| December 20, 2021

Growing and Slowing: The State of 5G Worldwide in 2021


5G continues to offer new and exciting ways of rethinking everything from streaming video to performing remote surgery. However, not everyone shares equally in these possibilities as many countries do not have access to 5G and even those that do, do not experience the same level of performance from their 5G connections. We examined Speedtest Intelligence® data from Q3 2021 Speedtest® results to see how 5G speeds have changed, where download speeds are the fastest at the country and capital level, where 5G deployments have increased and what worldwide 5G Availability looked like in Q3 2021. We also looked at countries that don’t yet have 5G to understand where consumers are seeing improvements in 4G access.

5G slowed down at the global level
Median-Speeds-Worldwide_1221-01

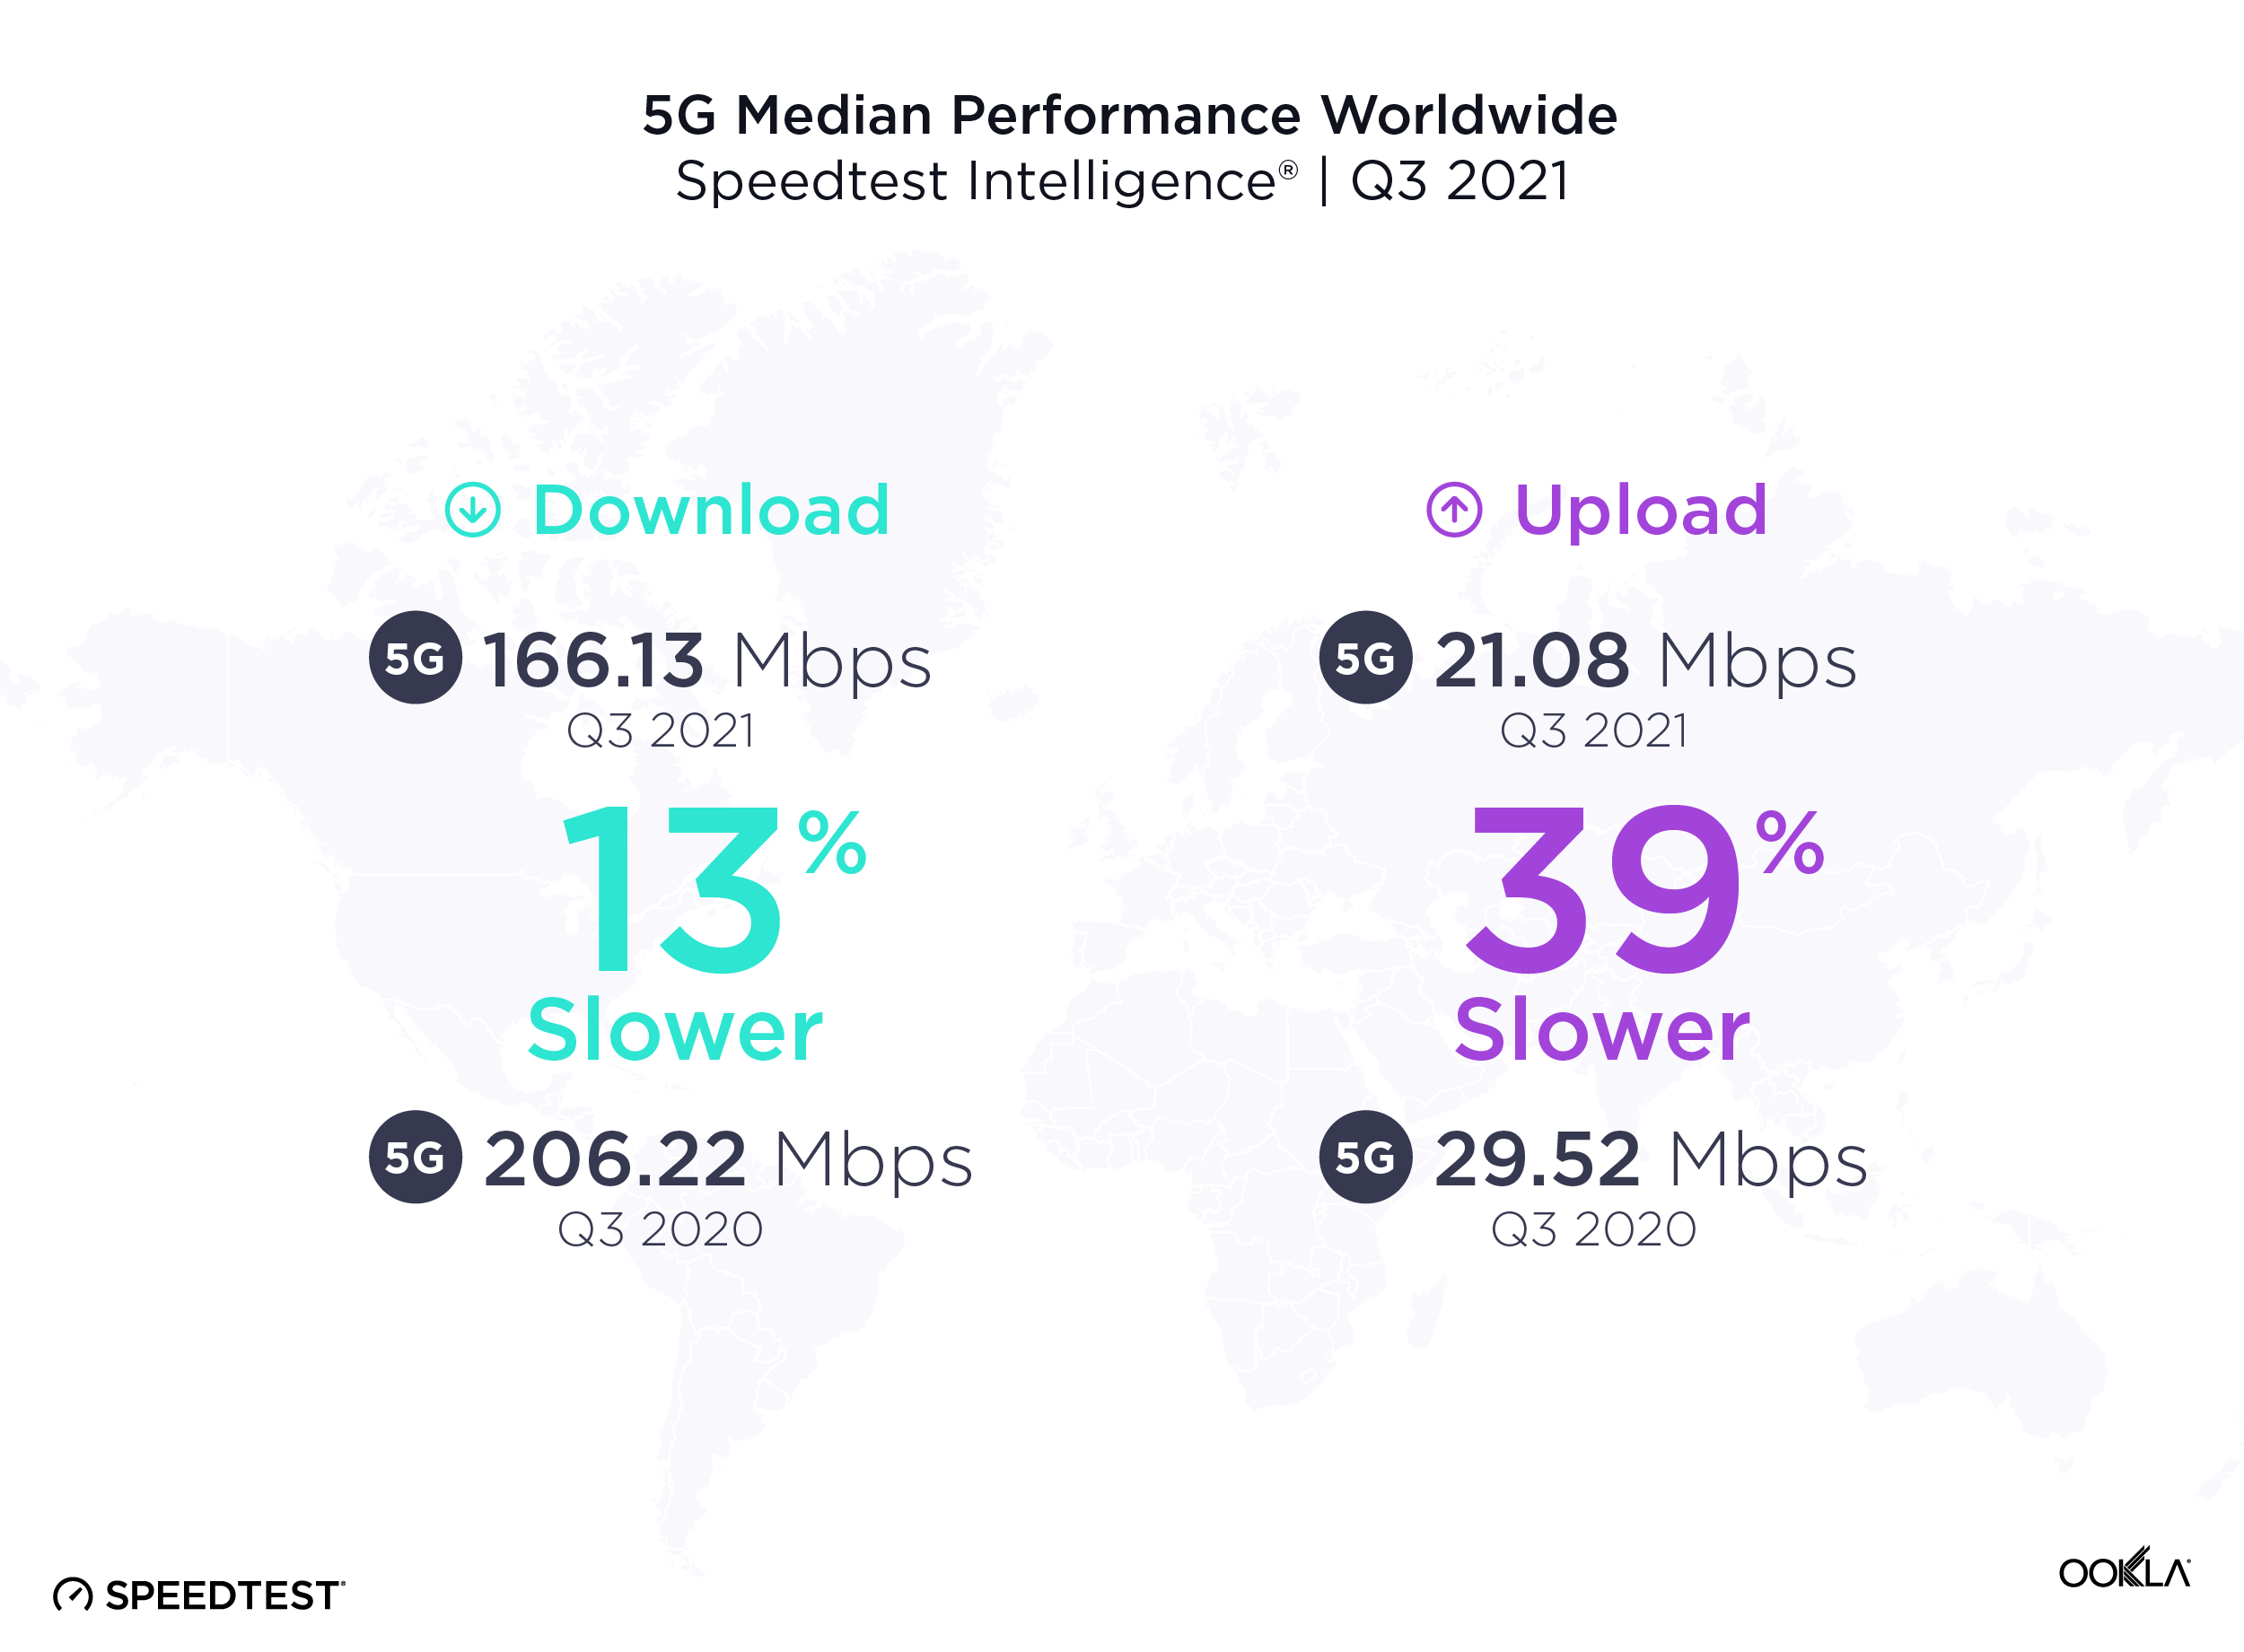
It’s common to see new mobile access technologies slow down as adoption scales, particularly early on in the tech cycle. Over the past year from Q3 2020 to Q3 2021, the median global 5G download speed fell to 166.13 Mbps, down from 206.22 Mbps in Q3 2020. Median upload speed over 5G also slowed to 21.08 Mbps (from 29.52 Mbps) during the same period.

More users are logging on to existing 5G networks, and we’re also at the stage in the evolution of 5G where countries that have historically had slower speeds are starting to offer 5G. In addition, the widespread use of dynamic spectrum sharing that has been used to boost early 5G coverage weighs on 5G download speeds. While the dip in speeds looks like a letdown, it’s more of a compromise to enable broader access. With additional spectrum and further deployments slated for 2022, we anticipate speeds will begin to pick up again.

South Korea had the fastest 5G in the world

ookla_5g-download_performance_countries_1221-01-1

South Korea had the fastest median download speed over 5G during Q3 2021, leading a top 10 list that included Norway, United Arab Emirates, Saudi Arabia, Qatar, Kuwait, Sweden, China, Taiwan and New Zealand. Sweden, China, Taiwan and New Zealand were new to the top 10 in 2021 while South Africa (whose 5G was brand new last year), Spain and Hungary fell out of the top 10.

5G expanded to 13 additional countries

ookla_5G-map_1221-01

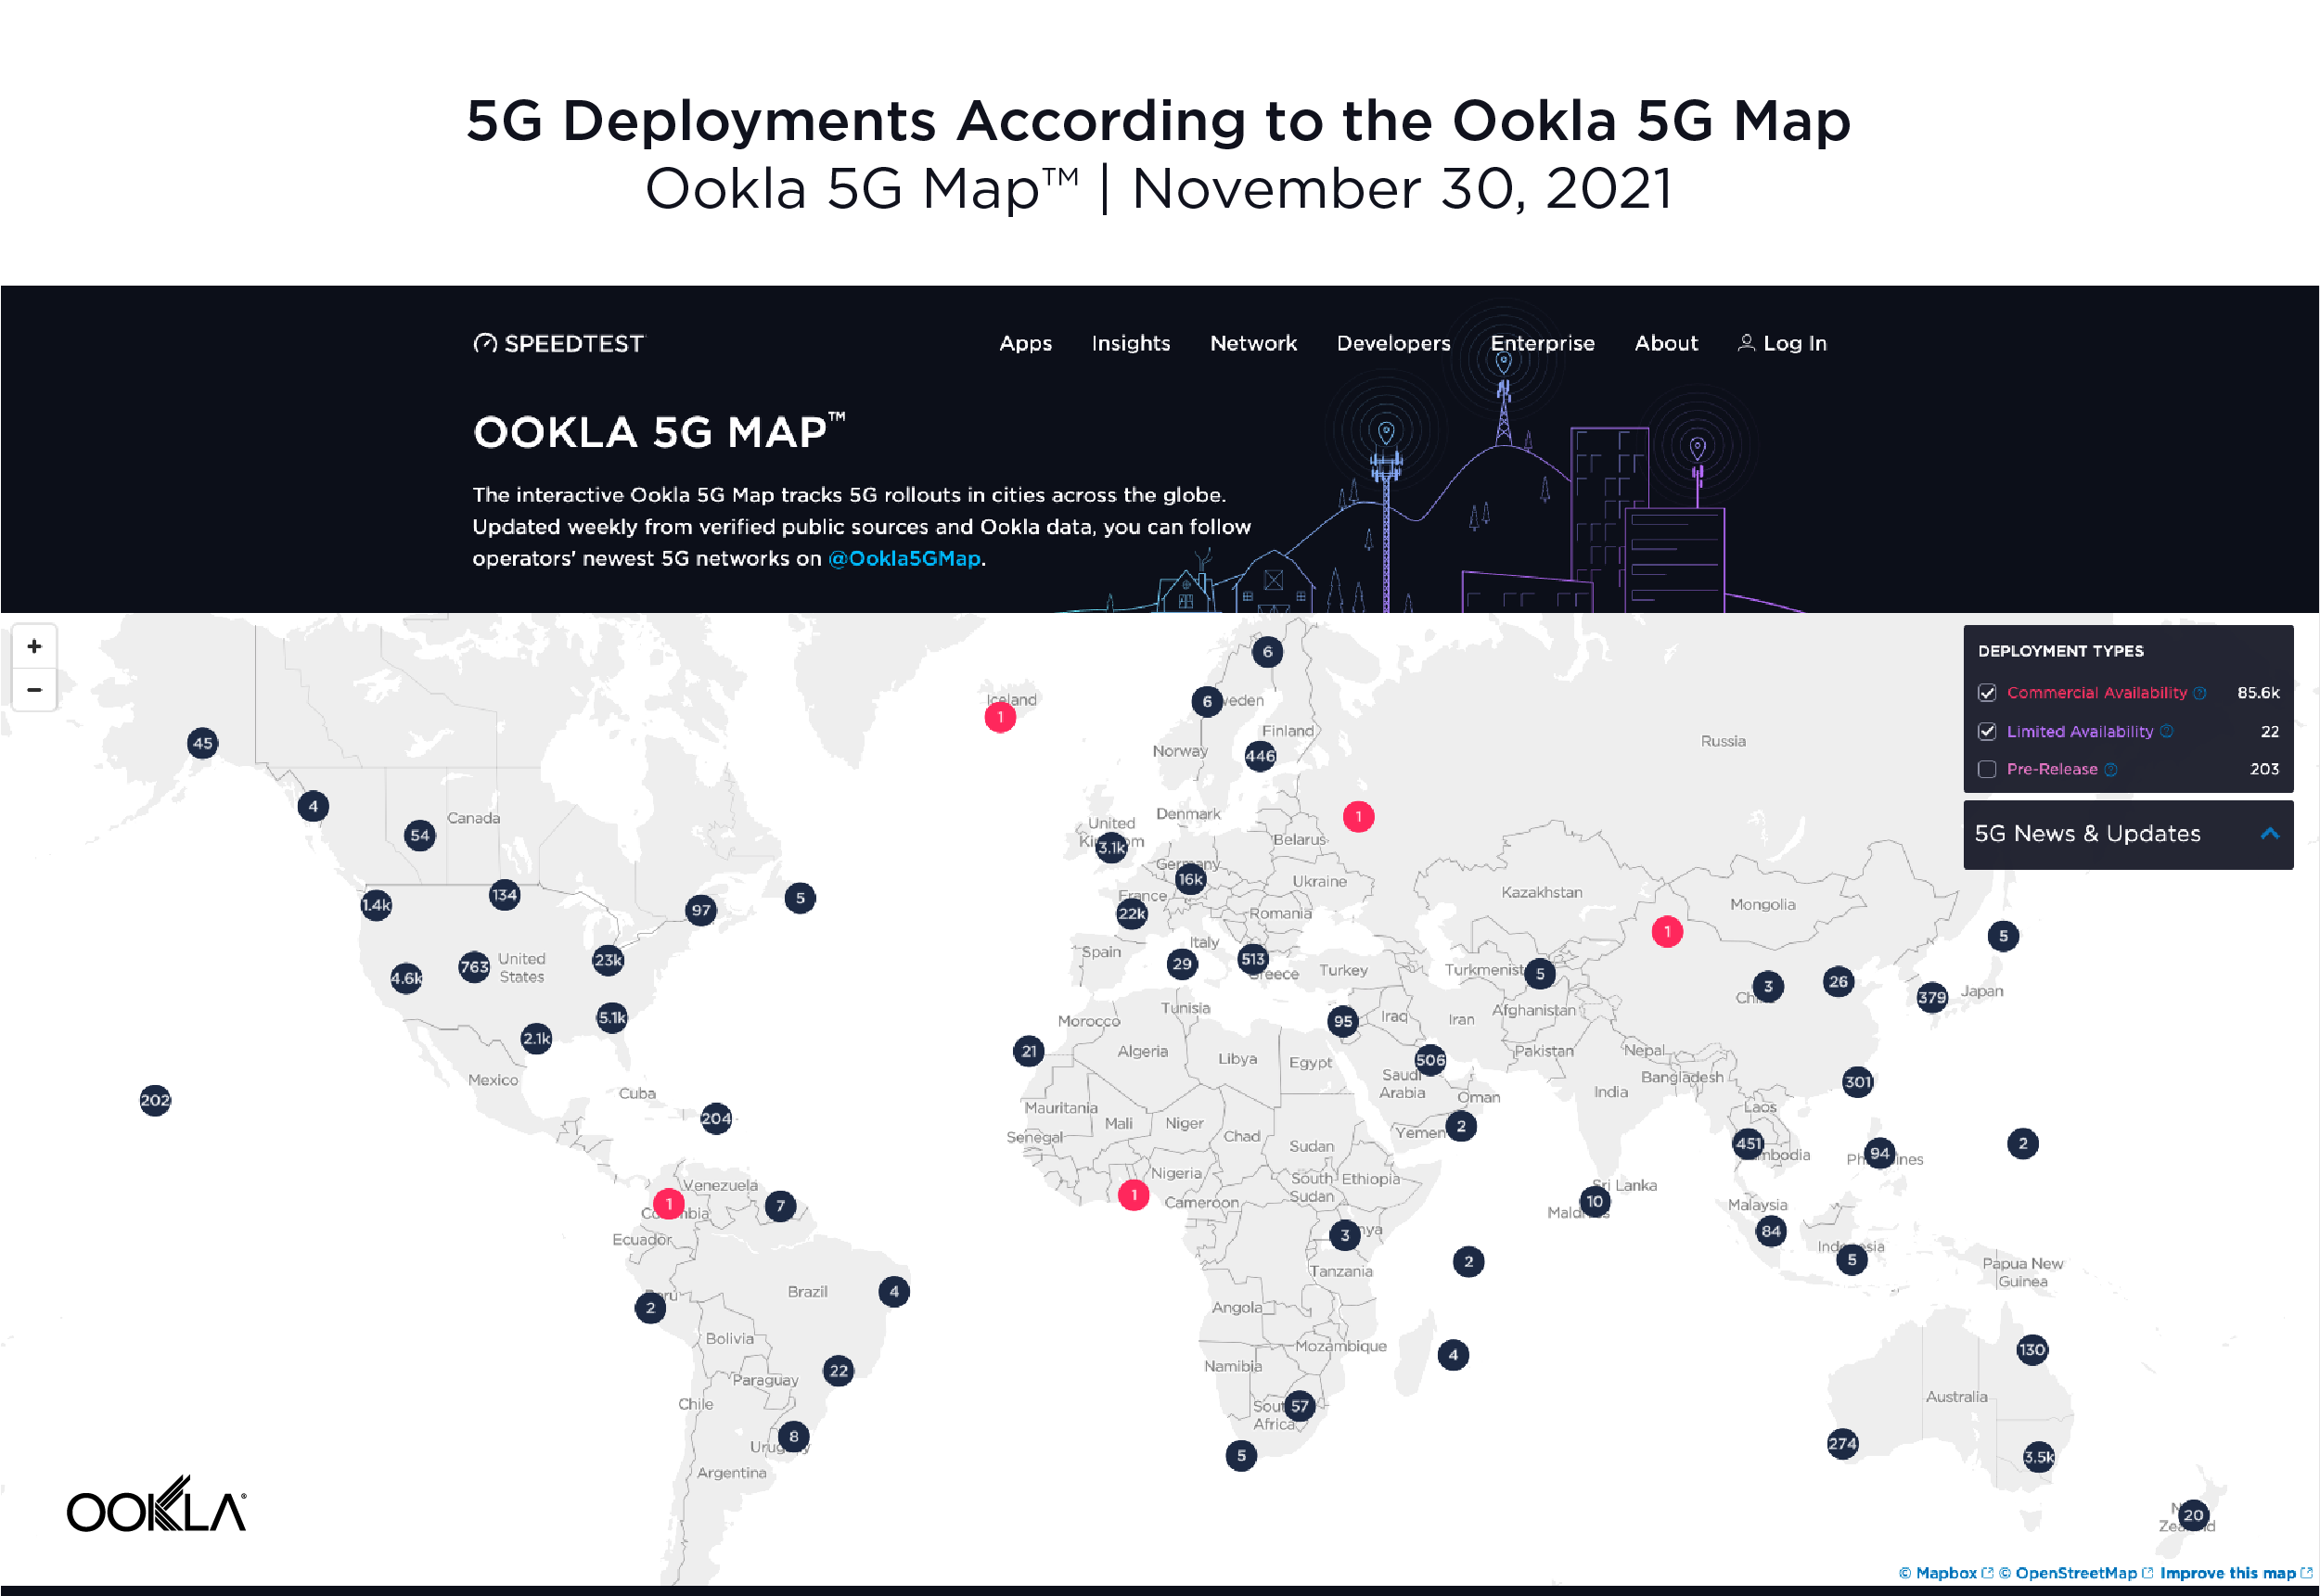
According to the Ookla® 5G Map, there were 5G deployments in 112 countries as of November 30, 2021. That’s up from 99 countries on the same date a year ago. The total number of deployments increased dramatically during the same time period with 85,602 deployments on November 30, 2021 compared to 17,428 on November 30, 2020, highlighting the degree to which 5G networks scaled during the year. Note that there are often multiple deployments in a given city.

Seoul and Oslo lead world capitals for 5G
ookla_5g-download_performance_capitals_1221-01

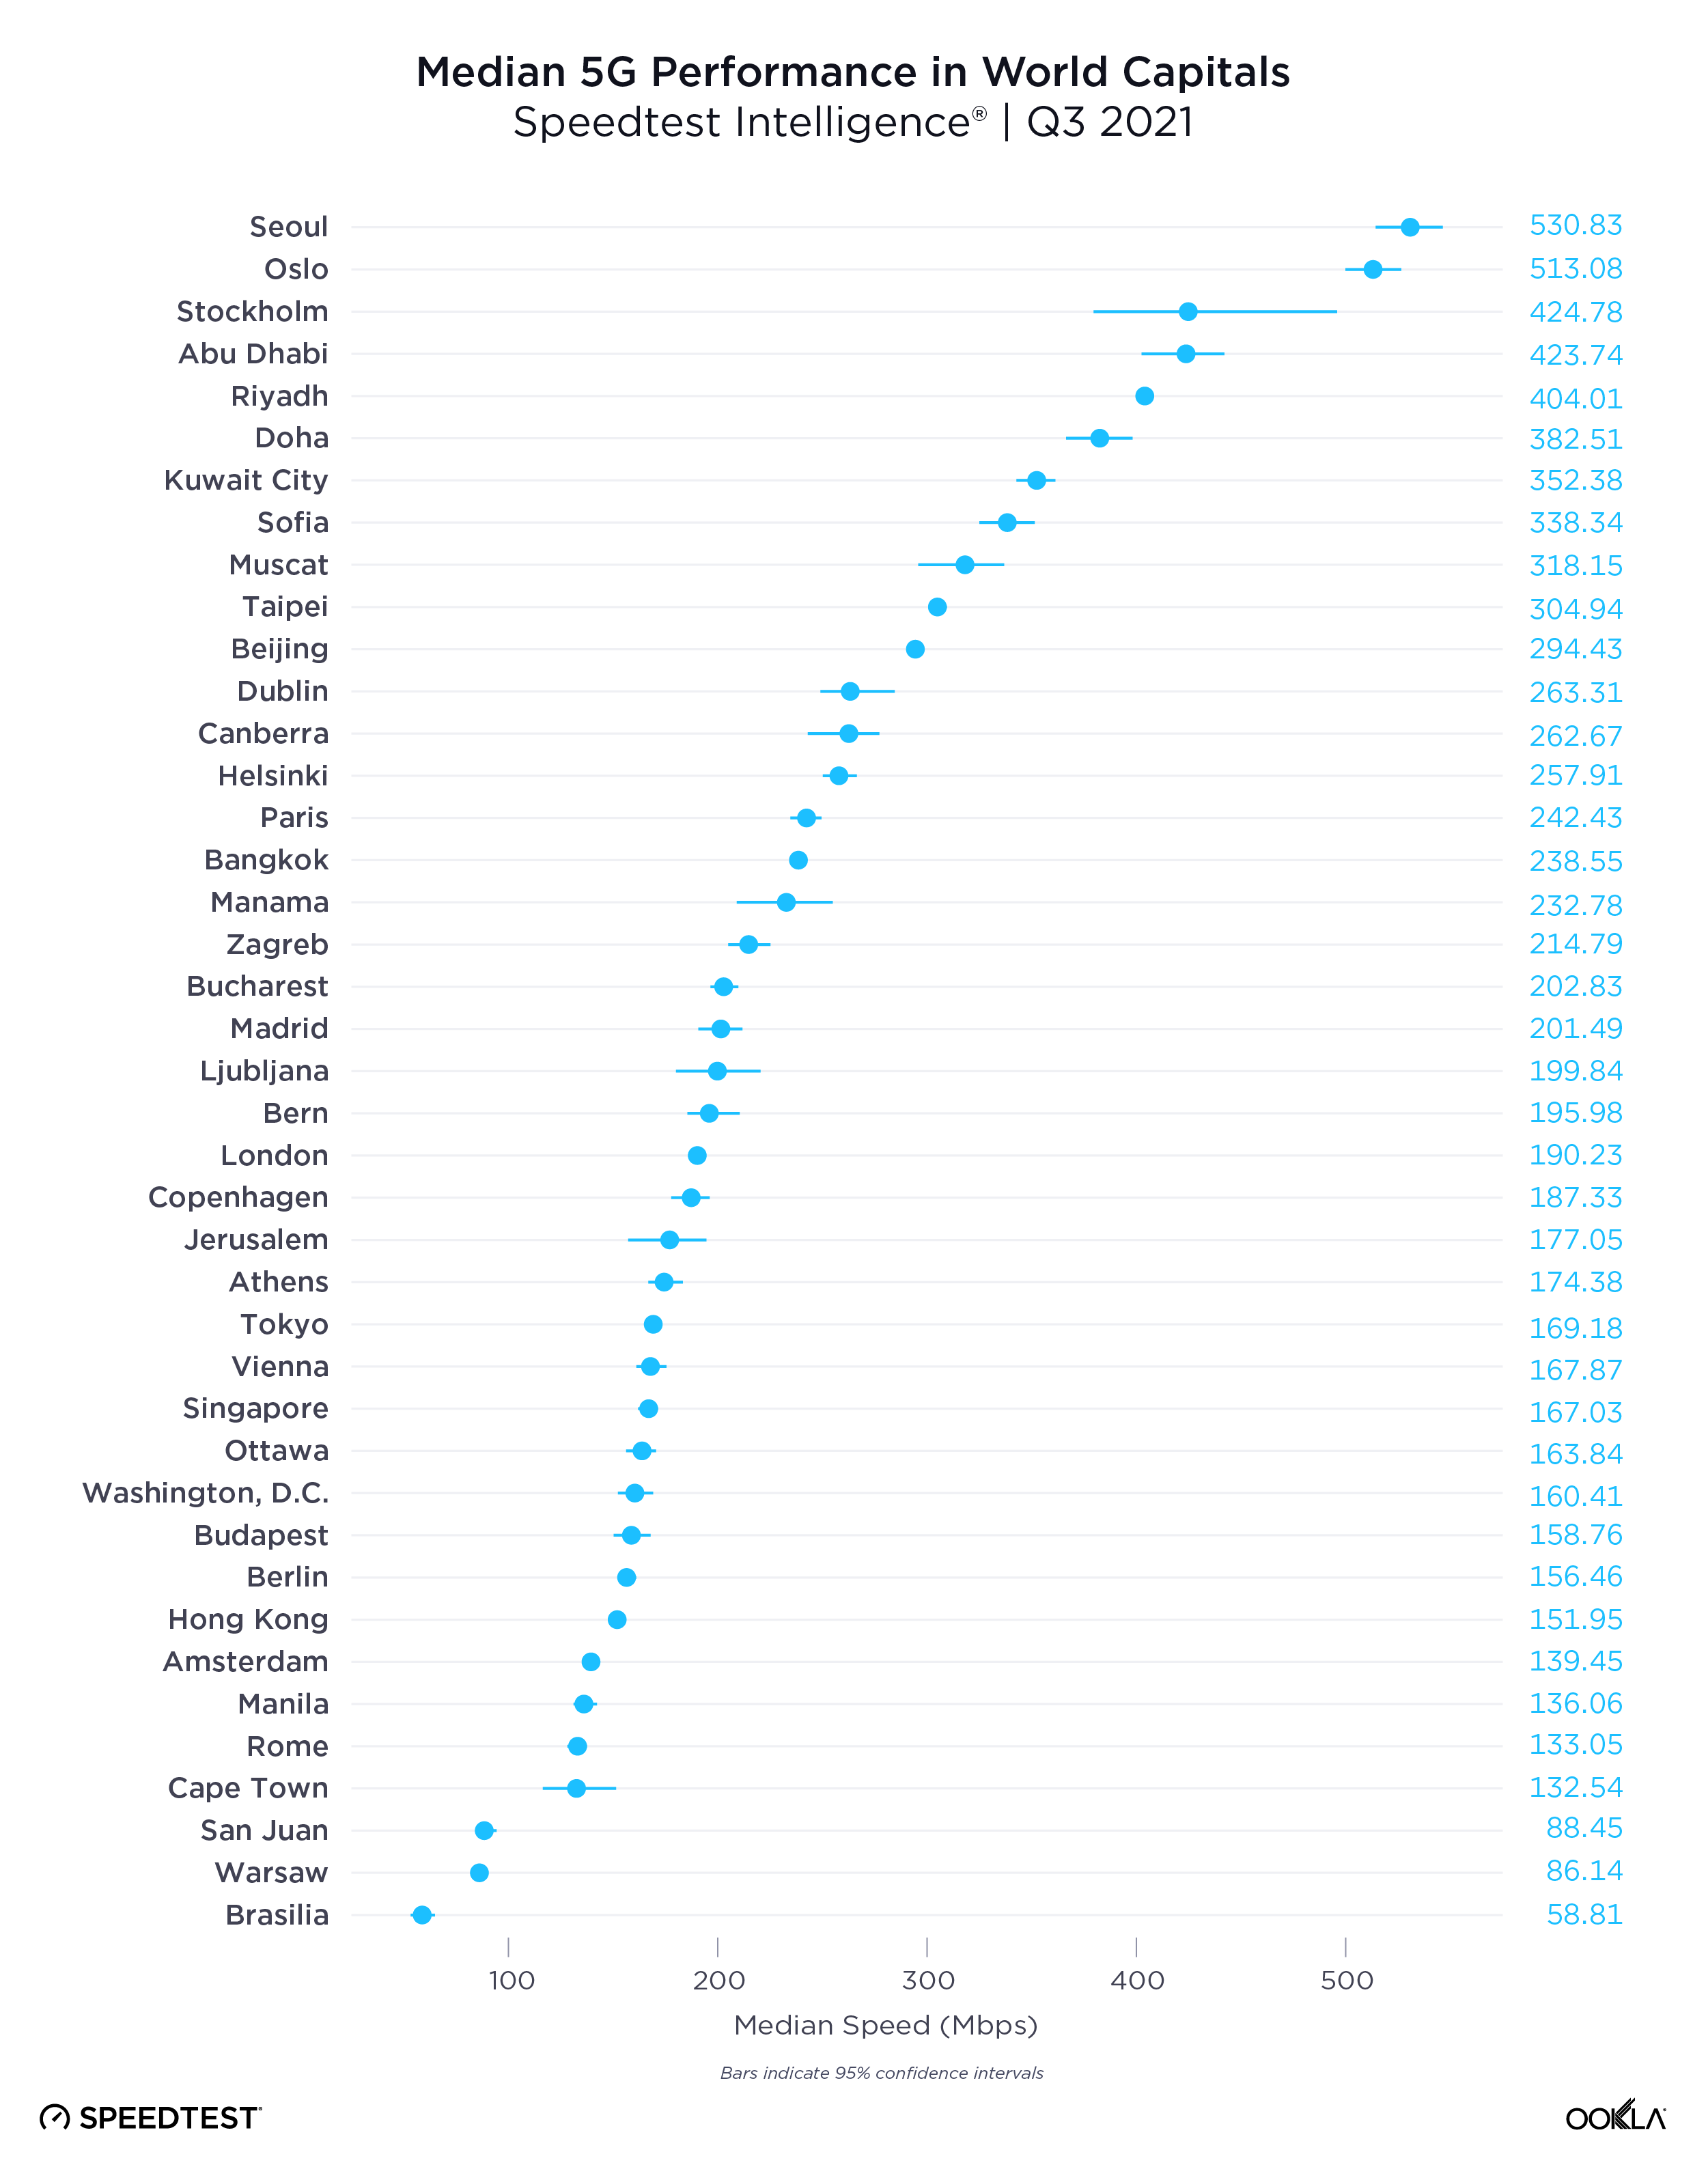
Speedtest Intelligence data from Q3 2021 shows a wide range of median 5G speeds among global capitals. Seoul, South Korea and Oslo, Norway were in the lead with 530.83 Mbps and 513.08 Mbps, respectively; Abu Dhabi, United Arab Emirates; Riyadh, Saudi Arabia and Doha Qatar followed. Brasilia, Brazil had the slowest median download speed over 5G on our list, followed by Warsaw, Poland; Cape Town, South Africa and Rome, Italy. Stockholm, Sweden and Oslo, Norway had some of the the fastest median upload speeds over 5G at 56.26 Mbps and 49.95 Mbps, respectively, while Cape Town had the slowest at 14.53 Mbps.

The U.S. had the highest 5G Availability

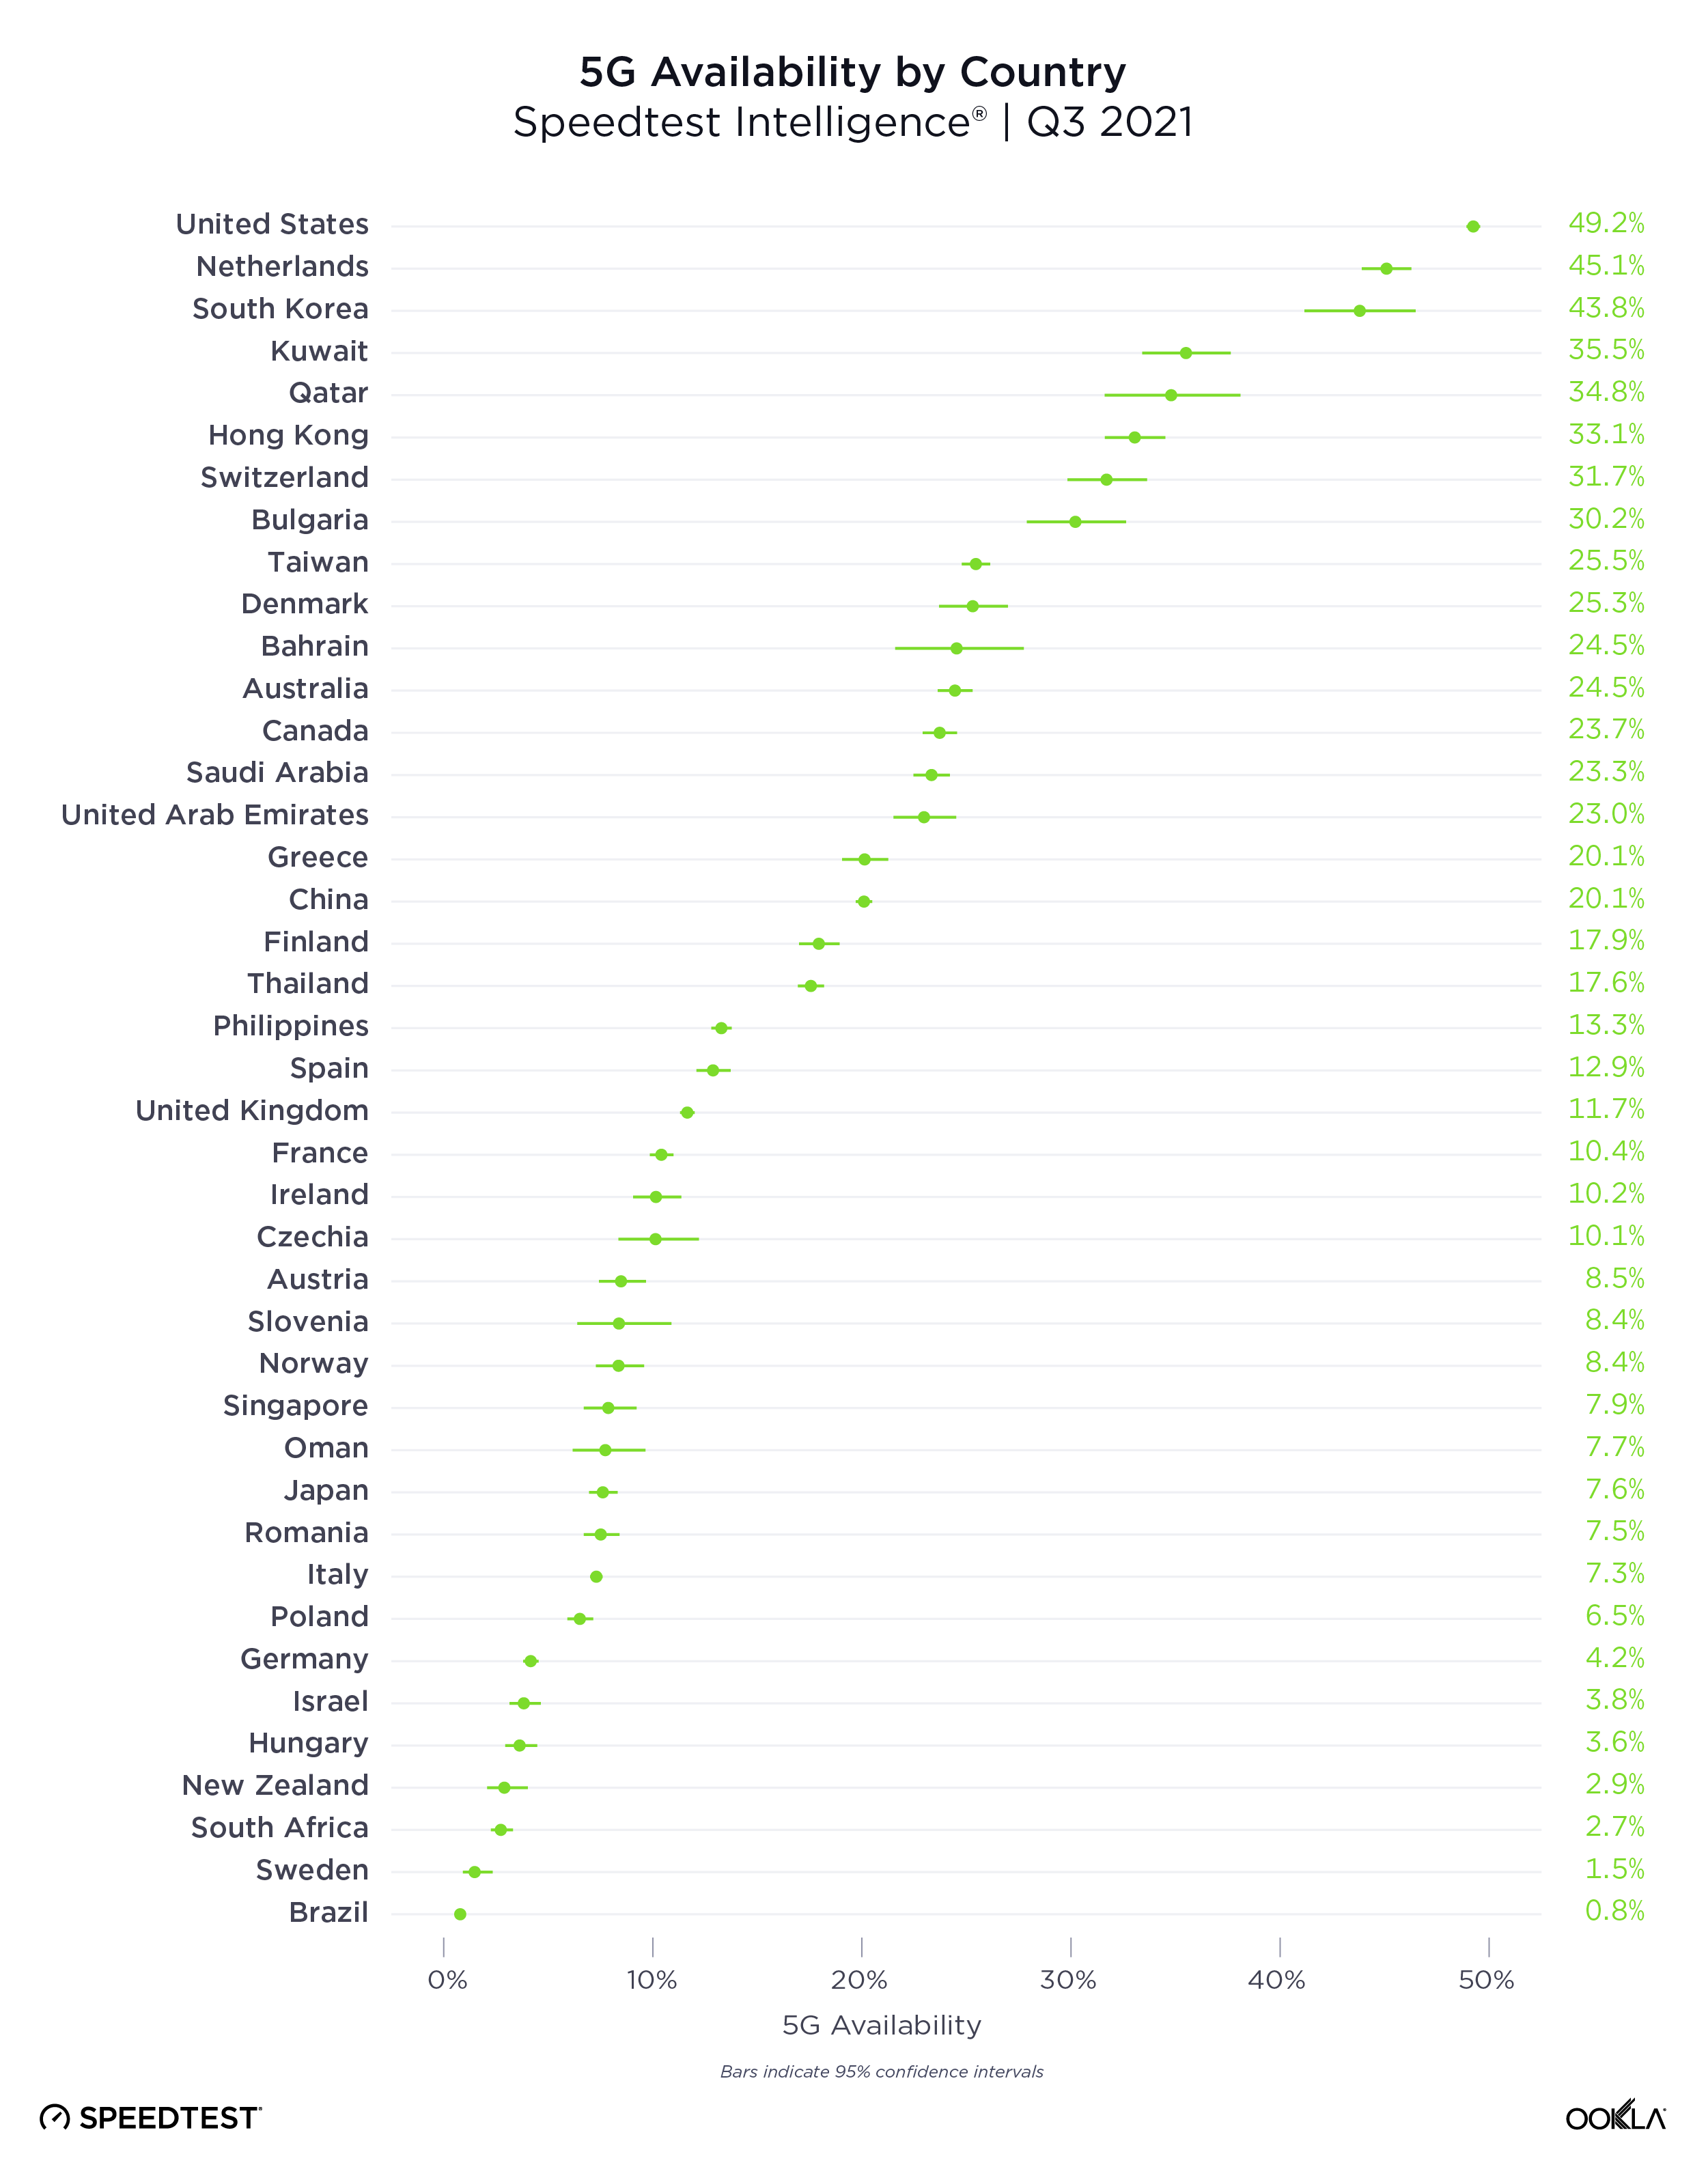
The presence of 5G is only one indicator in a market, because even in markets where 5G has launched, coverage and adoption can be pretty low. We analyzed 5G Availability to see what percent of users on 5G-capable devices spent the majority of their time on 5G, both roaming and on-network during Q3 2021.
ookla_5g-availability_countries_1221-01

The United States had the highest 5G Availability at 49.2%, followed by the Netherlands (45.1%), South Korea (43.8%), Kuwait (35.5%) and Qatar (34.8%). Brazil had the lowest 5G Availability on our list at 0.8%, followed by Sweden (1.5%), South Africa (2.7%), New Zealand (2.9%) and Hungary (3.6%).

Not all 5G networks are created equal

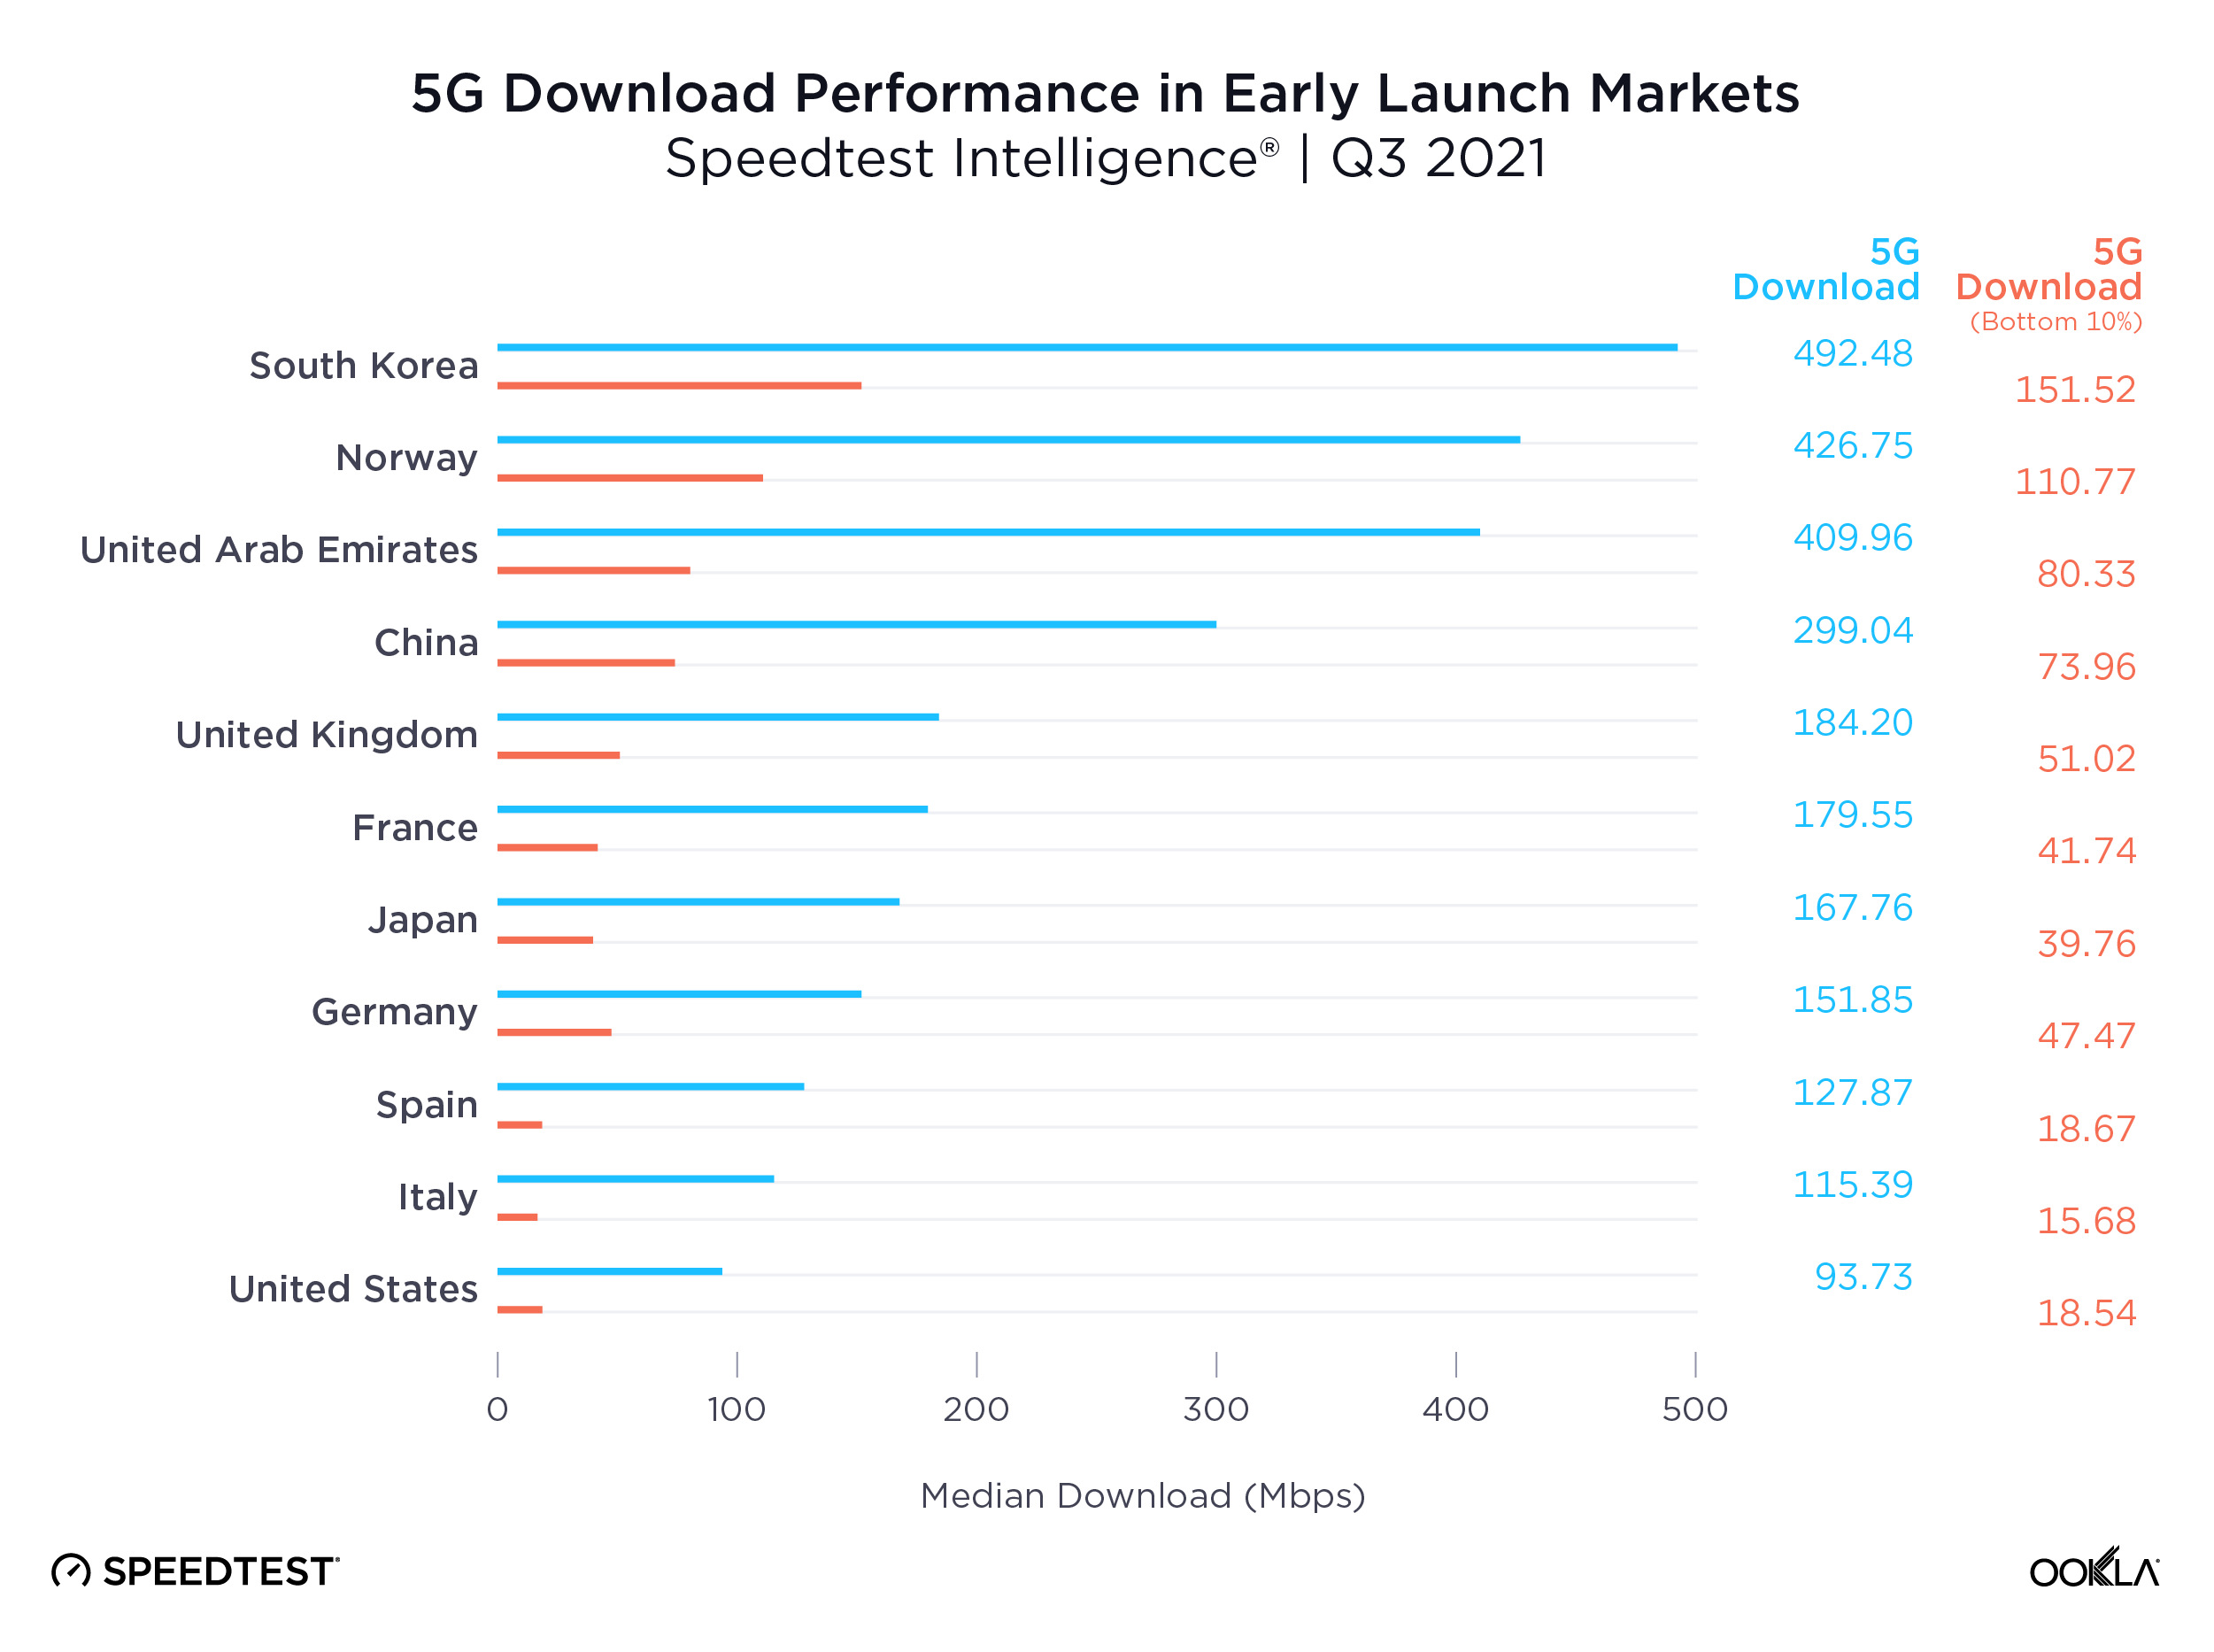
Ookla Speedtest Intelligence data shows a growing disparity in the performance of 5G networks worldwide, even among the pioneer markets who were among the first to launch the new technology. We see leading markets such as South Korea, Norway, the UAE and China pulling well ahead of key European markets, the U.S. and Japan on 5G download speeds, creating what increasingly looks like two tiers of 5G markets.
ookla_5g-download_performance_1221-01

Part of the reason for this divergence is access to key 5G spectrum bands, with Verizon and AT&T in the U.S. for example, soon to deploy their C-band spectrum holdings for 5G use. However, what really seems to separate these markets is the level of 5G network densification. The number of people per 5G base station ranges from 319 in South Korea and 1,531 in China, to 4,224 in the EU and 6,590 in the US, according to the European 5G Observatory’s International Scoreboard during October 2021.

Despite the noise around 6G, 5G still has a long way to run

Median 5G mobile download speeds across these markets are respectable relative to the International Telecommunication Union’s (ITU) IMT-2020 target of 100 Mbps for user experienced download data rates. However, 5G Speedtest® results in each market demonstrate significant variability, with the bottom 10th percentile only recording speeds in excess of the IMT-2020 target in South Korea and Norway, and falling significantly short in many other markets, with Spain, Italy and the U.S. below 20 Mbps.

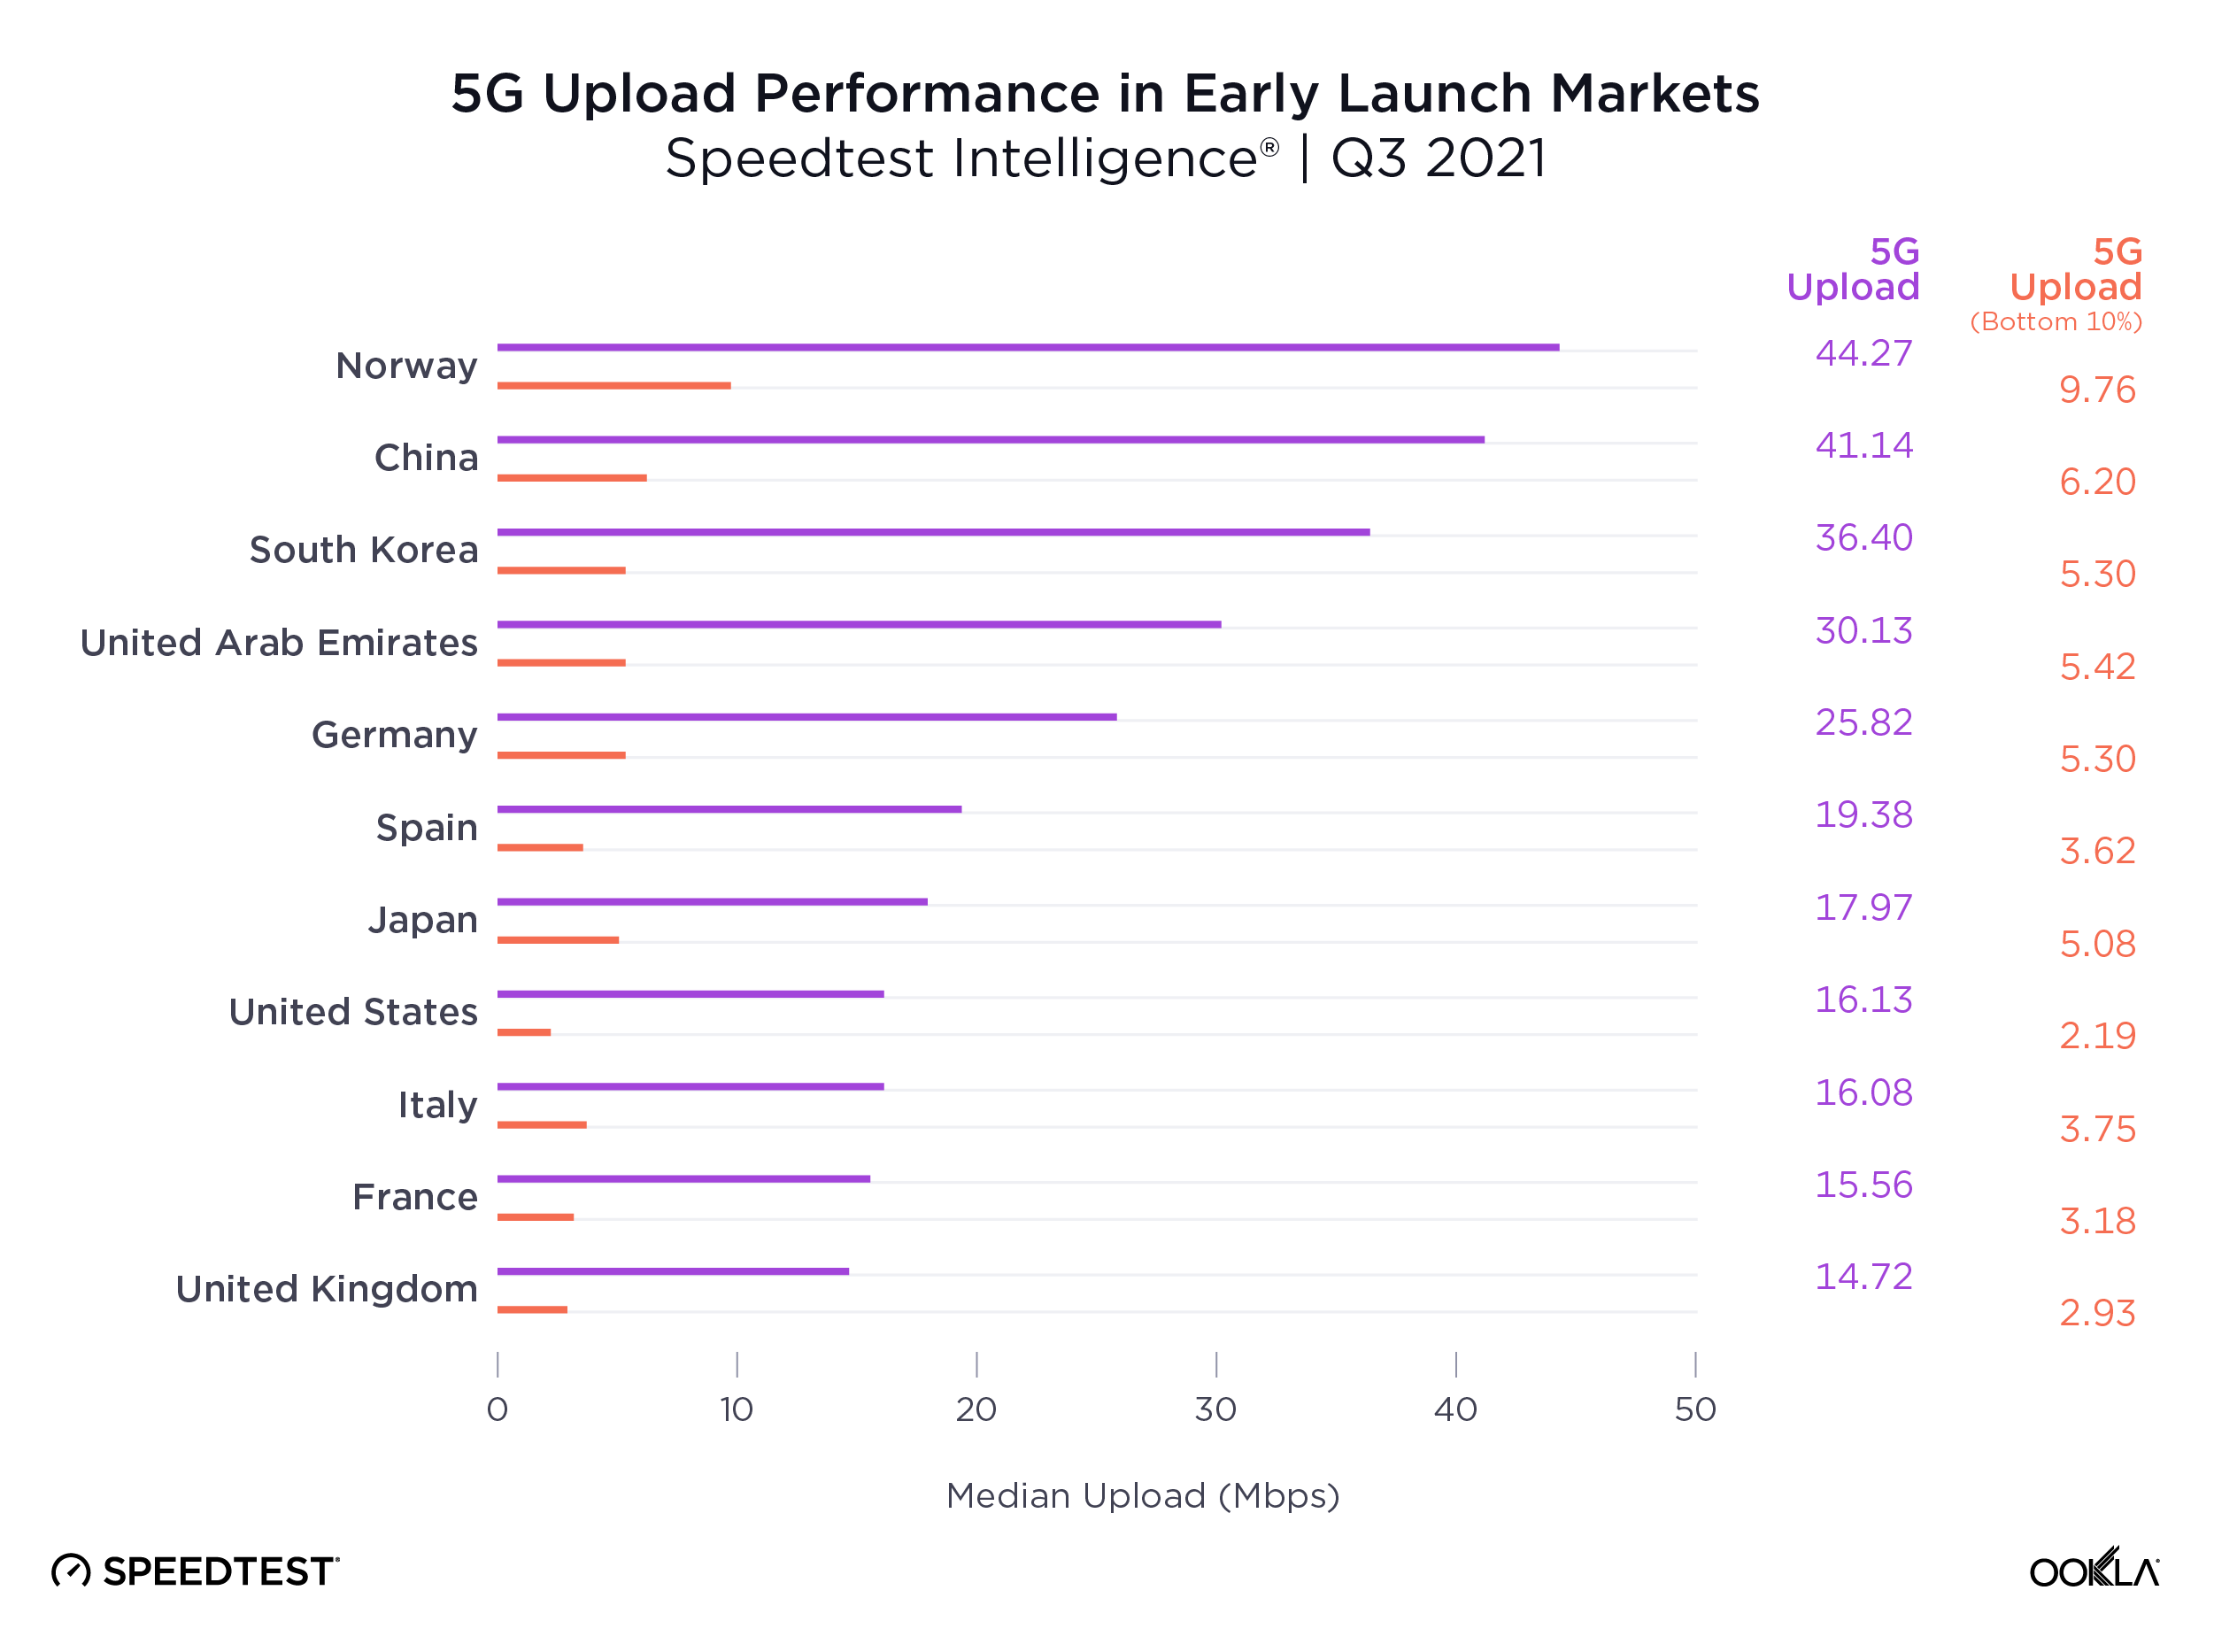
The story gets worse for upload speeds, where no market’s median speed broke the IMT-2020 recommended 50 Mbps, and where the bottom 10th percentile lay in single digits across the board. Operators are clearly prioritizing download speeds over upload, which makes sense given the asymmetric nature of demand, with most consumer applications requiring higher download speeds. However, as operators increasingly look to target the enterprise market with 5G connectivity and consumer demand for services such as video calling and mobile gaming continues to rise, operators will need to boost upload speeds.
ookla_5g-upload_performance_1221-01-1

Demand for mobile internet bandwidth continues to grow, up 43% year-on-year in Q3 2021 according to Ericsson’s latest mobility report. Looking ahead to 2022, operators will need to increase the capacity of their 5G networks to tackle this growing demand while driving network speeds to new heights. We’ve seen the impact the deployment of new spectrum can have on congested networks during 2021, with Reliance Jio witnessing a bump in 4G LTE performance and consumer sentiment following its acquisition of additional spectrum in India.

Where 5G still fails to reach

Speedtest Intelligence showed 70 countries in the world where more than 20% of samples were from 2G and 3G connections (combined) during Q3 2021 and met our statistical threshold to be included. These are mostly countries where 5G is still aspirational for a majority of the population. As excited as we are about the expansion of 5G, we do not want to see these countries left behind. Not only are 2G and 3G decades old, they are only sufficient for basic voice and texting, social media and navigation apps. To deliver rich media experiences or video calling, users need access to 4G or higher. Having so many consumers on 2G and 3G also prevents mobile operators from refarming that spectrum to make 4G and 5G networks more efficient.

Countries That Still Rely Heavily on 2G and 3G Connections
Speedtest IntelligenceⓇ | Q3 2021
Country 2G & 3G Samples
Central African Republic 89.9%
Palestine 84.7%
Yemen 72.4%
Turkmenistan 71.8%
Micronesia 56.3%
Madagascar 55.0%
Belarus 53.2%
Rwanda 51.7%
Kiribati 48.4%
Equatorial Guinea 47.6%
Afghanistan 44.4%
South Sudan 43.4%
Guyana 42.3%
Guinea 37.0%
Angola 36.8%
Cape Verde 35.9%
Tajikistan 35.6%
Zimbabwe 34.7%
Benin 34.4%
Togo 33.8%
Ghana 33.0%
Sierra Leone 31.7%
Antigua and Barbuda 30.2%
Vanuatu 30.1%
Lesotho 30.0%
Syria 29.6%
Moldova 29.4%
Saint Kitts and Nevis 28.9%
Mozambique 28.8%
Sudan 28.4%
Palau 28.3%
Grenada 28.1%
Tanzania 27.6%
Uganda 27.5%
Niger 27.5%
Gabon 27.5%
Haiti 27.4%
Suriname 27.4%
Tonga 27.3%
Liberia 27.0%
Namibia 26.7%
Swaziland 26.5%
The Gambia 26.3%
Saint Vincent and the Grenadines 26.3%
Dominica 26.3%
Somalia 26.1%
Cook Islands 26.0%
Zambia 25.9%
Barbados 25.7%
Armenia 25.5%
Algeria 25.4%
Papua New Guinea 25.2%
Jamaica 24.5%
Venezuela 24.2%
Ethiopia 24.1%
Uzbekistan 24.0%
El Salvador 23.5%
Honduras 23.1%
Nigeria 23.0%
Solomon Islands 22.8%
Caribbean Netherlands 22.7%
Botswana 22.3%
Anguilla 21.7%
Mauritania 20.6%
Saint Lucia 20.5%
Bosnia and Herzegovina 20.3%
Burundi 20.3%
Ecuador 20.2%
Ukraine 20.1%
Trinidad and Tobago 20.0%

We were pleased to see the following countries come off the list from last year, having dropped below the 20% threshold: Azerbaijan, Bangladesh, Belize, Burkina Faso, Cameroon, Costa Rica, Côte d’Ivoire, DR Congo, Iraq, Kenya, Laos, Libya, Maldives, Mali, Mauritius, Mongolia, Nicaragua, Paraguay and Tunisia. While countries like Palestine, Suriname, Ethiopia, Haiti and Antigua and Barbuda are still on this list, they have improved the percentage of their samples on these outmoded technologies when compared to last year (dropping 10-15 points, respectively), 2G and 3G samples in Belarus increased 6.7 points when comparing Q3 2021 to Q3 2020.

We’re excited to see how performance levels will normalize as 5G expands to more and more countries and access improves. Keep track of how well your country is performing on Ookla’s Speedtest Global Index.

Ookla retains ownership of this article including all of the intellectual property rights, data, content graphs and analysis. This article may not be quoted, reproduced, distributed or published for any commercial purpose without prior consent. Members of the press and others using the findings in this article for non-commercial purposes are welcome to publicly share and link to report information with attribution to Ookla.
| December 12, 2017

The World’s Internet Speeds Increased More than 30% in 2017. Are You Keeping Up?

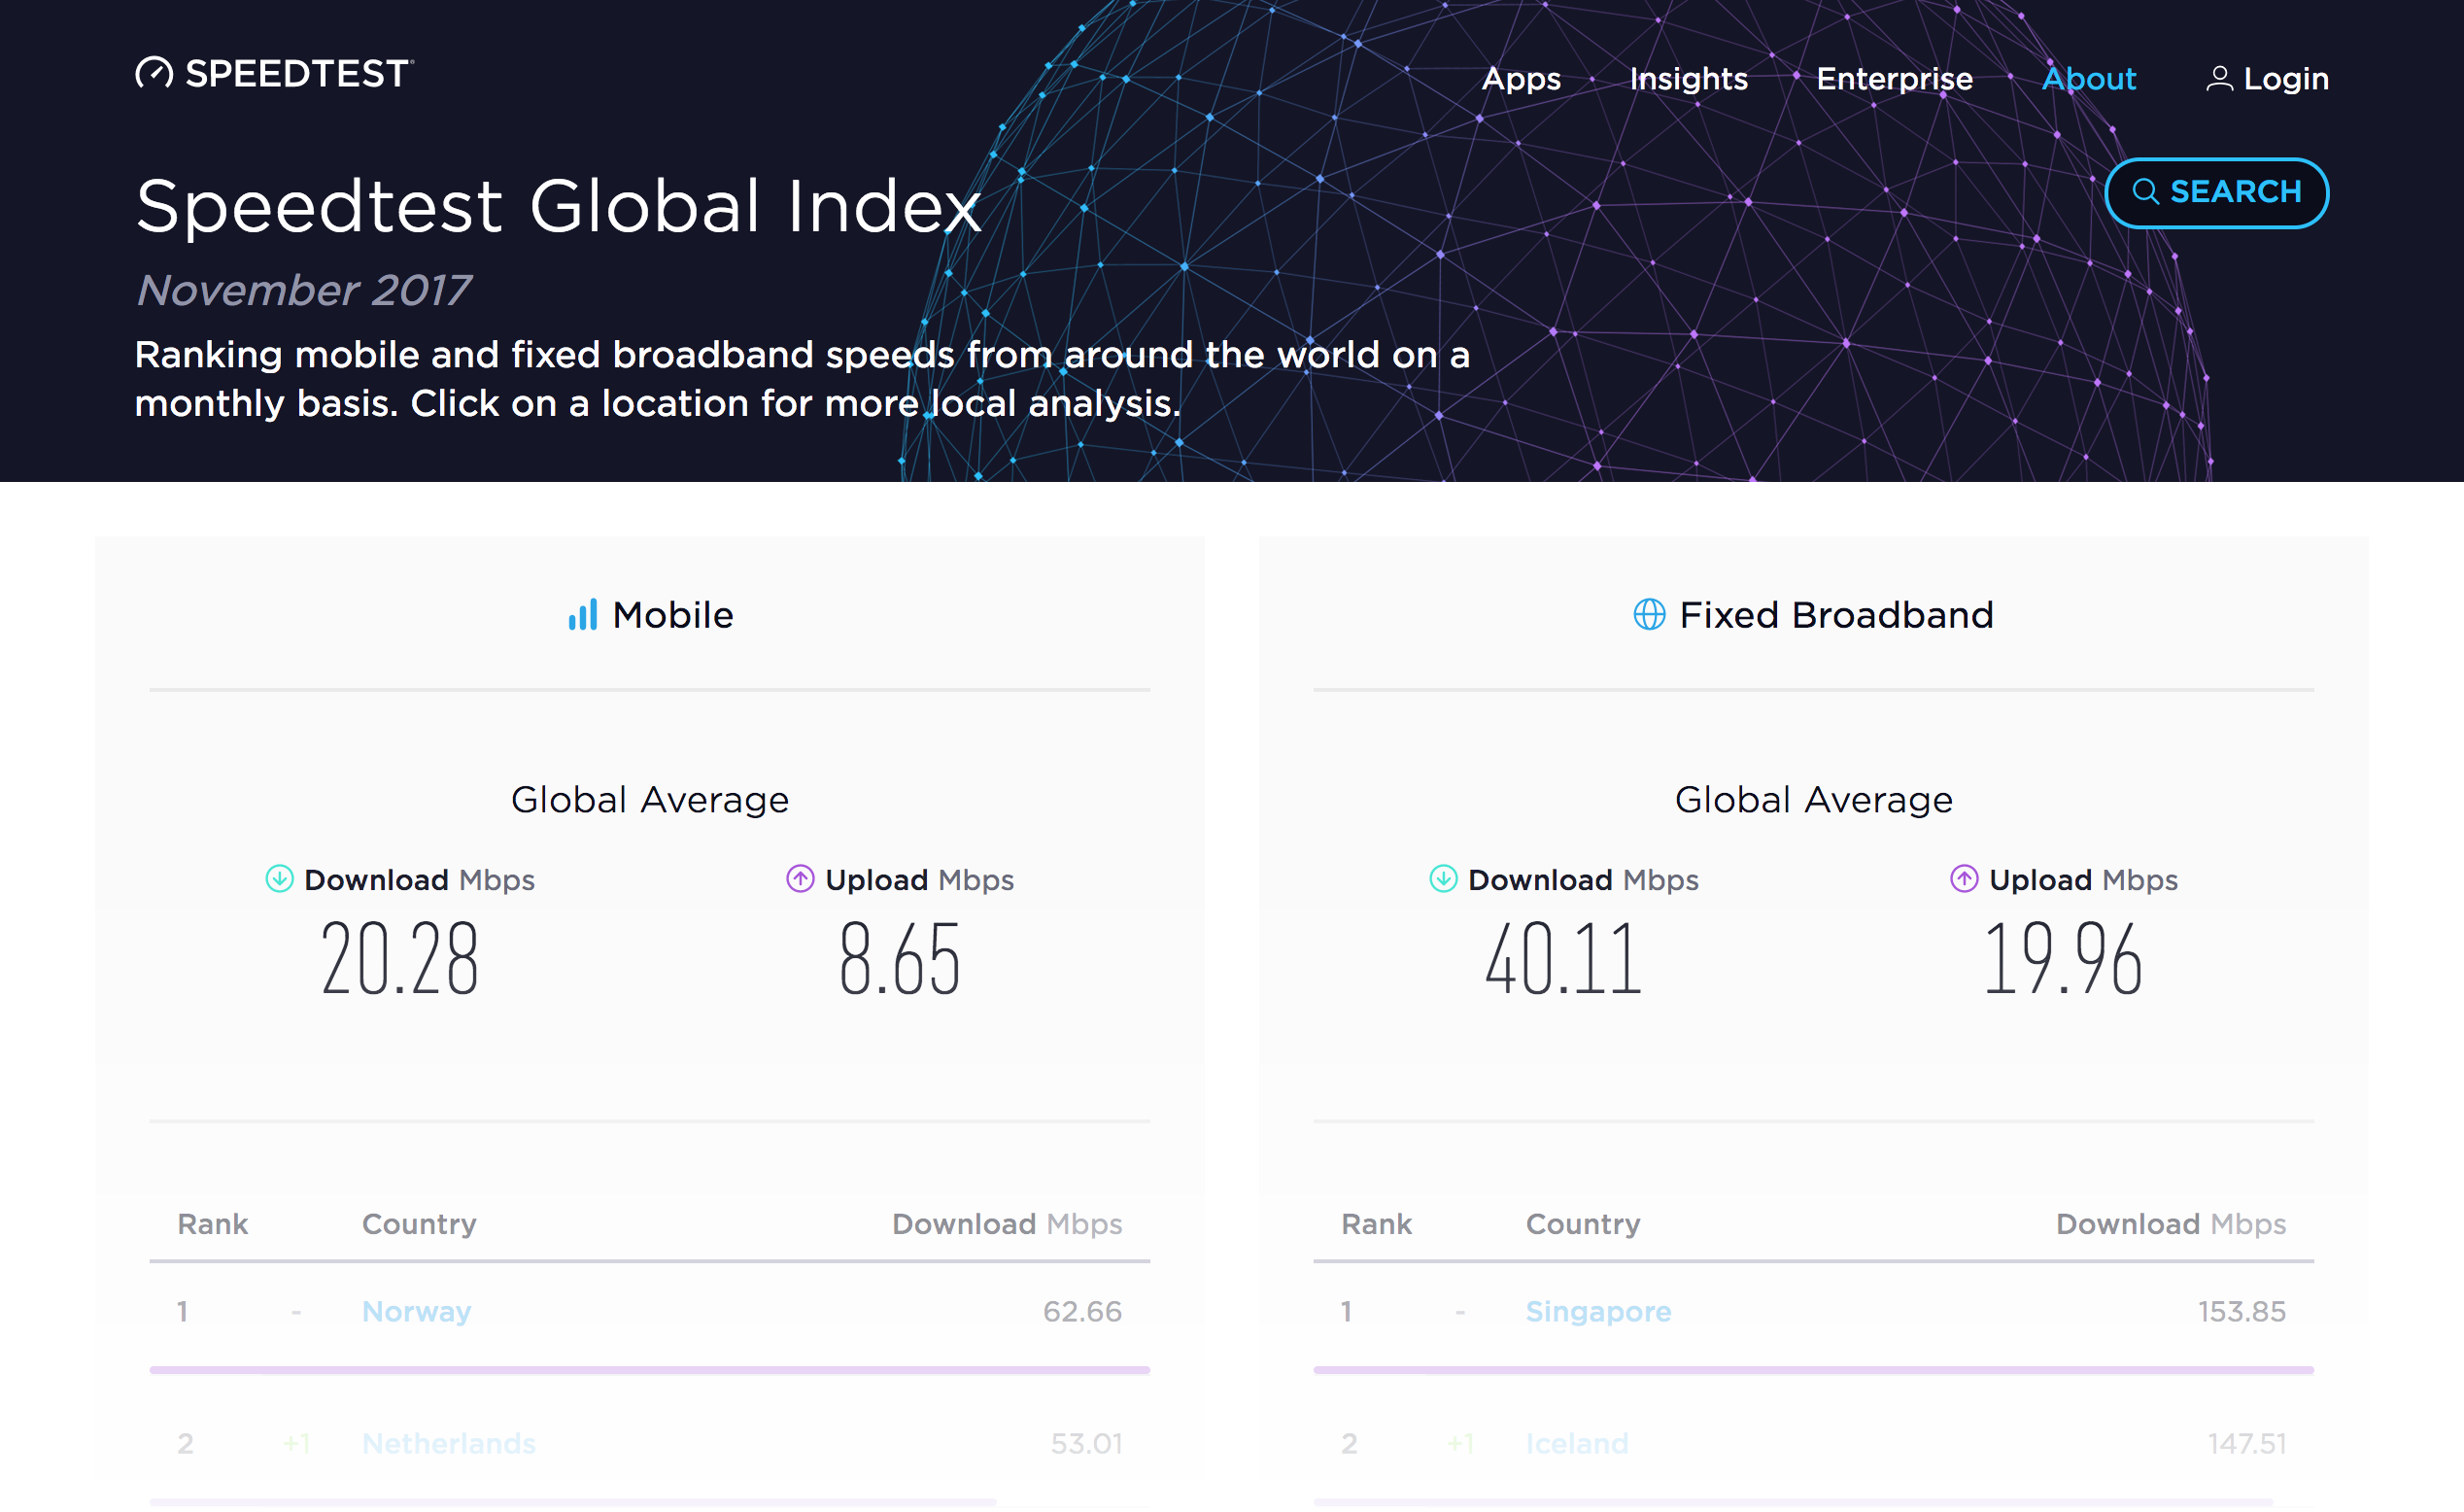
In a world where business and life are increasingly fast and global, you want to know if your country’s internet is up to speed. In August, we launched Speedtest Global IndexTM to provide you that objective look at internet performance around the world. Knowing what your speeds are and how they compare to your neighbors’ makes for a good story, but what was missing was a benchmark. To provide you that worldwide context, we’re introducing Global Speed, the average internet speed of the world, to the top of the Speedtest Global Index.

You can still use the Speedtest Global Index to see download and upload speeds by country and rank who’s fastest and slowest. Here we’ve paired data about those individual country speeds over the past year with the new global averages call out which countries have improved most over the past year, who’s shown the least improvement and what speeds are like in the world’s most populous countries. Read on to see who’s winning the internet speed race and who has a lot of catching up to do.

The comparisons here are based on Speedtest data from November 2016-November 2017. We used the same monthly threshold for this article that we do for inclusion in the Speedtest Global Index: to be ranked in each category, countries must have at least 670 Speedtest results from unique users on mobile and at least 3,333 for fixed broadband. Although we use the word “country” throughout, you will notice some regions like Hong Kong and Puerto Rico that are large or autonomous enough to call out as separate entities, even though they are not separate countries. Global speeds are a weighted average of all samples from around the world.

Global download speeds are up more than 30% across the board

With a mean global speed of 20.28 Mbps, mobile downloads increased 30.1% over the last 12 months and mobile uploads increased 38.9%. A global average of 40.11 Mbps makes fixed broadband downloads 97.8% faster than mobile and this speed increased 31.6% during the same period. Uploads over fixed broadband showed the smallest increase of 25.9%.

Global Internet Speeds
November 2016 – November 2017
Download: November 2017 Average (Mbps) Download: Year Over Year Increase Upload: November 2017 Average (Mbps) Upload: Year Over Year Increase
Mobile 20.28 30.1% 8.65 38.9%
Fixed 40.11 31.6% 19.96 25.9%

In November 2017, 119 countries boasted a faster mobile download speed than the global average while 134 were slower. On the fixed broadband side, 71 countries and regions beat the global average download speed and 185 were slower. As we reported last week, gigabit Speedtest results are rolling in from across the planet, but their distribution across continents is wildly uneven.

Most improved countries

It was a good year for Laotian mobile speeds. With a 249.5% jump in mobile download speeds, Laos showed the largest improvement in the world. Vietnam came in second with an increase of 188.7% and Trinidad and Tobago was third at 133.1%. All of the countries listed on the table below are to be commended for making mobile internet faster.

Countries with the Largest Improvement
Mobile Download Speed

November 2016 – November 2017
Year Over Year Increase November 2017 Speed (Mbps)
Laos 249.5% 13.77
Vietnam 188.7% 19.54
Trinidad and Tobago 133.1% 11.68
Hong Kong (SAR) 102.6% 35.64
Lebanon 92.3% 24.50
Cyprus 90.2% 26.14
Republic of the Union of Myanmar 81.0% 11.72
Costa Rica 80.9% 7.89
Cambodia 70.5% 14.97
Sudan 68.9% 9.85

The tiny island of Reunion, a region of France off the coast of Africa, saw the largest improvement in download speed over fixed broadband in the world with a gain of 141.5%. Guatemala was second at 116.7% and Ghana third at 82.1%.

Countries with the Largest Improvement
Fixed Broadband Download Speed

November 2016 – November 2017
Year Over Year Increase November 2017 Speed (Mbps)
Reunion 141.5% 62.64
Guatemala 116.7% 12.04
Ghana 82.1% 18.96
Peru 80.1% 16.48
India 76.9% 18.82
Panama 76.6% 28.62
Italy 72.1% 31.58
Libya 67.6% 3.84
Argentina 62.2% 15.49
Kenya 60.9% 15.59

In some countries, notably Libya, a small gain in megabits per second (Mbps) can result in a large percentage increase. Although the actual performance improvement is small, we’re glad to see speeds moving in the right direction.

Speeds in some countries declined

On the flip side, there were far too many countries and regions where internet speeds decreased. The devastation of Puerto Rico’s mobile infrastructure by Hurricane Maria surely contributed to the island’s 39.8% drop in mobile download speed during the past twelve months. Uzbekistan saw a decline of 31.8% and Côte d’Ivoire 26.1%.

Countries with the Smallest Improvement
Mobile Download Speed

November 2016 – November 2017
Year Over Year Change November 2017 Speed (Mbps)
Puerto Rico -39.8% 8.53
Uzbekistan -31.8% 6.47
Côte d’Ivoire -26.1% 10.95
Brunei -23.4% 9.83
Thailand -19.7% 13.38
Iraq -16.8% 3.12
Algeria -10.8% 7.19
Nigeria -8.4% 9.90
Bangladesh -7.4% 4.97
Morocco -6.3% 15.03

Algeria saw the largest decrease in download speed over fixed broadband speed in the world at 23.9%. Dips of 9.1% in Ecuador and 6.5% in Latvia were less troubling but still moving in the wrong direction.

Countries with the Smallest Improvement
Fixed Broadband Download Speed

November 2016 – November 2017
Year Over Year Change November 2017 Speed (Mbps)
Algeria -23.9% 3.76
Ecuador -9.1% 10.40
Latvia -6.5% 47.25
Tunisia -3.2% 6.90
Iraq -1.1% 7.87
Syria -0.3% 7.12
Taiwan 0.5% 42.32
Maldives 1.0% 12.04
Namibia 1.2% 9.74
Jamaica 1.5% 19.11

Performance in the world’s most populous countries

With 57% of the world’s population, any internet performance improvements seen in the world’s ten most populous countries have a wide reach. Pakistan came out on top of the world’s largest countries with a 56.2% jump in mobile download speed during the past 12 months. India came in second in this category at 42.4% and Brazil third at 27.6% .

World’s Most Populous Countries
Improvement in Mobile Downloads

November 2016 – November 2017
Year Over Year Change November 2017 Speed (Mbps)
Pakistan 56.2% 13.08
India 42.4% 8.80
Brazil 27.6% 16.25
Japan 23.5% 21.67
United States 22.0% 26.32
Russia 19.2% 15.80
Indonesia 18.1% 9.73
China 3.3% 31.22
Bangladesh -7.4% 4.97
Nigeria -8.4% 9.90

At the other end of the spectrum, Nigeria’s mobile download speed actually dropped 8.4% and Bangladesh’s dipped 7.4%. China showed only a modest 3.3% increase in mobile download speed in 2017.

On the fixed broadband side, India came out on top of the world’s most populous countries for improvements to download speed during the past 12 months with an increase of 76.9%, beating China’s second place 42.3% increase and a 37.3% gain in the U.S.

World’s Most Populous Countries
Improvement in Fixed Broadband Downloads

November 2016 – November 2017
Year Over Year Change November 2017 Speed (Mbps)
India 76.9% 18.82
China 42.3% 61.24
United States 37.3% 75.94
Japan 20.7% 73.51
Indonesia 18.9% 13.38
Brazil 18.5% 17.80
Pakistan 15.5% 6.13
Russia 14.6% 36.90
Bangladesh 13.7% 16.14
Nigeria 3.8% 9.53

Nigeria again came out at the bottom of the world’s largest countries, this time with a 3.8% increase in download speed over fixed broadband.

We’ll revisit global internet speeds periodically here on our blog, but you can keep up to date on the latest trends in worldwide internet speeds by visiting the Speedtest Global Index. It’s updated every month with individual country data and, now, global averages. Keep track of your country’s performance and see how you rank against the world.

Ookla retains ownership of this article including all of the intellectual property rights, data, content graphs and analysis. This article may not be quoted, reproduced, distributed or published for any commercial purpose without prior consent. Members of the press and others using the findings in this article for non-commercial purposes are welcome to publicly share and link to report information with attribution to Ookla.

| February 4, 2022

The OECD Uses Speedtest® Data to Improve Broadband Access and Address Digital Deserts

Ookla® maintains a data sharing partnership with the Organisation for Economic Co-operation and Development (OECD) as part of our Ookla for Good™ initiative. The OECD leverages data from the Ookla for Good open data initiative in their evaluation of broadband speeds across provinces within countries, including for rural and remote regions where data is often more difficult to find through administrative resources. The collaboration and analysis supports efforts to close the rural-urban connectivity divide on a global scale. For this purpose, the OECD recently published a report and summary blog post both studying access to fixed broadband in rural areas: “Bridging Digital Divides in G20 Countries” using data from Speedtest by Ookla Global Fixed Network Performance Map Tiles global fixed network performance maps corresponding to Q4 2020.

The report explores policies to reduce the disparity of connectivity between regions including targeted funding to support massive broadband and infrastructure investment projects after detailing the scope of network inequality among rural digital deserts that lack access to high-speed internet. The COVID-19 pandemic has highlighted that reliable internet access is a necessity as more people than ever before transition more of their lives online to attend work, school, and other virtual events. Despite the increasing reliance on the internet to participate in society, many rural communities have been left behind when it comes to fast and reliable internet. While internet traffic has increased over 1,000x throughout the past two decades, digital deserts are missing the necessary infrastructure to support network traffic in 2022 and beyond.

Key findings

  • Broadband download speeds vary greatly. The OECD report found that poor data collection and self-reporting issues can result in inaccurate data on network access and reliability. Using Ookla for Good open data, the OECD uncovered the depth of internet access inequality in digital deserts. This data demonstrated that rural areas are massively behind, averaging 31% slower than the mean national download speed and 52% slower than cities during Q4 2020.
  • Funding broadband improvements generates meaningful change. The OECD report discusses how many countries now view internet connectivity as a basic right, and many nations have put plans into place to improve access to broadband. The OECD also found that increasing competition and reducing network deployment costs alone is not enough for rural regions, even if they have proven to be investments that can help G20 countries expand their network coverage affordably. Furthermore, several studies by U.S. economists estimate that having access to broadband access saves households between $1,500 and $2,200 annually, which could have massive global economic impacts.
  • The importance of private and public sector partnerships remains integral to increasing access and promoting competition. The OECD looks to both national and sub-national governments to generate attention for broadband issues. In addition to policies specifically for rural areas, OECD points to policies that increase competition, working in concurrence with public investment to subsidize private investment in broadband for areas that may not otherwise receive coverage. For example, increased competition in Mexican broadband led to 84% decline in price in mobile broadband costs, while adding 72 million users from 2012 through 2020. The OECD report also provides information on the Quebec regional government’s 50-50 funding initiative to service 150,000 new rural homes through private network operators.
  • Bridging the “connectivity divide”means improving digital literacy. The connectivity divide is a term used to describe areas with disadvantaged groups and low population density. Not only do these areas lack access to broadband, but many individuals lack basic digital skills. Addressing the issues of both connectivity and digital literacy is paramount to strengthening the economic and social revitalization of these areas. Several of the OECD countries have taken measures to improve digital literacy: France has offered individual training accounts for upskilling, Australia has offered rural skills training initiatives to provide skills customized to regional needs, and Canada has provided digital literacy funds and youth programs.

We’re proud to partner with organizations like the OECD and empower them with data that ultimately creates a better, faster and more accessible internet across the world. Read the full report or click here to learn more about Ookla for Good.

Ookla retains ownership of this article including all of the intellectual property rights, data, content graphs and analysis. This article may not be quoted, reproduced, distributed or published for any commercial purpose without prior consent. Members of the press and others using the findings in this article for non-commercial purposes are welcome to publicly share and link to report information with attribution to Ookla.

| January 30, 2022

5G in Thailand: AIS Leads the Market

AIS and TrueMove H drive early 5G adoption

Thailand was one of the first markets to launch 5G in the Asia Pacific region, with AIS and TrueMove H both launching commercial 5G services during Q1 2020, shortly after the conclusion of the country’s 5G auction. Driving 5G adoption in the market is one of the primary objectives for AIS and TrueMove H — both have begun reporting the number of 5G connections on their networks — and had each targeted 2 million by the end of 2021.

The regulator, The National Broadcasting and Telecommunications Commission (NBTC), has been instrumental in establishing Thailand as a leading 5G market in the region. In February 2020, NBTC assigned spectrum for 5G use across low (700 MHz), mid (2,600 MHz) and high (26 GHz) frequency bands, and plans a further auction of mid-band spectrum in 2022 in the 3.5 GHz band, which was vacated in September 2021 by a Thaicom, a satellite provider. In terms of operator allocations:

  • AIS was first to launch 5G services in the market in February 2020, having acquired licenses across low, mid and high-frequency bands, giving it a strong mix of coverage and capacity spectrum.
  • TrueMove H followed, launching 5G in March 2020, having acquired spectrum in both the mid and high-frequency bands.
  • dtac launched 5G services in Q1 2021, only utilizing low-frequency spectrum in the 700 MHz band.
  • State-owned operator National Telecom (NT), formed from the merger of CAT and TOT, is yet to launch 5G services in the market. NT brings together spectrum across both low and high frequency bands and was expected to reveal a 5G investment plan, which could include handing the spectrum back to the regulator, by the end of 2021. However NT is still to indicate its plans at this date.

5G performance varies by operator in Thailand

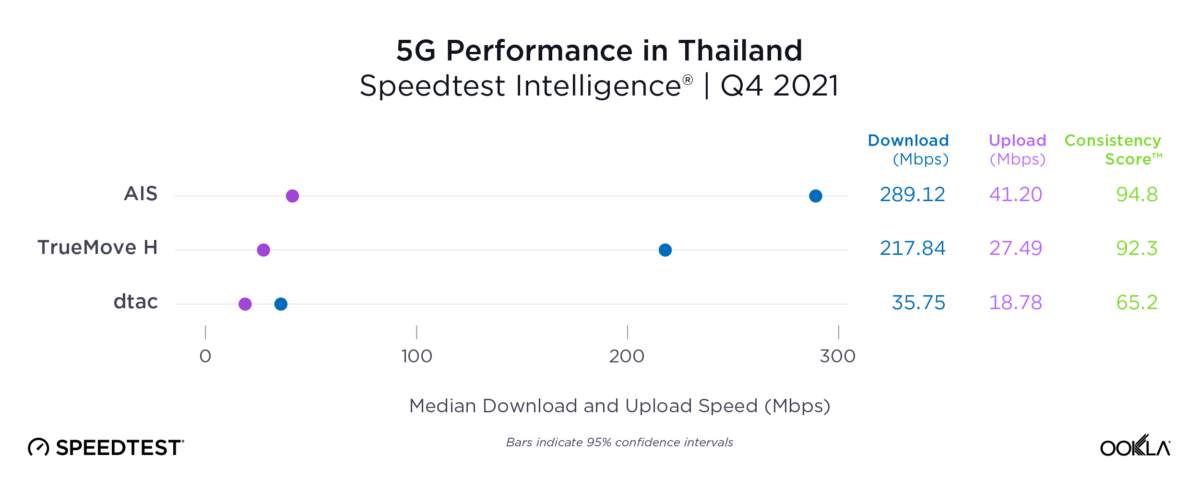
These significant differences in spectrum holdings between the Thai operators have helped to drive very different 5G performance profiles, particularly when comparing AIS and TrueMove H with dtac. AIS led the market on both median 5G download and upload speeds, recording 289.12 Mbps and 41.20 Mbps, respectively, in Q4 2021 according to [Speedtest Intelligence](https://www.ookla.com/speedtest-intelligence)® data. TrueMove H followed, with a median 5G download speed of 217.84 Mbps and upload of 27.49 Mbps. The lack of mid-band spectrum appears to be limiting dtac which showed a median 5G download speed of 35.73 Mbps and 18.78 Mbps upload.

Both AIS and TrueMove H maintained strong 5G Consistency Scores in Q4 2021, with well over 90% of Speedtest Intelligence samples on their 5G networks exceeding the threshold of 25 Mbps download and 3 Mbps upload, indicating widespread coverage of mid-band spectrum. dtac, on the other hand, recorded a much lower 5G Consistency Score, again driven by its lack of mid-band spectrum, with just under two-thirds of samples on its 5G network meeting the criteria.

5G Availability differentiates operators in Thailand

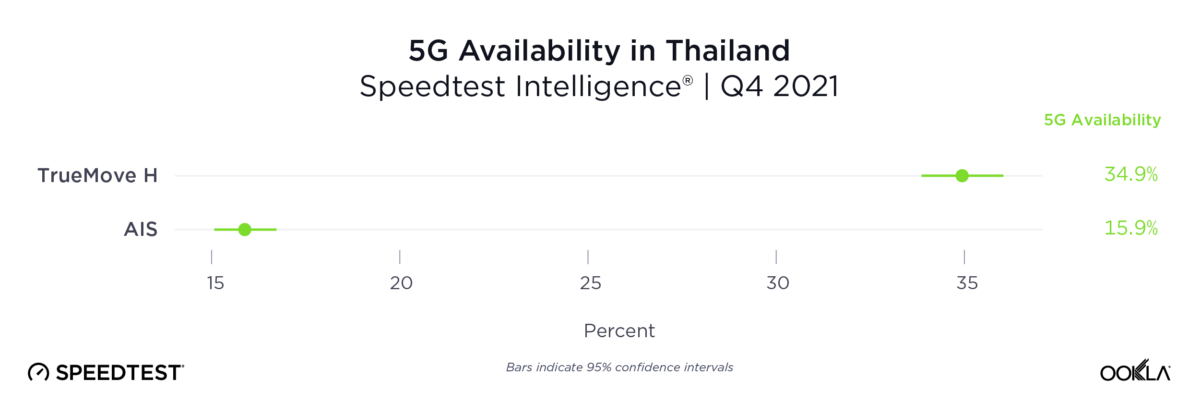
While AIS led on 5G performance and consistency, TrueMove H led the market for 5G Availability, the percentage of users on 5G-capable devices that spend a majority of time with access to 5G networks, with 34.9%, well above AIS with only 15.9%, and with dtac in the low single digits. Availability is normally a good proxy for coverage, however the disparity we see between TrueMove H and AIS is largely down to the fact that AIS requires users to subscribe to a 5G tariff, as opposed to TrueMove H which allows greater access to 5G-enabled devices on its network.

Regional 5G performance in Thailand

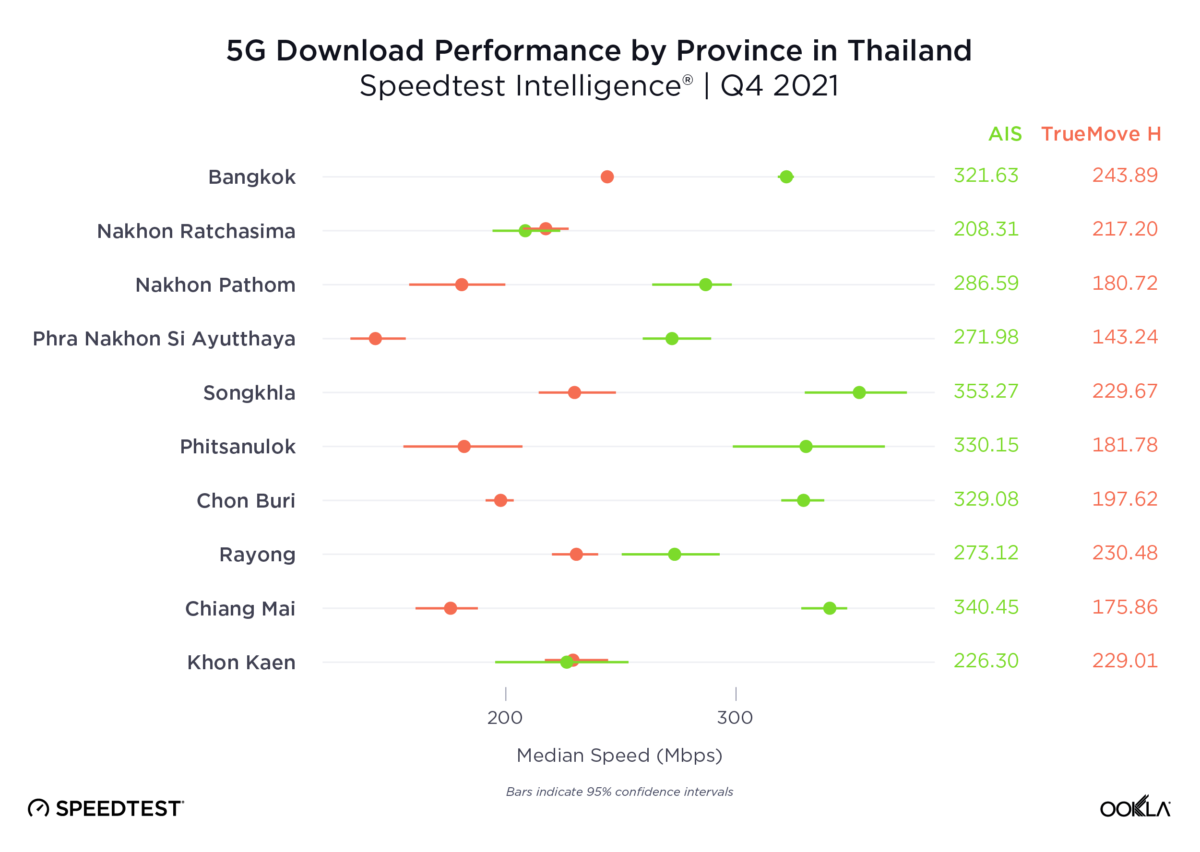
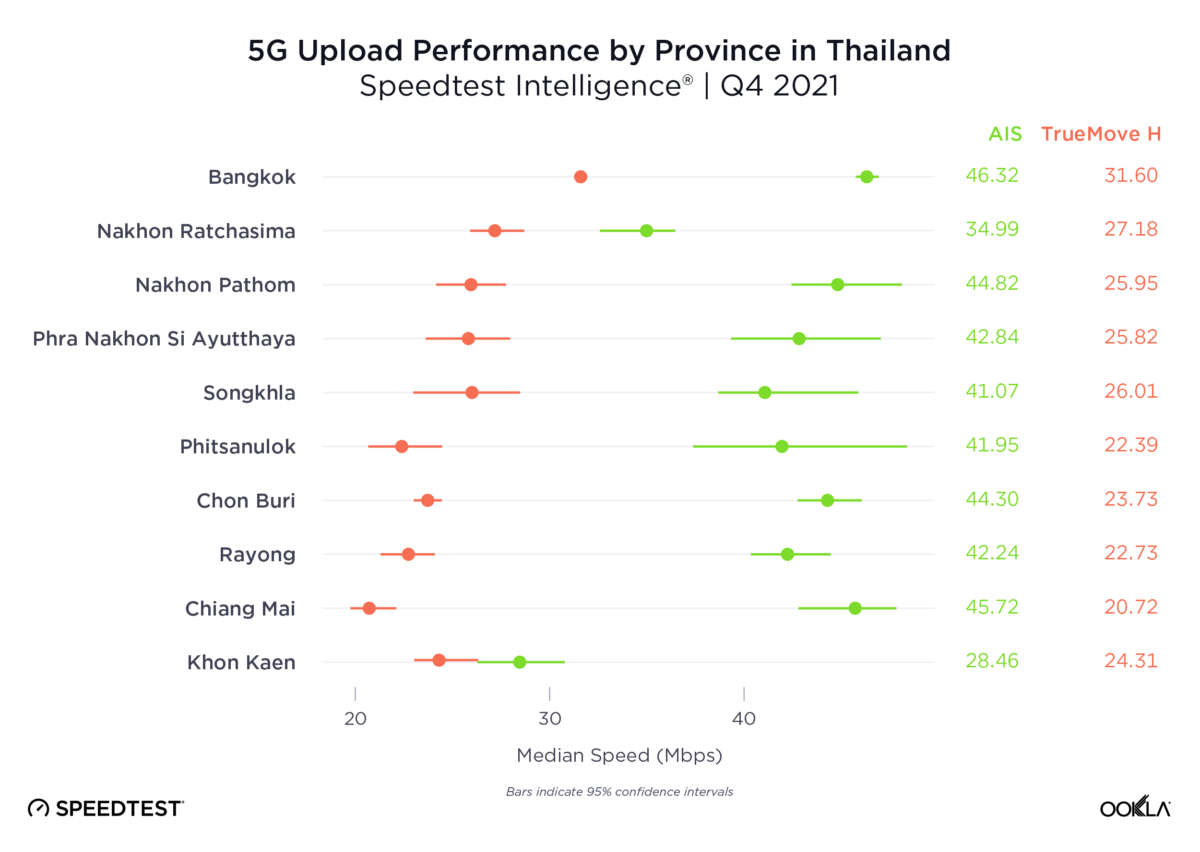
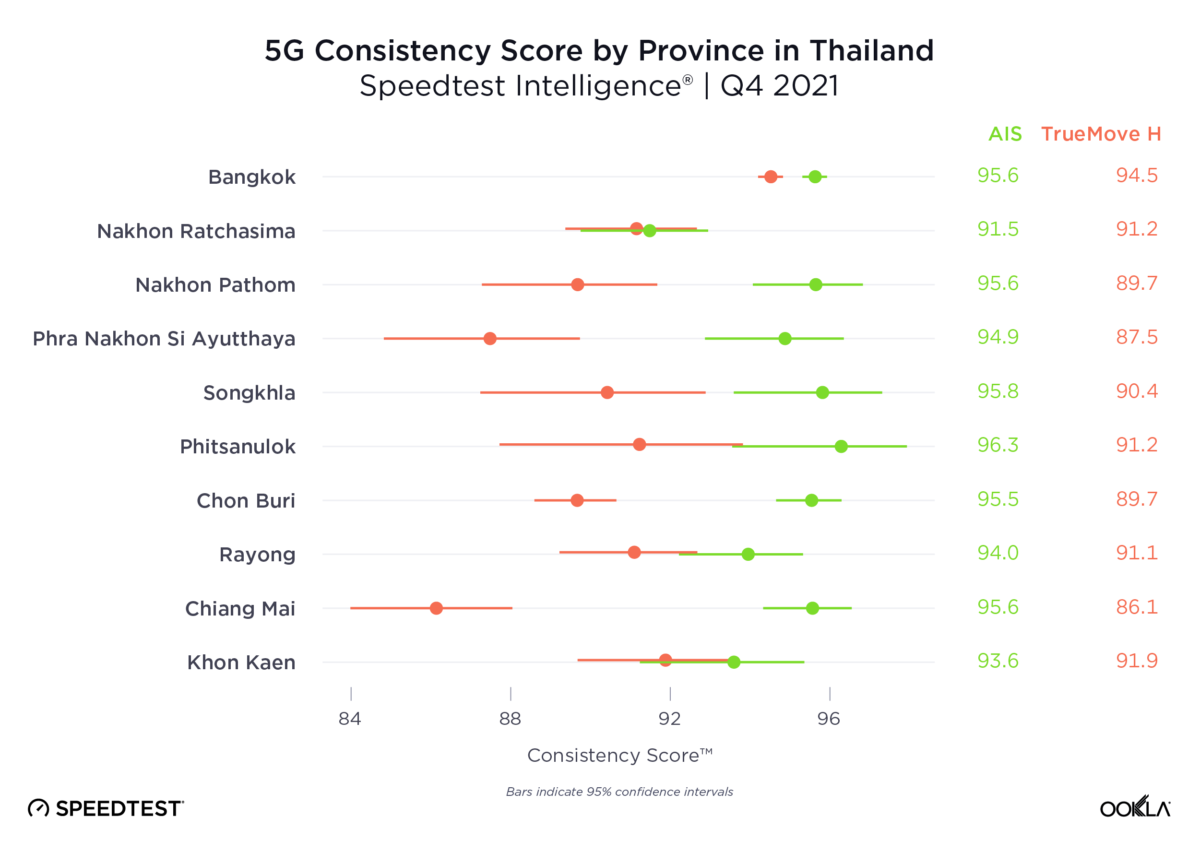
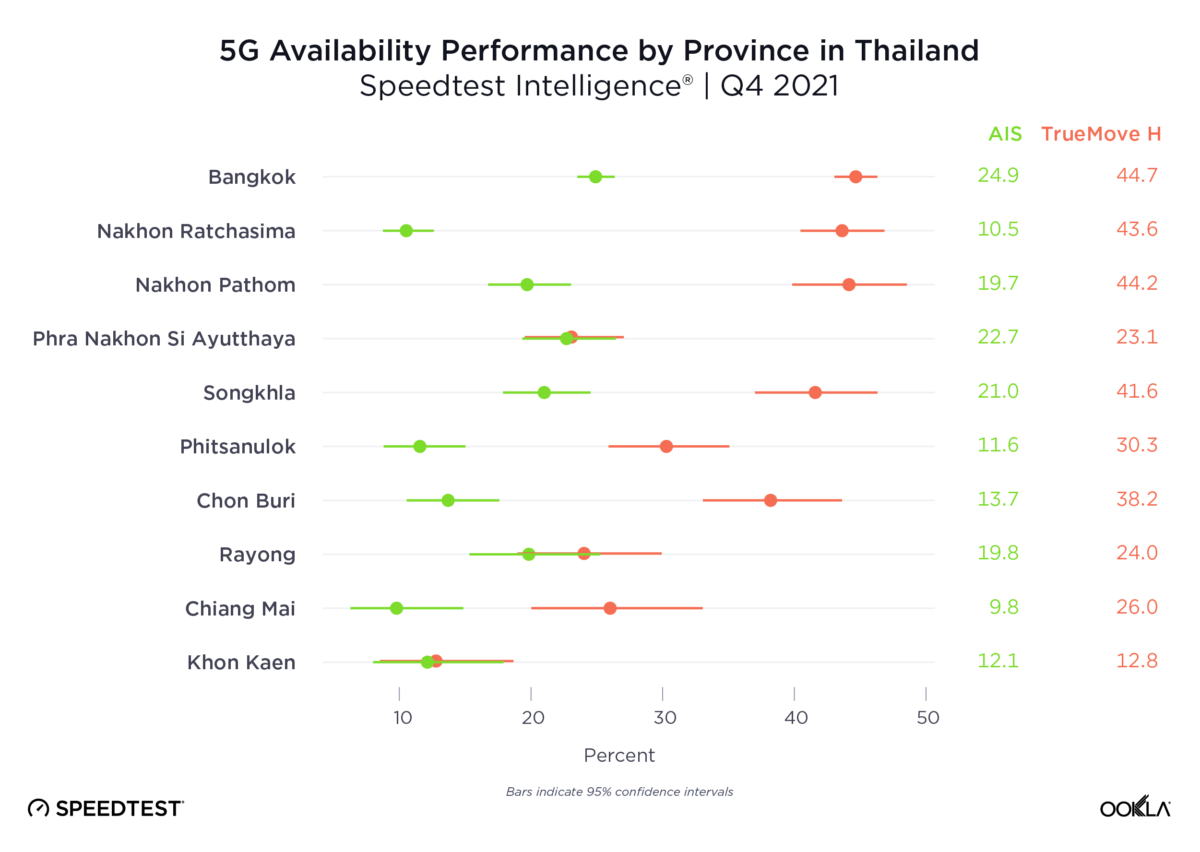
Every operator takes a unique approach to regional strategy, so we have looked closely at 5G performance in select regions during Q4 2021 to see what’s working. We included regions with a minimum threshold of 300 samples where both sample size and network speeds remained stable over the time period. Given the large disparity in 5G performance between dtac and the rest of the market, we have removed dtac from our regional analysis.

AIS led median 5G download speeds in eight of the ten provinces sampled and AIS led on 5G upload speeds across all provinces. AIS also led TrueMove H on 5G Consistency in eight of the provinces sampled, with the difference between the two in both Khon Kaen and Nakhon Ratchasima marginal.

The most significant performance gap between AIS and TrueMove H is in Chiang Mai, where AIS recorded a median 5G download speed of 340.45 Mbps, compared to TrueMove H (175.86 Mbps), and an upload speed of 45.72 Mbps, compared to TrueMove H with 20.72 Mbps. The performance gap between the two operators in some of Thailand’s other most populous provinces, including Bangkok, Chon Buri and Songkhla was also significant in favor of AIS. In northeastern Thailand, the two operators in the two most populous regions of Nakhon Ratchasima and Khon Kaen showed similar 5G download speeds to one another, although AIS was faster in terms of median 5G upload speeds and narrowly ahead on 5G Consistency.

5G Availability paints a different picture, with TrueMove H ahead in many of the provinces we sampled, but by a margin that varied significantly between provinces. TrueMove H established a lead of 20 percentage points or more in the provinces of Chon Buri, Rayong, Phra Nakhon Si Ayutthaya, Nakhon Pathom, Chiang Mai and Bangkok. There was no winner in 5G Availability between the two operators in Phra Nakhon Si Ayutthaya, Rayong and Khon Kaen.

Thailand 5G Signal Strength

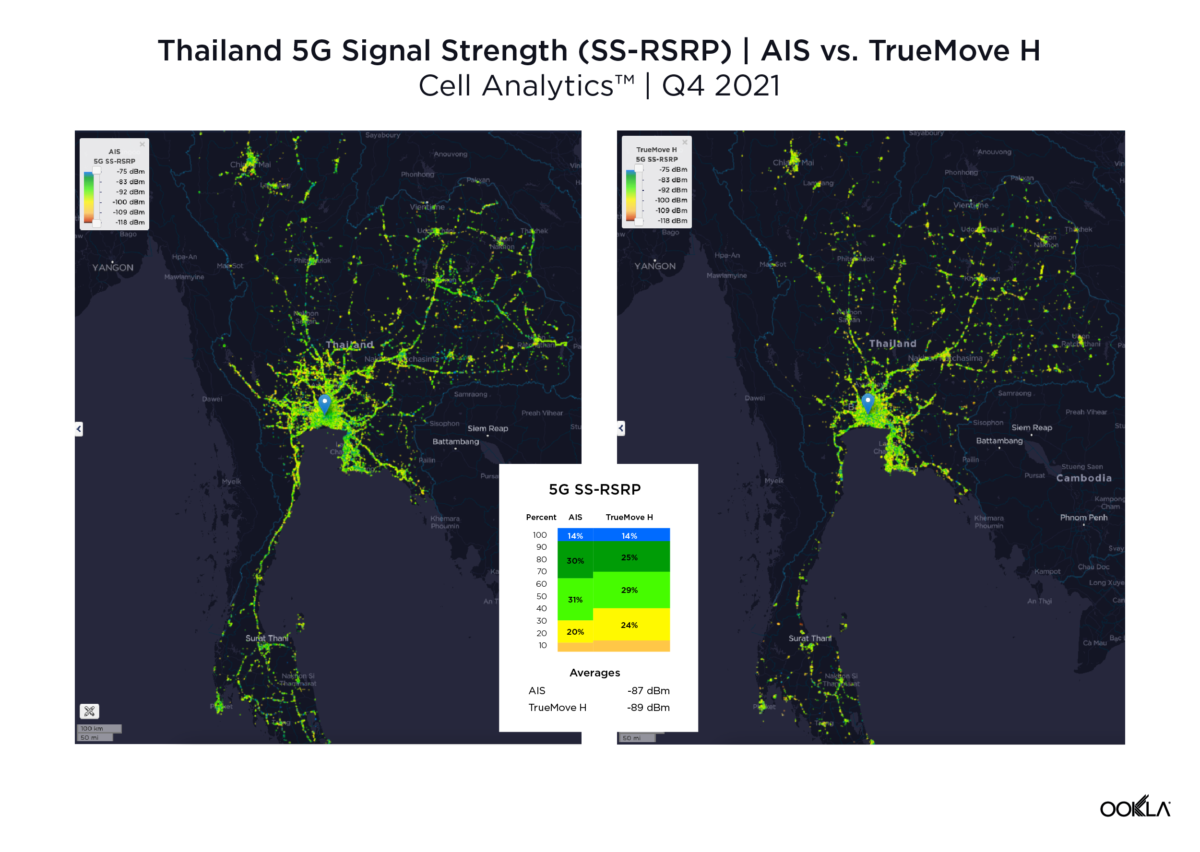
With 5G Availability between AIS and TrueMove H skewed, we examined 5G signal strength, using the SS-RSRP metric, as a more accurate reflection of 5G coverage across Thailand. Ookla® Cell Analytics™ showed strong 5G signal for both operators with wide coverage in the heavily populated regions of the country during Q4 2021. However, it’s also clear that AIS had more samples along arterial routes between Thailand’s various provinces. Based on overall 5G signal strength AIS edged out TrueMove H, with 5% more samples achieving -83 dBm or better, indicating that on average AIS customers are able to maintain a stronger 5G connection across the country.

Changes on the horizon for 5G in Thailand

While AIS leads the market in terms of 5G performance in Q4 2021, the release of further spectrum in the 3.5 GHz band, due to be auctioned by the regulator this year, could drive changes in the market. Other changes are already underway, with TrueMove H and dtac announcing in November 2021 plans to merge their businesses, a move which would create a new market leader with an overall market share in excess of 50% as of Q4 2021, according to GSMA Intelligence. The proposed merger will draw regulatory attention, as it will establish a virtual duopoly in the market. In light of National Telecom’s delay in building out its 5G business plan, this raises concerns that the market for 5G in Thailand will become less competitive.

Ookla’s suite of products can help you benchmark and monitor your network. Learn more about how we can help you here.

Ookla retains ownership of this article including all of the intellectual property rights, data, content graphs and analysis. This article may not be quoted, reproduced, distributed or published for any commercial purpose without prior consent. Members of the press and others using the findings in this article for non-commercial purposes are welcome to publicly share and link to report information with attribution to Ookla.
| May 2, 2017

How I Maximized the Speed of My Non-Gigabit Internet Connection

Tips from an engineer at Ookla

My name is Brennen Smith, and as the Lead Systems Engineer at Speedtest by Ookla, I spend my time wrangling servers and internet infrastructure. My daily goals range from designing high performance applications supporting millions of users and testing the fastest internet connections in the world, to squeezing microseconds from our stack — so at home, I strive to make sure that my personal internet performance is running as fast as possible.

I live in an area with a DOCSIS ISP that does not provide symmetrical gigabit internet — my download and upload speeds are not equal. Instead, I have an asymmetrical plan with 200 Mbps download and 10 Mbps upload — this nuance considerably impacted my network design because asymmetrical service can more easily lead to bufferbloat.

blinky lights

We will cover bufferbloat in a later article, but in a nutshell, it’s an issue that arises when an upstream network device’s buffers are saturated during an upload. This causes immense network congestion, latency to rise above 2,000 ms., and overall poor quality of internet. The solution is to shape the outbound traffic to a speed just under the sending maximum of the upstream device, so that its buffers don’t fill up. My ISP is notorious for having bufferbloat issues due to the low upload performance, and it’s an issue prevalent even on their provided routers.

As a result, I needed the ability to shape traffic over 200 Mbps speeds — this prevented me from using MIPS or ARM based routers, as they don’t have the CPU horsepower to route over ~150 Mbps without hardware offload (I was actually using Tomato on an Asus AC68U at the time). Very few routers provide the ability to shape a single direction of traffic in software, thus I had to find a solution that could handle bi-directional shaping over 200Mbps. While many of the Ookla Engineering team use Ubiquiti Edge Routers, their CPU limits their traffic shaping performance to the following:

  • ERLite-3 and ERPoe-5: below 60 Mbps most likely will work, above 200 Mbps most likely will not work
  • ER-8: below 160 Mbps most likely will work, above 450 Mbps most likely will not work
  • ERPro-8: below 200 Mbps most likely will work, above 550 Mbps most likely will not work
  • ER-X and ER-X-SFP: below 100 Mbps most likely will work, above 250 Mbps most likely will not work

Editor’s note: Since this article has been published, it is now possible on recent firmwares to perform traffic shaping in a single direction on the EdgeRouter platform.

Requirements

Thus, my router requirements were as follows:

  1. x86-64 based hardware with a TDP less than 15w.
  2. Strong support for native IPv6—many studies have shown
    IPv6 leads to a faster web browsing experience.
  3. Ability to perform Point to Point VPN and Split VPN tunnels.
  4. 802.1Q VLAN Tagging — I run three separate logical networks that correspond to respective SSIDs on the APs:
    • LAN network: the normal network we use in daily life. Has access to split VPN tunnels, Sonos devices, FreeNas storage server and Xen hypervisors.
    • GUEST network: network we place guests on, has no access to other networks/resources and is inbound rate limited to 100 Mbps.
    • IOT network: network for IOT devices, has no access to any other networks beyond WAN and is inbound rate limited to 5 Mbps. This is split off for security reasons, and the IOT devices we use (
      TPLink Smart Home, alarm system, security cameras) handle NAT translation without issue. (Note: these are affiliate links.)

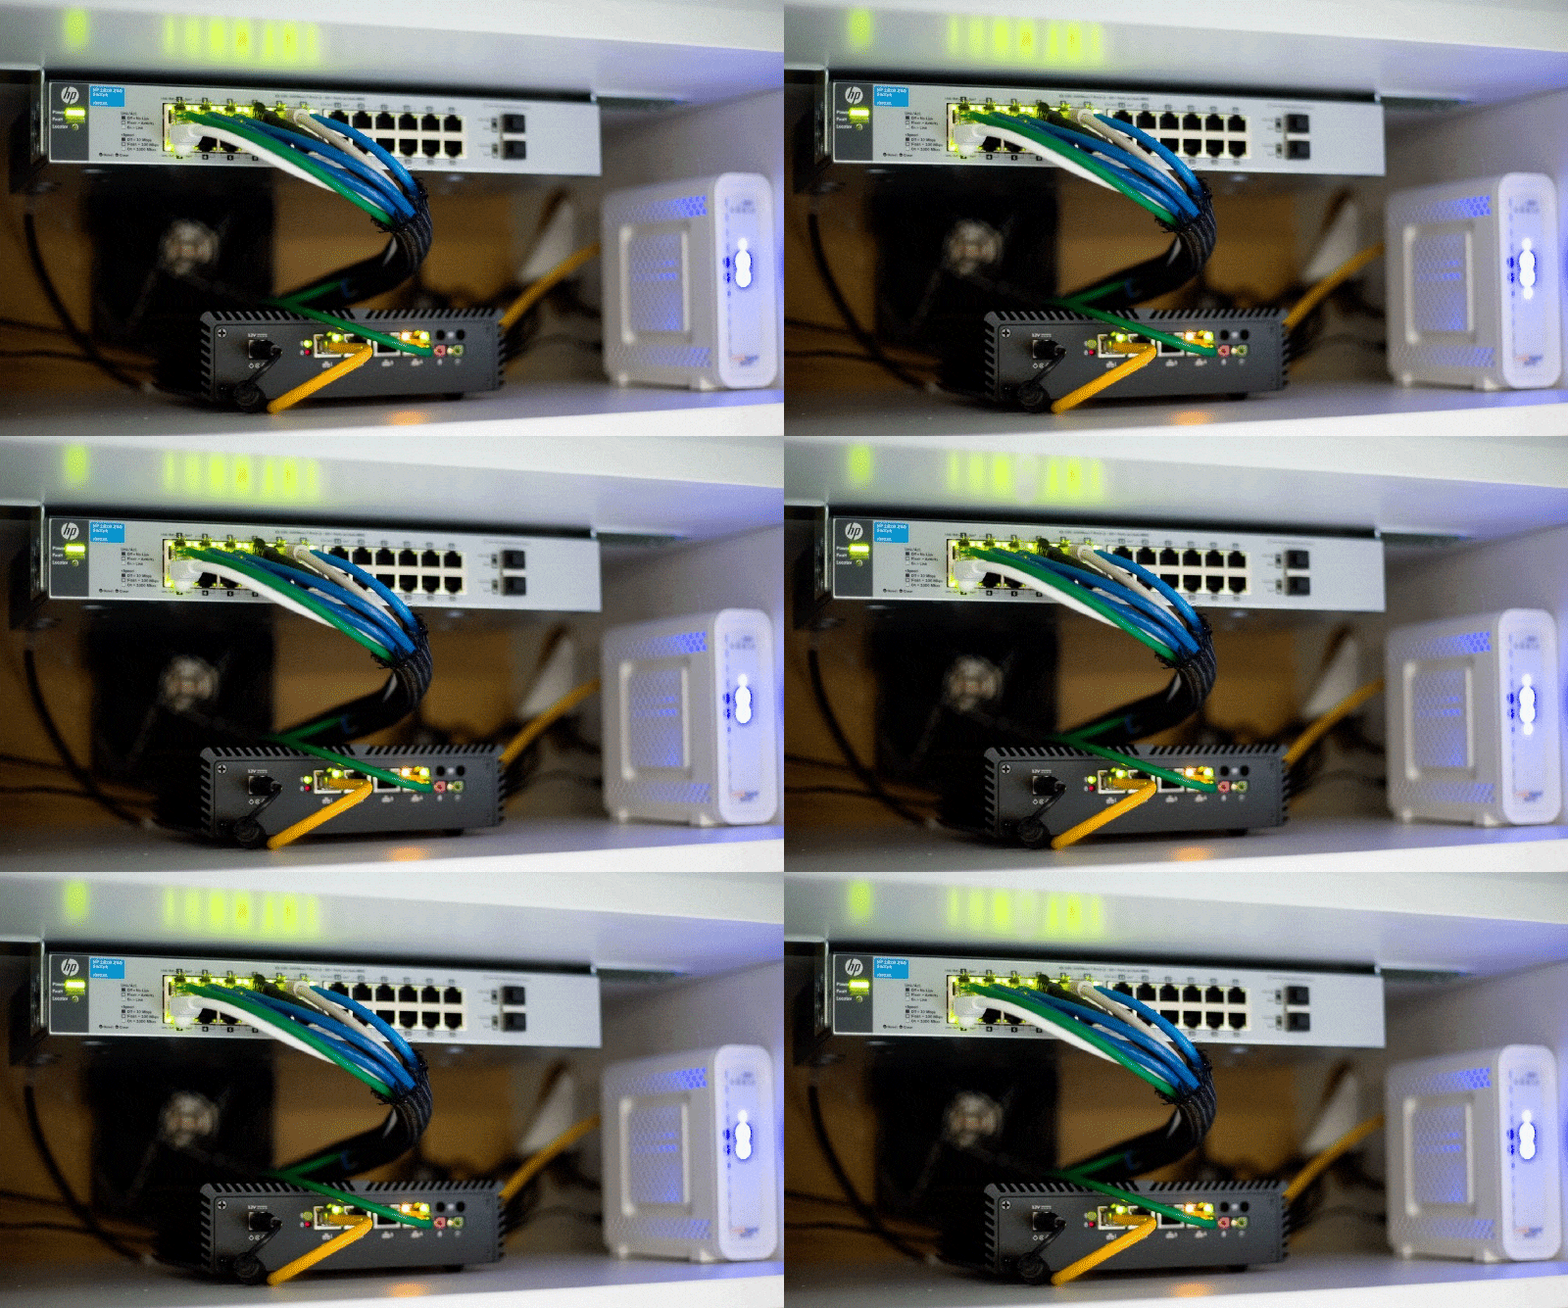
    I grabbed this small x86–64 server and combined it with 4GB of Kingston DDR3L and a 32GB Adata SSD. The key points to this server are fewer but higher frequency cores and 4xGBE Intel NICs. Intel NICs have some of the best support in the Open Source world, and it’s highly recommended to stay far away from the cheaper companies. This machine doesn’t have AES-NI or Intel Quickassist, but it hasn’t had any issues with encryption/decryption at line rate for the VPNs.

    The actual routing

    Once assembled, I installed PFSense 2.3 for handling the actual routing. For those who haven’t used PFSense, it’s an incredible routing operating system that is based on FreeBSD. It easily met the requirements above, and vastly surpassed them. I was able to apply CodelQ AQM shaping to outbound traffic to prevent bufferbloat, along with splitting the ISP provided IPv6 /60 into /64’s for my 3 VLANs.

    In my research and testing, I also evaluated IPCop, VyOS, OPNSense, Sophos UTM, RouterOS, OpenWRT x86, and Alpine Linux to serve as the base operating system, but none were as well supported and full featured as PFSense. The closest runner up to PFSense was VyOS as I love the declarative CLI interface and read only primary/backup partition system, but there were a few reasons which blocked me from using it:

    • VyOS doesn’t support IPv6 Prefix Delegation in the stable branch.
    • The stable branch is based on Debian Squeeze, which is quite old. There’s a Debian Jessie version, but it’s considered experimental.
    • Sadly, their development team and pace has shrunk considerably since the initial Vyatta fork.

    PFSense isn’t without its issues, but it’s perfect for my use case. The biggest issue I had was the default DNS configuration. On PFSense, the DNS server (unbound) is set to function as a recursive resolver rather than a forwarding server. While this might have a security benefit in edge cases, the performance impact on lookups is substantial — web browsing was jerky as domain-sharded assets had slow lookups.

    QoS Settings

    Some people have asked what QoS settings I use in PFSense. I avoided the default wizard QoS settings because in general, I try to avoid proto/port classification. The majority of traffic on the modern web is TCP 80/443 with a smattering of UDP 53, so HSFC class based QoS isn’t as effective as it used to be. However, every case is different, so I’d love to hear about your rule setups.

    I essentially emulated FQ-CODEL by placing a FAIRQ scheduler in front of a CODELQ queue. CODEL is capable of prioritizing streams and dropping packets when backoff is necessary, so it’s been highly effective in high contention scenarios. For the very curious, here’s a representation of the QoS tree I have setup in PFSense:

    WAN - Scheduler: FAIRQ | BW: 12531 Kbps  
     └── WAN_main - Options: Codel Active Queue | BW: 12531 Kbps
    GUEST_LAN - Scheduler: FAIRQ | BW: 100 Mbps  
     └── GUEST_LAN_main - Options: Codel Active Queue | BW: 100 Mbps
    IOT_LAN - Scheduler: FAIRQ | BW: 5 Mbps  
     └── IOT_LAN_main - Options: Codel Active Queue | BW: 5 Mbps
    LAN - (No limits/queues)

    Why 12,531 Kbps?

    For the eagle eyes out there — why was my upload speed shaped to 12,531 Kbps when my connection is 10 Mbps up?

    The answer is two-fold. First, DOCSIS connections are often over-provisioned to make sure that, even with loss in the cable/modem, users will probably hit the speeds they pay for. So running a Speedtest on my 10 Mbps connection without shaping actually revealed ~13 Mbps. However, I needed to find the point that maximized the upload speed while not filling the buffers of the upstream device.

    To find this point, many tutorials recommend “take a Speedtest, and then subtract 20%” — I argue that this is incorrect, as a flat percentage may be too much or not enough. To find the optimum point — I essentially did the following pseudocode:

    Turn on QOS with upload at expected speed
    Start a few massive uploads
    while (true):  
        if (UDP loss > .5% and ICMP latency change is impactful):  
            reduce QOS upload speed by 1%  
        else:  
            increase QOS upload speed by 1%

    This can easily be done by hand, and takes about 5 minutes of tweaking to perform. Thus, I settled at 12,531 Kbps as the highest upload speed possible without any impact on my service.

    Distribution to client devices

    The router then trunks to a HP Procurve 1810G switch, that then passes tagged VLAN traffic to three Ubiquiti UniFi AC Pro AP’s spread around the house. Untagged traffic then goes to other ethernet based devices.

    PFSense has great monitoring tools to measure the health and quality of a connection, but I wanted to track the speed of my connection. I built a little Node and HTML5 app called speedlogger that takes a Speedtest every 8 hours and plots it in a pretty graph.

    Was it worth it?

    Absolutely.

    As with any experiment, any conclusions need to be backed with data. To validate the network was performing smoothly under heavy load, I performed the following experiment:

    1. Ran a ping6 against speedtest.net to measure latency.
    2. Turned off QoS to simulate a “normal router”.
    3. Started multiple simultaneous outbound TCP and UDP streams to saturate my outbound link.
    4. Turned on QoS to the above settings and repeated steps 2 and 3.

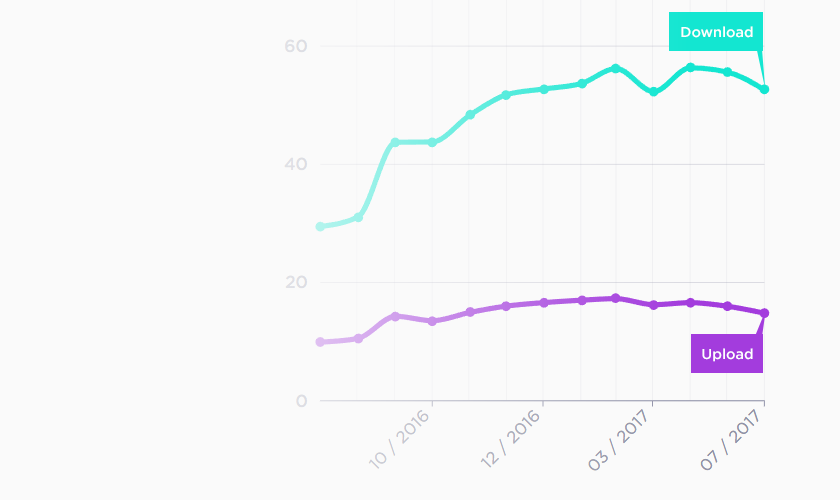
    As you can see from the plot below, without QoS, my connection latency increased by ~1,235%. However with QoS enabled, the connection stayed stable during the upload and I wasn’t able to determine a statistically significant delta.

    That’s how I maximized the speed on my non-gigabit internet connection. What have you done with your network?

    If you made it to the end of this article, you’re probably pretty nerdy like us. We are looking for a skilled Systems Engineer and Senior Software Engineer — if that’s up your alley, check out the postings on Workable.

    Ookla retains ownership of this article including all of the intellectual property rights, data, content graphs and analysis. This article may not be quoted, reproduced, distributed or published for any commercial purpose without prior consent. Members of the press and others using the findings in this article for non-commercial purposes are welcome to publicly share and link to report information with attribution to Ookla.

    | May 3, 2017

    Are You Gigabit Ready? 17 Tips to Help You Get the Highest Speeds Possible

    The future of the internet is fast. Fourteen times faster than the 70 Mbps the US averaged for download speed in March, gigabit-speed fixed broadband is still rare, but it’s making appearances in locations over the globe. Before you get too attached to the idea of downloading 1 billion bits of data per second, know that getting gigabit service and adjusting your set-up to achieve top speeds is harder than you might think.

    We’re here to offer a few tips to help you achieve the Speedtest results you dream of. Some of these will help you maximize your potential internet speeds even if gigabit is not available in your area.

    Factors you can’t control

    1. Is gigabit-level service available in your area?

    While internet service providers (ISPs), municipalities and companies like Google have been making headlines with gigabit (the ability to download 1 billion bits of information in one second), service is still rare (and expensive).

    Ask around to see if gigabit is available in your area. Google Fiber is one option in some cities. Also check with phone companies and smaller ISPs to see if they offer gigabit. Some forward-thinking governments in places like Longmont, CO; Grant County, WA and New Westminster, BC have even created their own fiber networks.

    2. What kind of infrastructure is your service delivered over?

    You’ll get the best speeds with fiber because you won’t have to deal with the noise or interference that occurs over copper lines. However, new coaxial technologies, namely DOCSIS 3.1, have the potential to provide gigabit speeds, but not symmetrically (see the next point). Finally, phone lines, used for DSL, absolutely won’t cut it at all.

    Having fiber doesn’t mean you’ll automatically have gigabit; the service still needs to be available in your area and you’ll likely pay more for it.

    3. Is the available service plan symmetrical?

    That is, are the advertised download and upload speeds the same? This varies by ISP, but asymmetrical service is more likely over coaxial connections — symmetrical gigabit service requires the robustness of a fiber optic connection. Asymmetrical service can lead to bufferbloat.

    4. Understand the network located upstream of you.

    And the quality of that network matters. If your ISP’s central office doesn’t have the bandwidth to support all the gigabit connections in your area, everyone will see slower speeds during peak usage times.

    This also applies to peer-to-peer connections. If you’re downloading games and/or streaming movies, your performance is impacted by both the quality of the network those applications are using and how fast those services allow content to be downloaded. Gigabit is great for ensuring that multiple users are having a consistent internet experience, but don’t expect to be downloading games from Steam at gigabit speeds.

    5. Data overhead makes 1 Gbps a theoretical number.

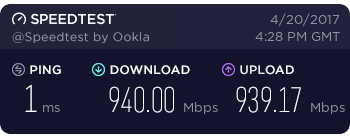
    Though perfect circumstances might allow you to send 1 billion bits of information per second, some of those bits are overhead (including preamble, inter-frame gaps and TCP) and your actual data throughput will be a little smaller. If there was no overhead, you might be able to achieve a Speedtest result of 997 Mbps, but you’re more likely to top out at 940 Mbps. For more details on the math, read this.

    What you can control

    6. Good quality wiring is essential.

    To achieve the fastest speeds possible, the most important thing you can do is use Cat 6 ethernet wiring to connect your devices to your modem and/or router. Cat 5e can do it but you’ll get less crosstalk using Cat 6. Plus, if you’re going to spend the money on new cables, it’s worth future-proofing your investment. Cat 5e supports up to up to 1,000 Mbps while Cat 6 supports ten times that. Also don’t run your data cabling parallel to power lines — interference from the power lines can cause interference in the ethernet cabling.

    7. Are both the ports and the CPU in your router gigabit-ready?

    Read the fine print when choosing a router. Not every consumer-grade router can support gigabit speeds over the ports in the back. And sometimes the ports support gigabit but the router’s CPU can’t keep up. In general, x86 processors are fastest, followed by ARM and then MIPS. You still need to check this even if your router was provided by your ISP.

    Typically you’ll find that recently-released and the more expensive consumer grade routers are up to the task. Here are two routers we recommend along with affiliate links to make your shopping easy:

    • Ubiquiti Edgerouter. The super advanced user will enjoy the pared-down customizability of this router. Many of the Ooklers use some version of this router. It doesn’t have Wi-Fi built in so be sure to get one or more compatible access points.
    • Velop Whole Home Wire Mesh. To set up your entire house at once, try this system. It comes pre-loaded with Speedtest so you can easily test your connection.

    8. Use a hardwired connection.

    While Wi-Fi technology is catching up, you’ll still likely see better speeds if you plug that Cat 6 ethernet cable directly into your computer.

    9. Check your adapter.

    Not all laptops have ethernet ports, so you’ll need an adapter for a hardwired connection. Make sure the adapter you’re using is gigabit capable. Thunderbolt and USB 3.0 adapters are usually good, but the performance of other adapters varies widely. And don’t forget, USB based adapters also add data overhead.

    wifi wave animation

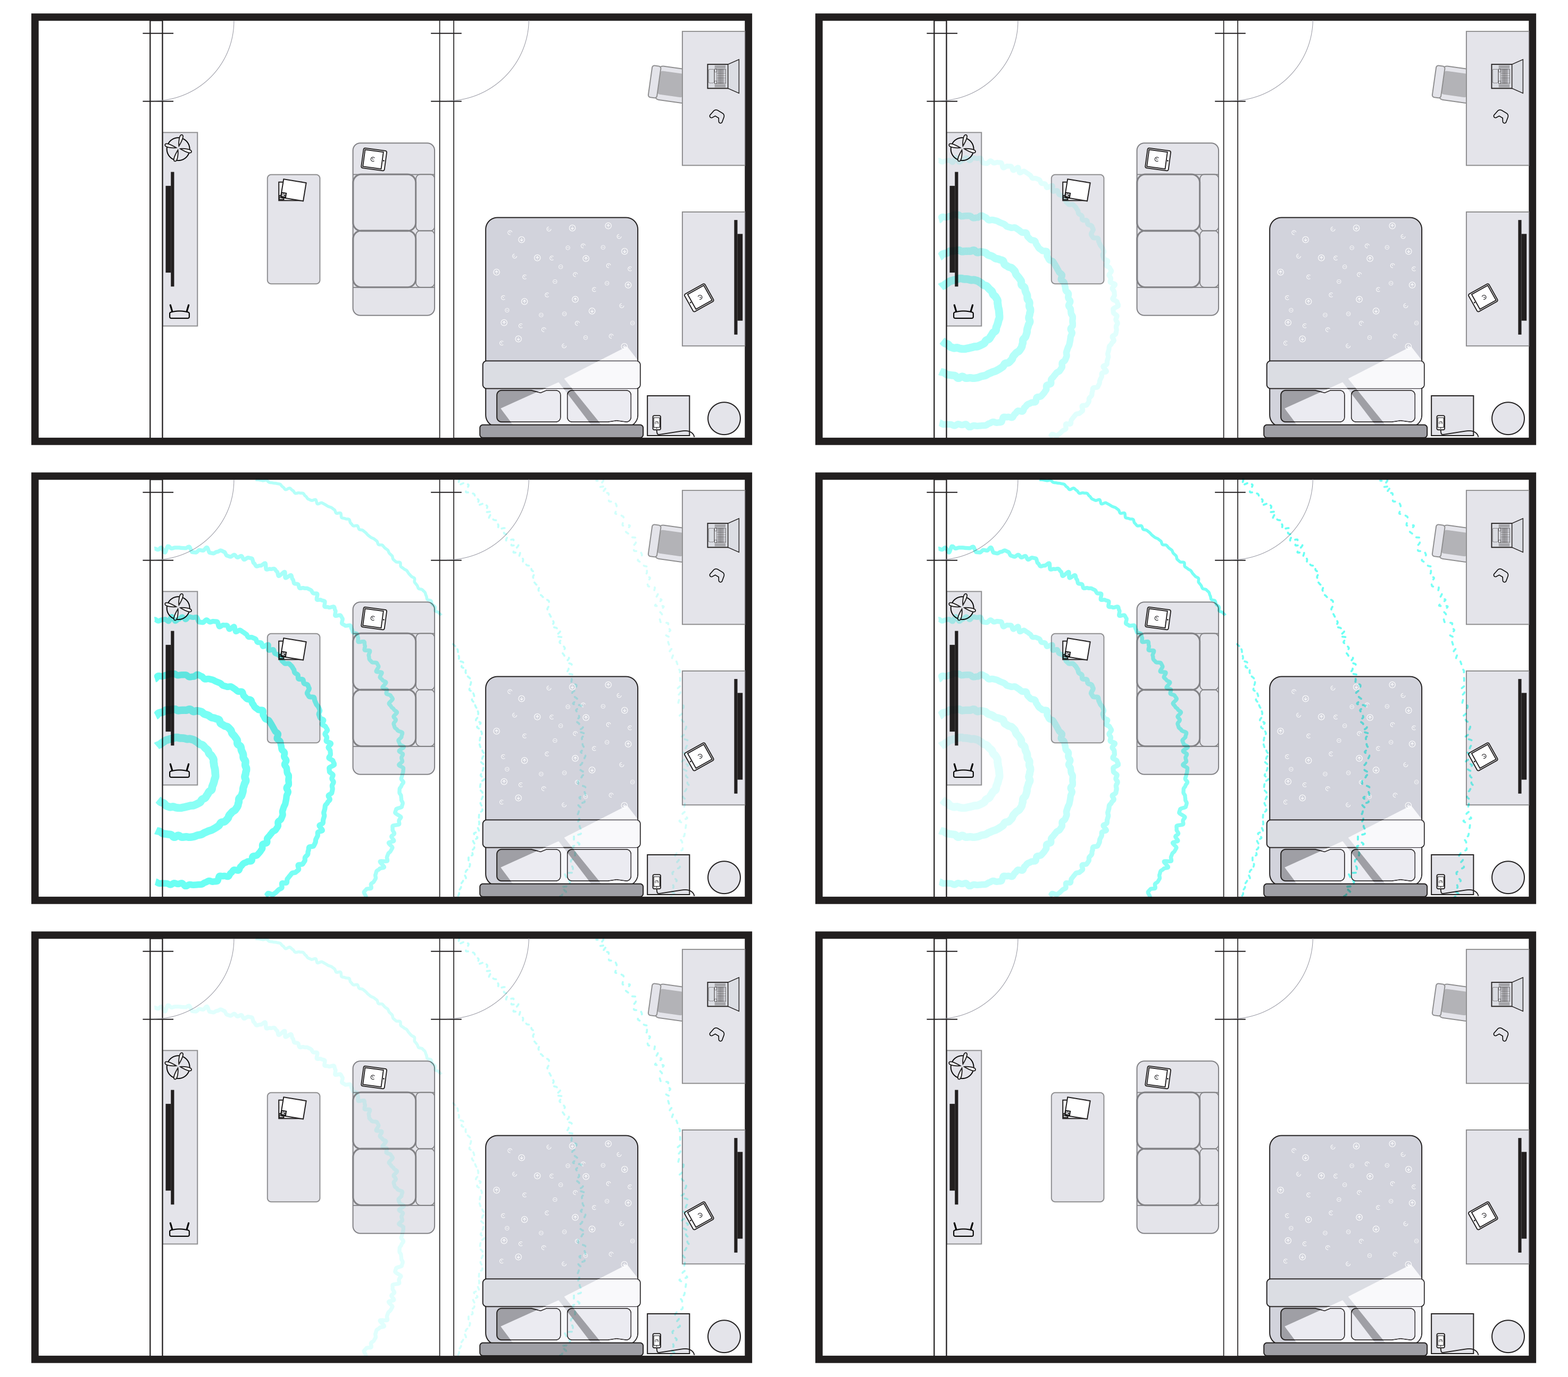
    10. If you must use Wi-Fi, pick a clear channel and sit close to your router.

    All kinds of things can interfere with your Wi-Fi signal and thereby slow down your connection: fluorescent bulbs, baby monitors or even a cheap pair of wireless headphones. This is critical for Wi-Fi performance as only one device can use the channel at a time. In addition, Wi-FI uses CSMA-CA to handle collisions — if it detects a collision on the channel, the Wi-Fi device will halt sending and wait until the channel is clear. Interference counts as collisions, so you will end up with a sporadic and halting connection with interference nearby.

    If your connection is clear, attenuation (signal drop over distance) is a very real problem when using Wi-Fi. The 2.4 GHz band handles attenuation better but is more subject to interference. The 5GHz band is less subject to interference but has more issues with attenuation. Either way, you’re still likely only to achieve speeds topping out around 600 Mbps.

    If you are on the 2.4 GHz band, make sure to chose from channels 1, 6, or 11 (or 14 if allowed by your country) — those are the only non-colliding channels at 20 MHz. At 40 MHz, you will pretty well consume the entire 2.4 channel spectrum, thus, it will be even more at risk of interference. For an illustration, click here.

    11. Make sure your computer is using the latest Wi-Fi standards.

    The nonprofit Wi-Fi Alliance keeps a close eye on these standards. In 2016 they announced Wi-Fi CERTIFIED ac standards which include Multi-User Multi-Input Multi-Output (MU-MIMO), 160MHz channels, quad-streams and extended 5GHz channel support. These standards change as technology improves, so check to make sure you’re working with the latest certifications. And just because your router supports these standards doesn’t mean your laptop or wireless device does.

    spot illustration

    12. Decipher the hype behind the marketing.

    For example, a wireless router that says it can support 4 gigs doesn’t necessarily mean it can support one 4 Gbps connection. It’s more likely that the device has four radios with 1 Gbps specified maximums (real world performance is likely to be slower).

    13. Stay up to date on router firmware, but don’t update on day zero.

    Vendors regularly release software updates for their routers to improve their stability, performance and security. It’s usually always the best option to stay up to date with these firmware patches. With that said, many of us Ooklaers wait anywhere from a week to a month to apply these patches (assuming they are not critical security updates) to make sure there are not any regressions or issues.

    14. Use our desktop apps to run your Speedtest.

    If you’re sure your setup is perfect but you’re still not seeing the Speedtest result you expect, download our free desktop apps for Windows or MacOS. Many lower performance systems can’t reach 1 Gbps via browser tests due to various limitations. Plus our desktop apps give you data on jitter and packet loss.

    Advanced options: For the tech savviest

    15. Is your network interface card (NIC) up to the task?

    Just being rated for 1000-Base-T may not be enough. NICs that use software offload instead of hardware offload are often found in older, cheaper computers and struggle to support gigabit speeds. Intel offers some of the best driver and hardware support on their NICs.

    16. Encryption can be slow if it’s not done right.

    Temporal Key Integrity Protocol (TKIP) encryption, often enabled by default on Wi-Fi routers, will slow you doooowwwwn. Use Advanced Encryption Standard (AES) instead as it’s often hardware accelerated. The standard for WPA2 encryption, AES is both more secure and faster than TKIP. Some routers have TKIP options for compatibility reasons, though, even if you’re using WPA2, so check.

    17. Turn off QoS shaping.

    Quality of Service (QoS) shaping on a router can help you prevent large downloads from eating up all your bandwidth. But on consumer hardware, you’re also bypassing hardware acceleration so all your packets of data have to be inspected by the main CPU. This can cut your performance by 10x on a high bandwidth connection.

    If you’ve gone this far and still want more, read how our lead systems engineer set up his non-gigabit connection to achieve super fast speeds

    Is gigabit worth the trouble?

    By now you’re probably thinking, “Getting the fastest internet speeds sure is a lot of work.” For some people hitting the maximum speed is worth any amount of work to get there. Others will be more than happy with the 300, 400 or 500 Mbps that they see on their gigabit plan with minimal tinkering.

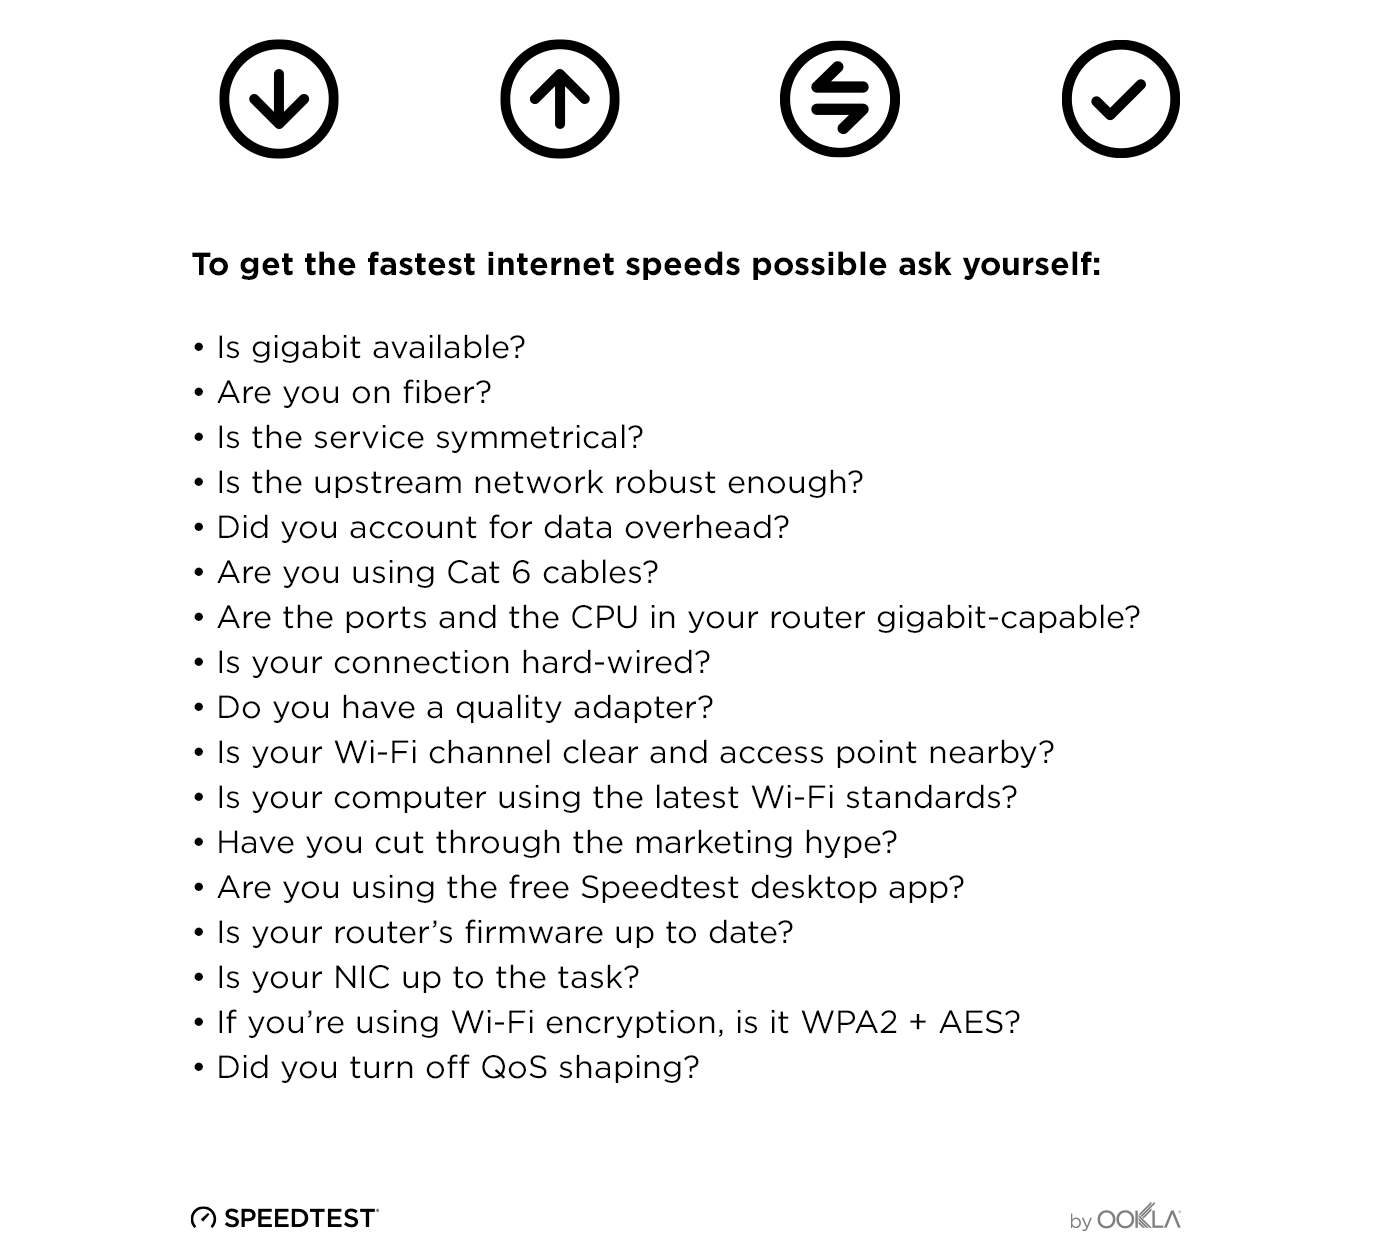
    Whether you’re gigabit ready or not, these tips will help you get the best speeds out of your internet connection now and in the future. Use this handy little list to keep track of all the steps:

    If you answered “yes” to all of the above questions, congratulations! You’re now ready to unlock that superfast Speedtest result.


    Ookla retains ownership of this article including all of the intellectual property rights, data, content graphs and analysis. This article may not be quoted, reproduced, distributed or published for any commercial purpose without prior consent. Members of the press and others using the findings in this article for non-commercial purposes are welcome to publicly share and link to report information with attribution to Ookla.

    | July 28, 2021

    Introducing the Speedtest Mobile SDK

    We are excited to announce that the Speedtest SDK™ is now available for both iOS and Android applications. The new Speedtest Mobile SDK allows providers to integrate Speedtest® into their mobile applications with a fully custom user interface. With Speedtest results delivered directly into your application, you can immediately surface network performance insights to your customer care team, network operations center and other key stakeholders.

    Joining the Speedtest Web SDK in our suite of Speedtest Powered™ solutions, the Mobile SDK provides even more rich insights about mobile network conditions, signal metrics, device information and other data. With Speedtest integrated directly into your mobile applications, you can more easily diagnose customer issues and make network improvements.

    A world-class consumer testing experience

    Speedtest is the name consumers across the globe trust when they need to better understand the performance and quality of their internet connections. Daily, Speedtest is used over 10 million times for unbiased network performance data, and over 35 billion tests have been taken with Speedtest to date.

    Our industry-leading methodology makes Speedtest the most reliable tool for measuring internet performance and providing network diagnostics. The Speedtest Mobile SDK allows providers to integrate this same robust, accurate testing experience into their mobile applications.

    Seamless integration, highly configurable testing

    The Speedtest Mobile SDK allows you to install Speedtest as the testing solution into your Android or iOS app. It integrates seamlessly into your custom UI and offers configuration over test stages, signal scan triggers and data delivery.

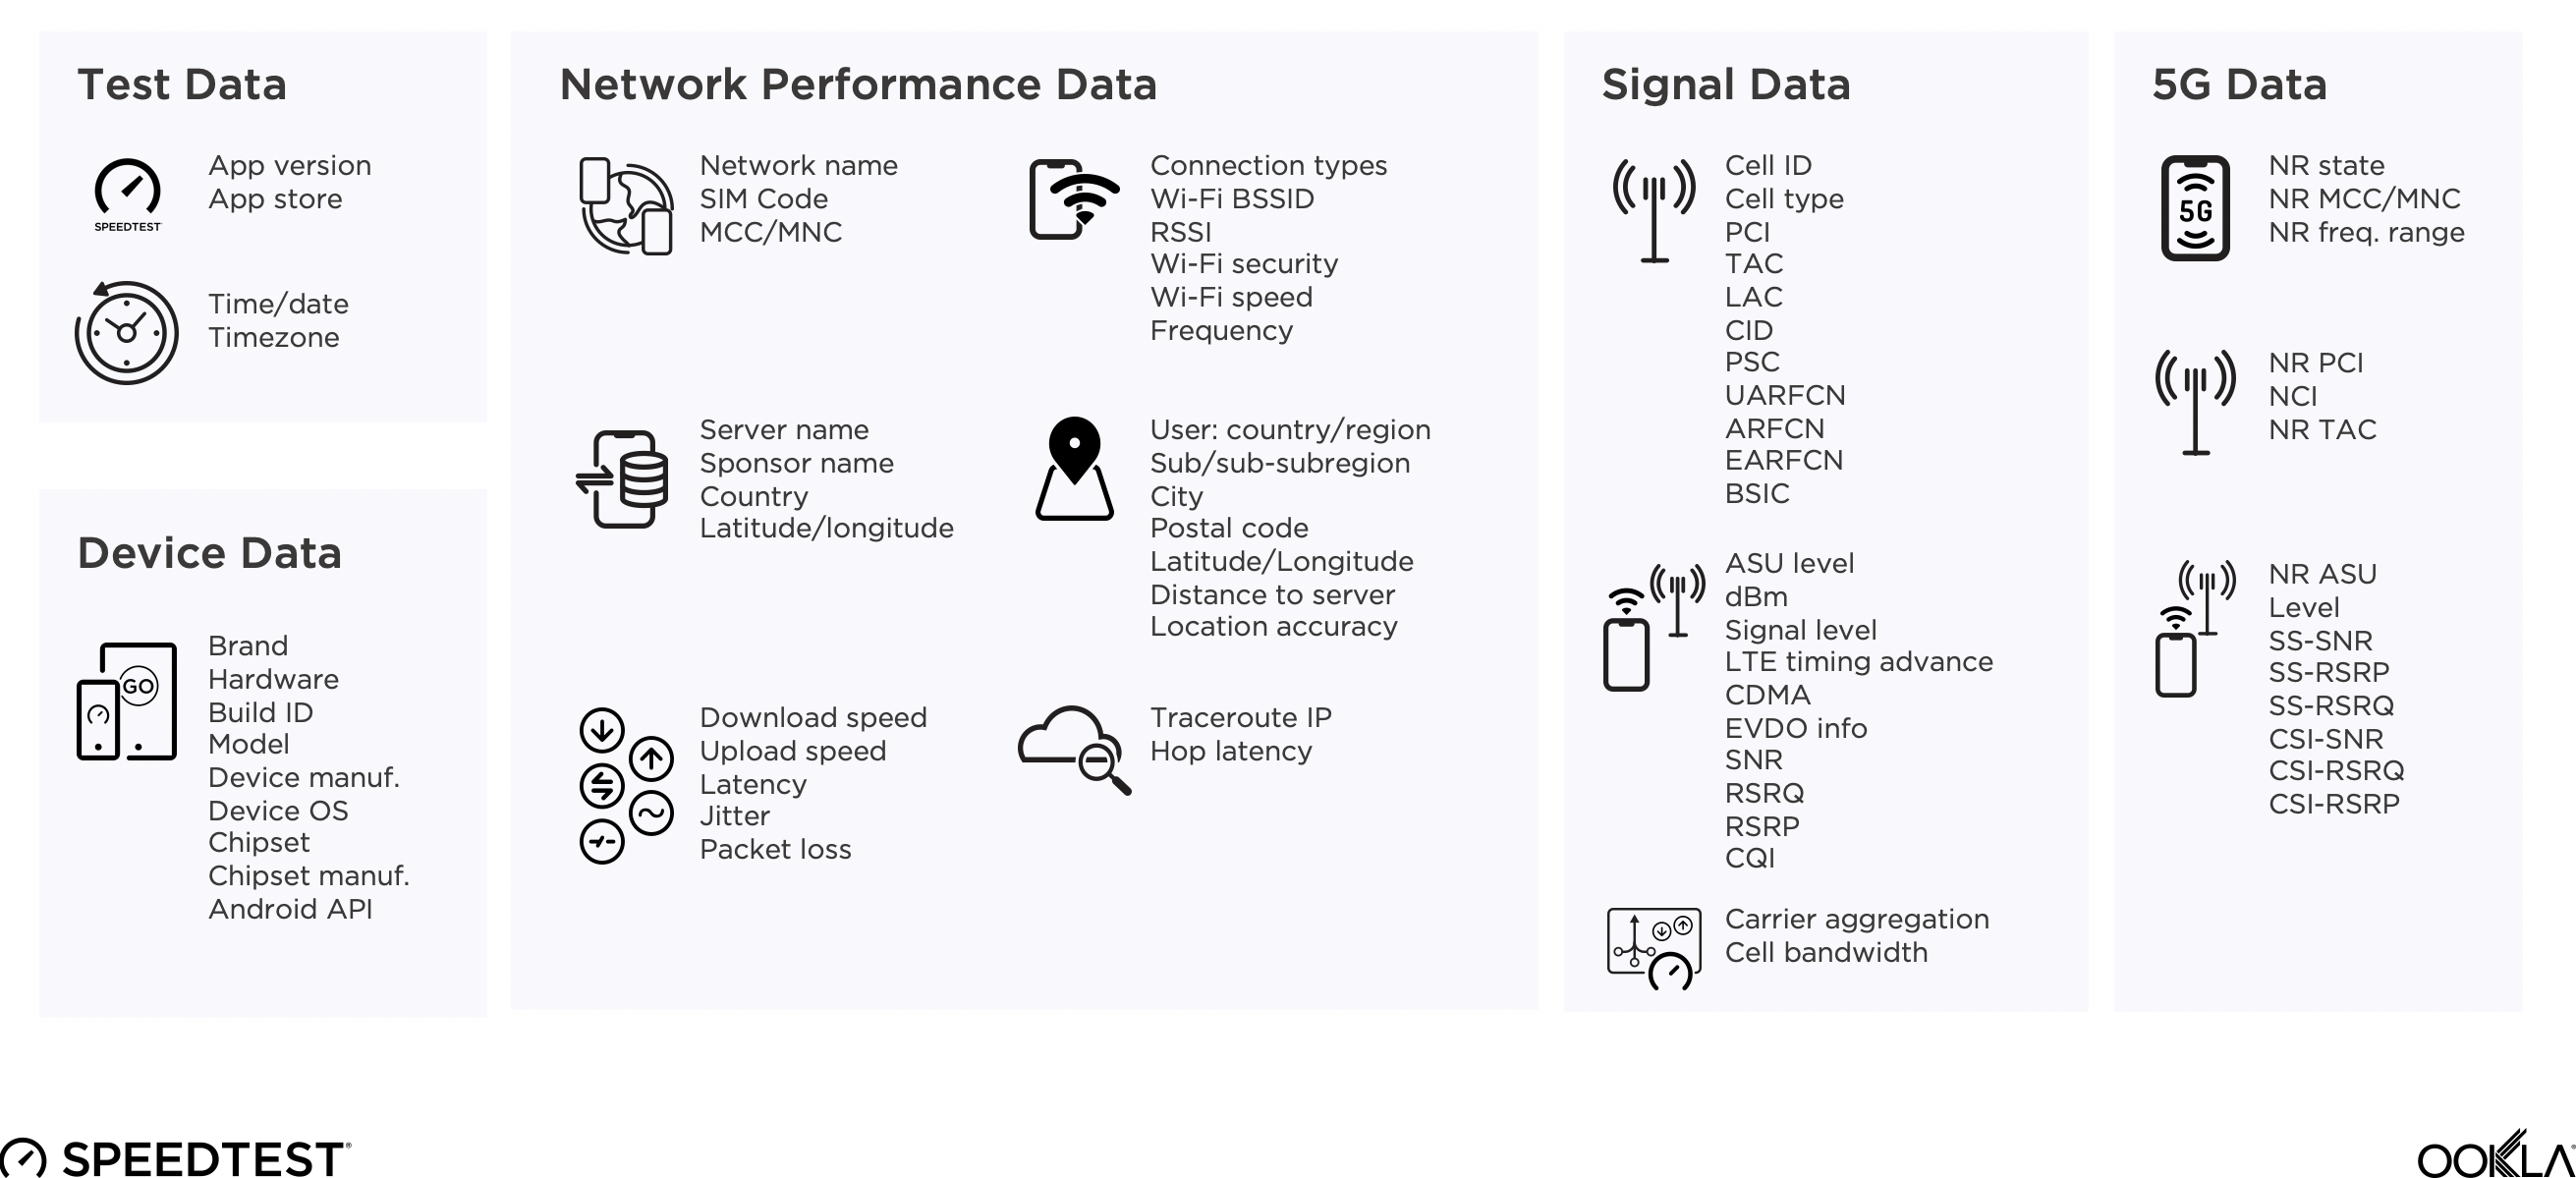
    The Speedtest Mobile SDK measures over 200 potential test and performance data elements to help you understand and improve your network. The Android SDK includes background signal scans, which provide additional data about LTE and 5G signal level and quality. All data elements can be delivered via extract, CSV file, JSON or real-time feeds.

    mobile-sdk-image-1

    Get actionable insight into network performance

    Enterprises can use the Speedtest Mobile SDK to better understand the network performance experience of their remote staff and customers. The Speedtest data collected within your app can help you:

    • Troubleshoot individual problems
    • Identify problem hotspots and potential solutions
    • Improve a customer’s call with customer care
    • Save money on field support costs
    • Prevent customer churn on a case-by-case basis

    On a larger scale, Speedtest data can help you analyze trends in network performance so that you can plan and validate network improvements – helping you build a better network for the long-term satisfaction of your customers.

    Inquire about the Speedtest Mobile SDK today to learn how you can join leading network operators around the world in integrating Speedtest into your mobile applications.

    Ookla retains ownership of this article including all of the intellectual property rights, data, content graphs and analysis. This article may not be quoted, reproduced, distributed or published for any commercial purpose without prior consent. Members of the press and others using the findings in this article for non-commercial purposes are welcome to publicly share and link to report information with attribution to Ookla.

    | June 10, 2021

    How to Make Data-Driven Broadband Funding Decisions [Webinar]

    Billions of dollars in federal funding are being dispersed this summer as part of the United States government’s mission to expand broadband across America. State and local policymakers are currently tasked with ensuring that funding goes to broadband investments that will connect constituents to the speeds they need. This article highlights two instances where Ookla® data is uniquely positioned to help federal, state and local governments understand where constituents don’t have access to high-speed internet.

    Register for our June 23 webinar to learn more about how accurate, up-to-date information about internet performance and accessibility can help you prioritize funding decisions and bridge the digital divide in your jurisdiction.


    Addressing the digital divide in network access

    This past year has made it increasingly clear that broadband is essential in our daily lives — students have needed high-speed internet to connect to the classroom, employees have needed to be able to connect to work remotely and sick people have needed access to broadband to use telehealth services. At the same time, broadband issues in both rural and urban communities have made the digital divide increasingly obvious. For those below or near the poverty line, a lack of equipment to get connected and a lack of financial resources acts as a barrier. In many areas there is a lack of adequate connectivity, impacting everyone, regardless of their economic circumstance.

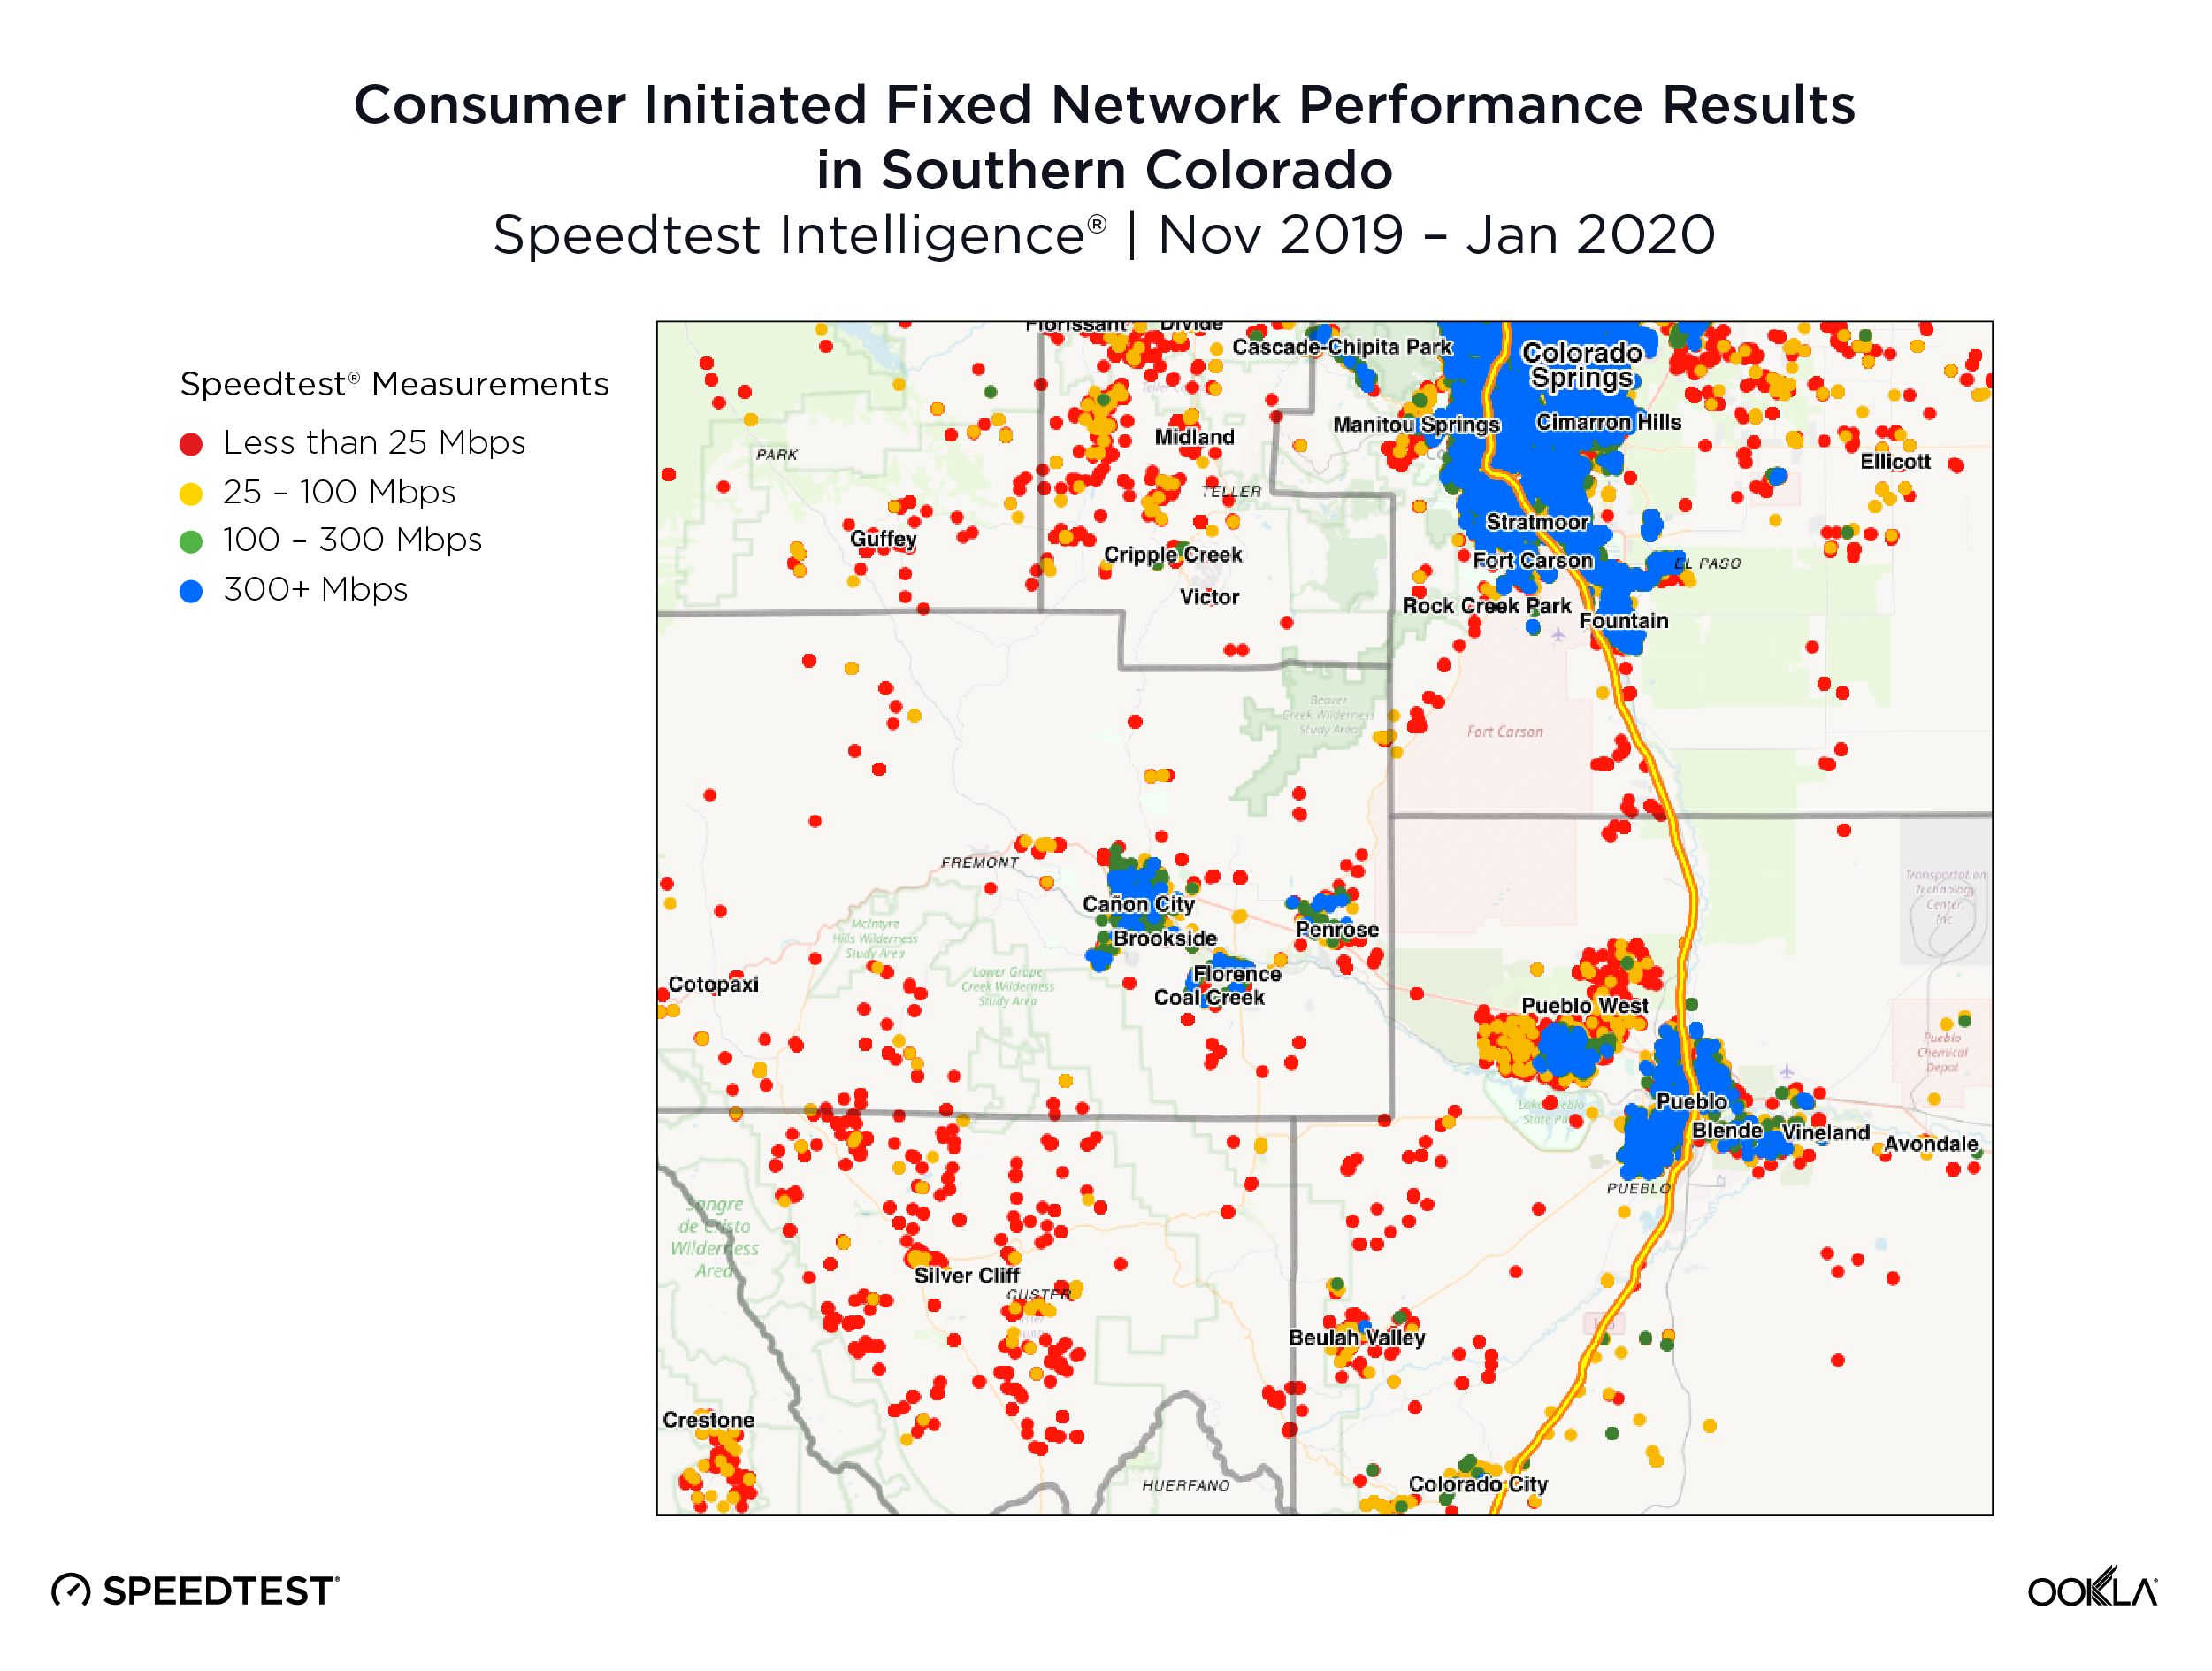
    Less populated, more rural areas of the U.S. tend to have less access to high-speed internet. Take Colorado, for example, where much of the greater Colorado Springs area has broadband speeds of 300+ Mbps. Yet many underserved areas exist in the more rural areas of Colorado. These underserved areas are clearly demonstrated by the red dots on the below map of Speedtest® measurements for all fixed operators via Android and iOS devices. This data reveals that many of the rural communities in Colorado don’t have access to the FCC minimum download speeds of 25 Mbps. By looking only at tests taken on devices that provide GPS location information, we can see the precise geographic boundaries of the digital divide, illustrated with real-world network performance data.

    speedtest_consumer_initiated_fixed_performance_so_colorado_0621

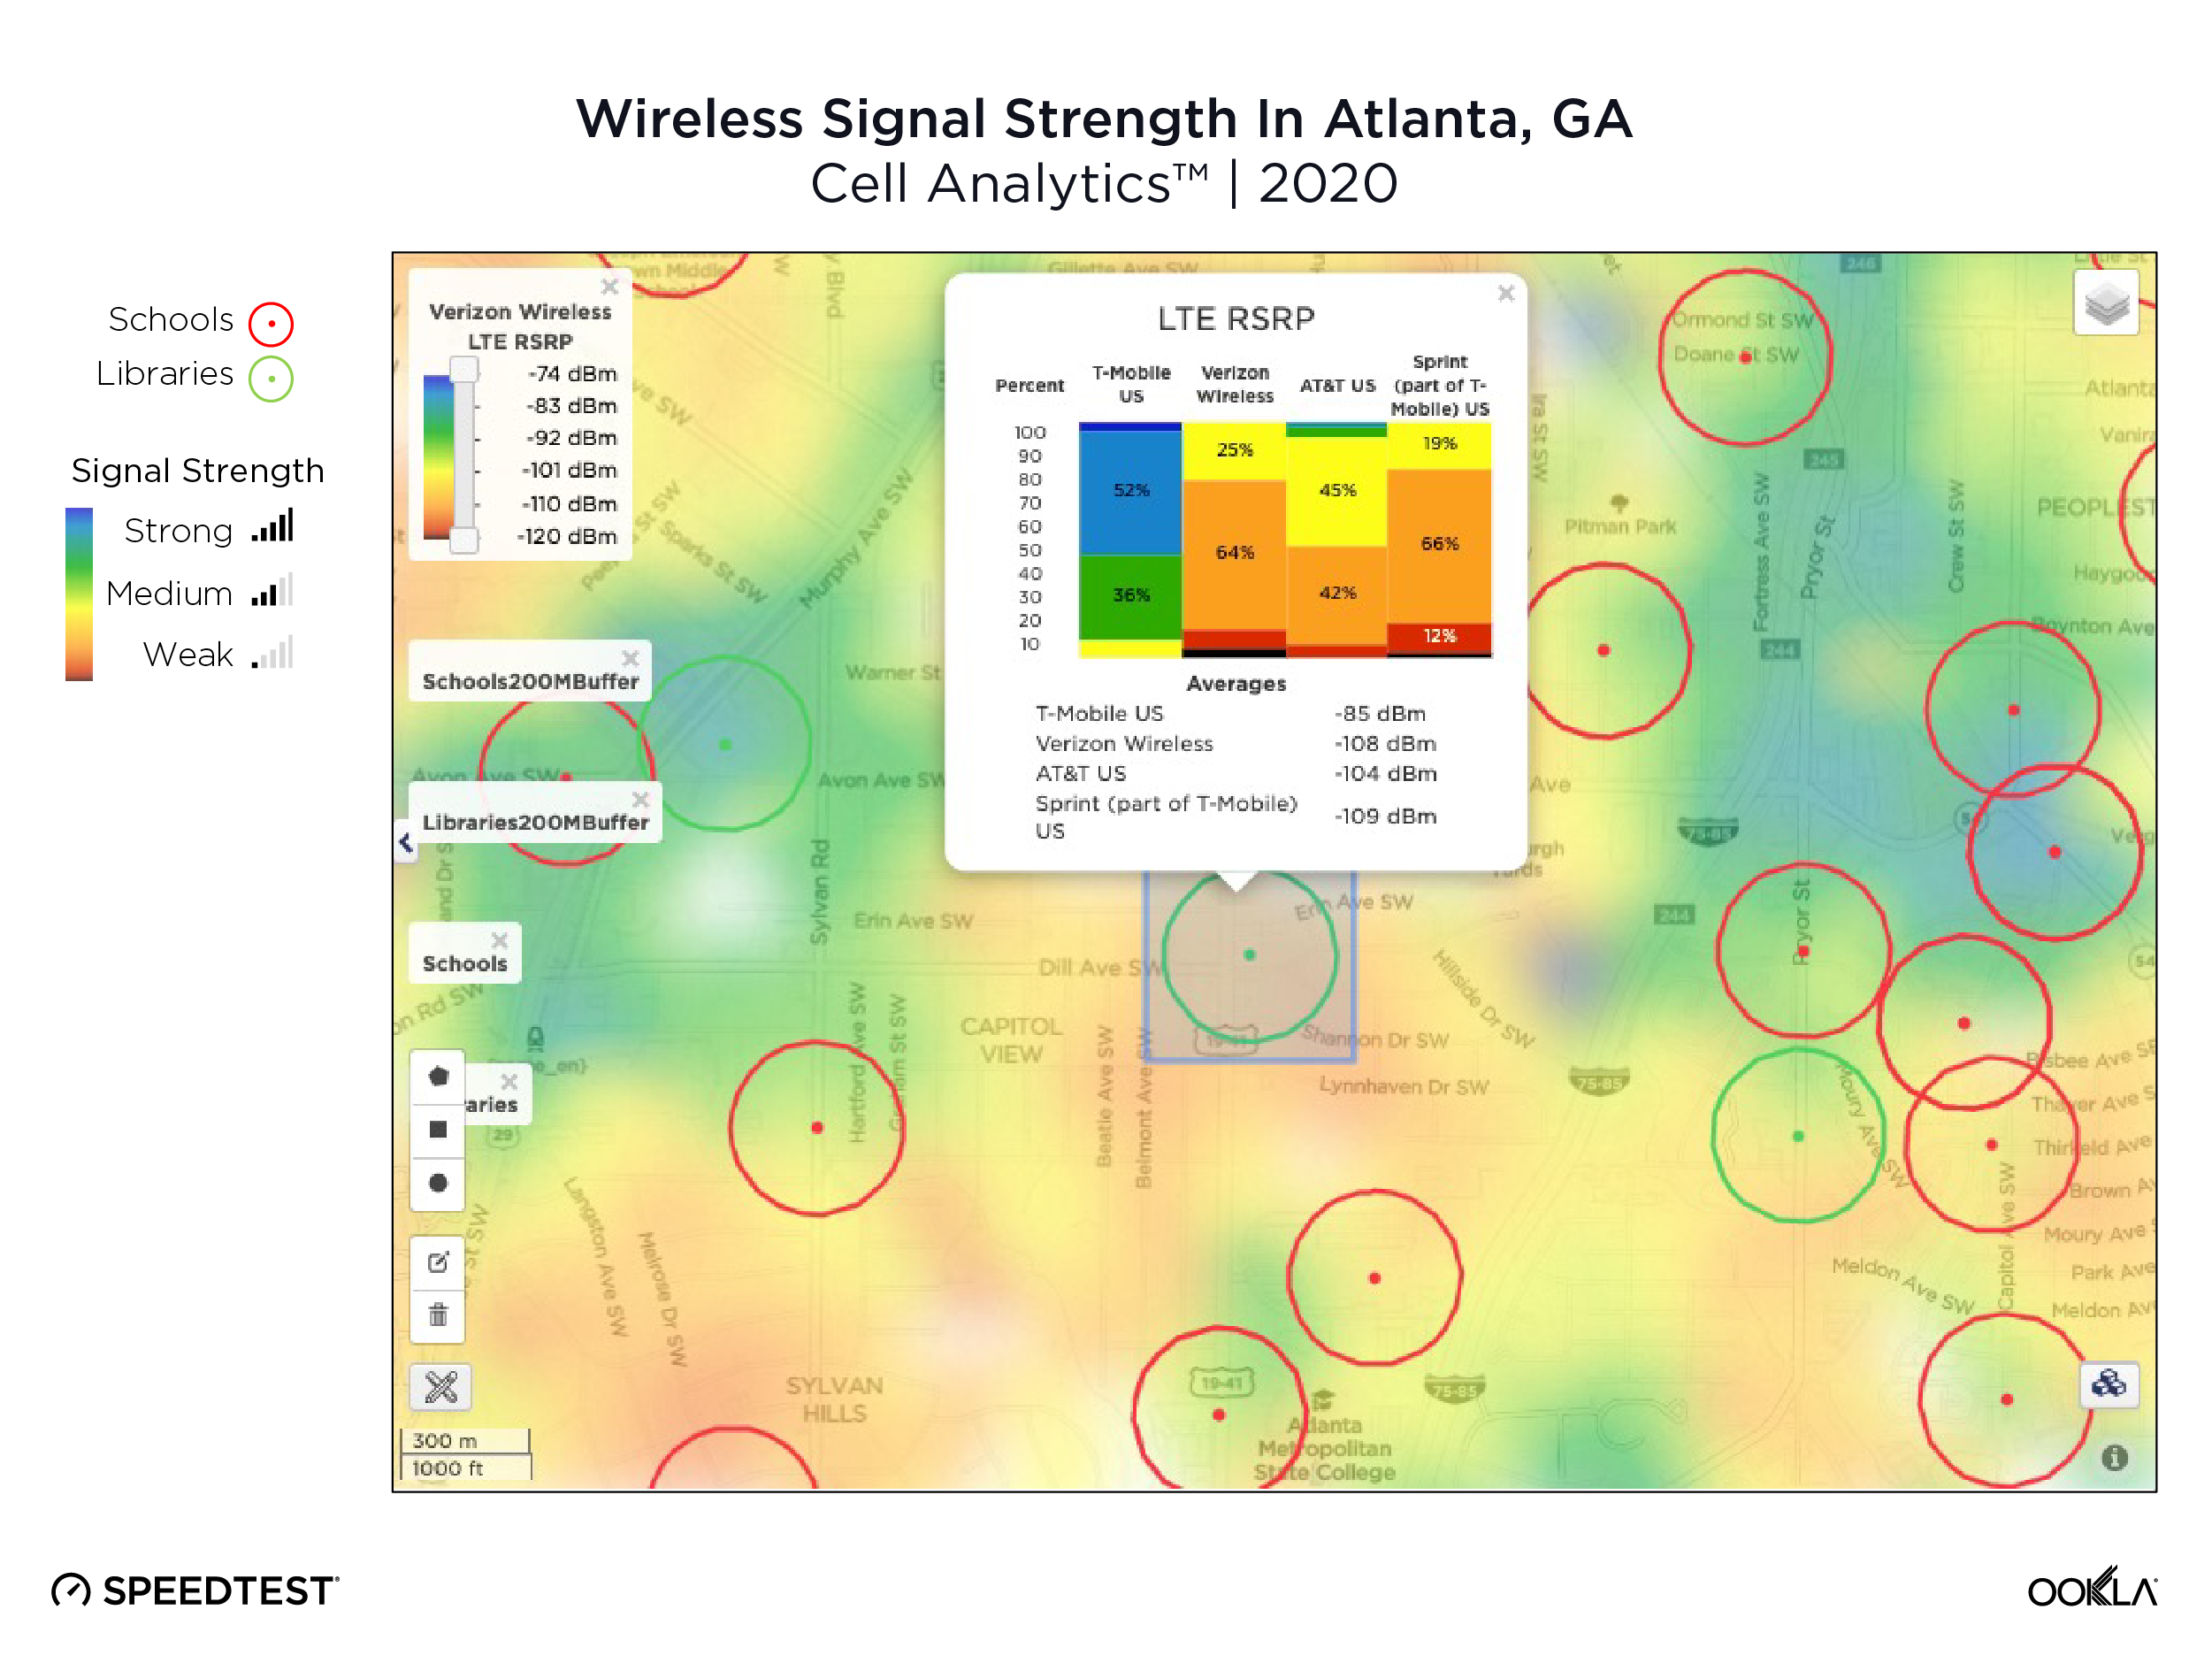
    Connectivity problems exist in urban communities as well. The map below shows Cell Analytics™ data for Atlanta, Georgia. The red circles are locations of schools, the green circles are locations of libraries and the color gradient on the map indicates the signal strength in those locations. As you can see, many of the schools and libraries in Atlanta only have access to medium or weak signal strength, depending upon the carrier they have chosen. Within some neighborhoods, coverage quality is poor across all operators, leaving residents with no good option. Residents in urban communities under economic stress often depend on their phone to connect to the internet. This is especially true for students who rely on hotspots and tablets to connect to the classroom. Higher quality wireless service is critical when it comes to closing the homework gap in urban communities such as Atlanta.

    cell_analytics_wirelss_signal_strength_atlanta_0621

    The federal government aims to make big strides towards closing the gap in both rural and urban communities across the nation with the billions of dollars in broadband funding allocated in the American Rescue Plan (ARP) Act. While this new funding is welcome, it creates a question for policymakers around how to best use the budget to solve for digital equity. Decision makers often lack the data that they need to make smart infrastructure investments that will provide broadband access to the greatest number of people.

    Using Ookla data for smarter spending

    The webinar will show how policymakers can use Speedtest datasets to determine specific locations where constituents can’t access adequate broadband. Learn how we can help you allocate resources to areas that show a clear need for investment in broadband infrastructure.

    Speedtest Intelligence® data can help answer questions like:

    • How is performance in a geographic area or for an internet service provider (ISP) trending over time?
    • How widespread are any changes (e.g., network improvements) impacting typical network performance in a given area?
    • Are minimum thresholds needed for remote work, education and telehealth being met in a given area?
    • How commonly does an ISP deliver a minimum level of service?
    • How does an ISP’s real-world network performance compare to their self-reported speeds and service levels?

    To learn how to turn this data into actionable broadband policy, tune into the webinar on Wednesday, June 23 at 9 a.m. Pacific (12 p.m. Eastern). A recording will be provided for registrants who can’t make the live presentation.


    Ookla retains ownership of this article including all of the intellectual property rights, data, content graphs and analysis. This article may not be quoted, reproduced, distributed or published for any commercial purpose without prior consent. Members of the press and others using the findings in this article for non-commercial purposes are welcome to publicly share and link to report information with attribution to Ookla.
    | December 12, 2021

    UAE Extends its Lead as the Fastest Mobile Market on Earth


    Consumer and business confidence returning to the UAE

    The United Arab Emirates (UAE) economy showed strong signs of recovery in Q3 2021, with Dubai’s Consumer Confidence Index reaching its highest level since 2011 according to the Dubai Department of Economic Development. Stimulus measures and an accelerated vaccine campaign have played a crucial role in this recovery. IHS Markit UAE Purchasing Managers’ Index (PMI) for October returned the highest Index score since the start of the pandemic, with panelists pointing to the re-opening of the economy and in particular the launch of Expo 2020 in driving increased sales and investment.

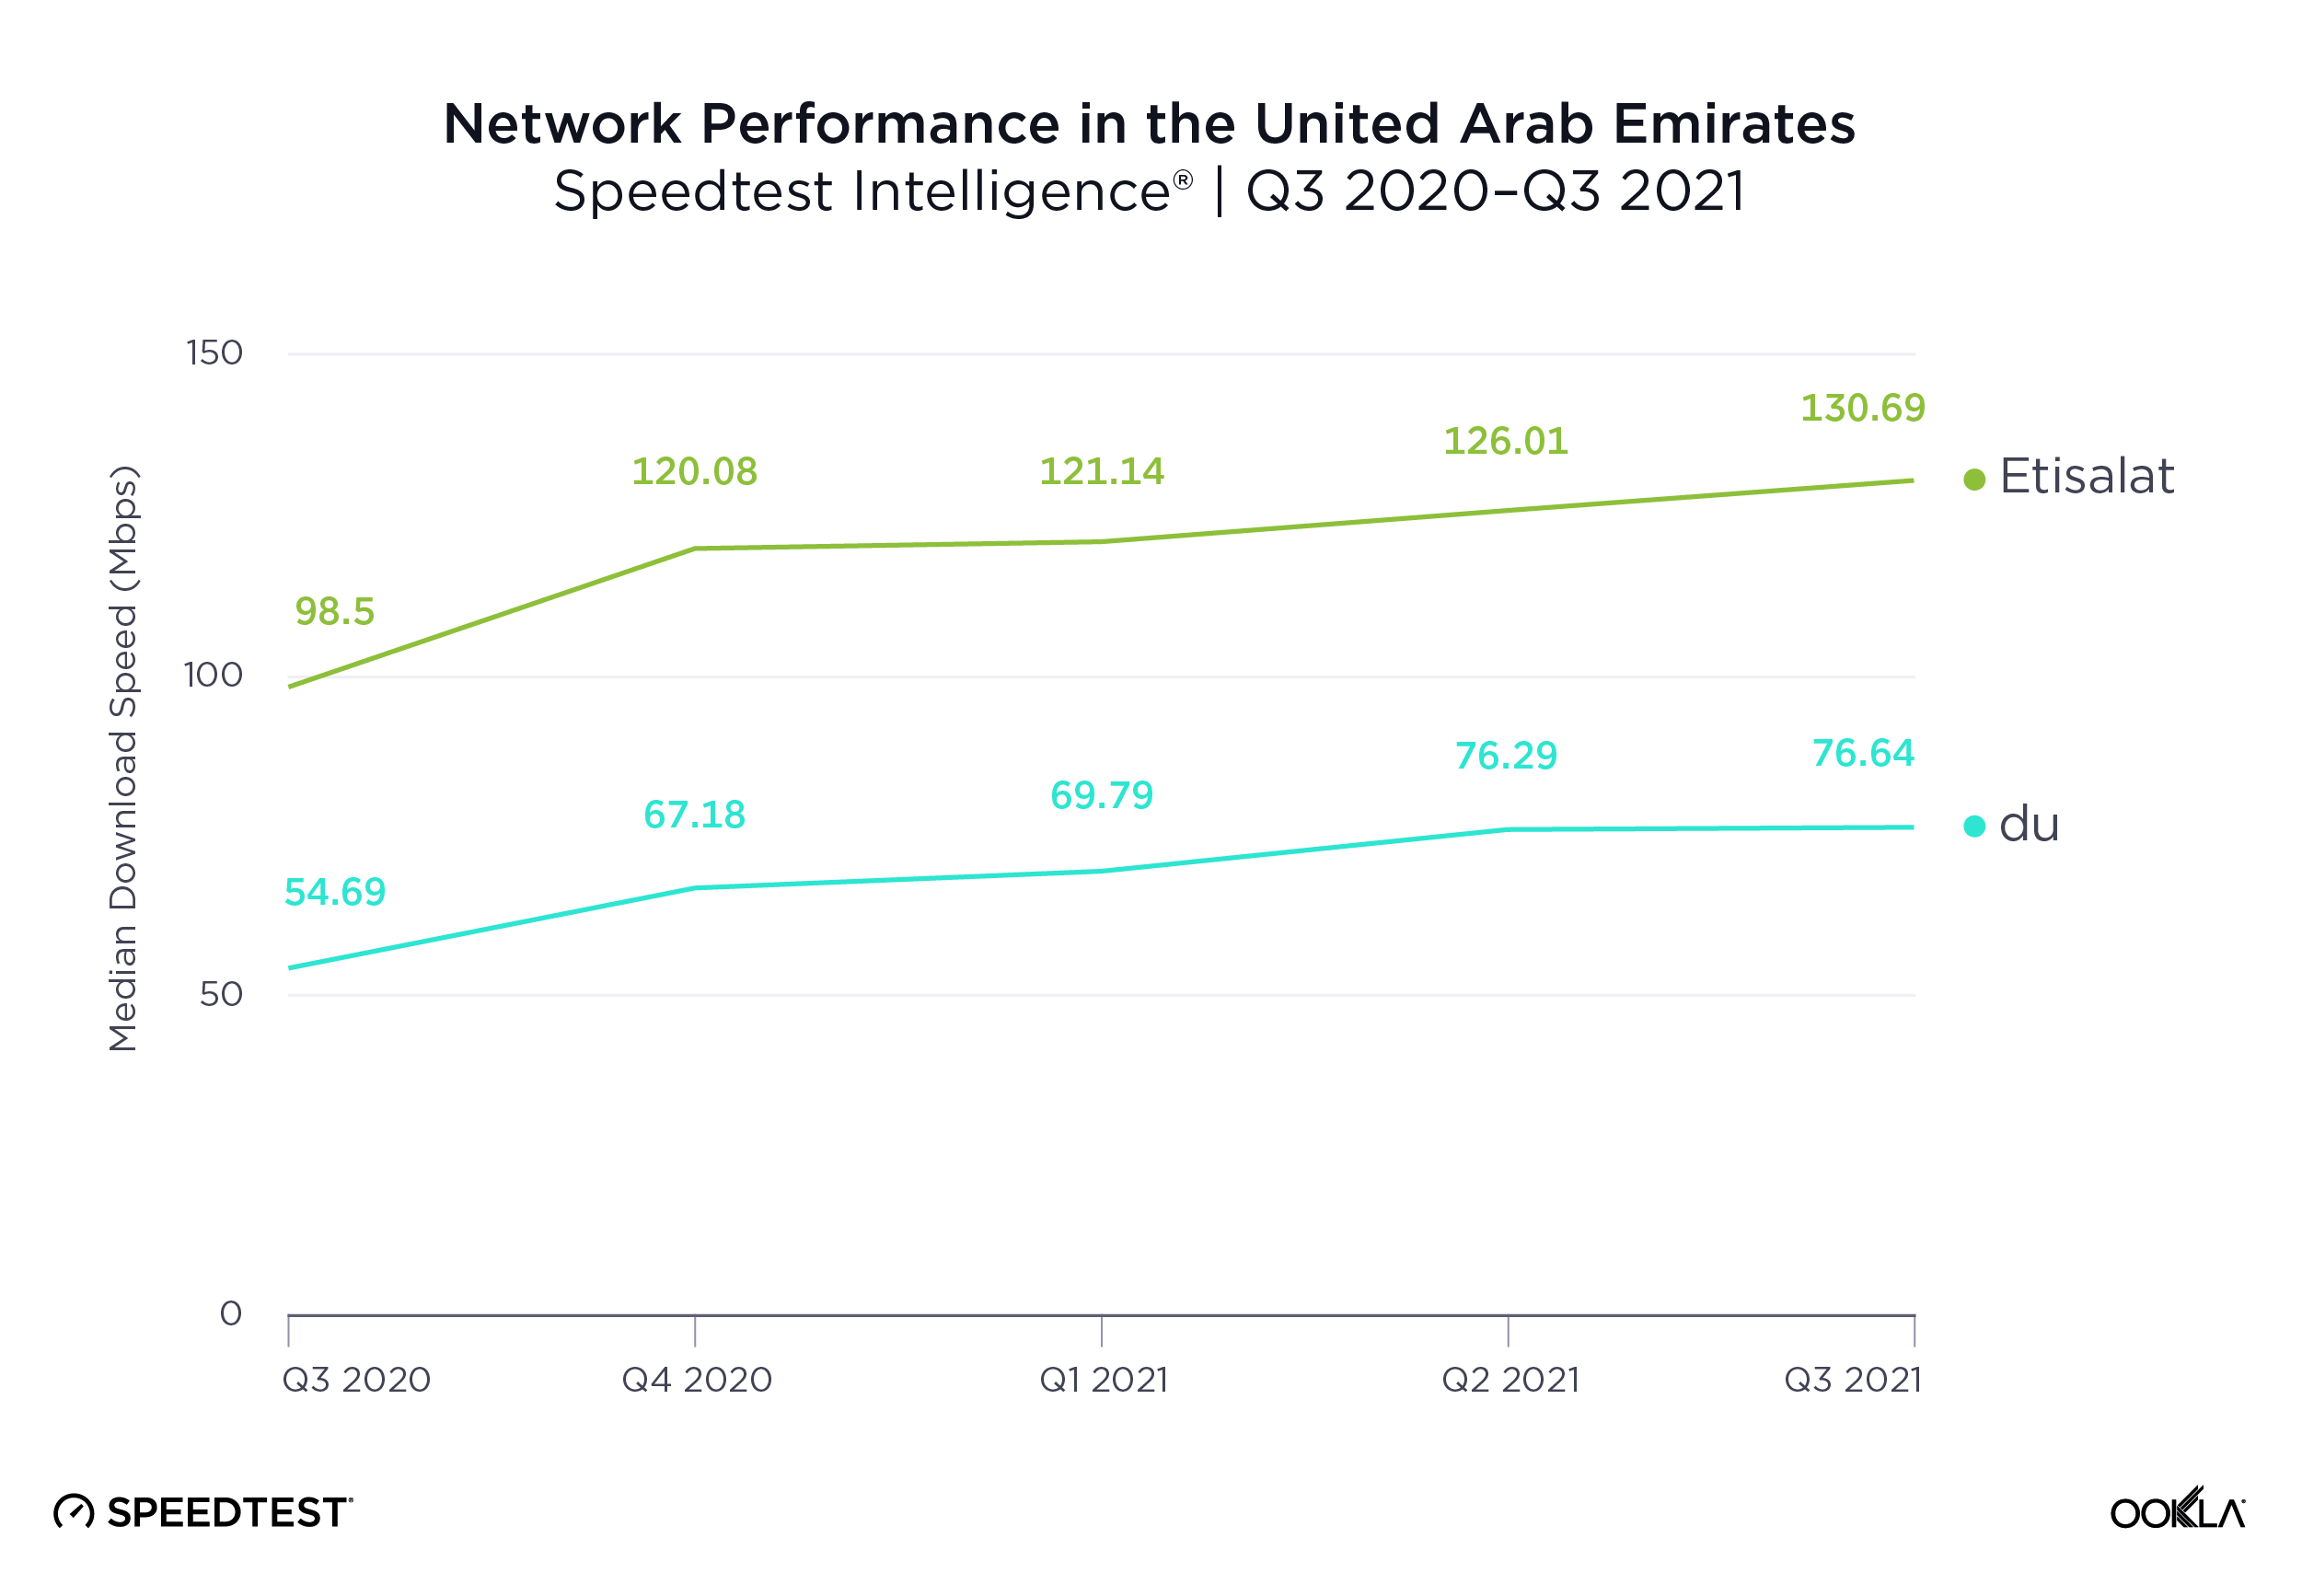
    With the economy reopening, national mobile operators Etisalat and du have reported increases in data consumption, in wholesale revenues and in the demand for 5G handsets. The UAE continues to occupy the number one position in Ookla’s Speedtest Global Index for October 2021 with a median mobile download speed of 127.81 Mbps, with Etisalat continuing to lead the market with a median download speed of 130.69 Mbps in Q3 2021.

    ookla_performance_uae_1221-01

    Etisalat retains its position as fastest 5G operator

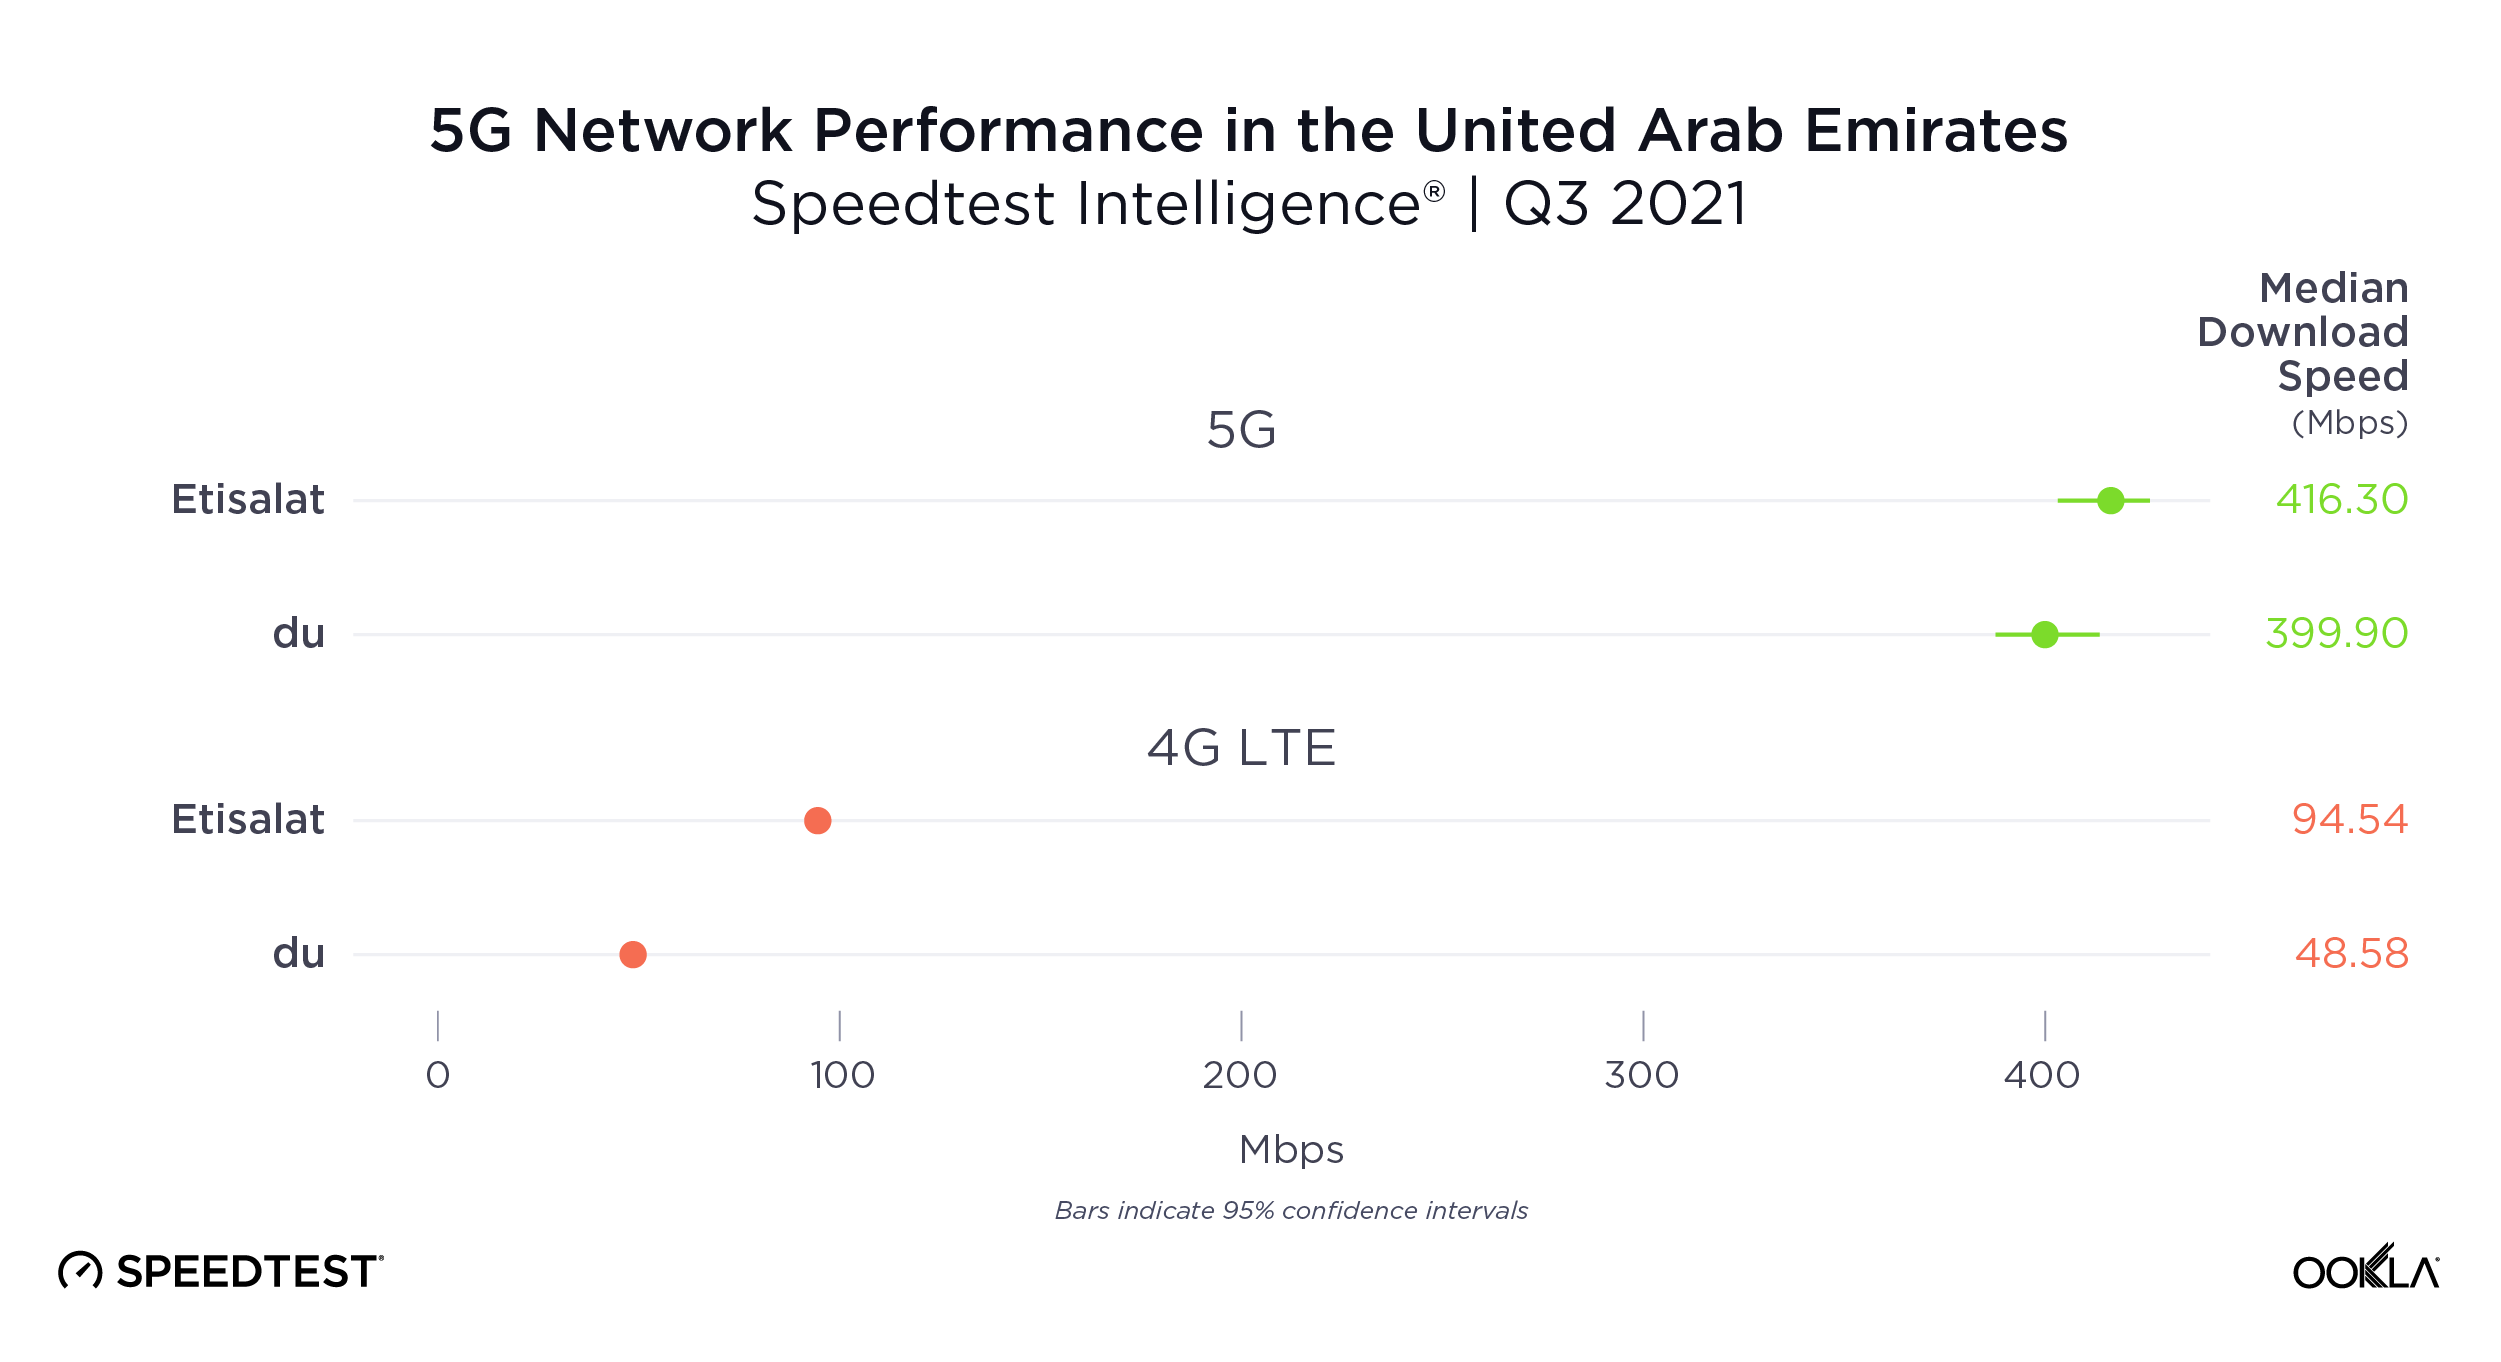
    Etisalat and du have focused heavily on driving further rollout and densification of their 5G networks over the past year. Despite strong competition from rival du, Etisalat remains the fastest operator for 5G, and the fastest operator overall within the UAE according to Ookla Speedtest Intelligence® data for Q3 2021, with its median 5G download speed of 416.30 Mbps faster than du’s 399.90 Mbps.

    ookla_5g-network-performance_uae_1221-01

    The Telecommunications and Digital Government Regulatory Authority (TDRA) of the UAE has targeted 5G coverage of all inhabited areas of the country by the end of 2025. To support this, the TDRA announced in June 2021 that 2G networks will be sunsetted by the end of 2022, with the spectrum refarmed for 5G use. Until universal 5G coverage is available in the UAE, LTE will continue to play an important role in providing broader coverage, but also support for older/non-5G devices. These still represent a majority within the market, and Speedtest Intelligence data shows that 62.3% of total tests run during Q3 2021 utilized non-5G networks, with the vast majority of those running over LTE. This is an area where Etisalat pulls well ahead, with its median LTE download speed of 94.54 Mbps in Q3 2021 1.9 times faster than that of its rival.

    Qualcomm’s CEO Cristiano Amon recently predicted that the global chip shortage will begin to ease over the coming year, and with both Etisalat and du reporting strong demand for 5G devices, 2022 looks set to be a pivotal year for 5G adoption in the market. Etisalat is already looking to advance its network lead, having recently completed a custom 5G network spanning the Expo 2020 site, covering 4.38 square kilometers with over 8,500 mobile access points and in excess of 700km of fiber optic cable. Etisalat also announced in June 2021 that it is partnering with Ericsson to enable mmW across its 5G network, while du has already trialed the technology, and was the first to launch a mmW 5G base station in February 2020. If the UAE economy continues on its positive trajectory, supported by Expo 2020 which is set to run until the end of March 2022, then we fully expect the strong network competition between these two players to drive median speeds in the market yet higher.

    Ookla retains ownership of this article including all of the intellectual property rights, data, content graphs and analysis. This article may not be quoted, reproduced, distributed or published for any commercial purpose without prior consent. Members of the press and others using the findings in this article for non-commercial purposes are welcome to publicly share and link to report information with attribution to Ookla.
    | July 20, 2021

    Solutelia Joins Ookla

    Ookla®, the global leader in network intelligence, testing platforms and related technologies, is proud to announce the acquisition of Solutelia and its flagship WINd® software suite. Together we will disrupt and forever change the wireless network test and measurement industry.

    Ookla’s enterprise products give mobile network operators unparalleled competitive insights into the consumer experience on networks all over the world, while Solutelia’s WINd platform evolves legacy drive-testing and walk-testing tools and eliminates the need for outdated, time-consuming methods of post-processing data. Solutelia’s innovative solutions for indoor, outdoor and competitive benchmark testing allow network operators and integrators to rapidly improve mobile network performance with real-time streaming KPIs, remote control of test devices, near-real-time post-processing and cloud-based analytics — with consumer network experience at the heart of the system.

    “The addition of WINd will bring much deeper network insights and testing capabilities to Ookla’s enterprise customers,” said Doug Suttles, CEO of Ookla. “Over the past few years we have invested in solutions and talent to help our clients solve more engineering-grade problems. Acquiring Solutelia is another concrete example of Ookla helping our clients more accurately measure and continuously improve their deployed networks.”
    Mohssen Davari, CEO of Solutelia adds, “We are thrilled to be joining Ookla. Our mission has been to redefine mobile network performance measurement with near-real-time analytical capabilities that drive operational efficiencies and faster network improvements. We first partnered with Ookla to integrate its best-in-class Speedtest software, and now together we will bring the benefits of the WINd software platform to the global marketplace.”
    The advent of 5G is resulting in substantial changes to the physical footprint of networks, which will require more cell sites and more intelligent, complex radio networks. This radical shift in the industry means that network operators need to be able to massively scale their testing and optimization efforts, without a commensurate increase in operational spending. Solutelia’s revolutionary approach to data collection has fundamentally reimagined drive and walk testing, creating process efficiencies and delivering instant network insights, while removing operational complexity and reducing network management costs.

    Mobile network operators using Ookla’s solutions for crowdsourced network intelligence (Speedtest Intelligence®, Cell AnalyticsTM and SpatialBuzz) already have an unrivaled view into network performance, quality, coverage, user density, data usage, consumer satisfaction and other key metrics. Solutelia’s WINd platform, which natively leverages Ookla’s best-in-class Speedtest methodology for throughput testing, allows operators to turn that network intelligence into immediate action in the field. With the addition of Solutelia’s WINd platform to its enterprise product suite, Ookla now provides solutions to support operators through each stage of mobile network planning, site verification, monitoring, optimization and performance assurance.

    To learn more about Ookla and Solutelia’s solutions for mobile network operators and integrators, inquire here. For media inquiries, please send a message to press@ookla.com

    Ookla retains ownership of this article including all of the intellectual property rights, data, content graphs and analysis. This article may not be quoted, reproduced, distributed or published for any commercial purpose without prior consent. Members of the press and others using the findings in this article for non-commercial purposes are welcome to publicly share and link to report information with attribution to Ookla.