| June 18, 2024

Ookla for Good Data Reveals a Persistent Digital Divide in Brazil

In Brazil, the digital divide is not merely a matter of technology access but a stark reflection of the nation’s economic disparities. The internet, serving as a vital portal to education, employment prospects, and critical services, remains inequitably accessible across the country. 

Research across Brazil shows that affluent individuals often benefit from consistently strong connectivity, while those in lower-income brackets frequently grapple with limited or nonexistent internet access. 

A recent World Bank study in Brazil, utilizing mobile and fixed broadband performance data from the Ookla for Good™ program, has illuminated stark differences in internet access across six major Brazilian cities, emphasizing the need for focused policies to address digital and socioeconomic gaps. 

Ookla for Good is an initiative to provide data, analysis, and content to organizations that are seeking to improve people’s lives through internet accessibility.

The research

Researchers in Brazil conducted a study titled “Bridging the Digital Divide: Mapping Internet Connectivity Evolution, Inequalities, and Resilience in six Brazilian Cities.” They used Ookla® Speedtest Intelligence® test results to examine internet speeds in Belo Horizonte, Brasilia, Fortaleza, Manaus, Rio de Janeiro, and São Paulo between 2017 and 2023. Their findings showed:

  • Wealthier neighborhoods consistently enjoyed superior internet speeds, especially on fixed networks.
  • Mobile internet speeds also correlated with wealth, but that trend has been decreasing over time.
  • Around 13% of areas near educational facilities had speeds below the 80 Mbps threshold recommended for effective e-learning, affecting approximately 8% of the school-age population.

“Our analysis underscores the persistent internet access inequalities in Brazil, a country with a very diverse digital landscape,” said Niccolò Comini, one of the lead researchers and Digital Development Specialist within the Infrastructure Vice-Presidency at the World Bank.

The impact of COVID-19

The study also highlighted how the COVID-19 pandemic exacerbated the digital divide in Brazil. After the declaration of a national emergency, all cities across Brazil saw a significant decrease in internet speed, with poorer areas experiencing bigger dips in speed, demonstrating a clear gap between those who have reliable connectivity and those who do not. 

More is needed for an equitable digital future

To address these disparities, policymakers and the private sector must collaborate on targeted local policies, such as:

  • Improving connectivity in underserved areas
  • Promoting Fiber to the Home (FTTH) technology
  • Making high-speed internet packages and devices more affordable
  • Fostering digital literacy through training and awareness programs

The World Bank is already supporting initiatives like connecting public buildings via fiber optics in the State of Sergipe in Brazil, driving private sector investments to bring internet access to unconnected households. 

Ookla joined the Development Data Partnership in 2020 to collaborate with partner’s like the World Bank in their efforts to reduce poverty, increase shared prosperity, and promote sustainable development by narrowing the digital divide and bringing connectivity to all.

The role of Ookla for Good™

At Ookla, we are proud to support research like this through our Ookla for Good initiative. The mission of Ookla for Good is to bring fast and reliable internet access to every person, regardless of location or socioeconomic status. 

That’s why we make this data available on a complimentary basis to policymakers, humanitarian organizations, academic research institutions, journalists, and consumers. By providing access to our vast dataset on a complimentary basis, we aim to empower researchers, policymakers, and organizations in their efforts to address the digital divide and promote equitable access to the internet across the globe.

We are grateful to Niccolò Comini, Nicolò Gozzi, and Nicola Perra for their dedication to this critical issue and for using Ookla’s data to drive positive change. For the full analysis, be sure to check out their research paper.

To learn more about Ookla for Good and inquire about partnership opportunities, visit the Ookla for Good page on our website.

Ookla retains ownership of this article including all of the intellectual property rights, data, content graphs and analysis. This article may not be quoted, reproduced, distributed or published for any commercial purpose without prior consent. Members of the press and others using the findings in this article for non-commercial purposes are welcome to publicly share and link to report information with attribution to Ookla.

| September 17, 2024

Mapping Internet Connectivity Inequality in Cities around the World

In today’s urbanized and digitized world, broadband connectivity is as crucial as basic utilities. However, significant disparities in broadband quality still remain, and this chasm is contributing to the creation of a new generation of digital inequalities. As a result, understanding the geographic distribution of broadband availability and quality is essential for crafting policies that ensure equitable digital access.

The Joint Research Centre of the European Commission recently published a research utilizing mobile and fixed broadband performance data from the Ookla for Good™ program. Their study focused on the issue of digital inequality by exploring the quality of broadband connectivity across urban centers globally. Key research questions in their study focused on the following:

  • Do urban centers in higher-income countries enjoy better mobile and fixed broadband quality compared to lower-income countries?
  • Are more populous urban centers better connected?
  • What is the relationship between population dynamics and broadband speed in urban centers?

To address these questions, the European Commission’s Joint Research Centre leveraged a combination of traditional and emerging data sources, including Ookla’s Speedtest® data:

  • Remote sensing data and official population statistics (Global Human Settlement Layer or GHSL).
  • Country borders and income data (Global Administrative layer, GADM, and World Bank).
  • Global broadband speed data (Speedtest® by Ookla®, using data from 2021).

Key findings

The research revealed stark geographic and income disparities in internet download speeds, underscoring the urgent need for targeted policies to bridge the digital divide — especially considering that urban centers are already the places where most people live.

Cities in 125 countries fall below the global median download speed of 86.45 Mbps as of 2021 (which has since increased to 93.93 Mbps in June 2024). In fact, entire regions — such as Africa — lag significantly, with median speeds in countries like the Central African Republic and Eritrea below 3 Mbps.

Regional and income group variations

Broadband speeds vary significantly by region and income group. About 40% of urban centers have connectivity exceeding 100 Mbps, while 60% are split between 0–30 Mbps and 30–100 Mbps. Over 70% of urban centers with speeds below 30 Mbps are in Africa, Central, and Southern Asia. To address these disparities, policies should focus on both expanding access to connectivity and improving speeds in underserved areas.

Connectivity and affluence

A strong correlation exists between connectivity and affluence. High-income countries enjoy significantly better broadband speeds. In contrast, lower-middle-income countries struggle, with 51% of urban centers in the 0–30 Mbps download speed range. Investment in digital infrastructure in these countries is crucial to support economic development and competitiveness.

Map: Countries showing the lowest and hightest distance from median Download Speeds

Figure 1. Map of world countries shaded in blue represent areas with fixed broadband download speeds above the global median fixed download speed of 86.45 Mbps in 2021, while areas shaded in red are below the global median. Dark colors highlight countries showing the lowest and highest distance from median value. Source: Authors’ elaboration on Ookla Speedtest Intelligence data from 2021.

Mobile vs. fixed broadband

High-speed mobile networks are more widespread than fixed broadband, with Ookla® data showing that mobile connectivity was more widely available than fixed broadband solutions in urban centers. While the global median download speed for fixed broadband networks (86.45 Mbps) surpasses that of mobile connections (33.5 Mbps), in many Global South countries, mobile broadband is more affordable and performs better than fixed broadband networks. Policymakers should therefore consider promoting mobile broadband as a cost-effective solution to bridge the digital gap.

Income and urbanization as drivers of connectivity

Income and urbanization drive access to better and faster connections. Larger urban centers, even in lower-income countries, tend to have faster broadband. This suggests that policies aimed at urban development should include comprehensive digital infrastructure plans to ensure all urban residents benefit from high-speed connectivity.

Three key observations of internet speeds across the world

The research identified three primary connectivity scenarios that were observed in countries across the world:

  1. Symmetrical speeds: Some countries, like Sweden, have symmetrical high-speed connections, while others, like Burundi, have symmetrical speeds but slower connections.
  2. Faster fixed network speeds: Countries like India and Brazil benefit from existing infrastructure that supports higher fixed network speeds.
  3. Faster mobile network speeds: Regions in West and South Africa and Southeast Asia often have faster mobile network speeds due to rapid urban growth favoring mobile infrastructure deployment.

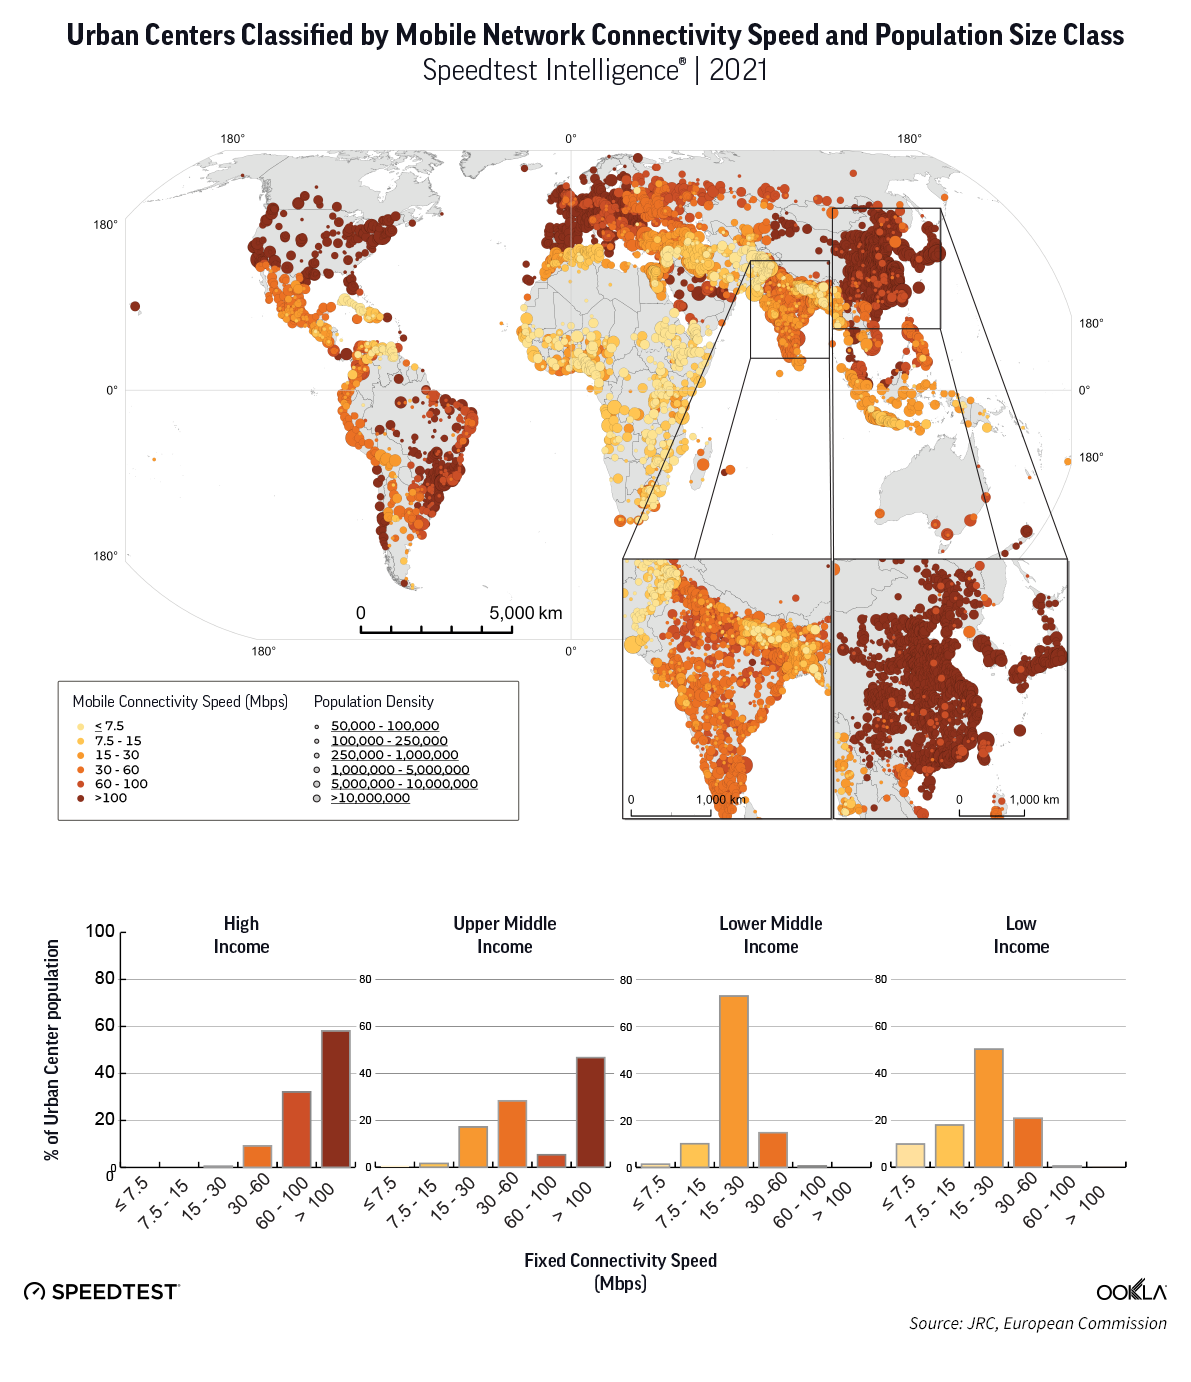
Map: Urban Centers Classified by Mobile Network Connectivity Speed and Population Size Class

Figure 2. Map of urban centers classified by mobile network connectivity speed and population size class. Source: Authors’ elaboration on Ookla data from 2021.

Looking ahead

The European Commission’s Joint Research Centre’s research highlights significant disparities in broadband quality across urban centers, driven by geographic, economic, and infrastructural factors. Policymakers must prioritize investments in digital infrastructure, particularly in underserved regions, to ensure equitable access to high-quality broadband connectivity.

After all, bridging the digital divide is not just about technology; it’s also about fostering inclusive economic growth and ensuring that all urban residents can participate in the digital economy. To learn more about this important work, read the complete article from the Joint Research Centre of the European Commission. 

The role of Ookla for Good™

At Ookla, we are proud to support research like this through our Ookla for Good initiative. The mission of Ookla for Good is to bring fast and reliable internet access to every person, regardless of location or socioeconomic status. 

That’s why we make this data available on a complimentary basis to policymakers, humanitarian organizations, academic research institutions, journalists, and consumers. The work we do with our partners is more significant than just improving internet speeds; we aim to leave a lasting impact on the communities we support worldwide.

We are grateful to Patrizia Sulis and colleagues (Michele Melchiorri, Paola Proietti, Marcello Schiavina, Alice Siragusa) for their work with our data within the European Commission’s paper and guidance in composing this article. For more information, please contact Patrizia Sulis – Spatial Data Scientist – Joint Research Centre, European Commission. And to read the full study, be sure to check out their article:

  • (2024) Integration of Remote and Social Sensing Data Reveals Uneven Quality of Broadband Connectivity Across World Cities. In Urban Inequalities from Space: Earth Observation Applications in the Majority World (pp. 13-31). Cham: Springer International Publishing.

To learn more about Ookla for Good and inquire about partnership opportunities, visit the Ookla for Good page on our website.

Ookla retains ownership of this article including all of the intellectual property rights, data, content graphs and analysis. This article may not be quoted, reproduced, distributed or published for any commercial purpose without prior consent. Members of the press and others using the findings in this article for non-commercial purposes are welcome to publicly share and link to report information with attribution to Ookla.

| April 14, 2024

Early 5G Results for the Samsung Galaxy S24 Family: How do New S24 Models Stack up to Previous Generations and iPhone 15’s on 5G? 

Consumers around the world eagerly awaited Samsung’s release of the latest line of its flagship Galaxy S series of smartphones on February 1, 2024. Was the wait worth it? In this article, we analyze how the Samsung Galaxy S24 family measures up against its predecessors in terms of 5G speed and latency during its first several weeks on the market (February 1 – March 24, 2024). 

With new chipsets and technologies alongside plenty of other cool new features in Galaxy S24 devices, we examined early results from Speedtest® users in 15 select countries around the world to see whether the Galaxy S24 lineup — comprising the S24, S24+, and S24 Ultra models — outpaced Samsung’s earlier S22 and S23 families for 5G performance. Additionally, we’ve compared the 5G speeds and latency of Apple’s iPhone 15 family — including the iPhone 15, 15 Pro, and 15 Pro Max — against Samsung’s offerings.

It’s important to note that device performance metrics can vary significantly from one country to another. Factors such as government and mobile operator investments in 5G infrastructure, spectrum allocations, and the extent of 5G network deployment all contribute to these variations.

Key takeaways:

  • The Samsung Galaxy S24 family showed a statistically significant lead for median 5G download speeds in seven out of 15 countries in this study. On the other hand, the Apple iPhone 15 family posted the fastest 5G speeds in only one country. It’s worth noting, however, that speed differences between Galaxy S24 devices and iPhone 15’s were relatively minor in some of the countries analyzed (see the charts below for details). 
  • The S24 family recorded the lowest median 5G multi-server latency in 10 of 15 countries, whereas iPhone 15 devices offered the highest median 5G latency in 10 markets.
  • Samsung Galaxy S22 models unsurprisingly offered the slowest median 5G download speeds in eight countries, while the Galaxy S23 family was slowest in four countries. 
  • Devices in the Galaxy S24 family experienced the fastest median 5G upload speed in 13 of the 15 countries examined for this analysis. However, upload speeds were much slower than 5G download speeds, ranging from 11.83 Mbps to Mbps to 66.52 Mbps, with median 5G upload speeds of 50 Mbps or better found in only three countries (South Korea, Qatar, and the U.A.E.). 

To learn more about what speeds mean in real-world terms, check out our article looking at how much speed users need for a variety of daily mobile activities.

Take me straight to the data!

Asia Pacific | Middle East & Africa | Europe | North America 

New chipsets and modems in the Galaxy S24 family 

Everyone wants to know if the newest technology is worth the upgrade when they’re investing in an expensive new smartphone. Each device within the Galaxy S24 family has various upgrades (including new AI features), but when it comes to features that impact speed and latency performance, here’s a look at the chipsets and modems for each line of smarthpones in our study:

  • Samsung Galaxy S24 Ultra models use Qualcomm’s Snapdragon 8 Gen 3 chipset globally, while the S24 and S24+ use it only in Canada, China, Hong Kong, Taiwan, and the United States. The Samsung Exynos 2400 is used elsewhere for the S24 & S24+.
  • The Galaxy S23 series uses Qualcomm’s Snapdragon 8 Gen 2 worldwide, while Samsung S22 models use an Exynos 2200 chipset in Europe and the Snapdragon 8 Gen 1 elsewhere. 
  • Galaxy S24 devices utilize the Snapdragon X75 5G modem, S23 models have a Qualcomm Snapdragon X70 modem, while S22 models have a Qualcomm Snapdragon X65 modem.
  • Apple iPhone 15 models use Apple’s A16 Bionic chipset, while iPhone 15 Pro and Pro Max models use the A 17 Pro chip. All devices in the Apple iPhone 15 family utilize Qualcomm’s Snapdragon X70 5G modem. 

Do you own one of these devices? See how your speeds compare by taking a quick Speedtest. And to learn more about mobile and fixed broadband performance in cities and regions across the world, visit the Speedtest Performance Directory, where you’ll find ISP recommendations, insights on mobile and fixed broadband performance, and more. 

Digging into the Data: Where does the Samsung Galaxy S24 Family Lead its S22, S23, and iPhone 15 Counterparts Around the Globe? 

Early findings from Speedtest Intelligence® reveal that the latest Galaxy S24 family outperformed its predecessors — especially S22 models — in terms of 5G speed across several of the countries we analyzed. While differences in speed between devices were minimal in some countries, S24 models showed significant speed advantages over previous generation Samsung devices in markets like Qatar, the United Arab Emirates, and others. 

Does that mean users in those locations should upgrade immediately? Not necessarily. The decision to upgrade depends on various factors, from price to features to performance and more. However, if speed is your primary concern, the Galaxy S24 series is a compelling option, especially for consumers currently utilizing devices from the Galaxy S22 lineup, which is now over two years old.

Read on to see our complete analysis of all 15 countries in this study or select a region below to dig into more localized results. 

Asia Pacific | Middle East & Africa | Europe | North America 

Asia Pacific

Consumers in Hong Kong who want new features might want to upgrade

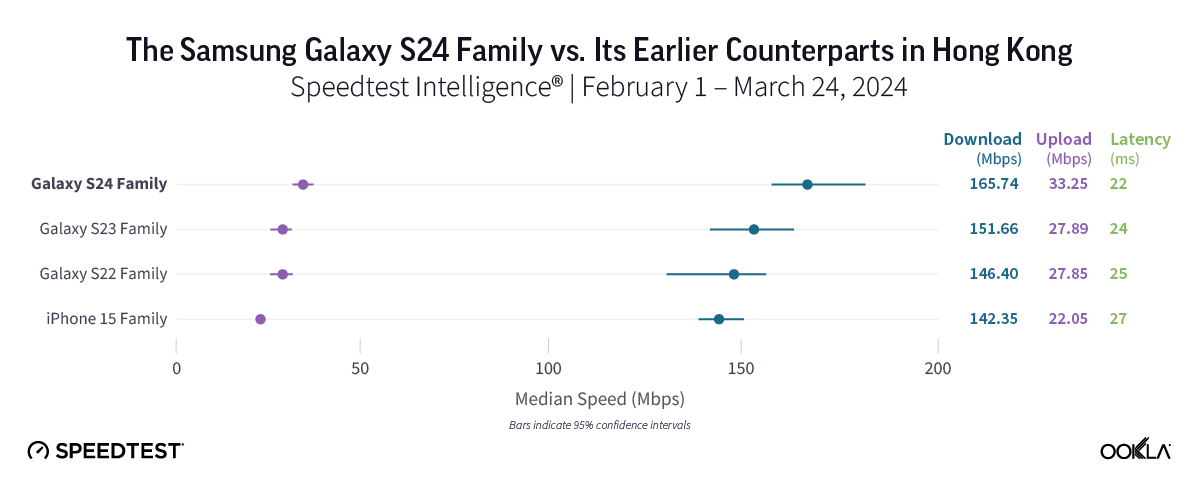
Speedtest Intelligence data revealed strong performance for all device families in Hong Kong, with the new Galaxy S24 family performing particularly well, boasting a median 5G download speed of 165.74 Mbps and the lowest median 5G multi-server latency in the market at 21.74 ms. However, the S24’s median 5G download speed was statistically comparable to that of its older Samsung and iPhone 15 peers, making the choice to upgrade currently more about new features than about performance.

Bottom line: With strong — and similar — 5G download speeds across all device families in Japan, upgrading to a new Galaxy device isn’t a must just yet, unless you want to enjoy the S24 family’s new features.

5G speeds were fast across the board in India, where the Samsung Galaxy 24 family held a slight edge 

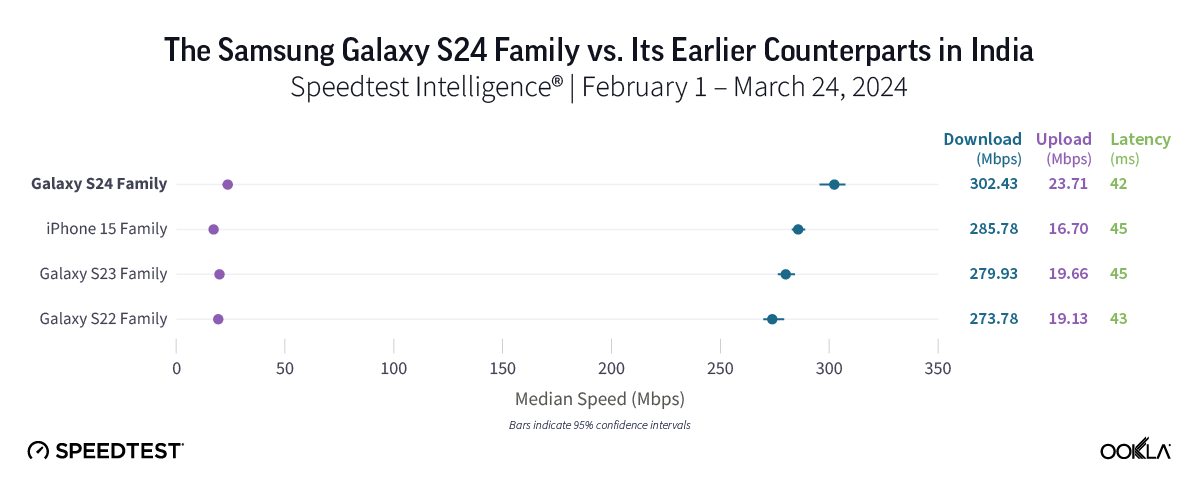
In the early days following the release of the Galaxy S24 series in India, the latest Samsung models led for both 5G download speeds and 5G multi-server latency. While 5G speeds impressed across all device families in India — all notched speeds of at least 273.78 Mbps — Galaxy S24 models posted the top median 5G download speed at 302.43 Mbps and the lowest median 5G multi-server latency at 41.56 ms. On the other hand, Galaxy S22 devices showed the slowest — but still impressive — speeds in India at 273.78 Mbps, while the Samsung Galaxy S23 was just a tick behind at 279.93 Mbps. The iPhone 15 family, meanwhile, clocked in with a median 5G download speed of 285.78 Mbps.

Bottom line: Consumers in India currently using S22 devices might want to upgrade to an S24 model, given the nearly 30 Mbps speed advantage the new devices provided in this study. However, with excellent 5G speeds across all device families and similar speeds for devices in the S22, S23, and iPhone 15 families, users might not feel a huge difference in their 5G experience from one device to another. 

Samsung Galaxy enthusiasts in Indonesia needn’t rush to upgrade to an S24 device — yet

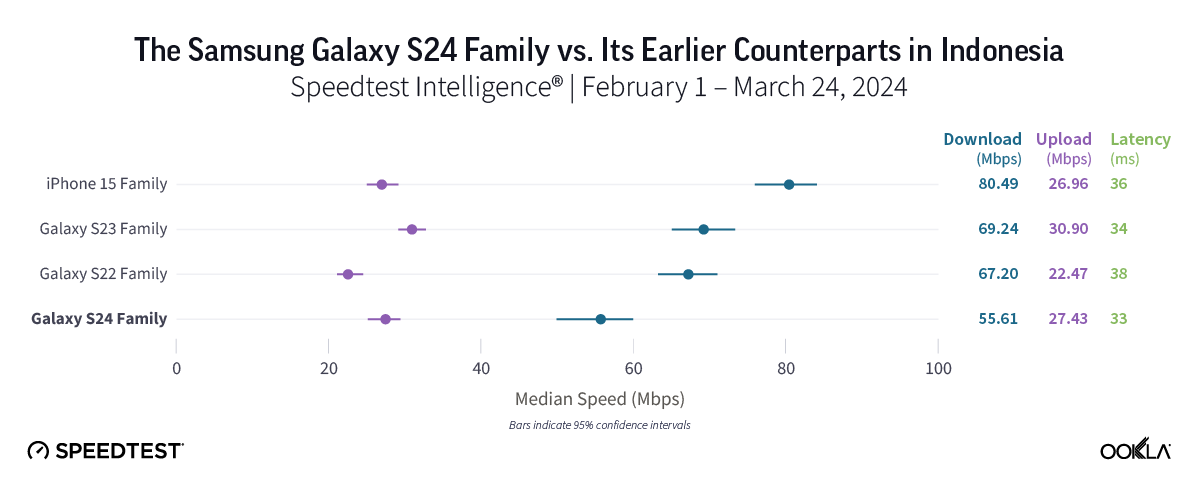
In contrast with what our results showed in most countries, the iPhone 15 family emerged as the leader in Indonesia with a median 5G download speed of 80.49 Mbps. All three Samsung Galaxy families trailed with speeds ranging from 55.61 Mbps for the S24 family to 69.24 Mbps for S23 models. While the iPhone 15 family’s 5G speed was nearly 25 Mbps faster than that of S24 devices, it’s worth noting that the difference among all three Samsung Galaxy models was only about 14 Mbps, and our results revealed no statistical difference in median 5G download speeds between the S22 and S23 families. 

Bottom line: Despite the iPhone 15 providing the top speeds in the market, the Galaxy S24 could hold greater long-term potential for consumers in Indonesia, especially when compared to older Samsung models. Equipped with a newer processor and modem, the S24 could see quicker speeds over time as Indonesia’s 5G networks evolve. In the meantime, users shouldn’t experience notable disparities in speed or latency among all three Samsung device families analyzed. 

No clear advantage to upgrading to a new Galaxy S24 in Japan

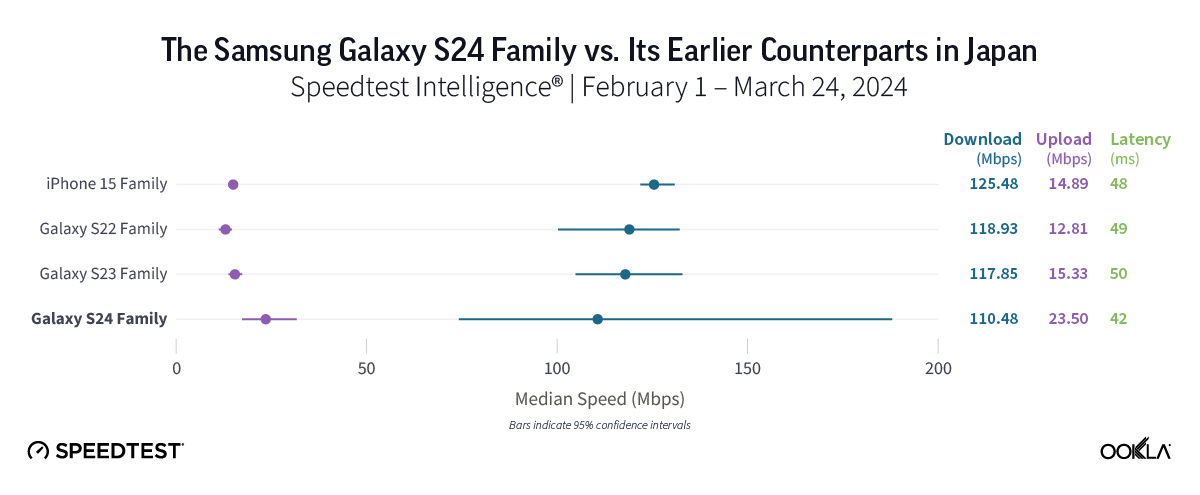
People in Japan who upgraded to a Galaxy S24 device likely haven’t seen a performance boost just yet. While all four device families performed similarly well in Japan, there was no statistical difference in the median 5G download speeds offered by all three Galaxy families, with speeds ranging from 110.48 Mbps to 118.93 Mbps across all three Galaxy devices. The iPhone 15 lineup also had a strong speed at 125.48 Mbps. 

Bottom line: With generally similar median 5G download speeds across all device families in Japan, users who are considering upgrading to a new Galaxy smartphone might want to wait. While we anticipate the S24’s speeds to surpass those of its predecessors over time, 5G speeds in the market were quite close across all three Galaxy device families in the early days of the S24’s release. 

For users in the Philippines who want the fastest 5G, Galaxy S22 users may want to upgrade. 

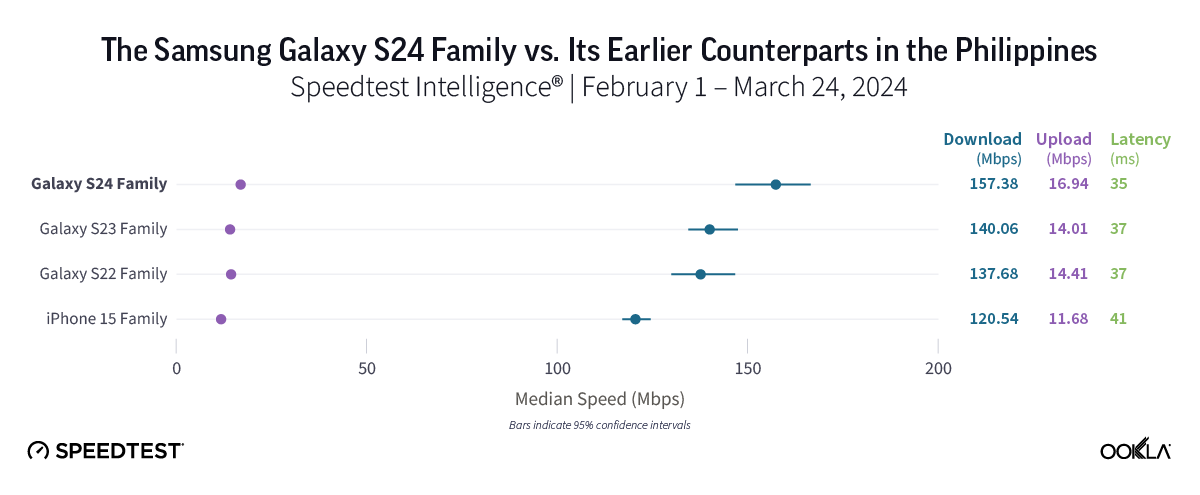
Samsung Galaxy S24 users in the Philippines might have noticed a modest improvement to their 5G speeds compared to those on older S23 and S22 models since they upgraded, as the Galaxy S24 family’s median 5G download speed of 157.38 Mbps was about 20 Mbps faster than that of Galaxy S22’s (137.68 Mbps) and a little over 15 Mbps faster than the Galaxy S23 family (140.06 Mbps). Meanwhile, the iPhone 15 family’s median 5G download speed of 120.04 Mbps trailed all three Samsung Galaxy families in the market.

Bottom line: For users in the Philippines seeking the fastest possible 5G experience, upgrading to an S24 device is worth considering. However, it’s worth noting that the differences in speed between devices wasn’t as stark as that in some other countries, and upgrading likely isn’t for everyone just yet.

Samsung Galaxy S24 and iPhone 15 much faster on 5G in South Korea than S22 devices 

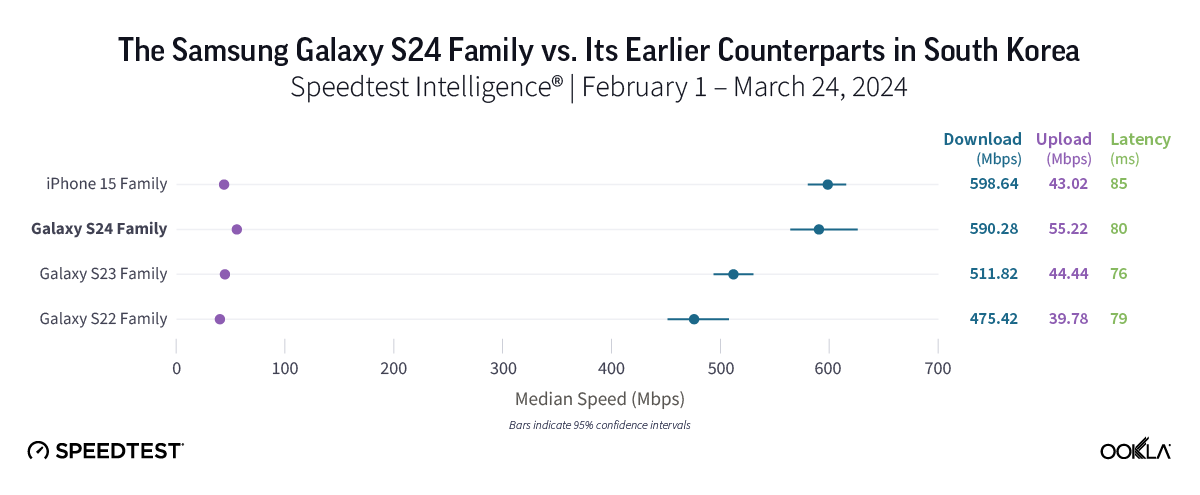
In South Korea, home to the first widespread 5G launch in the world, our results reflected outstanding 5G speeds, with the iPhone 15 and Samsung Galaxy S24 families posting similar median 5G download speeds of 598.64 Mbps and 590.28 Mbps, respectively. The S22 family, meanwhile, offered the “slowest” 5G speeds in South Korea, posting an excellent median 5G download speed of 475.42 Mbps, while Galaxy S23 devices came in at 511.82 Mbps.

Bottom line: 5G users in South Korea can expect remarkable 5G speeds across the board, regardless of their device. However, Samsung Galaxy loyalists who currently use S22 models might want to consider moving to an S24 model, given that the S24 family was over 100 Mbps faster than Galaxy S22’s, while also offering the top median 5G upload speed in the market at 55.22 Mbps. For users who prioritize the fastest 5G experience, Galaxy S24’s and iPhone 15’s are both worth a look.

Samsung Galaxy S24 family provides top 5G download speeds in Thailand 

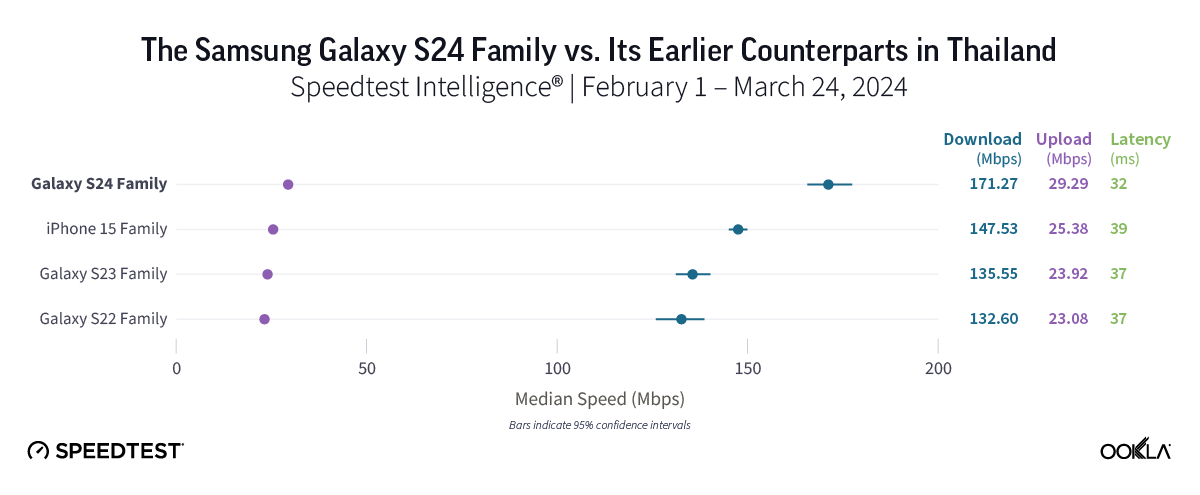
In Thailand, Speedtest Intelligence showed that the Galaxy S24 family delivered the fastest median 5G download speed in the market at 171.27 Mbps. That speed marks a notable improvement of roughly 35 Mbps over the S22’s 132.60 Mbps and the S23’s 135.55 Mbps. The Galaxy S24 family also offered the lowest median 5G multi-server latency in Thailand at 32.46 ms. The iPhone 15 family provided the second-fastest median 5G download speed in the market at 147.53 Mbps.

Bottom line: If you’re thinking of upgrading from an S22 or S23 device, our findings suggest that the Galaxy S24 might be the right choice. With faster 5G speeds compared to previous generations, coupled with low latency, smartphones in the Galaxy S24 family should allow for quick content downloads and smooth connectivity overall.

Middle East and Africa 

Excellent 5G speeds in Nigeria, but too soon to tell if you should upgrade for performance 

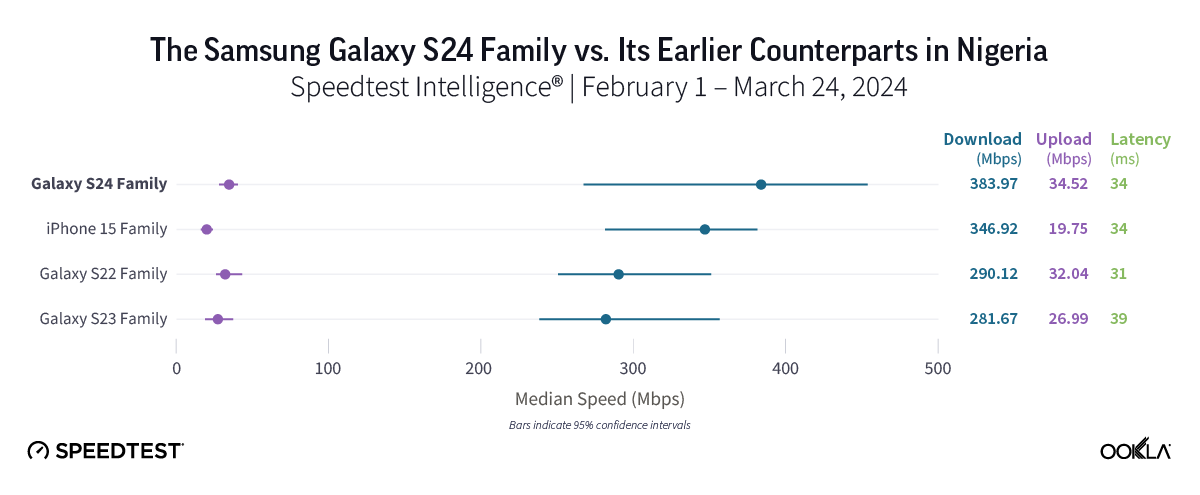
In Nigeria, 5G speeds were impressive overall, from the Galaxy S23 family’s median 5G download speed of 281.67 Mbps to the new Galaxy S24’s speed of 383.97 Mbps. However, in these early days of the S24 lineup’s release, we are still waiting to see how things stabilize in the market before we can make a firm recommendation on whether to upgrade. 

Bottom line: For users who like to have the latest gear and/or want the new features offered by the S24 lineup, upgrading is certainly worth considering. But with fast 5G speeds in general, users on any of the device families we looked at should see a quick download experience in general. 

Samsung Galaxy S24 by far the fastest 5G in Qatar 

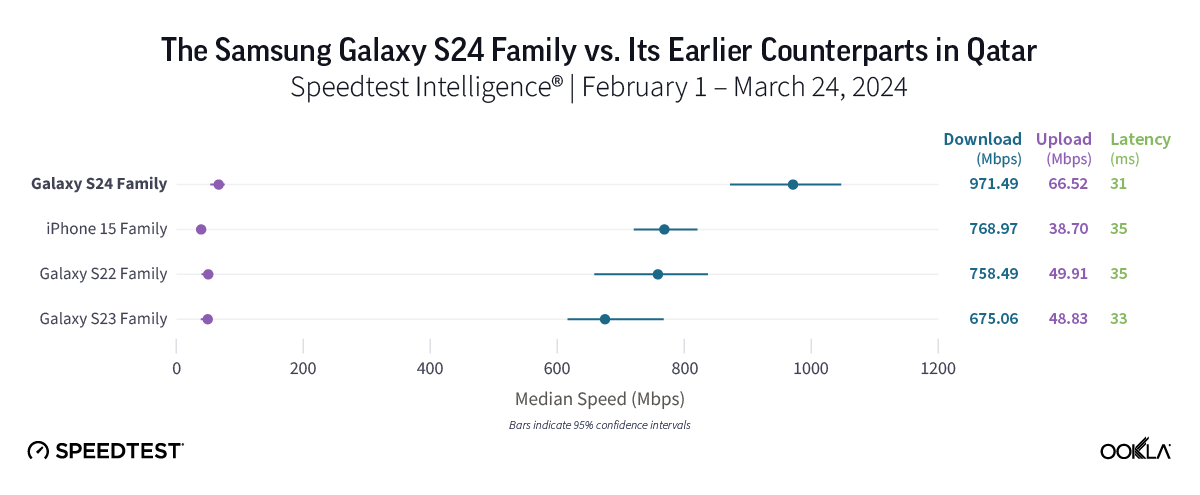
Home to some of the fastest 5G speeds in the world, Qatar showcased impressive median 5G download speeds across all three device families analyzed. The Galaxy S24 family led the pack with a jaw-dropping median 5G download speed of 971.49 Mbps and the top median 5G upload speed in the market at 66.52 Mbps. The Galaxy S22 and S23 families trailed, albeit with great median 5G download speeds of 675.06 Mbps and 758.49 Mbps, respectively. The iPhone 15 family also had a strong showing in Qatar, posting a median 5G download speed of 788.97 Mbps. 

Bottom line: Consumers in Qatar with older Galaxy S22 or S23 devices might want to make the switch, given that the S24 family’s remarkable median 5G download speed of nearly 1 Gbps was much faster than those of either the Galaxy S23 or especially S22 families.

Galaxy S24 a good option for Samsung fans in the U.A.E.

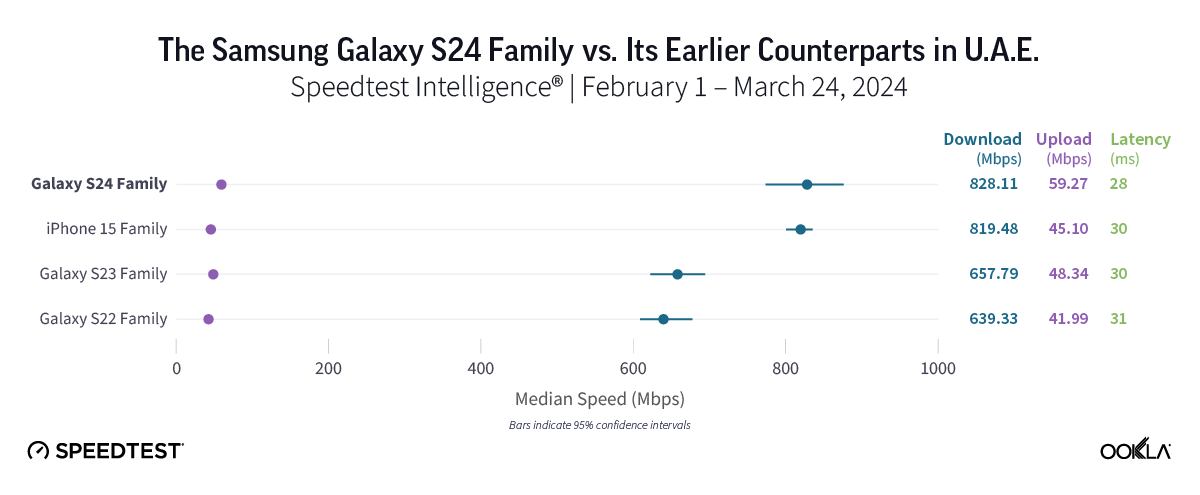
In the U.A.E., which is home to outstanding 5G speeds in general, the Samsung Galaxy S24 and iPhone 15 families delivered the top median 5G download speeds in the market at 828.11 Mbps and 819.48 Mbps, respectively. When compared to its earlier generation Samsung predecessors, the S24 family held a commanding speed advantage, boasting speeds that were at least 170 Mbps higher than those of either the S22 (639.33 Mbps) or S23 (657.79 Mbps) families. 

Bottom line: With median 5G download speeds ranging from 639.33 Mbps to 828.11 Mbps, consumers in the U.A.E. will likely enjoy fantastic speeds regardless of device model. However, for current S22 or S23 users hoping to boost their speeds, the Galaxy S24 family stands out as a good choice.

Europe

Galaxy 24 family clocked 5G speeds over 80 Mbps faster than those on S22 devices in France

In France, the Galaxy S24 family was the frontrunner, delivering the fastest median 5G download speed among all device families in the market at 292.15 Mbps. That marks a significant improvement of over 80 Mbps compared to the S22 family’s speed of 211.32 Mbps, along with a jump of more than 60 Mbps compared to the S23’s speed of 229.78 Mbps. Meanwhile, iPhone 15 users experienced the second-fastest median 5G download speed in the market at 257.15 Mbps, with 5G latency nearly identical to that of the S22 and S23 families.

Bottom line: For consumers currently using an S23 or especially an S22 model, upgrading to an S24 device is worth considering. Our results in France showed that the latest Samsung lineup delivered a superior 5G speed experience over older Galaxy models, especially those in the Galaxy S22 family.

Galaxy S24’s a good choice over S22 models in Spain

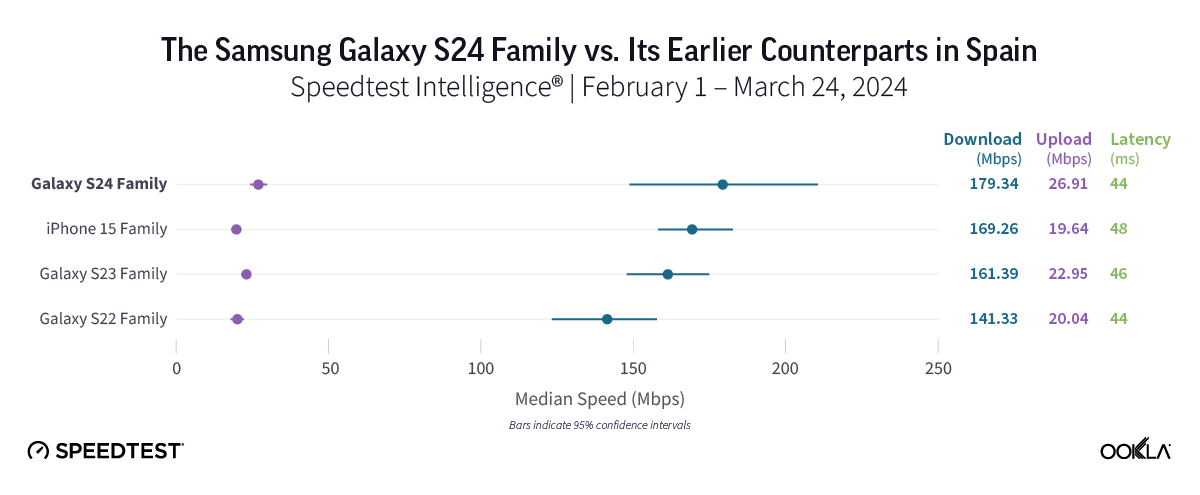
All four device families in Spain provided good 5G speeds, ranging from the S22’s median 5G download speed of 141.33 Mbps to the S24 family’s speed of 179.34 Mbps. While speeds recorded on S24, S23, and iPhone 15 devices were statistically similar, the difference in speed between the S24 and S22 was much starker, with the S24 nearly 40 Mbps faster than the S22. 

Bottom line: The decision to upgrade should be more straightforward for S22 users in Spain compared to those with S23 or iPhone 15 models, as the S24’s median 5G download speed of 179.34 Mbps was almost 40 Mbps faster than that of the S22 family. 

Samsung Galaxy S24 likely worth an upgrade from S22 in the U.K. 

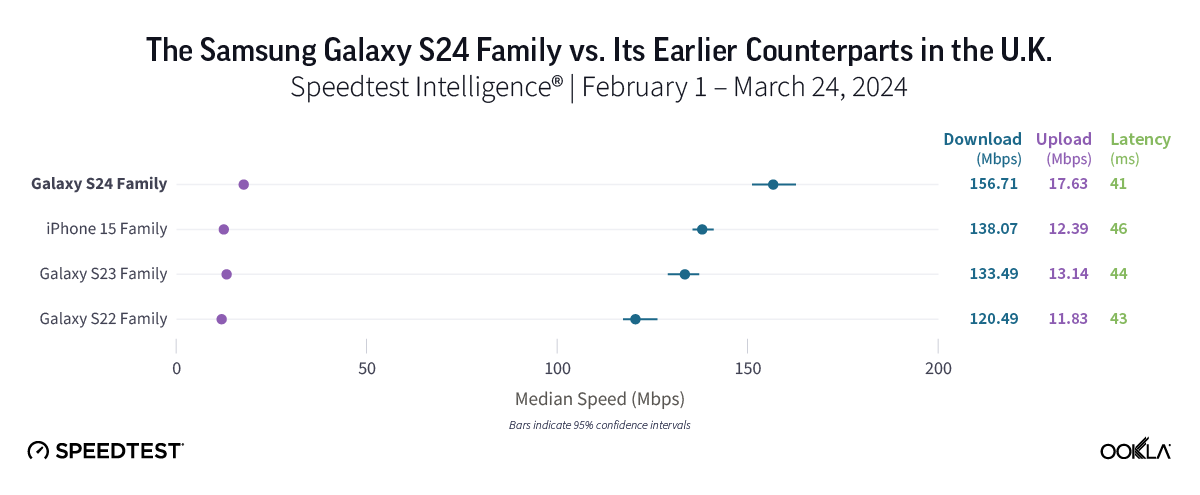
In the U.K., Samsung Galaxy S24 models were the fastest in the market, with the S24’s median 5G download speed of 156.71 Mbps offering a speed gain of nearly 40 Mbps compared to the Galaxy S22 family. Galaxy S24 models also posted faster speeds than both the Galaxy S23 and iPhone 15 families, but the difference was less stark than it was with the S22 family, with Galaxy S22 models clocking in at 120.49 Mbps, Galaxy S23’s at 133.49 Mbps, and iPhone 15’s at 138.07 Mbps. 

Bottom line: U.K. consumers using either S22 or S23 models may want to look into upgrading to the S24 to enjoy faster speeds. That’s especially true for S22 users, given that the S24’s median 5G download speed was nearly 40 Mbps faster than that of S22 devices.

North America

No major 5G speed boost for users in Mexico who upgraded to a Galaxy S24 

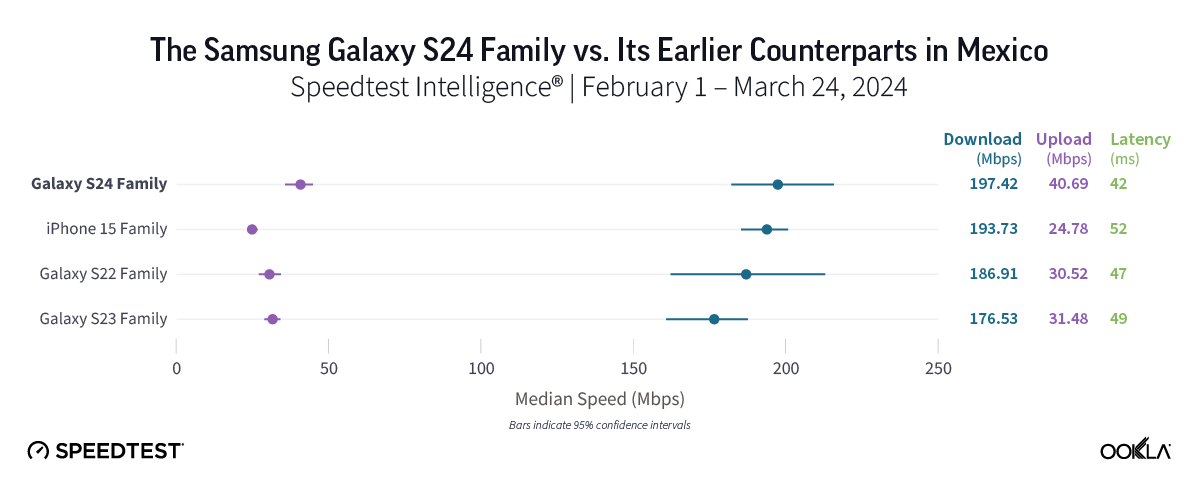
5G speeds in Mexico were impressive, with all device families posting median 5G download speeds of 176.53 Mbps or better. While Speedtest users of the Galaxy S24 family experienced the fastest median 5G download speed in the market at 197.42 Mbps, that speed marked only a modest improvement compared to Galaxy S22 devices (186.51 Mbps) and iPhone 15 models (193.73 Mbps). The Galaxy S23 family showed the slowest 5G speed in the market at 176.53 Mbps, coming in about 20 Mbps slower than Galaxy S24 models

Bottom line: For users eager to embrace the new features offered by Galaxy S24 devices or move on from S23 devices, an upgrade might be worthwhile. However, with fast 5G speeds across all device families in Mexico and only about 20 Mbps separating all four device families in our study, users likely won’t see a major change in their 5G experience by upgrading. 

Galaxy S22 users in the U.S. could get faster 5G with the S24 family. 

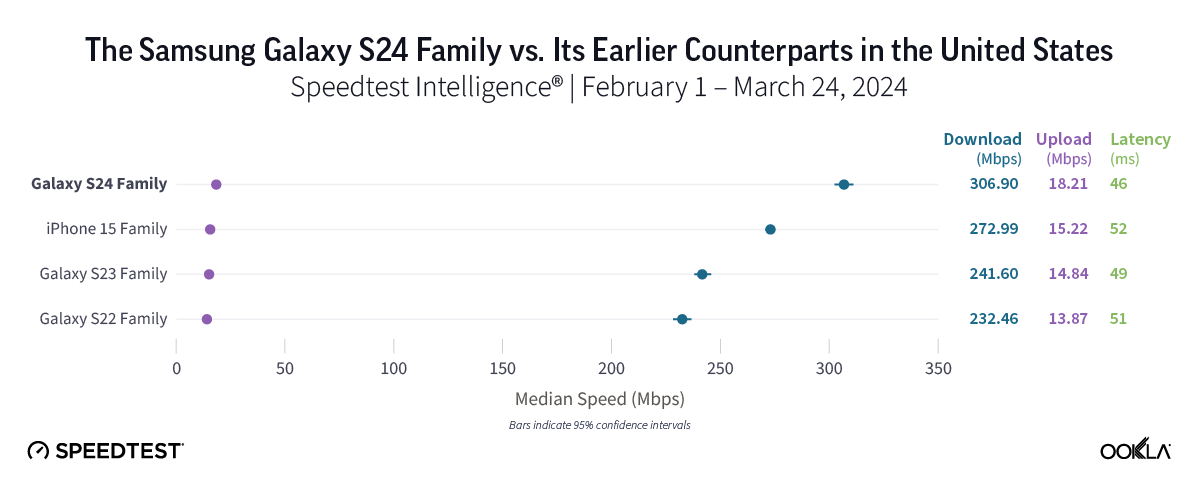
5G speeds in the U.S. had an impressive showing across the board, with median 5G download speeds of at least 232.46 Mbps across all device families. The Samsung Galaxy S24 family led the way with an excellent median 5G download speed of 306.90 Mbps and the lowest median 5G multi-server latency at 45.71 ms. Users of the Galaxy S24 family enjoyed speeds roughly 75 Mbps faster than those on S22 models (232.46 Mbps) and approximately 65 Mbps faster than those on S23 devices (241.60 Mbps). Meanwhile, the iPhone 15 family also offered a strong performance, with a median 5G download speed of 272.99 Mbps. 

Bottom line: Users of older Samsung device models in the United States may want to switch to one of the newer models to capitalize on the faster 5G speeds offered by S24 devices, though speeds were strong for all device families in this study. 

Ookla will continue monitoring how devices are performing 

We’ll continue to check in on device performance as new models enter the market, so stay tuned for further insights into mobile and fixed broadband performance in countries around the world. 

If you’ve recently made the switch to an S24 device, make sure you’re getting the speeds you need by downloading the iOS or Android Speedtest® app.
Ookla retains ownership of this article including all of the intellectual property rights, data, content graphs and analysis. This article may not be quoted, reproduced, distributed or published for any commercial purpose without prior consent. Members of the press and others using the findings in this article for non-commercial purposes are welcome to publicly share and link to report information with attribution to Ookla.
| September 10, 2025

5G Helped Egypt and Tunisia Uplift Mobile Performance to New Levels

North African countries are accelerating their 5G plans in response to Egypt’s and Tunisia’s success. Tunisia led the way with the introduction of 5G in February, followed by Egypt in June. Algeria and Morocco are also expected to join the race by the end of the year. 2025 is set to be a pivotal year for the countries in that region as 5G should offer a step change in user experience and create opportunities to accelerate the digitisation of the economy.

Takeaways

  • 5G rollouts in Tunisia and Egypt delivered strong speed gains. The two countries adopted different spectrum strategies for their commercial deployments in early 2025, with Tunisia opting for a mix of 700 MHz and 3500 MHz bands, and Egypt allocating spectrum in the 2500 MHz band. 5G launch led to median mobile download speeds jumping from tens of megabits per second to the hundreds—over 300 Mbps in Tunisia and above 100 Mbps in Egypt. However, as more users joined, national median speeds moderated—illustrating the typical tapering of early adoption boosts.
  • 5G could enhance the attractiveness of fixed wireless access (FWA), but its value proposition is currently weak. Operators introduced FWA plans mirroring VDSL and fiber speed tiers (30–100 Mbps in Tunisia; entry-level packages in Egypt) with comparable pricing. However, the high cost of CPE equipment for 5G FWA and parity in pricing reduces its affordability, keeping fixed broadband via fiber or VDSL more attractive for many consumers.
  • 5G is gaining momentum in the rest of North Africa. With Algeria and Morocco planning launches by late 2025, North Africa’s 5G rollout is accelerating. Spectrum allocations, infrastructure partnerships (e.g., tower and fiber joint ventures in Morocco), and sporting events like AFCON are driving operators to expand coverage rapidly, setting the stage for more competition and broader digital-economy growth across the region.

5G promises to bring socio-economic benefits to the population and businesses in North Africa

5G technology offers significantly faster and more reliable internet access to mobile users and households where it has been implemented. Everyday activities such as video calls with family, video streaming, and navigation will become smoother and less frustrating, enhancing the overall user experience.

Beyond individual convenience, 5G serves as a catalyst for local and national economic growth. Faster networks attract businesses, lower technical barriers, accelerate development cycles for new products and services, and empower small businesses to reach customers online. By fostering innovation enabled by 5G—such as automated logistics, advanced agricultural sensors, and smart city infrastructure—5G can create jobs, boost productivity, and enhance public services, making communities more competitive and resilient.

North African countries have the opportunity to leverage 5G infrastructure, attract investors, and startups that address regional needs. This activity, if combined with favorable policies, has the potential to draw venture capital, multinational R&D centers, and public-private partnerships that fund training programs and pilot projects, ultimately creating jobs and strengthening local tech ecosystems across North Africa.

The introduction of 5G in Tunisia significantly improved mobile performance

Gulf countries are the leaders in the Middle East and North Africa (MENA) in 5G commercial deployment, having launched in 2019/2020, followed by Jordan in 2023. Other countries in the region are still in the early stages or have yet to launch commercial 5G services. For example, Türkiye is preparing for 5G, with a spectrum auction planned for 2025 and targeted rollout in 2026. Iraq is close to launch, with technical preparations and partnerships in place, where Vodafone was selected as the main partner to build the national 5G network.

5G momentum is only beginning to build in the other North African countries. Tunisia officially launched 5G services in February 2025, with all three major operators—Tunisie Télécom, Orange Tunisie, and Ooredoo Tunisie—initiating commercial rollouts around the same time. Each operator received 5 MHz spectrum in the 700MHz band (FDD) and 100 MHz in the 3.5GHz band (TDD). An additional allocation of 20 MHz in the 3.5 GHz band is also possible for each operator, at an additional cost. The 2.6 GHz band is also optionally available to operators subject to a request to the Ministry of Communication Technologies and Digital Economy and payment of associated fees, with a capacity of 60 MHz (TDD) per operator. In the medium term, new bands will be allocated as part of the development of 5G, notably the 26 GHz millimeter wave (mmWave) band, to support very high-speed services and industrial use cases.

All three operators offered mobile broadband packages and fixed wireless access (FWA) plans at launch for consumers and businesses. Tunisie Telecom and Ooredoo offered FWA contracts with three speed tiers: 30 Mbps, 50 Mbps, and 100 Mbps, while Orange only introduced a single package at 30 Mbps. For mobile broadband, all three operators propose tariffs based on data allowances ranging from 25GB to up to 2000GB for Ooredoo (valid for 1 year). These speeds offered with 5G FWA mirror to a large extent those offered with VDSL or fiber, but significantly exceed ADSL speeds. However, since they are priced at the same level, there are no savings the consumers in adopting FWA over other solutions.

Since launch, Tunisia has experienced a surge in 5G Speedtest sample volumes and noticeably improved mobile download speeds, reflecting expanding coverage and great market adoption. The median mobile download speed went up to more than 300 Mbps following the launch of 5G on February 14th. Latency improved more moderately, falling below 12 ms after the 5G launch.

5G catapulted Tunisia to the top position in the Speedtest Global Index® in North Africa, overtaking Morocco in February 2025. Tunisia maintained its performance in subsequent months despite a slight drop from its February peak. 

Speedtest Global Index Rankings for Algeria, Egypt, Morocco, and Tunisia
Source: Speedtest Global Index® | January – June 2025
Speedtest Global Index rankings, Algeria, Egypt, Morocco, and Tunisia

Median download speed for all technologies fell to 41.96 Mbps in June 2025 (compared to 30.29 Mbps in January 2025), while upload speed dropped to 15.95 Mbps (compared to 14.65 Mbps at the beginning of the year).

This drop was partially due to a decrease in the 5G median download speed over the following two months. This is a typical trend as the same 5G network has to serve an increasing number of 5G subscribers. As a result, 5G’s speed fell from 237.19 Mbps in February 2025 to 200.95 Mbps by June 2025.

Evolution of Network Performance and Number of Samples After 5G Launch, Tunisia
Source: Speedtest Intelligence® | January 2025–June 2025
Evolution of Network Performance and Number of Samples after 5G Launch, Tunisia

Egypt, North Africa’s largest mobile market, also went 5G in 2025

Egypt is the latest market in North Africa to introduce 5G. At the beginning of 2025, there were 116 million mobile subscribers, corresponding to a population penetration of 99%, as many users typically carry multiple SIM cards. Telecom Egypt was the first to secure a 15-year 5G license in 2024, followed by the other three operators: e& Egypt, Orange, and Vodafone. Trials of 5G services have been ongoing since then, and the service was finally launched on June 4th, 2025. 

The initial 5G rollout focused on major cities such as Cairo and Alexandria, with plans for gradual expansion. Orange prioritized 5G deployment in high-traffic areas. Vodafone’s initial 5G rollout encompasses 2,000 sites distributed across various governorates, including Cairo and sections of Upper Egypt. According to Ookla’s data, all operators have used 2500MHz TDD spectrum. Vodafone, Etisalat, and WE use 20 MHz of bandwidth, while Orange uses 30 MHz.

Operators in Egypt did not introduce new 5G-dedicated mobile or FWA tariffs. Instead, they offered free service activation, discounts, and additional data allowances. On the fixed side, while FWA packages cost less than entry-level VDSL plans with similar data allowances, an FWA CPE can cost as much as four times the cost of a VDSL CPE. This currently makes FWA a less affordable option for those looking to get fast broadband at home.

Egypt’s median mobile download speed more than doubled to 82.49 Mbps following the June 4th, 2025, launch of 5G, exceeding the 4G median download speed of 46.42 Mbps. 5G median download speed exceeded 100 Mbps on that day and largely maintained the same level over the following week.

The median upload speed also improved, reaching 11.76 Mbps for all technologies, nearly 50% up from the median upload speed on June 1st. It exceeded 9.22 Mbps for 4G. The 5G median upload speed stayed in the 13-15 Mbps range over the next few days following the 5G launch, offering an incremental improvement over 4G. By the end of June, the overall median download and upload speeds had steadily declined over the following weeks.

Evolution of Network Performance Before and After 5G Launch, Egypt
Source: Speedtest Intelligence® | January 2025–June 2025
Evolution of Network Performance and Number of Samples after 5G Launch, Tunisia

Even if the impact of 5G on the median download speed weakened in more recent months, it has a significant impact in helping Egypt climb the mobile Speedtest Global Index to reach the 69th position, up 17 places since the beginning of 2025. As a result, it is closing the gap with regional peers like Morocco and Tunisia. This advancement is crucial not only for the telecom sector but also for positioning the country as a hub of innovation and technological progress in the wider MENA region.

Algeria and Morocco plan to launch 5G before year-end

In Algeria, 5G licenses were awarded at the beginning of July 2025 following the tendering process, initiated in late May. The initial 5G rollout campaign will begin in eight pilot provinces (Algiers, Oran, Constantine, Sétif, Skikda, Ouargla, Tlemcen, and Blida) and gradually expand to other regions. Commercialization of the services is expected in Q3 2025, with all three operators having conducted trials and prepared their infrastructure for the official launch.

Ookla’s radio frequency (RF) data allows us to track the progress of the pre-launch 5G network rollout. The chart below shows the extent of 5G coverage in the capital, Algiers, in two periods: Q4 2024 and Q2 2025. The 5G network expanded to more suburbs, with mostly good coverage indicated by a low RSRP value.

Map of 5G RSRP Algiers, Algeria - Q4 2024Map of 5G RSRP Algiers, Algeria - Q2 2025

The government is positioning 5G primarily as a driver of economic growth, expecting it to support the country’s digitization efforts. Based on that, we expect consumer adoption to be more limited than in Tunisia and Egypt. That said, consumer take-up is expected to pick up in the first year as around 60% to 70% unique smartphones identified by Ookla in Algeria are 5G-capable, giving a large proportion of the population the ability to activate 5G, provided that operators extend network coverage and offer incentives to migrate their SIMs and plans.

Morocco is also set to launch 5G before the end of 2025 as it hosts the Africa Cup of Nations (AFCON). The telecom regulator ANRT kicked off the tendering process and completed it in July 2025 with the award of three licenses. Maroc Telecom acquired 120 MHz of spectrum, while Orange and inwi obtained 70 MHz of spectrum to launch 5G. The operators are committed to covering 45% of the population of Morocco with 5G by the end of 2026 and 85% of it by the end of 2030, higher than the original target of 70% by 2030. The national coverage will coincide with the 2030 FIFA World Cup, which Morocco will host alongside Spain and Portugal.

The deployment of 5G infrastructure started in 2023 with the priority being to commercialize 5G in and around the six stadiums and cities hosting the AFCON (i.e. Rabat, Casablanca, Tangier, Fez, Marrakech, and Agadir), followed by additional 20 cities and main highways by 2026, then covering 40 more cities by the end of 2028. Furthermore, in March 2025, Maroc Telecom and inwi partnered to establish two joint ventures: TowerCo targets the installation of 3,000 new towers by 2028 and 6,000 by 2033 to support 5G rollout; and Fiber Co, which aims to expand fiber connections to 1 million in two years and 3 million in five years. These initiatives are part of the government’s Digital Morocco 2030 national development program.

Using Ookla’s RF data, it is possible to map out the progressive trial deployment of 5G. The chart below shows the extent of 5G coverage in Rabat between Q4 2024 and Q2 2025.

Map of 5G RSRP Rabat, Morocco - Q4 2024Map of 5G RSRP Rabat, Morocco - Q2 2025

Operators have been deploying 5G infrastructure since 2023, giving them enough lead time to make 5G services available across the cities hosting AFCON by the end of 2025. The sporting event is an ideal opportunity to drive consumer interest and adoption. According to Ookla’s data, around 60% of smartphones in Morocco already support 5G, giving mobile operators a large base of potential users who will migrate to 5G.

While North Africa has been late in adopting 5G, recent launches show the significant speed gain potential, as observed in Tunisia and Egypt, while highlighting the importance of pricing and spectrum strategy in driving coverage and uptake. As Algeria and Morocco prepare to join the 5G bandwagon, governments and operators alike must balance ambitious coverage targets with initiatives to offer affordable devices and compelling service offers. Providing incentives will not only stimulate early interest in 5G but also establish a new basis for market competition and service innovation, which will ultimately benefit users and the economy.

We will continue to monitor mobile networks’ performance across North Africa, benchmark countries, and operators, and explore how various factors affect it. For more information about Speedtest Intelligence data and insights, please contact us.

Ookla retains ownership of this article including all of the intellectual property rights, data, content graphs and analysis. This article may not be quoted, reproduced, distributed or published for any commercial purpose without prior consent. Members of the press and others using the findings in this article for non-commercial purposes are welcome to publicly share and link to report information with attribution to Ookla.

| July 8, 2025

From Vulnerability to Resilience: How Portugal’s Mobile Networks Handled the Iberian Peninsula Blackout | Da Vulnerabilidade à Resiliência: Como as Redes Móveis Portuguesas Reagiram ao Apagão na Península Ibérica

Portuguese/Português

Robust power redundancy markedly reduced outage impacts for one operator, while limited backup systems led to widespread service collapse for another, highlighting the importance of resilience planning and investment.

Mobile operators, equipment vendors, and policymakers throughout Europe are grappling with the challenge of hardening telecom infrastructure to withstand increasingly frequent and severe disruptions caused by power outages, sabotage, and extreme weather events.

Earlier this year, the Iberian grid blackout placed Portugal’s mobile operators at the coalface of this resilience challenge, creating a real-world stress test of their infrastructure on an unprecedented scale. Effective power redundancy, supported by battery and generator backups, coupled with energy conservation measures that strategically adjusted network configurations to preserve site availability, emerged as critical tools for limiting outage impact.

However, new analysis of Ookla® background signal scan data from the outage reveals that each operator’s ability to mitigate the disruption varied significantly, offering important lessons for future improvements in Portugal and beyond. This research builds upon our earlier findings in Spain, where we cross-referenced crowdsourced ‘no service’ data with satellite imagery to demonstrate that the profile of network disruptions and recovery moved in lockstep with power grid developments. 

Key Takeaways:

  • At the height of the network disruptions on the evening of April 28th, more than one in three mobile network users in Portugal was left without service. The voltage drop triggered by the grid collapse rapidly cascaded through Portugal’s mobile networks, driving the share of users experiencing total service loss (unable to call, text, or use data as sites went dark) from a pre-blackout baseline below 0.1% to over 10% within two hours. At the peak late on April 28th, as battery and generator backups were progressively depleted, more than 60% of users across the worst-affected areas of Portugal were left without service.
  • While severe network outages affected all Portuguese operators during the blackout, mobile users on DIGI’s network were significantly more likely to experience a total loss of service. With up to 90% of DIGI subscribers left without any mobile coverage for over twenty-four hours, the outage exposed critical gaps in redundancy across multiple infrastructure layers, from mobile sites at the edge all the way to the core, potentially reflecting the limitations of DIGI’s less mature network buildout in Portugal.
  • MEO’s network demonstrated significantly greater resilience across Portugal during the April 28th blackout, illustrating how deep and widely deployed battery reserves can materially flatten and delay outage impacts triggered by power loss. At the peak of service disruption six to eight hours after the power loss, MEO’s subscribers were on average half as likely to lose service as those on NOS’s network, four times less likely than Vodafone’s subscribers, and six times less likely than DIGI’s. As a result, at least tens of thousands more MEO subscribers likely stayed connected for calls, texts, and data throughout April 28th.
  • The variation in outage impact between operators in Portugal was significantly greater than in Spain, revealing much deeper asymmetry in the level of power resilience across Portugal’s mobile networks. As in Spain, however, the pattern of service restoration reflected the geographically phased re-energisation of the power grid, with network disruptions persisting later into the night in Lisbon than in Porto, consistent with transmission operator REN’s blackstart process, which began in the north and moved south.

Blackout cascaded through Portugal’s mobile networks, forcing aggressive energy conservation measures as traffic demand surged and power backups were depleted

When the grid-wide collapse severed power to virtually all of mainland Portugal at 11:33 local time on April 28th, mobile sites were immediately forced off mains electricity and had to rely on batteries or generator backups, triggering a nationwide race between grid restoration and the exhaustion of backup reserves across telecom networks. Sites lacking any power autonomy vanished immediately (such as dense urban small cells), triggering a stepwise collapse in overall network density that resembled a cliff drop followed by a gradually declining tail.

The sudden loss of residential electricity rendered fixed networks and in-home Wi-Fi CPEs unusable, forcing users onto mobile networks and unleashing a massive surge in traffic that put intense pressure on capacity, particularly in urban areas. This was reflected in a rapid degradation of mobile network performance across all metrics, as illustrated in analysis of Speedtest Intelligence® data published in our earlier research.

The spike in demand on the country’s mobile infrastructure occurred just as operators were racing to implement aggressive energy conservation measures to extend the life of backup power at mobile sites. These efforts included phased 5G switch-offs (as 3.5 GHz massive MIMO radios typically draw two to three times the power of a low-band 4G sector), prioritizing core voice and text services, and reducing cell-edge transmit power where network loads were light. 

Blackout produced a composite outage curve made of one large step (DIGI) superimposed on several peaked pulses (Vodafone, NOS, and MEO)

Although all of Portugal’s mobile operators implemented similar energy conservation measures during the blackout, the depth and distribution of power autonomy within each operator’s site portfolio, including the partially shared footprint between NOS and Vodafone, ultimately shaped their network resilience. This is evident in the distinct outage trajectories revealed by analysis of background signal scan data, which shows whether a device could connect to any network (2G, 3G, 4G, or 5G) based on a very large, geographically diverse sample across Portugal.

DIGI’s still-nascent network, which is leaner and heavily concentrated in cities (therefore making deployment of power autonomy more challenging at space-constrained rooftop sites), proved particularly brittle.  Within four hours of the voltage drop, the share of subscribers on its network with no signal shot up from less than 0.1% to more than 90%, a classic step-function collapse. The operator’s entire radio layer appeared to disappear almost simultaneously, driven by shallow site-level batteries and little layered fallback. In addition, network access remained crippled for more than a day, likely pointing to a catastrophic failure of deeper elements such as the Evolved Packet Core (EPC) in Lisbon, which may have lacked geo-redundancy or sufficient power autonomy.

While Vodafone’s outage curve did not exhibit the same cliff-like profile as DIGI’s, instead following more of a triangular or peaked pulse shape, it still reached a very sharp peak. The heterogeneous distribution of backup power across Vodafone’s site footprint produced a multi-step survival curve, with each autonomy band expiring (for example, sites with four-hour batteries) causing another visible kink in the aggregate outage trajectory. 

By 19:30 local time, almost 70% of Vodafone’s subscribers were left without service as the last reserves of backup power began to deplete ahead of grid restoration. While this was still materially lower than the more than 90% service loss seen on DIGI’s network in Portugal, it was nearly twice as high as the peak outage experienced by any operator in Spain on April 28th. Service was, however, rapidly restored on Vodafone’s network from 20:00 in a phased geographic sequence, aligning with the restoration of the grid, with the no service ratio falling below 5% by midnight.

Unlike other operators in Portugal, Vodafone and NOS have extensive RAN sharing, with a joint venture owning and operating actively shared sites in rural and interior areas, while sites in urban areas are passively shared. Despite this, the outage profile for NOS was notably less severe. This indicates that NOS’s network features relatively deeper power resilience in locations where its infrastructure is not actively shared, compared with Vodafone’s independently managed sites. On NOS’s network, the proportion of subscribers without service peaked early at nearly 30%, closely resembling the impact profile of the worst-affected operator in Spain, and remained at this level until power was restored.

The merits of widely deployed and deep battery reserves in flattening and delaying the outage curve (much like masks and vaccines suppress infection spread during a pandemic) were clearly demonstrated in MEO’s case. Its outage peak was lower and the tail shorter, with the proportion of subscribers left without service peaking at just over 16%, which was the best performance observed across Spain and Portugal on April 28th.

Outage experience demonstrates the role of power autonomy and geo-redundancy in hardening telecom infrastructure against external shocks

When the grid collapsed, every Portuguese operator reached for the same first lever by killing off the power-hungry 5G layer, but what happened next diverged. The breadth and depth of each operator’s power autonomy (at the site level) and the extent of geo-redundancy (at the core level), along with their ability to cascade lower-band layers, throttle traffic, and reshuffle spectrum, dictated how much of their network stayed online and for how long during the blackout.

The pronounced asymmetry in outage impacts observed across operators’ subscriber bases highlights the urgent need to harden mobile networks and raise all infrastructure layers to a higher baseline of resilience ahead of future severe events. There is now broad consensus, which is expected to be enshrined in the European Commission’s forthcoming Digital Networks Act (DNA), that telecom networks are critical infrastructure essential for societal functioning, and that even brief service disruptions can quickly escalate into serious public safety risks.


Da vulnerabilidade à resiliência: Como as redes móveis portuguesas reagiram ao apagão na Península Ibérica

Uma forte redundância energética atenuou significativamente os efeitos da falha para um dos operadores, enquanto a escassez de sistemas de reserva provocou a interrupção generalizada dos serviços noutro, evidenciando a importância do planeamento e do investimento em resiliência.

Os operadores móveis, fornecedores de equipamentos e reguladores em toda a Europa estão a enfrentar o desafio de reforçar a infraestrutura das telecomunicações para resistir a interrupções cada vez mais frequentes e graves causadas por falhas de energia, sabotagem e fenómenos meteorológicos extremos.

No início deste ano, o apagão da rede ibérica colocou os operadores móveis portugueses na linha da frente deste desafio de resiliência, criando um teste real de resistência das infraestruturas numa escala sem precedentes. A redundância energética eficaz, apoiada por baterias e geradores de reserva, aliada a medidas de poupança de energia que ajustaram estrategicamente as configurações da rede para preservar a disponibilidade dos sites, revelou-se uma ferramenta crucial para limitar o impacto das falhas de energia.

No entanto, uma nova análise dos dados de monitorização passiva de sinal da Ookla® durante a falha revela que a capacidade de cada operador para mitigar a interrupção variou significativamente, oferecendo lições importantes para futuras melhorias em Portugal e além-fronteiras. 

Esta investigação baseia-se nas conclusões anteriores obtidas em Espanha, onde cruzámos dados crowdsourced de “sem serviço” com imagens de satélite para demonstrar que o perfil das perturbações e da recuperação das redes evoluiu em paralelo com a situação da rede elétrica.

Principais conclusões:

  • No auge das perturbações na rede, na noite de 28 de abril, mais de um em cada três utilizadores de redes móveis em Portugal ficou sem serviço. A queda de tensão desencadeada pelo colapso da rede elétrica propagou-se rapidamente nas redes móveis do país, fazendo com que a proporção de utilizadores com perda total de serviço (sem possibilidade de fazer chamadas, enviar mensagens ou utilizar dados, à medida que os sites ficavam inoperacionais) subisse de um valor inferior a 0,1 % antes do apagão para mais de 10 % em menos de duas horas. No pico, já no final do dia de 28 de abril, à medida que as baterias e os geradores de reserva se esgotavam progressivamente, mais de 60 % dos utilizadores nas zonas mais afetadas de Portugal ficaram sem serviço.
  • Embora todas as operadoras portuguesas tenham sido afetadas por graves falhas na rede durante o apagão, os utilizadores móveis da rede DIGI foram significativamente mais propensos a experienciar uma perda total de serviço. Com até 90 % dos assinantes da DIGI sem qualquer cobertura móvel durante mais de vinte e quatro horas, a falha expôs lacunas críticas na redundância em vários níveis da infraestrutura, desde as antenas móveis na periferia até ao núcleo da rede, refletindo potencialmente as limitações do desenvolvimento menos amadurecido da rede da DIGI em Portugal.
  • A rede da MEO demonstrou uma resiliência significativamente maior em todo o território português durante o apagão de 28 de abril, mostrando como as reservas robustas e amplamente implantadas de baterias podem atenuar e atrasar de forma significativa os impactos das falhas de energia. No pico da interrupção do serviço, entre seis e oito horas após a perda de energia, os assinantes da MEO tinham, em média, metade da probabilidade de perder o serviço comparativamente aos da NOS, quatro vezes menos do que os da Vodafone e seis vezes menos do que os da DIGI. Como resultado, provavelmente dezenas de milhares de assinantes da MEO mantiveram-se conectados para chamadas, mensagens e dados ao longo de todo o dia 28 de abril.
  • A variação do impacto das interrupções entre operadores em Portugal foi significativamente maior do que em Espanha, revelando uma assimetria muito mais profunda no nível de resiliência energética das redes móveis portuguesas. No entanto, tal como em Espanha, o padrão de restabelecimento do serviço refletiu a reenergização faseada geograficamente da rede elétrica, com as perturbações a persistirem até mais tarde durante a noite em Lisboa do que no Porto, em conformidade com o processo de arranque da rede de transporte da REN, que começou no norte e avançou para sul.

O apagão propagou-se pelas redes móveis de Portugal, obrigando a medidas agressivas de poupança de energia, à medida que a procura de tráfego aumentava e as reservas de energia se esgotavam

Quando o colapso de toda a rede cortou a energia em praticamente todo o território português continental, às 11h33, hora local, do dia 28 de abril, as antenas móveis foram imediatamente desligadas da corrente elétrica principal e tiveram de recorrer a baterias ou geradores de reserva, desencadeando uma corrida nacional entre a restauração da rede e o esgotamento das reservas de energia nas redes de telecomunicações. As infraestruturas que não dispunham de qualquer autonomia energética desapareceram imediatamente (como as “small cells”— micro- e pico-células), desencadeando um colapso gradual da densidade global da rede que se assemelhou a uma queda abrupta seguida por uma diminuição gradual.

A súbita perda de eletricidade residencial tornou as redes fixas e os equipamentos de Wi-Fi domésticos (CPE) inutilizáveis, obrigando os utilizadores a recorrer às redes móveis e desencadeando um aumento massivo de tráfego que exerceu uma pressão intensa sobre a capacidade, em especial nas áreas urbanas. Isto refletiu-se numa rápida degradação do desempenho das redes móveis em todas as métricas, conforme ilustrado na análise dos dados Speedtest Intelligence® publicada na nossa investigação anterior.

O aumento súbito da procura na infraestrutura móvel do país ocorreu precisamente quando as operadoras estavam a correr para implementar medidas agressivas de poupança de energia para prolongar a duração da energia de reserva nos sites móveis. Esses esforços incluíram o desligamento faseado do 5G (já que os rádios MIMO de 3,5 GHz normalmente consomem duas a três vezes a potência de um setor 4G de baixa frequência), priorizando os principais serviços de voz e texto e reduzindo a potência de transmissão de ponta das células quando as cargas de rede eram baixas.

O apagão produziu uma curva de falha composta por um grande salto (DIGI) sobreposto a vários picos distintos (Vodafone, NOS e MEO)

Embora todos os operadores móveis em Portugal tenham implementado medidas semelhantes de poupança de energia durante o apagão, o grau e a distribuição da autonomia energética da infraestrutura de rede de cada operador, incluindo a infraestrutura parcialmente partilhada entre a NOS e a Vodafone, acabaram por moldar a resiliência das suas redes. Isso é evidente nas trajetórias distintas de falhas reveladas pela análise dos dados de monitorização passiva de sinal, que indicam se um dispositivo conseguia ligar-se a uma das redes (2G, 3G, 4G ou 5G), com base numa amostra ampla e geograficamente diversificada de todo o território português.

A rede ainda em fase inicial da DIGI, com uma cobertura mais limitada e fortemente concentrada em áreas urbanas (o que torna a implantação da autonomia de energia mais difícil em infraestruturas no topo de edifícios), revelou-se particularmente frágil. Quatro horas após o colapso da rede elétrica, a percentagem de assinantes da sua rede sem qualquer sinal disparou de menos de 0,1 % para mais de 90 %, um colapso abrupto e generalizado, típico de um corte súbito. Toda a infraestrutura de rádio da operadora parece ter desaparecido quase em simultâneo, impulsionada por baterias de curta duração ao nível dos sites e com pouca redundância em camadas superiores. Além disso, o acesso à rede permaneceu severamente comprometido por mais de um dia, apontando provavelmente para uma falha catastrófica de elementos mais profundos, como o Evolved Packet Core (EPC) em Lisboa, que pode ter carecido de redundância geográfica ou de autonomia energética suficiente.

Embora a curva de falhas da Vodafone não tenha apresentado o mesmo perfil de queda abrupto como a DIGI, seguindo mais uma forma triangular, ainda assim atingiu um pico muito acentuado. A distribuição heterogénea da autonomia energética na rede em toda a área de cobertura da Vodafone produziu uma curva de sobrevivência em várias etapas, com cada faixa de autonomia a esgotar-se (por exemplo, locais de rede com baterias de quatro horas) a provocar um novo ressalto visível na trajetória do apagão. 

Por volta das 19h30, hora local, quase 70 % dos assinantes da Vodafone estavam sem serviço, à medida que as últimas reservas de energia de apoio começaram a esgotar-se antes do restabelecimento da rede elétrica. Embora este valor seja significativamente inferior aos mais de 90 % de perda de serviço verificados na rede da DIGI em Portugal, representava quase o dobro do pico de interrupção registado por qualquer operador em Espanha no dia 28 de abril. O serviço, contudo, foi rapidamente restabelecido na rede da Vodafone a partir das 20h00, seguindo uma sequência geográfica faseada, em consonância com a reposição da rede elétrica, com a taxa de ausência de serviço a cair para menos de 5 % à meia-noite.

Ao contrário de outros operadores em Portugal, a Vodafone e a NOS partilham extensivamente a RAN, uma joint venture que possui e opera infraestruturas partilhadas ativamente em áreas rurais e do interior, enquanto nas zonas urbanas as infraestruturas são partilhadas de forma passiva. Apesar disso, o perfil de interrupções da NOS foi notavelmente menos grave. Isto indica que a rede da NOS apresenta uma resiliência energética relativamente maior nos locais onde a sua infraestrutura não é ativamente partilhada, em comparação com os geridos de forma independente pela Vodafone. Na rede da NOS, a proporção de subscritores sem serviço atingiu um pico precoce de quase 30 %, assemelhando-se de perto ao perfil de impacto do operador mais afetado em Espanha, mantendo-se neste nível até a energia ser restabelecida.

Os méritos das reservas de baterias amplas e profundamente distribuídas na atenuação e no adiamento da curva de falhas (de forma semelhante às máscaras e vacinas na contenção da propagação de infeções durante uma pandemia) ficaram claramente demonstrados no caso da MEO. O pico da interrupção foi menor e a retoma mais rápida, com a proporção de assinantes sem serviço a atingir um pouco mais de 16 %, o melhor desempenho observado em toda a Península Ibérica no dia 28 de abril. 

A experiência do apagão demonstra o papel da autonomia energética e da geo-redundância no reforço da resiliência da infraestrutura das telecomunicações face a choques externos

Quando a rede elétrica colapsou, todos os operadores portugueses tentaram a mesma primeira alavanca: desligar a camada de 5G, intensiva em consumo energético. Mas a partir daí, os caminhos divergiram. A extensão e a robustez da autonomia energética de cada operador (ao nível das infraestruturas) e o grau de geo-redundância (ao nível do núcleo), juntamente com a capacidade de cascatear camadas em bandas inferiores, limitar o tráfego e reconfigurar o espectro, ditaram quanto da sua rede permaneceu operacional, e durante quanto tempo, durante o apagão.

A acentuada assimetria nos impactos do apagão observada entre as bases de clientes dos diferentes operadores realça a necessidade urgente de reforçar as redes móveis e elevar todos os níveis da infraestrutura a um patamar mais robusto de resiliência, em antecipação a futuros eventos graves. Existe um consenso alargado, que se prevê que venha a ser consagrado no futuro Digital Networks Act (DNA) da Comissão Europeia, de que as redes de telecomunicações são infraestruturas críticas essenciais para o funcionamento da sociedade, e que mesmo interrupções breves do serviço podem rapidamente transformar-se em riscos sérios para a segurança pública.

Ookla retains ownership of this article including all of the intellectual property rights, data, content graphs and analysis. This article may not be quoted, reproduced, distributed or published for any commercial purpose without prior consent. Members of the press and others using the findings in this article for non-commercial purposes are welcome to publicly share and link to report information with attribution to Ookla.

| March 19, 2025

5G Standalone: Global Deployment Trends and Monetization Strategies

As 5G networks continue to mature globally, the industry is witnessing a pivotal shift toward 5G Standalone (5G SA) architecture, which offers significant performance improvements compared to the initial Non-Standalone (NSA) 5G deployments that began in 2019. This evolution to 5G SA represents not just a technical upgrade but a fundamental reimagining of what mobile networks can deliver to both consumers and enterprises. 

The global 5G SA landscape shows significant regional variations in deployment strategies, performance metrics, and monetization approaches. Using network data from Speedtest Intelligence® and market analysis from Omdia, this article looks at the current state of 5G SA development across different regions and the innovative ways operators are working to monetize these investments.

For a deeper dive into these topics, including expert analysis and interactive data visualizations, watch our recent webinar featuring Ookla and Omdia analysts. Additionally, our collaborative study with Omdia – “Global Evaluation of Europe’s Digital Competitors in 5G Standalone” – provides comprehensive analysis of 5G SA networks, their performance benchmarks, and the business considerations telecom operators face. 

Global 5G SA Deployment Status

Understanding where different regions stand in their 5G journey is crucial for operators planning their network evolution and investment strategies with 5G SA. The global landscape of 5G SA deployment shows striking variations that reflect different market priorities, regulatory environments, and competitive dynamics.

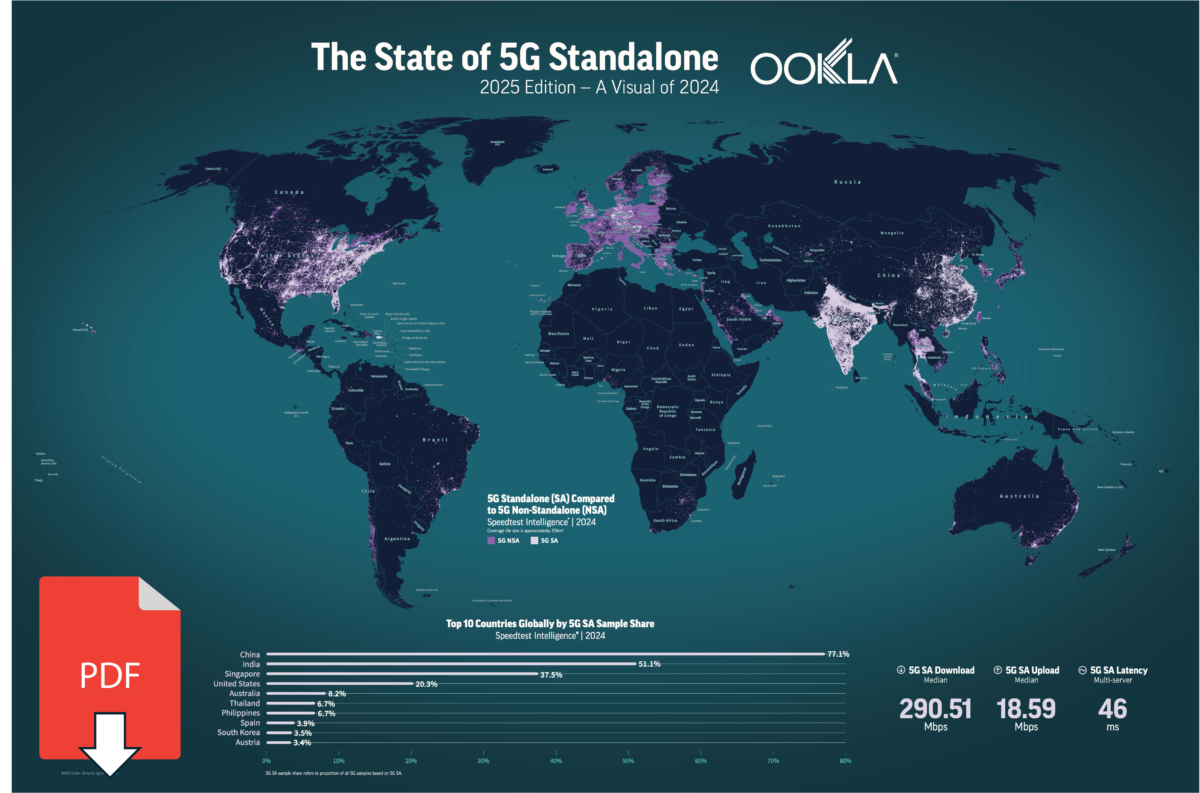
Our analysis shows that China, India, and the U.S. have established clear leadership in 5G SA deployment, with China showing over 80% 5G SA sample share in Ookla’s network measurement data. Meanwhile, Europe lags significantly behind, despite the European Commission setting some of the most ambitious 5G infrastructure targets of any advanced liberal economy. 

These regional disparities highlight the different approaches operators are taking, with some focusing on early competitive launches (to maintain network leadership and cater to the premium market segment), while others are being more cautious and balancing deployment against investment constraints. Several key trends are shaping the global 5G SA landscape:

  • Regional momentum: Despite a slow start, the EMEA region has accelerated its deployment pace, accounting for 70-75% of commercial SA launches in the last two years, with Spain and Austria emerging as regional leaders.
  • Performance gains: 5G SA is delivering consistent improvements across markets, particularly in reducing latency and providing faster median download speeds, with the U.S. emerging as a global performance leader through T-Mobile’s multi-band spectrum strategy.
  • Regulatory impact: Government funding programs and regulatory requirements have proven effective in driving deployment, with countries like Spain (Unico funding program), the U.K. (merger-related coverage obligations), and Germany (spectrum auction conditions) showing stronger progress.

The data clearly shows that no one-size-fits-all approach works for 5G SA deployment, with operators in each market pursuing strategies that reflect their specific circumstances. Countries implementing targeted regulatory measures and spectrum strategies are showing stronger progress, suggesting that supportive policy frameworks play a significant role in accelerating deployment.

Consumer 5G Monetization Strategies

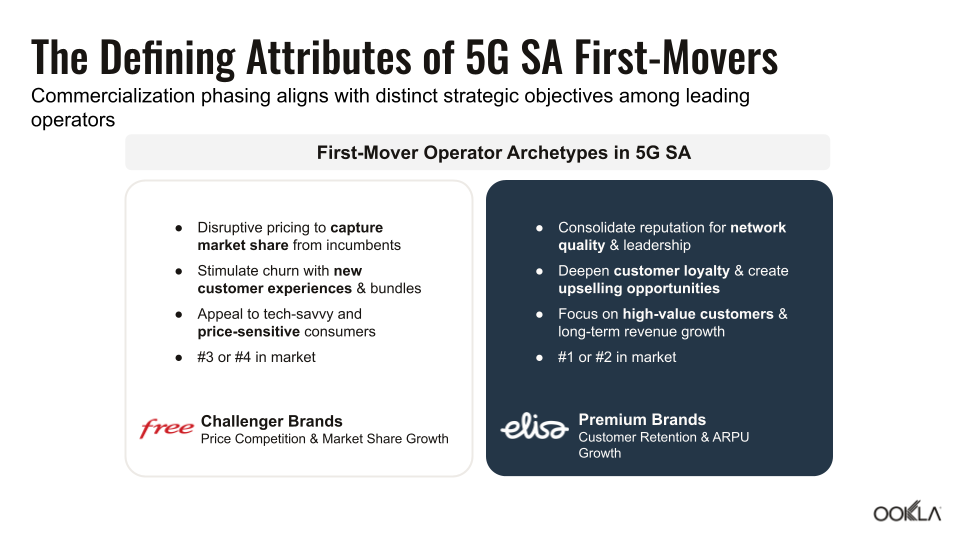
Many operators have struggled to increase average revenue per user (ARPU) despite significant 5G investments over the last several years. With 5G Standalone technology, operators now have new opportunities to create premium offerings that customers truly value, moving beyond simply selling larger data packages.

The most successful operators are finding ways to turn technical capabilities like faster speeds, lower latency, and guaranteed service levels into premium services that target specific customer groups. A recent Omdia survey of 19,000 consumers showed people are willing to pay more for specific benefits like faster speeds, priority video streaming, location-based speed boosts, reduced gaming lag, and better performance for work applications. These consumer preferences are already translating into real-world offerings, with several innovative approaches emerging across markets:

  • Speed tiers: Elisa in Finland offers SA-enabled “5G Plus Premium” with an 18% price premium over standard 5G service
  • Performance guarantees: Three Austria provides bandwidth guarantees for 5G home internet, with premium tiers commanding a 23% price premium
  • Event-based services: Singtel offers special “Event Pass” options for sporting events and concerts, giving customers priority connections when networks are congested
  • Gaming packages: Deutsche Telekom’s 5G Plus Gaming service combines reduced lag times with a bundle of over 100 games for €10
  • Priority connections: U.K. operators target premium subscribers with “Network Boost” and “5G Ultra” services that provide prioritized connections in crowded areas

These early examples demonstrate a clear shift toward more targeted service offerings. Operators are finding that different customer segments have different priorities and different willingness to pay for enhanced services, and the most successful approaches recognize these differences rather than treating all customers the same. While premium operators pursue advanced technical capabilities and guarantees, value-focused providers can still compete effectively with simpler offerings at competitive price points.

Fixed Wireless Access (FWA) Opportunities

5G Standalone technology is helping operators deliver competitive home internet service through Fixed Wireless Access (FWA), creating new revenue streams beyond mobile subscriptions. The approach varies by market, but the enhanced capabilities of SA networks — particularly through network slicing (creating dedicated virtual sections of the network for different services) — allow operators to deliver reliable home broadband while ensuring mobile customers maintain a good experience.

Effective FWA strategies depend heavily on local market conditions. Some operators use FWA to compete with traditional broadband providers, while others focus on underserved areas where fiber deployment is impractical. Key FWA deployment patterns include:

  • Dedicated capacity management: Operators like Elisa use network slicing to separate FWA traffic from mobile traffic, protecting their valuable smartphone customers while delivering better home internet performance
  • Market-specific strategies: U.S. operators have enough spectrum to deploy FWA widely without needing to separate traffic, while European operators in markets with extensive fiber networks must be more selective about where they offer FWA service
  • Targeted customer segments: FWA appeals to specific customer groups like students and temporary residents who value flexibility, while also serving as an alternative in areas underserved by traditional broadband
  • Competitive positioning: Mobile-only operators use FWA as an entry point into the home to compete with traditional broadband providers

FWA represents a significant opportunity for operators leveraging 5G SA capabilities. Our webinar highlighted how FWA approaches vary significantly by market, with operators adapting their strategies based on spectrum resources, existing broadband infrastructure, and competitive dynamics. These tailored approaches allow operators to target specific customer segments and market gaps where FWA offers the most compelling advantages.

Conclusion

The transition to 5G SA represents both a technical evolution and a business opportunity, but success requires understanding what consumers actually value. Beyond raw speed, consumers care about a consistent quality of experience, and the good news is that 5G SA is already delivering tangible improvements in network performance and the user experience.

Operators deploying 5G SA are recognizing that different customer segments have distinct priorities. By creating tailored offerings that address these needs — whether for entertainment, productivity, or other use cases — they are turning 5G SA’s technical advantages into services consumers are willing to pay more for.

For deeper insights into global 5G SA deployment, performance metrics, and monetization approaches, watch our webinar and check out our comprehensive report “Global Evaluation of Europe’s Digital Competitors in 5G Standalone.”

Ookla retains ownership of this article including all of the intellectual property rights, data, content graphs and analysis. This article may not be quoted, reproduced, distributed or published for any commercial purpose without prior consent. Members of the press and others using the findings in this article for non-commercial purposes are welcome to publicly share and link to report information with attribution to Ookla.

| May 19, 2025

Solving the Indoor Connectivity Problem

Indoor connectivity challenges have intensified as modern insulation materials, the shift to mid-band spectrum, and the sunset of 3G networks prevent outdoor mobile sites from reliably penetrating buildings

As much as 80% of all mobile data usage originates from indoor environments like homes, offices and shops. However, mobile networks were initially designed with an ‘outside-in’ approach—relying on outdoor towers to deliver coverage, with the expectation that the signal would reach indoors without being specifically optimised to do so. This strategy helped minimise deployment costs and was based on the assumption that indoor connectivity could be provided by low-band spectrum layered over the macro mobile network, with higher data rate demands met by home broadband and public Wi-Fi networks indoors. 

Consumers have come to rely on mobile data to serve their indoor browsing needs and expect performance parity as they move around from home, work, the shops, and everywhere in between. Even where Wi-Fi and related features like VoWiFi are available and sufficiently fast, in-building mobile coverage remains critical for last resort access to basic telephony features like calling and texting to ensure reliable access to emergency service networks. Indeed, in many advanced European markets, operators and regulators prioritise routing 112 emergency calls over mobile networks using VoLTE rather than Wi-Fi, as VoLTE offers greater reliability and quality of service through dedicated voice packet routing on mobile networks.

But if indoor connectivity is so important, why is it still so lacklustre? While there is no one easy answer, there are a few clear contributing factors.

More mid-band spectrum in 5G networks introduces new propagation challenges

One of the biggest barriers to good indoor connectivity lies in how networks are designed, and this challenge is becoming more common with the deployment of 5G. The trend towards higher frequency spectrum for 5G (e.g. 3.5 GHz mid-band) limits the ability of the existing mobile network site grid to provide high-speed mobile coverage deep indoors. This is due to the more constrained propagation characteristics of this spectrum. Simply put, the signals that mid-band 5G networks rely on struggle to penetrate the materials in their path when the user is indoors.

Lower frequency signals do not face this problem to the same extent, but their utility has become more limited over time. While the lower frequency spectrum (e.g. 800/900 MHz with 3G/4G and 700 MHz more recently with 5G) traditionally used to provide in-building mobile coverage previously sufficed, the significant increase in the density of devices and the intensity of their data traffic demands mean these frequencies alone are unable to support the higher performance attributes often expected with 5G, particularly in dense urban settings.

Because of this, the traditional approach of outside-in network design, where signals are transmitted from the macro coverage layer of a lattice or monopole-based high site into a cluster of buildings, is no longer fit for purpose in the absence of investment in network densification if demands for reliably fast connectivity indoors are to be met. 

Modern insulation materials turn buildings into Faraday cages

Network design is not the only contributing factor to the profile of signal propagation. While it is true that the signals typically used for 5G networks struggle to travel through buildings, some materials present a bigger challenge than others.

The use of modern insulation materials in new-build and retrofitted developments is posing a significant challenge for mobile operators. Take low-E glass, for example – a type of energy-efficient glass with a microscopic coating designed to reduce energy consumption, which is becoming a commonplace alternative to double glazing. Low-E glass has a significant negative impact on radio signal propagation, and with its growing use in retail and office buildings, the indoor connectivity problem is set to worsen, especially with the use of higher frequency bands

As these kinds of construction materials – those that significantly increase signal attenuation and effectively turn buildings into Faraday cages – become more widely used, network design and building design must go hand-in-hand. Otherwise, the ability of 5G signals to penetrate newer buildings will continue to be diminished.

Technology sunsets require deep network modernization to replicate legacy coverage footprints

The sunset of legacy network technologies like 2G (in markets such as Switzerland and the US) and 3G (in most developed markets) has introduced further challenges as operators seek to preserve indoor coverage levels while upgrading equipment and repurposing frequencies.The process of improving network performance and optimising long-term operating costs with technology sunsets is not as simple as removing and replacing outdated equipment. Operators need to ensure legacy end user devices are upgraded to take advantage of 4G and 5G networks and that older mobile sites are refreshed with modern radio equipment to ensure there is full continuity in coverage levels.

Time Without Service Rose Across All Polish Operators in 2024 as the 3G Sunset Advanced
Speedtest Intelligence® | FY 2023 – 2024

Analysis of Speedtest Intelligence data has revealed a concerning trend of increased time spent on 2G networks or with no service at all in several advanced markets where operators have been slower to repurpose spectrum employed by legacy technologies upon sunsetting 3G. This has manifested in increased reports of dropped calls and other mobile connectivity issues, particularly in areas where decommissioned 3G coverage has yet to be fully replaced by 4G or 5G networks.

Policy goals and incentives place emphasis on outdoor coverage, treating indoor access as incidental

Governments and regulators around the world have historically focused headline policy goals on achieving outdoor population coverage targets. This model has overlooked the importance of indoor mobile coverage, contributing to poor outcomes throughout in-building environments and a lack of public data on the extent of indoor coverage gaps. Some countries, like Ireland and Germany, have made progress by mandating minimum coverage levels at buildings and infrastructure of national importance as part of spectrum licence conditions. In the Irish context, for example, this includes a requirement to provide a minimum 30 Mbps service across key infrastructure sites like train stations and hospitals, as well as community hubs and tourist locations. 

These types of progressive policies, as well as those being adopted by city governments to increase building access for mobile sites through amendments to planning and zoning conditions on future renewals and large-scale commercial and residential developments, can play a positive role in stimulating better indoor coverage outcomes by re-aligning deployment incentives and removing obstacles.  

New deployment models, richer data insights, and greater policy oversight can drive better indoor outcomes

While consumers expect consistently high-performing in-building mobile performance, the path to get there is not a simple one. There is no one-stop solution to the indoor connectivity problem.

That said, the neutral host model is emerging as a key solution to improve in-building mobile outcomes, providing multi-operator access to promote fair competition and share deployment costs, typically based on small cell solutions like the Ericsson Radio Dot. Freshwave (UK) and Proptivity (Sweden) are early examples of neutral host specialists leading the charge in this space.

While the scaling up of small cell deployments at the street and building level, enabled by the neutral host model, is key to improving indoor performance, there are other factors at play. Operators must prioritise repurposing the spectrum in the wake of 3G sunsetting, and building developers and the planning system should take better account of the accommodations needed to host radio equipment. But if indoor connectivity is truly to see a material improvement, these changes should be underpinned by progressive regulatory policies that measure indoor coverage levels and provide better incentives to improve in-building mobile outcomes and remove barriers to deployment.

Ookla retains ownership of this article including all of the intellectual property rights, data, content graphs and analysis. This article may not be quoted, reproduced, distributed or published for any commercial purpose without prior consent. Members of the press and others using the findings in this article for non-commercial purposes are welcome to publicly share and link to report information with attribution to Ookla.

| December 13, 2024

Controlled Network Testing in one of the World’s Top Performing Cities - Seoul

South Korea stands out as an international 5G benchmark

South Korea is a global leader in 5G technology and adoption, having launched the first commercial 5G networks in April 2019. Its exclusive use of C-band for 5G services, with no sub-GHz spectrum allocated for 5G, also puts it in a unique position. 

This focus on C-band across the entire market has led to strong 5G network densification, with the OECD’s most recent Digital Economy Outlook 2024, highlighting the lead South Korea enjoys among a selection of advanced global markets on 5G deployment, with 593 5G base stations per 100,000 inhabitants, well ahead of next placed Lithuania (328) and Finland (251). Earlier this year, the Korean regulator, the Ministry of Science and ICT (MSIT) announced that South Korea had attained nationwide 5G coverage.

MSIT allocated wide bands to each of the three mobile operators, KT, SK Telecom and LG U+, with the former two receiving 100 MHz, and the latter initially receiving 80 MHz. Despite its spectrum disadvantage, our previous South Korean benchmark placed LG U+ in pole position in terms of median download performance. Since that benchmark, LG U+ was awarded an additional 20 MHz of C-band spectrum in mid-2022, which it deployed during 2023, which brought its C-band holdings in line with the competition.

Given its level of network densification, and deployment in wide spectrum bands in the prized C-band, it’s no surprise that South Korea consistently ranks in the top-10 of Ookla’s Speedtest Global Index for mobile performance, (which ranks countries based on median download speeds), currently placing 6th as of October 2024.

This lead is helping deliver improved consumer experiences, with South Korea outpacing other East Asian markets (including Japan, China, Taiwan and Hong Kong) on mobile gaming performance, recording the lowest latency, as well as the highest median download and upload performance in the region.

Strong 5G adoption, but performance has been a concern for consumers

From a consumer perspective, South Korea is a mature 5G market, with LG U+, for example, recording a 5G penetration rate (among handsets) in excess of 70% as of Q3 2024. South Korean users have been swift to embrace the new technology, with 5G connections in the market growing steadily, crossing the 30 million mark during 2023, and reaching 36.11 million as of Q3 2024, according to GSMA Intelligence.

Despite strong adoption, and 5G providing a significant uplift over 4G performance in the market – median 5G download speeds in November 2024 were 524.23 Mbps across the market according to Speedtest Intelligence, compared to 64.08 Mbps for 4G-LTE – the mobile providers have had to focus their efforts on continuous improvements in performance levels. All three mobile providers were fined by South Korea’s antitrust regulator in 2023, following consumer complaints that 5G had not delivered on promises the mobile providers had made in their marketing.

To assess how South Korean mobile performance has evolved since our last benchmark, and how mobile providers have responded to consumer concerns on performance, we returned to the capital Seoul during 2H 2024 to benchmark performance in the city. We measured mobile performance using RootMetrics’ controlled methodology across a variety of indoor and outdoors locations, using the latest Samsung Android devices. We tested where and when people most often use their smartphones: tourist areas, business districts, and other areas at times of peak mobile usage. Tests were conducted while walking and driving across more than 900km in distance within Seoul, and including in excess of 17,000 samples, including more than 50 major indoor locations. RootMetrics controlled testing methodology is specifically designed to mimic the end-user’s real-world mobile experience.

In addition to benchmarking the mobile providers based on median download and upload performance, as well as latency and availability metrics, we also examined video streaming and voice call performance.

The results: LG U+ approaches gigabit median mobile speeds

LG U+ led the market in 2H 2024 overall performance, with the carrier’s consistently strong showings across speed, reliability, and latency, allowing it to capture the award for the Best 5G Network in Seoul. Based on RootMetrics RootScore methodology, which combines scores across all components of the testing, LG U+ scored 990 out of 1000, ahead of both KT and SK Telecom, which ranked second jointly, with scores of 979 and 978, respectively.

South Korean mobile providers continue to push the boundaries of mobile performance in the South Korean capital, with all three providers recording a significant uplift in download throughput when compared to 1H 2022. LG U+ led the pack, with a median download speed of 916.90 Mbps, while it also led the market based on its performance at the 5th and 95th percentiles. This marks a large increase when compared to our controlled testing in 1H 2022, where LG U+ led the market with a median download speed of 663.4 Mbps, with all three mobile providers increasing median performance significantly, highlighting their continued investment in their 5G networks to help meet consumer expectations. LG U+ recorded the highest median upload speed, with 108.00 Mbps, while SK Telecom led the way on median latency, with 98 ms.

RootMetrics Performance Results – Seoul

5G performance driving impressive user experience metrics

RootMetrics benchmarks voice calling and video streaming performance as part of its comprehensive testing suite. Among South Korean mobile providers, both LG U+ and SK Telecom use a 5G non-standalone (NSA) network configuration, where voice is delivered via VoLTE (using the 4G network), while KT employs a 5G standalone (5G SA) network, where voice is carried over the 5G new radio (VoNR). LG U+ recorded the shortest voice call setup time, of 0.882 seconds, while also achieving an impressive zero call drops or blocks from our testing.

Based on our video testing, KT recorded the fastest median video start time, at 0.91 seconds, while both LG U+ and SK Telecom were able to drive higher bitrates over their networks, of 8.0 Mbps. With these consistent bitrates, 1080p video quality was consistently delivered to users.

RootMetrics User Experience Results – Seoul

Outlook: Seoul serves as a benchmark for other cities across Asia Pacific

South Korea stands out as a global leader in 5G technology and adoption, having launched the first commercial 5G networks in April 2019, and is investing heavily in next generation technologies, with a strong focus on AI and 6G. Its capital city, Seoul, stands out as a benchmark for mobile network performance globally and has maintained its first-mover advantage.

To learn more about Ookla’s controlled drive and walk testing with RootMetrics® and first-party crowdsourced data from Speedtest®, please contact us.

Ookla retains ownership of this article including all of the intellectual property rights, data, content graphs and analysis. This article may not be quoted, reproduced, distributed or published for any commercial purpose without prior consent. Members of the press and others using the findings in this article for non-commercial purposes are welcome to publicly share and link to report information with attribution to Ookla.

| March 16, 2025

Checking In with Speed: Wi-Fi Performance in Luxury Hotels Across APAC’s Top Business Hubs

For business travelers, fast and reliable Wi-Fi is no longer a luxury—it’s a necessity. In today’s digital-first business environment, seamless connectivity enables real-time communication, access to cloud-based applications, and virtual meetings, all of which are critical for productivity and efficiency. A hotel’s Wi-Fi quality plays a major role in a business traveler’s accommodation choice, making high-speed internet a key differentiator for luxury hotels in APAC’s top business cities.

Key Takeaways

  • Only five out of the selected 20 hotels provided Wi-Fi with a median download speed of at least 100 Mbps. The majority of selected hotels fall into either the good performers category (50–100 Mbps) or the laggards category (below 50 Mbps). Leading hotels such as The Peninsula Tokyo and Rosewood Hong Kong demonstrate the benefits of investing in high-quality Wi-Fi infrastructure. 
  • Having a strong national broadband infrastructure does not guarantee fast hotel Wi-Fi. Even in cities with strong broadband infrastructure like Singapore, inconsistent hotel speeds highlight the need for better in-house network optimization. Raffles Singapore and InterContinental Singapore, for example, recorded some of the lowest speeds at 21.35 Mbps and 20.03 Mbps, respectively, underscoring the importance of proper Wi-Fi setup for a better guest experience.
  • Wi-Fi performance in APAC luxury hotels strongly correlates with the adoption of modern technology and effective frequency band usage. Top-performing hotels lead with 47.1% of tests conducted on Wi-Fi 6 and a high reliance on the 5 GHz band (88.4%), delivering faster speeds and more stable connections. In contrast, hotels with download speeds less than 50 Mbps relied heavily on outdated standards, with 75.2% of tests conducted on Wi-Fi 4 and Wi-Fi 5 and only 69.8% of their tests using the faster 5 GHz band. 

Connectivity is a key factor for business travelers in APAC

The Asia-Pacific (APAC) region remains a major hub for global business travel, driven by strong economic growth and dynamic markets. In 2023, business travel spending in APAC surged by 41%, reaching US$567 billion, with projections to exceed US$800 billion by 2027. The top five business meeting destinations in APAC; Singapore, Tokyo, Bangkok, Hong Kong, and Sydney, serve as major business hubs, attracting professionals from around the world.

This report analyzes Wi-Fi performance in selected 5-star hotels across the five cities: Singapore, Tokyo, Bangkok, Hong Kong, and Sydney, with the addition of hotels in Bali, a key location for international conventions and events such as the G20 Bali Summit, the APEC Summit, and the World Bank Annual Meeting.

Map: List of selected hotels and location (cities)

Map of locations of select 5-star hotels in APAC

APAC luxury business hotels show mixed Wi-Fi performance

Using Speedtest Intelligence® data, we analyzed median download speeds inside and around selected hotel properties throughout 2024. This year-long period allows us to assess Wi-Fi performance and stability under varying hotel occupancy levels and guest profiles. To ensure data reliability, we excluded hotels with insufficient measurement samples and focused only on the most commonly used Wi-Fi network at each hotel—typically the one freely accessible to guests.

Chart of Wi-Fi Performance for Select Hotels in Asia Pacific

The Wi-Fi download speeds of selected hotels across major APAC business destinations show significant variation, with some properties delivering top-tier connectivity while others fall short. In a similar report that analyzed Wi-Fi download speeds of luxury hotels in the MENA region, we categorized the results to three groups of hotels based on Wi-Fi download speed:

  1. Top performers are hotels that offer exceptionally fast Wi-Fi, with median download speeds exceeding 100 Mbps. Such speeds provide seamless connectivity for business travelers, enabling ultra-high-definition video conferencing, large file transfers, and lag-free virtual collaboration. These results suggest that these hotels have made significant investments in high-performance Wi-Fi infrastructure, ensuring a premium experience for their guests.
  2. Good performers offer solid Wi-Fi performance, ranging between 50 Mbps and 100 Mbps. These speeds are sufficient for most business activities, including video conferencing, cloud-based work, and high-speed browsing. While they don’t reach the top-tier speeds of the leading hotels, they still provide a strong and stable connection for business travelers.
  3. Performance laggards include hotels with a median download speed below 50 Mbps, which may impact business travelers relying on high-speed internet for seamless virtual meetings, large data transfers, or streaming-intensive work applications. 

Top performers represent 23.8% of the properties reviewed in this report. The Peninsula Tokyo is a leader, offering nearly double the speed (188.57 Mbps) of the next best hotel, Rosewood Hong Kong (113.21 Mbps). The InterContinental Grand Stanford Hong Kong also secured a position among the top performers, with a reported download speed of 109.74 Mbps, reinforcing Hong Kong’s strong presence in high-quality hotel Wi-Fi infrastructure.

The good performers category included properties such as Island Shangri-La Hong Kong (99.33 Mbps), Four Seasons Hotel Sydney and Tokyo (99.05 Mbps and 80.68 Mbps respectively), Mandarin Oriental Bangkok (88.58 Mbps), The Ritz-Carlton Tokyo (73.46 Mbps), and Marina Bay Sands Singapore (70.51 Mbps). These speeds are sufficient for most business activities, including video conferencing, online collaboration, and cloud-based applications. Notably, hotels in Bali, such as W Seminyak Bali and The St. Regis Bali Resort performed well, recording download speeds of 56.63 Mbps and 50.25 Mbps respectively, suggesting that luxury resorts catering to international business events are prioritizing strong internet connectivity. The presence of multiple Four Seasons properties in this range also indicates that while this chain generally provides good connectivity, they do not always reach the highest tier of performance.

Almost all of the cities have hotels in the laggards’ category. Despite Singapore’s strong fixed broadband infrastructure, and consistently topping Speedtest Global Index fixed broadband ranking, hotel Wi-Fi performance varied significantly. This suggests that the issue is most likely with the Wi-Fi network configuration rather than national broadband capacity. Raffles Singapore and InterContinental Singapore recorded some of the lowest speeds in the list, at 21.35 Mbps, and 20.03 Mbps respectively.

Modern Wi-Fi technology boost hotel connectivity performance 

Many factors influence Wi-Fi performance, including network design and the number of users connected to each access point (AP). Wi-Fi technology has also evolved significantly, with each generation introducing key improvements in speed, efficiency, and capacity. Rolling out modern, well-configured Wi-Fi equipment enhances reliability while maximizing the performance benefits of newer Wi-Fi technology.

Speedtest Intelligence data reveals a clear correlation between Wi-Fi standards and network performance across the three categories. Top performers reported more test samples on Wi-Fi 6 (47.1%), with a smaller share using Wi-Fi 5 (32.9%) and Wi-Fi 4 (20.0%). In contrast, good-performing hotels reported 61.9% of samples were on Wi-Fi 5, with only 21% utilizing Wi-Fi 6. Performance laggards rely more on older Wi-Fi 4 and Wi-Fi 5 setups, with a combined total of 77.7% of test samples reported on these two Wi-Fi standards.

Test Distribution by Wi-Fi Standard for Different Hotels’ Performance Levels
Source: Speedtest Intelligence | Jan 2024 – Dec 2024

The distribution of Wi-Fi frequency bands further demonstrates the impact of network optimization on hotel performance. Hotels in the Top Performers category conducted 88.4% of their tests on the 5 GHz frequency band, followed by 80.8% for Good Performers hotels. Performance Laggards reported the lowest distribution at 64.6%.

Test Distribution by Frequency Band for Different Hotels’ Performance Levels
Source: Speedtest Intelligence | Jan 2024 – Dec 2024

Meeting the needs of modern business travelers

Reliable, high-speed Wi-Fi is essential for business travelers in luxury hotels. Poor connectivity disrupts productivity, affects virtual meetings, and leads to guest dissatisfaction. To remain competitive, hotels must invest in strategic Wi-Fi planning and infrastructure upgrades to meet the increasing connectivity demands of business travelers.

Effective Wi-Fi planning requires upgrading to modern standards such as Wi-Fi 6E or 7, thereby unlocking wider channels in the  6 GHz band to help alleviate congestion, and optimizing network capacity for high-density environments. Hotels must assess access point placement, bandwidth allocation, interference management, and simultaneous device connections to ensure a seamless experience for guests.

To address these connectivity gaps, professional Wi-Fi design solutions like Ekahau help hotels optimize network configurations from the outset. These tools enable precise access point placement, configuration, and performance monitoring, ensuring reliable coverage and high-speed connectivity across all areas of the hotel. Proper planning and investment in advanced Wi-Fi infrastructure are critical for delivering a seamless and high-quality digital experience for business travelers.

Ookla can assist hospitality property managers in designing Wi-Fi networks, monitoring their performance, and optimizing them. Please contact us to learn more about Speedtest Intelligence and Ekahau.

Ookla retains ownership of this article including all of the intellectual property rights, data, content graphs and analysis. This article may not be quoted, reproduced, distributed or published for any commercial purpose without prior consent. Members of the press and others using the findings in this article for non-commercial purposes are welcome to publicly share and link to report information with attribution to Ookla.

| February 13, 2023

mmWave Clocks Gigabit Speeds in the U.S. but Lacks Maturity Elsewhere

In this article, we will look at the real-life performance of mmWave in the United States, reflect on its progress so far across the globe, and discuss what the future holds.

Key takeaways

  • mmWave received additional spectrum as part of Release 17, in addition to the spectrum already allocated by Rel-15 and WRC-19. 5G connectivity using mmWave substantially improves 5G performance (increasing theoretical speeds to up to 5 Gbps). At the same time, it comes with a challenge because of its limited range, which can be easily blocked or obscured, necessitating a high degree of network densification, which comes with additional Capex. 
  • After initial enthusiasm, operators’ appetite for the mmWave band spectrum has been lackluster, with only two auctions taking place in 2022. However, we see a renewed interest, which could lead to more spectrum allocations and network launches. 
  • Due to the limited rollout of mmWave 5G networks, the device ecosystem has lagged behind other 5G spectrum bands. While support for mmWave spectrum bands across smartphones is skewed heavily towards the  U.S., an increase in spectrum launches and networks combined with a declining ASP should lead to a growing adoption worldwide. 
  • Ookla® Q4 2022 data from the U.S. shows mmWave is achieving mind blowing speeds — almost 1.6 Gbps median 5G download speed — 26 times faster than the median 5G speed on low-band, almost seven times faster than the C-band, and four times than mid-band. 
  • RootMetrics® tested mmWave performance simulating congested network environments and concluded that even in such conditions, mmWave spectrum could achieve four times faster throughput than mid- and low-band spectrum.

mmWave spectrum allocation and commercialization 

Oftentimes, consumers complain about 5G speeds, sold on the promise of ultra-fast mobile networks. Such speeds can only be delivered utilizing the mmWave spectrum band. Up until and including 4G LTE, operators have been deploying networks in the sub-6 GHz spectrum. It was only with Release 15 that the telecom standards body 3GPP extended the spectrum ranges available for mobile networks. Frequency bands for 5G New Radio (NR) are separated into two frequency ranges: 

  • Frequency Range 1 (FR1) refers to sub-6 GHz frequency bands, traditionally used by previous network generations, which have been further extended to cover potential new spectrum offerings from 410 MHz to 7125 MHz.
  • Frequency Range 2 (FR2) refers to frequencies above 24 GHz.

Chart of mmWave 5G frequency bands

Furthermore, in November 2019, delegates of the World Radiocommunication Conference (WRC-19) identified additional radio frequency bands for IMT-2020 (the name ITU uses for 5G standards). These frequency bands are 24.25-27.5 GHz, 37-43.5 GHz, 45.5-47 GHz, 47.2-48.2, and 66-71 GHz. 3GPP’s recently completed Release 17 has further expanded the mmWave spectrum frequency range from 24.25-52.6 GHz up to 71 GHz, including support for the global 60 GHz unlicensed band.

So far, mmWave spectrum allocation has been lackluster across Europe, following initial enthusiasm in the U.S., Japan, and South Korea. According to Global Mobile Suppliers Association (GSA), 26 countries have licensed mmWave worldwide. In 2022, only two auctions took place in India and Spain in the 26 GHz frequency band. The Indian auction itself was a subject of intense debate and lobbying against its allocation in the 28 GHz band by the satellite providers. The regulator auctioned the 26 GHz band to minimize overlaps and interference issues.

Map of mmWave spectrum auctions worldwide

However, the momentum for mmWave spectrum allocations is growing, especially in Europe. While 14 countries in Europe have licensed mmWave so far, more are planning to do so e.g., Hungary, Austria, and the United Kingdom, which should lead to more deployments and create economies of scale that the mmWave device ecosystem currently lacks. 

Beyond consumers, mmWave can address the needs of enterprise applications that require higher bandwidth and lower latency, such as factory robots or AGVs. For example, Italian manufacturer Exor International partnered with Intel, TIM, and JMA Wireless to build an end-to-end smart factory in Verona to showcase the benefits that Industry 4.0 brings to manufacturing utilizing sub-6 GHz and 26 GHz spectrum. It is worth noting that several regulators have created an encouraging environment for enterprises to deploy their own dedicated networks by allocating spectrum for vertical use across mid- and high-frequency bands. So far, ten countries have set aside mmWave spectrum for enterprises, including Australia, Denmark, Germany, Greece, Japan, Hong Kong, Finland, Sweden, South Korea, and the U.K. Japanese Fujitsu deployed a private 5G network combining 4.7 GHz SA and 28 GHz. 

The growing pains of the mmWave device ecosystem 

The South Korean example offers a cautionary tale regarding 5G mmWave readiness.

In 2018, three operators — SK, KT, and LG U+ — spent 620 billion Won ($435 million) on a five-year license for the 28 GHz spectrum. As part of the license conditions, operators had to deploy 15,000 base stations by the end of 2021. Following an audit by the Ministry of Science and IT (MSIT), KT and LGU+ had their licenses revoked, and SK Telecom was reduced by six months. One key challenge operators pointed to was the need for a mature mmWave devices ecosystem in the market.

Looking at the latest GSA data, this is indeed the case. Across the commercially available 5G devices that GSA has identified spectrum support information, most devices (85.7%) support the sub-6GHz band and only 8.9% mmWave spectrum.

Chart of number of announced 5G devices by spectrum band

However, mmWave device availability differs depending on the geography with smartphone availability heavily skewed to the U.S. For instance, all ‌iPhone 12‌-14 models in the U.S. support both mmWave and sub–6 GHz 5G connectivity; this was not the case in South Korea. Across Android-based smartphones, the story is similar. The Pixel 6 Pro includes mmWave 5G support only in the U.S., Australia, and Japan. There is also a price difference across devices that offer support for mmWave. For example, Google Pixel 6 is available in two versions in the U.S. — an unlocked version with sub-6 GHz 5G for $599 and another with mmWave 5G for $699. The latter is offered via operators such as Verizon and AT&T. The price difference is likely due to the mmWave requirement for specialized radio hardware and antennas. Yet, on average, the price delta between sub-6 GHz and mmWave smartphones is narrowing down to $10- $20, Counterpoint Research shows. 

Furthermore, Counterpoint sees consumer awareness and adoption growing in the U.S. According to its U.S. smartphone users survey, 60% of users checked before purchasing whether a 5G Smartphone has 5G mmWave capability, while 43% of users in the future plan to subscribe to 5G mmWave services and smartphones. Beyond the U.S., Counterpoint sees one billion cumulative 5G mmWave smartphone shipments between 2019 and 2026, with mmWave smartphone penetration reaching 26% by 2026, compared to 13% in 2022.

mmWave supports FWA 

Fixed Wireless Access (FWA) is often considered one of the most successful 5G use cases as we recently pointed out. Some operators leverage mmWave to offer FWA services, for example, in April 2022, US Cellular launched 5G Home Internet using mmWave spectrum (28 GHz and 39 GHz) in partnership with Qualcomm and Inseego across ten cities. In Italy, Fastweb collaborated with Qualcomm to commercialize 5G SA mmWave services in March 2022, following a partnership to deliver 5G FWA to 400 cities. Vendors are vying to address this opportunity too. Recently, Mavenir launched an FWA solution that supports massive MIMO and 5G mmWave for 4G, 5G NSA, and 5G SA deployments. This FWA platform has been deployed by several customers, such as 360 Communications, RINA Wireless, Triangle Communications in the U.S., and Quickline in the U.K. 

mmWave delivers on the promise of gigabit speeds 

The U.S. is a global leader in using mmWave spectrum, with AT&T, T-Mobile, and Verizon using mmWave to offer mobile service, while US Cellular deploys it for FWA. Speedtest Intelligence® data shows that 5G connectivity using mmWave can reach staggering speeds of up to 1.6 Gbps. Comparing 5G performance across spectrum bands across mobile operators in the U.S. used for 5G services low-, mid-, C-band, and high-band (mmWave) it is clear that mmWave delivers superior performance. Our data shows that users on 5G mmWave achieved speeds that are 4.29 times faster than mid-band, 6.86 times faster than C-band, and a staggering 26.1 times faster than a low band.

Chart of median 5G download speed by spectrum band in the US

Due to its high throughput, mmWave is particularly useful for streaming and gaming. For example, at CES 2023, Razer unveiled its new Razer Edge, the first Android handheld gaming tablet on the market. The device can play games locally on the device or stream them remotely via 5G. The Razer Edge 5G became available from Verizon on January 26. 

Mmwave also offers the advantage of lower latency — anything over 20 ms will give gamers a headache, according to Qualcomm

mmWave helps with network congestion too 

Speaking at the Citi 2023 Communications, Media & Entertainment conference, Kyle Malady — Verizon’s Executive VP, President of Global Networks & Technology, noted that the operator has deployed over 40,000 mmWave nodes, which support its 5G services in dense, urban environments. He also stated, “And now that millimeter wave technology turns into a tool for RF engineers to use in hotspots that they have and C-Band.” 

A RootMetrics study supports this, based on several tests conducted in December 2021 to simulate the performance of the 5G spectrum in a congested environment. While, unsurprisingly, the results showed speeds in congested environments were slower on all bands than when congestion wasn’t present, there was a difference when it came to bands in use: mmWave 5G delivered a median download speed of 231.40 Mbps, which was over four times faster than the speeds recorded on either mid-band or low-band 5G, both of which were below 50 Mbps (44.80 Mbps on mid-band and 49.50 Mbps on low-band). To put mmWave’s capacity boost in a different perspective, its speed of 231.40 Mbps with congestion was nearly as fast as the 256.80 Mbps recorded on mid-band 5G without congestion. RootMetrics’ study showed that mmWave provides speeds 4-5 times faster than those of mid- and low-band in congested circumstances, delivering on its promise of providing greater capacity and faster speeds under heavy network load. 

Chart of comparison of throughput by band

Millimeter wave also lends additional capacity in dense areas such as stadiums. Poor performance during events such as concerts stems from the networks needing to deal with extra demand and becoming congested. Constraints on the spectrum allocated to 5G today can impact performance more in places like stadiums than in other areas because many users are concentrated in a small space and share the same limited spectrum. To illustrate how mmWave enables better network performance, we can look to Ookla Wind® walk testing data, which can show the benefits of mmWave in terms of 5G bandwidth. Since each carrier is 100 MHz wide, a test showed that a stadium used four carriers aggregated 80% of the time, which resulted in 400 MHz of 5G bandwidth. In turn, this helped to achieve higher 5G capacity and lower latency. 

Illustration of 80% samples, four Carrier Aggregation is being used on mmWave

Another benefit of mmWave that the Wind test showed is that with the mmWave 5G NSA network, most of the user data traffic is carried by mmWave spectrum only (contrary to other 5G bands in NSA). This reduces the load on the LTE network. This, in turn, allows legacy users with non-5G capable devices to use an LTE network that is less congested because it doesn’t have to support 5G devices as well. 

We will examine the relationship between spectrum and 5G performance in future articles. Subscribe to Ookla Research to stay up to date on our analyses. 

Ookla retains ownership of this article including all of the intellectual property rights, data, content graphs and analysis. This article may not be quoted, reproduced, distributed or published for any commercial purpose without prior consent. Members of the press and others using the findings in this article for non-commercial purposes are welcome to publicly share and link to report information with attribution to Ookla.