| October 21, 2020

5G Claims Gone Wrong: The Dangers of Bad Data

5G is in the news as competing operators roll out deployments in a race to have the fastest service in the most places. At Ookla®, we’ve observed astonishing 5G speeds that live up to the hype. But 5G headlines can be confusing for consumers who are trying to sift through conflicting claims that are often based on limited (if not deeply flawed) data. 5G as a technology is also rapidly evolving, which makes sound data collection that addresses the nuances of these shifts even more important.

As the industry leader in internet testing, Ookla has over 15 years of experience measuring emerging technologies. We’re here to share some lessons learned about what goes into making an authoritative claim that consumers can rely on. We’ll also look closely at some recent examples from the United Kingdom where a multitude of methodological shortcomings from unseasoned data providers have led to unreliable network claims. While this article is focused on U.K. examples, the same methodology critiques apply to active 5G claims from the same data providers in other markets.

Poor data leads to spurious claims, examples from the U.K.

Operators are eager to use designations like “fastest,” “best coverage” and “most improved” because these messages resonate with customers. But without proper data and careful analysis backing them, these labels are meaningless and potentially misleading. Ookla has a team of data scientists dedicated to ensuring our claims about networks are accurate, representative and fair.

In recent months we’ve seen a series of conflicting claims being made in the U.K. market. These claims are not based on robust, proven data collection and processing practices. As a result, consumers are being misled about which operators are truly providing the best experience.

Poor 5G identification muddles what’s being measured

As 5G is an emerging technology, it needs to reach a certain level of both adoption and maturity before comparative performance claims can be made in new markets. The U.K. is one such hotbed of 5G activity where every operator is racing to be crowned the best. This well-intended desire of operators to show off new capabilities has led to dubious claims being made in the market. Namely, competing operators are making similar claims about their network capabilities, while differing data providers are publishing reports based upon very limited and flawed data. This can lead consumers to make decisions based on questionable reporting — or to purchase services that aren’t even available in their area.

device-identification
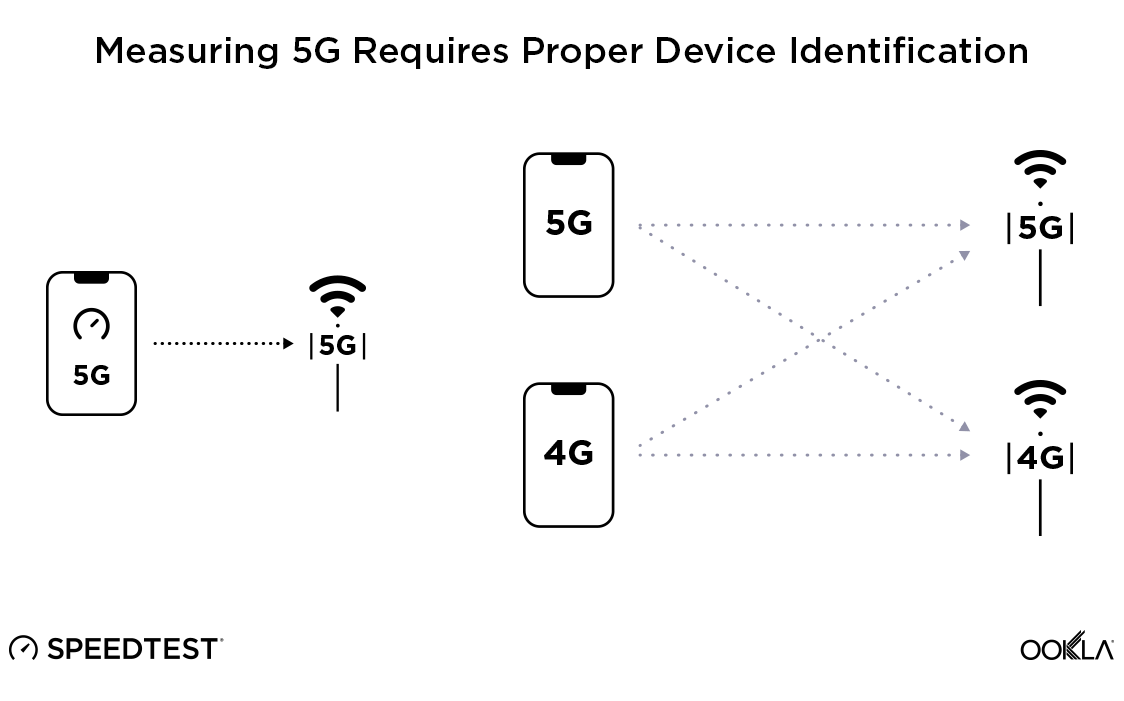
Not all 5G-capable devices natively identify 5G when reporting the connection type to applications. That’s why Ookla has directly partnered with device manufacturers worldwide to implement accurate in-app 5G detection in Speedtest®. Data providers who do not couple robust in-app detection with strict filtering criteria are highly likely to mis-identify a wide range of 5G connections and ultimately show speeds that do not accurately reflect the network’s actual 5G service capability.

Failure to measure full throughput undervalues high-speed connections

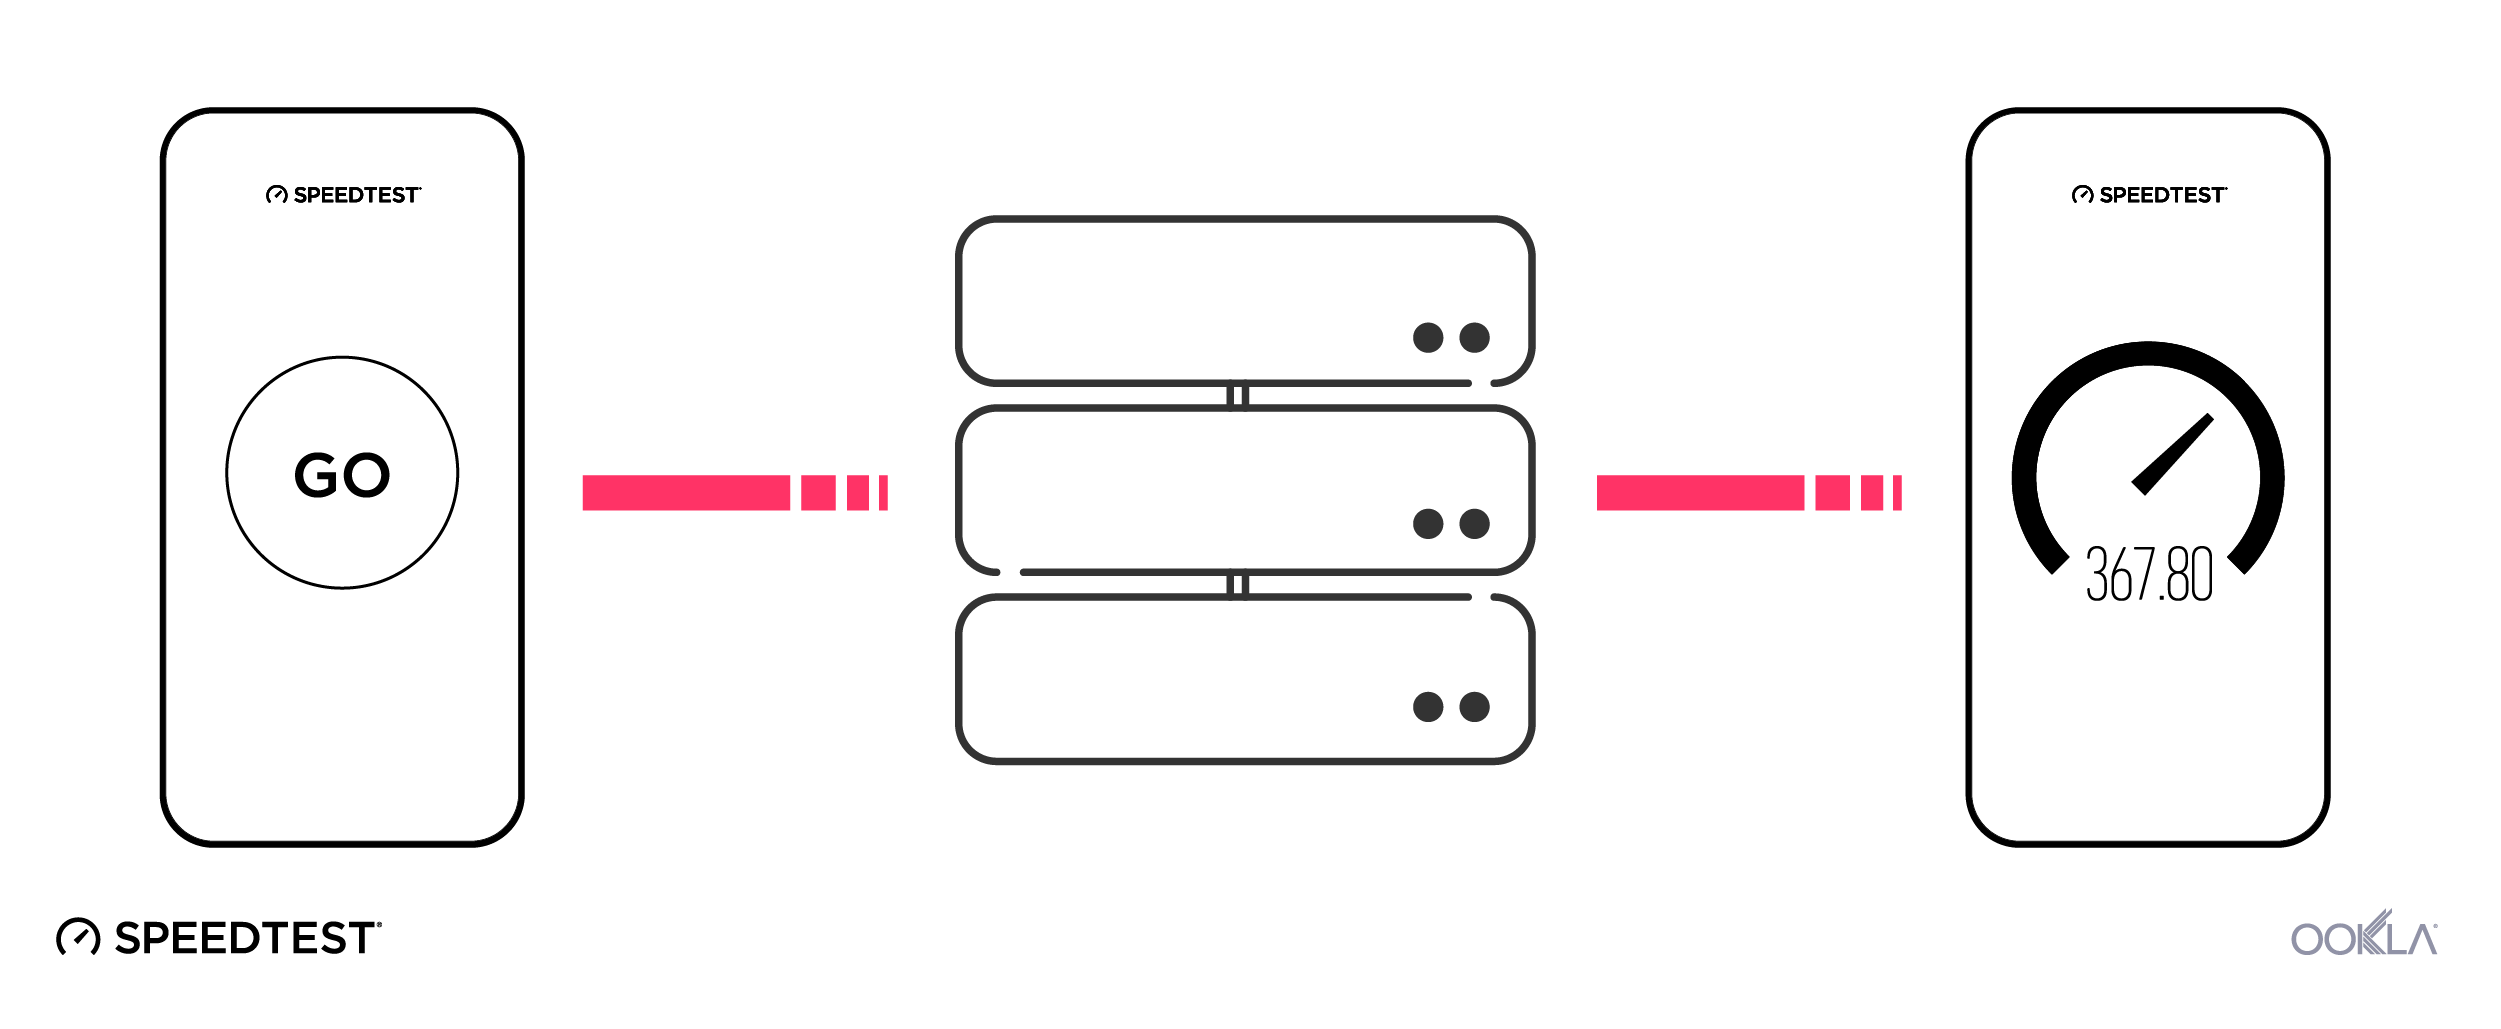
Modern technologies like 5G are capable of achieving gigabit speeds and beyond. Unless a testing solution is capable of measuring the full throughput of a user’s connection, measured speeds will not reflect the network’s real-world performance. The Ookla Speedtest Methodology uses a distributed network of servers to fully maximize a connection in the foreground, on demand, that can accurately measure speeds up to 10 Gbps. Other data providers like Opensignal, nPerf and umlaut either test to remote CDNs, test in the background or — worse still — hide their tests in third-party apps that are completely unrelated to network diagnostics.

dedicated-measuring-1
The Opensignal methodology allows for a blend of testing methods. However, their public reporting consistently makes no distinction between results derived from these differing methodologies and presents them as a simple national average. This mix of methodologies introduces the possibility that any reported differences in download speed among operators may be due to differences in testing and not due to differences in the actual services that they provide.

Opensignal’s test methodology also tends to seriously undervalue the full capability of networks. Because a significant amount of demand must be generated on the network before 5G carrier aggregation can even take effect, shorter-duration and background tests are incapable of ensuring that the network assigns a sufficient number of component carriers to the user equipment (UE) to trigger a 5G connection. Data providers that only pass along a small file do not fully saturate a network connection and often cannot place enough demand on the network to trigger a 5G connection, leaving devices — and speeds — stuck registering 4G.

For example, Opensignal recently reported that the average 5G download speed in the U.K. was 130.1 Mbps. Ookla’s data for that same time period, on the other hand, reported a dramatically higher mean download speed of 187.49 Mbps (95%CI [185.57, 189.42]). This range of 185.57-189.42 Mbps is a 95% confidence interval, which represents the range of values in which the true value is likely to be. Ookla’s large sample sizes combined with rigorous statistical testing ensure that all claims that we make stand on solid ground. To their credit, Opensignal also includes uncertainty in their reported speeds, but because it is unclear — though important — what their confidence intervals represent, we cannot compare them directly.

If networks wish to demonstrate that they truly are the fastest, they must employ methodologies that test using the full capacity of the connection, rather than a small file passed to a distant server. This is especially true when considering the high speeds achieved with 5G.

Inadequate sample sizes falsely represent reality

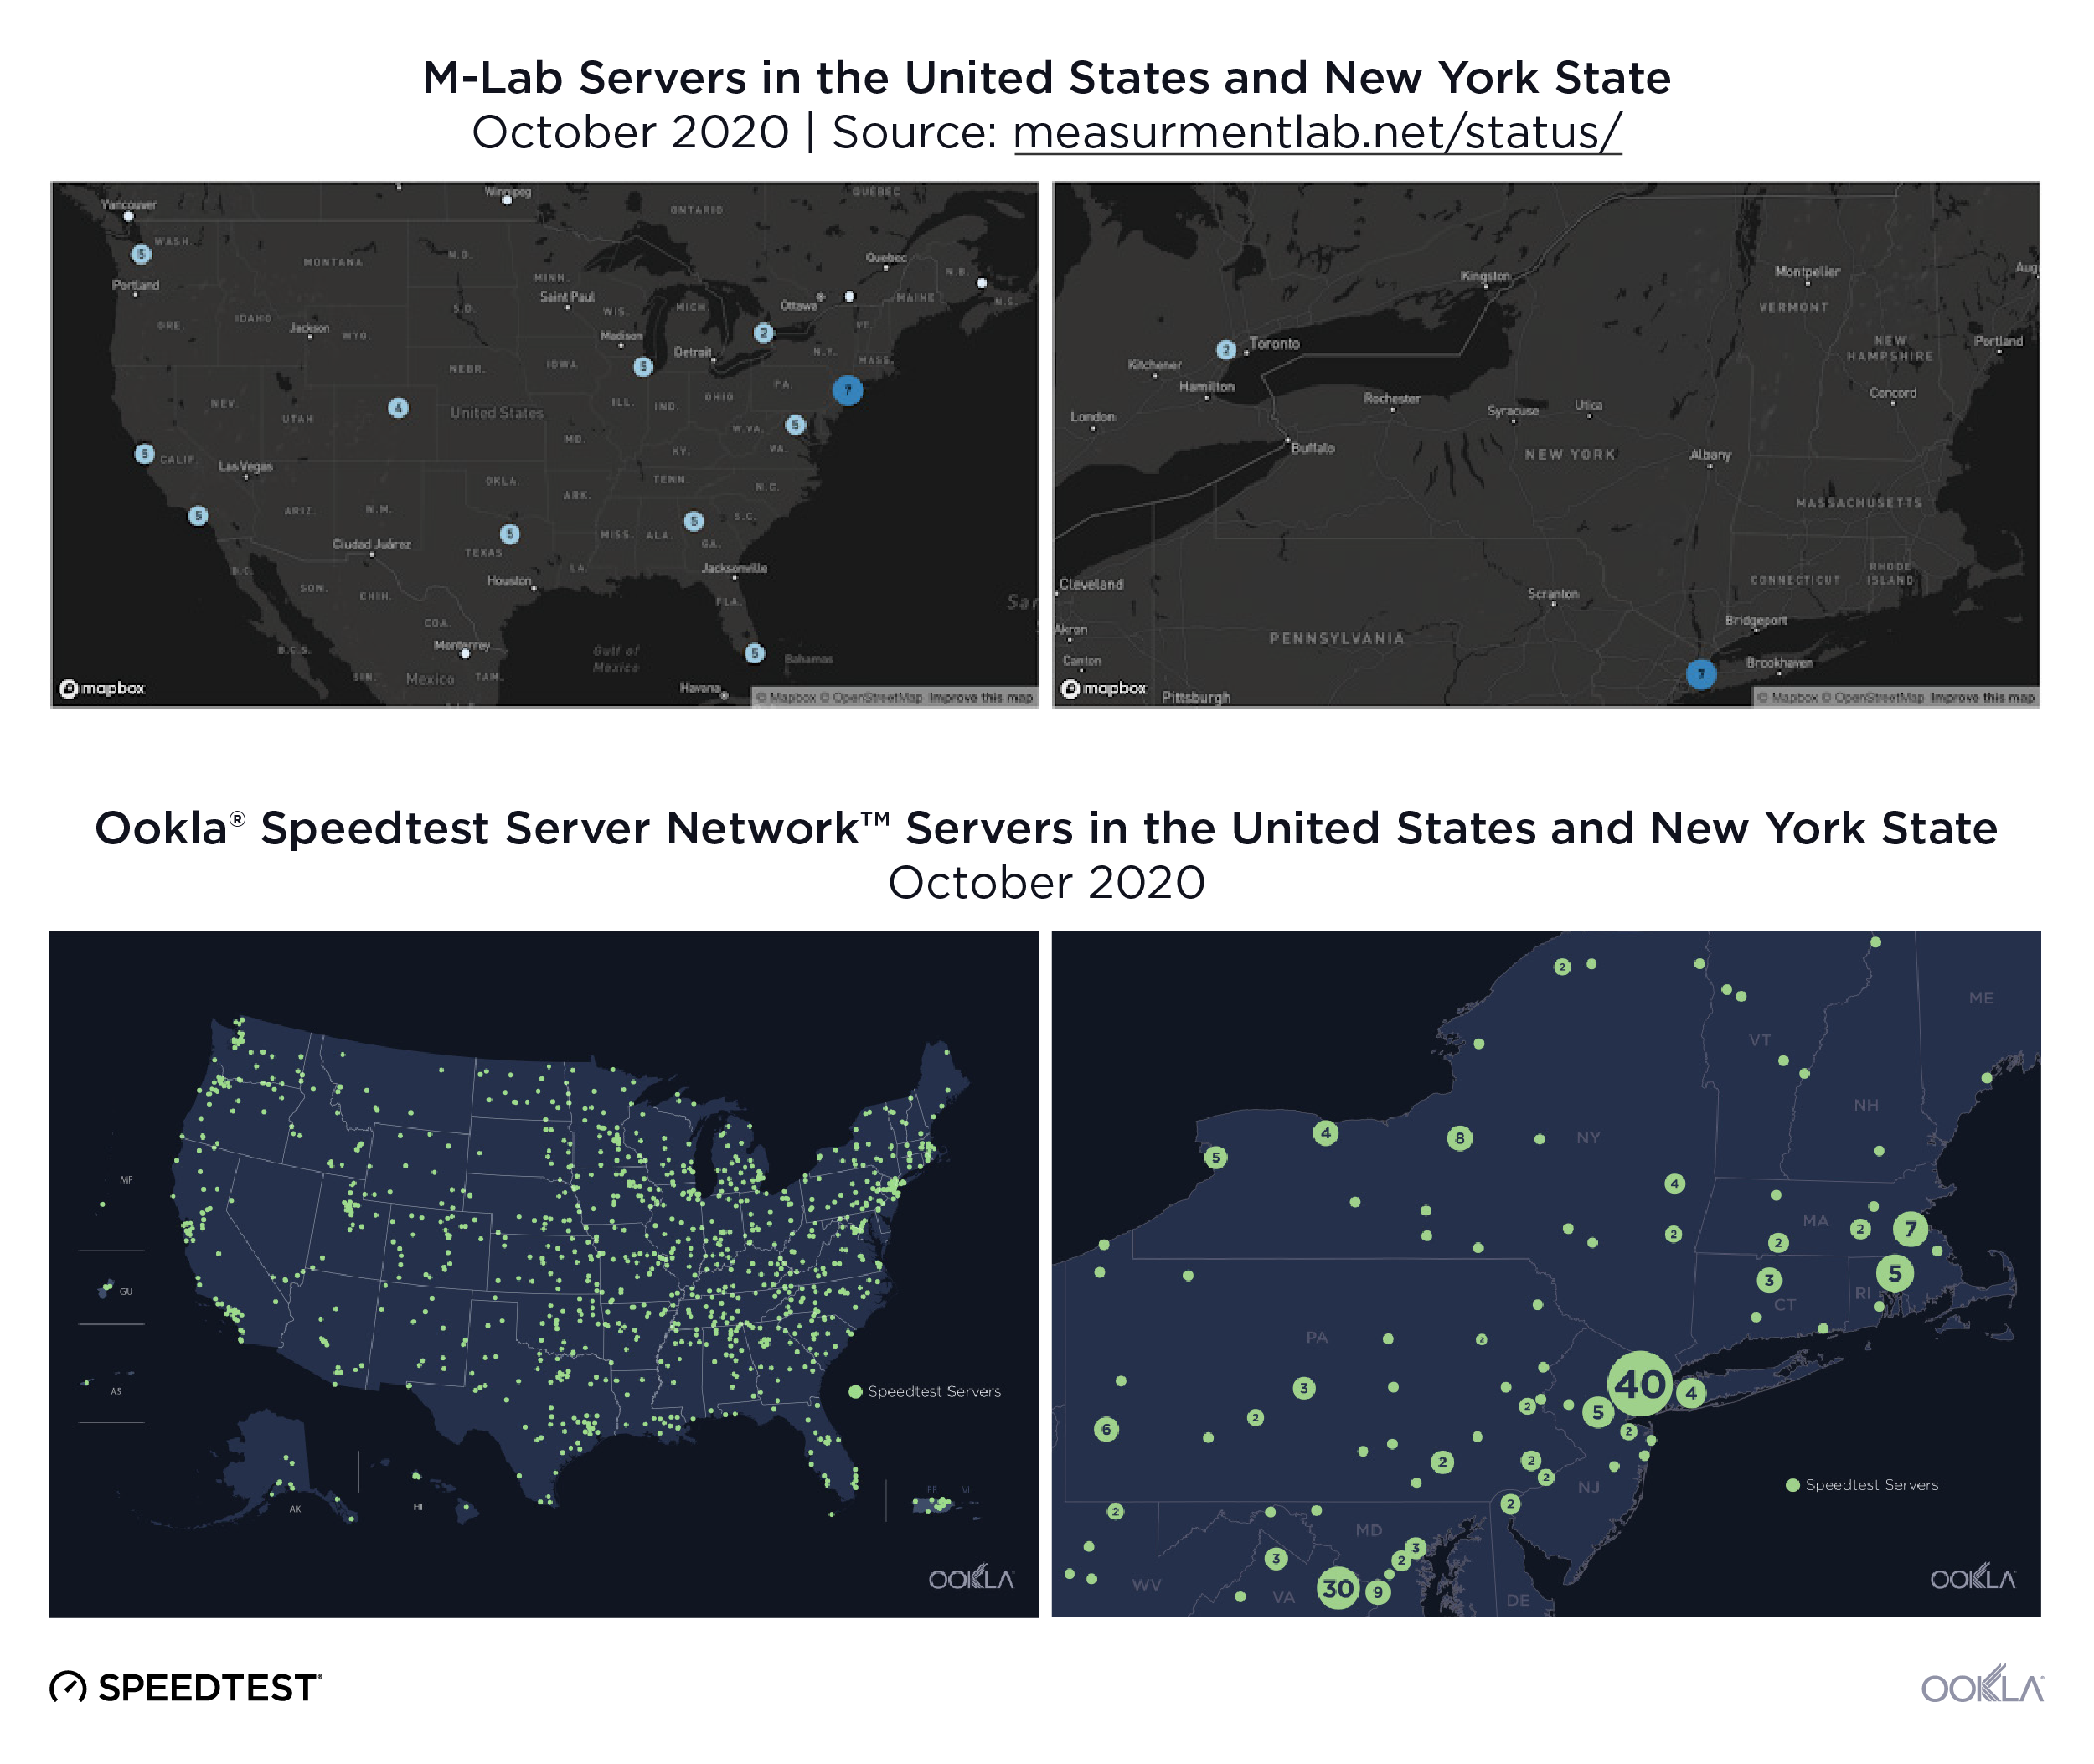
Data providers with small test volumes from a limited number of locations do not have the statistical power needed to draw sound conclusions about network performance.

sample-volume

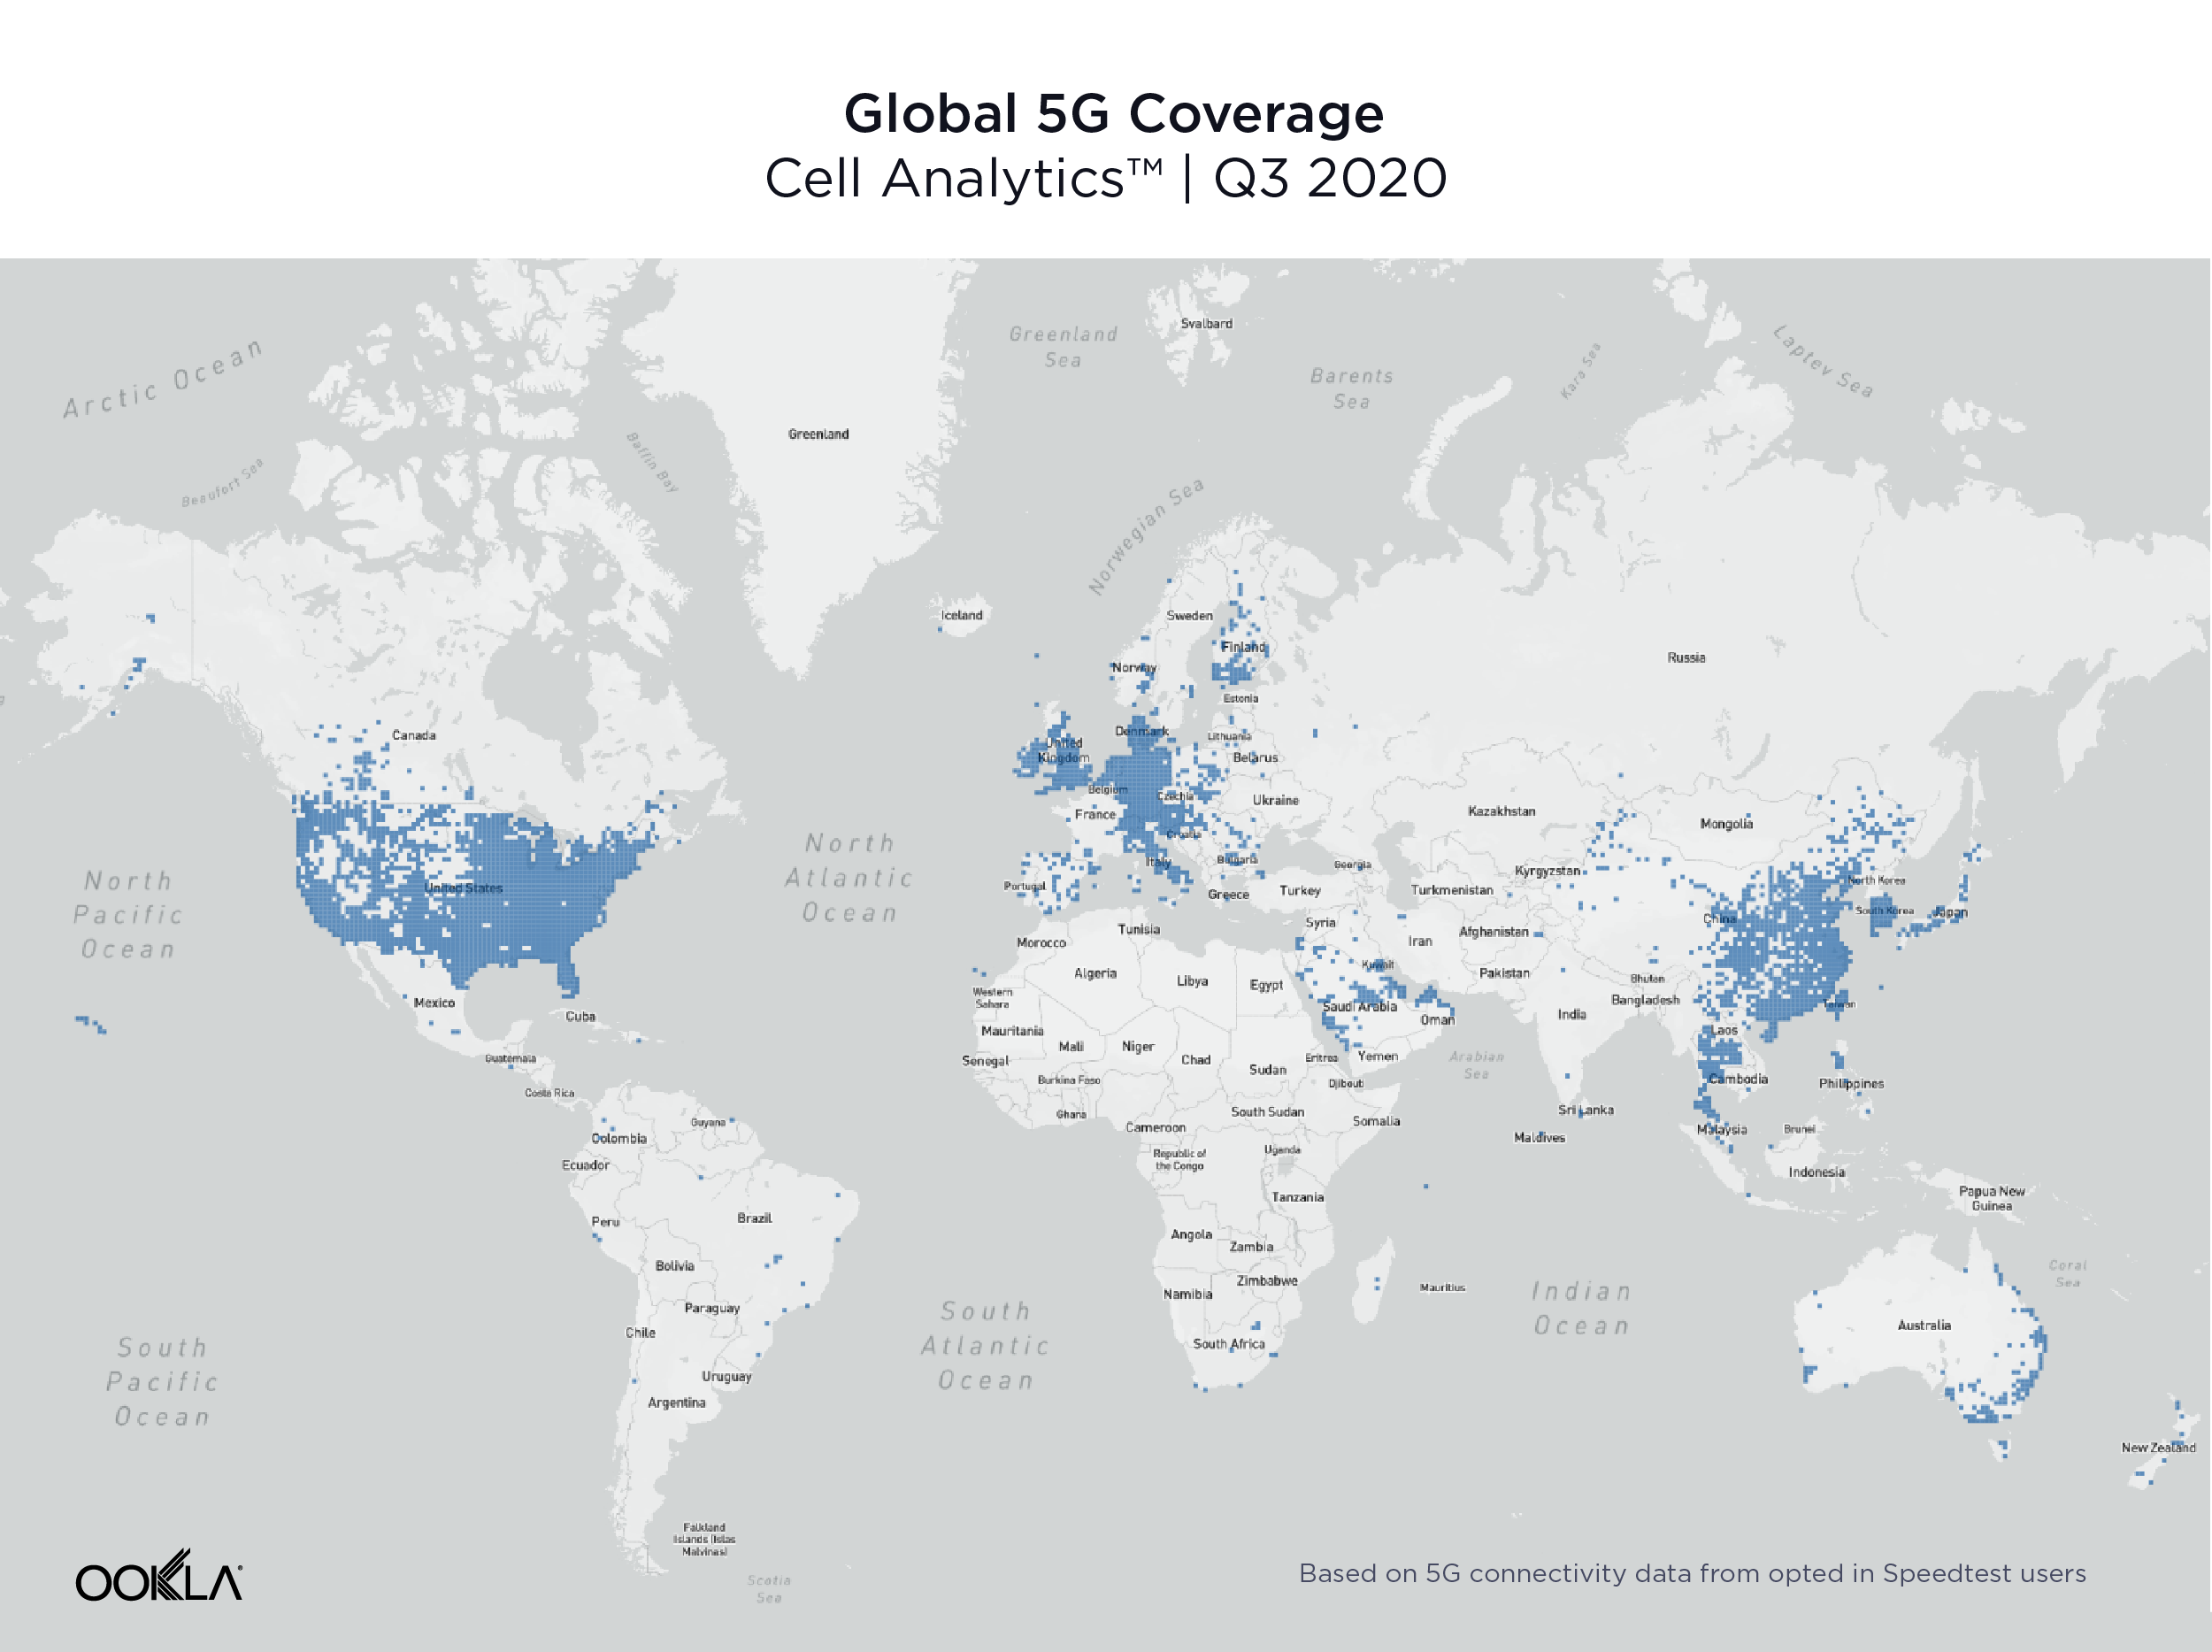
As the industry’s most trusted source for consumer throughput testing, Speedtest users performed over 19.4 million tests daily during Q3 2020. We see real-time results on almost every mobile and fixed broadband network in the world — including just about every device make and model — which provides an unmatched view of how the internet is currently performing at a global scale.

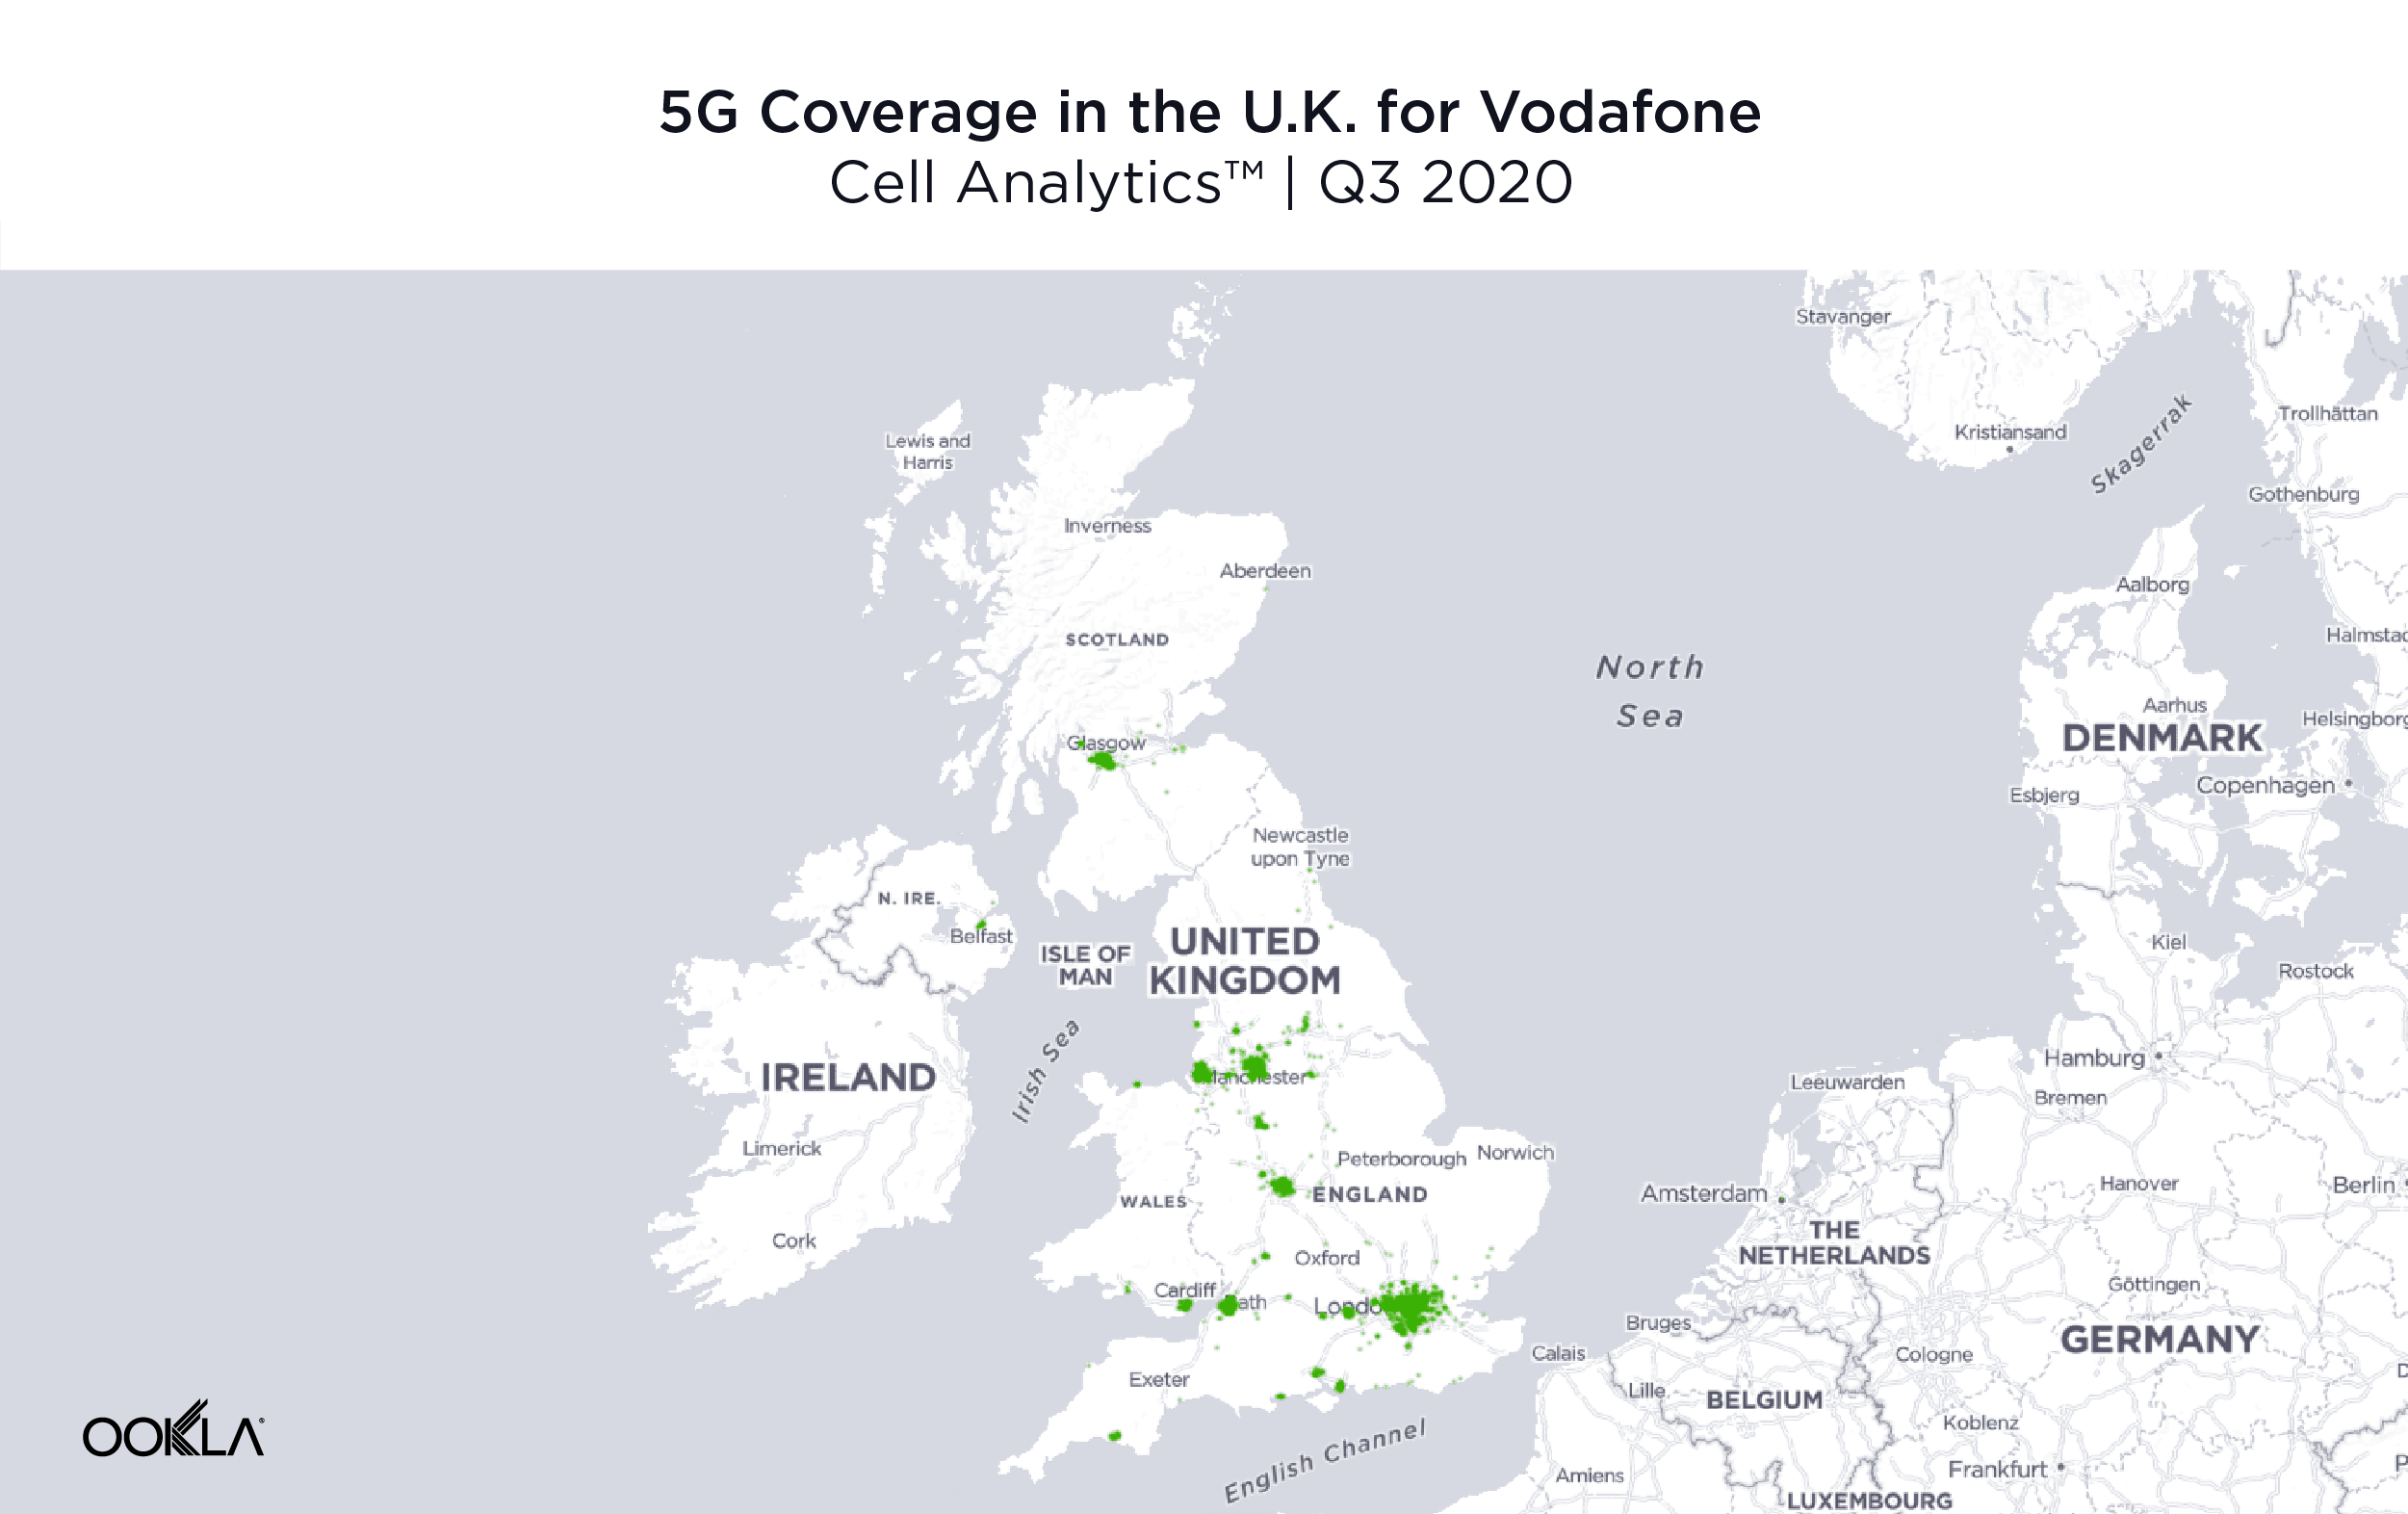
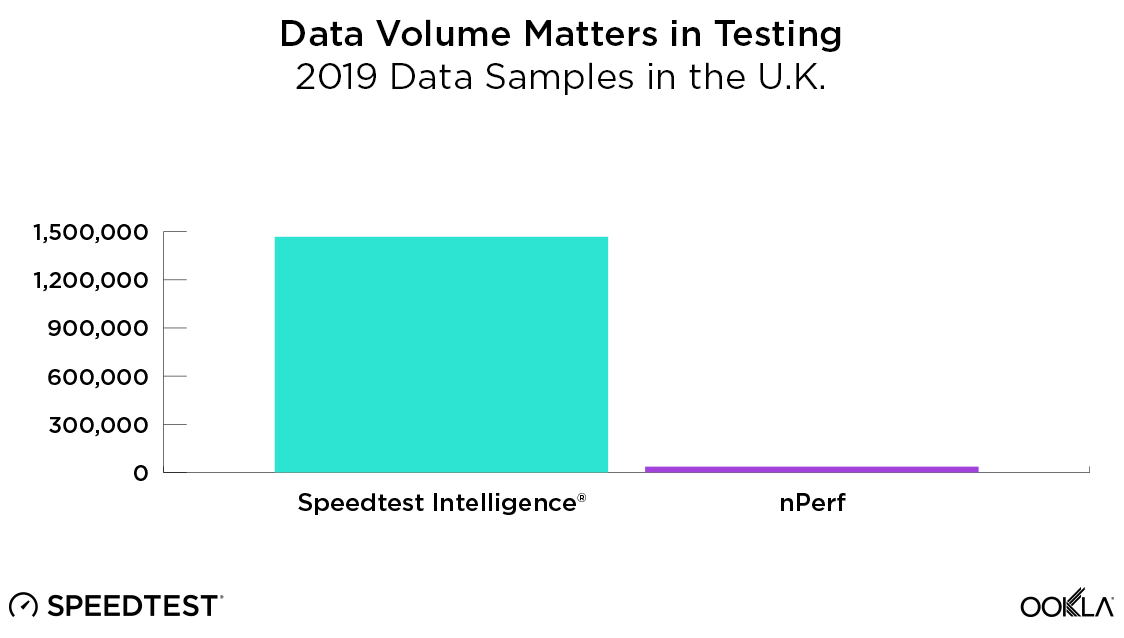
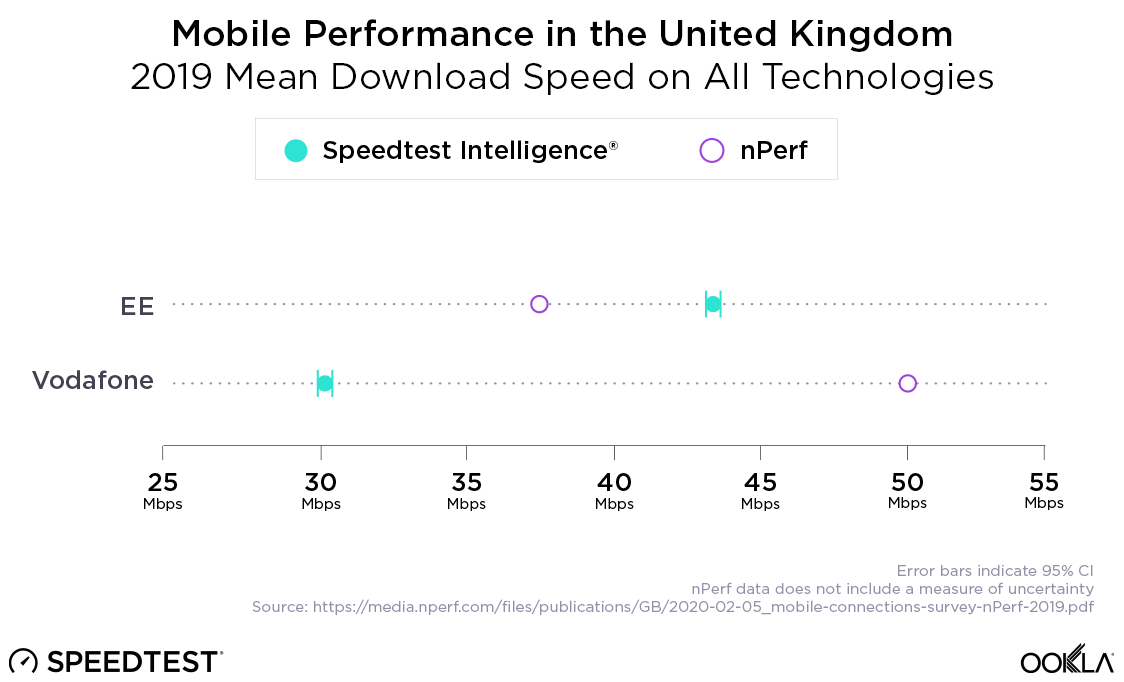
For example, nPerf published a U.K. report which was based on less than 36,000 test samples taken over a 12-month period. For comparison, Ookla collects over 15,000 tests every day in the U.K. It took Ookla less than three days to collect the same amount of data that nPerf collected in a year. Generally speaking, lower sample counts tend to produce results with much less statistical certainty. This particular report from nPerf showed wildly different results than all others released in the market — unsurprisingly, given their limited sample size. This put Vodafone on the defensive as rivals ran TV ads to debunk nPerf’s claim, which was meant to bolster Vodafone’s network offerings.

ookla-vs-nPerf-1

Drive testing misses areas where users are most likely to connect

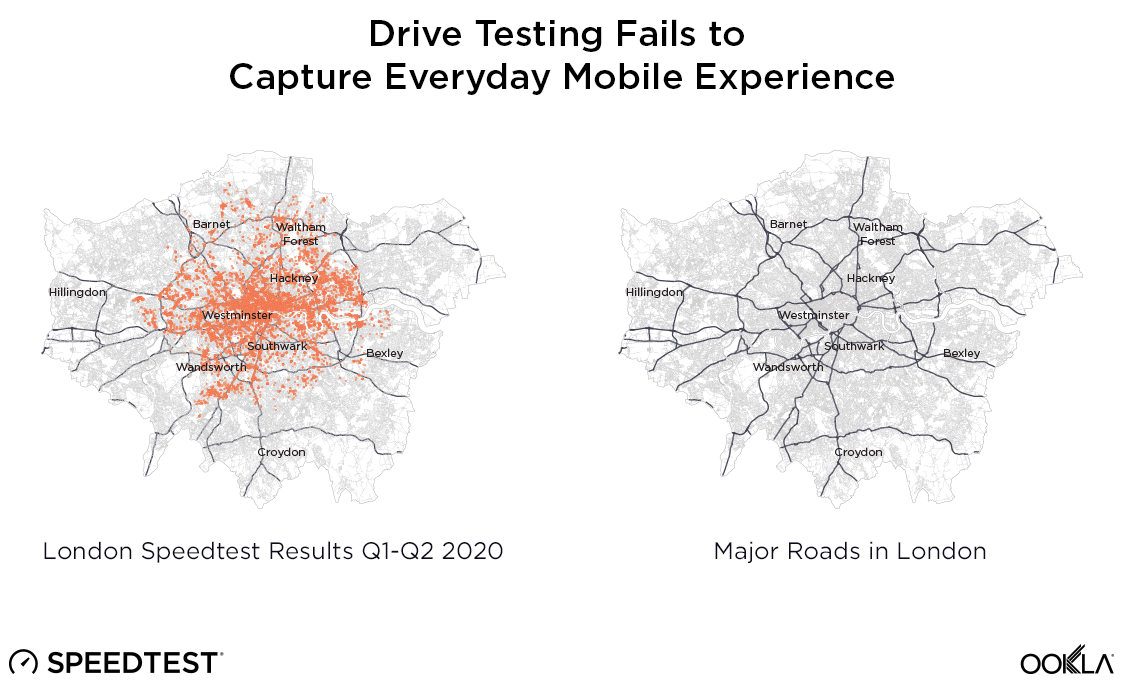
Driving pre-configured test equipment on pre-configured routes in static, lab-like conditions has been a staple of network reporting for a long time. While drive testing removes several potentially confounding variables, this data is not representative of real users’ experiences. Using drive testing as a proxy measurement of user experience always proved troublesome, given the optimized nature of the pre-selected routes and equipment involved. When you take into consideration that 5G is an emerging technology — with limited network coverage and limited device penetration — using drive testing as a tool to back claims about how a customer may experience a 5G network is disingenuous, at best.

5G speeds are only important to measure where customers actually have access to that service. Both umlaut and Rootmetrics have reported on 5G performance in London based on drive testing results. Only the Rootmetrics report included an availability metric, which showed that while Vodafone was slightly faster in London, their 5G signal was only available on 5% of the route driven — compared to 28% for EE. Narrow measurements taken from a small number of devices, in cars, in a test environment, on a small number of routes over a small time period do not provide a sufficient sample to underpin the claim of “fastest 5G” in one of the world’s foremost cities.

drive-test-map-2

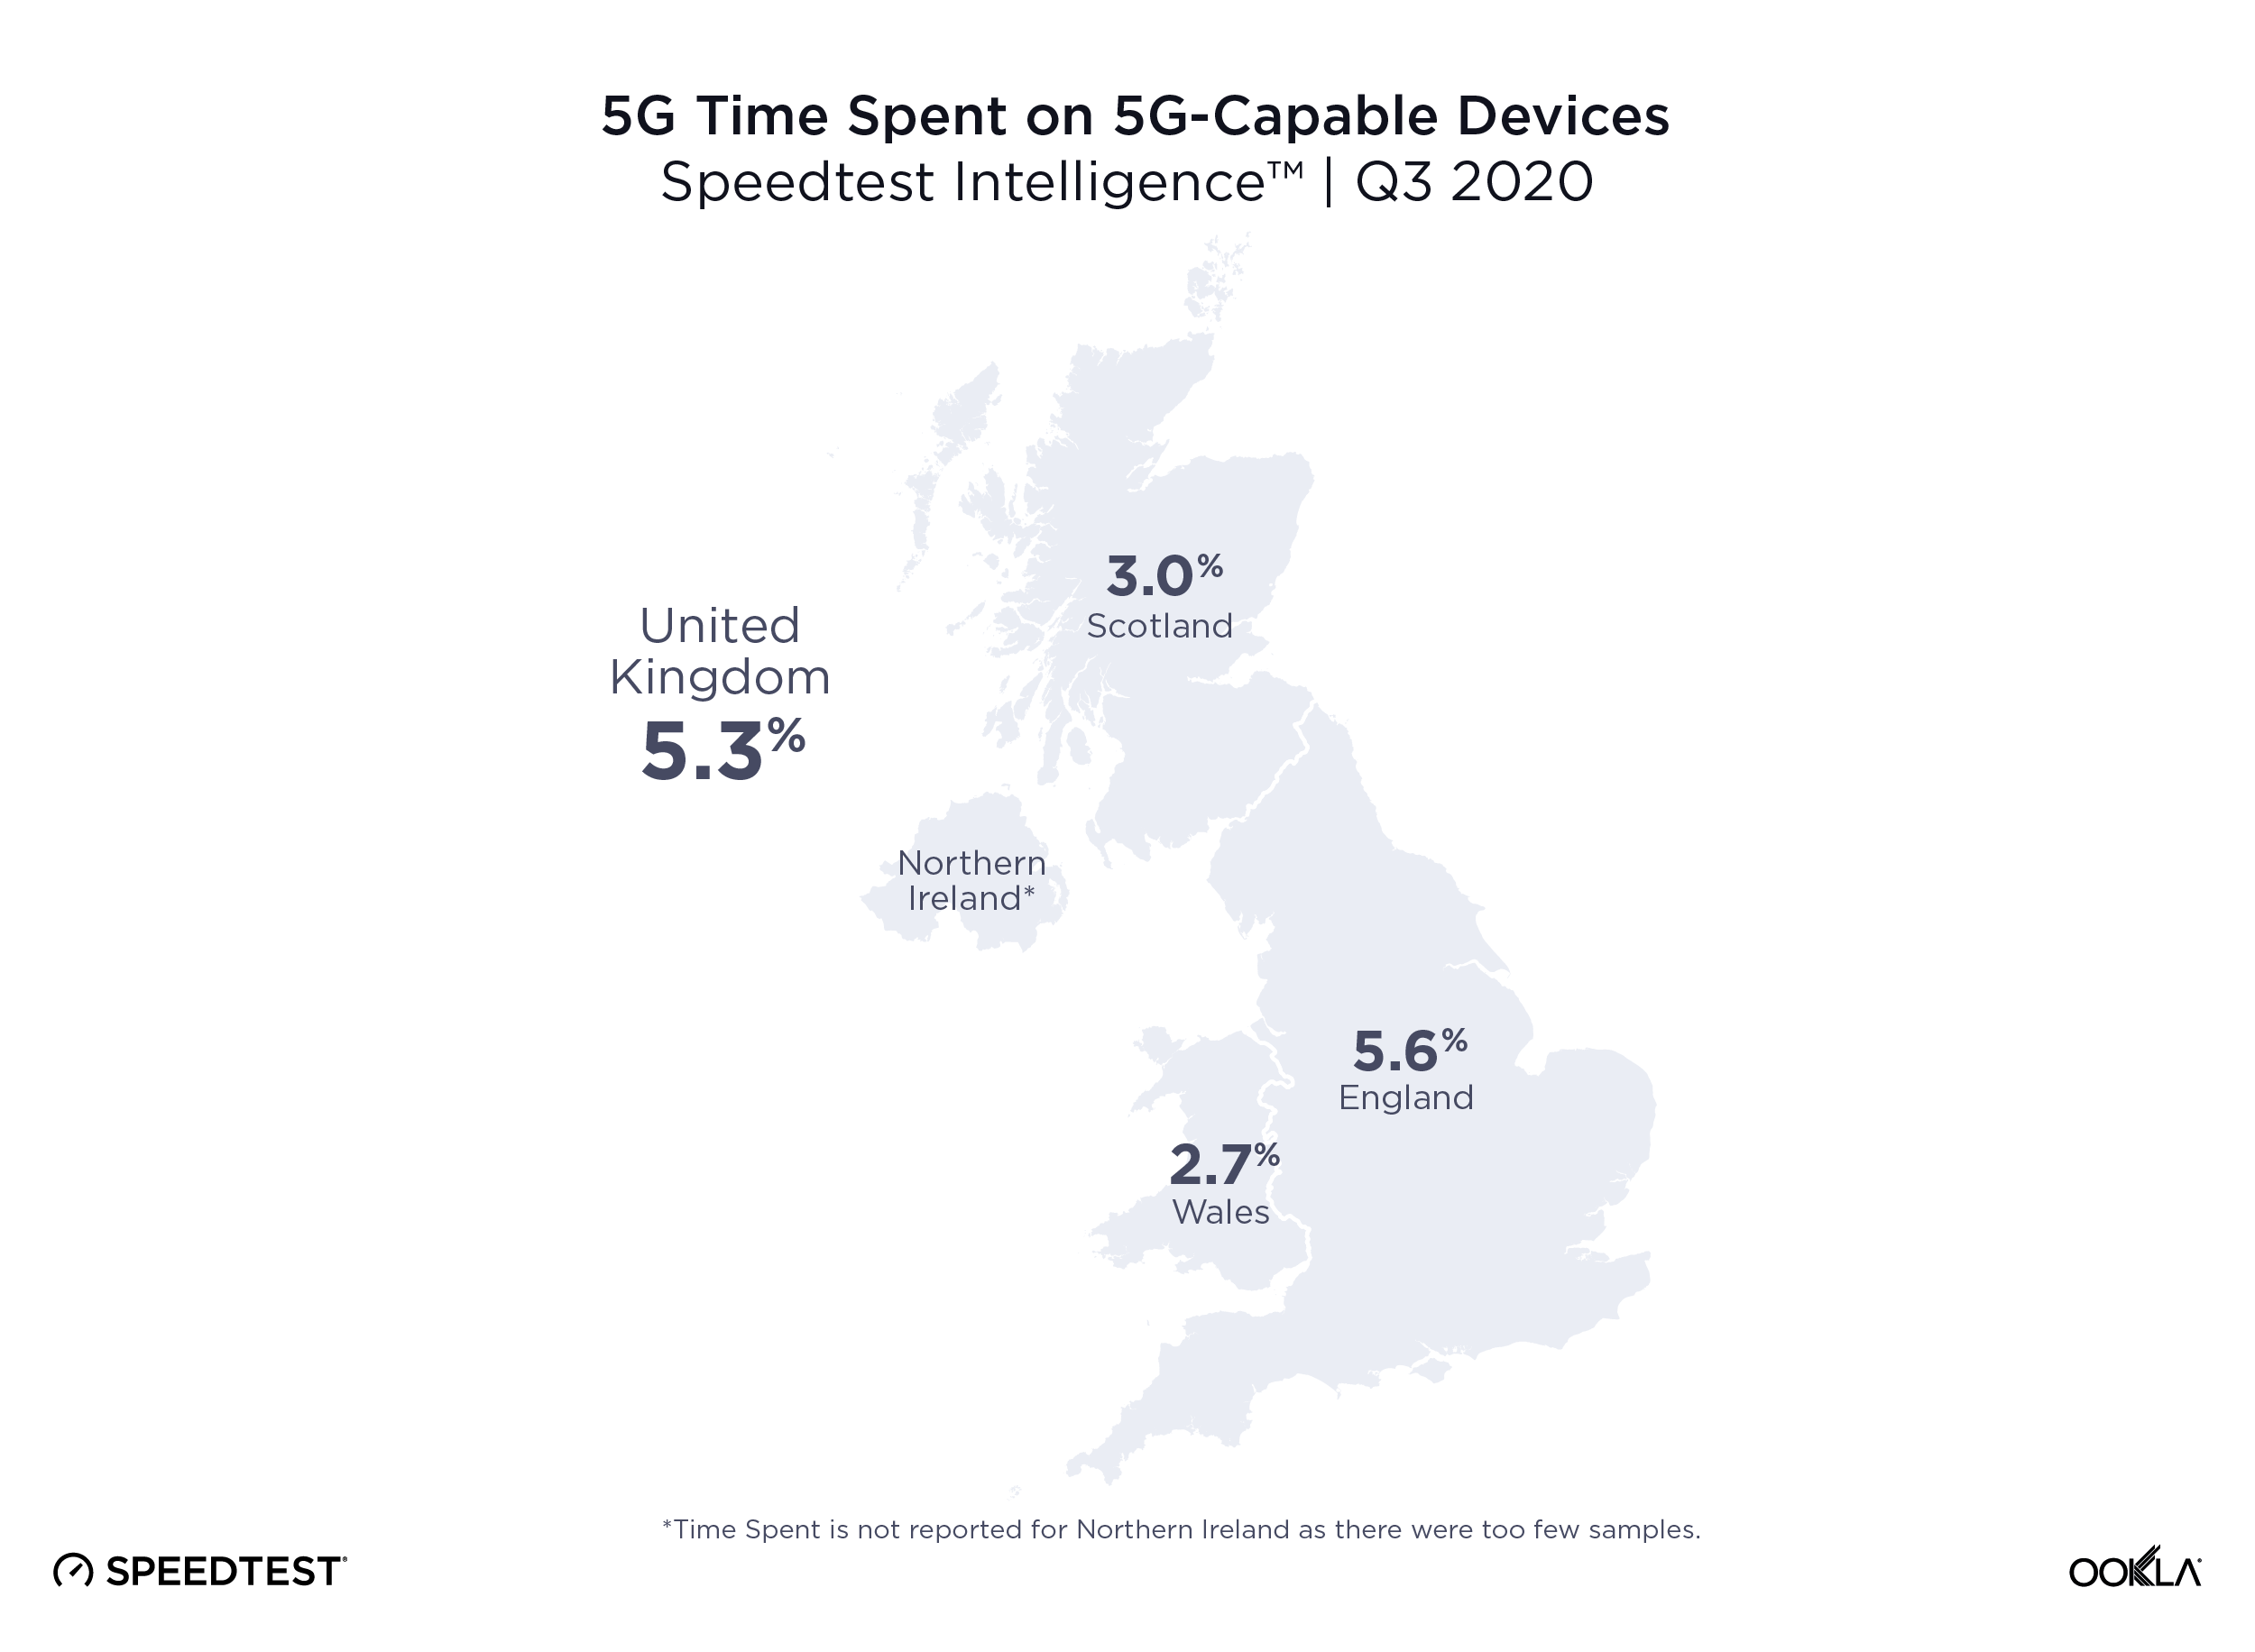
Each time a user takes a Speedtest, a snapshot of the internet is captured for that specific time, place, device and network. Because these tests are initiated by consumers when and where they need performance data, Speedtest gives users accurate information about internet speeds at the times and locations that are important to them. When aggregated, these measurements describe the network’s real-world, round-the-clock performance and its ability to meet the needs of its users. Our volume of data allows us to accurately describe and compare performance, including how much time consumers spend connected to 5G. For example, we can look at results across all devices to quantify the performance that the average user is experiencing or narrow our focus to 5G-capable devices, which allows us to fully assess the high-end capabilities offered in modern deployments.

Poor data science causes untrustworthy results

Other telecommunications data providers each have their own indices that they use when awarding “winners.” Unfortunately, most of these are based upon unclear and, at times, unsound ranking systems. From nPoints to Rootscores, compound scores hide an operator’s actual performance from consumers who simply want to know what performance they can expect. Arbitrary data periods seem altered to suit the highest bidder among network operators, device definitions are unclear, and data samples are minuscule. This produces the desirable commercial outcome for the data providers, but it does not give consumers transparent information about which operator will actually serve them best.

Basing claims on flawed data confuses consumers. Worse still, conflicting or misleading claims can substantially degrade a customer’s perception and trust in their network operator. Basing regulatory policy on this flawed data can lead to devastating consequences, such as poorly allocating government funding and deepening the digital divide for underserved populations, particularly in a world where we are all relying on connectivity more than ever before.

Good data makes for justifiable claims

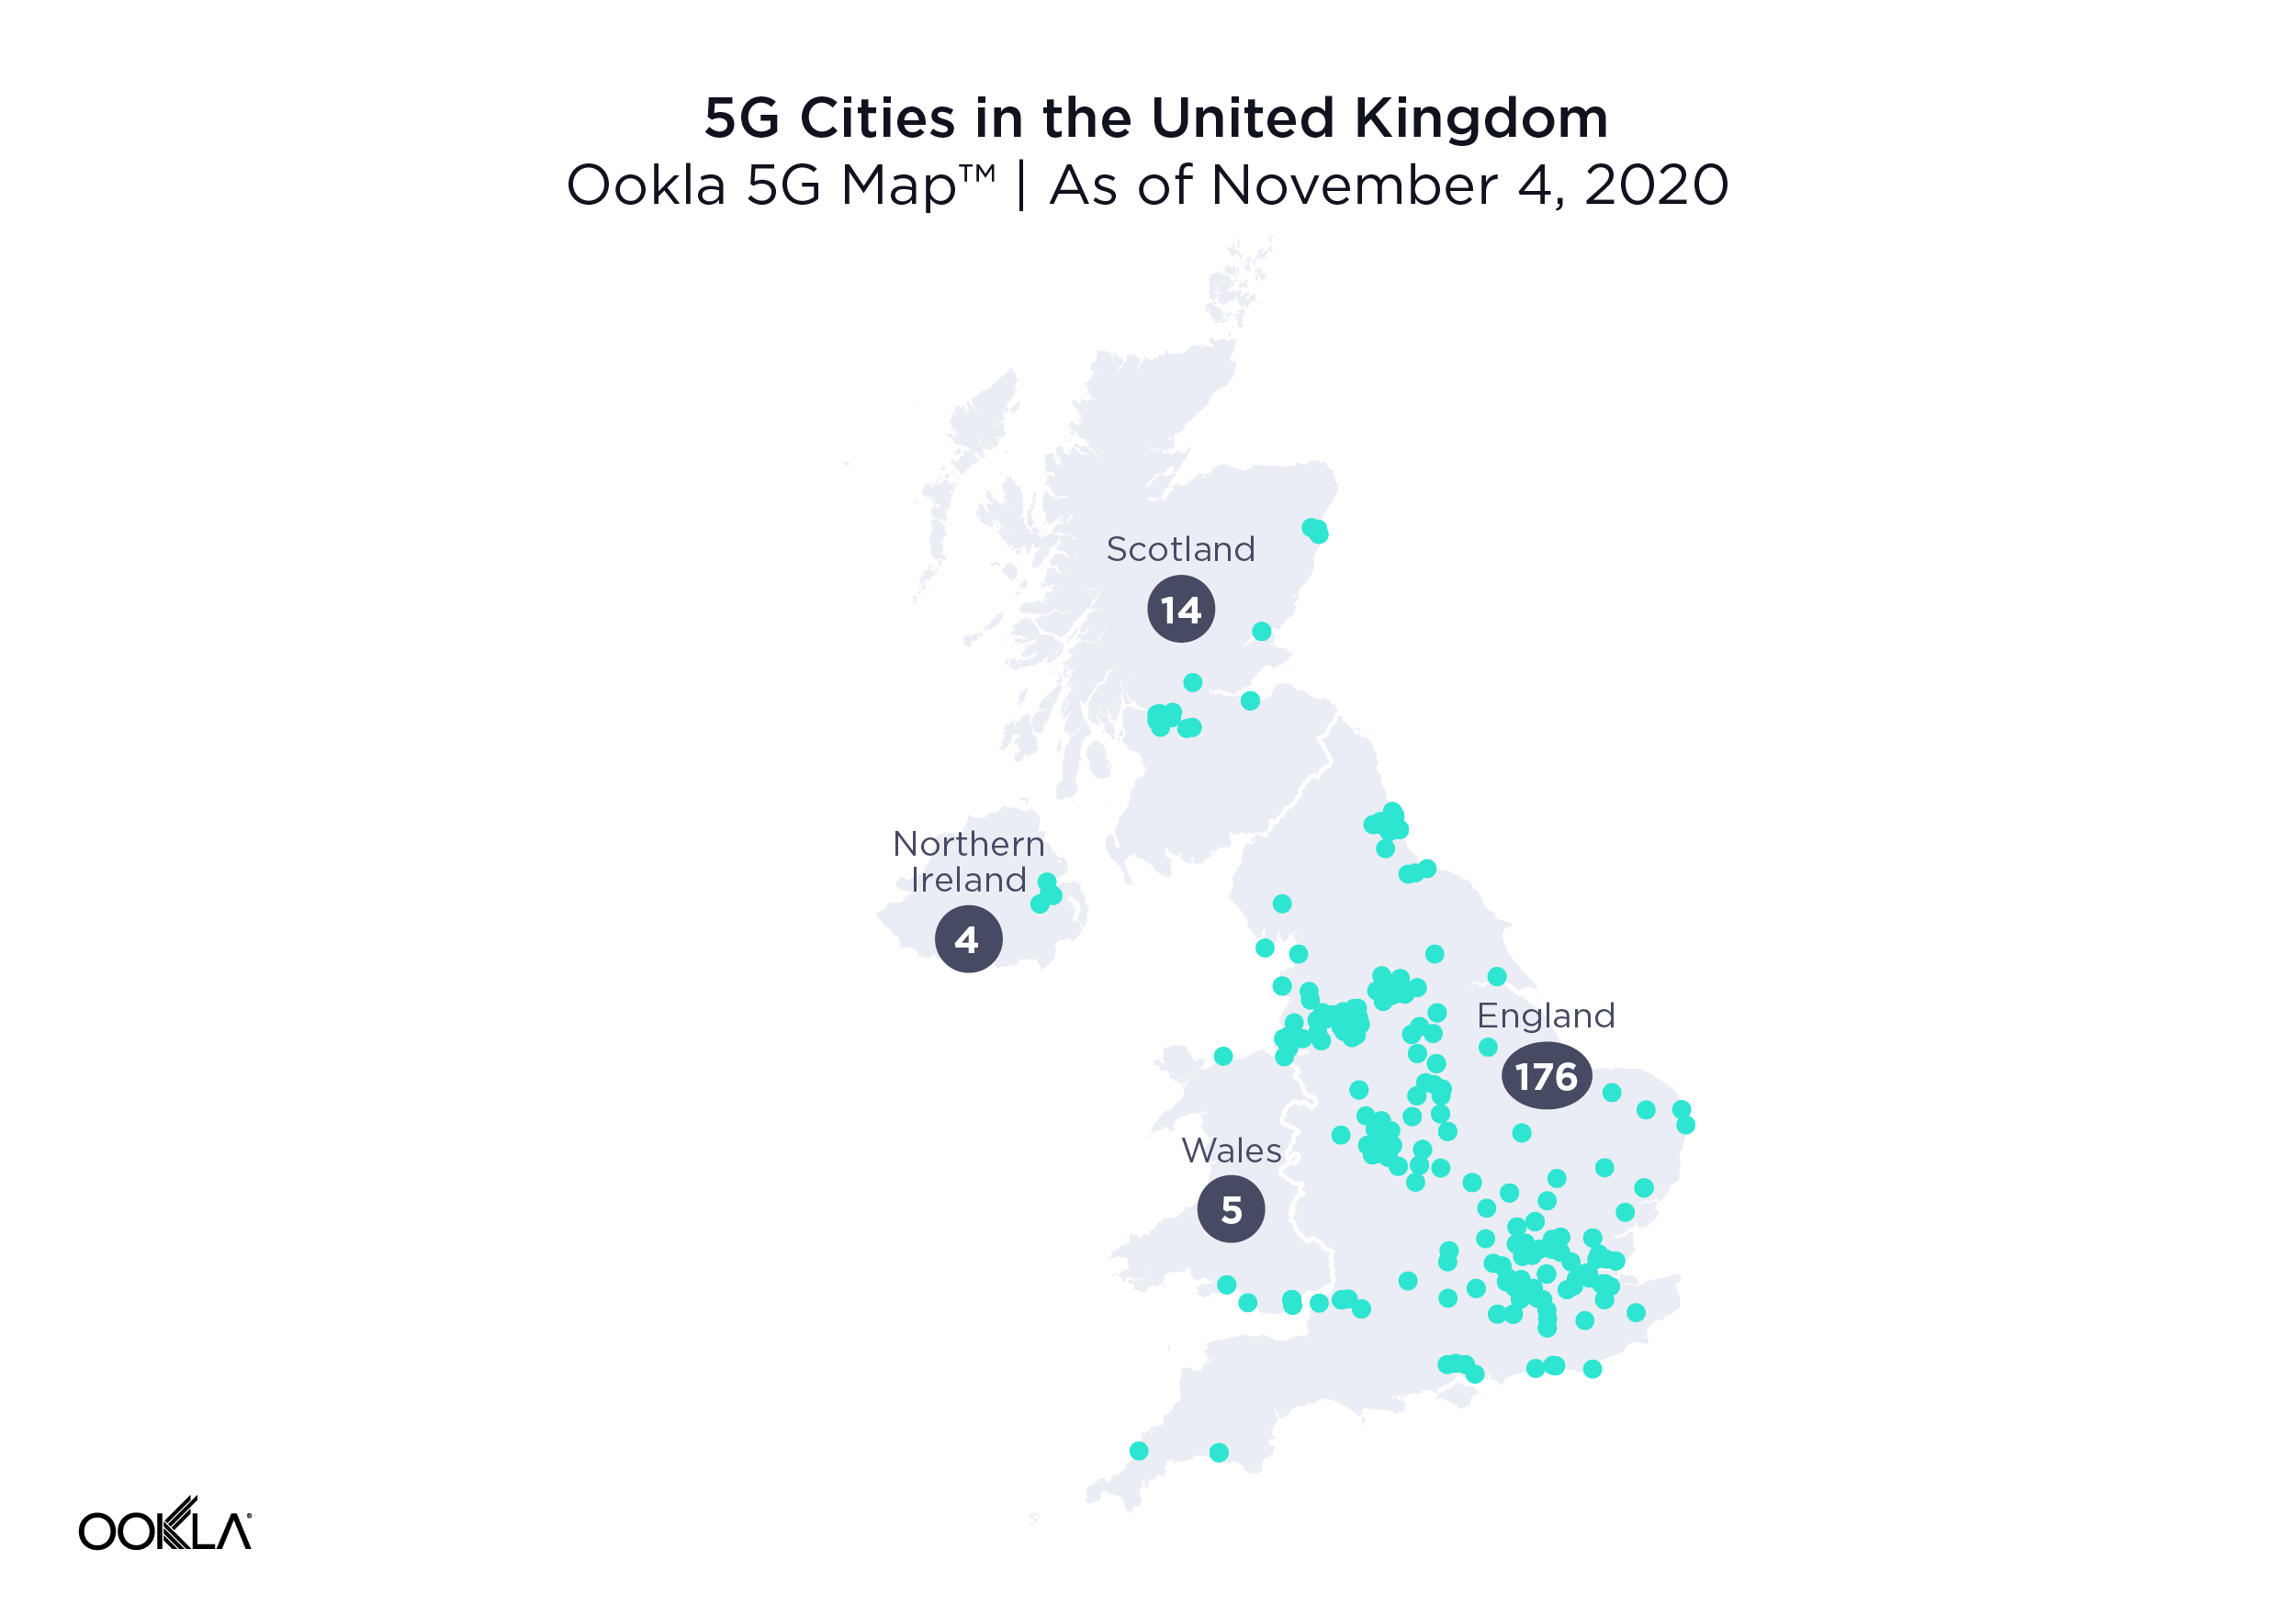
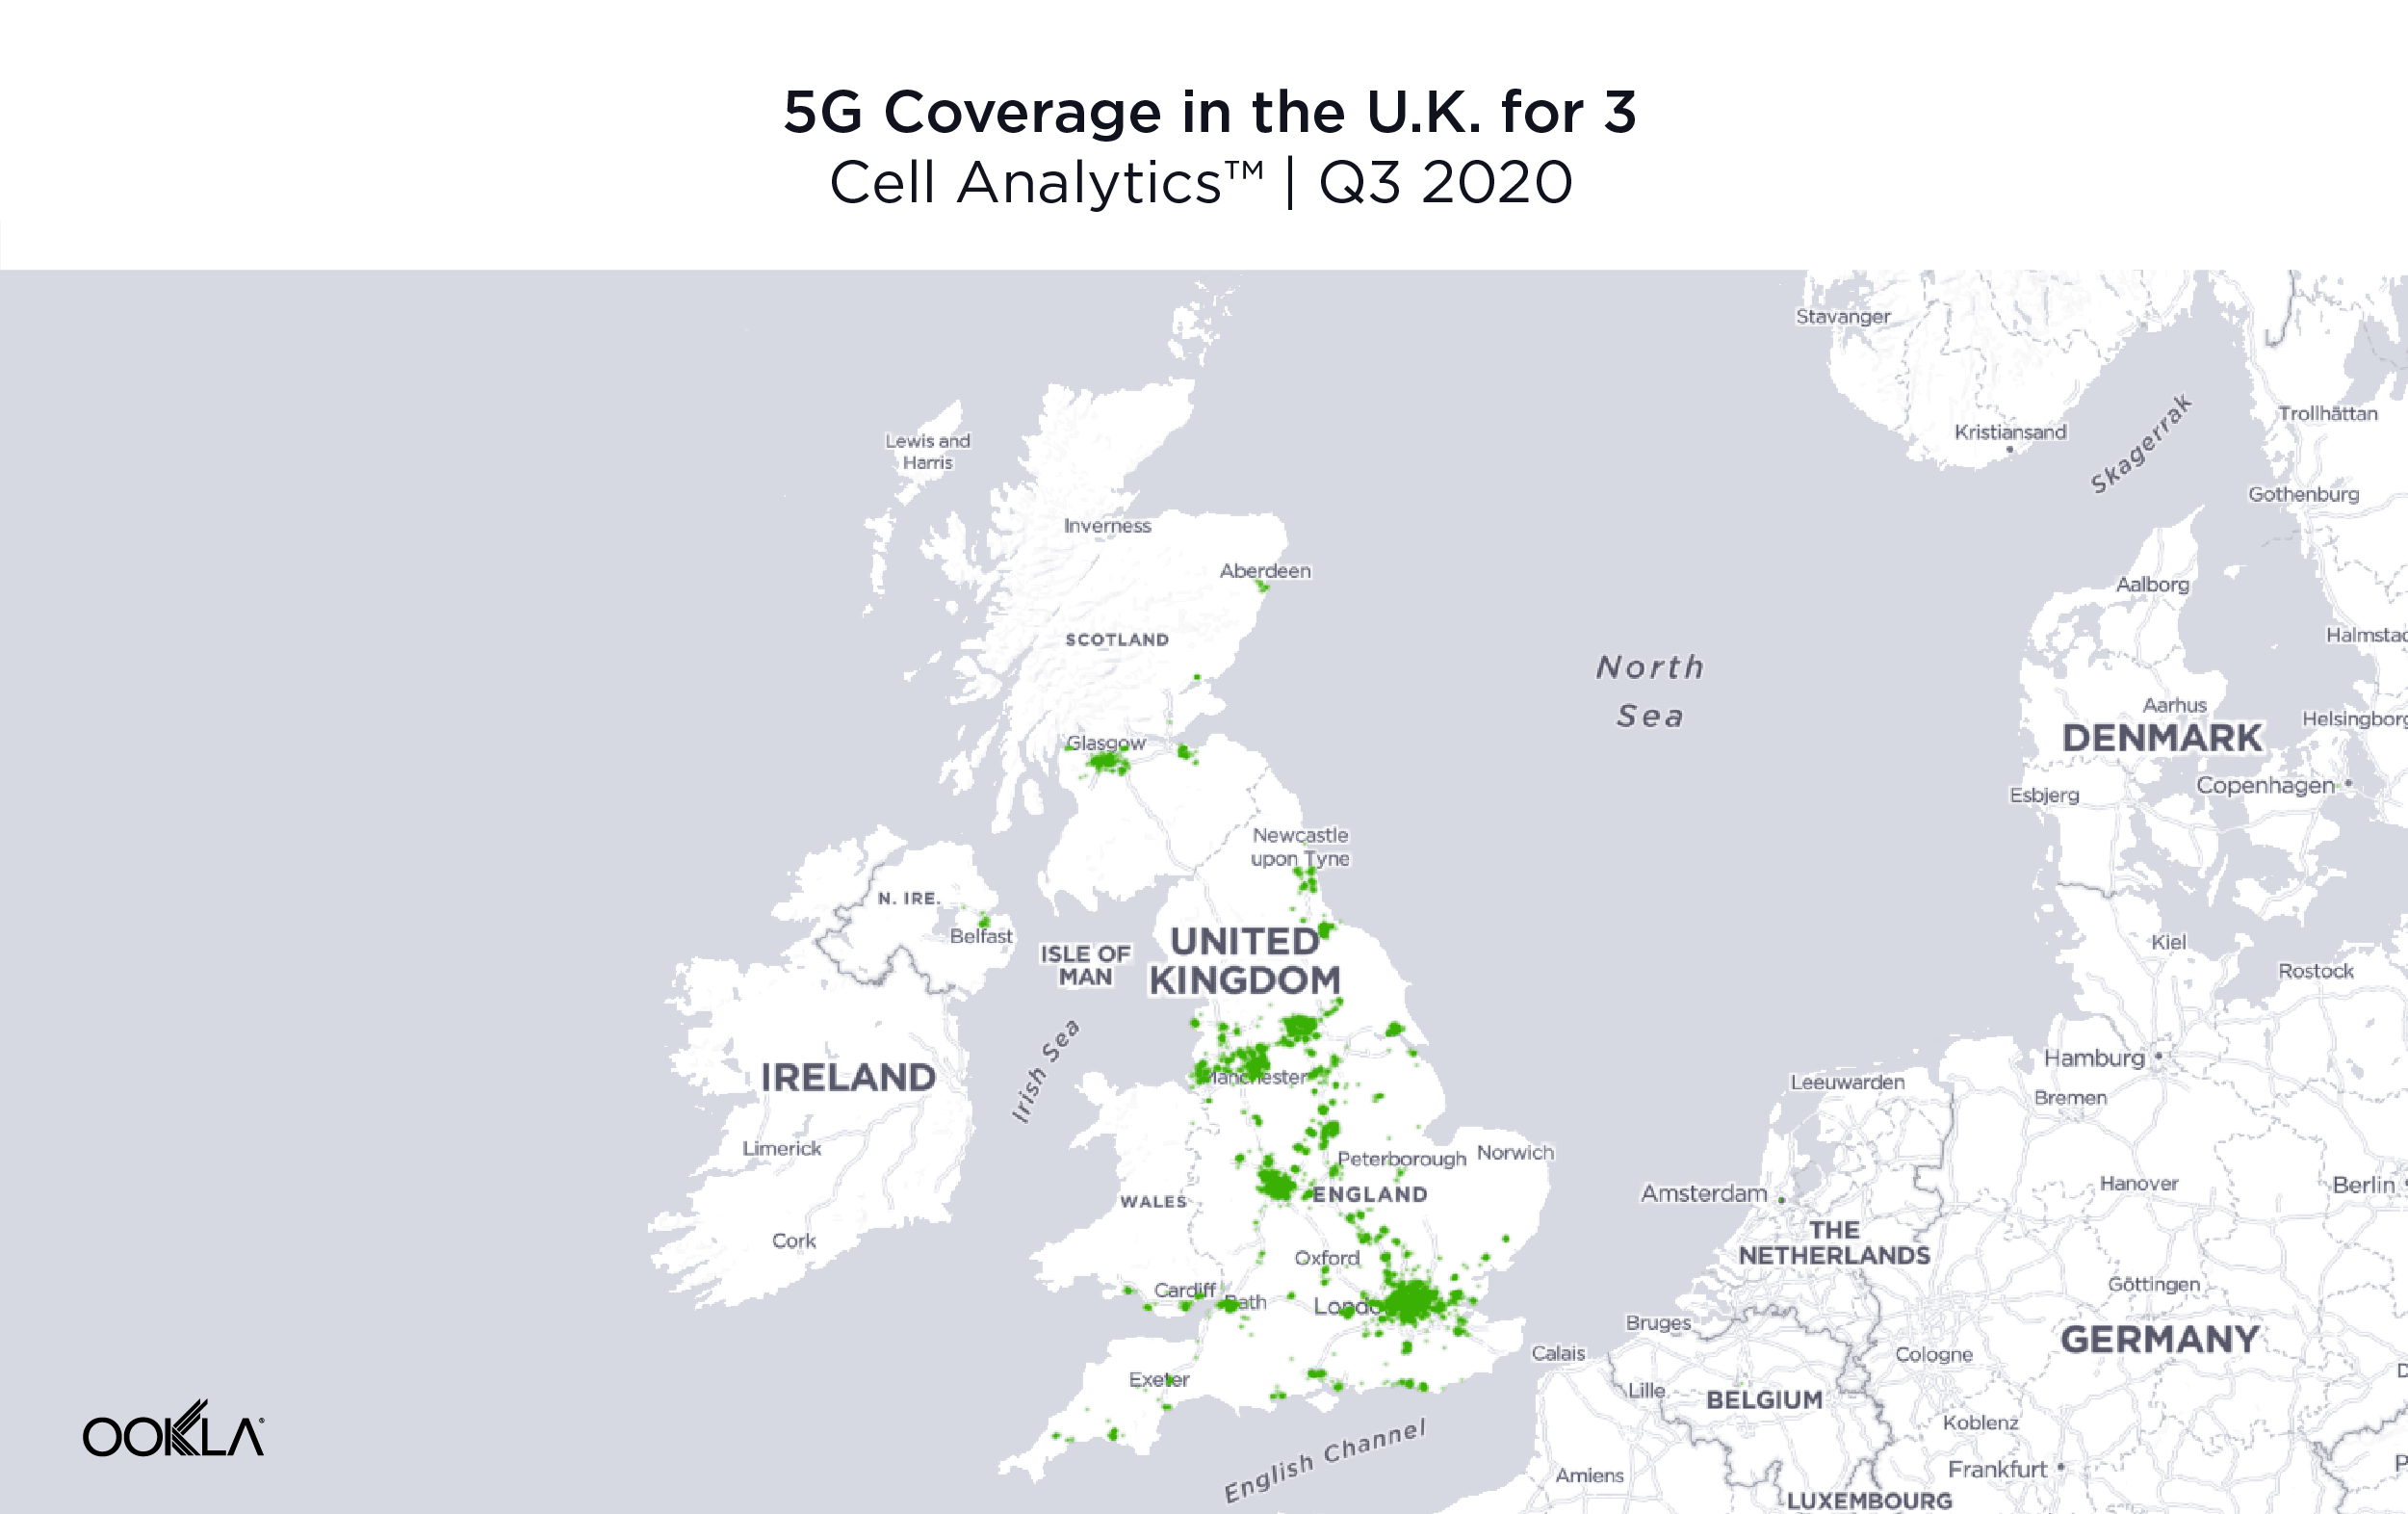
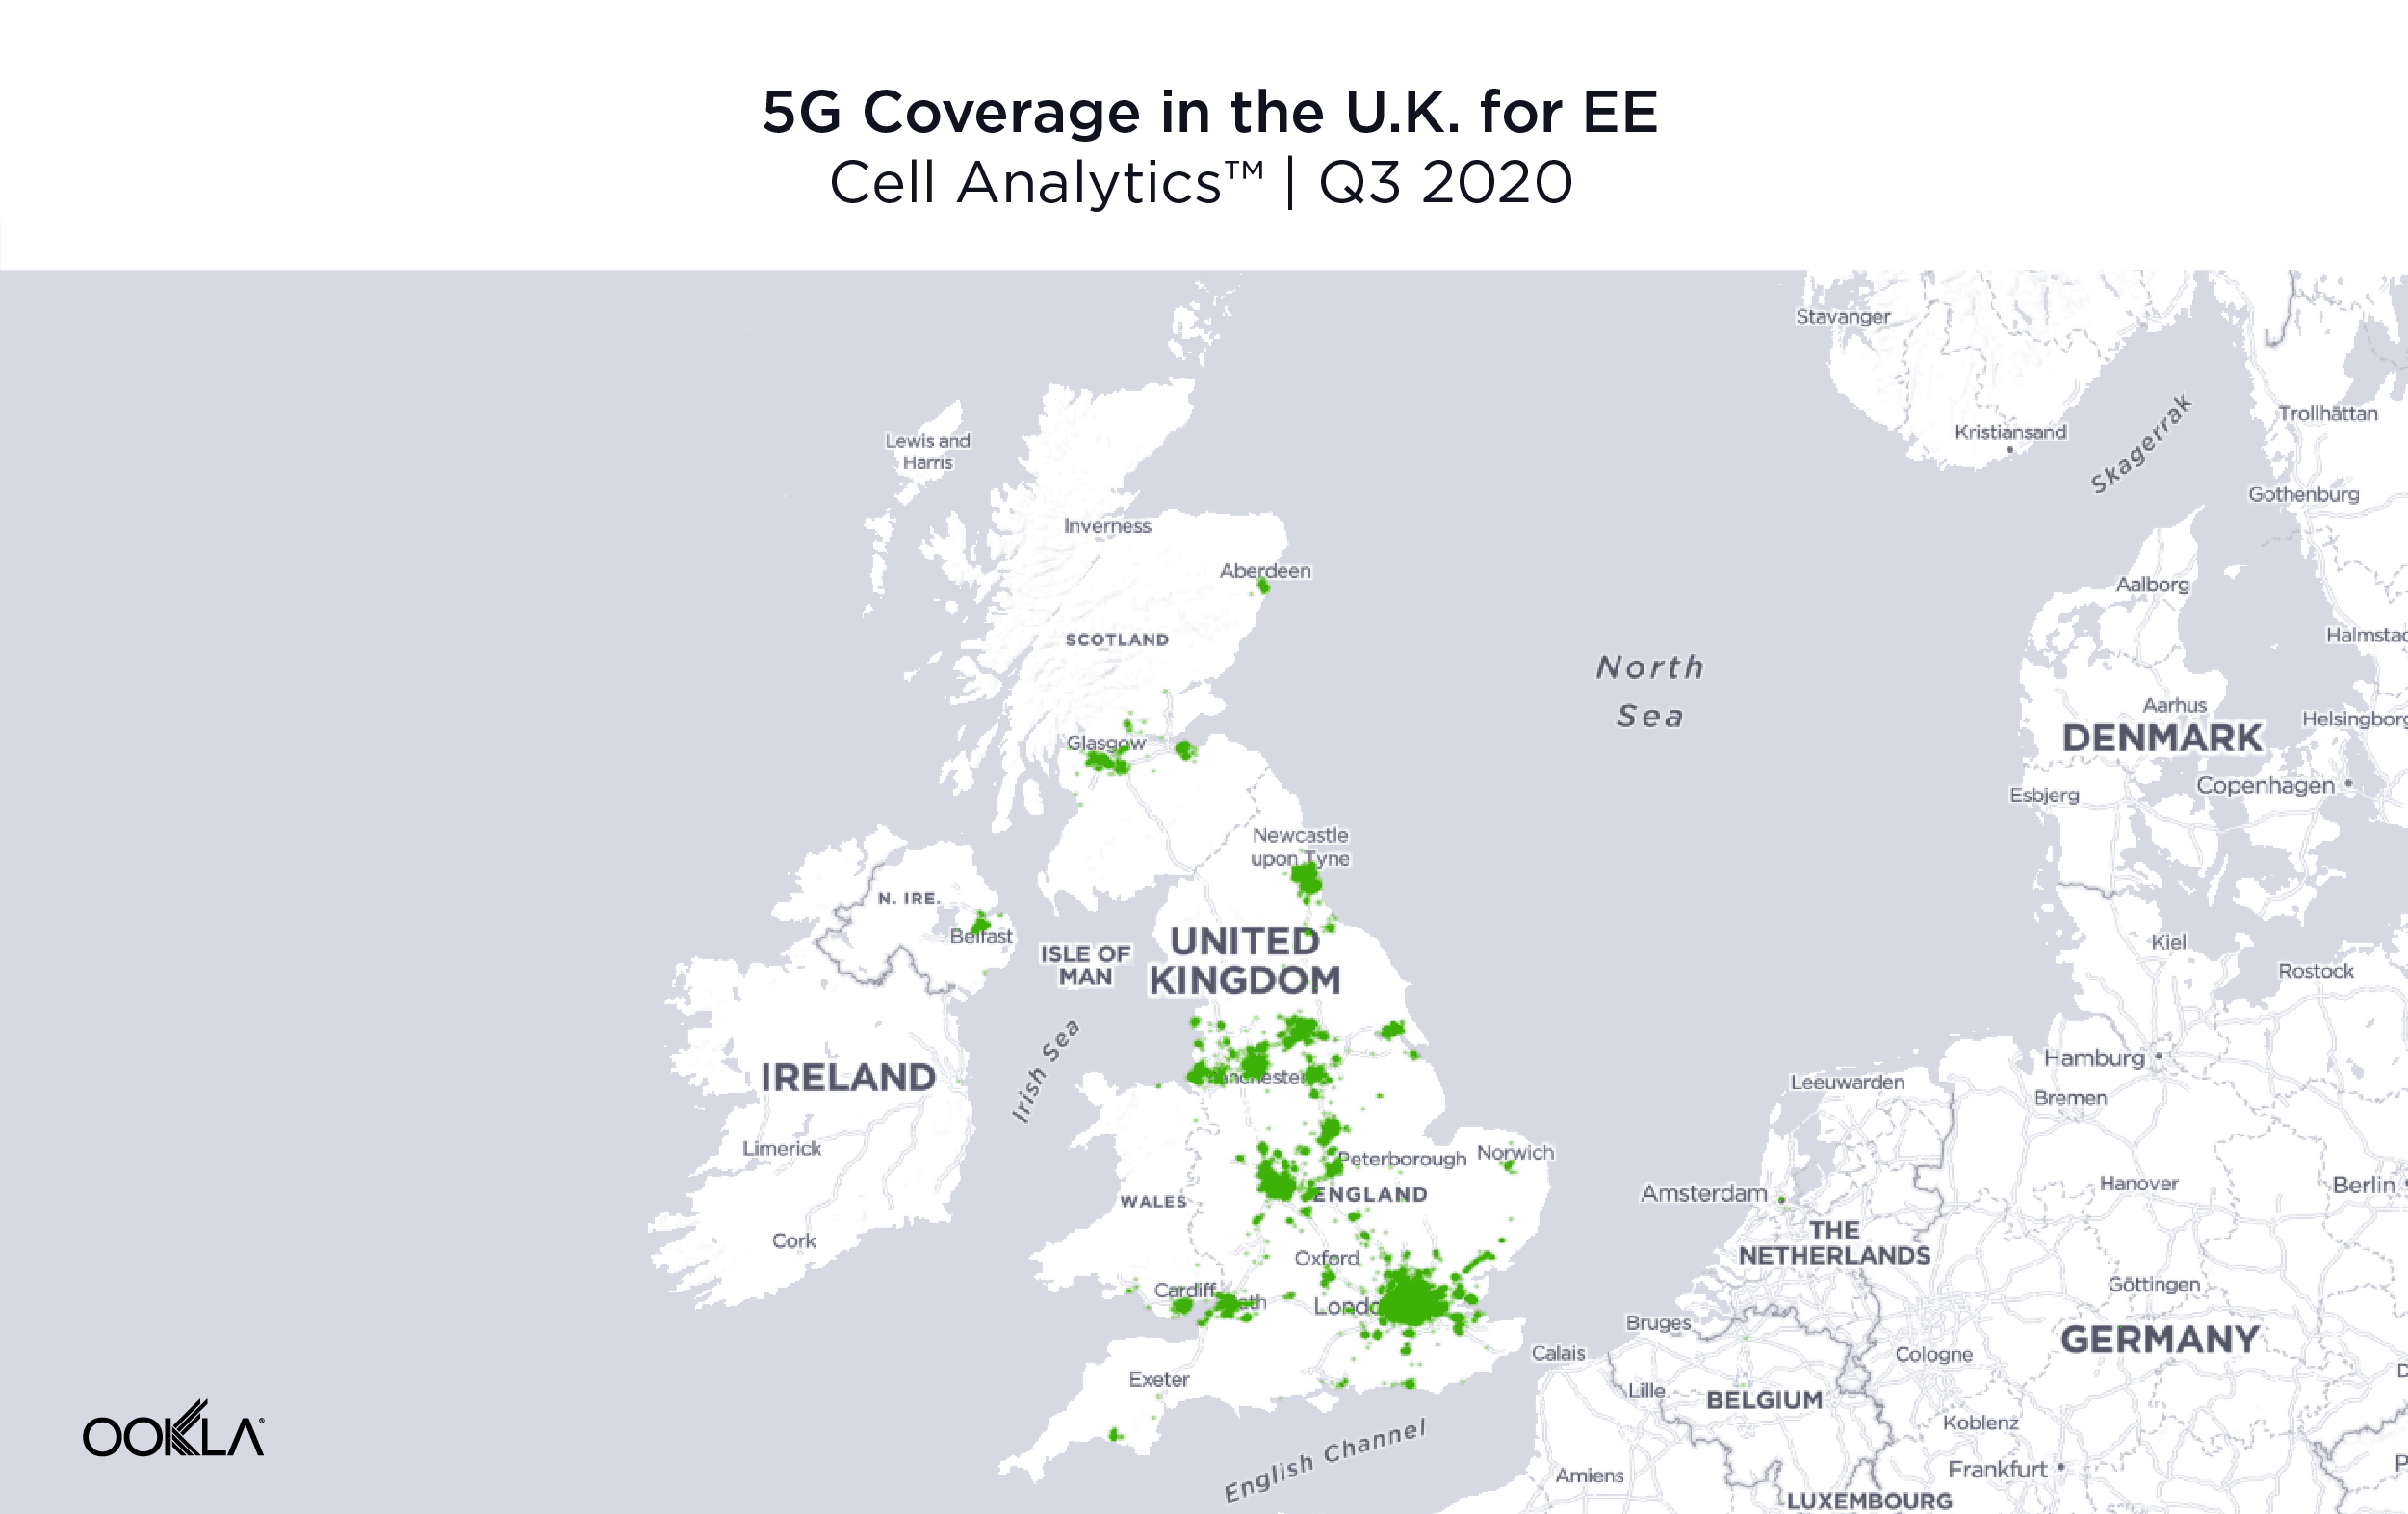
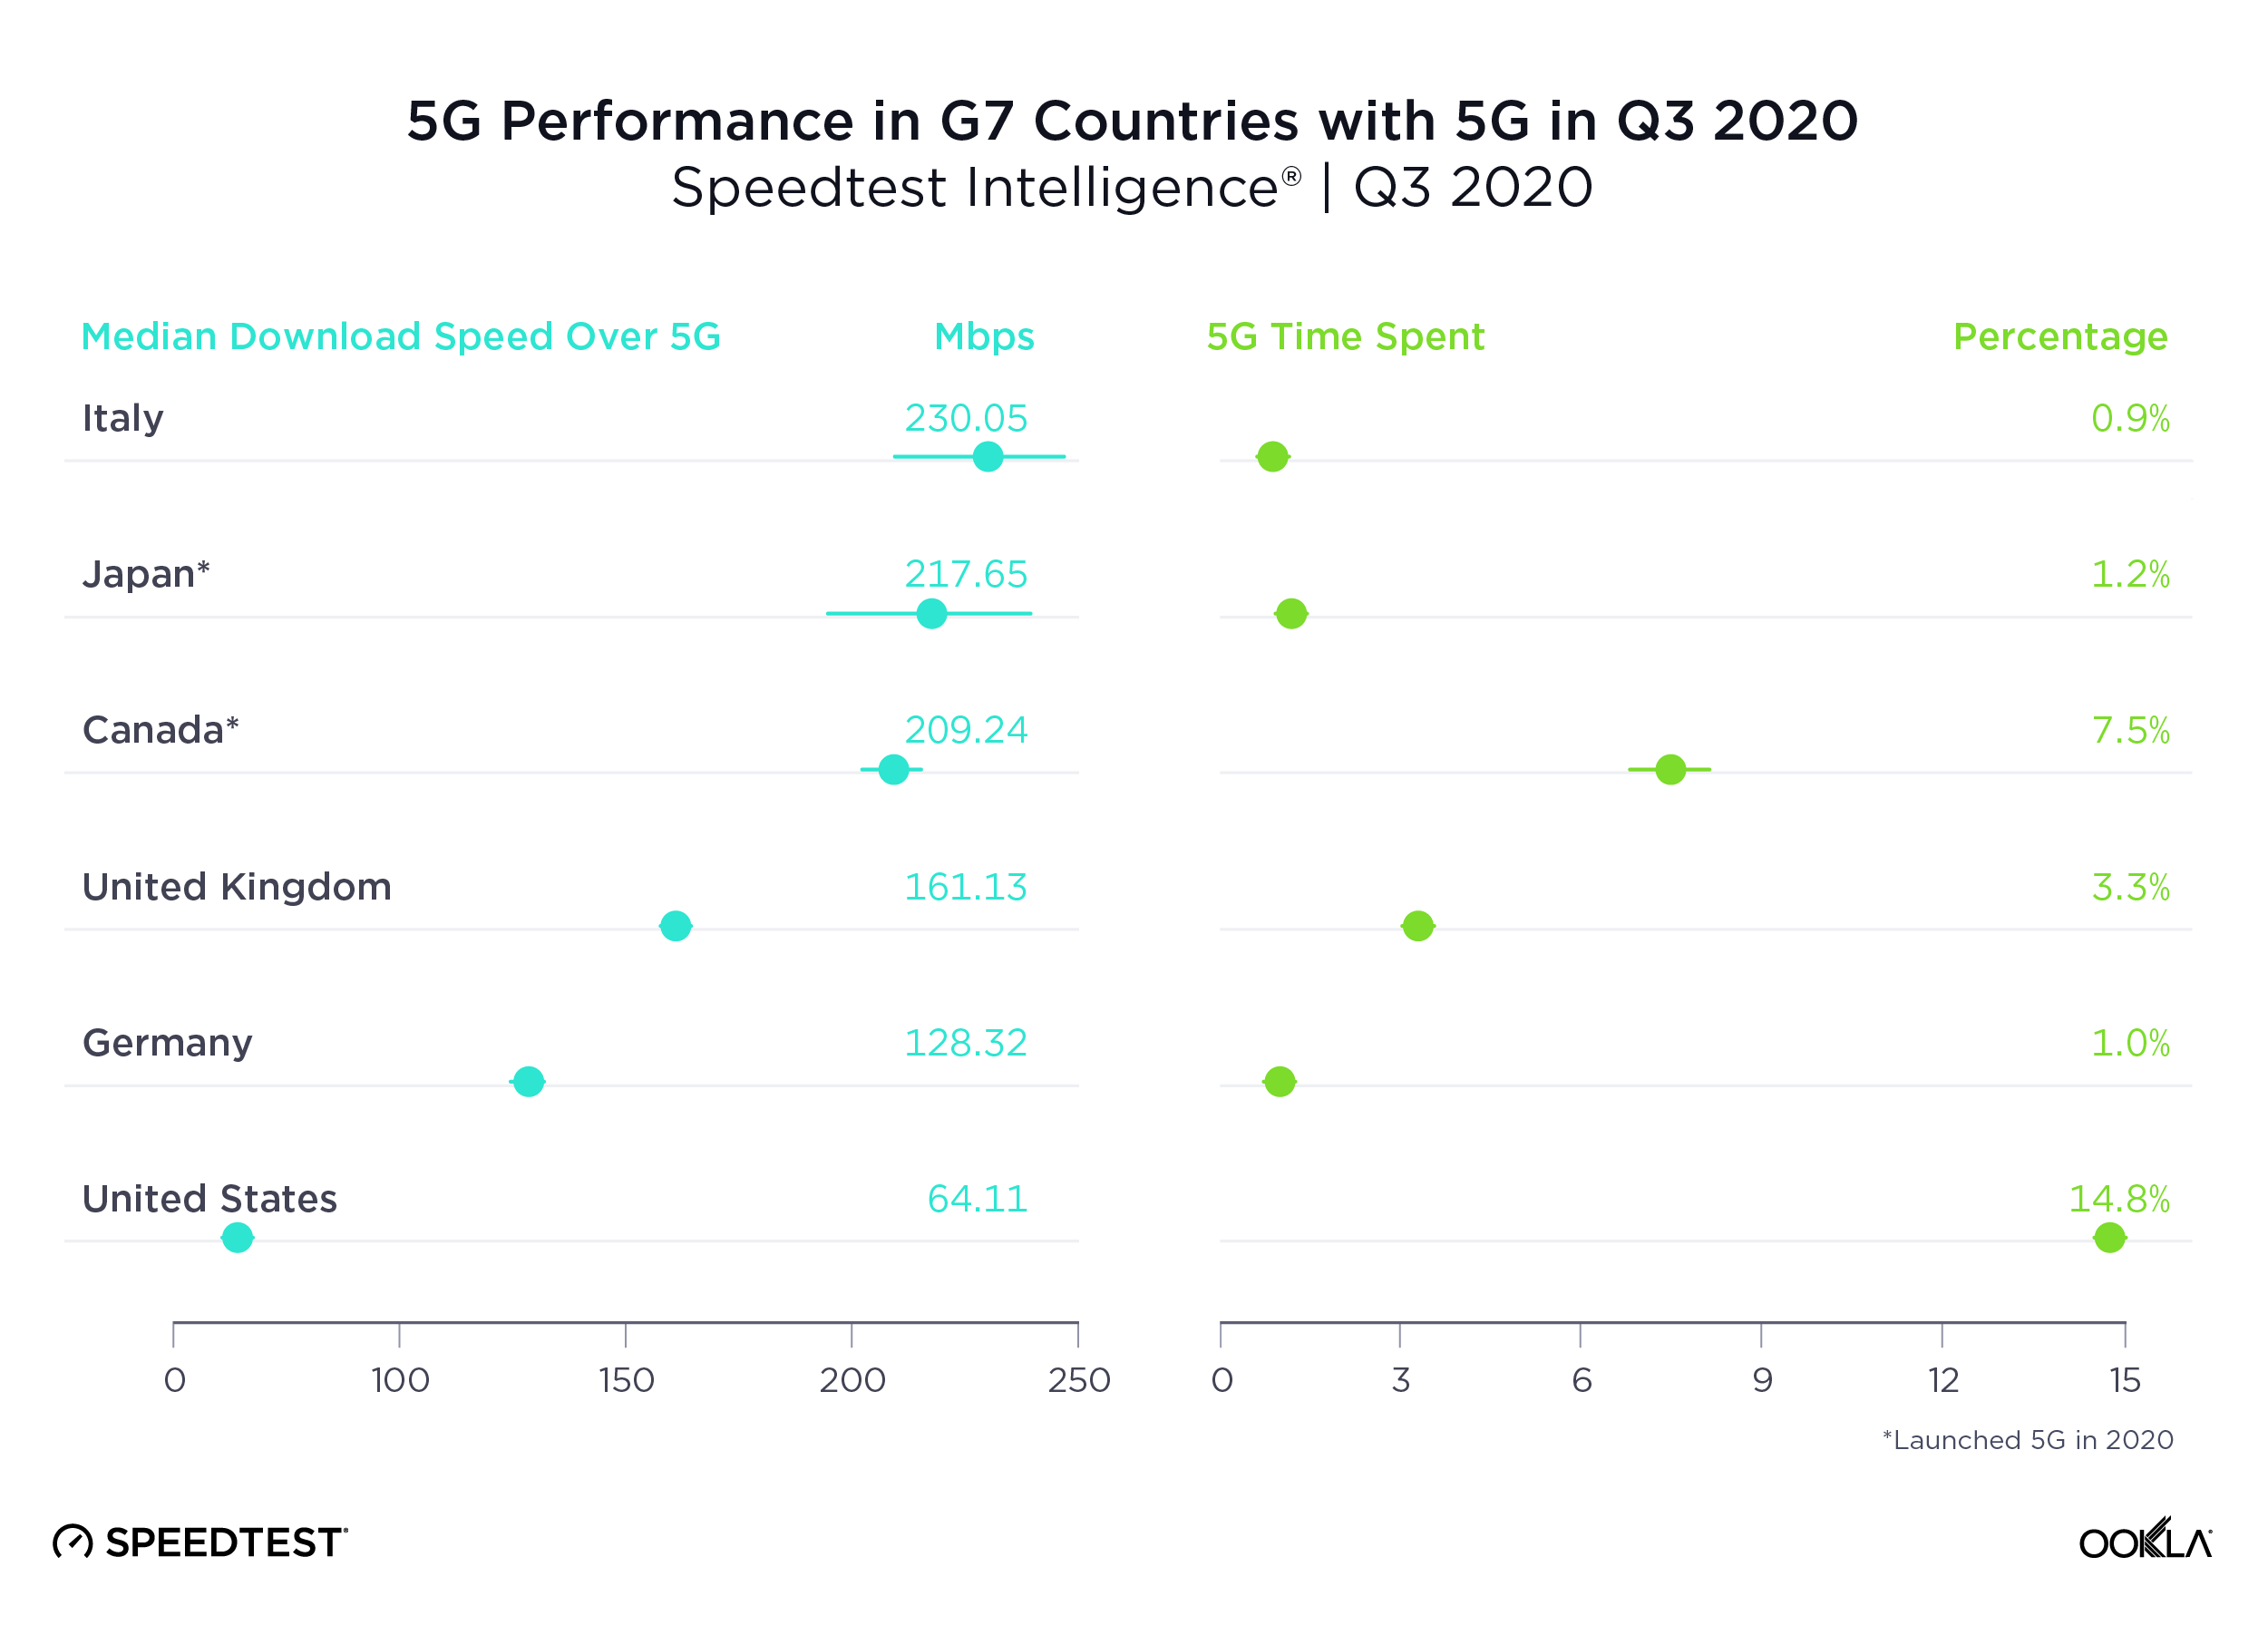
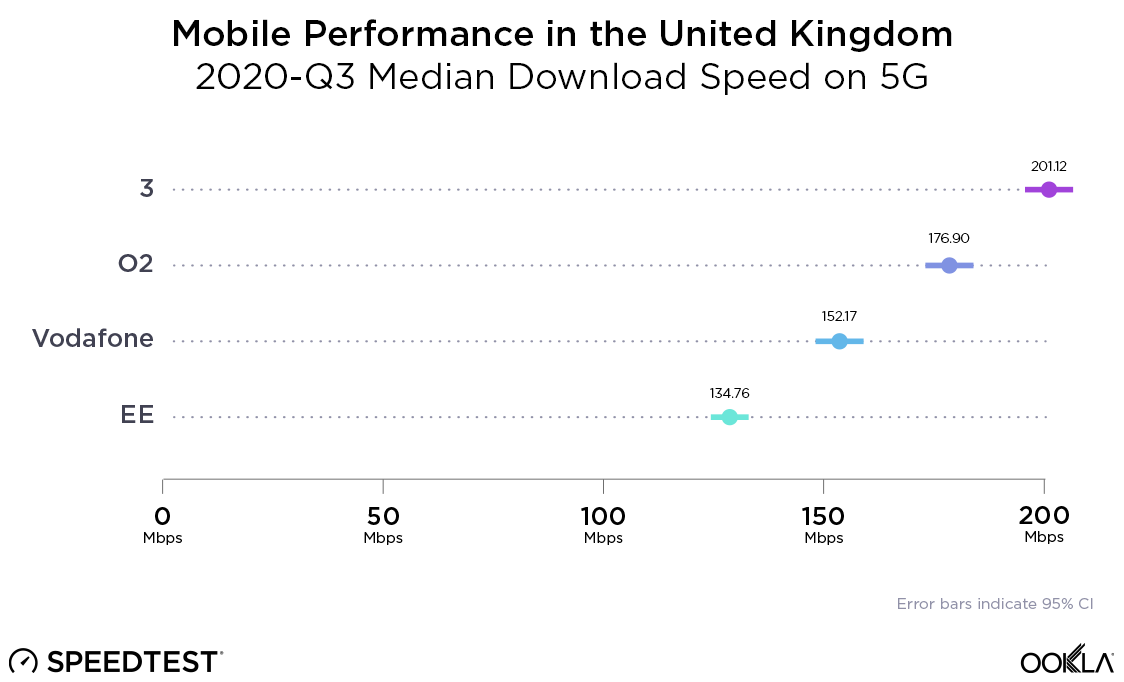
As we found in our recent U.K. market analysis, the 3 network has by far the fastest median download speed over 5G in the U.K. This analysis is based on over 60,000 Speedtest results taken over 5G by more than 16,000 devices in the U.K. during Q3 2020. In all, there were over 500,000 samples of Speedtest results in the U.K during Q3 2020. EE shows the highest Time Spent on 5G by 5G-capable devices at 10.9%, with 3 coming in at a distant second and Vodafone third.

5g-median-uk-1

Squandering marketing budgets to promote claims based on unsound data or unsound methodologies helps no one — not the customer, the operator or even the company providing the unsound claim. When Ookla stands behind a claim of “fastest” or “best” network in a country, we do so only when a strict set of conditions has been met. Being a trusted source of consumer information was our first function and it remains the driver behind our mission.

Ookla retains ownership of this article including all of the intellectual property rights, data, content graphs and analysis. This article may not be quoted, reproduced, distributed or published for any commercial purpose without prior consent. Members of the press and others using the findings in this article for non-commercial purposes are welcome to publicly share and link to report information with attribution to Ookla.

| November 10, 2020

Make Better Funding Decisions with Accurate Broadband Network Data: A Guide for Federal, State and Local Governments [White Paper]

State and federal officials are charged with spending billions of dollars in funding to improve broadband availability, particularly in rural areas. While many yearly budgets had already earmarked money for broadband development projects before COVID-19, the pandemic has highlighted deep digital divides at a time when the public is more reliant than ever on the internet for work, education and other essential services.

Federal, state and local governments need accurate data on broadband availability and network performance to correctly allocate this funding to serve the most constituents. This data drives budget and spending decisions — and historically, a significant portion of these funds have been misdirected by relying on bad data.

In this new Ookla® white paper, we share a case study where misleading data from Measurement Lab (M-Lab) led a U.S. Congressional office to an incomplete picture of broadband performance in Upstate New York. The white paper also includes a guide to the key considerations a savvy policymaker should take when evaluating network data on which to base funding decisions.


Using broadband network data to understand — and close — the digital divide

The shift to working and learning from home has underscored the need for high-speed connectivity across the entire country. Many households are trying to do much more with their internet connections than they ever have before. As more family members in a household use an internet connection for teleconferencing or distance learning, their need for internet speeds will go beyond the FCC minimum guidelines of what constitutes a broadband connection: 25 Mbps download speed and 3 Mbps upload speed.

In the U.S., legislators whose districts include rural areas have long been aware of the “digital divide” created by a lack of broadband access — and the economic and educational opportunities rural communities miss out on because of this divide. While urban dwellers usually have access to high-speed connections at or near their home addresses, sometimes broadband service can be cost prohibitive. Their rural counterparts are faced with the additional challenge of a lack of connectivity in their area. To commercial internet service providers (ISPs), there is a tipping point where population density is too low to make investments in high-speed internet infrastructure profitable.

Broadband funding efforts are often focused on closing this digital divide by targeting the most under-served communities for investment and development.

The dangers of using bad data to prioritize broadband funding

The white paper explores a case study where inaccurate network performance data created an incomplete picture of broadband access in Upstate New York. In August 2020, the office of Congressman Anthony Brindisi, New York, District 22, U.S. House of Representatives, released a report highlighting the lack of broadband service across the district. New York’s District 22 (NY-22) is large, and the people of the district are somewhat evenly distributed between city and country life, with 57.5% living in urban areas and 42.5% (roughly four out of ten people) living in rural areas. Like so many rural regions of the U.S., broadband has not yet reached all constituents in NY-22.

The report provided valuable insights gleaned from constituents’ direct feedback on their connectivity, and the congressman’s office made excellent recommendations on how the district should approach improving broadband access. However, our concern with the rest of the report is that it was based on network performance test results that painted an inaccurate picture of what many constituents were actually experiencing in the district. The presented results greatly underestimated the speeds being delivered by internet service providers (ISPs) throughout most of the study area while overestimating speeds in some others. The speeds included in the report used network performance information exclusively from tests taken with M-Lab.

The speeds measured by Speedtest® for the same areas during the same time period are dramatically higher in most areas, which indicates that some constituents can already achieve network speeds that meet FCC minimums — meaning that additional infrastructure investments are unnecessary. By relying on numbers that inaccurately indicate lower speeds than reality, the congressman’s office runs the danger of targeting certain areas for funding that already have adequate broadband service. Resources are limited, and these funds should be allocated to areas that lack the connectivity needed to meet the FCC’s minimum of 25 Mbps download speed and 3 Mbps upload speed.

The table below shows comparisons of the median download and upload throughputs for the twenty ZIP codes specified in the report as having the “worst” speeds within NY-22. Looking at Ookla and M-Lab data side by side, you can see that M-Lab vastly under-reported the network throughput in every single “worst” ZIP code in the congressional report.
Ookla_NY22_slowest_zips_chart_1120

The ZIP code showing the least amount of difference between Ookla and M-Lab data was 13803 (Marathon) where M-Lab’s recorded median was 5.5 Mbps and the median from Ookla data was 14.5 Mbps. This means the typical speed in Marathon measured by Ookla’s Speedtest was over two and a half times as fast as the average measurement captured by M-Lab. On the other end of the scale, in Whitney Point, M-Lab’s recorded median was 0.9 Mbps while Ookla measured a median of 71.6 Mbps, almost eighty times faster.

Contrary to M-Lab’s data, Ookla data determined that 12 of the listed ZIP codes met the FCC minimum threshold of 25 Mbps download and 3 Mbps upload, with two additional ZIP codes falling just below the thresholds.

A policymaker looking at M-Lab’s data alone might incorrectly assume that every single listed ZIP code in the district is wildly underserved. In this case, funding may be allocated to areas that already have adequate broadband service, leaving underserved constituents without connectivity.

When bad data leads to underserved communities

In a few outlying ZIP codes, the speeds measured by Ookla were actually much slower than those measured by M-Lab. Below is a comparison of the “best” ZIP codes in NY-22, as reported by M-Lab, compared to Speedtest results.

While the majority of their data vastly under-reported network speeds, we zoomed in on one example where M-Lab’s data looked questionable in the very rural town of New Berlin (13411). M-Lab results showed a median download speed of 103.5 Mbps, but the median upload speed of 102.6 Mbps looked too good to be true. If this measurement was accurate, it would be outstanding service for such an isolated community. M-Lab’s report names New Berlin’s ZIP code the fastest in the entire district, which may have come as a shock to the residents there.
Ookla_NY22_fastest_zips_chart_1120

Ookla’s results for the New Berlin ZIP code show a strikingly different picture: a median download speed of 18.5 Mbps and median upload speed of 3.3 Mbps. While the upload number meets FCC minimums, the download certainly does not. If ZIP codes are used to determine eligibility for broadband funding, the M-Lab results would indicate that the area around New Berlin is not in need of broadband infrastructure assistance.

While reporting data aggregated by ZIP code is common among network testing providers like M-Lab, Ookla does not recommend using ZIP codes as an arbitrary boundary for measuring broadband performance.

ZIP codes were created for a single purpose — to efficiently deliver the mail via linear routes. While an urban ZIP code may contain several neighborhoods in the same city, rural ones can encompass several small communities many miles apart from one another. ZIP code names do not reflect every community served, and are usually named for the community that hosts the postal facility.

The disparities between network data providers

Federal, state and local policymakers need to use the most accurate, comprehensive data available on the networks when deciding where to spend broadband funding. However, not all network testing providers are created equal.

To accurately measure the download speed of an internet connection, a testing application such as Ookla’s Speedtest or M-Lab’s Network Diagnostic Tool, running on the end users’ machine, pings dedicated testing servers to send as much data as possible. The testing application then measures how much data it receives back from the servers during a period of time (usually 10 or 15 seconds).
Test2_graphic_1102

Each test requires a large enough data transfer to ensure that it fully saturates the network connection and measures the full throughput capability. With ISPs offering high-speed connectivity such as optical fiber to the home, this problem is only getting worse. These connections are able to handle speeds between 1 and 2 Gbps, roughly 40 to 80 times more than the minimum broadband speed of 25 Mbps.

Some network testing providers, however, do not have adequate testing infrastructure to account for normal demand on the network, and thus are incapable of accurately measuring peak network speed.

Since M-Lab is a Google partner, search engine results drive traffic their way for performance testing. This is not because they are the best test, but because of the relationship between the two organizations. In fact, M-Lab’s testing infrastructure is extremely limited in a way that produces inferior testing outcomes. Currently, M-Lab has fewer than 60 servers across the entire United States listed on their infrastructure map below (with no servers shown in Alaska, Hawaii or the U.S. territories.)

The Speedtest Server Network™ was purpose-built to manage a global scale of volume, with testing servers strategically located in every country and most major population centers. We have over 12,000 servers in the network, with more than 1,600 in the United States and 68 servers in New York State alone.
Ookla_server-location-comparison_US_NY_1120

When a user takes a test through M-Lab, the test measures the speed between the user’s device and a single — and often distant — server. When data travels between the user’s device and a distant server it may have to traverse many network “hops” (when a packet of data is passed from one network segment to the next) to get there. The additional lag time this introduces to the test results can negatively impact the user’s perception of the local network’s performance. If the server being used for that specific test is also trying to run many other tests at the same time, it may not have sufficient capacity to provide an accurate result. If there are multiple users simultaneously testing their high-speed connection, the tests might consume all the available throughput from a single test server, thus denying other users the capacity required to measure their own connection. Simply put, M-Lab’s infrastructure is insufficient for internet performance testing in the modern era.

Learn how bad data can negatively impact government funding

There are billions of dollars of federal, state and local government funding at stake — not to mention the educational opportunities and livelihoods of millions of constituents. It is critical that policymakers vet their data sources to fully understand the broadband landscape in their jurisdictions — and prioritize spending to best serve their most vulnerable constituents.

Download the full white paper to learn the five considerations every policymaker should take into account when evaluating data sources for their broadband funding decisions.

Ookla retains ownership of this article including all of the intellectual property rights, data, content graphs and analysis. This article may not be quoted, reproduced, distributed or published for any commercial purpose without prior consent. Members of the press and others using the findings in this article for non-commercial purposes are welcome to publicly share and link to report information with attribution to Ookla.

| November 23, 2020

5G Advances Across the U.K., but Access Varies Widely by Country

The United Kingdom has seen considerable advances in 5G during the past year, but access to this emerging technology continues to be uneven across countries of the U.K. Looking at Q3 2020, data from Speedtest Intelligence® and Ookla Cell Analytics™ reveals how 5G affected overall mobile speeds, which country had the fastest 5G and where access was lacking. We also shed light on which operator had the fastest 5G in the U.K. as a whole and in London, specifically.

5G is 518% faster than 4G in the U.K.

5G speeds in the U.K. far exceeded those on 4G during Q3 2020 with the mean download speed over 5G coming in 517.8% faster than median download speed over 4G. The U.K’s mean upload speed over 5G was 121.5% faster than that over 4G.

Mean Mobile Speeds in the United Kingdom
Speedtest Intelligence® | Q3 2020
5G Download (Mbps) 5G Upload (Mbps) 4G Download (Mbps) 4G Upload (Mbps)
United Kingdom 186.97 21.38 30.26 9.65

Scotland had the fastest 5G download speed

Scotland brought up the national average for 5G speeds in the U.K. during Q3 2020 with a 6.1% faster mean download speed than we saw in the U.K. as a whole. England was the second fastest country in the U.K. for mean download speed over 5G and Wales was third. While 5G download speeds were promising in Northern Ireland, the volume of data did not meet our rigorous sampling guidelines. We’ll be interested to see how speeds there develop as more users access the networks.

Mean Mobile Speeds in the United Kingdom
Speedtest Intelligence® | Q3 2020
5G Download (Mbps) 5G Upload (Mbps) 4G Download (Mbps) 4G Upload (Mbps)
England 184.48 21.49 31.05 9.69
Scotland 198.39 22.05 28.60 9.87
Wales 171.12 21.49 26.26 9.02

Three was the fastest operator for 5G in the U.K.

As we’ve previously reported, 3 was the fastest mobile operator over 5G in the U.K during Q3 2020 with a median download speed of 201.12 Mbps. EE had the highest percentage of 5G Time Spent (when subscribers’ 5G-capable devices are connected to 5G).

How operators in the U.K. are using spectrum for 4G

The distribution of low, mid and high spectrum bands is evenly spread across all mobile operators in the U.K. All four operators hold licenses in the 800 MHz frequency band, while Vodafone and O2 hold additional 900 MHz licenses — some of which are still used to support the legacy 2G and 3G services. Three and Vodafone hold 20 MHz each of the 1500 MHz supplemental downlink band 32, and all four operators hold 1800 MHz and 2100 MHz licenses. It’s worth noting that EE holds a massive 40 MHz contiguous slice in the 1800 MHz band and 20 MHz in the 2100 MHz band.

O2 holds an additional 40 MHz contiguous spectrum block in the 2300 MHz (TDD) band. In the 2600 MHz capacity band, O2 holds a single 20 MHz block, Vodafone holds two 20 MHz blocks, while EE operates on a whopping 50 MHz slice of spectrum.

Given the spectrum distribution in the mid- and high-capacity bands, and the increased proliferation of devices with modern chipsets capable of aggregating multiple LTE component carriers, it’s fairly easy to see why EE has been able to consistently deliver the fastest LTE speeds in recent years.

5G-specific spectrum allocation in the U.K.

When it comes to 5G, all operators have deployed 5G non-standalone networks in the 3.5GHz to 3.6GHz band (n78). EE and O2 operate their 5G networks using 40 MHz slices, Vodafone holds a 50 MHz license, while 3 was able to secure a 100 MHz license during the 5G auction — the largest possible channel width defined for FR1 networks. Given the massive advantage over its 5G competitors, 3 is able to consistently deliver the fastest 5G speeds.

The upcoming Ofcom spectrum auction in early 2021 should offer additional capacity in the 3.6-3.8 GHz range as well as the 700 MHz band, which should enable much wider 5G coverage across the U.K. Devices capable of aggregating low and mid 5G spectrum bands are also expected in the first half of 2021, which should allow operators to efficiently roll out standalone 5G and deliver broader 5G coverage with even faster speeds and ultra low latency.

England has the majority of 5G deployments in the U.K.

The Ookla 5G MapTM showed 5G deployments in 199 cities or towns in the U.K. as of November 4, 2020. 5G was commercially available in 176 English cities, and there were 14 5G cities or towns in Scotland, five in Wales and four in Northern Ireland.

This compares with 29 5G cities in the whole U.K. at this time last year: 22 in England, three each for Scotland and Wales and one in Northern Ireland.

Ookla_UK_5G_Deployment_Map_1120

5G coverage varies by operator

Not all operators are deploying 5G cell sites in the same areas. Data from Cell Analytics measures where customers of each operator are accessing 5G and how strong that 5G signal is in each area. The following maps show 5G signal strength greater than -110 dBm for each operator.

Ookla_UK_Coverage_3_1120

Ookla_UK_Coverage_EE_1120-3

Ookla_UK_Coverage_O2_1120-3

Ookla_UK_Coverage_Vodafone_1120-3

Three and EE show larger areas of measured coverage in most parts of the U.K., especially in and around Belfast, Birmingham and London. Vodafone shows a larger area of coverage around Glasgow and Newcastle upon Tyne. O2 shows a much smaller coverage area with clusters in and around Belfast, Leeds and London.

London’s 5G download speed was slower than the national average

London saw a mean download speed over 5G of 167.06 Mbps in Q3 2020, 10.6% slower than that in the U.K. as a whole. London’s median 5G upload speed of 22.92 Mbps was 7.2% faster than that in the U.K as a whole.

Mean 5G Performance in London
Speedtest Intelligence® | Q3 2020
Download (Mbps) Upload (Mbps)
London 167.06 22.92

We’d like to be able to report which country’s capital city had the fastest 5G, but this technology is still emerging and there were not enough samples to responsibly determine a winner outside of London. We will be watching these markets carefully and will report back when there is additional information.

Three was the fastest operator in London

Three showed the fastest mean download speed over 5G among mobile operators in London during Q3 2020. O2 was second, an important distinction as many other data providers do not have sufficient samples to include O2 in their analyses. Vodafone was third and EE fourth.

5G Performance by Operator in London
Speedtest Intelligence® | Q3 2020
Operator Mean Download (Mbps) Mean Upload (Mbps) Top 10% Download (Mbps) Top 10% Upload (Mbps)
3 196.02 18.93 362.46 43.74
O2 181.19 15.55 289.65 24.35
Vodafone 166.77 25.50 288.17 41.42
EE 142.86 26.83 245.73 52.21

We also analyzed the fastest 10% of Speedtest results over 5G for each operator to evaluate what speeds each network is capable of reaching at this time. Three had the fastest download speed in this category by far and EE led for upload speed.

England showed the highest time spent on 5G

Ookla_UK_5G_Time-Spent_Map_1120-3

We calculated the proportion of time that users with 5G-capable devices spent on 5G in the United Kingdom and found that England had the highest 5G Time Spent during Q3 2020 at 5.6%. This was higher than the average 5G Time Spent for the U.K. of 5.3%. Scotland had the second highest 5G Time Spent in the U.K. at 3.0% and Wales was third. As above, we have not included data for Northern Ireland because samples were too few. 5G Time Spent includes time spent on both 5G and 5G roaming.

While the rapid spread of 5G across the U.K. is exciting and speeds are promising, the benefits of 5G are spread unevenly across the nation — and time spent on 5G is still very low. We’ll be excited to see this technology expand and to analyze how 5G improves mobile performance across the U.K.

Ookla retains ownership of this article including all of the intellectual property rights, data, content graphs and analysis. This article may not be quoted, reproduced, distributed or published for any commercial purpose without prior consent. Members of the press and others using the findings in this article for non-commercial purposes are welcome to publicly share and link to report information with attribution to Ookla.

| September 28, 2021

TRAI Attempts to Kick-Start the Indian Fixed Broadband Market


Key takeaways

  • New fixed broadband speed categories of “Basic”, “Fast” and “Super-fast” throw the performance of Indian States under the spotlight.
  • Ookla® Speedtest Intelligence® data shows only 2.5% of current Indian fixed connections fail to meet TRAI’s new 2 Mbps broadband grade.
  • Delhi tops the list for “Super-fast” broadband connections (>300 Mbps), but that equates to a mere 1.5% of its connections; the remaining states fare worse, with Sikkim recording zero.
  • Rajasthan tops the list for “Fast” broadband connections (50 Mbps – 300 Mbps) at 45.9% of connections, while Gujarat and Maharashtra lag far behind with 19.8% and 25.8%, respectively.
  • Rural locations fare worse than urban, but the gap is not as large as expected, with 3.4% of rural connections failing to achieve broadband speeds, versus 2.3% of urban connections.

TRAI redefines broadband in India

TRAI, the Telecom Regulatory Authority of India, recently published a raft of recommendations as part of a “RoadMap to Promote Broadband Connectivity and Enhanced Broadband speed.” These are designed to help achieve the goals of the National Digital Communications Policy (NDCP-2018), which targets universal broadband provision of 50 Mbps, as well as breaking into the top-50 of the ITU’s ICT Development Index, by 2022.

The most prominent of these recommendations targets increased fixed broadband network rollout and adoption. According to TRAI, current broadband penetration levels in India are approximately 55%. Mobile accounts for the lion’s share of this, having grown strongly since the launch of 4G, while the Indian fixed broadband market remains underpenetrated, at approximately 9.1% of Indian households at the end 2020.

The details include a wide range of proposals designed to alleviate network deployment challenges, in particular relating to Right of Way (RoW) permissions, as well as encouraging India’s multitude of cable TV providers to offer broadband services. In addition, TRAI proposed a pilot Direct Benefit Transfer scheme, to subsidize broadband service in rural locations. Beyond these proposals, TRAI also recommended:

  • A change to India’s definition of broadband (for fixed and mobile), increasing from the current 512 Kbps to 2 Mbps from the point-of-presence (POP) of the service provider, to the subscriber
  • New categories of fixed broadband speed beyond this new baseline, including:
    • “Basic” (2-50 Mbps),
    • “Fast” (50-300 Mbps) and
    • “Super-fast” (>300 Mbps)

TRAI’s new speed tiers to drive improved internet performance

New speed tiers align India with ITU’s IDI Index

For TRAI, the introduction of a new minimum speed alongside speed tiers, helps it bring its definition of broadband into the present, while also allowing it to monitor and report on a key plank of the NDCP-2018 — India’s advancement up the ITU’s ICT Development Index (IDI).

Broadband definitions vary widely around the world in terms of throughput , from the original OECD definition of a minimum of 256 Kbps, which is still used in many markets, to markets such as the U.S., where even the current minimum of 25 Mbps download and 3 Mbps upload is no longer considered sufficient. Part of the rationale for TRAI’s recommended increase to the minimum download speed is that the 512 Kbps threshold introduced in 2013 can no longer handle even basic internet use cases. This has been thrown into sharp relief by the pandemic, which forced an unprecedented number of people to learn and work from home. In effect, traffic inflation has raised the minimum download speed for basic internet services in TRAI’s estimation to 2 Mbps. Furthermore, the introduction of speed tiers will allow Indian broadband performance to be linked to a new indicator the ITU has introduced within its ICT Development Index (IDI), in which the Indian Government is targeting a top-50 place by 2022.

Vast majority of fixed broadband connections already meet the new minimum speed threshold

Speedtest uses the Speedtest Server Network™, a global network of high-performance servers, ready to test the maximum sustained throughput of the user’s connection (download and upload speeds) and report back on key network health metrics. There are Speedtest servers in virtually every country and major population center worldwide, which means we can accurately reflect the service provided from the operator’s POP to the end-user. Our data shows only 0.5% of Indian fixed subscribers did not have access to broadband speeds under the old definition. The new definition doesn’t shift the needle much, increasing that underserved proportion of subscribers to 2.5% as of Q2 2021.

ookla_consumer-percentage_india_0921-01

The natural conclusion from the above chart is that TRAI should consider a higher speed threshold for its definition of broadband. When the United States Federal Communications Commission (F.C.C.) changed their definition of broadband in 2015, the proportion of U.S. households without access to broadband speeds hit 20%. However, with fixed broadband penetration in India below 10% of households, TRAI’s new definition serves as a marker in the sand, designed to track performance as the fixed broadband market begins to unlock.

Much emphasis is placed on the myriad of cable TV providers already present in the market, with TRAI’s recommendation on AGR fees, alongside other remedies, designed to encourage them to branch out and provide broadband to their customer bases. However, as detailed in TRAI’s submission to the DoT, many of these cable companies are sub-scale and rely on out-dated network infrastructure. If and when they start signing up internet customers, we may well see the proportion of users that fall below the broadband definition increase.

Wide variation in performance among Indian states

Access to India’s new broadband speed categories varies widely from state to state. The new minimum threshold for broadband only renders an additional 2% of households without access to broadband speeds, however this is skewed by India’s more populous states and cities. At a state/union territory level, this value varies from a low of 1.6% in Delhi, to a high of 7.6% in the largely rural State of Sikkim. This split continues when we look at the new broadband speed categories, with over 70% of connections in the States of Gujarat and Maharashtra falling into the “Basic” speed category, while almost half of connections in the States of Delhi, Rajasthan, Tamil Nadu, Chandigarh and Kamataka were at least “Fast” (>50 Mbps). The availability of “Super-fast” broadband in India is very low, ranging from a high of 1.5% of connections in Delhi, to 0% in Sikkim.

ookla_consumer-percentage_india_states_0921-01

Urban-rural performance gap not as wide as expected

Indian fixed broadband penetration remains low and is heavily skewed towards urban areas. While 65.1% of the Indian populace live in rural areas (based on World Bank estimates for 2020), TRAI data shows that they account for a mere 5.6% of total fixed broadband connections. A comparison of Speedtest Intelligence data against rural and urban locations (based on India’s 2011 census) fails to show a large disparity between the two when looking at TRAI’s new speed categories, with 58.7% of connections in urban areas falling within the “Basic” speed category, compared to 61.7% in rural areas.

ookla_consumer-percentage_india_urban_0921-01

A more detailed segmentation of performance between rural and urban areas shows a wider performance gap, with rural locations tending to have a higher proportion of connections supporting speeds of less than 25 Mbps, while urban locations had a much higher share of connections with speeds greater than 100 Mbps. This is understandable given the lack of a modern fixed network infrastructure in many parts of rural India, coupled with challenges that the country’s ambitious BharatNet infrastructure project has encountered.

Our data shows that many connections currently sit at the boundary between “Basic” and “Fast” broadband, and this should serve as encouragement to India’s providers to boost fixed network performance and thereby drive mass market adoption of “Fast” broadband.

New speed categories to provide more clarity on network performance to Indian consumers

In addition to driving faster speeds and improved availability of fixed broadband, these changes will bring more clarity for Indian consumers when selecting a fixed broadband subscription. At Ookla, we’re fully aware that reporting on network speeds helps spur network operator competition and infrastructure investment. Introducing speed categories goes one step further, as operators in countries that have implemented this will naturally begin to include these speed categories in their marketing and products. They will also target network investment at increasing the proportion of their footprint that supports higher-tier broadband speeds.

For the Indian government and TRAI, this move will provide much needed visibility into the state of broadband within India, to better track performance and the reach of different access technologies, and to target and tweak remedies and incentives to spur further adoption.

Ookla retains ownership of this article including all of the intellectual property rights, data, content graphs and analysis. This article may not be quoted, reproduced, distributed or published for any commercial purpose without prior consent. Members of the press and others using the findings in this article for non-commercial purposes are welcome to publicly share and link to report information with attribution to Ookla.

| November 30, 2021

5G in Europe: EU Targets Require a Rethink

Monitoring progress of the EU’s Digital Decade

We recently attended the European 5G Observatory’s workshop, “5G in the Digital Decade,” which provided an overview of progress towards the EU’s 5G Action Plan targets and also looked ahead to the new targets as set out in the EU Digital Decade. The European Commission presented its vision of the region’s Digital Decade in March 2021, providing targets (the Digital Compass) for the digital transformation of Member States by 2030. Progress towards these targets is measured through the existing Digital Economy and Society Index (DESI), a key component of which focuses on connectivity. The relevant 2030 goals here are to provide Gigabit access to all EU households and 5G coverage in all populated areas.

The connectivity component of DESI is made up of a mix of demand and supply-side factors, including fixed and mobile broadband coverage and take-up, 5G spectrum availability and broadband pricing. The latest iteration was published in November using 2020 data, with Denmark, the Netherlands and Spain securing the top three spots for connectivity, and Greece and Bulgaria the bottom two.

ookla_desi_eu_markets_1121-01

As 5G evolves, so should the Commission’s 5G targets

The Commission’s DESI has evolved from its inception in 2014 to now track the Digital Compass’ targets. However, 5G is a rapidly evolving technology, and it was clear from the discussion during the Observatory’s workshop that there will be a need to review the actual targets and by implication the measurement criteria. The key concern lies in the “5G everywhere” target, both from a coverage and a performance perspective. As the end goal is the digital transformation of Member States, 5G coverage should be extended beyond the current target of all populated areas, to provide greater geographical coverage — in particular to support emerging vertical industry needs, for example in agriculture or logistics.

In terms of 5G performance, the ITU’s IMT-2020 requirements are for a user-experienced data rate of 100 Mbps download and 50 Mbps upload. However, not all 5G networks are created equally. The increasing use of dynamic spectrum sharing (DSS) means that operators can boost 5G coverage and capacity by using existing spectrum formerly dedicated to other generations of mobile technology. As a result, network performance will vary widely based on the bands used. There are also differences in 5G rollout, with initial 5G radio equipment tending to be deployed on existing tower infrastructure, and the coverage of higher capacity C-band spectrum will be limited relative to that of lower frequency bands as result.

ookla_median-download-speeds_europe_1121-01

Divergence between the DESI and end-user internet speed

What’s also interesting are the outliers and how their performance differs from their position within the DESI. Bulgaria (which came second to last in the connectivity portion of the DESI), does lag behind the European average on fixed broadband speeds, but is significantly faster on mobile speeds. Bulgaria’s median mobile download speed of 83.71 Mbps makes it the seventh fastest market globally. The reverse is true for Spain, which came third in the DESI, and where median fixed download speeds of 118.25 Mbps are well above the European average, putting it in 11th place globally, but where mobile speeds of 34.63 Mbps lag well behind the European average, and place it 51st globally. Other examples of divergence between the DESI and actual internet speeds on the ground include markets such as Belgium, Cyprus, Estonia and Lithuania.

To support Member States, the Commission has proposed a “Path to the Digital Decade”, a governance framework which in addition to the development of roadmaps at a Member State level and regular reporting on progress, will also include a framework to address progress shortfalls and support for multi-country projects. Member States have been encouraged to make use of the Recovery and Resilience Facility, an EU-wide fund of EUR 723.8 billion designed to mitigate the impact of the COVID-19 pandemic, from which they are required to devote at least 20% of their allocation to digital projects. As of October 2021, digital investment plans totalled 26% of the fund, of which 11% is dedicated to connectivity. With such significant public funds directed at improving connectivity, and the digital services that it underpins, the Commission must ensure that its targets and measurement methodology keep pace with the evolution of network technologies.

Ookla retains ownership of this article including all of the intellectual property rights, data, content graphs and analysis. This article may not be quoted, reproduced, distributed or published for any commercial purpose without prior consent. Members of the press and others using the findings in this article for non-commercial purposes are welcome to publicly share and link to report information with attribution to Ookla.

| December 12, 2017

The World’s Internet Speeds Increased More than 30% in 2017. Are You Keeping Up?

In a world where business and life are increasingly fast and global, you want to know if your country’s internet is up to speed. In August, we launched Speedtest Global IndexTM to provide you that objective look at internet performance around the world. Knowing what your speeds are and how they compare to your neighbors’ makes for a good story, but what was missing was a benchmark. To provide you that worldwide context, we’re introducing Global Speed, the average internet speed of the world, to the top of the Speedtest Global Index.

You can still use the Speedtest Global Index to see download and upload speeds by country and rank who’s fastest and slowest. Here we’ve paired data about those individual country speeds over the past year with the new global averages call out which countries have improved most over the past year, who’s shown the least improvement and what speeds are like in the world’s most populous countries. Read on to see who’s winning the internet speed race and who has a lot of catching up to do.

The comparisons here are based on Speedtest data from November 2016-November 2017. We used the same monthly threshold for this article that we do for inclusion in the Speedtest Global Index: to be ranked in each category, countries must have at least 670 Speedtest results from unique users on mobile and at least 3,333 for fixed broadband. Although we use the word “country” throughout, you will notice some regions like Hong Kong and Puerto Rico that are large or autonomous enough to call out as separate entities, even though they are not separate countries. Global speeds are a weighted average of all samples from around the world.

Global download speeds are up more than 30% across the board

With a mean global speed of 20.28 Mbps, mobile downloads increased 30.1% over the last 12 months and mobile uploads increased 38.9%. A global average of 40.11 Mbps makes fixed broadband downloads 97.8% faster than mobile and this speed increased 31.6% during the same period. Uploads over fixed broadband showed the smallest increase of 25.9%.

Global Internet Speeds
November 2016 – November 2017
Download: November 2017 Average (Mbps) Download: Year Over Year Increase Upload: November 2017 Average (Mbps) Upload: Year Over Year Increase
Mobile 20.28 30.1% 8.65 38.9%
Fixed 40.11 31.6% 19.96 25.9%

In November 2017, 119 countries boasted a faster mobile download speed than the global average while 134 were slower. On the fixed broadband side, 71 countries and regions beat the global average download speed and 185 were slower. As we reported last week, gigabit Speedtest results are rolling in from across the planet, but their distribution across continents is wildly uneven.

Most improved countries

It was a good year for Laotian mobile speeds. With a 249.5% jump in mobile download speeds, Laos showed the largest improvement in the world. Vietnam came in second with an increase of 188.7% and Trinidad and Tobago was third at 133.1%. All of the countries listed on the table below are to be commended for making mobile internet faster.

Countries with the Largest Improvement
Mobile Download Speed

November 2016 – November 2017
Year Over Year Increase November 2017 Speed (Mbps)
Laos 249.5% 13.77
Vietnam 188.7% 19.54
Trinidad and Tobago 133.1% 11.68
Hong Kong (SAR) 102.6% 35.64
Lebanon 92.3% 24.50
Cyprus 90.2% 26.14
Republic of the Union of Myanmar 81.0% 11.72
Costa Rica 80.9% 7.89
Cambodia 70.5% 14.97
Sudan 68.9% 9.85

The tiny island of Reunion, a region of France off the coast of Africa, saw the largest improvement in download speed over fixed broadband in the world with a gain of 141.5%. Guatemala was second at 116.7% and Ghana third at 82.1%.

Countries with the Largest Improvement
Fixed Broadband Download Speed

November 2016 – November 2017
Year Over Year Increase November 2017 Speed (Mbps)
Reunion 141.5% 62.64
Guatemala 116.7% 12.04
Ghana 82.1% 18.96
Peru 80.1% 16.48
India 76.9% 18.82
Panama 76.6% 28.62
Italy 72.1% 31.58
Libya 67.6% 3.84
Argentina 62.2% 15.49
Kenya 60.9% 15.59

In some countries, notably Libya, a small gain in megabits per second (Mbps) can result in a large percentage increase. Although the actual performance improvement is small, we’re glad to see speeds moving in the right direction.

Speeds in some countries declined

On the flip side, there were far too many countries and regions where internet speeds decreased. The devastation of Puerto Rico’s mobile infrastructure by Hurricane Maria surely contributed to the island’s 39.8% drop in mobile download speed during the past twelve months. Uzbekistan saw a decline of 31.8% and Côte d’Ivoire 26.1%.

Countries with the Smallest Improvement
Mobile Download Speed

November 2016 – November 2017
Year Over Year Change November 2017 Speed (Mbps)
Puerto Rico -39.8% 8.53
Uzbekistan -31.8% 6.47
Côte d’Ivoire -26.1% 10.95
Brunei -23.4% 9.83
Thailand -19.7% 13.38
Iraq -16.8% 3.12
Algeria -10.8% 7.19
Nigeria -8.4% 9.90
Bangladesh -7.4% 4.97
Morocco -6.3% 15.03

Algeria saw the largest decrease in download speed over fixed broadband speed in the world at 23.9%. Dips of 9.1% in Ecuador and 6.5% in Latvia were less troubling but still moving in the wrong direction.

Countries with the Smallest Improvement
Fixed Broadband Download Speed

November 2016 – November 2017
Year Over Year Change November 2017 Speed (Mbps)
Algeria -23.9% 3.76
Ecuador -9.1% 10.40
Latvia -6.5% 47.25
Tunisia -3.2% 6.90
Iraq -1.1% 7.87
Syria -0.3% 7.12
Taiwan 0.5% 42.32
Maldives 1.0% 12.04
Namibia 1.2% 9.74
Jamaica 1.5% 19.11

Performance in the world’s most populous countries

With 57% of the world’s population, any internet performance improvements seen in the world’s ten most populous countries have a wide reach. Pakistan came out on top of the world’s largest countries with a 56.2% jump in mobile download speed during the past 12 months. India came in second in this category at 42.4% and Brazil third at 27.6% .

World’s Most Populous Countries
Improvement in Mobile Downloads

November 2016 – November 2017
Year Over Year Change November 2017 Speed (Mbps)
Pakistan 56.2% 13.08
India 42.4% 8.80
Brazil 27.6% 16.25
Japan 23.5% 21.67
United States 22.0% 26.32
Russia 19.2% 15.80
Indonesia 18.1% 9.73
China 3.3% 31.22
Bangladesh -7.4% 4.97
Nigeria -8.4% 9.90

At the other end of the spectrum, Nigeria’s mobile download speed actually dropped 8.4% and Bangladesh’s dipped 7.4%. China showed only a modest 3.3% increase in mobile download speed in 2017.

On the fixed broadband side, India came out on top of the world’s most populous countries for improvements to download speed during the past 12 months with an increase of 76.9%, beating China’s second place 42.3% increase and a 37.3% gain in the U.S.

World’s Most Populous Countries
Improvement in Fixed Broadband Downloads

November 2016 – November 2017
Year Over Year Change November 2017 Speed (Mbps)
India 76.9% 18.82
China 42.3% 61.24
United States 37.3% 75.94
Japan 20.7% 73.51
Indonesia 18.9% 13.38
Brazil 18.5% 17.80
Pakistan 15.5% 6.13
Russia 14.6% 36.90
Bangladesh 13.7% 16.14
Nigeria 3.8% 9.53

Nigeria again came out at the bottom of the world’s largest countries, this time with a 3.8% increase in download speed over fixed broadband.

We’ll revisit global internet speeds periodically here on our blog, but you can keep up to date on the latest trends in worldwide internet speeds by visiting the Speedtest Global Index. It’s updated every month with individual country data and, now, global averages. Keep track of your country’s performance and see how you rank against the world.

Ookla retains ownership of this article including all of the intellectual property rights, data, content graphs and analysis. This article may not be quoted, reproduced, distributed or published for any commercial purpose without prior consent. Members of the press and others using the findings in this article for non-commercial purposes are welcome to publicly share and link to report information with attribution to Ookla.

| December 12, 2021

UAE Extends its Lead as the Fastest Mobile Market on Earth


Consumer and business confidence returning to the UAE

The United Arab Emirates (UAE) economy showed strong signs of recovery in Q3 2021, with Dubai’s Consumer Confidence Index reaching its highest level since 2011 according to the Dubai Department of Economic Development. Stimulus measures and an accelerated vaccine campaign have played a crucial role in this recovery. IHS Markit UAE Purchasing Managers’ Index (PMI) for October returned the highest Index score since the start of the pandemic, with panelists pointing to the re-opening of the economy and in particular the launch of Expo 2020 in driving increased sales and investment.

With the economy reopening, national mobile operators Etisalat and du have reported increases in data consumption, in wholesale revenues and in the demand for 5G handsets. The UAE continues to occupy the number one position in Ookla’s Speedtest Global Index for October 2021 with a median mobile download speed of 127.81 Mbps, with Etisalat continuing to lead the market with a median download speed of 130.69 Mbps in Q3 2021.

ookla_performance_uae_1221-01

Etisalat retains its position as fastest 5G operator

Etisalat and du have focused heavily on driving further rollout and densification of their 5G networks over the past year. Despite strong competition from rival du, Etisalat remains the fastest operator for 5G, and the fastest operator overall within the UAE according to Ookla Speedtest Intelligence® data for Q3 2021, with its median 5G download speed of 416.30 Mbps faster than du’s 399.90 Mbps.

ookla_5g-network-performance_uae_1221-01

The Telecommunications and Digital Government Regulatory Authority (TDRA) of the UAE has targeted 5G coverage of all inhabited areas of the country by the end of 2025. To support this, the TDRA announced in June 2021 that 2G networks will be sunsetted by the end of 2022, with the spectrum refarmed for 5G use. Until universal 5G coverage is available in the UAE, LTE will continue to play an important role in providing broader coverage, but also support for older/non-5G devices. These still represent a majority within the market, and Speedtest Intelligence data shows that 62.3% of total tests run during Q3 2021 utilized non-5G networks, with the vast majority of those running over LTE. This is an area where Etisalat pulls well ahead, with its median LTE download speed of 94.54 Mbps in Q3 2021 1.9 times faster than that of its rival.

Qualcomm’s CEO Cristiano Amon recently predicted that the global chip shortage will begin to ease over the coming year, and with both Etisalat and du reporting strong demand for 5G devices, 2022 looks set to be a pivotal year for 5G adoption in the market. Etisalat is already looking to advance its network lead, having recently completed a custom 5G network spanning the Expo 2020 site, covering 4.38 square kilometers with over 8,500 mobile access points and in excess of 700km of fiber optic cable. Etisalat also announced in June 2021 that it is partnering with Ericsson to enable mmW across its 5G network, while du has already trialed the technology, and was the first to launch a mmW 5G base station in February 2020. If the UAE economy continues on its positive trajectory, supported by Expo 2020 which is set to run until the end of March 2022, then we fully expect the strong network competition between these two players to drive median speeds in the market yet higher.

Ookla retains ownership of this article including all of the intellectual property rights, data, content graphs and analysis. This article may not be quoted, reproduced, distributed or published for any commercial purpose without prior consent. Members of the press and others using the findings in this article for non-commercial purposes are welcome to publicly share and link to report information with attribution to Ookla.

| September 22, 2021

The Infrastructure Investment and Jobs Act Could Improve Internet Access for Those Who Need it Most


Investment in broadband infrastructure in the United States is long overdue. The past two years have revealed how critical the internet is to daily life for everyone, and yet far too many people don’t have adequate speeds and service, even in wealthier areas like Loudoun County, Virginia, near Washington, D.C. The bipartisan omnibus infrastructure bill is a once-in-a-generation opportunity to address the digital inequities plaguing our country by connecting millions of Americans with critical services that many of us take for granted.

Ookla strongly supports the passage of the Infrastructure Investment and Jobs Act. As we all look on to see if this bill will successfully pass the United States House of Representatives, we’ve taken a close look at what the bill could mean for internet connectivity in the U.S. and why this bill is essential to bridging the digital divide.

17% of counties do not have access to “adequate” internet speeds

Data from Speedtest Intelligence® shows that 17% of counties with sufficient samples didn’t meet the minimum median speeds for the current FCC definition of broadband (25 Mbps download / 3 Mbps upload) in Q2 2021.

Worse, if you’ve ever tried to have a video call while someone was doing anything else online, you know that a download speed of 25 Mbps will likely result in massive lags for at least one of those users, if you can stay connected at all. That’s why the Senate bill will incentivize network expansion funding for networks offering speeds of 100 Mbps download and 20 Mbps upload or more. While these speeds are a far better benchmark for our modern and evolving lives, 92% of counties with sufficient samples did not meet this new proposed threshold in Q2 2021.

ookla_fcc_minimum_speeds_Counties_0921

The maps above show which counties do meet the current and proposed FCC minimums. While more than 80% of U.S. counties met the FCC’s current broadband minimum in Q2 2021, the counties that don’t are in the places that are already deeply economically disadvantaged — rural areas including Appalachia and the deep South.

The map for proposed speeds shows the less than 10% of counties that met the proposed 100 Mbps download / 20 Mbps upload speed in Q2 2021 were largely in urban areas. We saw other urban counties with high download speeds and some Midwest counties with high upload speeds stand out as having met half the requirement, but those places will need more investment to reach the proposed standard.

Of course, determining where best to direct broadband investment requires a much more granular approach, but examining data aggregated by county is a great way to compare connectivity across the entire country. Some counties shown as having adequate service will have pockets needing investment. For the purpose of this high-level view, should an entire county average throughput speeds below federal broadband definitions, it is assuredly in need of assistance.

What the Infrastructure Investment and Jobs Act does for broadband infrastructure and working to end digital disparity

Our careful review of the Infrastructure Investment and Jobs Act shows the provisions that could specifically put the U.S. on the path to being a global leader in internet connectivity:

  • Increase deployment. The bill currently allocates $42.45 billion for deploying improved internet infrastructure. Each state will receive a minimum of $100 million and U.S. territories split another $100 million. Up to 5% of funds may be used for planning and mapping. This would allow state and local governments to look closely at what areas are unserved or underserved by broadband in their jurisdictions and actually build the infrastructure to connect them.
  • Expand the Emergency Broadband Benefit (EBB). This program, originally funded at $6 billion, currently provides subsidies to low-income households to directly pay for broadband. The bill would devote $14.2 billion to funding $30/month subsidies for those who qualify. The program would be renamed the “Affordable Connectivity Program” and increases in funding would be allowed over time. This would continue to connect some of the most economically vulnerable families to the internet.
  • Fund the Digital Equity Grant Act. $2.75 billion is included to pay for the "State Digital Equity Capacity Grant" and the "Digital Equity Competitive Grant" programs which finance state and nonprofit programs to increase connectivity and improve digital equity.
  • Redefine broadband levels. The bill would formally recategorize “Unserved” locations as those having access to internet slower than 25 Mbps download / 3 Mbps upload. Locations where 80% of people or more lack access to 100 Mbps download / 20 Mbps upload would be labeled “Underserved.” This is critical in acknowledging the level at which most people in the U.S. need access to the internet today.
  • Increase funding to the Tribal Broadband Connectivity Fund. An additional $2 billion would go to building broadband infrastructure to and across tribal lands.
  • Increase funding to the Rural Utilities Service. This program to serve rural communities would receive an additional $2 billion for the Distance Learning, Telemedicine and Broadband Program.
  • Subsidize the Middle Mile Infrastructure Deployment Plan. The bill provides $1 billion for this vital infrastructure that connects individual internet users with the backbone of the internet. At a cost of tens of thousands of dollars per mile, this may not go far enough, but it is a start.
  • Finance Private Activity Bonds. $600 million is written into the bill to back private financing of broadband efforts.
  • Expand the definition of “anchor institutions.” Places like schools, libraries and healthcare facilities have long been considered locations people could go to in order to access broadband when they don’t have access at home. This bill expands that list to include: public safety entities, institution of higher education, public housing and community support organizations. This expanded list of anchor institutions increases the number of places community members can access broadband and the institutions are eligible for funding to provide that broadband.

Failing to invest in broadband infrastructure is failing the future of the U.S. economy

The COVID-19 pandemic revealed how critical adequate internet access is in a modern society as everything from routine medical visits to everyday education and millions of jobs went online. Some of that may shift back to in-person, but we can not and should not forget the disparities in internet access that were revealed during this time. The U.S. often holds itself out as an example for the world and the past year and a half have shown woeful cracks in broadband equity.

If the U.S. House of Representatives fails to pass this bill, they are abandoning millions of Americans to a future of falling behind. Poorly connected towns will fail because businesses that need broadband will go elsewhere. Poorly connected students will fall farther behind their classmates that have quality internet. Poorly connected workers will miss out on high-paying jobs. And poorly connected patients will put additional strain on our healthcare system without telehealth access. From connecting with teachers and co-workers in a video chat to streaming entertainment, access to adequate broadband makes participation in modern life possible.

The U.S. Congress must pass this bill. Whether you believe it is a moral imperative to address the digital inequities in our country as well as throw a lifeline to rural communities, or you simply view this as a strategic opportunity to maintain our position as a global leader, the time to act is now.

Ookla retains ownership of this article including all of the intellectual property rights, data, content graphs and analysis. This article may not be quoted, reproduced, distributed or published for any commercial purpose without prior consent. Members of the press and others using the findings in this article for non-commercial purposes are welcome to publicly share and link to report information with attribution to Ookla.

| March 9, 2021

How to Benchmark and Market Your 5G Network [Webinar]

5G has dominated the news as mobile operators race to provide the fastest service in the most places. Every network provider wants to be the best in their market, however, conflicting 5G claims in news headlines and advertisements have begun to lead to headaches for operators.

The upcoming Ookla® webinar on March 24 will share how you can accurately position your 5G network using claims backed by the industry’s most trusted source for network data — while also building more trust with consumers.


Why legacy data collection methods like drive testing provide biased results for emerging technology

5G is an emerging technology with limited network coverage and limited device penetration. Using drive testing as a tool to back claims about how a customer might experience a 5G network connection is disingenuous, at best. At worst, it can drastically misrepresent the real-world 5G experience available in an area. Drive testing provides only a small sample of data and is often conducted in limited areas — missing places where users are most likely to connect. The artificial conditions created with drive testing don’t reflect real-world consumer experience and can lead to incorrect claims about network speeds.

How to validate a network claim based on test volume, 5G connection detection and throughput capacity

High test volume is critical to get an accurate picture of your 5G speeds. Generally speaking, the higher the test count the greater the statistical accuracy in the claims being made. In addition, not all 5G-capable devices can natively identify 5G when reporting the connection type to applications. Data providers who do not include robust in-app detection with strict filtering criteria are likely to misidentify the technology type of a connection, which in turn shows speeds that do not accurately reflect that network’s actual 5G service capability. In order to reflect the network’s real-world performance, the testing solution must be capable of measuring the full throughput of a user’s connection. Testing solutions that test to remote CDNs, test only in the background, or hide their tests in third-party applications are unable to accurately measure the full capacity of a connection.

The webinar on Wednesday, March 24 at 7 a.m. Pacific (10 p.m. Eastern / 3 p.m. GMT) will show you how to benchmark your network and promote your brand with validated marketing claims. Don’t miss it. A recording will be provided for registrants who can’t tune in to the live presentation.


Ookla retains ownership of this article including all of the intellectual property rights, data, content graphs and analysis. This article may not be quoted, reproduced, distributed or published for any commercial purpose without prior consent. Members of the press and others using the findings in this article for non-commercial purposes are welcome to publicly share and link to report information with attribution to Ookla.

| December 10, 2020

Massive Expansions and Huge Improvements in Speed: The Worldwide Growth of 5G in 2020

The rapid expansion of 5G in countries across the globe was a bright spot in a year that needed one. But just how great is the news? We examined Speedtest Intelligence® data from over 60.5 million Speedtest® results during Q3 2020 to see how much speeds have improved, where download speeds are the fastest at the country and capital level, where 5G deployments have increased and what worldwide 5G coverage looks like now. We also looked at countries where 5G doesn’t yet reach to understand where good news might be on the horizon.

We have only included countries with commercially available 5G on these lists in order to provide a more accurate view of the performance consumers can reasonably expect. While our data shows results for many countries where 5G is not yet commercially available, these tests are likely results from engineers testing their own networks. In addition, we’re only providing analysis for countries with more than 200 samples during Q3 2020. The bars shown in our charts are 95% confidence intervals, which represent the range of values in which the true value is likely to be. Countries marked in tables with an asterisk first launched 5G commercially in 2020.

5G downloads were 954% faster than 4G at the global level

The worldwide median download speed over 5G was 954% faster than that over 4G during Q3 2020. Median upload speed over 5G was 311% faster than that over 4G. Consumers are eagerly adopting the new technology and many have wanted to measure the full throughput capacity of their network connection. In Q3 2020 alone, there were 4,324,788 Speedtest results over 5G.
Median-Speeds-Worldwide_1220-1

United Arab Emirates had the fastest 5G

United Arab Emirates topped the list of countries with the fastest top 10% 5G download speed in Q3 2020. Top 10% (or 90th percentile) measures the speeds seen by the fastest 10% of users and is a way to gauge what each country’s networks are capable of. Saudi Arabia was second for top 10% 5G download speed, Norway third, Spain fourth and Japan fifth.
Fastest-Countries-Top-5G-Download-Speed_1220-2

Another way to measure 5G performance is to look at median 5G download speed, which is a better predictor of the kind of performance most 5G customers can expect. Norway was the country with the fastest median download speed over 5G during Q3 2020. U.A.E. was second in this category, South Africa third, Saudi Arabia fourth and Spain fifth.
Fastest-Countries-Median-5G-Download-Speed_1220-2

It’s notable that Japan was on the list of 10 countries with the fastest top 10% 5G download speed but not on the list of 10 countries with the fastest median download speed over 5G. No matter how fast a country’s mobile infrastructure is, many other factors go into median 5G speeds, including device adoption and spectrum allocation.

Abu Dhabi tops list of 5G speeds in world capitals

Our examination of 5G performance for 18 world capital cities with 5G during Q3 2020 found that Abu Dhabi had the fastest median download speed over 5G at 546.81 Mbps. Riyadh was second, Madrid third, Seoul fourth and Kuwait City fifth. As we saw at the country level, median upload speed was much lower than download speed.
Median-5G-Performance-Capitals_1220-2

How 5G performance and time spent compare within regions

We looked more closely at 5G performance across several intergovernmental organizations and trade blocs to get a better sense of how countries are performing in comparison to their neighbors and trade partners. We also calculated Time Spent on 5G, the proportion of time that users with 5G-capable devices spent on 5G, for each country.

Italy had the fastest 5G among G7 countries, U.S. the slowest

Italy had the fastest median download speed over 5G of all the G7 countries. Japan was second, Canada third, the U.K. fourth and Germany fifth. The U.S. had the highest Time Spent on 5G, followed by Canada. For a deeper analysis of 5G in the U.K., read our previous coverage. Because France launched commercially available 5G only within the last couple of weeks, we have not included it on this table.
5G-Performance-G7-Countries_1220

South Africa was the only country in the African Union with sufficient 5G to rate

As we saw above, South Africa’s impressive median download speed over 5G ranked the country third in the world during Q3 2020. South Africa was only one of two countries in the African Union to have commercially available 5G during Q3 2020. The other, Madagascar, did not have sufficient samples to properly analyze. Time Spent on 5G in South Africa was very low, an indication that 5G is not yet widely available there.
5G-Performance-Africa_1220

South Korea had the fastest 5G in APEC countries, U.S. the slowest

A median download speed over 5G of 411.11 Mbps put South Korea comfortably at the top of Asia-Pacific Economic Cooperation (APEC) countries with the fastest 5G during Q3 2020. Thailand was second, Australia third, China fourth and Taiwan fifth. 5G speeds represented the largest improvement over 4G in the Philippines where the median download speed over 4G during Q3 2020 (9.36 Mbps) was substantially lower than that of other countries on this list.

South Korea and the U.S. tied for highest Time Spent on 5G among APEC countries during Q3 2020, followed by Hong Kong and Taiwan.
5G-Performance-APEC_1220

Spain had the fastest 5G in the E.U., Poland the slowest

Spain showed the fastest median download speed over 5G among the 11 European Union (E.U.) countries with sufficient 5G samples to rank during Q3 2020. Hungary was second, Finland third, Romania fourth and Ireland fifth. Spain’s median download speed over 5G also represented the largest gain over 4G among all of these countries, partially because Spain had the second slowest median download speed over 4G. France is not included on this list because 5G did not become commercially available in the country until after Q3 2020.

The Netherlands had the highest Time Spent on 5G among E.U. countries during Q3 2020, indicating that customers with 5G phones are able to spend far more time on 5G there than in other E.U. countries. Denmark was second for Time Spent on 5G among EU countries in Q3 2020 and Finland third.
5G-Performance-EU_1220

U.A.E had the fastest 5G in Gulf Cooperation Council Countries

With the second fastest median download speed over 5G in the world, U.A.E. was also the Gulf Cooperation Council (GCC) country with the fastest 5G during Q3 2020. Saudi Arabia was second and Qatar third. While Oman does have commercially available 5G, there were insufficient samples in the country during Q3 2020 to properly analyze performance.

5G represented the largest improvement over 4G in Kuwait and Bahrain, countries that had slower median download speeds over 4G than their neighbors.

Time Spent on 5G was relatively high in all the GCC countries on this list, except Bahrain, when compared to other countries in the world during Q3 2020. Qatar showed the highest Time Spent on 5G among GCC countries in Q3 2020 at 16.0%. U.A.E. was second and Saudi Arabia third.
5G-Performance-GCC_1220

Brazil was the only MERCOSUR country with sufficient 5G to rate

Brazil’s median download speed over 5G of 84.60 Mbps during Q3 2020 may not seem fast for 5G, but it still puts Brazil well ahead of other countries in the Southern Common Market (MERCOSUR), most of which do not yet have 5G at all. We did see 5G results in Colombia, but there were insufficient samples to properly compare.

Time Spent on 5G in Brazil during Q3 2020 was not quite one percent, indicating that customers do not have much access to 5G yet.
5G-Performance-MERCOSUR_1220

The U.S., Europe and Asia see widespread 5G coverage

Data from Cell Analytics™ shows a global view of 5G coverage in Q3 2020. This map, based on 5G connectivity data for opted-in Speedtest users, shows that 5G is spreading rapidly across the U.S., Europe, the Arabian Peninsula and Asia. In other regions, 5G is primarily available in larger cities, if at all.
Global-5G-Coverage_1220

99 countries worldwide had 5G, in 14,643 total cities

The number of countries with 5G deployments increased 62.3% between Q3 2019 and Q3 2020, with 99 countries having 5G deployments at the end of Q3 2020, according to the Ookla 5G Map™. There were 14,643 cities worldwide with 5G deployments at the end of Q3 2020, a 1,671% increase over Q3 2019. The total number of deployments worldwide was 17,046. The counts here and throughout this section include commercially available 5G as well as 5G networks with limited availability and those in pre-release.

Countries with the Most 5G Cities
Ookla 5G Map™ | Q3 2020
Country Numbers of Cities with 5G
United States 7,583
Germany 2,312
Austria 1,104
Netherlands* 1,009
Switzerland 554
Thailand* 325
Ireland 214
Puerto Rico 187
United Kingdom 169
Kuwait 97

The U.S. had the most cities with 5G deployments at the end of Q3 2020 with 7,583. Germany was second, Austria third, the Netherlands fourth and Switzerland fifth. A deployment is when a provider has some level of 5G presence in a city. A city can have multiple deployments when more than one provider is present.

Countries with the Largest Growth in Number of Deployments
Ookla 5G Map™ | Q3 2020
Country 5G Deployments as of Q3 2020 % Change Q3 2020 vs Q3 2019
Netherlands* 1,071 50,350%
Thailand* 451 32,401%
United States 7,808 21,566%
Germany 2,417 11,460%
Canada* 93 7,600%
Austria 1,173 4,918%
Ireland 236 4,180%
Poland 81 3,150%
Japan* 75 2,050%
Oman 50 2,000%

The Netherlands showed the largest percentage change in the number of 5G deployments between Q3 2019 and Q3 2020 with a 50,350% jump from two deployments in Q3 2019 to 1,071 in Q3 2020. Thailand saw the second largest percentage increase, the U.S. third, Germany fourth and Canada fifth.

Most early trials and commercial deployments of 5G spectrum allocations around the world have been centered around fallow swaths of the mid-band (3.3 GHz – 4.2 GHz) spectrum. With the recent commercialization of Dynamic Spectrum Sharing (DSS) across all major 5G infrastructure vendors, there is now increasing demand for 5G support on many existing 4G frequencies, ranging from 600 MHz to 2.5 GHz. In unique 5G markets like Japan, there is an additional need for the 4.5 GHz band as well as the millimeter wave (FR2).

In the United States, early deployments leveraged millimeter wave frequency bands in the 28 GHz and the 39 GHz, which delivered impressive speeds in a very constrained footprint. The rapid 5G deployment in the 600 MHz band has added a substantial nationwide 5G footprint — and with that, much wider 5G availability for many more Americans. With the recent merger between T-Mobile and Sprint, the deployment of 2.5 GHz spectrum has been significantly accelerated, which should improve both network efficiency and user experience on T-Mobile’s network. Additionally, next year’s availability of 5G Carrier Aggregation will allow T-Mobile to combine 600 MHz with 2.5 GHz to deliver improved 5G speeds on top of the existing nationwide footprint. In addition, DSS has recently been deployed by AT&T and Verizon, which allows operators to choose from existing low-band spectrum assets (850 MHz) and deliver both LTE and 5G at the same time. This feature alone doesn’t add a significant boost in perceived user experience, but will certainly improve the 5G footprint.

China showed the highest percentage of 5G test samples

Another way to measure 5G adoption is to look at the proportion of samples taken over 5G relative to the total number of samples on all technologies. Speedtest Intelligence is uniquely positioned to measure global growth in 5G because of the worldwide adoption of Speedtest apps. China had the highest percentage of 5G Speedtest results compared to other mobile technology types in Q3 2020 at 18.9%. South Korea was second, Hong Kong third, Puerto Rico fourth and Qatar fifth.

Countries with the Most 5G
Speedtest Intelligence® | Q3 2020
Country 5G Samples as a % of Total
China 18.9%
South Korea 15.8%
Hong Kong (S.A.R.)* 7.9%
Puerto Rico 6.7%
Qatar 5.7%
United States 5.5%
Netherlands* 4.9%
United Arab Emirates 4.6%
Kuwait 4.6%
Australia 4.2%

What 5G will look like in 2021

With recently announced device chipset advancements expected in 2021, including 5G Carrier Aggregation, operators will be able to combine two 5G frequency bands in the sub-6GHz (FR1) range, allowing not only faster speeds, but also greater coverage. More importantly, the ability to combine Frequency Division Duplexing (FDD) and Time Division Duplexing (TDD) FR1 channels will enable operators to leverage low-band frequencies (sub-1GHz) for uplink transmissions (user device to cell site), while combining the low-band with the mid-band (2.5 GHz, 3.5 GHz) on the downlink. This should significantly expand the availability of fast 5G download speeds across larger geographies.

Similarly, DSS — which is a stepping stone to standalone 5G and allows for the simultaneous delivery of 4G and 5G technology on the same spectrum slice — will enable operators to combine already-deployed FDD spectrum with dedicated mid-band spectrum for an enhanced standalone 5G experience. This will unlock the full potential of 5G networks, such as ultra low latency and network slicing, while delivering an improved mobile experience to users.

Where 5G fails to reach

During Q3 2020 Speedtest Intelligence showed 55 countries in the world (with more than 200 samples) where more than 20% of samples were from 2G and 3G connections (combined). These are countries where, in many cases, 5G is still aspirational. As excited as we are about the expansion of 5G, we do not want to see these countries left behind.

Countries That Still Rely Heavily on 2G and 3G Connections
Speedtest Intelligence® | Q3 2020
Country 2G & 3G Samples 4G Samples
Turkmenistan 74.9% 25.1%
Rwanda 52.3% 47.7%
Iraq 49.4% 50.6%
Belarus 46.5% 53.5%
Afghanistan 46.0% 54.0%
Antigua and Barbuda 40.2% 59.8%
Tajikistan 40.2% 59.8%
Suriname 39.7% 60.3%
Haiti 37.7% 62.3%
Syria 37.5% 62.5%
Ghana 36.0% 64.0%
Ethiopia 35.0% 65.0%
Mozambique 34.7% 65.3%
Benin 34.3% 65.7%
Angola 34.1% 65.9%
El Salvador 32.5% 67.5%
Moldova 31.8% 68.2%
Venezuela 30.3% 69.7%
Tanzania 30.0% 70.0%
Papua New Guinea 29.5% 70.5%
Jamaica 29.4% 70.6%
Sudan 29.2% 70.8%
Algeria 29.0% 71.0%
Namibia 28.5% 71.5%
Zimbabwe 28.5% 71.5%
Somalia 28.4% 71.6%
Nicaragua 28.1% 71.9%
Armenia 28.1% 71.9%
Bosnia and Herzegovina 28.1% 71.9%
Uzbekistan 27.8% 72.2%
Cameroon 27.5% 72.5%
Zambia 27.4% 72.6%
Uganda 26.6% 73.4%
Trinidad and Tobago 26.6% 73.4%
Honduras 26.5% 73.5%
Bangladesh 26.3% 73.7%
Burkina Faso 26.0% 74.0%
Ukraine 25.8% 74.2%
Nigeria 25.7% 74.3%
DR Congo 24.6% 75.4%
Costa Rica 24.3% 75.7%
Botswana 24.1% 75.9%
Libya 22.9% 77.1%
Azerbaijan 22.9% 77.1%
Ecuador 22.8% 77.2%
Mali 22.4% 77.6%
Mongolia 21.8% 78.2%
Maldives 21.6% 78.4%
Mauritius 21.3% 78.7%
Tunisia 21.0% 79.0%
Belize 20.7% 79.3%
Laos 20.5% 79.5%
Kenya 20.3% 79.7%
Paraguay 20.1% 79.9%
Côte d’Ivoire 20.0% 80.0%

In markets where 4G layers haven’t been deployed or substantially covered, end users fall back to the circuit-switched network (2G, 3G). These decades-old network technologies should be sufficient for basic voice and texting, social media, and navigation apps, but cannot deliver rich media experiences or video calling. Unfortunately, many countries on this list are places where consumers rely primarily on mobile phones for their internet connectivity.

5G is radically changing the speeds and capabilities of mobile networks around the world. If the current growth rate continues, it won’t be long before most nations have access to 5G. But there are nations and subsets of subscribers who may not see the benefits of 5G for years to come. We will continue reporting on 5G achievements across the globe and watching speeds in general on the Speedtest Global Index™.

Ookla retains ownership of this article including all of the intellectual property rights, data, content graphs and analysis. This article may not be quoted, reproduced, distributed or published for any commercial purpose without prior consent. Members of the press and others using the findings in this article for non-commercial purposes are welcome to publicly share and link to report information with attribution to Ookla.