| May 17, 2023

ISPs Need to Do More to Improve Wi-Fi Performance in the Home

Key messages

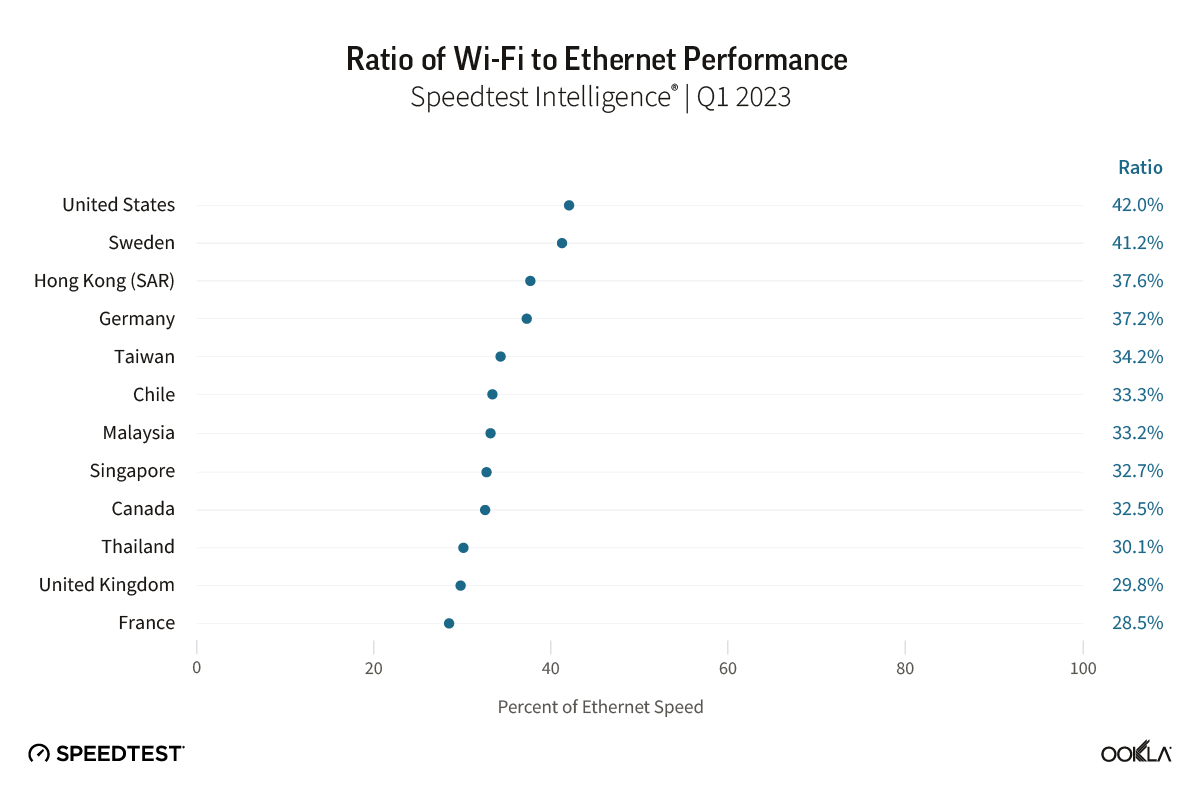
  • Wi-Fi woes continue. Ookla® Speedtest Intelligence® data shows Wi-Fi performance continues to lag behind ethernet performance within home networks in many advanced fixed broadband markets, with Wi-Fi speeds typically ranging from between 30-40% of ethernet speeds during Q1 2023.
  • Developed Asian and North American markets lead the charge to Wi-Fi 6/6E. Wi-Fi 4 and 5 remain the dominant Wi-Fi access technologies globally, accounting for a combined 89% of Speedtest® samples during Q1 2023. However, a number of advanced fixed broadband markets are rapidly migrating to Wi-Fi 6 and 6E, with China, Hong Kong (SAR), Singapore, Canada, and the U.S. leading the charge.
  • Growing Wi-Fi 6/6E adoption helps narrow the gap in Wi-Fi performance. In markets such as Canada, France, Germany, Singapore, Sweden, and the U.S., where the transition to fiber is more advanced, and where ISPs are actively driving adoption of Wi-Fi 6/6E routers, we see Wi-Fi performance closing the gap to ethernet. However, more needs to be done in other markets, where migration to more advanced fixed access networks is exposing the limitations of the installed base of Wi-Fi routers.
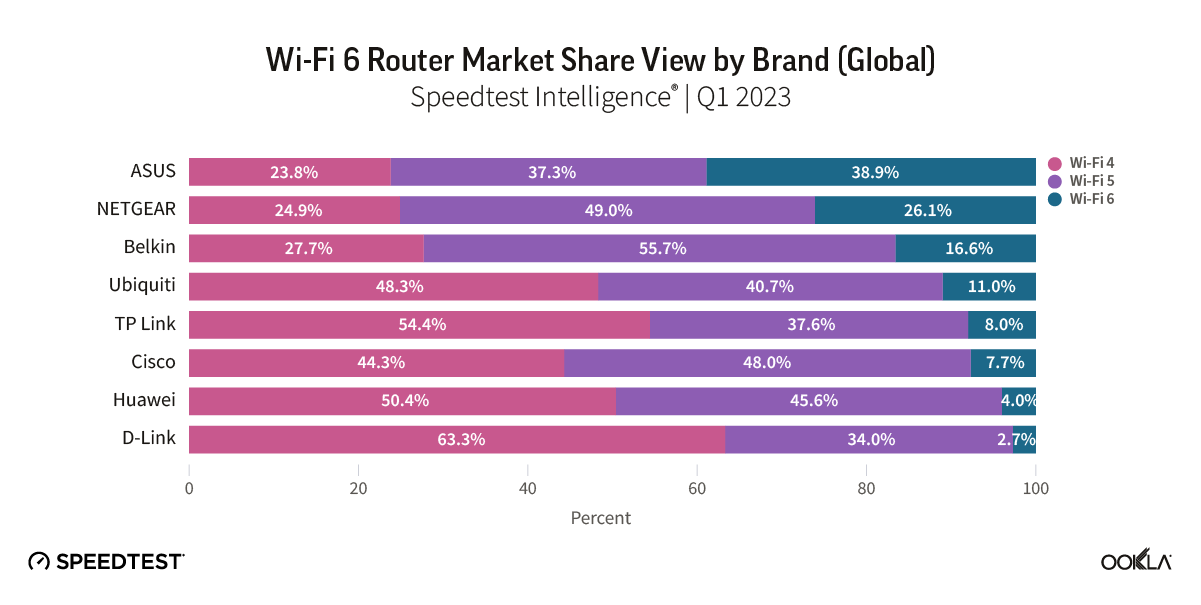
  • Router vendors pushing the envelope with Wi-Fi 7 capable launches. ASUS leads the market for Wi-Fi 6/6E routers among Speedtest samples, and both ASUS and other leading router vendors have been quick to launch Wi-Fi 7 capable routers. Despite this, Wi-Fi 6 and 6E remain the growing component of their installed bases. ASUS leads the market according to Speedtest Intelligence with 39% of its routers we sampled supporting Wi-Fi 6/6E during Q1 2023, well ahead of second placed NETGEAR with 26%.
  • Smartphone device support indicates Wi-Fi 6/6E should remain the immediate focus for ISPs. With the two largest smartphone vendors globally, Samsung and Apple, currently shunning Wi-Fi 7, ISPs waiting to see if they can leapfrog Wi-Fi 6E to Wi-Fi 7 should stay their hands. The fact that China still needs to allocate the 6 GHz spectrum band — key for Wi-Fi 6E and 7 — for unlicensed use is also significant, and appears to have weighed on the Wi-Fi 6E adoption among China’s leading Android smartphone manufacturers.

Wi-Fi performance continues to lag ethernet within the home

ISPs in advanced fixed broadband markets are increasingly looking to offer more advanced Wi-Fi routers and solutions such as mesh networks, which are designed to improve Wi-Fi coverage and performance. However, Speedtest Intelligence data shows that more needs to be done to improve Wi-Fi performance, which typically ranged from between 30-40% of ethernet speeds. Median Wi-Fi performance as measured by Speedtest will tend to lag behind median ethernet performance, depending on distance of the end-user device from the router, including any obstacles and signal interference the Wi-Fi signal needs to traverse to reach the device.

Chart of Ratio of Wi-Fi to Ethernet Performance

Our analysis of Speedtest Intelligence data reveals that driving greater adoption of more advanced Wi-Fi routers can help ISPs narrow the gap between Wi-Fi and ethernet performance, with ISPs in Canada, France, Germany, Singapore, Sweden, and the U.S. already successfully doing so over the past year.

Chart of Closing the Gap on Wi-Fi Performance

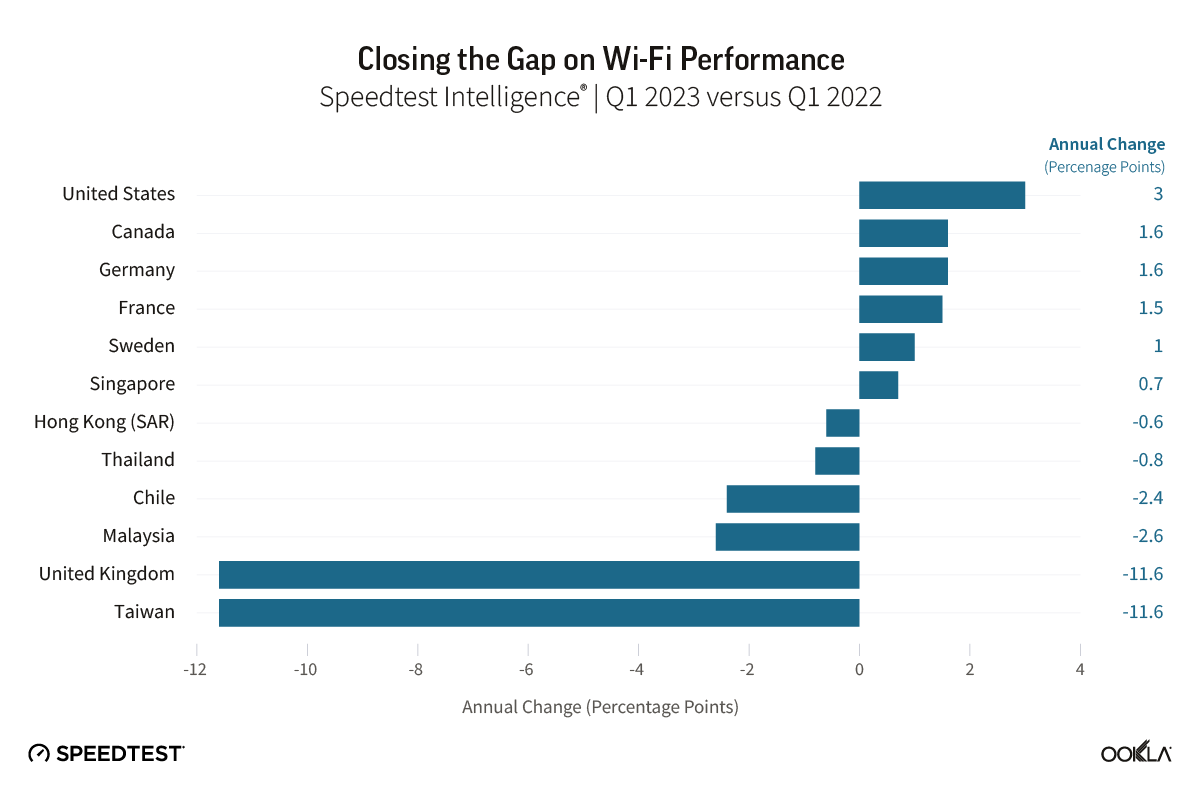
Despite this, the results are not always positive, with the gap between Wi-Fi and ethernet performance widening, in particular in the U.K. and Taiwan. Where markets are rapidly migrating from more legacy fixed broadband technology to advanced cable and fiber connections, Wi-Fi performance can lag relative to ethernet, indicating a need to accelerate the adoption of more advanced Wi-Fi technologies.

Older generations of Wi-Fi 4 and Wi-Fi 5 remain dominant globally

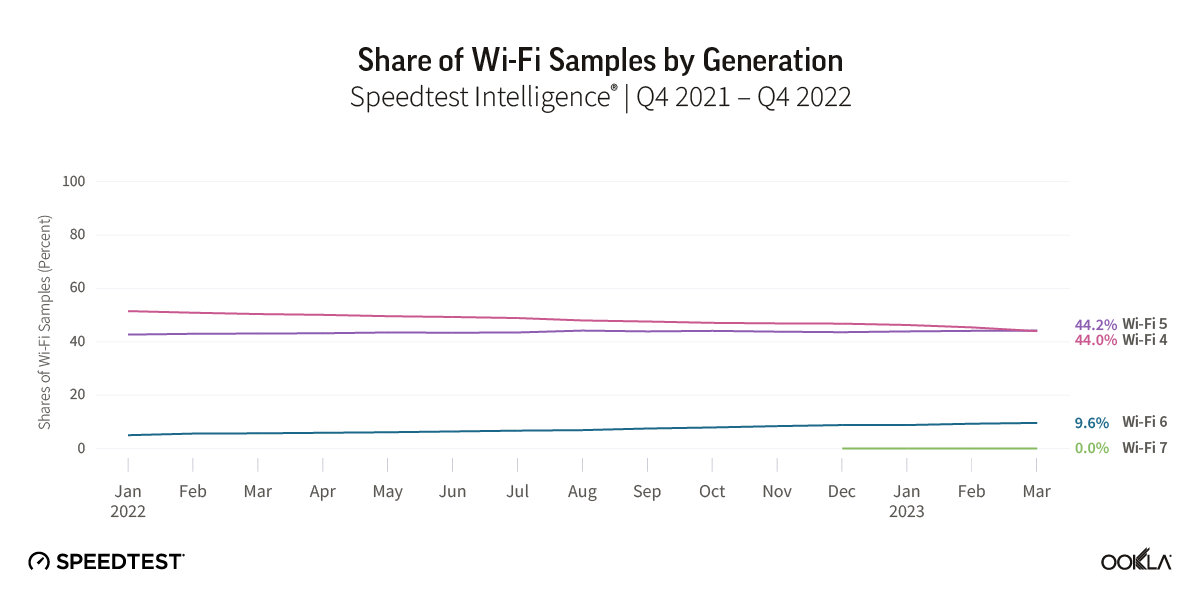
While much of the focus of the device ecosystem is on spurring adoption of the latest Wi-Fi standards, there is a long way to go before even Wi-Fi 6 becomes a dominant standard globally. Based on Speedtest Intelligence data, the proportion of Wi-Fi tests by generation (a good proxy for adoption) shows that Wi-Fi 4 and Wi-Fi 5 remain the dominant router technology, with Wi-Fi 6 representing just under 10% as of February 2023, and Wi-Fi 7 showing very few samples. The share of samples from Wi-Fi 4 routers has fallen by 6 ppts year-over-year, while Wi-Fi 5’s share of samples has marginally increased.

Chart of Share of wi-Fi Samples by Generation

Asian and North American ISPs lead the charge to Wi-Fi 6 and beyond

ISPs are the main driver behind the adoption of new Wi-Fi standards, as highlighted by a 2022 study by Parks Associates, which found that 52% of U.S. consumers acquired their router from their ISP. Rolling out more advanced routers to their customer bases enables them to take advantage of the increased performance of newer generations of Wi-Fi technology, and helps to ensure ISPs deliver faster speeds, particularly over fiber access networks.

Adoption of Wi-Fi 6 varies by market, even among the most developed fixed broadband markets globally. ISPs in a number of advanced fixed markets have already begun offering Wi-Fi 6E routers to their customer bases, with ISPs in North America in particular moving in this direction, including Bell Canada, Rogers, Telus, Verizon, XFINITY, Charter, and Frontier, as well as leading ISPs in advanced Asian and European markets.

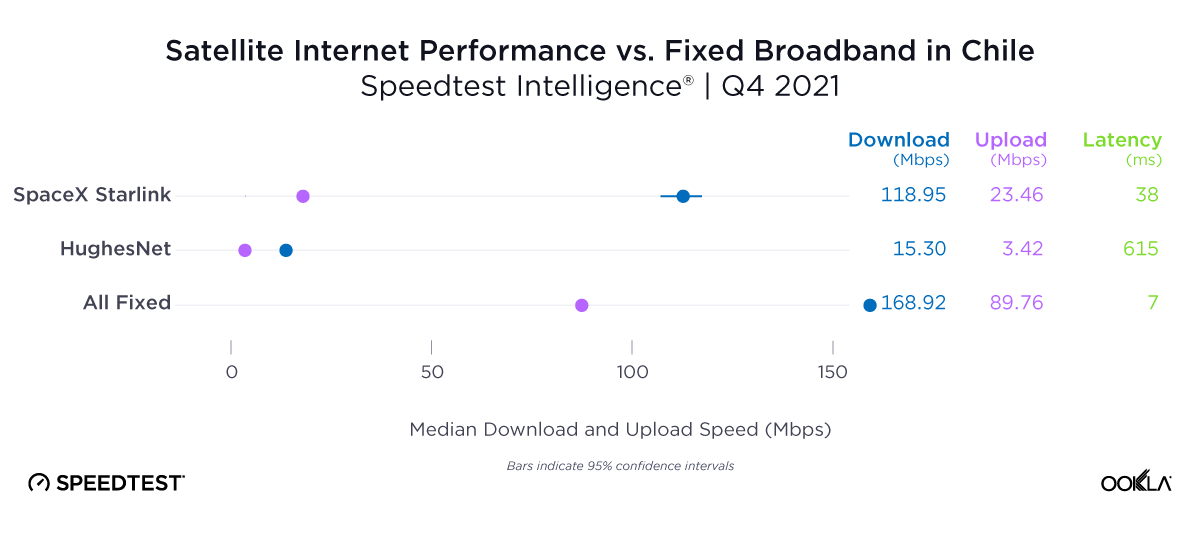
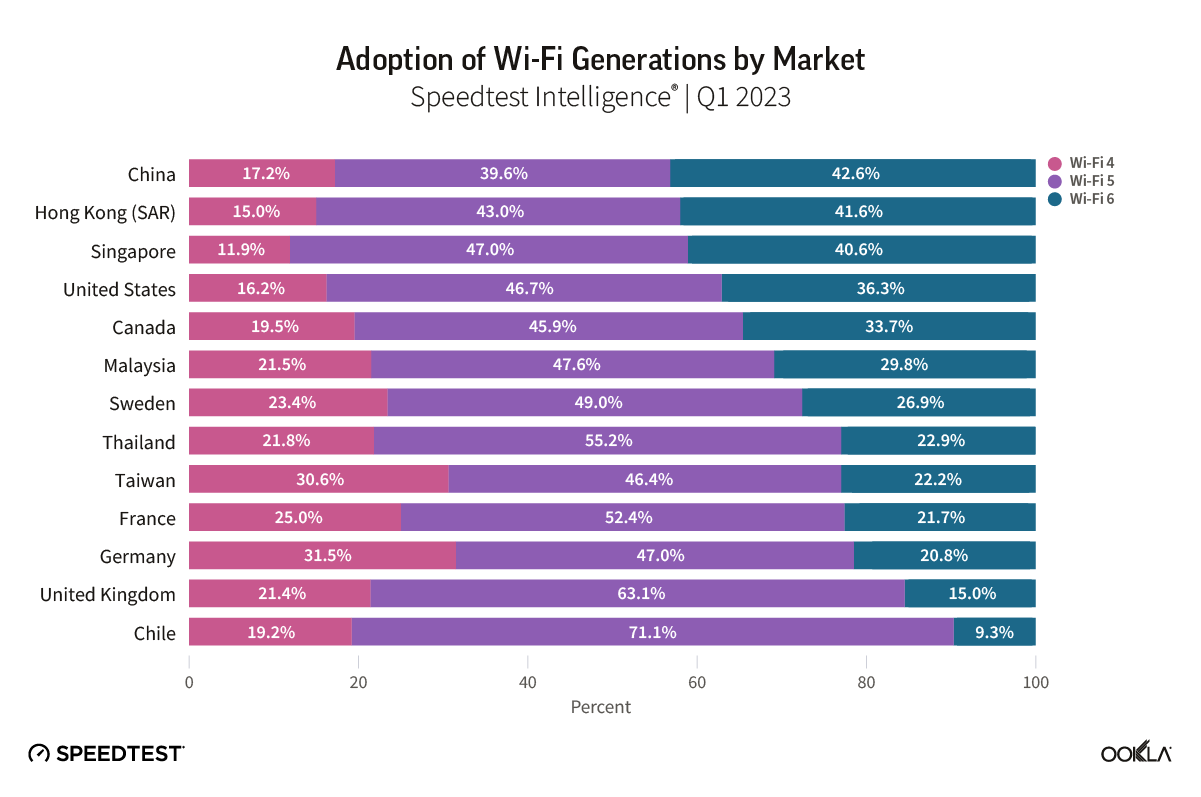
Markets in Asia led the way on Wi-Fi 6 adoption, with China and Hong Kong both recording 42% adoption, followed by Singapore with 37%. Outside of Asia, North America showed the next highest level of adoption, with the U.S. and Canada recording 32% and 30%, respectively. European fixed markets lagged behind, with adoption ranging from 13% in the U.K., to 24% in Sweden. For markets such as Chile, which placed towards the top of the Ookla Speedtest Global Index™ for median fixed broadband speeds, a relatively low-level of Wi-Fi 6 adoption (8% in Q4 2022) signals further opportunity for ISPs in the market to boost performance.

Chart of Adoption of Wi-Fi Generations by Market

The fastest growing markets, in terms of increasing share of Wi-Fi 6 of Speedtest samples year-over-year in Q1 2023, were Canada and Malaysia (+15 ppts), Singapore (+14 ppts), and Hong Kong (+12 ppts). While there was considerable variance between ISPs within each market, leading ISPs such as SmarTone (Hong Kong), DiGi (Malaysia), and ViewQwest (Singapore), are prompting a competitive response so that even ISPs with lower levels of Wi-Fi 6 adoption are prioritizing the technology and seeing adoption grow steadily.

CountryISPWi-Fi 6 %, Q1 2023
Hong Kong (SAR)SmarTone62.4%
CanadaBell pure fibre57.3%
SingaporeViewQwest53.7%
SingaporeMyRepublic50.3%
MalaysiaDigi50.2%
MalaysiaMaxis49.0%
Hong Kong (SAR)NETVIGATOR44.2%
CanadaRogers43.4%
SingaporeM141.7%
SingaporeSingTel41.4%
CanadaTelus PureFibre41.0%
Hong Kong (SAR)HKBN41.0%
CanadaShaw39.0%
SingaporeStarHub35.6%
Hong Kong (SAR)HGC30.0%
MalaysiaTIME28.8%
MalaysiaTM21.5%

In addition to providing newer routers, ISPs are increasingly positioned to help consumers solve Wi-Fi performance issues in the home, such as offering mesh Wi-Fi solutions. For some ISPs, this has even taken precedence over offering newer Wi-Fi 6E routers, as they look to improved coverage within the home as a faster route to improving Wi-Fi performance. 

In the U.K., BT has prioritized whole-home coverage over Wi-Fi 6E with its BT Complete Wi-Fi (mesh) offer, despite the U.K. regulator Ofcom having released the lower portion of the 6 GHz band for unlicensed use in 2020. In Canada, Telus, while having recently released a Wi-Fi 6E router for its broadband users, also offers its WiFi Plus package, which includes professional installation and “wall-to-wall coverage” throughout the home. Rogers also offers guaranteed Wi-Fi coverage throughout the home, as well as Wi-Fi 6E routers. Plume offers a subscription-based service, HomePass, across a number of markets, which allows users to add additional access points to help eradicate not-spots or poor Wi-Fi signal within the home and also offers solutions for ISPs looking to improve their Wi-Fi offerings. In Hong Kong, China Mobile Hong Kong (CMHK) was the first ISP in the market to offer a fiber-to-the-room service, while it and other ISPs such as NETVIGATOR offer consumers the option to subscribe to multiple channels over fiber with separate IP addresses, allowing them to divide their activities across channels and thereby help avoid congestion.

To capture the full performance benefits of Wi-Fi 6E and Wi-Fi 7, countries must allocate 6 GHz spectrum for unlicensed use, therefore allowing Wi-Fi devices to access this higher frequency, higher capacity spectrum, and utilize wider channels. At present, according to the Wi-Fi Alliance, allocation of the lower portion of the 6 GHz spectrum band (5,925 MHz to 6,425 MHz) is common among developed economies, with some notable exceptions in some developed markets in Asia and Asia Pacific, in particular China, while allocation of the full 6 GHz band is more limited, available across North America and some Latin American markets, as well as Saudi Arabia and South Korea.

Wi-Fi 7 on the horizon as router vendors continue to push the envelope on performance

Wi-Fi performance continues to scale, and with Wi-Fi 7 routers and smartphones having launched in the second half of 2022, that trend is set to continue. In addition to higher throughput, successive Wi-Fi generations also support lower latency, helping to better support higher quality video streaming, cloud gaming, and future use cases linked to concepts such as the Metaverse and other uses of extended reality (XR).

The major silicon vendors, Broadcom, Qualcomm, and Mediatek, were quick to update their solutions to support the emerging Wi-Fi 7 standard, and hardware vendors have followed suit. Chinese vendor H3C was the first to launch with its H3C Magic BE18000 Wi-Fi 7 router in July 2022, and it has since been followed by other major vendors including tp-link, ASUS, and more recently NETGEAR. However, the prices of early Wi-Fi 7 routers that take advantage of Wi-Fi 7’s range of enhanced performance capabilities will be a barrier to entry for many, with tp-link’s flagship Archer BE900 currently retailing at a cost of $699.99. 

Speedtest Intelligence data shows minimal Wi-Fi 7 adoption as of March 2023, however we are likely to see the same vendors drive Wi-Fi 7 adoption that are currently leading on Wi-Fi 6. Based on global Speedtest Intelligence samples, we see ASUS leading the market in Wi-Fi 6 penetration, with 39% of samples recorded using Wi-Fi 6 compatible routers. NETGEAR and Belkin followed, but for the remaining major router vendors, Wi-Fi 6 penetration currently stands at close to 10% or below. Wi-Fi 6E remains a small but growing subset of Wi-Fi 6 certified devices, currently standing at 7.7% of products based on the latest Wi-Fi Alliance data. Of these, a majority are either routers or smartphones, with an almost even split between the two.

Chart of Wi-Fi 6 Router Market Share view by Brand (Global)

Smartphone support indicates ISPs should focus on Wi-Fi 6E for now

With Samsung releasing its Galaxy S23 range in February 2023 without Wi-Fi 7 support, and Apple’s latest iPhone 14 smartphones limited to Wi-Fi 6, it’s clear that, for now, ISPs should prioritize the rollout of Wi-Fi 6/6E among their customer bases rather than consider leapfrogging to Wi-Fi 7. The Xiaomi Mi13 Pro was the first Wi-Fi 7 capable smartphone to hit the market, launching in December 2022, although it was limited to Wi-Fi 6E initially, requiring a software update to enable Wi-Fi 7. The availability of Wi-Fi 7 supporting Android smartphones will grow through 2023, enabled by SoCs from leading vendor Qualcomm with its flagship Snapdragon 8 Gen 2, and MediaTek with its Dimensity 9200. Apple, on the other hand, lags on the latest Wi-Fi standard support, with the iPhone 14 series featuring Wi-Fi 6, and with its fall 2023 models rumored to be adding Wi-Fi 6E to their feature list.

Chart of Android Smartphone Vendor Installed Base, by Wi-Fi Standard, Global

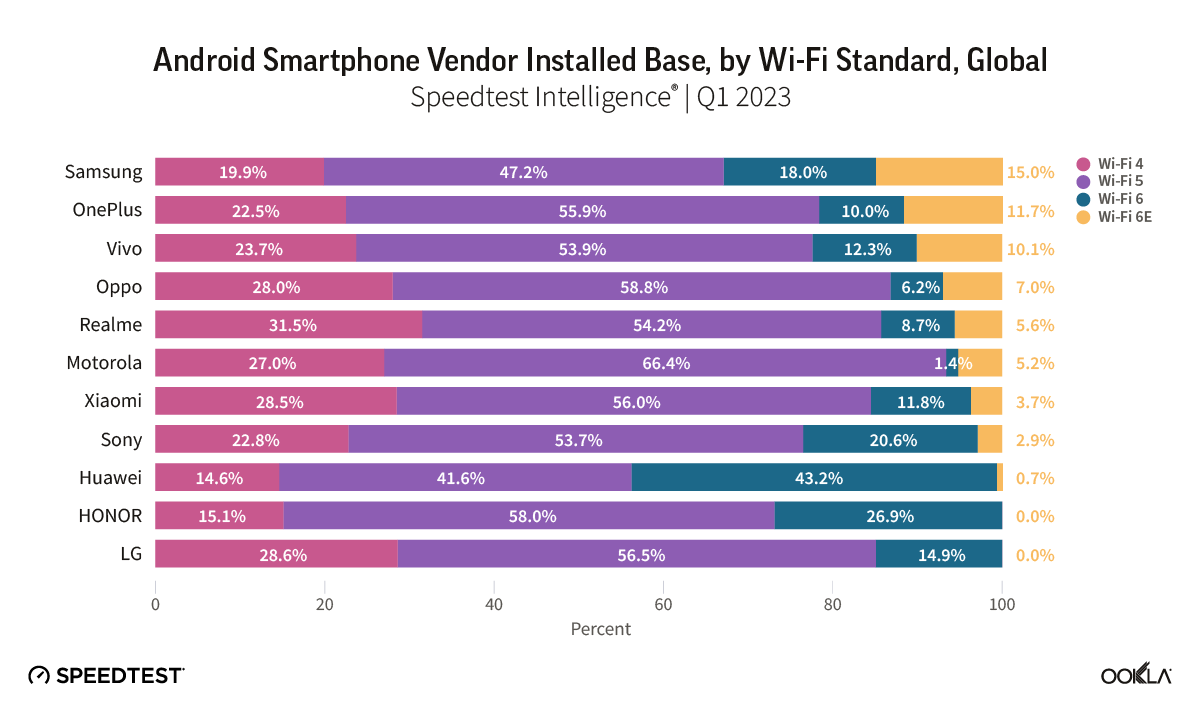
Samsung, as the leading Android smartphone vendor globally, has the largest installed base of smartphones supporting Wi-Fi 6 and Wi-Fi 6E, and has stolen a march on its main rivals Xiaomi, OPPO, and Vivo. While the major Chinese smartphone vendors have launched Wi-Fi 7 compatible devices, the lack of assignment of 6 GHz spectrum for unlicensed use in China does appear to have held them back relative to brands such as Samsung and ASUS.

The outlook for Wi-Fi in the home

It’s clear from the gap between Wi-Fi and ethernet performance that ISPs need to do more to improve the customer experience for Wi-Fi users within the home. Part of the solution lies in rolling out more advanced generations of Wi-Fi technology, given Wi-Fi 4 and 5 remain the dominant technologies deployed globally. However, evidence linking increased adoption of Wi-Fi 6 to overall Wi-Fi closing the gap to ethernet performance is mixed, and validates the approach of ISPs looking to also offer mesh networking Wi-Fi solutions. Contact us to find out more about how Ookla Research can help you monitor the performance of your networks, and stay ahead of the competition.

Ookla retains ownership of this article including all of the intellectual property rights, data, content graphs and analysis. This article may not be quoted, reproduced, distributed or published for any commercial purpose without prior consent. Members of the press and others using the findings in this article for non-commercial purposes are welcome to publicly share and link to report information with attribution to Ookla.

| February 8, 2023

Latency is the Next Frontier of Consumer Experience. Are You Ready?

Internet service providers and mobile operators have spent decades optimizing their networks to provide the best speeds possible so consumers can achieve seamless connected experiences. However, the internet and how we use it is changing; bandwidth is no longer all that matters for networks operators to deliver on the possibilities that a connected world can offer. While latency has always affected connectivity, latency and responsiveness metrics have become increasingly critical to network operators focused on delivering a superior connected experience and supporting evolving consumer use cases. Read on to learn why latency matters to quality of experience, why you need to consider latency now, and how Ookla® can help you measure what matters most.

Bandwidth is now an economics problem, latency is the new opportunity horizon.

Why latency matters

A 2009 study detailed that every 100 ms of additional latency on Amazon.com, cost the company 1% of revenue. While speed has always been the focus for optimization, since the end user delay was caused by the delay of downloading data assets, now that bandwidth has increased for many people around the globe, the bottleneck for these folks is the time delay between two systems communicating.

Latency is the bidirectional roundtrip time between two endpoints.

Latency matters for every online experience. While best known for gaming, video conferencing, and streaming video, the underlying internet protocols powering modern experiences rely on bidirectional communication to negotiate encryption keys, determine routing paths, and request resources. As a result, the typical request on the internet requires two to five round trip communications between various entities over different latency sensitive protocols (DNS, TCP, TLS, and QUIC/H3).

animation showing 1 round trip vs 2 for various internet protocols DNS, TCP, TLS, QUIC/H3

On a gigabit connection, 500 ms of additional latency dramatically affects the page load time. It can take 7x to load a full webpage when latency is high, as seen in the example below.

In addition to web browsing, video and voice calling needs a latency below 300 ms to provide an acceptable experience. This is a physiological threshold — below 300 ms — where the human brain can manage the delay and not speak over other parties. Above the 300 ms barrier, it’s difficult to maintain a coherent conversation.

Think back to the Amazon example above: You may not be directly losing money when your customers see a slow page load due to high latency, but you are providing a poor network experience that will result in increased customer service costs and churn. In fact, one study from the University of Massachusetts Amherst and Akamai concluded “…an increase in the startup delay beyond 2 seconds causes viewers to abandon the video. Using regression, we show that an additional increase of the startup delay by 1 second increases the abandonment rate by 5.8%.” Of course, network operators don’t control the full experience here, and things like CDN location can really affect an end user’s experience, but consumers don’t have visibility into that and the more you can optimize the portions you do control, the less negative feedback you’ll receive.

Latency will matter even more in the very near future

The future of the internet is bidirectional where download and upload communication are necessarily performed simultaneously. Whether AR and VR or self-driving vehicles, this will require dramatic improvements in latency.

animation diagram showing the effects of latency on various internet experiences

How Ookla measures latency

Ookla uses three main measures of latency, each of which helps you understand a specific set of issues.

diagram showing three latency measurements, unloaded latency, multiserver latency and loaded latency

Unloaded latency

Unloaded latency is our classic measure of latency, looking at the time it takes for a bidirectional round trip on the last mile of a connection under no load. This is a best case measure of latency.

Multi-server latency

Multi-server latency measures latency to multiple connections and then takes an average. This is a better representation of a customer’s experience as their connection pulls media and other information from a variety of locations around the internet. Poor multi-server latency can show the need for improvement in peering arrangements and transit. This metric tests to on-net and off-net locations.

Loaded latency

Loaded latency measures latency under a large load. We represent both download loaded latency and upload loaded latency and this metric gives an approximation of how a network performs with poor buffer management or if a background app is using a lot of bandwidth.

Global latency today

Given the importance of latency to consumer experience today, it’s clear that there is much room for improvement in latency at a global level. Investments in better latency will make for major improvements in connected experiences overall, including video calling, internet shopping, and other day-to-day internet activities.

Table showing fixed and mobile latency data for various regions across the world

Latency is key to present user experiences, and will be the defining factor for unlocking future connected opportunities. The first step to improving latency on your network is to have the data to make informed decisions. Look forward to future articles where we dive into how to use this data to identify common areas of latency bottlenecks and optimize your network. If you’d like to discuss how our data can help you improve latency on your network, stop by Booth 2i28 in Hall 2 at MWC.

Ookla retains ownership of this article including all of the intellectual property rights, data, content graphs and analysis. This article may not be quoted, reproduced, distributed or published for any commercial purpose without prior consent. Members of the press and others using the findings in this article for non-commercial purposes are welcome to publicly share and link to report information with attribution to Ookla.

| March 19, 2024

Sunsetting Networks in Africa will be Gradual and More Selective Than in Other Regions

We recently examined operators’ plans for sunsetting 2G and 3G networks in the Middle East and North Africa (MENA) and highlighted the benefits and challenges of phasing out legacy networks. In contrast, Sub-Saharan Africa (SSA) is just beginning this journey, with South Africa leading the way compared to other large markets like Nigeria, as it aims to shut down 2G and 3G by 2027. This article examines the factors contributing to slower progress in SSA and suggests how operators might expedite the transition.

Key Takeaways:

  • Sunsetting is not yet a priority for most African operators. The shift from 2G/3G to more advanced technologies will be slower in Africa due to economic, social, and infrastructural factors as well as the strong dependence on existing legacy ecosystems. A gradual approach is recommended to maintain digital inclusiveness in Africa.
  • South Africa is the only country in SSA with an established plan to sunset 2G and 3G networks. Cell Analytics® data shows a large concentration of 2G and 3G users in suburban and rural areas as well as along transportation routes. South Africa plans to decommission these networks by 2027, but most countries, including Nigeria, have not yet set a date. We expect network sunsetting to be in full swing from 2030 onwards.
  • Operators should strike a balance between driving progress and maintaining the inclusivity of their services. African operators should continue to support and potentially expand their legacy networks to ensure continued access to critical communication services for most of the population while investing in the roll-out of 4G and 5G networks.

Network sunsetting could play a key role in addressing the growing demand for data and spectrum in Africa

More operators are contemplating turning off their 2G and/or 3G networks to refarm their existing spectrum and combine it with other bands to enhance 4G and 5G services, promising faster data speeds, lower latency, and enhanced connectivity. At the same time, operators seek to optimize spectrum utilization as it is a scarce and expensive resource. 

Our previous article delved into how decommissioning 2G or 3G networks can boost efficiency, reduce costs, and improve customer satisfaction. We also emphasized the importance of careful planning to minimize service disruption and potential financial and reputational damage.

2G and 3G network sunsetting across Africa is evolving very slowly, with no country on the continent having completed the transition yet. This delay in transitioning to newer network technologies has significant implications on the ability of the population to access high-speed internet which is vital for socio-economic development. It is important to explore the reasons behind the slow progress and identify potential strategies to overcome the challenges associated with sunsetting old networks.

3G remains the most prevalent network technology in SSA, but 4G will overtake it by 2027. The GSMA predicts that 3G’s share of connections will fall below 50% in 2025, while 2G adoption will decline under 10%. 4G connections will almost double between 2022 and 2030 to represent nearly half of the total, overtaking 3G by the end of 2027. Continued network upgrades and better device affordability will drive this surge. While 5G adoption will initially be slow, it is anticipated to gain momentum during the second half of the decade, reaching 17% by 2030. This shift will lead to a fourfold increase in mobile data traffic per smartphone by 2028, a higher rate than any other region, to 19 GB per month.

Network sunsetting is more important in SSA because of limited spectrum availability and the rapid growth in demand for faster-speed data services. As regulators released only a small quantity of spectrum, operators resorted to refarming existing spectrum bands to deploy 4G and 5G services. The low-frequency bands occupied by earlier network technologies are valuable due to their excellent propagation characteristics, making them ideal for fulfilling coverage obligations with 4G and 5G.

Network sunsetting in Africa is hampered by the prevalence of legacy infrastructure and the high cost of migrating customers

Many parts of the continent still heavily rely on legacy technology and will continue to do so in the short-to-medium term. This reliance makes the transition to newer generation networks more challenging and costly. In 2023, 3G represented 55% of mobile connections in SSA and is expected to represent a third of total connections by 2030. 

This shows that many revenue-generating customers are still on legacy networks. Operators are understandably hesitant to risk service disruptions and incur the significant investment and planning required to upgrade the infrastructure, which will make the transition more challenging and lengthier. Besides, 3G was launched less than a decade ago in several countries. In Burundi, Cameroon, Ethiopia, and Liberia, some operators have only introduced 3G services since 2019 or later, meaning the network costs have not yet been fully amortized. 

In the enterprise sector, Africa hosts millions of machine-to-machine (M2M) devices, some of them in difficult-to-reach geographies or embedded in cars and equipment, making replacement or upgrades challenging. For example, South Africa had 11.5 million M2M connections in Q3 2022, according to the Independent Communications Authority of South Africa (ICASA), while Kenya recorded more than 1.5 million M2M connections in Q3 2023.

Despite the expansion of mobile networks in many African countries, coverage gaps persist, posing a connectivity challenge. If operators decide to rush the decommissioning of older networks, they could leave many people losing mobile access, thus widening the digital divide. 2G is particularly suitable for the region’s large rural population because 2G base stations can provide good coverage across large distances. That is why in many African countries, 2G coverage of the population has reached or exceeded 90% while that of 3G and 4G lag behind.

The prevalence of basic and feature phones across the continent is another barrier. Handset compatibility issues with newer technologies and the higher costs of smartphones and data plans represent significant hurdles for low-income populations, complicating the transition process.

Finally, operators may face regulatory challenges when retiring old technologies. Spectrum freed from legacy networks may not be readily available for new networks after the switch-off if it is tied to a specific technology. Repurposing it for modern networks can also be a bureaucratic and time-consuming process.

African operators can adopt different strategies to address challenges that hinder the sunsetting process

The challenges outlined above contribute to the slower rate of network sunsetting in Africa compared to other regions. However, operators can employ various strategies to facilitate the decommissioning process while mitigating the negative impact on revenue and brand.

The decision to sunset one network before another should be informed by market conditions, including the number of customers that use legacy networks, the cost of maintaining their operations, and the dependency of enterprise services on these networks. In either case, it is important to adopt a phased approach to sunsetting, prioritizing areas with higher 4G coverage first, before moving to rural and remote regions. This approach will help to minimize disruption and allow users more time to prepare for the transition.

Operators could encourage subscribers to upgrade to newer devices that support 4G and 5G networks through incentives such as handset trade-in programs or subsidies for low-income individuals. They should couple it with awareness campaigns to educate subscribers about the benefits of newer networks and the steps they need to take to ensure a smooth migration.

Operators should also communicate early about potential service disruptions and the timeline for the switch-off to make the necessary adjustments to their M2M systems. For example, they could offer incentives or subsidies to upgrade to 4G-grade M2M technologies, such as LTE-M, which offer longer usable life, larger operating range, and higher data rates. Offering assistance to enterprises to address any network compatibility and reliability issues during and after the migration is also essential. The regulator should be involved in the discussions around sunset plans as it may require operators to maintain some capacity and coverage for critical IoT infrastructure.

For spectrum reuse, operators should lobby the regulators for technology-neutral licenses, enabling them to use the old spectrum once released. Reducing regulatory constraints and requirements will help to improve network coverage and reduce capital expenditure. A recent GSMA report highlights that countries in Africa that adopted technology-neutral licensing have seen a 30% rise in mobile internet penetration, and a 74% improvement in 4G coverage, in contrast to 24% and 57%, respectively, for countries without such licensing.

Network sunsetting is not yet a priority in Africa given the prevalence of 2G and 3G connections

2G will likely remain important during the rollout of 4G and 5G for years to come because it supports essential consumer services in Africa, including voice, basic information, and mobile money transactions. As 4G provides a much better data experience than 3G, operators will likely consider sunsetting 3G before 2G. We used Speedtest Intelligence’s “Availability” data to get the percentage of users with a service-active device who spend the majority of their time connected to 2G and 3G in Nigeria and South Africa, the two largest markets in Sub-Saharan Africa by revenue. This data is a proxy for the relative penetration of 2G and 3G in these markets. Since customer-initiated Speedtest® measurements require a relatively modern phone, samples reported as 2G or 3G indicate the unavailability of 4G and 5G coverage rather than actual 2G and 3G usage. As such, we rely on this data solely to gauge the relative penetration of 2G and 3G in these markets. 

Speedtest Intelligence® data showed that the 2G/3G share of connections has been trending down in Nigeria and South Africa throughout 2023. By February 2024, 3G penetration in Nigeria was at 7.4% and in South Africa at 4.3%, with 2G penetration significantly lower at 0.7% and 0.4%, respectively. This suggests that more subscribers in Nigeria than in South Africa spend the majority of their time on 2G/3G.

According to the Nigerian Communications Commission (NCC), 67.6% of subscribers used 2G or 3G as of December 2023. ICASA in South Africa does not publish detailed mobile connection technology data. However, we can estimate that 2G/3G subscribers accounted for around 35-40% of total connections in South Africa at the end of 2023 based on Speedtest Intelligence and NCC data. Since South Africa is the most developed mobile market in SSA, the penetration of legacy networks is expected to be much higher in less developed markets.

Chart of Share of2G and 3G Samples of Total in Nigeria
Chart of Share of2G and 3G Samples of Total in South Africa

Network sunsetting is not yet on the table for Nigerian operators

Nigeria’s journey with 5G began in December 2022 with the auctions for 5G licenses using the 3500 MHz spectrum band. MTN and ISP Mafab Communications emerged as winners. Airtel acquired its 5G license about a year later. MTN launched 5G in September 2022, initially in seven cities, expanding to 300 cities by the end of 2023. Despite this, 5G adoption has been limited, with 4G capturing a growing market share and 5G representing just 1.0% of mobile subscribers by the end of 2023.

This is mainly due to limited 5G coverage, device affordability, and customer demand. ITU’s report shows that while 94% and 87% of the population had access to 2G and 3G coverage, respectively, only 6% could access 5G at the end of 2022. Furthermore, 58% of the urban population had a smartphone at the end of 2022, compared to only 32% in rural areas, according to the GSMA.

Call Analytics® identified areas with 2G and 3G concentration between February 2023 and January 2024 in high-population centers, Abuja, Ibadan, and Lagos. The red dots on the map pinpoint customers connected to 2G and 3G because they have SIM cards not provisioned for LTE (including roamers), lack 4G coverage, or use devices incompatible with 4G.

Data shows that mobile operators still heavily rely on 2G and 3G networks to provide connectivity across city centers, suburban regions, rural areas, and along transport routes. With the rising cost of living, people are expected to reduce their data usage and continue using 2G and 3G devices due to budget constraints and increasing mobile phone prices. Notably, Nigeria’s annual inflation rate reached a nearly 30-year high of 28.9% in December 2023 due to currency devaluation, reduction of subsidies, and foreign exchange liberalization. 

The combination of high living expenses and Nigeria’s extensive geography suggests the full transition to modern networks will be slow and gradual while 2G and 3G networks remain in operation for the foreseeable future. This is evidenced by MTN and Airtel’s renewal of their 2100MHz spectrum license in 2022, primarily for 3G uses while progressing with 5G deployment. An operator can choose to repurpose that spectrum for 4G and 5G in the future or use dynamic spectrum sharing to share it between different technologies. 

South Africa plans to turn off 2G and 3G by the end of 2027

Local operators have long awaited the release of new spectrum to enhance 4G services and launch 5G. Faced with this delay, Vodacom and MTN introduced 5G services in May and June 2020 using the emergency spectrum granted by ICASA during COVID-19 and refarming some of their existing spectrum assets on 2G and 3G.

The much-anticipated spectrum auction was finally completed in March 2022 with spectrum bands across 700 MHz, 800 MHz, 2.6 GHz, and 3.5 GHz bands awarded to six operators Cell C, Liquid Intelligent Technologies, MTN, Rain, Telkom, and Vodacom. 

Cell Analytics’ Service Availability maps show that 2G and 3G remain prevalent in suburban and rural areas of major cities like Cape Town, Johannesburg, and Pretoria. While South Africa leads SSA in 4G and 5G penetration, 3G is still widespread and offers a satisfactory experience for basic use cases like checking the news. 2G is less relevant since it supports mainly voice services but occupies a valuable sub-1Ghz spectrum which could be repurposed for more efficient technologies.

In light of this, the Department of Communications and Digital Technologies (DCDT) proposed a plan in 2022 to sunset 2G and 3G networks to free up spectrum for 5G and future technologies. Initially, the plan aimed to shut down 2G and 3G networks by the end of June 2024 and March 2025, respectively. The DCDT subsequently extended the deadlines twice to give more time for the operators to prepare for the transition. The most recent amendment was in February 2024, scheduling the phase-out to begin in June 2025 and conclude by the end of 2027. It will also include new spectrum auctions, likely to take place in 2024

The revised deadline seems to be more practical, but it still needs to be discussed with all the stakeholders to make sure that the end-users and businesses don’t face any challenges during this transition. The DCDT will allow operators to choose which network to switch off first. Based on operators’ current positions on network retirement, 3G will likely be the first to go:

  • Vodacom’s initial plan was to end 3G services before 2G, but their latest stance is less definitive. Their decision will significantly impact Cell C, whose contract customers use Vodacom’s network.
  • Telkom has already shut down most 2G services as they account for less than 1% of its traffic.
  • MTN suggested that 3G should be shut down before 2G, as migrating 2G devices to 4G will take longer than moving from 3G. This presents a challenge as MTN has the highest proportion of 3G samples in South Africa, (according to Speedtest data) at 6.35% in January 2024 compared to 3.4% for Vodacom and 3.3% for Telkom.

A phased approach to retiring networks, with consideration for affordability and coverage, is essential to maintain digital inclusiveness

The sunsetting of 2G and 3G networks is a global trend, led by developed countries. It promises to bring benefits like faster data speeds, improved connectivity, and more efficient spectrum usage. Yet, Sub-Saharan Africa trails in this transition because of the heavy reliance on legacy networks, the cost barrier to the operators and consumers, and the unequal distribution of new network infrastructure, especially in poorer regions. 

2G and 3G networks form the backbone of mobile communications for a large proportion of the population, enabling vital services such as voice and mobile money transactions. Operators thus face the challenge of investing in advanced network rollouts while maintaining and even expanding their legacy networks to ensure everyone has access to communication services. 

Using network analytical tools such as Ookla’s Speedtest Intelligence and Cell Analytics can provide valuable insights to help prepare for network decommissioning. These tools can track the progress of the switch off, and monitor its impact on network and spectrum usage as well as gauge consumer sentiment, ensuring that the transition to 4G and 5G is as smooth and beneficial.

Ookla retains ownership of this article including all of the intellectual property rights, data, content graphs and analysis. This article may not be quoted, reproduced, distributed or published for any commercial purpose without prior consent. Members of the press and others using the findings in this article for non-commercial purposes are welcome to publicly share and link to report information with attribution to Ookla.

| March 16, 2022

Starlink Hits 100+ Mbps Download Speed in 15 Countries During Q4 2021

Fast satellite internet has become increasingly available to more and more people across the globe. It’s already a huge boon to rural communities that might otherwise be too remote for fixed broadband service. Starlink, Viasat, HughesNet, and other satellite providers are all placing big bets on low-earth orbital (LEO) satellite constellations, and Starlink is even introducing a new premium service with speeds expected to be around 150-500 Mbps. It’s a gamble, as Starlink recently learned after losing about 40 satellites to a geomagnetic storm, but it’s a gamble worth making. The European Commission is even planning a multibillion Euro investment to connect the continent to satellite internet. 

We’ve analyzed fresh satellite internet performance data from Q4 2021 including results from seven additional countries to update our ongoing series.

United States: Starlink was the fastest satellite provider during Q4 2021 and speeds increased over Q3 2021

Satellite Internet Performance vs Fixed in USA

U.S. consumers saw mixed satellite performance when comparing Q3 2021 to Q4 2021, while the United States government has been trying to increase satellite internet competition. Starlink’s median download speed increased from 87.25 Mbps during Q3 2021 to 104.97 Mbps in Q4 2021 — an important benchmark that inches Starlink closer to reaching the Rural Digital Opportunity Fund’s (RDOF) baseline of download speeds greater than 100 Mbps. Viasat overtook HughesNet to follow Starlink distantly at 21.81 Mbps (comparable to the 18.75 Mbps we saw in Q3 2021) and HughesNet followed at 20.92 Mbps (19.30 Mbps in Q3 2021). SES, new to our list this quarter, trailed far behind at 2.19 Mbps. For comparison, the median download speed for all fixed broadband providers rose moderately in the U.S. during Q4 2021 from 119.84 Mbps in Q3 2021 to 131.30 Mbps in Q4 2021.

Starlink saw a slight decrease in median upload speed from 13.54 Mbps during Q3 2021 to 12.04 Mbps in Q4 2021, still short of the median upload speed for all fixed broadband, which rose to 19.49 Mbps in Q4 2021 from 18.03 Mbps in Q3 2021. Viasat followed at 2.88 Mbps (2.96 Mbps in Q3 2021), then HughesNet at 2.54 Mbps (2.13 Mbps in Q3 2021), and SES at 1.19 Mbps.

As we’ve seen over the past year, Starlink, which uses only low earth orbit (LEO) satellites, was once again the only satellite internet provider with a median latency anywhere close to fixed broadband in Q4 2021 (40 ms and 14 ms, respectively). SES, Viasat, and HughesNet, which all utilize higher geosynchronous earth orbit (GEO) satellites for now, had much higher median latencies at 613 ms, 627 ms, and 725 ms, respectively.

Starlink performance continues to vary widely at the county level

Median Download Speed for Starlink in Selected US Counties

During Q4 2021, we saw about a 130 Mbps range in performance between the U.S. county with the fastest median download speed over Starlink (Miami Dade County in Florida at 191.08 Mbps) and the county with the slowest median download speed (Columbia County in Oregon at 64.95 Mbps). Even the lower-end speeds were well above the FCC’s baseline performance tier for broadband internet of at least a 25 Mbps download speed.

Satellite internet performance elsewhere in the world

We examined satellite internet performance in countries with an established market share to see how well their speeds compare to local fixed broadband. We’re excited to add analyses on satellite performance in Austria, Ireland, Italy, Mexico, Netherlands, Poland, and Portugal this quarter. We’ve also added Starlink to the list of providers in Chile. With Starlink continuing to launch in additional countries, we’re looking forward to seeing how Starlink performs during Q1 2021.

Australia: Starlink nearly triples fixed broadband download average

Starlink performed well in Australia during Q4 2021 with a median download speed of 141.55 Mbps. The median download speed for all fixed broadband providers was 51.35 Mbps. Starlink’s 14.84 Mbps median upload speed fell behind fixed broadband providers’ 18.01 Mbps. Starlink is a clear alternative to traditional fixed broadband for speeds, however Starlink can’t yet compete for latency, with Starlink showing a median latency of 43 ms vs. 10 ms for all fixed broadband combined.

Austria: Starlink download speed outpaces fixed broadband by more than double

New to our list this quarter, Austrian consumers had fast speeds over Starlink during Q4 2021, achieving faster median download speeds than that of all fixed broadband providers combined at 131.84 Mbps vs. 50.33 Mbps on fixed broadband. Starlink also had a faster median upload speed at 19.91 Mbps vs. 14.34 Mbps on fixed broadband. Starlink trailed fixed broadband on median latency during Q4 2021, 52 ms vs. 13 ms.

Satellite Internet Performance vs Fixed Broadband in Austria

Belgium: Starlink much faster than fixed broadband

Starlink’s median download speed of 155.15 Mbps during Q4 2021 was much faster than the country’s median download for all fixed broadband of 76.94 Mbps. That’s also a large increase from Starlink’s median download speed of 127.46 Mbps in Q3 2021. For median upload speed, Starlink was only slightly slower at 15.15 Mbps than the median fixed broadband upload speed of 18.05 Mbps. However, Starlink’s 45 ms latency was higher than the country’s median latency of 13 ms. Starlink was the only satellite internet provider with adequate samples to analyze in Belgium during Q4 2021. For rural Belgians, Starlink is a strong option.

Satellite Internet Performance vs Fixed Broadband in Belgium

Brazil: Viasat fell further behind as national fixed broadband sped up

Viasat’s median download speed in Brazil dipped slightly from 66.32 Mbps during Q3 2021 to 62.80 Mbps during Q4 2021. This fell further away from the national median for fixed broadband, which sped up to 83.03 Mbps during Q4 2021 (71.50 Mbps in Q3 2021). Viasat’s median upload speed (1.07 Mbps) was much slower than that on fixed broadband (40.76 Mbps), and Viasat’s latency was much higher (610 ms vs 6 ms). With Starlink slated to enter the Brazilian market soon, we’ll be watching these numbers closely to see if additional competition spurs the market.

Satellite Internet Performance vs Fixed Broadband in Brazil

Canada: Starlink performance reaches milestone during Q4 2021

In our last article, Starlink’s median download speed decreased to slower than fixed broadband in Canada during Q3 2021 (84.55 Mbps vs. 90.67 Mbps). But in Q4 2021, Starlink’s median download speed leapt ahead, achieving 106.64 Mbps while median download speed for fixed broadband increased to 96.39 Mbps. Starlink’s median upload speed was slower than fixed broadband (12.82 Mbps vs. 21.66 Mbps) and latency on Starlink was still much higher (55 ms vs. 11 ms). Starlink should be considered a viable option compared to fixed broadband in Canada, especially for rural consumers or those without access to fast fixed broadband options like fiber.

Satellite Internet Performance vs Fixed Broadband in Canada

Starlink faster than overall fixed broadband in nearly every province

Median Download Speed for Starlink in Canadian Provinces

Starlink showed enough samples to analyze performance in all 10 provinces in Canada during Q4 2021 — all of which showed substantial increases in Starlink’s download speed during Q4 2021 compared to Q3 2021. Starlink’s median download speed was faster than the median download for all fixed broadband in seven provinces during Q4 2021: Manitoba (101.66 Mbps vs. 83.06 Mbps), Newfoundland and Labrador (195.30 Mbps vs. 131.58 Mbps), Nova Scotia (143.52 Mbps vs. 121.57 Mbps), Ontario (106.24 Mbps vs. 95.06 Mbps), Prince Edward Island (139.11 Mbps vs. 75.95 Mbps), Quebec (123.50 Mbps vs. 84.50 Mbps), and Saskatchewan (116.24 Mbps vs. 68.43 Mbps).

Download speeds were comparable between Starlink and overall fixed broadband in New Brunswick (130.67 Mbps vs. 132.65 Mbps), and overall fixed broadband was faster than Starlink in Alberta (107.32 Mbps vs. 96.56 Mbps) and British Columbia (130.97 Mbps vs. 94.74 Mbps) — with the latter two provinces having better access to fiber-to-the-home (FTTH).

Chile: Starlink debuts fast speeds, but still much slower than scorching fast fixed broadband

Chilean fixed broadband providers have continued to achieve some of the fastest speeds in the world, recording the fastest speed on the Speedtest Global Index during February 2022, and we were interested to see how Starlink would compete. Starlink reached 118.95 Mbps in Chile during Q4 2021, which was faster than HughesNet (15.30 Mbps) but much slower than Chile’s median download speed for all fixed broadband providers (168.92 Mbps). 

Median upload speeds also showed a wide gap in Chile between satellite and fixed broadband during Q4 2021 (23.46 Mbps for Starlink and 3.42 Mbps for HughesNet vs. 89.76 Mbps on fixed broadband). Fixed broadband was also much faster for latency: 7 ms for fixed broadband vs. 38 ms for Starlink and 615 ms for HughesNet.

Satellite Internet Performance vs Fixed Broadband in Chile

Colombia: HughesNet decreased over download and upload speeds

HughesNet’s median download speed decreased in Q4 2021 to 11.75 Mbps from 12.12 Mbps during Q3 2021, while Colombia’s fixed broadband increased to 54.60 Mbps (46.08 Mbps in Q3 2021). Median upload speed was also slower for HughesNet than fixed broadband (2.88 Mbps vs. 11.86 Mbps), and latency was much higher on HughesNet (717 ms vs. 14 ms).

Satellite Internet Performance vs Fixed Broadband in Colombia

France: Starlink download speed increased, still faster than fixed broadband

Starlink users in France saw a median download speed of 121.21 Mbps in Q4 2021 (up from 102.15 Mbps in Q3 2021). Starlink’s download speed easily beat the country-wide median for fixed broadband of 90.88 Mbps (up from 75.47 Mbps in Q3 2021). Starlink’s upload speed during Q4 2021 was slower than the fixed broadband median (17.20 Mbps vs. 69.49 Mbps), and Starlink’s latency was higher (51 ms vs. 12 ms). Satellite provider SES, on this list for the first time, trailed behind both Starlink and fixed broadband with a 14.88 Mbps download speed, 1.83 Mbps upload speed, and 649 ms latency. Starlink remains an good option for rural French consumers.

Satellite Internet Performance vs Fixed Broadband in France

Germany: Starlink blazes ahead of fixed broadband download speed

Starlink’s median download speed in Germany of 115.58 Mbps was much faster than the fixed broadband median of 65.86 Mbps during Q4 2021 (and Starlink’s Q3 2021 download speed of 95.40 Mbps). Starlink was slightly slower for upload speed than overall fixed broadband (15.17 Mbps vs. 22.40 Mbps) and Starlink showed a higher latency (47 ms) than fixed broadband (14 ms).

Satellite Internet Performance vs Fixed Broadband in Germany

Ireland: Starlink download debuts nearly double that of fixed broadband

Starlink’s debut on our list is noteworthy in Ireland, where it achieved a download speed almost double that of Ireland’s combined fixed broadband average during Q4 2021 (123.51 Mbps vs. 65.89 Mbps). Median upload speeds were almost level, with Starlink recording a median upload speed at 24.35 Mbps vs. 22.63 Mbps for fixed broadband. Starlink lagged for latency at 45 ms vs. 11 ms for fixed broadband. Starlink is a great option for those who are looking for fast speeds in Ireland and can’t get access to fixed broadband.

Satellite Internet Performance vs Fixed Broadband in Ireland

Italy: Starlink dominates against fixed broadband

Starlink enters our list in Italy with a decisive statement during Q4 2021: It achieved a median download speed of 124.39 Mbps, a huge leap ahead of Italy’s fixed broadband average of 49.56 Mbps. Upload speeds were comparable between the two, with Starlink recording a median of 18.90 Mbps to 18.29 on fixed broadband. Starlink had a higher latency at 52 ms vs. 14 ms on fixed broadband. Starlink is an attractive option for fast internet in Italy.

Satellite Internet Performance vs Fixed Broadband in Italy

Mexico: Starlink impresses during Q4 2021 debut

Starlink, which only became commercially available in Mexico during November 2021, made a significant splash during its brief Q4 2021 debut, achieving a median download speed of 141.94 Mbps. That was significantly faster than Viasat (16.34 Mbps), HughesNet (10.63 Mbps), and all fixed broadband providers combined (36.56 Mbps). 

Starlink also outpaced fixed broadband for fastest upload speed (22.32 Mbps vs. 9.53 Mbps). HughesNet and Viasat followed at 3.10 Mbps and 2.06 Mbps, respectively. Starlink was the only satellite provider that came close to fixed broadband median latency, 64 ms to 11 ms. Viasat and HughesNet were distantly behind at 676 ms and 763 ms, respectively. With Starlink making such an impressive entrance into Mexico, we’ll be interested to see if the performance holds up in the coming months.

Satellite Internet Performance vs Fixed Broadband in Mexico

Netherlands: Starlink faster for median download, lagging on upload and latency

The Netherlands, which is new to this list, has some of the fastest median mobile and fixed broadband speeds in the world according to the Speedtest Global Index. We were eager to see how Starlink would perform against this competition. During Q4 2021, Starlink achieved a median download speed of 138.40 Mbps compared to 95.55 Mbps over fixed broadband. Starlink lagged noticeably behind for upload speed at 15.60 Mbps vs. 30.87 Mbps on fixed broadband. Starlink also had a higher latency at 45 ms vs. 11 ms on fixed broadband.

Satellite Internet Performance vs Fixed Broadband in Netherlands

New Zealand: Starlink slowed slightly, still faster than fixed broadband download

Starlink’s Q4 2021 median download speed (116.44 Mbps, down slightly from 120.10 Mbps Mbps in Q3 2021, likely due to increased adoption) was faster than New Zealand’s median fixed broadband download speed (98.61 in Q4 2021, up from 84.98 Mbps in Q3 2021). Starlink was much slower than New Zealand’s median fixed broadband upload speed for Q4 2021 (13.79 Mbps vs. 59.26 Mbps, which was a huge increase from 23.62 Mbps on fixed broadband during Q3 2021). Starlink’s median latency during Q4 2021 was comparable to Q3 2021 (79 ms vs. 81 ms) which was still much slower than New Zealand’s median for all fixed broadband of 6 ms during Q4 2021.

Satellite Internet Performance vs Fixed Broadband in New Zealand

Poland: Starlink a fast option for Poles

Starlink launched in Poland during September 2021 and is already recording fast speeds. The median download speed for Starlink was much faster than fixed broadband at 129.29 Mbps to 83.88 Mbps during Q4 2021. Upload speed was roughly comparable, with Starlink recording a slightly slower median upload speed of 24.17 Mbps and fixed broadband ahead at 28.60 Mbps. Starlink’s latency was higher at 58 ms to 10 ms on fixed broadband. That’s still acceptable for online gaming, but higher than what’s considered optimal.

Satellite Internet Performance vs Fixed Broadband in Poland

Portugal: Starlink far ahead on download speed in debut, fixed broadband much faster on upload

Another newcomer to this list this quarter, Portugal was a place where Starlink dominated with a much faster median download speed than fixed broadband at 140.35 Mbps to 94.62 Mbps, respectively, during Q4 2021. Upload speed was a different story, with fixed broadband notching a median upload speed of 65.52 Mbps to Starlink’s 30.16 Mbps. Starlink also had a much higher latency than fixed broadband at 44 ms to 7 ms. Starlink remains a good option if you don’t have access to good fixed broadband in Portugal. 

Satellite Internet Performance vs Fixed Broadband in Portugal

United Kingdom: Starlink still nearly twice as fast as fixed broadband median

Starlink showed a faster median download speed in the U.K. (121.94 Mbps in Q4 2021, up from 111.66 Mbps in Q3 2021) than the country’s median for fixed broadband (57.66 Mbps in Q4 2021, up from 53.16 Mbps in Q3 2021). Starlink’s median upload speed (13.96 Mbps) was comparable to the median upload for all fixed broadband in the U.K. (16.84 Mbps), and the latency was relatively fast given the distance traveled (36 ms for Starlink vs. 15 ms for all fixed broadband) — enough to be able to reliably play online multiplayer games. Satellite provider SES trailed far behind during Q4 2021 with a 3.79 Mbps median download speed, 3.74 Mbps median upload, and 636 ms median latency.

Satellite Internet Performance vs Fixed Broadband in United Kingdom

Competition among satellite providers is rapidly increasing and we’ll continue watching closely

We look forward to updating this data again next quarter with new locations as satellite internet continues to become a more viable option for many. If you’re using satellite internet, take a Speedtest® to help us provide an accurate picture of real-world performance.

Editor’s note: The section on Australia was amended on March 24 to remove performance details for Viasat which was determined not to be a consumer offering at this time.

Ookla retains ownership of this article including all of the intellectual property rights, data, content graphs and analysis. This article may not be quoted, reproduced, distributed or published for any commercial purpose without prior consent. Members of the press and others using the findings in this article for non-commercial purposes are welcome to publicly share and link to report information with attribution to Ookla.

| May 8, 2023

New Speedtest Data Shows Starlink Users Love Their Provider

Satellite internet competition is heating up and Ookla® has exciting, fresh data from Q4 2022 and Q1 2023 for HughesNet, SpaceX’s Starlink, and Viasat in North America, South America, and the Caribbean, as well as new Starlink markets we haven’t yet featured in our ongoing satellite internet series

This analysis includes Starlink Net Promoter Score (NPS) for metro and nonmetro internet connections in the United States, year-over-year data for Starlink in Canada, Chile, Mexico, and the U.S., and Starlink results from three new countries (Philippines, Nigeria, and Peru).

Starlink users in metro and nonmetro areas love Starlink, fixed broadband users dislike their internet service providers

Using Speedtest Intelligence®, we examined NPS ratings by Starlink users and all fixed broadband providers combined for “metropolitan” and “nonmetropolitan” counties as defined by the U.S. Office of Management and Budget. NPS based on Speedtest® user responses after being asked how likely they are to recommend their provider to friends or family on a 0 to 10 scale. NPS ratings are categorized into Detractors (score 0-6), Passives (score 7-8), and Promoters (score 9-10), and is calculated as (% Promoters – % Detractors) x 100. Any NPS score above 0 indicates that a provider’s audience is more loyal than not.

Chat of Metropolitan vs. Nonmetropolitan NPS and Performance in the United States

As you see above, the difference in NPS between Starlink and all fixed broadband providers combined is stark: both metro and nonmetro Starlink far outperformed metro and nonmetro ISPs combined for NPS. Metro Starlink had a score of 31.94 compared to -23.62 for all metro fixed broadband providers combined, despite Starlink having a median download speed of 65.29 Mbps compared to 203.93 Mbps for all metro fixed broadband providers combined. Nonmetro Starlink had an even higher NPS at 42.21 compared to nonmetro ISPs at -21.27 — that’s especially notable given that Starlink’s median download speed was much closer to the median nonmetro fixed broadband speed at 72.18 Mbps to 100.41 Mbps. 

Clearly, Starlink provides a much loved option for more rural, nonmetro users who often don’t have many good — if any — internet options. And the message is loud and clear: Starlink users are more than willing to recommend the service and love the internet they are getting.

Starlink speeds increased in Canada and the U.S. over the past two quarters, but are mixed year-over-year

Chart of Starlink Performance in Select Countries in North and South America

As Starlink continues to become an increasingly popular and beloved option for users, especially those in more rural areas, steady increases in speeds in two large markets like Canada and the U.S. bode well for the internet provider. These increases come as major upgrades to Starlink’s satellite array are beginning, with Starlink having just launched 46 nextgen satellites on April 27, so we wouldn’t be surprised if speeds keep climbing across the globe.

In North America, all of the countries we surveyed saw slower median download and upload speeds during Q1 2023 than Q1 2022. However, Canada saw just about a 3 Mbps decrease in download speed from Q1 2022 to Q1 2023, with about a 28 Mbps increase over the past two quarters. The U.S., where Starlink has many more users, saw about a 24 Mbps decrease year-over-year for median download speeds, but at least a 13 Mbps increase during Q4 2022 and Q1 2023. Mexico, which saw 100+ Mbps median download speeds during Q1 2022, saw a roughly 49 Mbps dip year-over-year as more users signed up for the service; however, speeds leveled slightly with only an overall dip of about 8 Mbps during the past two quarters.

In South America, Chilean Starlink speeds slowed about 22 Mbps from Q1 2022 to Q1 2023, however, speeds only slowed about 8 Mbps over the past two quarters. Chile has continually ranked in the top four for fastest fixed broadband speeds on the Speedtest Global Index™ for over a year now. 

Starlink in Canada blazed ahead as the fastest satellite provider in mainland North America

Chart of Satellite vs. Fixed Broadband Internet in North America

Speedtest Intelligence reveals that Starlink in Canada had the fastest download speed among satellite providers in mainland North America at 93.97 Mbps. That was about 40% faster than the runner-up, which was Starlink in the U.S. at 66.59 Mbps. Starlink in Mexico was next at 56.42 Mbps, and was faster than all fixed broadband providers in Mexico combined at 50.46 Mbps. 

Viasat in Canada, Mexico, and the U.S. made noticeable performance leaps over download speed from Q3 2022 when we last measured North American satellite providers. Canada went from 24.36 Mbps in Q3 2022 to 48.24 Mbps in Q1 2023, the U.S. from 28.07 Mbps to 36.47 Mbps, and Mexico from 16.14 Mbps to 24.06 Mbps. Hughesnet trailed over download speed in the U.S. (16.32 Mbps) and in Mexico (12.98 Mbps).

For upload speeds, all satellite providers trailed fixed broadband speeds in their respective countries, with Starlink in Canada achieving the fastest satellite upload speed at 9.60 Mbps, followed by Starlink in Mexico (8.47 Mbps) and the U.S. (7.74 Mbps). Viasat and HughesNet trailed behind.

Multi-server latency showed the stark difference of satellite internet’s real limitations, with the huge distances between satellite and users adding up to longer lag times than fixed broadband. Starlink had the only latencies under 100 ms among satellite providers, with Starlink in the U.S. having the lowest latency at 62 ms, followed by Canada (70 ms) and Mexico (97 ms). Viasat and HughesNet, which have farther geosynchronous orbits (GEO) than Starlink’s low-earth orbit (LEO), had much higher latencies.

Starlink in Chile raced ahead as the fastest satellite provider in South America

Chart of Satellite vs. Fixed Broadband Internet in South America

Starlink in Chile was the fastest satellite provider in South America during Q1 2023, edging out Starlink in Peru by about 5% with a median download speed at 84.62 Mbps to 77.17 Mbps. No satellite provider outperformed all fixed broadband providers combined in Q1 2023, but Starlink in Colombia and Brazil both reached median download speeds above 70 Mbps at 73.51 Mbps and 70.92 Mbps, respectively. HughesNet in Chile broke 20 Mbps at 21.01 Mbps, while Viasat in Brazil only reached 14.41 Mbps.

Satellites were outperformed by fixed broadband over upload speed in South America during Q1 2023, but Starlink had median upload speeds that ranged from 13.90 Mbps to 22.08 Mbps, the fastest being in Peru. HughesNet ranged from 2.12 Mbps to 3.21 Mbps, and Viasat in Brazil was at 1.42 Mbps.

Starlink’s multi-server latency dipped below 60 ms in three South American markets during Q1 2023: Peru (48 ms), Chile (54 ms), and Colombia (55 ms). Brazil followed at 75 ms, which was the next lowest. Viasat and HughesNet trailed far behind.

Starlink in Jamaica was the fastest Caribbean satellite provider

Chart of Satellite vs. Fixed Broadband Internet in the Caribbean

Speedtest Intelligence reveals that Starlink in Jamaica was the fastest satellite provider in the Caribbean at 83.79 Mbps during Q1 2023. Starlink was faster than all fixed broadband providers in Jamaica, and both Starlink and Viasat were faster than all providers combined in the Dominican Republic during Q1 2023. Starlink reached median download speeds of over 50 Mbps during Q1 2023 in Jamaica (83.79 Mbps), Puerto Rico (74.61 Mbps), and the U.S. Virgin Islands (57.08 Mbps), while it fell just short of that benchmark in the Dominican Republic (46.24 Mbps). Viasat had median download speeds of 37.07 Mbps and 33.37 Mbps in Puerto Rico and the Dominican Republic, respectively, during Q1 2023, while HughesNet had a median download speed of 23.74 Mbps in Puerto Rico during Q1 2023.

Upload speeds showed a bit more parity between satellite providers with only Starlink in Jamaica rising above 10 Mbps with a median upload speed of 13.45 Mbps during Q1 2023. Starlink had median upload speeds ranging from 6.65 Mbps to 13.45 Mbps, HughesNet had a median upload speed at 3.78 Mbps in Puerto Rico, and Viasat had upload speeds of 1.02 Mbps and 1.03 Mbps in Puerto Rico and the Dominican Republic, respectively, during Q1 2023. 

For multi-server latency, Caribbean satellite users saw higher multi-server latencies than mainland North and South America with only Starlink in Jamaica breaking under 100 ms. While fast speeds for remote users are always going to be appreciated, multi-server latencies of over 100 ms do make some internet uses much harder to do well like live gaming and video conferencing.

New Q1 2023 Starlink countries show promising initial results

Chart of Satellite vs. Fixed Broadband Internet in Select Countries

Speedtest Intelligence data shows new Starlink data in three countries during Q1 2023, including Nigeria, Peru, and the Philippines, where Starlink is still a nascent provider with limited market share. Median download speeds for new Starlink countries were: 110.78 Mbps in the Philippines, 77.17 Mbps in Peru, and 61.75 Mbps in Nigeria during Q1 2023. 

Starlink had slower upload speeds than all fixed broadband providers combined in all of the new countries except Nigeria, which was too close to call at 11.17 Mbps to 10.70 Mbps. Starlink had a much higher latency than fixed broadband providers in the Philippines (162 ms) in Q1 2023, though it came very close in Nigeria 57 ms to 46 ms. 

It should be noted that satellite constellations have limited network bandwidth capacity, which may affect the consumer experience as more users sign up for the service. Starlink’s reach within these markets will also be limited by the cost of equipment (CPE) in particular, which ranges from PEN 1,750 ($470) in Peru, to PHP 29,320 ($530) in the Philippines and NGN 268,584 ($590) in Nigeria (prices correct at time of publication).

The 2023 space revolution is off to a huge start

Here are some major updates about what’s next for various different satellite competitors:

Amazon’s Project Kuiper showcases low-cost customer satellite terminals

After Amazon’s Project Kuiper 3,236 satellite LEO constellation was greenlit by the FCC, Amazon swiftly moved to showcase its consumer terminals in March. These new terminals have different tiered models, which are promised to deliver 100 Mbps and 400 Mbps models for consumers and businesses, and 1 Gbps models for “enterprise, government, and telecommunications applications that require even more bandwidth.” Furthermore, Amazon is getting into the chipset business and producing their own 5G modem chip, which will feature in each terminal.

Viasat launched its Viasat-3 arrays

On April 30, 2023, Viasat launched the first of three long-awaited Viasat-3 arrays, which aims to provide 1 Terabit per second (Tbps) of network capacity on each satellite, double that of the entire operating fleet. Add two more satellites and Viasat could raise the throughput up to 500-600% of its current network capacity. That could allow its users to experience 100+ Mbps connections — a huge improvement for many consumers. We’ll be eagerly anticipating results in the coming quarters.

Eutelsat, OneWeb, and Intelsat are making big moves

While the merger of Eutelsat and OneWeb has yet to be fully completed, both satellite operators inked major deals with Intelsat to add more global satellite capacity. Furthermore, OneWeb launched an additional 36 LEO satellites into orbit in late March 2023, providing additional options for many of its resellers. 

European Union greenlights multi-orbit constellation

The European Union has approved its multi-orbit, €6 billion constellation plan, which includes GEO, MEO, and LEO arrays, and will offer connectivity to all EU citizens. The project will support EU connectivity priorities including the economy, environment, security and defense, and is hoping to launch in 2024, and be fully operational by 2027.

HughesNet aiming to launch Jupiter 3 array in Q2 2023

Incumbent satellite internet provider HughesNet has revealed its new Jupiter 3 array, which is designed to offer 500 Gbps over Ka-band and will allow HughesNet to provide consumers offerings of 50 Mbps and 100 Mbps. While the array still doesn’t have an official launch, the Jupiter 3 array is “doubling the size of the Hughes JUPITER fleet over North and South America.”

Ookla will continue monitoring new satellite internet developments

As 2023 continues to shape up as a pivotal year for satellite internet providers, we’ll be watching the sky to make sure providers are providing the connectivity consumers need. We’ll continue our series next quarter with Q1 and Q2 2023 data from Asia, Europe, Oceania, and any new countries where Starlink launches, and be back with Africa, North America, and South America data in Q4 2023. In the meantime, be sure to download the Speedtest® app for Windows and Mac computers or for iOS or Android for devices and see how your satellite internet stacks up to our findings.

Editor’s note: This article was updated on May 10 with clarifying details and an updated chart.

Ookla retains ownership of this article including all of the intellectual property rights, data, content graphs and analysis. This article may not be quoted, reproduced, distributed or published for any commercial purpose without prior consent. Members of the press and others using the findings in this article for non-commercial purposes are welcome to publicly share and link to report information with attribution to Ookla.

| September 18, 2023

New Speedtest Data Shows Starlink Performance is Mixed — But That’s a Good Thing

Satellite providers are playing no small part in the rapid expansion of global connectivity. Some experts predict there will be 58,000 satellites orbiting the earth by 2030 — a nearly 725% increase from 2023. Ookla® is back with our ongoing satellite internet series with compelling, fresh data for satellite providers in Africa, Europe, and Oceania during Q2 2023, including SpaceX’s Starlink, Viasat, and Skylogic.

This analysis includes Starlink Net Promoter Score (NPS) data for France, Germany, Italy, New Zealand, and the United Kingdom, year-over-year data for satellite providers in Europe and Oceania from Q2 2022 to Q2 2023, and new Q2 2023 data from Starlink in Africa.

Starlink users across different continents continue to love the service

Using Speedtest Intelligence®, we examined NPS ratings data for Starlink users against an aggregate of all fixed broadband providers combined. 

NPS is based on Speedtest® user responses after being asked how likely they are to recommend their provider to friends or family on a 0 to 10 scale. NPS ratings are categorized into Detractors (score 0-6), Passives (score 7-8), and Promoters (score 9-10), and is calculated as (% Promoters – % Detractors) x 100. Any NPS score above 0 indicates that a provider’s audience is more loyal than not.

Chart of NPS Performance in Select Countries

As you can see from the above image, Starlink users in France, Germany, Italy, New Zealand, and the U.K. had an NPS score much higher than the aggregate score for all fixed broadband providers combined during Q2 2023. France had the highest NPS among the aggregate of fixed broadband providers for the countries we surveyed at -15.98 and fixed broadband providers had a much faster median download speed at 165.37 Mbps to Starlink’s 107.56 Mbps. In New Zealand there was a similar story with the aggregate of fixed broadband providers having a -20.40 NPS to Starlink’s 48.83, while having a faster median download speed 147.86 Mbps to 113.78 Mbps during Q2 2023.

Germany, which had the lowest NPS rating of aggregate of fixed broadband providers in Europe at -30.10, also had the smallest difference in NPS with Starlink scoring 38.19. Interestingly, the aggregate of fixed broadband providers and Starlink both had similar median download speeds at 83.16 Mbps and 82.56 Mbps, respectively, during Q2 2023.

Of note, Starlink had much higher NPS ratings and median download speeds than the aggregate of all fixed providers combined in Italy and the U.K., respectively, during Q2 2023. Starlink’s NPS was 50.20 to -25.61 for the aggregate of all fixed broadband providers in Italy during Q2 2023, while the median download speeds were 100.68 Mbps to 63.99 Mbps. In the U.K., Starlink’s NPS was 47.18 to -26.88 for the aggregate of all fixed broadband providers combined, with the median download speeds a little closer, 100.11 Mbps to 77.38 Mbps, respectively. 

In our last report, we found a wide NPS gap between U.S. rural Starlink users — who often have fewer options for fixed broadband access — and the corresponding aggregate of fixed broadband providers. Given that all five of these countries have rural or remote regions that are underserved or not served by traditional broadband offerings, it may be no surprise that Starlink users who reside in those areas may feel positive about having access to fast broadband internet. 

Starlink speeds over 100 Mbps in 14 European countries during Q2 2023, speeds stabilizing across Europe

Key takeaways:

  • Starlink results were the fastest among satellite providers we surveyed.
  • Starlink quarter-to-quarter speeds improved or remained about the same (between 5% and -5%) in 23 countries, while decreasing in 4 countries.
  • Among the 27 European countries we surveyed, Starlink had median download speeds greater than 100 Mbps in 14 countries, greater than 90 Mbps in 20 countries, and greater than 80 in 24 countries, with only three countries failing to reach 70 Mbps.
  • Skylogic, while delivering speeds slower than Starlink, showed stabilized broadband speeds over the past year for those seeking a Starlink alternative.

Over the past year, we’ve seen huge developments in the global satellite market, Europe notwithstanding, with Amazon’s Project Kuiper moving forward, the EU creating its own satellite constellation, and OneWeb and Eutelsat merging. While Starlink continues to lead for performance among satellite providers we surveyed, Starlink has experienced some major hurdles over the past year as users flock to the service and speeds have subsequently dipped — but of note those concerns seem to have started allaying in most of Europe during Q2 2023.

At first glance, year-over-year median download speeds for Starlink are about the same (-5% to 5%) or better (greater than 5%) from Q2 2022 to Q2 2023 in 15 countries and slower (decreasing more than 5%) in 8 countries. But among the 27 countries we surveyed during Q2 2023, Starlink had speeds faster than the aggregate of all fixed broadband providers combined in 11 countries (Austria, Belgium, Bulgaria, Croatia, Czechia, Estonia, Greece, Ireland, Italy, Latvia, and the U.K.) Those speeds were most notably faster in Croatia and Greece for Starlink at 94.41 Mbps to 45.24 Mbps and 108.97 to 44.09 Mbps, respectively, during Q2 2023. Speeds were about the same in four countries (Finland, Slovenia, Germany, and Lithuania), and speeds were slower than the aggregate of fixed broadband providers in 12 countries, most notably in Poland, Spain, Romania, Denmark, and France which saw between 50% and 105% faster aggregate fixed broadband speeds than Starlink.

Quarterly download speeds stabilizing or improving

Looking at results from Q1 2023 to Q2 2023, median download speeds for Starlink remained about the same (between 5% and -5%) in 23 countries, while decreasing in four countries. That’s a big deal, especially given Starlink had median download speeds greater than 100 Mbps in 14 countries, and greater than 90 Mbps in 20 countries, and greater than 80 in 24 countries — with only three countries failing to reach 70 Mbps.

While trailing Starlink speeds, Skylogic recorded median download speeds in Italy at 29.21 Mbps during Q2 2023, a roughly 27% statistical increase year-over-year from 22.28 Mbps during Q2 2022. Notably, Skylogic recorded a median download speed of 68.44 Mbps in Italy during Q1 2023. Among the various countries we recorded Skylogic data for during the past year, the range of median download speeds varied between 19.53 Mbps and 68.44 Mbps, with most speeds between 28 and 50 Mbps, all fast enough to stream 4K video online. Viasat, had relatively similar download speeds in Germany and Italy at 17.22 Mbps and 17.45 Mbps, respectively, during Q2 2023. 

Top 10 fastest Starlink download speeds in European countries

Chart of Top 10 Fastest Starlink Median Download Speeds in Europe

Starlink in Switzerland had one of the fastest median download speed among countries with Starlink during Q2 2023 at 122.47 Mbps, followed by Denmark (117.38 Mbps), Austria (111.91 Mbps), Belgium (111.20 Mbps), Hungary (108.97 Mbps), France (107.56 Mbps), Ireland (104.42 Mbps), Estonia (102.38 Mbps), Portugal (101.75 Mbps), and Latvia (100.94 Mbps). Sweden, Italy, Bulgaria, and the U.K. all followed but had speeds greater than 100 Mbps.

Upload speeds for Starlink are down year over year, but quarterly speeds almost all improved or were about the same

Upload speeds for Starlink mostly decreased notably year over year, with only the U.K. showing an improved median upload speed in Q2 2023 out of 27 countries surveyed. However, looking quarter to quarter, Q2 2023 upload speeds for Starlink stayed about the same or improved in 25 out of 27 countries, with only Greece and Ireland showing declines. For upload speeds, Starlink all 27 countries we surveyed had upload speeds between 10 Mbps and 15 Mbps except Portugal (17.70 Mbps), Hungary (16.91 Mbps), Croatia (16.12 Mbps), Bulgaria (15.93 Mbps), Romania (15.82 Mbps), Spain (15.79 Mbps), and Poland (9.11 Mbps). Starlink in Greece was the only instance of a satellite provider in Europe having an upload speed greater than the aggregate of all fixed providers combined, 12.97 Mbps for Starlink to 7.85 Mbps for the aggregate of fixed broadband providers combined. Skylogic showed upload speeds lower than 4 Mbps in both Austria and Italy during Q2 2023. Viasat had upload speeds of 3.51 Mbps in Germany and 4.69 Mbps in Italy during Q2 2023. 

Multi-server latency is stabilizing for Starlink users across Europe

As an low-earth orbiting (LEO) satellite internet provider, Starlink has a leg up on some satellite competitors who rely on further away geosynchronous-earth orbit (GEO) and medium-earth orbit (MEO) satellite constellations. However, once again, all the aggregates of all fixed broadband providers in Europe had much lower multi-server latencies than Starlink, Viasat (which had latencies over 600 ms) and Skylogic (which had latencies over 700 ms). That being said, Starlink still saw multi-server latencies under 60 ms in the U.K. (51.26 ms), Spain (53.37 ms), Portugal (55.84 ms), and Belgium (59.34 ms). Starlink saw most countries’ multi-server latencies between 60 and 90 ms.

Starlink speeds stabilize in Oceania

Oceania, the second least densely populated continent in the world to Antarctica, has rural and remote populations that benefit from (and even rely on) satellite internet connections. Luckily for rural and remote Starlink users, they’ve probably seen a good amount of stability over the past year with Q2 2023 median download speeds in New Zealand at 113.78 Mbps (105.99 Mbps in Q2 2022) and Australia at 104.92 Mbps (102.76 Mbps in Q2 2022). Tonga, which is very remote, saw download speeds drop from 45.25 Mbps in Q2 2022 to 37.95 Mbps in Q2 2023. 

Upload speeds also showed some stability with Australia going from 10.45 Mbps in Q2 2022 to 11.33 Mbps during Q2 2023 and New Zealand going from 12.31 Mbps to 14.62 during the same time period. Tonga saw a notable drop in speeds year over year from 19.26 Mbps in Q2 2022 to 6.66 Mbps Q2 2023. 

Multi-server latency, which usually will be higher for satellite internet options, showed promising results for Starlink in Oceania during Q2 2023. Multi-server latency dropped noticeably in New Zealand year over year, going from 89.38 ms in Q2 2022 to 46.42 ms in Q2 2023. Australia saw a more modest drop with multi-server latency going from 63.04 ms to 59.78 ms from Q2 2022 to Q2 2023. Tonga saw an increase in multi-server latency from 125.24 ms to 137.16 ms during the same time period.

Starlink in Africa is off to a promising start

Chart of Satellite Performance in Africa, Q2 2023

Starlink, which first launched on the African continent in Nigeria this past January, is showing intriguing early results. Speedtest Intelligence showed that Starlink in Nigeria had a faster median download speeds than all aggregate fixed broadband providers combined at 63.69 Mbps to 15.60 Mbps during Q2 2023. Upload speeds were more similar during the same time period with Starlink at 13.72 Mbps and the aggregate of all fixed broadband providers combined at 10.60 Mbps. Starlink did have a marginally higher multi-server latency at 55.88 ms to 50.26 ms during Q2 2023.

In Rwanda, median download speeds were a little closer with Starlink recording a median download speed at 63.10 Mbps in Q2 2023 compared to the aggregate of all fixed broadband providers combined at 34.55 Mbps. Starlink trailed behind for median upload speed at 6.88 Mbps to 10.05 Mbps for fixed broadband providers during Q2 2023. Multi-server latency for Starlink was much higher at 320.45 ms to 29.04 ms for fixed broadband providers during the same time period.

The 2023 space revolution is off to a huge start

Here are some major updates about what’s next for various different satellite competitors:

After delays, Amazon’s Project Kuiper aim to launch prototype satellites this fall

Facing a series of rocket-related delays, Amazon recently announced it could send its first two Project Kuiper prototypes into orbit in late September. That news follows a recently announced $120 million 100,000-square-foot satellite processing facility at NASA’s Kennedy Space Center in Florida. Planning on offering internet service in 2025, Amazon is slated to have half of its 3,236 LEO satellite constellation in space by 2026.

China’s grand ambitions to provide internet connectivity to over 362 million people

According to the Wall Street Journal, over 362 million people in China don’t have access to the internet — which is about 1 in every 4 people in China, a large portion of which live in rural or remote communities. In order to overcome that connectivity gap, China is looking to the sky to create its own satellite constellation with potentially over 12,000 satellites. China’s biggest gap seems to be with recreating the success of SpaceX’s reusable rockets — however, initial tests are far underway and a host of reusable rockets are slated for test launches in 2024. 

SpaceX’s Starlink service offerings are about to rapidly expand

While Starlink continues to lead among satellite providers in most areas of the world, their expansion is only starting. Looking at the Starlink availability map, Starlink has an incredibly busy rest of 2023 and 2024 in Africa, Asia, and South America — and they’re marking their intent to expand into most of the world. That comes as Starlink marked launching over 5,000 satellites into space at the end of August. With some wiley entrepreneurs already renting out their Starlink “Dishy McFlatfaces” to vacationers and campers for $25-30 dollars a day, satellite connectivity is truly becoming a full-time gig.

Viasat’s bad luck might affect entire industry

Viasat launched the first of its three long-awaited Viasat-3 arrays — but then their first satellite suffered an antenna anomaly, which prevented a large reflector to deploy that affects whether or not the satellite can operate as intended. While Viasat is rushing to solve the issue, this could ultimately trigger a $420 million insure claim for the loss of the $700 million satellite. With such a high-value loss, this could send ripples through the satellite industry, causing insurance premiums to skyrocket for companies looking to mitigate potential losses through insurance. All of this comes on the heels of acquiring Inmarsat in May for $7.3 billion to expand its satellite arrays and spectrum holdings. We’ll be watching to see whether or not Viasat can find a solution. 

Eutelsat and OneWeb merger imminent, big moves abound

The Eutelsat and OneWeb merger should make competitors take notice — combining satellite networks, expanding enterprise offerings, and competing in emerging markets has big revenue potential — with OneWeb having an already established LEO network of 630 satellites and Eutelsat offering 36 GEO satellites. Of note, OneWeb recently inked a deal with Telstra in Australia to provide satellite backhaul for locations “where satellite backhaul is a preferred or only viable option.” OneWeb is also partnering with the European Space Agency to develop a next-gen 5G beam-hopping satellite, which could quickly increase connectivity for people traveling or for disaster areas that need emergency connectivity. Shareholders are set to vote on approving the merger on Sept. 28.

European Union greenlights multi-orbit constellation

With grand ambitions to launch a multi-orbit, €6 billion constellation in 2024, the European Union is partnering with a consortium of industry players including Airbus, SES, Eutelsat, Hispasat, and Thales to develop the EU’s IRIS² project. The EU still expects to have the first of its satellites go live by the end of 2024 and have a fully operational constellation by 2027.

HughesNet aiming to launch Jupiter 3 array in Q2 2023

HughesNet successfully launched its Jupiter 3 array on July 29, which aims to provide U.S. and Latin America consumers with higher broadband download speeds. While the actual satellite will take some time to reach its geosynchronous orbit and deploy, this satellite adds 500 Gbps of Ka-band capacity for HughesNet, which could see consumers reaching download speeds between 50 Mbps and 100 Mbps. We’ll be eagerly awaiting Speedtest® results from HughesNet’s Jupiter 3 array.

Ookla will continue monitoring new satellite internet developments

2023 continues to be an important year for satellite internet providers. Satellite connectivity is something we’ll be watching closely and we’ll continue our series next quarter with Q3 2023 data from select continents including North America. In the meantime, be sure to download the Speedtest app for Windows and Mac computers or for iOS or Android for devices and see how your satellite internet stacks up to our results.

Ookla retains ownership of this article including all of the intellectual property rights, data, content graphs and analysis. This article may not be quoted, reproduced, distributed or published for any commercial purpose without prior consent. Members of the press and others using the findings in this article for non-commercial purposes are welcome to publicly share and link to report information with attribution to Ookla.

| December 20, 2021

Starlink Expands but Q3 2021 Performance Flattens in Some Areas


Satellite internet is making headlines across the globe as Starlink continues to launch service in new countries and Viasat plans to acquire Inmarsat. We’re here to check in on our ongoing series on satellite internet performance around the globe with fresh data from Q3 2021 to see if Starlink’s performance is holding up and how satellite internet compares to fixed broadband in 12 countries.

United States: Starlink fastest, speeds decreasing

Consumers in the U.S. looking to use satellite service to connect to the internet will find that performance was mostly flat when comparing Q3 2021 to Q2 2021. Starlink’s median download speed decreased from 97.23 Mbps during Q2 2021 to 87.25 Mbps in Q3 2021, which could be a function of adding more customers. HughesNet followed distantly at 19.30 Mbps (comparable to the 19.73 Mbps we saw in Q2 2021) and Viasat third at 18.75 Mbps (18.13 Mbps in Q2 2021). For comparison, the median download speed for all fixed broadband providers in the U.S. during Q3 2021 was 119.84 Mbps (115.22 Mbps in Q2 2021).

ookla_satellite-performance_us_1221-01-1

Starlink’s median upload speed of 13.54 Mbps (down from 13.89 Mbps in Q2 2021) was much closer to that on all fixed broadband (18.03 Mbps in Q3 2021 and 17.18 Mbps in Q2 2021). Viasat and HughesNet followed at 2.96 Mbps (3.38 Mbps in Q2 2021) and 2.54 Mbps (2.43 Mbps in Q2 2021), respectively.
As we saw last quarter, Starlink, which uses low earth orbit (LEO) satellites, was the only satellite internet provider with a median latency anywhere near that seen on fixed broadband in Q3 2021 (44 ms and 15 ms, respectively). Viasat and HughesNet, which both utilize higher “geosynchronous” orbits, had median latencies of 629 ms and 744 ms, respectively.

Starlink performance varies at the county level

We saw sufficient samples during Q3 2021 to analyze Starlink performance in 304 counties in the U.S. While there was about a 100 Mbps range in performance between the county with the fastest median download speed (Santa Fe County, New Mexico at 146.58 Mbps) and the county with the slowest median download speed (Drummond Township, Michigan at 46.63 Mbps), even the lower-end speeds are well above the FCC’s Baseline performance tier of at least a 25 Mbps download speed.

ookla_united_states_median_download_starlink_map_1221g-01-1

Satellite internet performance elsewhere in the world

We examined satellite internet performance in countries with an established market share to see how well their speeds compare to local fixed broadband. We’re excited to add analysis on satellite performance in Australia and Belgium this quarter.

Australia: Starlink outperformed Viasat and fixed broadband average

Starlink radically outperformed Viasat in Australia during Q3 2021 with a median download speed of 138.12 Mbps to Viasat’s 15.60 Mbps. Starlink also outpaced Viasat for median upload speed at 22.63 Mbps and 1.04 Mbps, respectively. Compared to the median download speed over all fixed broadband of 51.17 Mbps, Starlink could be an attractive alternative to traditional fixed broadband on all levels except latency where Starlink showed 42 ms vs. 10 ms for all fixed broadband combined.

ookla_satellite-performance_au_1221-01-1

Belgium: Starlink dramatically faster than fixed broadband

Starlink’s median download speed of 127.46 Mbps during Q3 2021 was dramatically faster than the country’s median download for all fixed broadband of 72.90 Mbps. At 16.73 Mbps, Starlink’s median upload speed was only slightly slower than the overall median of 17.98 Mbps. However, Starlink’s 49 ms latency was higher than the country’s average of 13 ms. Starlink was the only satellite internet provider with adequate samples to analyze in Belgium during Q3 2021.

ookla_satellite-performance_be_1221-01

Brazil: Viasat close to national average

Viasat’s median download speed in Brazil improved to 66.32 Mbps during Q3 2021 (up from 60.30 Mbps in Q2 2021. This was close to the national median for fixed broadband of 71.50 Mbps. Viasat’s median upload speed (1.06 Mbps) was much slower, however, than that on fixed broadband (36.37 Mbps), and Viasat’s latency was much higher (615 ms vs 6 ms).

ookla_satellite-performance_br_1221-01-1

Canada: Starlink performance relatively flat

Our previous article showed that Starlink’s median download speed exceeded that of fixed broadband in Canada during Q2 2021 (86.92 Mbps vs. 84.24 Mbps). In Q3 2021, Starlink’s median download speed decreased slightly to 84.55 Mbps while that over all fixed broadband increased to 90.67 Mbps. This is in line with what we expect to see on new technologies as additional users are added to a system. Starlink’s median upload speed was slower than fixed broadband (13.87 Mbps vs. 20.67 Mbps). Latency on Starlink was much higher (56 ms vs. 12 ms). Starlink is still a viable alternative to fixed broadband in Canada, especially for consumers without access to other options.

ookla_satellite-performance_ca_1221-01-1

Starlink faster than overall fixed broadband in 5 provinces

Starlink showed enough samples to analyze performance in nine out of 10 provinces in Canada during Q3 2021. Starlink’s Q3 2021 median download speed was faster than the median for all fixed broadband in five provinces: Manitoba (81.04 Mbps vs. 65.91 Mbps), Nova Scotia (109.60 Mbps vs. 99.82 Mbps), Prince Edward Island (118.02 Mbps vs. 46.86 Mbps), Quebec (92.59 Mbps vs. 72.07 Mbps) and Saskatchewan (97.67 Mbps vs. 57.59 Mbps). Download speeds were comparable between Starlink and overall fixed broadband in New Brunswick (104.56 Mbps vs. 104.28 Mbps), and overall fixed broadband was faster than Starlink in Alberta (92.65 Mbps vs. 82.48 Mbps), British Columbia (111.36 Mbps vs. 87.34 Mbps) and Ontario (86.26 Mbps vs. 79.54 Mbps).

ookla_canada_median_download_starlink_map_1221g-01

Chile: HughesNet slower than fixed broadband average

HughesNet was hard pressed to compete with Chile’s fixed broadband, which ranked fourth in the world during October 2021. HughesNet showed a 15.21 Mbps median download speed compared during Q3 2021 with the country’s fixed broadband average of 133.81 Mbps during the same period. Median upload speeds also showed a wide gap (3.50 Mbps for HughesNet to 62.18 Mbps on fixed broadband), and HughesNet’s latency was very high (626 ms vs. 8 ms).

ookla_satellite-performance_cl_1221-01-1

Colombia: HughesNet slow but improving

HughesNet’s median download speed increased in Q3 2021 to 12.12 Mbps (up from 9.28 Mbps during Q2 2021), compared with Colombia’s 46.08 Mbps for fixed broadband overall (35.90 Mbps in Q2 2021). Median upload speed was also slower using the satellite internet provider (3.05 Mbps) than fixed broadband (10.50 Mbps), and latency was much higher on satellite (753 ms vs. 15 ms).

ookla_satellite-performance_co_1221-01-1

France: Starlink speeds decreasing, remains faster than fixed broadband average

Starlink users in France saw a median download speed of 102.15 Mbps in Q3 2021 (down from 139.39 Mbps in Q2 2021, likely due to increased usage). Starlink’s download speed easily beat the country-wide median for fixed broadband of 75.47 Mbps (up from 70.81 Mbps in Q2 2021). Starlink’s upload speed during Q3 2021 was slower than the fixed broadband median (19.84 Mbps vs. 56.66 Mbps), and Starlink’s latency was higher (54 ms vs. 13 ms).

ookla_satellite-performance_fr_1221-01

Germany: Starlink faster than country average for fixed broadband

Starlink’s median download speed in Germany of 95.40 Mbps was much faster than the country median of 60.99 Mbps during Q3 2021. Starlink was slightly slower for upload speed than overall fixed broadband (17.63 Mbps vs. 21.05 Mbps) and Starlink showed a higher latency (45 ms vs. 15 ms).

ookla_satellite-performance_de_1221-01-1

Mexico: Viasat faster than HughesNet for downloads

Viasat, with a median download speed of 14.94 Mbps during Q3 2021 (up from 13.95 Mbps in Q2 2021), was faster than HughesNet (10.64 Mbps in Q3 2021, down from 11.92 Mbps in Q2 2021) but slower than the country’s median for fixed broadband (33.14 Mbps in Q3 2021, 29.99 Mbps in Q2 2021). HughesNet was slightly faster than Viasat for upload speed during Q3 2021 (3.21 Mbps vs. 2.03 Mbps). While Viasat’s latency was high (675 ms vs 12 ms for fixed broadband), it was lower than HughesNet’s (748 ms).

ookla_satellite-performance_mx_1221-01-1

New Zealand: Starlink slowed slightly, remained faster than fixed broadband average

Starlink’s Q3 2021 median download speed (120.10 Mbps, down from 127.02 Mbps in Q2 2021, likely due to increased usage) was much faster than New Zealand’s median fixed broadband download speed (84.98 in Q3 2021 up from 78.85 Mbps in Q2 2021). Starlink was slower than New Zealand’s overall fixed broadband for Q3 2021 upload speed (16.87 Mbps vs. 23.62 Mbps). While Starlink’s median latency improved from 101 ms in Q2 2021 to 81 ms in Q3 2021, it was still slower than New Zealand’s median for all fixed broadband of 7 ms during Q3 2021.

ookla_satellite-performance_nz_1221-01-1

United Kingdom: Starlink nearly twice as fast as fixed broadband average

Starlink showed a much faster median download speed in the U.K. during Q3 2021 (111.66 Mbps, up from 108.30 Mbps in Q2 2021) than the country’s median for fixed broadband (53.16 Mbps in Q3 2021, up from 50.14 Mbps in Q2 2021). Starlink’s upload speed was comparable to the median for all fixed broadband in the U.K. (16.02 Mbps vs. 15.77 Mbps), and the latency was pretty good, given the distance traveled (37 ms vs. 15 ms).

ookla_satellite-performance_uk_1221-01-1

We look forward to updating this data again next quarter with new locations as satellite internet continues to become a more viable option for many. If you’re using satellite internet, take a Speedtest to help us provide an accurate picture of real-world performance.

Ookla retains ownership of this article including all of the intellectual property rights, data, content graphs and analysis. This article may not be quoted, reproduced, distributed or published for any commercial purpose without prior consent. Members of the press and others using the findings in this article for non-commercial purposes are welcome to publicly share and link to report information with attribution to Ookla.

| November 30, 2022

Starlink Speeds Dipped Slightly During Q3 2022 as the Space Race Heats up

Ookla® has exciting, fresh data from Q3 2022 for SpaceX’s Starlink, HughesNet, and Viasat in North and South America, as well as new Starlink markets we haven’t yet featured in our ongoing series on satellite internet. With accelerating competition on the horizon for 2023, we’ve been eager to see how Starlink continues to perform, especially as building new fiber connections continues to be costly around the world. 

This analysis includes results from five additional countries, two new providers, and expanded data for Starlink, HughesNet, and Viasat. We also examine how Starlink’s internet performance has changed over the past year in Canada, Chile, and the United States.

Starlink performance dipped once again during Q3 2022 (though only slightly)

Chart of Starlink perfromance in select North and South American countries

Perhaps a victim of their own success, Starlink download speeds dropped once again in Canada (at least 14%) and the U.S. (at least 17%) from Q2 to Q3 2022, while speeds remained roughly the same in Chile quarter over quarter. During the same period, fixed broadband performance raced ahead, improving at least 8% to 115.18 Mbps in Canada, at least 4% to 207.04 Mbps in Chile, and at least 8% to 164.13 Mbps in the U.S. 

Over the past year, as we’ve seen more users flock to sign up for Starlink (reaching 400,000 users worldwide during Q2 2022), speeds have started to decrease. Without a doubt, Starlink often can be a life-changing service for consumers where connectivity is inadequate or nonexistent. Even as speeds slow, they still provide more than enough connectivity to do almost everything consumers normally need to do, including streaming 4K video and video messaging. The biggest thing you might have issues with is if you’re trying to play multiplayer online games — even being a low-earth orbit (LEO) satellite, latency still lags far behind low-latency fixed broadband connections.

Starlink upload speeds remained roughly unchanged in all three countries we surveyed during Q3 2022, improving marginally in Canada and Chile, and essentially staying the same in the U.S. 

Starlink remains a boon for rural U.S. consumers who can afford it

Map of Starlink expansion in U.S. counties

Over the past year, Starlink has proliferated across the U.S., going from having at least 10 unique users in 776 U.S. counties, or roughly 25% of all counties during Q2-Q3 2021 to 2,399 counties in Q2-Q3 2022, or roughly 75% of counties. That marks about a 200% increase year over year, indicating consumer confidence in the provider. 

Looking at only “nonmetro” counties as defined by the U.S. Office of Management and Budget, 336 counties showed at least 10 Starlink users in Q2-Q3 2021. That was about 17% of all nonmetro counties. In Q2-Q3 2022, that rose to 1359 counties, or about 69% of nonmetro counties, marking about a 300% increase year over year. 

Starlink in Puerto Rico and the U.S. Virgin Islands had the fastest satellite internet in North America

Chart of satellite performance compared to fixed broadband internet in North America

Speedtest Intelligence® reveals that Starlink in Puerto Rico and the U.S. Virgin Islands had the fastest median download speed among satellite providers in North America at 85.88 Mbps and 85.57 Mbps during Q3 2022. Starlink in the Dominican Republic (72.01 Mbps), Canada (65.80 Mbps), Mexico (64.30 Mbps), and the U.S. (53.00 Mbps) followed. Starlink had faster median download speeds than all fixed broadband providers combined in all of these countries except Canada and the U.S., and Viasat outperformed fixed broadband in the Dominican Republic (22.92 Mbps). 

Viasat and HughesNet recorded their fastest median download speeds in Puerto Rico at 36.65 Mbps and 22.19 Mbps, respectively. Almost every satellite provider on our list reached speeds fast enough to stream high-quality video at around 20 Mbps, though latency still was much higher than fixed broadband internet.

For upload speeds, Starlink outperformed fixed broadband providers combined in the Dominican Republic (14.68 Mbps to 5.83 Mbps) and the U.S. Virgin Islands (12.59 Mbps to 8.37 Mbps). Fixed broadband providers in Canada had the fastest upload on our list at 29.29 Mbps.

Multi-server latency showed satellite internet’s limits, with the huge distances between satellite and receivers adding up to long lags — and every satellite provider with higher latencies than fixed broadband providers. However, the Dominican Republic and U.S. Virgin Islands still had higher fixed broadband multi-server latencies at 55.45 ms and 76.15 ms, respectively. Starlink in the U.S. had the lowest multi-server latency at 67.16 ms, followed by Canada (77.32 ms), and Mexico (96.42 ms), which were the only satellite options that had a multi-server latency under 100 ms.

Starlink in Brazil was the fastest satellite provider in South America

Chart of satellite performance compared to fixed broadband internet in South America

Brazilian satellite consumers weren’t lacking for fast internet options during Q3 2022, with Starlink blazing ahead among satellite providers in South America at 112.97 Mbps. Even Viasat notched a respectable median download speed of 45.15 Mbps. Starlink in Brazil was also the only satellite provider to outperform its country’s fixed broadband speeds, with ultrafast fixed broadband in Chile pulling ahead of Starlink 207.04 Mbps to 92.58 Mbps. Colombia was statistically too close to call in Q3 2022 with Starlink at 71.42 Mbps and fixed broadband at 83.76 Mbps. HughesNet trailed far behind with its fastest speed in Chile at 22.62 Mbps during Q3 2022.

For upload speeds, fixed broadband providers in every country we surveyed were faster than their satellite counterparts during Q3 2022. Starlink in Colombia had the fastest upload speed among satellite providers at 24.48 Mbps.

Speedtest Intelligence reveals multi-server latency told a similar story, with every country’s fixed broadband providers having a lower multi-server latency than their satellite counterparts. However, Starlink in Brazil and Chile had the lowest satellite multi-server latencies at 52.21 ms and 52.32 ms, respectively, during Q3 2022. Viasat and HughesNet lowest latencies were far behind with Viasat in Brazil at 670.63 ms and HughesNet in Chile at 713.04 ms.

New Q3 2022 Starlink countries have mixed results

Chart of satellite performance compared to fixed broadband internet in select countries

Speedtest Intelligence data shows Starlink data in six new countries during Q3 2022, including Colombia, the Dominican Republic, Estonia, Moldova, Norway, and the U.S. Virgin Islands. Starlink in Estonia (93.48 Mbps), the U.S. Virgin Islands (85.57 Mbps), and the Dominican Republic (72.01 Mbps) were much faster options than fixed broadband providers in their respective countries during Q3 2022. Starlink in Norway (113.86 Mbps) and Colombia (71.42 Mbps) were statistically in the same range as fixed broadband providers in their respective countries during the same time period. Starlink in Moldova (53.11 Mbps) was much slower than all fixed broadband providers combined (105.65 Mbps), though for rural folks with fewer options, still provides a speedy connection.

In all six countries, Starlink underperformed all fixed broadband providers combined for upload speed during Q3 2022, lagging behind from 12.59 Mbps to 24.48 Mbps, while median fixed broadband upload speeds ranged from 30.66 Mbps to 93.80 Mbps.

Multi-server latency was generally much higher than fixed broadband, with Starlink in Colombia showing the lowest multi-server latency at 58.65 ms, followed by Norway (73.00 ms), Estonia (85.37 ms), Moldova (105.26 ms), the Dominican Republic (110.62 ms), and the U.S. Virgin Islands (113.12 ms). 

The great space race is on

There is no doubt a new space race for connectivity is being waged across the world. Competitors are pouring hundreds of millions and even billions into unlocking the celestial connectivity dilemma. Here are some major updates about what’s next for various different satellite competitors:

With the competition for satellite connectivity heating up and Starlink facing potentially more competition in the coming months, we’ll be keeping our eyes to the sky to see how connectivity is performing. We’ll continue our series next quarter with Q3-Q4 2022 data from Europe and Oceania and any new countries where Starlink launches, and be back with North and South America data in Q2 2023. In the meantime, be sure to download the Speedtest app for Windows and Mac computers or for iOS or Android for devices and see how your satellite internet stacks up to our findings.

Ookla retains ownership of this article including all of the intellectual property rights, data, content graphs and analysis. This article may not be quoted, reproduced, distributed or published for any commercial purpose without prior consent. Members of the press and others using the findings in this article for non-commercial purposes are welcome to publicly share and link to report information with attribution to Ookla.

| September 20, 2022

Starlink Slowed in Q2, Competitors Mounting Challenges

Ookla® has covered SpaceX’s Starlink satellite internet for over a year now with our ongoing series on satellite internet performance. We’ve seen Starlink launch in new locations across the world, and while some speeds have shown signs of slowing down from their initial launches, the newly announced T-Mobile partnership with Starlink could extend the benefit of satellite connections to the mobile market.

Today, we have fresh data on satellite performance during Q2 2022 in Europe, Oceania, North America, and South America. This analysis includes results from eight additional countries, two new providers, and expanded data for Starlink, HughesNet, and Viasat. We also examine how Starlink’s internet performance has changed over the past year in Canada, France, Germany, New Zealand, the United Kingdom, and the United States.

Starlink speeds decreased in every country we surveyed over the past year as more users sign up for service

Chart of Starlink performances in select countries

Speedtest Intelligence® reveals that median download speeds for Starlink fell across Canada, France, Germany, New Zealand, the U.K, and the U.S., dropping between 9% and 54% from Q2 2021 to Q2 2022 as more users signed up for the service. However, Starlink still reached a median download speed of at least 60 Mbps in North America during Q2 2022, which is more than enough for at least one connected device to do most everything on the internet including streaming video, downloading games, and chatting on video with friends and family.

Upload speeds also slowed on Starlink, with speeds decreasing across all of the countries we’ve tracked over the past year. Latency fared a little better with latency remaining relatively flat (though high when compared to fixed broadband) in most countries. New Zealand was the outlier, with latency dropping 23 ms. For most users, we still suspect these dips are still worthwhile for areas that have no service, slow service, or few affordable options for fast internet.

Starlink in Puerto Rico was the fastest satellite provider in North America

Chart of Satellite performance versus fixed broadband internet in North America

Starlink in Puerto Rico had the fastest satellite internet in North America during Q2 2022 with a median download speed of 112.22 Mbps, followed by Starlink in Mexico (80.17 Mbps), Canada (75.73 Mbps), and the U.S. (62.53 Mbps). Starlink in Puerto Rico and Mexico was faster than their countries’ fixed broadband providers combined (74.80 Mbps and 45.50 Mbps, respectively), while fixed broadband in the U.S. (150.12 Mbps) and Canada (106.41 Mbps) was faster than each country’s satellite providers.

In every country except Mexico, fixed broadband upload speeds were faster than satellite speeds. Starlink in Mexico edged out fixed broadband providers 14.48 Mbps to 12.20 Mbps. Latency was higher for every satellite provider compared to fixed broadband. Starlink in the U.S. had the lowest median latency among satellite providers at 48 ms.

Starlink outperformed fixed broadband average in 16 European countries

Chart of Satellite performance versus fixed broadband internet in Europe

Speedtest Intelligence shows Starlink was fast in Europe during Q2 2022, outperforming fixed broadband median download speed in 16 countries and reached download speeds over 100 Mbps in 10 countries. In contrast, fixed broadband only achieved median download speeds over 100 Mbps in six countries: Romania, Spain, Portugal, France, Hungary, and the Netherlands during Q2 2022. Starlink was fastest for median download speed in Portugal at 123.01 Mbps, the Netherlands (122.43 Mbps), Austria (112.01 Mbps), France (110.98 Mbps), and Belgium (110.40 Mbps). Romania and Spain were the only countries to have fixed broadband beat Starlink for fastest median download speed, achieving 131.41 Mbps and 127.19 Mbps, respectively.

For upload, Starlink in Greece and Austria was the only satellite provider to achieve faster upload speeds than all fixed broadband providers combined at 19.34 Mbps to 5.14 Mbps, and to 17.14 Mbps to 15.90 Mbps, respectively. Fixed broadband providers in Spain (99.21 Mbps), Romania (94.23 Mbps), Sweden (92.77 Mbps), France (88.22 Mbps), Lithuania (83.54 Mbps), and Portugal (73.13 Mbps) all recorded median upload speeds greater than 70 Mbps, with the closest satellite provider being Starlink in Portugal at 28.52 Mbps.

All satellite providers fell far behind fixed broadband providers in the whole of Europe for latency during Q2 2022. Starlink in Spain and the United Kingdom recorded the lowest satellite latencies at 37 ms and 39 ms, respectively — still a far cry from the closest fixed broadband latency, which was 14 ms in Germany, Greece, and Italy.

Starlink in Brazil was the fastest satellite provider in South America

Chart of Satellite performance versus fixed broadband internet in South America

Our analysis of Speedtest Intelligence data found Starlink in Brazil was the fastest satellite provider in South America with a median download speed of 128.38 Mbps during Q2 2022, followed by Starlink in Chile at 94.79 Mbps. Chilean fixed broadband internet was still much faster for those who could get access to it. The Speedtest Global Index™ found Chile had the second fastest fixed broadband internet in the world with a median download speed of 211.43 Mbps during August 2022. Starlink in Brazil was the only satellite provider to be faster than its country’s fixed broadband providers combined.

Like last quarter, South American fixed broadband providers surpassed satellite providers in each respective upload speeds during Q2 2022. All satellite providers had a higher median latency than fixed broadband, though Starlink in Brazil and Chile had latencies of 38 ms.

Starlink in New Zealand was the fastest satellite provider in Oceania 

Chart of Satellite performance versus fixed broadband internet in Oceania

Starlink’s fastest median download speed in Oceania was in New Zealand at 105.99 Mbps, though this still fell short of fixed broadband providers in the country. Starlink in Australia was faster than fixed broadband providers by a wide margin at 102.76 Mbps to 51.46 Mbps during Q2 2022. Starlink outperformed fixed broadband providers in new-to-our-list Tonga 45.25 Mbps to 22.32 Mbps. 

New Zealand’s fixed broadband dominated for the fastest median upload speed in Oceania at 87.29 Mbps during Q2 2022, while Australia’s fixed broadband fell far behind with an upload speed of 17.86 Mbps. Both speeds were still faster than Starlink’s median upload speeds in New Zealand and Australia (12.31 Mbps and 10.45 Mbps, respectively). Tonga didn’t have a statistical winner for fastest upload speed, but Starlink reached 19.26 Mbps and fixed broadband 18.11 Mbps. Fixed broadband also had a lower median latency than Starlink during Q1 2022, which clocked in at 49 ms in Australia, 78 ms in New Zealand, and 98 ms in Tonga.

Biggest questions lie ahead, but competition will be good for consumers

Satellite connectivity is coming to mobile, with Starlink’s new partnership with T-Mobile and new mobile devices becoming satellite enabled. This will cause ripples across North America, which is a net positive for consumers who live in areas with low mobile and fixed broadband connectivity. Connecting with the world won’t be a question of how anymore, it will be a question of how good your experience is. That’s hopefully a win-win for consumers, especially as more providers vie for the fastest and best satellite experience — a true global space race.

Starlink isn’t stopping there — they’re trying to get into airplanes, cruise ships, and cars. But they’re not the only satellite provider making moves; Viasat is launching its Viasat-3 fleet, OneWeb is combining business with Eutelsat, and Amazon is sending 3,236 Project Kuiper satellites into orbit. We’ll be here monitoring the skies in our ongoing satellite series. Take a Speedtest® to help us provide an accurate and more complete picture of real-world performance. And if we’re missing data on your satellite network, send us a screenshot of your speed on Twitter or Facebook.

Ookla retains ownership of this article including all of the intellectual property rights, data, content graphs and analysis. This article may not be quoted, reproduced, distributed or published for any commercial purpose without prior consent. Members of the press and others using the findings in this article for non-commercial purposes are welcome to publicly share and link to report information with attribution to Ookla.

| June 28, 2022

Here’s How Fast Starlink Has Gotten Over the Past Year

It’s been a year since we first examined SpaceX’s Starlink satellite internet, which launched its public beta in November 2020. Today we’re updating our ongoing series on satellite internet performance with data from Q1 2022 in Europe, Oceania, North America, and South America, including results from 10 additional countries. We’re also examining how Starlink’s internet performance has changed over the past year in the United States and Canada.

Starlink speeds increased nearly 58% in Canada and 38% in the U.S. over the past year

chart of Starlink and fixed broadband performance in Canada and the United States

Speedtest Intelligence® reveals that median download speeds for Starlink dramatically increased from Q1 2021 to Q1 2022 in the U.S. and Canada, as did speeds for all fixed broadband providers combined. In the U.S., Starlink median download speeds improved roughly 38% from 65.72 Mbps in Q1 2021 to 90.55 Mbps in Q1 2022. In Canada, Starlink’s download speed leapt ahead nearly 58% from 61.84 Mbps to 97.40 Mbps during the same time period.

However, Speedtest Intelligence also showed that upload speeds for Starlink decreased at least 33% in the U.S. (16.29 Mbps in Q1 2021 to 9.33 Mbps in Q1 2022) and at least 36% in Canada (16.69 Mbps to 10.70 Mbps) during the same time period. Median latency on Starlink marginally increased from 40 ms to 43 ms in the U.S. and from 51 ms to 55 ms in Canada during the past year. For many Starlink users, we suspect these changes are negligible.

Starlink in Mexico was the fastest satellite provider in North America

Chart of Satellite performance versus fixed broadband internet in North America

Starlink in Mexico had the fastest satellite internet in North America during Q1 2022 with a median download speed of 105.91 Mbps, followed by Starlink in Canada (97.40 Mbps) and the U.S. (90.55 Mbps). Mexico’s fixed broadband download speed (40.07 Mbps) was much slower than Starlink, while Starlink download speeds were slower than fixed broadband for all providers combined in the U.S. (144.22 Mbps) and Canada (106.86 Mbps). Puerto Rico, new to our list, showed HughesNet had the fastest satellite internet on the island territory at 20.54 Mbps, though fixed broadband was much faster at 68.88 Mbps.

Starlink in Lithuania was the fastest satellite provider in Europe

Chart of satellite performance versus fixed broadband internet in Europe

Speedtest Intelligence showed that Starlink blazed ahead in Europe during Q1 2022, with Starlink achieving a 100+ Mbps median download speed in every country where it was commercially available. In contrast, fixed broadband only achieved median download speeds over 100 Mbps in Spain, Portugal, and the Netherlands during Q1 2022. Starlink was fastest for download speed in Lithuania at 160.08 Mbps, followed by Belgium (147.85 Mbps), Slovakia (146.25 Mbps), Croatia (136.00 Mbps), and Austria (132.61 Mbps). Spain was the only country to have its fixed broadband beat Starlink for fastest median download speed, achieving 131.99 Mbps to Starlink’s 108.43 Mbps within the country.

For upload, fixed broadband providers in Spain (100.65 Mbps), France (86.02 Mbps), Portugal (74.42 Mbps), and Lithuania (73.95 Mbps) all recorded median speeds greater than 70 Mbps, while the closest satellite provider, Starlink in Portugal, trailed at 32.05 Mbps.

All satellite providers fell far behind fixed broadband providers in the whole of Europe for latency during Q1 2022, with Starlink in Spain and the United Kingdom recording the highest satellite latencies at 35 ms and 36 ms, respectively — a far cry from the lowest fixed broadband latency, which was 15 ms in the U.K.

Starlink in Chile was the fastest satellite provider in South America

Chart of Satellite performance versus fixed broadband internet in South America

Our analysis of Speedtest Intelligence data found Starlink in Chile was the fastest satellite provider in South America with a median download speed of 110.49 Mbps during Q1 2022. Although Chilean fixed broadband internet was much faster for those who could get access to it. In fact, during May 2022, the Speedtest Global Index™ found Chile had the second fastest fixed broadband internet in the world with a median download speed of 206.97 Mbps, just a hair shy of Singapore’s first place speed of 209.21 Mbps. 

No South American satellite provider surpassed its country’s fixed broadband download or upload speeds during Q1 2022. Viasat in Brazil had a noteworthy median download speed of 62.07 Mbps, though still fell short of the country’s fixed broadband speed of 90.20 Mbps. All satellite providers had a higher median latency than fixed broadband, though Starlink in Chile had a latency of 38 ms.

Starlink in Australia was the fastest satellite provider in Oceania

Chart of Satellite performance versus fixed broadband internet in Oceania

Starlink raced ahead in Oceania, recording faster median download speeds than fixed broadband in both Australia and New Zealand. In Australia, Starlink had a median download speed of 124.31 Mbps, much faster than Australian fixed broadband at 50.87 Mbps for download during Q1 2022. The comparison in New Zealand was much closer with Starlink’s median download speed at 118.70 Mbps and fixed broadband at 116.83 Mbps during Q1 2022.

New Zealand’s fixed broadband dominated for the fastest median upload speed in Oceania at 84.34 Mbps during Q1 2022, while Australia’s fixed broadband fell far behind with an upload speed at 17.85 Mbps. Both speeds were still faster than Starlink’s median upload speeds in New Zealand and Australia (13.09 Mbps and 11.71 Mbps, respectively). Fixed broadband also had a faster median latency than Starlink during Q1 2022, which clocked in at 47 ms in Australia and 78 ms in New Zealand.

Consumers are flocking to Starlink, but competitors are close behind

As we’ve continued to see over the past year, Starlink’s low-earth orbit satellites (LEOs) provide a life-changing service for consumers in rural areas that might not otherwise have access to high-speed internet. However, more companies are looking to compete with Starlink and launch their own LEO constellations, including Amazon’s Project Kuiper, which recently received FCC permission to test their own satellite service and is slated to launch later this year, and Viasat which is set to merge with Inmarsat and launch new constellations by 2023.

We’ll continue to monitor the skies in our ongoing satellite series, but if you’re using satellite internet, take a Speedtest® to help us provide an accurate and more complete picture of real-world performance.

Editor’s note: This article was amended on June 28 to clarify percentage increases in the U.S. and Canada and to update the percent change for upload for Canada.

Ookla retains ownership of this article including all of the intellectual property rights, data, content graphs and analysis. This article may not be quoted, reproduced, distributed or published for any commercial purpose without prior consent. Members of the press and others using the findings in this article for non-commercial purposes are welcome to publicly share and link to report information with attribution to Ookla.