
Our investigations of free airport Wi-Fi were nearly grounded when we reached Africa. Not only is free airport Wi-Fi not universally available on the African continent, when you do find it, it’s often very slow and available for only limited periods of time. But digging into Speedtest data for March-May 2017, we did discover a few bright spots.
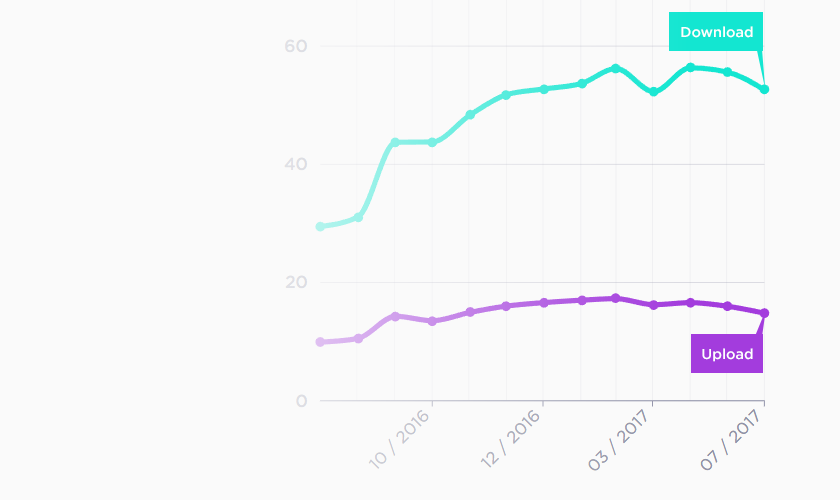
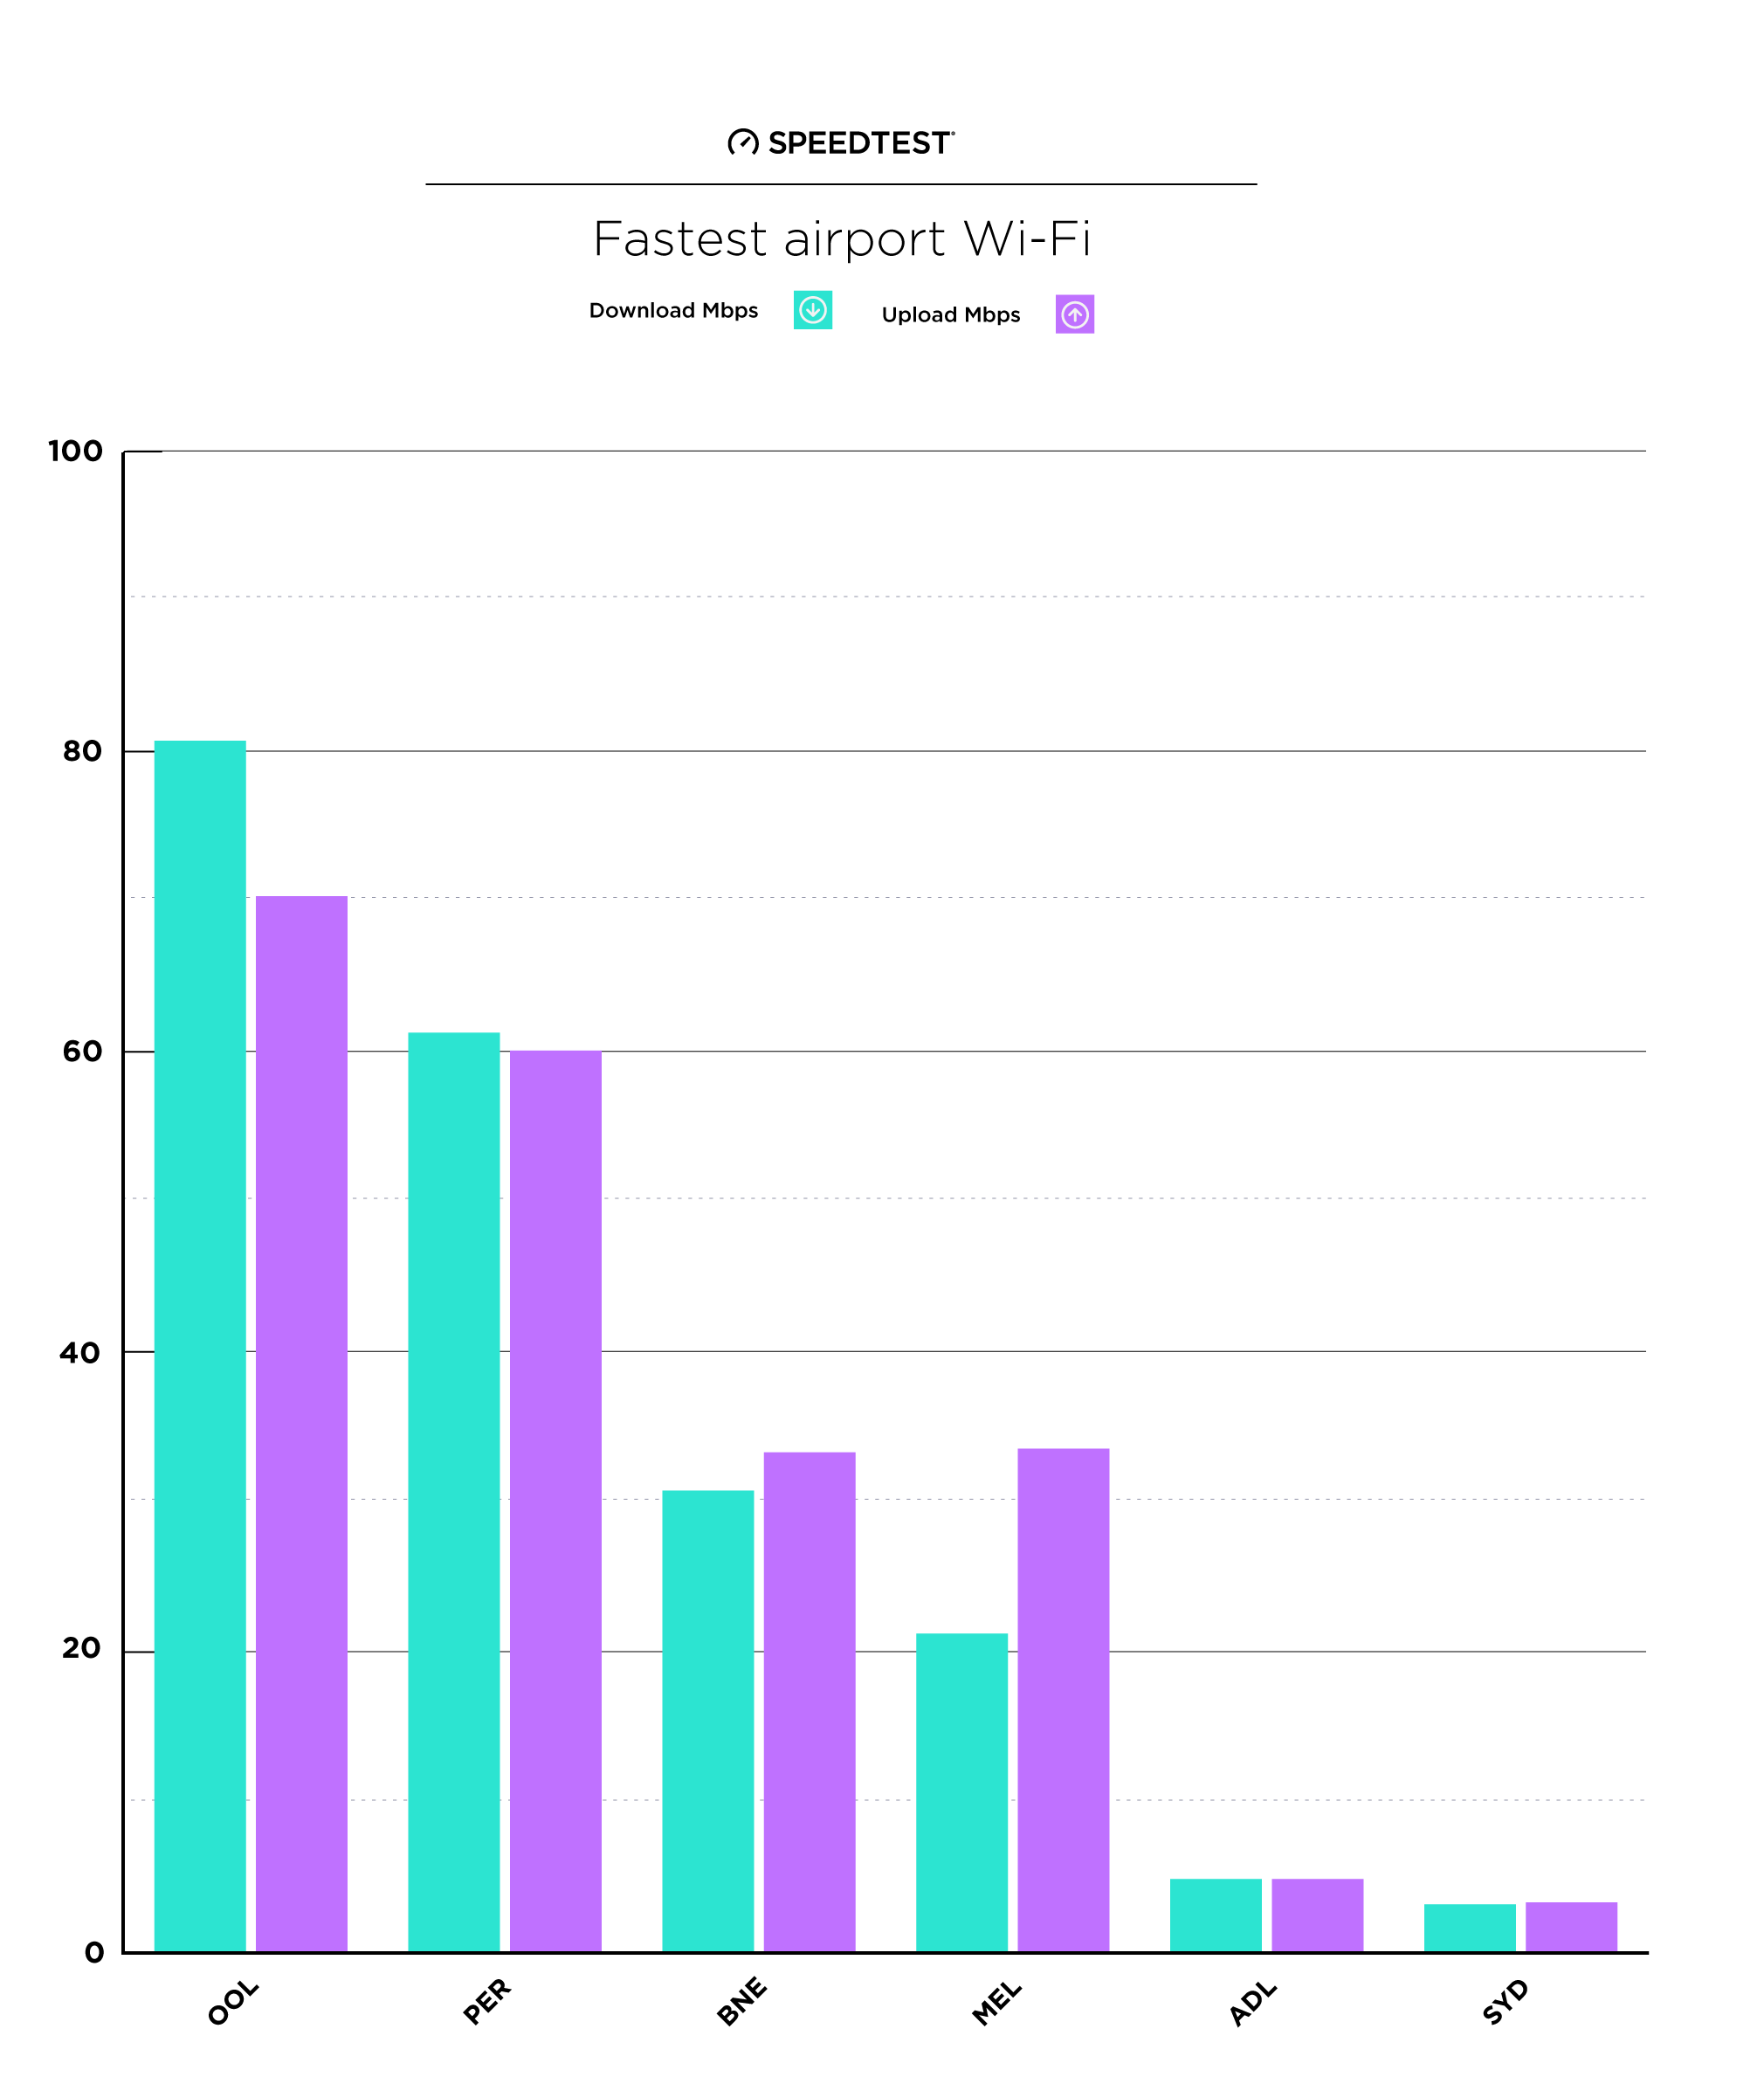
Fastest airport Wi-Fi
Only five of the 10 busiest airports in Africa showed Speedtest results on free, publicly-available Wi-Fi during the time we surveyed. And three of those airports were in South Africa.
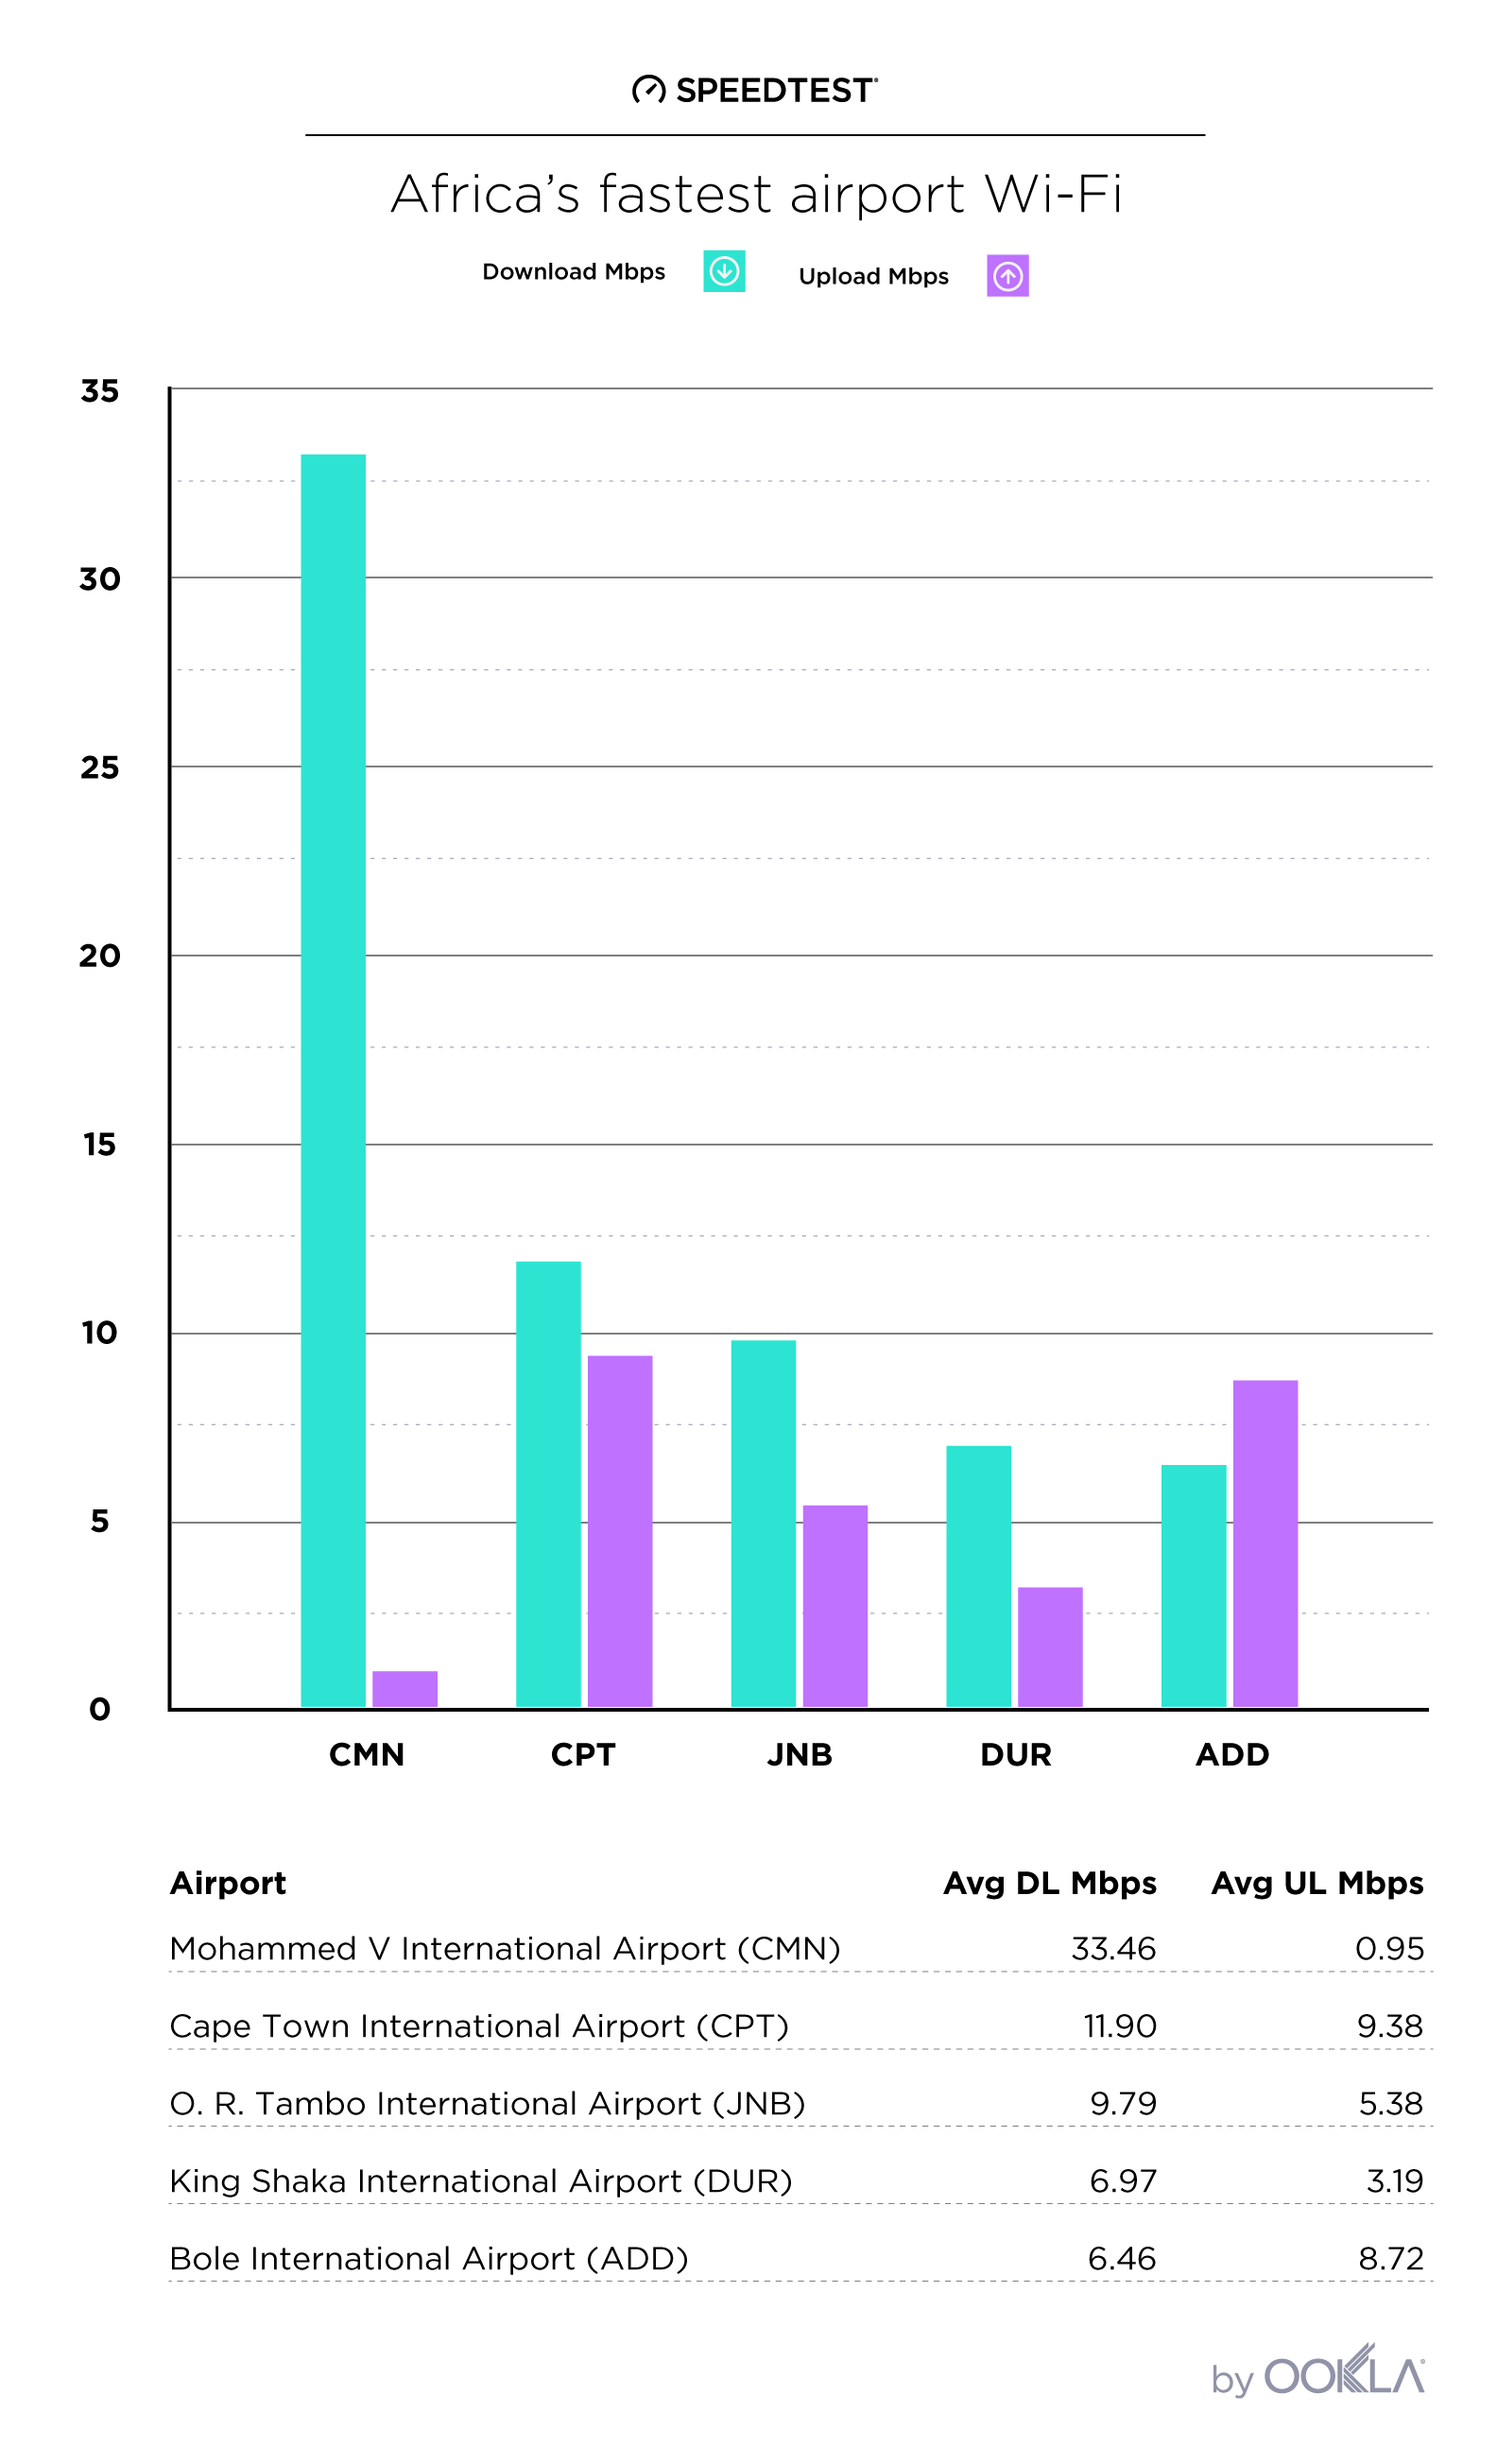
Of those five airports, though, Casablanca’s Mohammed V International Airport wins download speed by far. At 33.46 Mbps, the airport Wi-Fi is faster than any airport we’ve seen in Africa or Europe, and faster than all of the airports in Asia except for Dubai. Upload speed is terrible, though, so if Rick wants to send Ilsa a few snapshots of their final meeting, he’s going to spend more than a little time watching that upload wheel spin.
South Africa’s free airport Wi-Fi is all managed by VAST, an open-access Wi-Fi infrastructure provider, which doesn’t explain why the download speed at Durban’s King Shaka International Airport is about half that in Cape Town, but the company does seem to offer a general band of speed for free service. We saw other, faster tests on VAST-related SSIDs and can only assume that these are the pay-to-play options that are available to users after their first four hours of free Wi-Fi have expired.
Though we found many reports of free airport Wi-Fi, we were not able to verify tests on published SSIDs for airports in Cairo, Addis Ababa, Nairobi, Lagos and Tunis. And as far as we can tell, there is no free, public Wi-Fi at the airport in Algiers. If we’re wrong, take a Speedtest using your phone on the airport Wi-Fi and share your results with us on Twitter or Facebook.
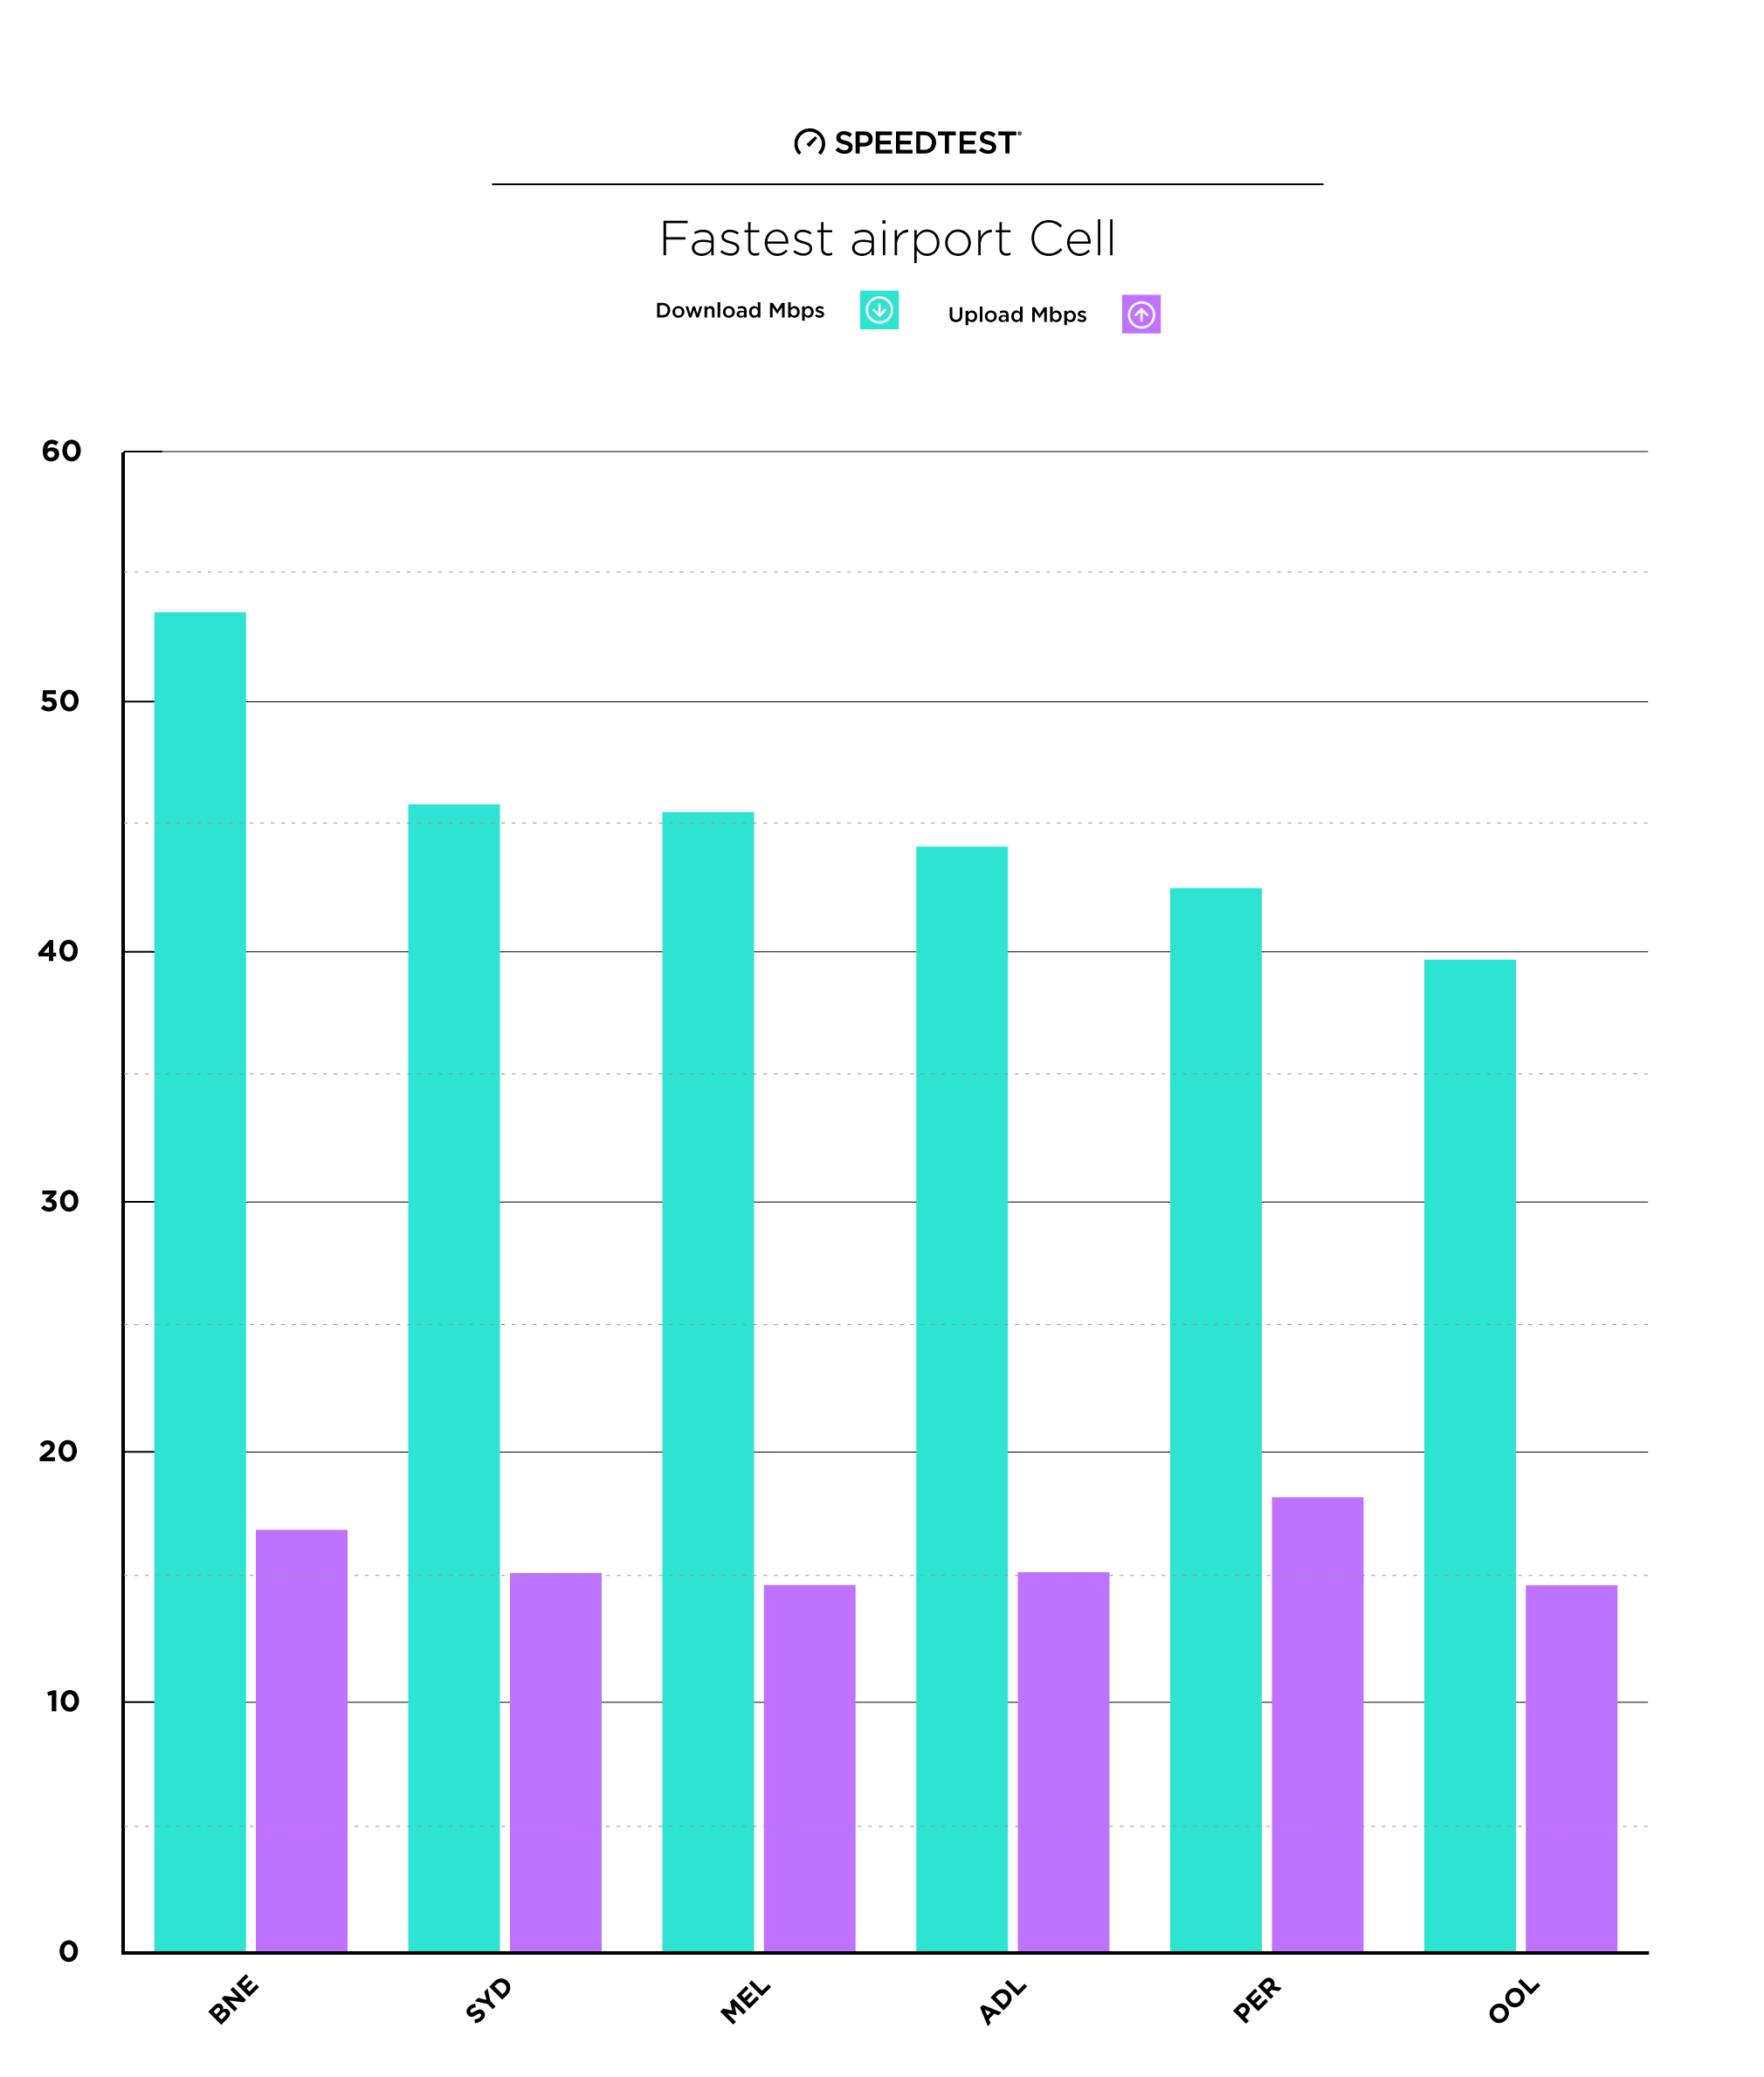
Fastest airport cell
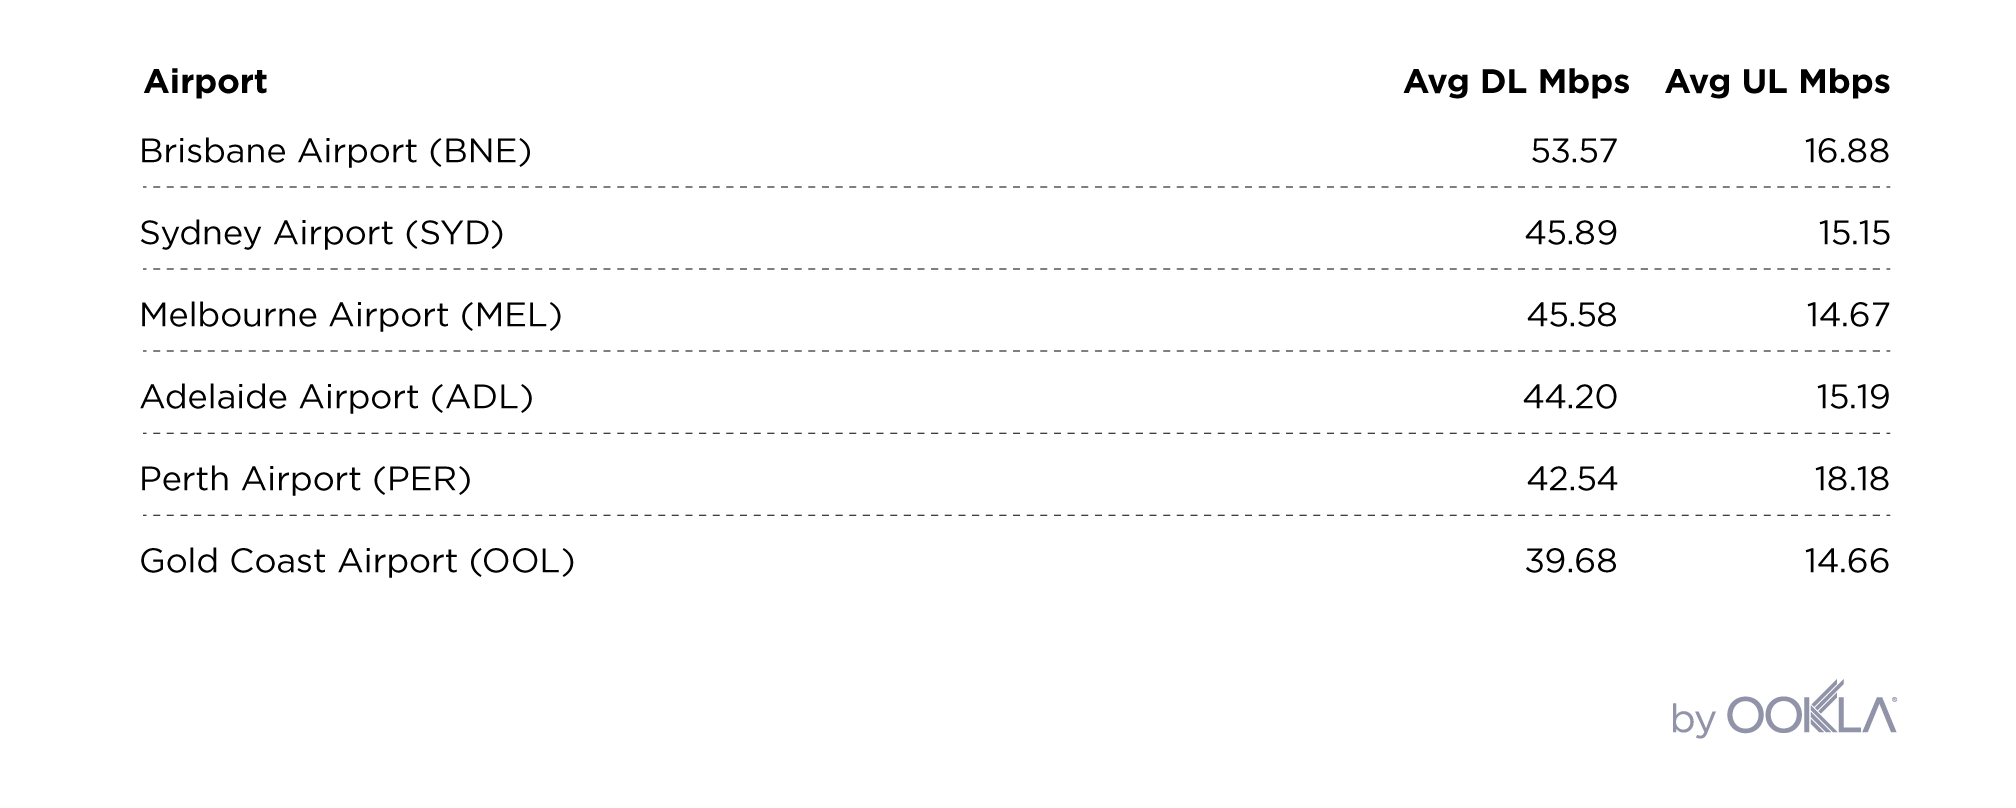
The good news is that cellular service is available at all the busiest African airports. The better news is that download speeds are decent at eight out of 10 of those airports.
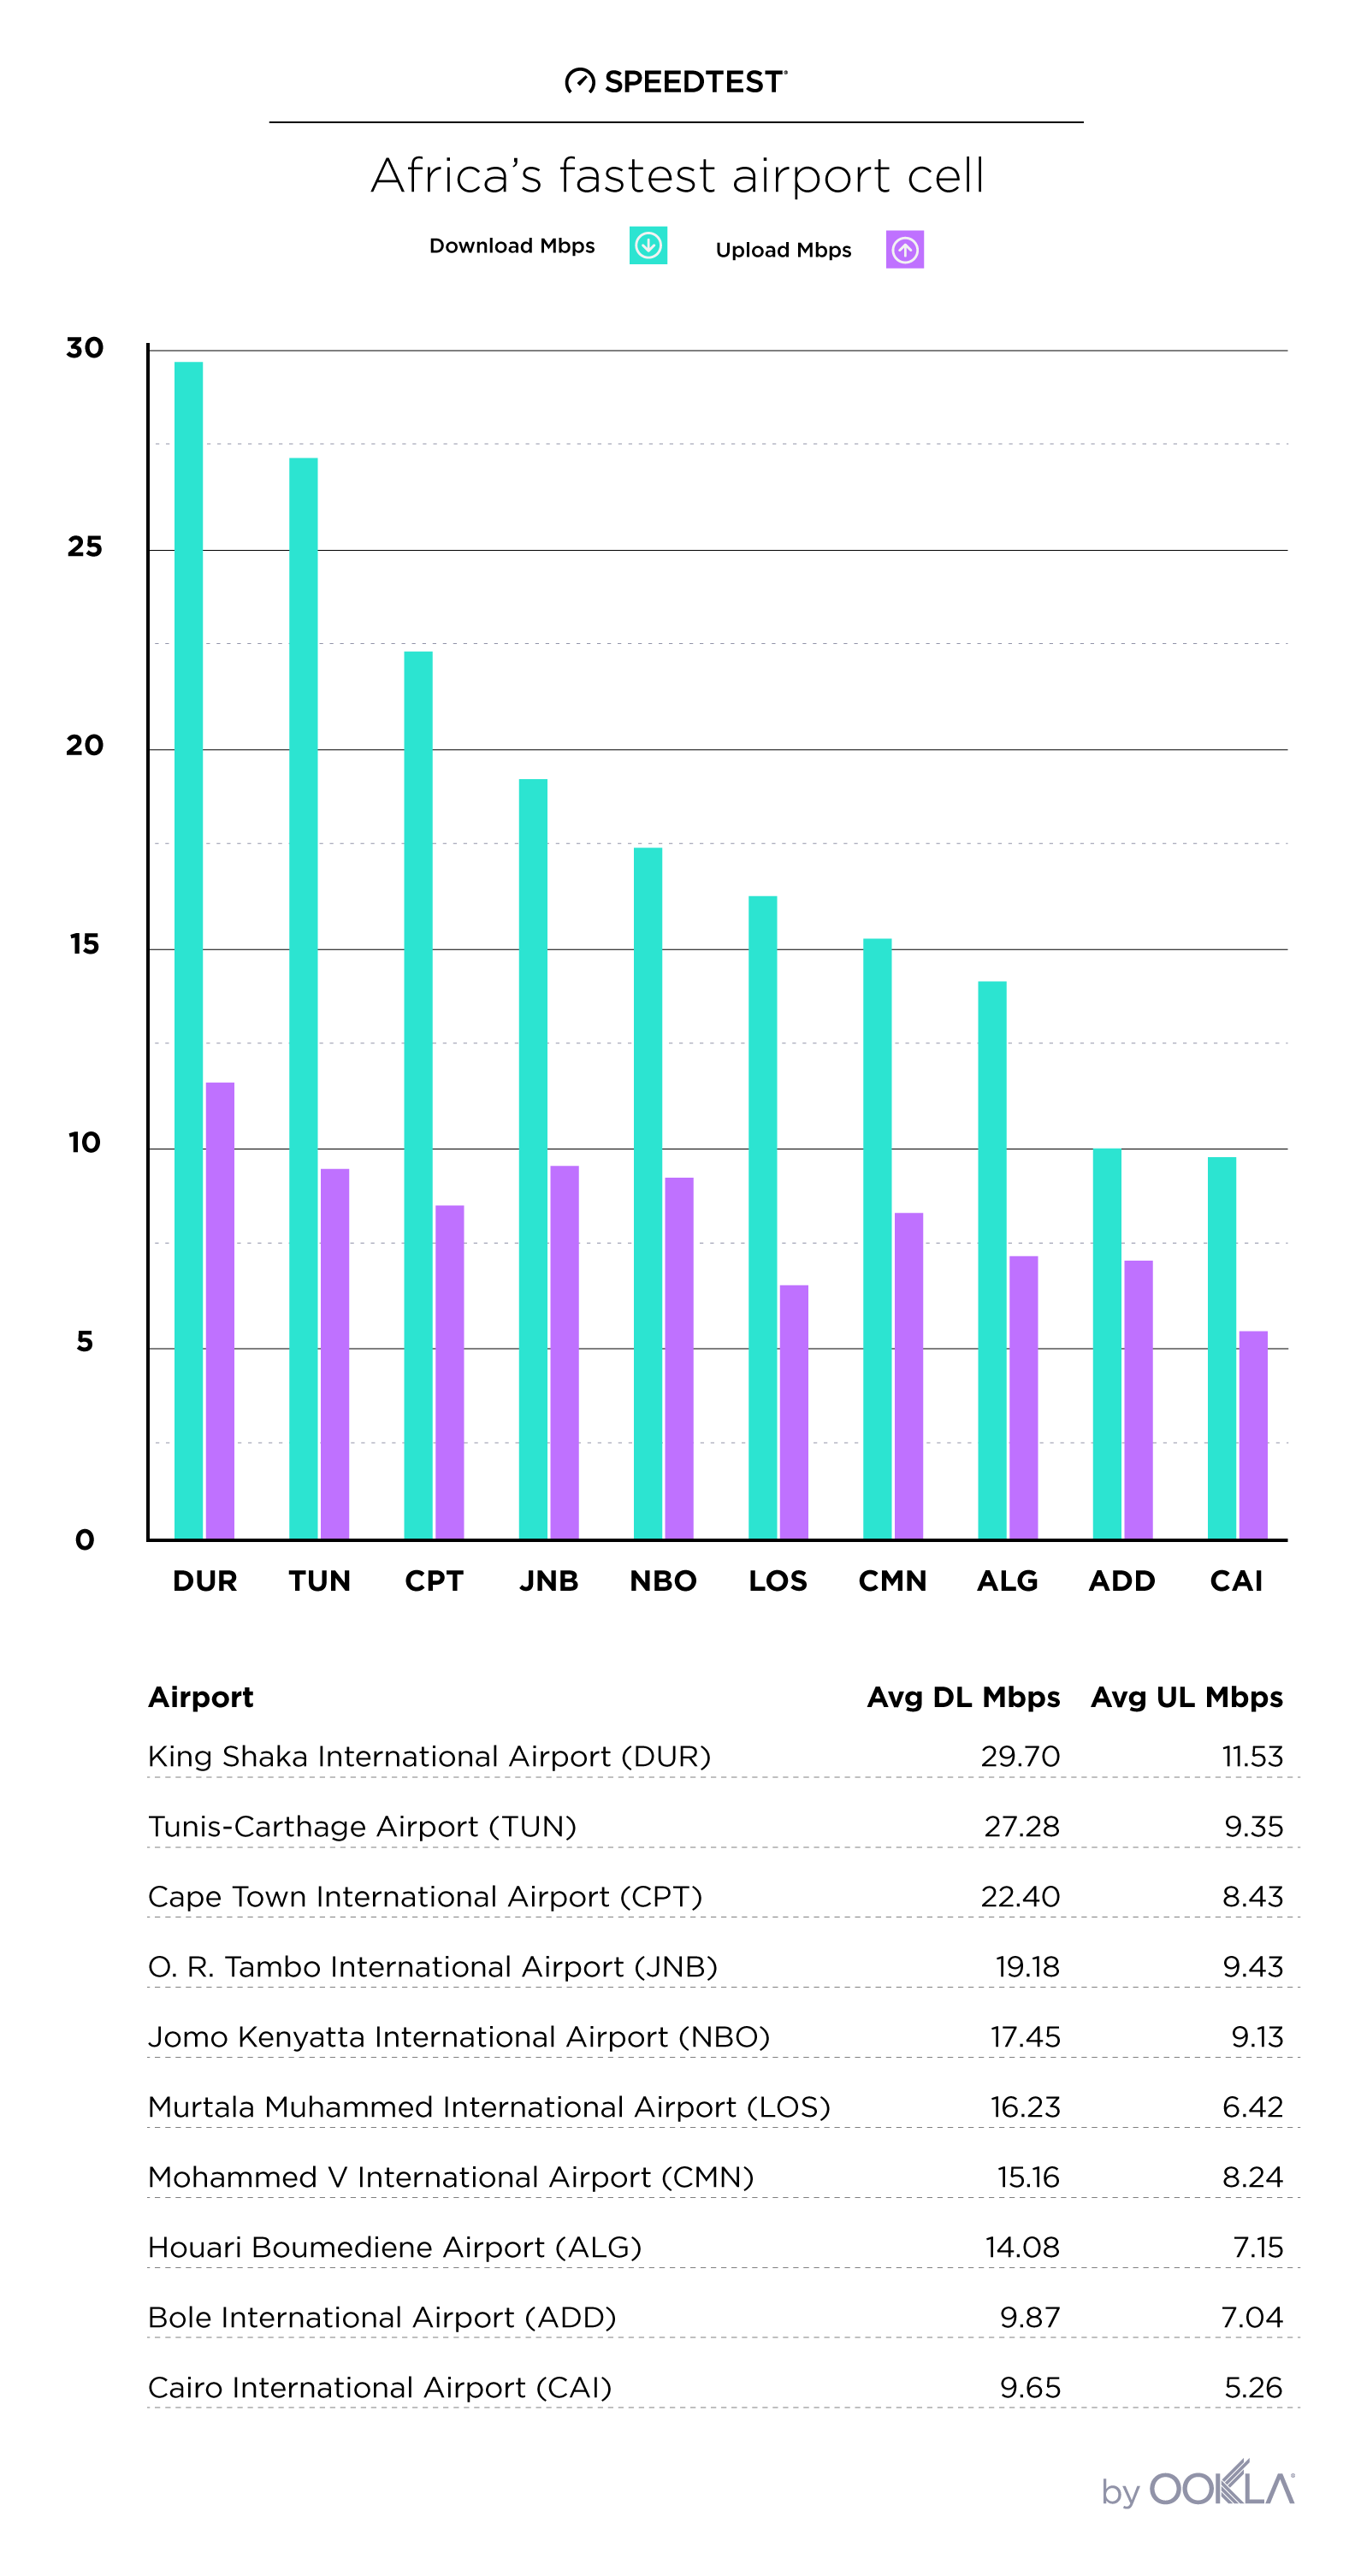
Mobile downloads are slower at all three of South Africa’s major airports than the country average of 34.45 Mbps, but they are still three of the four fastest airports in Africa for mobile.
The mobile download speed at Tunis’ airport is nearly twice as fast as the country average of 15.08 Mbps while the speed at Lagos’ Murtala Muhammed is just over 50% faster than Nigeria’s average of 10.64 Mbps. And although the Houari Boumediene download speed is among the slowest on the list, it’s 68% faster than the average download speed in Algeria.
Nairobi Kenyatta’s mobile download speed is closer to the Kenyan average of 14.51 Mbps, and downloads at Casablanca’s Mohammed V are slightly slower than the Moroccan average of 16.54 Mbps.
The slowest airports on our list, Bole and Cairo, are both located in countries with some of the slowest mobile downloads we saw, with Ethiopia at 10.50 Mbps and Egypt at 7.68 Mbps.
Upload speeds overall are slow, but they are in the same range as airports in Asia and Europe and they should get you by for any normal usage.
Wi-Fi or cell?
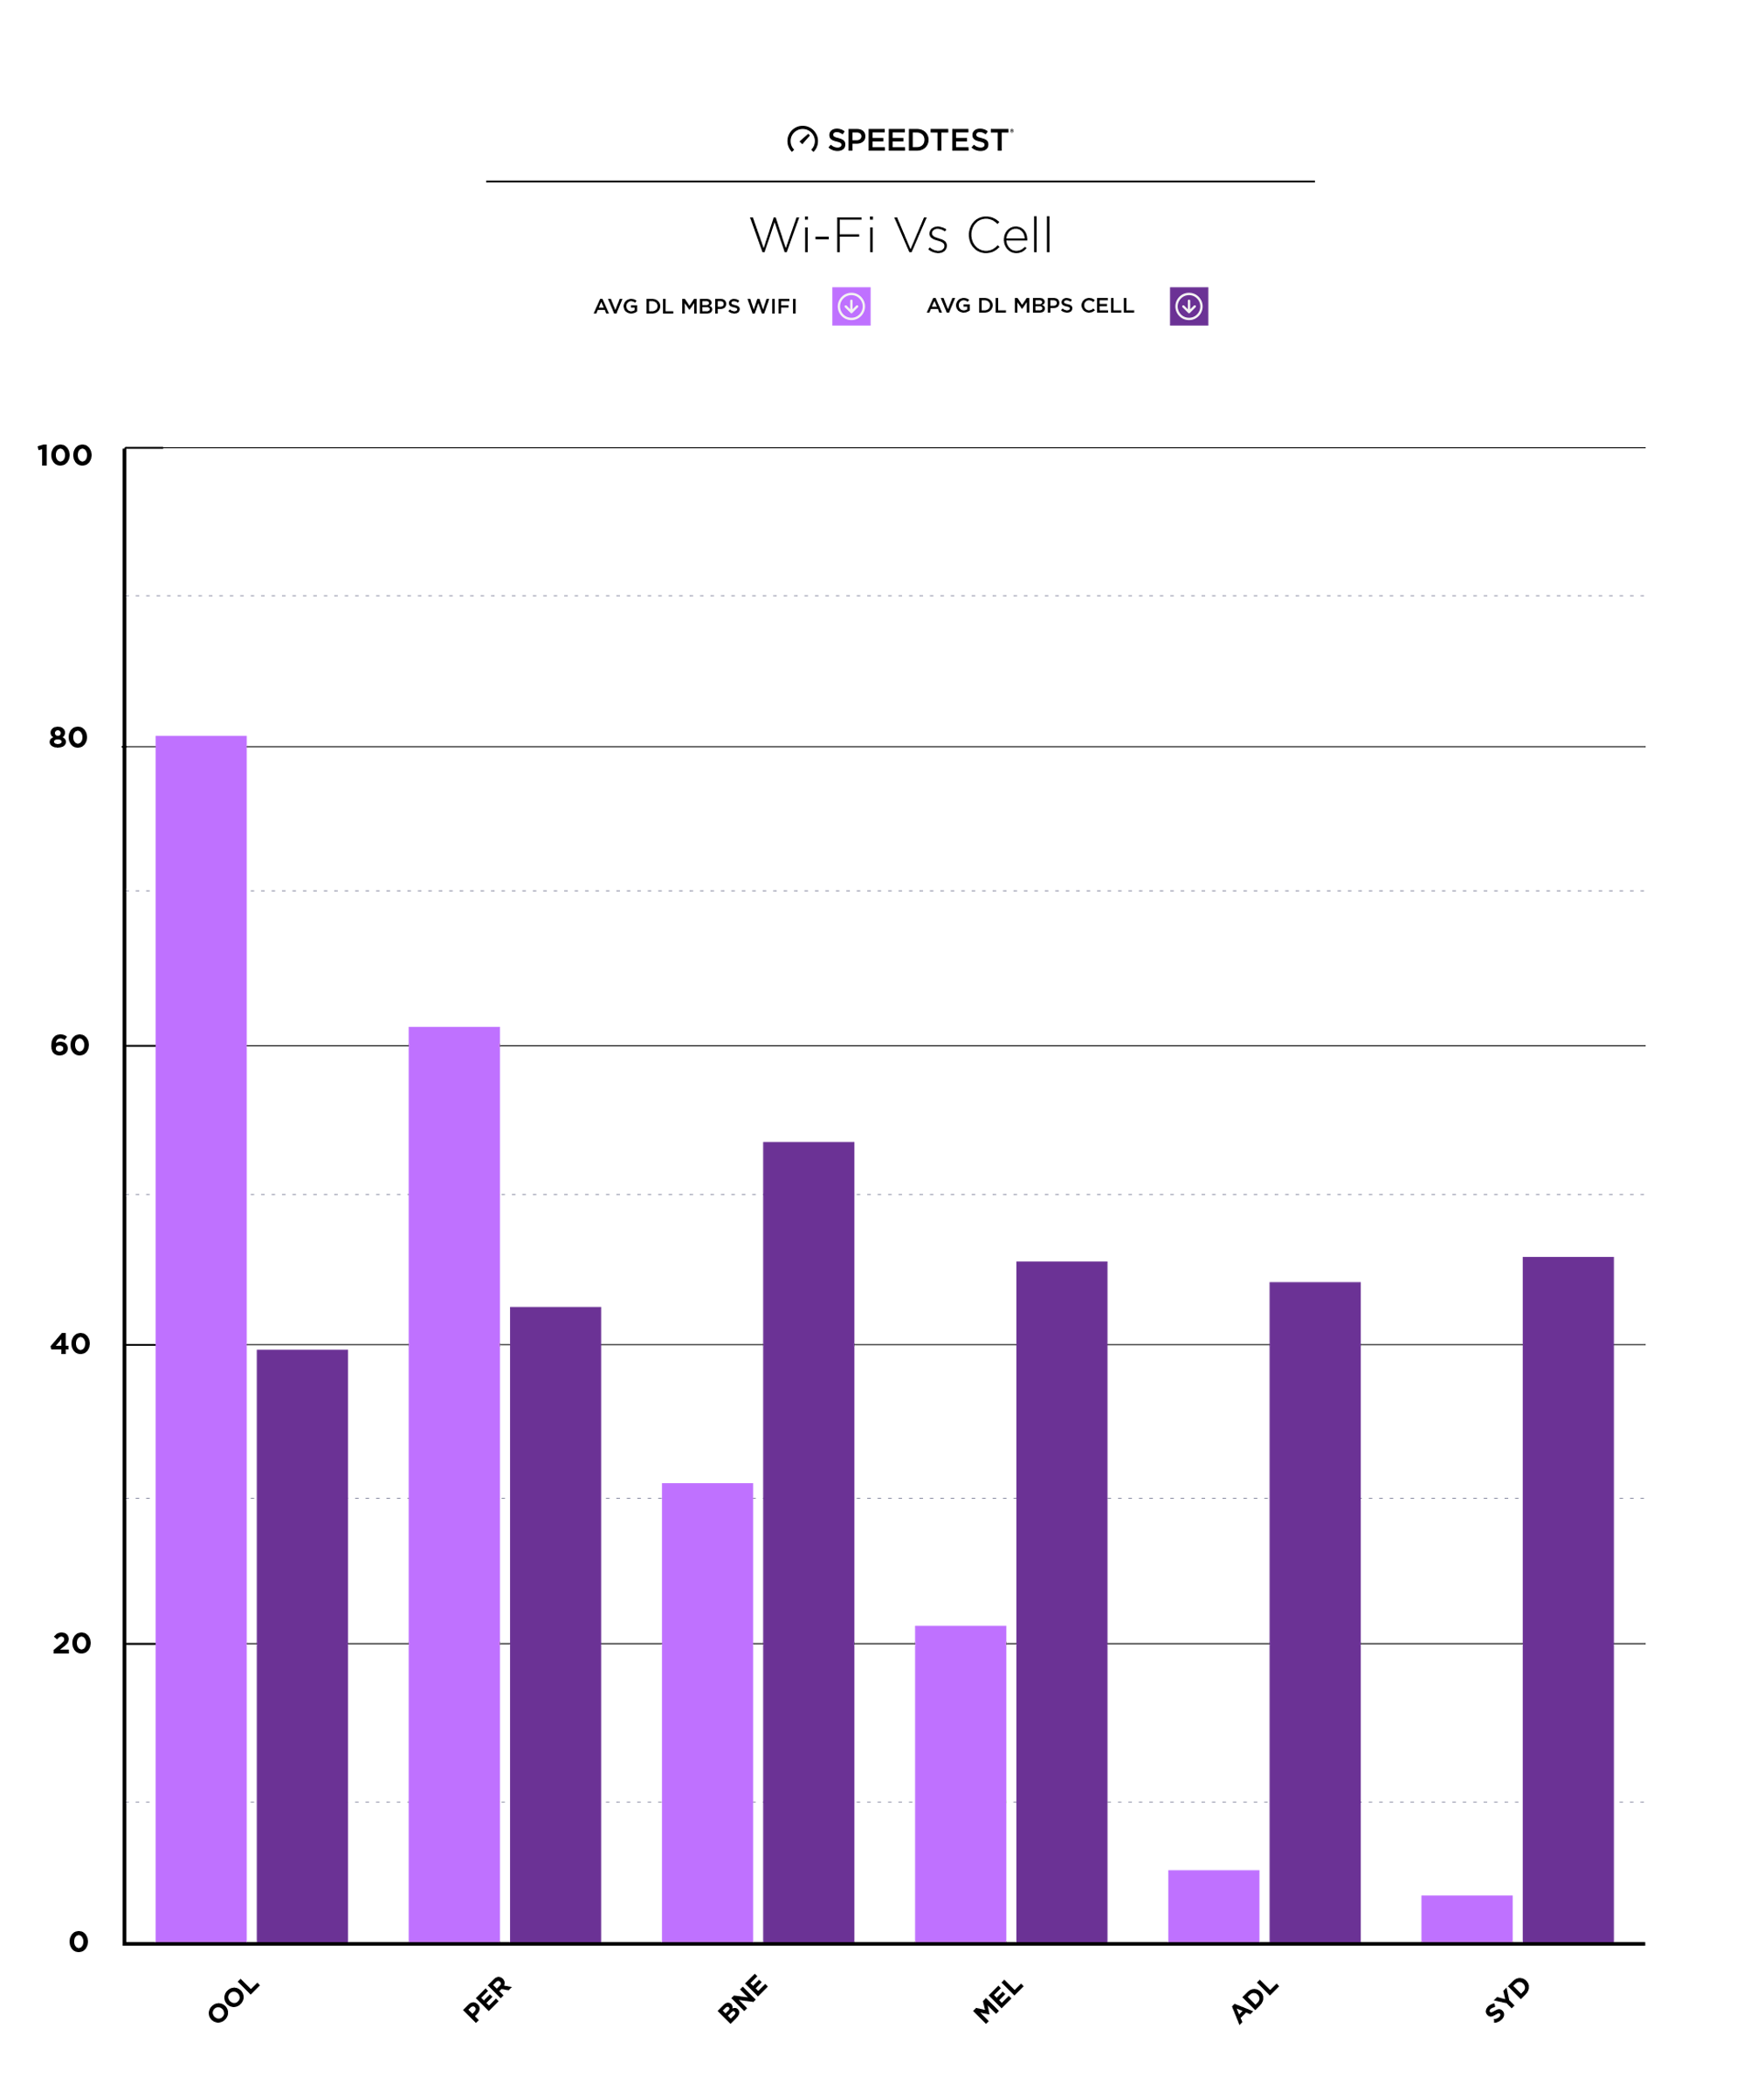
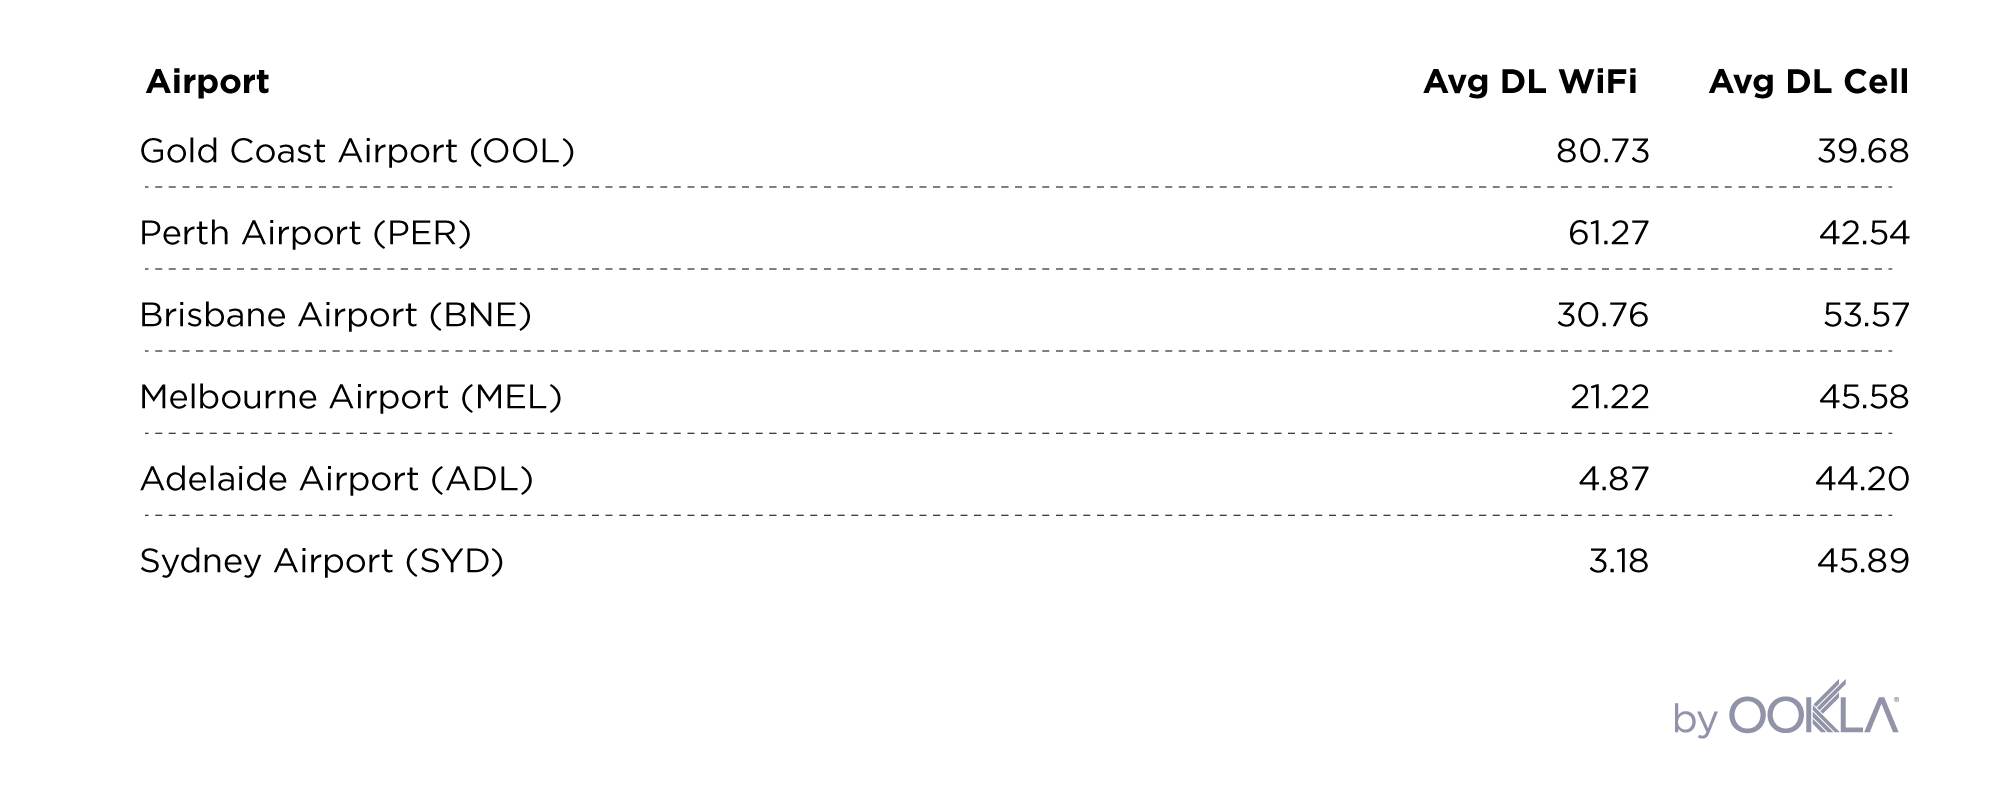
At five of the African airports we examined, the choice between Wi-Fi and cellular service is a no-brainer because the free Wi-Fi just doesn’t exist.
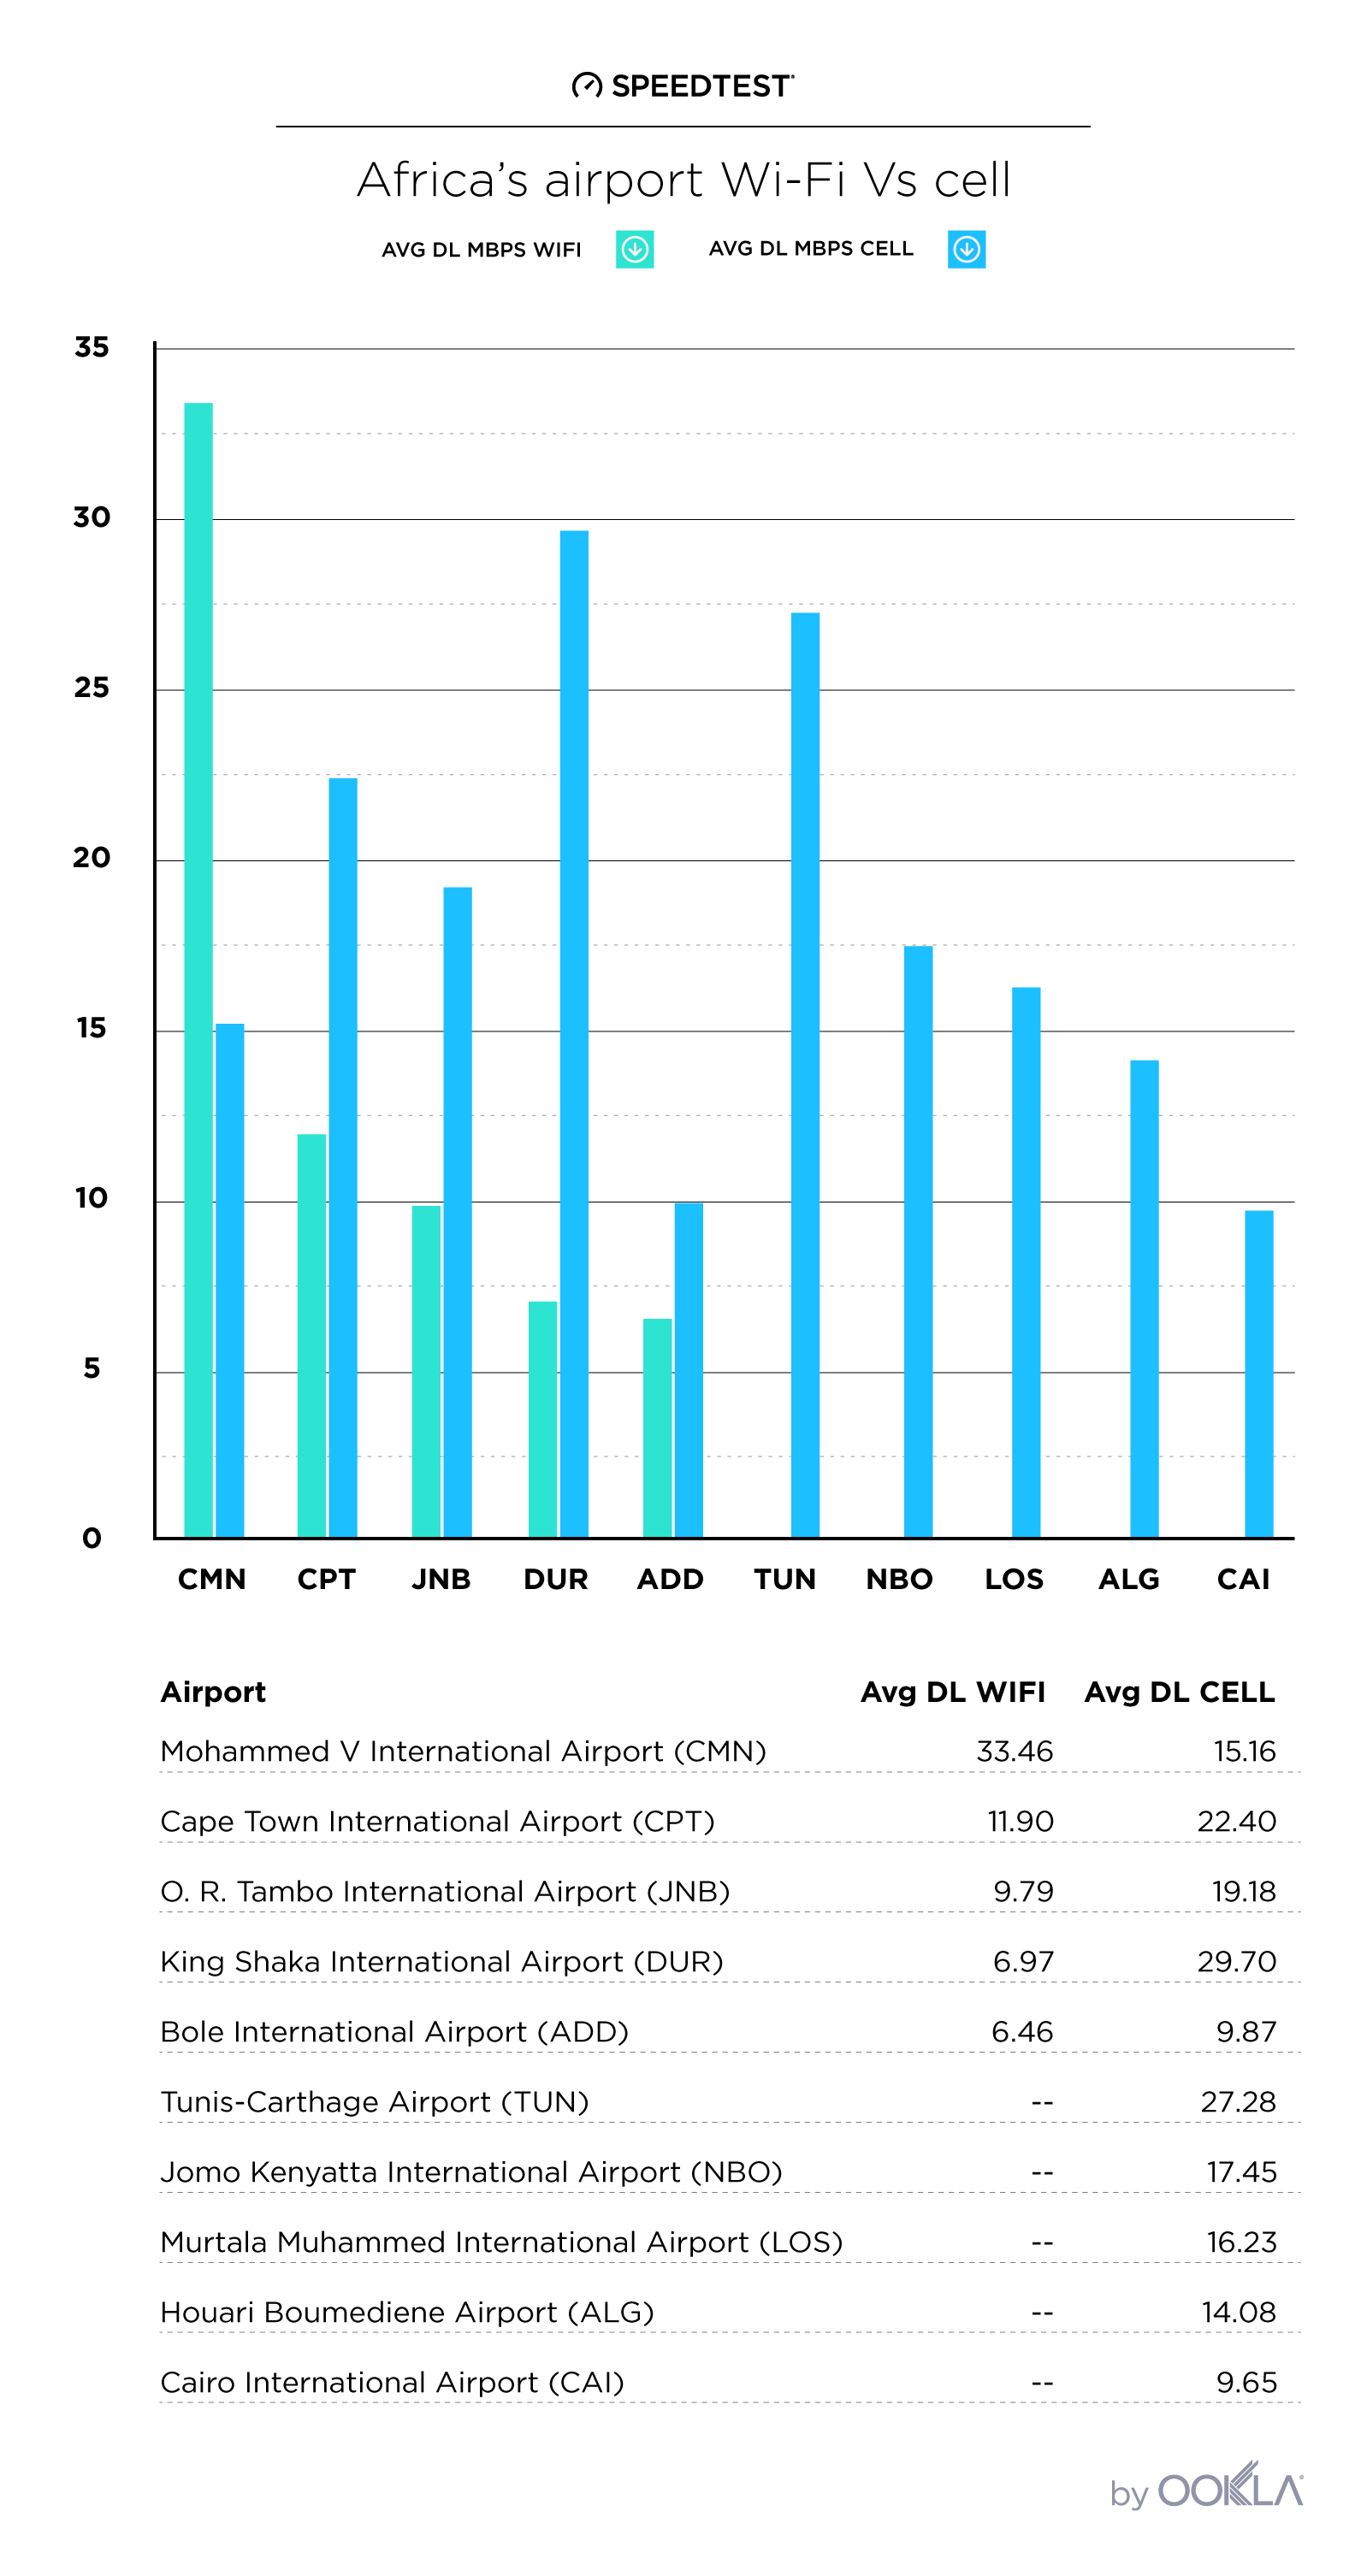
Casablanca’s download speed over Wi-Fi is 120% faster than over cellular, but it’s alone in this distinction.
At all other airports in Africa, choose cellular downloads rather than the free Wi-Fi. Cellular services is 88% faster than Wi-Fi at the Cape Town airport, 96% at Johannesburg, 326% at Durban and 53% at Addis Ababa.
Regional trends
Northern Africa
On the whole, the airports we surveyed in Northern Africa offer slower cellular downloads than those elsewhere on the continent. Tunisia is the exception.
Northern African airports were also the least likely to offer free Wi-Fi with three out of four airports showing no Speedtest results over free airport Wi-Fi. Morocco is the exception here, not only because Casablanca offers free airport Wi-Fi, but because that Wi-Fi is the fastest we found on the entire continent.
Eastern Africa
We only surveyed two airports in Eastern Africa, but what they have in common is ranking at the bottom of the list for cellular download speeds. Addis Ababa offered Wi-Fi, albeit slow. Cairo did not.
Western, Central, and Southern Africa
Africa is a very large and diverse continent and so we only examined one airport apiece in Western and Southern Africa this time around. And because we were focused on the busiest airports in Africa, we didn’t look at any airports in Central Africa at all. We’re hesitant to draw any trend lines based on this limited data, but we are definitely interested to learn more about internet performance in Africa as a whole and at airports in Africa. If you want to show us what your experience of the internet in any part of Africa (or anywhere else) is like, take a Speedtest on Android or iOS.
Ookla retains ownership of this article including all of the intellectual property rights, data, content graphs and analysis. This article may not be quoted, reproduced, distributed or published for any commercial purpose without prior consent. Members of the press and others using the findings in this article for non-commercial purposes are welcome to publicly share and link to report information with attribution to Ookla.