| January 24, 2018

GOOOOAL: Which World Cup Finalist Scored the Fastest Internet in their Capital City?

Whether you call it soccer or football, everyone calls the World Cup fun. We couldn’t wait for the actual match-ups in June, so we decided to pit the qualifying countries against one another to see who has the fastest internet speeds in their capital cities. The results might surprise you.

Get ready to watch Russia best Brazil and Portugal defeat Iran; meanwhile, Argentina and Nigeria and Belgium and England are preparing for penalty shoot-outs.

Using data from Speedtest Intelligence for Q3-Q4 2017, we’ve calculated which capital cities of World Cup-qualifying countries have the fastest mobile and fixed broadband speeds. We also took a peek at the fastest carriers and internet service providers (ISPs) in each capital using Speed Score, a comprehensive metric that combines measures of internet performance at all levels.

Mobile winners

Iceland’s sixth place ranking for mobile download speed in the Speedtest Global IndexTM virtually assured that Reykjavík would come out at the top of the list of fastest World Cup contenders. Canberra represents Australia well with a second place finish for mobile download speeds among World Cup capitals. And Brussels, Belgium barely surpasses Bern, Switzerland for a third place finish.

Mobile Internet Speeds
Capitals of World Cup Qualifying Countries | Q3 – Q4 2017
Country Capital City Average Download (Mbps) Average Upload (Mbps)
Iceland Reykjavík 55.49 21.53
Australia Canberra 44.24 12.60
Belgium Brussels 42.52 16.74
Switzerland Bern 42.02 17.52
South Korea Seoul 41.85 14.15
Denmark Copenhagen 41.78 18.29
Croatia Zagreb 41.16 16.40
Sweden Stockholm 40.12 12.63
Spain Madrid 38.30 14.02
Portugal Lisbon 30.60 11.39
Serbia Belgrade 30.33 12.49
France Paris 29.03 9.26
Poland Warsaw 26.94 9.84
Germany Berlin 25.83 9.51
England London 25.09 11.49
Russia Moscow 21.89 8.49
Japan Tokyo 19.89 7.10
Uruguay Montevideo 19.82 11.49
Mexico Mexico City 19.11 11.51
Peru Lima 18.33 12.90
Tunisia Tunis 18.27 8.07
Brazil Brasília 18.00 8.64
Morocco Rabat 17.32 9.76
Colombia Bogotá 16.87 9.50
Nigeria Abuja 16.17 6.76
Iran Tehran 15.05 7.04
Argentina Buenos Aires 13.77 7.70
Egypt Cairo 13.15 6.33
Panama Panama City 12.89 8.45
Saudi Arabia Riyadh 12.28 8.88
Senegal Dakar 8.85 3.81
Costa Rica San José 5.97 3.33

Looking at the group draw, Group A fares the worst with 16th place Moscow, Russia being the capital city with the fastest mobile downloads in the group. In Group B, Spain comes out on top. Australia wins Group C, Iceland takes Group D, Switzerland leads Group E and South Korea has the fastest mobile download speed in Group F. Belgium finishes first in Group G and Poland prevails in Group H, despite a 13th place finish overall.

From a regional perspective, European capitals top the rankings with all 14 European World Cup capitals sitting in the top half of the list. Latin American, Middle Eastern and African cities fare worst. Asia’s two contenders are split with Seoul boasting the fifth fastest mobile download speed among World Cup capitals and Tokyo, Japan coming in 17th.

The fastest World Cup capital in Latin America (Montevideo, Uruguay) shows a 64.3% slower mobile download speed than Reykjavík. First place among African World Cup capitals, Rabat, Morocco is 68.8% slower than Reykjavík for mobile downloads. And Tehran, Iran, the fastest World Cup capital in the Middle East, is 72.9% slower than Reykjavík.

Fastest carriers

We also looked into which carriers were fastest in each of the 32 World Cup capital cities.

With Speed Scores ranging from 8.89 in Dakar, Senegal to 46.57 in Brussels, mobile carrier Orange was fastest in four cities and tied for fastest in one. Vodafone was fastest in both Lisbon, Portugal and Madrid, Spain with comparable Speed Scores in the two locations. The rest of the cities show the diversity of fastest carriers that you might expect from a worldwide competition.

Fastest Carriers Speeds
Capitals of World Cup Qualifying Countries | Q3 – Q4 2017
Country Capital City Fastest Carrier Speed Score
Argentina Buenos Aires Personal 16.15
Australia Canberra Telstra 50.21
Belgium Brussels Orange 46.57
Brazil Brasília Claro 24.72
Colombia Bogotá Avantel 20.93
Costa Rica San José ICE 8.30
Croatia Zagreb Hrvatski Telekom 49.35
Denmark Copenhagen TDC / Telia 45.34 / 45.09
Egypt Cairo Orange 16.50
England London EE 36.83
France Paris Orange 33.15
Germany Berlin Telekom 53.54
Iceland Reykjavík Nova 64.61
Iran Tehran MTN IranCell 15.89
Japan Tokyo SoftBank 27.26
Mexico Mexico City AT&T 20.26
Morocco Rabat inwi 20.51
Nigeria Abuja MTN 29.23
Panama Panama City Cable & Wireless Panama / Movistar 14.85 / 14.80
Peru Lima Entel Peru 20.73
Poland Warsaw T-Mobile 36.07
Portugal Lisbon Vodafone 42.44
Russia Moscow MegaFon 37.06
Saudi Arabia Riyadh Zain 13.20
Senegal Dakar Orange 8.89
Serbia Belgrade Vip mobile 45.56
South Korea Seoul LG U+ 50.03
Spain Madrid Vodafone 40.17
Sweden Stockholm Telia 54.49
Switzerland Bern Sunrise / Swisscom 42.14 / 41.91
Tunisia Tunis Ooredoo / Orange 19.90 / 19.89
Uruguay Montevideo Antel 20.35

Fixed broadband winners

Given that Iceland ranks second in the world for fixed broadband download speed on the Speedtest Global Index and has the world’s highest gigabit user penetration (GUP), we’re not surprised to see Reykjavík shut out the competition by coming out on top of World Cup contenders for fixed broadband speed, too. Seoul, South Korea comes in second for fixed broadband download speed among World Cup capitals and Paris, France takes third.

Fixed Broadband Internet Speeds
Capitals of World Cup Qualifying Countries | Q3 – Q4 2017
Country Capital City Average Download (Mbps) Average Upload (Mbps)
Iceland Reykjavík 142.89 154.28
South Korea Seoul 130.75 131.96
France Paris 112.58 55.86
Sweden Stockholm 98.77 66.68
Spain Madrid 86.59 73.43
Japan Tokyo 75.88 70.46
Denmark Copenhagen 72.74 52.13
Switzerland Bern 68.82 54.44
Poland Warsaw 62.57 16.19
Portugal Lisbon 55.80 30.97
England London 52.53 16.12
Germany Berlin 46.84 9.52
Russia Moscow 45.25 42.96
Belgium Brussels 43.25 9.63
Panama Panama City 29.11 5.93
Australia Canberra 28.85 12.46
Serbia Belgrade 26.45 5.59
Croatia Zagreb 26.20 11.40
Mexico Mexico City 24.11 10.14
Uruguay Montevideo 23.02 5.82
Argentina Buenos Aires 22.03 4.26
Brazil Brasília 21.57 5.29
Saudi Arabia Riyadh 20.93 9.05
Peru Lima 18.15 3.51
Colombia Bogotá 13.43 6.48
Morocco Rabat 11.83 2.51
Iran Tehran 9.33 4.18
Costa Rica San José 8.79 4.29
Nigeria Abuja 8.07 5.27
Tunisia Tunis 7.82 4.49
Senegal Dakar 7.42 3.11
Egypt Cairo 5.61 1.92

Group A again suffers on the fixed side with leader Russia coming in 13th based on Moscow’s fixed broadband download speed. Spain’s still the front-runner of Group B. France takes Group C, Iceland wins Group D, Switzerland tops Group E, South Korea reigns over Group F, England heads up Group G and Japan starts Group H based on average download speeds over fixed broadband in their respective capitals.

European capitals again fare well, with 12 of the 14 placing in the top half of fastest World Cup capitals for fixed broadband download speed. Belgrade, Serbia and Zagreb, Croatia rank 17th and 18th, respectively. Tokyo ranks much better for fixed broadband download speed than for mobile, which puts both Asian World Cup capitals in the top six.

With the exception of Panama City, Panama, which ranks 15th, all Latin American World Cup capitals are in the bottom half of the list for download speed over fixed broadband. As are all Middle Eastern and African capital cities.

Panama City’s fixed broadband download speed is 79.6% slower than Reykjavík’s. Riyadh, Saudia Arabia boasts the title of fastest World Cup capital in the Middle East, but is still 85.4% slower for fixed broadband downloads than Reykjavík. The fastest World Cup capital in Africa — Rabat, Morocco — is 91.7% slower than Reykjavík.

Fastest providers

Comparing Speed Scores for fixed broadband across World Cup capitals, Vodafone had wins in Berlin, Germany and Lisbon and Orange took Paris and tied for first in Madrid. The rest of the fastest ISPs vary by location as listed below:

Fastest ISPs Speeds
Capitals of World Cup Qualifying Countries | Q3 – Q4 2017
Country Capital City Fastest ISP Speed Score
Argentina Buenos Aires Cablevisión Fibertel 21.72
Australia Canberra iiNet 33.23
Belgium Brussels Telenet 66.95
Brazil Brasília NET Virtua 27.30
Colombia Bogotá ETB 19.17
Costa Rica San José Cabletica 8.28
Croatia Zagreb vip 30.23
Denmark Copenhagen Fiberby 103.26
Egypt Cairo TE Data 4.84
England London Hyperoptic 117.40
France Paris Orange 107.20
Germany Berlin Vodafone 55.46
Iceland Reykjavík Nova 278.06
Iran Tehran Mobin Net 11.74
Japan Tokyo So-net 118.05
Mexico Mexico City Axtel 45.83
Morocco Rabat Maroc Telecom 9.25
Nigeria Abuja MTN 10.73
Panama Panama City Cable Onda 25.08
Peru Lima Movistar 16.64
Poland Warsaw UPC 82.72
Portugal Lisbon Vodafone 61.80
Russia Moscow MGTS 62.00
Saudi Arabia Riyadh STC 16.46
Senegal Dakar Tigo 6.42
Serbia Belgrade SBB 34.60
South Korea Seoul KT 162.45
Spain Madrid Masmovil / Orange 101.52 / 101.34
Sweden Stockholm Ownit 158.78
Switzerland Bern Fiber7 241.93
Tunisia Tunis TOPNET 7.61
Uruguay Montevideo Antel 22.01

Did your team not come out as expected? Or are you defending a tight match? Take a Speedtest on Android, iOS or on the web and we’ll check back in on scores closer to the main event.

Ookla retains ownership of this article including all of the intellectual property rights, data, content graphs and analysis. This article may not be quoted, reproduced, distributed or published for any commercial purpose without prior consent. Members of the press and others using the findings in this article for non-commercial purposes are welcome to publicly share and link to report information with attribution to Ookla.

| December 10, 2018

The World’s Internet in 2018: Faster, Modernizing and Always On

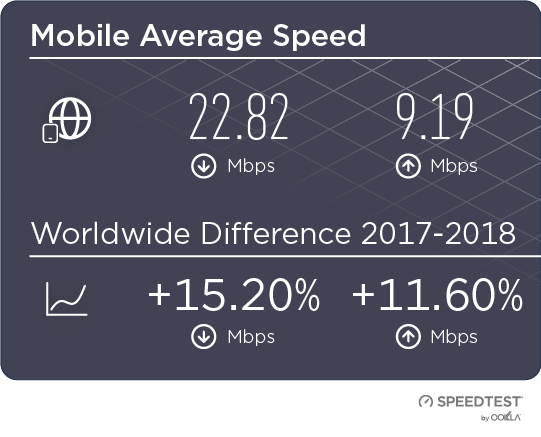
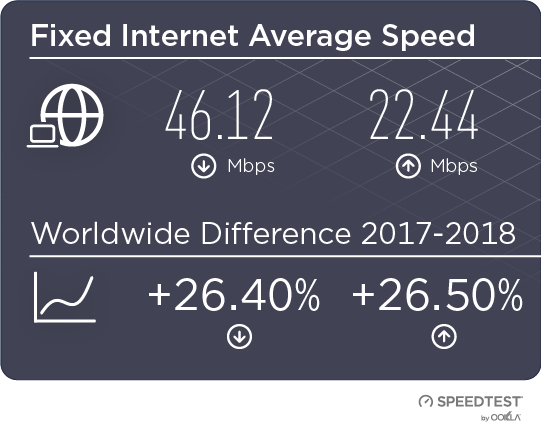
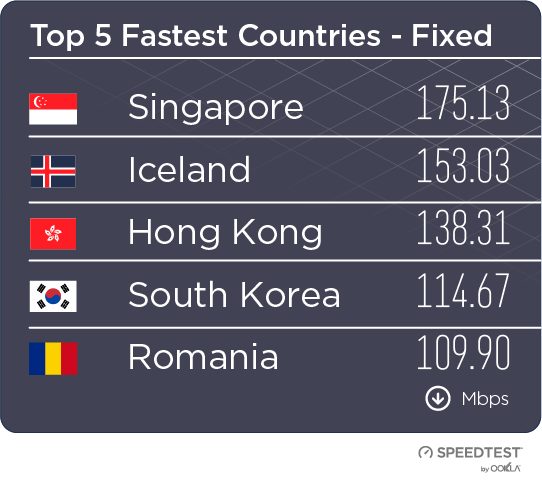
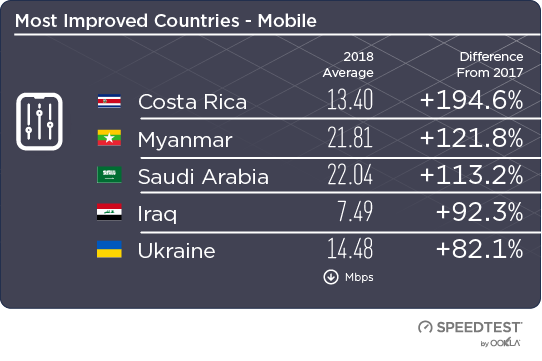
When it comes to the internet, the news is mostly good for 2018. Download and upload speeds are increasing across the globe on both mobile and fixed broadband. 5G is on the horizon and gigabit service is expanding.

We looked at data from Speedtest IntelligenceTM, Ookla’s flagship data platform, from December 2017 through November 2018, to analyze everything from global internet speeds to the world’s fastest countries to when people are online. We also investigated which parts of the world are seeing the most benefit from high speed LTE on mobile and gigabit speeds on fixed broadband.

Mobile speeds increased more than 15% in 2018

Graphic-Tables-Final-v2_mobile-average-speed-3

The world’s average mobile download speed of 22.82 Mbps increased 15.2% over the past year, while mobile upload speed increased 11.6% to reach 9.19 Mbps.

Graphic-Tables-Final-v2_android-vs-ios-1

With a mean download speed of 27.84 Mbps and a mean upload of 10.61 Mbps, worldwide speeds on iOS devices were faster than those on Android (21.35 Mbps download, 8.73 Mbps upload) in 2018. This is likely due to market factors as Android devices are more popular in emerging markets where internet speeds tend to be slower.

However, download speed on Android devices increased 19.0% and upload speed increased 15.1%, more than those on iOS (18.0% increase for download and 11.1% increase for upload), which is good news for those emerging markets.

Fixed broadband speeds increased more than 26% in 2018

Graphic-Tables-Final-v2_fixed-average

On a global level, fixed broadband speeds were nearly twice as fast as those on mobile in 2018. The world’s average download speed on fixed broadband was 46.12 Mbps, 26.4% faster than last year. Upload speed increased 26.5% to 22.44 Mbps.

All said, though, both mobile and fixed broadband speeds increased at a slower rate in 2018 than they did in 2017.

Countries with the fastest internet in 2018

Graphic-Tables-Final-v2_top-5-mobile

The countries with the fastest mean download speeds over mobile in the past 12 months were: Norway (63.19 Mbps), Iceland (58.68 Mbps), Qatar (55.17 Mbps), Singapore (54.71 Mbps) and the Netherlands (53.42 Mbps).

Graphic-Tables-Final-v2_top-5-fixed

Singapore showed the world’s fastest mean download speeds over fixed broadband during the past twelve months at 175.13 Mbps. Next fastest were Iceland (153.03 Mbps), Hong Kong (138.31 Mbps), South Korea (114.67 Mbps) and Romania (109.90 Mbps).

To keep up with month-to-month internet speeds at a global level, visit the Speedtest Global Index.

Most improved countries for 2018 internet speeds

Graphic-Tables-Final-v2_most-improved-mobile

Costa Rica saw the largest increase in mobile download speed over the past year at 194.6%. Myanmar was second with 121.8%, Saudi Arabia third (113.2%), Iraq fourth (92.3%) and the Ukraine fifth (82.1%).

The countries with the largest improvements in upload speeds were Bangladesh (179.2%), the Ukraine (172.5%), Costa Rica (163.4%), Myanmar (146.9%) and Iraq (126.7%).

Graphic-Tables-Final-v2_most-improved-fixed

Paraguay saw the biggest increase in mean download speed over fixed broadband in the world over the past year at 268.6%. Guyana was second with 113.5%, Libya third (108.0%), Malaysia fourth (89.5%) and Laos fifth (76.2%).

Libya showed the most improvement in mean upload speed over fixed broadband during the past twelve months at 176.4%. Guyana was second with 116.1%, Malaysia third (95.2%), Belize fourth (88.9%) and Iraq fifth (76.8%).

4G is increasing mobile speeds

2017-2018-LTE-growth

When we looked specifically at Speedtest results on 4G, we saw that mean download speeds increased in most countries. Costa Rica was most improved for 4G download speed as was the case with overall download speed on mobile increasing 184.3% year over year. Saudi Arabia was second at 110.2% and Myanmar third at 78.0%.

Most encouragingly, we saw the number of Speedtest results over 4G increase in all but 15 countries. This could indicate that 4G availability is expanding. Tanzania saw the greatest increase with 355.0% more tests over 4G in 2018 than in 2017. Malta was second at 267.2% and Algeria third at 143.7%. We can see this expansion on the map above as 4G results fill in areas of the globe that were previously blank.

Gigabit coverage is expanding globally

gigabit-fade-1

Gigabit is in the news as ISPs across the globe expand their high-speed networks. We looked at Speedtest results on fixed broadband in excess of 750 Mbps to see which cities are benefitting most. Comparing locations with 100 or more gigabit-speed results in 2017 with those in 2018, that expansion becomes obvious. In 2017, 60 countries met our gigabit test threshold. In 2018, 16 additional countries joined our gigabit list. We’re also seeing that more cities around the world now have access to gigabit speeds.

Also exciting is that cities which already had gigabit in 2017 saw increases in the number of gigabit-speed results in 2018 as ISPs continue to build out infrastructure across cities. Many cities saw their first real gigabit expansion in 2018. For example, we saw the number of gigabit tests in New Delhi increase from 119 gigabit speed results in 2017 to 20,239 in 2018, that’s a mind-boggling 16,908% increase. Chennai, India saw a 7,481% increase (from 763 to 57,840) and Cormeilles-en-Parisis, France jumped 6,480%. Huge leaps in the number of gigabit-speed results were also seen in Gdańsk, Poland (6,338%); Rome, Italy (4,909%); Lancashire, United Kingdom (3,962%); Ota, Japan (3,240%); São Paulo, Brazil (2,947%); Hangzhou, China (2,669%) and Turda, Romania (2,636%).

When people are online

point-3-sec-final-1

The internet is always on, but we were surprised to see how consistently and steeply usage fell off on both mobile and fixed broadband after 9 pm local time. Normalizing the time of day for Speedtest results from around the globe, we found that usage bottoms out at 4 am and then climbs steeply again until 10 am. From there, the internet gets gradually busier until that night time drop off.

Internet in the world’s largest countries

The world’s five most populous countries are notably absent from the lists of fastest and most improved countries on mobile and fixed broadband. China, India, the U.S., Indonesia and Brazil represent about 46% of the world’s population, which makes their internet speeds worth noting nonetheless.

Internet Speeds in the World’s Largest Countries
Speedtest Data | December 2017-November 2018
Country Mean Mobile Download Speed (Mbps) % Improvement in Mobile Speed Mean Fixed Download Speed (Mbps) % Improvement in Fixed Speed
China 30.96 -5.8% 76.03 42.5%
India 9.11 15.2% 23.00 50.4%
United States 28.50 22.3% 92.77 37.3%
Indonesia 10.39 5.3% 14.89 18.3%
Brazil 18.65 29.3% 22.95 39.4%

Mobile internet speeds in the world’s largest countries

China had the fastest average mobile download speed among the world’s most populous countries in the past twelve months. However, China’s mobile download speed decreased during that time. The United States is fast catching up with China on mobile download speed.

Brazil occupied a middle ground for mobile download speed among the world’s most populous countries and showed the fastest rate of increase. India and Indonesia were at the bottom of this list. While the two nations show similar mobile download speeds to each other, India’s mobile download speed is improving much more quickly than Indonesia’s.

Fixed broadband speeds in the largest countries in the world

The United States showed the fastest fixed broadband download speed among the world’s most populous countries over the past year. China was second, India and Brazil nearly tie for third and Indonesia follows.

India showed the largest improvement in mean download speed over fixed broadband of the world’s five largest countries. China was second, Brazil third, the U.S. fourth and Indonesia fifth.

We’ll be back throughout 2019 to report on the state of the world’s internet as it evolves. Until then, take a Speedtest to find out how your network compares.

Ookla retains ownership of this article including all of the intellectual property rights, data, content graphs and analysis. This article may not be quoted, reproduced, distributed or published for any commercial purpose without prior consent. Members of the press and others using the findings in this article for non-commercial purposes are welcome to publicly share and link to report information with attribution to Ookla.

| February 20, 2019

An Expansive Analysis of European Mobile Roaming Speeds and Behaviors

Last year we took a look at how free roaming was working out for EU citizens in terms of speeds and latency. This year we’ve expanded our analysis to all European countries and included data on Wi-Fi roaming behavior. We’ve also added a little insight into how roaming might affect download speeds for visitors to Mobile World Congress (MWC) in Barcelona from February 25- 28, 2019.

Except where noted, this analysis is based on Speedtest data from Android devices on 4G LTE cellular connections during Q3-Q4 2018. We included data on any country with greater than 30 samples in all categories.

Most Europeans experience slower downloads while roaming

Roaming traffic is subject to deals struck between individual mobile operators on how that traffic will be prioritized, so roaming speeds can depend not only on the country of origin but also the country of destination and the plan a subscriber has selected.

Consider the following table where an Albanian experiences a mean download speed of 54.56 Mbps at home and then 38.47 Mbps while roaming elsewhere in Europe. This is expected as a roamer does not usually have a direct relationship with the mobile operator handling their data and calls abroad.

Mean Mobile Download Speeds in Europe
Speedtest Data | Q3-Q4 2018
Country Local Speed (Mbps) Roaming Speed (Mbps) % Difference
Austria 38.23 35.78 -6.4%
Belarus 16.15 19.49 20.7%
Belgium 52.58 35.42 -32.6%
Bulgaria 47.28 32.35 -31.6%
Croatia 43.83 43.60 -0.5%
Cyprus 37.13 20.58 -44.6%
Czech Republic 44.91 13.43 -70.1%
Denmark 48.83 34.89 -28.6%
Estonia 36.43 38.98 7.0%
Finland 39.33 38.20 -2.9%
France 39.94 34.97 -12.5%
Germany 33.77 28.57 -15.4%
Greece 41.35 38.08 -7.9%
Hungary 49.57 28.19 -43.1%
Iceland 69.27 35.58 -48.6%
Ireland 28.23 31.49 11.6%
Italy 32.18 43.12 34.0%
Kazakhstan 22.93 13.80 -39.8%
Latvia 30.88 33.79 9.4%
Liechtenstein 56.48 36.66 -35.1%
Lithuania 41.49 33.43 -19.4%
Luxembourg 50.91 25.08 -50.7%
Malta 56.34 34.27 -39.2%
Montenegro 45.45 49.97 10.0%
Netherlands 56.06 33.86 -39.6%
Norway 68.49 38.69 -43.5%
Poland 28.74 29.71 3.4%
Portugal 32.06 36.95 15.3%
Romania 36.64 30.74 -16.1%
Russia 20.91 20.47 -2.1%
Serbia 43.41 21.64 -50.1%
Slovakia 33.47 31.80 -5.0%
Slovenia 35.51 36.41 2.5%
Spain 36.07 22.37 -38.0%
Sweden 44.87 34.59 -22.9%
Switzerland 47.59 30.36 -36.2%
Turkey 38.19 28.77 -24.7%
Ukraine 26.07 25.48 -2.3%
United Kingdom 30.84 38.76 25.7%

Residents of the Czech Republic will face massive speed disappointment when roaming through the rest of Europe. Other countries with much better speeds at home than abroad include Luxembourg, Serbia, Iceland and Cyprus.

In ten European countries, citizens experience faster mobile downloads while roaming than they do at home. These include: Italy, the United Kingdom, Belarus, Portugal, Ireland, Montenegro, Latvia, Estonia, Poland and Slovenia. Most of these are among the slowest countries on this list, so it would make sense that their citizens would experience better speeds elsewhere in Europe than they do at home.

Europeans are connected to Wi-Fi most of the time

Customers sometimes try to get better speeds and avoid roaming fees (for those outside the E.U.) and data overages by connecting to Wi-Fi. The following table compares the percentage of time spent on Wi-Fi by a resident of a country with that of a visitor to the country.

Percentage of Time Spent on Wi-Fi in Europe
Speedtest Data | Q3-Q4 2018
Country Local Customers Visitors % Difference
Albania 61.9% 59.8% -3.4%
Andorra 73.6% 69.0% -6.2%
Armenia 61.5% 68.1% 10.7%
Austria 65.6% 36.7% -44.1%
Azerbaijan 67.0% 70.7% 5.5%
Belarus 63.9% 58.3% -8.9%
Belgium 71.1% 32.9% -53.7%
Bosnia and Herzegovina 71.9% 66.0% -8.2%
Bulgaria 65.2% 46.8% -28.2%
Croatia 66.1% 41.0% -38.0%
Cyprus 70.9% 58.4% -17.7%
Czech Republic 75.1% 38.9% -48.1%
Denmark 70.4% 52.9% -24.9%
Estonia 61.2% 45.6% -25.4%
Finland 56.6% 47.1% -16.7%
France 60.2% 43.1% -28.5%
Georgia 61.4% 62.2% 1.3%
Germany 72.2% 42.4% -41.3%
Greece 73.5% 52.2% -28.9%
Hungary 71.9% 35.0% -51.3%
Iceland 65.7% 58.2% -11.4%
Ireland 67.2% 52.4% -22.0%
Italy 64.1% 48.9% -23.7%
Kazakhstan 57.7% 64.7% 12.3%
Latvia 60.9% 43.8% -28.1%
Liechtenstein 71.7% 58.2% -18.9%
Lithuania 66.8% 43.3% -35.1%
Luxembourg 63.6% 26.0% -59.1%
Macedonia 65.3% 52.9% -18.9%
Malta 74.3% 58.0% -22.0%
Moldova 67.2% 67.3% 0.2%
Montenegro 63.6% 65.2% 2.5%
Netherlands 73.0% 42.5% -41.7%
Norway 74.7% 59.7% -20.1%
Poland 62.5% 48.1% -23.1%
Portugal 69.1% 54.7% -20.9%
Romania 62.4% 48.7% -21.9%
Russia 58.8% 65.9% 12.2%
San Marino 66.8% 39.7% -40.6%
Serbia 68.6% 61.2% -10.7%
Slovakia 69.6% 35.1% -49.6%
Slovenia 63.3% 26.4% -58.3%
Spain 70.8% 53.0% -25.2%
Sweden 71.8% 44.9% -37.4%
Switzerland 62.4% 47.2% -24.4%
Turkey 61.7% 73.0% 18.4%
Ukraine 61.5% 62.4% 1.5%
United Kingdom 71.3% 54.0% -24.3%

Finland showed the lowest time spent on Wi-Fi by residents at 56.6%. Kazakhstan was second at 57.7% followed by Russia (58.8%), France (60.2%) and Latvia (60.9%). The Czech Republic showed the highest time spent on Wi-Fi by residents at 75.1%. Norway was second at 74.7% followed by Malta (74.3%), Andorra (73.6%) and Greece (73.5%).

When it comes to time spent on Wi-Fi by visitors, Luxembourg had the lowest percentage at 26.0%. Slovenia was second at 26.4% followed by Belgium (32.9%), Hungary (35.0%) and Slovakia (35.1%). Turkey showed the highest time spent on Wi-Fi by visitors at 73.0%. Azerbaijan was second at 70.7% followed by Andorra (69.0%), Armenia (68.1%) and Moldova (67.3%).

Luxembourg saw the largest difference in time spent on Wi-Fi between residents and visitors with visitors using Wi-Fi 59.1% less than residents. Slovenia was close behind at 58.3%, followed by Belgium (53.7%) and Hungary (51.3%). On the other end of the spectrum, visitors to Turkey were on Wi-Fi 18.4% longer than residents followed by Kazakhstan (12.3%) and Russia (12.2%).

Roaming dramatically increases latency in Europe

Because roaming signals are routed through a user’s home network, latency is always an issue in roaming. Speedtest data shows that latency while roaming is a much larger issue for residents of some countries than it is for others.

Comparing European Latency In-Country and Abroad
Speedtest Data | Q3-Q4 2018
Country Local Latency (ms) Roaming Latency (ms) % Difference
Austria 24 83 245.8%
Belarus 32 75 134.4%
Belgium 24 81 237.5%
Bulgaria 24 126 425.0%
Croatia 32 86 168.8%
Cyprus 20 194 870.0%
Czech Republic 24 86 258.3%
Denmark 24 98 308.3%
Estonia 23 78 239.1%
Finland 26 104 300.0%
France 42 87 107.1%
Germany 33 87 163.6%
Greece 27 137 407.4%
Hungary 22 94 327.3%
Iceland 18 163 805.6%
Ireland 34 114 235.3%
Italy 52 116 123.1%
Kazakhstan 35 164 368.6%
Latvia 24 94 291.7%
Liechtenstein 40 90 125.0%
Lithuania 26 108 315.4%
Luxembourg 23 73 217.4%
Malta 18 141 683.3%
Montenegro 18 42 133.3%
Netherlands 26 81 211.5%
Norway 36 109 202.8%
Poland 33 104 215.2%
Portugal 27 102 277.8%
Romania 26 131 403.8%
Russia 42 161 283.3%
Serbia 22 76 245.5%
Slovakia 30 69 130.0%
Slovenia 21 69 228.6%
Spain 45 118 162.2%
Sweden 30 118 293.3%
Switzerland 26 75 188.5%
Turkey 26 115 342.3%
Ukraine 35 116 231.4%
United Kingdom 37 107 189.2%

Residents of Cyprus saw an average latency of 194 ms while roaming in Europe. The country with the second highest latency for residents roaming abroad was Kazakhstan at 164 ms, followed by Iceland (163 ms). Russia (161 ms) and Malta (141 ms). In contrast, Montenegro had a lower latency for residents roaming abroad than Italy did for residents using their mobile phones locally.

Roaming performance at MWC

MWC, the largest mobile conference in the world, has Barcelona teeming with visitors from across the globe all trying to connect to their home networks. During February 2018 we saw an average download speed of 34.31 Mbps while roaming in Barcelona and a mean latency of 201 ms. Visitors from the U.K. saw an average download speed of 49.00 Mbps and a mean latency of 111 ms, while those from Italy averaged a download of 32.88 Mbps and a latency of 128 ms.

What will the performance look like at this year’s conference? Schedule a meeting or come see us in Hall 2 at Booth 2i25 to learn more about our roaming data.

Ookla retains ownership of this article including all of the intellectual property rights, data, content graphs and analysis. This article may not be quoted, reproduced, distributed or published for any commercial purpose without prior consent. Members of the press and others using the findings in this article for non-commercial purposes are welcome to publicly share and link to report information with attribution to Ookla.