| February 19, 2024

Illustrating the Global Reach of 5G (Poster Download)

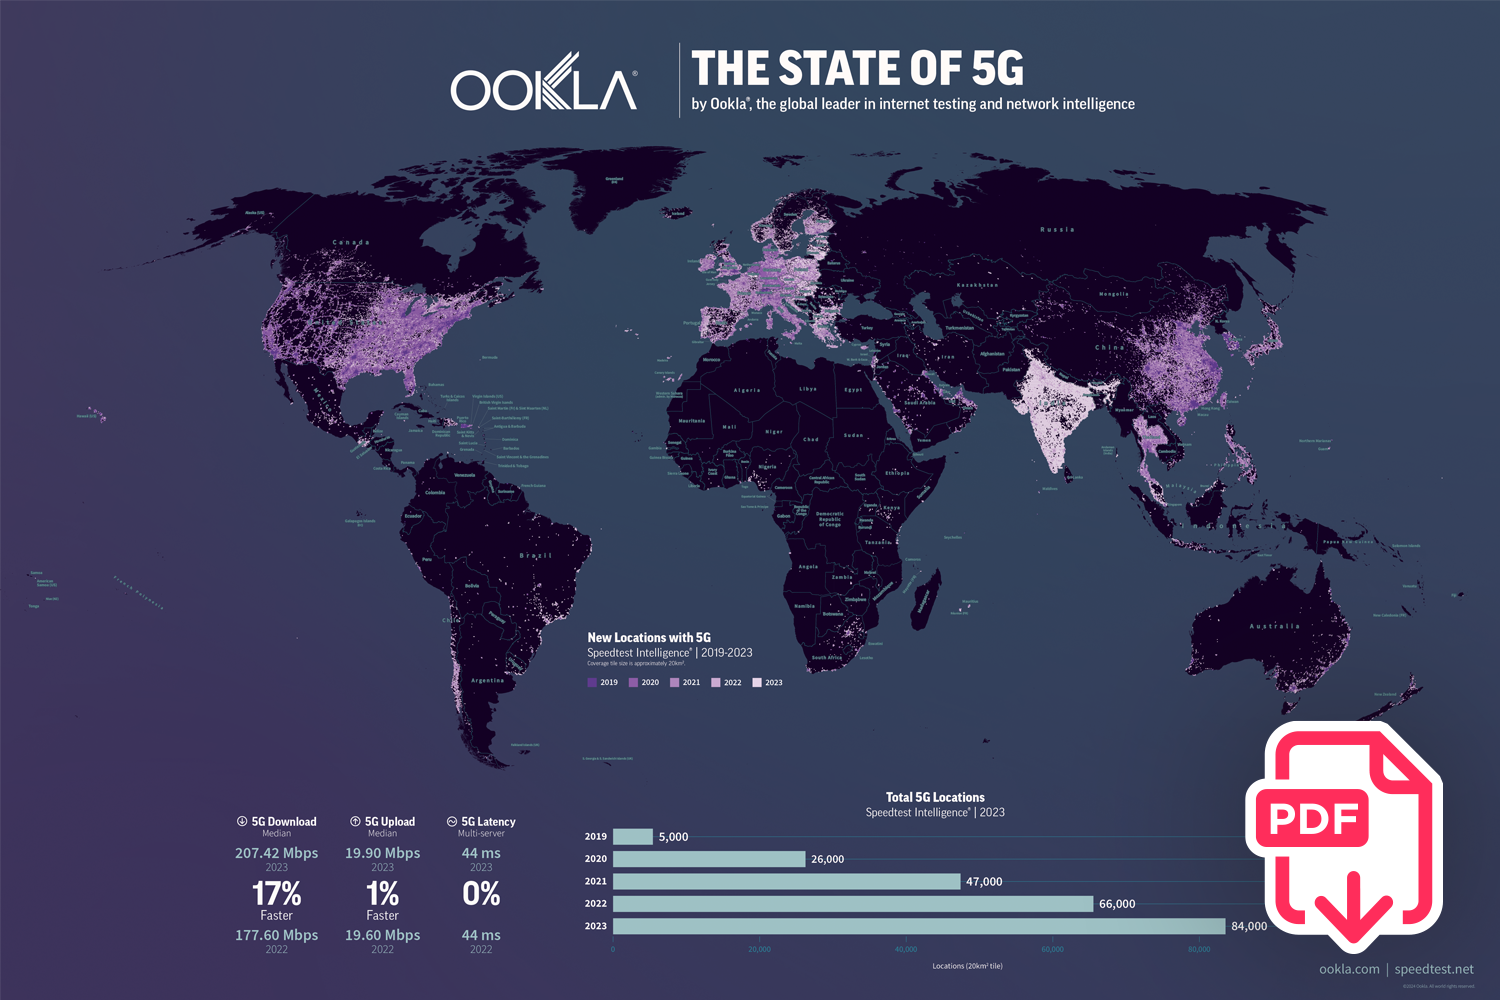
Ookla® Speedtest Intelligence® data illustrates the continued expansion of 5G networks globally, with Speedtest users in India in particular adding many new locations during the course of 2023. Our recent analysis of global 5G performance showed that newer 5G markets such as India, Malaysia, and Brazil have all contributed to an uplift in worldwide median performance. While the number of locations with 5G continues to rise, 5G download speeds show no sign of levelling off, increasing by 17% in 2023 to reach 207.42 Mbps. However, 5G upload performance has stagnated, up only 1% year-on-year to 19.90 Mbps, and latency continues to drag on the 5G experience, with no statistical difference year-on-year, with the median user globally experiencing a 5G connection latency of 44 ms.

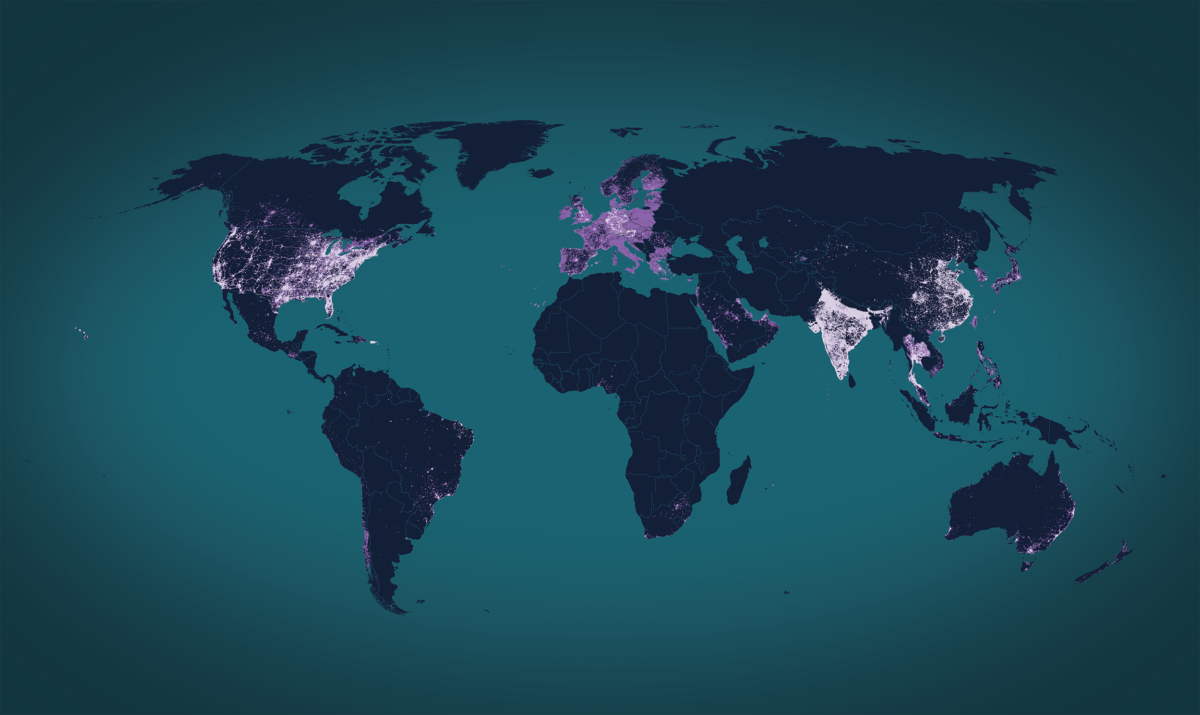
To fully appreciate the continued expansion of 5G networks around the world, we’ve created a high-resolution downloadable poster (mobile friendly version available here), detailing locations with 5G based on consumer initiated Speedtest samples.

Ookla will be at Mobile World Congress this year, located at in Booth 2I28 in Hall 2. Please drop by to discuss the state of connectivity in your market, and how Ookla’s network insights can help deliver better connected experiences.

Preview image of Ookla The State of 5G Poster. Click here to download.

Ookla retains ownership of this article including all of the intellectual property rights, data, content graphs and analysis. This article may not be quoted, reproduced, distributed or published for any commercial purpose without prior consent. Members of the press and others using the findings in this article for non-commercial purposes are welcome to publicly share and link to report information with attribution to Ookla.

| December 20, 2023

U.S. - The Rise of 5G FWA & The Battle for Fixed Broadband Customers

Fixed-wireless access (FWA) has emerged as a key 5G use case. Cellular providers in many markets are using FWA to easily enter and compete in fixed broadband markets, while fixed ISPs with access to 5G spectrum are utilizing it as a complementary access technology, allowing them to target locations where fiber access networks are not present. FWA can also be a solution to help bridge the digital divide in more remote locations where it’s uneconomical to lay fiber to connect premises.

The U.S. is at the forefront of fixed wireless access (FWA) development, with many of its major wireless carriers, including T-Mobile, Verizon, AT&T and UScellular targeting expansion. T-Mobile has built up a lead in terms of 5G fixed-wireless market share, with Verizon following closely, and AT&T recently launching a new FWA service – AT&T Internet Air. We examined Ookla Speedtest data to understand how FWA performance is evolving in the U.S., and how it is impacting churn in the market.

Key takeaways

  • T-Mobile & Verizon 5G FWA performance holding up well nationally. Despite strong customer growth, both T-Mobile and Verizon have maintained performance levels over the past year according to Speedtest data. Both ISPs recorded similar median download speeds in Q3 2023, although T-Mobile maintains an edge on median upload performance. Despite this, there are significant differences in performance at a State-level, and for urban versus rural locations.
  • Cable & DSL providers bear the brunt of user churn. The FWA value proposition is clearly resonating most with existing cable and DSL customers, which make up the vast bulk of churners to both T-Mobile’s and Verizon’s FWA services. It’s not one-way traffic however, with T-Mobile’s larger user base in particular showing some attrition to cable providers. In rural locations where options are more limited, FWA services are increasingly going head to head, with over 10% of users joining Verizon’s FWA service coming from T-Mobile.
  • Clear signs that download performance could be a key contributor to churn in the market. Our analysis of the customers of major ISPs in the US that have churned to T-Mobile’s FWA service shows that their median download performance before churning was below the median performance of all customers of these ISPs, indicating a performance short-fall that is likely contributing towards churn.
  • Further C-band spectrum will serve to strengthen FWA’s case. The release and deployment of additional C-band spectrum for all three national cellular carriers, and AT&T’s new FWA service will drive further performance gains, and further competitive pressure in 2024.

T-Mobile and Verizon FWA scaling strongly and national performance holding up well

Launched during the COVID-19 pandemic, FWA services from T-Mobile and Verizon have seen strong growth over the past three years. Aided by disruptive pricing strategies, no annual contracts, and ease of installation (self-install), net additions remain strong for both ISPs. T-Mobile’s current FWA plan retails for $50/month, but that falls to $30/month for customers subscribing to its Magenta MAX mobile plan. Verizon prices at a slight premium to T-Mobile, with its FWA service currently retailing for $60/month, but falling to $35/month with select 5G mobile plans. On the back of their success we’ve also recently seen AT&T update its FWA strategy, launching AT&T Internet Air in August 2023, with a similar pricing strategy.

Fixed Wireless Access (FWA) Customers – T-Mobile & Verizon
Company Reporting | Q3 2020 – Q3 2023

Utilizing the same 5G spectrum that its mobile customer base accesses, both T-Mobile and Verizon have been at pains to point out how they manage the on-boarding of new FWA customers, in order to limit any negative impact on performance for both cellular and FWA customers. The release and rollout of additional C-band spectrum for all three operators will provide extra headroom and the potential for improved 5G FWA performance, while T-Mobile has begun testing 5G Standalone mmWave, and has indicated that this could be utilized for 5G FWA in the future. 

Performance on T-Mobile’s and Verizon’s 5G FWA services has held up well to date, although it lags behind median download performance of the major cable and fiber ISPs. The median download speed across the US for all fixed providers combined in Q3 2023 was 207.42 Mbps. T-Mobile has recorded consistent median download speed over the past four quarters, reaching 122.48 Mbps in Q3 2023 based on Speedtest data, but saw its median upload performance erode slightly, down from 19.76 Mbps in Q4 2022, to 17.09 Mbps in Q3 2023. Verizon on the other hand improved its median download performance when compared to Q4 2022, reaching a similar level to T-Mobile, of 121.23 Mbps in Q3 2023. However, its upload performance remained lower than T-Mobile’s, at 11.53 Mbps.

U.S. 5G Fixed Wireless Access (FWA) Performance
Speedtest® Data – Custom Analysis | Q4 2022 – Q3 2023

Churn data shows Cable & DSL providers losing out to FWA

In order to understand the impact of these 5G FWA services on the U.S. fixed broadband market, we examined Speedtest data to identify users that had churned since Q2 2022 – when these services started to scale and really impact the rest of the market.

Our data shows that the bulk of churn to both T-Mobile’s and Verizon’s 5G FWA services in that time was from cable and DSL providers. Furthermore, it doesn’t skew towards rural locations, with both T-Mobile and Verizon seeing approximately 80% of their gross additions in urban locations. The aggressive pricing strategies of FWA providers have driven prices down across the market, with cable providers for example offering slimmed down broadband and content packages at competitive prices, while AT&T Fiber now prices its entry fiber package of 300 Mbps at $55/month.

Fixed Wireless Access New Recruits – Distribution of 5G FWA Gross Additions by ISP
Speedtest® Data – Custom Analysis | Q2 2022 – Q3 2023

While cable operators bear the brunt of churn to 5G FWA services at present, their strategic response in competing on price is seeing some FWA subscribers move back to cable – a trend which the availability of FWA services with no annual contracts makes easier. Speedtest data shows that Cox for example, saw 7.3% of gross additions come from previous users of T-Mobile’s FWA service, while for Spectrum and XFINITY, former T-Mobile FWA users accounted for 6.3% and 6.0%, respectively. 

In rural locations where FWA performance lags that of urban locations, and where cable providers have less overlap with FWA service, there is a more even spread of churn to FWA, between cable and DSL providers. In addition, we see stronger churn to rival FWA services, with Verizon’s FWA service attracting 11.1% of its gross additions from T-Mobile, and T-Mobile recording 2.7% of its gross additions from Verizon’s FWA users.

Users that churn experience improved network performance

With the larger FWA customer base, we ran an analysis of Speedtest data of users churning to and from T-Mobile’s 5G FWA service over the period Q2 2022 – Q3 3023, to understand if there were clear drivers for this churn. We found that the median download speed for the subset of users churning to T-Mobile, was consistently below the median of all users, for each ISP, highlighting the importance of ISPs ensuring consistent performance across their user base.

Targeting Churn – Performance Prior to Churning to T-Mobile's 5G FWA Service
Speedtest® Data – Custom Analysis | Q2 2022 – Q3 2023

Users moving to T-Mobile’s 5G FWA service, and those churning away from it, experienced an increase in median download performance. Those users joining T-Mobile’s FWA service over the period Q2 2022 – Q3 2023, recorded an increase in their median download speed of 13.04 Mbps. On the other hand, those users churning away from T-Mobile saw their median download performance increase by 85.53 Mbps. Users joining Spectrum, Optimum, Cox and XFINITY from T-Mobile’s 5G FWA service experienced median download speeds in excess of 100 Mbps faster, highlighting the significant performance advantages that cable and fiber providers maintain over FWA.

Targeting Churn – Performance for Customers Churning Away From T-Mobile’s 5G FWA Service
Speedtest® Data – Custom Analysis | Q2 2022 – Q3 2023

State and urban/rural analysis reveal 5G FWA performance gaps

While median performance has remained relatively stable for both operators over the past year, regional performance, and between urban and rural locations, varies significantly. The performance of 5G FWA services depends heavily on the spectrum bands available in each location, as well as the fact these FWA services do not rely on outdoor consumer premise equipment (CPE), with wireless signals having to navigate into the home. The deployment of additional C-band spectrum will help improve performance over time, however, users and ISPs who do not locate CPE externally, will have to continue to navigate the intricacies of available spectrum bands and CPE positioning within the home.

Rural locations predictably fared worse than urban locations for both T-Mobile and Verizon 5G FWA service, given differences in spectrum availability, and also distance from cell sites, although the difference was starker for Verizon’s FWA service, which recorded a median of 155.77 Mbps in urban locations during Q3 2023, but only 51.41 Mbps in rural locations. T-Mobile increased rural FWA performance, up from 82.20 Mbps in Q4 2022, to 91.96 Mbps in Q3 2023. Verizon on the other hand focussed more heavily on urban locations, with the 155.77 Mbps it achieved in Q3 2023 a sizeable increase on the 125.55 Mbps it recorded in Q4 2022.

Urban vs Rural 5G FWA performance
Speedtest® Data – Custom Analysis | Q3 2023

Setting a minimum threshold of 100 samples for Q3 2023, Speedtest data showed Verizon recorded a median 5G FWA download speed of 181.77 Mbps in Nebraska, followed by 160.56 Mbps in Colorado, and 150.24 Mbps in Kansas. At the other end of the scale, Verizon 5G FWA users in Mississippi recorded median download speeds of 31.54 Mbps, of 36.72 Mbps in Wyoming, and 46.92 Mbps in West Virginia. Upload performance followed a similar trend, with a high of 16.74 Mbps in Nebraska, and a low of 4.20 in Mississippi.

T-Mobile’s 5G FWA service saw median download performance hit a high of 189.58 Mbps in Hawaii during Q3 2023, and like Verizon was strong in Nebraska, with 150.53 Mbps, while Oregon followed with 145.11 Mbps. States with lower median download speeds for T-Mobile included Vermont with 63.31 Mbps, South Dakota with 65.38 Mbps, and like T-Mobile, West Virginia with 67.23 Mbps. Median upload performance for T-Mobile’s 5G FWA service also varied significantly, reaching 41.62 Mbps in Hawaii, but falling to 9.74 Mbps in North Dakota.

We’ll continue to monitor the progress of FWA in the U.S., and the competitive response from cable, DSL, fiber and even satellite providers, as the battle for users intensifies. To find out more about Speedtest Intelligence data and insights, please contact us here.

Ookla retains ownership of this article including all of the intellectual property rights, data, content graphs and analysis. This article may not be quoted, reproduced, distributed or published for any commercial purpose without prior consent. Members of the press and others using the findings in this article for non-commercial purposes are welcome to publicly share and link to report information with attribution to Ookla.

| December 19, 2023

The State of Worldwide Connectivity in 2023

To gain insight into the current performance of networks, we analyzed Speedtest® data in Q3 2023. Our analysis compares changes in 5G performance to the previous year, identifies the top 10 countries with the best performance, and discusses customer satisfaction with 5G. We also ranked countries based on the performance of their fixed networks and investigated the connectivity gap across the world.

5G | Fixed | Connectivity for All

Key takeaways 

  • Global 5G download speed improved. The median global 5G download speed experienced a substantial 20% increase in Q3 2023, reaching 203.04 Mbps, compared to 168.27 Mbps in Q3 2022. This improvement aligns with a significant rise in global 5G subscriptions, indicating positive progress in user adoption of 5G and the performance of 5G networks. 
  • Top 5G performers have shifted. The top 10 countries for 5G performance witnessed notable changes, with the United Arab Emirates claiming the top spot, surpassing South Korea. Malaysia, India, and the Dominican Republic also made significant strides, showcasing a dynamic shift in the global 5G landscape.
  • Speedtest user ratings indicate room for 5G improvement. Despite advancements in 5G technology, there has been a decline in the Net Promoter Score (NPS) among 5G users. Factors contributing to this dissatisfaction could include unmet expectations and discrepancies between actual 5G speeds and advertised speeds.
  • Fixed Networks Advancements. On a global scale, fixed networks demonstrated significant performance improvement, with a 19% increase in median download speed (83.95 Mbps) and a 28% increase in upload speed (38.32 Mbps) in Q3 2023 compared to the previous year. This highlights the ongoing transition to more advanced broadband technologies, particularly Fiber-to-the-Home (FTTH).
  • The imperative of closing the connectivity gaps. Despite improvements in global connectivity, there are still areas that fall outside of network coverage. Speedtest® data highlights disparities in internet performance between fixed and mobile networks across different regions, emphasizing the importance of addressing connectivity challenges worldwide.

5G Networks

Global 5G download speed improvements
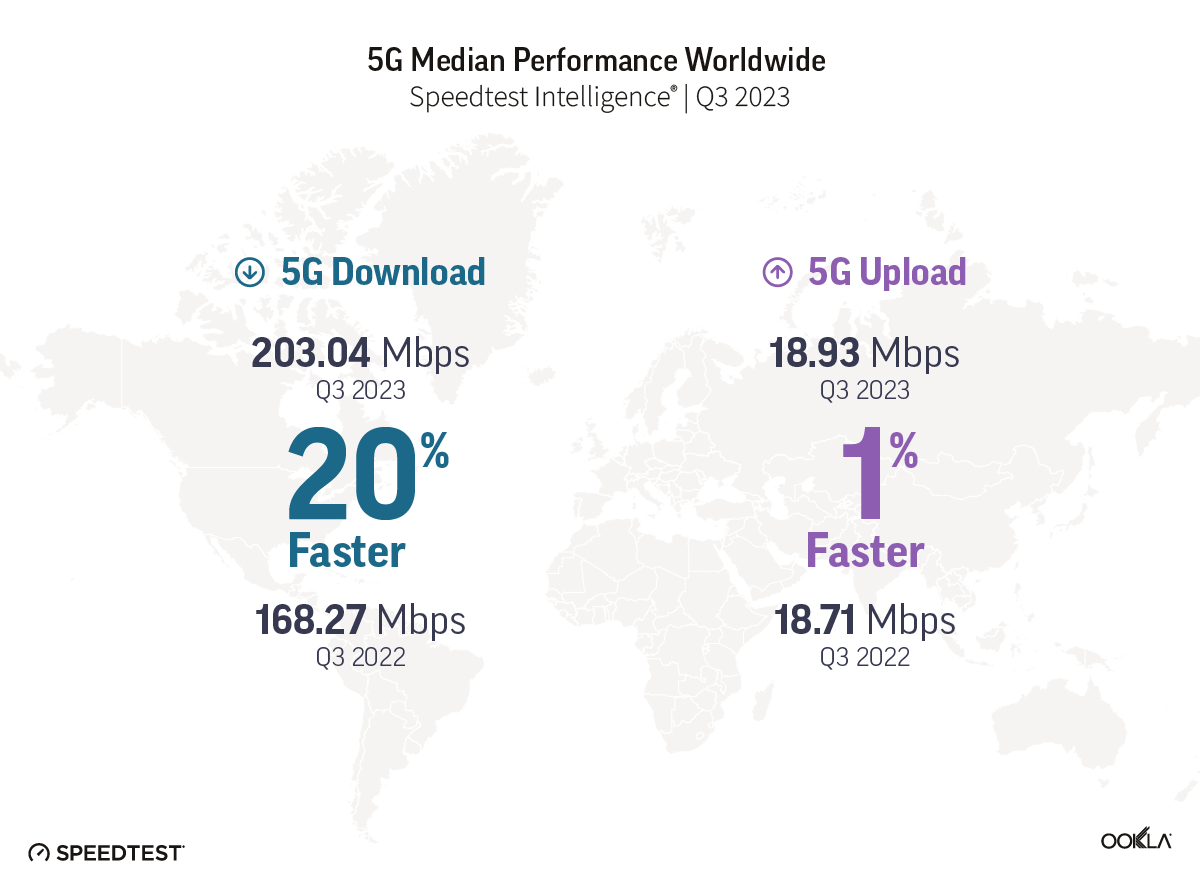
Illustration of 5G Median Performance Worldwide

The median global 5G download speed has experienced a noteworthy surge, registering a 20% increase and reaching 203.04 Mbps in Q3 2023, compared to 168.27 Mbps in Q3 2022, according to Speedtest Intelligence® data. This improvement coincides with a substantial rise in global 5G connections, reaching 1.4 billion according to GSMA Intelligence, representing a 65% year-on-year increase from 872 million a year ago. 

In terms of upload speed and latency, only a very modest improvement of 1% occurred. Median 5G upload speeds reached 18.93 Mbps in Q3 2023, compared to 18.71 Mbps in the same period last year; multi-server latency, a critical metric for network responsiveness, improved from 45 ms in Q3 2022 to 44 ms in Q3 2023. 

Speedtest users experiencing the top 10% of 5G download speeds globally have seen a 9% increase, rising from 525.54 Mbps in Q3 2022 to 573.12 Mbps in Q3 2023. However, speeds have not yet reached Gigabit levels, primarly because of network economics. 5G was originally designed to deliver peak data rates of up to 20 Gbps based on IMT-2020 requirements, but we are still a ways off before gigabit speeds become the new normal. For instance, symmetrical download, upload speeds, and ultra-low latency haven’t been realized, partially because the vast majority of 5G networks are not ‘true 5G’ as they have been deployed in Non-Standalone (NSA) mode, meaning they rely on a 4G LTE network core. According to GSA, over 40 operators have launched 5G standalone (SA) in public networks, but the rollout is not yet complete. Nevertheless, the industry is actively exploring the prospect of 5G Advanced, which promises symmetrical upload and download speeds and ultra-low latency, signaling a proactive stance ahead of the eventual transition to 6G.

Malaysia joined South Korea and the U.A.E at 5G speeds podium
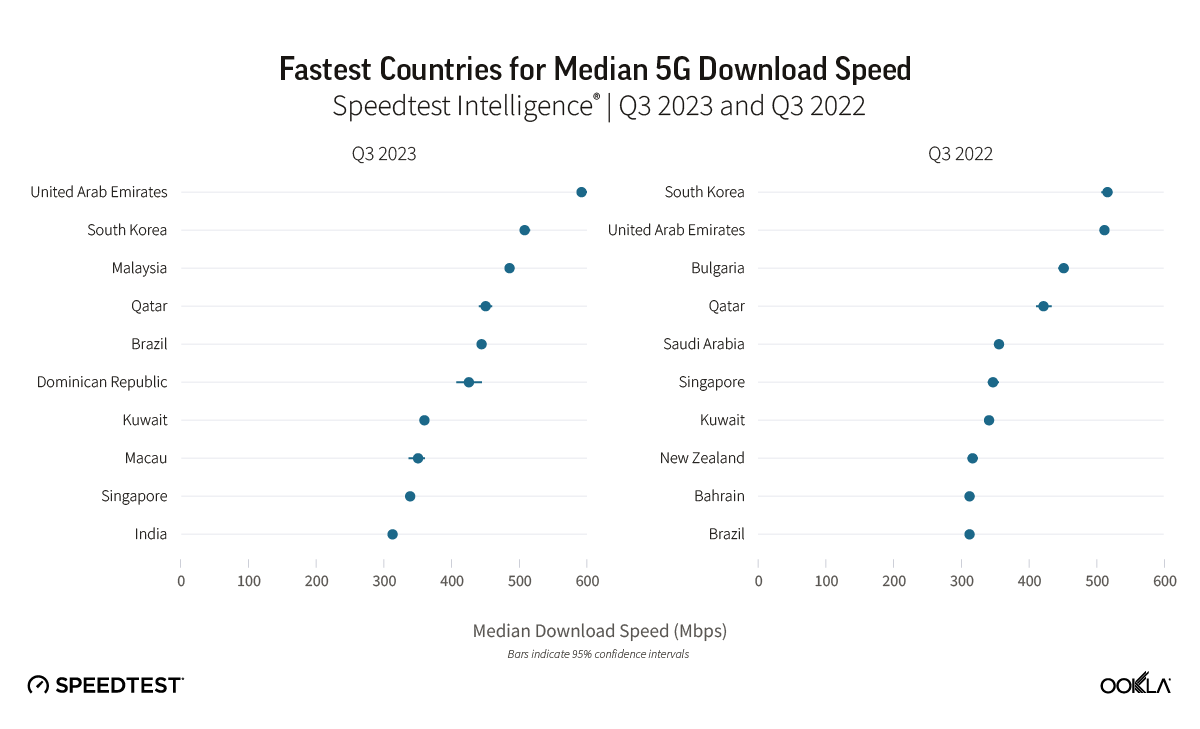
Chart of Fastest Countries for Median 5G Download Speed

During Q3 2023, the United Arab Emirates and South Korea stood out as leaders in 5G performance, boasting the fastest median 5G download speeds globally at 592.01 Mbps and 507.59 Mbps, respectively. Our top 10 list also includes Malaysia, Qatar, Brazil, the Dominican Republic, Kuwait, Macau, Singapore, and India. The shift in the top 10 rankings reveals dynamic changes, with Malaysia, the Dominican Republic, and India making significant strides, while Bulgaria, Saudi Arabia, New Zealand, and Bahrain dropped out of the rankings.

The U.A.E showcased a 14% increase in its median 5G download speed, reaching 592.01 Mbps in Q3 2023, up from 511.68 Mbps in Q3 2022, allowing the U.A.E to take the top spot from South Korea. Key factors contributing to the U.A.E.’s 5G leadership include fierce market competition driven by Etisalat and du, resulting in extensive 5G coverage and widespread access to 5G services. Additionally, the allocation of a 100 MHz of contiguous spectrum, as discussed in our 5G spectrum article, has played a pivotal role in achieving faster speeds, lower latency, and improved spectral efficiency.

The regional shift in 5G performance leadership is noteworthy. In 2022, half of the top 10 countries were from the Middle East, while in 2023, the same proportion hailed from the Asia Pacific region. Our analysis suggests that early adopters in the Asia Pacific region have outperformed major European markets in 5G performance, due to factors such as early spectrum availability and supportive government policies.

Malaysia’s remarkable achievement in reaching the third spot globally for 5G download speed, with a reported speed of 485.24 Mbps in Q3 2023, is particularly noteworthy. Despite launching its nationwide 5G network less than two years ago, Malaysia’s unconventional deployment strategy has proven effective. India has also made a significant leap, with its median 5G download speed of 312.26 Mbps allowing India to reach the top 10 worldwide. The country’s climb of 72 places on the Speedtest Global Index™ between September 2022 and August 2023 is primarily credited to the launch of 5G. Following a 5G spectrum auction in India, operators have successfully addressed network congestion issues by offloading 4G traffic onto 5G networks.

In Brazil, 5G download speed increased 1.4 times, jumping from 312.09 Mbps in Q3 2022 to 443.93 Mbps in Q3 2023. Before Brazil’s 5G spectrum auction, operators had offered 5G using DSS since July 2020. While DSS can provide broad 5G coverage, its speeds are often similar to those on 4G LTE networks. In November of 2021, however, Brazil’s multi-band 5G spectrum auction closed, which not only generated BRL47.2 billion ($8.5 billion) in total commitments, but it also allowed operators to deliver much faster speeds on dedicated 5G spectrum compared to DSS. National operators – Telefonica Brasil (Vivo), Claro Brazil, and TIM Brazil – ended up with 40 MHz or 50 MHz in the 2.3 GHz spectrum band and 100 MHz each in the 3.5 GHz band. The subsequent simultaneous activation of 5G networks in July 2022 marked a transformative moment with the continuous expansion of 5G services to 623 municipalities by December 2023. An upcoming spectrum auction expects to improve Brazil’s 5G standing even further.

The Dominican Republic’s entry into the top 10 fastest 5G countries was marked by its official launch of 5G services in December 2021, making it the first Caribbean nation and the third in Latin America to adopt a 5G network.

Disparity Between 5G Performance and Consumer Perception

The Net Promoter Score (NPS) is a tool that gauges customer loyalty and satisfaction. At the end of Speetest, users may be asked to answer “How likely is it that you would recommend [provider] to a friend or colleague?” on a scale from 0-10. Net Promoter Scores are applied to both users and providers. Users are categorized into Detractors (score 0-6), Passives (score 7-8), and Promoters (score 9-10). NPS is the percent of Promoters minus the percent of Detractors and is displayed in the range from -100 to 100. Providers are ranked in descending order of NPS. NPS categorizes users into Detractors (those that score 0-6), Passives (scores between 7 and 8), and Promoters (scores of 9-10). NPS represents the percentage of Promoters minus the percent of Detractors displayed in the range from -100 to 100. 

In our article discussing whether 5G was meeting customer expectations, we found that 5G users typically rate their network operator with NPS scores universally higher than those for 4G LTE users. In Q3 2023, that trend continued, as 5G  users that were on 5G network when answering the NPS question still scored higher than those on 4G across all markets analyzed. It isn’t surprising given that at a global level, 5G had a 637% better median download speed than 4G and a 130% better median upload speed. 
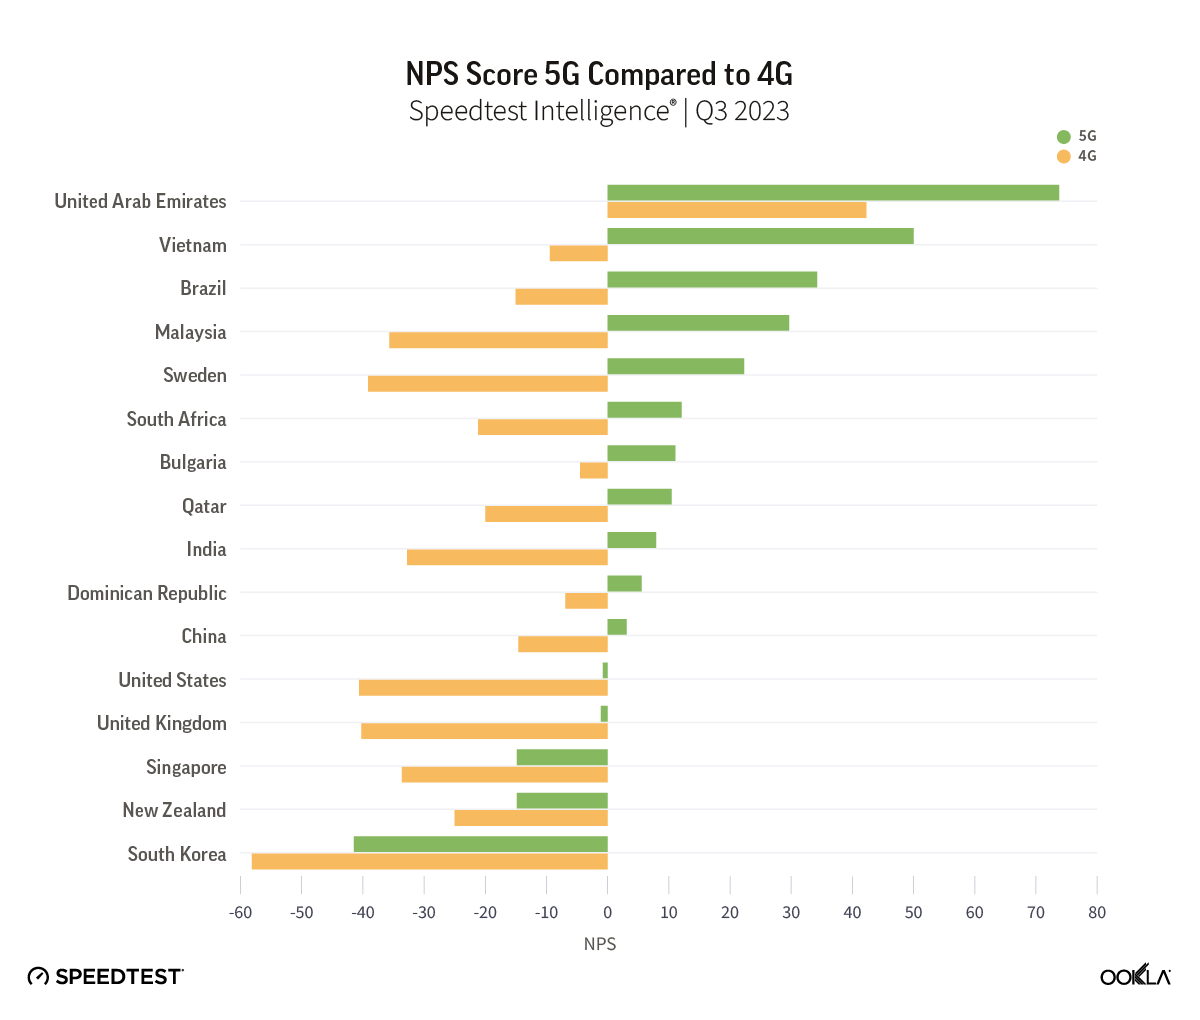
Chart of NPS Score, 5G Compared to 4G

While 5G NPS still outpaces scores on 4G, our data shows that 5G NPS has been decreasing annually. This could point to the fact that excitement about 5G as a new technology is waning as users become used to faster speeds, or as customers await new use cases that can take advantage of the faster speeds that 5G can provide. After all, we are still waiting for that killer app for 5G, the way the video and streaming were for 4G. 

While it is difficult to fully explain the reasons behind the 5G NPS decrease without further research, we can clearly see that network performance isn’t the only factor at play influencing NPS declines. Others can include customer care, pricing, and other services. For example, in South Korea, one of the first countries to launch 5G with one of the world’s fastest speeds, consumers scored 5G networks -41.47 in Q3 2023 compared to -20.51 in Q3 2022. 

In March 2021, South Korean consumers launched a class action suit against operators because they felt they were being misled by the promises of 5G in the country. Recently, South Korea’s antitrust regulator fined three 5G operators a total of 33.6 billion won ($25.06 million) for making exaggerated claims about the level of performance their networks could achieve. South Korean operators claimed consumers could experience theoretical 5G speeds, which are not practically achievable in a “real world” environment, as factors such as spectrum usage, network densification, user location, and device capability significantly affect actual performance. Our data shows that the top 10% of 5G users in South Korea experienced speeds of 1.004 Gbps in Q3 2023, which, although impressive, are far lower than the advertised 20 Gbps speeds. 
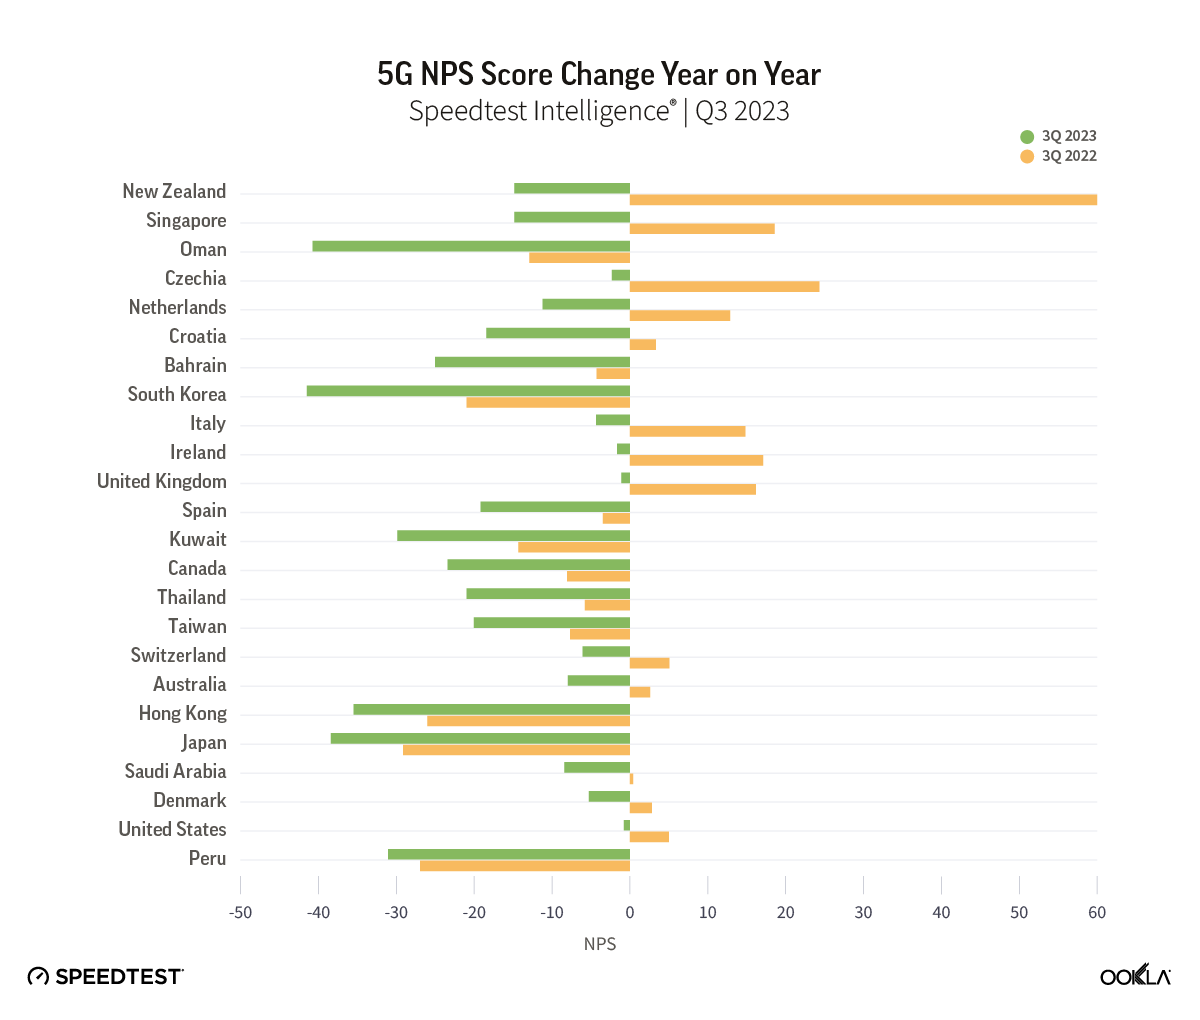
Chart of 5G NPS Score Change Year on Year

Fixed Networks

Fiber driving fixed performance gains 
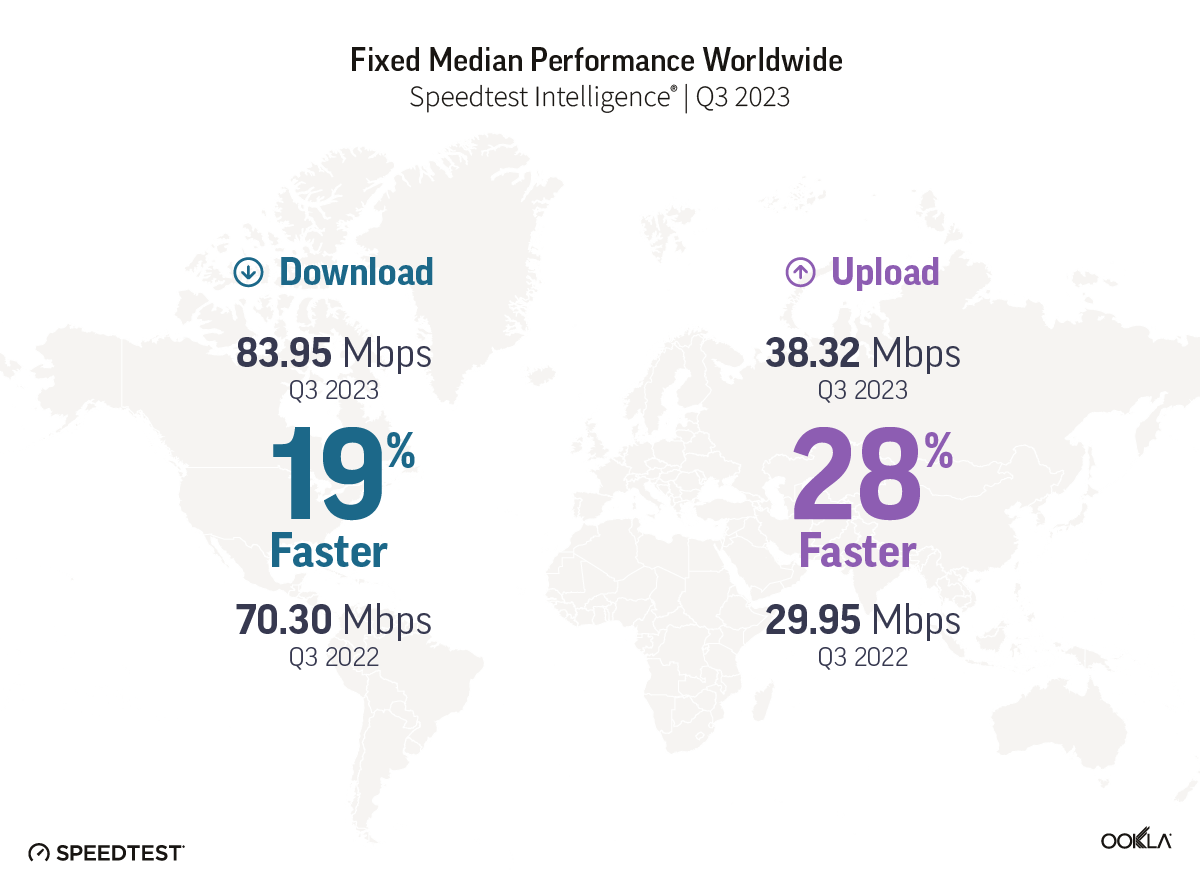
Illustration of Fixed Median Performance Worldwide

On a global scale, fixed networks have demonstrated significant advancements, achieving a median download speed of 83.95 Mbps and an upload speed of 38.32 Mbps in Q3 2023, per Speedtest Intelligence data. This signifies a substantial 19% improvement in download speed and an impressive 28% enhancement in upload speed compared to those in 2022. This also indicates that more fixed connections have migrated to fiber networks.

According to the World Broadband Association (WBBA) report titled “Next Generation Broadband Roadmap 2023 to 2030” Fiber-to-the-Home (FTTH) is identified as the natural progression from copper-based xDSL broadband networks. The shift towards FTTH varies across different countries and regions, but the industry is committed to embracing more advanced and efficient broadband technologies. 

Oftentimes, despite improvement in underlying broadband technology, Wi-Fi is the bottleneck that reduces customer experience. Our research has shown that Wi-Fi performance can lag behind ethernet in markets where advanced cable and fiber connections are replacing legacy broadband technology (such as DSL or coax cable). Wi-Fi speeds typically range from 30-40% of ethernet, indicating a need to accelerate the adoption of more advanced Wi-Fi technologies and optimize the home network environment.

The UAE, Singapore, and Hong Kong are in the lead for fixed
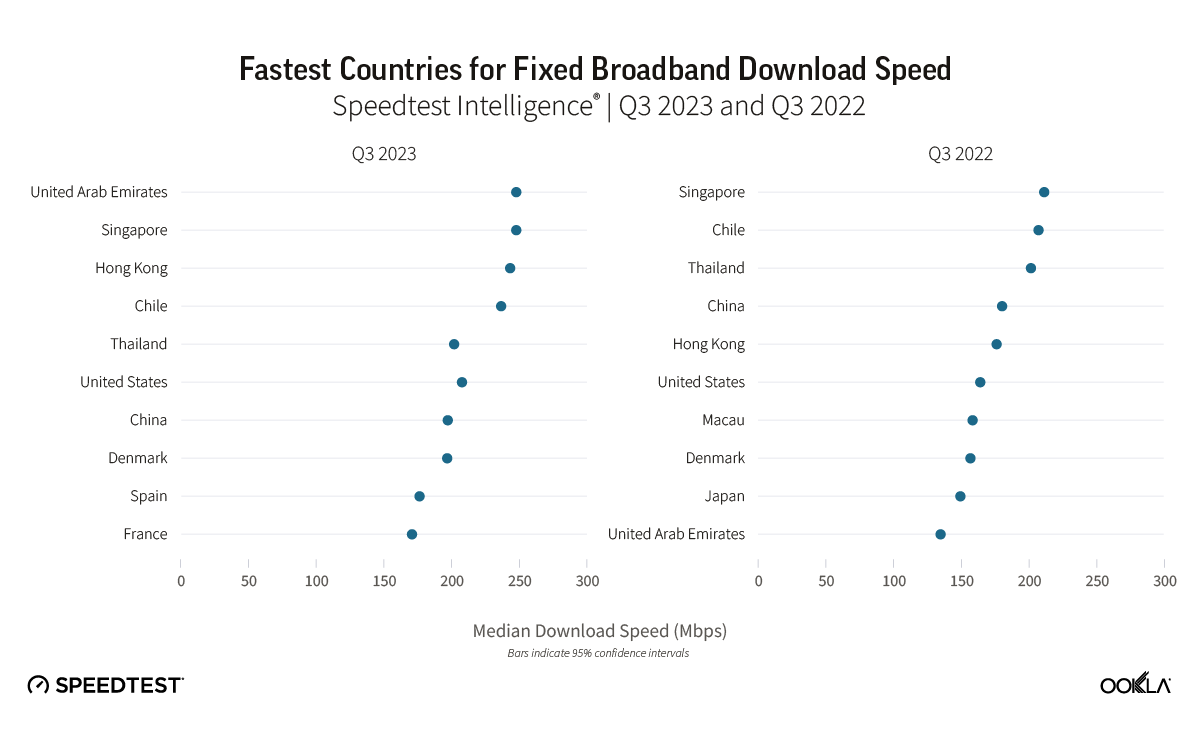
Chart of Fastest Countries for Fixed Broadband Download Speed

The United Arab Emirates (UAE) and Singapore led the way in fixed network performance.

The UAE achieved a median download speed of 247.63 Mbps in Q3 2023, representing a notable 1.83 times increase compared to the previous year. Most customers in the UAE have access to fiber networks, and additional measures have been implemented by operators in the region to enhance internet speeds, such as increasing the minimum download speed from 250 Mbps to 500 Mbps and offering price discounts to incentivize users to upgrade to higher-tier plans. 

Singapore also leads on the 2023 Fiber Development Index (FDI), with maximum scores in seven of the nine metrics. Singapore, along with Qatar and South Korea, has achieved 100% FTHH coverage. One of the reasons for this success, besides having a smaller area, is that Singapore’s regulator mandates building owners and real estate developers to provide adequate space, facilities, and accessibility for network operators to pre-install fiber networks.

Hong Kong also demonstrated significant progress, with a 37% increase in median download speed and a 40% increase in upload speed. To track broadband adoption, the Office of the Communications Authority (OFCA) in Hong Kong monitors broadband adoption by advertised speed and technology mix; as of August 2023, 66% of residential clients already subscribed to the Internet with a download speed equal to or greater than 1 Gbps.

Chile has seen a 14% improvement in median download speed and a 29% improvement in upload speed on the back of a greater fiber adoption. Chile has been the top-performing fixed broadband market across Latin America, consistently outperforming other regional markets but over the last three years, it has also closed the performance gap with other leading markets globally. Chile’s strong fixed broadband performance — an anomaly in the region — is primarily due to strong competition among Chilean ISPs. Chile has seven ISPs with over 5% market share, all heavily focused on migrating customers to fiber. 

Thailand is a newcomer to the ranking as FTTH continues to grow strongly. FTTH constitutes an impressive 95% of fixed broadband users in Thailand, equivalent to around 58.96% of household penetration. Operators have been actively rolling out fiber in adherence to the Digital Thailand National Policy.

In the United States, there has been a 26% improvement in median download speed and a 7% improvement in upload speed. In this very competitive market, with a range of access technologies vying for customers, a combination of migration to fiber, 5G fixed-wireless access (FWA), and faster cable connections is helping drive higher performance levels. In line with the demand for faster network performance in the market, the FCC recently announced that it is seeking input on a planned increase to its definition of broadband/high-speed internet to 100 Mbps download and 20 Mbps upload, up from the current 25 Mbps download and 3 Mbps upload standard.

As discussed in our recent article, several European countries are making substantial progress in offering high-speed broadband. Across Europe, Denmark had the fastest median download speed for fixed broadband (196.43 Mbps), followed by Spain (176.08 Mbps) and France (170.51 Mbps). Denmark experienced a 25% improvement in median download speed and a 16% improvement in upload speed. Spain also showed significant improvement, with a 32% increase in median download speed and a 29% increase in upload speed. France exhibited even stronger progress, with a 53% increase in median download speed and a 41% increase in upload speed. The speed gains we’ve seen in Spain and France are correlated with an increase in fiber adoption; for example, Spain boasts nearly 90% fiber optic coverage, thanks to private initiatives and government support, while France expects a full-fiber rollout by 2025.

Connectivity for All

The imperative of closing the connectivity gap

Massive investments are being made to bridge the connectivity gap as recognition of connectivity as a fundamental human right is growing. According to a WBBA Whitepaper, a high level of broadband penetration is critical to the country’s socioeconomic development. However, it’s not only about being connected to the network per se; the quality of that broadband connection is equally crucial. Unlike other utility services like gas and electricity, where quality is generally stable, with broadband, the quality of the network experience is crucial to ensure users can benefit fully from multiple applications.

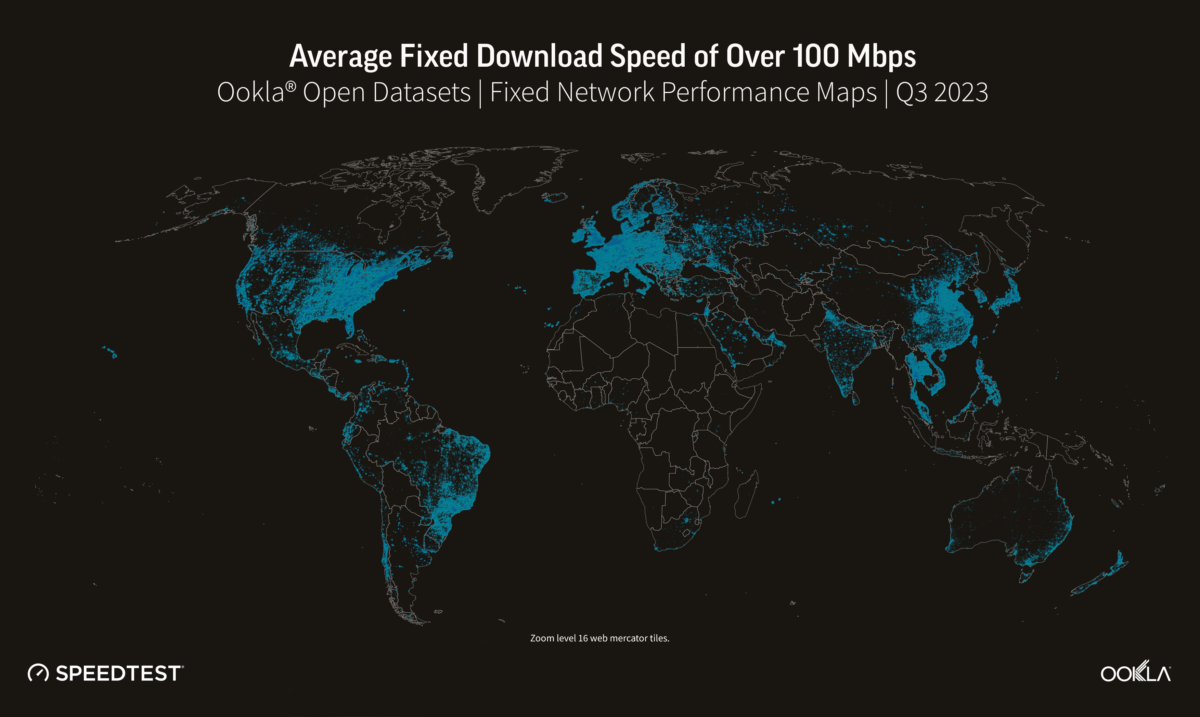
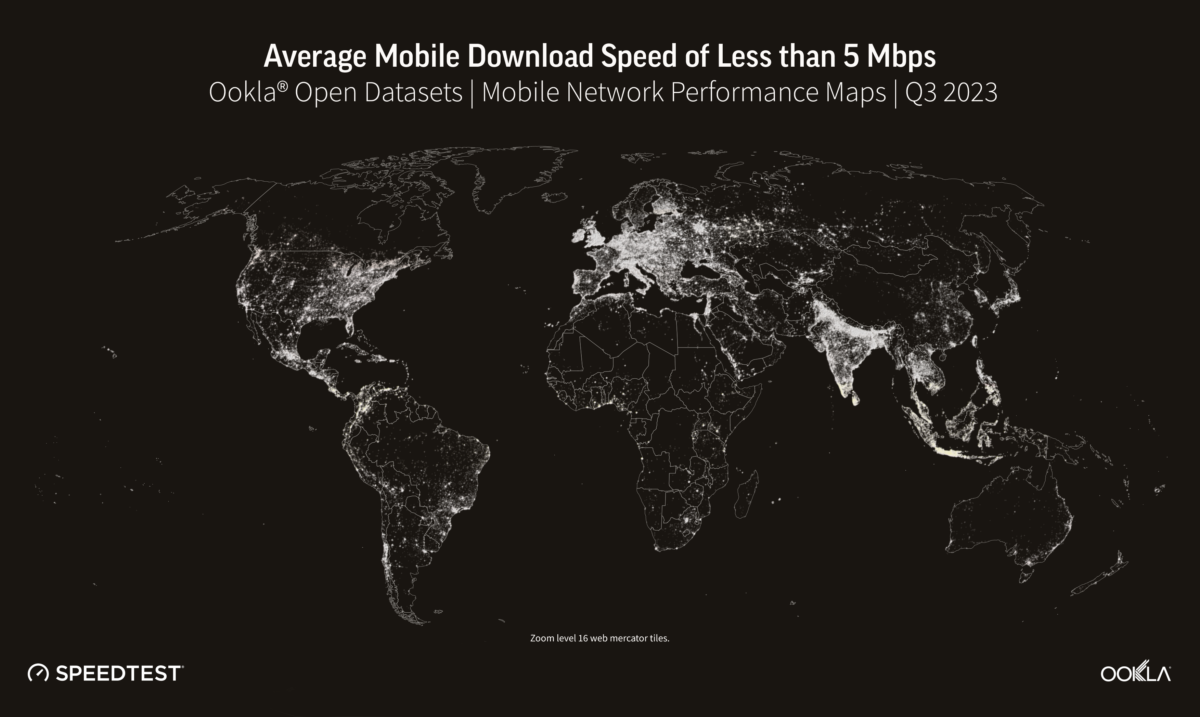
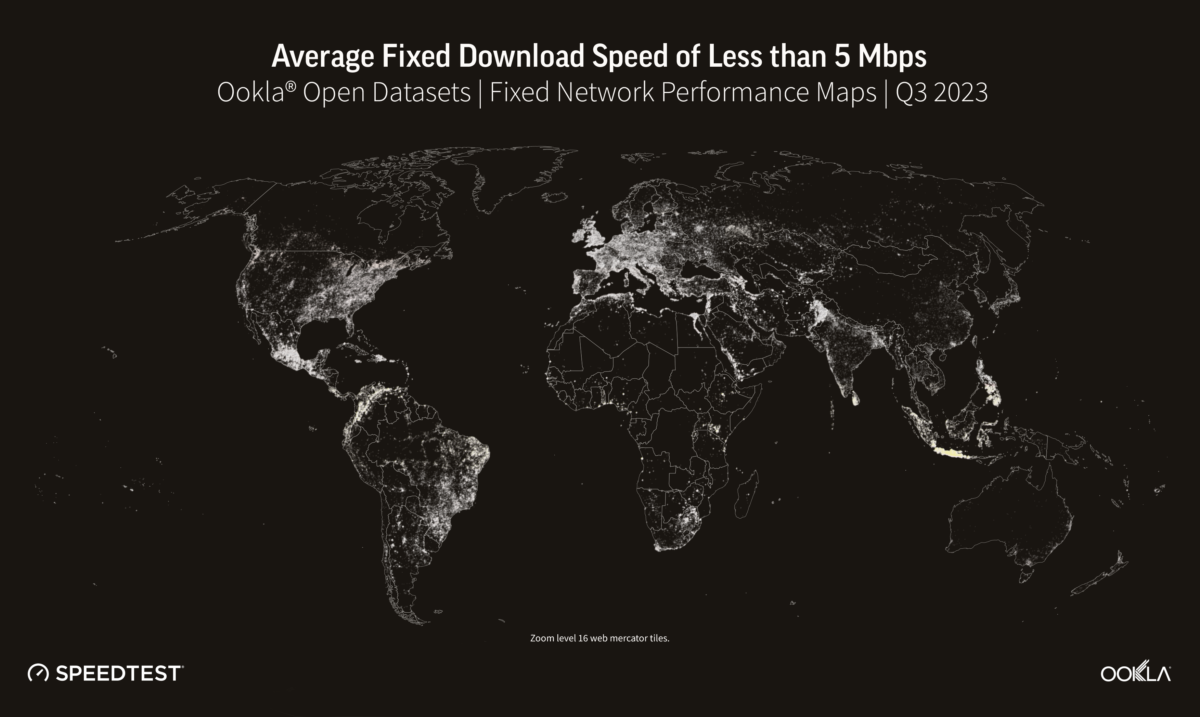
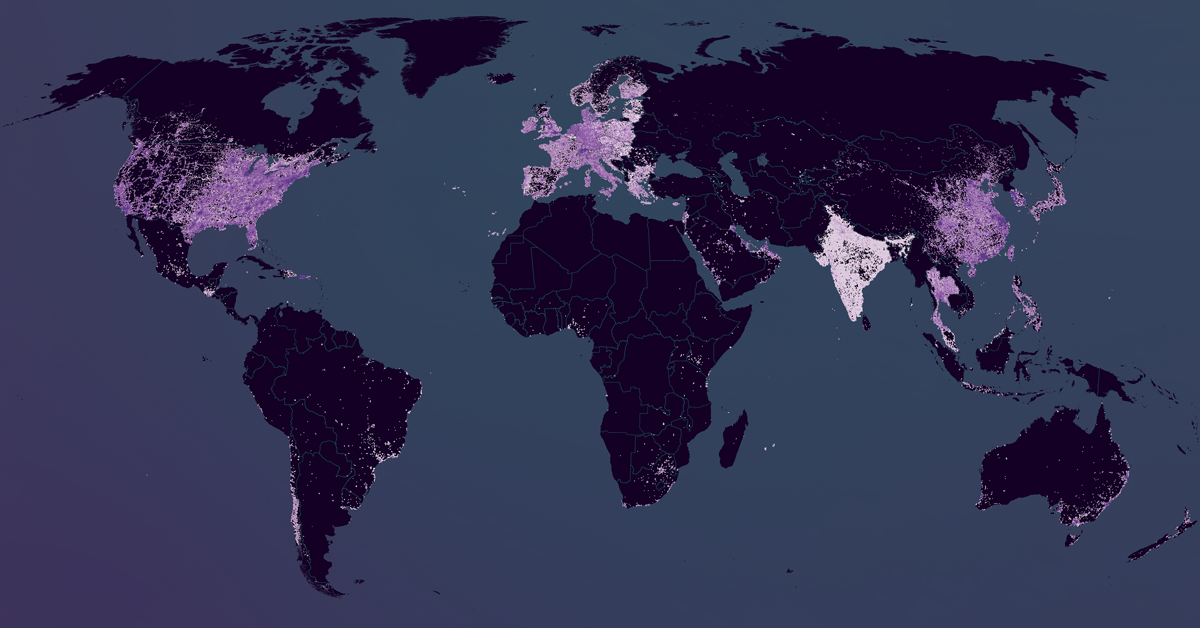
To assess the digital divide, we mapped mobile and fixed internet performance using data from the Open Data Initiative, which Ookla provides as part of Ookla for Good

Determining where a digital divide exists is a complex issue that involves identifying where network infrastructure is located, where people need connectivity, and how affordable it is. Although it can be challenging to dig into a specific location, it is evident that there are varying levels of Internet performance worldwide. A quick glance at our data shows that fixed broadband customers are more likely to experience faster networks (measured as an average download speed of 100 Mbps and above) than mobile across the Americas and Europe. The opposite is true for mobile networks across Africa and APAC, where mobile networks are often the primary means of connectivity. Compared to urban areas, rural communities are often ill-equipped for broadband access. Due to a lack of bandwidth (and therefore slower speeds), people in these areas need help doing many things on the internet, such as streaming videos. The US regulator FCC defines broadband in the United States as access to  25 Mbps download and 3 Mbps upload speeds. Areas without those speeds are classified as broadband “digital deserts,” even if those areas have internet access. Although broadband definitions can vary considerably from country to country, we can see in the next section that many areas fall outside any standards of connectivity globally.

Despite the world becoming increasingly connected, many rural and remote areas still struggle to access the internet. For example, large swathes of South America and Africa fall outside terrestrial network coverage. As discussed in our recent article, cellular networks are critical to connecting individuals and businesses as internet access in Africa is predominantly mobile. Before we can start discussing 5G, connecting communities with the internet in general is a priority. Affordable 4G smartphones and targeted financing for under-served demographics are key for bridging the digital divide and reducing poverty, as a World Bank study found that 4G coverage can help cut poverty by up to 4.3%. 

5G technology can potentially replace fixed internet access in situations where the cost of fiber deployments is high and rolling out traditional fixed broadband networks isn’t commercially viable. However, in countries like Indonesia, satellite technology may be a more effective solution for connecting remote areas. While 5G Fixed Wireless Access (FWA) and satellite technology can complement each other, the adoption of satellite technology is currently limited by factors such as coverage, device affordability, and service cost. As revealed in our recent article, Starlink outperforms GEO satellites and is a suitable replacement for fixed networks in rural areas. While it may not match the leading cable or fiber providers in terms of median speeds or multi-server latency, satellite internet provides a viable alternative in places where cable and fiber access networks are unavailable. This is mainly due to a more consistent distribution of download performance across Speedtest samples, unlike FWA and DSL-based services, where performance is impacted by the distance from the cell site or exchange/DSLAM.

Fixed and mobile network operators across the globe widely use Speedtest data to enhance Internet quality, improve accessibility, and inform network expansion. The United States Federal Communications Commission and the Malaysian Communications and Multimedia Commission rely on Speedtest data to ensure accountability of telecommunications entities and allocate funds for rural and urban connectivity development. Ookla also licenses data to NGOs and educational institutions to help bridge the digital divide between areas with and without modern Internet access. Our mapping data is used to track results and determine whether broadband infrastructure can handle growth as more people connect devices and technologies demand more bandwidth. We are also actively involved in discussing best practices for ensuring digital transformation and connectivity for all in the APAC region, Central Asia, and Europe. If you are interested in working with us, please reach out. 

Keep track of how well your country is performing on Ookla’s Speedtest Global Index and get advice on how to plan and optimize your network.
Ookla retains ownership of this article including all of the intellectual property rights, data, content graphs and analysis. This article may not be quoted, reproduced, distributed or published for any commercial purpose without prior consent. Members of the press and others using the findings in this article for non-commercial purposes are welcome to publicly share and link to report information with attribution to Ookla.

| February 24, 2025

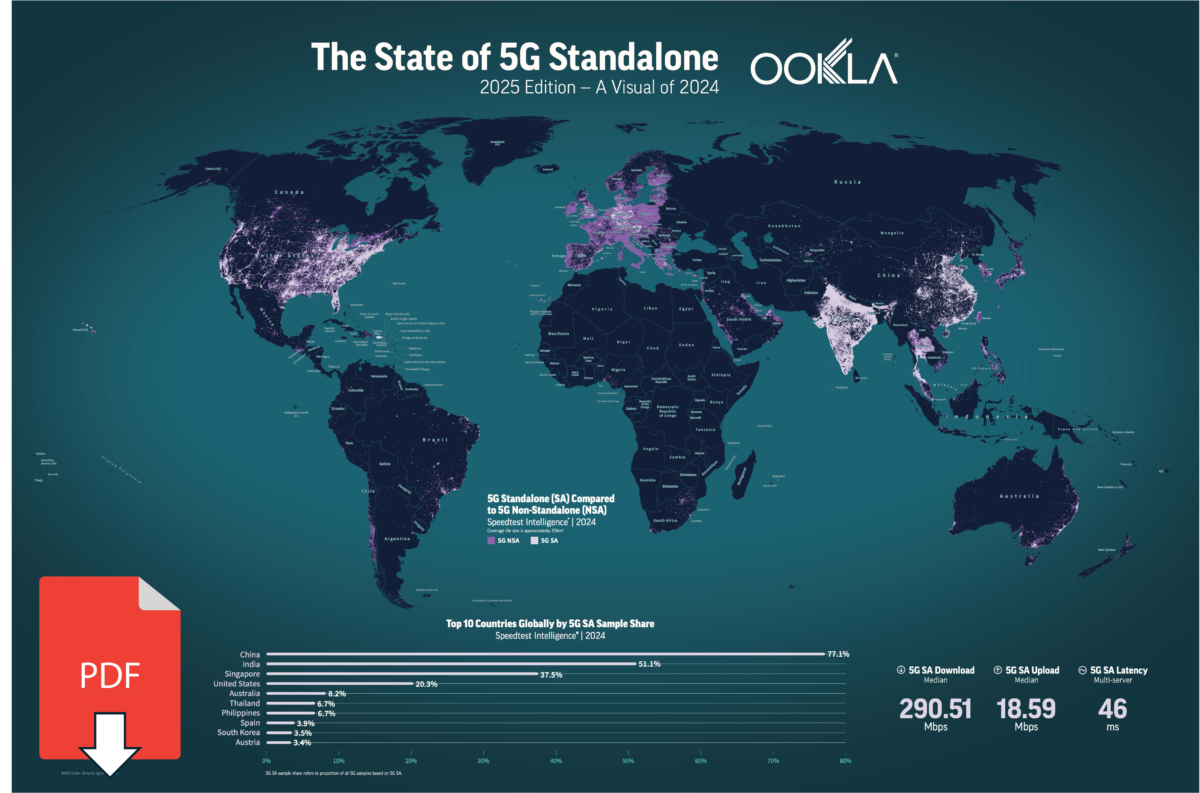
Illustrating the Global State of 5G SA (Poster Download)

Global 5G SA rollouts are gaining momentum after a sluggish start, with China, India, Singapore, and the U.S. maintaining a substantial lead

The telecoms industry is approaching the midpoint of the 5G technology cycle, with capital investment in radio access network (RAN) expansion slowing significantly in developed markets over the last two years as the initial 5G coverage layer nears maturity. Many advanced operators are now prioritizing network densification while cautiously transitioning to a new 5G core architecture with standalone (SA), seeking to unlock new monetization opportunities through the enhanced flexibility, agility, and performance that 5G SA enables.

The interplay of high interest rates driving up the cost of capital, challenges in monetizing the initial non-standalone (NSA) architecture, and the technical complexity of the new 5G core—demanding an entirely new skill set to support implementation—has weighed on the global rollout of 5G SA, with significant regional disparities persisting in commercialization progress.

For the first time, and with the goal of offering deeper insight into the state of 5G SA worldwide, Ookla® has created a high-resolution downloadable poster based on Speedtest Intelligence® data, providing a unified view of the global reach of both 5G NSA and 5G SA networks in 2024. This visual is part of a flagship global study in collaboration with Omdia, comparing the competitiveness of leading regions and countries in 5G SA deployment, performance, and monetization.


Key Takeaways:

Asia Pacific remains at the forefront of global 5G SA deployment

In 2024, seven of the top ten countries by 5G SA reach were in Asia Pacific, with China (77.1% 5G SA sample share), India (51.1%), and Singapore (37.5%) leading globally. The region’s strong position has been driven by a higher number of multi-operator 5G SA deployments (as seen in China and Australia), extensive low-band rollout (such as Reliance Jio’s use of the 700MHz band for deep nationwide coverage in India), and favorable demographics, including very high urbanization in countries like Singapore.

Asia Pacific leads the world in 5G SA reach
Speedtest Intelligence® | 2024

Outside of Asia Pacific, the United States also ranks highly in 5G SA reach, despite only one of its three largest operators engaging in a commercial launch to date. In contrast, just two European countries—Spain and Austria—make the top ten, highlighting the region’s slow pace of 5G SA deployment and the broader decline in its global competitiveness in mobile network infrastructure during the 5G cycle.

Spectrum diversity propels the U.S. to a leading position in 5G SA performance

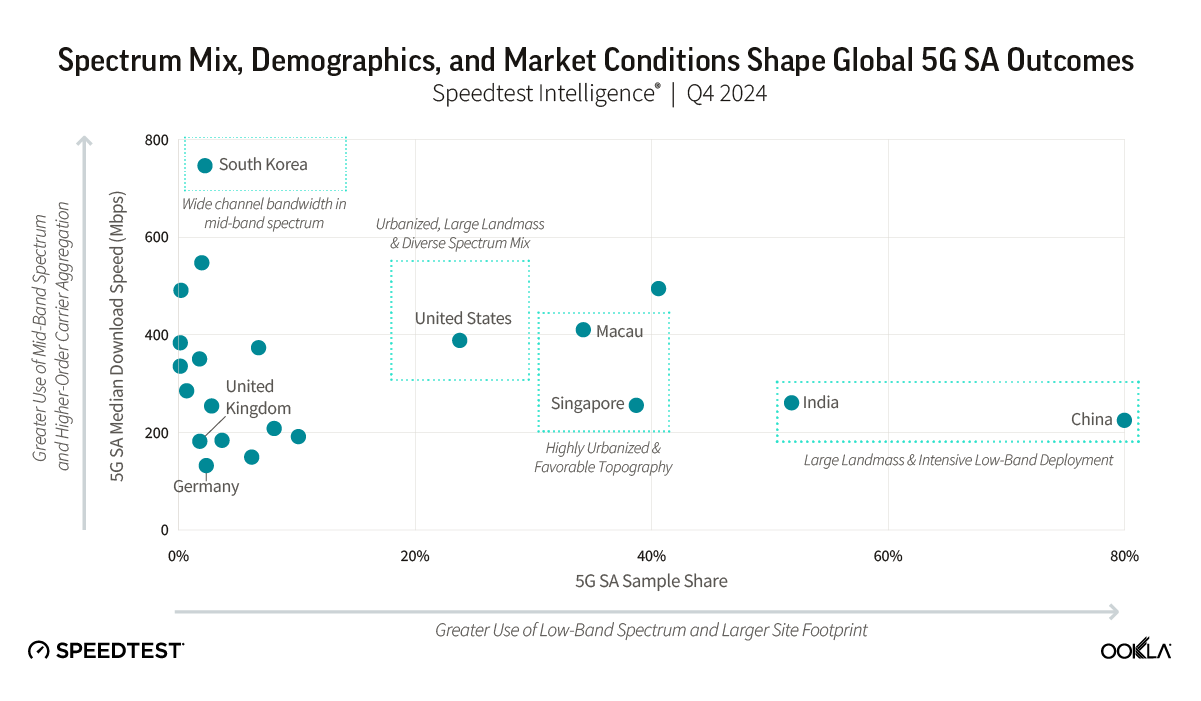
The U.S. has distinguished itself with significantly higher 5G SA reach than competing regions like Europe while also delivering superior median download speeds. In Q4 2024, median download speeds on 5G SA in the U.S. reached 388.44 Mbps, a substantial increase from 305.36 Mbps in the same period the previous year, and well ahead of Asian competitors such as Japan (254.18 Mbps) and China (224.82 Mbps).

The U.S.’s strong performance has been driven by T-Mobile’s post-merger 5G SA buildout—the first globally—which balanced nationwide reach with network depth. Its “layer cake” strategy combined a broad 600 MHz rollout, initially launched as 5G NSA in 2019 before transitioning to 5G SA in 2020, with mid-band deployments in the 2.5 GHz band. This approach has allowed T-Mobile to more extensively implement features like carrier aggregation and Voice over NR (VoNR) on its maturing 5G SA network, lending it a competitive edge in both availability and key performance metrics such as download speed and latency.


South Korea led the world in Q4 2024 with the highest median 5G SA download speeds at 746.25 Mbps, driven by its exclusive use of the 3.5 GHz band. However, it continues to trail its regional peers in 5G SA reach due to the challenging propagation characteristics exhibited by this spectrum and the limited commercialization beyond a single operator, KT.

5G SA enhances download speeds and latency globally, yet uplink advancements remain underutilized

Globally, 5G SA networks are delivering significantly improved performance across key metrics compared to the non-standalone architecture. In Q4 2024, median latency—a key beneficiary of transitioning to the 5G core—was nearly 20% lower on 5G SA networks compared to 5G NSA networks in Europe and China, and more than 25% lower in the United States and Japan. Similarly, median download speeds on 5G SA were more than 57% higher in Europe and 84% higher in China than those on non-standalone networks.

European 5G SA Users Benefit from Markedly Lower Latency and Higher Download Speed
Speedtest Intelligence® | Q4 2024

Notwithstanding these improvements, 5G SA’s full potential remains largely untapped in Europe. Advanced uplink capabilities unlocked by the technology—such as higher-order MIMO and carrier aggregation—remain limited to a few operators in leading markets like the United States, highlighting the still nascent profile of the device and equipment ecosystems for 5G SA. 


A detailed analysis of the state of 5G SA around the world is featured in Ookla’s flagship report, produced in collaboration with Omdia, on regional competitiveness in the technology.

Ookla will be at Mobile World Congress this year, located at Booth 2I28 in Hall 2. Please drop by to discuss the state of connectivity in your market, and how Ookla’s network insights can help deliver better connected experiences.

Ookla retains ownership of this article including all of the intellectual property rights, data, content graphs and analysis. This article may not be quoted, reproduced, distributed or published for any commercial purpose without prior consent. Members of the press and others using the findings in this article for non-commercial purposes are welcome to publicly share and link to report information with attribution to Ookla.

| February 18, 2025

Comparing 5G Wireless Rural/Urban Connectivity in the 50 U.S. States

Having reached much of their 5G coverage and capacity goals in the urban and suburban areas of the U.S. in 2023, the big-three national U.S. wireless operators have turned their attention toward expanding their 5G networks into rural markets. This strategy is intended to help operators acquire new subscribers, particularly as growth in the urban and suburban markets has slowed.

But the big three U.S. wireless operators have taken very different approaches when it comes to expanding their 5G networks into less-densely populated areas. Of course, much of their strategies have been dictated by their spectrum holdings – particularly how much mid-band spectrum they were able to acquire.

Key Takeaways

  • T-Mobile has the largest percentage of 5G users spending the majority of their time on its 5G network in both urban and rural markets.
  • Nevada and Illinois are the only two states to make the Top 10 list for T-Mobile, AT&T and Verizon when it comes to high urban 5G availability indicating that these states, and their large cities of Chicago and Las Vegas, have been a 5G focus for all three operators. 
  • 5G service is scarce in remote Wyoming, which makes the Top 5 list for T-Mobile, AT&T and Verizon for having the lowest rural 5G availability. This isn’t particularly surprising as Wyoming ranks 49th in population density among all 50 states.

For this analysis, we used Ookla®’s 5G Availability metric, which shows how likely a user, on average, is to have 5G service available. 5G Availability is impacted by 5G network coverage, but also the network policies of each mobile provider, which determine the conditions under which users access its 5G network. For example, some providers may prioritize 4G-LTE for less data intensive tasks. Ookla Speedtest® data provides a consumer-centric view of 5G Availability — recording the percentage of 5G active users connected to 5G a majority of the time, based on when the 5G icon is displayed on the device.
T-Mobile leads the way

T-Mobile has been the most vocal about its rural market expansion targets. During the company’s Analyst Day in 2021 T-Mobile executives said they estimated the company had about 13% share of households in small markets and rural America and they set a goal of reaching 20% by the end of 2025. The operator also has said it is committed to providing coverage to 90% of America’s rural population by 2026. 

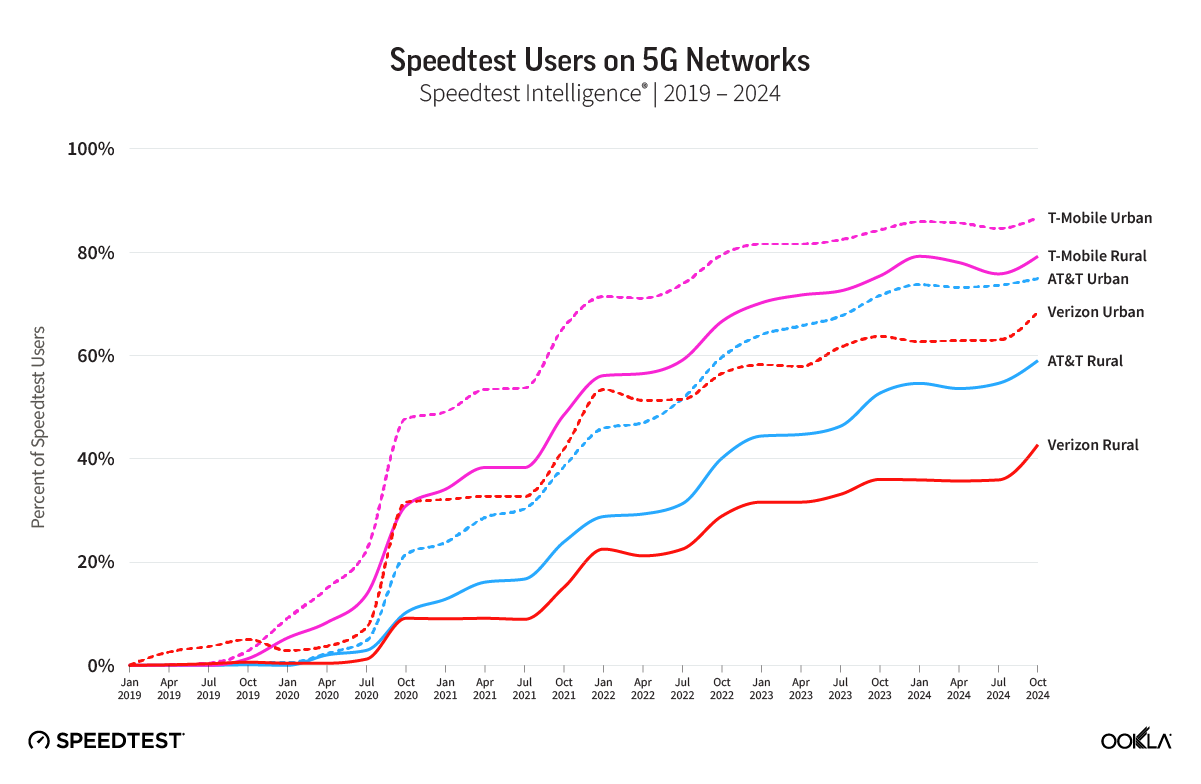
We compared Speedtest® users on 5G networks from the top three nationwide operators from 2019 to 2024.  Our analysis shows T-Mobile’s growth and its lead in the number of 5G users spending the majority of their time on its 5G network in both urban and rural markets followed by AT&T and Verizon. 

To determine urban vs. rural areas we used US Census Bureau’s urban-rural classifications. The Census Bureau’s urban areas represent densely developed territory, and encompass residential, commercial, and other non-residential urban land uses. Rural encompasses all population, housing, and territory not included within an urban area.

T-Mobile’s lead here is not particularly surprising. In our Speedtest®Connectivity report for the second half of 2024, T-Mobile recorded the highest 5G Availability score in the U.S. with 89.4% of its users accessing its 5G network the majority of the time. 

Speedtest® users on 5G networks from 2019 until 2024 

Speedtest® users on 5G networks from 2019 (when the first 5G markets came online) until Q4 2024. 

T-Mobile: The Back Story

T-Mobile first started to deploy 5G in 2019 in its low-band 600 MHz spectrum, which it calls its Extended Range 5G. In September 2023 T-Mobile said its Extended Range 5G covered 323 million people and today the operator says the Extended Range 5G covers 98% of the U.S. 

In 2020, not long after T-Mobile closed on its acquisition of Sprint, the company started deploying 5G in the 2.5 GHz spectrum. When T-Mobile purchased Sprint it acquired 150 MHz of Sprint’s 2.5 GHz spectrum in the top 100 markets. One condition for getting the approval from the Federal Communications Commission (FCC) for T-Mobile’s merger with Sprint was that the company was required to deploy 5G service to 97% of the U.S. population within three years and 99% of the population within six years.

When combining that 2.5 GHz spectrum with T-Mobile’s existing mid-band spectrum, the company gained control of 319 MHz of sub-6 GHz spectrum. Today T-Mobile refers to its 5G in the mid-band spectrum as its Ultra Capacity 5G and it now covers more than 300 million people in the U.S. with it. 

T-Mobile’s 5G expansion is far from over, however. In May 2024 T-Mobile announced plans to purchase around 30% of regional operator USCellular’s spectrum holdings and all of its 4.5 million customers and retail stores for $4.4 billion. The deal is expected to close later this year. 

Mike Sievert, T-Mobile CEO, discussed the company’s expansion into rural markets during its Q3 2024 earnings call. In that call, Sievert told investors that T-Mobile grew its share of customers in both top 100 and smaller markets and rural areas. He also said that the company believes it has lots of room to grow in underpenetrated areas.

Delving deeper into the data 

We took a deeper look at our 5G Availability data to determine the percentage of users in each state with 5G-capable devices that are spending most of the time connected to 5G networks. The remainder of the users are those that have accessed the 5G network but spent the majority of their time connected to LTE.  We specifically looked at Ookla Speedtest Intelligence® data from Q4 2024 to see which states recorded the largest share of users spending a majority of their time on 5G in both urban and rural areas. Once again, we used US Census Bureau data for our urban-rural classifications. 

Top 5 States with the Highest Rural 5G Availability from T-Mobile (2H2024)
State% of Users on T-Mobile 5G
Florida 83.58
Connecticut 80.62
Illinois80.49
Delaware 80.39
Georgia 80.18

Top 5 States with the Highest Urban 5G Availability from T-Mobile (2H2024)

State % of Users on T-Mobile 5G
Illinois91.86
Nevada91.78
Oklahoma91.77
Florida91.57
North Dakota91.30

AT&T benefits from FirstNet for rural expansion

AT&T’s rural expansion has primarily focused on its building of FirstNet, the nationwide public safety network for first responders that uses Band 14, which is a 10 MHz block of spectrum in the 758–768 MHz and 788–798 MHz ranges. 

In 2017 the U.S. Department of Commerce awarded AT&T the FirstNet contract and essentially gave the operator access to Band 14 700 MHz low-band spectrum so it could build a nationwide wireless network specifically for first responders. 

But one of the key components to this agreement was that Congress wanted to ensure first responders even in remote areas of the country could have access to the network so it required that AT&T expand the FirstNet into rural areas that previously had little to no wireless coverage. 

AT&T finished its buildout of FirstNet’s Band 14 700 MHz network in April 2023. That buildout entailed putting 700 MHz FirstNet radios on thousands of AT&T cell towers across the country, as well as deploying more than 1,000 new FirstNet cell towers in locations earmarked by state and public-safety officials.

AT&T’s FirstNet buildout was part of the company’s “One Touch” strategy, which referred to the company’s upgrading of multiple technologies — 4G LTE, 5G and FirstNet— at a single cell site during a single visit and essentially “touching” each site once in order to provide those upgrades and avoiding repeated visits. 

Although initially FirstNet supported 4G LTE connections, in 2021 AT&T upgraded its FirstNet core to support 5G and in February 2024 the FirstNet Authority agreed to invest $8 billion over 10 years to enhance FirstNet’s 5G coverage and upgrade the network, giving it a dedicated 5G core.

AT&T said in October 2024 that the FirstNet network supports more than 6.4 million connections and 29,000 public safety agencies. 

Besides its reliance on FirstNet, AT&T also has deployed 5G across its low-band spectrum and is building out its mid-band 5G network. The operator spent roughly $37 billion on mid-band spectrum licenses in the FCC’s C-band and 3.45 GHz auctions.

Top 5 States with the Highest Rural 5G Availability from AT&T (2H2024)

State% of Users on AT&T 5G
Texas78.17
Florida75.24
Alabama74.77
Louisiana74.76
California72.81
Top 5 States with the Highest Urban 5G Availability from AT&T (2H2024)

State% of Users on AT&T 5G
California92.47
Florida 91.1
Nevada90.92
Texas 89.91
Louisana89.45

Verizon relies on C-band and acquisitions 

Unlike AT&T and T-Mobile, Verizon didn’t have a slew of low-band spectrum for its 5G deployment so the company deployed a technology called Dynamic Spectrum Sharing (DSS), which allowed it to run 5G on the same spectrum bands as LTE, effectively letting 4G and 5G users take turns using the same chunk of spectrum via 1 millisecond increments. AT&T also used DSS in some of its low-band spectrum. 

However, DSS proved to be a bit of a disappointment and didn’t provide much of a boost to customers’ download speeds. 

Besides its efforts with DSS, Verizon deployed 5G in its C-band spectrum, which it acquired in a spectrum auction in 2021 for $52 billion. The company has an average of about 161 MHz of mid-band spectrum across the U.S. 

But to cover rural America, Verizon primarily got access to spectrum through several acquisitions and effectively purchased many of its roaming partners. In 2020 Verizon purchased Bluegrass Cellular, which operated in 34 counties in Kentucky, and Chat Mobility, a wireless operator in Iowa. It also purchased Blue Mobility, a small wireless carrier that operated in New York and Pennsylvania. In 2021 Verizon acquired the assets of Montana-based Triangle Mobile and Chariton Valley Communications Corp., which operated a 4G network in Missouri. 

However, all of these acquisitions primarily just expanded Verizon’s already strong 4G LTE network into more rural areas and didn’t help it expand its 5G network. 

Because of this, most of Verizon’s rural 5G coverage hinges on its C-band deployment.

In its Q2 2024 earnings CEO Hans Vestberg said the company was expanding its C-band 5G network in suburban and rural areas. The company also revealed in October 2024 that it will spend around $1 billion to purchase a combination of 850 MHz, AWS and PCS spectrum licenses from UScellular. Although it’s unclear where those licenses are located, it’s likely that Verizon will use this spectrum to supplement its suburban and rural 5G coverage. 

Top 5 States with the Highest Rural 5G Availability from Verizon (2H 2024)

State% of Users on Verizon 5G
Ohio56.07
Arkansas44.51
Texas43.09
New Jersey41.8
Delaware40.56
Top 5 States with the Highest Urban 5G Availability from Verizon (2H 2024)

State% of Users on Verizon 5G
Ohio 73.86
California67.76
Nebraska67.45
Arkansas66.26
Arizona66.01


5G service is scarce in rural Wyoming

The state of Wyoming has the distinction of being the only state to have the lowest 5G Availability for all three operators: T-Mobile, Verizon and AT&T.  Of course, Wyoming is known for its low population density.  Wyoming is the 10th largest state in the U.S., spanning 97,813 square miles but its population is concentrated in just a few cities: Cheyenne, Casper, Laramie and Gillette. 

Based on Speedtest Intelligence® data, T-Mobile clearly has made the most inroads when it comes to customers having access to its 5G network. Verizon, meanwhile, with just 9.8% of users on its 5G network still has quite a bit of catching up to do. 
Rural 5G Availability in Wyoming (2H 2024)

Operator% of Users on the 5G Network
T-Mobile59.29
AT&T29.73
Verizon9.8

Nevada, Illinois benefit from 5G focus

On the opposite end of the spectrum, Nevada and Illinois both appear to have benefited from a strong 5G focus from all three operators in their urban areas. Of course, Nevada is home to Las Vegas which hosts hundreds of high-profile conventions and sporting events, making it a perfect venue for showing off the latest in wireless technology. AT&T announced in 2019 that Las Vegas was one of the cities where it would be deploying low-band 5G. Likewise, Verizon in August 2023 announced that Las Vegas was its first market where it was able to use a full 160 MHz of its C-band spectrum to triple the available bandwidth for its 5G Ultra Wideband network. And T-Mobile touted its 5G coverage in Las Vegas in advance of the Formula 1 Las Vegas Grand Prix and the Super Bowl at Allegiant Stadium in February 2024. 

Chicago is also a key market for wireless players with its Magnificent Mile and United Center events venue. AT&T made Chicago a priority by deploying 5G in its mid-band spectrum in the city in late 2020. And similar to Las Vegas, Chicago also benefitted from Verizon’s C-band 5G deployment.  


Urban 5G Availability in Nevada (2H 2024)

Operator% of Users on the 5G Network
T-Mobile91.86
AT&T90.92
Verizon63.38
Urban 5G Availability in Illinois (2H 2024)

Operator% of Users on the 5G Network
T-Mobile91.78
AT&T85.27
Verizon62.5

Promise for more rural 5G is on its way

Although some states boast fairly strong 5G availability in rural areas, there are more efforts underway to improve rural 5G coverage throughout the U.S. In particular, the Federal Communications Commission (FCC) recently established the 5G Fund for Rural America which will enable it to distribute up to $9 billion to wireless service providers to bring 5G service to more than 14 million rural homes and businesses. 

The FCC has been collecting mobile coverage data to identify and target rural areas that may not otherwise receive 5G coverage if not otherwise subsidized. In August 2024 the FCC adopted final rules for the 5G Fund but the agency didn’t set up a timeline for the program.  It’s set to be a reverse auction in which operators bid to serve areas with the lowest level of government support. 

We will continue to monitor the status of urban and rural 5G coverage in the U.S. and track improvements that operators are making to their 5G networks. For more information about Speedtest Intelligence data and insights, please get in touch

Ookla retains ownership of this article including all of the intellectual property rights, data, content graphs and analysis. This article may not be quoted, reproduced, distributed or published for any commercial purpose without prior consent. Members of the press and others using the findings in this article for non-commercial purposes are welcome to publicly share and link to report information with attribution to Ookla.

| April 16, 2025

Mind the Gap: London's 5G Performance Lags Behind Other UK Cities

Londoners spend more time in mobile signal not-spots, or coverage gaps, and experience slower 5G speeds than residents of other UK cities—resulting in poorer performance in everyday tasks such as web browsing.

London is the sprawling metropolis at the heart of the UK economy, home to one of the world’s largest and most lucrative service hubs, supporting a vast network of finance and technology firms. Beyond its strategic time zone and English-language advantage for accessing both American and Asian markets, London’s prosperity has been founded on the availability of world-class infrastructure that facilitates doing business.

The city’s reputation for international competitiveness has not, however, been matched by the quality of its telecommunications infrastructure. In recent years, a flurry of media reports has highlighted the frustrations of Londoners—and visitors alike—that experience frequent issues using mobile devices indoors, underground, and in busy areas. These problems, reported as being more pronounced than in other UK and European cities, typically manifest as poor quality of experience in everyday tasks such as web browsing, video streaming, and gaming.

This article is the first and a high-level prelude to a series exploring the competitiveness of mobile networks in European towns and cities—starting in the UK with city-level comparisons to London, and followed by a deeper, more comprehensive analysis among international peers coming in research later this year. 

Key Takeaways:

  • London lags behind the UK’s largest cities across key 5G performance indicators, and the gap to top-performing Glasgow is widening. In Q1 2025, London trailed other UK cities in 5G network consistency—a key indicator of performance at the lower end of the user experience—as well as in median download and upload speeds. Mobile users in London and Belfast experienced the weakest outcomes among UK cities, with median 5G download speeds of approximately 115 Mbps in both cities, significantly behind Glasgow’s 185 Mbps. London’s marked underperformance makes the UK unique in Western European terms—not only are the disparities between its major cities wider, but it is also unusual for the capital to be the primary laggard.
  • Mobile users in London spend more time in signal not-spots with no service than residents of other UK cities, reflecting lingering coverage gaps indoors and across key transport routes. The proportion of Londoners spending the majority of their time in locations with no service (0.7%) remained higher than in other UK cities in Q1 2025, but has improved significantly from 3.7% in Q1 2023. This progress reflects operator investments in network densification through small cells and the ongoing rollout of mobile coverage across the London Underground—historically one of the city’s largest mobile not-spots—which have together enhanced overall network availability in the capital. Time spent on 2G networks increased, however, across several UK cities over the last year, including Birmingham and Manchester, as the advancement of the 3G sunset in the UK contributed to greater propensity for 2G fallback.
  • The gap in 5G availability between the UK’s major cities and the national average has significantly narrowed over the past year. In Q1 2024, Leeds led UK cities in 5G availability, with a 21 percentage point gap above the national average. By Q1 2025, London had taken the lead in 5G availability among major UK cities, and that gap above the national average had narrowed to 13 percentage points. This trend reflects progress in 5G network expansion in smaller UK towns and rural areas in recent months, which has moved at a faster pace than coverage improvements in larger cities. Overall, median 5G download speeds fell by more than 7% on average across major UK cities between Q1 2024 and Q1 2025, likely reflecting the impact of shifting network load from older technologies onto 5G, which contributed to broader improvements in overall mobile network performance in most UK cities in the same period.

A confluence of factors has created unique headwinds for mobile network deployments in UK cities in recent years, particularly in dense urban settings like London

The deployment of 5G networks in higher-frequency spectrum—most commonly the 3.5 GHz band—continues to present significant challenges for operators globally. Like their counterparts across Europe, UK mobile operators have had to invest heavily in network densification during the 5G cycle. The widespread deployment of small cells at street level across UK cities illustrates the scale of effort required to increase network capacity and overcome the more limited propagation attributes of mid-band spectrum.

Over time, the city environment itself has become increasingly hostile to the operation of high-performing mobile networks. Across developed markets, advancements in building design and stricter regulations have led to a proliferation of highly insulated, airtight structures. These developments often incorporate low-E glass, metal cladding, and reinforced concrete—materials that, collectively, turn new and retrofitted buildings into de facto Faraday cages. London, in particular, presents unique challenges among UK cities, with a high concentration of high-rise buildings featuring deep floorplates. 

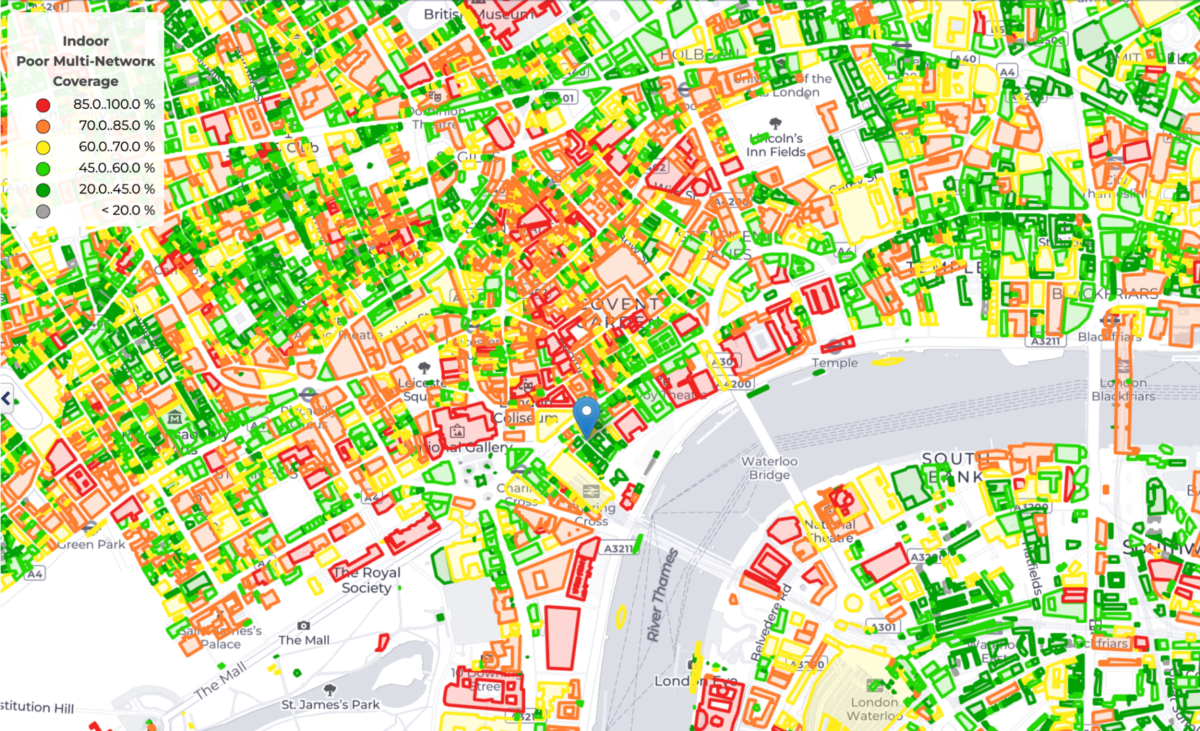
Indoor Mobile Not-Spots Have Proliferated Across Central London, Particularly in Dense Settings with New and Retrofitted Builds (Image: Ookla Cell Analytics)

While the UK’s Part L Building Regulations are not unique or unusually stringent by European standards, they have evolved alongside a set of factors particular to the UK context that have significantly hindered mobile operators’ ability to deliver high-performing 5G networks in dense urban environments. The roots of these factors stem as far back as 2017, well before the commercialization of the country’s first 5G networks, when the UK government introduced changes to the Electronics Communications Code (ECC) in an effort to accelerate mobile network rollouts and reduce costs by streamlining access to land for telecommunications deployments. 

The Digital Economy Act, which reformed the ECC, granted mobile operators and tower companies greater rights to access land on more favorable financial terms in the UK. The intention was to curb inflated lease costs, particularly in cases where landowners appeared to demand “ransom rents.” However, rather than accelerating network rollouts, the reforms triggered widespread legal disputes, uncertainty in lease negotiations, and delays in site access and upgrades. 

The impact of these land access reforms has been especially acute in dense urban settings such as London, where rooftop deployments play a disproportionate role due to limited ground-level space for mobile equipment. In London, the sheer number of individual property owners—including private landlords, commercial building managers, and housing associations—results in highly fragmented land ownership, making rooftop sites significantly more complex to manage, both legally and logistically, than rural ground leases.

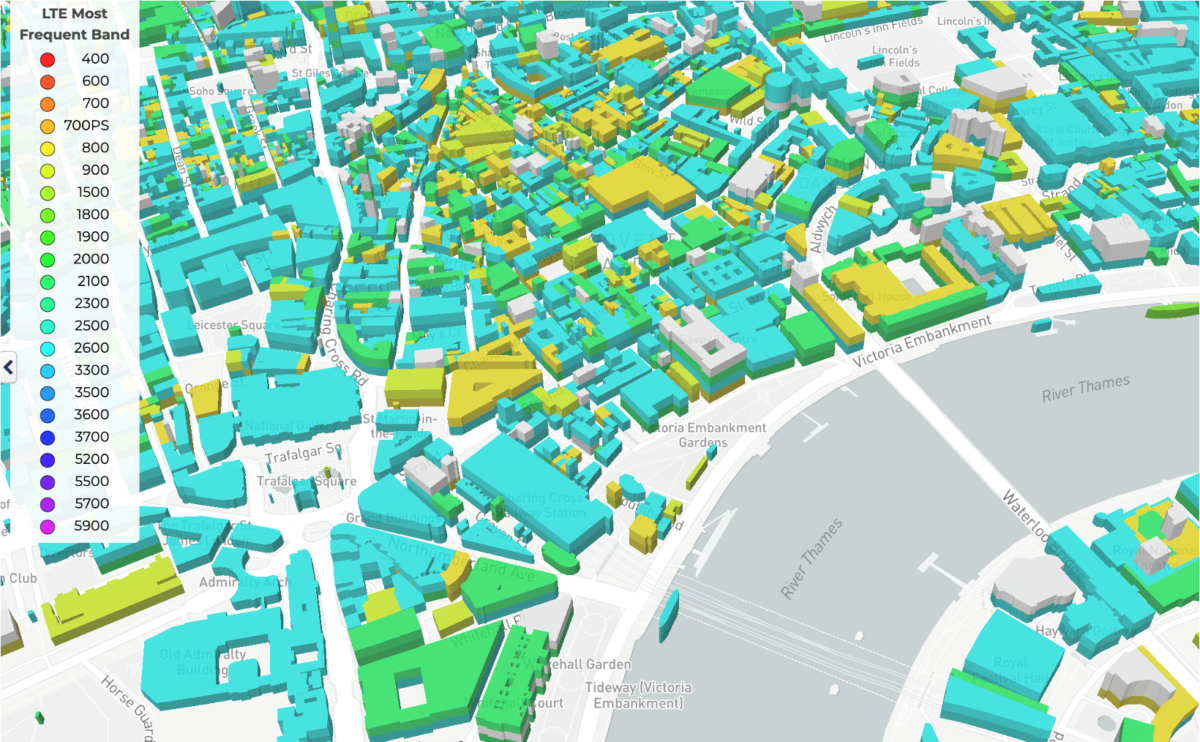
The Combination of Increasing Building Density, Use of New Insulation Materials, and Decline in Rooftop Site Availability Has Resulted in More Frequent Fallback to Less Capable Low-Band Spectrum in UK Cities like London (Image: Ookla Cell Analytics)

The EEC further compounded this complexity by disrupting long-standing rooftop leasing arrangements in cities like London, leading to thousands of disputes since 2017 over issues such as ransom rents, blocked site upgrades, and non-renewals. The regulation reduced potential rental income by as much as 80% to 90% for some landlords, significantly discouraging the availability of rooftop space for mobile network deployments. This effect was particularly pronounced in London, where building owners have seen greater commercial value in alternative uses for scarce rooftop space, such as bars, gardens, or solar panel installations, hindering the ability of operators to densify their networks. 

The UK is the only European country to have adopted such a unilateral price-cutting approach to site access during the 5G cycle. To ease tensions between operators and land owners, the UK government introduced further changes in the “2022 Product Security and Telecommunications Infrastructure Act.” These updates aimed to encourage alternative dispute resolution, simplify lease renewals, and extend the provisions from the EEC to agreements signed before 2017. However, the reforms retained the reduced rental model, meaning while procedural barriers were reduced, incentives for property owners to host rooftop sites remained weak, failing to stem the decline in rooftop site availability in cities like London in recent years.

Combined with the UK’s decision to impose stricter controls on the use of telecom equipment from non-European vendors than those seen elsewhere in Europe, which diverted time and resources toward network rebuilds rather than expansion and upgrades, UK operators have faced significant headwinds in deploying mobile network infrastructure during the 5G cycle.

Progress in the 5G rollout belies lingering performance disparities among the UK’s major cities

Despite significant progress countrywide in improving 5G networks with additional sites, more spectrum availability (some of it from the refarming of 3G), and an expanded 5G standalone (SA) footprint, disparities continue to exist among the UK’s cities. The gap between the best- and worst-performing major cities in median 5G download and upload speeds, for example, widened between Q1 2024 and Q1 2025, based on analysis of Speedtest Intelligence® data.

The Gap in 5G Download Speeds Between Glasgow and Other UK Cities Has Widened
Speedtest Intelligence® | Q1 2024 – Q1 2025


In Q1 2025, Glasgow led the UK with median 5G download speeds reaching 185 Mbps, which was as much as 47% higher than in London, the slowest major city, and 24% higher than in Birmingham, the next best performer. This ranking profile extended to 5G network consistency, which measures the proportion of Speedtest samples that meet a minimum download and upload speed threshold of 25 Mbps and 3 Mbps. While more than 85% of Speedtest samples met this threshold in Glasgow, fewer than 75% did in London, which exhibited the lowest consistency rate among major UK cities and was the only one aligned with the national average that includes both rural and urban areas.

London’s underperformance at the lower percentiles of measures like download speeds is particularly notable, as it strongly reflects the experience of mobile users in more challenging conditions—such as at the network edge, during peak hours, or in congested areas. The city’s lower consistency score and weaker 10th percentile download and upload speeds suggest that Londoners are more likely to encounter poor mobile performance compared to residents of other major UK cities.

Londoners Experience Less Consistent 5G Performance Than Residents of Other UK Cities
Speedtest Intelligence® | Q1 2025

The UK stands out in Western Europe for both the scale of the performance gap between its major cities and the unusual fact that its capital is the lagging city. Most regional peers more closely resemble the profile of neighboring France, where Paris ranks among the top three cities nationally for 5G network consistency, as well as median download and upload speeds. In France, the gap in 5G network consistency between the best- and worst-performing cities was as narrow as 5 percentage points in Q1 2025—a disparity that is half that of the UK.

The UK's Cities Exhibit a Greater Range in 5G Consistency Than Other Western European Countries
Speedtest Intelligence® | Q1 2025

In practical terms, London’s underperformance in metrics like 5G download speed and consistency translates into poorer QoE outcomes in everyday tasks like web browsing. In Q1 2025, for example, median web page load times to popular global websites were higher in London than in nine out of ten other major UK cities.

Londoners Spend More Time Waiting on Popular Websites to Load
Speedtest Intelligence® | Q1 2025

Mobile not-spots continue to be a fixture of everyday life in UK cities, particularly in London

The combination of factors outlined earlier, including the shift toward insulation materials that inhibit signal propagation, the collapse in rooftop rental fees reducing access to mobile sites, and the use of higher-frequency spectrum for 5G, has posed challenges for mobile operators across all UK cities seeking to reduce the prevalence of mobile not-spots. These challenges have been particularly pronounced in the cities with the highest levels of density, most notably London.

Deep indoor and underground spaces (e.g., transport systems like the London Underground network) remain the primary contributors to time spent with no mobile signal or fallback to 2G networks. These cell edge scenarios are highly disruptive for the end-user, resulting in limited access to basic telephony features like texting and calling and a substantial increase in device-side power consumption. 

Londoners Spend More Time in Mobile Not-Spots Than the UK Average
Speedtest Intelligence® | Q1 2024 – Q1 2025

The proportion of mobile users in London spending the majority of their time in locations with no network access at all (0.7%) was higher than in other major UK cities in Q1 2025 (an observation related to the capital city that again defies Western European norms). By contrast, less than 0.3% of mobile users in Belfast, Bristol and Sheffield spent the majority of their time in not-spots in the same period. Overall, time spent with no service accounted for as much as 2.6% of quarterly network usage in Q1 2025 in London, significantly higher than the national average.

Despite the disproportionate scale of mobile not-spots lingering in London, recent operator investments in network densification and progress in the ongoing rollout of 4G and 5G coverage throughout the London Underground network are driving dramatic improvements in outcomes. The proportion of Londoners spending the majority of their time in locations with no service has more than halved over the last two years, reflecting a much more pronounced pace of improvement than other UK cities and putting the capital on course to fall into line with other large cities like Birmingham and Manchester.

The Proportion of Mobile Users Spending the Majority of Their Time on 2G Has Increased in Several UK Cities
Speedtest Intelligence® | Q1 2024 – Q1 2025 (Including Roaming Samples)

The advancement of the UK’s 3G sunset, which is set to be substantially complete by the end of this year, is reflected in a sharp reduction in the proportion of mobile users spending the majority of their time on 3G networks. In London, for example, this proportion fell from over 4.5% in Q1 2023 to less than 0.7% in Q1 2025.

The 3G sunset has, however, contributed to an increase in 2G fallback in UK cities at the cell edge where 4G and 5G networks are unavailable. Time spent on 2G increased across several UK cities over the last year, including Liverpool, where this trend has resulted in a larger share of users spending the majority of their time on 2G than in areas with no service at all (a rarity among UK cities). 

The Decline in 3G Usage Has Been Similarly Rapid Across UK Cities
Speedtest Intelligence® | Q1 2023 – Q1 2025

Cities that take a proactive approach to telecoms feature the best 5G outcomes

Glasgow’s position as the leading UK city in key 5G performance indicators is unlikely to be an outcome achieved by mere chance. Beyond the contribution of inherent structural factors related to building composition, such as a lower prevalence of high-rise developments relative to other major UK cities, Glasgow’s 5G leadership is also likely rooted in its early and proactive approach to supporting telecoms infrastructure.

The city was among the first in Europe to establish a dedicated “Telecoms Unit”, which streamlined access to city-owned assets for telecom deployments, provided standardized agreements for rental fees, and consolidated telecoms functions within the local authority to reduce departmental siloes. This proactive approach facilitates inward investment in network infrastructure and better 5G outcomes. 

Ookla retains ownership of this article including all of the intellectual property rights, data, content graphs and analysis. This article may not be quoted, reproduced, distributed or published for any commercial purpose without prior consent. Members of the press and others using the findings in this article for non-commercial purposes are welcome to publicly share and link to report information with attribution to Ookla.

| December 13, 2024

Controlled Network Testing in one of the World’s Top Performing Cities - Seoul

South Korea stands out as an international 5G benchmark

South Korea is a global leader in 5G technology and adoption, having launched the first commercial 5G networks in April 2019. Its exclusive use of C-band for 5G services, with no sub-GHz spectrum allocated for 5G, also puts it in a unique position. 

This focus on C-band across the entire market has led to strong 5G network densification, with the OECD’s most recent Digital Economy Outlook 2024, highlighting the lead South Korea enjoys among a selection of advanced global markets on 5G deployment, with 593 5G base stations per 100,000 inhabitants, well ahead of next placed Lithuania (328) and Finland (251). Earlier this year, the Korean regulator, the Ministry of Science and ICT (MSIT) announced that South Korea had attained nationwide 5G coverage.

MSIT allocated wide bands to each of the three mobile operators, KT, SK Telecom and LG U+, with the former two receiving 100 MHz, and the latter initially receiving 80 MHz. Despite its spectrum disadvantage, our previous South Korean benchmark placed LG U+ in pole position in terms of median download performance. Since that benchmark, LG U+ was awarded an additional 20 MHz of C-band spectrum in mid-2022, which it deployed during 2023, which brought its C-band holdings in line with the competition.

Given its level of network densification, and deployment in wide spectrum bands in the prized C-band, it’s no surprise that South Korea consistently ranks in the top-10 of Ookla’s Speedtest Global Index for mobile performance, (which ranks countries based on median download speeds), currently placing 6th as of October 2024.

This lead is helping deliver improved consumer experiences, with South Korea outpacing other East Asian markets (including Japan, China, Taiwan and Hong Kong) on mobile gaming performance, recording the lowest latency, as well as the highest median download and upload performance in the region.

Strong 5G adoption, but performance has been a concern for consumers

From a consumer perspective, South Korea is a mature 5G market, with LG U+, for example, recording a 5G penetration rate (among handsets) in excess of 70% as of Q3 2024. South Korean users have been swift to embrace the new technology, with 5G connections in the market growing steadily, crossing the 30 million mark during 2023, and reaching 36.11 million as of Q3 2024, according to GSMA Intelligence.

Despite strong adoption, and 5G providing a significant uplift over 4G performance in the market – median 5G download speeds in November 2024 were 524.23 Mbps across the market according to Speedtest Intelligence, compared to 64.08 Mbps for 4G-LTE – the mobile providers have had to focus their efforts on continuous improvements in performance levels. All three mobile providers were fined by South Korea’s antitrust regulator in 2023, following consumer complaints that 5G had not delivered on promises the mobile providers had made in their marketing.

To assess how South Korean mobile performance has evolved since our last benchmark, and how mobile providers have responded to consumer concerns on performance, we returned to the capital Seoul during 2H 2024 to benchmark performance in the city. We measured mobile performance using RootMetrics’ controlled methodology across a variety of indoor and outdoors locations, using the latest Samsung Android devices. We tested where and when people most often use their smartphones: tourist areas, business districts, and other areas at times of peak mobile usage. Tests were conducted while walking and driving across more than 900km in distance within Seoul, and including in excess of 17,000 samples, including more than 50 major indoor locations. RootMetrics controlled testing methodology is specifically designed to mimic the end-user’s real-world mobile experience.

In addition to benchmarking the mobile providers based on median download and upload performance, as well as latency and availability metrics, we also examined video streaming and voice call performance.

The results: LG U+ approaches gigabit median mobile speeds

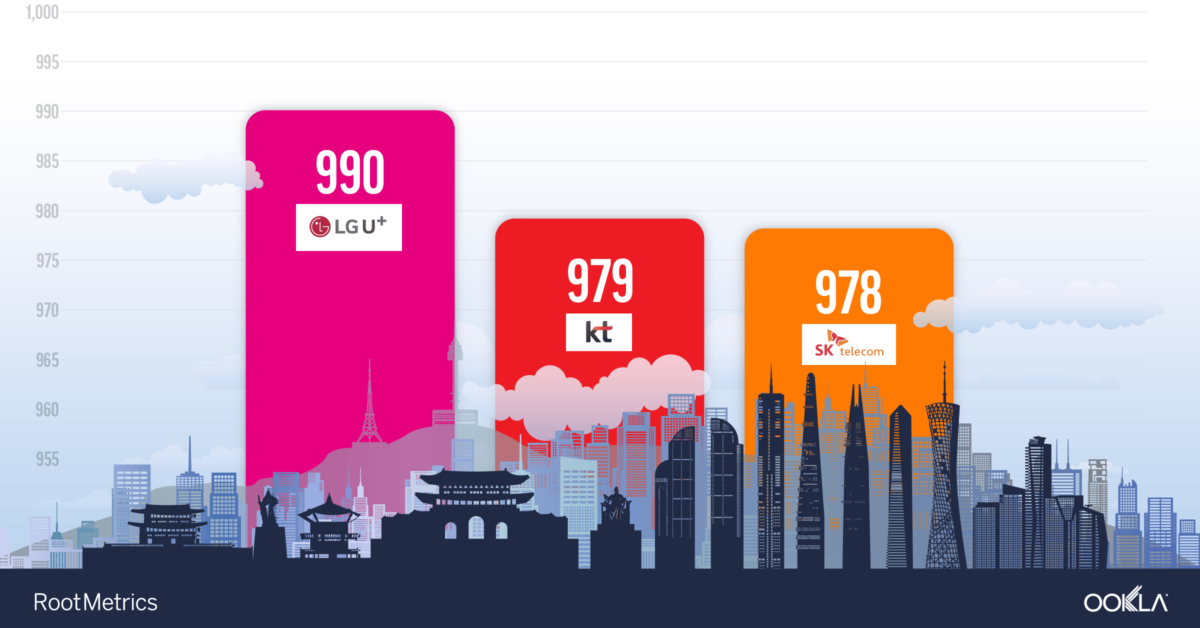
LG U+ led the market in 2H 2024 overall performance, with the carrier’s consistently strong showings across speed, reliability, and latency, allowing it to capture the award for the Best 5G Network in Seoul. Based on RootMetrics RootScore methodology, which combines scores across all components of the testing, LG U+ scored 990 out of 1000, ahead of both KT and SK Telecom, which ranked second jointly, with scores of 979 and 978, respectively.

South Korean mobile providers continue to push the boundaries of mobile performance in the South Korean capital, with all three providers recording a significant uplift in download throughput when compared to 1H 2022. LG U+ led the pack, with a median download speed of 916.90 Mbps, while it also led the market based on its performance at the 5th and 95th percentiles. This marks a large increase when compared to our controlled testing in 1H 2022, where LG U+ led the market with a median download speed of 663.4 Mbps, with all three mobile providers increasing median performance significantly, highlighting their continued investment in their 5G networks to help meet consumer expectations. LG U+ recorded the highest median upload speed, with 108.00 Mbps, while SK Telecom led the way on median latency, with 98 ms.

RootMetrics Performance Results – Seoul

5G performance driving impressive user experience metrics

RootMetrics benchmarks voice calling and video streaming performance as part of its comprehensive testing suite. Among South Korean mobile providers, both LG U+ and SK Telecom use a 5G non-standalone (NSA) network configuration, where voice is delivered via VoLTE (using the 4G network), while KT employs a 5G standalone (5G SA) network, where voice is carried over the 5G new radio (VoNR). LG U+ recorded the shortest voice call setup time, of 0.882 seconds, while also achieving an impressive zero call drops or blocks from our testing.

Based on our video testing, KT recorded the fastest median video start time, at 0.91 seconds, while both LG U+ and SK Telecom were able to drive higher bitrates over their networks, of 8.0 Mbps. With these consistent bitrates, 1080p video quality was consistently delivered to users.

RootMetrics User Experience Results – Seoul

Outlook: Seoul serves as a benchmark for other cities across Asia Pacific

South Korea stands out as a global leader in 5G technology and adoption, having launched the first commercial 5G networks in April 2019, and is investing heavily in next generation technologies, with a strong focus on AI and 6G. Its capital city, Seoul, stands out as a benchmark for mobile network performance globally and has maintained its first-mover advantage.

To learn more about Ookla’s controlled drive and walk testing with RootMetrics® and first-party crowdsourced data from Speedtest®, please contact us.

Ookla retains ownership of this article including all of the intellectual property rights, data, content graphs and analysis. This article may not be quoted, reproduced, distributed or published for any commercial purpose without prior consent. Members of the press and others using the findings in this article for non-commercial purposes are welcome to publicly share and link to report information with attribution to Ookla.

| February 4, 2025

5G FWA in Reshaping the Broadband Market in the Gulf region

5G fixed wireless access (FWA) has positively impacted the Gulf region’s broadband landscape. It became popular because it provides consumers and enterprises with affordable, flexible, alternative high-broadband services to fiber. In this article, we identify the drivers for 5G FWA adoption in the Gulf region, use the example of Ooredo in Oman to examine the performance of FWA services, and discuss how local ISPs could improve the positioning of FWA to drive further adoption.

Key Takeaways:

  • The main drivers of 5G FWA’s take-up in the Gulf region are performance, affordability, reach, and convenience. These characteristics helped to make the service more accessible to a broader population segment. Moreover, the shift from data-capped plans to unlimited data offerings has made 5G FWA more appealing to consumers and businesses.
  • The evolution of 5G technology is helping FWA cater to the needs of high-demand users. For example, in Q3 2024, Ooredoo (Oman) achieved a 90-percentile download speed of 83 Mbps, narrowing the gap with the most affordable fiber package that starts at an advertised speed of 100 Mbps.
  • Gulf operators could address the negative perceptions associated with 5G FWA by continuously optimizing networks, offering flexible contract terms, affordable pricing, and popular over-the-top (OTT) bundles. 

The Gulf region is one of the global leaders in the deployment and adoption of FWA services

Some of the earliest adopters of 4G/5G FWA have been Gulf-based operators. They have been integrating it into their fixed broadband portfolios with 4G since 2021. While FWA has traditionally been considered secondary to fiber, its significance has grown with the advent of 5G as a cheaper alternative to fiber, particularly in areas of low coverage.

Operators’ emphasis on 5G FWA services is primarily influenced by their market share in the fixed broadband market and the extent of their fiber network coverage. Market incumbents initially focused on expanding their fiber services as part of transitioning from legacy technologies like DSL, viewing 5G FWA as a secondary offering. In larger countries, where fiber deployment and adoption have been slower, like Oman, all operators recognized the potential for 5G FWA to bridge the high-speed broadband divide. Hence, they have been offering FWA while actively promoting fiber.

5G FWA created an opportunity for market challengers to address the limitations of both legacy and fiber technologies, including:

  • Poor performance on legacy technologies: 5G FWA represents a significant upgrade in performance for DSL and 4G FWA users.
  • Coverage gap: 5G FWA offers an advantage in terms of reach. Mobile operators have used it to enter the fixed market, and converged operators have deployed FWA to extend broadband services to remote or hard-to-reach locations quickly.
  • Installation complexity: Self-installed indoor customer premises equipment (CPE) is typically provided free as part of an annual subscription.
  • Contract length and cost: Operators have positioned 5G FWA as lower-priced packages, offering more contract flexibility than fiber plans, which usually lock customers in a contract for two years.

Ooredoo Oman used 5G FWA to complement its fiber strategy

We use Oman as an example to analyze the market context that favored the launch of 5G FWA and discuss the operator’s business strategy. We also use Speedtest Intelligence® to assess network performance between Q3 2023 and Q3 2024 and identify the locations within the Omani capital, Muscat, where customers would have experienced the fastest median download speeds during Q3 2024.

Omantel and Ooredoo launched 5G FWA in Oman before introducing mobile 5G in April 2021. Omantel was the first to launch 5G fixed-wireless access (FWA) services in December 2019, followed by Ooredoo in May 2020. According to the Telecommunications Regulatory Authority (TRA), 5G broadband subscriptions increased from 37,000 in June 2021 to 212,204 in June 2024, a nearly 6-fold increase in three years. During this period, fiber subscriptions increased by almost 48% to 307,635. 

Ooredoo has been expanding its 5G coverage to serve more customers. Its 5G FWA coverage increased from 46.8% at the end of 2021 to 87.6% in June 2024, increasing its fixed 5G base by 27% by the end of 2023 compared to 2022. While 5G has driven fixed broadband growth for Ooredoo, the operator has also pursued a fiber expansion strategy by relying on a national wholesale fiber infrastructure provider, Oman BroadBand (OBB). 

At launch, Ooredoo introduced speed-tiered FWA tariffs ranging from 30 Mbit/s to 200 Mbit/s with varying monthly data allowances. It continues to segregate 4G from 5G plans and segment them by speed, contract length, and number of content packages included. In 2024, the price of FWA packages dropped to an OMR25–OMR35 ($65–$91) range per month, with faster speed, higher data allowances, and more content.

4G/5G FWA performance improved with some fluctuations. The median download speed was 18.74 Mbps in Q2 2022 and gradually increased to 43.78 Mbps by Q3 2024. This steady growth suggests that Ooredoo has improved its network infrastructure and, as a result, its user experience. 

5G FWA underperforms wired broadband service according to Speedtest Intelligence data, but the performance gap is shrinking. For reference, the median download speed measured for Ooredoo’s wired broadband users reached 64.22 Mbps in Q3 2024. Considering that this figure represents mainly fiber performance, FWA can provide a decent alternative for those who cannot subscribe to fiber services.

Ooredoo’s performance is reflected in the significant upward trend in the 90th percentile speeds. It started at 33.66 Mbps in Q2 2022 and peaked at 83.37 Mbps by Q3 2024. This increase indicates that while the median speeds were relatively modest, the top-performing users experienced substantial improvements in their download speeds.

Median and 90th percentile 5G FWA Download Speeds, Ooredoo Oman

Median and 90th percentile 5G FWA Download Speeds, Ooredoo Oman

When we look at the distribution of median download speeds around the capital city of Muscat, we note that central neighborhoods, such as Madinat Al Irfane and Ghala, and coastal areas, such as Qurm, enjoy a speed of at least 100 Mbps. Meanwhile, residents west of Falaj enjoyed a median speed of at least 200 Mbps.

Map: Distribution of 5G FWA Median Download Speeds for Ooredoo in Muscat, Oman

ISPs can adopt different strategies to enhance 5G FWA adoption in the Gulf region

Operators could adjust the way they position 5G FWA propositions to address the concerns and negative perceptions that hindered their adoption in the past, including:

  • Provide high-quality CPEs. Operators have regularly refreshed the CPEs with new models that provide better reception (for example, by using MIMO technology), support better Wi-Fi capacity (for example, by using Wi-Fi 6 standard), and indoor coverage (by offering mesh devices).
  • Position it as a more affordable alternative to fiber. Over the last two years, the price of 5G FWA has decreased considerably, and all operators in the Gulf have waived the upfront one-time payment for the CPE while shifting to unlimited data usage by default (at least in the first year).
  • Bundle FWA services with content subscriptions to help differentiate from fiber offerings with flexible content, such as video streaming and gaming. For instance, some operators offer a selection of these with their FWA plans, which adds significant value for customers and helps position it as a comprehensive home entertainment solution. 

Operators’ strategic deployment of 5G FWA, affordability, and ability to quickly extend high-speed internet access to areas with limited fiber coverage helped popularize the Gulf region service. As network coverage expands, FWA will likely play an increasingly important role in the region’s broadband market, offering a viable alternative to traditional fiber connections and helping bridge the digital divide in underserved areas. 

Challenger FWA operators, such as Ooredoo Oman, are investing in optimizing their network performance to maintain their competitiveness. The recent 5.5G trials in the region will also set a new basis for competition as the latest technology promises to offer even faster download speeds, lower latency, and enable differentiated quality of service and dedicated resources through network slicing. These enhancements will help to improve customer satisfaction and drive the growth of FWA services in the region.We will continue to monitor the evolution of 5G FWA and its adoption in the region. For more information about Speedtest Intelligence data and insights, please contact us.

Ookla retains ownership of this article including all of the intellectual property rights, data, content graphs and analysis. This article may not be quoted, reproduced, distributed or published for any commercial purpose without prior consent. Members of the press and others using the findings in this article for non-commercial purposes are welcome to publicly share and link to report information with attribution to Ookla.

| January 20, 2025

The Envy of Europe: Nordics Lead in 5G Availability and Network Sunsets

Nordic countries have consolidated their lead in 5G Availability and network sunsets, underscoring the emergence of a two-speed Europe in 5G deployment  

Home to two of the world’s largest radio vendors, Ericsson and Nokia, and characterised by markedly higher operator profitability than much of the rest of Europe,  the Nordic region remains a key bright spot in Europe’s struggle for competitiveness against the Middle East, North America and Asia in 5G. Nordic countries have distinguished themselves in the 5G cycle through the timely release of mid-band spectrum assets, the development of innovative government policies to enable widespread rollout beyond core urban centres and a unique appetite for network sharing.

Combined with other favourable factors—such as some of the highest urbanisation rates in Europe (resulting in a smaller-than-average share of the population living in rural areas), flat topography (particularly in Denmark and Finland) and high average revenue per user (ARPU)—the Nordic countries have positioned themselves as European leaders in 5G Availability, rivaling global frontrunners like the United States, Qatar and South Korea.

Such is the importance of network quality to consumer sentiment in the Nordics that recent months have seen a flurry of operators eager to highlight major 5G coverage milestones as they complete their multi-year nationwide network refresh and expansion programmes.

At the end of 2024, Telia in Norway announced it was the first in the country to reach “close to 99% of the population” with 5G, while DNA in Finland declared that its 5G network had “reached all municipalities in mainland Finland with population coverage close to 100%“. Similar announcements came from Sweden, where Tele2 and Telenor, collaborating through the Net4Mobility joint venture, reported covering “over 90% of Sweden’s population with 5G”.

Intensive low-band deployment makes the Nordic 5G strategy the envy of Europe

Analysis of Speedtest Intelligence® data confirms that Nordic operators have much to celebrate. In Q4 2024, Nordic countries claimed three of the top five positions in Europe for 5G Availability—the percentage of users with 5G-capable devices spending most of their time connected to 5G networks. Furthermore, all four Nordic countries ranked within the top ten. Denmark retained its position as Europe’s leader, achieving an impressive 5G Availability of 83.4%, narrowly surpassing Switzerland, which remains the only other European country to exceed the 80% milestone to date. 

Two-Speed Europe: Nordic Countries Take the Lead in 5G Availability
Speedtest Intelligence® | 5G Availability (%) in Q4 2024

Spectrum configuration decisions are a critical pillar of mobile network design and play a direct role in shaping coverage outcomes. Many European countries, including Ireland (61.9%) and the Netherlands (60.5%), have achieved high levels of 5G Availability by extensively utilising Dynamic Spectrum Sharing (DSS)—a technology that allows 4G and 5G networks to share the same frequency bands simultaneously (most commonly in the 1800 MHz and 2100 MHz bands)—to rapidly and cost-effectively expand 5G coverage atop the existing site footprint.

However, this reliance on DSS to fill coverage maps can negatively impact 5G performance and is intended as a temporary measure until more traffic transitions to newer 5G networks. This helps explain why the level of 5G coverage available is not always a reliable predictor of overall performance outcomes across Europe—for example, Ireland boasts above-average 5G Availability but has consistently ranked last in Europe for median mobile download speed.

The Nordic 5G Model: Early Low-Band Spectrum Access at Competitive Prices
Source: EU4Digital


The Nordic countries stand out for achieving high levels of 5G Availability without relying disproportionately on DSS technology. Operators in all four Nordic countries benefited from the early allocation of dedicated low-band spectrum for 5G in the 700 MHz band (first assigned in Finland in 2016 and most recently in Norway in 2019) and relatively low spectrum acquisition costs (e.g., €0.218 MHz/pop in Finland versus €0.701 MHz/pop in France). This combination has enabled extensive 5G deployments across the region, delivering deeper indoor and rural 5G access compared to much of Europe, thanks to the favourable propagation characteristics of the 700 MHz band.

Higher levels of 5G Availability in the Nordics have facilitated a greater shift of traffic from 4G to 5G networks compared to other parts of Europe. For example, Finnish regulator Traficom reported that nearly a quarter of all smartphone traffic in Finland originated on 5G networks during the first half of 2024, significantly surpassing other countries that track similar metrics, such as Spain and Portugal, where the 5G traffic share (even including FWA) remained well below 20% during the same period.

Innovative ‘carrot-and-stick’ policies drive Nordic 5G rollout  

Nordic countries have consistently prioritised 5G access as a cornerstone of ambitious national digital transformation strategies. For example, the Norwegian government has introduced a range of policy measures aimed at achieving its goal of becoming the “world’s most digitalised country by 2030”. Recognising the critical role of high-speed mobile networks in driving economic competitiveness, the Nordic prime ministers signed a Letter of Intent (LOI) in 2018, declaring that the region should become the “first and most integrated 5G region in the world” and establish a “common Nordic 5G space”.

Sweden has closed the 5G Availability Gap with its Nordic Peers after a Slow Start
Speedtest Intelligence® | Q4 2023 – Q4 2024

To achieve this vision, Nordic countries adopted a whole-of-government approach, introducing a suite of financial and policy tools aimed at supporting the 5G rollout. In particular, Nordic telecoms regulators have been European leaders in the development of progressive ‘carrot-and-stick’ policies to accelerate 5G deployments and have leveraged spectrum assignments to steer operator behaviour:

  • Denmark incentivised 5G rollout through multi-band auctions in 2019 by attaching regional coverage obligations to low-band spectrum (700 MHz), requiring Danish operators to serve specific underserved addresses with minimum download speeds of 30 Mbps and upload speeds of 3 Mbps by April 2022. To encourage participation, these spectrum lots were auctioned under conditions of limited competition and without a minimum price, meaning operators could bid for additional coverage commitments in exchange for reductions in their licence costs. This innovative approach rewarded Danish operators for expanding 5G access in targeted areas with limited network access.
  • Finland implemented similar coverage obligations in its 2016 auction of the 700 MHz band, requiring operators to provide coverage to 99% of the population within four years. However, it allowed coverage from other frequency bands already in use at the time (800 MHz, 1800 MHz, and 2.6 GHz) to be included in meeting the target.
  • Sweden assigned two lots of 10 MHz in its 2018 auction of the 700 MHz band with coverage obligations, requiring operators to address prioritised areas with insufficient mobile coverage, ensuring minimum download speeds of 10 Mbps. Licence holders were required to deploy new mobile sites and invest up to €30 million to meet phased coverage targets, including 25% of the prioritised areas by the end of 2021 and 100% by the end of 2024.

Favourable Demographics and Topography Enable High 5G Availability Across Every Region in Denmark
Speedtest Intelligence® | 5G Availability (%) in Q4 2024

Denmark’s coverage obligations have delivered tangible results. Helped by the highest urbanisation rate, smallest rural population and flattest terrain among the Nordic countries, Denmark’s four operators have collectively achieved 5G Availability of at least 70% in each of the country’s regions (regioner), despite lower-than-average ARPU, according to Speedtest Intelligence data for Q4 2024.

Despite Lower Urbanisation Rates than its Nordic Peers, Norway Excels in 5G Availability
Speedtest Intelligence® | 5G Availability (%) in Q4 2024

Similarly, the most rural regions of northern Sweden (e.g., Norrbotten) and Norway (e.g., Finnmark), characterised by sparse populations, vast forests and a challenging Arctic climate, exhibit higher levels of 5G Availability than many more densely populated areas in Europe. Financial support of €140 million from the European Investment Bank (EIB) to Tele2, which also benefits Telenor through their Net4Mobility joint venture, has been instrumental in supporting 5G deployments in these rural areas of Sweden.

Rural Sweden Exhibits Higher Levels of 5G Availability than typical in Europe
Speedtest Intelligence® | 5G Availability (%) in Q4 2024

Similar financial instruments are aiding 5G deployments in rural Norway. In the first half of 2024, the Nordic Investment Bank (NIB) provided a 15-year €85 million loan to Lyse AS, the owner of Norway’s third mobile operator, Ice, to finance the upgrade of over 2,800 mobile sites and the development of more than 3,500 new ones, aiming to extend Ice’s 5G coverage to 99.5% of the population over the next three years.

Network sharing accelerates Nordic 5G rollouts in rural areas  

Higher levels of inter-operator collaboration on mobile infrastructure buildouts in the Nordics compared to other European countries have been key to improving the economics of delivering 5G coverage in rural areas. Extensive network sharing agreements between at least two operators exist in Denmark (e.g., the TT Network joint venture between Telia and Telenor), Finland (e.g., the Finnish Shared Network joint venture between DNA and Telia in Northern and Eastern Finland) and Sweden (e.g., the Net4Mobility joint venture between Tele2 and Telenor).

Deep Network Sharing among Nordic Operators Drives Symmetry in 5G Availability
Speedtest Intelligence® | 5G Availability (%) in Q4 2024

The extensive depth of network sharing has contributed to balanced 5G coverage outcomes among operators in the Nordics, resulting in a greater-than-usual symmetry in 5G Availability within these countries. Sweden exemplifies this, with nearly identical 5G Availability levels (72.5%) observed for Tele2 and Telenor, according to Speedtest Intelligence data for Q4 2024. In contrast, smaller operators that have historically relied on national roaming agreements (e.g., Ice in Norway) or are not part of major sharing arrangements (e.g., 3 in Sweden) continue to exhibit lower 5G Availability, leading to greater coverage imbalances with market leaders.

Alongside a strong appetite for network sharing, Nordic operators have also embraced the shutdown of legacy networks more rapidly than other parts of Europe. Speedtest Intelligence data for Q4 2024 shows that operators in Finland and Norway have already completed the full sunset of 3G, with Denmark expected to follow suit once 3 finalises its 3G sunset in the coming months.

Low-Band Deployment and Early Network Sunsets Minimise Nordic Subscriber Time on 2G and 3G
Speedtest Intelligence® | Q4 2024

The proportion of Nordic mobile subscribers spending the majority of their time without network access was highest in Finland (1.9%) in Q4 2024, significantly above Norway (0.8%), the regional leader. Despite progress in phasing out 3G networks, several Nordic operators are postponing their 2G shutdowns to facilitate smoother migration for legacy users. Telia in Sweden, for example, recently announced a two-year delay to its 2G switch-off, now planned for 2025, to minimise disruptions in sectors like agriculture, which rely on 2G for essential equipment such as milking robots and irrigation systems.

Ookla retains ownership of this article including all of the intellectual property rights, data, content graphs and analysis. This article may not be quoted, reproduced, distributed or published for any commercial purpose without prior consent. Members of the press and others using the findings in this article for non-commercial purposes are welcome to publicly share and link to report information with attribution to Ookla.

| January 12, 2025

How consolidation is reshaping Spain’s telecoms market in 2025 | La consolidación cambia las telecomunicaciones españolas en 2025

Spanish/Español

Spain continues to lead Europe in fiber rollout, but lagging mobile performance undermines country’s overall telecoms competitiveness

The dynamism of Spain’s telecoms market stood out among its European peers last year, with a flurry of mergers reshaping the market’s structure and strong investment in next-generation networks, supported by targeted government initiatives, improving outcomes for Spanish consumers. However, while increased fiber and 5G penetration have driven notable year-on-year improvements in overall network performance, Spain’s international competitiveness in telecoms remains highly imbalanced between its fixed and mobile infrastructure.

The country’s credentials as Europe’s preeminent fiber leader remain intact. In 2024, Spain ranked among the top three in the EU for fiber-to-the-premises (FTTP) coverage (95.2%) and the share of fixed broadband subscriptions providing download speeds above 100 Mbps (93.5%), according to the latest edition of the European Commission’s ‘State of the Digital Decade’ report. This continues to position the country significantly ahead of some of the bloc’s largest economies, most notably Germany, which still lags in FTTP coverage (28.8%) due to a slow shift away from cable networks.

Analysis of Speedtest Intelligence® data reveals that median fixed download speeds in Spain increased from 173.32 Mbps to 210.46 Mbps between 2023 and 2024. This trend of improvement was mirrored across other fixed network performance metrics, with upload speeds increasing in the same period from 129.62 Mbps to 155.53 Mbps. In Q3 2024, DIGI achieved a median fixed download speed of 321.21 Mbps in the Spanish market, followed by Jazztel (273.18 Mbps), Orange (262.78 Mbps), Yoigo (255.74 Mbps) and Movistar (180.30 Mbps).

Spain Leads Europe in Fiber Deployment and Adoption, Boasting the Highest Coverage Among the EU's Top 10 Economies
European Commission | DESI 2018 – 2024

Having achieved exceptionally high levels of FTTP penetration across urban, suburban and rural areas—placing Spain among the top three in the European Commission’s DESI 2024 Index for FTTP coverage in sparsely populated rural areas—the focus in Spain is shifting toward enhancing quality of experience (QoE) in core use cases such as gaming and video streaming. Despite boasting higher FTTP coverage and take-up rates, Spain ranks below countries like France in Ookla’s Speedtest Global Index™. This disparity highlights the influence of factors such as Wi-Fi technology—France has a higher penetration of Wi-Fi 6 and 7 in ISP-provided CPE—and tariff provisioned speeds, with a larger share of fiber customers in France subscribing to multi-gigabit plans, on fixed broadband performance.

DIGI’s strong fixed download speed performance in Spain, detailed in Ookla’s Speedtest Connectivity Report for 1H 2024, is underpinned by similar favourable factors. Notably, it was first to market in Spain with a 10 Gbps service, fully leveraging its XGS-PON fiber infrastructure. With highly competitive pricing—starting at just €20 per month for 1 Gbps and €25 per month for 10 Gbps, including Wi-Fi 6 CPE as standard—DIGI has quickly secured a significant share of multi-gigabit capable connections in the Spanish market. 

Autonomous Communities in Northern Spain Lead in Fixed Download Speed Performance
Speedtest Intelligence® | 2024

In addition to highlighting the importance of modern CPE and higher tariff-provisioned speeds, DIGI’s business last year exemplified the accelerating consolidation trends in Spain’s highly overbuilt and fragmented fiber market. The acquisition of DIGI’s fiber infrastructure by a Macquarie-led consortium, which solidified wholesale specialist Onivia’s status as the largest of the ‘neutral’ FTTP networks in Spain, dovetailed with developments such as Telefónica’s BlueVia wholesale spin-off, the emergence of MásOrange and Zegona-controlled Vodafone’s ‘FiberCo’ tie-ups with both Telefónica and MásOrange.

As observed in other European markets with significant fiber overbuild, such as the alt-net model in the UK, consolidation is a slow and challenging process. However, Spanish operators continue to pursue it to enhance the economics of their fiber investments in highly overbuilt urban areas, unlocking scale and resources to capture future growth in rural areas where overlapping infrastructure is less common. This begins with small local operators—of which there are hundreds—being absorbed by ‘local consolidators’. These are then integrated into the infrastructure portfolios of regional consolidators, ultimately leading to acquisition by one of the largest traditional players. 

Fiber Overbuild from Smaller Players like DIGI Drives Market Share Shift from Incumbents
Analysis of CNMC Market Data | 2022 – 2024

This gradual process of consolidation is reshaping the fiber business model in Spain, as traditional operators separate their infrastructure and service units to support the growth of wholesale offerings. The coming year will provide some insight into whether a consolidated third player can successfully compete and coexist alongside the vertically integrated Telefónica and MásOrange in the long-term.

MásOrange is vying for network leadership in Spain, founded on a significant spectrum advantage

The winds of consolidation have swept through the Spanish mobile market too, culminating last year in the European Commission’s approval of a 50:50 joint venture between MásMóvil and Orange. The merger has pole-vaulted the newly formed ‘MásOrange’ into a leading position in the market, both in subscription and spectrum share. To secure regulatory approval from Brussels, the merging entity committed to divesting 60 MHz of spectrum, including 20 MHz in the 3.5 GHz band, to facilitate the entry of DIGI as a fully-fledged independent mobile operator, effectively restoring the Spanish market to a four-player structure and ‘exerting a strong competitive constraint on the joint venture’.

In addition to diversifying its portfolio of brands through the merger—with Orange and Yoigo catering to the premium segment, Jazztel and MásMóvil focusing on value for money and regional brands like Euskaltel and Telecable serving local needs—MásOrange hopes its consolidated spectrum assets will enable it to achieve network leadership in the Spanish mobile market. 

Movistar Revenues Stable YoY in Q3 2024 while Vodafone and MásOrange Face Declines
Analysis of CNMC Market Data | 2022 – 2024

The merged entity’s consolidated network will be primarily based on Orange’s infrastructure, complemented by MásMóvil’s existing site portfolio and the deployment of new greenfield sites. The integration of MásMóvil’s network, which relies entirely on mid- and high-band spectrum and has historically depended on a national roaming agreement with Orange, creates a natural synergy for the merged entity. It enables the integrated network to leverage MásMóvil’s capacity and density in urban areas alongside Orange’s extensive coverage and nationwide reach.

MásOrange is particularly focused on vying to unseat Movistar’s dominance in the premium segment, a position it has long upheld thanks to its emphasis on superior network quality. Movistar emerged as the fastest mobile operator in the Spanish market in Ookla’s Speedtest Connectivity Report for 1H 2024, delivering the highest median download speeds of 82.68 Mbps.  This placed Movistar significantly ahead of Orange (56.42 Mbps) and Yoigo (36.73 Mbps).

The merged entity’s spectrum advantage is heavily weighted toward mid- and high-bands, which are typically utilised for 5G deployments in urban and suburban areas. According to data published by MásOrange, it holds 37% of all mid- and high-band assets in the Spanish market—compared to 28% and 26% for its closest competitor, Telefónica—giving it a unique opportunity to enhance 5G speed performance and gain a competitive edge.

Movistar has maintained its strong 5G speed performance with a 100 MHz allocation in the 3.5 GHz band, but this is now overshadowed by MasOrange’s expanded allocation of 170 MHz. Capital investment by the merged entity in upgrading the 5G RAN to support advanced carrier aggregation (CA) capabilities and the standalone (SA) architecture will enable it to fully realise the performance benefits of wider channel bandwidth through the extensive deployment of its 3.5 GHz spectrum across its consolidated mobile site grid. 

Seville Leads in 5G Download Speed Among Spain's Largest Cities, but Operator Performance Varies Widely
Speedtest Intelligence® | Q3 2024

To establish network leadership in coverage, however, MásOrange will need to move beyond its spectrum advantage and focus on increasing the number of physical sites in rural areas within its integrated network. In Q3 2024, Vodafone and Movistar recorded 4G Availability of 95.1% and 93.4% respectively in the Spanish market, followed by Orange at 92.7% and Yoigo at 91.5%.

In parallel to MásOrange’s network consolidation journey, DIGI is building out its own infrastructure to gradually wean itself off dependence on a national roaming and RAN sharing agreement with Telefónica (which DIGI selected over MásOrange, despite both being options under the merger conditions), starting with urban and suburban areas. The European Commission designed the spectrum divestment remedies to position DIGI to replicate the competitive pressure previously exerted by MásMóvil. The goal is for DIGI to carry a similar share of its total mobile data traffic on its own network in the coming years, at least matching the 40-60% on-net share that MásMóvil achieved pre-merger. 

Spain's Rural Provinces Trail in 5G Availability, Highlighting the Importance of Government Support through UNICO
Speedtest Intelligence® | Overall 5G Availability (%) in 2024

More broadly, it is hoped that the substantial long-term investment commitments from DIGI and MásOrange, driven by the consolidation activity, combined with government support through programmes such as Unico, will bolster Spain’s international competitiveness in mobile performance in the coming years. The country has significant catching up to do, ranking 57th in the Speedtest Global Index at the end of 2024 and trailing most of its European peers across a suite of network performance metrics, including download speed, consistency and coverage. 


La consolidación cambia las telecomunicaciones españolas en 2025

España sigue a la cabeza en despliegue de fibra en Europa, pero el rezagado desempeño móvil reduce la competitividad del país

El dinamismo del mercado español de telecomunicaciones destacó el año pasado frente al de otros mercados europeos, por fusiones que modificaron la estructura del sector y una fuerte inversión en redes de próxima generación, respaldadas por iniciativas gubernamentales, que supusieron mejoras para los consumidores españoles. Si bien la mayor penetración de la fibra y el 5G han impulsado año tras año notables avances en el rendimiento general de la red, la competitividad internacional de España en telecomunicaciones sigue estando muy desequilibrada entre su infraestructura fija y móvil.

Las credenciales del país como líder europeo en fibra permanecen intactas. En 2024, según la última edición del informe ‘Estado de la Década Digital’ de la Comisión Europea, España se situó entre los tres primeros países de la UE en cobertura de fibra hasta las instalaciones (FTTP), con un 95,21%, y en porcentaje de suscripciones de banda ancha fija con velocidades de descarga superiores a 100 Mbps (93,54%). Esto posicionó al país significativamente por delante de algunas de las economías más grandes del bloque, en particular Alemania, todavía rezagada en cobertura FTTP (28,80%).

Según Speedtest Intelligence la velocidad mediana de descarga fija en España aumentó de 173,32 Mbps a 210,46 Mbps entre 2023 y 2024. Esta tendencia de mejora se reflejó en otras métricas de rendimiento de la red fija, con velocidades medianas de carga que se incrementaron de 129.62 Mbps a 155.53 Mbps en el mismo período. En el tercer trimestre de 2024, DIGI alcanzó una velocidad mediana de descarga fija de 321,21 Mbps, por delante de Jazztel (273,18 Mbps), Orange (262,78 Mbps), Yoigo (255,74 Mbps) y Movistar (180,30 Mbps).

España lidera Europa en despliegue y adopción de fibra, con la mayor cobertura entre las 10 principales economías de la UE
Comisión Europea | DESI 2018-2024

Habiendo alcanzado niveles excepcionalmente altos de penetración de FTTP en áreas urbanas, suburbanas y rurales (que posicionan a España entre los tres primeros del índice DESI 2024 de la Comisión Europea  sobre cobertura FTTP en zonas rurales escasamente pobladas), España está cambiando el foco hacia la mejora de la calidad de la experiencia (QoE) para casos de uso como los vídeojuegos y el streaming. A pesar de contar con más cobertura y tasas de aceptación FTTP, España está por debajo de países como Francia en el Índice Global de Speedtest de Ookla.

Este desequilibrio pone de relieve la influencia en el rendimiento de la banda ancha fija de factores como la tecnología Wi-Fi (Francia tiene una mayor penetración de Wi-Fi 6 y 7 en los router proporcionados por los operadores) y las velocidades ofrecidas en la tarifa (con una mayor proporción de clientes de fibra suscritos a planes multi-gigabit en Francia).

El sólido rendimiento de la velocidad de descarga fija de DIGI en España, detallado en Informe de Conectividad de Speedtest, está respaldado por factores favorables similares. Fue el primero en comercializar en España un servicio de 10 Gbps, aprovechando al máximo su infraestructura de fibra XGS-PON. Con precios altamente competitivos (desde sólo 20€ al mes por 1 Gbps y 25€ por 10 Gbps y router Wi-Fi 6 incluido), DIGI se ha asegurado rápidamente una cuota importante de conexiones con capacidad multigigabit en el mercado español. 

Las comunidades autónomas del norte de España, líderes en rendimiento de velocidad de descarga fija
Speedtest Intelligence® | 2024

Además de evidenciar la importancia de un router moderno y velocidades más altas, el negocio de DIGI ejemplificó el año pasado la acelerada tendencia de consolidación en el fragmentado y sobredimensionado mercado español de fibra. La adquisición de la infraestructura de fibra de DIGI por parte de un consorcio liderado por Macquarie, que consolidó el estatus de Onivia como la mayor red FTTP ‘neutra’ en España, coincidió con otros acontecimientos como la escisión de BlueVia de Telefónica, la aparición de MásOrange y las alianzas de ‘FibreCo’ de Vodafone con Telefónica y MásOrange.

Como se observa en otros mercados europeos con un importante despliegue de fibra (como Reino Unido), la consolidación es un proceso lento y desafiante. Sin embargo, los operadores españoles continúan persiguiéndola para mejorar la rentabilidad de sus inversiones en fibra en áreas urbanas altamente edificadas, liberando recursos para aprovechar el crecimiento futuro en áreas rurales donde la superposición de infraestructura es menos común. Esto comienza con la absorción de pequeños operadores locales (de los que hay cientos) por “consolidadores locales”. Luego, éstos se integran en las carteras de infraestructura de los consolidadores regionales, lo que en última instancia conduce a la adquisición por parte de uno de los actores tradicionales más grandes.

El despliegue de fibra por parte de actores más pequeños como DIGI impulsa el cambio en la cuota de mercado de los operadores tradicionales
Análisis de datos de CNMC | 2022-2024

Esta consolidación gradual está modificando el negocio de la fibra en España, mientras que los operadores tradicionales separan sus unidades de infraestructura y servicios para apoyar el crecimiento de la oferta mayorista. Este año se podrá saber si un tercer actor consolidado puede competir y coexistir con éxito a largo plazo con Telefónica y MásOrange.

MásOrange compite por el liderazgo de la red en España, apoyándose en una importante ventaja de espectro

La consolidación también ha afectado al mercado móvil español. A finales del año pasado, la Comisión Europea aprobó la creación de una empresa conjunta entre MásMóvil y Orange. La fusión ha llevado a la recién formada MásOrange a una posición de liderazgo, tanto en suscripción como en cuota de espectro. Para obtener la aprobación de Bruselas, la entidad se comprometió a vender 60 MHz de espectro, incluidos 20 MHz en la banda de 3,5 GHz, para facilitar la entrada de DIGI como un operador móvil independiente de pleno derecho, convirtiendo así el mercado español en una estructura de cuatro actores. 

Además de diversificar su cartera de marcas a través de la fusión (con Orange y Yoigo en el segmento premium, Jazztel y MásMóvil centrándose en la relación calidad-precio y Euskaltel y Telecable atendiendo las necesidades locales), MásOrange espera que sus activos de espectro le permitan alcanzar el liderazgo en el mercado móvil español.

Los ingresos de Movistar se mantienen estables interanualmente en el 3T de 2024 mientras que Vodafone y MásOrange afrontan caídas
Análisis de datos de mercado de CNMC | 2022-2024

La red de la entidad se basará principalmente en la infraestructura de Orange, complementada con la cartera de sites existentes de MásMóvil y el despliegue de nuevos. La integración de la red de MásMóvil, que depende íntegramente del espectro de banda media y alta e históricamente ha dependido de un acuerdo de roaming nacional con Orange, crea una sinergia para la entidad: aprovechar la capacidad y densidad de MásMóvil en áreas urbanas junto con la amplia cobertura y alcance nacional de Orange.

MásOrange está centrado en desbancar a Movistar en el segmento premium, que ha liderado durante mucho tiempo gracias a su foco en la calidad superior de la red. Movistar emergió como el operador móvil más rápido del mercado español en el Informe de Conectividad Speedtest de Ookla para el primer semestre de 2024, al ofrecer la velocidad de descarga media más alta de 82,68 Mbps.  Esto sitúa a Movistar muy por delante de Orange (56,42 Mbps) y Yoigo (36,73 Mbps).

La ventaja espectral de MásOrange se inclina hacia las bandas medias y altas, normalmente utilizadas para implementaciones 5G en áreas urbanas y suburbanas. De acuerdo con los datos publicados por la compañía, MásOrange cuenta con el 37% de todos los activos de banda media y alta de España (en comparación con el 28% y el 26% de su competidor más cercano, Telefónica), lo que le da una oportunidad única de mejorar el rendimiento de la velocidad 5G y adelantarse a sus competidores.

Movistar ha mantenido su liderazgo en velocidad 5G con una asignación de 100 MHz en la banda de 3,5 GHz, pero esto se ve ahora eclipsado por la asignación de MásOrange de 170 MHz. La inversión de ésta para actualizar la RAN 5G para que cuente con capacidades avanzadas de agregación de operadores y arquitectura independiente (SA), le permitirá aprovechar los beneficios de rendimiento de un ancho de banda mayor a través del amplio despliegue de su espectro de 3,5 GHz en toda su red móvil consolidada. 

Sevilla lidera en velocidad de descarga 5G entre las principales ciudades de España, pero el rendimiento de los operadores varía ampliamente
Speedtest Intelligence® | Q3 2024

Sin embargo, para liderar en cobertura de red, MásOrange necesitará ir más allá de su ventaja de espectro y centrarse en incrementar el número de sites físicos en áreas rurales. En el tercer trimestre de 2024, Vodafone y Movistar registraron en el mercado español una disponibilidad 4G del 95,1% y 93,4% respectivamente, seguidas de Orange con un 92,7% y Yoigo con un 91,5%.

Paralelamente a la consolidación de la red de MásOrange, DIGI está construyendo su propia infraestructura para dejar de depender gradualmente de un acuerdo de roaming y del uso compartido de RAN con Telefónica, comenzando con zonas urbanas y suburbanas. La Comisión Europea diseñó los remedies de desinversión de espectro para que DIGI replique la presión competitiva ejercida anteriormente por MásMóvil. El objetivo es que DIGI transporte una proporción similar de su tráfico total de datos móviles en su propia red en los próximos años, al menos igualando la cuota on-net del 40-60% que MásMóvil lograba antes de la fusión. 

Provincias rurales de España, a la zaga en disponibilidad de 5G, lo que destaca la importancia del apoyo gubernamental a través de UNICO.
Speedtest Intelligence® | Disponibilidad general 5G (%) en 2024

En términos generales, se espera que los compromisos de inversión a largo plazo de DIGI y MásOrange, impulsados ​​por la consolidación, unidos al apoyo gubernamental con programas como Único, impulsen la competitividad internacional de España en rendimiento móvil en los próximos años. El país tiene mucho por hacer, ya que a finales de 2024 ocupa el puesto 57 en Índice Global de Speedtest, situándose por detrás de la mayoría de sus colegas europeos en rendimiento de red, incluidas velocidad de descarga, coherencia y cobertura.

Ookla retains ownership of this article including all of the intellectual property rights, data, content graphs and analysis. This article may not be quoted, reproduced, distributed or published for any commercial purpose without prior consent. Members of the press and others using the findings in this article for non-commercial purposes are welcome to publicly share and link to report information with attribution to Ookla.