| February 16, 2023

European Commission Uses Ookla® Data to Demonstrate Territorial Disparities and the Digital Divide in the EU

The characteristics of places might not define the identity of people living there, but they affect the daily life of every citizen and can prevent them from reaching their full potential and the best life. Persisting territorial disparities, related to phenomena such as depopulation or limited access to services, can become even more visible by observing places rather than individuals. In fact, growing territorial inequality, further exacerbated by the COVID-19 pandemic, limits on people’s lifestyle and life choices, and creates a feeling of being left behind.

The Joint Research Centre of the European Commission recently published a report focused on understanding and identifying territorial disparities and challenges in the EU across a variety of sectors, including access to broadband and the performance of the digital connection, using the Speedtest® by Ookla® Global Fixed and Mobile Network Performance data for Q4 2020. A full comprehension of these challenges and their interlinkages is essential to produce evidence to improve policies, especially for the benefit of those living in vulnerable conditions, in line with the principle of leaving no place and no one behind.

Key findings

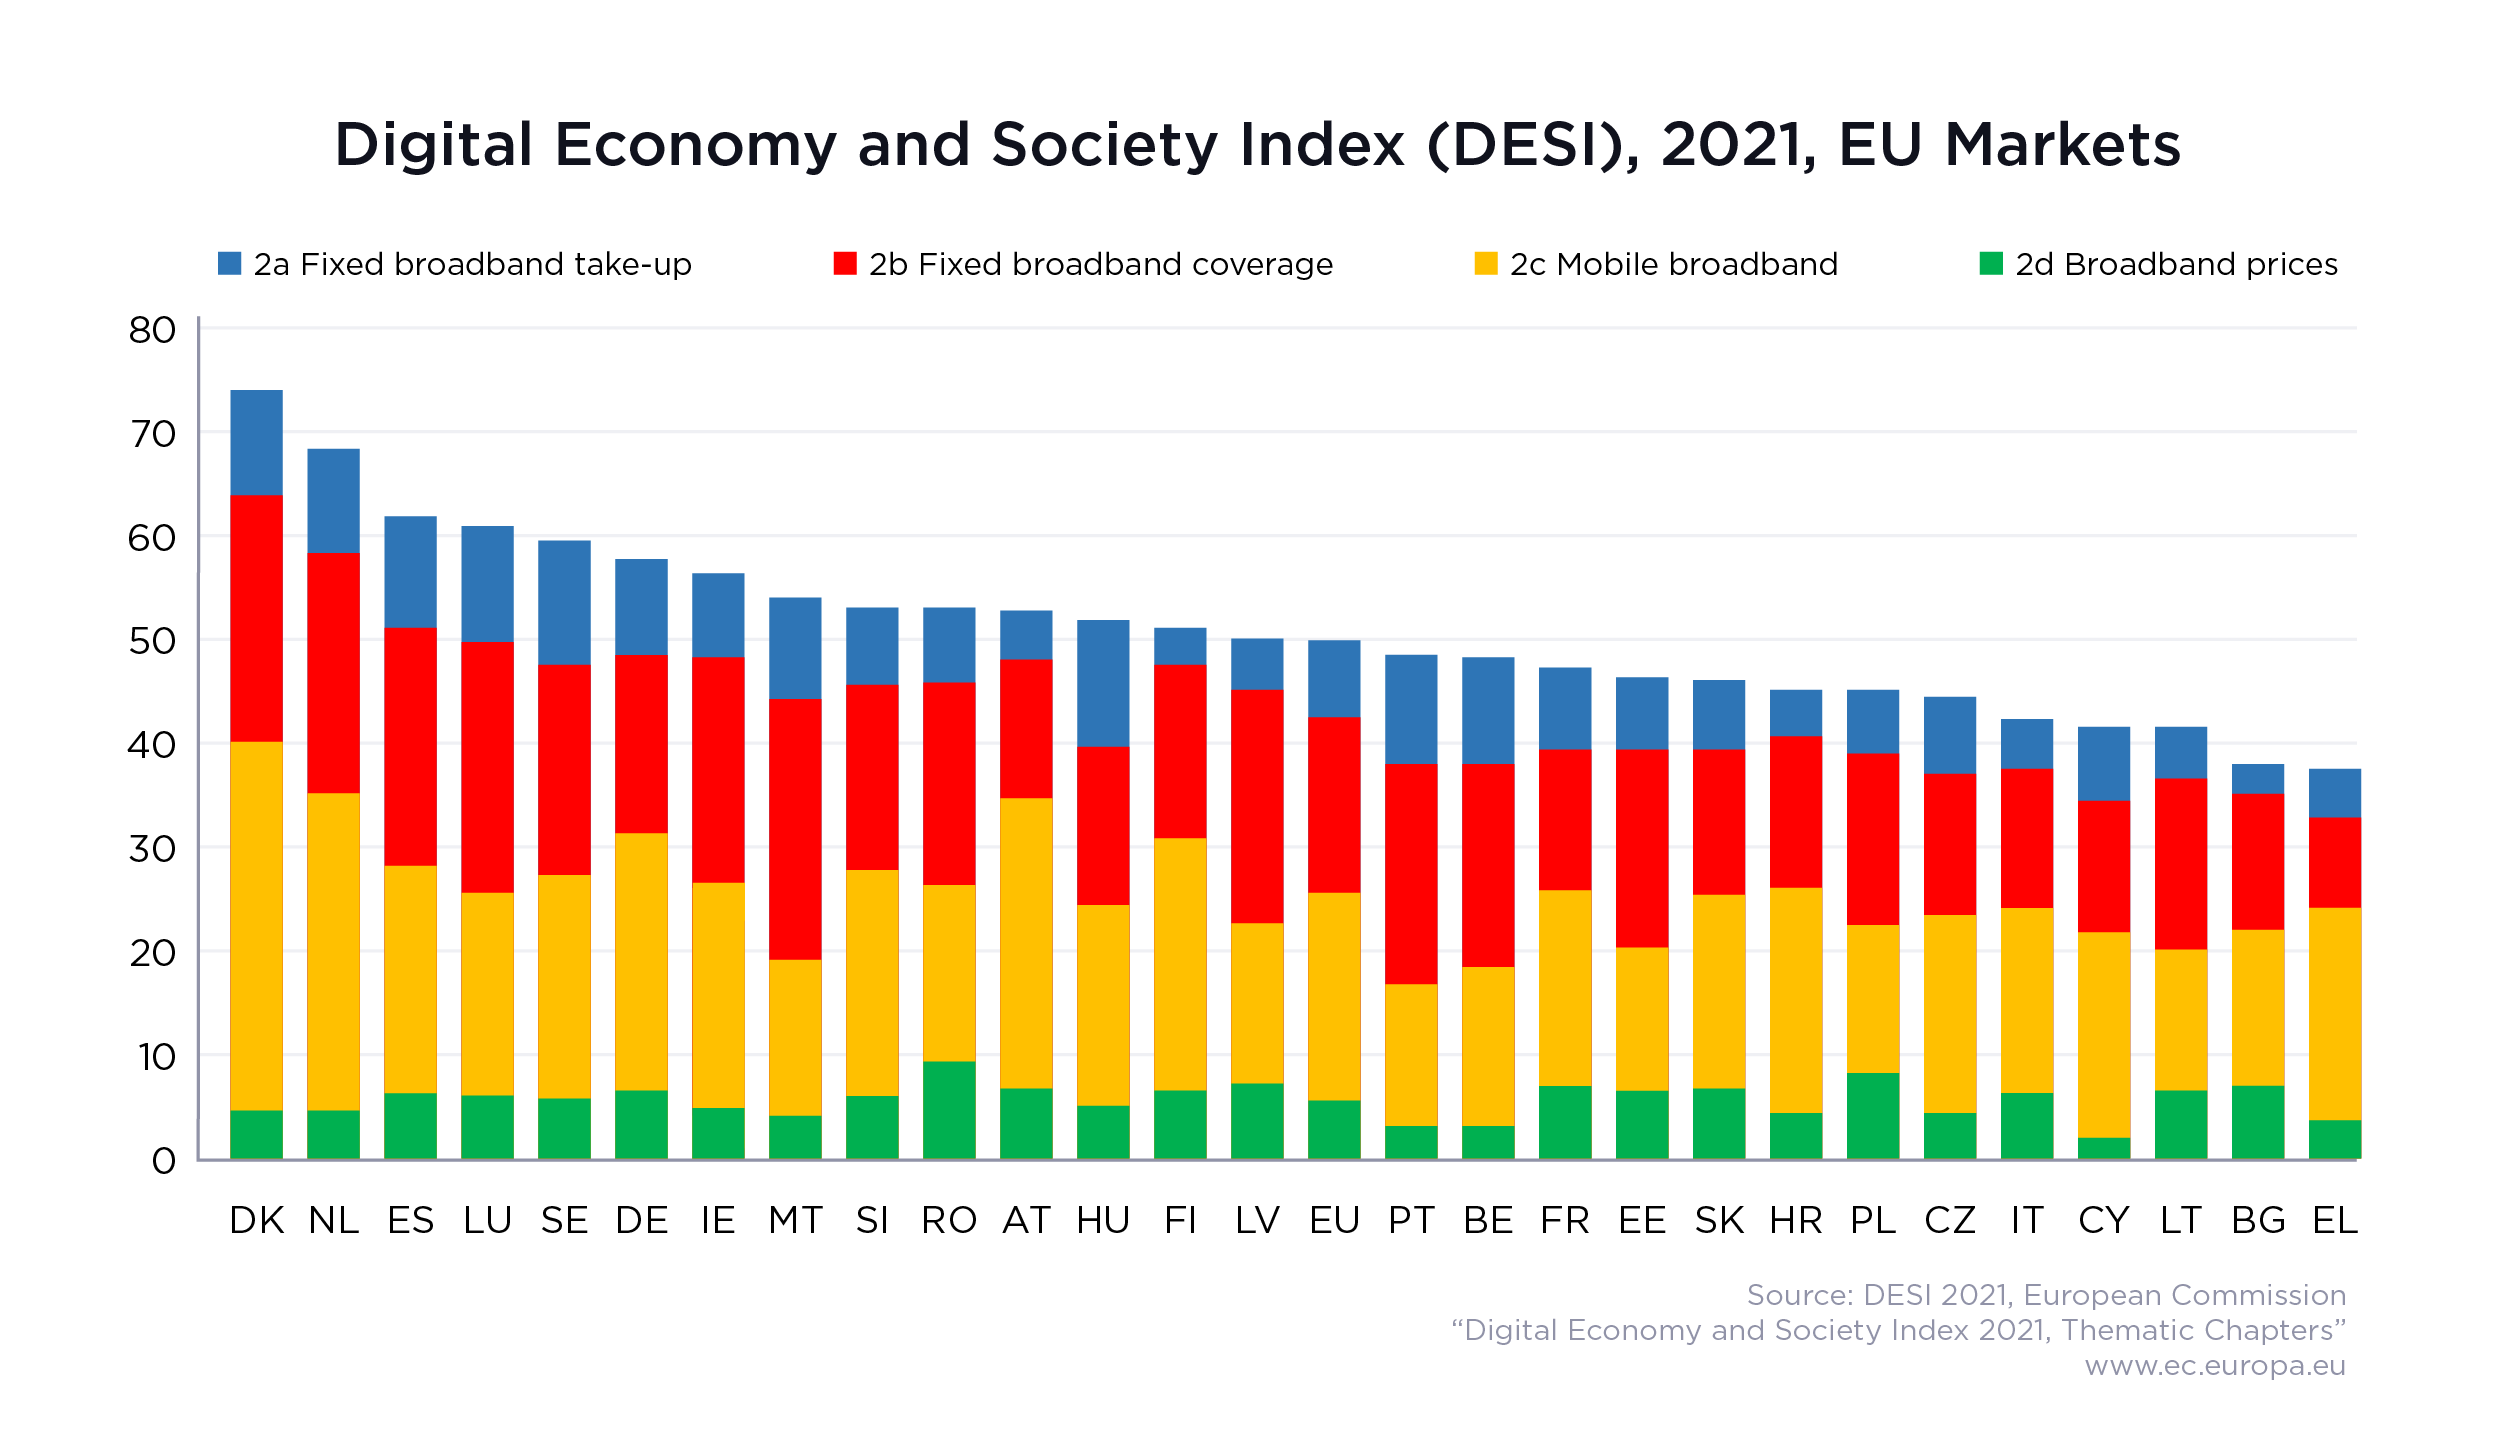
High-speed broadband increasingly represents an essential infrastructure to drive the economic and social development of territories. Therefore, the lack of broadband network or poor access to a high-speed connection might cause significant disparities among places and citizens and leave some areas behind in terms of access to services and opportunities, diminishing the quality of life of residents. The connectivity gap, often recognized as an urban-rural digital divide, represents an important challenge to face for some countries and policy makers and may require a joint effort by both public and private initiatives.

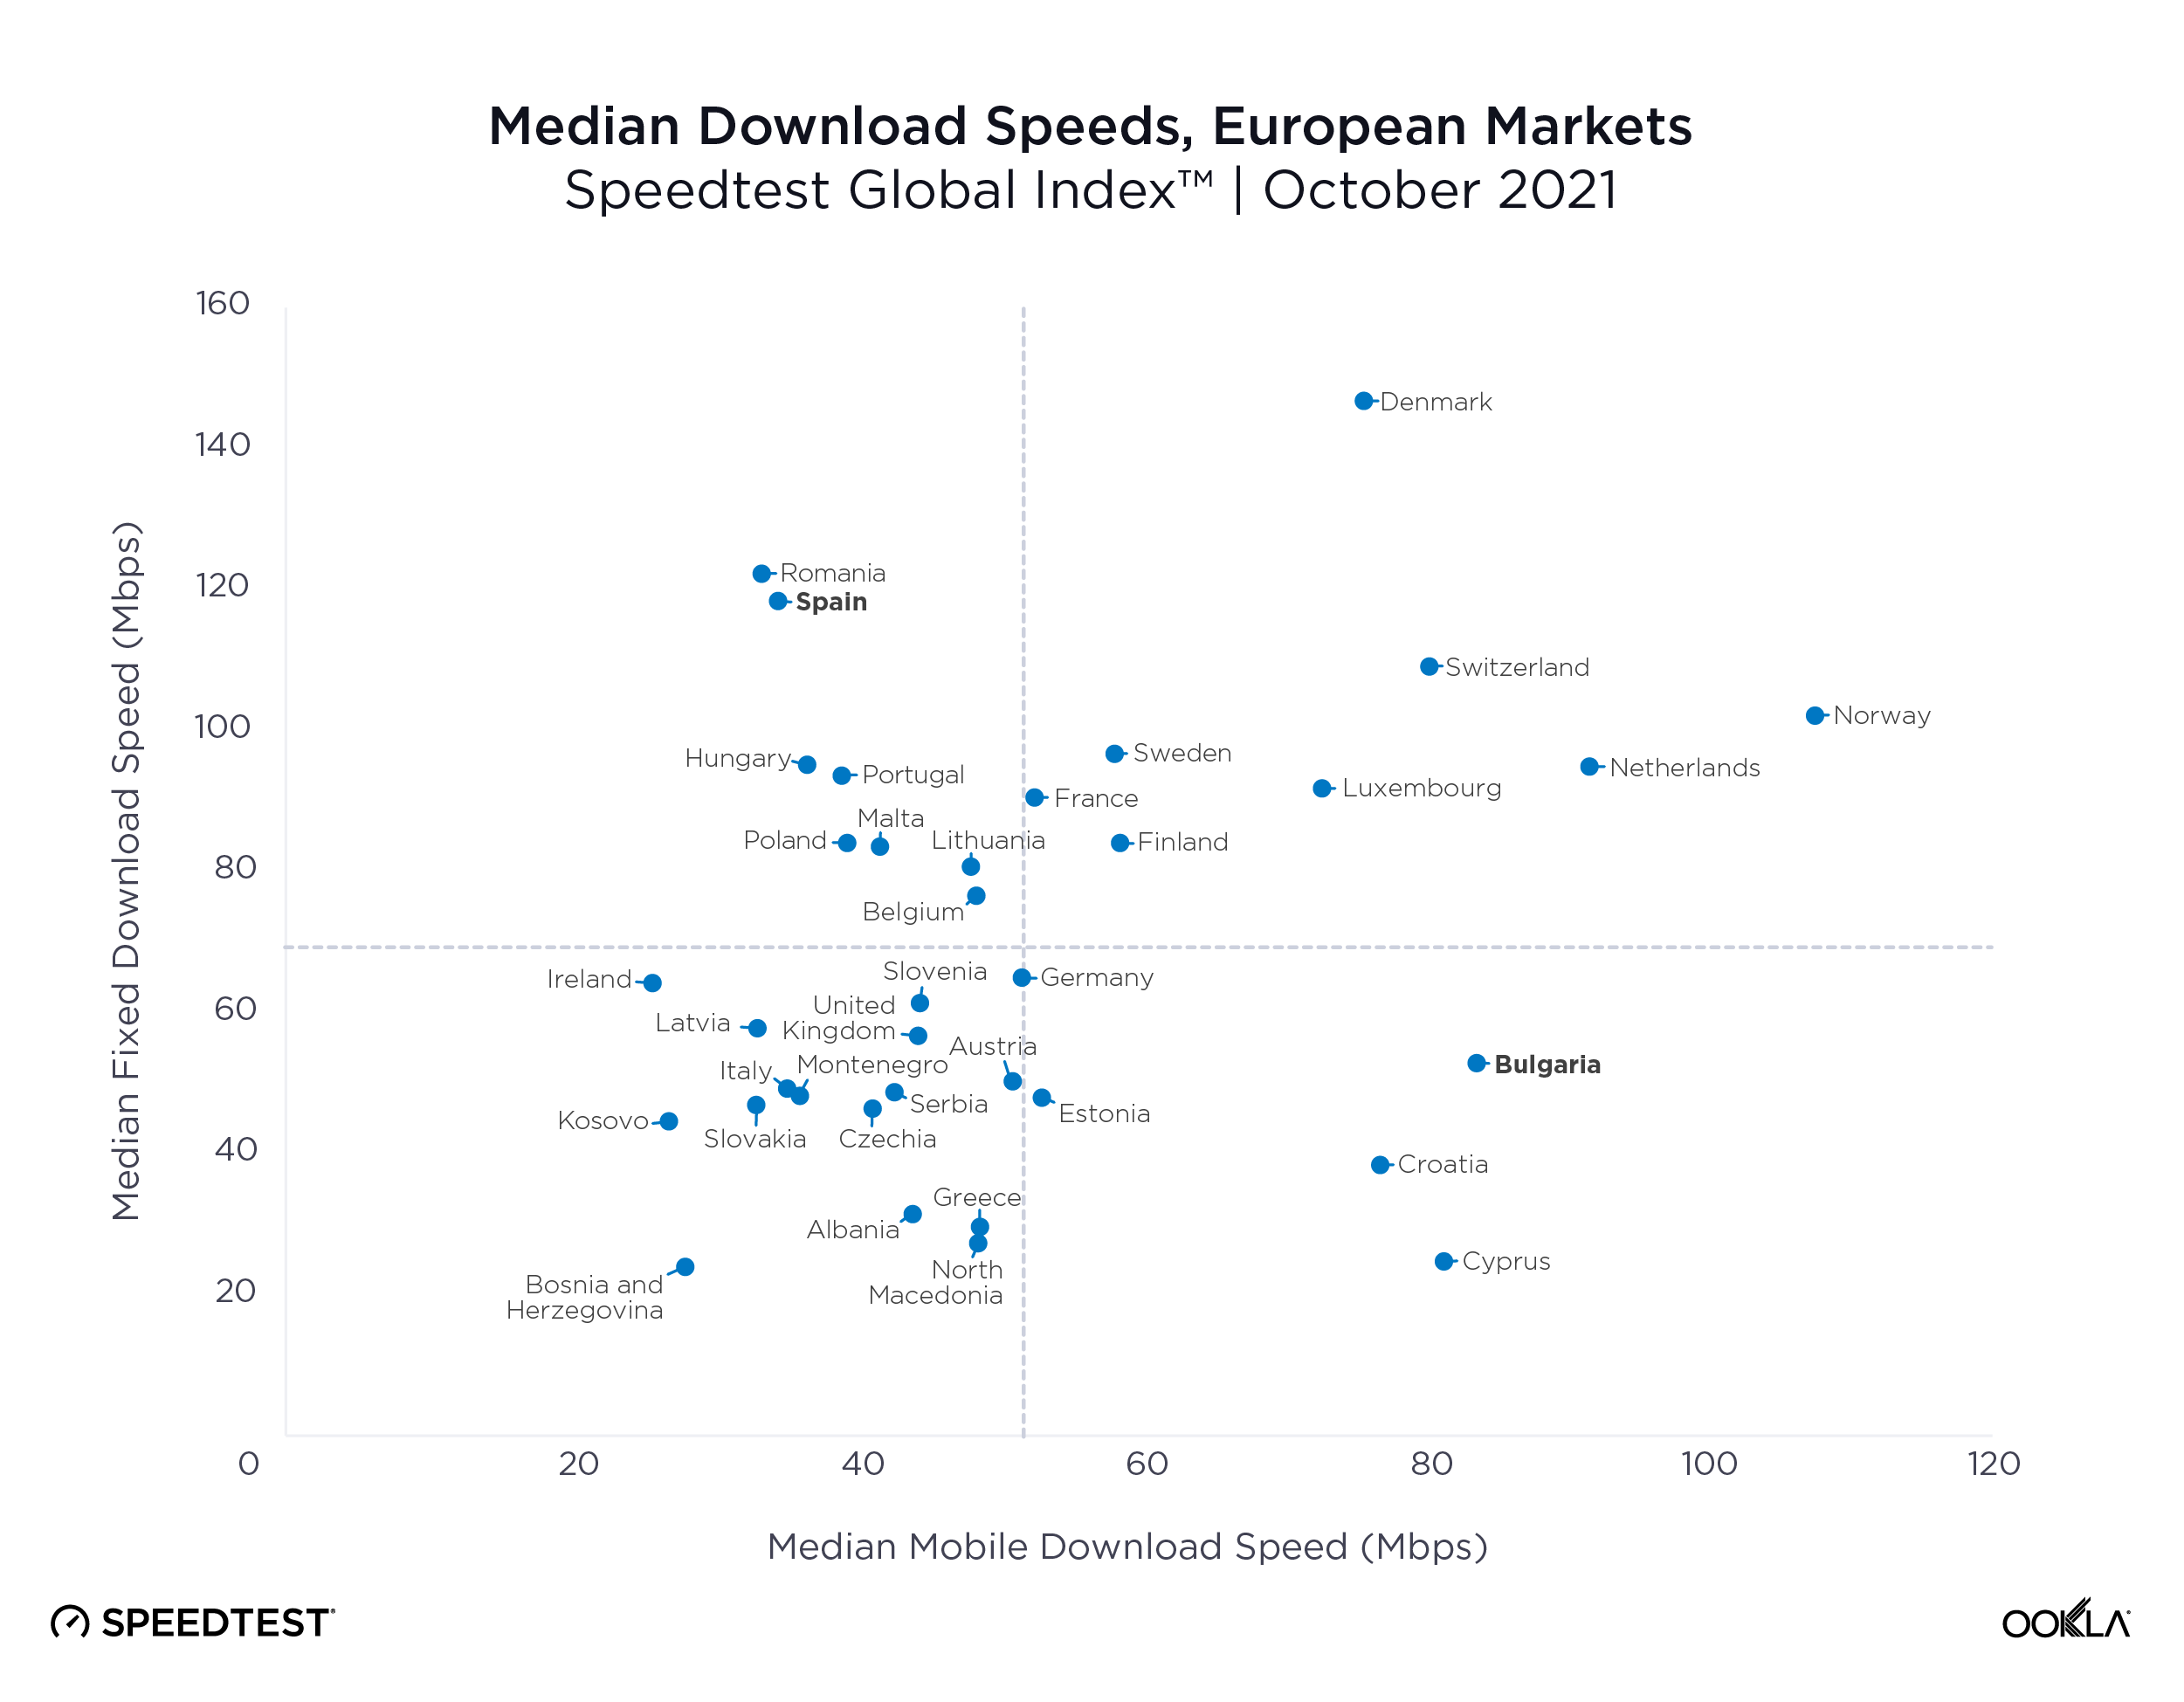
Results show that significant differences exist in network speed across the EU-27 countries. Territorial disparities are even more relevant, with most Member States in urban areas enjoying easy access to the highest fixed broadband available (> 100 Mbps), whereas in rural areas a significant percentage of residents have access to an average speed below the minimum standard of 30 Mbps. Only very few countries show access to over 100 Mbps broadband for rural populations (Denmark, Sweden, the Netherlands, Luxembourg).

Regarding mobile broadband, the average speed is generally lower than fixed broadband in all countries, with only a few areas having more than 100 Mbps average speed. Interestingly, the Alpine region across France, Italy and Austria appears to have better connectivity with mobile broadband (over 30 Mbps) than with fixed broadband (under 30 Mbps). The same pattern can be observed in Central Italy and Sardinia, Croatia, and partially in Greece.

To strengthen the evidence of such urban-rural digital divide, the spatial patterns of access to broadband were combined with the population density and the classification of degree of urbanization of municipalities in cities, towns and rural areas (see Figure 01). Results confirm that urban areas present the highest speed in broadband connection, revealing how the areas already most connected in terms of physical networks (i.e., with roads and railways) are also the most connected from the digital point of view. Access to a good broadband connection is most problematic in remote municipalities (with 45 minutes or more from the nearest city by drive), where the average speed is significantly lower than the national averages, especially in countries such as Belgium, Spain, France, and Portugal.

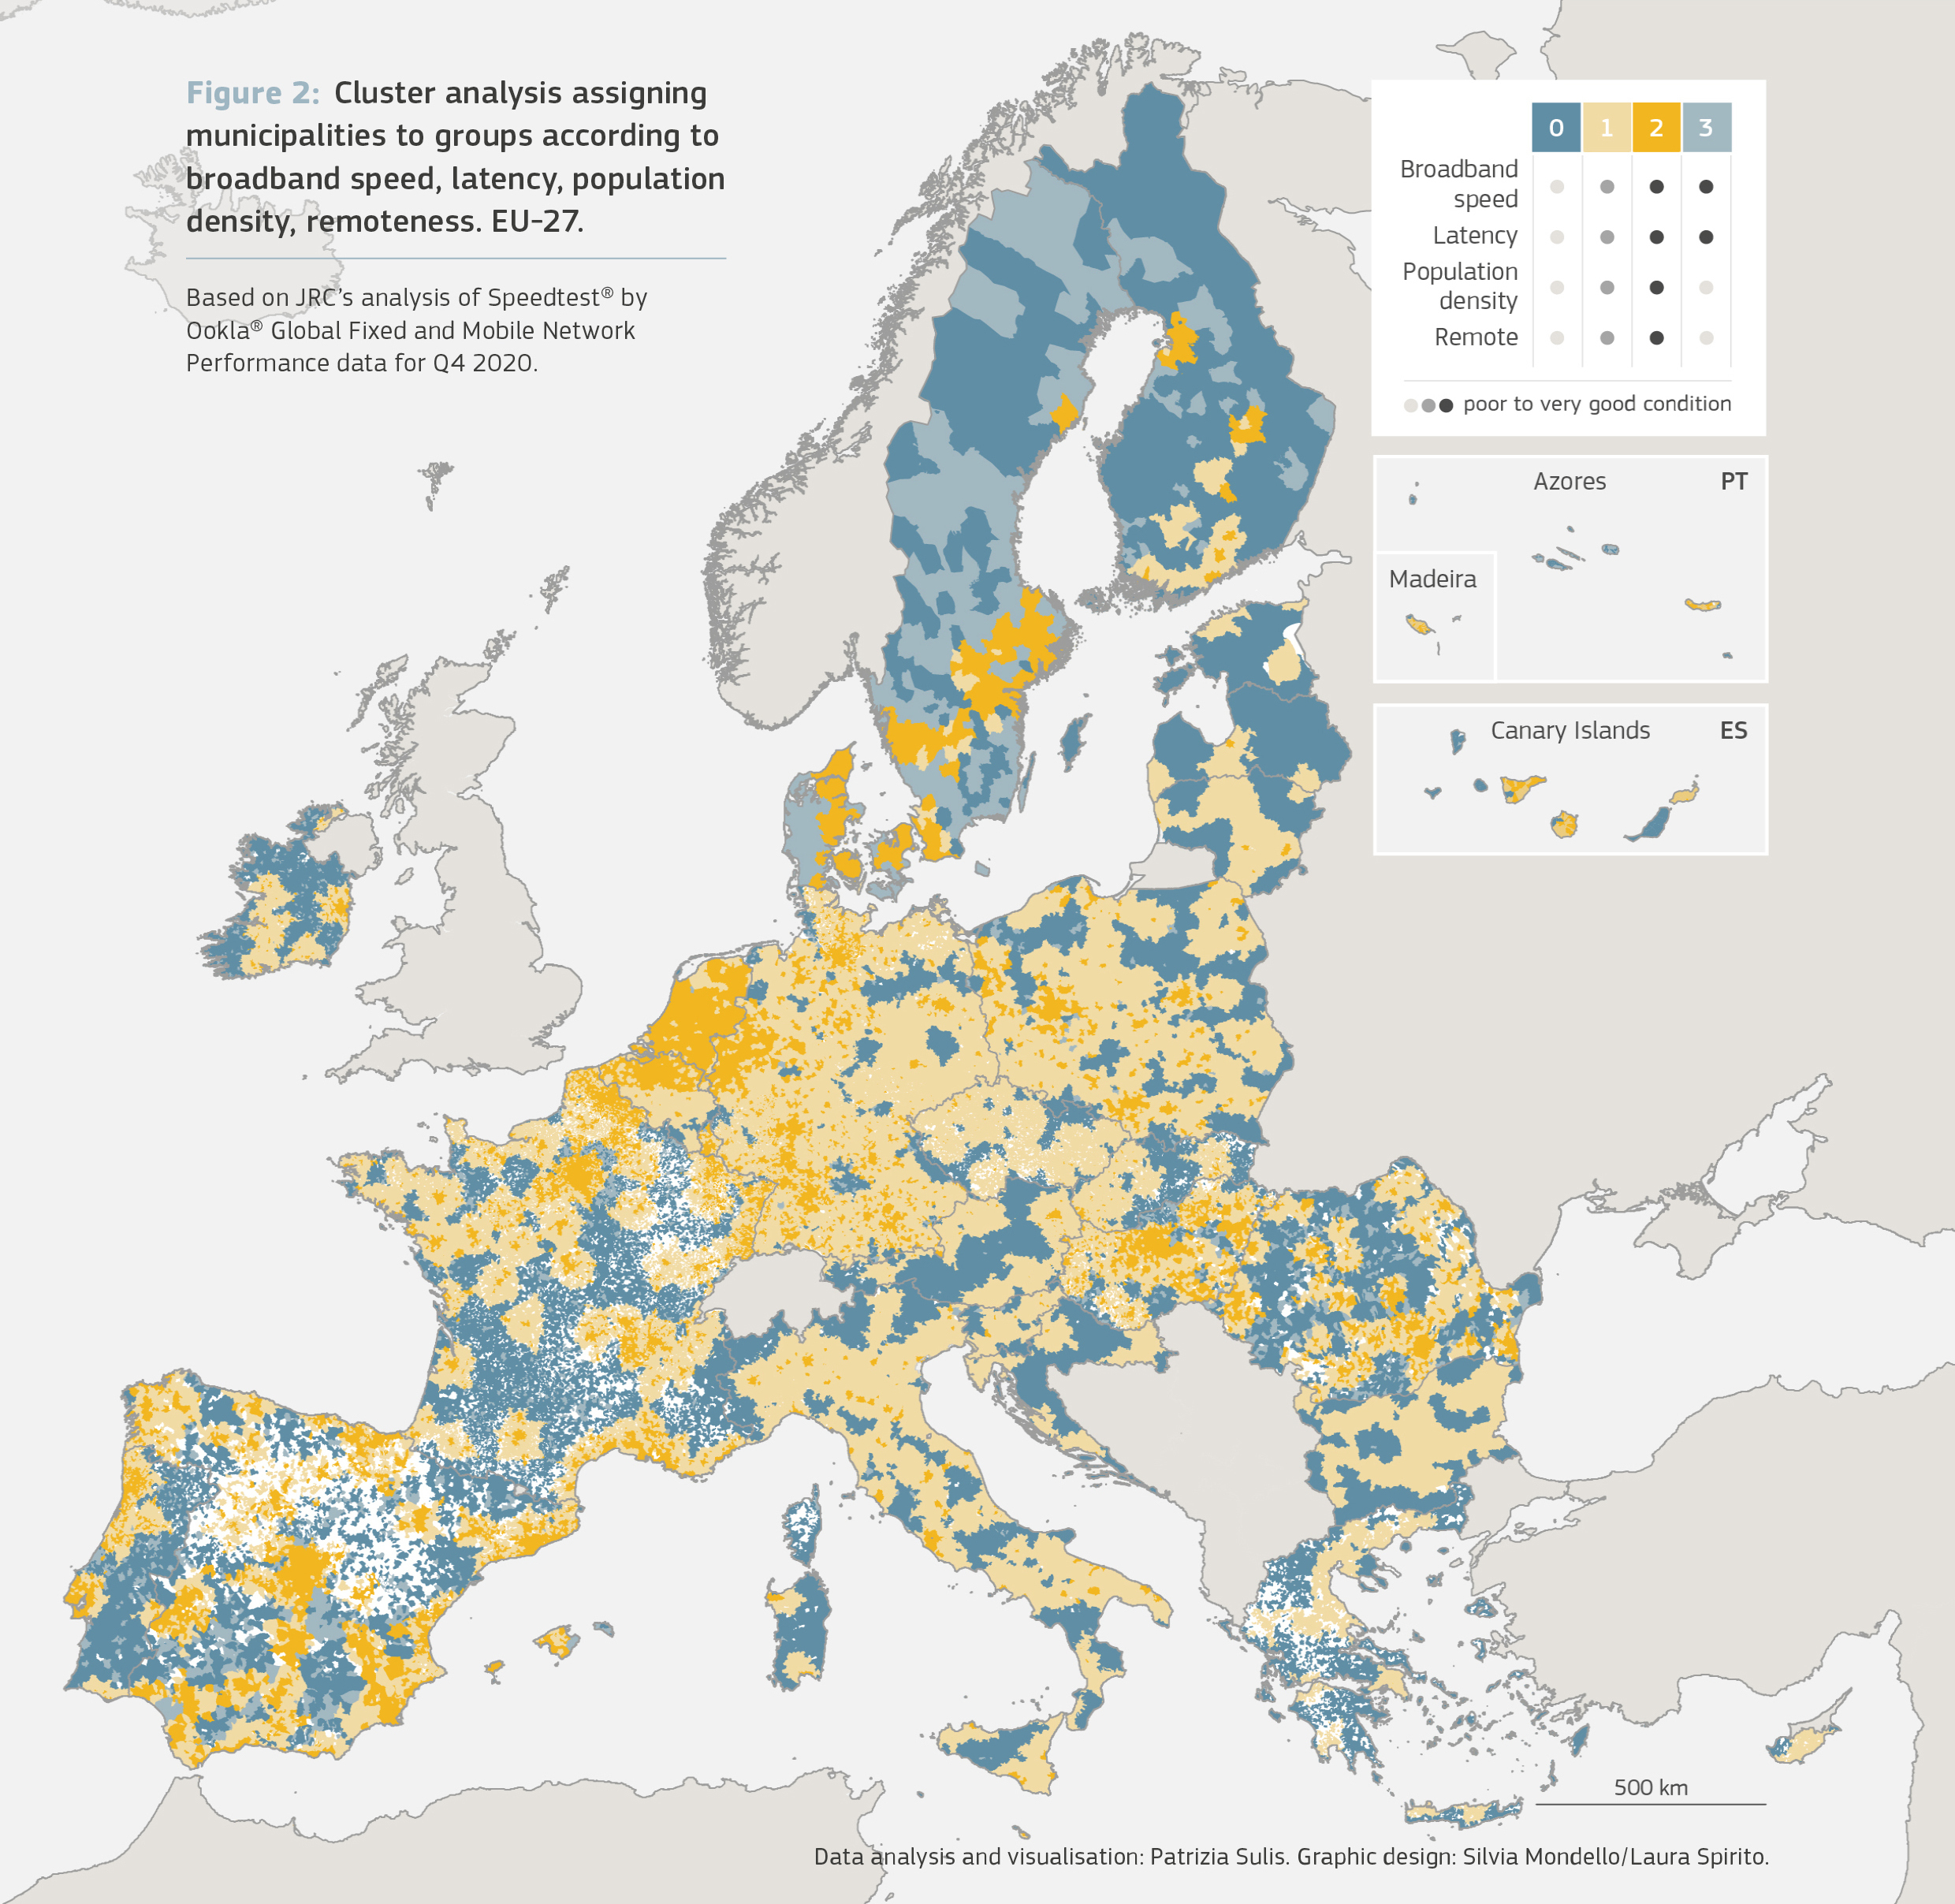
To explore the urban-rural digital divide further, the analysis employed Machine Learning to identify patterns of similarities in terms of vulnerabilities across all areas, regardless of their degree of urbanization, considering the performance of the broadband infrastructure, the population distribution and the remoteness classification of all areas. The areas (belonging to group 0 in Figure 2) are characterized by low speed, high latency, low population density, remoteness, and are identified as the most vulnerable places. However, this analysis also showed that the bad performance of broadband networks is not limited to rural areas. This means that the digital divide is not merely a matter of urban-rural, but mostly a matter of cities versus non-cities: places that would not be considered as disconnected from the physical perspective (not remote areas, but towns close to cities) can still be disconnected from the broadband perspective.

Digitalization can be an opportunity only if its rollout is quick enough to enable rural businesses to remain competitive. However, it is useless without a parallel development of digital literacy and skills for residents in rural areas. Furthermore, digital connectivity is only one player in the game, and it cannot alone overturn the depopulation trends and the other vulnerabilities affecting rural areas.

Without policy support, a lack of or poor access to high-speed broadband might leave some areas behind. Access to broadband and data might help to foster new business and economic activities, especially in vulnerable areas such as rural regions. Exploiting the potential that connectivity and digitalization represent for education and training, cooperation and networking, access to services and markets, can make these areas more attractive to people and businesses.

Cohesion Policy will support the implementation of the EU’s digital agenda. In particular, European Regional and Development Fund investments will focus on digitalization of services for businesses and citizens and rollout of the high-speed broadband. The support will go where it is most needed, i.e. areas where there is a weak take-up of digital technologies or no, or very slow, or very expensive, broadband access or where there is not enough commercial potential to attract private investors.

To read more about this work, the full report is available here.

We are grateful to Patrizia Sulis for her work with our data within the European Commission’s report and guidance in composing this article. For more information, please contact Patrizia Sulis – Scientific Officer – Joint Research Centre, European Commission.

Ookla retains ownership of this article including all of the intellectual property rights, data, content graphs and analysis. This article may not be quoted, reproduced, distributed or published for any commercial purpose without prior consent. Members of the press and others using the findings in this article for non-commercial purposes are welcome to publicly share and link to report information with attribution to Ookla.

| February 20, 2019

An Expansive Analysis of European Mobile Roaming Speeds and Behaviors

Last year we took a look at how free roaming was working out for EU citizens in terms of speeds and latency. This year we’ve expanded our analysis to all European countries and included data on Wi-Fi roaming behavior. We’ve also added a little insight into how roaming might affect download speeds for visitors to Mobile World Congress (MWC) in Barcelona from February 25- 28, 2019.

Except where noted, this analysis is based on Speedtest data from Android devices on 4G LTE cellular connections during Q3-Q4 2018. We included data on any country with greater than 30 samples in all categories.

Most Europeans experience slower downloads while roaming

Roaming traffic is subject to deals struck between individual mobile operators on how that traffic will be prioritized, so roaming speeds can depend not only on the country of origin but also the country of destination and the plan a subscriber has selected.

Consider the following table where an Albanian experiences a mean download speed of 54.56 Mbps at home and then 38.47 Mbps while roaming elsewhere in Europe. This is expected as a roamer does not usually have a direct relationship with the mobile operator handling their data and calls abroad.

Mean Mobile Download Speeds in Europe
Speedtest Data | Q3-Q4 2018
Country Local Speed (Mbps) Roaming Speed (Mbps) % Difference
Austria 38.23 35.78 -6.4%
Belarus 16.15 19.49 20.7%
Belgium 52.58 35.42 -32.6%
Bulgaria 47.28 32.35 -31.6%
Croatia 43.83 43.60 -0.5%
Cyprus 37.13 20.58 -44.6%
Czech Republic 44.91 13.43 -70.1%
Denmark 48.83 34.89 -28.6%
Estonia 36.43 38.98 7.0%
Finland 39.33 38.20 -2.9%
France 39.94 34.97 -12.5%
Germany 33.77 28.57 -15.4%
Greece 41.35 38.08 -7.9%
Hungary 49.57 28.19 -43.1%
Iceland 69.27 35.58 -48.6%
Ireland 28.23 31.49 11.6%
Italy 32.18 43.12 34.0%
Kazakhstan 22.93 13.80 -39.8%
Latvia 30.88 33.79 9.4%
Liechtenstein 56.48 36.66 -35.1%
Lithuania 41.49 33.43 -19.4%
Luxembourg 50.91 25.08 -50.7%
Malta 56.34 34.27 -39.2%
Montenegro 45.45 49.97 10.0%
Netherlands 56.06 33.86 -39.6%
Norway 68.49 38.69 -43.5%
Poland 28.74 29.71 3.4%
Portugal 32.06 36.95 15.3%
Romania 36.64 30.74 -16.1%
Russia 20.91 20.47 -2.1%
Serbia 43.41 21.64 -50.1%
Slovakia 33.47 31.80 -5.0%
Slovenia 35.51 36.41 2.5%
Spain 36.07 22.37 -38.0%
Sweden 44.87 34.59 -22.9%
Switzerland 47.59 30.36 -36.2%
Turkey 38.19 28.77 -24.7%
Ukraine 26.07 25.48 -2.3%
United Kingdom 30.84 38.76 25.7%

Residents of the Czech Republic will face massive speed disappointment when roaming through the rest of Europe. Other countries with much better speeds at home than abroad include Luxembourg, Serbia, Iceland and Cyprus.

In ten European countries, citizens experience faster mobile downloads while roaming than they do at home. These include: Italy, the United Kingdom, Belarus, Portugal, Ireland, Montenegro, Latvia, Estonia, Poland and Slovenia. Most of these are among the slowest countries on this list, so it would make sense that their citizens would experience better speeds elsewhere in Europe than they do at home.

Europeans are connected to Wi-Fi most of the time

Customers sometimes try to get better speeds and avoid roaming fees (for those outside the E.U.) and data overages by connecting to Wi-Fi. The following table compares the percentage of time spent on Wi-Fi by a resident of a country with that of a visitor to the country.

Percentage of Time Spent on Wi-Fi in Europe
Speedtest Data | Q3-Q4 2018
Country Local Customers Visitors % Difference
Albania 61.9% 59.8% -3.4%
Andorra 73.6% 69.0% -6.2%
Armenia 61.5% 68.1% 10.7%
Austria 65.6% 36.7% -44.1%
Azerbaijan 67.0% 70.7% 5.5%
Belarus 63.9% 58.3% -8.9%
Belgium 71.1% 32.9% -53.7%
Bosnia and Herzegovina 71.9% 66.0% -8.2%
Bulgaria 65.2% 46.8% -28.2%
Croatia 66.1% 41.0% -38.0%
Cyprus 70.9% 58.4% -17.7%
Czech Republic 75.1% 38.9% -48.1%
Denmark 70.4% 52.9% -24.9%
Estonia 61.2% 45.6% -25.4%
Finland 56.6% 47.1% -16.7%
France 60.2% 43.1% -28.5%
Georgia 61.4% 62.2% 1.3%
Germany 72.2% 42.4% -41.3%
Greece 73.5% 52.2% -28.9%
Hungary 71.9% 35.0% -51.3%
Iceland 65.7% 58.2% -11.4%
Ireland 67.2% 52.4% -22.0%
Italy 64.1% 48.9% -23.7%
Kazakhstan 57.7% 64.7% 12.3%
Latvia 60.9% 43.8% -28.1%
Liechtenstein 71.7% 58.2% -18.9%
Lithuania 66.8% 43.3% -35.1%
Luxembourg 63.6% 26.0% -59.1%
Macedonia 65.3% 52.9% -18.9%
Malta 74.3% 58.0% -22.0%
Moldova 67.2% 67.3% 0.2%
Montenegro 63.6% 65.2% 2.5%
Netherlands 73.0% 42.5% -41.7%
Norway 74.7% 59.7% -20.1%
Poland 62.5% 48.1% -23.1%
Portugal 69.1% 54.7% -20.9%
Romania 62.4% 48.7% -21.9%
Russia 58.8% 65.9% 12.2%
San Marino 66.8% 39.7% -40.6%
Serbia 68.6% 61.2% -10.7%
Slovakia 69.6% 35.1% -49.6%
Slovenia 63.3% 26.4% -58.3%
Spain 70.8% 53.0% -25.2%
Sweden 71.8% 44.9% -37.4%
Switzerland 62.4% 47.2% -24.4%
Turkey 61.7% 73.0% 18.4%
Ukraine 61.5% 62.4% 1.5%
United Kingdom 71.3% 54.0% -24.3%

Finland showed the lowest time spent on Wi-Fi by residents at 56.6%. Kazakhstan was second at 57.7% followed by Russia (58.8%), France (60.2%) and Latvia (60.9%). The Czech Republic showed the highest time spent on Wi-Fi by residents at 75.1%. Norway was second at 74.7% followed by Malta (74.3%), Andorra (73.6%) and Greece (73.5%).

When it comes to time spent on Wi-Fi by visitors, Luxembourg had the lowest percentage at 26.0%. Slovenia was second at 26.4% followed by Belgium (32.9%), Hungary (35.0%) and Slovakia (35.1%). Turkey showed the highest time spent on Wi-Fi by visitors at 73.0%. Azerbaijan was second at 70.7% followed by Andorra (69.0%), Armenia (68.1%) and Moldova (67.3%).

Luxembourg saw the largest difference in time spent on Wi-Fi between residents and visitors with visitors using Wi-Fi 59.1% less than residents. Slovenia was close behind at 58.3%, followed by Belgium (53.7%) and Hungary (51.3%). On the other end of the spectrum, visitors to Turkey were on Wi-Fi 18.4% longer than residents followed by Kazakhstan (12.3%) and Russia (12.2%).

Roaming dramatically increases latency in Europe

Because roaming signals are routed through a user’s home network, latency is always an issue in roaming. Speedtest data shows that latency while roaming is a much larger issue for residents of some countries than it is for others.

Comparing European Latency In-Country and Abroad
Speedtest Data | Q3-Q4 2018
Country Local Latency (ms) Roaming Latency (ms) % Difference
Austria 24 83 245.8%
Belarus 32 75 134.4%
Belgium 24 81 237.5%
Bulgaria 24 126 425.0%
Croatia 32 86 168.8%
Cyprus 20 194 870.0%
Czech Republic 24 86 258.3%
Denmark 24 98 308.3%
Estonia 23 78 239.1%
Finland 26 104 300.0%
France 42 87 107.1%
Germany 33 87 163.6%
Greece 27 137 407.4%
Hungary 22 94 327.3%
Iceland 18 163 805.6%
Ireland 34 114 235.3%
Italy 52 116 123.1%
Kazakhstan 35 164 368.6%
Latvia 24 94 291.7%
Liechtenstein 40 90 125.0%
Lithuania 26 108 315.4%
Luxembourg 23 73 217.4%
Malta 18 141 683.3%
Montenegro 18 42 133.3%
Netherlands 26 81 211.5%
Norway 36 109 202.8%
Poland 33 104 215.2%
Portugal 27 102 277.8%
Romania 26 131 403.8%
Russia 42 161 283.3%
Serbia 22 76 245.5%
Slovakia 30 69 130.0%
Slovenia 21 69 228.6%
Spain 45 118 162.2%
Sweden 30 118 293.3%
Switzerland 26 75 188.5%
Turkey 26 115 342.3%
Ukraine 35 116 231.4%
United Kingdom 37 107 189.2%

Residents of Cyprus saw an average latency of 194 ms while roaming in Europe. The country with the second highest latency for residents roaming abroad was Kazakhstan at 164 ms, followed by Iceland (163 ms). Russia (161 ms) and Malta (141 ms). In contrast, Montenegro had a lower latency for residents roaming abroad than Italy did for residents using their mobile phones locally.

Roaming performance at MWC

MWC, the largest mobile conference in the world, has Barcelona teeming with visitors from across the globe all trying to connect to their home networks. During February 2018 we saw an average download speed of 34.31 Mbps while roaming in Barcelona and a mean latency of 201 ms. Visitors from the U.K. saw an average download speed of 49.00 Mbps and a mean latency of 111 ms, while those from Italy averaged a download of 32.88 Mbps and a latency of 128 ms.

What will the performance look like at this year’s conference? Schedule a meeting or come see us in Hall 2 at Booth 2i25 to learn more about our roaming data.

Ookla retains ownership of this article including all of the intellectual property rights, data, content graphs and analysis. This article may not be quoted, reproduced, distributed or published for any commercial purpose without prior consent. Members of the press and others using the findings in this article for non-commercial purposes are welcome to publicly share and link to report information with attribution to Ookla.

| November 30, 2021

5G in Europe: EU Targets Require a Rethink

Monitoring progress of the EU’s Digital Decade

We recently attended the European 5G Observatory’s workshop, “5G in the Digital Decade,” which provided an overview of progress towards the EU’s 5G Action Plan targets and also looked ahead to the new targets as set out in the EU Digital Decade. The European Commission presented its vision of the region’s Digital Decade in March 2021, providing targets (the Digital Compass) for the digital transformation of Member States by 2030. Progress towards these targets is measured through the existing Digital Economy and Society Index (DESI), a key component of which focuses on connectivity. The relevant 2030 goals here are to provide Gigabit access to all EU households and 5G coverage in all populated areas.

The connectivity component of DESI is made up of a mix of demand and supply-side factors, including fixed and mobile broadband coverage and take-up, 5G spectrum availability and broadband pricing. The latest iteration was published in November using 2020 data, with Denmark, the Netherlands and Spain securing the top three spots for connectivity, and Greece and Bulgaria the bottom two.

ookla_desi_eu_markets_1121-01

As 5G evolves, so should the Commission’s 5G targets

The Commission’s DESI has evolved from its inception in 2014 to now track the Digital Compass’ targets. However, 5G is a rapidly evolving technology, and it was clear from the discussion during the Observatory’s workshop that there will be a need to review the actual targets and by implication the measurement criteria. The key concern lies in the “5G everywhere” target, both from a coverage and a performance perspective. As the end goal is the digital transformation of Member States, 5G coverage should be extended beyond the current target of all populated areas, to provide greater geographical coverage — in particular to support emerging vertical industry needs, for example in agriculture or logistics.

In terms of 5G performance, the ITU’s IMT-2020 requirements are for a user-experienced data rate of 100 Mbps download and 50 Mbps upload. However, not all 5G networks are created equally. The increasing use of dynamic spectrum sharing (DSS) means that operators can boost 5G coverage and capacity by using existing spectrum formerly dedicated to other generations of mobile technology. As a result, network performance will vary widely based on the bands used. There are also differences in 5G rollout, with initial 5G radio equipment tending to be deployed on existing tower infrastructure, and the coverage of higher capacity C-band spectrum will be limited relative to that of lower frequency bands as result.

ookla_median-download-speeds_europe_1121-01

Divergence between the DESI and end-user internet speed

What’s also interesting are the outliers and how their performance differs from their position within the DESI. Bulgaria (which came second to last in the connectivity portion of the DESI), does lag behind the European average on fixed broadband speeds, but is significantly faster on mobile speeds. Bulgaria’s median mobile download speed of 83.71 Mbps makes it the seventh fastest market globally. The reverse is true for Spain, which came third in the DESI, and where median fixed download speeds of 118.25 Mbps are well above the European average, putting it in 11th place globally, but where mobile speeds of 34.63 Mbps lag well behind the European average, and place it 51st globally. Other examples of divergence between the DESI and actual internet speeds on the ground include markets such as Belgium, Cyprus, Estonia and Lithuania.

To support Member States, the Commission has proposed a “Path to the Digital Decade”, a governance framework which in addition to the development of roadmaps at a Member State level and regular reporting on progress, will also include a framework to address progress shortfalls and support for multi-country projects. Member States have been encouraged to make use of the Recovery and Resilience Facility, an EU-wide fund of EUR 723.8 billion designed to mitigate the impact of the COVID-19 pandemic, from which they are required to devote at least 20% of their allocation to digital projects. As of October 2021, digital investment plans totalled 26% of the fund, of which 11% is dedicated to connectivity. With such significant public funds directed at improving connectivity, and the digital services that it underpins, the Commission must ensure that its targets and measurement methodology keep pace with the evolution of network technologies.

Ookla retains ownership of this article including all of the intellectual property rights, data, content graphs and analysis. This article may not be quoted, reproduced, distributed or published for any commercial purpose without prior consent. Members of the press and others using the findings in this article for non-commercial purposes are welcome to publicly share and link to report information with attribution to Ookla.