| September 8, 2021

Despite All Odds, Global Internet Speeds Continue Impressive Increase


“A lot has changed” we wrote in our 2019 global roundup of internet speeds based on the Speedtest Global Index. Little did we know how much was about to change. But two things remain the same: the internet is getting faster and the Speedtest Global Index is still a fantastic resource for tracking improvements on a global and country level (if we do say so ourselves). Today we’re taking a look back at how much internet speeds have increased over the past four years and which countries have seen some of the largest gains.

Mobile download speed jumped 59.5% over the last year globally, fixed broadband up 31.9%

The global mean of download speeds improved over the last 12 months on both mobile and fixed broadband to 55.07 Mbps and 107.50 Mbps, respectively, in July 2021. Mobile saw an increase of 59.5% when comparing July 2020 to July 2021 and fixed broadband saw an increase of 31.9%, according to the Speedtest Global Index.

ookla_global-index_world-speeds_0921-1

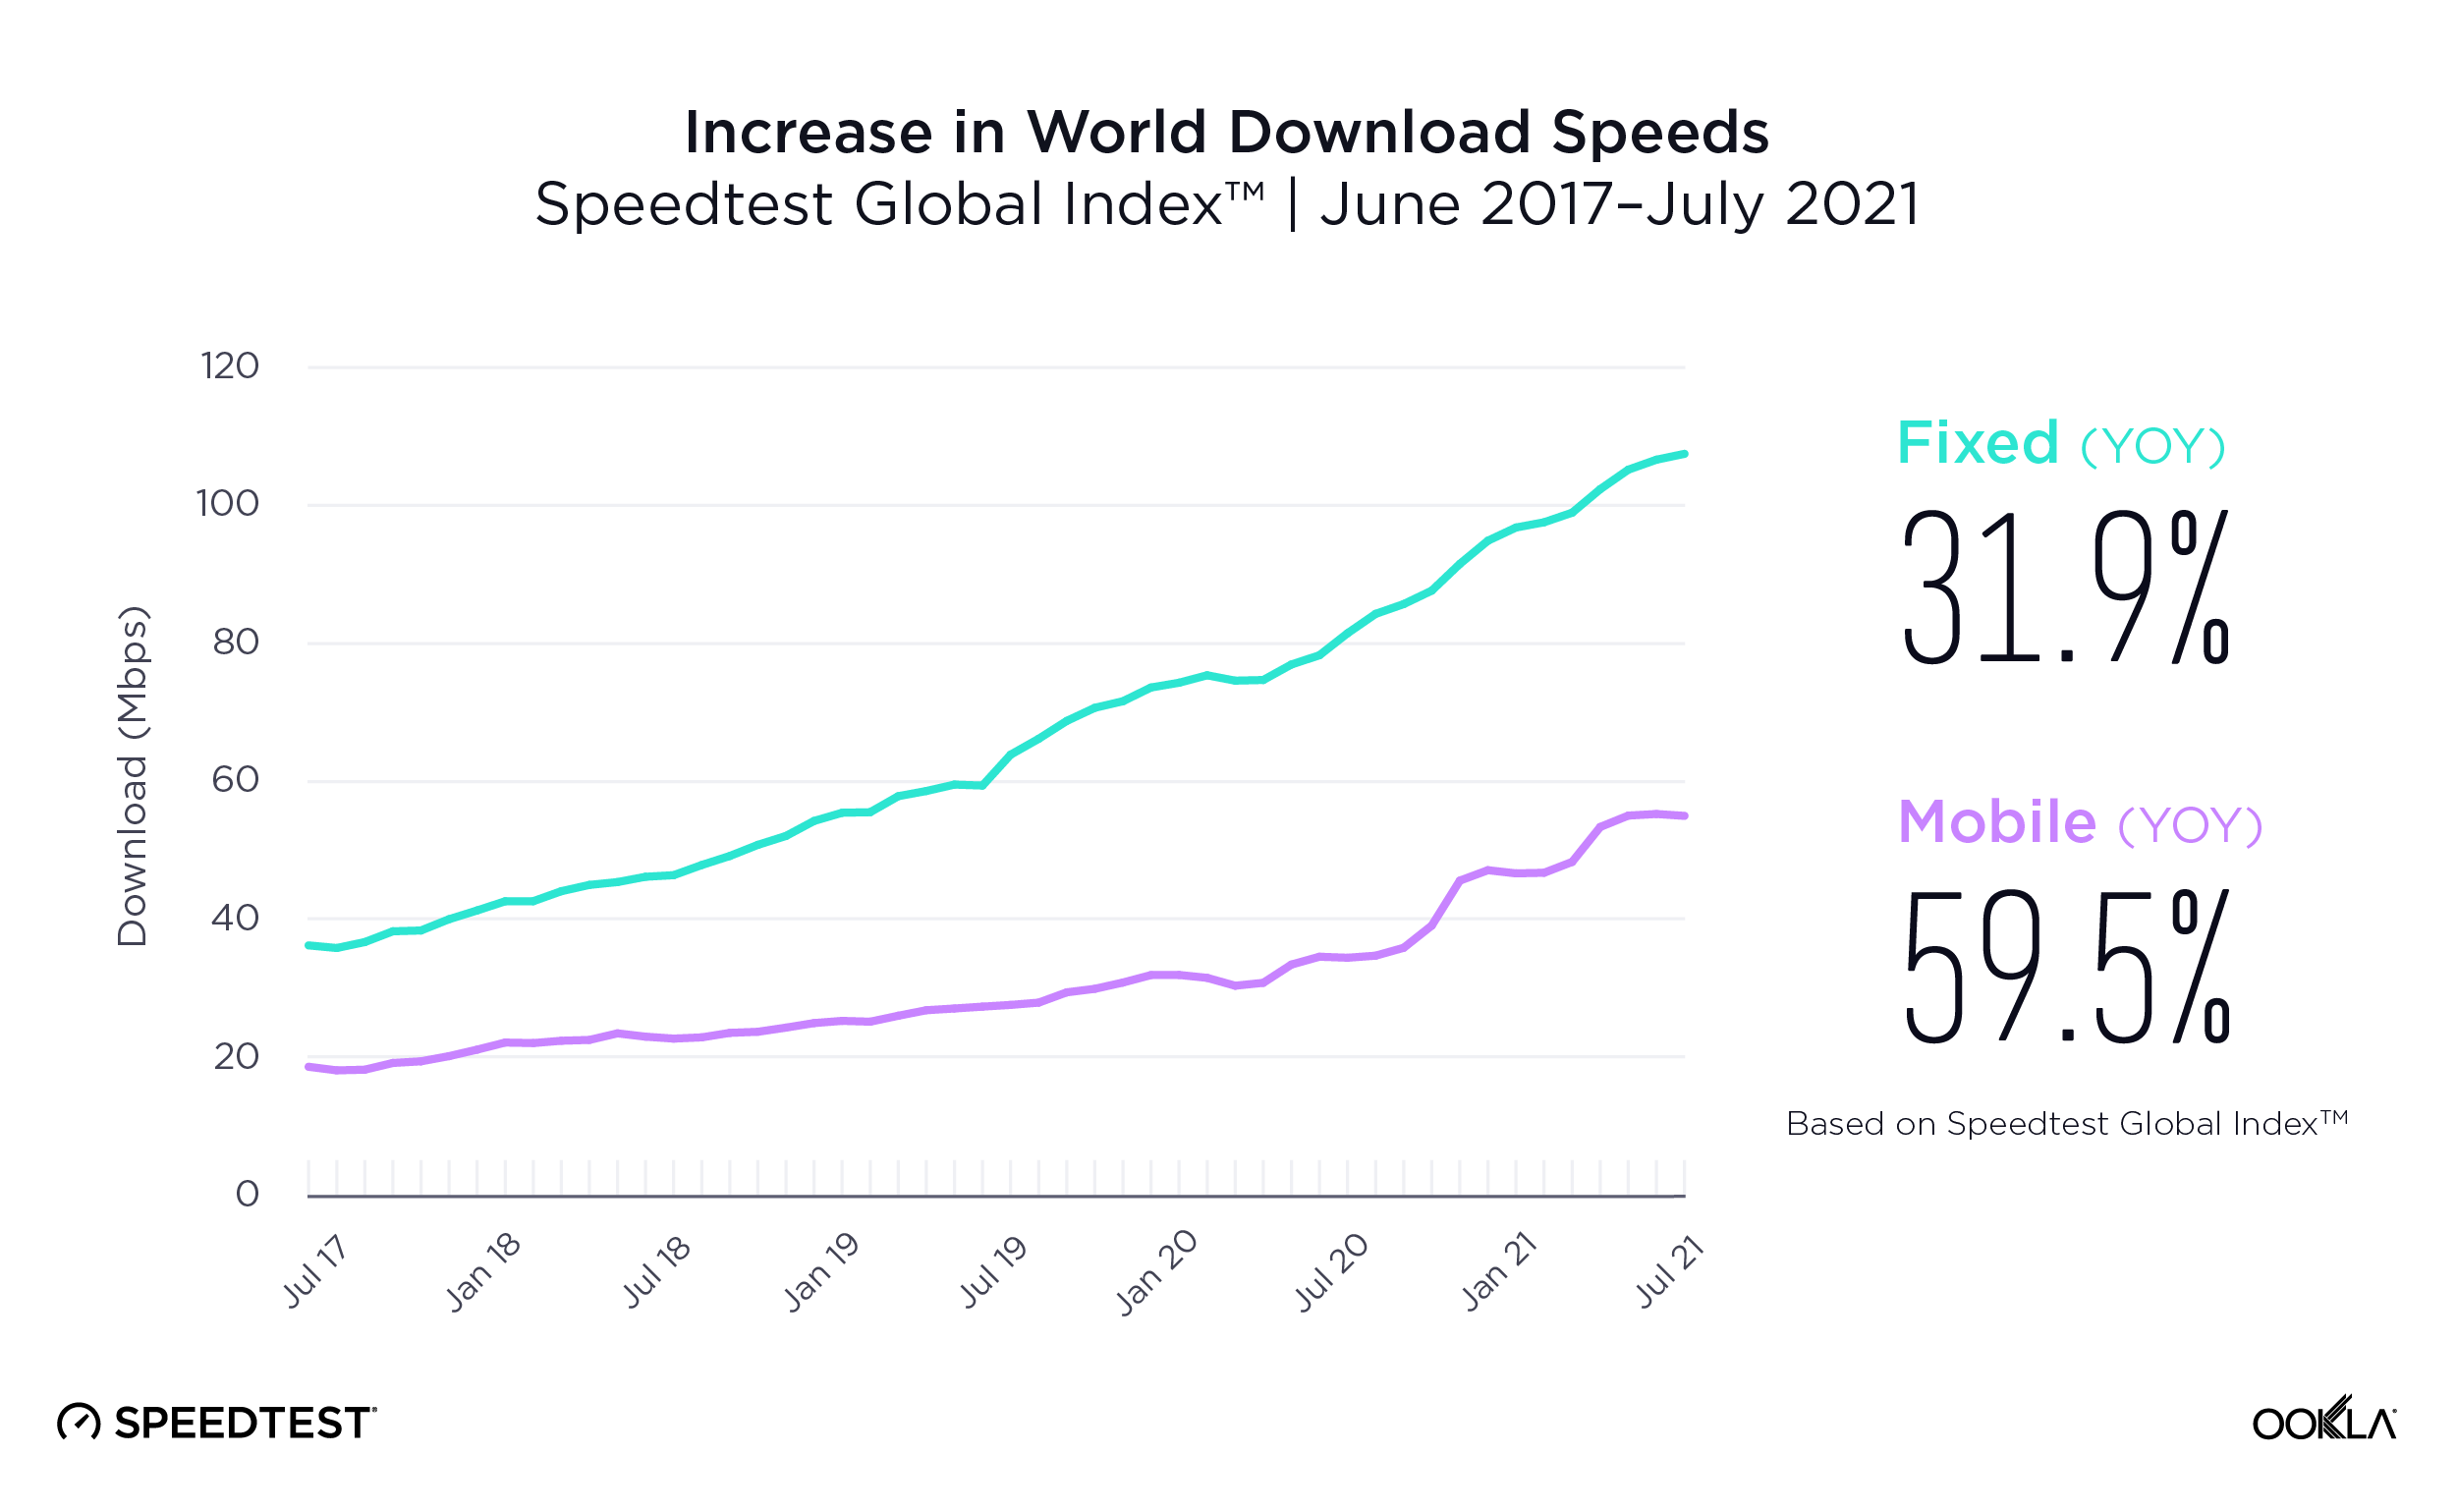
Looking further back, mean download speed over mobile was 98.9% faster in July 2021 than in July 2019, 141.4% faster when comparing July 2021 to July 2018, and 194.0% faster when comparing July 2021 to June 2017, the month we began tracking speeds on the Speedtest Global Index. Over the last two years there were only two months when the global average for mobile download speed did not show an upward slope: February and March 2020. Speeds began increasing again in April 2020, but did not recover to pre-February levels until May 2020. This coincides with initial lockdowns due to COVID-19 in many countries.

On fixed broadband, mean download speed was 68.2% faster in July 2021 than in July 2019, 131.3% faster in July 2021 than in July 2018, and 196.1% faster in July 2021 than in June 2017. There was a similar dip in download speed over fixed broadband in March of 2020 as we saw on mobile. The speed increased again in April 2020 but did not recover to a pre-March level until April 2020.

Top 10 rankings are somewhat constant over three years, U.S. and Canada slip off in 2021

There has been surprising parity of which countries continue to occupy the top 10 spots on the Speedtest Global Index in July of each year. However, the lists for mobile and fixed broadband are radically different, with only one country (South Korea) showing up on both lists in 2021.

ookla_fastest-countries_mobile_0921

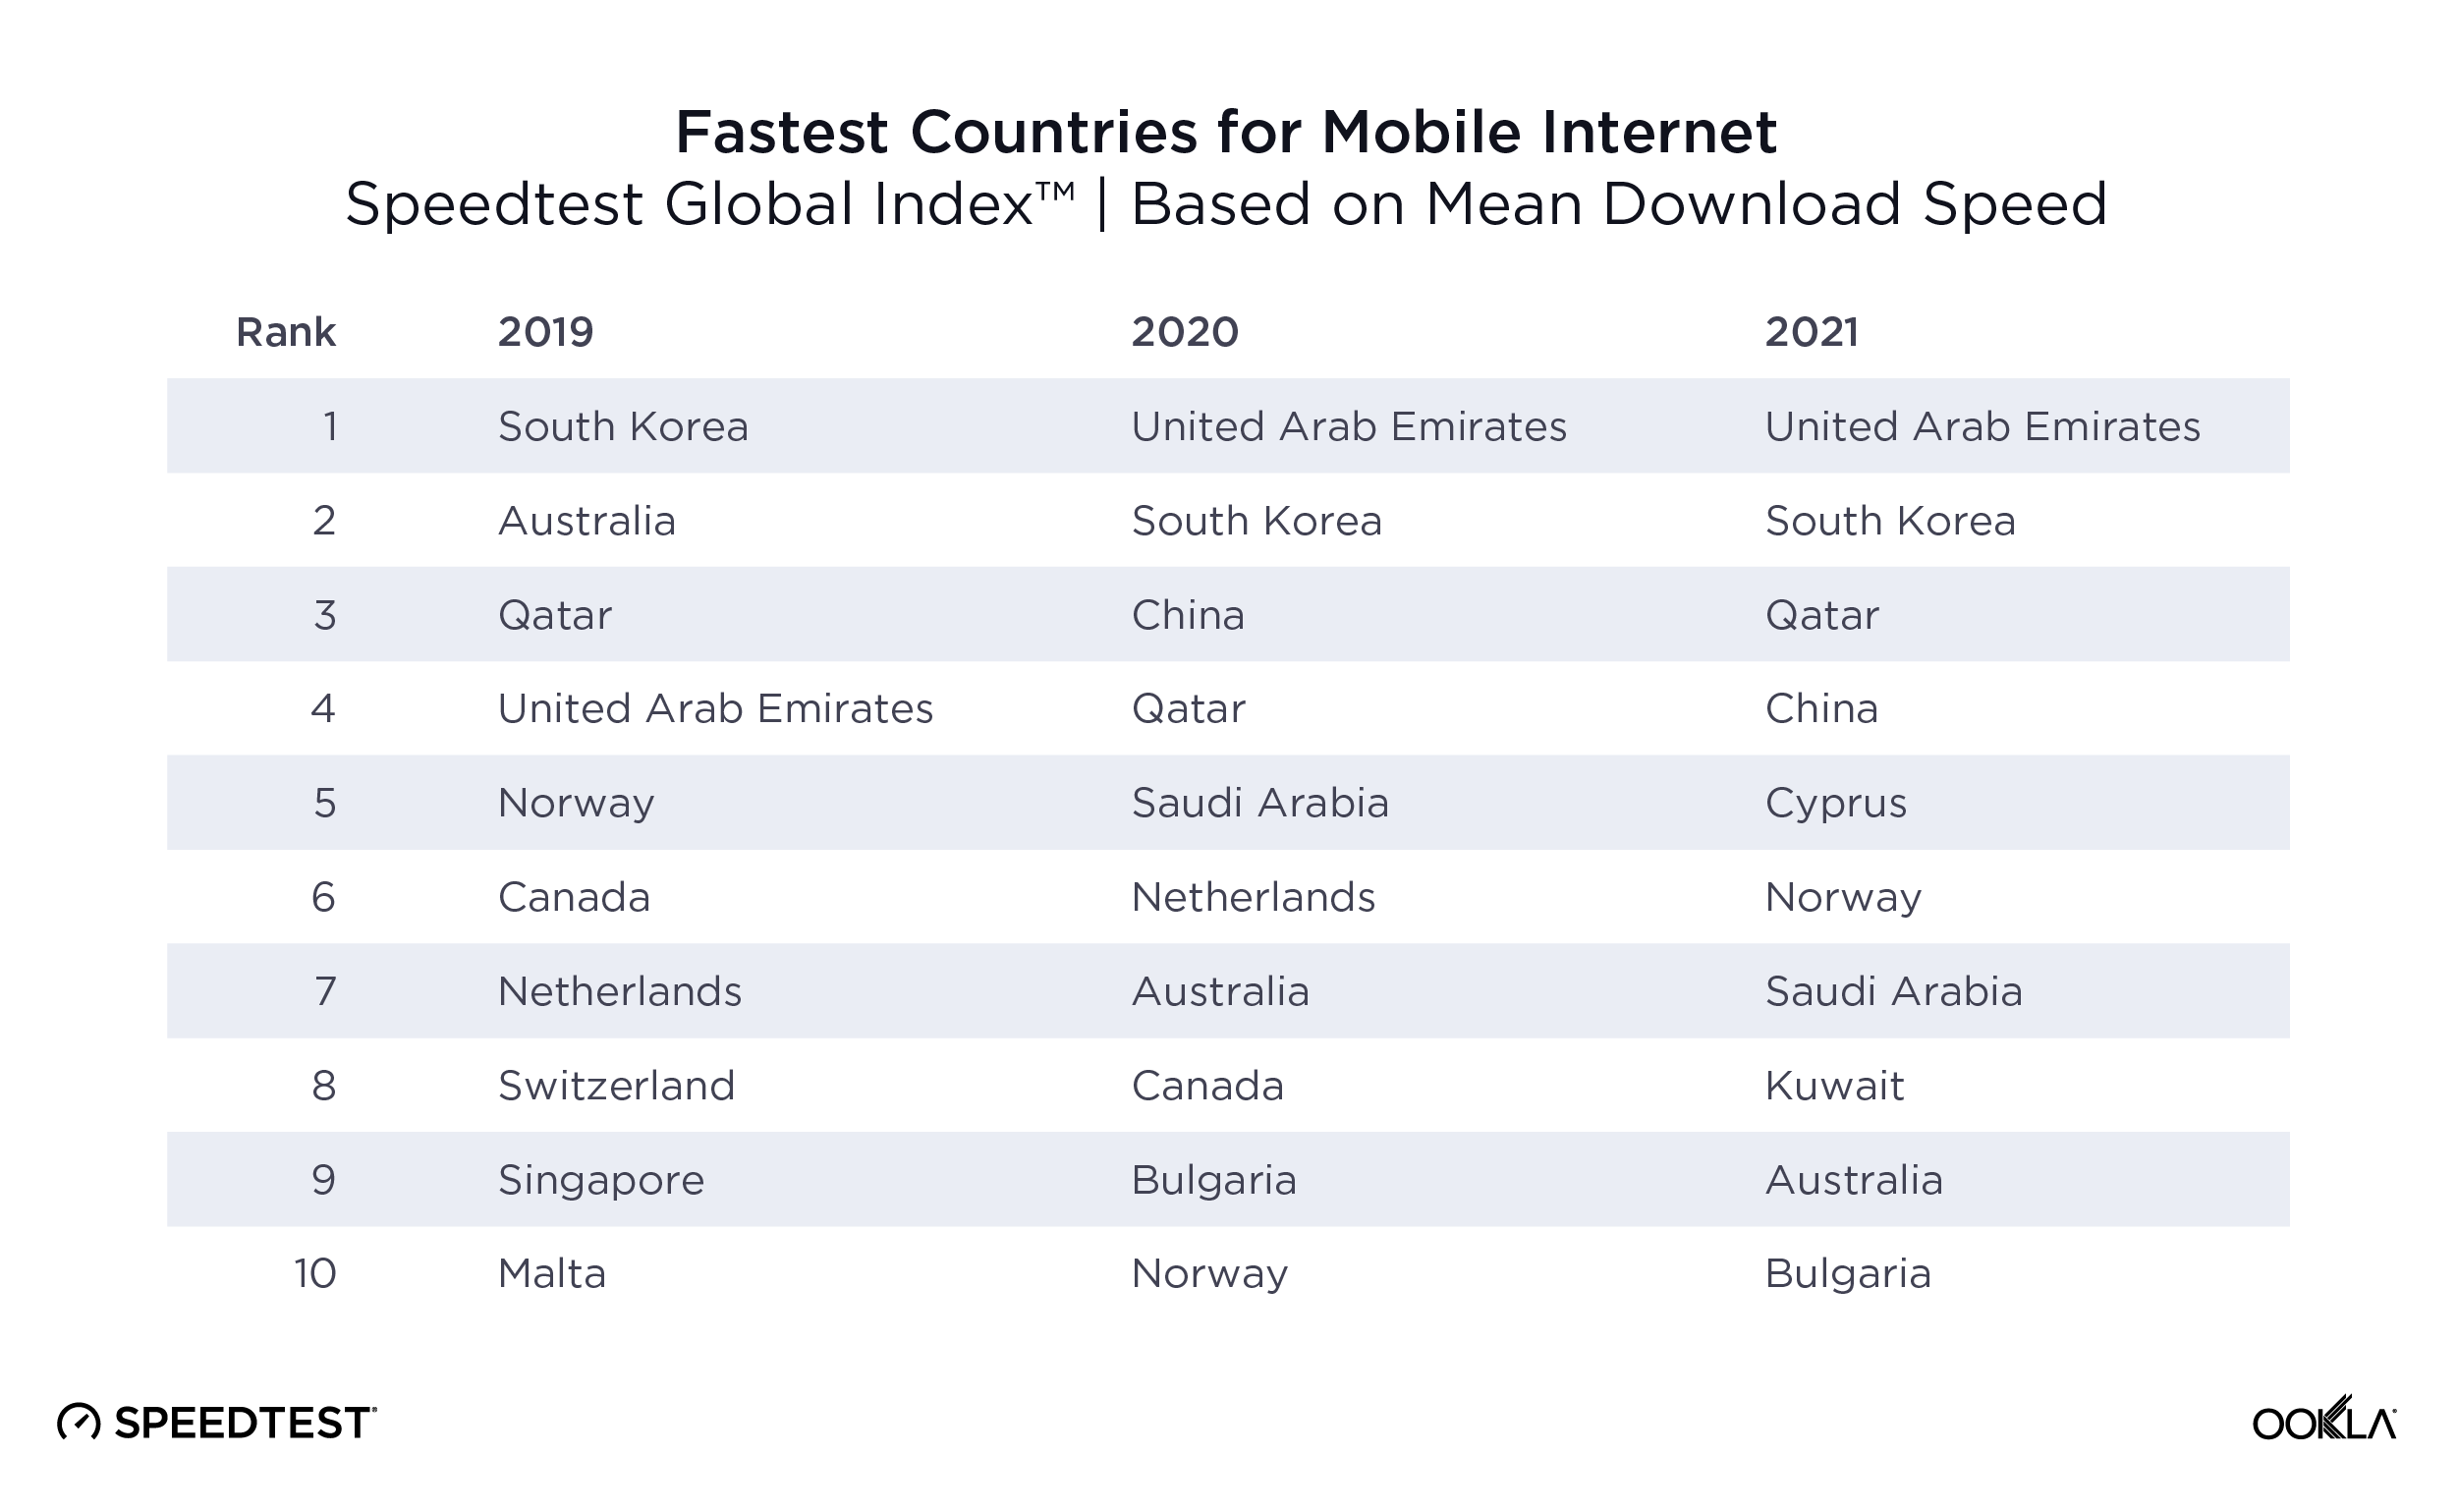
The United Arab Emirates and South Korea maintain their first and second place rankings for mobile in both 2020 and 2021 and China and Qatar merely flip-flop for third and fourth place. It’s interesting to see Australia and Canada decline in the rankings although their speeds have increased dramatically during the past three years. 5G is shifting mobile rankings where even countries with 5G (which few countries had in 2019) need a strong 5G focus to maintain their presence at the top of the list lest they be outpaced by other countries with larger investments in 5G.

ookla_fastest-countries_fixed_0921

The fixed broadband rankings are more dynamic than those on mobile. Monaco traveled up and down the top 10 from sixth place in 2019 to 10th in 2020 to first place in 2021. Singapore ranked first or second in all three years and Hong Kong (SAR) was in the top four. Romania was solidly in fifth place while South Korea dropped lower in the ranking every year. Chile and Denmark both debuted in the top 10 in 2021 and the United States dropped off the list.

Most of the top 10 countries perform well for fixed and mobile

We were curious to see if countries that made the top 10 in July 2021 for either mobile or fixed broadband were also performing well on the other medium, so we plotted the percentage difference from the global average for mobile download speed against download speed on fixed broadband. Note that the global average increased between 2020 and 2021 and that Liechtenstein and Monaco are not included in this comparison as they did not have sufficient samples to be listed on both axes.

2020/2021 chart of leading country performance again global averages

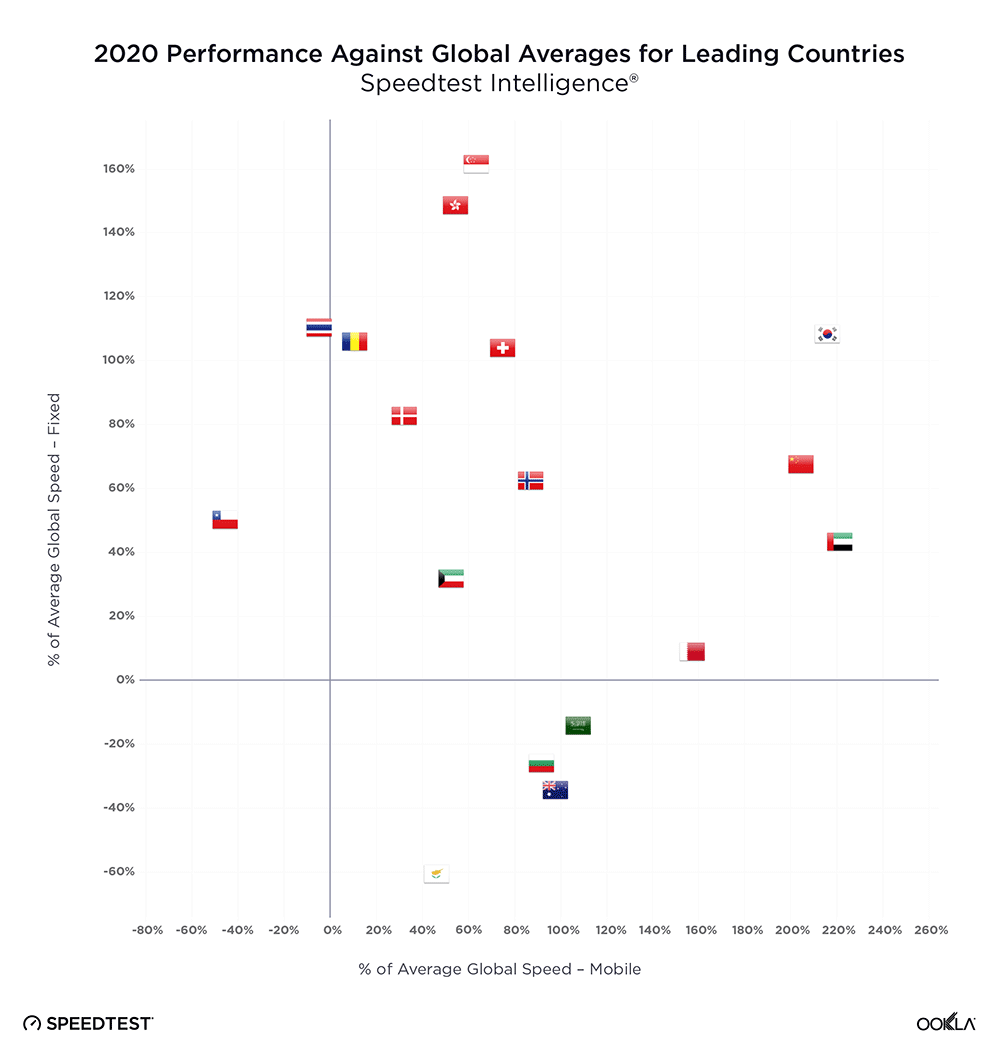
Most countries that made the top 10 in July 2021 for either mobile or fixed broadband were performing well over the global average for both at that point in time. South Korea and the U.A.E. stood out with mean mobile download speeds that were more than 240% faster than the global average and fixed broadband downloads that were more than 70% faster than the global average. China’s mobile download speed was more than 180% faster than the global average and the country was more than 70% faster than the global average for fixed broadband. Switzerland’s mobile and fixed broadband download speeds were close to 100% faster than the global average.

Chile and Thailand are in a quadrant that shows both had faster than average fixed broadband download speeds, but their mobile download speeds were slower than the global average in July 2021. Australia, Bulgaria, Cyprus and Saudi Arabia were in the opposite quadrant with faster than average mobile speeds and below average fixed broadband speeds.

Comparing the chart for July 2021 to that of July 2020, we saw a wide variety of outcomes. Countries with increases compared to the global average on mobile and fixed broadband included Australia, Cyprus, Denmark, Hong Kong, Romania and the U.A.E. Chile and Norway showed dramatic increases compared to the global average on fixed broadband and declines on mobile. Bulgaria, China, Kuwait, Saudi Arabia and Switzerland increased on mobile but showed little change on fixed. South Korea and Qatar increased on mobile compared to the global average and declined on fixed. Singapore and Thailand declined on both mobile and fixed broadband compared to the global average.

We’re interested to see how global speeds and rankings change over time as individual countries and their providers choose to invest in different technologies. Track your country’s performance using monthly updates on the Speedtest Global Index. Check the Ookla 5G Map for up-to-date information on 5G deployments where you live, and if you want more in-depth analyses, subscribe to Ookla Research.

Ookla retains ownership of this article including all of the intellectual property rights, data, content graphs and analysis. This article may not be quoted, reproduced, distributed or published for any commercial purpose without prior consent. Members of the press and others using the findings in this article for non-commercial purposes are welcome to publicly share and link to report information with attribution to Ookla.

| February 20, 2019

An Expansive Analysis of European Mobile Roaming Speeds and Behaviors

Last year we took a look at how free roaming was working out for EU citizens in terms of speeds and latency. This year we’ve expanded our analysis to all European countries and included data on Wi-Fi roaming behavior. We’ve also added a little insight into how roaming might affect download speeds for visitors to Mobile World Congress (MWC) in Barcelona from February 25- 28, 2019.

Except where noted, this analysis is based on Speedtest data from Android devices on 4G LTE cellular connections during Q3-Q4 2018. We included data on any country with greater than 30 samples in all categories.

Most Europeans experience slower downloads while roaming

Roaming traffic is subject to deals struck between individual mobile operators on how that traffic will be prioritized, so roaming speeds can depend not only on the country of origin but also the country of destination and the plan a subscriber has selected.

Consider the following table where an Albanian experiences a mean download speed of 54.56 Mbps at home and then 38.47 Mbps while roaming elsewhere in Europe. This is expected as a roamer does not usually have a direct relationship with the mobile operator handling their data and calls abroad.

Mean Mobile Download Speeds in Europe
Speedtest Data | Q3-Q4 2018
Country Local Speed (Mbps) Roaming Speed (Mbps) % Difference
Austria 38.23 35.78 -6.4%
Belarus 16.15 19.49 20.7%
Belgium 52.58 35.42 -32.6%
Bulgaria 47.28 32.35 -31.6%
Croatia 43.83 43.60 -0.5%
Cyprus 37.13 20.58 -44.6%
Czech Republic 44.91 13.43 -70.1%
Denmark 48.83 34.89 -28.6%
Estonia 36.43 38.98 7.0%
Finland 39.33 38.20 -2.9%
France 39.94 34.97 -12.5%
Germany 33.77 28.57 -15.4%
Greece 41.35 38.08 -7.9%
Hungary 49.57 28.19 -43.1%
Iceland 69.27 35.58 -48.6%
Ireland 28.23 31.49 11.6%
Italy 32.18 43.12 34.0%
Kazakhstan 22.93 13.80 -39.8%
Latvia 30.88 33.79 9.4%
Liechtenstein 56.48 36.66 -35.1%
Lithuania 41.49 33.43 -19.4%
Luxembourg 50.91 25.08 -50.7%
Malta 56.34 34.27 -39.2%
Montenegro 45.45 49.97 10.0%
Netherlands 56.06 33.86 -39.6%
Norway 68.49 38.69 -43.5%
Poland 28.74 29.71 3.4%
Portugal 32.06 36.95 15.3%
Romania 36.64 30.74 -16.1%
Russia 20.91 20.47 -2.1%
Serbia 43.41 21.64 -50.1%
Slovakia 33.47 31.80 -5.0%
Slovenia 35.51 36.41 2.5%
Spain 36.07 22.37 -38.0%
Sweden 44.87 34.59 -22.9%
Switzerland 47.59 30.36 -36.2%
Turkey 38.19 28.77 -24.7%
Ukraine 26.07 25.48 -2.3%
United Kingdom 30.84 38.76 25.7%

Residents of the Czech Republic will face massive speed disappointment when roaming through the rest of Europe. Other countries with much better speeds at home than abroad include Luxembourg, Serbia, Iceland and Cyprus.

In ten European countries, citizens experience faster mobile downloads while roaming than they do at home. These include: Italy, the United Kingdom, Belarus, Portugal, Ireland, Montenegro, Latvia, Estonia, Poland and Slovenia. Most of these are among the slowest countries on this list, so it would make sense that their citizens would experience better speeds elsewhere in Europe than they do at home.

Europeans are connected to Wi-Fi most of the time

Customers sometimes try to get better speeds and avoid roaming fees (for those outside the E.U.) and data overages by connecting to Wi-Fi. The following table compares the percentage of time spent on Wi-Fi by a resident of a country with that of a visitor to the country.

Percentage of Time Spent on Wi-Fi in Europe
Speedtest Data | Q3-Q4 2018
Country Local Customers Visitors % Difference
Albania 61.9% 59.8% -3.4%
Andorra 73.6% 69.0% -6.2%
Armenia 61.5% 68.1% 10.7%
Austria 65.6% 36.7% -44.1%
Azerbaijan 67.0% 70.7% 5.5%
Belarus 63.9% 58.3% -8.9%
Belgium 71.1% 32.9% -53.7%
Bosnia and Herzegovina 71.9% 66.0% -8.2%
Bulgaria 65.2% 46.8% -28.2%
Croatia 66.1% 41.0% -38.0%
Cyprus 70.9% 58.4% -17.7%
Czech Republic 75.1% 38.9% -48.1%
Denmark 70.4% 52.9% -24.9%
Estonia 61.2% 45.6% -25.4%
Finland 56.6% 47.1% -16.7%
France 60.2% 43.1% -28.5%
Georgia 61.4% 62.2% 1.3%
Germany 72.2% 42.4% -41.3%
Greece 73.5% 52.2% -28.9%
Hungary 71.9% 35.0% -51.3%
Iceland 65.7% 58.2% -11.4%
Ireland 67.2% 52.4% -22.0%
Italy 64.1% 48.9% -23.7%
Kazakhstan 57.7% 64.7% 12.3%
Latvia 60.9% 43.8% -28.1%
Liechtenstein 71.7% 58.2% -18.9%
Lithuania 66.8% 43.3% -35.1%
Luxembourg 63.6% 26.0% -59.1%
Macedonia 65.3% 52.9% -18.9%
Malta 74.3% 58.0% -22.0%
Moldova 67.2% 67.3% 0.2%
Montenegro 63.6% 65.2% 2.5%
Netherlands 73.0% 42.5% -41.7%
Norway 74.7% 59.7% -20.1%
Poland 62.5% 48.1% -23.1%
Portugal 69.1% 54.7% -20.9%
Romania 62.4% 48.7% -21.9%
Russia 58.8% 65.9% 12.2%
San Marino 66.8% 39.7% -40.6%
Serbia 68.6% 61.2% -10.7%
Slovakia 69.6% 35.1% -49.6%
Slovenia 63.3% 26.4% -58.3%
Spain 70.8% 53.0% -25.2%
Sweden 71.8% 44.9% -37.4%
Switzerland 62.4% 47.2% -24.4%
Turkey 61.7% 73.0% 18.4%
Ukraine 61.5% 62.4% 1.5%
United Kingdom 71.3% 54.0% -24.3%

Finland showed the lowest time spent on Wi-Fi by residents at 56.6%. Kazakhstan was second at 57.7% followed by Russia (58.8%), France (60.2%) and Latvia (60.9%). The Czech Republic showed the highest time spent on Wi-Fi by residents at 75.1%. Norway was second at 74.7% followed by Malta (74.3%), Andorra (73.6%) and Greece (73.5%).

When it comes to time spent on Wi-Fi by visitors, Luxembourg had the lowest percentage at 26.0%. Slovenia was second at 26.4% followed by Belgium (32.9%), Hungary (35.0%) and Slovakia (35.1%). Turkey showed the highest time spent on Wi-Fi by visitors at 73.0%. Azerbaijan was second at 70.7% followed by Andorra (69.0%), Armenia (68.1%) and Moldova (67.3%).

Luxembourg saw the largest difference in time spent on Wi-Fi between residents and visitors with visitors using Wi-Fi 59.1% less than residents. Slovenia was close behind at 58.3%, followed by Belgium (53.7%) and Hungary (51.3%). On the other end of the spectrum, visitors to Turkey were on Wi-Fi 18.4% longer than residents followed by Kazakhstan (12.3%) and Russia (12.2%).

Roaming dramatically increases latency in Europe

Because roaming signals are routed through a user’s home network, latency is always an issue in roaming. Speedtest data shows that latency while roaming is a much larger issue for residents of some countries than it is for others.

Comparing European Latency In-Country and Abroad
Speedtest Data | Q3-Q4 2018
Country Local Latency (ms) Roaming Latency (ms) % Difference
Austria 24 83 245.8%
Belarus 32 75 134.4%
Belgium 24 81 237.5%
Bulgaria 24 126 425.0%
Croatia 32 86 168.8%
Cyprus 20 194 870.0%
Czech Republic 24 86 258.3%
Denmark 24 98 308.3%
Estonia 23 78 239.1%
Finland 26 104 300.0%
France 42 87 107.1%
Germany 33 87 163.6%
Greece 27 137 407.4%
Hungary 22 94 327.3%
Iceland 18 163 805.6%
Ireland 34 114 235.3%
Italy 52 116 123.1%
Kazakhstan 35 164 368.6%
Latvia 24 94 291.7%
Liechtenstein 40 90 125.0%
Lithuania 26 108 315.4%
Luxembourg 23 73 217.4%
Malta 18 141 683.3%
Montenegro 18 42 133.3%
Netherlands 26 81 211.5%
Norway 36 109 202.8%
Poland 33 104 215.2%
Portugal 27 102 277.8%
Romania 26 131 403.8%
Russia 42 161 283.3%
Serbia 22 76 245.5%
Slovakia 30 69 130.0%
Slovenia 21 69 228.6%
Spain 45 118 162.2%
Sweden 30 118 293.3%
Switzerland 26 75 188.5%
Turkey 26 115 342.3%
Ukraine 35 116 231.4%
United Kingdom 37 107 189.2%

Residents of Cyprus saw an average latency of 194 ms while roaming in Europe. The country with the second highest latency for residents roaming abroad was Kazakhstan at 164 ms, followed by Iceland (163 ms). Russia (161 ms) and Malta (141 ms). In contrast, Montenegro had a lower latency for residents roaming abroad than Italy did for residents using their mobile phones locally.

Roaming performance at MWC

MWC, the largest mobile conference in the world, has Barcelona teeming with visitors from across the globe all trying to connect to their home networks. During February 2018 we saw an average download speed of 34.31 Mbps while roaming in Barcelona and a mean latency of 201 ms. Visitors from the U.K. saw an average download speed of 49.00 Mbps and a mean latency of 111 ms, while those from Italy averaged a download of 32.88 Mbps and a latency of 128 ms.

What will the performance look like at this year’s conference? Schedule a meeting or come see us in Hall 2 at Booth 2i25 to learn more about our roaming data.

Ookla retains ownership of this article including all of the intellectual property rights, data, content graphs and analysis. This article may not be quoted, reproduced, distributed or published for any commercial purpose without prior consent. Members of the press and others using the findings in this article for non-commercial purposes are welcome to publicly share and link to report information with attribution to Ookla.