| August 21, 2022

Qatar – Stronger Competition Driving 5G Performance Gains Ahead of World Cup

Key messages

  • Vodafone’s resurgence is putting pressure on market leader Ooredoo to maintain its performance lead. Vodafone’s Turnaround Strategy has created a more level competitive playing field in Qatar, helping it increase its market share and drive strong growth in top-line revenues and net profit so far this year. Vodafone’s improving performance in median 5G network speeds is driving Ooredoo to react in order to maintain its lead.
  • Strong 5G network investment in Qatar, as both operators seek to gain the upper hand, with all eyes on the up-coming FIFA World Cup. This major event gives both operators a chance to demonstrate the capabilities and resilience of their 5G networks to a global audience. They have already driven median 5G download speeds in the market to over 400 Mbps so far in 2022, and with mmWave spectrum due to be allocated in 2023, consumers should expect faster performance to come.
  • Perfect storm has helped propel Qatar to second place globally in mobile download speeds. A desire to rapidly transition their customer bases to 5G has boosted 5G Availability in the market, and has helped Qatar climb to second place in Ookla’s Speedtest Global Index as of July 2022.
  • Beyond faster speeds, consumers are paying less and have access to unlimited 5G tariffs. While headline median 5G speeds impress, strong competition is also driving improved outcomes for consumers, as ARPU falls quarter-on-quarter. Both operators have also introduced unlimited 5G tariffs, including voice, SMS and data, albeit with fair usage caps.

Vodafone’s resurgence has forced Ooredoo to respond and helped drive network speeds to new highs 

Vodafone Qatar’s resurgence as a stronger competitor to market leader Ooredoo Qatar has taken place at a key juncture for the Qatari market — the arrival of 5G. Qatar’s Communications Regulatory Authority (CRA) amended the mobile licenses held by Vodafone Qatar and Ooredoo Qatar in early 2019. The new licenses included harmonized terms and conditions for both companies, authorizing each to utilize 100 MHz of C-band spectrum and committed them to roll out commercial 5G networks before the end of 2020 in all densely populated areas. It also required they provide coverage of all primary roads and highways as well as all venues associated with the up-coming FIFA World Cup. This was updated in May 2022 to plan the allocation to both operators of additional spectrum in the C-band as well as high frequency (26 GHz) spectrum by 2023, while their license obligations require their 5G networks to cover 99% of Qatar with minimum download speeds of 100 Mbps by 2024.

Both network operators have invested heavily in their 5G networks, with Ooredoo attaining 99.5% population coverage in Q1 2022, and Vodafone committed to near universal coverage by the end of 2022. This drive to increase coverage and rapidly migrate users to 5G means that Qatar is among the top markets globally in terms of 5G Availability, (the percentage of users with 5G-capable devices who spend a majority of their time connected to 5G networks), which stood at 46.8% as of Q2 2022 according to Speedtest Intelligence®. Ooredoo maintained an advantage over Vodafone in median 5G download speeds in Q2 2022, recording 450.08 Mbps compared to Vodafone’s 426.04 Mbps, while Vodafone maintains an advantage in upload speeds of 28.61 Mbps to Ooredoo’s 26.76 Mbps.

Ookla® Speedtest Intelligence data shows that Vodafone’s renewed position within the market is helping spur network investment from both operators. In early 2021, Ooredoo had the upper hand in terms of 5G download performance, while in Q4 2021 Vodafone’s performance jumped considerably, prompting Ooredoo to strengthen its position in  Q1 2022. Monthly Speedtest® data shows that the performance gap between the two operators is beginning to narrow once more. At a national level, this has helped Qatar maintain a top-five position in Ookla’s Speedtest Global Index (a global ranking of median download speeds based on all mobile technologies), and as of July 2022 it ranked second globally.

Vodafone targeting market share gains, helping drive ARPU in the market lower

Qatar has been a challenging market for Vodafone Group. Vodafone Qatar launched in 2009 as the second mobile network operator in the country. While it was able to grow market share, it consistently made losses — in the nine months to December 2017, the company made a loss of QAR 182.16 million (~$50 million), which led to Vodafone Group selling its share in the operator in 2018. The Qatar Foundation took control of the company, having increased its shareholding to 50%, maintaining the Vodafone brand but also implementing a Turnaround Strategy, designed to reverse the company’s fortunes, with a focus on cost containment and revenue growth. 

Vodafone Qatar’s operational and financial performance has gone from strength to strength over the five years since then. Costs have fallen from close to 75% of revenues in 2017, to under 60% during 1H 2022, spurred by a rigid focus on cost containment. During the first half of 2022, Vodafone Qatar grew top line revenues by 23.5% (year-on-year, with service revenues increasing by 14%), while net profit rose by 61.3%.

The company is reaping the benefits of an aggressive move to capture new customers — in Q1 2022 its mobile connections base topped 2 million for the first time, representing 18.6% growth year-on-year, well above Ooredoo’s 6.8% growth. Vodafone was the first to introduce “unlimited” tariffs to the market in 2019 across voice, SMS, and data (subject to a fair usage policy), while it has also allowed users across all its tariffs to access 5G. Vodafone’s 5G Availability, the proportion of its users with 5G capable devices which spend a majority of time connected to 5G networks, hit 53.0% during Q2 2022, ahead of Ooredoo’s 42.0%. Vodafone’s drive to acquire new customers has come at the expense of average revenue per user (ARPU), as it is clear it is undercutting Ooredoo in the market. Vodafone’s ARPU fell by 10.3% in the year to Q1 2022, while Ooredoo’s only declined by 3.9%, despite being almost 40% higher. 

Focus currently on FIFA World Cup Qatar 2022, but more to come

A large part of 5G network investment in the country is targeted at the upcoming FIFA World Cup, scheduled to take place in November and December 2022. The award of the world’s premier global football tournament was a significant coup for Qatar, and is predicted to attract around 1.5 million visitors, a significant increase on the local population of 2.93 million. In addition to covering all fan zones related to the event, both operators have been investing heavily in increasing the capacity of their networks and in building enhanced network assurance capabilities, to make sure their networks can cope with the strain of the additional connections and traffic from the event. 

Ooredoo announced in March that it had been selected by the FIFA World Cup organizers as the Official Global Connectivity Services Provider. This will involve providing connectivity services to all media rights licensees in Qatar, and it is building a dedicated network to support broadcast video production and distribution. In order to further boost its network capacity for users at the event, Ooredoo signed a partnership agreement with Ericsson in November 2021, where the vendor will provide network optimization and event management services, covering 5G services in fan zones, stadiums, airports, and major tourist attractions. While not an official partner, Vodafone Qatar’s role in delivering a successful event should not be overlooked. It has tapped the experience of the wider Vodafone Group in delivering connectivity at major events, has been aggressively densifying its 5G network (with over 50% more radio access network sites deployed since 2017), and has also been expanding the reach of its GigaNet fiber network. 

The failure to allocate mmWave spectrum in time for the World Cup has disappointed, however this will now take place in 2023, and consumers should expect further 5G performance gains once both operators begin deployment. We will continue to look at performance on both operator’s networks as we draw closer to the World Cup, and at how they handle the deluge of visitors and traffic that it will bring. To stay abreast of Ookla’s latest content, you can subscribe to our updates here.

Ookla retains ownership of this article including all of the intellectual property rights, data, content graphs and analysis. This article may not be quoted, reproduced, distributed or published for any commercial purpose without prior consent. Members of the press and others using the findings in this article for non-commercial purposes are welcome to publicly share and link to report information with attribution to Ookla.

| June 2, 2022

Fixed Broadband Network Performance in Indonesia Falling Further Behind Regional Peers

Bahasa Indonesia

Key messages:

  • Fixed performance in Indonesia continues to lag behind regional peers. While Indonesian fixed broadband network performance continues to improve quarter over quarter, Ookla® Speedtest Intelligence® shows that Indonesia lags behind many of its regional peers on key metrics such as median download speed and the penetration of more advanced routers supporting 5 GHz Wi-Fi, and this disparity is growing.
  • East and Central Java among the slowest performing Indonesian regions. Most regions of Indonesia achieve similar median download speeds. However there remain outliers: Bali was the top-performing region, and the more populous regions of East and Central Java continued to record some of the slowest performance in the market.
  • Faster speeds equal happier customers. Consumer sentiment towards fixed broadband providers in Indonesia, as measured by Ookla’s 5-Star Rating, tracks closely with network performance over the past year.
  • Competition ramps up in the Indonesian fixed broadband market. Speedtest Intelligence® sample data for Q3-Q4 2021 shows 306 ISPs active in the market. Of these, four major national network operators meet our threshold to be considered top providers (with a minimum of 3% of samples) — Telkom, First Media, MyRepublic, and Biznet. At a regional level, this list of top providers expands to ten, including CBN, MNC Play, StarNet, PT Global Media Data Prima, MTM Bali, and GlobalXtreme.
  • Biznet leads the market in fixed broadband network performance according to Speedtest Intelligence. Biznet is the leading operator both nationally and in many of Indonesia’s regions, achieving almost symmetrical download and upload speeds.

Singapore leads in fixed broadband network speeds in Southeast Asia

Indonesia ranks 114th on the Speedtest® Global IndexTM for median fixed download speeds, based on data for May 2022. According to Speedtest Intelligence, fixed broadband speeds in the country have increased over the past year, from a median download speed of 17.37 Mbps in March 2021 to 21.23 Mbps in March 2022. Fixed broadband upload speeds in the market have improved by a greater margin, from 4.95 Mbps in March 2021, to 9.73 Mbps in March 2022. However, as with its mobile market, and despite its improving trajectory, Indonesia’s fixed broadband performance continues to lag behind many of its regional peers. 

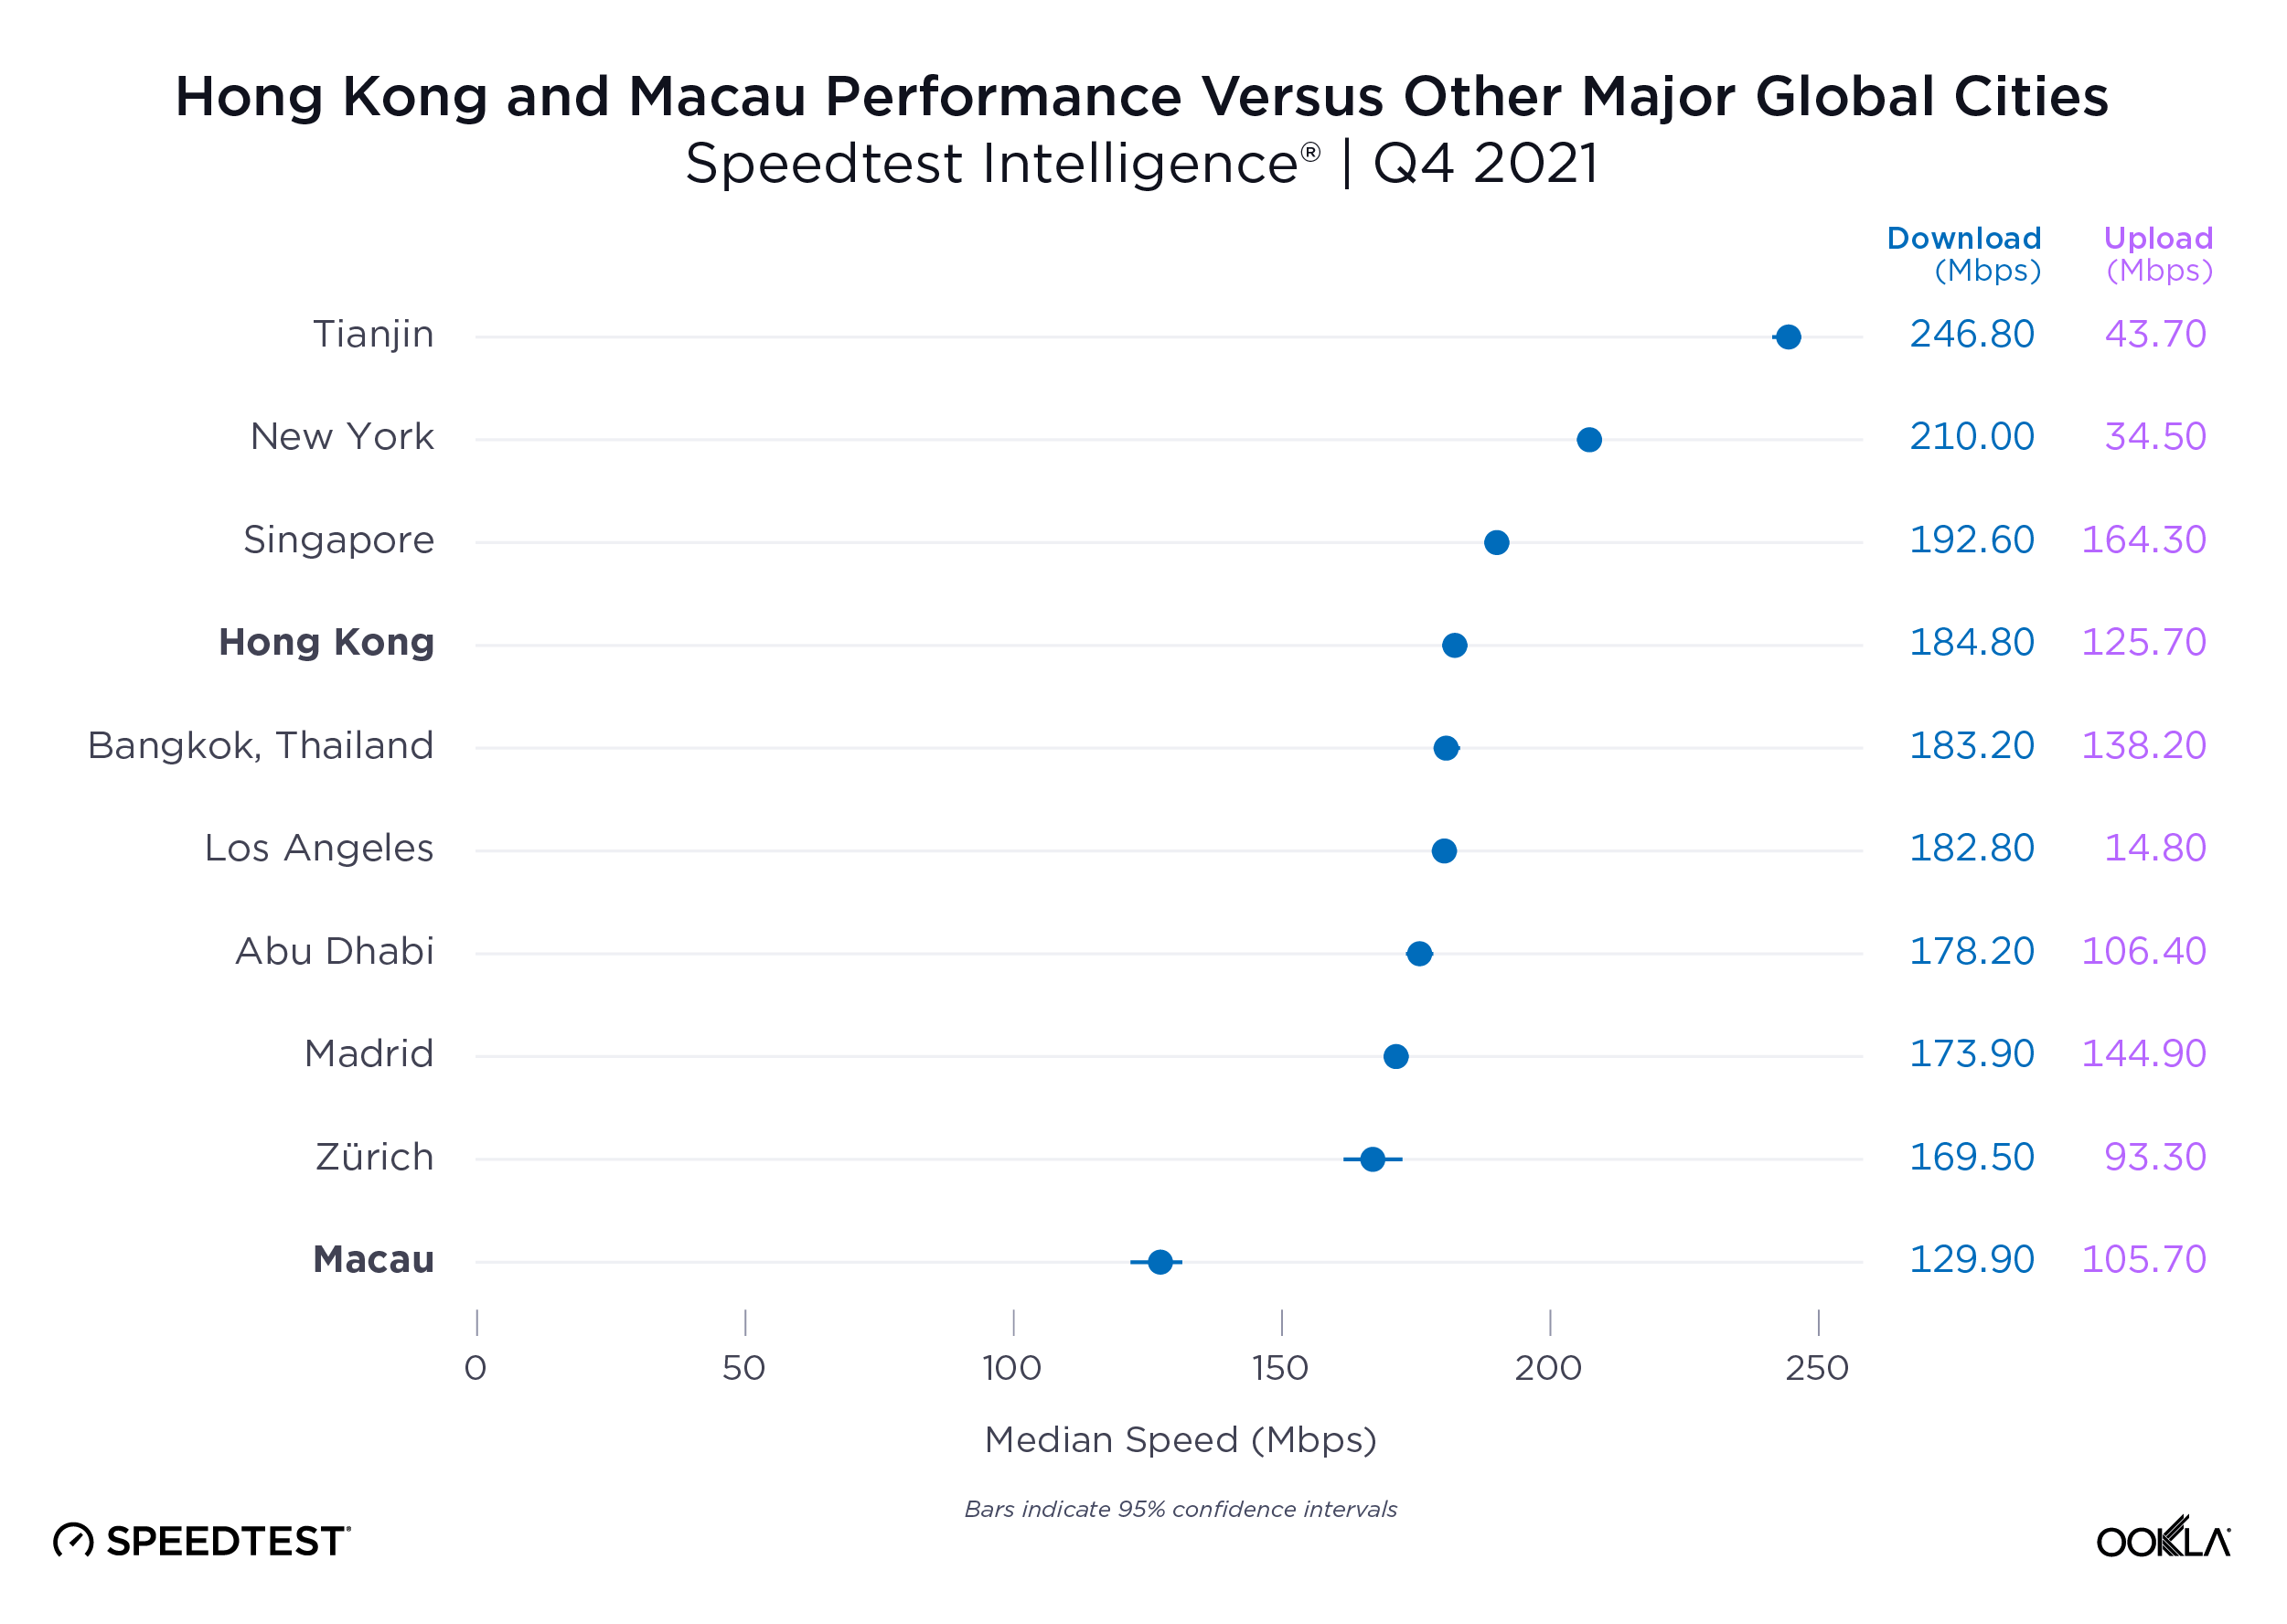
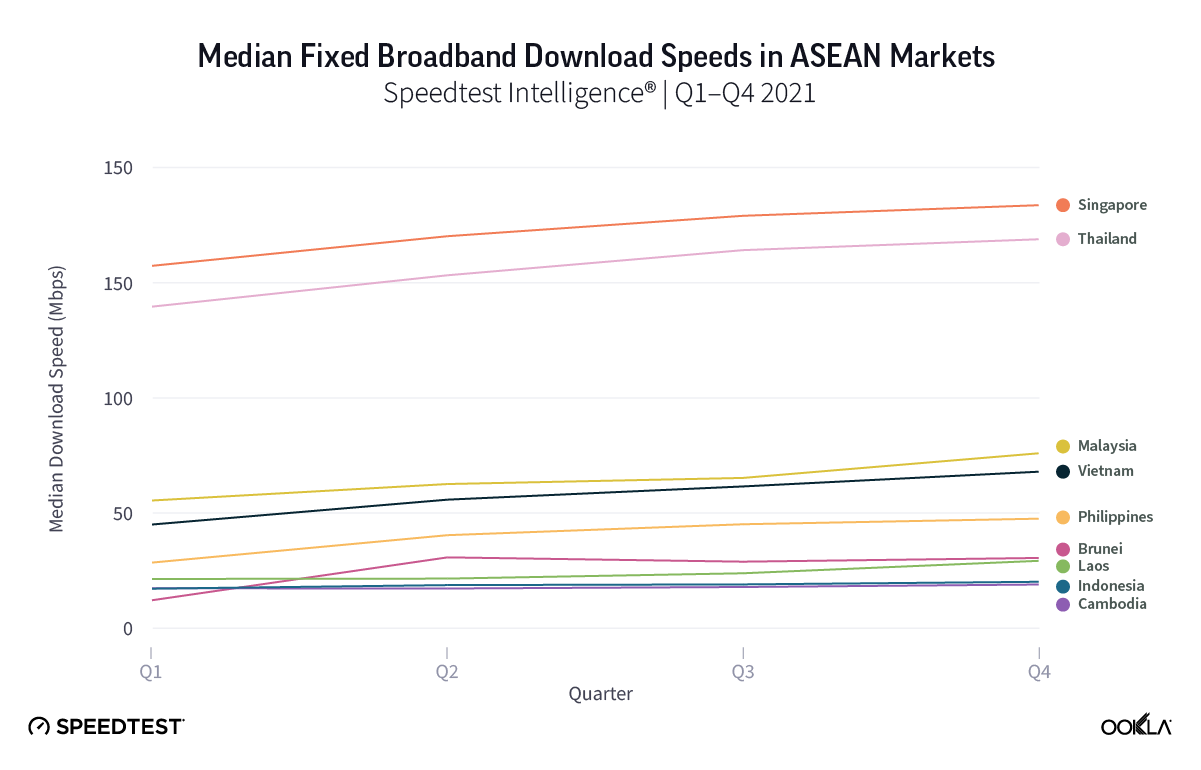
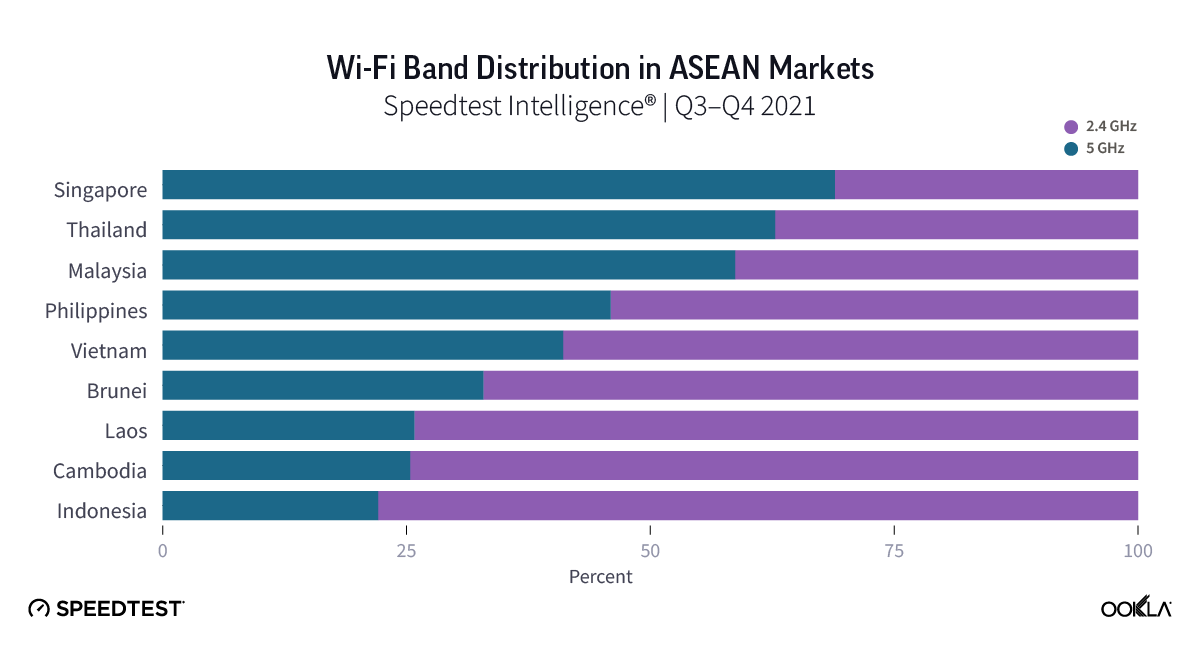
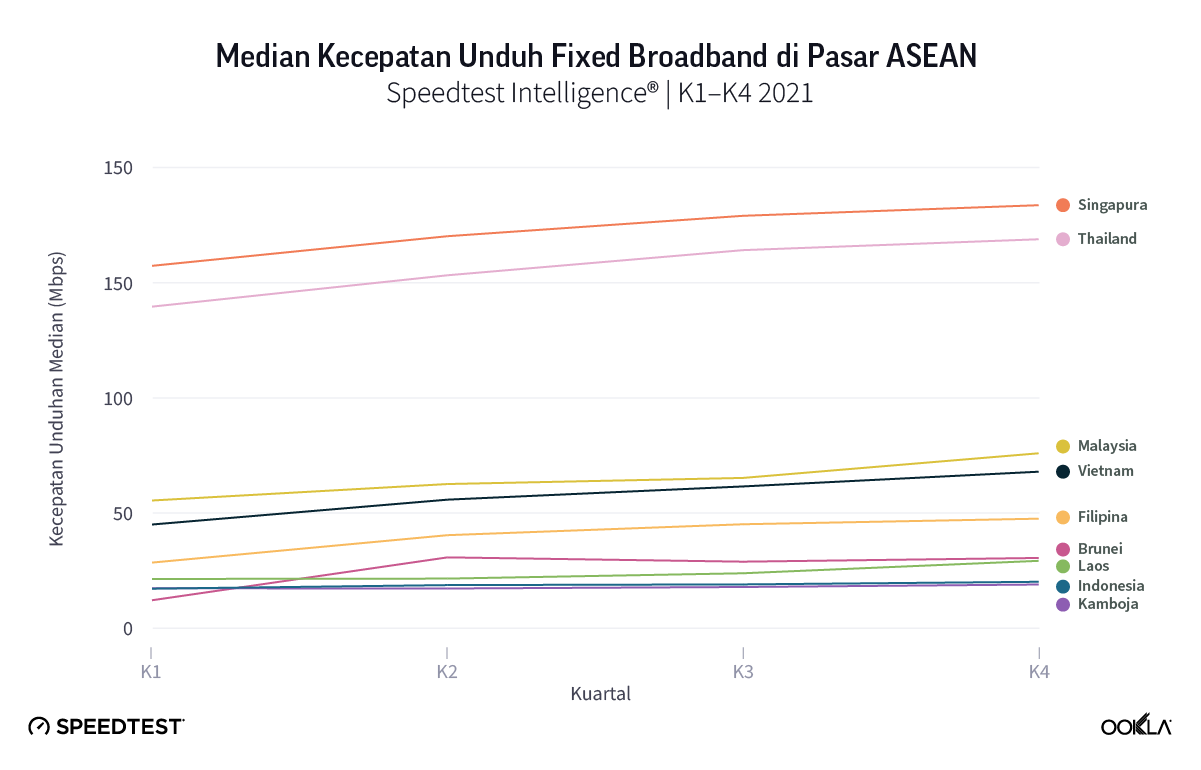
Looking at performance across 2021 in Southeast Asian markets, Singapore and Thailand continue to maintain a sizable performance gap compared to their regional peers, with both achieving median fixed broadband download speeds in excess of 150 Mbps during Q4 2021. There was also clear separation in performance between Malaysia (75.91 Mbps), Vietnam (67.91 Mbps), and the Philippines (47.50 Mbps). Of the remaining four markets, Brunei and Laos achieved speeds of close to 30 Mbps, while Indonesia and Cambodia were the slowest fixed-line markets, recording median download speeds of 20.08 Mbps and 18.89 Mbps respectively.

median fixed broadband download speeds in ASEAN markets

We used data from Speedtest Intelligence to evaluate fixed broadband performance in Indonesia during Q3-Q4 2021. Our analysis examines fixed broadband speeds at the country and provider-level. We also examine Wi-Fi performance as a subset of total fixed broadband samples in order to assess the speed delivered to end-user devices and look at the share of samples that utilize routers that support 5 GHz over Wi-Fi.

Operators worldwide are increasingly offering home networking solutions in order to help improve Wi-Fi speeds and coverage within the home. In Indonesia, First Media, Biznet, and MyRepublic offer mesh networking solutions, while some ISPs also offer the option to upgrade to routers that support the 5 GHz band. This offers greater channel bandwidth and typically lower interference than Wi-Fi over the 2.4 GHz band, allowing for improved performance for high bandwidth activities such as gaming and streaming high definition video content.

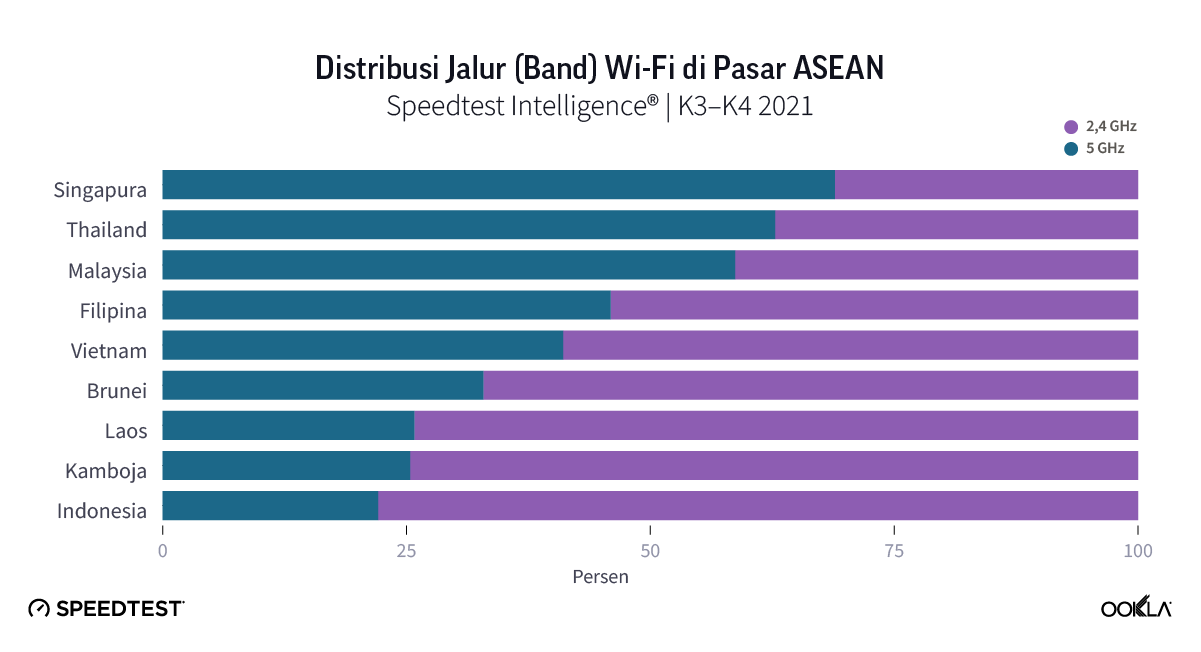
Looking at the distribution of fixed Wi-Fi Speedtest samples run over 2.4 GHz versus 5 GHz Wi-Fi connections, regional leaders Singapore and Thailand are joined by Malaysia as the only markets on this list with a majority of samples recorded using 5 GHz. Indonesia again came last with 5 GHz connections accounting for only 22% of samples.

wi-fi band distribution in ASEAN markets

Biznet leading in Indonesia nationwide fixed broadband download speed

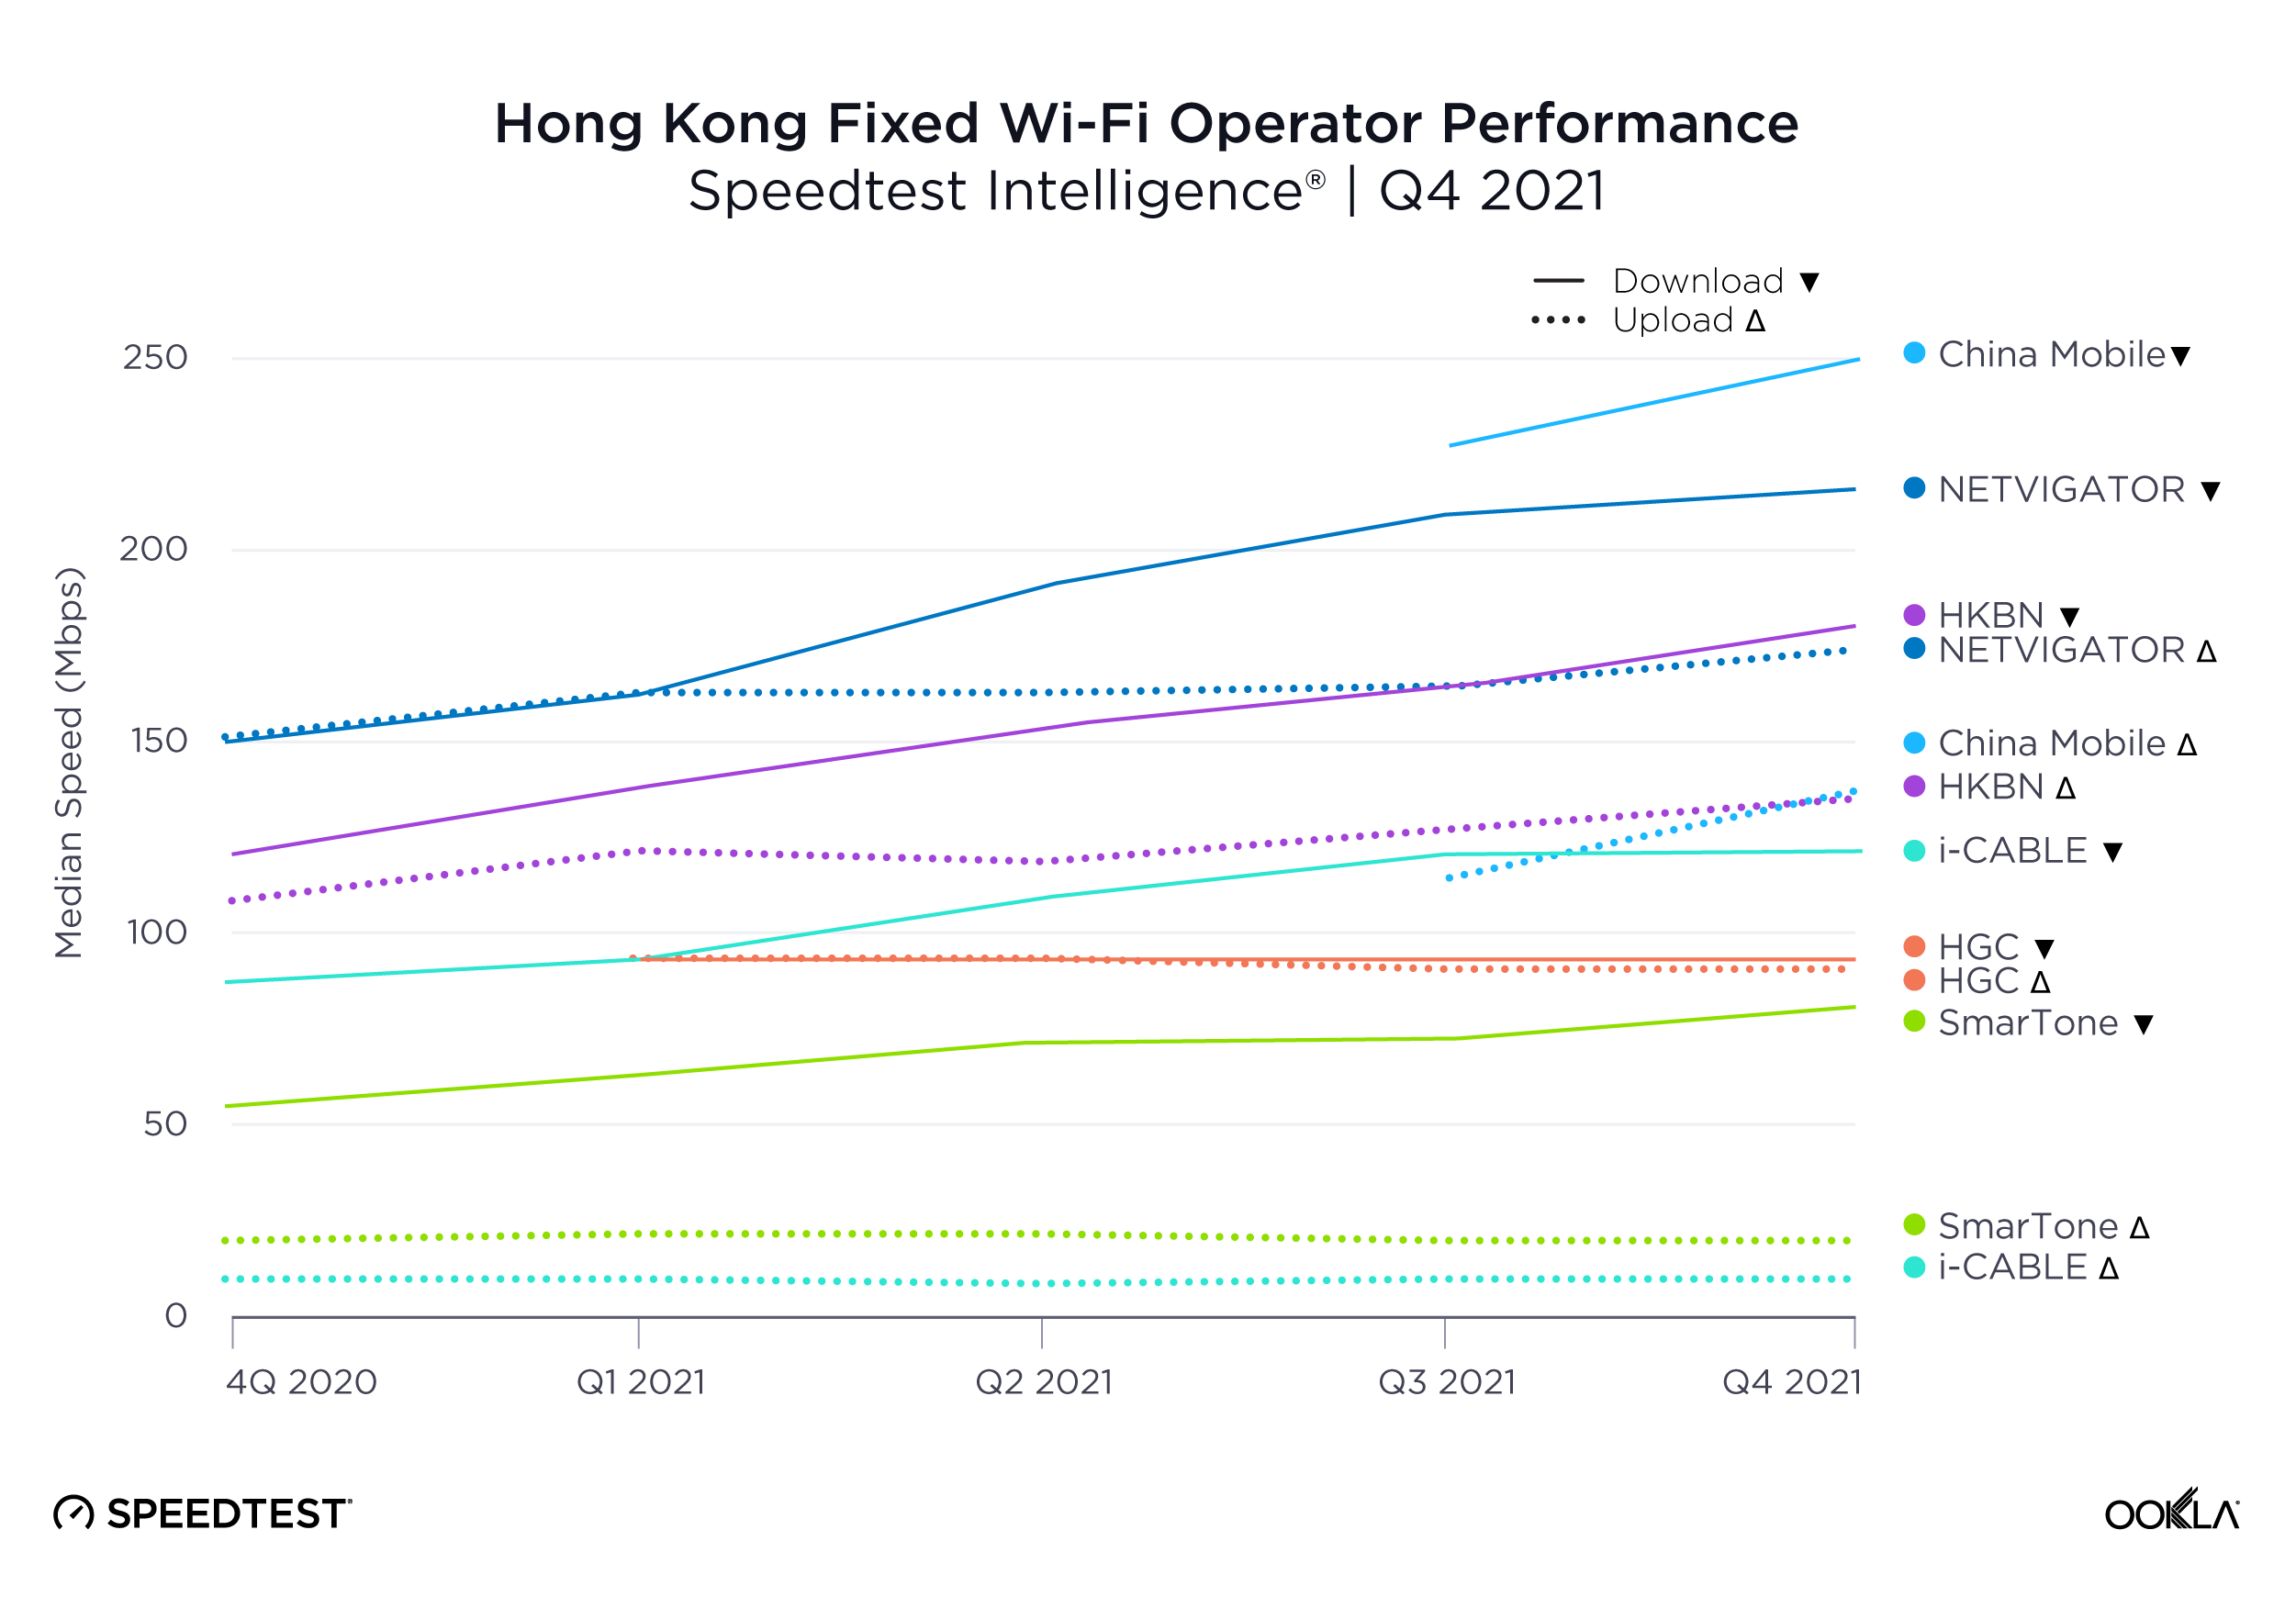
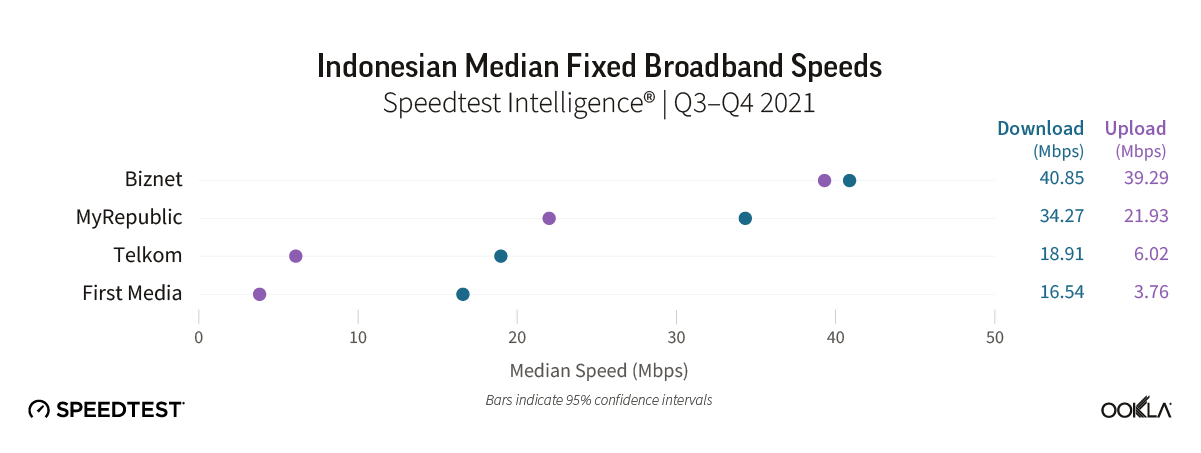
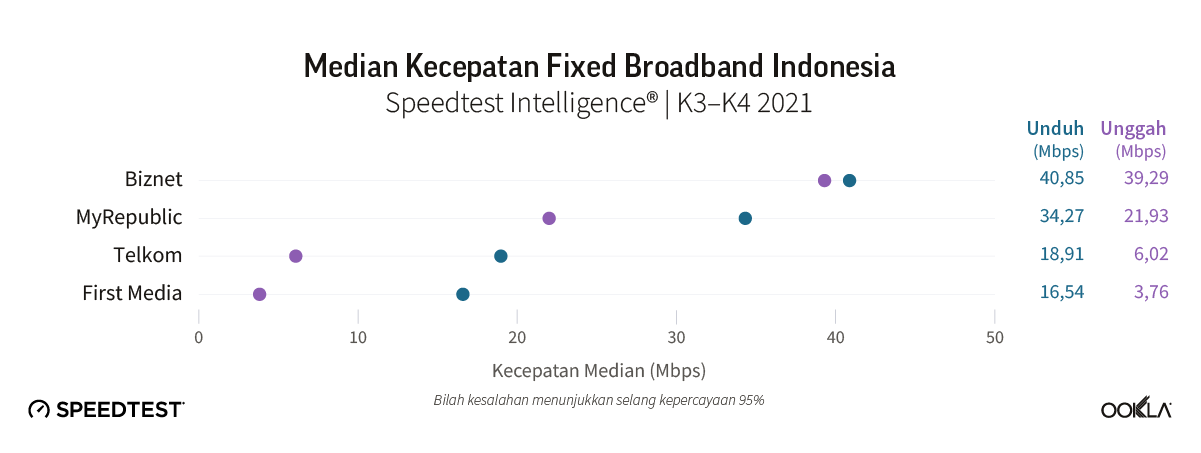
Our statistical methodology sets a minimum threshold of 3% of samples for an operator to be considered a top provider and part of our analysis. Using this methodology, Biznet was the fastest fixed broadband operator for both median download and upload speeds in Q3-Q4 2021, followed by My Republic. Biznet attained almost symmetrical results of 40.85 Mbps download and 39.29 Mbps upload, with My Republic achieving 34.27 Mbps download 21.93 Mbps upload. As of May 2022, Biznet’s fiber optic network extends to a total of more than 64,000 km, with its access network currently passing over 1.46 million households. In a bid to compete more aggressively with Telkom’s IndiHome service, Biznet launched an IPTV service in February 2020. The remaining two national ISPs, Telkom and First Media, lagged behind, achieving median download speeds of 18.91 Mbps and 16.54 Mbps respectively.

indonesian median fixed broadband speeds

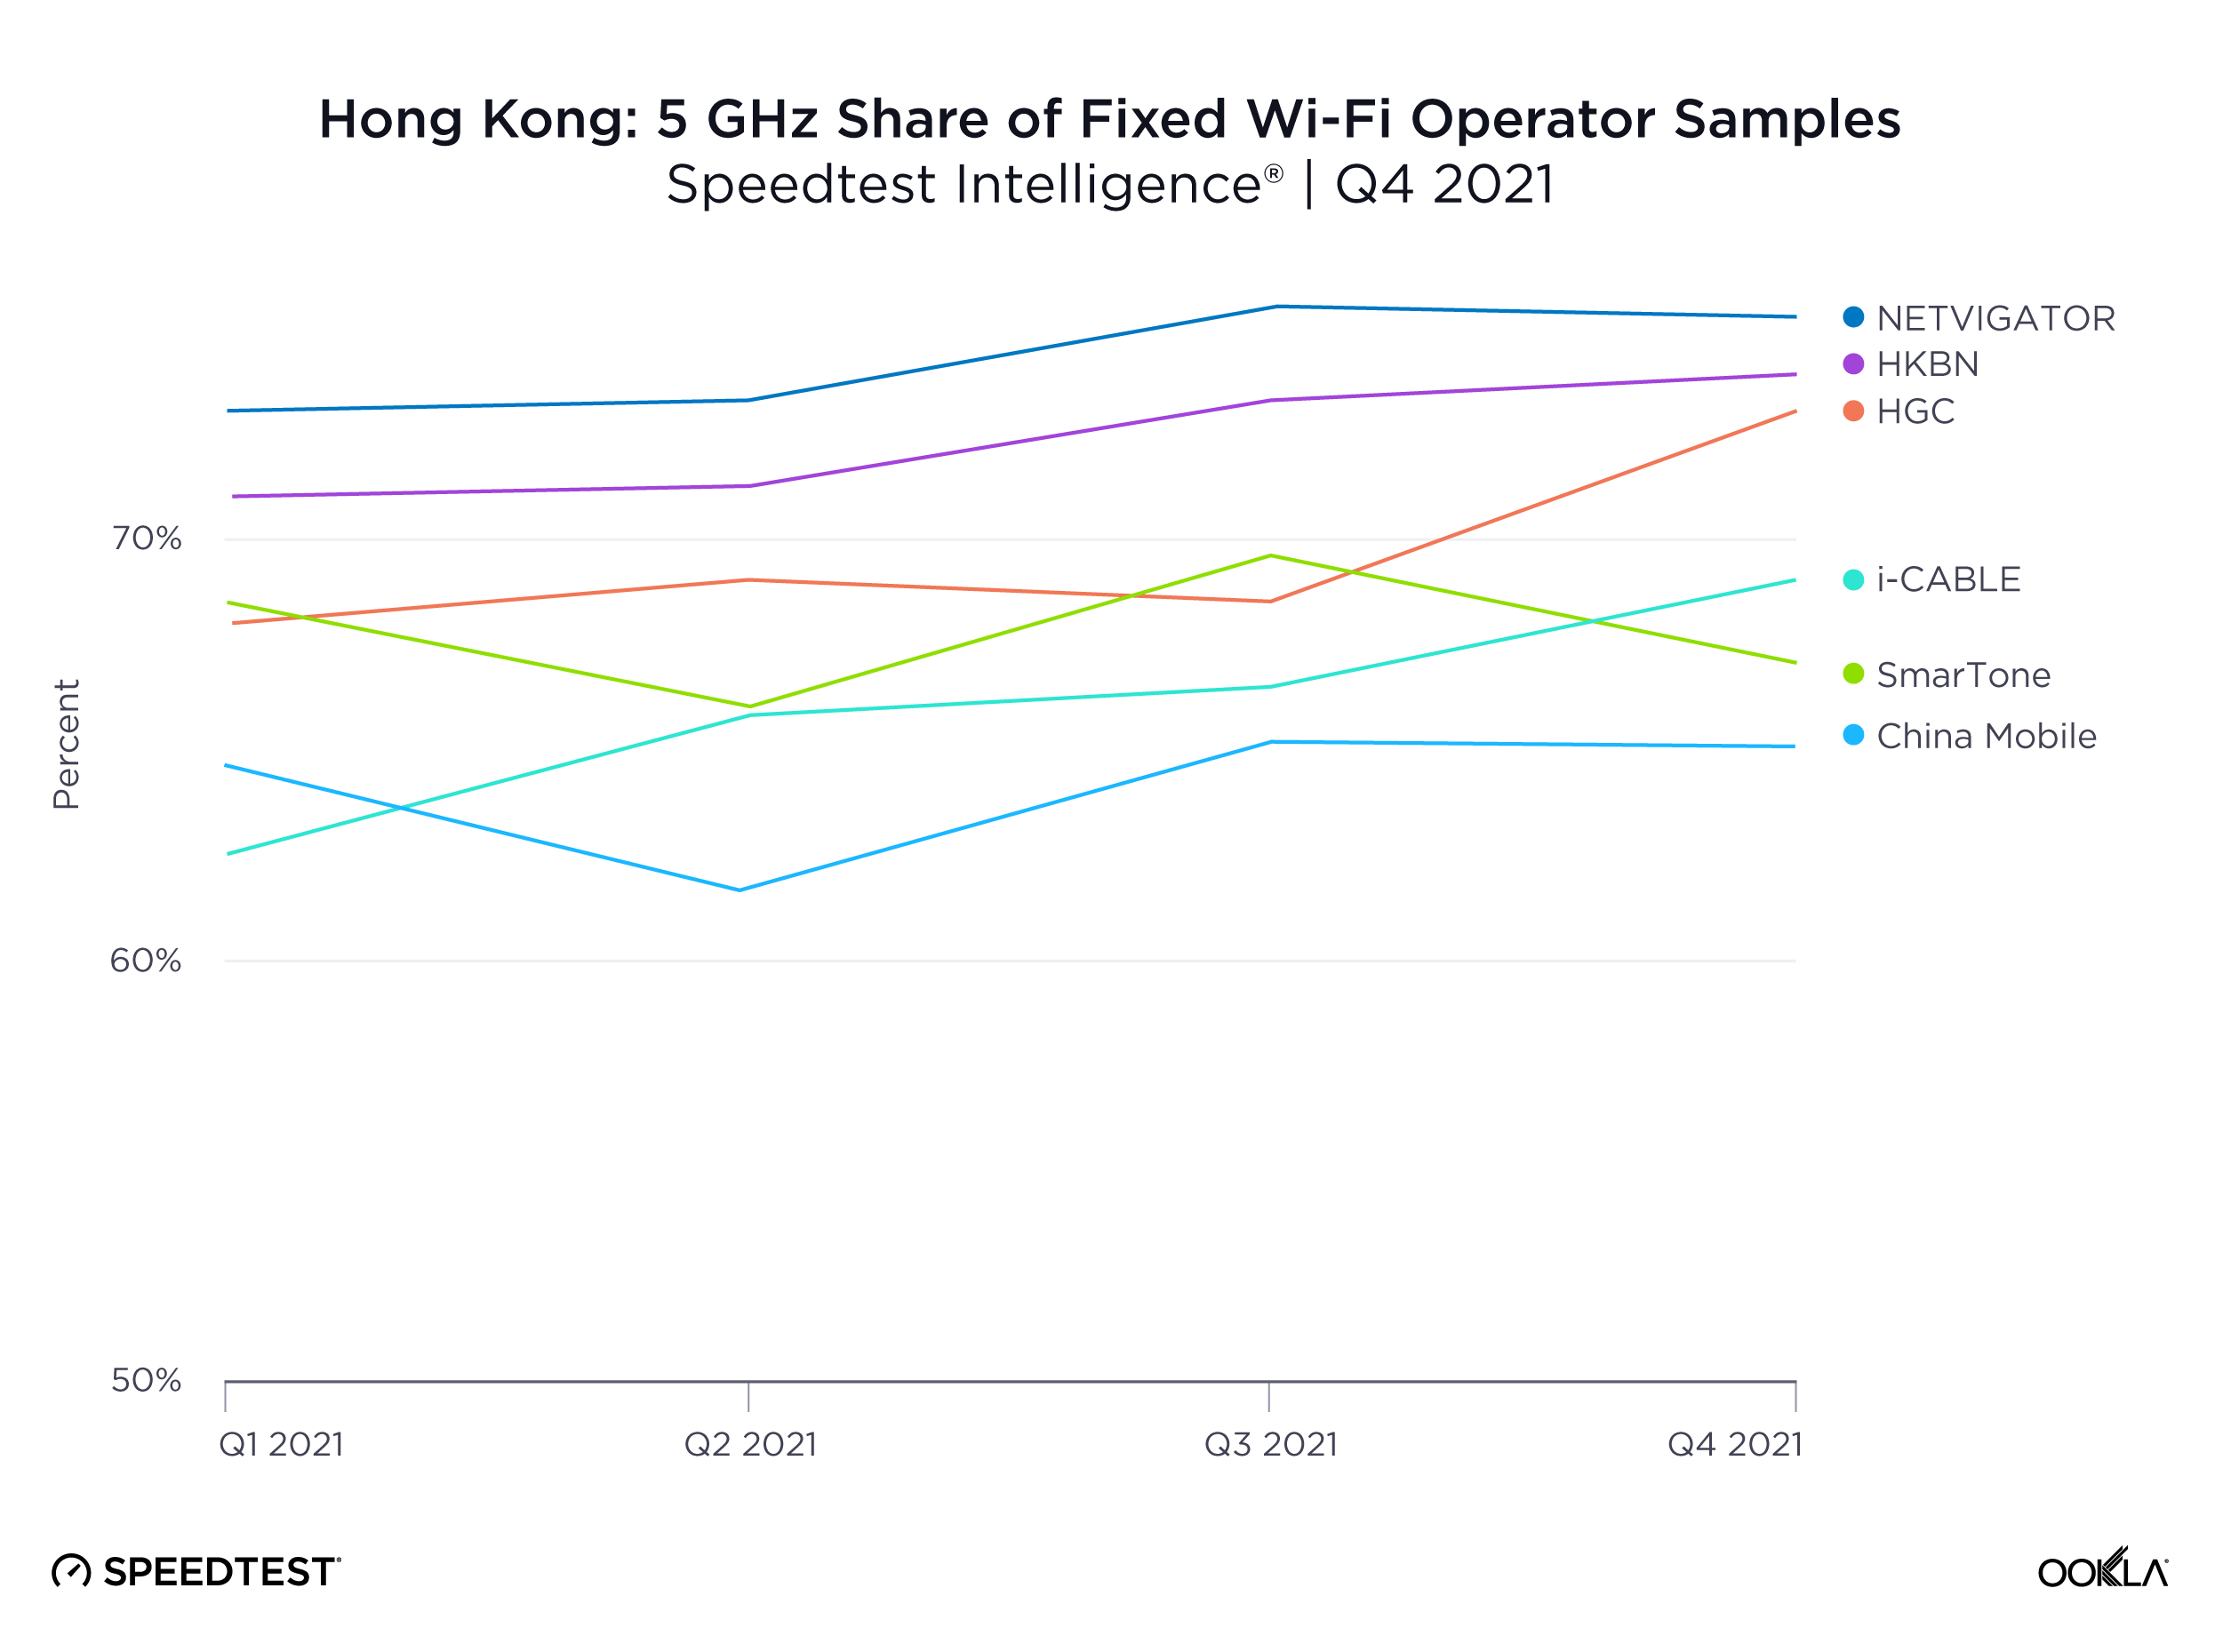
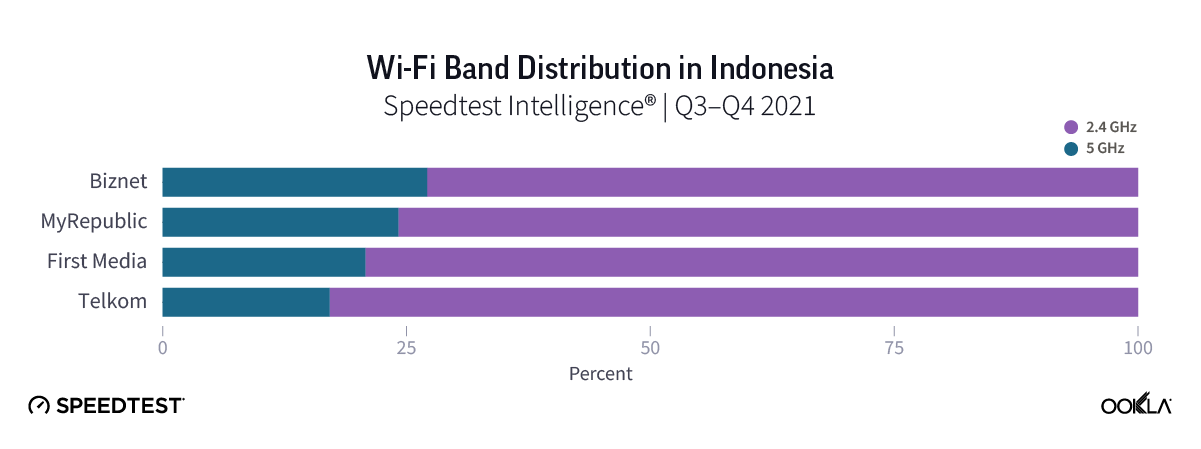
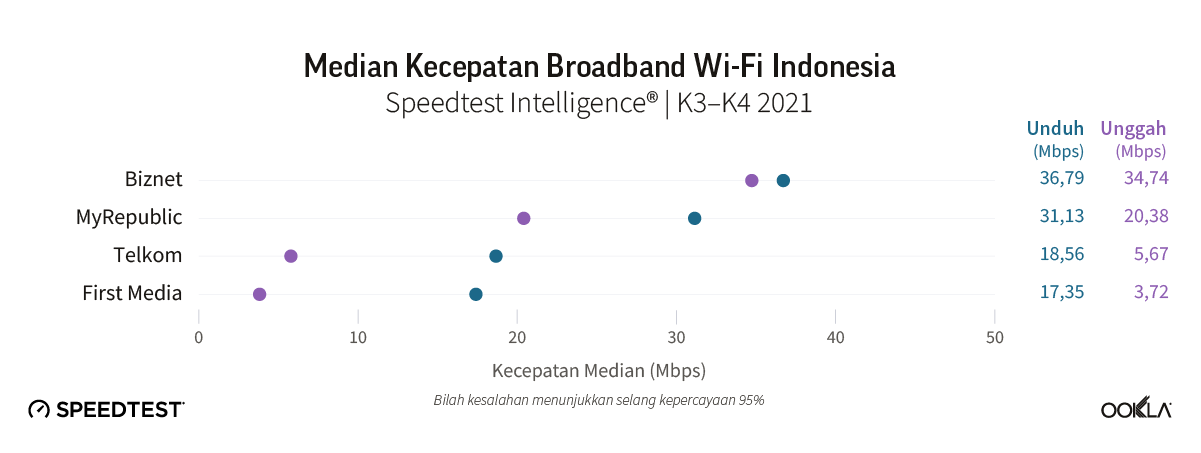
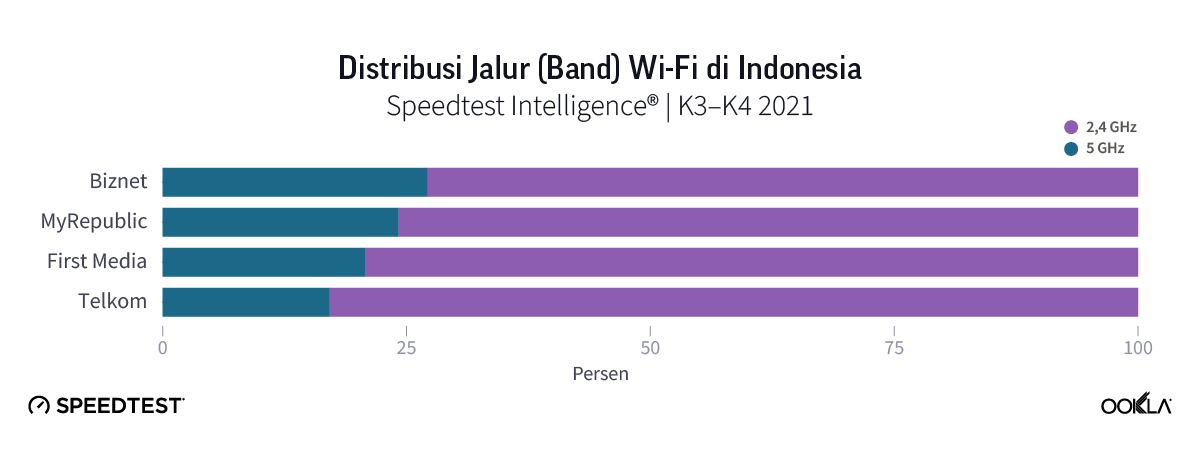
Looking at the split of samples from 2.4 GHz versus 5 GHz Wi-Fi connections shows some divergence between the market leaders, Biznet and MyRepublic and First Media and Telkom. However, all four fixed broadband operators recorded in excess of 70% of tests using 2.4 GHz Wi-Fi connections. If we look at Wi-Fi performance in Indonesia as a subset of total fixed broadband samples, then a similar picture emerges, with Biznet and My Republic outperforming both Telkom and First Media.

indonesian median wi-fi broadband speeds

wi-fi band distribution in indonesia

Consumer sentiment tracks network performance

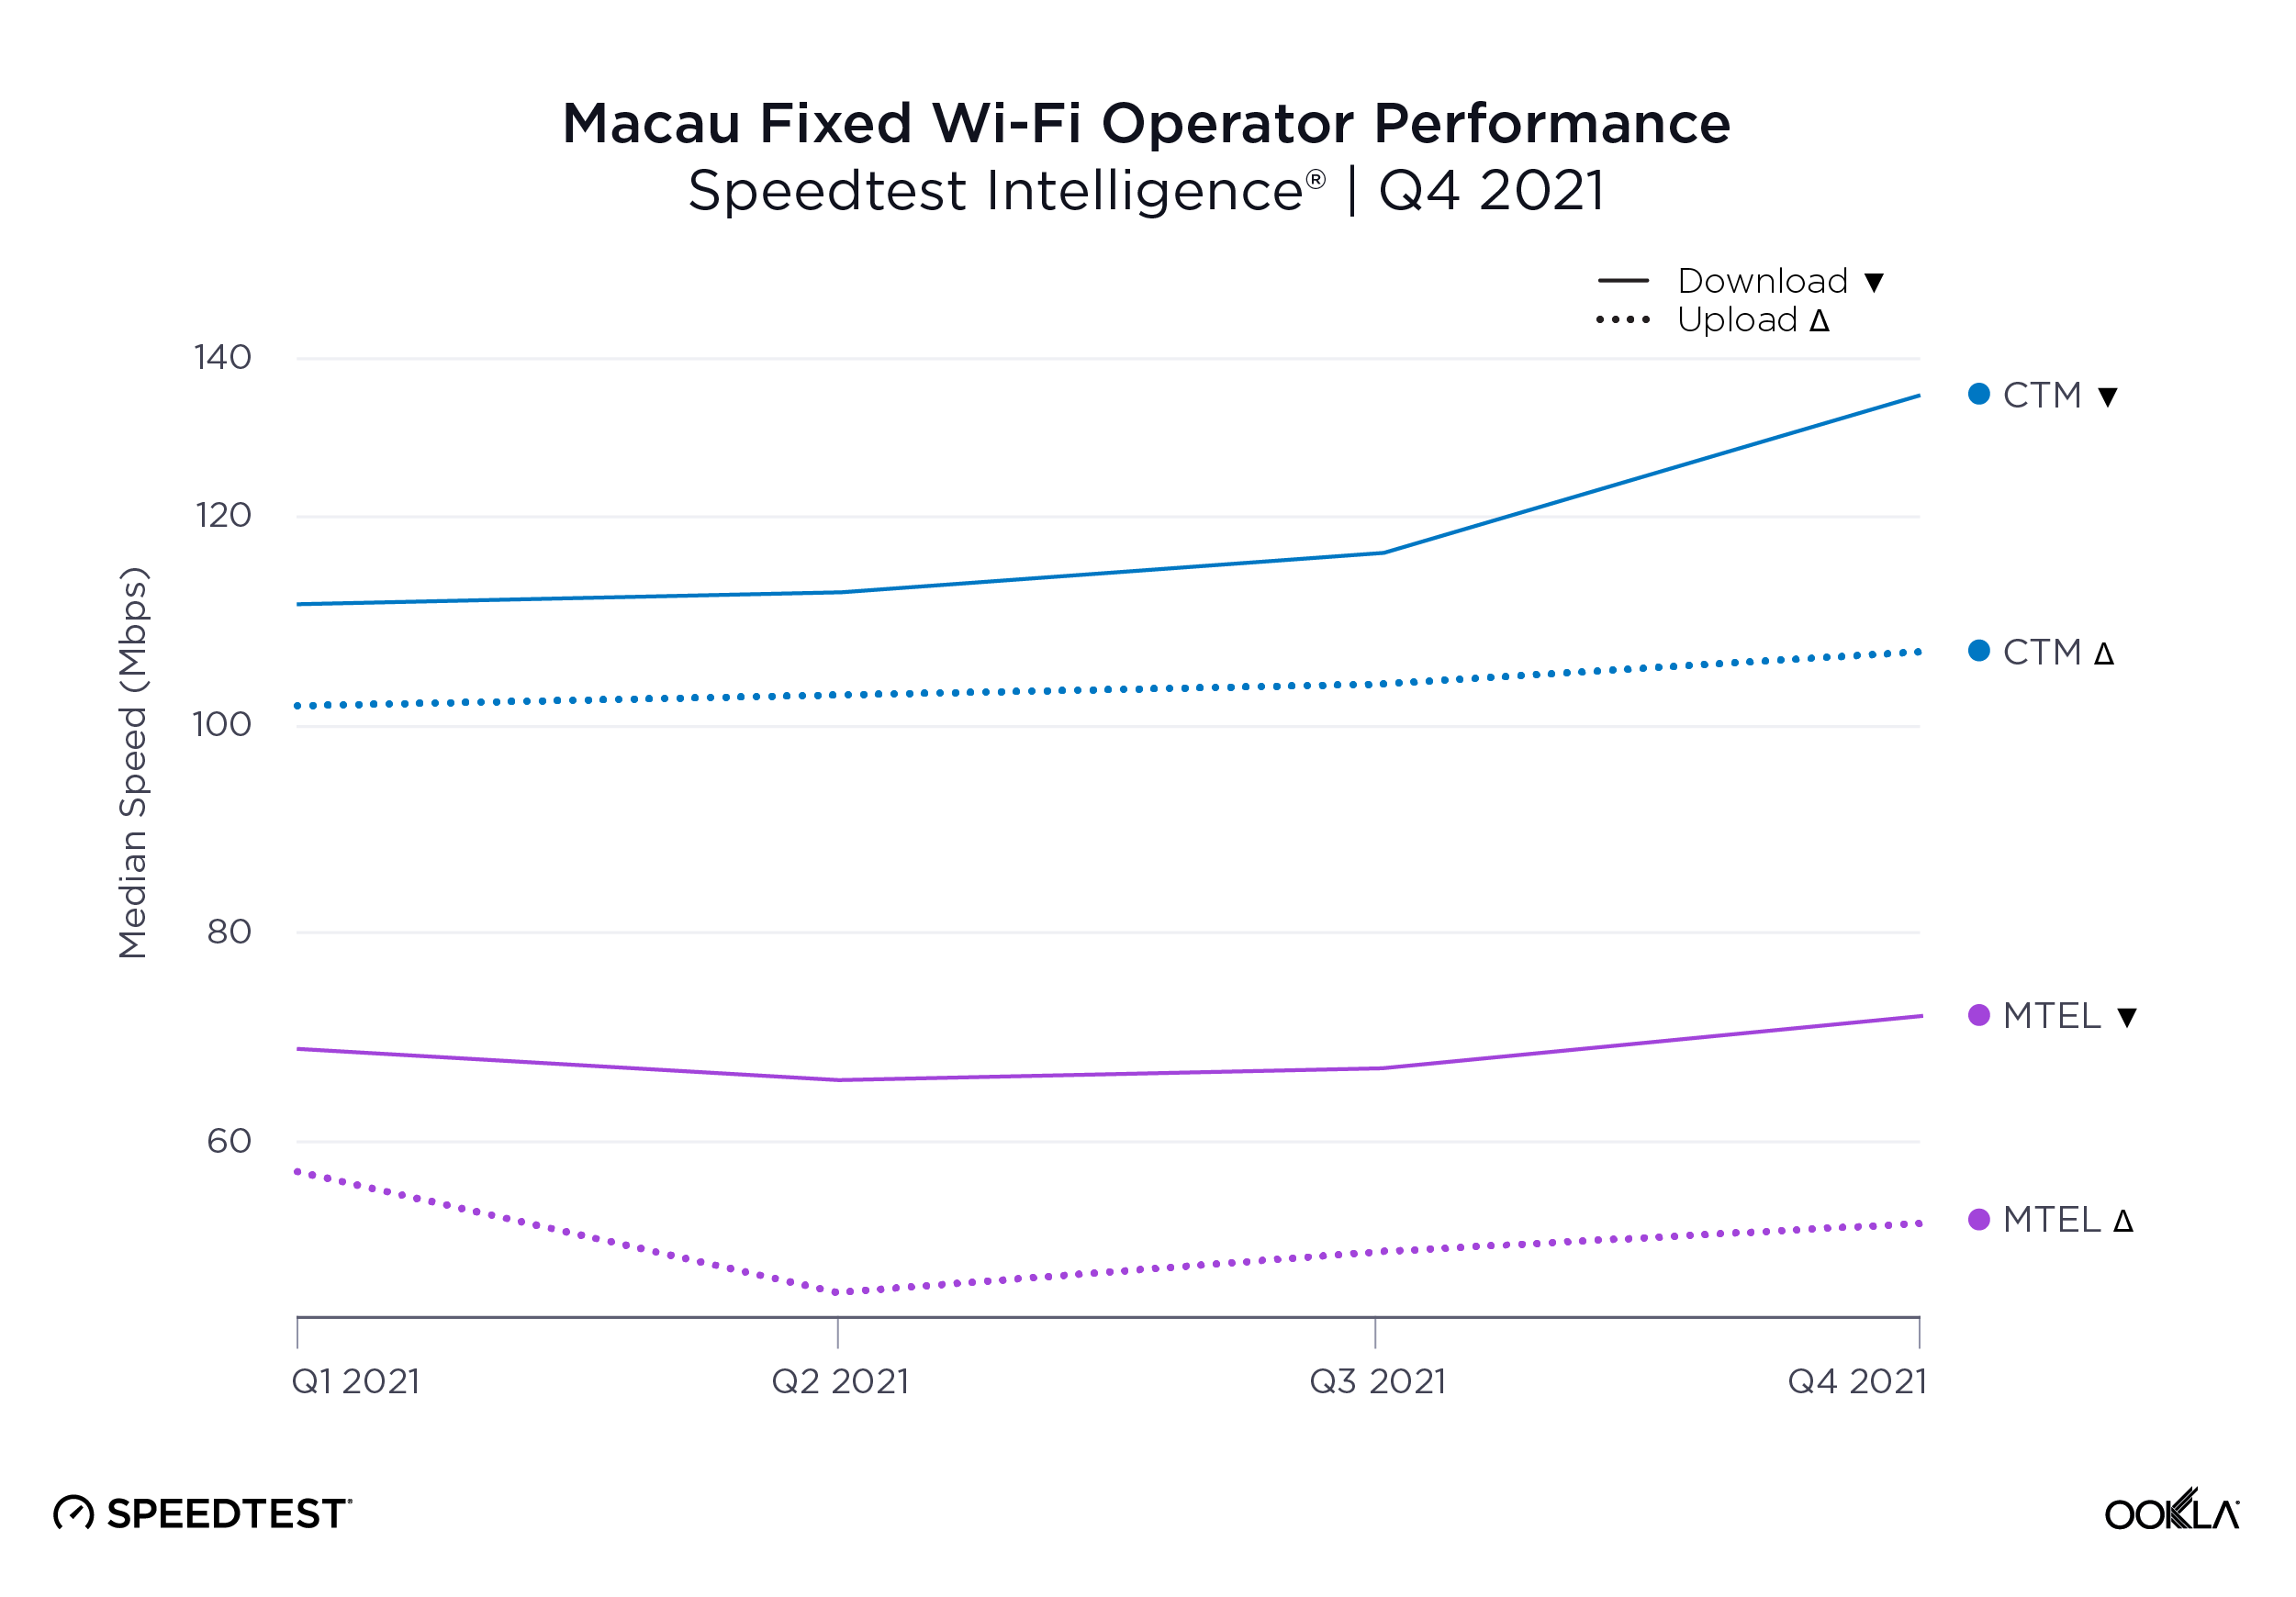
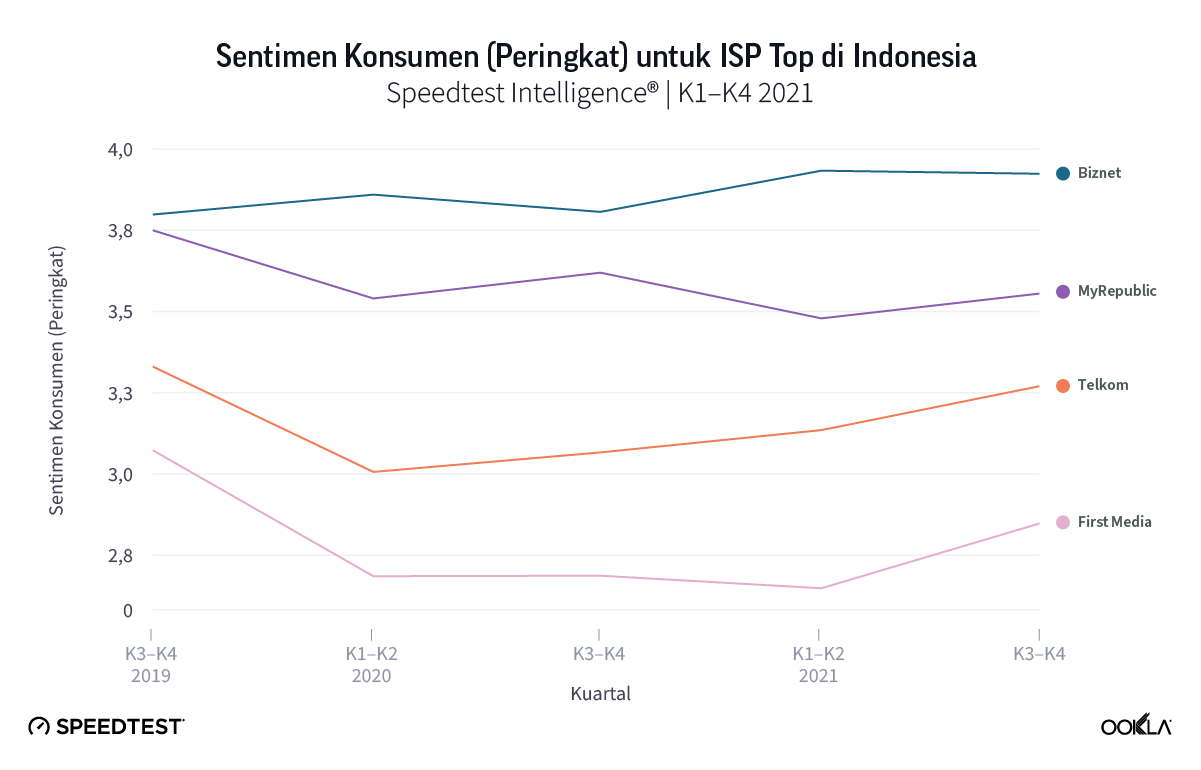
There is a clear positive correlation between fixed network performance and consumer sentiment within the Indonesian fixed broadband market. Based on the mean of Speedtest 5-Star Ratings in the market, Biznet was the top-rated fixed operator in Q3-Q4 2021 with a score of 3.9, while First Media placed last with a score of 2.8.

consumer sentiment (ranking) for top isps in indonesia

Regional disparities in fixed broadband download speeds over Wi-Fi persist

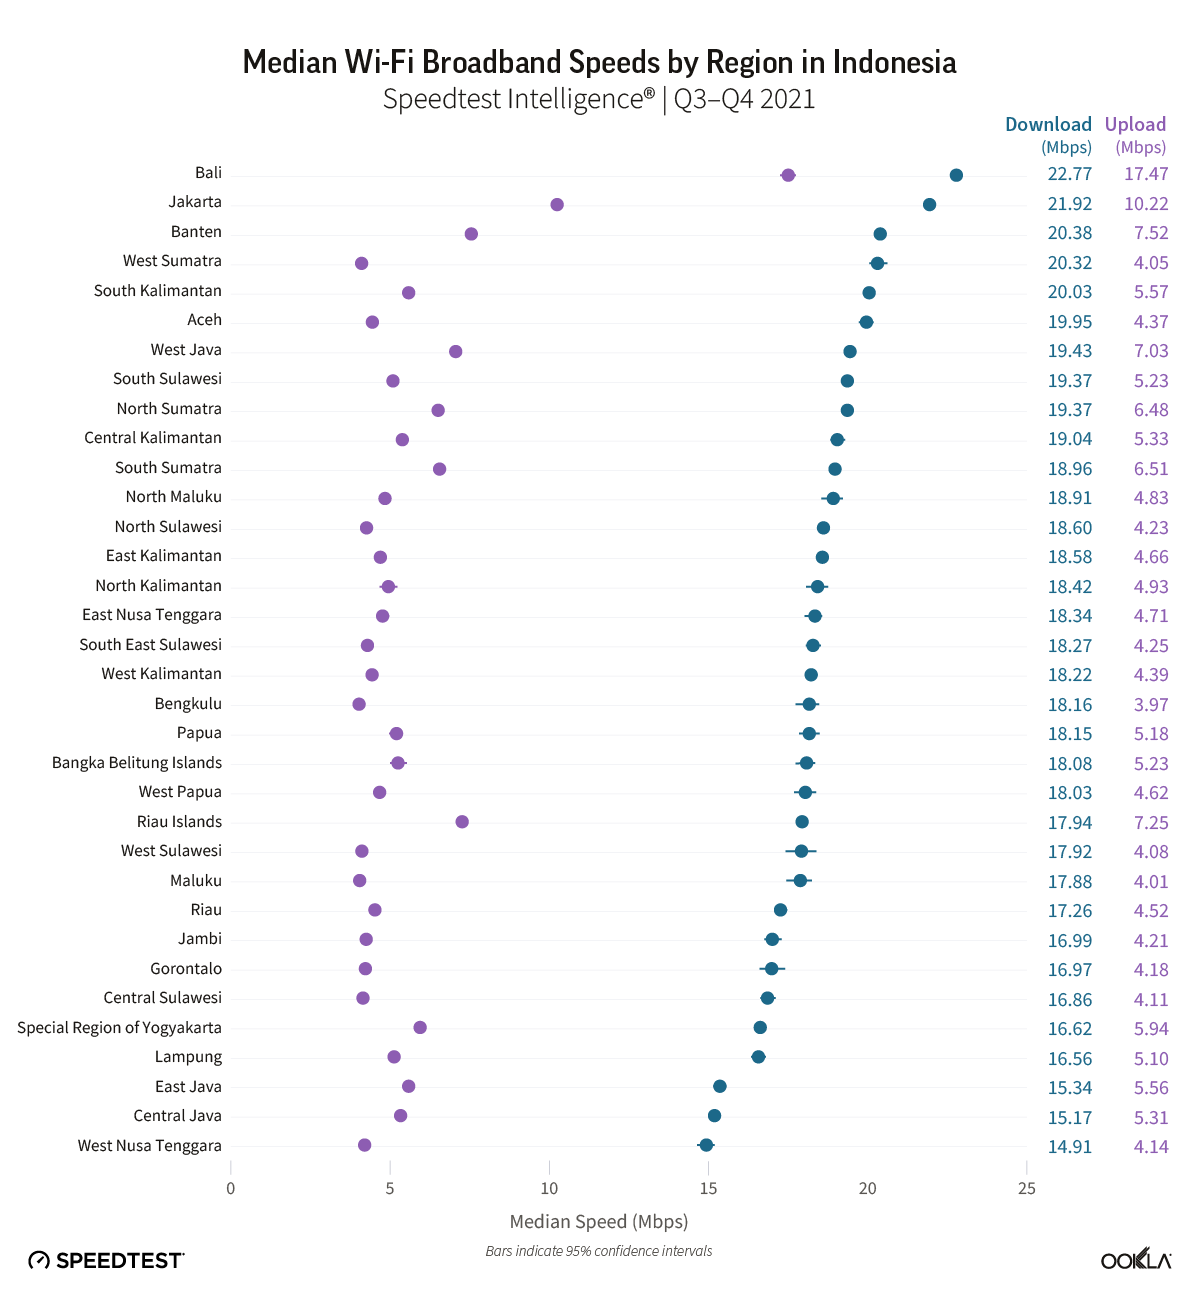
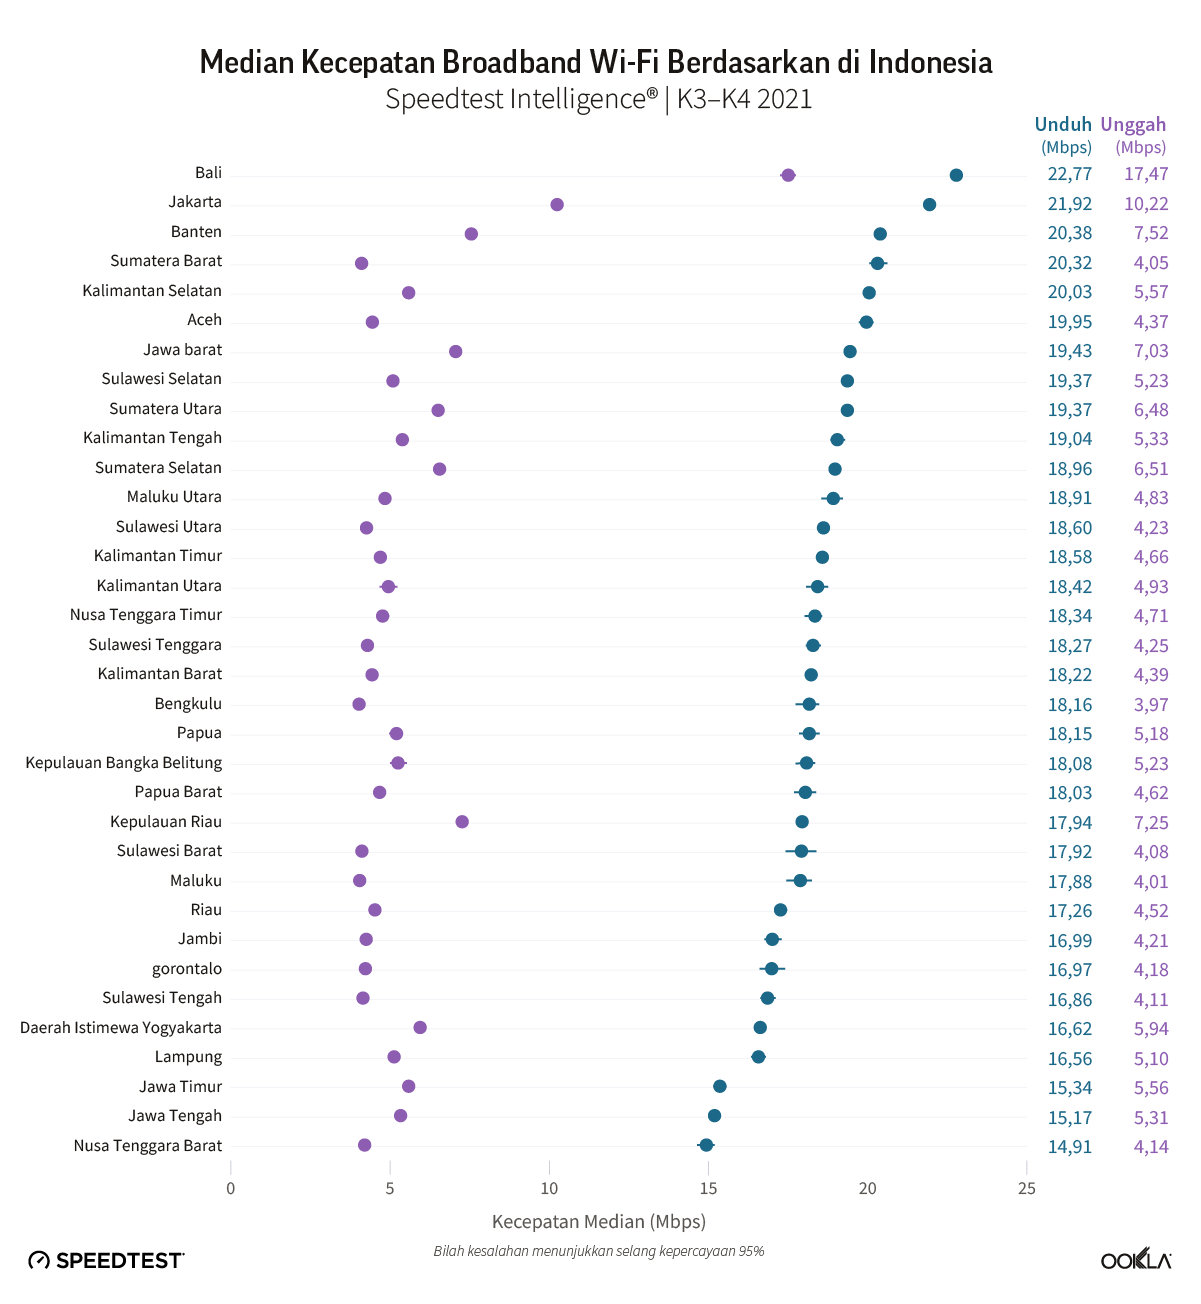
Despite the Indonesian Broadband Plan’s goal to improve speeds across Indonesia, some regional disparities in median download and upload speeds persist. For a broad section of Indonesia’s regions, download speeds show little variation, ranging between 16 Mbps and 20 Mbps. There are however outliers. Tourist hotspot Bali, which has also emerged as a popular destination for digital nomad workers,  and the Indonesian capital Jakarta occupied the top two positions nationally during Q3-Q4 2021, with download speeds of 22.77 Mbps and 21.92 Mbps respectively. 

At the other end of the scale, two of the country’s most populous regions, East and Central Java, scored some of the lowest median download speeds at 15.34 Mbps and 15.17 Mbps, respectively. Upload speeds across the market show much more variation, ranging from a high of 17.47 Mbps in Bali, to a low of 3.97 Mbps in Bengkulu.

median wi-fi broadband speeds by region in indonesia

Biznet leading in Jakarta Region for Wi-Fi download speeds

Biznet was the fastest fixed provider in the Indonesian capital Jakarta during Q3-Q4 2021, recording near symmetrical speeds for median download (42.59 Mbps) and upload (41.22 Mbps). It was followed by MyRepublic, with a download speed of 32.47 Mbps and upload of 25.46 Mbps, and CBN which also achieved symmetrical speeds at about 28 Mbps. Wi-Fi performance for the remaining three providers, First Media, Telkom, and MNC Play lagged behind, with First Media and Telkom recording upload speeds well below the competition, both below 10 Mbps.

median wi-fi broadband speeds in jakarta

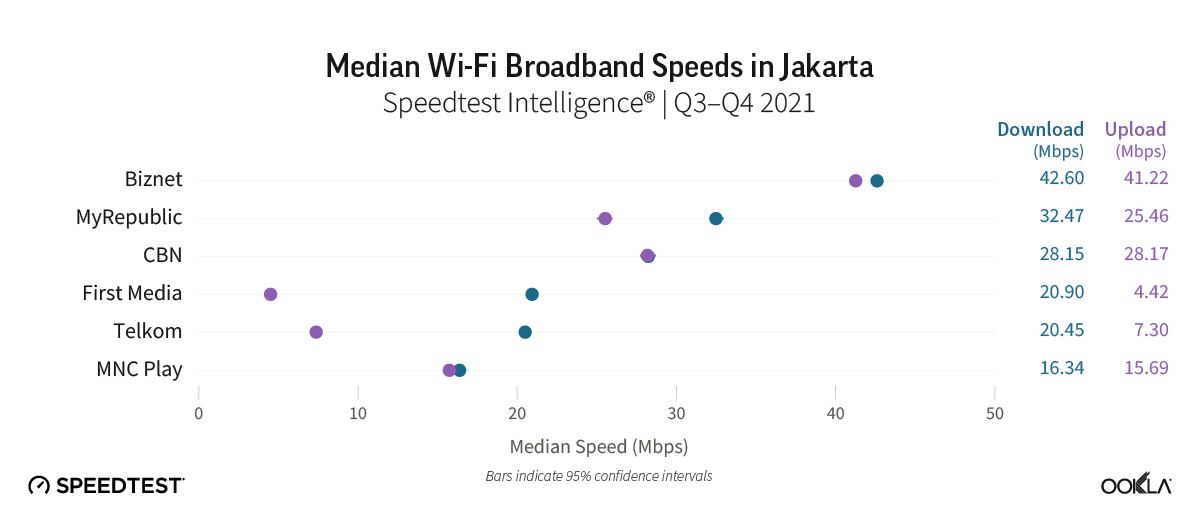
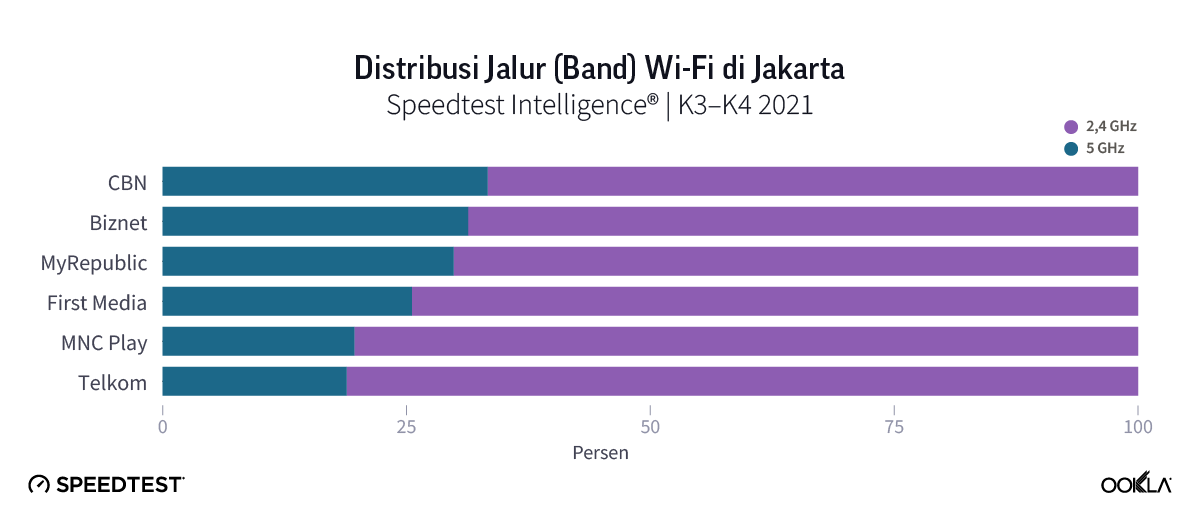
One in three Speedtest samples for provider CBN utilized 5 GHz Wi-Fi, the largest share of any operator in Jakarta. Biznet, MyRepublic and First Media followed, while Telkom and MNC Play showed the lowest share of samples using 5 GHz Wi-Fi.

wi-fi band distribution in jakarta

MyRepublic leading in Banten Region fixed broadband download speed over Wi-Fi

In Banten, the westernmost province of the island of Java, Biznet was the fastest provider over Wi-Fi. Biznet has extended its reach in this region, and obtained sufficient samples (in excess of 3% of the market) to be included as a top provider in our analysis of Banten. Biznet recorded a median download speed of 42.73 Mbps and upload of 41.32 Mbps.

median wi-fi broadband speeds in banten

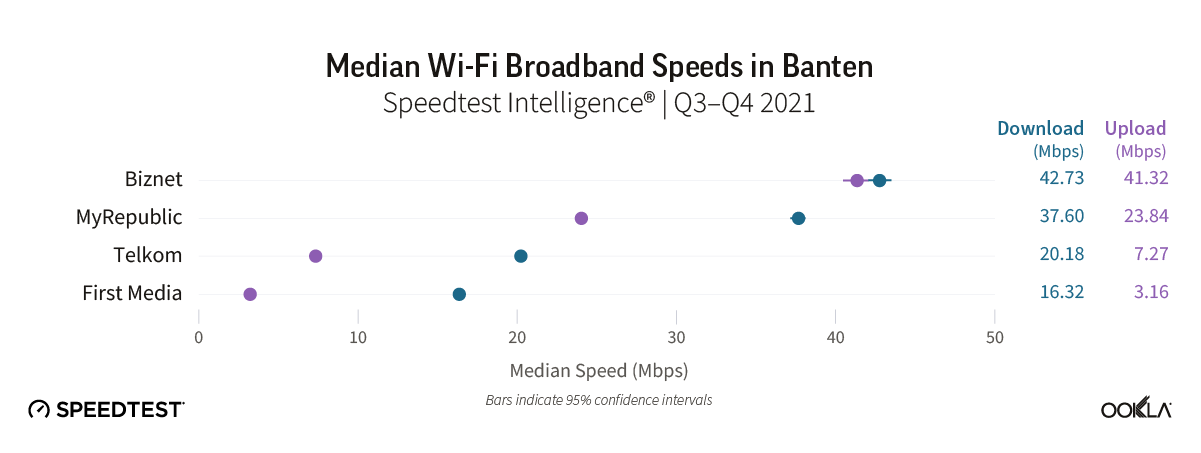
Biznet also led the region for use of 5 GHz Wi-Fi, at 29% of samples. MyRepublic followed with a download speed of 37.60 Mbps and upload of 23.84 Mbps, setting it apart from both Telkom and First Media.

wi-fi band distribution in banten

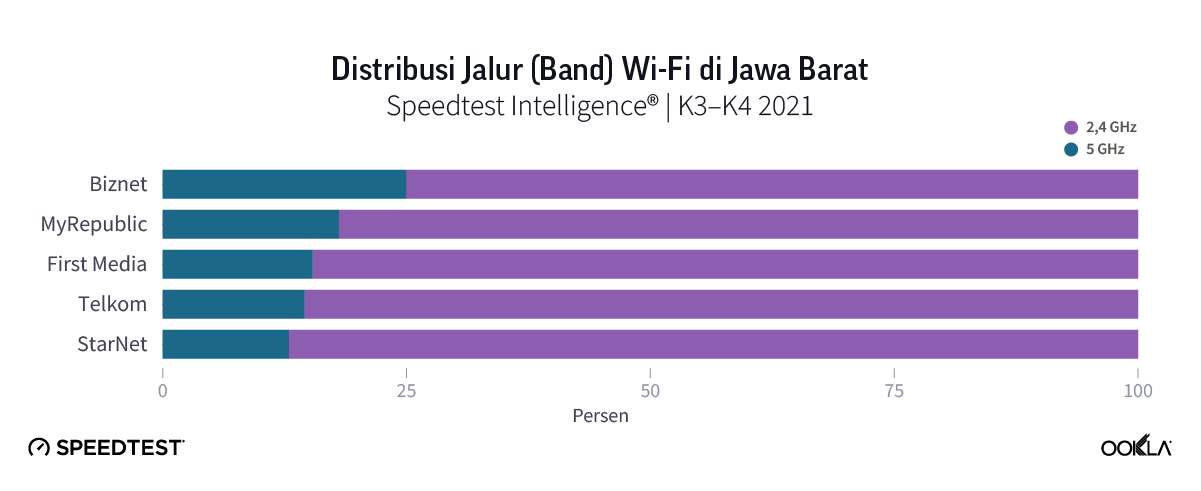
Biznet leading in West Java Region fixed broadband download speed over Wi-Fi

As the most populous region in Indonesia, West Java saw more providers meet the minimum statistical threshold to be included in our analysis. Biznet was once again the fastest provider over Wi-Fi, albeit with slower speeds than in its other coverage regions, at 36.18 Mbps for median download and 35.76 Mbps for upload speed. MyRepublic was the second placed operator for download speeds, recording 29.57 Mbps, followed by Telkom, StarNet, and First Media.

median wi-fi broadband speeds in west java

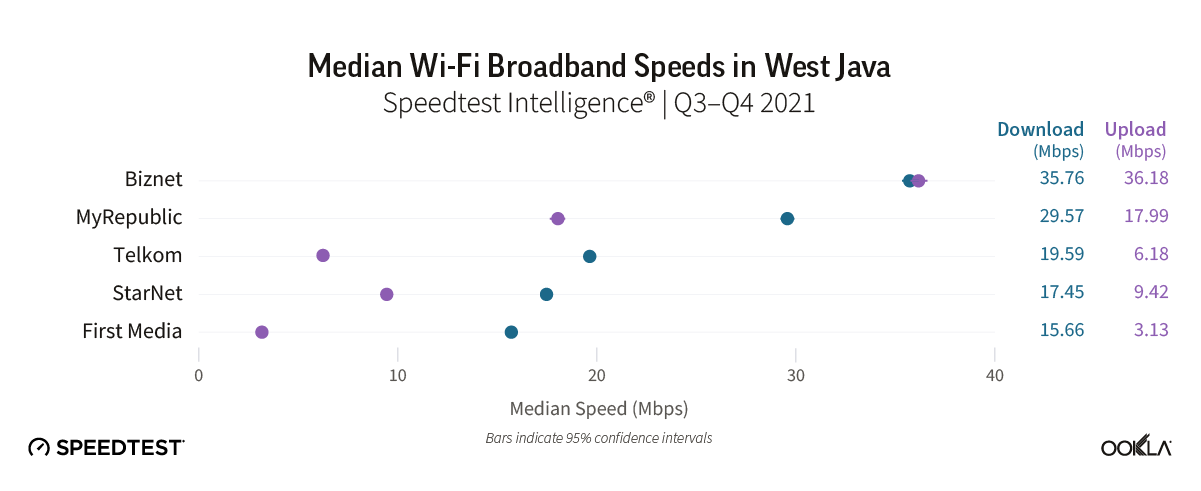
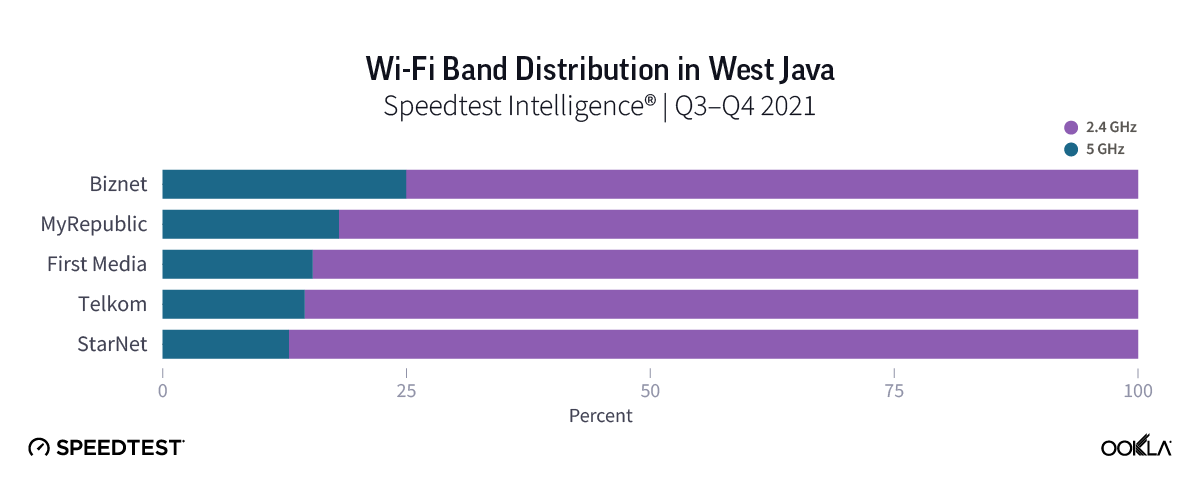
Providers in West Java generally recorded slower speeds than in other regions, and the distribution of Wi-Fi samples between 2.4 GHz and 5 GHz also skewed further towards 2.4 GHz than elsewhere, with First Media, Telkom, and StarNet all recording approximately 85% of samples over 2.4 GHz.

wi-fi band distribution in west java

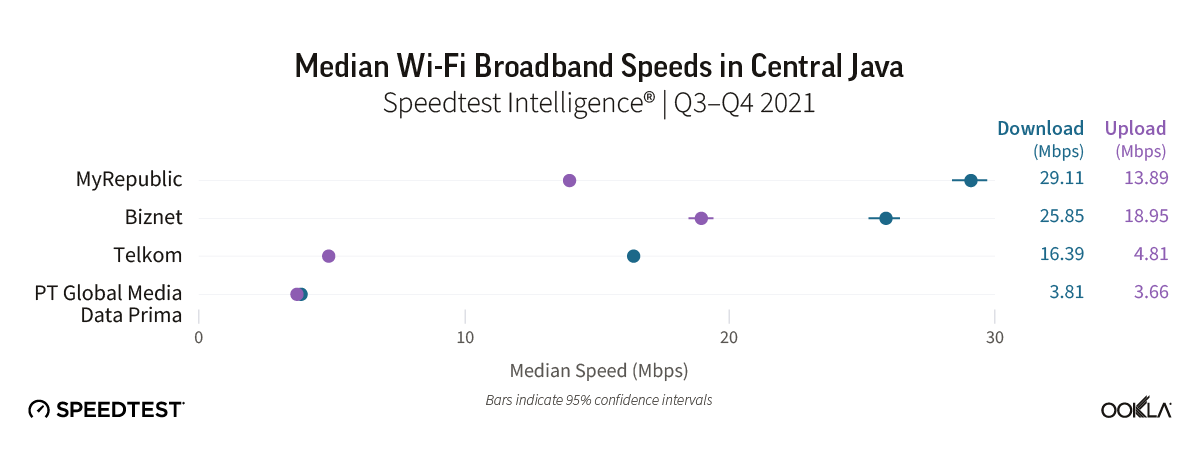
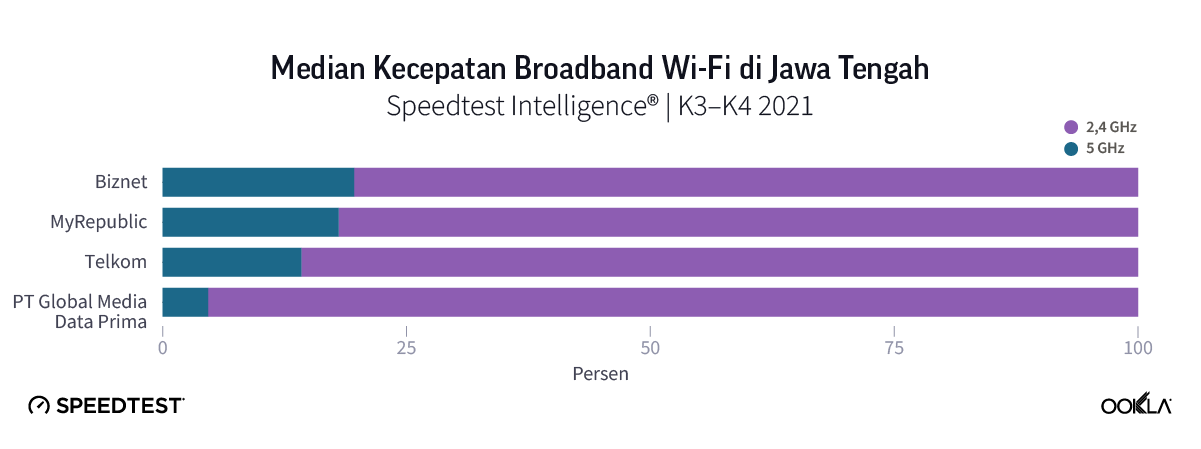
MyRepublic leading in Central Java Region Wi-Fi fixed broadband download speed

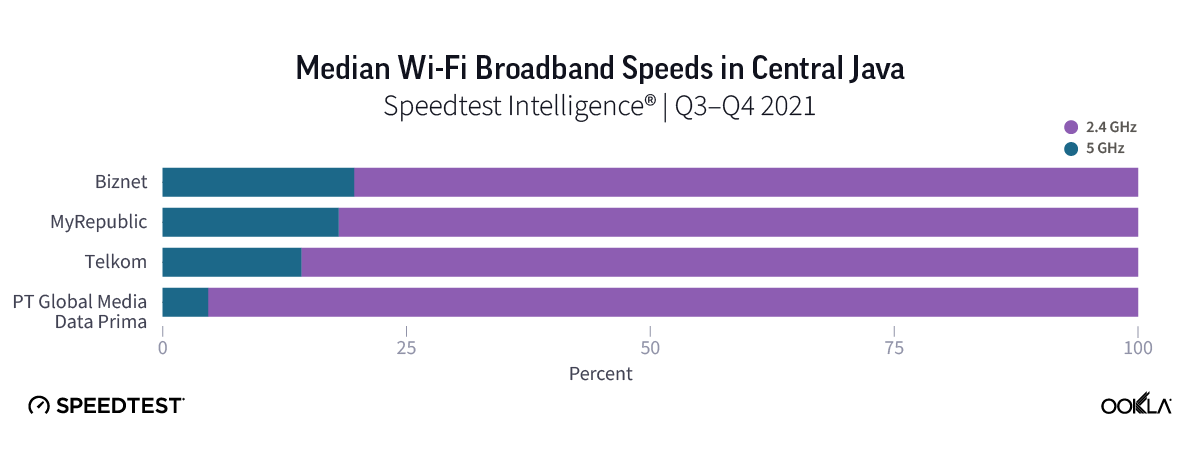
In Central Java, in contrast to most other Indonesian regions, MyRepublic outperformed Biznet on median Wi-Fi download speeds, recording 29.11 Mbps during Q3-Q4 2021. Biznet followed with 25.85 Mbps, but also recorded the fastest upload speed of 18.95 Mbps. Telkom followed with a download speed of 16.39 Mbps, while PT Global Media Data Prima lagged behind the rest of the region with a median download speed of 3.81 Mbps. It also recorded the lowest proportion of Wi-Fi samples using 5 GHz, at only 5%.

median wi-fi broadband speeds in central java

median wi-fi broadband speeds in central java

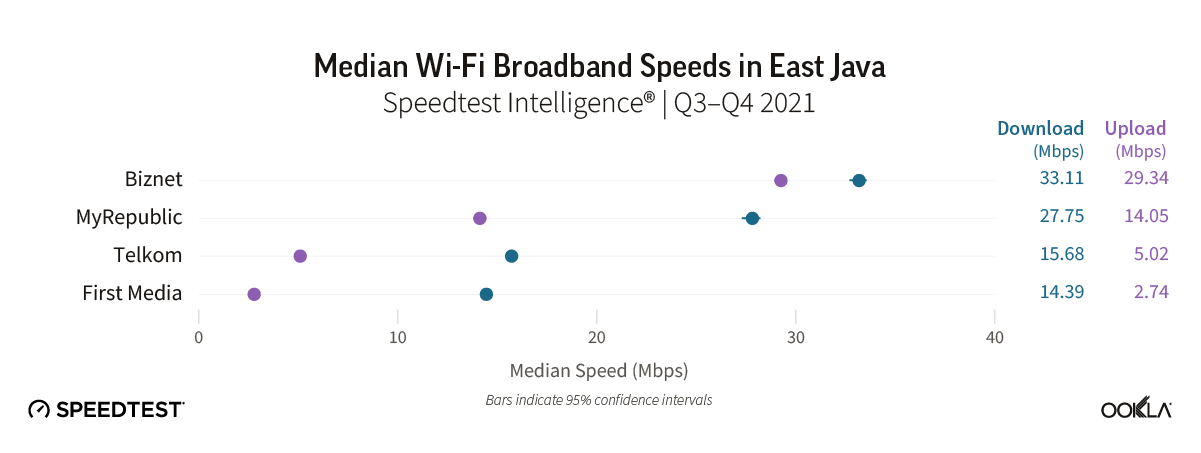
Biznet leading in East Java Region for Wi-Fi fixed broadband download speed

East Java saw a return to form for Biznet as the fastest performing provider over Wi-Fi, with a median download speed of 33.11 Mbps and upload speed 29.34 Mbps. It was closely followed in terms of download speeds by MyRepublic with 27.75 Mbps. Telkom and First Media came next with download speeds of 15.68 Mbps and 14.39 Mbps respectively, while their upload speeds lagged far behind their rivals.

median wi-fi broadband speeds in east java

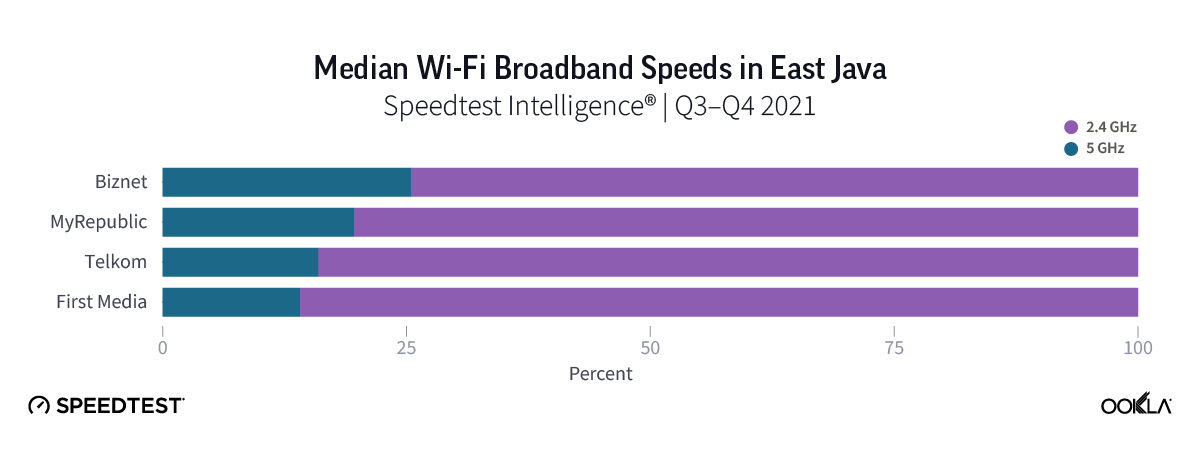
Wi-Fi distribution showed a similar story, with Telkom and First Media scoring the lowest share of samples over 5 GHz, at 16% and 14%, respectively.

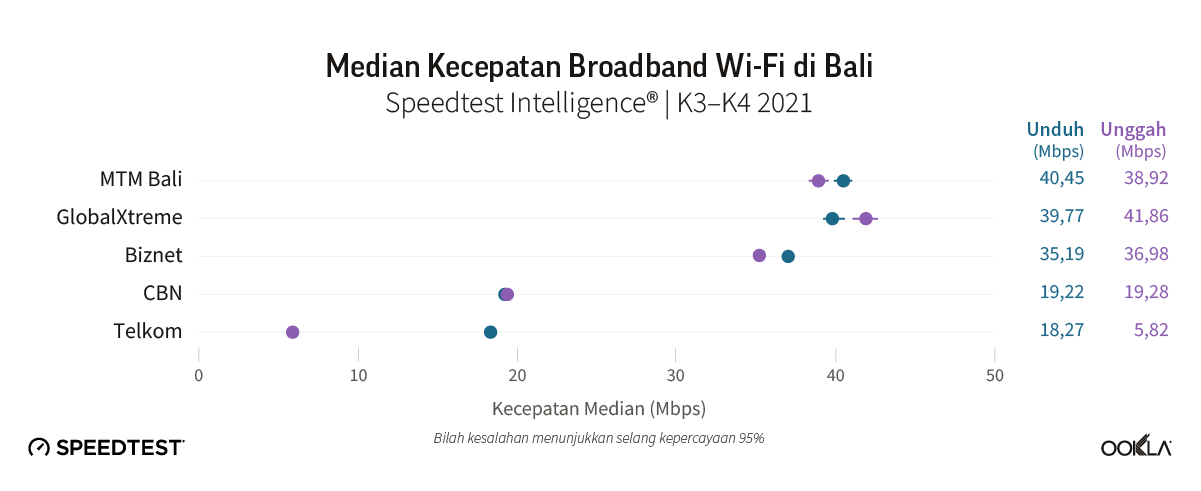
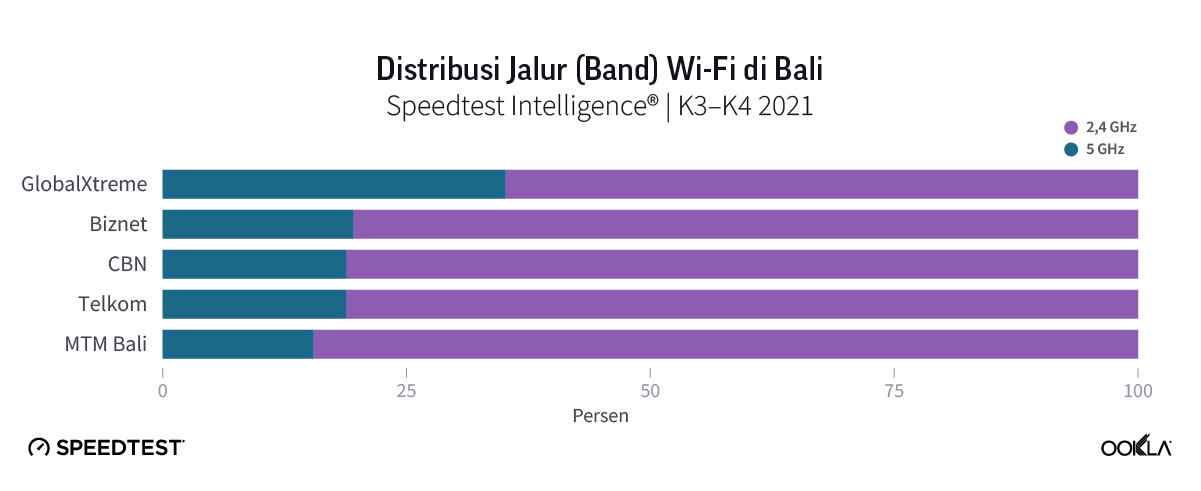
MTM Bali leading in Bali Region fixed broadband download speed over Wi-Fi

Bali was the most competitive region in this analysis in terms of top speeds among providers, with three providers all recording similar median download and upload speeds of close to 40 Mbps. We could not declare a statistical winner based on median Wi-Fi download speeds, with both MTM Bali and GlobalXtreme’s download speeds in the same range, although GlobalXtreme’s upload speeds were demonstrably faster.

median wi-fi broadband speeds in bali

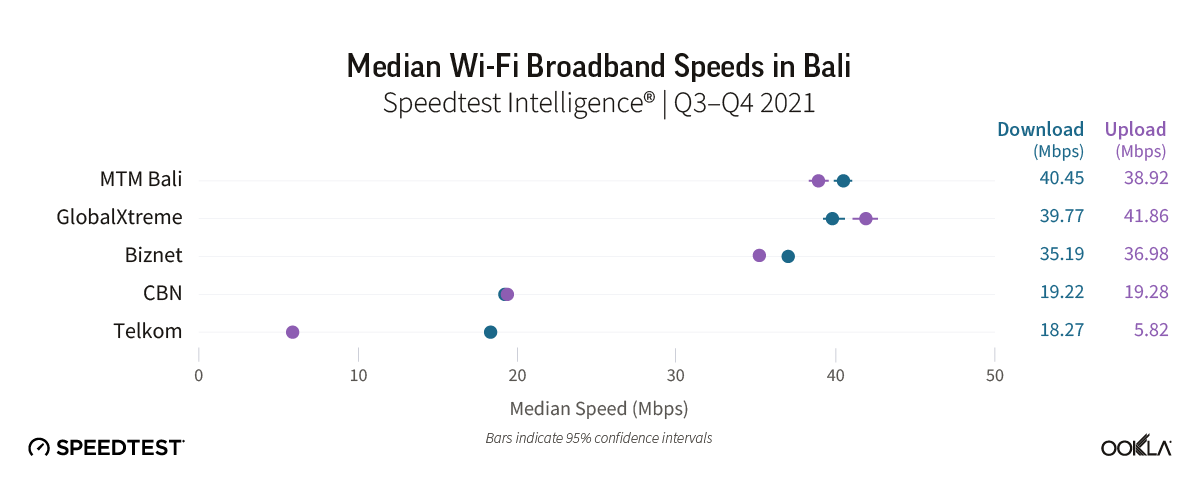
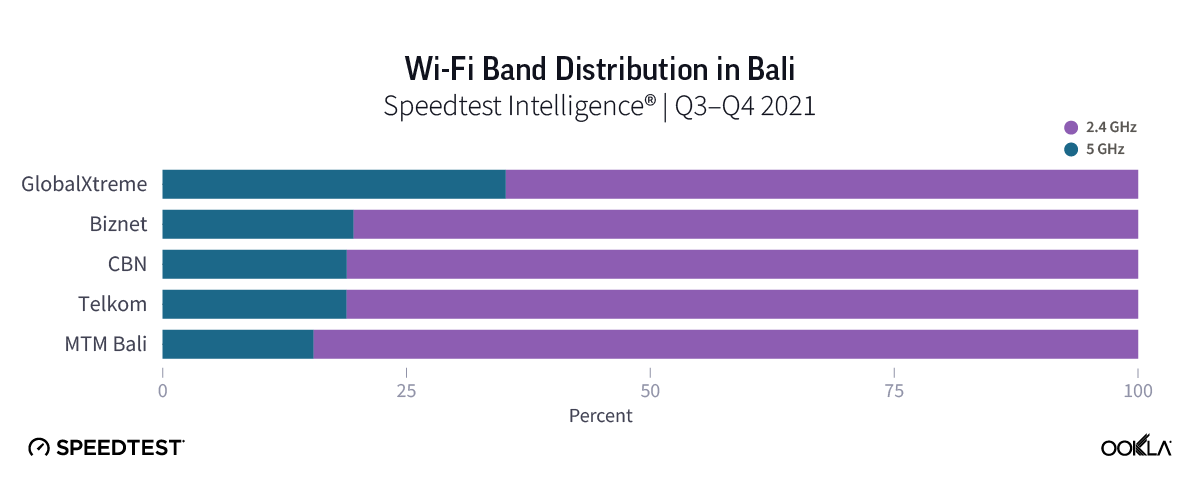
GlobalXtreme also recorded the highest share of 5 GHz Wi-Fi samples, at 35% of total, far outpacing the competition, with the remaining operators achieving 20% or less.

wi-fi band distribution in Bali

Indonesian fixed broadband outlook

Fixed broadband penetration among Indonesian households remains low, at below 20% according to most estimates. Mobile internet remains the dominant access technology in the market, but the move to working and studying at home as a result of the COVID-19 pandemic has driven more households to subscribe to fixed broadband services. Competition is ramping up in the market, with smaller players such as Biznet and MyRepublic actively rolling out networks and targeting gains from Telkom, which still maintains a majority market share of broadband connections. The recent news that Axiata Group and its Indonesian subsidiary XL Axiata have signed a non-binding agreement to acquire a majority share of Indonesian broadband provider LinkNet is further evidence that providers see strong opportunity for growth. We expect this will help accelerate network rollout and the provision of more sophisticated bundled broadband services in the market, which in turn will help drive up Indonesian fixed broadband speeds, particularly in the densely populated regions covered in this report.


Performa Jaringan Fixed Broadband di Indonesia Semakin Tertinggal dari Rekan-rekannya di Satu Kawasan

Pesan utama:

  • Performa jaringan fixed di Indonesia terus tertinggal dari rekan-rekannya di satu kawasan. Meskipun performa jaringan fixed broadband di Indonesia terus meningkat dari kuartal ke kuartal, Ookla® Speedtest Intelligence® menunjukkan bahwa Indonesia tertinggal dari banyak rekannya di satu kawasan pada metrik utama seperti median kecepatan unduh dan penetrasi router yang lebih canggih yang mendukung Wi-Fi 5 GHz, dan perbedaan ini semakin besar.
  • Jawa Timur dan Jawa Tengah termasuk wilayah di Indonesia yang paling lambat performanya. Sebagian besar wilayah di Indonesia mencapai median kecepatan unduh yang sama. Namun masih ada beberapa pencilan (outlier): Bali adalah wilayah dengan performa terbaik, dan wilayah-wilayah di Jawa Timur dan Jawa Tengah yang penduduknya lebih padat terus mengalami performa yang paling lambat di pasar.
  • Dengan kecepatan yang lebih tinggi, pelanggan pun lebih bahagia. Sentimen konsumen terhadap penyedia jaringan fixed broadband di Indonesia, yang diukur dengan Peringkat Bintang 5 Ookla, berkaitan erat dengan performa jaringan selama setahun terakhir.
  • Persaingan kian sengit di pasar jaringan fixed broadband Indonesia. Data sampel Speedtest Intelligence® untuk K3-K4 2021 menunjukkan 306 ISP aktif di pasar. Dari jumlah tersebut, empat operator jaringan nasional utama memenuhi ambang batas kami untuk dianggap sebagai penyedia teratas (dengan minimal 3% sampel) – Telkom, First Media, MyRepublic, dan Biznet. Di tingkat regional, daftar penyedia teratas ini berkembang menjadi sepuluh, termasuk CBN, MNC Play, StarNet, PT Global Media Data Prima, MTM Bali, dan GlobalXtreme.
  • Biznet memimpin pasar dalam performa jaringan fixed broadband menurut Speedtest Intelligence. Biznet merupakan operator terkemuka, baik secara nasional maupun di banyak wilayah di Indonesia, dengan kecepatan unduh dan unggahnya yang hampir simetris.

Singapura memimpin dalam kecepatan jaringan fixed broadband di Asia Tenggara

Indonesia menempati peringkat ke-114 pada Speedtest® Global IndexTM untuk median kecepatan unduh tetap (fixed download), berdasarkan data Mei 2022. Menurut Speedtest Intelligence, kecepatan fixed broadband di negara ini telah meningkat selama setahun terakhir, dari median kecepatan unduh 17,37 Mbps pada Maret 2021 menjadi 21,23 Mbps pada Maret 2022. Kecepatan unggah fixed broadband di pasar telah meningkat dengan margin yang lebih besar, dari 4,95 Mbps pada Maret 2021, menjadi 9,73 Mbps pada Maret 2022. Namun, sebagaimana pasar selulernya, dan meskipun lintasannya membaik, performa fixed broadband Indonesia terus tertinggal dari banyak rekannya di satu kawasan  

Mengamati performa selama tahun 2021 di pasar Asia Tenggara, kesenjangan performa yang cukup besar terus terjadi antara Singapura dan Thailand dibandingkan dengan rekan-rekan keduanya di satu kawasan, di mana keduanya mencapai median kecepatan unduh tetap (fixed download) lebih dari 150 Mbps selama K4 2021. Juga terjadi perbedaan performa antara Malaysia (75,91 Mbps), Vietnam (67,91 Mbps), dan Filipina (47,50 Mbps). Dari keempat pasar yang tersisa, Brunei dan Laos kecepatannya nyaris 30 Mbps, sementara Indonesia dan Kamboja menjadi pasar fixed-line yang paling lambat, dengan median kecepatan unduh masing-masing 20,08 Mbps dan 18,89 Mbps.

Kami menggunakan data dari Speedtest Intelligence untuk mengevaluasi performa fixed broadband di Indonesia selama K3-K4 2021. Analisis kami memeriksa kecepatan fixed broadband di tingkat negara dan penyedia. Kami juga memeriksa performa Wi-Fi sebagai subset dari total sampel fixed broadband untuk menilai kecepatan yang dikirimkan ke perangkat pengguna akhir dan melihat pangsa sampel yang menggunakan router yang mendukung 5 GHz melalui Wi-Fi.

Semakin banyak operator di seluruh dunia yang menawarkan solusi jaringan rumah untuk membantu meningkatkan kecepatan dan jangkauan Wi-Fi di dalam rumah. Di Indonesia, First Media, Biznet, dan MyRepublic menawarkan solusi jaringan mesh, sedangkan beberapa ISP juga menawarkan opsi untuk melakukan upgrade ke router yang mendukung jalur (band) 5 GHz. Dengan jalur ini, bandwidth saluran yang dihasilkan menjadi lebih besar dan gangguan yang ditimbulkan pun biasanya lebih rendah daripada Wi-Fi di jalur (band) 2,4 GHz, yang memungkinkan peningkatan performa untuk aktivitas bandwidth tinggi seperti bermain game dan streaming konten video definisi tinggi.

Mencermati distribusi sampel Speedtest untuk fixed Wi-Fi yang berjalan pada koneksi Wi-Fi 2,4 GHz versus koneksi Wi-Fi 5 GHz, pemimpin di kawasan ini, Singapura dan Thailand, berikut Malaysia, menjadi satu-satunya pasar di daftar ini yang mayoritas sampelnya tercatat menggunakan 5 GHz. Indonesia kembali berada di urutan terakhir dengan koneksi 5 GHz yang hanya menyumbang 22% sampel.

Biznet memimpin di Indonesia secara nasional pada kecepatan unduh fixed broadband

Metodologi statistik kami menetapkan ambang batas minimal 3% sampel bagi operator agar dapat dipertimbangkan sebagai penyedia teratas dan bagian dari analisis kami. Dengan menggunakan metodologi ini, Biznet menjadi operator fixed broadband tercepat untuk median kecepatan unduh dan unggah selama K3-K4 2021, disusul oleh My Republic. Biznet meraih hasil yang hampir simetris dari kecepatan unduh 40,85 Mbps dan kecepatan unggah 39,29 Mbps, sedangkan My Republic mencapai kecepatan unduh 34,27 Mbps dan kecepatan unggah 21,93 Mbps. Hingga Mei 2022, jaringan fiber optik Biznet meluas hingga mencapai total lebih dari 64.000 km, dengan jaringan aksesnya saat ini yang mencakup lebih dari 1,46 juta rumah tangga. Untuk bersaing lebih agresif dengan layanan IndiHome Telkom, Biznet meluncurkan layanan IPTV pada Februari 2020. Dua ISP nasional lainnya, Telkom dan First Media, tertinggal, yang masing-masing mencapai median kecepatan unduh 18,91 Mbps dan 16,54 Mbps.

Mencermati pemisahan sampel dari koneksi Wi-Fi 2,4 GHz versus koneksi Wi-Fi 5 GHz, terlihat adanya perbedaan antarpemimpin pasar, antara Biznet dan MyRepublic serta First Media dan Telkom. Namun, keempat operator fixed broadband tersebut mencatat lebih dari 70% tes menggunakan koneksi Wi-Fi 2,4 GHz. Jika kita mengamati performa Wi-Fi di Indonesia sebagai bagian dari total sampel fixed broadband, maka muncul gambar serupa, di mana Biznet dan My Republic mengungguli Telkom dan First Media.

Sentimen konsumen mengikuti jejak performa jaringan

Ada korelasi positif yang jelas antara performa jaringan tetap (fixed) dan sentimen konsumen di pasar fixed broadband Indonesia. Berdasarkan rata-rata (mean) Peringkat Bintang 5 Speedtest di pasar, Biznet menjadi operator tetap (fixed) dengan peringkat teratas di K3-K4 2021 dan skor 3,9, sedangkan First Media menempati posisi terakhir dengan skor 2,8.

Kesenjangan di tingkat regional dalam hal kecepatan unduh fixed broadband melalui Wi-Fi tetap terjadi

Terlepas dari tujuan Rencana Broadband Indonesia untuk meningkatkan kecepatan di seluruh Indonesia, tetap terjadi sejumlah kesenjangan di tingkat regional dalam hal median kecepatan unduh dan unggah. Bagi sebagian besar wilayah di Indonesia, kecepatan unduh menunjukkan adanya sedikit variasi, berkisar antara 16 Mbps dan 20 Mbps. Namun terdapat beberapa pencilan (outlier). Bali, sebagai hotspot wisata dan berkembang menjadi tujuan populer bagi pekerja nomaden digital, dan Jakarta, sebagai ibukota Indonesia, menempati dua posisi teratas secara nasional selama K3-K4 2021, dengan kecepatan unduh masing-masing 22,77 Mbps dan 21,92 Mbps.

Sementara itu, dua wilayah terpadat di negeri ini, Jawa Timur dan Tengah, menghasilkan median kecepatan unduh terendah, masing-masing 15,34 Mbps dan 15,17 Mbps. Kecepatan unggah di seluruh pasar menunjukkan variasi yang lebih banyak, mulai dari tertinggi 17,47 Mbps di Bali, hingga terendah 3,97 Mbps di Bengkulu.

Biznet memimpin di wilayah Jakarta dalam kecepatan unduh Wi-Fi

Biznet adalah penyedia broadband fixed tercepat di Jakarta, ibukota Indonesia, selama K3-K4 2021, dengan kecepatan yang hampir simetris untuk median unduh (42,59 Mbps) dan unggah (41,22 Mbps). Disusul oleh MyRepublic, dengan kecepatan unduh 32,47 Mbps dan unggah 25,46 Mbps, serta CBN yang juga mencapai kecepatan simetris sekitar 28 Mbps. Performa Wi-Fi untuk tiga provider lainnya, First Media, Telkom, dan MNC Play justru tertinggal, di mana First Media dan Telkom mencapai kecepatan unggah jauh di bawah pesaing, keduanya kurang dari 10 Mbps.

Satu dari tiga sampel Speedtest untuk penyedia CBN menggunakan Wi-Fi 5 GHz, yang terbesar di antara seluruh operator di Jakarta. Biznet, MyRepublic, dan First Media menyusul, sementara Telkom dan MNC Play menunjukkan sampel terendah dengan menggunakan Wi-Fi 5 GHz.

MyRepublic memimpin di wilayah Banten dalam kecepatan unduh fixed broadband melalui Wi-Fi

Di Banten, provinsi paling barat di Pulau Jawa, Biznet menjadi penyedia tercepat melalui Wi-Fi. Biznet telah memperluas jangkauannya di wilayah ini, dan memperoleh sampel yang cukup (lebih dari 3% dari pasar) untuk dimasukkan sebagai penyedia teratas dalam analisis kami di Banten. Biznet mencatat median kecepatan unduh 42,73 Mbps dan unggah 41,32 Mbps.

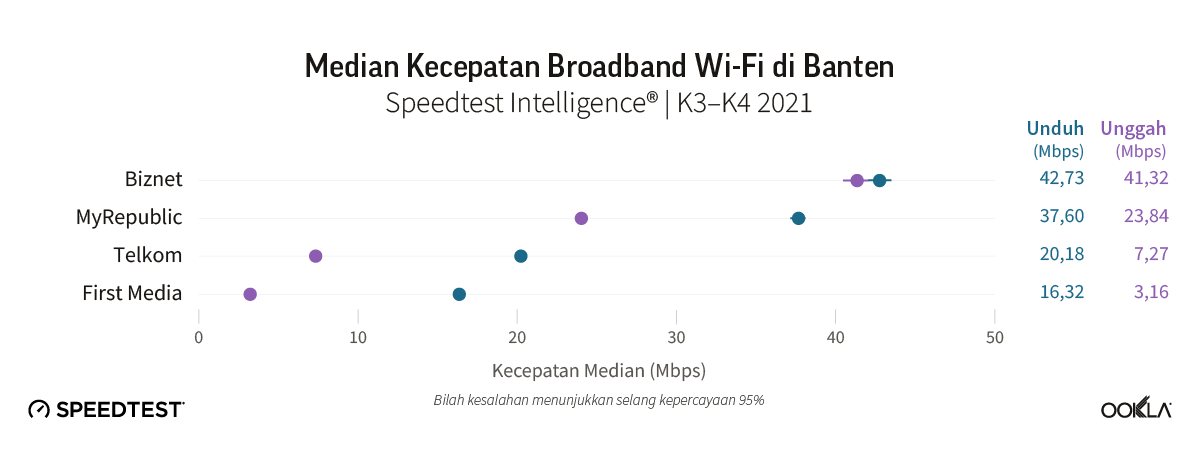
Biznet juga memimpin di wilayah tersebut dalam penggunaan Wi-Fi 5 GHz, pada 29% sampel. MyRepublic mengekor dengan kecepatan unduh 37,60 Mbps dan unggah 23,84 Mbps, sehingga tampak berbeda dari Telkom dan First Media.

Biznet memimpin di wilayah Jawa Barat dalam kecepatan unduh fixed broadband melalui Wi-Fi

Sebagai wilayah terpadat di Indonesia, Jawa Barat memiliki lebih banyak penyedia yang memenuhi ambang batas statistik minimal untuk dimasukkan dalam analisis kami. Biznet sekali lagi menjadi penyedia tercepat yang menggunakan Wi-Fi, meskipun dengan kecepatan yang lebih lambat daripada di wilayah cakupan lainnya, pada 36,18 Mbps untuk median unduh dan 35,76 Mbps untuk kecepatan unggah. MyRepublic menjadi operator di urutan kedua untuk kecepatan unduh, mencatat 29,57 Mbps, diikuti oleh Telkom, StarNet, dan First Media.

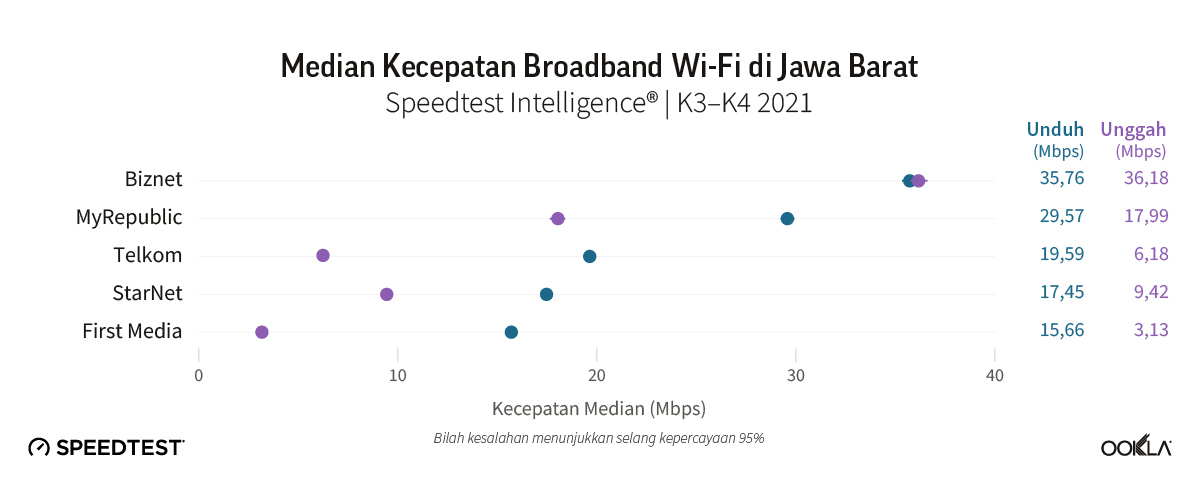
Para penyedia jaringan di Jawa Barat umumnya meraih kecepatan yang lebih lambat daripada di daerah lain, dan distribusi sampel Wi-Fi antara 2,4 GHz dan 5 GHz juga condong lebih jauh ke arah 2,4 GHz daripada di tempat lain, di mana First Media, Telkom, dan StarNet semuanya merekam sekitar 85% sampel pada 2,4 GHz.

MyRepublic memimpin di wilayah Jawa Tengah dalam kecepatan unduh fixed broadband melalui Wi-Fi

Di Jawa Tengah, berbedar dari sebagian besar wilayah Indonesia lainnya, MyRepublic mengungguli Biznet pada median kecepatan unduh Wi-Fi, mencapai 29,11 Mbps selama K3-K4 2021. Biznet menyusul dengan kecepatan unggah 25,85 Mbps, namun sekaligus mencatat kecepatan unggah tercepat 18,95 Mbps. Telkom menyusul dengan kecepatan unduh 16,39 Mbps, sedangkan PT Global Media Data Prima jauh tertinggal dari wilayah lainnya dengan median kecepatan unduh 3,81 Mbps. Penyedia ini juga mencatat proporsi terendah sampel Wi-Fi menggunakan 5 GHz, hanya 5%.

Biznet memimpin di wilayah Jawa Timur dalam kecepatan unduh fixed broadband melalui Wi-Fi

Jawa Timur kembali hadir untuk Biznet sebagai penyedia dengan performa tercepat melalui Wi-Fi, dengan median kecepatan unduh 33,11 Mbps dan kecepatan unggah 29,34 Mbps. Selanjutnya diikuti oleh MyRepublic dalam hal kecepatan unduh dengan 27,75 Mbps. Telkom dan First Media berada di urutan berikutnya dengan kecepatan unduh masing-masing 15,68 Mbps dan 14,39 Mbps, sementara kecepatan unggah mereka tertinggal jauh di belakang saingan-saingan mereka.

Distribusi Wi-Fi menunjukkan hal yang senada, di mana Telkom dan First Media mencetak persentase sampel terendah pada 5 GHz, masing-masing sebesar 16% dan 14%.

MTM Bali memimpin di wilayah Bali dalam kecepatan unduh fixed broadband melalui Wi-Fi

Bali merupakan wilayah yang paling kompetitif pada analisis ini dalam hal kecepatan tertinggi di antara para penyedia, dengan tiga penyedia semuanya merekam median kecepatan unduh dan unggah serupa yang mendekati 40 Mbps. Kami tidak dapat menyatakan pemenang statistik berdasarkan median kecepatan unduh Wi-Fi, dengan kecepatan unduh MTM Bali dan GlobalXtreme dalam kisaran yang sama, meskipun kecepatan unggah GlobalXtreme terbukti lebih cepat.

GlobalXtreme juga mencatat persentase tertinggi dari sampel Wi-Fi 5 GHz, pada 35% dari total, jauh melampaui persaingan, dengan para operator yang lain mencapai 20% atau kurang.

Prospek fixed broadband di Indonesia

Penetrasi fixed broadband dalam lingkup rumah tangga di Indonesia tetap rendah, di bawah 20% menurut sebagian besar perkiraan. Internet seluler tetap menjadi teknologi akses yang dominan di pasar, tetapi peralihan ke opsi bekerja dan belajar di rumah sebagai akibat dari pandemi COVID-19 telah mendorong lebih banyak rumah tangga untuk berlangganan layanan fixed broadband. Persaingan semakin meningkat di pasar, di mana para pemain yang lebih kecil seperti Biznet dan MyRepublic aktif meluncurkan jaringan dan menargetkan keuntungan dari Telkom, yang masih mempertahankan pangsa pasar mayoritas koneksi broadband. Berita yang muncul baru-baru ini yang menyatakan bahwa Axiata Group dan anak perusahaannya di Indonesia, XL Axiata, telah menandatangani perjanjian yang tidak mengikat untuk mengakuisisi mayoritas saham penyedia broadband Indonesia, LinkNet, menjadi bukti lebih lanjut bahwa para penyedia melihat adanya peluang besar untuk pertumbuhan. Kami berharap hal ini akan membantu mempercepat peluncuran jaringan dan penyediaan layanan broadband bundel yang lebih canggih di pasar, yang pada gilirannya akan membantu meningkatkan kecepatan fixed broadband Indonesia, terutama di wilayah-wilayah padat penduduk yang diulas pada laporan ini.

Ookla retains ownership of this article including all of the intellectual property rights, data, content graphs and analysis. This article may not be quoted, reproduced, distributed or published for any commercial purpose without prior consent. Members of the press and others using the findings in this article for non-commercial purposes are welcome to publicly share and link to report information with attribution to Ookla.

| June 1, 2022

Capitalizing on C-band — United States Q1 2022 Results Show Room for Improvement

Key messages

  • T-Mobile maintains a sizable lead on 5G performance. Median 5G performance for Verizon reached 107.25 Mbps in Q1 2022, fuelled by its C-band deployment, but T-Mobile maintains the upper hand in the performance stakes, recording 191.12 Mbps.
  • Verizon looking to capitalize on C-band advantage. While still early days for C-band in the US, Verizon will hope that its improved 5G performance will feed through into growth in postpaid net phone additions, following a decline in Q1 2022.
  • AT&T continues to surpass expectations. AT&T’s postpaid net phone additions have exceeded expectations, driven by stronger 4G/LTE performance relative to Verizon, coupled with wider 5G coverage and aggressive postpaid pricing.
  • Rising costs could well shift the competitive dynamic in Verizon’s favor. While the release of further C-band spectrum will shift this dynamic, that won’t happen until the end of 2023. In the meantime rising inflation will play a larger role, forcing operators to either consider raising prices or absorb additional costs. AT&T has already signaled that it favors the former. Verizon could well be a beneficiary.

AT&T & T-Mobile outperform Verizon

Postpaid net phone additions, a key barometer of the health of the wireless industry in the United States, has shown strong growth since Q3 2020, following the outbreak of COVID-19. The latest Q1 2022 reporting from the big three US operators, showed a return to negative growth for Verizon (a decline it has now replicated annually over the last three years), but also showed continued strong gains for both T-Mobile and AT&T. 

While we’d expect T-Mobile to perform strongly given its leading position in the market based on 5G performance, AT&T and Verizon’s relative performance is surprising. On the one hand, AT&T has outperformed even T-Mobile since Q2 2021, despite lagging both T-Mobile and Verizon on 5G performance according to Speedtest Intelligence®. More concerning is Verizon’s decline in postpaid net phone additions, despite it deploying C-band spectrum in Q1 2022 and seeing an uplift in speeds as a result. Since its deployment in the C-band, Verizon’s 5G speeds have set it apart from AT&T, but it continues to lag behind market leader T-Mobile.

The factors driving AT&T’s strong postpaid customer acquisition

Network performance isn’t the only factor driving postpaid net phone additions. A March 2021 YouGov survey listed cost as the main driver of churn for U.S. consumers, followed by network quality and services. AT&T’s strong performance, particularly relative to Verizon, reflects a number of factors:

  • Strong 4G/LTE performance. During Q1 2022, AT&T recorded a median speed of 34.57 Mbps over 4G/LTE, versus 26.33 Mbps for Verizon. 
  • Greater 5G Availability. 50.6% of AT&T customers with a 5G capable device spent a majority of their time on 5G networks during Q1 2022, versus only 28.9% of Verizon customers. And when they’re not on its faster 5G network, Verizon customers fall back on its slower 4G/LTE network. 
  • Aggressive pricing. In a bid to drive customer acquisition, AT&T has been aggressive on pricing, looking to attract new and existing customers to 5G phones and its unlimited plans. This has had a knock-on impact on its financial results, with postpaid ARPU down marginally over the last two years, from $50.63 in Q1 2020, to $48.88 in Q1 2022. In addition, the EBITDA margin for its mobility division fell from 45.6% to 39.4% over the same 2-year period.
  • C-band delay and controversy. With Verizon targeting a big competitive push alongside its deployment in the C-band, the concerns raised by the FAA relating to interference at U.S. airports and the subsequent delay in launch, will have had a knock-on impact on its ability to attract new customers in Q1.

Economic pressure could play into Verizon’s hands

As economic headwinds build in the US, with inflation surging to a 40-year high, we expect the dynamics of the U.S. wireless market to shift. AT&T CEO John Stankey pointed to rising wages adding approximately $1 billion to the company’s costs in 2022 during its Q1 2022 earnings call. Set against a backdrop of an already declining wireless EBITDA margin, rather than absorb the cost, Stankey raised the prospect of increasing prices. Shortly afterwards, AT&T announced that it would raise prices for older mobile service plans (the first such rise in three years) and at the same time attempt to transition these users onto newer plans. Verizon has since followed suit, raising the administrative fee it charges on postpaid voice accounts.

At the same time, competition is increasing. Having just launched 5G service in Las Vegas, Dish, which has been beset by problems with its network rollout, is set to ramp up 5G coverage. More targeted competition currently comes from some of the US regional carriers, for example US Cellular, which has built up its mid-band spectrum holdings (including C-band), and is currently targeting a balance between customer acquisition and ARPU growth. These changes could well begin to shift the dynamic in terms of postpaid net phone additions between AT&T and Verizon and other regional carriers, if they can continue to broaden the coverage of their 5G networks and build on their C-band fuelled speed advantage.

If you want to learn more about how Speedtest Intelligence can help you benchmark your 5G performance against competitors, please inquire here.

Ookla retains ownership of this article including all of the intellectual property rights, data, content graphs and analysis. This article may not be quoted, reproduced, distributed or published for any commercial purpose without prior consent. Members of the press and others using the findings in this article for non-commercial purposes are welcome to publicly share and link to report information with attribution to Ookla.

| May 12, 2022

How EXPO 2020 Dubai Became the Fastest Show on Earth

A project 8 years in the making

The UAE was awarded the right to host the World EXPO 2020 in November 2013 following its successful bid. EXPO 2020 Dubai, the first in the MEASA (Middle East, Africa and South Asia) region was originally scheduled for 2020, but was delayed due to the COVID-19 pandemic, opening to visitors for 6 months between October 2021 and March 2022. 

While international travel had resumed from many markets when the EXPO opened its doors in October 2021, the event had to contend with a subsequent wave of COVID-19 restrictions around the world. Despite this, and the resultant impact on international travel and the maintenance of social distancing and other COVID-19 safety measures, EXPO 2020 operated without interruption during the six months it was open. It was a huge event, welcoming in excess of 24 million visitors to a greenfield build consisting of pavilions from 191 countries, across a site covering 4.38 square kilometers.

Showcasing 5G’s potential

The Telecommunications and Digital Government Regulatory Authority (TDRA) of the UAE has been very proactive in creating an enabling telecoms regulatory environment. In November 2018 it allocated 100 MHz of spectrum in the C-band, to both Etisalat and du, to enable them to roll out 5G networks. In addition, it has been proactive in enabling the operators to begin the sunsetting of their legacy 2G networks, to be able to refarm spectrum for use for newer mobile technologies. Thanks in part to this early allocation of 5G spectrum, and a favorable investment climate, as of March 2022 the UAE ranked 1st in Ookla’s Speedtest Global Index, based on median mobile network download speeds.

EXPO 2020 represented an opportunity for both Etisalat and du to showcase the performance of their 5G networks on a global stage. As a greenfield build, EXPO 2020 represented a unique opportunity, but also a significant challenge, given its sprawling layout across 4.38 square kilometers, and the coverage challenges posed by 191 pavilions which varied significantly in terms of size and construction material, as well as the main dome at the center of the EXPO. Both network operators had to be able to deliver a consistent 5G experience, supporting up to 25 million visitors across the six month period, with an anticipated peak of up to 300,000 visitors at a time.

Fastest global event

We compared the network performance at EXPO 2020 against other select major events worldwide, to understand how operators are building improved consumer experiences using 5G, and pushing the boundaries for performance at large scale events. The macro sites of EXPO 2020’s 5G network utilized 200 MHz of spectrum in total, using dual carrier aggregation to link high-capacity C-band spectrum with 90 MHz of spectrum in the 2.6 GHz band.

The 5G speeds recorded at the event by Ookla Speedtest Intelligence, confirm that EXPO 2020’s 5G network is the fastest event on record, with peak 5G download speeds in excess of 2 Gbps on Etisalat’s network. According to Doug Suttles, CEO and Founder of Ookla, “the speeds delivered on the Expo 2020 network are truly impressive – the fastest we’ve seen on 5G using mid-band spectrum, and testament to the work of Etisalat’s network build and the vision of the Expo 2020 team.”

5G Network Performance at Major Events

Across the duration of the event, the EXPO 2020 network achieved a median 5G download speed of 983.19 Mbps, putting it ahead of the next fastest event surveyed, the 2022 Super Bowl, which recorded a median 5G speed of 874.48 Mbps. It also outstripped its closest competitor on median 5G upload speed, recording 103.06 Mbps to the 81.32 Mbps recorded at MWC Barcelona 2022. For users without a 5G capable device or tariff, 4G/LTE performance at EXPO 2020 was also the fastest event we measured, with a 4G/LTE median download speed of 122.65 Mbps, putting it ahead of MWC Barcelona 2022, which recorded a speed of 90.41 Mbps.

Etisalat’s median 5G network speed clocked at over 1 Gbps

EXPO 2020 signed a premium partnership agreement with Etisalat in June 2016 to be its telecommunications and digital services provider. As part of this, Etisalat was responsible for developing the EXPO site’s telecoms infrastructure, which aimed to provide visitors and participants a cutting-edge, immersive digital experience to bring EXPO 2020’s themes of Opportunity, Mobility, and Sustainability to life.

Etisalat was tasked with deploying a greenfield dedicated network for EXPO 2020, capable of supporting up to 25 million visitors in total, and up to 300,000 per day, across an area of 4.38 square kilometers. As part of the 5-year network build project, the first commercial 5G network in the MEASA region, Etisalat clearly wanted to showcase the capabilities of a next-generation 5G network. However, with 191 pavilions, as well as the main dome in the center of the EXPO, to ensure the best blend of coverage and performance, it deployed:

  • Over 8,500 mobile access points, including 20 macro cell sites, 91 small cells, and 40 in-building sites, to provide full coverage
  • 700km of fiber optic cable, including 10 Gbps connections to all sites
  • 800km of cabling to support indoor mobile and Wi-Fi network requirements
  • 2 data centers within the EXPO itself
  • Redundancy in the form of a dedicated fallback Wi-Fi network, as well as the option to rapidly deploy cells on wheels (COW)

Across the six months that EXPO 2020 Dubai was open, and despite the much larger and more complex coverage requirement compared to other events (given the multitude of exhibitions pavilions), both Etisalat and du recorded impressive median 5G network speeds. Etisalat’s median speed of 1.10 Gbps, ahead of du’s 691 Mbps, helped drive Expo 2020 to first place as the fastest event on record. Median upload performance between the two operators was a closer affair, with Etisalat recording 105.09 Mbps, ahead of du’s 91.79 Mbps.

EXPO 2020’s economic impact and legacy 

EXPO 2020 provided a significant contribution to the UAE economy. In a February update, the IMF claimed that the UAE’s economic recovery was gaining momentum, estimating that it grew 2.2% in 2021, and forecasting that growth will accelerate to 3.5% in 2022. The IMF noted that this momentum was due to the country’s swift response to the COVID-19 pandemic alongside macroeconomic policies that have helped key sectors rebound, and economic activity related to EXPO 2020. With EXPO 2020 now complete, as part of its legacy, it will transition into District 2020 – a smart city deployment. District 2020 will re-use at least 80% of the EXPO-built infrastructure, including key components of the 5G network build, for both residential and business use.

Please contact us to learn how Ookla® can help you determine if your network is prepared for the massive crowds that accompany a marquee event, and analyze how your network performs both indoors and out, down to the building level.

Ookla retains ownership of this article including all of the intellectual property rights, data, content graphs and analysis. This article may not be quoted, reproduced, distributed or published for any commercial purpose without prior consent. Members of the press and others using the findings in this article for non-commercial purposes are welcome to publicly share and link to report information with attribution to Ookla.

| March 14, 2022

Hong Kong & Macau: Migration to Faster Fiber Services Driving Performance Gains

讀中文

Operators in Hong Kong and Macau are continuing to drive migration of their customer bases from legacy fixed-line technologies to faster fiber and cable connections. Both markets are heavily saturated and connection growth remains low, with Hong Kong adding an additional 50,000 broadband subscribers to reach 2.92 million in total in the 10 months ended October 2021, while Macau saw fixed broadband subscribers grow by 4,000 to reach 206,000 during 2021.

The regulators in both markets provide detailed broadband subscription statistics. In Hong Kong, the Office of the Communications Authority (OFCA) tracks broadband adoption by advertised speed and technology mix. It recorded 85.4% of broadband subscribers on packages with a maximum download speed equal to or greater than 100 Mbps, and 80.3% fiber to the home/building (FTTH/B) as of October 2021. Of these, over half subscribe to broadband packages offering speeds of at least 1 Gbps. In Macau, the Macau Post and Telecommunications (CTT) tracks broadband adoption by technology, with 97.8% of Macau broadband subscribers using fiber at the end of 2021.

Global city ranking leaves room for improvement

We used Ookla® Speedtest Intelligence® data to rank the broadband performance of select cities globally. Across all cities with a minimum of 10,000 samples in Q4 2021, Hong Kong ranked 20 on median Wi-Fi download speeds with 184.80 Mbps, while Macau ranked 74 with a download speed of 129.90 Mbps. Despite strong download performance, median Wi-Fi upload speeds in Hong Kong lagged behind download performance, at 125.70 Mbps, while Macau recorded a more symmetrical median upload speed of 105.70 Mbps. Greater penetration of fiber in broadband access networks provides operators with the ability to offer more symmetrical upload and download speeds.

hong kong and macau performance versus other major global cities

Hong Kong: China Mobile Hong Kong leads on download performance

We examined fixed Wi-Fi performance in Hong Kong, excluding any 5G fixed-wireless internet connections from the analysis. Operators in Hong Kong offer a range of broadband packages based on network speeds, e.g. HGC offers subscriptions with download speeds ranging from 6 Mbps to 2.2 Gbps. Availability of higher speed subscription tiers depends on the operator’s footprint and whether fiber connectivity is to the premises (FTTP) or to the building (FTTB), with some buildings utilizing copper as part of the last mile. Migrating Hong Kong’s remaining FTTP connections (19.3% of total) to FTTH (61.0% of total) would help boost median speeds. China Mobile Hong Kong (CMHK) has gone one step further in a bid to boost home fiber speeds, launching a fiber to the room (FTTR) service in September 2021, which deploys optical cables within a house/apartment.

Hong Kong Fixed Wi-Fi Operator Performance

Our examination of fixed broadband Wi-Fi performance in Hong Kong shows CMHK, which obtained in excess of 3% of overall samples to be considered in this analysis in Q3 2021, in first place in Q4 2021, with a median download speed of 251.73 Mbps, followed by Netvigator with 216.06 Mbps. While operators continue to market broadband based primarily on download speeds, upload speeds continue to grow in importance given the increased prevalence of remote working and growth in demand for services such as video calling and online gaming. Netvigator led the market based on median upload speeds in Q4 2021, recording 174.72 Mbps, followed by CMHK and HKBN. Looking at the distribution of Wi-Fi samples between 5 GHz, which offers higher capacity than lower frequency bands, Netvigator and HKBN led the market based on percentage of 5 GHz samples, with 75.3% and 74.1% respectively.

Hong Kong: 5Ghz Share of Fixed Wi-Fi Operator Samples

Macau: CTM outstrips MTEL on overall performance

Macau lags Hong Kong on fixed Wi-Fi performance for both median download and upload speeds, despite the regulator CTT reporting widespread adoption of fiber in the market. Operators MTEL and CTM offer a range of fiber broadband plans for residential users, segmented by download speed. As of February 2022, MTEL offers packages ranging from 25 Mbps to 600 Mbps, while CTM offers a wider range of speeds, from 50 Mbps to its headline speed of 10 Gbps, introduced in September 2020.

Macau Fixed Wi-Fi Operator Performance

Speedtest Intelligence performance data for Macau during 2021 aligns with CTM’s focus on providing higher broadband speed tiers in the market. CTM maintained a significant performance gap over MTEL, recording a median download speed of 131.80 Mbps in Q4 2021, compared to MTEL with 72.26 Mbps. Upload performance between the two operators shows a similar picture, with CTM recording a median speed of 107.39 Mbps in Q4 2021, over double that of MTEL which recorded 52.26 Mbps. Looking at the distribution of Wi-Fi samples between 5 GHz and other bands, MTEL recorded a greater proportion of samples using 5 GHz than CTM.

Macau: 5 Ghz Share of Fixed Wi-Fi Operator Samples

In order to maintain or improve their position among top-performing cities globally, operators in Hong Kong and Macau need to drive greater availability of higher-speed broadband services, while encouraging existing customers to upgrade to faster speeds. For Hong Kong in particular, improving the penetration of routers which support 5 GHz Wi-Fi could help those operators which currently lag the market on overall performance. We’ll continue monitoring how fixed broadband performs across major cities like Hong Kong and Macau. If you want to learn more about Speedtest Intelligence, please inquire here.


香港澳門:轉移到更快速的光纖服務將有助提升性能

香港及澳門的營辦商正在不斷向客戶進行推廣,希望他們轉用更快速的光纖及電纜網絡接駁,以取代傳統固網技術。但這兩個市場都已經嚴重飽和,網絡接駁增長仍然很低;2021 年的 10 個月內,香港增加了 50,000 名寬頻用戶,總數達到 292 萬;而澳門的固網寬頻用戶在 2021 年增加 了4,000個,總數達到 206,000個。

兩個市場的監管機構均提供了詳細的寬頻訂閱統計數據。香港的通訊事務管理局(OFCA)透過營辦商宣傳的網速及技術追蹤寬頻用量:截至 2021 年 10 月,85.4% 的寬頻用戶使用最大下載速度等於或大於 100 Mbps 的服務計劃,80.3% 的寬頻用戶使用「光纖到戶 」(FTTH)/「光纖到樓」(FTTB),其中超過一半人訂閱網速至少為 1 Gbps 的服務計劃。澳門郵電 (CTT)則透過技術來追蹤寬頻用量:截至 2021 年底,97.8% 的澳門寬頻用戶使用光纖。

全球城市排名顯示仍有進步空間

hong kong and macau performance versus other major global cities

香港:中國移動香港的下載表現領先

我們測試了香港的固網 Wi-Fi 性能,但並不包括任何 5G 固網無線互聯網接駁。香港營辦商提供大量不同網速的寬頻計劃,例如HGC環電提供下載速度由6 Mbps至 2.2 Gbps的寬頻計劃。寬頻速度取決於營辦商的網絡覆蓋範圍,以及是使用「光纖到樓」(FTTP/FTTB)技術,而某些大廈在最後一英里會使用銅線接入。將香港剩餘的 FTTP接駁(佔總數的 19.3%)轉移為到 FTTH接駁(佔總數的 61.0%)將有助提升速度中位數。中國移動香港(CMHK)在2021年9月推出了FTTR (Fiber to the Room)技術,實現光纖接入房屋/單位內部,令家居光纖寬頻的網速又向前邁進了一步。

Hong Kong Fixed Wi-Fi Operator Performance

我們對香港固網寬頻 Wi-Fi 性能的測試顯示,中國移動香港在2021年第三季才開始成為Top Providers(獲得超過3%的總體樣本),因此在2021年第三季前無數據顯示。在 2021 年第四季度,中國移動香港以 251.73 Mbps 的下載速度中位數位居第一,而網上行則以216.06 Mbps排名第二。雖然營辦商繼續主要以下載速度來推銷其寬頻計劃,但鑑於遠程工作的日益普及,以及視像通話及網上遊戲等服務的需求增加,上載速度的重要性亦不斷上升。根據 2021 年第四季的上載速度中位數資料,網上行以174.72 Mbps領先市場,其次是中國移動香港及香港寬頻。根據5 GHz(比低頻段擁有更廣的覆蓋範圍與更強的穿透能力) Wi-Fi熱點分佈的樣本,網上行及香港寬頻以 5 GHz 樣本百分比領先市場,分別為 75.3% 和 74.1%。

Hong Kong: 5Ghz Share of Fixed Wi-Fi Operator Samples

澳門:澳門電訊的整體表現比MTel 電信更出色

儘管監管機構澳門郵電的報告顯示該市場廣泛採用光纖技術,但其固網 Wi-Fi 的下上載速度均落後於香港。營辦商MTel 電信有限公司及澳門電訊為住宅用戶提供一系列不同下載速度的光纖寬頻計劃。2022 年 2 月,MTel 電信有限公司提供下載速度由25 Mbps 至 600 Mbps的寬頻計劃,而澳門電訊則提供50 Mbps至10 Gbps(於2020年9月推出的主打)的寬頻計劃,速度範圍更廣泛。

Macau Fixed Wi-Fi Operator Performance

Speedtest Intelligence 的2021年澳門網路連接速度表現數據反映了澳門電訊致力於向市場提供更快速的寬頻服務。在2021 年第四季,澳門電訊的下載速度中位數為131.80 Mbps,其性能遠超只有72.26 Mbps的MTel 電信;而兩者的上載速度中位數差距亦很大,澳門電訊的上載速度中位數為107.39 Mbps,比只有52.26 Mbps 的 MTel 電信快兩倍。如比較5 GHz及其他頻段Wi-Fi熱點分佈的樣本,MTel 電信5 GHz Wi-Fi熱點分佈的樣本百分比較澳門電訊高。

Macau: 5 Ghz Share of Fixed Wi-Fi Operator Samples

如要保持或提高在全球表現最好城市的排名,港澳兩地的營辦商需要提供更高的高速寬頻服務可及性,同時鼓勵現有客戶升級到更快速的寬頻計劃。特別是香港,如果支援 5 GHz Wi-Fi的設備可以更滲透市場,便可以幫助那些目前在整體性能方面落後於市場的營辦商。我們將繼續監測固網寬頻在香港和澳門等主要城市的表現。如果您想了解更多有關Speedtest Intelligence的資訊請到此處查詢


Ookla retains ownership of this article including all of the intellectual property rights, data, content graphs and analysis. This article may not be quoted, reproduced, distributed or published for any commercial purpose without prior consent. Members of the press and others using the findings in this article for non-commercial purposes are welcome to publicly share and link to report information with attribution to Ookla.

| January 30, 2022

5G in Thailand: AIS Leads the Market

AIS and TrueMove H drive early 5G adoption

Thailand was one of the first markets to launch 5G in the Asia Pacific region, with AIS and TrueMove H both launching commercial 5G services during Q1 2020, shortly after the conclusion of the country’s 5G auction. Driving 5G adoption in the market is one of the primary objectives for AIS and TrueMove H — both have begun reporting the number of 5G connections on their networks — and had each targeted 2 million by the end of 2021.

The regulator, The National Broadcasting and Telecommunications Commission (NBTC), has been instrumental in establishing Thailand as a leading 5G market in the region. In February 2020, NBTC assigned spectrum for 5G use across low (700 MHz), mid (2,600 MHz) and high (26 GHz) frequency bands, and plans a further auction of mid-band spectrum in 2022 in the 3.5 GHz band, which was vacated in September 2021 by a Thaicom, a satellite provider. In terms of operator allocations:

  • AIS was first to launch 5G services in the market in February 2020, having acquired licenses across low, mid and high-frequency bands, giving it a strong mix of coverage and capacity spectrum.
  • TrueMove H followed, launching 5G in March 2020, having acquired spectrum in both the mid and high-frequency bands.
  • dtac launched 5G services in Q1 2021, only utilizing low-frequency spectrum in the 700 MHz band.
  • State-owned operator National Telecom (NT), formed from the merger of CAT and TOT, is yet to launch 5G services in the market. NT brings together spectrum across both low and high frequency bands and was expected to reveal a 5G investment plan, which could include handing the spectrum back to the regulator, by the end of 2021. However NT is still to indicate its plans at this date.

5G performance varies by operator in Thailand

These significant differences in spectrum holdings between the Thai operators have helped to drive very different 5G performance profiles, particularly when comparing AIS and TrueMove H with dtac. AIS led the market on both median 5G download and upload speeds, recording 289.12 Mbps and 41.20 Mbps, respectively, in Q4 2021 according to [Speedtest Intelligence](https://www.ookla.com/speedtest-intelligence)® data. TrueMove H followed, with a median 5G download speed of 217.84 Mbps and upload of 27.49 Mbps. The lack of mid-band spectrum appears to be limiting dtac which showed a median 5G download speed of 35.73 Mbps and 18.78 Mbps upload.

Both AIS and TrueMove H maintained strong 5G Consistency Scores in Q4 2021, with well over 90% of Speedtest Intelligence samples on their 5G networks exceeding the threshold of 25 Mbps download and 3 Mbps upload, indicating widespread coverage of mid-band spectrum. dtac, on the other hand, recorded a much lower 5G Consistency Score, again driven by its lack of mid-band spectrum, with just under two-thirds of samples on its 5G network meeting the criteria.

5G Availability differentiates operators in Thailand

While AIS led on 5G performance and consistency, TrueMove H led the market for 5G Availability, the percentage of users on 5G-capable devices that spend a majority of time with access to 5G networks, with 34.9%, well above AIS with only 15.9%, and with dtac in the low single digits. Availability is normally a good proxy for coverage, however the disparity we see between TrueMove H and AIS is largely down to the fact that AIS requires users to subscribe to a 5G tariff, as opposed to TrueMove H which allows greater access to 5G-enabled devices on its network.

Regional 5G performance in Thailand

Every operator takes a unique approach to regional strategy, so we have looked closely at 5G performance in select regions during Q4 2021 to see what’s working. We included regions with a minimum threshold of 300 samples where both sample size and network speeds remained stable over the time period. Given the large disparity in 5G performance between dtac and the rest of the market, we have removed dtac from our regional analysis.

AIS led median 5G download speeds in eight of the ten provinces sampled and AIS led on 5G upload speeds across all provinces. AIS also led TrueMove H on 5G Consistency in eight of the provinces sampled, with the difference between the two in both Khon Kaen and Nakhon Ratchasima marginal.

The most significant performance gap between AIS and TrueMove H is in Chiang Mai, where AIS recorded a median 5G download speed of 340.45 Mbps, compared to TrueMove H (175.86 Mbps), and an upload speed of 45.72 Mbps, compared to TrueMove H with 20.72 Mbps. The performance gap between the two operators in some of Thailand’s other most populous provinces, including Bangkok, Chon Buri and Songkhla was also significant in favor of AIS. In northeastern Thailand, the two operators in the two most populous regions of Nakhon Ratchasima and Khon Kaen showed similar 5G download speeds to one another, although AIS was faster in terms of median 5G upload speeds and narrowly ahead on 5G Consistency.

5G Availability paints a different picture, with TrueMove H ahead in many of the provinces we sampled, but by a margin that varied significantly between provinces. TrueMove H established a lead of 20 percentage points or more in the provinces of Chon Buri, Rayong, Phra Nakhon Si Ayutthaya, Nakhon Pathom, Chiang Mai and Bangkok. There was no winner in 5G Availability between the two operators in Phra Nakhon Si Ayutthaya, Rayong and Khon Kaen.

Thailand 5G Signal Strength

With 5G Availability between AIS and TrueMove H skewed, we examined 5G signal strength, using the SS-RSRP metric, as a more accurate reflection of 5G coverage across Thailand. Ookla® Cell Analytics™ showed strong 5G signal for both operators with wide coverage in the heavily populated regions of the country during Q4 2021. However, it’s also clear that AIS had more samples along arterial routes between Thailand’s various provinces. Based on overall 5G signal strength AIS edged out TrueMove H, with 5% more samples achieving -83 dBm or better, indicating that on average AIS customers are able to maintain a stronger 5G connection across the country.

Changes on the horizon for 5G in Thailand

While AIS leads the market in terms of 5G performance in Q4 2021, the release of further spectrum in the 3.5 GHz band, due to be auctioned by the regulator this year, could drive changes in the market. Other changes are already underway, with TrueMove H and dtac announcing in November 2021 plans to merge their businesses, a move which would create a new market leader with an overall market share in excess of 50% as of Q4 2021, according to GSMA Intelligence. The proposed merger will draw regulatory attention, as it will establish a virtual duopoly in the market. In light of National Telecom’s delay in building out its 5G business plan, this raises concerns that the market for 5G in Thailand will become less competitive.

Ookla’s suite of products can help you benchmark and monitor your network. Learn more about how we can help you here.

Ookla retains ownership of this article including all of the intellectual property rights, data, content graphs and analysis. This article may not be quoted, reproduced, distributed or published for any commercial purpose without prior consent. Members of the press and others using the findings in this article for non-commercial purposes are welcome to publicly share and link to report information with attribution to Ookla.

| January 20, 2022

Why Verizon and AT&T Couldn’t Wait Any Longer for U.S. C-band to Go Live

Key takeaways

  • Verizon and AT&T’s concessions on 5G around affected airports marks a breakthrough in a situation that could easily have escalated further and ended up in court, with subsequent delays to their planned C-band launch.
  • The opportunity cost of any delay is significant, as T-Mobile continues to extend its lead on 5G performance, which has helped the self-styled “Un-carrier” attract more postpaid net additions than its key rivals combined. This is why both Verizon & AT&T had little choice but to placate the FAA.
  • Further mid-band spectrum auction results announced on January 14, saw AT&T and DISH in particular increase their holdings, and underline just how critical mid-band spectrum is to operator performance.
  • Comparable international benchmarks from operators in France, Germany and Taiwan show that similar C-band spectrum holdings can drive 5G performance well over 100 Mbps, offering a means for Verizon and AT&T to close the gap with T-Mobile and potentially even move ahead.

Verizon and AT&T play catch-up with T-Mobile

Opportunity cost of further C-band delay too great

Back in February 2021, Verizon and AT&T paid $45.4 billion and $23.4 billion, respectively, for C-band spectrum for 5G use in the most expensive spectrum auction in history. Fast forward almost a year, and both telcos voluntarily agreed in early December to postpone their C-band deployment for a month due to Federal Aviation Administration (FAA) concerns that the use of these 5G bands could interfere with existing radio-based safety equipment, a delay which was subsequently extended to January 19.

In early December, Verizon CEO Hans Vestberg and AT&T Communications CEO Jeff McElfresh were bullish about the prospect of being able to launch in early January following a “short delay,” and that it would have no meaningful impact on their businesses. However, their insistence on a January 19 launch belies obvious concerns over T-Mobile’s increasingly strong lead on 5G performance — a lead which it continued to extend throughout the second half of 2021 — and coinciding with stronger postpaid net adds than its two main rivals combined during the year ended Q3 2021.

Averting an impasse with the FAA was critical

It was critical for both telcos that the delay to their C-band launch was only temporary, despite any skepticism over the potential impact on aircraft passenger safety. Part of the frustration evident from the network operators lies in the fact that C-band spectrum is already widely used elsewhere in the world for 5G, without showing any detrimental impact on aircraft passenger safety. C-band spectrum has already been deployed, and commercial networks launched, by a total of 136 network operators in 56 countries worldwide, according to the Global mobile Suppliers Association (GSA). This includes almost 11,000 airports (assuming nationwide coverage in each market). It’s also not new — the earliest use of C-band spectrum for 5G was in South Korea, which launched in Q4 2018.

Both have sought to compromise by agreeing not to turn on 5G equipment in the vicinity of affected airports. The delayed launch in these locations will enable the FAA to analyze proposed 5G cell site deployments and the impact on airports nationwide. One of the affected airports is Dallas/Fort Worth International Airport. If we look at Verizon’s current 5G (excluding C-band) footprint around the airport using Ookla Cell Analytics below, we can see widespread 5G coverage across its terminal buildings, as well as surrounding highways. The operators have been at pains to point out that their C-band spectrum includes a 220 MHz wide guard band, utilizing the lower portion of the C-band, from 3.7 GHz to 3.8 GHz.

C-band spectrum resets the playing field for 5G in the US

C-band spectrum is considered a sweet spot for 5G, as it strikes a good balance between capacity and coverage. While its reach isn’t as wide as the lower frequency spectrum, it allows operators to add much more capacity while also allowing for significantly better geographical reach when compared to mmWave. At launch, AT&T and Verizon won’t be able to utilize all their C-band assets, being limited to 40 MHz and 60 MHz, respectively, until the end of 2023. Despite this, deployments in the 3.7 GHz band will drive a considerable uplift in performance, helping them begin to close the gap on T-Mobile. The recently announced results of a further auction of mid-band spectrum (3.45 GHz) highlight the importance of mid-band holdings among the US network operators, with AT&T and DISH emerging as the main winners, in the third most expensive spectrum auction in US history. Once made available, this spectrum will allow them to gain further ground on T-Mobile and Verizon (which holds a greater share of C-band spectrum).

If we look internationally at other markets where operators have deployed 5G in the C-band with similar bandwidths, we see 5G median download speeds well in excess of 100 Mbps for O2 in Germany and SFR in France. At the top end of the scale, Taiwan Mobile has deployed 5G in 60 MHz of C-band spectrum, but has pursued an aggressive 5G densification strategy in what is a very competitive 5G market to achieve median speeds approaching 300 Mbps.

Examining the transition from LTE to 5G in France, which launched 5G in the C-band in late November 2020, shows a considerable uptick in performance from day one. Median LTE download speeds in France were 35.30 Mbps in Q4 2020, while 5G median speeds were 94.66 Mbps once launched and have since advanced strongly to a high of 194.69 Mbps in Q4 2021.

While this indicates that both Verizon and AT&T may continue to play catch-up with T-Mobile upon the initial launch of 5G in the C-band, the margin of difference will be substantially reduced, and then it will largely come down to how many 5G cell sites each operator deploys, and when they can turn on additional spectrum resources — the race is on.

This is good news for consumers and businesses alike, and over time will help propel the U.S. up the Ookla Speedtest Global Index™, where it sits in 24th place as of December 2021, and languishes well behind global leaders such as South Korea and China in terms of absolute median speeds.

Ookla retains ownership of this article including all of the intellectual property rights, data, content graphs and analysis. This article may not be quoted, reproduced, distributed or published for any commercial purpose without prior consent. Members of the press and others using the findings in this article for non-commercial purposes are welcome to publicly share and link to report information with attribution to Ookla.

| December 12, 2021

UAE Extends its Lead as the Fastest Mobile Market on Earth


Consumer and business confidence returning to the UAE

The United Arab Emirates (UAE) economy showed strong signs of recovery in Q3 2021, with Dubai’s Consumer Confidence Index reaching its highest level since 2011 according to the Dubai Department of Economic Development. Stimulus measures and an accelerated vaccine campaign have played a crucial role in this recovery. IHS Markit UAE Purchasing Managers’ Index (PMI) for October returned the highest Index score since the start of the pandemic, with panelists pointing to the re-opening of the economy and in particular the launch of Expo 2020 in driving increased sales and investment.

With the economy reopening, national mobile operators Etisalat and du have reported increases in data consumption, in wholesale revenues and in the demand for 5G handsets. The UAE continues to occupy the number one position in Ookla’s Speedtest Global Index for October 2021 with a median mobile download speed of 127.81 Mbps, with Etisalat continuing to lead the market with a median download speed of 130.69 Mbps in Q3 2021.

ookla_performance_uae_1221-01

Etisalat retains its position as fastest 5G operator

Etisalat and du have focused heavily on driving further rollout and densification of their 5G networks over the past year. Despite strong competition from rival du, Etisalat remains the fastest operator for 5G, and the fastest operator overall within the UAE according to Ookla Speedtest Intelligence® data for Q3 2021, with its median 5G download speed of 416.30 Mbps faster than du’s 399.90 Mbps.

ookla_5g-network-performance_uae_1221-01

The Telecommunications and Digital Government Regulatory Authority (TDRA) of the UAE has targeted 5G coverage of all inhabited areas of the country by the end of 2025. To support this, the TDRA announced in June 2021 that 2G networks will be sunsetted by the end of 2022, with the spectrum refarmed for 5G use. Until universal 5G coverage is available in the UAE, LTE will continue to play an important role in providing broader coverage, but also support for older/non-5G devices. These still represent a majority within the market, and Speedtest Intelligence data shows that 62.3% of total tests run during Q3 2021 utilized non-5G networks, with the vast majority of those running over LTE. This is an area where Etisalat pulls well ahead, with its median LTE download speed of 94.54 Mbps in Q3 2021 1.9 times faster than that of its rival.

Qualcomm’s CEO Cristiano Amon recently predicted that the global chip shortage will begin to ease over the coming year, and with both Etisalat and du reporting strong demand for 5G devices, 2022 looks set to be a pivotal year for 5G adoption in the market. Etisalat is already looking to advance its network lead, having recently completed a custom 5G network spanning the Expo 2020 site, covering 4.38 square kilometers with over 8,500 mobile access points and in excess of 700km of fiber optic cable. Etisalat also announced in June 2021 that it is partnering with Ericsson to enable mmW across its 5G network, while du has already trialed the technology, and was the first to launch a mmW 5G base station in February 2020. If the UAE economy continues on its positive trajectory, supported by Expo 2020 which is set to run until the end of March 2022, then we fully expect the strong network competition between these two players to drive median speeds in the market yet higher.

Ookla retains ownership of this article including all of the intellectual property rights, data, content graphs and analysis. This article may not be quoted, reproduced, distributed or published for any commercial purpose without prior consent. Members of the press and others using the findings in this article for non-commercial purposes are welcome to publicly share and link to report information with attribution to Ookla.

| November 30, 2021

5G in Europe: EU Targets Require a Rethink

Monitoring progress of the EU’s Digital Decade

We recently attended the European 5G Observatory’s workshop, “5G in the Digital Decade,” which provided an overview of progress towards the EU’s 5G Action Plan targets and also looked ahead to the new targets as set out in the EU Digital Decade. The European Commission presented its vision of the region’s Digital Decade in March 2021, providing targets (the Digital Compass) for the digital transformation of Member States by 2030. Progress towards these targets is measured through the existing Digital Economy and Society Index (DESI), a key component of which focuses on connectivity. The relevant 2030 goals here are to provide Gigabit access to all EU households and 5G coverage in all populated areas.

The connectivity component of DESI is made up of a mix of demand and supply-side factors, including fixed and mobile broadband coverage and take-up, 5G spectrum availability and broadband pricing. The latest iteration was published in November using 2020 data, with Denmark, the Netherlands and Spain securing the top three spots for connectivity, and Greece and Bulgaria the bottom two.

ookla_desi_eu_markets_1121-01

As 5G evolves, so should the Commission’s 5G targets

The Commission’s DESI has evolved from its inception in 2014 to now track the Digital Compass’ targets. However, 5G is a rapidly evolving technology, and it was clear from the discussion during the Observatory’s workshop that there will be a need to review the actual targets and by implication the measurement criteria. The key concern lies in the “5G everywhere” target, both from a coverage and a performance perspective. As the end goal is the digital transformation of Member States, 5G coverage should be extended beyond the current target of all populated areas, to provide greater geographical coverage — in particular to support emerging vertical industry needs, for example in agriculture or logistics.

In terms of 5G performance, the ITU’s IMT-2020 requirements are for a user-experienced data rate of 100 Mbps download and 50 Mbps upload. However, not all 5G networks are created equally. The increasing use of dynamic spectrum sharing (DSS) means that operators can boost 5G coverage and capacity by using existing spectrum formerly dedicated to other generations of mobile technology. As a result, network performance will vary widely based on the bands used. There are also differences in 5G rollout, with initial 5G radio equipment tending to be deployed on existing tower infrastructure, and the coverage of higher capacity C-band spectrum will be limited relative to that of lower frequency bands as result.

ookla_median-download-speeds_europe_1121-01

Divergence between the DESI and end-user internet speed

What’s also interesting are the outliers and how their performance differs from their position within the DESI. Bulgaria (which came second to last in the connectivity portion of the DESI), does lag behind the European average on fixed broadband speeds, but is significantly faster on mobile speeds. Bulgaria’s median mobile download speed of 83.71 Mbps makes it the seventh fastest market globally. The reverse is true for Spain, which came third in the DESI, and where median fixed download speeds of 118.25 Mbps are well above the European average, putting it in 11th place globally, but where mobile speeds of 34.63 Mbps lag well behind the European average, and place it 51st globally. Other examples of divergence between the DESI and actual internet speeds on the ground include markets such as Belgium, Cyprus, Estonia and Lithuania.

To support Member States, the Commission has proposed a “Path to the Digital Decade”, a governance framework which in addition to the development of roadmaps at a Member State level and regular reporting on progress, will also include a framework to address progress shortfalls and support for multi-country projects. Member States have been encouraged to make use of the Recovery and Resilience Facility, an EU-wide fund of EUR 723.8 billion designed to mitigate the impact of the COVID-19 pandemic, from which they are required to devote at least 20% of their allocation to digital projects. As of October 2021, digital investment plans totalled 26% of the fund, of which 11% is dedicated to connectivity. With such significant public funds directed at improving connectivity, and the digital services that it underpins, the Commission must ensure that its targets and measurement methodology keep pace with the evolution of network technologies.

Ookla retains ownership of this article including all of the intellectual property rights, data, content graphs and analysis. This article may not be quoted, reproduced, distributed or published for any commercial purpose without prior consent. Members of the press and others using the findings in this article for non-commercial purposes are welcome to publicly share and link to report information with attribution to Ookla.

| September 28, 2021

TRAI Attempts to Kick-Start the Indian Fixed Broadband Market


Key takeaways

  • New fixed broadband speed categories of “Basic”, “Fast” and “Super-fast” throw the performance of Indian States under the spotlight.
  • Ookla® Speedtest Intelligence® data shows only 2.5% of current Indian fixed connections fail to meet TRAI’s new 2 Mbps broadband grade.
  • Delhi tops the list for “Super-fast” broadband connections (>300 Mbps), but that equates to a mere 1.5% of its connections; the remaining states fare worse, with Sikkim recording zero.
  • Rajasthan tops the list for “Fast” broadband connections (50 Mbps – 300 Mbps) at 45.9% of connections, while Gujarat and Maharashtra lag far behind with 19.8% and 25.8%, respectively.
  • Rural locations fare worse than urban, but the gap is not as large as expected, with 3.4% of rural connections failing to achieve broadband speeds, versus 2.3% of urban connections.

TRAI redefines broadband in India

TRAI, the Telecom Regulatory Authority of India, recently published a raft of recommendations as part of a “RoadMap to Promote Broadband Connectivity and Enhanced Broadband speed.” These are designed to help achieve the goals of the National Digital Communications Policy (NDCP-2018), which targets universal broadband provision of 50 Mbps, as well as breaking into the top-50 of the ITU’s ICT Development Index, by 2022.

The most prominent of these recommendations targets increased fixed broadband network rollout and adoption. According to TRAI, current broadband penetration levels in India are approximately 55%. Mobile accounts for the lion’s share of this, having grown strongly since the launch of 4G, while the Indian fixed broadband market remains underpenetrated, at approximately 9.1% of Indian households at the end 2020.

The details include a wide range of proposals designed to alleviate network deployment challenges, in particular relating to Right of Way (RoW) permissions, as well as encouraging India’s multitude of cable TV providers to offer broadband services. In addition, TRAI proposed a pilot Direct Benefit Transfer scheme, to subsidize broadband service in rural locations. Beyond these proposals, TRAI also recommended:

  • A change to India’s definition of broadband (for fixed and mobile), increasing from the current 512 Kbps to 2 Mbps from the point-of-presence (POP) of the service provider, to the subscriber
  • New categories of fixed broadband speed beyond this new baseline, including:
    • “Basic” (2-50 Mbps),
    • “Fast” (50-300 Mbps) and
    • “Super-fast” (>300 Mbps)

TRAI’s new speed tiers to drive improved internet performance

New speed tiers align India with ITU’s IDI Index

For TRAI, the introduction of a new minimum speed alongside speed tiers, helps it bring its definition of broadband into the present, while also allowing it to monitor and report on a key plank of the NDCP-2018 — India’s advancement up the ITU’s ICT Development Index (IDI).

Broadband definitions vary widely around the world in terms of throughput , from the original OECD definition of a minimum of 256 Kbps, which is still used in many markets, to markets such as the U.S., where even the current minimum of 25 Mbps download and 3 Mbps upload is no longer considered sufficient. Part of the rationale for TRAI’s recommended increase to the minimum download speed is that the 512 Kbps threshold introduced in 2013 can no longer handle even basic internet use cases. This has been thrown into sharp relief by the pandemic, which forced an unprecedented number of people to learn and work from home. In effect, traffic inflation has raised the minimum download speed for basic internet services in TRAI’s estimation to 2 Mbps. Furthermore, the introduction of speed tiers will allow Indian broadband performance to be linked to a new indicator the ITU has introduced within its ICT Development Index (IDI), in which the Indian Government is targeting a top-50 place by 2022.

Vast majority of fixed broadband connections already meet the new minimum speed threshold

Speedtest uses the Speedtest Server Network™, a global network of high-performance servers, ready to test the maximum sustained throughput of the user’s connection (download and upload speeds) and report back on key network health metrics. There are Speedtest servers in virtually every country and major population center worldwide, which means we can accurately reflect the service provided from the operator’s POP to the end-user. Our data shows only 0.5% of Indian fixed subscribers did not have access to broadband speeds under the old definition. The new definition doesn’t shift the needle much, increasing that underserved proportion of subscribers to 2.5% as of Q2 2021.

ookla_consumer-percentage_india_0921-01

The natural conclusion from the above chart is that TRAI should consider a higher speed threshold for its definition of broadband. When the United States Federal Communications Commission (F.C.C.) changed their definition of broadband in 2015, the proportion of U.S. households without access to broadband speeds hit 20%. However, with fixed broadband penetration in India below 10% of households, TRAI’s new definition serves as a marker in the sand, designed to track performance as the fixed broadband market begins to unlock.

Much emphasis is placed on the myriad of cable TV providers already present in the market, with TRAI’s recommendation on AGR fees, alongside other remedies, designed to encourage them to branch out and provide broadband to their customer bases. However, as detailed in TRAI’s submission to the DoT, many of these cable companies are sub-scale and rely on out-dated network infrastructure. If and when they start signing up internet customers, we may well see the proportion of users that fall below the broadband definition increase.

Wide variation in performance among Indian states

Access to India’s new broadband speed categories varies widely from state to state. The new minimum threshold for broadband only renders an additional 2% of households without access to broadband speeds, however this is skewed by India’s more populous states and cities. At a state/union territory level, this value varies from a low of 1.6% in Delhi, to a high of 7.6% in the largely rural State of Sikkim. This split continues when we look at the new broadband speed categories, with over 70% of connections in the States of Gujarat and Maharashtra falling into the “Basic” speed category, while almost half of connections in the States of Delhi, Rajasthan, Tamil Nadu, Chandigarh and Kamataka were at least “Fast” (>50 Mbps). The availability of “Super-fast” broadband in India is very low, ranging from a high of 1.5% of connections in Delhi, to 0% in Sikkim.

ookla_consumer-percentage_india_states_0921-01

Urban-rural performance gap not as wide as expected

Indian fixed broadband penetration remains low and is heavily skewed towards urban areas. While 65.1% of the Indian populace live in rural areas (based on World Bank estimates for 2020), TRAI data shows that they account for a mere 5.6% of total fixed broadband connections. A comparison of Speedtest Intelligence data against rural and urban locations (based on India’s 2011 census) fails to show a large disparity between the two when looking at TRAI’s new speed categories, with 58.7% of connections in urban areas falling within the “Basic” speed category, compared to 61.7% in rural areas.

ookla_consumer-percentage_india_urban_0921-01

A more detailed segmentation of performance between rural and urban areas shows a wider performance gap, with rural locations tending to have a higher proportion of connections supporting speeds of less than 25 Mbps, while urban locations had a much higher share of connections with speeds greater than 100 Mbps. This is understandable given the lack of a modern fixed network infrastructure in many parts of rural India, coupled with challenges that the country’s ambitious BharatNet infrastructure project has encountered.

Our data shows that many connections currently sit at the boundary between “Basic” and “Fast” broadband, and this should serve as encouragement to India’s providers to boost fixed network performance and thereby drive mass market adoption of “Fast” broadband.

New speed categories to provide more clarity on network performance to Indian consumers

In addition to driving faster speeds and improved availability of fixed broadband, these changes will bring more clarity for Indian consumers when selecting a fixed broadband subscription. At Ookla, we’re fully aware that reporting on network speeds helps spur network operator competition and infrastructure investment. Introducing speed categories goes one step further, as operators in countries that have implemented this will naturally begin to include these speed categories in their marketing and products. They will also target network investment at increasing the proportion of their footprint that supports higher-tier broadband speeds.

For the Indian government and TRAI, this move will provide much needed visibility into the state of broadband within India, to better track performance and the reach of different access technologies, and to target and tweak remedies and incentives to spur further adoption.

Ookla retains ownership of this article including all of the intellectual property rights, data, content graphs and analysis. This article may not be quoted, reproduced, distributed or published for any commercial purpose without prior consent. Members of the press and others using the findings in this article for non-commercial purposes are welcome to publicly share and link to report information with attribution to Ookla.