| July 30, 2023

U.A.E. – World’s Fastest 5G Market Driving Consumer Experience Gains

Key takeaways

  • Top-performing global 5G market and network operator. The U.A.E. was the fastest 5G market globally in Q2 2023 according to Ookla Speedtest Intelligence data, with growing competition between the nation’s two network operators helping to drive overall performance in the market to reach a median download speed of 557.63 Mbps. etisalat by e& was the fastest 5G operator globally with a median download speed of 680.73 Mbps.
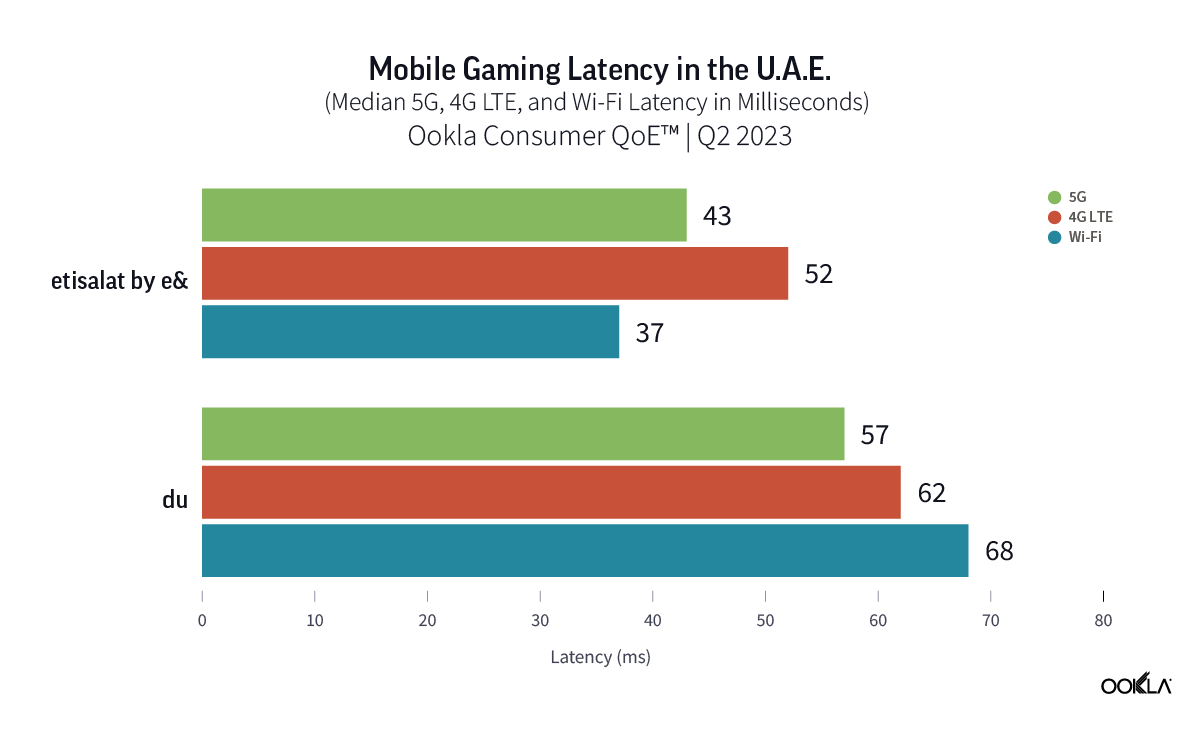
  • 5G networks trump 4G-LTE for mobile gaming and video streaming experiences. Users accessing both etisalat by e&’s and du’s 5G networks experienced median gaming latency of 43 ms and 57 ms respectively, lower than those recorded across 4G LTE. 5G users also experienced improved video start times and experienced less buffering when streaming video compared to those on either 4G LTE or Wi-Fi.
  • Improved network experience driving industry leading Net Promoter Scores (NPS). With 5G driving improved experiences across use cases such as mobile gaming and video streaming, and with the U.A.E. ranking first in terms of median 5G performance, it’s no surprise that NPS in the market are leading the industry. Indeed, 5G users in the market are more likely to recommend the nation’s networks when compared to 4G, with etisalat by e& leading the market with a score of 64.7 in Q2 2023, and du following with 46.7.
  • Lower 10% of Speedtest samples point to room for improvement. du led the market for 5G Consistency – the proportion of Speedtest samples that met a minimum performance threshold of 25 Mbps download and 5 Mbps upload during Q2 2023. Reviewing 5G performance of the lower 10% of samples at a city-level highlights where etisalat by e& has been targeting improvements, while du’s has seen its performance erode quarter-on-quarter.

Return to economic growth driving mobile market competition

etisalat by e& and du both launched commercially available 5G services across the U.A.E. in Q2 2019, following the allocation of spectrum for 5G use by U.A.E. regulator, the TDRA (Telecommunications and Digital Government Regulatory Authority). Since then, both operators have rolled out 5G networks aggressively, achieving near universal 5G population coverage as of 2022. Both operators have had to contend with a challenging macroeconomic environment brought on by the COVID-19 pandemic, which led to declining mobile revenues, constrained prepaid spending, and reduced roaming and device revenues.

However, 2022 saw growth return to the market with etisalat by e&’s U.A.E. mobile revenues increasing by 6.0% to reach 11,406 million AED, while du’s mobile revenues grew by 8.4% to reach 5,748 AED million. The outlook for the U.A.E. economy going forward is very positive, with the IMF predicting GDP growth of 3.5% in 2023, following a strong rebound in 2022 of 7.4% as COVID-19 restrictions were lifted, international visitors returned to the country and rising oil prices helped bolster economic growth. For the nation’s mobile network operators, this return to growth is driving increased competition as both operators seek to demonstrate network leadership, convert prepaid users to postpaid, while also focusing on driving enhanced customer experiences and offering new digital services.

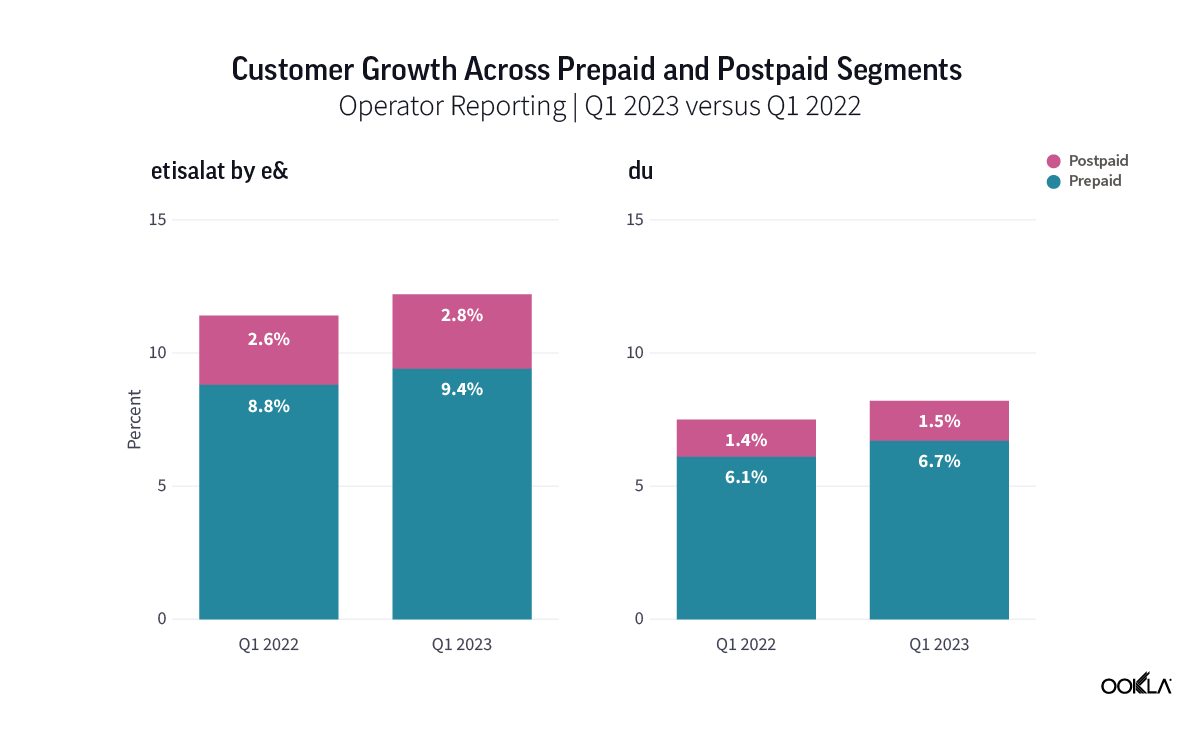
Both mobile network operators are prioritizing the growth of their postpaid customer bases. For example, subscribers of either operator can choose plans that allow them to pick and choose additional services with a strong focus on entertainment options, such as video streaming services, live sports, and mobile gaming, among others.

U.A.E. leads on 5G performance globally

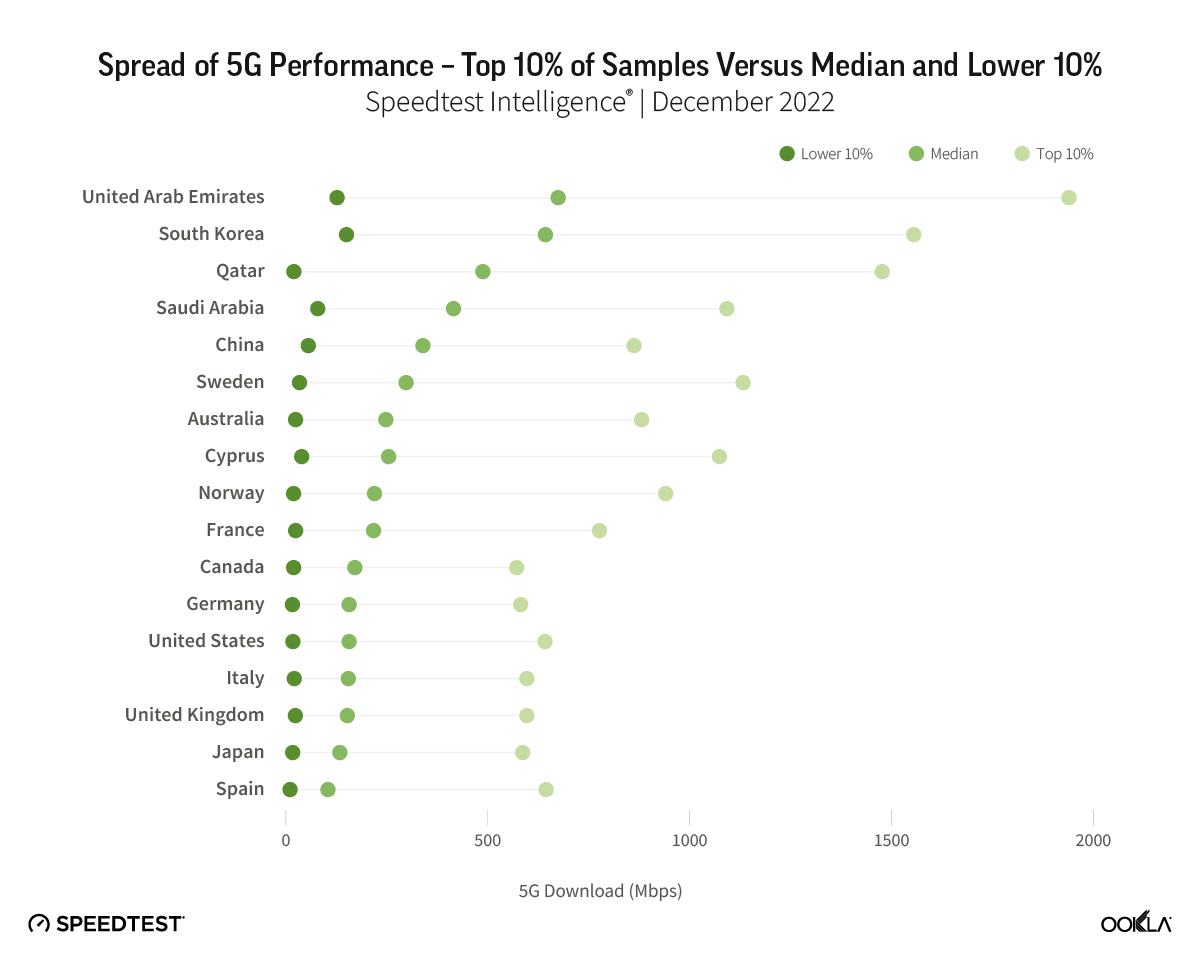
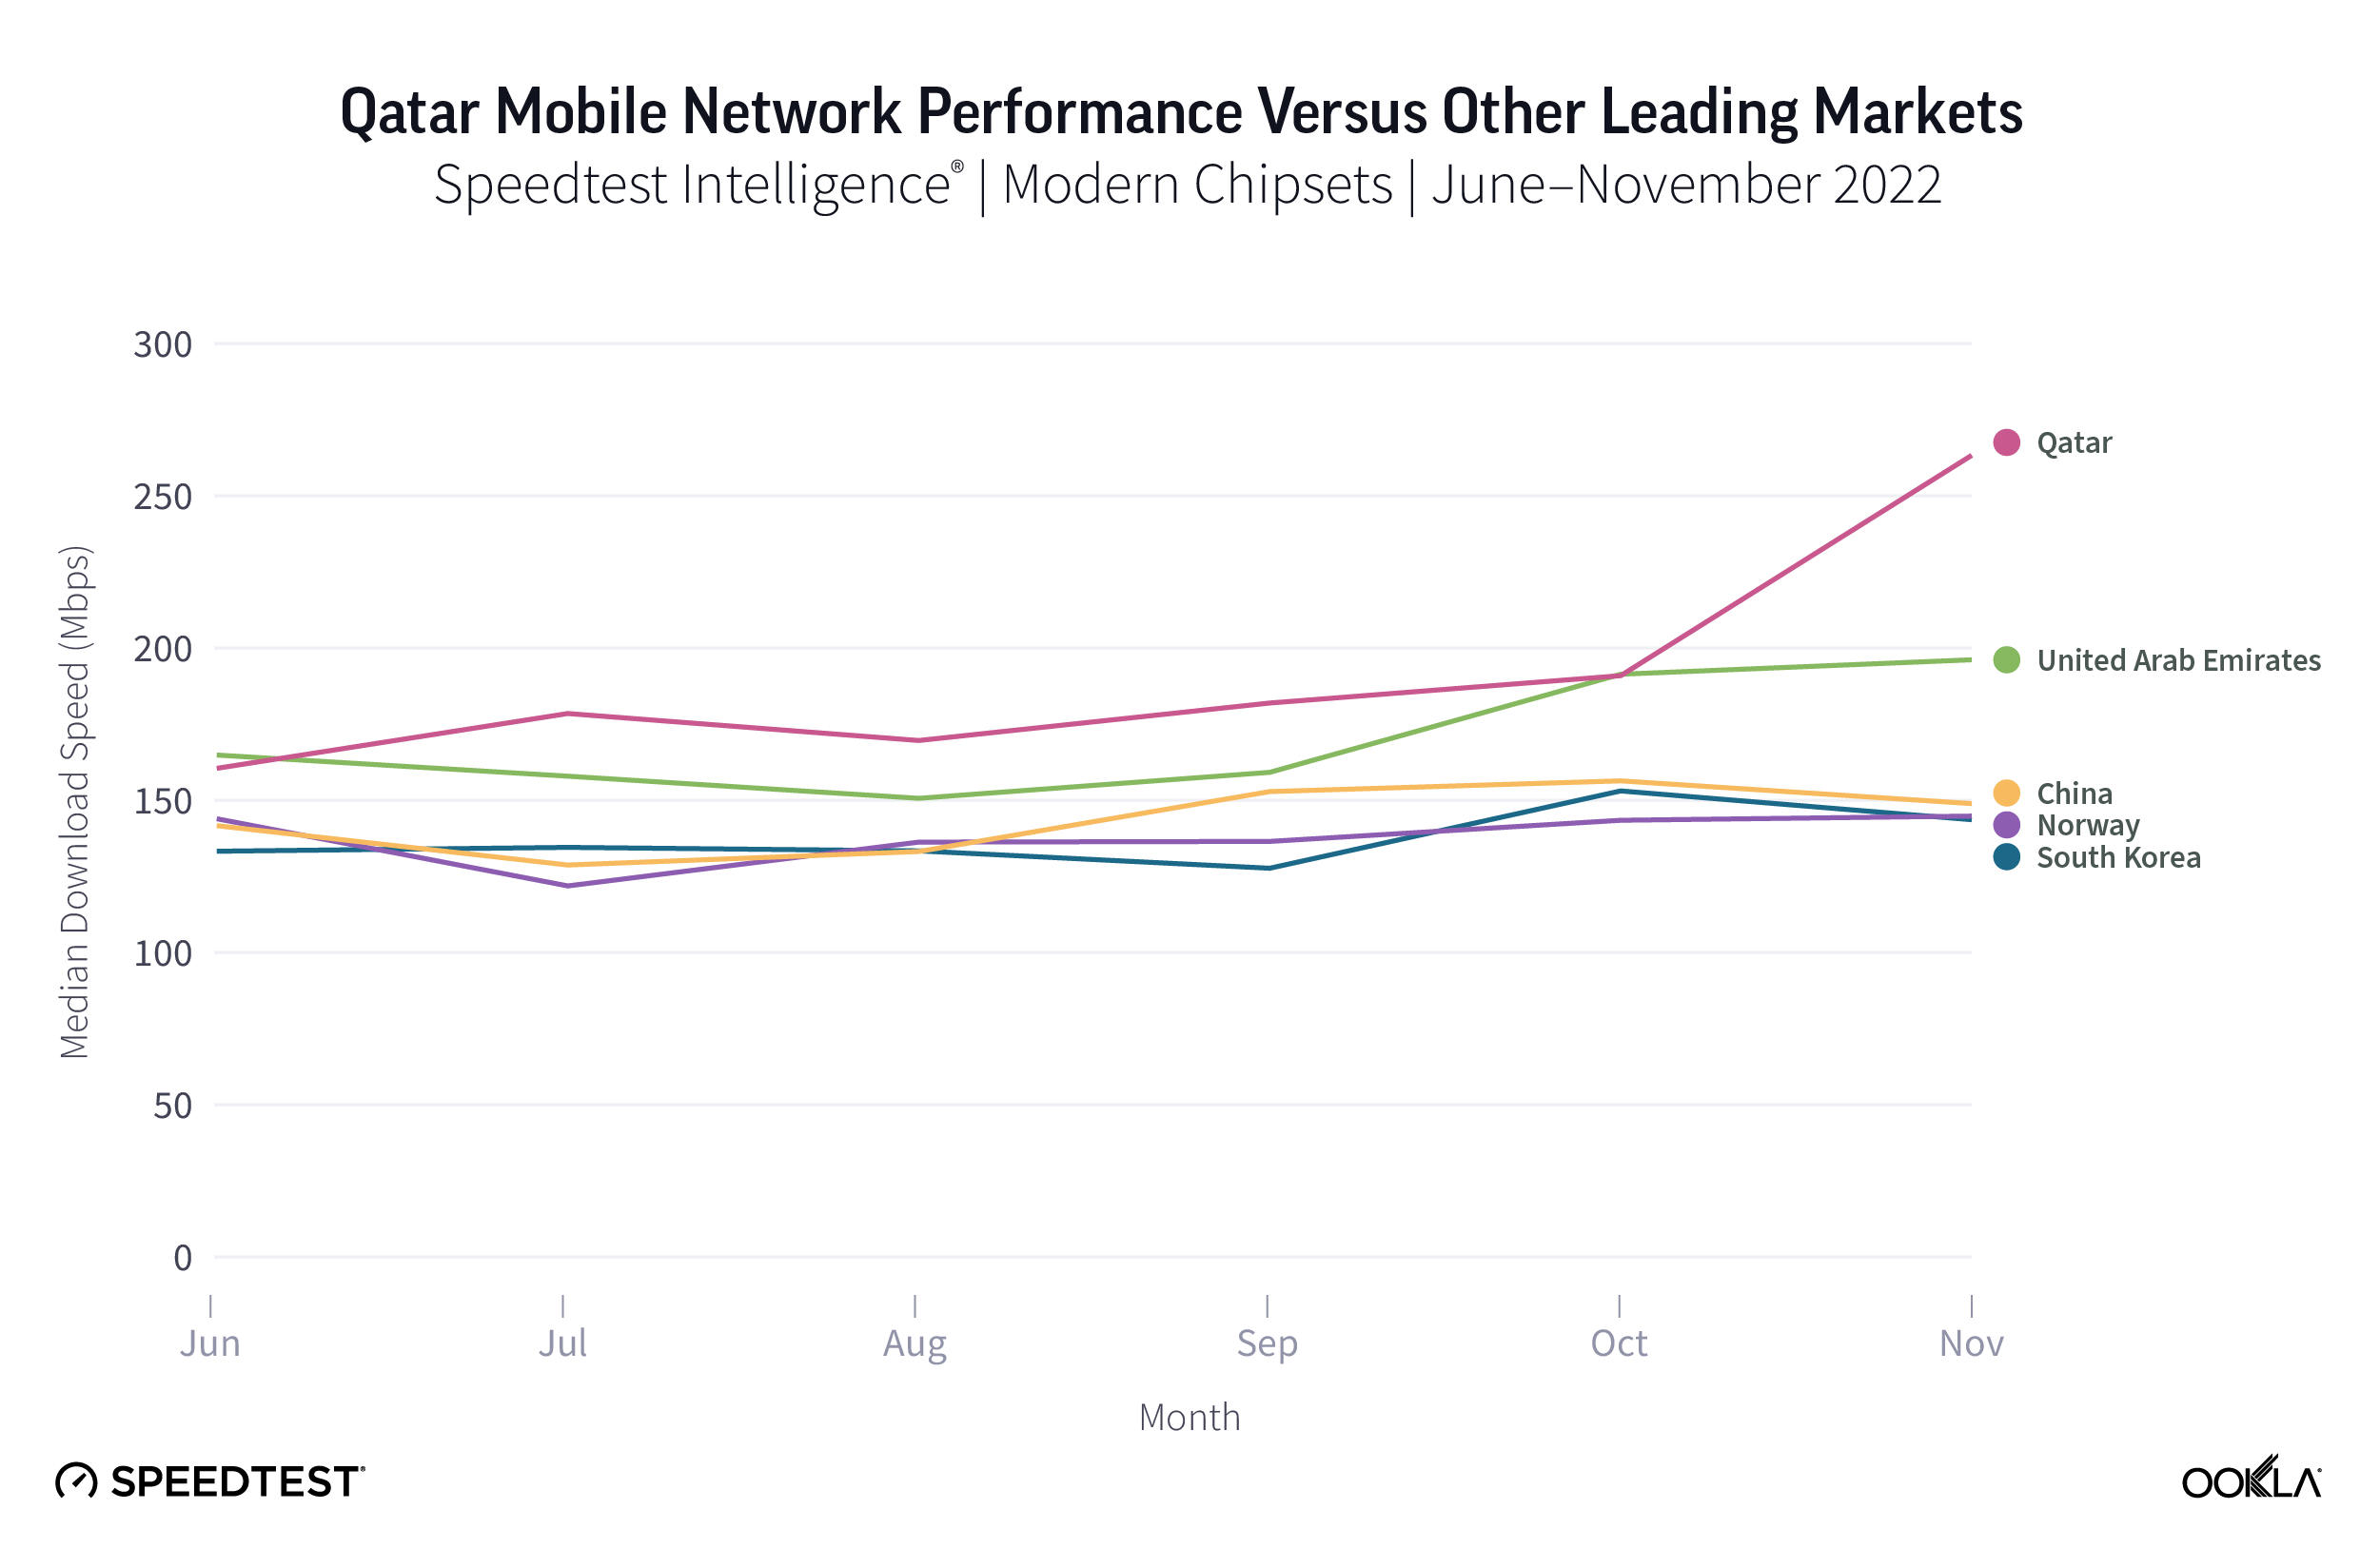
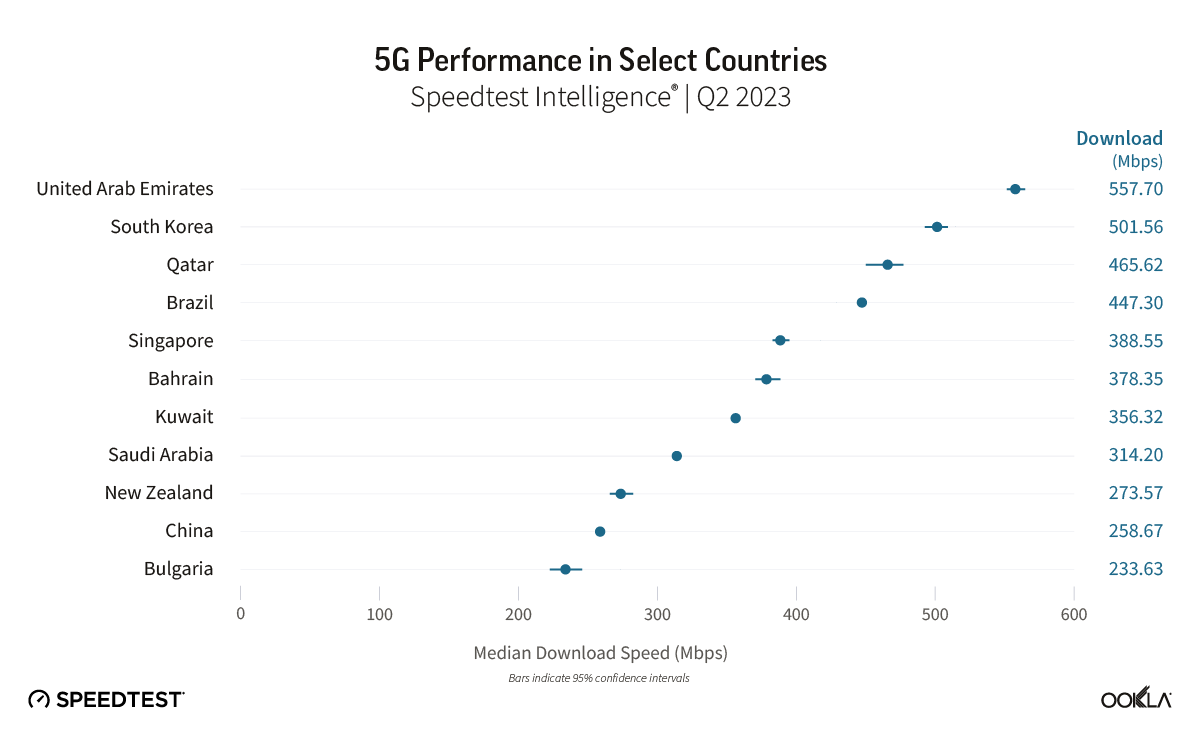
The U.A.E. was the fastest 5G market globally in Q2 2023, according to Ookla Speedtest Intelligence data, recording a median download speed of 557.63 Mbps, with South Korea placing second at 501.56 Mbps.

etisalat by e& places first in global 5G performance stakes

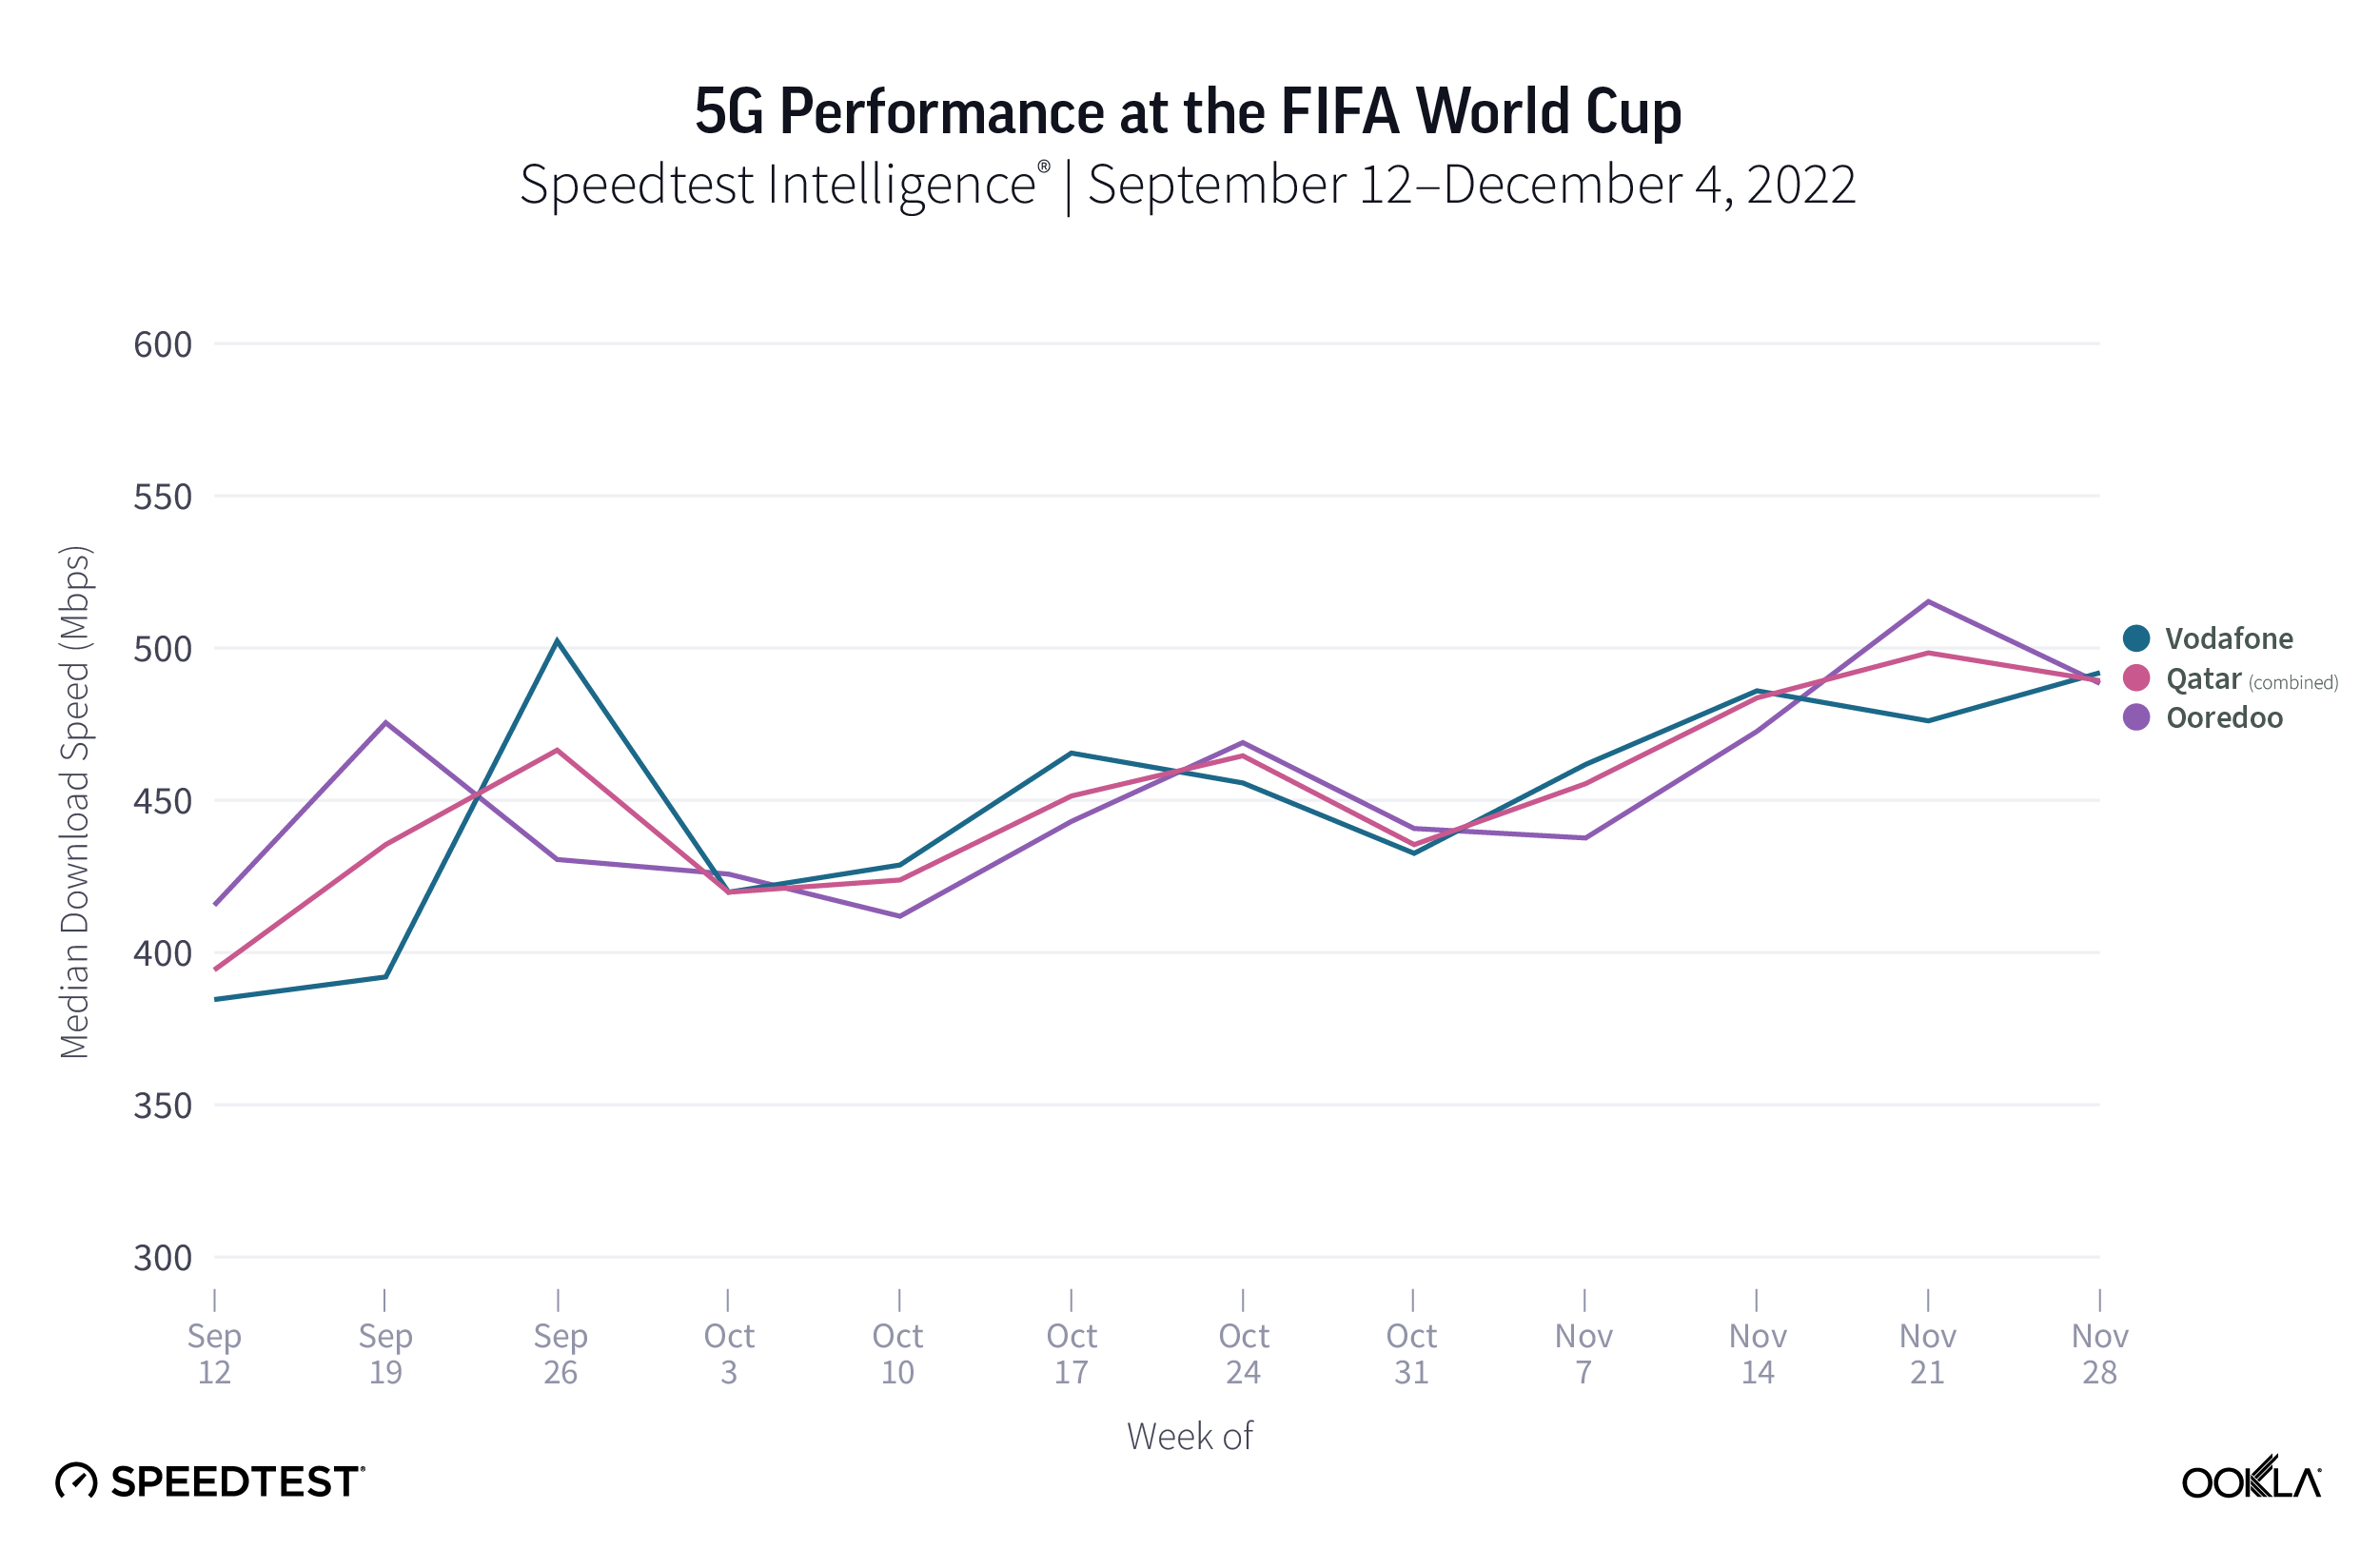
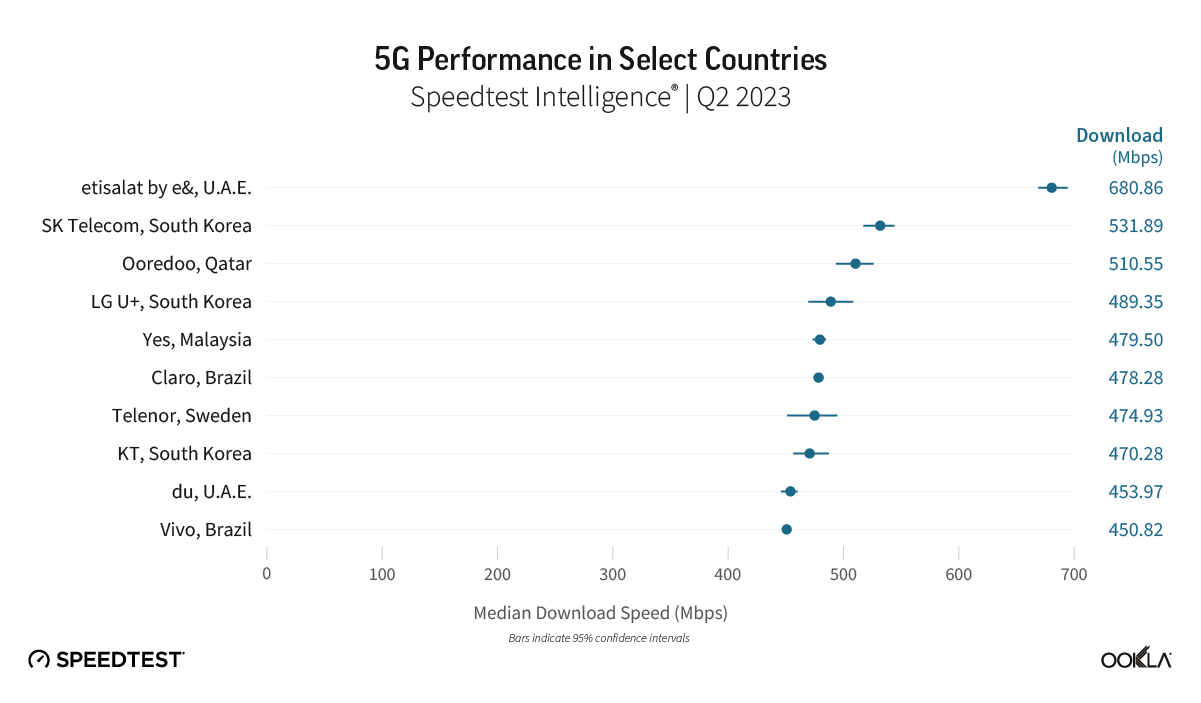
etisalat by e& was the fastest operator within the U.A.E. and globally on 5G, recording a median download speed of 680.73 Mbps during Q2 2023, ahead of du’s 453.93 Mbps. The same was true for 4G LTE, with etisalat by e& recording a median download speed of 83.35 Mbps, ahead of du’s 64.96 Mbps. 5G performance between the two mobile operators remained similar throughout 2022, peaking in time to support Dubai EXPO 2020. Both operators increased speeds through Q4 2022 and Q1 2023, helping drive overall 5G performance in the U.A.E. to reach 557.63 Mbps, but du’s performance declined in Q2 2023, with etisalat by e& extending its 5G performance lead to 226.80 Mbps.

Among a selection of the top-performing 5G networks globally by median download speed, etisalat by e& ranked first in Q2 2023. Du’s 5G performance also ranked it among the world’s fastest, which reflect the strong position of the GCC States, and leading markets in Asia Pacific, in terms of 5G performance.

Recent news indicates that both operators will continue to drive investment toward further performance gains, while also looking to offer new use cases over their 5G networks. At MWC Barcelona 2023, etisalat by e& announced the commercial launch of its 5G Standalone (SA) network in the U.A.E., which will initially be dedicated to fixed-wireless access (FWA) customers. At the same time, du announced an agreement with Huawei to collaborate on 5G-Advanced technology and use cases.

etisalat by e& leading on 5G download performance across U.A.E. cities

Speedtest Intelligence data showed that etisalat by e& was the leading operator across all major cities in the U.A.E. for both median 5G download performance and multi-server latency in Q2 2023. It also led on median 5G upload speed in Abu Dhabi, Dubai and Sharjah, however there was no statistically significant difference between it and du in Al Ain and Ajman.

Lower 10% of Speedtest samples point to need for further improvement

Median 5G performance allows us to gauge the midpoint of user experience on 5G networks, however it doesn’t always tell the full story, as 5G performance can vary widely, depending on factors such as the spectrum used, network congestion, and the distance and any obstacles between the user device and the cell site. Ookla tracks network Consistency, which for 5G networks records the proportion of samples which meet or exceed 25 Mbps download speed (the recommended speed for streaming in 4K) and 3 Mbps upload speed.

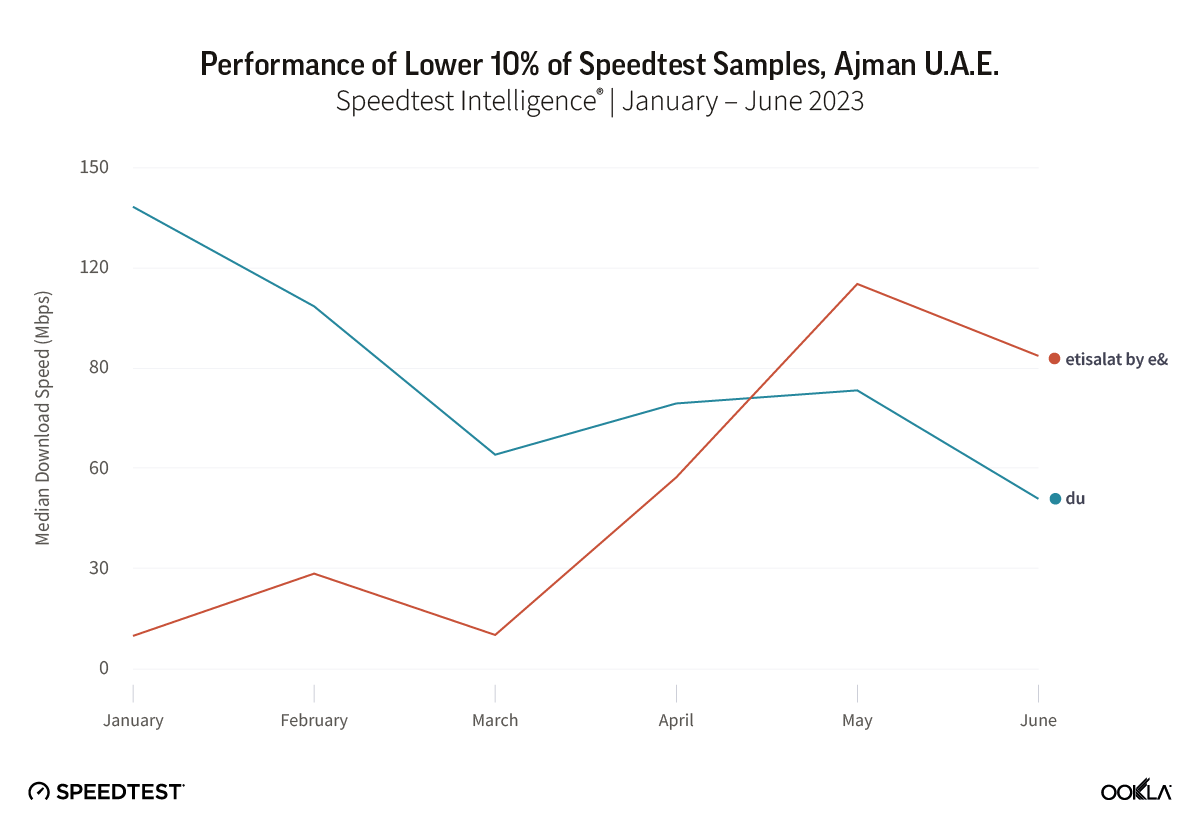
du and etisalat by e& both performed strongly on 5G Consistency, with scores of 92.1% and 90.9% respectively. Drilling down into the city-level data, and looking at performance for the lowest 10% of samples, reveals some potential improvement points for both operators. For the city of Ajman, etisalat by e& has recorded a significant improvement in the lower 10th percentile of 5G samples, increasing from 9.76 Mbps in January to 93.67 Mbps in June. However despite the increase, its performance in Ajman remains below that recorded in other U.A.E. cities. du on the other hand has returned more stable 5G performance among the lower 10% of samples in the city over the past six months, but is seeing performance decline, from 138.33 Mbps in January to 50.85 Mbps in June.

5G delivering improved mobile gaming and video streaming experiences

With both operators keen to grow their customer bases and prioritizing migration toward higher value postpaid subscribers, translating 5G performance gains into discernible improvements for the end-user experience is vital.

Consumers in the U.A.E. spent on average 4.7 hours per day playing mobile games during 2021, the most of all MENA markets, according to data.ai’s State of MENA 2022. Usage continues to grow, fueled by a young and tech-savvy population with high disposable income. 5G offers the potential for lower latency than previous generations of mobile technology, which alongside higher throughput, enables improved experiences for both consumer and enterprise use cases that rely on a high level of network responsiveness. This is particularly true for online gaming and cloud streaming of games. For example, network response times are critical for Call of Duty Mobile (which etisalat by e& has bundled with some of its postpaid plans.) 

According to Ookla Consumer QoE™ data, etisalat by e& recorded lower median latency across both its mobile and fixed networks when compared to du during Q2 2023. 5G latency for both operators was lower than for 4G LTE,  with etisalat by e& achieving a 5G latency of 43 ms, and du 57 ms. Wi-Fi performance differed between the operators, with etisalat by e&’s Wi-Fi recording the lowest latency across all access types, while du’s Wi-Fi latency lagged behind its mobile network latency performance.

Video content is a primary focus for both network operators in the U.A.E. and a common route for operators globally to add value to consumer mobile subscriptions. We examined Ookla Consumer QoE data, looking at two key video streaming metrics as measures of the consumer experience delivered: video start time and video rebuffering ratio.

Video start time measures the time between when a user clicks play, or the video auto-starts, and when the first frame of a video is rendered. Based on Ookla’s Consumer QoE data for Q2 2023, our results showed that 5G networks offered a faster video start time for both network operators compared to their 4G LTE or Wi-Fi networks, of almost half a second.

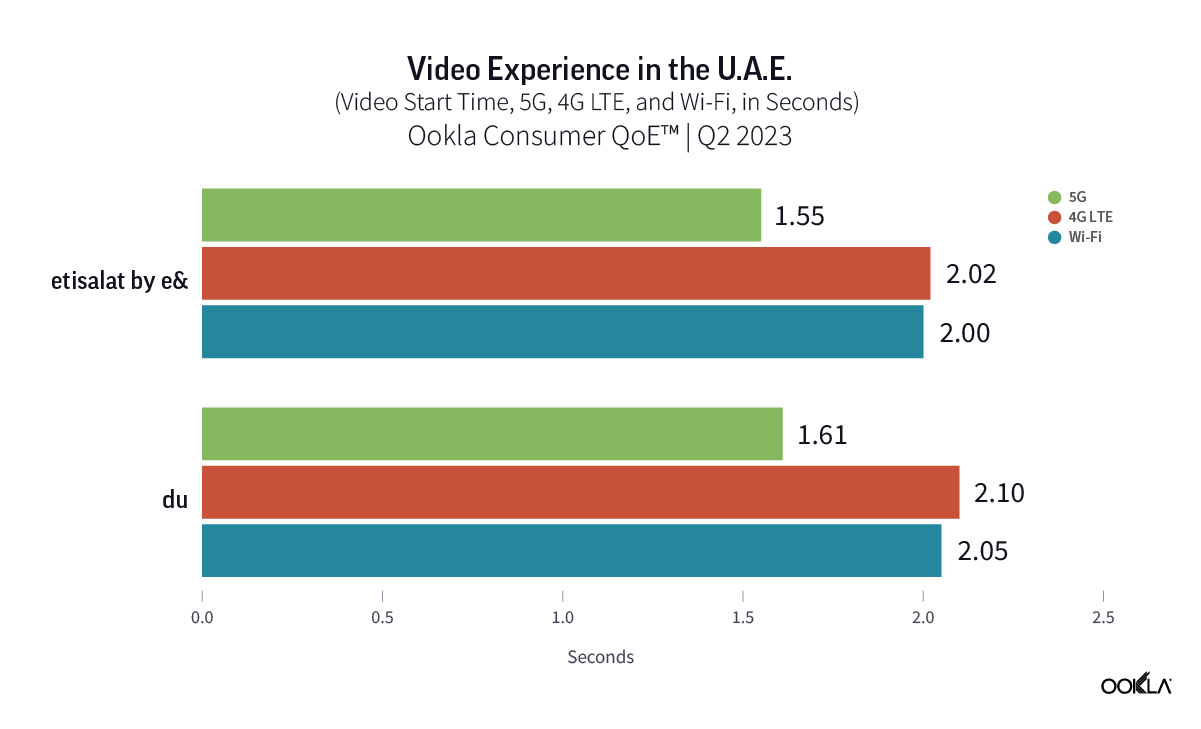
Video rebuffering ratio compares the time users have experienced buffering during a video to the total playtime of the video, excluding the initial video start time. Rebuffering occurs when the video stalls during playback and the user must wait for the video to resume. It is a major source of poor quality of experience, and if rebuffering is severe enough, it can lead to audience abandonment and can also serve as an indication of poor overall network performance. In good news, Ookla’s Consumer QoE data for Q2 2023 showed a substantial reduction in median video rebuffering ratios for both network operators, with rebuffering reduced to nearly 0% on 5G for both networks.

5G driving an uplift in industry-leading NPS scores for both operators

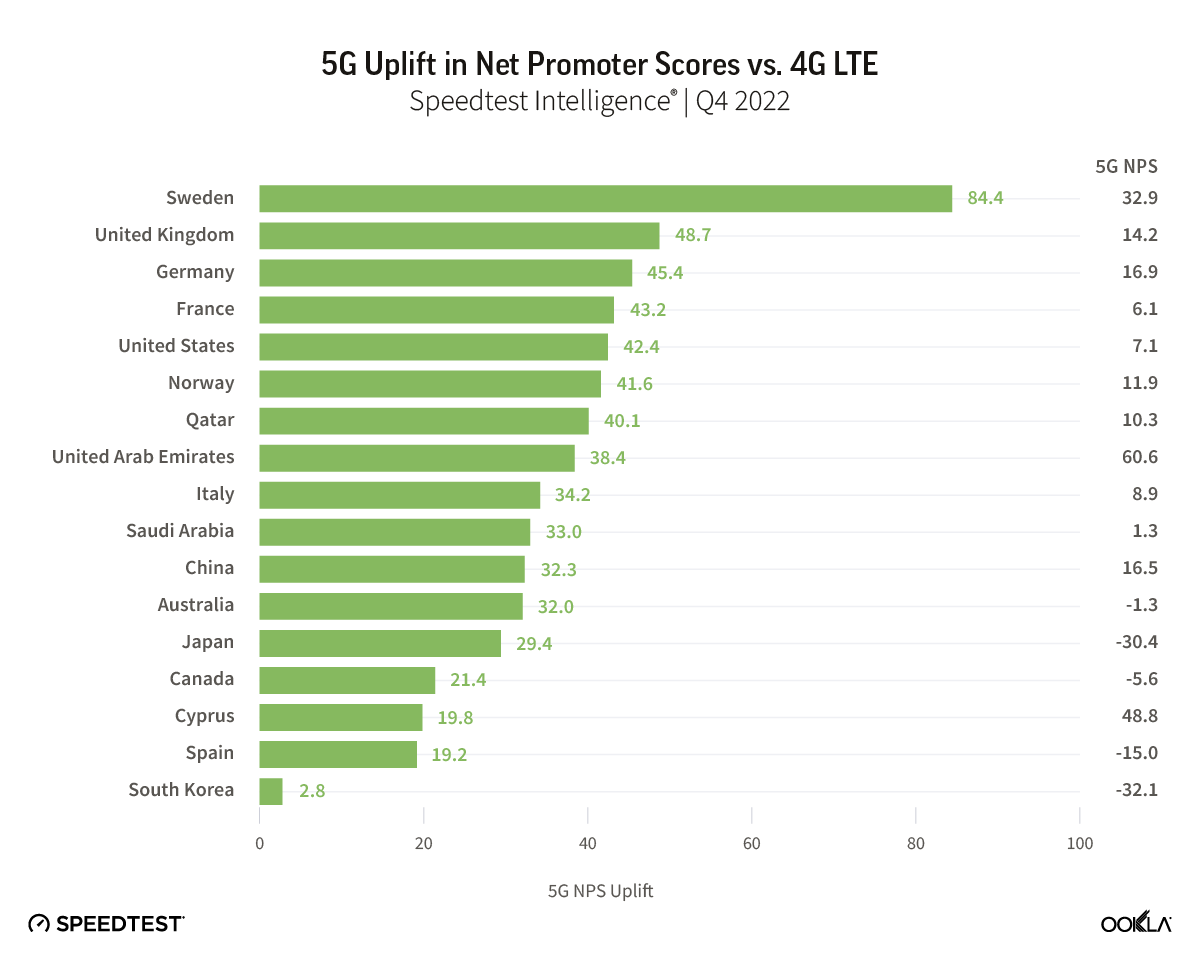
With the fastest median 5G download performance globally, it’s no surprise that NPS for 5G users within the U.A.E. are leading the industry. NPS is a key performance indicator of customer experience, categorizing users into Detractors (score 0-6), Passives (score 7-8), and Promoters (score 9-10), with the NPS representing the percentage of Promoters minus the percent of Detractors, displayed in the range from -100 to 100. 

Ookla’s Speedtest Intelligence data showed that du’s 5G service recorded the largest difference in NPS when comparing users on its 4G LTE network to those on 5G during Q2 2023, with an uplift of 61.0 basis points to reach 46.7. etisalat by e& recorded the higher NPS scores on its 5G network, of 64.7, while its 4G LTE NPS score of 40.4 was equally impressive.

Both operators in the U.A.E. are in prime position to capitalize on their 5G network investment to date, which is already helping drive improved consumer experiences on their networks. They are also poised to take advantage of the deployment of 5G Standalone networks in the market, offering further performance gains, but also opening up opportunities to target services for key enterprise verticals that among other things often demand highly reliability, as well as low latency communications.

Ookla retains ownership of this article including all of the intellectual property rights, data, content graphs and analysis. This article may not be quoted, reproduced, distributed or published for any commercial purpose without prior consent. Members of the press and others using the findings in this article for non-commercial purposes are welcome to publicly share and link to report information with attribution to Ookla.

| July 17, 2023

48 New Ookla Market Reports Available for Q2 2023

Ookla® Market Reports™ identify key data about internet performance in countries across the world. This quarter we’ve provided updated analyses for 48 markets using Speedtest Intelligence® and summarized a few top takeaways below. Click through to the market report to see more details and charts about the countries you’re interested in, including the fastest fixed broadband providers and mobile operators, who had the most consistent service, and 5G and device performance in select countries during Q2 2023. Jump forward to a continent using these links:

Africa | Americas | Asia | Europe | Oceania

Africa

  • Cameroon: Speedtest Intelligence data showed no winner for fastest mobile operator in Cameroon during Q2 2023. blue had the lowest median mobile multi-server latency at 191 ms, while Douala had the fastest median mobile download speed among Cameroon’s most populous cities at 15.51 Mbps.
  • Ethiopia: Safaricom had the fastest median mobile download speed at 35.19 Mbps during Q2 2023. Safaricom also recorded the lowest median mobile multi-server latency at 42 ms, and highest Consistency of 89.4%. Of Ethiopia’s most populous cities, Gondar had the fastest median mobile download speed of 61.22 Mbps.
  • Tanzania: There were no winners over fastest mobile or fixed broadband in Tanzania during Q2 2023. Maisha Broadband registered the lowest median multi-server latency in Tanzania at 14 ms. Of Tanzania’s most populous cities, Dar es Salaam had the fastest median mobile download speed of 26.33 Mbps, while Mbeya had the fastest median fixed download speed of 21.32 Mbps.

Americas

  • Argentina: Personal had the fastest median download speed over mobile (35.05 Mbps) and lowest mobile multi-server latency (38 ms) during Q2 2023. In the fixed broadband market, Movistar recorded the fastest median download speed (98.37 Mbps) and lowest multi-server latency (12 ms). Among Argentina’s most populous cities, Buenos Aires recorded the fastest download speeds across mobile and fixed broadband networks.
  • Belize: Digi had the fastest median mobile download and upload speeds of 17.61 Mbps and 9.88 Mbps respectively during Q2 2023. It also recorded the highest Consistency of 79.8%. smart! recorded the lowest median mobile multi-server latency, of 67 ms. NEXGEN had the fastest median download and upload performance over fixed broadband in Belize at 48.65 Mbps and 47.38 Mbps respectively.
  • Canada: Bell was the fastest mobile operator in Canada with a median download speed of 116.59 Mbps in Q2 2023. Bell also had the fastest median 5G download speed at 208.05 Mbps. Rogers had the fastest median mobile upload speed of 13.29 Mbps, and the highest Consistency of 84.7%. Bell pure fibre was fastest for fixed broadband across both download (277.24 Mbps) and upload (235.27 Mbps) speeds. Of Canada’s most populous cities, St. John’s recorded the fastest median mobile download speed (214.29 Mbps) and Fredericton recorded the fastest median fixed download speed (239.28 Mbps). 
  • Colombia: Movistar was fastest for fixed broadband with a median download speed of 161.28 Mbps in Q2 2023. ETB had the lowest median multi-server latency over fixed broadband at 8 ms. Of Colombia’s most populous cities, Cartagena recorded the fastest median fixed download speed of 109.01 Mbps.
  • Costa Rica: Claro had the fastest median download and upload speeds among mobile operators at 51.88 Mbps and 12.56 Mbps respectively. Liberty had the lowest mobile multi-server latency at 34 ms, and the highest Consistency at 79.7%. Metrocom was fastest for fixed broadband download and upload performance, at 192.00 Mbps and 143.94 Mbps respectively.
  • Dominican Republic: Claro had the fastest median download and upload speeds among mobile operators at 30.60 Mbps and 8.70 Mbps respectively. Viva had the lowest mobile multi-server latency at 44 ms. SpaceX’s Starlink was fastest for fixed broadband at 57.31 Mbps.
  • Ecuador: CNT was the fastest mobile operator in Ecuador with a median download speed of 28.45 Mbps in Q2 2023. It also recorded the highest Consistency of 81.5%. Movistar registered the lowest median multi-server latency in Ecuador at 39 ms. Netlife was fastest for fixed broadband, at 78.36 Mbps.
  • El Salvador: Claro had the fastest median download and upload speeds among mobile operators at 42.00 Mbps and 15.42 Mbps respectively. Movistar registered the lowest median multi-server latency in El Salvador at 65 ms. Cable Color recorded the fastest median fixed download speed (51.14 Mbps), upload speed (47.58 Mbps), and lowest median multi-server latency (35 ms).
  • Guatemala: Claro was the fastest mobile operator in Guatemala with a median download speed of 34.67 Mbps and median upload speed of 20.68 Mbps. Claro also had the highest Consistency with 84.4% of results showing at least a 5 Mbps minimum download speed and 1 Mbps minimum upload speed. Claro was also fastest for median fixed download performance, at 40.60 Mbps, while Cable Color was fastest for fixed upload performance, at 26.85 Mbps, and had the lowest median multi-server latency, of 35 ms.
  • Guyana: ENet was the top performing operator in the market, recording a median mobile download and upload speed of 67.58 Mbps and 20.92 Mbps respectively, and a median fixed download and upload speed of 62.40 Mbps and 39.66 Mbps respectively, in Q2 2023. ENet also recorded the lowest median multi-server latency across mobile and fixed networks.
  • Haiti: Digicel was the fastest mobile operator in Haiti with a median mobile download speed of 10.53 Mbps and median upload speed of 6.99 Mbps. SpaceX Starlink had the fastest median fixed download speed at 60.24 Mbps, while Natcom had the fastest median fixed upload speeds (17.76 Mbps) and lowest median fixed multi-server latency at 32 ms. 
  • Jamaica: Flow was the fastest mobile operator in Jamaica with a median download speed of 35.56 Mbps. Flow also had the lowest mobile median multi-server latency at 36 ms. SpaceX Starlink had the fastest median fixed speeds at 84.93 Mbps.
  • Mexico: Telcel had the fastest median download speed over mobile at 48.76 Mbps, and for 5G at 223.93 Mbps. Telcel also had the lowest mobile median multi-server latency at 64 ms. Totalplay was fastest for fixed broadband (87.03 Mbps) and had the lowest median multi-server latency at 24 ms. Among Mexico’s most populous cities, Guadalajara recorded the fastest median mobile download speed of 39.13 Mbps, and Monterrey the fastest median fixed download speed of 78.30 Mbps.
  • Peru: Claro was the fastest mobile operator with a median download speed of 22.67 Mbps, and had the highest mobile network Consistency in the market with 80.4%. Apple devices had the fastest median download speed among top device manufacturers at 29.68 Mbps.
  • Trinidad and Tobago: Digicel had the fastest median download speed over mobile at 37.34 Mbps, and highest Consistency of 87.7%. Digicel+ had the fastest median fixed broadband download and upload speed at 99.11 Mbps and 98.32 Mbps respectively, and the lowest median multi-server latency at 7 ms.
  • United States: T-Mobile was the fastest mobile operator with a median download speed of 164.76 Mbps. T-Mobile also had the fastest median 5G download speed at 220.00 Mbps, and lowest 5G multi-server latency of 51 ms. Spectrum edged out Cox as the fastest fixed broadband provider with a median download speed of 243.02 Mbps. Verizon had the lowest median multi-server latency on fixed broadband at 15 ms.
  • Venezuela: Digitel was the fastest mobile operator with a median download speed of 9.53 Mbps, and had the highest mobile network Consistency in the market with 58.1%. Airtek Solutions had the fastest fixed median download speed of 73.44 Mbps, and lowest median multi-server latency at 8 ms.

Asia

  • Afghanistan: The fastest mobile operator in Afghanistan was Afghan Wireless with a median download speed of 7.17 Mbps. It also had the lowest median multi-server latency at 78 ms, and highest Consistency of 58.1% in Q2 2023.
  • Bangladesh: Banglalink was the fastest mobile operator in Bangladesh with a median download speed of 23.47 Mbps in Q2 2023. DOT Internet was the fastest fixed broadband provider with a median download speed of 90.88 Mbps and had the lowest median multi-server latency at 4 ms.
  • Bhutan: There was no fastest mobile operator in Bhutan during Q2 2023, but TashiCell had the lowest median multi-server latency at 42 ms, and offered the highest Consistency in the market with 83.8%.
  • Brunei: There was no statistical winner for fastest mobile download performance during Q2 2023 in Brunei, but Apple devices had the fastest median download speed at 143.97 Mbps.
  • Cambodia: Cellcard recorded the fastest median mobile download speeds at 31.60 Mbps during Q2 2023. SINET had the fastest median fixed download speed at 42.26 Mbps.
  • China: China Mobile was the fastest mobile operator with a median download speed of 132.81 Mbps. China Mobile also had the fastest median mobile 5G download speed at 279.14 Mbps. China Unicom was fastest for fixed broadband at 222.22 Mbps.
  • Georgia: There was no statistical winner for fastest mobile download performance during Q2 2023 in Georgia. Geocell recorded the lowest median mobile multi-server latency at 39 ms, while Magti recorded the highest mobile Consistency with 90.0%. MagtiCom had the fastest median fixed speed at 27.81 Mbps. MagtiCom also had the lowest median multi-server latency at 11 ms.
  • Indonesia: Telkomsel was the fastest Indonesian mobile operator with a median download speed of 28.71 Mbps. Telkomsel also had the lowest median mobile multi-server latency at 46 ms.
  • Japan: There was no statistical winner for fastest mobile download performance during Q2 2023 in Japan, however Rakuten recorded the fastest mobile upload speed at 19.90 Mbps. So-net had the fastest fixed download and upload speeds, at 276.58 Mbps and 179.51 Mbps respectively, and the lowest median multi-server latency at 9 ms.
  • Malaysia: TIME was the fastest fixed provider in Malaysia with a median download speed of 108.38 Mbps, and had the lowest multi-server latency at 9 ms.
  • Pakistan: Transworld had the fastest median fixed broadband download speed in Pakistan at 17.10 Mbps, and the highest Consistency, at 36.6%.
  • Philippines: Smart delivered the fastest median mobile download speed in the Philippines at 35.39 Mbps. 
  • South Korea: SK Telecom recorded the fastest median mobile download and upload speeds at 161.16 Mbps and 16.37 Mbps respectively. LG U+ had the lowest median multi-server latency in the market at 63 ms. KT delivered the fastest median fixed download speed at 131.09 Mbps.
  • Sri Lanka: SLT-Mobitel delivered the fastest mobile and fixed broadband speeds in Sri Lanka at 20.71 Mbps and 38.97 Mbps, respectively in Q2 2023. Dialog had the lowest median mobile multi-server latency at 35 ms, and the highest Consistency, at 81.8%.
  • United Arab Emirates: etisalat by e& recorded the fastest median download speeds across both mobile and fixed, at 216.65 Mbps and 261.98 Mbps respectively in Q2 2023. etisalat by e& also had the fastest median 5G download speed at 680.88 Mbps and lowest median mobile multi-server latency at 35 ms. du recorded the lowest fixed multi-server latency, at 12 ms.
  • Vietnam: Vinaphone had the fastest median mobile download speed in Q2 2023, at 52.58 Mbps. It also had the lowest median mobile multi-server latency at 34 ms, and highest Consistency at 94.8%. Viettel was the fastest fixed provider with a median download speed of 105.72 Mbps.

Europe

  • Albania: Digicom was the fastest fixed broadband provider in Albania in Q2 2023, recording a median download speed of 93.40 Mbps. It also recorded the highest Consistency in the market, at 86.0%. There was no winner for fastest mobile operator in the market.
  • Belgium: Proximus recorded the fastest median mobile download speed during Q2 2023, at 78.01 Mbps. It also recorded the highest Consistency in the market, at 90.5%. Telenet had the fastest median fixed download speed at 143.42 Mbps. Among Belgium’s most populous cities, Ghent recorded the fastest median mobile download speed of 187.90 Mbps, and Antwerp the fastest median fixed download speed of 87.72 Mbps.
  • Denmark: YouSee was the fastest mobile operator in Denmark with a median download speed of 140.59 Mbps. Hiper was fastest for fixed broadband at 268.02 Mbps.
  • Estonia: The fastest mobile operator in Estonia was Telia with a median download speed of 101.32 Mbps. Telia also had the lowest median multi-server latency on mobile at 31 ms. Elisa was the fastest fixed broadband provider, with a median download speed of 94.70 Mbps.
  • Finland: DNA had the fastest median mobile download speed at 99.07 Mbps. Lounea was fastest for fixed broadband at 105.84 Mbps and had the lowest median multi-server latency at 11 ms.
  • Germany: Telekom was the fastest mobile operator in Germany with a median download speed of 93.39 Mbps, and a median download speed with 5G at 187.25 Mbps. Vodafone recorded the fastest fixed broadband performance, with a median download speed at 121.76 Mbps. It also recorded the highest Consistency in the market, at 83.8%.
  • Latvia: BITĖ was the fastest mobile operator in Latvia during Q2 2023, with a median download speed of 114.51 Mbps. LMT recorded the lowest mobile multi-server latency, at 26 ms.  Balticom was fastest for fixed broadband with a median download speed of 243.92 Mbps. Balticom also had the lowest median fixed broadband multi-server latency at 4 ms.
  • Lithuania: The mobile operator with the fastest median download speed was Telia at 117.68 Mbps in Q2 2023. It also recorded the highest Consistency in the market, at 95.0%. Cgates was fastest for fixed broadband with a median download speed at 161.67 Mbps.
  • Poland: UPC was the fastest provider for fixed broadband with a median download speed of 223.32 Mbps in Q2 2023. There was no statistical winner for fastest mobile operator during Q2 2023, however Plus recorded the fastest median 5G download performance, at 153.19 Mbps.
  • Switzerland: Salt blazed ahead for the fastest fixed broadband in Switzerland, with a median download speed of 358.73 Mbps. Salt also had the lowest median multi-server latency over fixed broadband at 8 ms, and highest Consistency in the market, at 94.1%.
  • Turkey: Turkcell was the fastest mobile operator in Turkey with a median download speed of 58.52 Mbps. Türk Telekom had the lowest median mobile multi-server latency at 39 ms. TurkNet was fastest for fixed broadband, with a median download speed of 62.80 Mbps. It recorded the lowest median fixed multi-server latency, at 13 ms, and highest Consistency, at 80.5%. Among Turkey’s most populous cities, Istanbul recorded the fastest median download speeds across mobile and fixed, of 39.89 Mbps, and 40.27 Mbps respectively.

Oceania

  • New Zealand: Speedtest Intelligence data showed no winner for fastest mobile operator in New Zealand during Q2 2023. 2degrees had the lowest median mobile multi-server latency at 40 ms, and the highest Consistency, at 91.6%.

The Speedtest Global Index is your resource to understand how internet connectivity compares around the world and how it’s changing. Check back next month for updated data on country and city rankings, and look for updated Ookla Market Reports with Q3 2023 data in October.

Ookla retains ownership of this article including all of the intellectual property rights, data, content graphs and analysis. This article may not be quoted, reproduced, distributed or published for any commercial purpose without prior consent. Members of the press and others using the findings in this article for non-commercial purposes are welcome to publicly share and link to report information with attribution to Ookla.

| July 5, 2023

Combating 5G Battery Drain Concerns

Chipset vendors driving generational efficiency gains

  • 5G use drains your smartphone battery faster than 4G-LTE. Ookla® Speedtest Intelligence® data shows that smartphone users accessing 5G networks experience higher battery drain than for those using 4G-LTE, of between 6% and 11%, depending on the System on Chip (SoC) in their device.
  • Qualcomm’s Snapdragon is the most efficient Android SoC. Qualcomm’s latest flagship SoC, the Snapdragon 8 Gen 2, recorded the lowest battery drain of all SoCs in our analysis, recording 31% for users on 5G, and 25% on 4G-LTE.
  • Newer flagship SoCs demonstrate clear improvements in battery performance. While the gap in battery drain between 4G-LTE and 5G use does not appear to be closing over time, newer generations of SoC from Qualcomm, MediaTek, Samsung and Google all demonstrate battery efficiency gains over previous iterations. MediaTek’s latest flagship SoC, the Dimensity 9200 for example, recorded 34% battery drain when using 5G, compared to 45% for its previous generation, the Dimensity 9000.
  • Smartphone users concerned about 5G’s impact on battery life should consider upgrading. For users with 5G-capable devices camping on 4G-LTE networks due to battery life concerns, an upgrade to the latest flagship smartphone (and SoC) and enabling 5G service will in some cases deliver comparable battery performance. Qualcomm’s Snapdragon 8 Gen 2 for example recorded battery drain of 31% when using 5G, compared to 32% for the previous generation Snapdragon 8 Gen 1 on 4G-LTE.

Chart of 5G vs 4G-LTE Battery Drain for Flagship SoCs

Methodology

Analysis based on Speedtest Intelligence data, for Android, split by SoC, for a selection of major markets globally. To measure battery drain, we identified all devices recording 100% battery level during morning hours (6am-12pm), and compared to their minimum battery level in the afternoon (12pm-6pm).

Ookla retains ownership of this article including all of the intellectual property rights, data, content graphs and analysis. This article may not be quoted, reproduced, distributed or published for any commercial purpose without prior consent. Members of the press and others using the findings in this article for non-commercial purposes are welcome to publicly share and link to report information with attribution to Ookla.

| May 17, 2023

ISPs Need to Do More to Improve Wi-Fi Performance in the Home

Key messages

  • Wi-Fi woes continue. Ookla® Speedtest Intelligence® data shows Wi-Fi performance continues to lag behind ethernet performance within home networks in many advanced fixed broadband markets, with Wi-Fi speeds typically ranging from between 30-40% of ethernet speeds during Q1 2023.
  • Developed Asian and North American markets lead the charge to Wi-Fi 6/6E. Wi-Fi 4 and 5 remain the dominant Wi-Fi access technologies globally, accounting for a combined 89% of Speedtest® samples during Q1 2023. However, a number of advanced fixed broadband markets are rapidly migrating to Wi-Fi 6 and 6E, with China, Hong Kong (SAR), Singapore, Canada, and the U.S. leading the charge.
  • Growing Wi-Fi 6/6E adoption helps narrow the gap in Wi-Fi performance. In markets such as Canada, France, Germany, Singapore, Sweden, and the U.S., where the transition to fiber is more advanced, and where ISPs are actively driving adoption of Wi-Fi 6/6E routers, we see Wi-Fi performance closing the gap to ethernet. However, more needs to be done in other markets, where migration to more advanced fixed access networks is exposing the limitations of the installed base of Wi-Fi routers.
  • Router vendors pushing the envelope with Wi-Fi 7 capable launches. ASUS leads the market for Wi-Fi 6/6E routers among Speedtest samples, and both ASUS and other leading router vendors have been quick to launch Wi-Fi 7 capable routers. Despite this, Wi-Fi 6 and 6E remain the growing component of their installed bases. ASUS leads the market according to Speedtest Intelligence with 39% of its routers we sampled supporting Wi-Fi 6/6E during Q1 2023, well ahead of second placed NETGEAR with 26%.
  • Smartphone device support indicates Wi-Fi 6/6E should remain the immediate focus for ISPs. With the two largest smartphone vendors globally, Samsung and Apple, currently shunning Wi-Fi 7, ISPs waiting to see if they can leapfrog Wi-Fi 6E to Wi-Fi 7 should stay their hands. The fact that China still needs to allocate the 6 GHz spectrum band — key for Wi-Fi 6E and 7 — for unlicensed use is also significant, and appears to have weighed on the Wi-Fi 6E adoption among China’s leading Android smartphone manufacturers.

Wi-Fi performance continues to lag ethernet within the home

ISPs in advanced fixed broadband markets are increasingly looking to offer more advanced Wi-Fi routers and solutions such as mesh networks, which are designed to improve Wi-Fi coverage and performance. However, Speedtest Intelligence data shows that more needs to be done to improve Wi-Fi performance, which typically ranged from between 30-40% of ethernet speeds. Median Wi-Fi performance as measured by Speedtest will tend to lag behind median ethernet performance, depending on distance of the end-user device from the router, including any obstacles and signal interference the Wi-Fi signal needs to traverse to reach the device.

Chart of Ratio of Wi-Fi to Ethernet Performance

Our analysis of Speedtest Intelligence data reveals that driving greater adoption of more advanced Wi-Fi routers can help ISPs narrow the gap between Wi-Fi and ethernet performance, with ISPs in Canada, France, Germany, Singapore, Sweden, and the U.S. already successfully doing so over the past year.

Chart of Closing the Gap on Wi-Fi Performance

Despite this, the results are not always positive, with the gap between Wi-Fi and ethernet performance widening, in particular in the U.K. and Taiwan. Where markets are rapidly migrating from more legacy fixed broadband technology to advanced cable and fiber connections, Wi-Fi performance can lag relative to ethernet, indicating a need to accelerate the adoption of more advanced Wi-Fi technologies.

Older generations of Wi-Fi 4 and Wi-Fi 5 remain dominant globally

While much of the focus of the device ecosystem is on spurring adoption of the latest Wi-Fi standards, there is a long way to go before even Wi-Fi 6 becomes a dominant standard globally. Based on Speedtest Intelligence data, the proportion of Wi-Fi tests by generation (a good proxy for adoption) shows that Wi-Fi 4 and Wi-Fi 5 remain the dominant router technology, with Wi-Fi 6 representing just under 10% as of February 2023, and Wi-Fi 7 showing very few samples. The share of samples from Wi-Fi 4 routers has fallen by 6 ppts year-over-year, while Wi-Fi 5’s share of samples has marginally increased.

Chart of Share of wi-Fi Samples by Generation

Asian and North American ISPs lead the charge to Wi-Fi 6 and beyond

ISPs are the main driver behind the adoption of new Wi-Fi standards, as highlighted by a 2022 study by Parks Associates, which found that 52% of U.S. consumers acquired their router from their ISP. Rolling out more advanced routers to their customer bases enables them to take advantage of the increased performance of newer generations of Wi-Fi technology, and helps to ensure ISPs deliver faster speeds, particularly over fiber access networks.

Adoption of Wi-Fi 6 varies by market, even among the most developed fixed broadband markets globally. ISPs in a number of advanced fixed markets have already begun offering Wi-Fi 6E routers to their customer bases, with ISPs in North America in particular moving in this direction, including Bell Canada, Rogers, Telus, Verizon, XFINITY, Charter, and Frontier, as well as leading ISPs in advanced Asian and European markets.

Markets in Asia led the way on Wi-Fi 6 adoption, with China and Hong Kong both recording 42% adoption, followed by Singapore with 37%. Outside of Asia, North America showed the next highest level of adoption, with the U.S. and Canada recording 32% and 30%, respectively. European fixed markets lagged behind, with adoption ranging from 13% in the U.K., to 24% in Sweden. For markets such as Chile, which placed towards the top of the Ookla Speedtest Global Index™ for median fixed broadband speeds, a relatively low-level of Wi-Fi 6 adoption (8% in Q4 2022) signals further opportunity for ISPs in the market to boost performance.

Chart of Adoption of Wi-Fi Generations by Market

The fastest growing markets, in terms of increasing share of Wi-Fi 6 of Speedtest samples year-over-year in Q1 2023, were Canada and Malaysia (+15 ppts), Singapore (+14 ppts), and Hong Kong (+12 ppts). While there was considerable variance between ISPs within each market, leading ISPs such as SmarTone (Hong Kong), DiGi (Malaysia), and ViewQwest (Singapore), are prompting a competitive response so that even ISPs with lower levels of Wi-Fi 6 adoption are prioritizing the technology and seeing adoption grow steadily.

CountryISPWi-Fi 6 %, Q1 2023
Hong Kong (SAR)SmarTone62.4%
CanadaBell pure fibre57.3%
SingaporeViewQwest53.7%
SingaporeMyRepublic50.3%
MalaysiaDigi50.2%
MalaysiaMaxis49.0%
Hong Kong (SAR)NETVIGATOR44.2%
CanadaRogers43.4%
SingaporeM141.7%
SingaporeSingTel41.4%
CanadaTelus PureFibre41.0%
Hong Kong (SAR)HKBN41.0%
CanadaShaw39.0%
SingaporeStarHub35.6%
Hong Kong (SAR)HGC30.0%
MalaysiaTIME28.8%
MalaysiaTM21.5%

In addition to providing newer routers, ISPs are increasingly positioned to help consumers solve Wi-Fi performance issues in the home, such as offering mesh Wi-Fi solutions. For some ISPs, this has even taken precedence over offering newer Wi-Fi 6E routers, as they look to improved coverage within the home as a faster route to improving Wi-Fi performance. 

In the U.K., BT has prioritized whole-home coverage over Wi-Fi 6E with its BT Complete Wi-Fi (mesh) offer, despite the U.K. regulator Ofcom having released the lower portion of the 6 GHz band for unlicensed use in 2020. In Canada, Telus, while having recently released a Wi-Fi 6E router for its broadband users, also offers its WiFi Plus package, which includes professional installation and “wall-to-wall coverage” throughout the home. Rogers also offers guaranteed Wi-Fi coverage throughout the home, as well as Wi-Fi 6E routers. Plume offers a subscription-based service, HomePass, across a number of markets, which allows users to add additional access points to help eradicate not-spots or poor Wi-Fi signal within the home and also offers solutions for ISPs looking to improve their Wi-Fi offerings. In Hong Kong, China Mobile Hong Kong (CMHK) was the first ISP in the market to offer a fiber-to-the-room service, while it and other ISPs such as NETVIGATOR offer consumers the option to subscribe to multiple channels over fiber with separate IP addresses, allowing them to divide their activities across channels and thereby help avoid congestion.

To capture the full performance benefits of Wi-Fi 6E and Wi-Fi 7, countries must allocate 6 GHz spectrum for unlicensed use, therefore allowing Wi-Fi devices to access this higher frequency, higher capacity spectrum, and utilize wider channels. At present, according to the Wi-Fi Alliance, allocation of the lower portion of the 6 GHz spectrum band (5,925 MHz to 6,425 MHz) is common among developed economies, with some notable exceptions in some developed markets in Asia and Asia Pacific, in particular China, while allocation of the full 6 GHz band is more limited, available across North America and some Latin American markets, as well as Saudi Arabia and South Korea.

Wi-Fi 7 on the horizon as router vendors continue to push the envelope on performance

Wi-Fi performance continues to scale, and with Wi-Fi 7 routers and smartphones having launched in the second half of 2022, that trend is set to continue. In addition to higher throughput, successive Wi-Fi generations also support lower latency, helping to better support higher quality video streaming, cloud gaming, and future use cases linked to concepts such as the Metaverse and other uses of extended reality (XR).

The major silicon vendors, Broadcom, Qualcomm, and Mediatek, were quick to update their solutions to support the emerging Wi-Fi 7 standard, and hardware vendors have followed suit. Chinese vendor H3C was the first to launch with its H3C Magic BE18000 Wi-Fi 7 router in July 2022, and it has since been followed by other major vendors including tp-link, ASUS, and more recently NETGEAR. However, the prices of early Wi-Fi 7 routers that take advantage of Wi-Fi 7’s range of enhanced performance capabilities will be a barrier to entry for many, with tp-link’s flagship Archer BE900 currently retailing at a cost of $699.99. 

Speedtest Intelligence data shows minimal Wi-Fi 7 adoption as of March 2023, however we are likely to see the same vendors drive Wi-Fi 7 adoption that are currently leading on Wi-Fi 6. Based on global Speedtest Intelligence samples, we see ASUS leading the market in Wi-Fi 6 penetration, with 39% of samples recorded using Wi-Fi 6 compatible routers. NETGEAR and Belkin followed, but for the remaining major router vendors, Wi-Fi 6 penetration currently stands at close to 10% or below. Wi-Fi 6E remains a small but growing subset of Wi-Fi 6 certified devices, currently standing at 7.7% of products based on the latest Wi-Fi Alliance data. Of these, a majority are either routers or smartphones, with an almost even split between the two.

Chart of Wi-Fi 6 Router Market Share view by Brand (Global)

Smartphone support indicates ISPs should focus on Wi-Fi 6E for now

With Samsung releasing its Galaxy S23 range in February 2023 without Wi-Fi 7 support, and Apple’s latest iPhone 14 smartphones limited to Wi-Fi 6, it’s clear that, for now, ISPs should prioritize the rollout of Wi-Fi 6/6E among their customer bases rather than consider leapfrogging to Wi-Fi 7. The Xiaomi Mi13 Pro was the first Wi-Fi 7 capable smartphone to hit the market, launching in December 2022, although it was limited to Wi-Fi 6E initially, requiring a software update to enable Wi-Fi 7. The availability of Wi-Fi 7 supporting Android smartphones will grow through 2023, enabled by SoCs from leading vendor Qualcomm with its flagship Snapdragon 8 Gen 2, and MediaTek with its Dimensity 9200. Apple, on the other hand, lags on the latest Wi-Fi standard support, with the iPhone 14 series featuring Wi-Fi 6, and with its fall 2023 models rumored to be adding Wi-Fi 6E to their feature list.

Chart of Android Smartphone Vendor Installed Base, by Wi-Fi Standard, Global

Samsung, as the leading Android smartphone vendor globally, has the largest installed base of smartphones supporting Wi-Fi 6 and Wi-Fi 6E, and has stolen a march on its main rivals Xiaomi, OPPO, and Vivo. While the major Chinese smartphone vendors have launched Wi-Fi 7 compatible devices, the lack of assignment of 6 GHz spectrum for unlicensed use in China does appear to have held them back relative to brands such as Samsung and ASUS.

The outlook for Wi-Fi in the home

It’s clear from the gap between Wi-Fi and ethernet performance that ISPs need to do more to improve the customer experience for Wi-Fi users within the home. Part of the solution lies in rolling out more advanced generations of Wi-Fi technology, given Wi-Fi 4 and 5 remain the dominant technologies deployed globally. However, evidence linking increased adoption of Wi-Fi 6 to overall Wi-Fi closing the gap to ethernet performance is mixed, and validates the approach of ISPs looking to also offer mesh networking Wi-Fi solutions. Contact us to find out more about how Ookla Research can help you monitor the performance of your networks, and stay ahead of the competition.

Ookla retains ownership of this article including all of the intellectual property rights, data, content graphs and analysis. This article may not be quoted, reproduced, distributed or published for any commercial purpose without prior consent. Members of the press and others using the findings in this article for non-commercial purposes are welcome to publicly share and link to report information with attribution to Ookla.

| February 28, 2023

Chile Writes the Blueprint for Fixed Network Improvement in Latin America

Key messages

  • From a median download speed of 50.23 Mbps in Q1-Q2 2020 to 205.96 Mbps in Q3-Q4 2022 – Chile punches up on fixed line performance. Chile has been the top performing fixed broadband market across Latin America, consistently outperforming other markets in the region. Over the last three years it has also closed the performance gap to other leading markets globally, and during 2022 consistently featured in the top five of Ookla®’s Speedtest Global Index™, where as of January it placed second.
  • Strong competition the primary driver. Chile’s strong fixed broadband performance — an anomaly in the region — is due primarily to strong competition among Chilean ISPs. Chile has six ISPs with more than 5% market share, all of which are heavily focused on migrating customers to fiber, and five of which recorded median download speeds in excess of 100 Mbps during Q4 2022.
  • Fixed-line investment focused on driving rapid migration to fiber. Strong competition has promoted heavy fixed-line network investment, with reported data indicating capital intensity ratios in excess of 20% in the market. This has translated into a rapid technology migration, shifting the market from a majority of connections via cable (HFC) at the end of 2019, to fiber now comprising almost two-thirds of connections. Furthermore, it has also seen the formation of a neutral network, On*Net, which offers wholesale fiber access to other ISPs.
  • Supporting economic growth in the market. Subject to rising inflation and a market overheated following government intervention post the COVID-19 pandemic, Chile’s economy is expected to contract in 2023 before returning to growth in 2024. Despite this, broadband adoption among businesses continues to advance at a rapid pace, a positive sign in helping support the market’s future growth potential. In addition, broadband performance across the entire market is strong, with median download speeds in all Chilean regions in excess of 100 Mbps as of Q4 2022.

Chile punches up on fixed-line performance

Chile has been a regional leader in fixed line performance in Latin America since 2016, and since then has continually widened its advantage over its regional peers. Over the past three years Chile has driven fixed-line performance increases, from a median download speed of 50.23 Mbps in Q1-Q2 2020 to 205.96 Mbps in Q3-Q4 2022. This makes Chile now a clear anomaly among Latin American markets, having closed the performance gap to the top-performing fixed-line markets worldwide during 2022.

chart of median fixed download performance, chile versus regional and international peers

Chile’s population is predominantly urban-based, with a rural population of just 12.2% in 2021 according to the World Bank. While connecting rural premises with advanced fixed access networks is more costly and less profitable than in urban environments, the urban nature of Chile is not markedly different compared to its peers in Latin America. Brazil has only a marginally greater rural share of population at 12.7%, while Argentina has a lower share, at only 7.8%.

Speedtest Intelligence® data shows that at a regional level within Chile, ISPs are supporting median download speeds in excess of 100 Mbps across all regions during Q4 2022. Santiago Metropolitan Region is the most populous region in Chile, and recorded a median download speed of 215.73, while the region with the largest rural share of population, Maule, recorded a median download of 189.36 Mbps. The lowest median speed was observed in Aysén, with 117.34 Mbps. This relative equity in fixed line performance across regions echoes a 2020 OECD country report on Chile, which highlighted that while economic disparities between Chile’s regions are above the OECD average, it has shown the largest reduction in regional economic inequality among OECD countries since 2008.

map of median fixed download speeds by region in chile

Hyper-competitive fixed broadband market

Of the top eight markets in the Speedtest Global Index, Chile had the greatest concentration of ISPs supporting high-speed broadband services. Speedtest data shows eight ISPs active in the Chilean market with more than 3% share of samples, and of these seven supported median download speeds in excess of 100 Mbps. According to the regulator Subtel, Telefonica led the market with 30.3% market share, ahead of second-placed VTR with 26.2%.

Telefonica also led the market in terms of fiber connections, with a market share of 45.7%, followed by Mundo with 25.0%, which in January 2023 announced that it had completed the migration of its customer base from HFC (hybrid fiber-coaxial cable) to fiber-to-the-home (FTTH). Other smaller ISPs are actively deploying fiber or looking for alternative solutions to boost their reach. Entel agreed to sell its fiber network to On*Net Fibra, a joint venture between KKR and Telefonica Chile to provide a neutral fiber network in Chile, in October 2022. This will allow Entel to continue provisioning new households over the larger OnNet network. We also see SpaceX’s Starlink active in the market, alongside Hughesnet, although satellite remains a very small but growing technology within the market.

chart of chile, fixed broadband connections market share by isp

Strong competition driving network investment

Strong competition in Chile’s fixed line market has helped drive network investment, with Chilean ISPs focused on expanding the number of homes passed and migrating to more advanced fiber access. The relatively late launch of 5G networks in the region has enabled operators to focus more heavily on fiber deployment, with a view to increasing fixed broadband adoption and also supporting 5G networks.  The first 5G networks in the market launched in December 2021.

While there is limited reported fixed-line financial data in the market, Telefonica Chile has reported capex historically. Its data shows strong early investment in the market, with capital intensity (capex as a share of revenues) well above 20% from 2015 onwards, peaking at 28.8% of revenues in 2018.

chart of telefonica chile, fixed capex and capital intensity

Telefonica Chile stopped reporting fixed revenues in 2020, however its fixed capex dipped significantly, highlighting the change in strategy from its parent group to deleverage its Latin American operation. This eventually led to KKR’s acquisition of a 60% share in InfraCom from Telefonica, creating On*Net Fibra, a neutral FTTH network joint-venture, which began offering wholesale services in July 2021. Rival ISP VTR confirms the overall trend of strong fixed-line investment in the country, reporting capital intensity in excess of 20% over the past three years. In addition, Mundo announced in early 2022 that it planned to invest $200 million expanding its fiber infrastructure in Chile, and the ISP is targeting 4.5 million homes passed, by the end of 2023.

Accelerating migration to fiber

As of 2019, a majority of Chilean broadband connections were supported by hybrid fiber-coaxial (HFC) services, with fiber the second most frequently used technology, followed by ADSL. The transformation of the Chilean fixed broadband market since then has been rapid, with the latest data for September 2022 showing that fiber makes up the majority of broadband connections, with HFC’s share declining strongly, and ADSL’s share dropping below that of wireless broadband connections.

chart of chile, fixed broadband connections market share by isp

This rapid tech migration has also led to Chile being among the strongest adopters of Wi-Fi 5 and 6 in Latin America, which support faster speeds within business and in the home. In Q4 2022, 71.3% of Chile’s Speedtest samples utilized Wi-Fi 5, with less than 20% utilizing Wi-Fi 4. By contrast, Brazil had 38.2% of samples utilizing Wi-Fi 4, and Argentina 53.4%. Adoption of the newer Wi-Fi 6 routers is slower in Chile compared to international peers, standing at 8.5% as of Q4 2022, however it still leads within Latin America by a significant margin. Within Chile GTD led the pack with 33.5% of samples utilizing Wi-Fi 6 during Q4 2022, followed by WOM with 25.9%, Entel with 21.9% and Telefonica del Sur with 19.4%. By contrast, Claro, Movistar, Mundo and VTR all returned less than 10% in Wi-Fi 6 samples, indicating there is plenty of scope to increase median fixed-line performance yet further in the market. Our analysis of the median download speeds shows a strong correlation with adoption of Wi-Fi routers utilizing 5 GHz spectrum (WiFi 5 and above).

chart of installed router base by wi-fi generation, chile versus regional and international peers

Driving increased fixed broadband adoption

The growth in fixed broadband adoption in Chile was disrupted significantly by the COVID-19 pandemic, and resultant move towards remote working and more people staying at home. Connections growth increased from 5.5% in 2019, to 10.7% in 2020 and 12.8% in 2021, as the importance of home internet connectivity grew.

chart of chile growth in fixed broadband connections by residential and business users

The initial acceleration in connection growth in 2020 was due to growth in residential fixed broadband adoption, with connections increasing by 13% in 2020 and 12% in 2021. Business fixed broadband connections declined in 2020 as the economy contracted, but rebounded strongly in 2021 on the back of government economic stimuli, increasing 19%, and a further 8% in the first three quarters of 2022, demonstrating the important role of broadband in supporting economic growth in the market.

Chile’s economy is forecast to contract in 2023, as inflation continues to impact the market, and fiscal stimuli following the COVID-19 pandemic are unwound. However, the Chilean Central Bank forecasts that the market will rebound in 2024, with growth ranging from 2.25% – 3.25%. A key component of Chile’s future growth will be the ability of businesses to secure fast and reliable internet connections. From an infrastructure point of view, Chile is very well served in this regard, with a very dynamic fixed infrastructure market, as demonstrated by its operators continuing to push on fiber rollout, the emergence of a neutral fiber network with broad coverage, and even the increasing role of satellite connectivity in the market. Such is the success of its Chilean operation, that Telefonica is using the market as a blueprint for its other operations across Latin America. We’ll continue to monitor the rapid progress of Chile’s fixed broadband market as it continues to vie with other leading markets internationally at the top of Ookla’s Global Index. To find out more about Speedtest Intelligence, please get in touch.

Ookla retains ownership of this article including all of the intellectual property rights, data, content graphs and analysis. This article may not be quoted, reproduced, distributed or published for any commercial purpose without prior consent. Members of the press and others using the findings in this article for non-commercial purposes are welcome to publicly share and link to report information with attribution to Ookla.

| February 15, 2023

Are 5G Networks Meeting Consumers’ Expectations?

Key messages

  • In-market 5G performance varies widely. Reviewing the top 10% and worst 10% of Ookla® Speedtest Intelligence® samples reveals significant variance in the consumer experience on today’s 5G networks, with 5G speeds peaking at over 1 Gbps for the top 10% of users in the U.A.E on average, but falling to below 20 Mbps for the lower 10% in Norway, the U.S., Japan, Germany, and Spain.
  • Median 5G performance is declining in many early launch 5G markets. While understandable as 5G adoption grows and users in more remote locations access 5G, declining median download speeds also point to investment and deployment challenges in some markets. At the same time, many of these markets are facing economic headwinds, placing more emphasis than ever on cost control. As a result, operators must carefully balance network investment priorities.
  • 5G Net Promoter Scores (NPS) significantly higher than 4G LTE in most markets, but waning. With the exception of Sweden and Qatar, all the early launch 5G markets in our analysis saw 5G NPS fall year-over-year. Operators’ 5G NPS still trade at a premium compared to 4G, and while performance is just one part of the equation, operators should take care to build on the positive sentiment that 5G has brought to date.

Despite impressive headline speeds, 5G performance varies a lot

Median 5G performance allows us to gauge the midpoint of user experience on 5G networks, however it doesn’t paint the full picture. While headline 5G speeds impress, Speedtest Intelligence data lays bare the ups and downs of 5G performance for consumers, even in early launch, advanced 5G markets. We recently looked at 5G network performance over high frequency (mmW) bands, painting a view of the true potential of 5G networks. However, if we look at performance on today’s 5G networks, looking beyond the median at the range of performance between users in the top 10% and those in the lower 10%, Speedtest Intelligence data reveals huge variance in the performance users experience.

Chart of psread of 5g performance, top 10% of samples versus median and lower 10%

The U.A.E. was the fastest 5G market in our analysis, based on median download performance of 545.53 Mbps in December 2022, followed by South Korea and Qatar. However, the top 10% of users in the U.A.E. recorded speeds of at least 1,266.49 Mbps on average, while the lowest 10% of users experienced speeds of 127.52 Mbps or slower on average. At the other end of the scale, Spain recorded a median 5G speed of 94.14 Mbps, but also demonstrated wide variance between the top 10% of samples at 537.95 Mbps or faster and the lowest 10% with 10.67 Mbps or less.

Based on many of the marketing messages around 5G, consumers are led to expect a big bang change in performance. However, with 5G operating over a greater range of spectrum bands than previous generations, including high frequency spectrum which has relatively poorer propagation, it’s understandable that 5G performance will vary more than previous generations of mobile network technology.

5G markets set to face performance challenges during 2023

While globally 5G speeds have remained stable, for many of the markets in our analysis, median 5G download speeds have fallen over the past year. The U.S. was the main outlier, recording the strongest uplift in 5G performance as T-Mobile continued to drive home its performance advantage in the market, while Verizon’s performance improved early in 2022 through its deployment of 5G in C-band spectrum. This trend is likely to continue in 2023 in the U.S., as more C-band spectrum is made available. However, the picture remains concerning for a number of other 5G markets, particularly those where median 5G speeds are at the lower end of the spectrum.

Chart of Year-over-Year change in median 5G download performance

In some markets, 5G was initially priced at a premium to 4G, with operators focused on driving incremental returns on the new network technology. However, operators have been increasingly opening up 5G access by removing incremental costs for consumers and adding prepaid plans too. As 5G adoption scales, it places more strain on the new networks. The challenge for many of these markets is that network performance is likely to degrade further unless network densification picks up. 

For network operators, this investment imperative is occuring amidst macroeconomic headwinds, which are driving up operating costs and putting pressure on consumer and enterprise spend. In addition, there remain challenges in deploying additional 5G cell sites in dense urban areas where demand is strongest, while in some markets EMF limits and other regulations can limit the deployment of high-capacity 5G sites.

Degrading 5G performance impacts consumer sentiment

Net Promoter Score (NPS) from Speedtest Intelligence paints a largely positive picture of current 5G networks. NPS is a key performance indicator of customer experience, categorizing users into Detractors (score 0-6), Passives (score 7-8), and Promoters (score 9-10), with the NPS representing the percentage of Promoters minus the percent of Detractors, displayed in the range from -100 to 100. Across the markets we analyzed, 5G users on average rated their network operator with NPS scores that were universally higher than those for 4G LTE users. However, consumer sentiment for users on 5G networks is beginning to shift, with NPS scores falling, coinciding with lower median 5G performance in many of the markets we analyzed.

Chart of 5G uplift in Net Promoter Scores vs. 4G LTE

Declining performance levels will be a factor driving NPS down for some 5G users. It’s also important to remember that as 5G scales in many of these early launch markets, the profile of 5G users is also changing from predominantly urban-based users, to more of a mix of urban, suburban, and rural users, which brings additional coverage and performance challenges for network operators. We plan to examine the relationship between 5G performance and spectrum in an up-coming content piece. Please get in touch if you’d like to learn more about Speedtest Intelligence data.

Ookla retains ownership of this article including all of the intellectual property rights, data, content graphs and analysis. This article may not be quoted, reproduced, distributed or published for any commercial purpose without prior consent. Members of the press and others using the findings in this article for non-commercial purposes are welcome to publicly share and link to report information with attribution to Ookla.

| January 8, 2023

Hong Kong & Macau: Driving Greater Adoption of Fiber Services in Advanced Telecoms Markets

Key messages

  • Despite ranking highly in Ookla’s Speedtest Global Index™ based on median download speeds, operators in both Hong Kong (SAR) and Macau (SAR) are focussed on driving greater fixed broadband performance and fiber adoption.
  • We see greater proliferation of advanced fiber services in both markets to help encourage user adoption of faster fiber services, including flagship 10 Gbps fiber connections, fiber to the room (FTTR) services, and well as the option for subscribers to purchase multiple Gigabit channels which utilize the same connection, allowing them to allocate channels for different activities.
  • The latest statistics from the regulators in both markets point to further increases in fiber penetration over the course of 2022, reaching a high of 84.6% in Hong Kong, and 98.6% in Macau.
  • Ookla® Speedtest Intelligence® data for Q3 2022 shows that China Mobile Hong Kong (CMHK) led the Hong Kong market with a median download speed of 271.99 Mbps, while CTM led the Macau market with a speed of 160.15 Mbps.

Advancing towards a gigabit digital economy

Ookla recently presented at the Communications Association of Hong Kong’s (CAHK) Symposium 2022, “Challenge and Opportunities for Fiber Gigabit Economy”. Markets like Hong Kong  and Macau are advanced in terms of fixed network development and adoption, characterized by low levels of connection growth and strong fiber penetration, and Ookla’s Speedtest Global Index™ ranks Hong Kong 5th and Macau 12th on median fixed download speeds, as of November 2022. The development of fixed broadband networks in Hong Kong and Macau is predominantly driven by market forces, however, the Government of Hong Kong has sought to intervene, by subsidizing the deployment of fiber networks in remote locations, with a view to reducing digital inequality and helping boost the growth of the digital economy.

To track broadband adoption, the Office of the Communications Authority (OFCA) in Hong Kong monitors broadband adoption by advertised speed and technology mix, while the Macau Post and Telecommunications (CTT) monitors broadband adoption by technology. Based on the latest data they provide for 2022:

  • The number of broadband subscribers in Hong Kong rose by 0.7% during the first eight months of 2022, to reach 2.95 million. Fiber-to-the-Home/Building (FTTH/B) penetration stood at 84.6%, and 87.1% subscribed to packages with a maximum download speed equal to or greater than 100 Mbps.
  • Macau saw fixed broadband subscribers grow by 1.1% during the first 10 months of 2022, to reach 208,000, with a fiber penetration rate of 98.6%.

Chart of Hong Kong and Macau fixed broadband splits

Global comparison leaves room for improvement

We used Ookla® Speedtest Intelligence® data to compare broadband performance for Hong Kong and Macau with that of other major cities globally. Hong Kong recorded median Wi-Fi download speeds of 203.46 Mbps in Q3 2022, up from 184.79 Mbps in Q4 2021. Macau, on the other hand, lags behind its peers in terms of its median download speed performance, recording 160.13 Mbps in Q3 2022, up from 136.89 Mbps in Q4 2021. Despite strong download performance, median Wi-Fi upload speeds in Hong Kong lagged behind download performance, at 153.96 Mbps, while Macau recorded a more symmetrical median upload speed of 148.73 Mbps. Greater penetration of fiber in broadband access networks allows providers the ability to offer more symmetrical upload and download speeds.

Chart of Hong Kong and Macau Wi-Fi performance versus major global cities

Hong Kong: China Mobile Hong Kong leads on performance

We examined fixed Wi-Fi performance in Hong Kong, excluding any 5G fixed-wireless internet connections from the analysis. Providers in Hong Kong offer a range of broadband packages based on network speeds, but are also starting to differentiate through additional services such as the provision of fiber to the room and security services. Strong competition continues to drive innovation in the market, with China Mobile Hong Kong (CMHK) offering dual Gigabit fiber connections for additional capacity, and NETVIGATOR offering a Multi-Use Broadband Service, which provides bandwidth on multiple channels (up to four), with separate IP addresses, to allow consumers to divide their activities between channels. The availability of higher speed subscription tiers depends on the provider’s footprint and whether fiber connectivity is to the premises (FTTP) or to the building (FTTB), with some buildings utilizing copper as part of the last mile. Migrating Hong Kong’s remaining FTTB connections (17.8% of total as of August 2022) to FTTH (66.8% of total) would help boost median speeds.

Chart of Hong Kong fixed Wi-Fi provider performance

Our examination of fixed broadband Wi-Fi performance in Hong Kong shows that CMHK was the fastest provider overall during Q3 2022, with a median download speed of 271.99 Mbps, followed by NETVIGATOR with 221.79 Mbps. While providers continue to market broadband based primarily on download speeds, services such as video calling and online gaming demand are driving the importance and growth of upload speeds. CMHK also led the market based on median upload speeds at 213.93 Mbps during Q3 2022, followed by NETVIGATOR and HKBN. Looking at the distribution of Wi-Fi samples between 5 GHz, which offers higher capacity than lower frequency bands, NETVIGATOR and HKBN led the market based on the percentage of 5 GHz samples, with 78.2% and 77.9% respectively.

Chart of Hong Kong 5 GHz share of fixed Wi-Fi provider samples

Macau: CTM outstrips MTEL on overall performance

Macau lagged behind Hong Kong on fixed Wi-Fi performance for both median download and upload speeds during Q3 2022, despite the regulator CTT reporting widespread adoption of fiber in the market. Providers CTM and MTEL offer a range of fiber broadband plans for residential users, segmented by speed, with download speeds ranging from 150 Mbps to 10 Gbps for CTM, and from 25 Mbps to 600 Mbps for MTEL.

Chart of Macau fixed Wi-Fi provider performance

Speedtest Intelligence performance data for Macau during 2022 aligns with CTM’s focus on providing higher broadband speed tiers in the market. CTM maintained a significant performance gap over MTEL, recording a median download speed of 160.15 Mbps compared to MTEL at 89.63 Mbps during Q3 2022. Upload performance between the two providers showed a similar picture, with CTM recording a median speed of 151.96 Mbps in Q3 2022 — almost double that of MTEL which recorded 77.49 Mbps. Looking at the distribution of Wi-Fi samples between 5 GHz and other bands, CTM outstripped MTEL with a greater proportion of samples using 5 GHz during Q3 2022.

Chart of Macau 5 GHz share of fixed Wi-Fi provider samples

In order to maintain or improve their position among top-performing cities globally, providers in Hong Kong and Macau need to drive greater availability of higher-speed broadband services and newer routers, while encouraging existing customers to upgrade to faster speeds. For Hong Kong in particular, improving the penetration of routers which support 5 GHz Wi-Fi could help those providers that currently lag behind in the market on overall performance. We’ll continue monitoring how fixed broadband performs across major cities like Hong Kong and Macau. If you want to learn more about Speedtest Intelligence, please inquire here.

Ookla retains ownership of this article including all of the intellectual property rights, data, content graphs and analysis. This article may not be quoted, reproduced, distributed or published for any commercial purpose without prior consent. Members of the press and others using the findings in this article for non-commercial purposes are welcome to publicly share and link to report information with attribution to Ookla.

| December 11, 2022

No Upsets in Qatar as Network Performance Peaks

Key messages

  • The FIFA World Cup Qatar 2022™ is the first in the Middle East region, and the first to be supported by 5G networks.
  • It would not have been a surprise to see network performance degrade during the tournament, with over 2.45 million cumulative stadium attendees in a country with a population of just 2.93 million. However, median mobile network download speeds increased substantially in November to reach 263.37 Mbps (based on modern chipsets), up from 190.93 Mbps in October.
  • Ooredoo and Vodafone’s network investment has helped maintain a consistent user experience for fans, with median internet page load times and video streaming start times well below 2 seconds for 5G users.

The first FIFA World Cup® supported by 5G networks

Awarded in December 2010 to Qatar, this year’s FIFA World Cup is the first to take place in the Middle East, and the first to be supported by commercial 5G networks. Ahead of the event, we outlined the important role of the Qatar Communications Regulatory Authority (CRA) and both Ooredoo Qatar and Vodafone Qatar in driving performance gains in the market. A competitive, pro-investment market environment has paid dividends, coupled with firm commitments from both operators to roll out commercial 5G networks in all densely populated areas and all venues associated with the FIFA World Cup. 

As of December 3, 2022, after almost two weeks and 48 games, the FIFA World Cup has seen over 2.45 million cumulative stadium attendees. For a country with a population of 2.93 million, ensuring mobile network performance meets expectations has been no easy feat. Ookla® was keen to understand how Qatari mobile networks were handling the deluge of visitors and additional traffic. According to Speedtest Intelligence®, median download performance in November rose to 263.37 Mbps on modern chipsets across all mobile technologies combined, with median 5G download performance hitting 472.13 Mbps.

Chart of Qatar mobile network performance versus other leading markets

Fans visiting Qatar for the World Cup™ have benefitted from the offer of local SIMs from national mobile operators Ooredoo and Vodafone, which include free data. Ooredoo SIMs include 2022 MB of data for free, valid for 3 days, while Vodafone customers have access to 3GB of data for free, valid across 2 days. Encouraging visitors to utilize local SIMs has helped provide superior network performance for fans at the World Cup. In addition, it’s clear that the network enhancements made by Ooredoo and Vodafone, and their live monitoring and optimization of network performance using crowdsourced data, has helped boost overall network performance at the event, despite the deluge of fans and resultant data traffic.

Qatar’s mobile networks driving increased speeds despite the deluge of fans

We used Speedtest Intelligence data to observe performance in the lead up to, and during the FIFA World Cup™. 5G performance increased from a median download of 394.2 Mbps and upload of 19.93 Mbps 10 weeks before the event, while hitting a median download speed of 489.29 Mbps and median upload speed of 38.36 Mbps during the second week of the World Cup™. Ooredoo and Vodafone have played a crucial role in driving increased 5G performance at the World Cup with both mobile network operators neck-and-neck in terms of 5G download performance.

Chart of 5G performance at the FIFA World Cup 2022

Comparing mobile network performance during the first two weeks of the FIFA World Cup™ to that of other major sporting events in the region and further afield shows just how impressive 5G network performance has been so far, given the number of attendees. While not the fastest sporting event on record, the FIFA World Cup Qatar 2022™ ranks highly, well ahead of events such as the French Open and Wimbledon.

Chart of FIFA World Cup 2022 - 5G performance versus other major sporting events

Network improvements ensuring consistent quality of experience for World Cup fans

Ooredoo, FIFA’s Official Global Connectivity Services Provider for the event, has been very vocal on the improvements it has made to its network and operations. Ooredoo has rolled out additional macro cell sites and small cells to cater to data traffic around the stadiums, and has also deployed over 5,000 cell sites to offer sufficient network coverage across mobile technologies within the stadiums. 

Using Speedtest Intelligence data to analyze network performance across Qatar’s World Cup™ stadiums for both Ooredoo and Vodafone combined, we see that Al Janoub Stadium recorded the fastest median 5G download performance at 757.77 Mbps, and that all World Cup™ stadiums recorded median 5G speeds over 400 Mbps. Of the most popular fan sites, the Ras Bufontas and Airport Free Zone recorded the highest 5G performance.

Chart of Fastest 5G Performance at World Cup stadiums and fan zones

Ooredoo has also implemented a full modernisation of its core network, moving to a cloud-based architecture, while also making improvements to the capacity of its national and international IP transport links to ensure sufficient capacity for fans to better access servers for popular OTT services such as Facebook, Instagram, and Snapchat. These network improvements are helping to drive improved customer experience, as reflected in page load times for mobile users at the World Cup™ accessing Facebook, with median page load times for the social network of well under 2 seconds on 4G networks, and below 1.5 seconds with 5G. Video streaming start times, which were 2.3 seconds on 4G networks, improve to 1.7 seconds on 5G networks.

Chart of 5G driving inproved customer experience at the World Cup 2022

We’ll continue to examine network performance at the FIFA World Cup™, as it moves towards the final game on December 18.

Ookla retains ownership of this article including all of the intellectual property rights, data, content graphs and analysis. This article may not be quoted, reproduced, distributed or published for any commercial purpose without prior consent. Members of the press and others using the findings in this article for non-commercial purposes are welcome to publicly share and link to report information with attribution to Ookla.

| December 5, 2022

The United States — Ripe for Converged Networks

Key messages

  • Moves by mobile operators in the U.S. to offer fixed-wireless home broadband services are further blurring the lines between fixed and mobile networks. Cable operators in the U.S. are responding to this competitive challenge by driving the U.S. market further towards convergence, in the form of fixed-mobile bundling. This trend is driving greater competition in the market, lower prices, and more choice for consumers.
  • Speedtest Intelligence® data shows opportunities for cable companies and the big-three national operators to leverage positions of strength in one access technology to cross-sell to consumers and drive adoption of bundled services.
  • U.S. operators should look to European operators’ experiences with service bundling, where they have been shown to reduce churn and offer ARPU uplift opportunities, but require operators shift from a focus purely on price, to driving improvements in the consumer experience.
  • Fixed and mobile networks are already being used in tandem. For example in the U.K. BT includes a SIM within its Halo routers to offer redundancy to its fixed broadband customers. And already in the U.S. Comcast utilizes its XFINITY Wi-Fi hotspot network to provide high capacity coverage for its customers, allowing it to improve network performance in areas where 5G signal typically struggles to penetrate, while also offloading mobile traffic to its fixed network.
  • Looking to the future, we anticipate more strategic moves to drive improved consumer experiences as the convergence of fixed and mobile networks continues. The emerging set of Wireless Wireline Convergence (WWC) standards being developed by 3GPP and the BBF offer up some unique capabilities, but as ever, vendor and operator support will be key.

Blurring the lines between fixed and mobile networks

Fixed and mobile networks are becoming increasingly complementary, extending the reach of internet connectivity, performance, and reliability. Fixed networks support wireless devices through Wi-Fi offload in the home and via public and operator Wi-Fi access points, often in locations where cellular signals face propagation challenges. Additionally, wireless networks can provide cellular redundancy to fixed broadband services, often via a SIM added to the router.

Cable companies have offered mobile services for some time now via MVNO agreements, (Cox is set to be the latest example), and are able to utilize their Wi-Fi hotspot networks to offer greater coverage and capacity to subscribers. Ookla® data indicates that for markets such as the U.S. that have widespread fixed broadband penetration, mobile users spend approximately 75% of time on average connected to Wi-Fi networks, as opposed to wireless networks. This number ranged from a low of 67.5% for T-Mobile, to a high of 80.0% for cable operator Comcast’s XFINITY. This helped XFINITY and Spectrum rank as fastest overall mobile service across their respective service areas when considering 5G and Wi-Fi access combined.

On the flip side of the coin, the growth in fixed-wireless access (FWA), particularly via higher-speed 5G spectrum, offers an alternative to existing fixed networks. In the U.S., fixed wireless is already being used to cover locations that would  be too costly to lay fiber to reach, and is also being offered as a competitive alternative to existing fixed networks. Both Verizon and T-Mobile have championed this approach, and are seeing strong growth in their respective fixed-wireless customer bases, although fixed wireless still represents a small proportion of overall fixed broadband subscribers.

Fixed and wireless technologies also play an important role in today’s backhaul networks, with fiber instrumental in extending the reach and capacity of mobile networks, and microwave point-to-point wireless connections still common in many parts of the world for backhaul. Throw satellite connectivity into the mix via the growth of LEO constellations, and it’s clear that there’s no one-size-fits-all solution for providing universal connectivity — a blend of technologies is required.

Fixed-mobile bundling — initially focused on cost savings for consumers

The growth of fixed-mobile (convergent) bundles in the U.S. is occurring amidst a slowing of the global economy, with inflation running into double digits in many markets, pushing them towards a possible recession. This could well spur the adoption of fixed-mobile bundles in the U.S., paralleling the experience of many European markets during the last prolonged economic downturn which began in 2008. In this economic environment, a number of European operators introduced convergent bundles, offering them at an overall discount to the discrete underlying services. 

While not prevalent in all European markets, fixed-mobile bundles have taken hold in many key markets, championed by regional powerhouses including Telefonica and Orange. Orange even goes so far as to highlight convergence as the “bedrock of our strategy,” and has pursued M&A across Europe in order to combine fixed and mobile assets in order to pursue a convergent strategy. 

Initially, European operators pursuing convergent bundles saw a reduction in churn, as including more services within a bundle for multiple people in a household made these customers stickier. Over time, operators looked to drive increased ARPU by including additional services, particularly broadcast television and video streaming. For consumers, fixed-mobile bundles also offer managerial benefits, adding the convenience of a single bill for all telecoms services in a household and gives the account holder more control over telecoms expenditure as a result.

More recently, in European markets where fixed and mobile bundles have become commonplace, we’re seeing moves to expand the value offered to customers, to avoid ARPU erosion. For Movistar, this included a recent rebrand of its Fusion offering to MiMovistar, and a move to include services such as health, gaming, and security. The key lesson for U.S. telcos is to avoid a race to the bottom that will harm margins and ultimately investment. Instead, telcos should focus on extending the value delivered from fixed-mobile bundles. For cable companies with MVNO agreements driving Wi-Fi offload for their mobile customers can help improve performance. It also keeps wholesale costs down, allowing them to be more aggressive with their mobile pricing.

U.S. fixed-mobile service overlap — battle lines drawn

To estimate the current overlap in fixed and mobile subscriptions by provider and look at bundling opportunities within the U.S.,  we used Speedtest Intelligence data to show the share of Speedtest® samples for mobile devices conducted via wireless networks versus Wi-Fi. Cable operators Spectrum (Charter) and XFINITY (Comcast) show very high degrees of overlap, as explained by their sales model where mobile is not offered as a standalone service, but only as an add-on to their fixed broadband subscriptions services.

Overlap in fixed and wireless subscriptions (Q3 2022 | Speedtest® Data)
WIRELESS WIRELINE
AT&T
T-Mobile Verizon Spectrum XFINITY Other
AT&T Wireless 20.5% 0.1% 4.9% 21.7% 21.2% 31.6%
T-Mobile 11.2% 0.2% 7.8% 24.9% 26.1% 29.9%
Verizon Wireless 9.2% 0.1% 10.9% 23.1% 21.3% 35.3%
Spectrum 2.2% 0.1% 1.0% 85.7% 2.0% 9.1%
XFINITY 2.4% 0.1% 1.3% 2.1% 87.5% 6.7%

Three main takeaways emerge from the data:

  1. AT&T has a larger wireline footprint than Verizon, and this shows over 20% of its wireless customers also access AT&T’s fixed broadband service according to Ookla Speedtest data versus Verizon’s 10.9%. Both companies have opportunities to drive further mobile uptake among their fixed user bases.
  2. T-Mobile has a greenfield opportunity for fixed wireless, where strong 5G network performance should help it capitalize on both mobile and fixed net additions.
  3. Sizeable proportions of the big three’s mobile user base (in excess of 40%) accessing fixed Wi-Fi via either Charter or Comcast, represent a significant opportunity for the cable companies to expand their mobile user bases.

Beyond fixed-mobile bundling — driving experiential improvements to network service

The advent of 5G, alongside the COVID-19 pandemic, has helped drive growth in the use of data intensive services including video calling, video streaming, and mobile gaming. As these services continue to grow in popularity, and as consumers begin to demand more immersive extended reality (XR) experiences that push the boundaries of today’s networks, so operators will need to improve the performance of both fixed and mobile networks, while also looking to opportunities for network convergence to support enhanced service experiences and reduced operational costs.

High-throughput 5G service utilizes higher frequency spectrum bands than has been used for previous generations of mobile technology. These spectrum bands have lower propagation properties, particularly in-building, mandating that operators further densify their networks to offer consistent performance. Operator Wi-Fi hotspot networks can offer an alternative to this, providing a secure fixed network connection in locations where 5G signals can often degrade. In the U.S., cable companies have also begun to offer differentiated network speeds to their mobile subscribers when connected to their Wi-Fi networks, provisioning faster network speeds to capable smartphones.

Standards bodies have also identified a need to help drive fixed-mobile convergence. The development of Wireless Wireline Convergence (WWC) standards by 3GPP and the Broadband Forum (BBF) seeks to allow operators to converge existing fixed and mobile technology stacks using a common 5G core network. In doing so, operators will move to a single control plane for fixed and mobile sessions, enabling them to offer customers seamless connectivity via fixed and mobile access while also allowing them to aggregate the performance of both access networks to help drive enhanced performance and reliability. In doing so, this will allow operators to streamline the set of network functions and processes required to operate their networks, while also allowing them to simplify their Operational and Business Support Systems (OSS and BSS).

Leading operators such as Deutsche Telekom and BT are actively moving in this direction, with Deutsche Telekom in September conducting a proof of concept lab trial of WWC standards to steer traffic from a 5G residential gateway and route traffic along the entire wireline access chain to the core network. According to Ahmed Hafez, VP of network convergence at Deutsche Telekom, “convergence will allow us to optimize our network assets and deliver new, differentiated service experiences to our customers regardless of the access used.” BT has also signaled its intent to move to a single transport and core network serving both fixed and mobile services as it looks to accelerate the convergence of its mobile and fixed services in the U.K. under a single brand, EE.

While it’s clear that pioneers in the industry are looking to push the envelope on fixed-mobile convergence, there’s still a long way to go. We look forward to more operator trials of WWC standards, but ultimately it will also require the vendor ecosystem to integrate these standards in their product roadmaps to help spur adoption. If you’re interested to find out more about Ookla Speedtest Intelligence, and its wealth of fixed and mobile consumer initiated data and insights, please get in touch.

Ookla retains ownership of this article including all of the intellectual property rights, data, content graphs and analysis. This article may not be quoted, reproduced, distributed or published for any commercial purpose without prior consent. Members of the press and others using the findings in this article for non-commercial purposes are welcome to publicly share and link to report information with attribution to Ookla.

| September 11, 2022

5G Supporting Digital Transformation of the Hajj Experience

This year’s Hajj, held July 7-12, marked an important proof point in the development of Saudi Arabia’s 5G networks and their ability to support increasing numbers of pilgrims, in line with the Saudi Vision 2030 goals. It was the first Hajj to welcome international pilgrims back to Mecca following COVID-19, with one million domestic and international guests allowed to attend. It was also the first stress-test of the nation’s 5G networks, which launched in October 2019. 5G networks are also becoming a central point of innovation for digital services to support the Hajj pilgrim’s experience.

5G network densification driving Saudi Arabia’s performance gains

The first commercial 5G network launched in Saudi Arabia in October 2019. Thanks to early allocation of key spectrum bands for 5G use and strong investment from network operators, Saudi Arabia has rapidly climbed Ookla’s Speedtest Global Index™, moving from 46th place in January 2019 with a median download speed of 22.14 Mbps to 8th place in July 2022 at 96.23 Mbps.

Stc led in terms of 5G base stations (based on reported data), with 6,506 nationally as of December 2021, representing a density of ~5,400 people per 5G base station, putting it on par with operators such as NTT DoCoMo and Deutsche Telekom. According to Speedtest Intelligence®, 5G Availability in the market (the percentage of users with 5G-capable devices who spent a majority of time connected to 5G networks) hit 25% at the end of 2021, supported by the network densification efforts of the nation’s three mobile network operators.

The Saudi Communications, Space & Technology Commission (CST) announced full ICT readiness for the Hajj in late June. Operators have sought to densify their networks around Mecca and locations specific to the Hajj, with over 5,900 mobile towers operational, including 2,600 5G towers, 41% more than in 2021, according to CST. Given the million pilgrims in attendance in 2022, this equates to a maximum density of 385 people per base station (assuming operators have located equipment on each tower). Operators have also installed over 11,000 Wi-Fi access points, with pilgrims offered two hours of free access per day.

Hajj represents a unique challenge for mobile networks

Hajj takes place over a set number of days each year, in specific locations in and around the city of Mecca. It represents a unique demand on telecom networks, considering the number of visitors and their movement and congregation around various locations integral to the pilgrimage. For example, the journey from Mina to Arafat is 13 km and is undertaken by foot, while pilgrims also congregate in locations such as the Masjid al-Haram mosque in Mecca on the final day.

Pilgrims attending the Hajj typically use mobile networks to keep in touch with family and relatives at home and to document their pilgrimage. With a million people in attendance, the build up to the Hajj and ensuring sufficient network infrastructure is in place has become a major project. The CST works with network operators in the region to ensure sufficient network coverage and capacity before Hajj, while also monitoring performance metrics during Hajj. CST also developed business continuity and recovery plans to ensure the continuity of telecom and ICT services for pilgrims.

5G performance during Hajj 2022

Speedtest Intelligence® data shows that the introduction of 5G has massively boosted network performance in Saudi Arabia. In addition, despite the large number of pilgrims and resultant demand for capacity, the level of network densification at Hajj locations has driven increased performance over and above national levels. During this year’s Hajj, mean download speeds across all technologies in Saudi Arabia clocked in at 187.22 Mbps, while the mean upload speed was 23.89 Mbps. By contrast, the speeds recorded in Medina city were faster, with a mean download speed of 229.33 Mbps and a mean upload speed of 47.68 Mbps.

chart comparing 5G performance during Hajj, 2019 vs. 2022

Operator performance at Hajj locations can vary based on both the network infrastructure deployed and the level of congestion on each network. Speedtest Intelligence data during Hajj 2022 (7-12 July), for the city of Medina showed that stc achieved a median 5G download speed of 470.00 Mbps during Hajj 2022, ahead of Zain with 375.20 Mbps. Mobily led for median 5G upload performance with 40.18 Mps. In Mecca, there was no statistically significant lead for any operator in terms of median 5G download speeds, with Mobily recording 453.00 Mbps and stc 393.73 Mbps, while Mobily led on median 5G upload speed with 54.77 Mbps.

maps of 5G performance of Medina and Mecca during Hajj 2022

The impressive network speeds available in these locations are helping drive increased data use. Ericsson’s Mobility report estimates that global data traffic per user was on average 395 MB per day during 2021, while in GCC States the average was 723 MB. CST reported that daily internet consumption during the Hajj averaged 851 MB per user, an uplift of 142% compared to the average of 352 MB consumed in 2019. Beyond voice calls, video and social media apps including YouTube, TikTok, Facebook, Snapchat, and Instagram were the most heavily used.

The growth in video calls and social media video use necessitates sufficient network capacity to support an optimal video user experience. Speedtest Intelligence data shows that the adaptive average bitrate supported by 5G networks in the country was 3.97 Mbps in July, up from 3.57 Mbps in December 2021. Supporting a higher bitrate allows networks to serve higher definition video content. As a result, 77.2% of users recorded an adaptive primary video resolution of at least 720p, which is generally considered high definition. Mobily and Zain performed similarly in July, recording an adaptive average bitrate of 4.43 Mbps and 4.42 Mbps respectively.

Chart showing adaptive average bitrate in Saudi Arabia by operators

Mobile networks driving digitization of Hajj services

For several years, Saudi Arabia’s Ministry of Hajj and Umrah has sought to improve the experience and safety of pilgrims visiting the country. Prior to this, managing the Hajj application process, as well as logistics, accommodation, and other important services such as healthcare provision had been a largely manual process, and given the scale of Hajj, subject to errors and delays. The Pilgrim Experience Program was launched in 2019, following a study involving thousands of Muslims worldwide to define their expectations and needs. It seeks to enable new innovations (many supported by mobile network connectivity) designed to enhance the pilgrim’s experience during the Hajj and Umrah (pilgrimage outside of Hajj). Key developments include:

Hajj Smart ID. 2021 saw the introduction of electronic “Hajj cards,” allowing contactless access to all religious sites, accommodation, and transport. These digital passes aimed to facilitate the movement of pilgrims to and from Mecca, reducing waiting times for transport between Mecca and the Holy Sites, while also minimizing the need for human contact (an imperative during the COVID-19 pandemic). This initiative was expanded in 2022 with the introduction of the Hajj Smart ID, enabling pilgrims, Hajj staff, and organizers to access medical services, location data, as well as coordination and communication with the rest of a pilgrim’s group.

Digital Healthcare Services. Healthcare for pilgrims attending Hajj has been a major focus, given the strenuous nature of the pilgrimage and the high temperatures pilgrims are exposed to. The smart bracelet initiative, introduced in 2021, provided pilgrims with a connected wearable health device, which included their personal data as well as health status. The bracelet monitored blood oxygen levels and heart rate in real-time, allowing pilgrims to seek emergency medical or security assistance services. This year, the Saudi Minister of Health launched a “Holodoctor” service in partnership with stc, using 5G connectivity to offer pilgrims medical services via 3D video conference, including inspection, diagnosis, and the disbursement of medicines.

Crowd management. The “Tafweej” program focuses on crowd management for the Hajj, a vital task in light of problems in the past caused by overcrowding which led to fatalities. Organizers have sought to group pilgrims together and schedule movements of these groups using an electronic system that monitors traffic flow at key sites. During 2022’s Hajj, CITC and GPH (General Presidency of Haramain) trialed an indoor smart navigation system to help pilgrims and operations teams navigate the Grand Mosque more efficiently. Stc has also looked to introduce Augmented Reality (AR) services to support this effort, providing virtual guides for Tawaf (the part of Hajj involving circumambulation of the Ka’bah), as well as providing directions and information about the Grand Mosque (Mecca Haram). Saudi Arabia’s Vision’s 2030 goal is to support 30 million pilgrims annually, a huge increase over current levels, and will rely on further innovations built on top of the nation’s rapidly developing 5G networks. Click here to find out more about how Ookla’s Speedtest Intelligence data can offer competitive network insights and support targeted network investment decisions.

Ookla retains ownership of this article including all of the intellectual property rights, data, content graphs and analysis. This article may not be quoted, reproduced, distributed or published for any commercial purpose without prior consent. Members of the press and others using the findings in this article for non-commercial purposes are welcome to publicly share and link to report information with attribution to Ookla.