
Travelers jetting off to Asia this summer will probably want to know whether you can connect to the internet upon landing and whether that internet is fast enough to help you nail down any final travel details before hitting the hotel and sleeping off the jet lag.
Using Speedtest data for March-May 2017, we analyzed the speeds of free airport Wi-Fi and local cellular signals at the busiest airports in Asia to see what your best options are and where you’re flat out of luck.
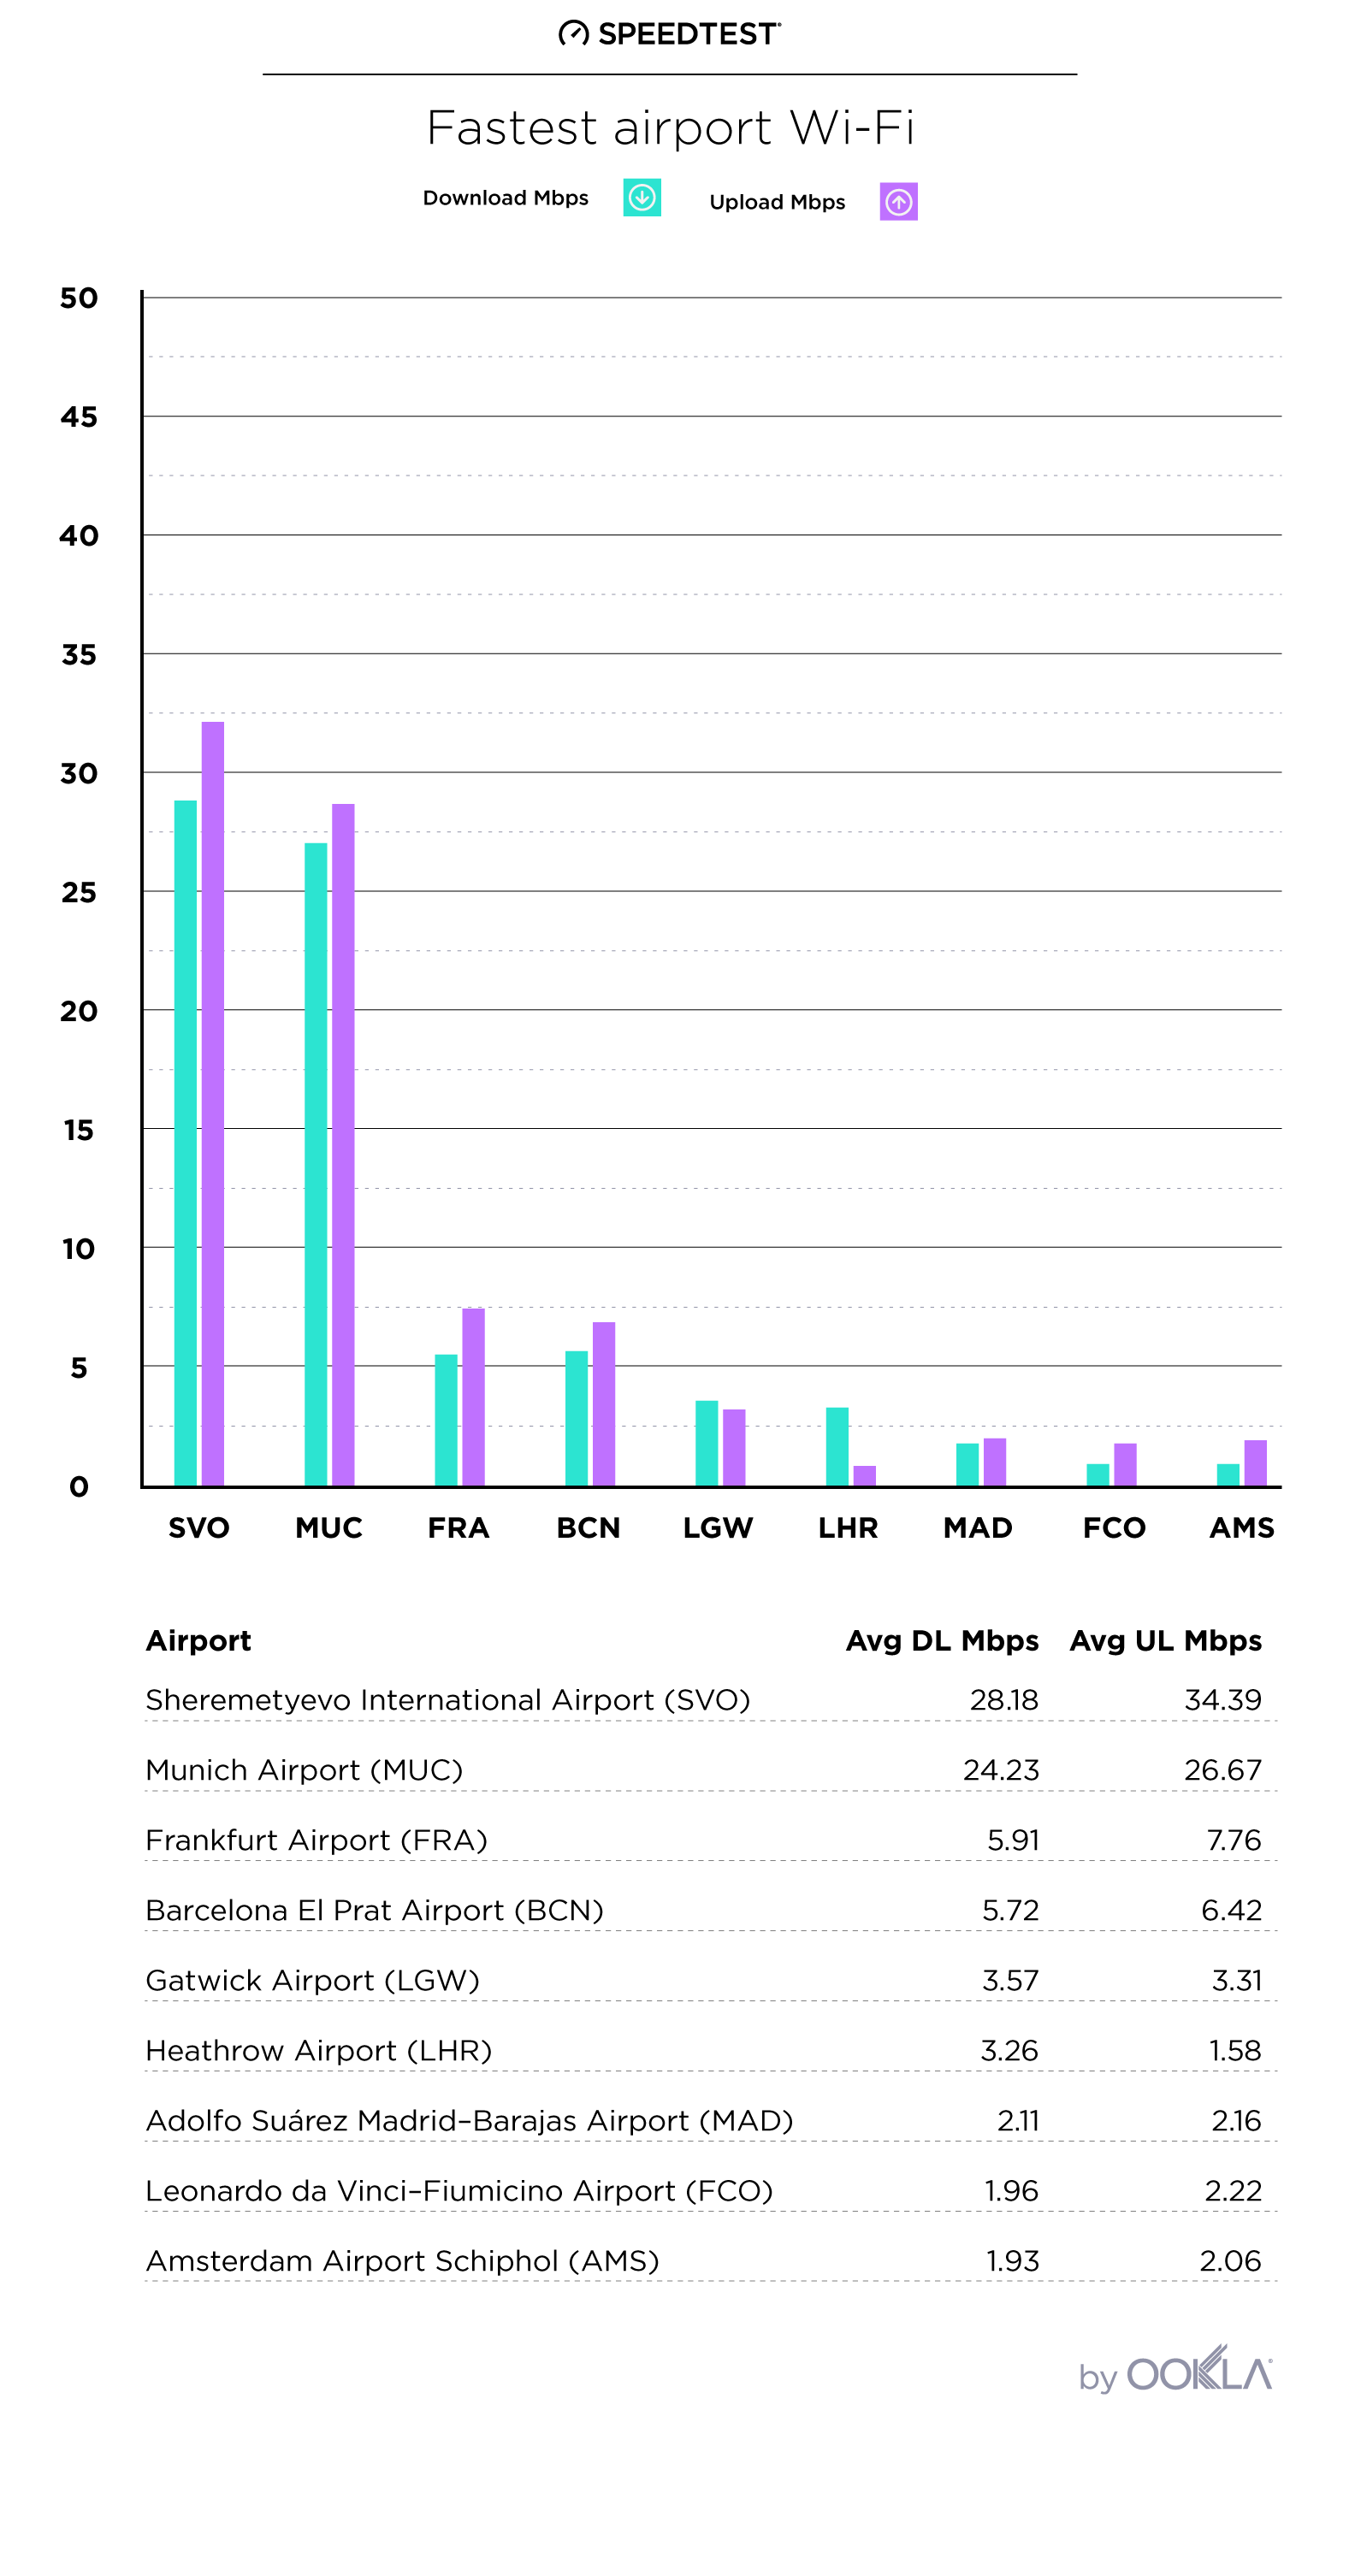
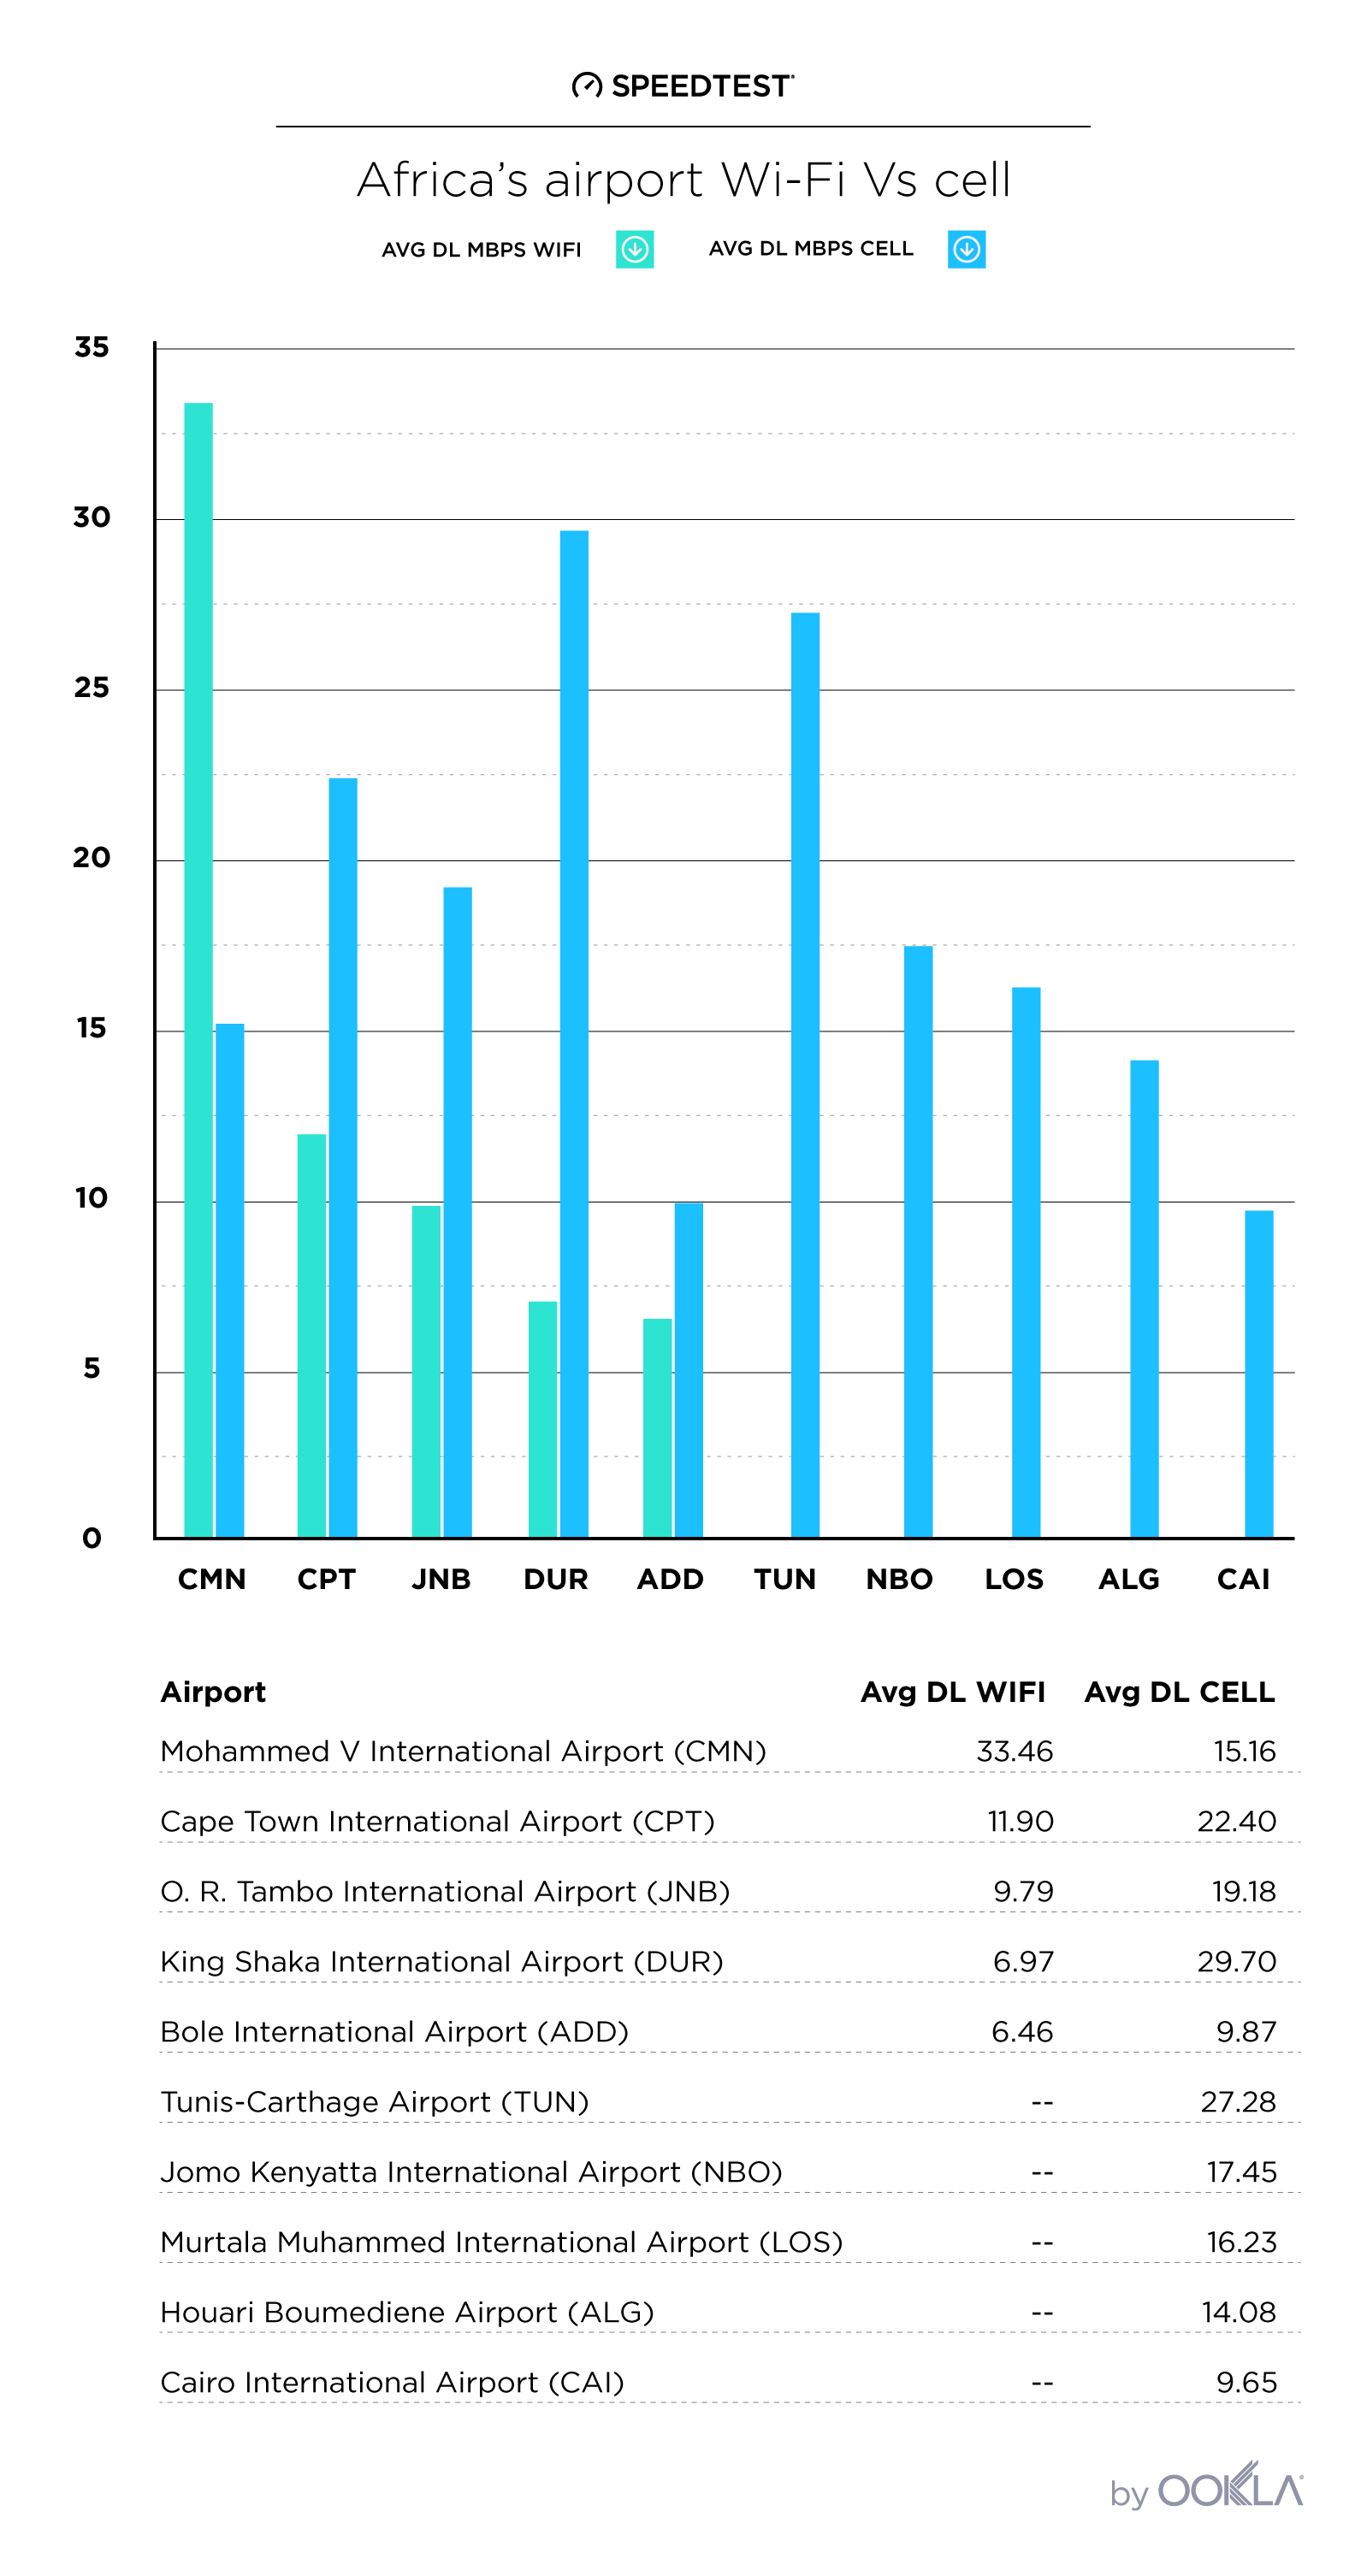
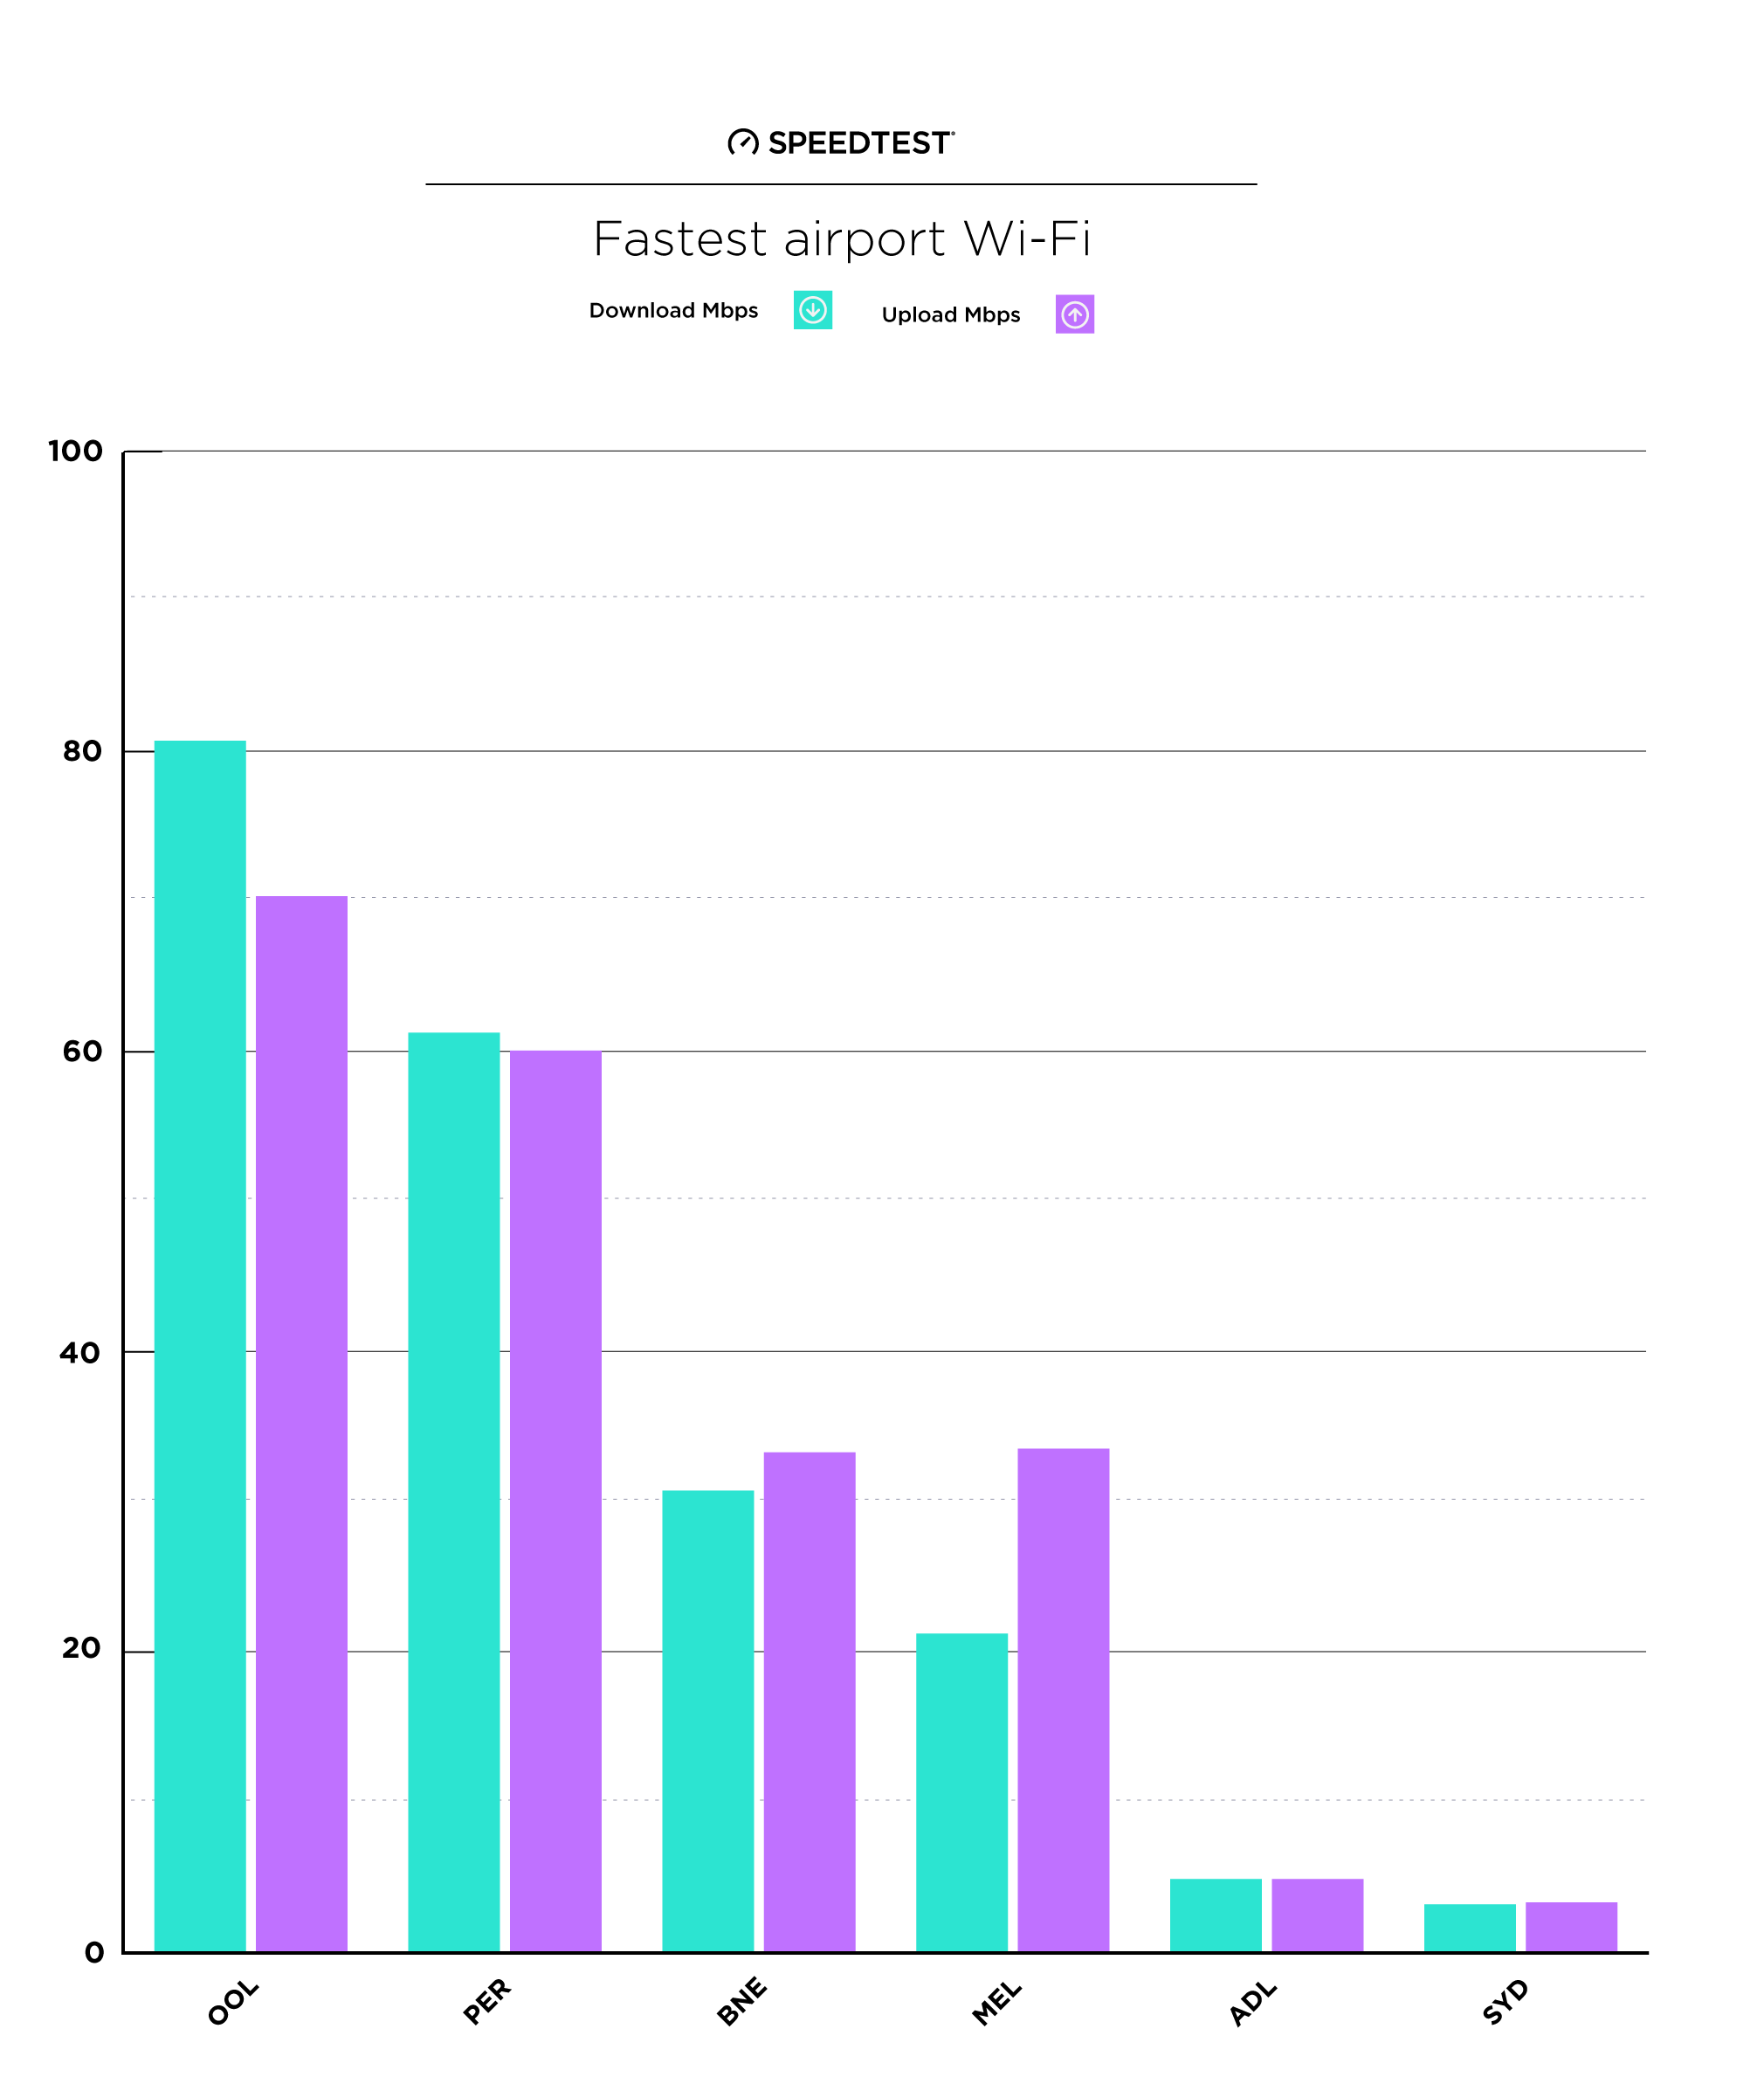
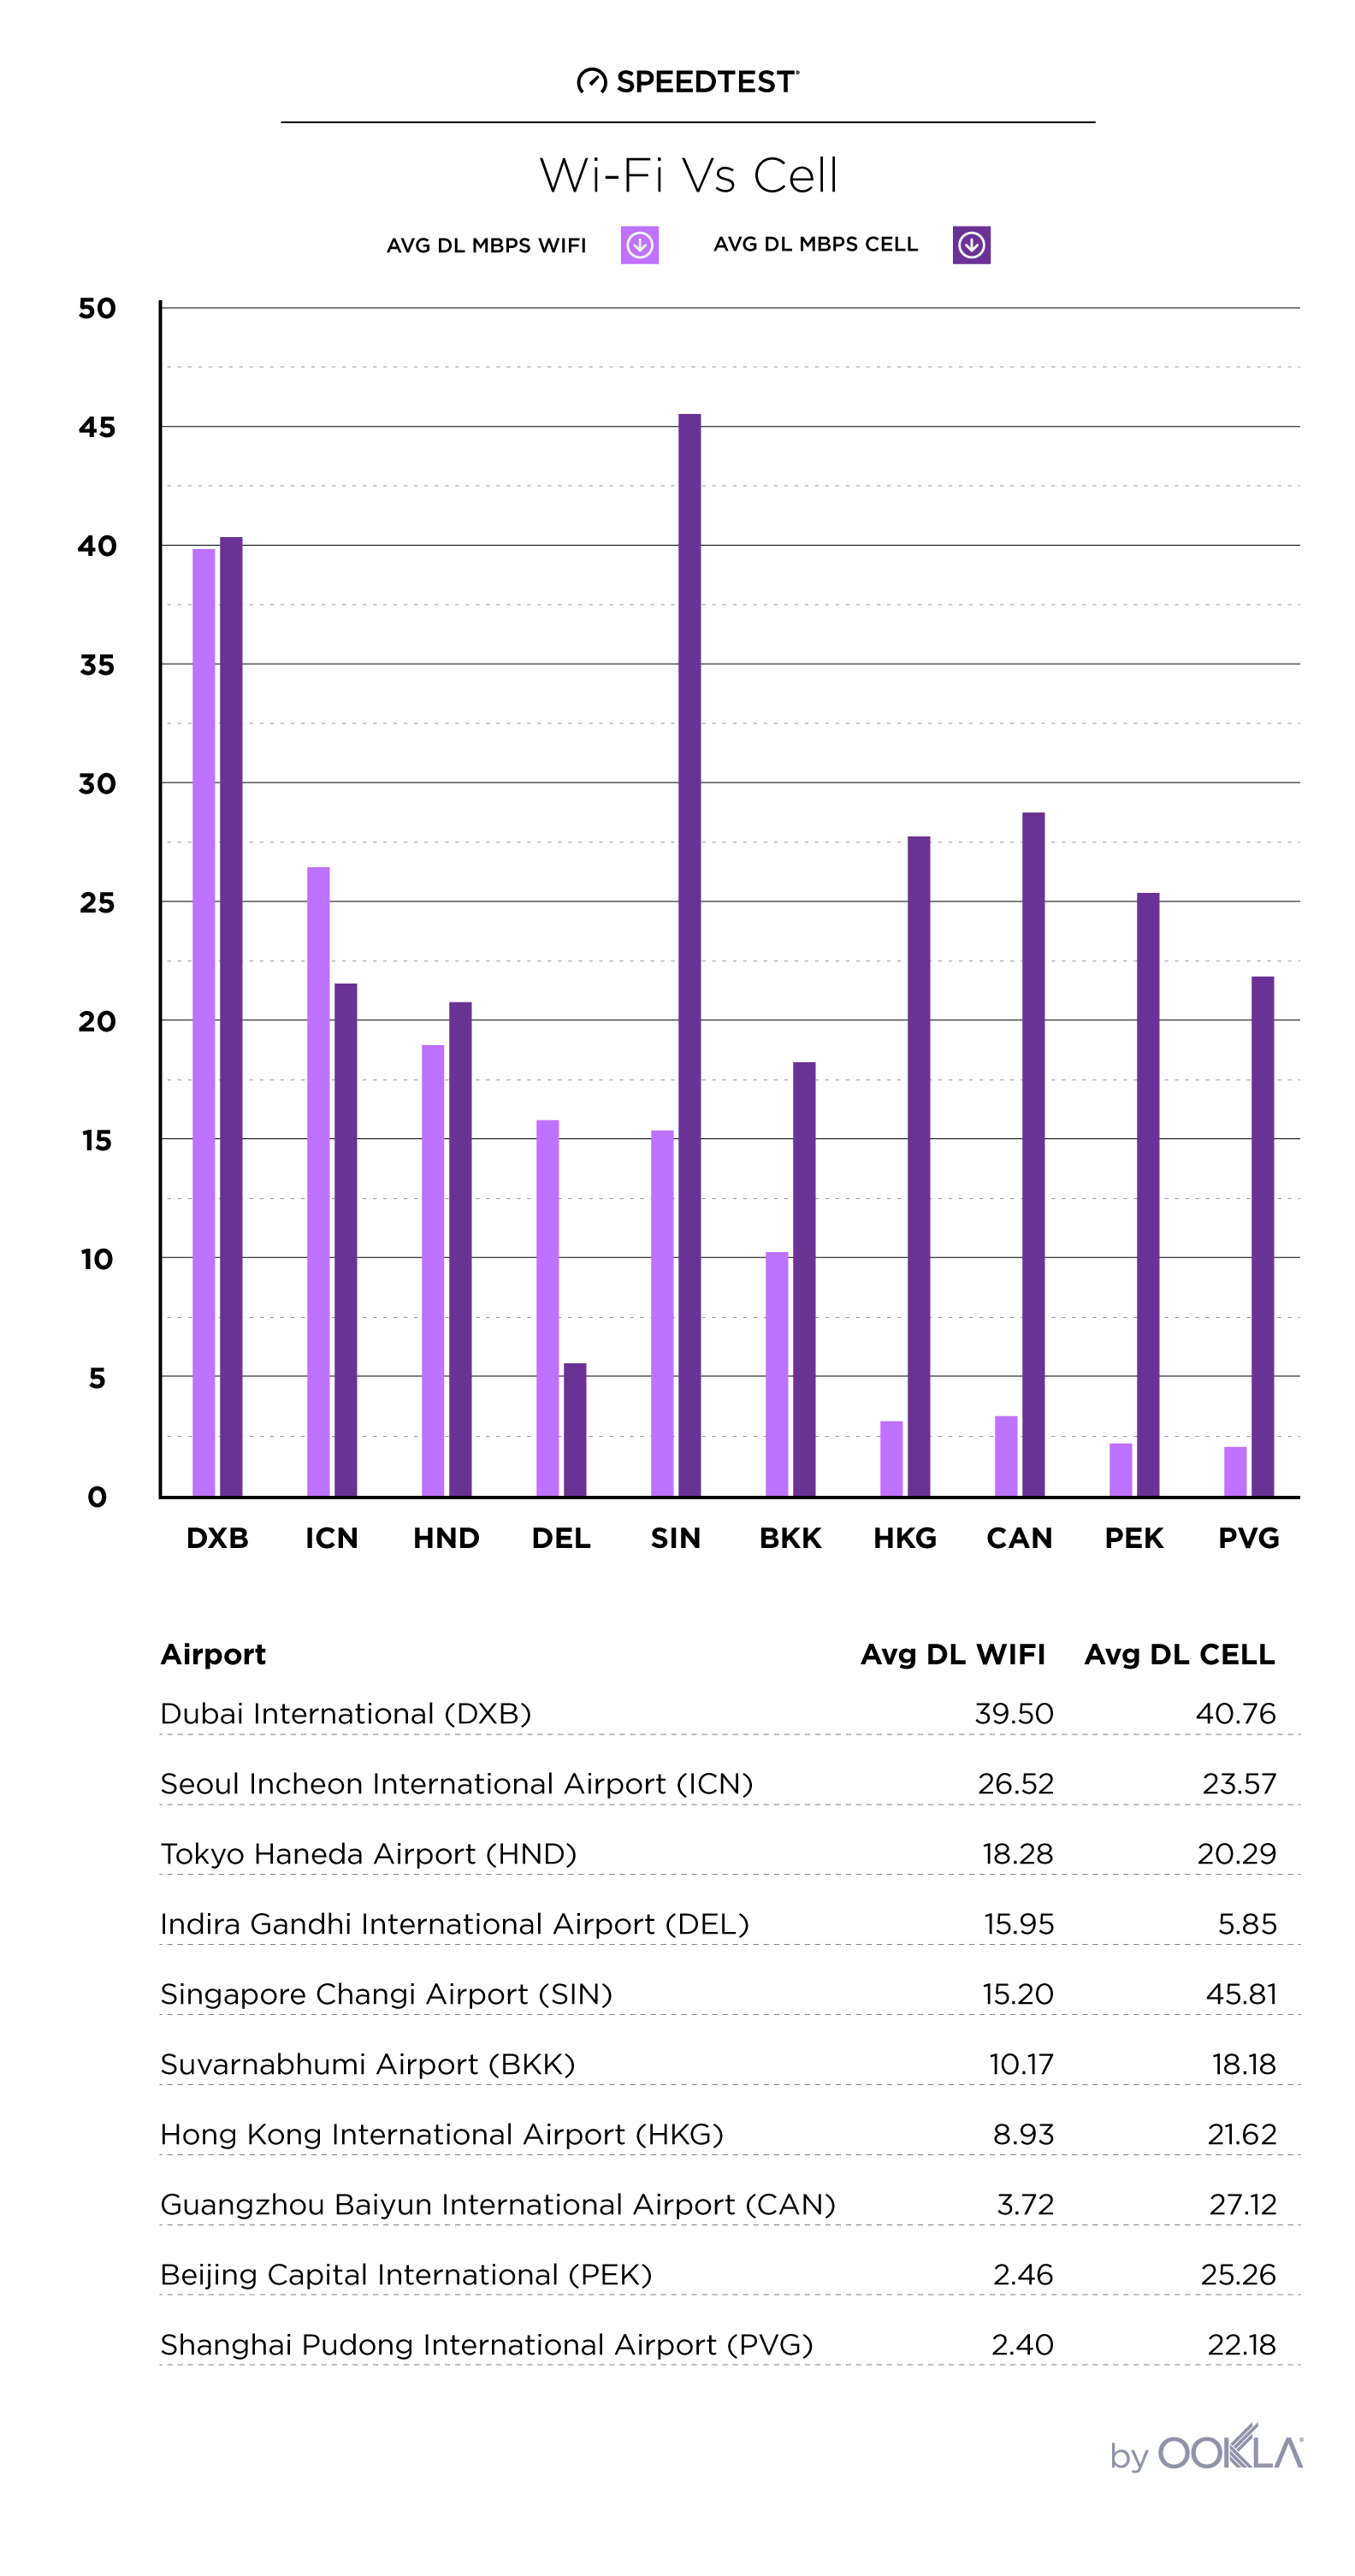
Fastest airport Wi-Fi
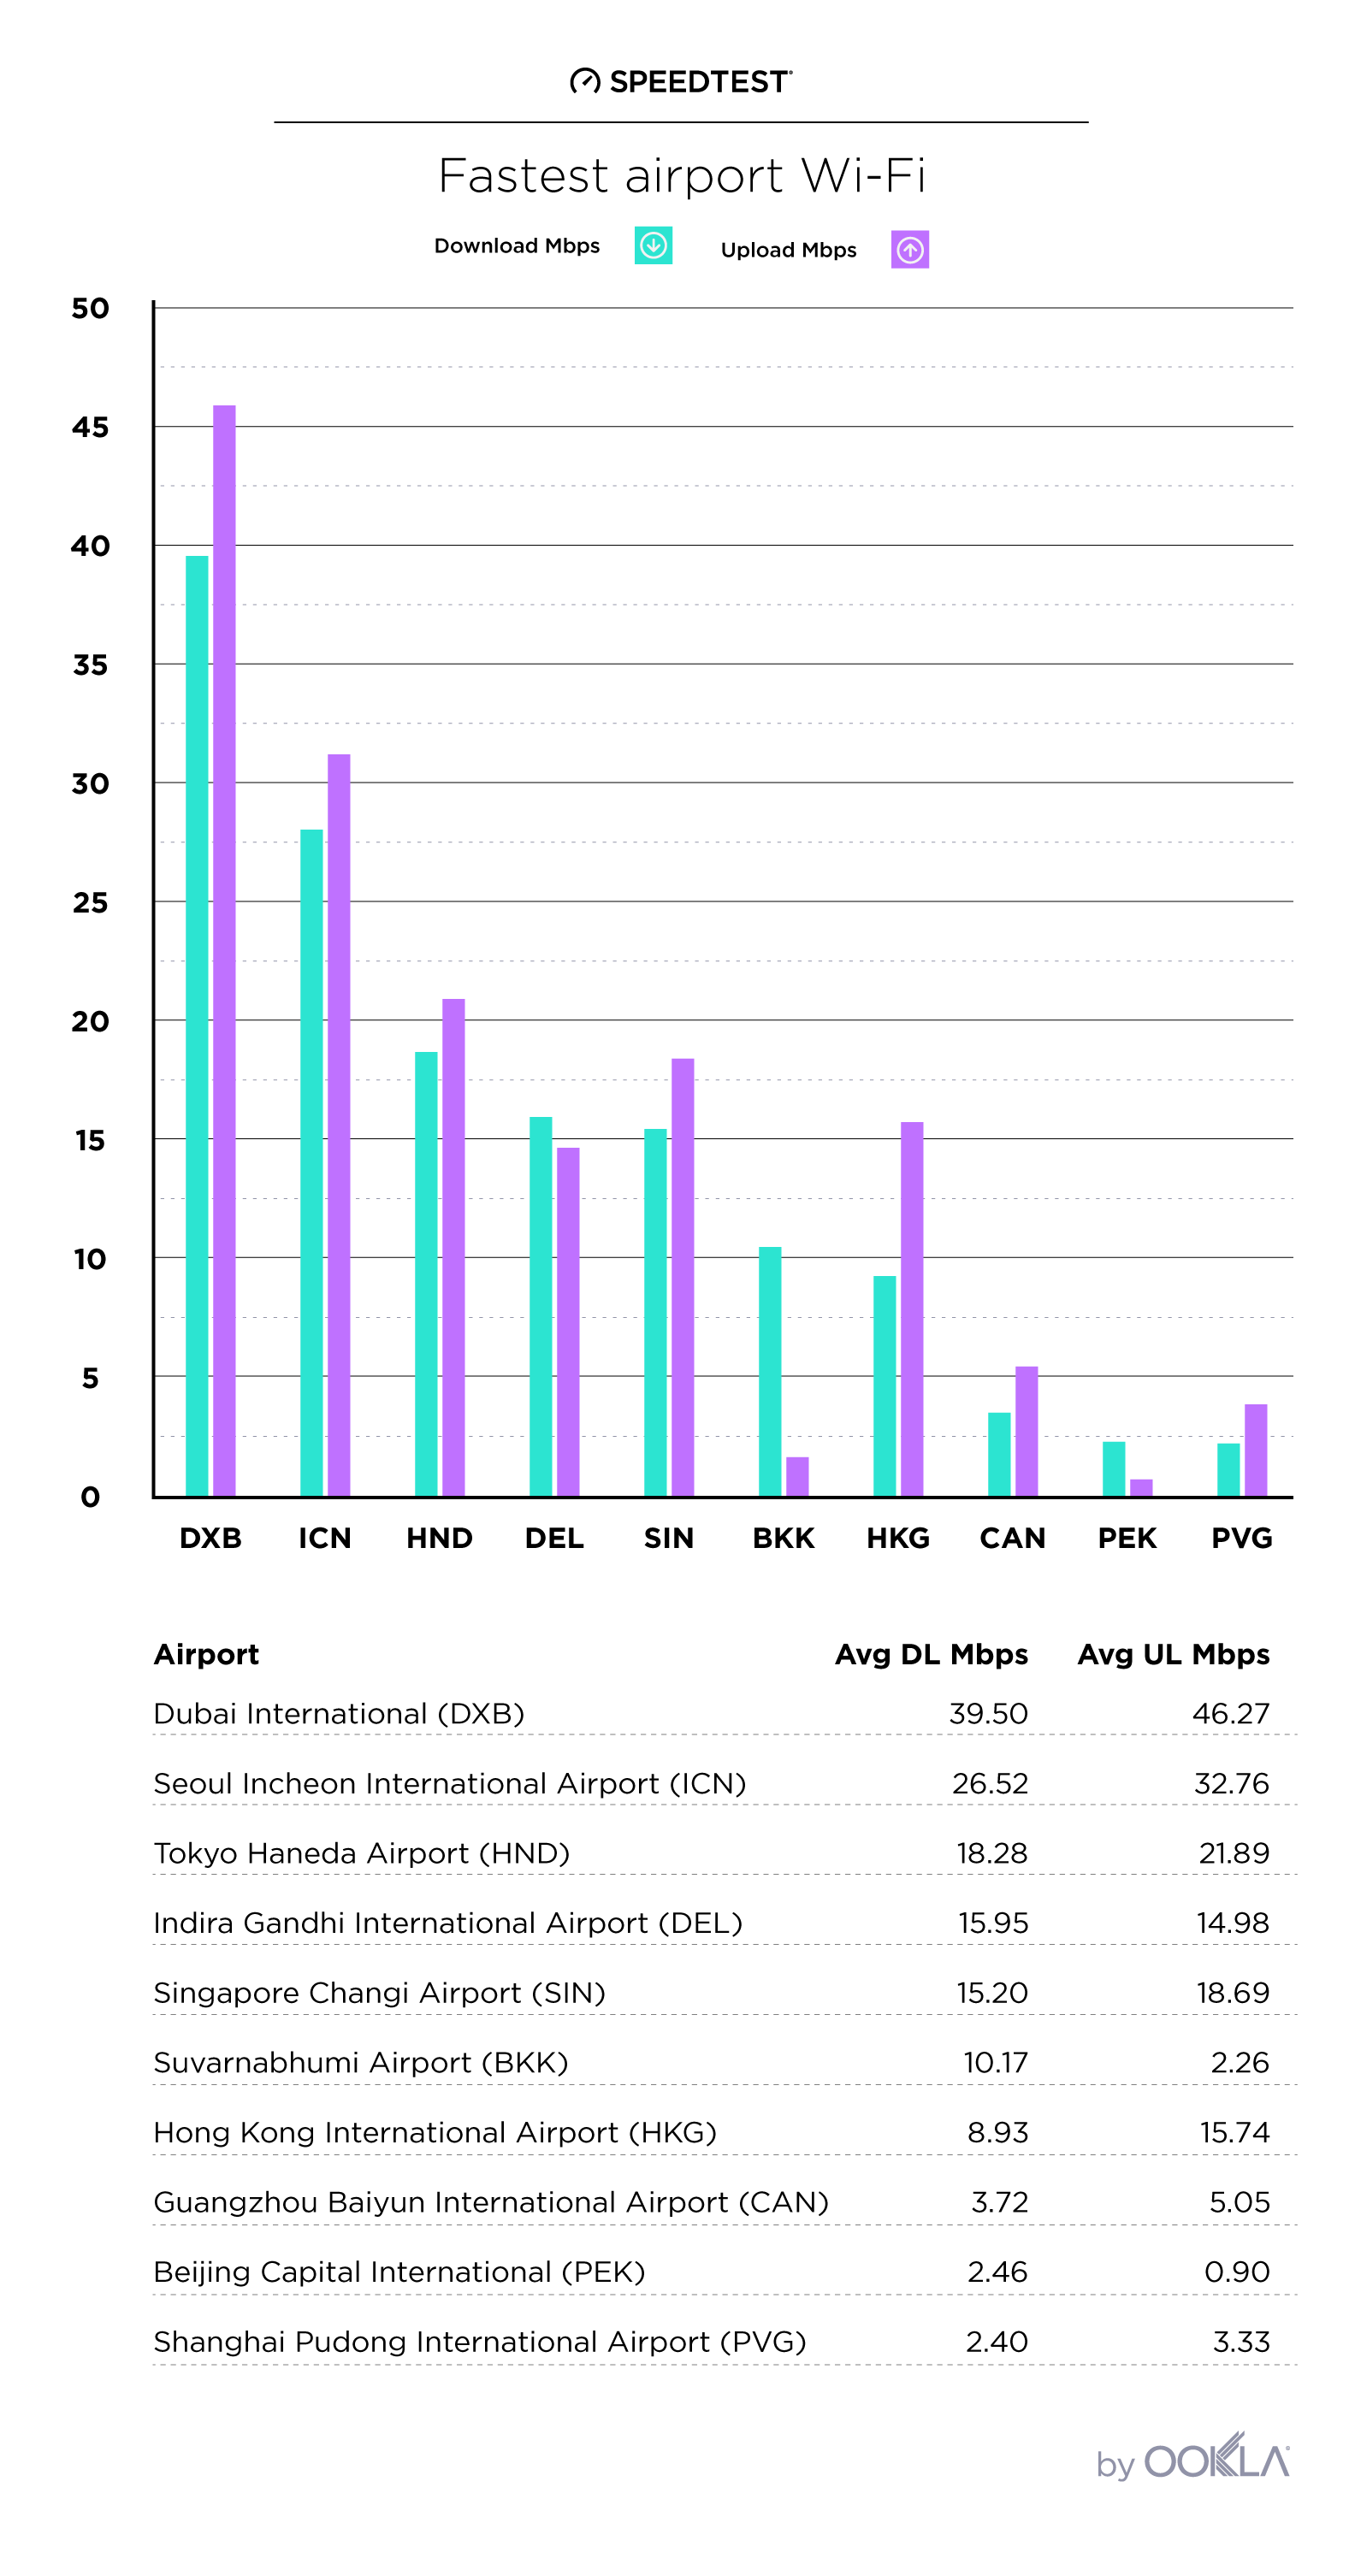
Dubai reigns when it comes to free airport Wi-Fi. In fact, this airport has the fastest Wi-Fi we’ve seen at any airport in Asia, Europe or Africa. And their average upload speed is even faster than their download. Travelers to second-place Seoul are also in excellent shape if they need to connect to the internet while in transit.
Tokyo, Delhi and Singapore have decently fast download speeds over airport Wi-Fi while Bangkok’s and Hong Kong’s are merely okay. Sadly, the rest of the airports offer painfully slow free Wi-Fi.
You might think airport Wi-Fi is similar to the average mobile Wi-Fi speeds of the country, but instead some of the fastest countries — Singapore (111.59 Mbps), Hong Kong (63.70 Mbps) and China (47.64 Mbps) — have poor to average airport Wi-Fi speeds. Though sitting near the top of the airport Wi-Fi pack, South Korea’s 66.67 Mbps, Japan’s 42.00 Mbps and Thailand’s 30.48 Mbps country averages show the Wi-Fi at their premier airports could be a lot faster. India’s average download speed (12.39 Mbps) is right in line with the Wi-Fi at Indira Gandhi International Airport.
On the other end of the spectrum, the United Arab Emirates has clearly prioritized airport Wi-Fi because the Wi-Fi download speed at Dubai International is nearly double the country average of 22.12 Mbps.
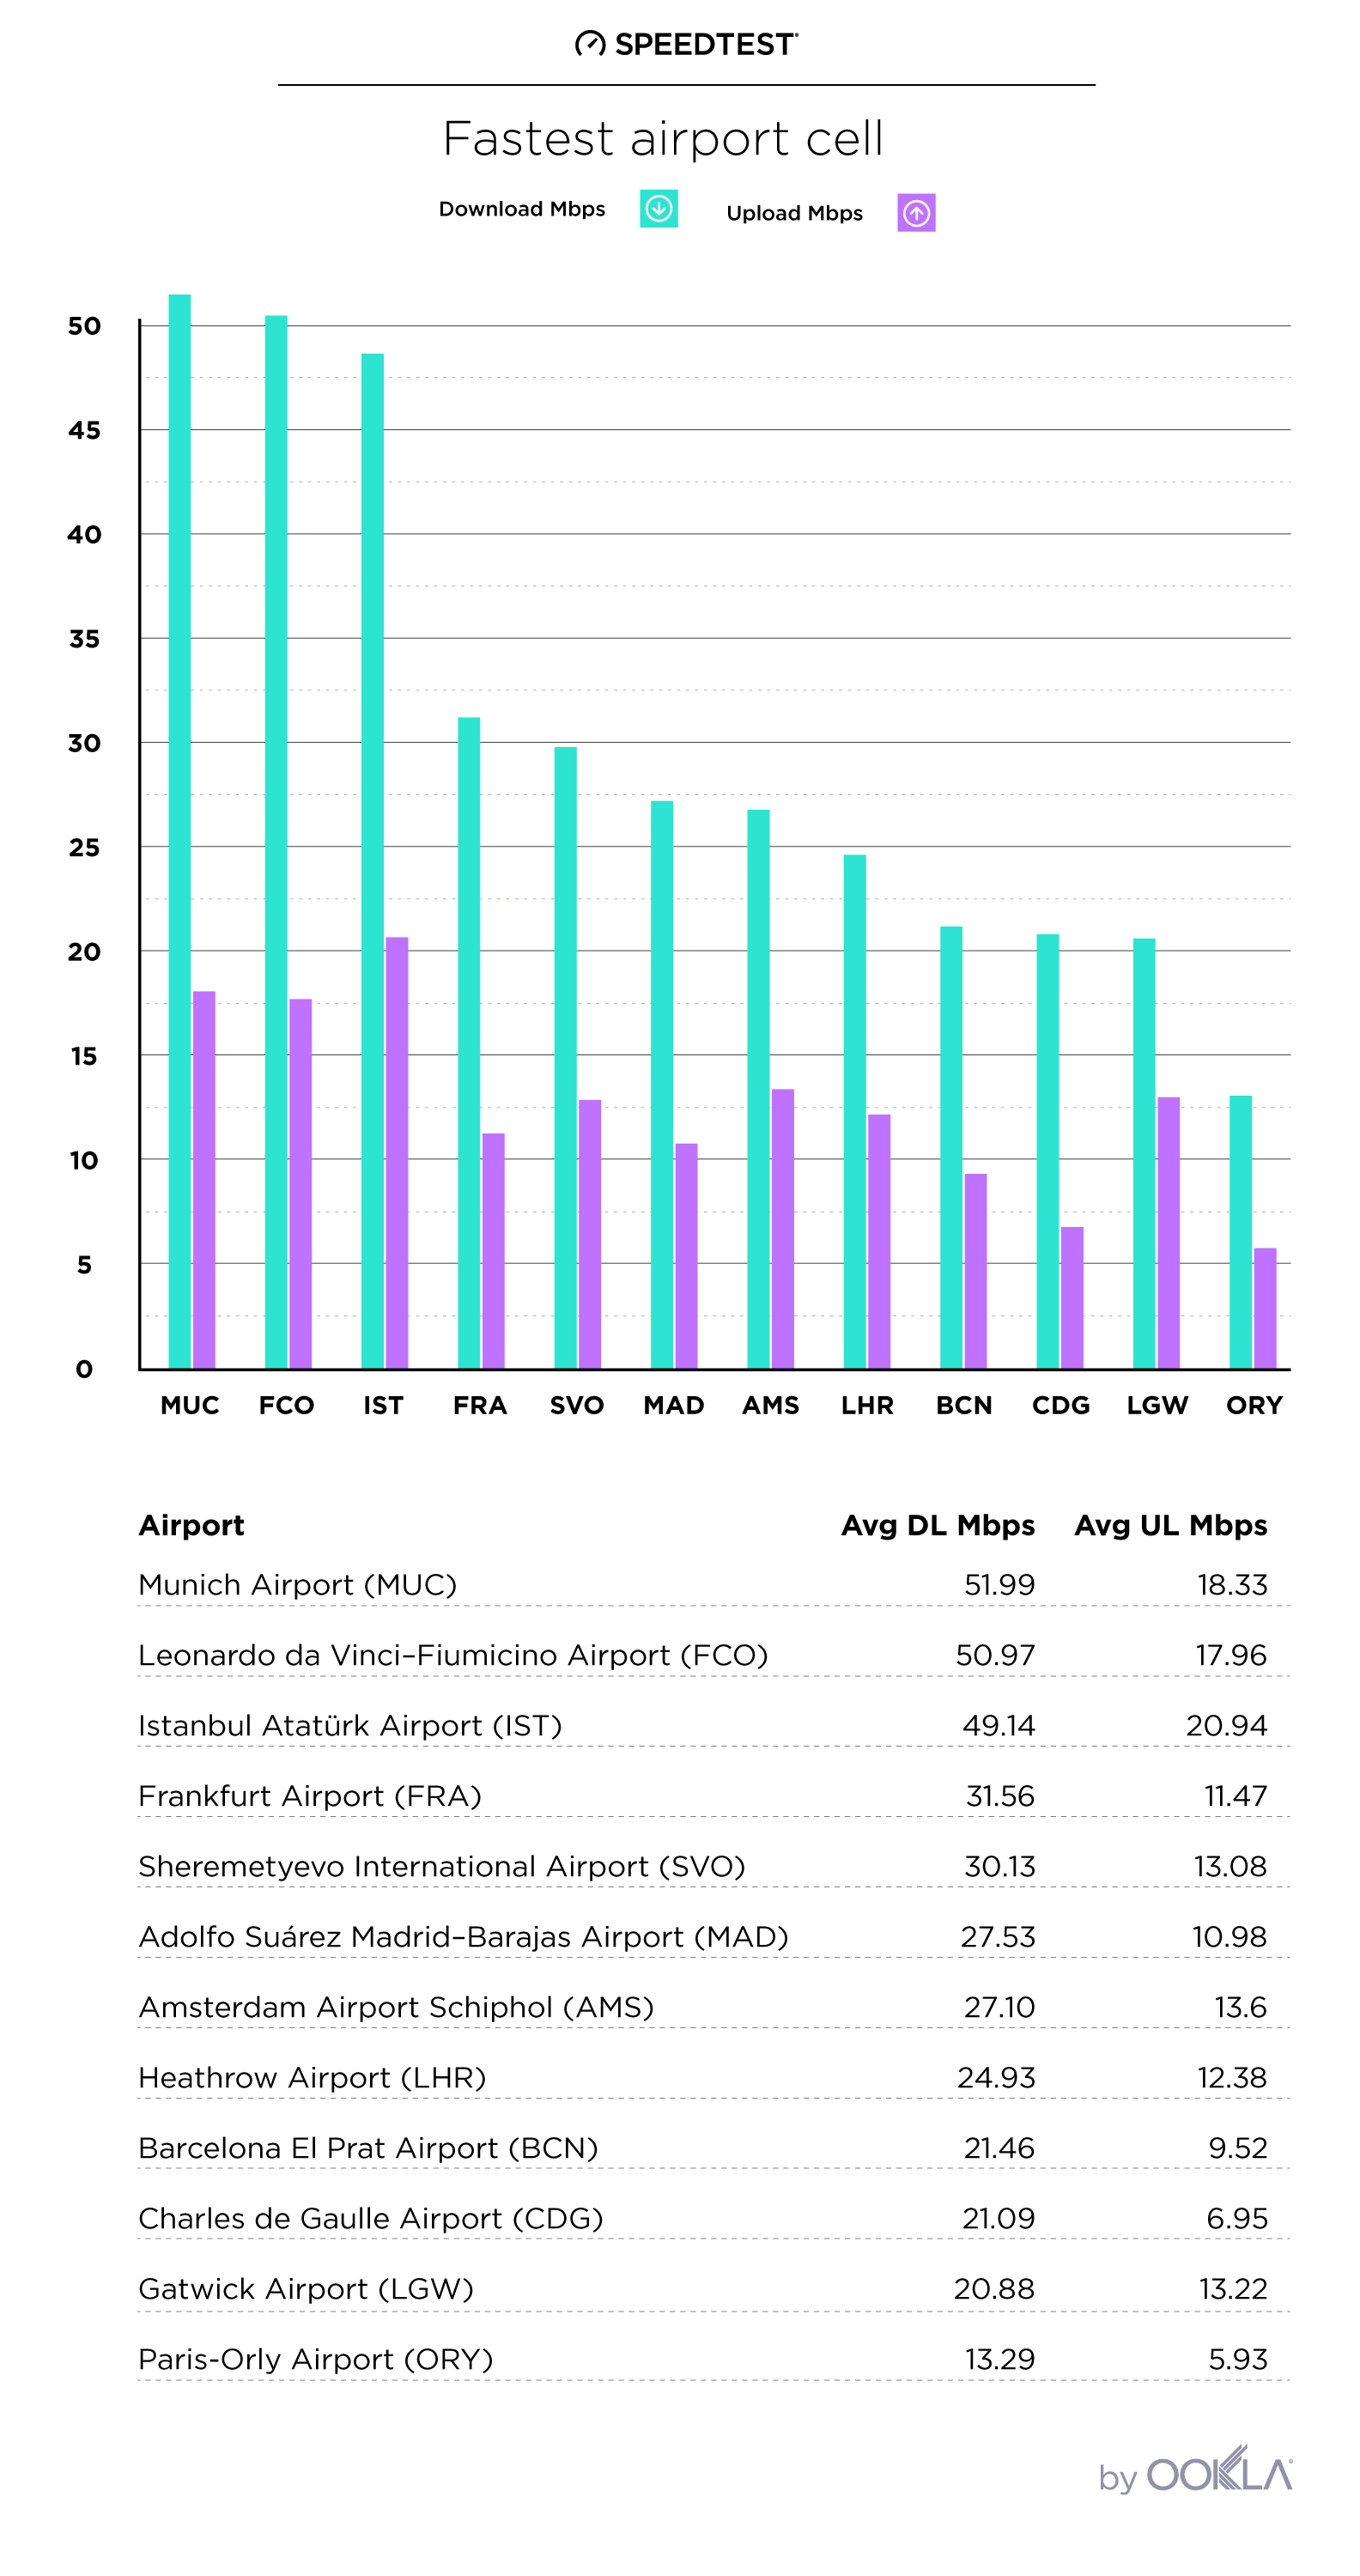
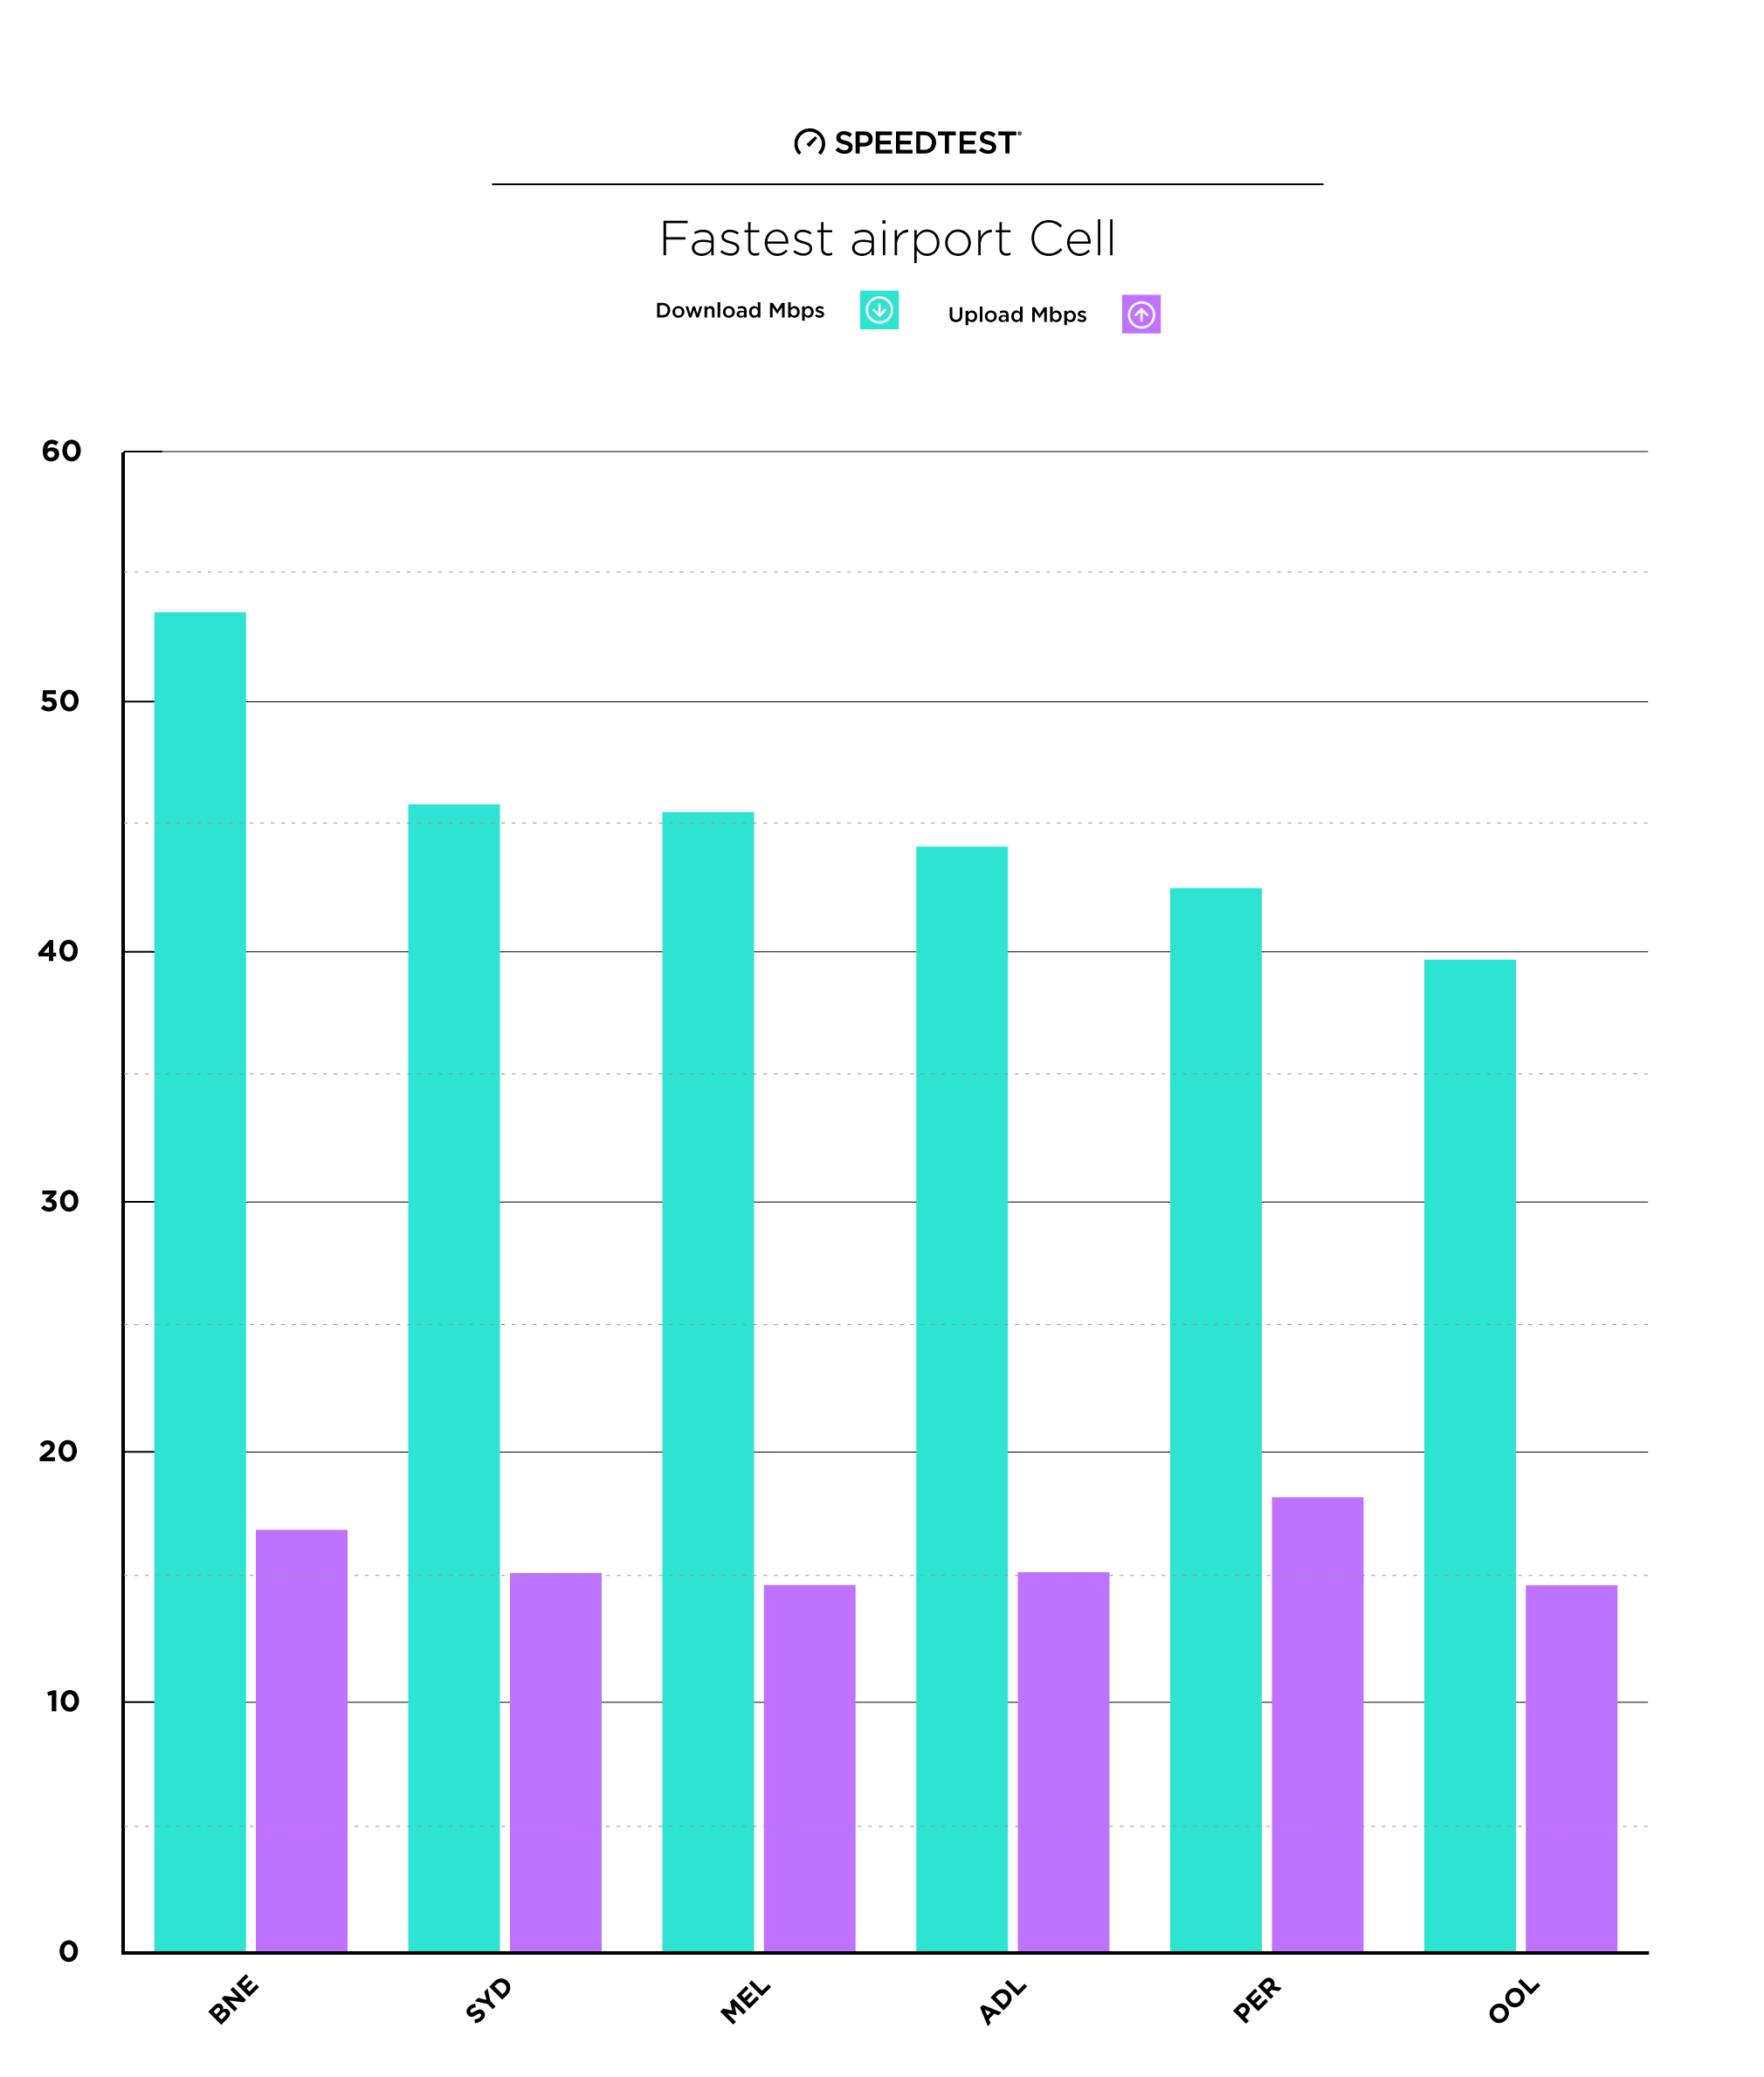
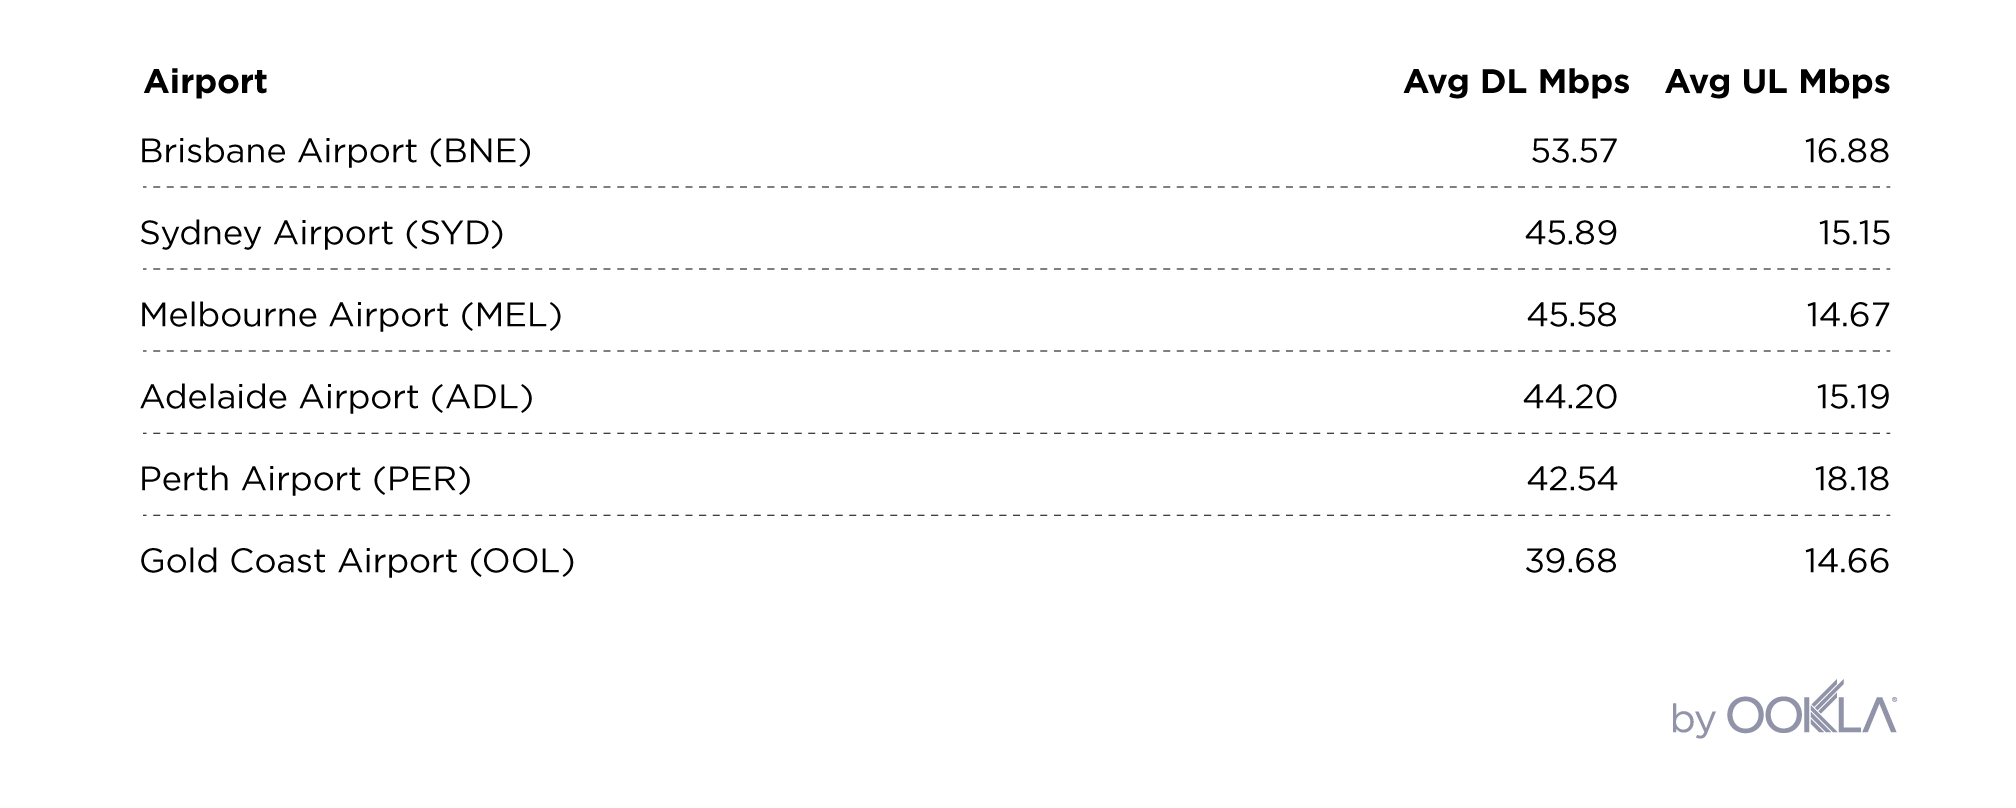
Fastest airport cell
In countries including China and India, you can’t connect to the free airport Wi-Fi without an in-country mobile number, so we checked Speedtest results for users on cell networks as well.
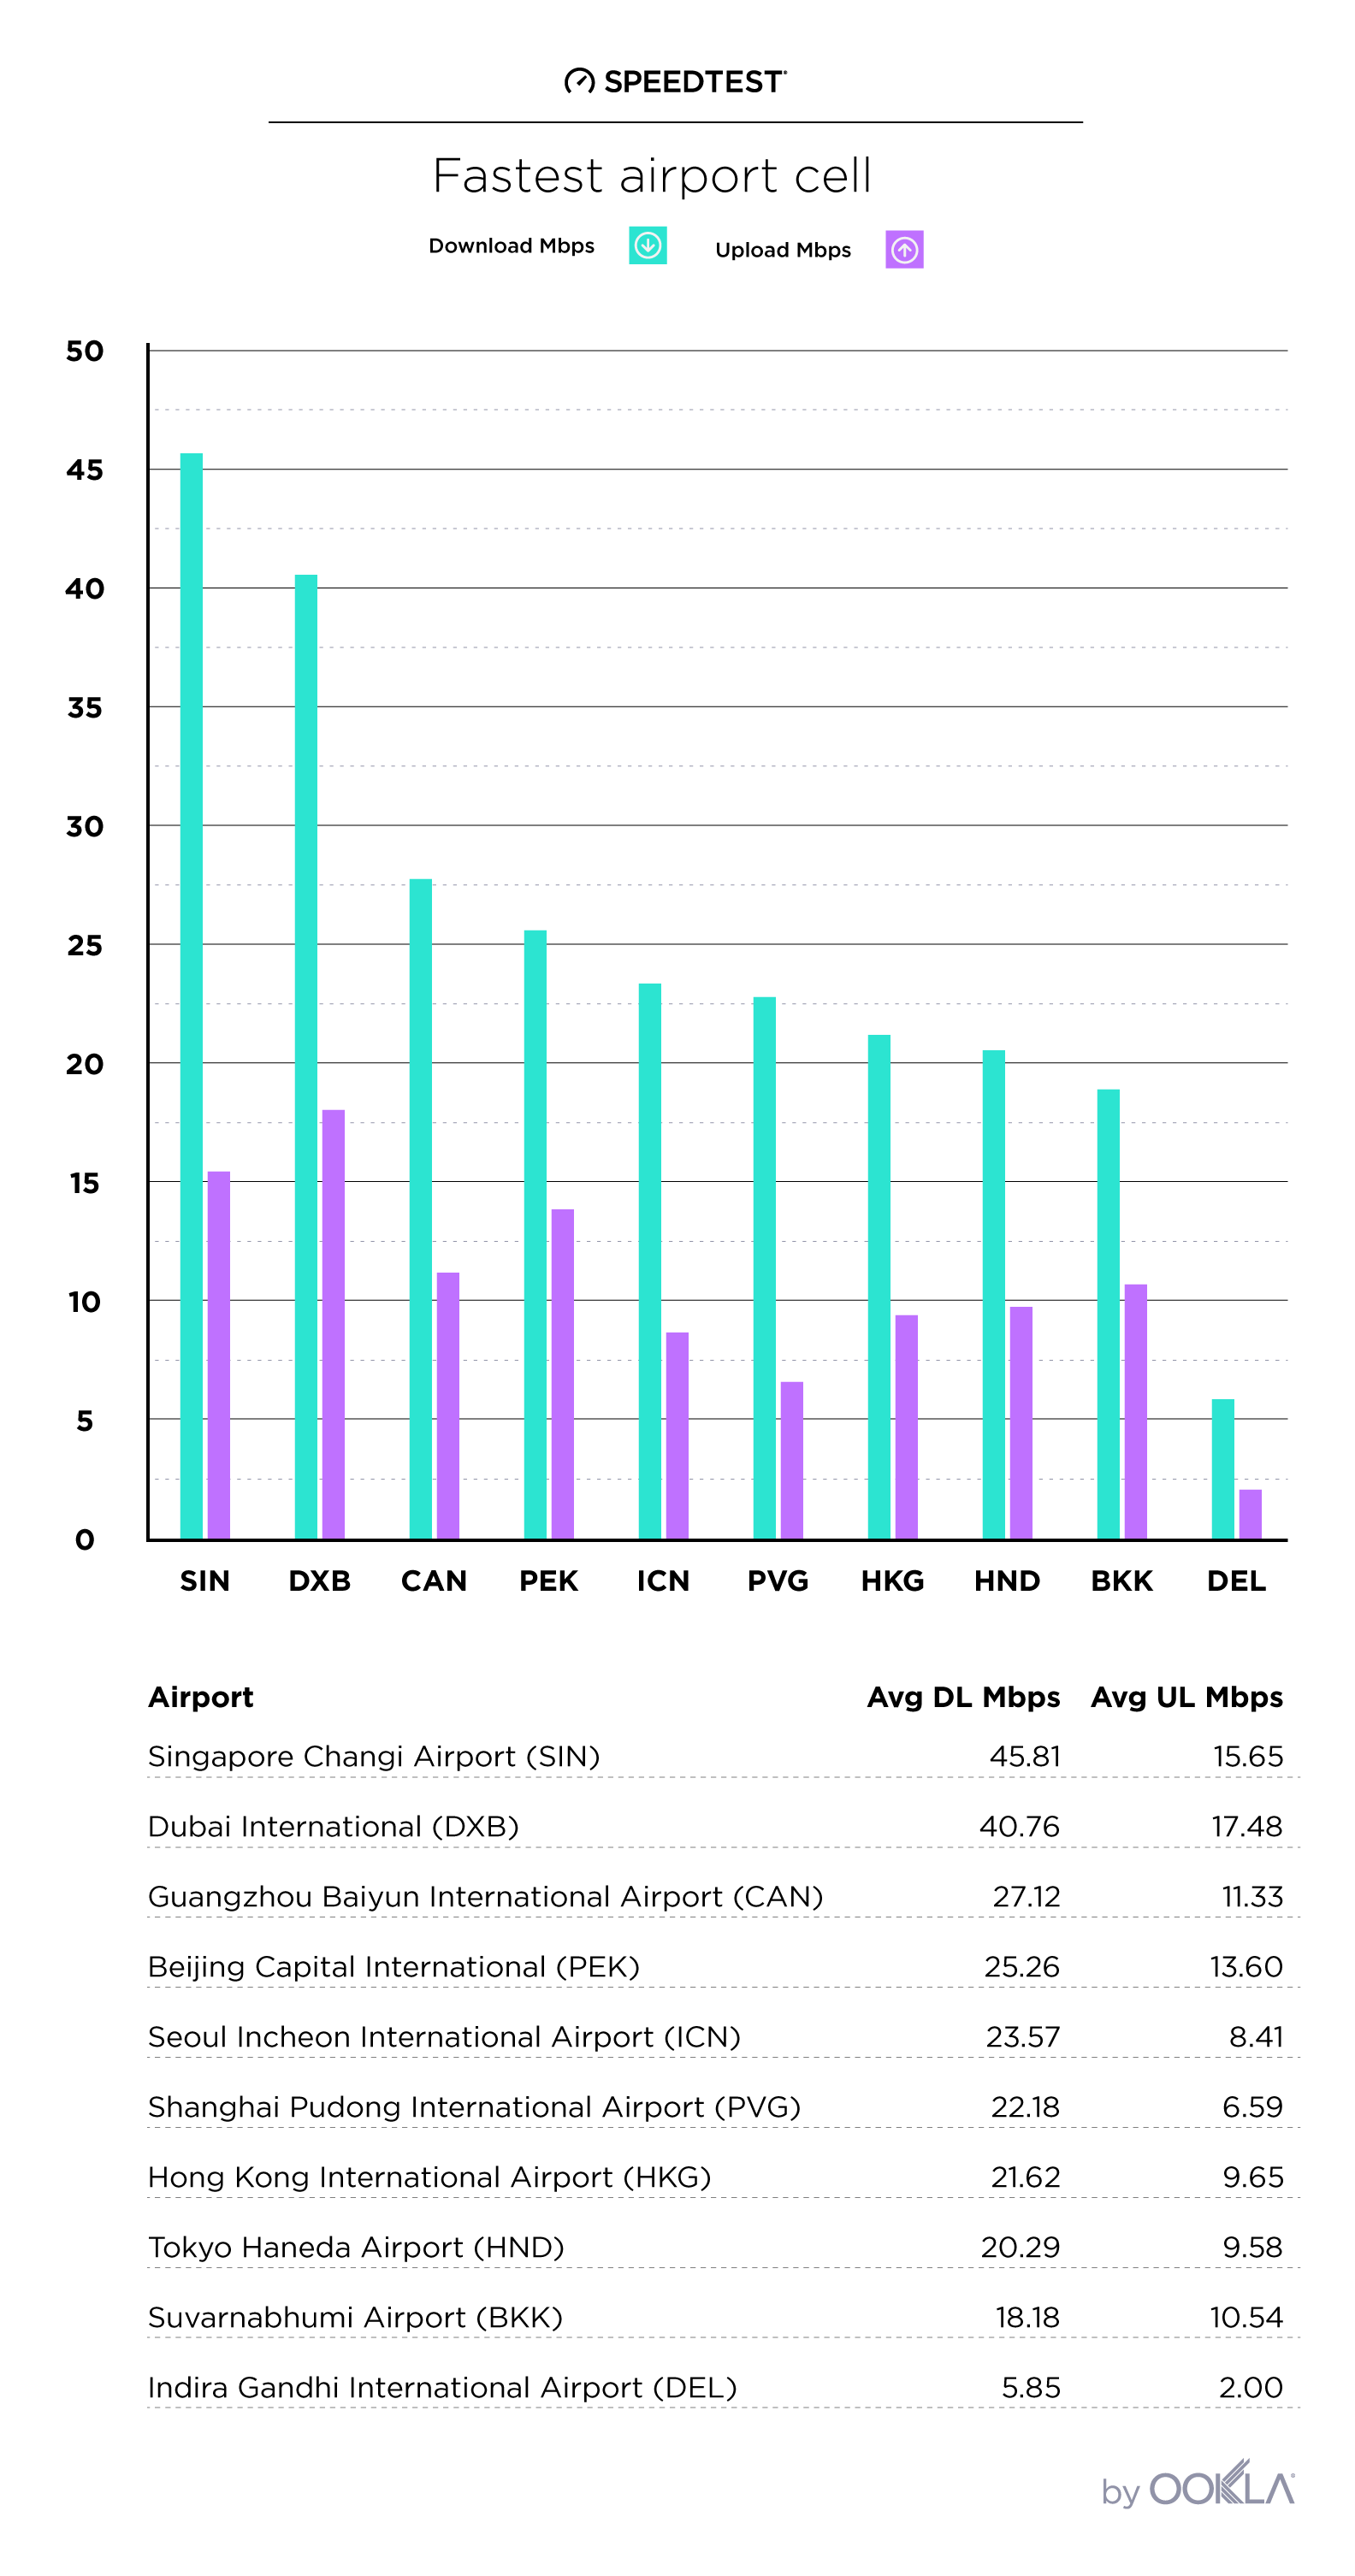
The average mobile download speed at Singapore’s Changi Airport is nearly as fast as the country’s average of 46.12 Mbps. Considering Singapore ranks second fastest in the world for mobile downloads, that’s a hard speed to beat. Dubai also has wonderfully fast speeds, and they beat the country average of 29.81 Mbps.
East Asia’s airports form a strong middle of the pack with cellular download speeds ranging from 18.18 Mbps in Bangkok to 27.12 in Guangzhou. These are comparable to the country average mobile download speeds of 33.63 Mbps for China, 19.70 Mbps for Hong Kong, 18.48 for Japan, and 14.58 for Thailand. Flyers at Delhi’s Indira Gandhi Airport, though, will be sorely disappointed with the 5.85 Mbps on offer. But that’s only slightly slower than India’s 7.62 Mbps mobile download average.
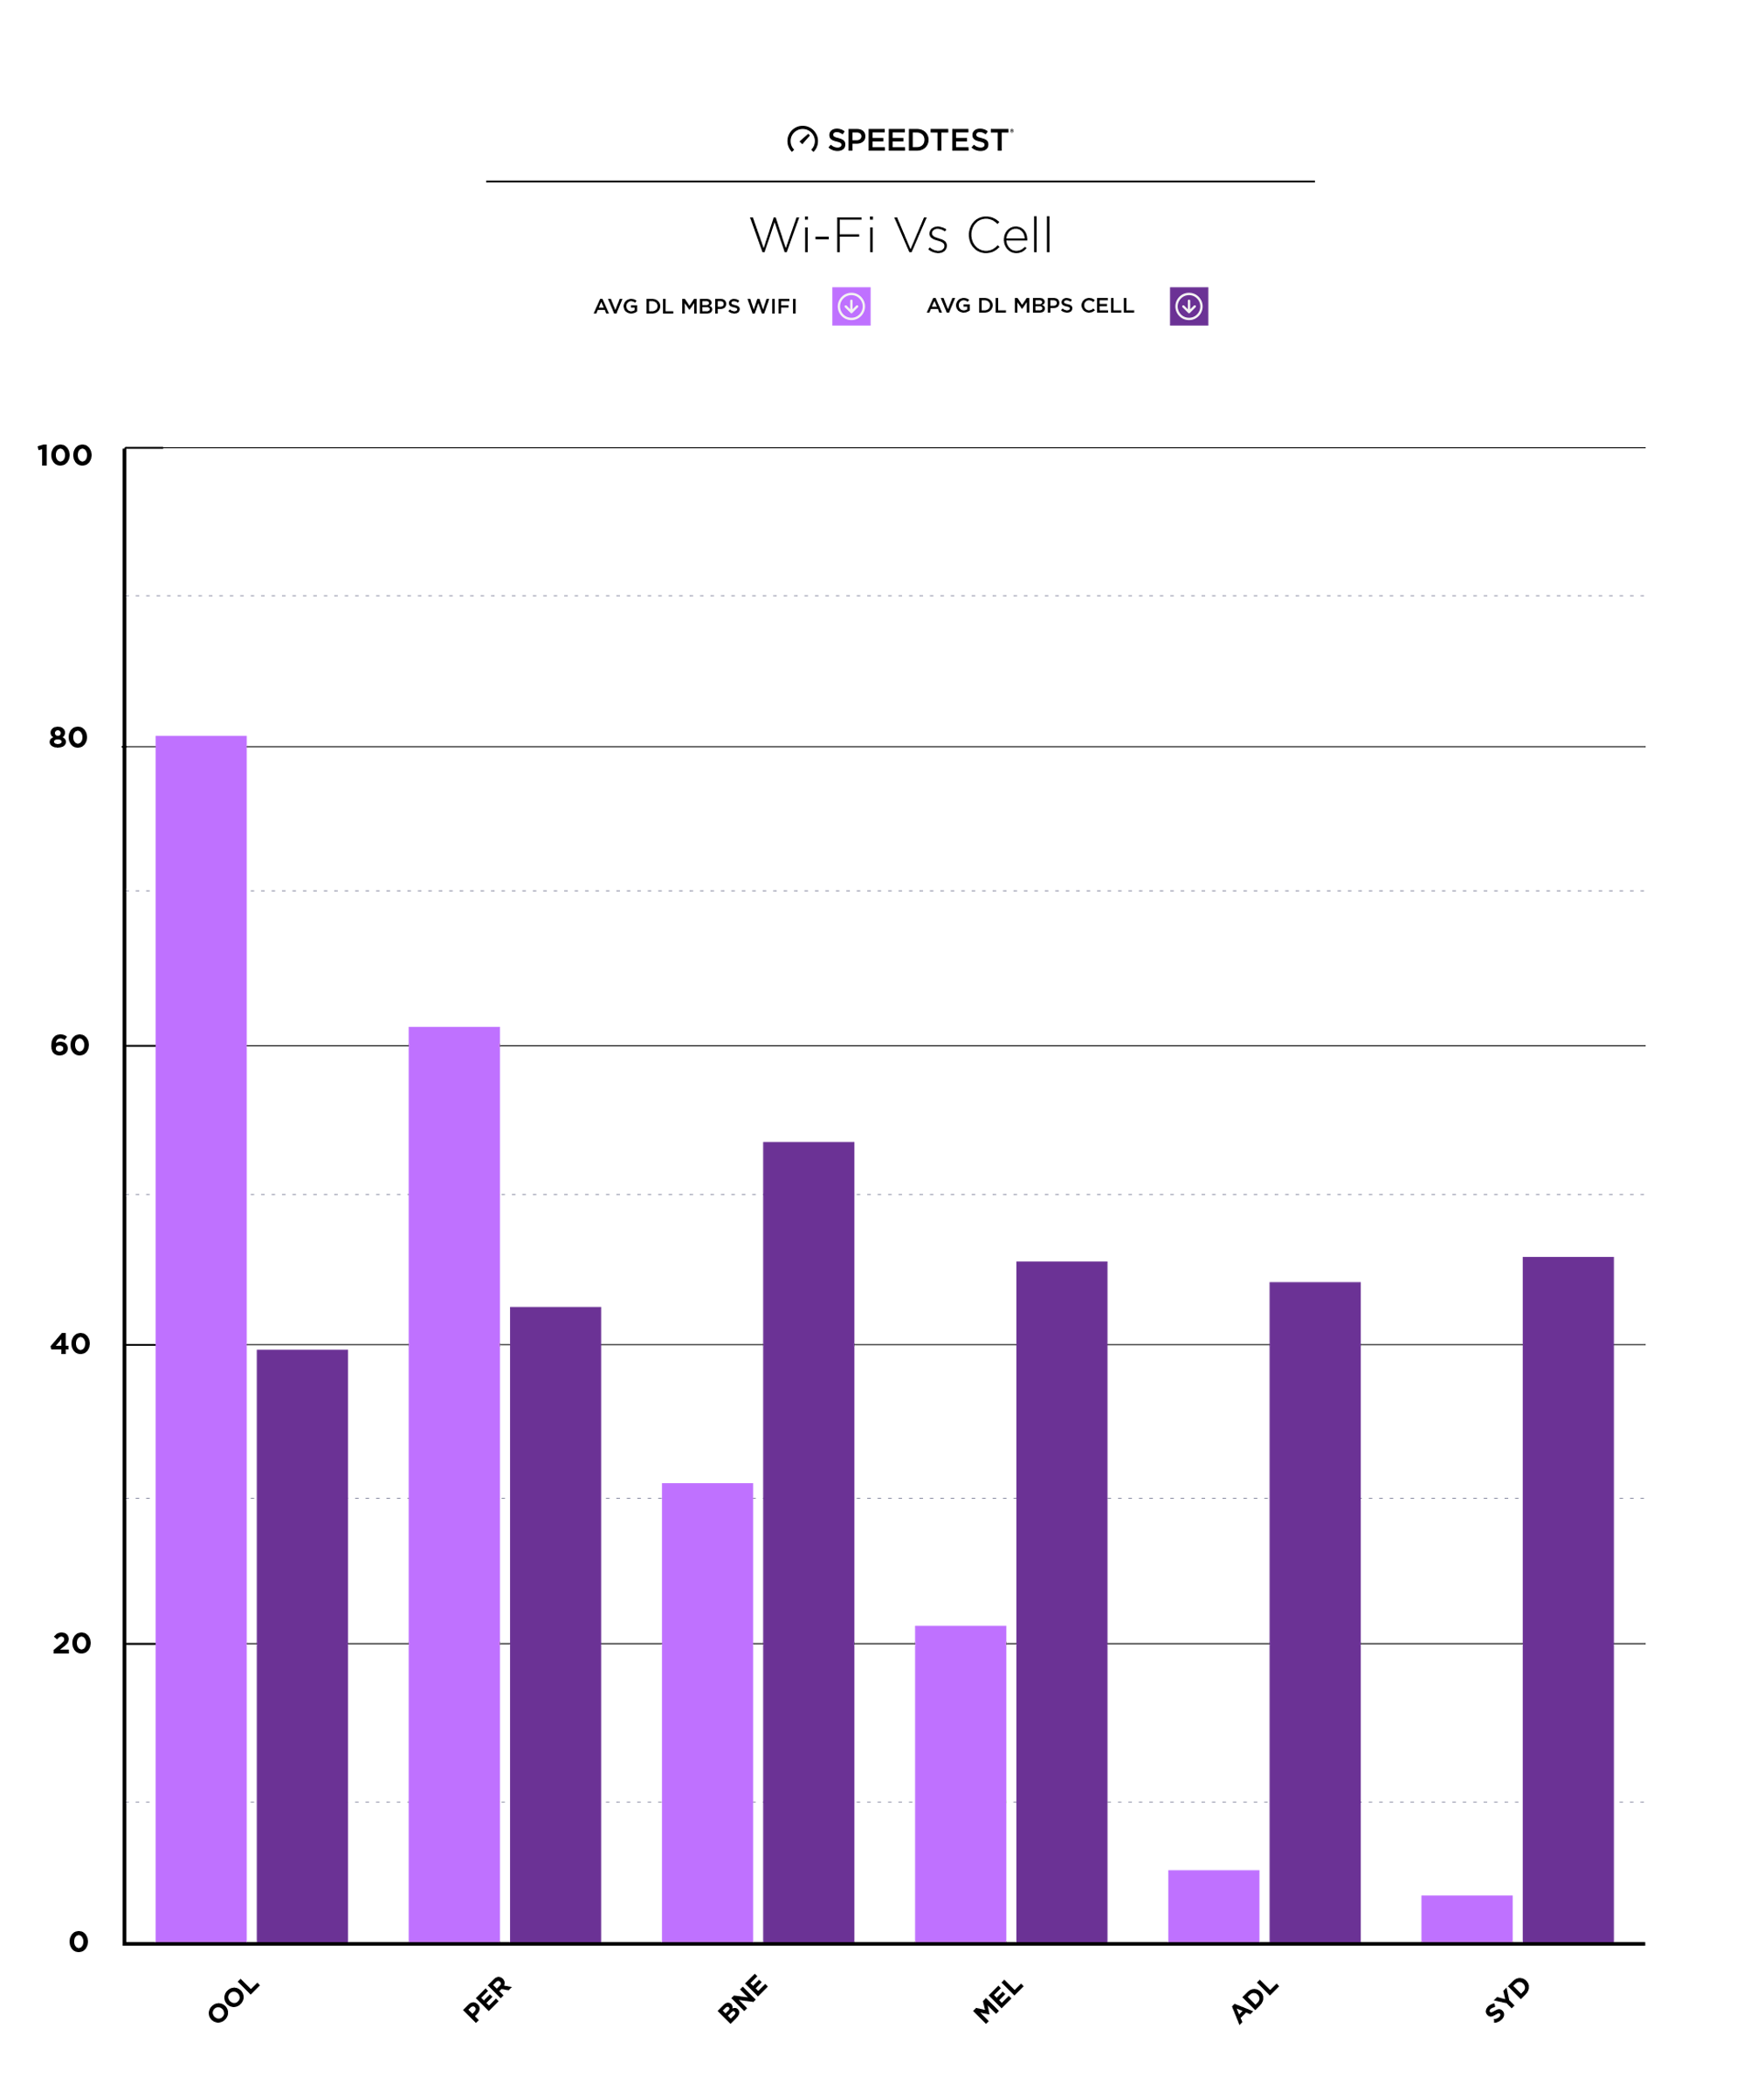
Wi-Fi or cell?
If you’ve already nailed down your international SIM card options, you’re going to have a lot better luck in many parts of Asia on a cellular signal than you would using the free airport Wi-Fi.
Of course you’re in good shape either way in Dubai, Seoul’s Wi-Fi download speed is slightly faster than that on cell, and in India you’ll definitely want to use the airport Wi-Fi if you can access it. Everywhere else the local cell performance puts airport Wi-Fi to shame.
Regional trends
Southeast Asia
If you’re jet-setting through Southeast Asia, count on any time spent in the Singapore Airport for your internet needs and plan to enjoy a more disconnected experience in India and Thailand, especially if you don’t have an Indian phone number and have to rely on cell service at the Delhi airport.
East Asia
As mentioned above, all the airports we analyzed in China, Japan and Korea had strong cellular speeds. Tokyo’s Haneda Airport and Seoul’s Incheon Airport also had good download speeds over their free airport Wi-Fi networks. China’s free airport Wi-Fi, on the other hand, is varying degrees of slow.
China
Within China, Hong Kong has the fastest free airport Wi-Fi, but you will be much better off with cellular networks at any of the airports we surveyed in China. Guangzhou has the fastest average download on cell while Hong Kong is the slowest, but with averages between 22 Mbps and 28 Mbps, you should be just fine.
Watch this space for upcoming articles comparing Wi-Fi and cellular speeds at airports across the globe. Until then, if you think your local airport is over- (or under-) rated, take a Speedtest on Android or iOS and show us what you’re experiencing.
Ookla retains ownership of this article including all of the intellectual property rights, data, content graphs and analysis. This article may not be quoted, reproduced, distributed or published for any commercial purpose without prior consent. Members of the press and others using the findings in this article for non-commercial purposes are welcome to publicly share and link to report information with attribution to Ookla.