
Latin America is a booming market for internet. Between a rapid increase in broadband subscribers and some of the most engaged mobile internet users, Latin Americans are smartphone savvy and looking for first world connection speeds. Trouble is, some markets don’t have access to the kind of fast mobile and broadband speeds that encourage economies to grow.
We analyzed Speedtest data on mobile and fixed broadband speeds from across Latin America during Q2-Q3 2018. The list includes sovereign countries and other generally recognized territories, except for Saint Barthélemy which did not show a significant test volume. We’ve broken down each set of results by the speeds typically needed for various activities:
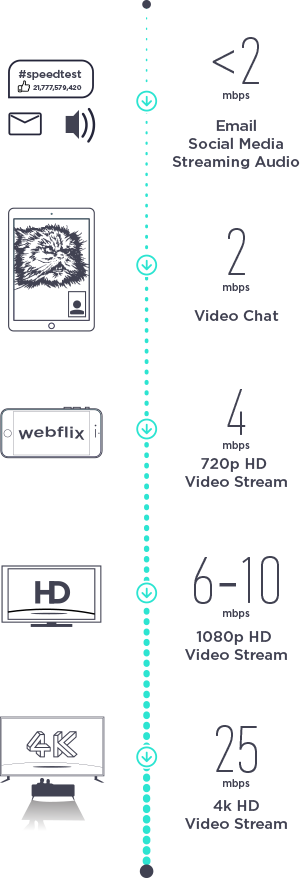
The results revealed deep divides in which countries are getting the speeds they need to easily connect to the world at large, those that have adequate connections and those that are struggling to connect.
Which country has the fastest mobile speeds in Latin America?
According to the GSMA, “Smartphones have been instrumental in establishing Latin America as one of the world’s largest consumers of social media, with the vast majority of usage occurring over mobile networks.” So who’s able to use those smartphones to their full capability and who’s better off using broadband?
4K Video Streamers
Our first group is made up of countries that should have the mean mobile download speeds to navigate even the most data-intensive mobile experiences. Martinique leads, ranking first in Latin America with a mean download speed over mobile that’s faster even than France. Guadeloupe is a close second.
| Country | Mean Download (Mbps) | Mean Upload (Mbps) |
|---|---|---|
| Martinique | 35.27 | 9.64 |
| Guadeloupe | 32.85 | 8.35 |
HD Streamers
The next group contains countries where residents should have the mobile speeds they need for HD streaming (at 1080p), video chat and social media. Uruguay tops this list to rank third in Latin America for mobile download speed. Saint Martin, Mexico, French Guiana, Ecuador, Peru and Honduras all show mobile download speeds faster than 20 Mbps.
| Country | Mean Download (Mbps) | Mean Upload (Mbps) |
|---|---|---|
| Uruguay | 23.10 | 11.39 |
| Saint Martin | 22.65 | 8.00 |
| Mexico | 22.05 | 11.78 |
| French Guiana | 21.40 | 6.84 |
| Ecuador | 21.37 | 8.21 |
| Peru | 20.83 | 12.86 |
| Honduras | 20.36 | 10.33 |
| Nicaragua | 19.68 | 8.36 |
| Brazil | 18.50 | 7.52 |
| Bolivia | 17.33 | 11.03 |
| Chile | 16.32 | 9.07 |
| Colombia | 16.11 | 8.85 |
| Argentina | 15.40 | 7.77 |
| Dominican Republic | 14.90 | 8.28 |
| Guatemala | 14.89 | 9.48 |
| Costa Rica | 14.59 | 6.56 |
| Puerto Rico | 14.36 | 8.41 |
| Paraguay | 12.67 | 7.61 |
| Panama | 12.30 | 8.54 |
| Haiti | 9.33 | 3.41 |
| El Salvador | 8.83 | 4.17 |
| Venezuela | 7.74 | 4.33 |
Nicaragua, Brazil, Bolivia, Chile, Colombia, Argentina, the Dominican Republic, Guatemala, Costa Rica, Puerto Rico, Paraguay and Panama all show average mobile download speeds that are faster than the 6-10 Mbps recommended for HD video streaming on 1080p. This is important as growing segments of this region consume media primarily over mobile connections.
Learn more about Brazil’s mobile market in our Brazil Market Snapshot.
Video Chat and Email
The mobile speeds picture is not so good in Cuba where mobile speeds are slow enough that residents might struggle to use smartphones for more than one-to-one video chats and emails.
| Country | Mean Download (Mbps) | Mean Upload (Mbps) |
|---|---|---|
| Cuba | 5.34 | 1.92 |
Looking at the countries with the slowest speeds in Latin America, we can see they have all faced significant structural challenges including war, poverty and natural disaster. They are also countries that clearly need significant mobile investment.
While mobile infrastructure might not be the first thing these slowest countries choose to invest in, improving speeds in these areas could also significantly boost their economies by creating an environment that’s ripe for new startups and investment.
Fixed broadband
The speeds needed to complete internet tasks are similar on fixed broadband to what they are on mobile. What’s not the same is the list of countries in the 4K Video Streamers category.
4K Video Streamers
Chile jumps to the top when considering mean download speeds over fixed broadband in Latin America. Uruguay is second, Puerto Rico third, Panama fourth, Martinique fifth and Paraguay sixth. All of these Latin American countries have fast enough fixed broadband speeds to allow residents to easily do anything they’d like online.
| Country | Mean Download (Mbps) | Mean Upload (Mbps) | % Difference in Download Mobile Over Fixed |
|---|---|---|---|
| Chile | 47.40 | 9.28 | -190.44% |
| Uruguay | 35.97 | 9.38 | -55.71% |
| Puerto Rico | 35.39 | 7.85 | -146.45% |
| Panama | 34.94 | 7.21 | -184.07% |
| Martinique | 29.71 | 11.39 | 15.76% |
| Paraguay | 27.84 | 8.00 | -119.73% |
In almost all of these countries our analysis shows that fixed broadband download speeds are significantly faster than those on mobile. The exception is Martinique, which has faster mobile downloads than those on fixed broadband.
HD Streamers
The next group contains countries whose fixed broadband download speeds are good enough for video chat but where heavier uses like online gaming and streaming might not be as enjoyable. Brazil tops this list, ranking 7th in Latin America for download speed over fixed broadband. Brazil is followed by Guadeloupe, French Guiana, Peru, Mexico, Argentina, the Dominican Republic, Colombia, Ecuador, Costa Rica, Saint Martin, El Salvador, Haiti, Guatemala, Honduras, Bolivia and Nicaragua.
| Country | Mean Download (Mbps) | Mean Upload (Mbps) | % Difference in Download Mobile Over Fixed |
|---|---|---|---|
| Brazil | 23.64 | 10.57 | -27.78% |
| Guadeloupe | 23.31 | 9.34 | 29.04% |
| French Guiana | 22.58 | 11.45 | -5.51% |
| Peru | 22.43 | 4.90 | -7.68% |
| Mexico | 22.37 | 8.53 | -1.45% |
| Argentina | 19.68 | 4.24 | -27.79% |
| Dominican Republic | 14.16 | 3.83 | 4.97% |
| Colombia | 13.79 | 5.86 | 14.40% |
| Ecuador | 13.08 | 9.69 | 38.79% |
| Costa Rica | 11.39 | 3.61 | 21.93% |
| Saint Martin | 9.13 | 5.54 | 59.69% |
| El Salvador | 8.38 | 3.14 | 5.10% |
| Haiti | 8.33 | 6.42 | 10.72% |
| Guatemala | 7.94 | 3.78 | 46.68% |
| Honduras | 7.32 | 4.36 | 64.05% |
| Bolivia | 6.96 | 3.13 | 59.84% |
| Nicaragua | 6.62 | 3.39 | 66.36% |
With the exception of Guadeloupe, the six fastest countries in this group all have faster fixed broadband speeds than those on mobile. From the Dominican Republic on down the list, the rest of the countries in this group have faster mobile download speeds than those on fixed broadband.
Video Chat and Email
Venezuela joins Cuba on this list of countries in Latin America with fixed broadband download speeds slower than 6 Mbps. Though both countries have faster mobile download speeds than they do on fixed broadband. Which is good, because residents might need to resort to their phones to do more than simple video chats or email.
| Country | Mean Download (Mbps) | Mean Upload (Mbps) | % Difference in Download Mobile Over Fixed |
|---|---|---|---|
| Venezuela | 3.96 | 1.50 | 48.84% |
| Cuba | 3.73 | 4.07 | 30.15% |
As we saw with mobile internet, there are many countries in Latin America that could use a solid investment in fixed broadband speeds. That is, unless providers are ready for mobile to be the primary vehicle consumers use to access the internet.
Mobile and broadband internet performance at a city level
Fort-de-France, Martinique ranks a strong first for mobile speed among the largest cities in Latin America, Marigot, Saint Martin second and Basse-Terre, Guadeloupe third. On the other end of the mobile spectrum, Havana ranks last followed by San Salvador, El Salvador and Caracas, Venezuela.
| City | Mobile Download (Mbps) | Mobile Upload (Mbps) | Fixed Download (Mbps) | Fixed Upload (Mbps) | % Difference in Download Mobile Over Fixed |
|---|---|---|---|---|---|
| Asunción, Paraguay | 14.58 | 8.57 | 43.49 | 8.86 | -198.29% |
| Basse-Terre, Guadeloupe | 27.73 | 8.61 | 21.20 | 8.15 | 23.55% |
| Belo Horizonte, Brazil | 19.00 | 7.86 | 28.38 | 6.62 | -49.37% |
| Bogotá, Colombia | 15.89 | 9.48 | 16.46 | 7.16 | -3.59% |
| Brasília, Brazil | 22.20 | 9.29 | 29.27 | 7.79 | -31.85% |
| Buenos Aires, Argentina | 16.40 | 8.53 | 27.56 | 5.31 | -68.05% |
| Cali, Colombia | 22.35 | 12.11 | 13.10 | 5.16 | 41.39% |
| Caracas, Venezuela | 8.83 | 5.13 | 5.10 | 2.04 | 42.24% |
| Cayenne, French Guiana | 22.66 | 7.86 | 25.32 | 14.67 | -11.74% |
| Curitiba, Brazil | 22.60 | 8.31 | 32.58 | 17.65 | -44.16% |
| Ecatepec de Morelos, Mexico | 16.67 | 10.35 | 19.89 | 3.98 | -19.32% |
| Fort-de-France, Martinique | 36.00 | 10.34 | 43.60 | 21.47 | -21.11% |
| Fortaleza, Brazil | 18.85 | 8.63 | 26.20 | 10.33 | -38.99% |
| Guatemala City, Guatemala | 16.09 | 10.33 | 9.60 | 5.10 | 40.34% |
| Guayaquil, Ecuador | 23.61 | 9.43 | 14.44 | 9.42 | 38.84% |
| Havana, Cuba | 4.47 | 1.26 | 2.99 | 3.10 | 33.11% |
| La Paz, Bolivia | 16.92 | 11.81 | 7.16 | 3.20 | 57.68% |
| Lima, Peru | 22.23 | 14.89 | 27.52 | 6.66 | -23.80% |
| Managua, Nicaragua | 21.04 | 8.89 | 6.87 | 3.52 | 67.35% |
| Manaus, Brazil | 14.83 | 7.16 | 20.92 | 4.10 | -41.07% |
| Marigot, Saint Martin | 28.97 | 9.23 | 9.62 | 5.45 | 66.79% |
| Medellín, Colombia | 17.58 | 9.17 | 14.76 | 6.87 | 16.04% |
| Mexico City, Mexico | 21.41 | 11.22 | 29.81 | 12.41 | -39.23% |
| Montevideo, Uruguay | 23.30 | 11.65 | 38.39 | 10.12 | -64.76% |
| Panama City, Panama | 12.18 | 8.82 | 37.02 | 7.88 | -203.94% |
| Port-au-Prince, Haiti | 10.08 | 3.71 | 8.94 | 6.63 | 11.31% |
| Quito, Ecuador | 21.01 | 7.75 | 15.54 | 11.59 | 26.04% |
| Rio de Janeiro, Brazil | 22.02 | 9.02 | 28.62 | 10.36 | -29.97% |
| Salvador, Brazil | 17.85 | 7.44 | 20.43 | 6.09 | -14.45% |
| San José, Costa Rica | 14.69 | 6.92 | 12.39 | 4.74 | 15.66% |
| San Juan, Puerto Rico | 16.05 | 9.76 | 50.13 | 15.64 | -212.34% |
| San Salvador, El Salvador | 8.65 | 4.23 | 10.26 | 3.88 | -18.61% |
| Santiago, Chile | 16.05 | 9.35 | 42.69 | 12.37 | -165.98% |
| Santo Domingo, Dominican Republic | 15.15 | 8.87 | 17.86 | 4.47 | -17.89% |
| São Paulo, Brazil | 20.74 | 8.41 | 36.54 | 17.45 | -76.18% |
| Sucre, Bolivia | 14.81 | 11.18 | 4.86 | 3.24 | 67.18% |
| Tegucigalpa, Honduras | 26.24 | 13.61 | 7.39 | 2.91 | 71.84% |
Denser and more urban locations are easier and more cost-effective places to deploy improvements to mobile infrastructure, so if speeds are slow in these areas, it’s a good sign that speeds are much worse elsewhere in the country.
On the fixed broadband side, San Juan, Puerto Rico ranks first in Latin America, followed by Fort-de-France, Martinique and Asunción, Paraguay. The city with the slowest fixed broadband download speed of those we analyzed is Havana, Cuba followed by Sucre, Bolivia and Caracas Venezuela.
Now that you know whether your country or city is rated for 4K video streaming, HD video streaming or just video chat and email, it’s time to find out if your speeds are above or below average. Take a Speedtest on Android, iOS or the web and tweet to us at @speedtest to share your experience.
Revelamos qué países de América Latina tienen velocidades de Internet adecuadas (y cuáles no)
América Latina es un mercado en expansión para Internet. Entre el rápido aumento de los suscriptores a la banda ancha y algunos de los usuarios de Internet móvil más activos, podemos decir que los latinoamericanos son conocedores de los teléfonos inteligentes y pretenden alcanzar las velocidades de conexión del primer mundo. El problema es que algunos mercados no tienen acceso a los tipos de velocidades de banda ancha y móvil rápidas que impulsan el crecimiento de las economías.
Analizamos los datos de Speedtest sobre velocidades de banda ancha móvil y fija de toda América Latina durante el segundo y tercer trimestres de 2018. La lista incluye países soberanos y otros territorios generalmente reconocidos, con la excepción de San Bartolomé, que no presentó un volumen de prueba significativo. Desglosamos cada conjunto de resultados por las velocidades que, en general, se necesitan para diversas actividades:

Los resultados revelaron grandes diferencias en los países que obtienen las velocidades que necesitan para conectarse de manera sencilla con el resto del mundo, los que tienen conexiones adecuadas y los que tienen dificultades de conexión.
¿Cuál es el país de América Latina que tiene las velocidades móviles más rápidas?
De acuerdo con la Asociación GSM, los “teléfonos inteligentes han sido fundamentales para que América Latina se convirtiera en uno de los más grandes consumidores de redes sociales del mundo, ya que la mayor parte de ese consumo se produce en redes móviles”. Por lo tanto, ¿quién puede aprovechar al máximo los teléfonos inteligentes y a quién le conviene usar la banda ancha?
Transmisores de video en 4K
Nuestro primer grupo está compuesto por países que deberían tener las velocidades medias de descarga móvil necesarias para admitir las experiencias móviles con el uso más intensivo de datos. Martinica lidera el grupo ocupando el primer lugar de América Latina con una velocidad media de descarga móvil más rápida que incluso la de Francia. Guadalupe ocupa el segundo lugar.
| País | Enlace descendente móvil (Mbps) | Enlace ascendente móvil (Mbps) |
|---|---|---|
| Martinica | 35,27 | 9,64 |
| Guadeloupe | 32,85 | 8,35 |
Transmisores en HD
El siguiente grupo incluye países en que los residentes deberían tener las velocidades móviles que necesitan para transmisión en HD (a 1080p), videollamada y redes sociales. Uruguay encabeza esta lista ocupando el tercer puesto de América Latina en cuanto a velocidad de descarga móvil. San Martín, México, Guayana Francesa, Ecuador, Perú y Honduras presentan velocidades de descarga móvil superiores a 20 Mbps.
| País | Enlace descendente móvil (Mbps) | Enlace ascendente móvil (Mbps) |
|---|---|---|
| Uruguay | 23,10 | 11,39 |
| San Martín | 22,65 | 8,00 |
| México | 22,05 | 11,78 |
| Guayana Francesa | 21,40 | 6,84 |
| Ecuador | 21,37 | 8,21 |
| Perú | 20,83 | 12,86 |
| Honduras | 20,36 | 10,33 |
| Nicaragua | 19,68 | 8,36 |
| Brasil | 18,50 | 7,52 |
| Bolivia | 17,33 | 11,03 |
| Chile | 16,32 | 9,07 |
| Colombia | 16,11 | 8,85 |
| Argentina | 15,40 | 7,77 |
| República Dominicana | 14,90 | 8,28 |
| Guatemala | 14,89 | 9,48 |
| Costa Rica | 14,59 | 6,56 |
| Puerto Rico | 14,36 | 8,41 |
| Paraguay | 12,67 | 7,61 |
| Panamá | 12,30 | 8,54 |
| Haití | 9,33 | 3,41 |
| El Salvador | 8,83 | 4,17 |
| Venezuela | 7,74 | 4,33 |
Nicaragua, Brasil, Bolivia, Chile, Colombia, Argentina, República Dominicana, Guatemala, Costa Rica, Puerto Rico, Paraguay y Panamá presentan velocidades medias de descarga móvil superiores a los 6-10 Mbps recomendados para transmisión de video en HD a 1080p. Esto es importante, ya que los segmentos en crecimiento de esta región utilizan los medios principalmente mediante conexiones móviles.
Conozca más sobre el mercado móvil brasileño.
Videollamada y correo electrónico
El panorama de las velocidades móviles no es muy bueno en Cuba, donde las velocidades móviles son tan lentas que los residentes tienen dificultades para usar teléfonos inteligentes para correos electrónicos y videollamadas entre más de dos personas.
| País | Enlace descendente móvil (Mbps) | Enlace ascendente móvil (Mbps) |
|---|---|---|
| Cuba | 5,34 | 1,92 |
Si analizamos los países con las velocidades más lentas de América Latina, podemos observar que todos han enfrentado desafíos estructurales significativos, entre ellos, guerras, pobreza y desastres naturales. Además, son países que, sin dudas, necesitan una importante inversión en redes móviles.
Si bien la infraestructura móvil puede no ser lo primero en que eligen invertir los países más lentos, al mejorar las velocidades en estas áreas, también se podrían impulsar significativamente sus economías mediante la creación de entornos preparados para nuevas empresas emergentes e inversiones.
Banda ancha fija
Las velocidades necesarias para realizar tareas en Internet son similares para la banda ancha fija y la banda ancha móvil. Lo que no es igual es la lista de países dentro de la categoría de transmisores de video en 4K.
Transmisores de video en 4K
Chile asciende al primer lugar cuando consideramos las velocidades medias de descarga mediante banda ancha fija en América Latina. Uruguay ocupa el segundo lugar; Puerto Rico, el tercero; Panamá, el cuarto; Martinica, el quinto; y Paraguay, el sexto. Todos estos países latinoamericanos cuentan con velocidades de banda ancha fija lo suficientemente rápidas para permitir que los residentes hagan lo que quieran con facilidad en Internet.
| País | Enlace descendente fijo (Mbps) | Enlace ascendente fijo (Mbps) | Diferencia porcentual entre las descargas mediante banda ancha móvil y fija |
|---|---|---|---|
| Chile | 47,40 | 9,28 | -190,44% |
| Uruguay | 35,97 | 9,38 | -55,71% |
| Puerto Rico | 35,39 | 7,85 | -146,45% |
| Panamá | 34,94 | 7,21 | -184,07% |
| Martinica | 29,71 | 11,39 | 15,76% |
| Paraguay | 27,84 | 8,00 | -119,73% |
Nuestro análisis muestra que, en casi todos estos países, las velocidades de descarga de banda ancha fija son significativamente más rápidas que las de banda ancha móvil. La única excepción es Martinica, donde las velocidades de descarga móvil son más rápidas que las de banda ancha fija.
Transmisores en HD
El siguiente grupo incluye países cuyas velocidades de descarga de banda ancha fija son lo suficientemente buenas para videollamadas, pero donde los usos más intensivos, como los juegos y las transmisiones en línea, pueden no resultar tan placenteros. Brasil encabeza esta lista ocupando el séptimo lugar en América Latina para velocidad de descarga mediante banda ancha fija. A continuación de Brasil, se ubican Guadalupe, Guayana Francesa, Perú, México, Argentina, República Dominicana, Colombia, Ecuador, Costa Rica, San Martín, El Salvador, Haití, Guatemala, Honduras, Bolivia y Nicaragua.
| País | Enlace descendente fijo (Mbps) | Enlace ascendente fijo (Mbps) | Diferencia porcentual entre las descargas mediante banda ancha móvil y fija |
|---|---|---|---|
| Brasil | 23,64 | 10,57 | -27,78% |
| Guadeloupe | 23,31 | 9,34 | 29,04% |
| Guayana Francesa | 22,58 | 11,45 | -5,51% |
| Perú | 22,43 | 4,90 | -7,68% |
| México | 22,37 | 8,53 | -1,45% |
| Argentina | 19,68 | 4,24 | -27,79% |
| República Dominicana | 14,16 | 3,83 | 4,97% |
| Colombia | 13,79 | 5,86 | 14,40% |
| Ecuador | 13,08 | 9,69 | 38,79% |
| Costa Rica | 11,39 | 3,61 | 21,93% |
| San Martín | 9,13 | 5,54 | 59,69% |
| El Salvador | 8,38 | 3,14 | 5,10% |
| Haití | 8,33 | 6,42 | 10,72% |
| Guatemala | 7,94 | 3,78 | 46,68% |
| Honduras | 7,32 | 4,36 | 64,05% |
| Bolivia | 6,96 | 3,13 | 59,84% |
| Nicaragua | 6,62 | 3,39 | 66,36% |
Con la excepción de Guadalupe, los seis países más rápidos de este grupo tienen velocidades de banda ancha fija más rápidas que las de banda ancha móvil. A partir de la República Dominicana hasta el final de la lista, el resto de los países de este grupo tienen velocidades de descarga móvil más rápidas que las velocidades de banda ancha fija.
Videollamada y correo electrónico
Venezuela ocupa el mismo lugar que Cuba en esta lista de países de América Latina con velocidades de descarga de banda ancha fija inferiores a 6 Mbps. Sin embargo, ambos países tienen velocidades de descarga móvil más rápidas que las velocidades de descarga por banda ancha fija. Esto es positivo, porque los residentes pueden necesitar recurrir a sus teléfonos para mucho más que solamente simples videollamadas o correos electrónicos.
| País | Enlace descendente fijo (Mbps) | Enlace ascendente fijo (Mbps) | Diferencia porcentual entre las descargas mediante banda ancha móvil y fija |
|---|---|---|---|
| Venezuela | 3,96 | 1,50 | 48,84% |
| Cuba | 3,73 | 4,07 | 30,15% |
Tal como observamos con el uso de Internet móvil, hay muchos países latinoamericanos donde sería recomendable realizar inversiones sólidas en velocidades de banda ancha fija. Es decir, a menos que los proveedores estén preparados para que la banda ancha móvil sea el principal medio que los consumidores utilizan para acceder a Internet.
Rendimiento de Internet por banda ancha fija y móvil en las ciudades
Fort-de-France (Martinica) ocupa cómodamente el primer lugar en cuanto a velocidad móvil entre las ciudades más grandes de América Latina. Marigot (San Martín) ocupa el segundo lugar y Basse-Terre (Guadalupe), el tercero. En el otro extremo del espectro móvil, La Habana ocupa el último lugar, seguida de San Salvador (El Salvador) y Caracas (Venezuela).
| Ciudad | Descarga móvil (Mbps) | Carga móvil (Mbps) | Descarga fijo (Mbps) | Carga fijo (Mbps) | Diferencia porcentual entre las descargas mediante banda ancha móvil y fija |
|---|---|---|---|---|---|
| Asunción, Paraguay | 14,58 | 8,57 | 43,49 | 8,86 | -198,29% |
| Basse-Terre, Guadeloupe | 27,73 | 8,61 | 21,20 | 8,15 | 23,55% |
| Belo Horizonte, Brasil | 19,00 | 7,86 | 28,38 | 6,62 | -49,37% |
| Bogotá, Colombia | 15,89 | 9,48 | 16,46 | 7,16 | -3,59% |
| Brasília, Brazil | 22,20 | 9,29 | 29,27 | 7,79 | -31,85% |
| Buenos Aires, Argentina | 16,40 | 8,53 | 27,56 | 5,31 | -68,05% |
| Cali, Colombia | 22,35 | 12,11 | 13,10 | 5,16 | 41,39% |
| Caracas, Venezuela | 8,83 | 5,13 | 5,10 | 2,04 | 42,24% |
| Cayena, Guayana Francesa | 22,66 | 7,86 | 25,32 | 14,67 | -11,74% |
| Ciudad de Guatemala, Guatemala | 16,09 | 10,33 | 9,60 | 5,10 | 40,34% |
| Ciudad de México, México | 21,41 | 11,22 | 29,81 | 12,41 | -39,23% |
| Ciudad de Panamá, Panamá | 12,18 | 8,82 | 37,02 | 7,88 | -203,94% |
| Curitiba, Brasil | 22,60 | 8,31 | 32,58 | 17,65 | -44,16% |
| Ecatepec de Morelos, México | 16,67 | 10,35 | 19,89 | 3,98 | -19,32% |
| Fort-de-France, Martinica | 36,00 | 10,34 | 43,60 | 21,47 | -21,11% |
| Fortaleza, Brasil | 18,85 | 8,63 | 26,20 | 10,33 | -38,99% |
| Guayaquil, Ecuador | 23,61 | 9,43 | 14,44 | 9,42 | 38,84% |
| La Habana, Cuba | 4,47 | 1,26 | 2,99 | 3,10 | 33,11% |
| La Paz, Bolivia | 16,92 | 11,81 | 7,16 | 3,20 | 57,68% |
| Lima, Perú | 22,23 | 14,89 | 27,52 | 6,66 | -23,80% |
| Managua, Nicaragua | 21,04 | 8,89 | 6,87 | 3,52 | 67,35% |
| Manaos, Brasil | 14,83 | 7,16 | 20,92 | 4,10 | -41,07% |
| Marigot, San Martín | 28,97 | 9,23 | 9,62 | 5,45 | 66,79% |
| Medellín, Colombia | 17,58 | 9,17 | 14,76 | 6,87 | 16,04% |
| Montevideo, Uruguay | 23,30 | 11,65 | 38,39 | 10,12 | -64,76% |
| Puerto Príncipe, Haití | 10,08 | 3,71 | 8,94 | 6,63 | 11,31% |
| Quito, Ecuador | 21,01 | 7,75 | 15,54 | 11,59 | 26,04% |
| Río de Janeiro, Brasil | 22,02 | 9,02 | 28,62 | 10,36 | -29,97% |
| Salvador, Brasil | 17,85 | 7,44 | 20,43 | 6,09 | -14,45% |
| San José, Costa Rica | 14,69 | 6,92 | 12,39 | 4,74 | 15,66% |
| San Juan, Puerto Rico | 16,05 | 9,76 | 50,13 | 15,64 | -212,34% |
| San Salvador, El Salvador | 8,65 | 4,23 | 10,26 | 3,88 | -18,61% |
| Santiago, Chile | 16,05 | 9,35 | 42,69 | 12,37 | -165,98% |
| Santo, Domingo, República Dominicana | 15,15 | 8,87 | 17,86 | 4,47 | -17,89% |
| San Pablo, Brasil | 20,74 | 8,41 | 36,54 | 17,45 | -76,18% |
| Sucre, Bolivia | 14,81 | 11,18 | 4,86 | 3,24 | 67,18% |
| Tegucigalpa, Honduras | 26,24 | 13,61 | 7,39 | 2,91 | 71,84% |
Las ubicaciones más urbanas y con mayor densidad de población son lugares donde es más fácil y económico implantar mejoras para la infraestructura móvil; por lo tanto, si las velocidades son lentas en estas áreas, es una buena señal que las velocidades sean aún más lentas en otros lugares del país.
En cuanto a la banda ancha fija, San Juan (Puerto Rico) ocupa el primer lugar de América Latina, seguida de Fort-de-France (Martinica) y Asunción (Paraguay). La ciudad con la velocidad de descarga de banda ancha fija más lenta de las que analizamos es La Habana (Cuba), seguida de Sucre (Bolivia) y Caracas (Venezuela).
Ahora que sabe si su país o su ciudad son aptos para transmisión de video en 4K, transmisión de video en HD o solo para videollamadas y correo electrónico, es momento de averiguar si las velocidades están por encima o por debajo de la media. Realice un Speedtest en Android, iOS o la Web y envíenos un tuit a @speedtest para compartir su experiencia.
Revelando quais países da América Latina têm velocidade de internet adequada (e quais não têm)
A América Latina é um mercado em expansão para a internet. A população da América Latina vivenciou um crescimento rápido no número de assinantes de banda larga, tem alguns dos usuários de internet móvel mais engajados do mundo, sabe usar bem seus smartphones e busca velocidades de conexão de primeiro mundo. O problema é que alguns mercados não têm acesso às velocidades rápidas de banda larga móvel e fixa que encorajam o crescimento econômico.
Analisamos dados do Speedtest quanto à velocidade de banda larga móvel e fixa de toda a América Latina durante o segundo e o terceiro trimestres de 2018. Essa lista inclui países soberanos e outros territórios geralmente reconhecidos, exceto São Bartolomeu, que não exibiu um volume de teste significativo. Detalhamos cada conjunto de resultados de acordo com as velocidades tipicamente necessárias para diversas atividades.

O resultado revelou que existe uma divisão em três grandes grupos: países que atingem as velocidades necessárias para se conectar com facilidade com o resto do mundo, países que atingem conexões adequadas e países que enfrentam dificuldades de conexão.
Qual país tem a maior velocidade de internet móvel na América Latina?
De acordo com o GSMA, “os smartphones foram e são essenciais para estabelecer a América Latina como um dos maiores consumidores de redes sociais do mundo, com grande parte do uso ocorrendo em redes móveis.” Então queremos saber: que países conseguem usar smartphones em sua capacidade total e que países dependem mais de banda larga fixa?
Streamers de vídeo em 4K
Nosso primeiro grupo é composto por países que atingem velocidades médias de download móvel ideal até mesmo para as experiências móveis que mais usam dados. Martinica está na liderança, ocupando a primeira posição na América Latina e contando com uma velocidade média de download em banda larga móvel mais rápida do que a da França. Guadalupe fica em segundo lugar, com pouca diferença.
| País | Veloc. de download (Mbps) | Veloc. de upload (Mbps) |
|---|---|---|
| Martinica | 35,27 | 9,64 |
| Guadeloupe | 32,85 | 8,35 |
Streamers de HD
No próximo grupo estão países nos quais os residentes têm velocidade móvel suficiente para streaming HD (em 1080p), chat por vídeo e redes sociais. O Uruguai ocupa o primeiro lugar da lista, ficando em terceiro na América Latina em questão de velocidade de download móvel. São Martinho, México, Guiana Francesa, Equador, Peru e Honduras apresentam velocidades de download móvel mais rápidas do que 20 Mbps.
| País | Veloc. de download (Mbps) | Veloc. de upload (Mbps) |
|---|---|---|
| Uruguai | 23,10 | 11,39 |
| São Martinho | 22,65 | 8,00 |
| México | 22,05 | 11,78 |
| Guiana Francesa | 21,40 | 6,84 |
| Equador | 21,37 | 8,21 |
| Peru | 20,83 | 12,86 |
| Honduras | 20,36 | 10,33 |
| Nicarágua | 19,68 | 8,36 |
| Brasil | 18,50 | 7,52 |
| Bolívia | 17,33 | 11,03 |
| Chile | 16,32 | 9,07 |
| Colômbia | 16,11 | 8,85 |
| Argentina | 15,40 | 7,77 |
| República Dominicana | 14,90 | 8,28 |
| Guatemala | 14,89 | 9,48 |
| Costa Rica | 14,59 | 6,56 |
| Porto Rico | 14,36 | 8,41 |
| Paraguai | 12,67 | 7,61 |
| Panamá | 12,30 | 8,54 |
| Haiti | 9,33 | 3,41 |
| El Salvador | 8,83 | 4,17 |
| Venezuela | 7,74 | 4,33 |
Nicarágua, Brasil, Bolívia, Chile, Colômbia, Argentina, República Dominicana, Guatemala, Costa Rica, Porto Rico, Paraguai e Panamá têm velocidades de download móvel médias mais rápidas do que os 6 a 10 Mbps recomendados para streaming de vídeo HD em 1080p. Isso é importante, pois cada vez mais segmentos dessa região consomem mídia primariamente por conexões móveis.
Saiba mais sobre o mercado de telefonia móvel do Brasil.
Chat por vídeo e e-mail
A cena da velocidade móvel não é tão boa em Cuba, onde as velocidades móveis são baixas a ponto de os residentes terem problemas para usar smartphones quando o uso vai além de chats de vídeo com duas pessoas e troca de e-mails.
| País | Veloc. de download (Mbps) | Veloc. de upload (Mbps) |
|---|---|---|
| Cuba | 5,34 | 1,92 |
Observando os países com as velocidades mais baixas da América Latina, podemos constatar que todos eles enfrentaram desafios estruturais significativos, tais como guerra, pobreza e desastres naturais. Também são países que claramente precisam de investimento móvel significativo.
Embora a infraestrutura móvel possa não ser a primeira coisa na qual esses países mais lentos escolhem investir, a melhoria das velocidades nessas áreas também pode impulsionar significativamente suas economias ao criar um ambiente propício para novas startups e investimentos.
Banda larga fixa
As velocidades necessárias para realizar as tarefas da internet são semelhantes na banda larga fixa e móvel. Mas a lista de países na categoria Streamers de vídeo em 4K não é igual.
Streamers de vídeo em 4K
O Chile pula para o primeiro lugar quando consideramos as velocidades médias de download em banda larga fixa na América Latina. O Uruguai fica em segundo, Porto Rico em terceiro, Panamá em quarto, Martinica em quinto e Paraguai em sexto. Todos esses países da América Latina têm velocidades de banda larga fixa rápidas o suficiente para permitir que os residentes façam o que quiserem on-line e com facilidade.
| País | Veloc. de download (Mbps) | Veloc. de upload (Mbps) | Percentual de diferença na veloc. de download de banda larga móvel em relação a banda larga fixa |
|---|---|---|---|
| Chile | 47,40 | 9,28 | -190,44% |
| Uruguai | 35,97 | 9,38 | -55,71% |
| Porto Rico | 35,39 | 7,85 | -146,45% |
| Panamá | 34,94 | 7,21 | -184,07% |
| Martinica | 29,71 | 11,39 | 15,76% |
| Paraguai | 27,84 | 8,00 | -119,73% |
Em quase todos esses países, nossa análise revela que as velocidades de download de banda larga fixa são significativamente mais rápidas do que as velocidades de redes móveis. A exceção é Martinica, que tem velocidades de downloads móveis mais rápidas do que as velocidades downloads de banda larga fixa.
Streamers de HD
O próximo grupo contém países cujas velocidades de download de banda larga fixa são boas o suficiente para chat por vídeo, mas não são ideais para usos que exigem maior velocidade, tais como jogos on-line e streaming. O Brasil ocupa a primeira posição nessa lista e a 7ª na América Latina para velocidade de download em banda larga fixa. Depois do Brasil, temos Guadalupe, Guiana Francesa, Peru, México, Argentina, República Dominicana, Colômbia, Equador, Costa Rica, São Martinho, El Salvador, Haiti, Guatemala, Honduras, Bolívia e Nicarágua.
| País | Veloc. de download (Mbps) | Veloc. de upload (Mbps) | Percentual de diferença na veloc. de download de banda larga móvel em relação a banda larga fixa |
|---|---|---|---|
| Brasil | 23,64 | 10,57 | -27,78% |
| Guadeloupe | 23,31 | 9,34 | 29,04% |
| Guaiana Francesa | 22,58 | 11,45 | -5,51% |
| Peru | 22,43 | 4,90 | -7,68% |
| México | 22,37 | 8,53 | -1,45% |
| Argentina | 19,68 | 4,24 | -27,79% |
| República Dominicana | 14,16 | 3,83 | 4,97% |
| Colômbia | 13,79 | 5,86 | 14,40% |
| Equador | 13,08 | 9,69 | 38,79% |
| Costa Rica | 11,39 | 3,61 | 21,93% |
| São Martinho | 9,13 | 5,54 | 59,69% |
| El Salvador | 8,38 | 3,14 | 5,10% |
| Haiti | 8,33 | 6,42 | 10,72% |
| Guatemala | 7,94 | 3,78 | 46,68% |
| Honduras | 7,32 | 4,36 | 64,05% |
| Bolívia | 6,96 | 3,13 | 59,84% |
| Nicarágua | 6,62 | 3,39 | 66,36% |
Com a exceção de Guadalupe, os seis países mais rápidos deste grupo têm velocidades de banda larga fixa mais rápidas do que as de banda larga móvel. Da República Dominicana para baixo na lista, os outros países do grupo têm velocidades de download de banda larga móvel mais rápidas do que as de banda larga fixa.
Chat por vídeo e e-mail
A Venezuela se junta a Cuba na lista de países da América Latina com velocidades de download de banda larga fixa inferiores a 6 Mbps. Apesar disso, ambos os países terem velocidades de download de banda larga móvel mais rápidas do que as de banda larga fixa. Isso é positivo, já que é possível que os residentes precisem usar seus telefones para coisas mais complexas do que simples chats por vídeo ou e-mail.
| País | Veloc. de download (Mbps) | Veloc. de upload (Mbps) | Percentual de diferença na veloc. de download de banda larga móvel em relação a banda larga fixa |
|---|---|---|---|
| Venezuela | 3,96 | 1,50 | 48,84% |
| Cuba | 3,73 | 4,07 | 30,15% |
Como vimos com a internet móvel, para muitos países na América Latina seria útil ter um investimento maciço em velocidades de banda larga fixa. Quer dizer, a menos que os provedores estejam prontos para que a banda larga móvel seja o principal veículo que os consumidores usam para acessar a internet.
Desempenho de internet com banda larga móvel e fixa por cidade
Fort-de-France, em Martinica, ocupa a primeira posição no quesito velocidade móvel com bastante vantagem em relação às outras cidades importantes da América Latina. Marigot, em São Martinho, fica em segundo, e Basse-Terre, em Guadalupe, em terceiro. No outro extremo do espectro de redes móveis, a cidade de Havana é a última, seguida por San Salvador, El Salvador e Caracas, na Venezuela.
| Cidade | Download móvel (Mbps) | Upload móvel (Mbps) | Download fixa (Mbps) | Upload fixa (Mbps) | Percentual de diferença na veloc. de download de banda larga móvel em relação a banda larga fixa |
|---|---|---|---|---|---|
| Asunción, Paraguai | 14,58 | 8,57 | 43,49 | 8,86 | -198,29% |
| Basse-Terre, Guadeloupe | 27,73 | 8,61 | 21,20 | 8,15 | 23,55% |
| Belo Horizonte, Brasil | 19,00 | 7,86 | 28,38 | 6,62 | -49,37% |
| Bogotá, Colômbia | 15,89 | 9,48 | 16,46 | 7,16 | -3,59% |
| Brasília, Brazil | 22,20 | 9,29 | 29,27 | 7,79 | -31,85% |
| Buenos Aires, Argentina | 16,40 | 8,53 | 27,56 | 5,31 | -68,05% |
| Cali, Colômbia | 22,35 | 12,11 | 13,10 | 5,16 | 41,39% |
| Caracas, Venezuela | 8,83 | 5,13 | 5,10 | 2,04 | 42,24% |
| Cayenne, Guaiana Francesa | 22,66 | 7,86 | 25,32 | 14,67 | -11,74% |
| Cidade de Guatemala, Guatemala | 16,09 | 10,33 | 9,60 | 5,10 | 40,34% |
| Cidade de México, México | 21,41 | 11,22 | 29,81 | 12,41 | -39,23% |
| Cidade de Panamá, Panamá | 12,18 | 8,82 | 37,02 | 7,88 | -203,94% |
| Curitiba, Brasil | 22,60 | 8,31 | 32,58 | 17,65 | -44,16% |
| Ecatepec de Morelos, México | 16,67 | 10,35 | 19,89 | 3,98 | -19,32% |
| Fort-de-France, Martinica | 36,00 | 10,34 | 43,60 | 21,47 | -21,11% |
| Fortaleza, Brasil | 18,85 | 8,63 | 26,20 | 10,33 | -38,99% |
| Guayaquil, Equador | 23,61 | 9,43 | 14,44 | 9,42 | 38,84% |
| Havana, Cuba | 4,47 | 1,26 | 2,99 | 3,10 | 33,11% |
| La Paz, Bolívia | 16,92 | 11,81 | 7,16 | 3,20 | 57,68% |
| Lima, Peru | 22,23 | 14,89 | 27,52 | 6,66 | -23,80% |
| Managua, Nicarágua | 21,04 | 8,89 | 6,87 | 3,52 | 67,35% |
| Manaus, Brasil | 14,83 | 7,16 | 20,92 | 4,10 | -41,07% |
| Marigot, São Martinho | 28,97 | 9,23 | 9,62 | 5,45 | 66,79% |
| Medellín, Colômbia | 17,58 | 9,17 | 14,76 | 6,87 | 16,04% |
| Montevideo, Uruguai | 23,30 | 11,65 | 38,39 | 10,12 | -64,76% |
| Port-au-Prince, Haiti | 10,08 | 3,71 | 8,94 | 6,63 | 11,31% |
| Quito, Equador | 21,01 | 7,75 | 15,54 | 11,59 | 26,04% |
| Rio de Janeiro, Brasil | 22,02 | 9,02 | 28,62 | 10,36 | -29,97% |
| Salvador, Brasil | 17,85 | 7,44 | 20,43 | 6,09 | -14,45% |
| San José, Costa Rica | 14,69 | 6,92 | 12,39 | 4,74 | 15,66% |
| San Juan, Porto Rico | 16,05 | 9,76 | 50,13 | 15,64 | -212,34% |
| San Salvador, El Salvador | 8,65 | 4,23 | 10,26 | 3,88 | -18,61% |
| Santiago, Chile | 16,05 | 9,35 | 42,69 | 12,37 | -165,98% |
| Santo, Domingo, República Dominicana | 15,15 | 8,87 | 17,86 | 4,47 | -17,89% |
| São Paulo, Brasil | 20,74 | 8,41 | 36,54 | 17,45 | -76,18% |
| Sucre, Bolívia | 14,81 | 11,18 | 4,86 | 3,24 | 67,18% |
| Tegucigalpa, Honduras | 26,24 | 13,61 | 7,39 | 2,91 | 71,84% |
Locais mais densos e urbanos são locais mais fáceis e econômicos para implementar melhorias na infraestrutura móvel, portanto, se as velocidades forem lentas nessas áreas, é um bom sinal de que as velocidades são muito piores em outros lugares do país.
No que diz respeito à banda larga fixa, San Juan, em Porto Rico, ocupa a primeira posição na América Latina, seguida por Fort-de-France, em Martinica, e Asunción, no Paraguai. A cidade com a velocidade de download de banda larga fixa mais lenta dentre as que analisamos é Havana, em Cuba, seguida por Sucre, na Bolívia e Caracas, na Venezuela.
Agora que você sabe a classificação do seu país ou cidade para streaming de vídeo em 4K, streaming de vídeo em HD ou apenas chat por vídeo e e-mail, é hora de descobrir se suas velocidades estão acima ou abaixo da média. Faça o Speedtest no Android, iOS, ou na web e mande um tweet para @speedtest para compartilhar sua experiência.
Ookla retains ownership of this article including all of the intellectual property rights, data, content graphs and analysis. This article may not be quoted, reproduced, distributed or published for any commercial purpose without prior consent. Members of the press and others using the findings in this article for non-commercial purposes are welcome to publicly share and link to report information with attribution to Ookla.


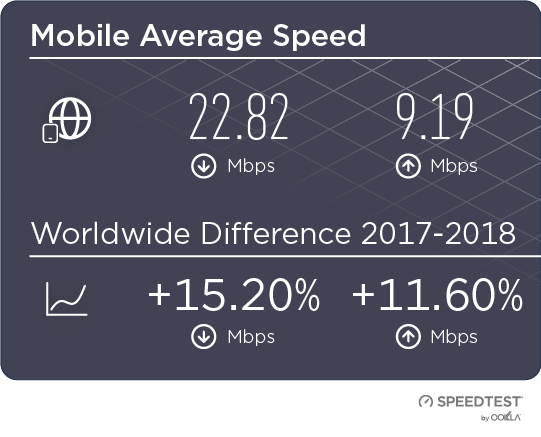
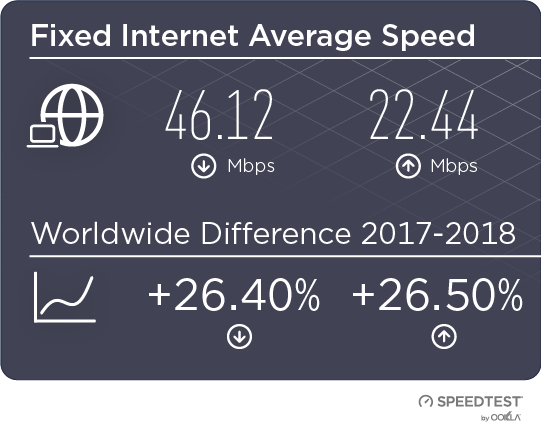
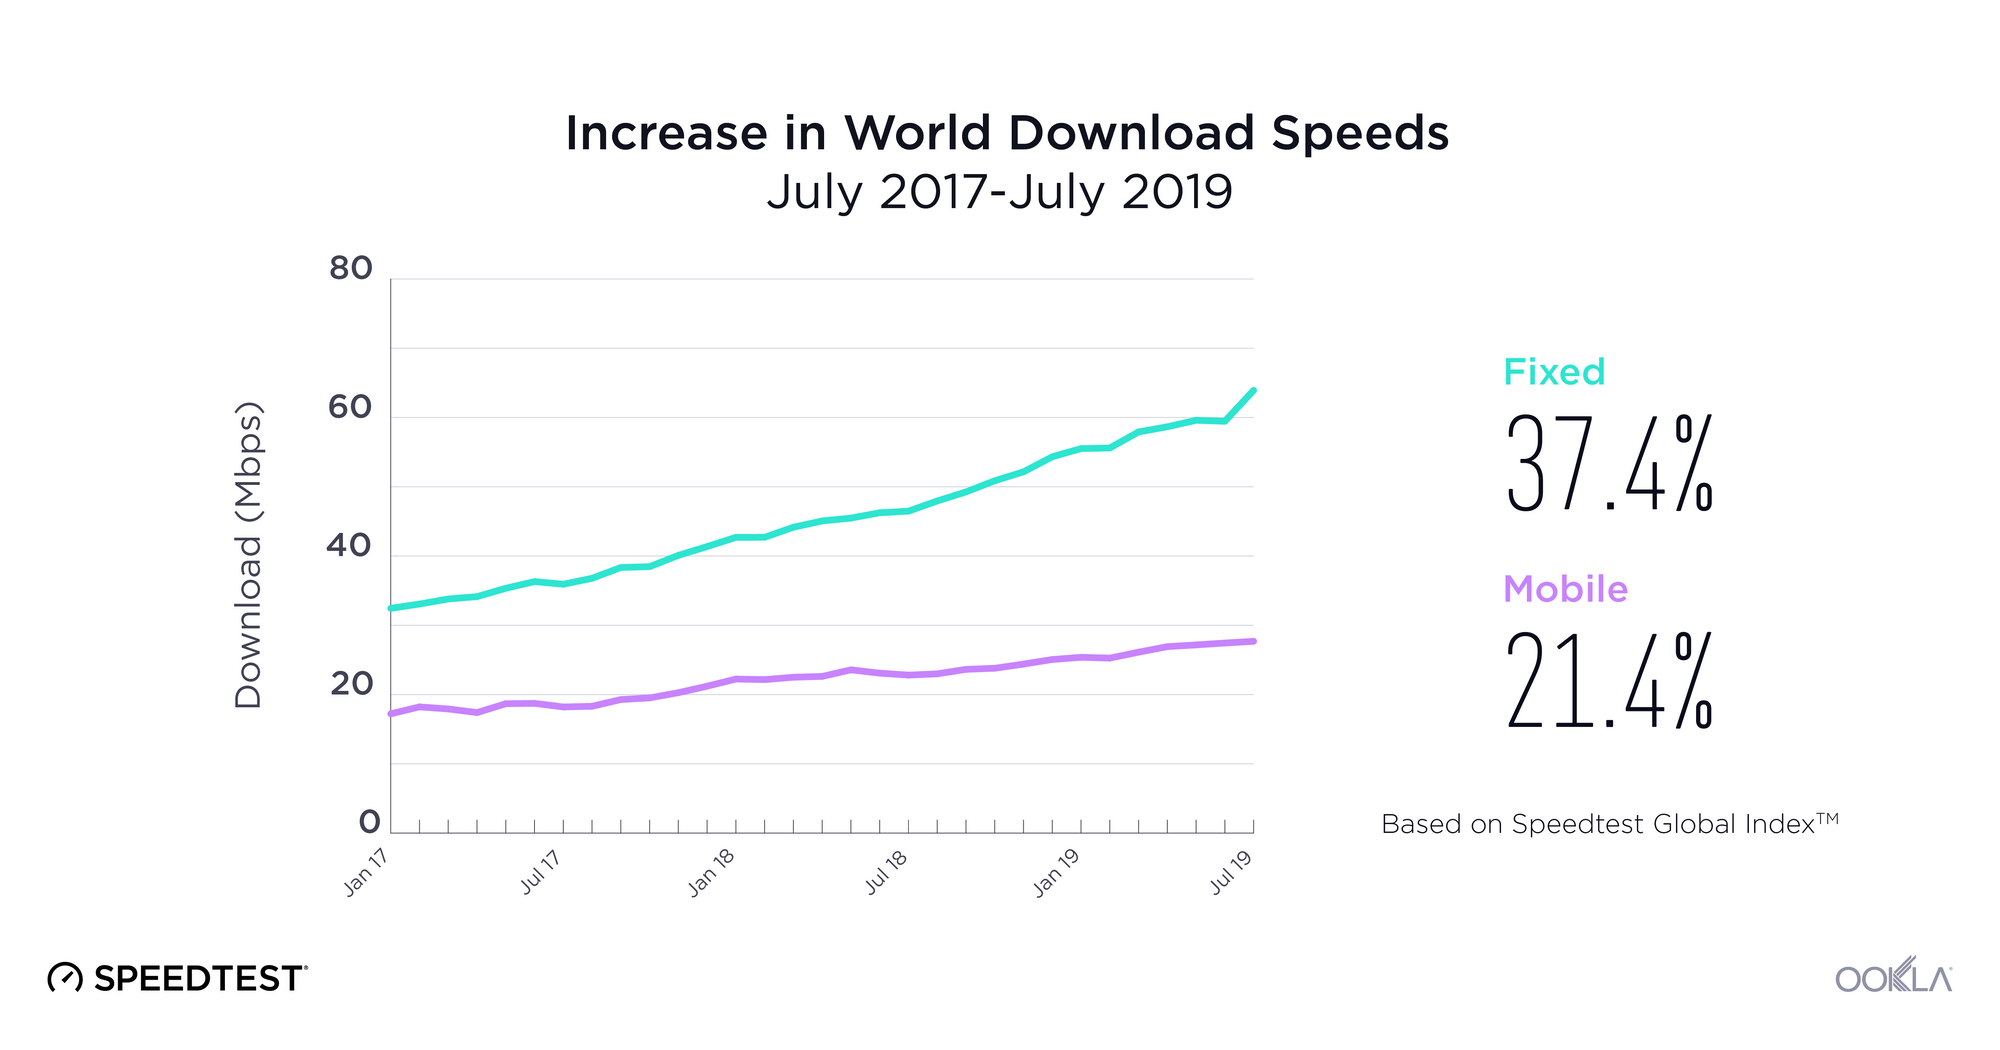
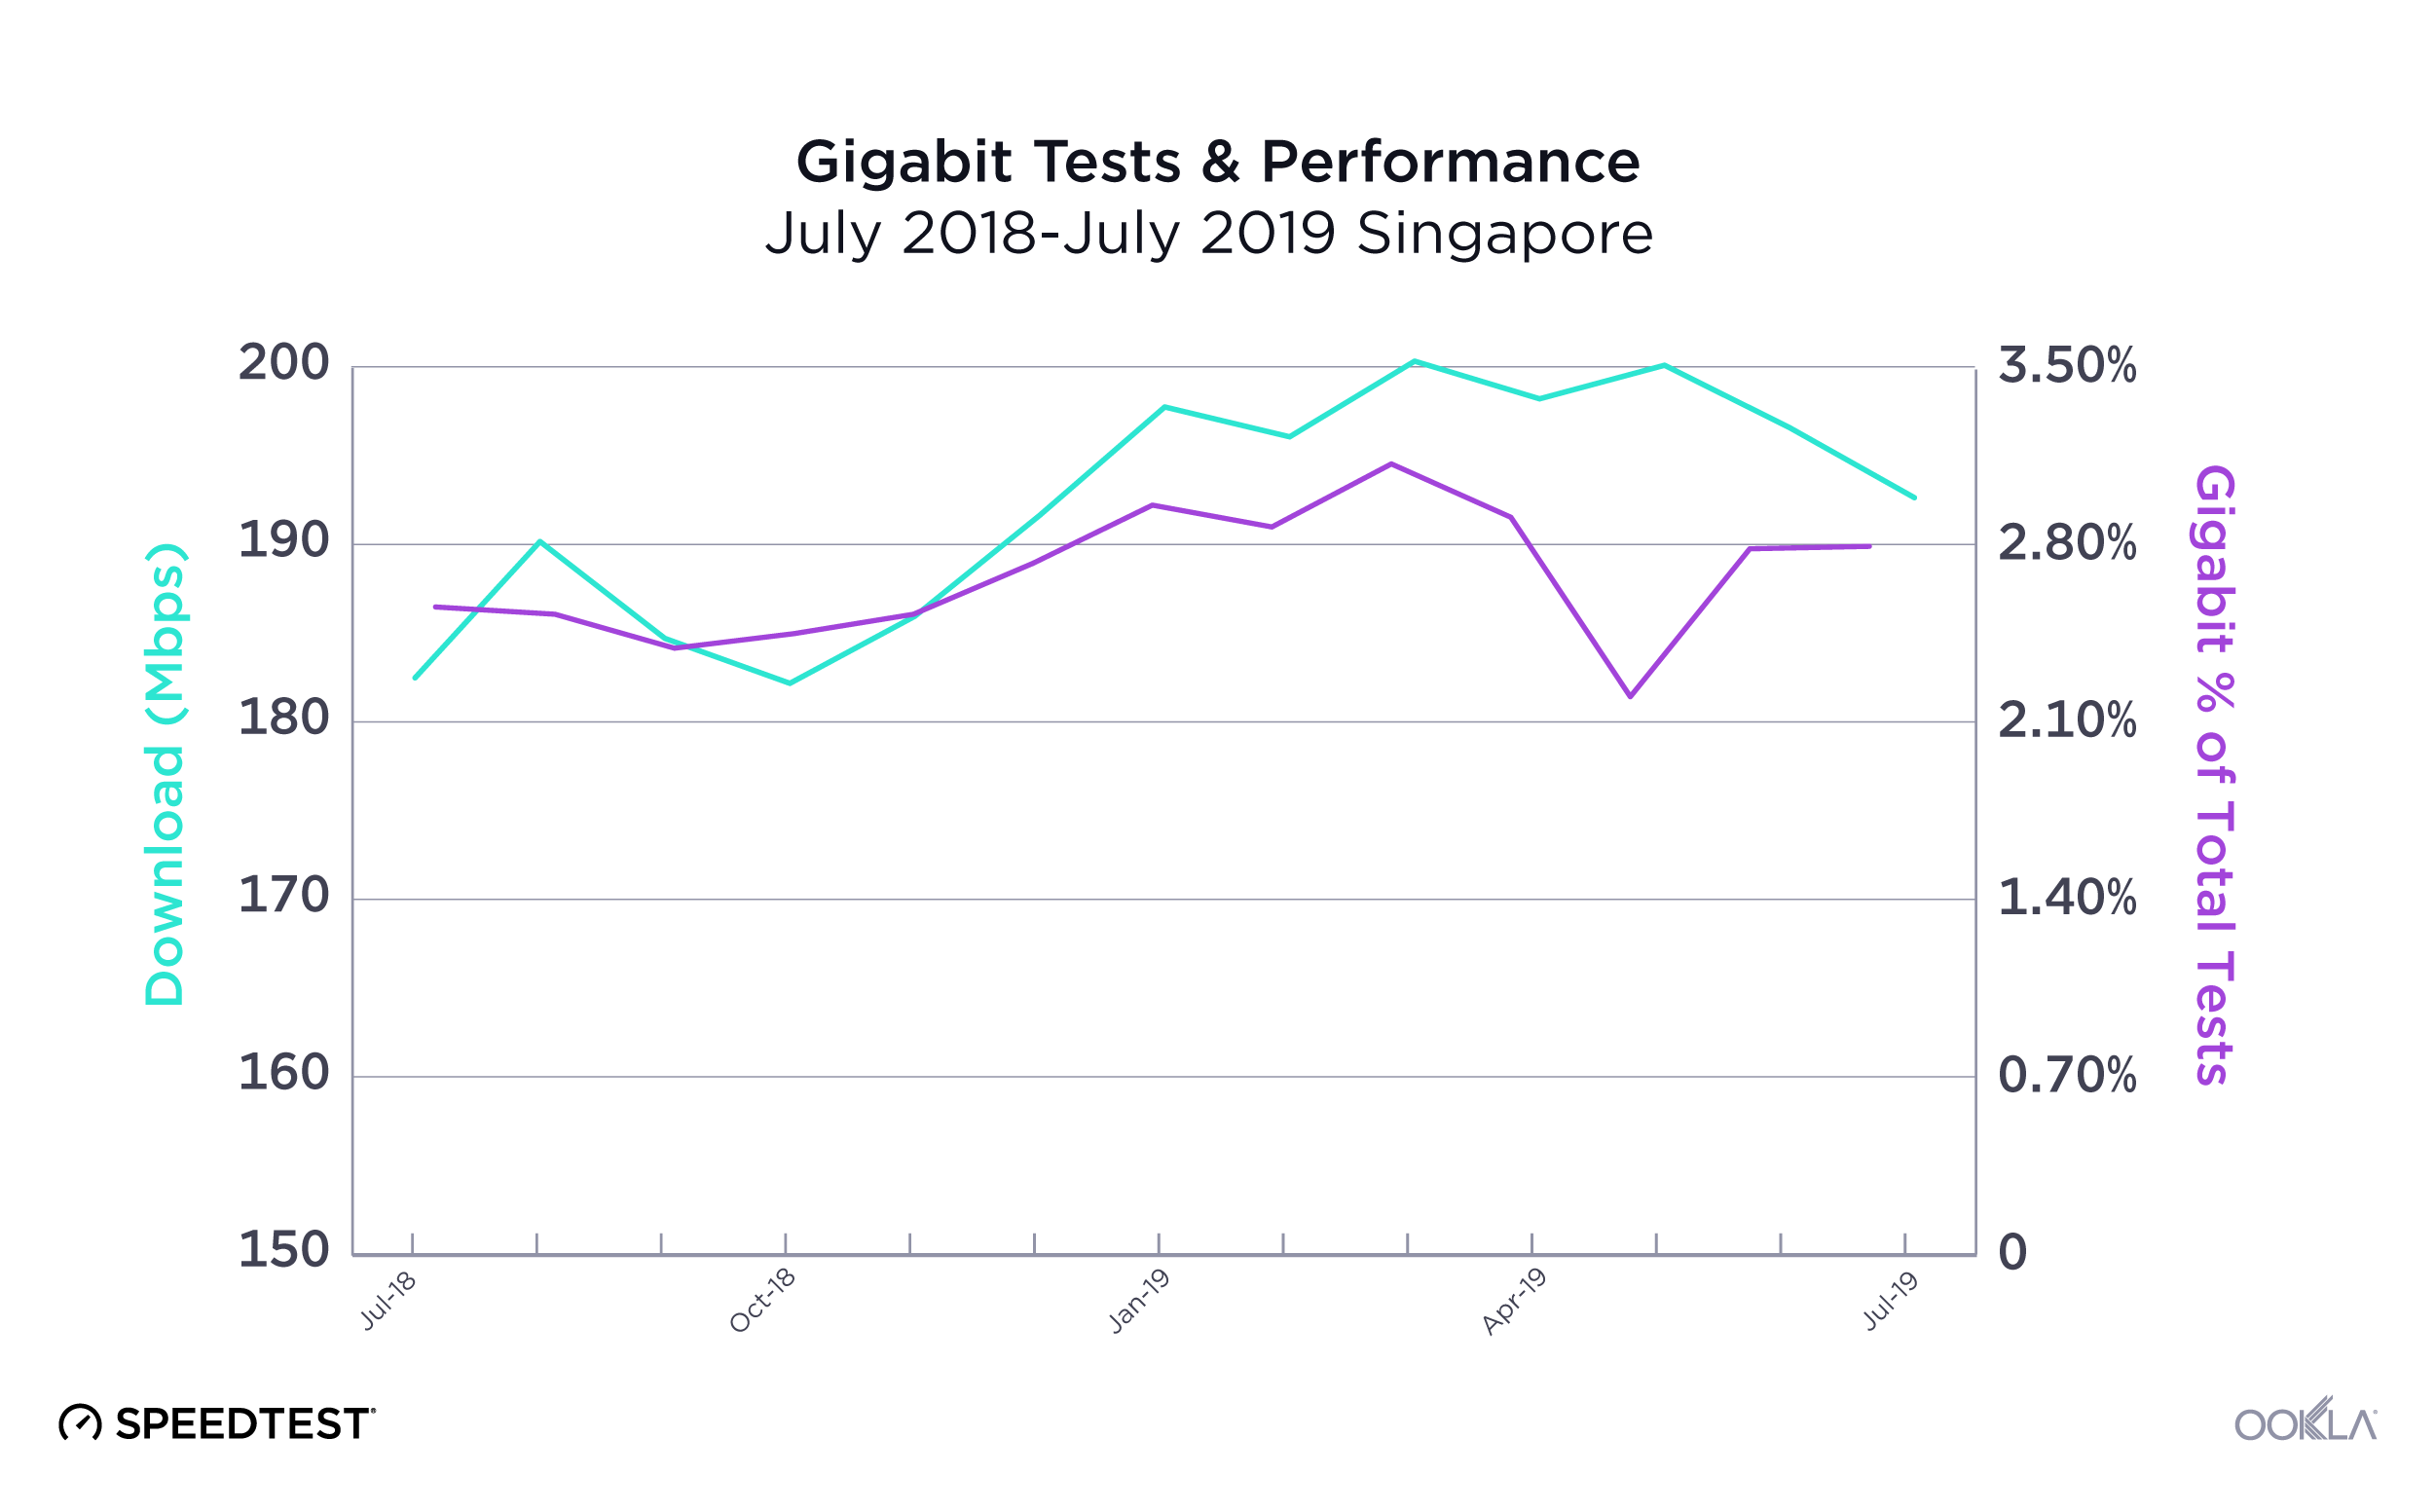
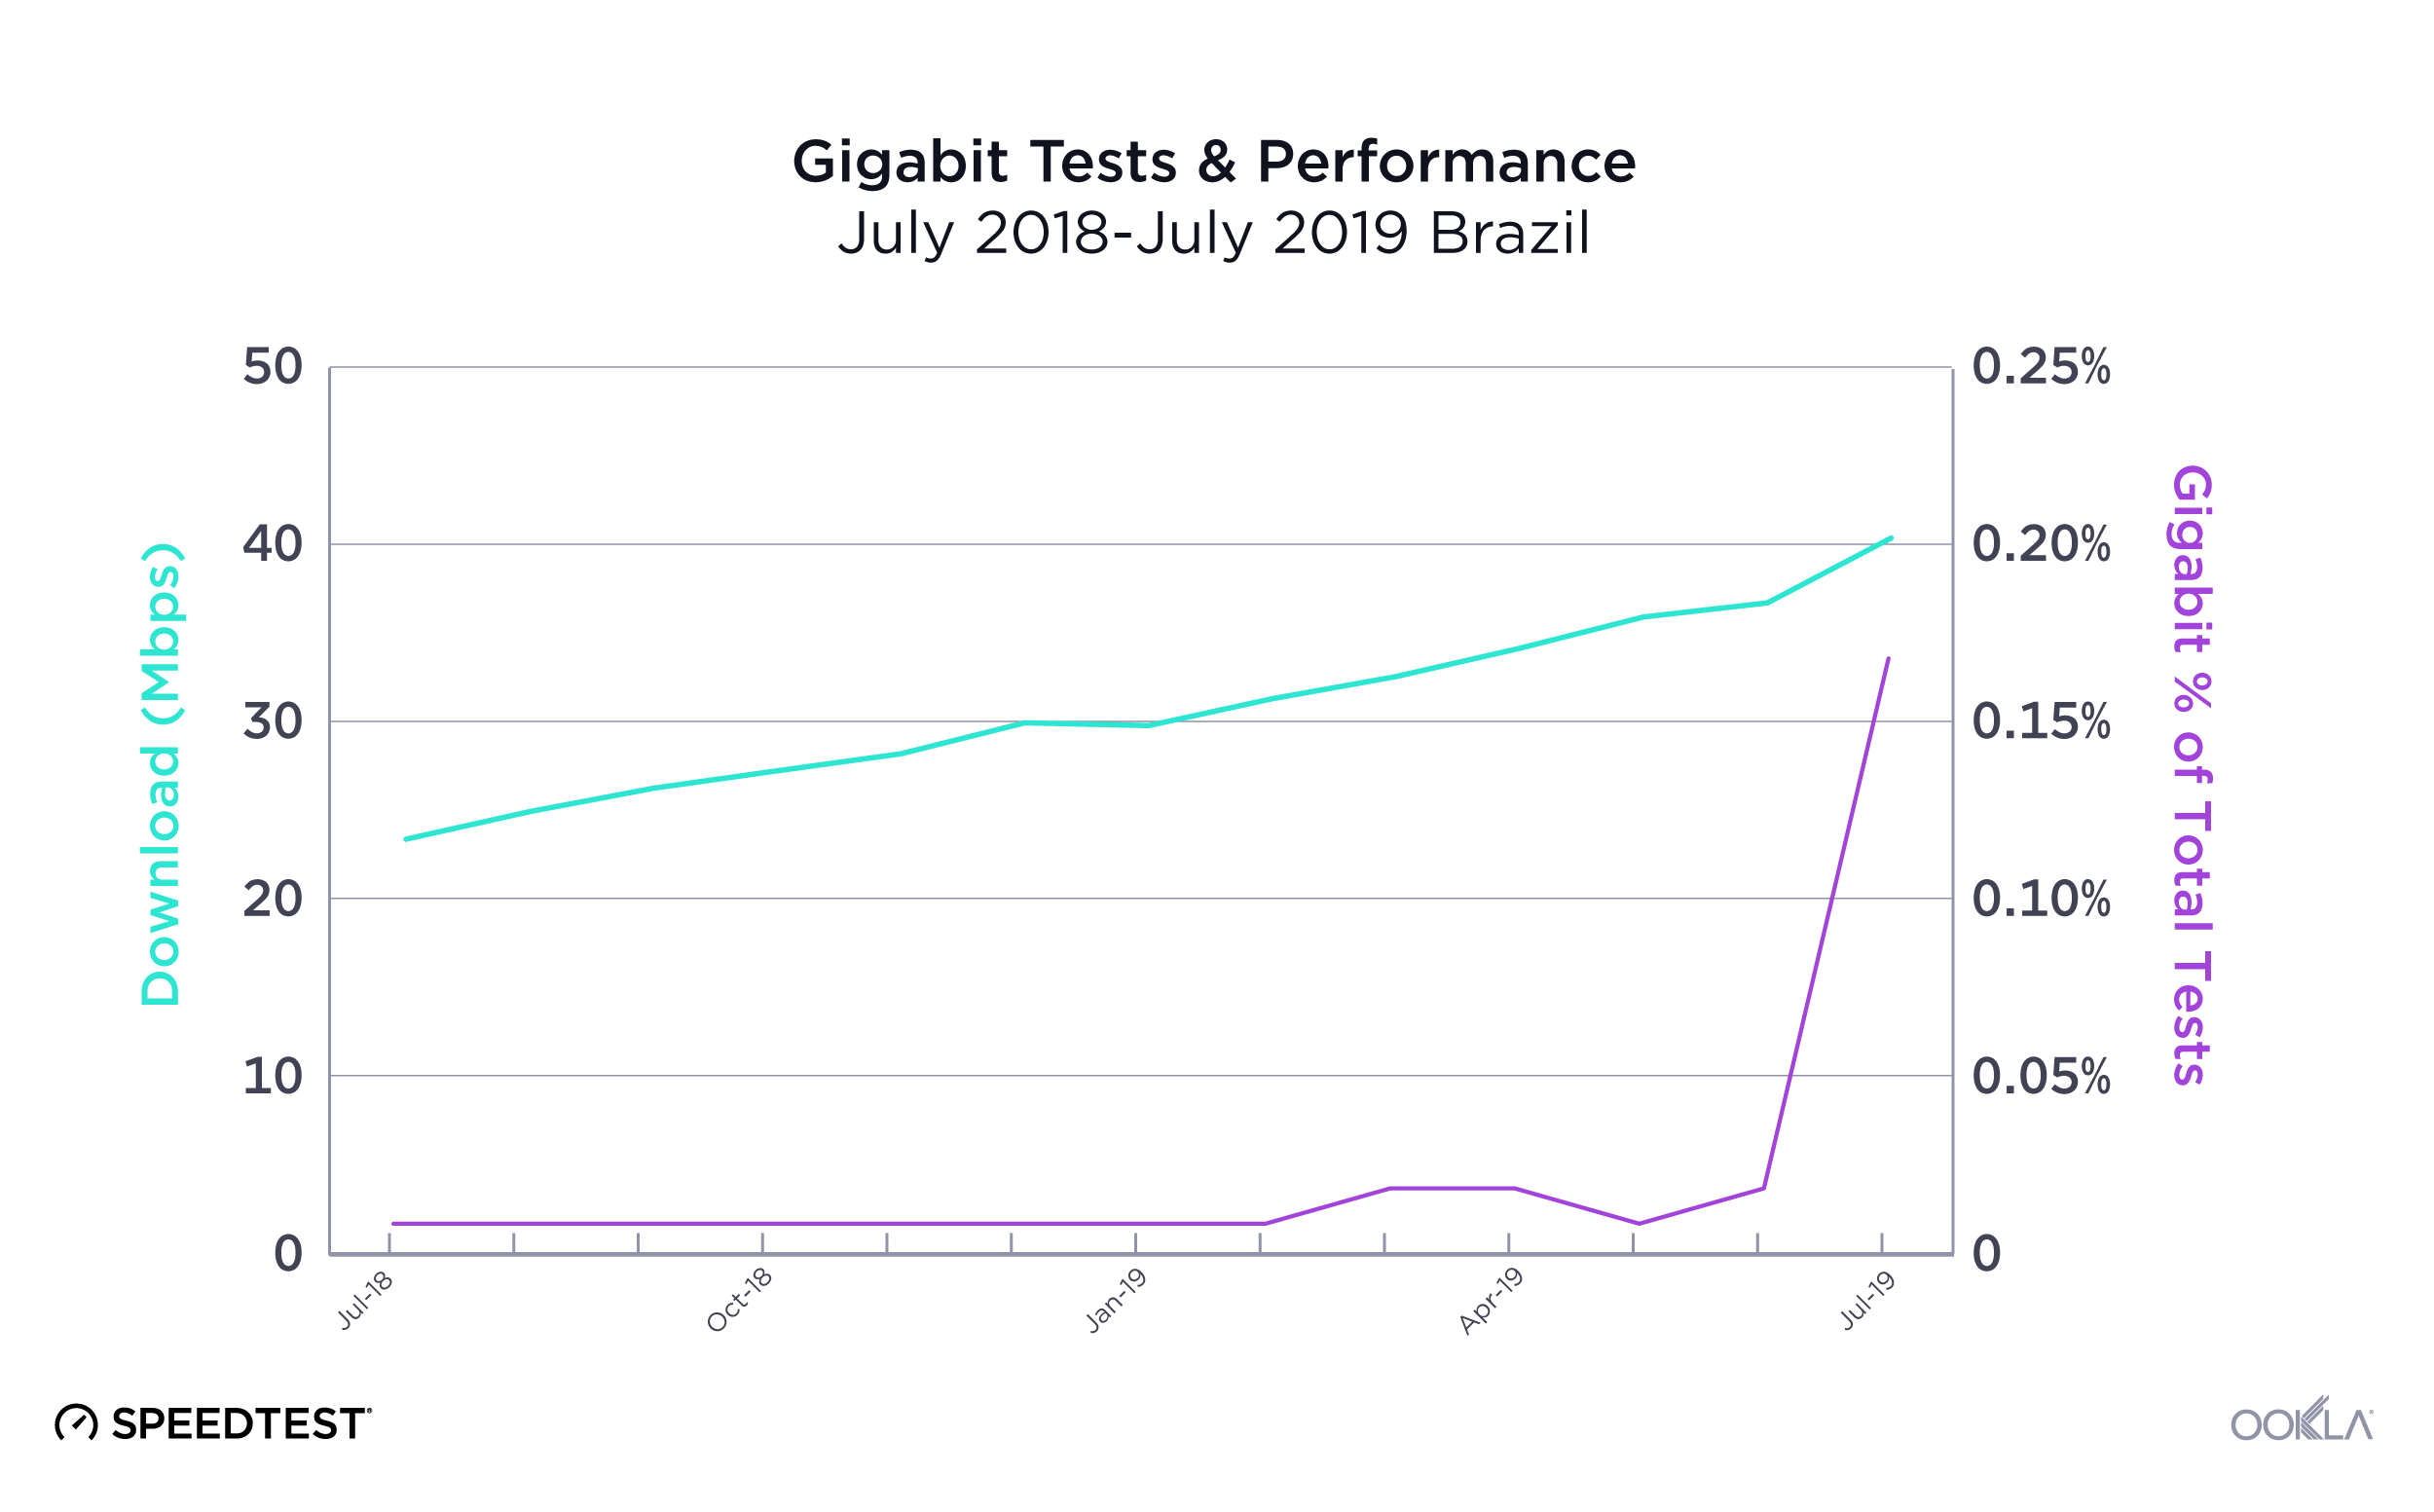
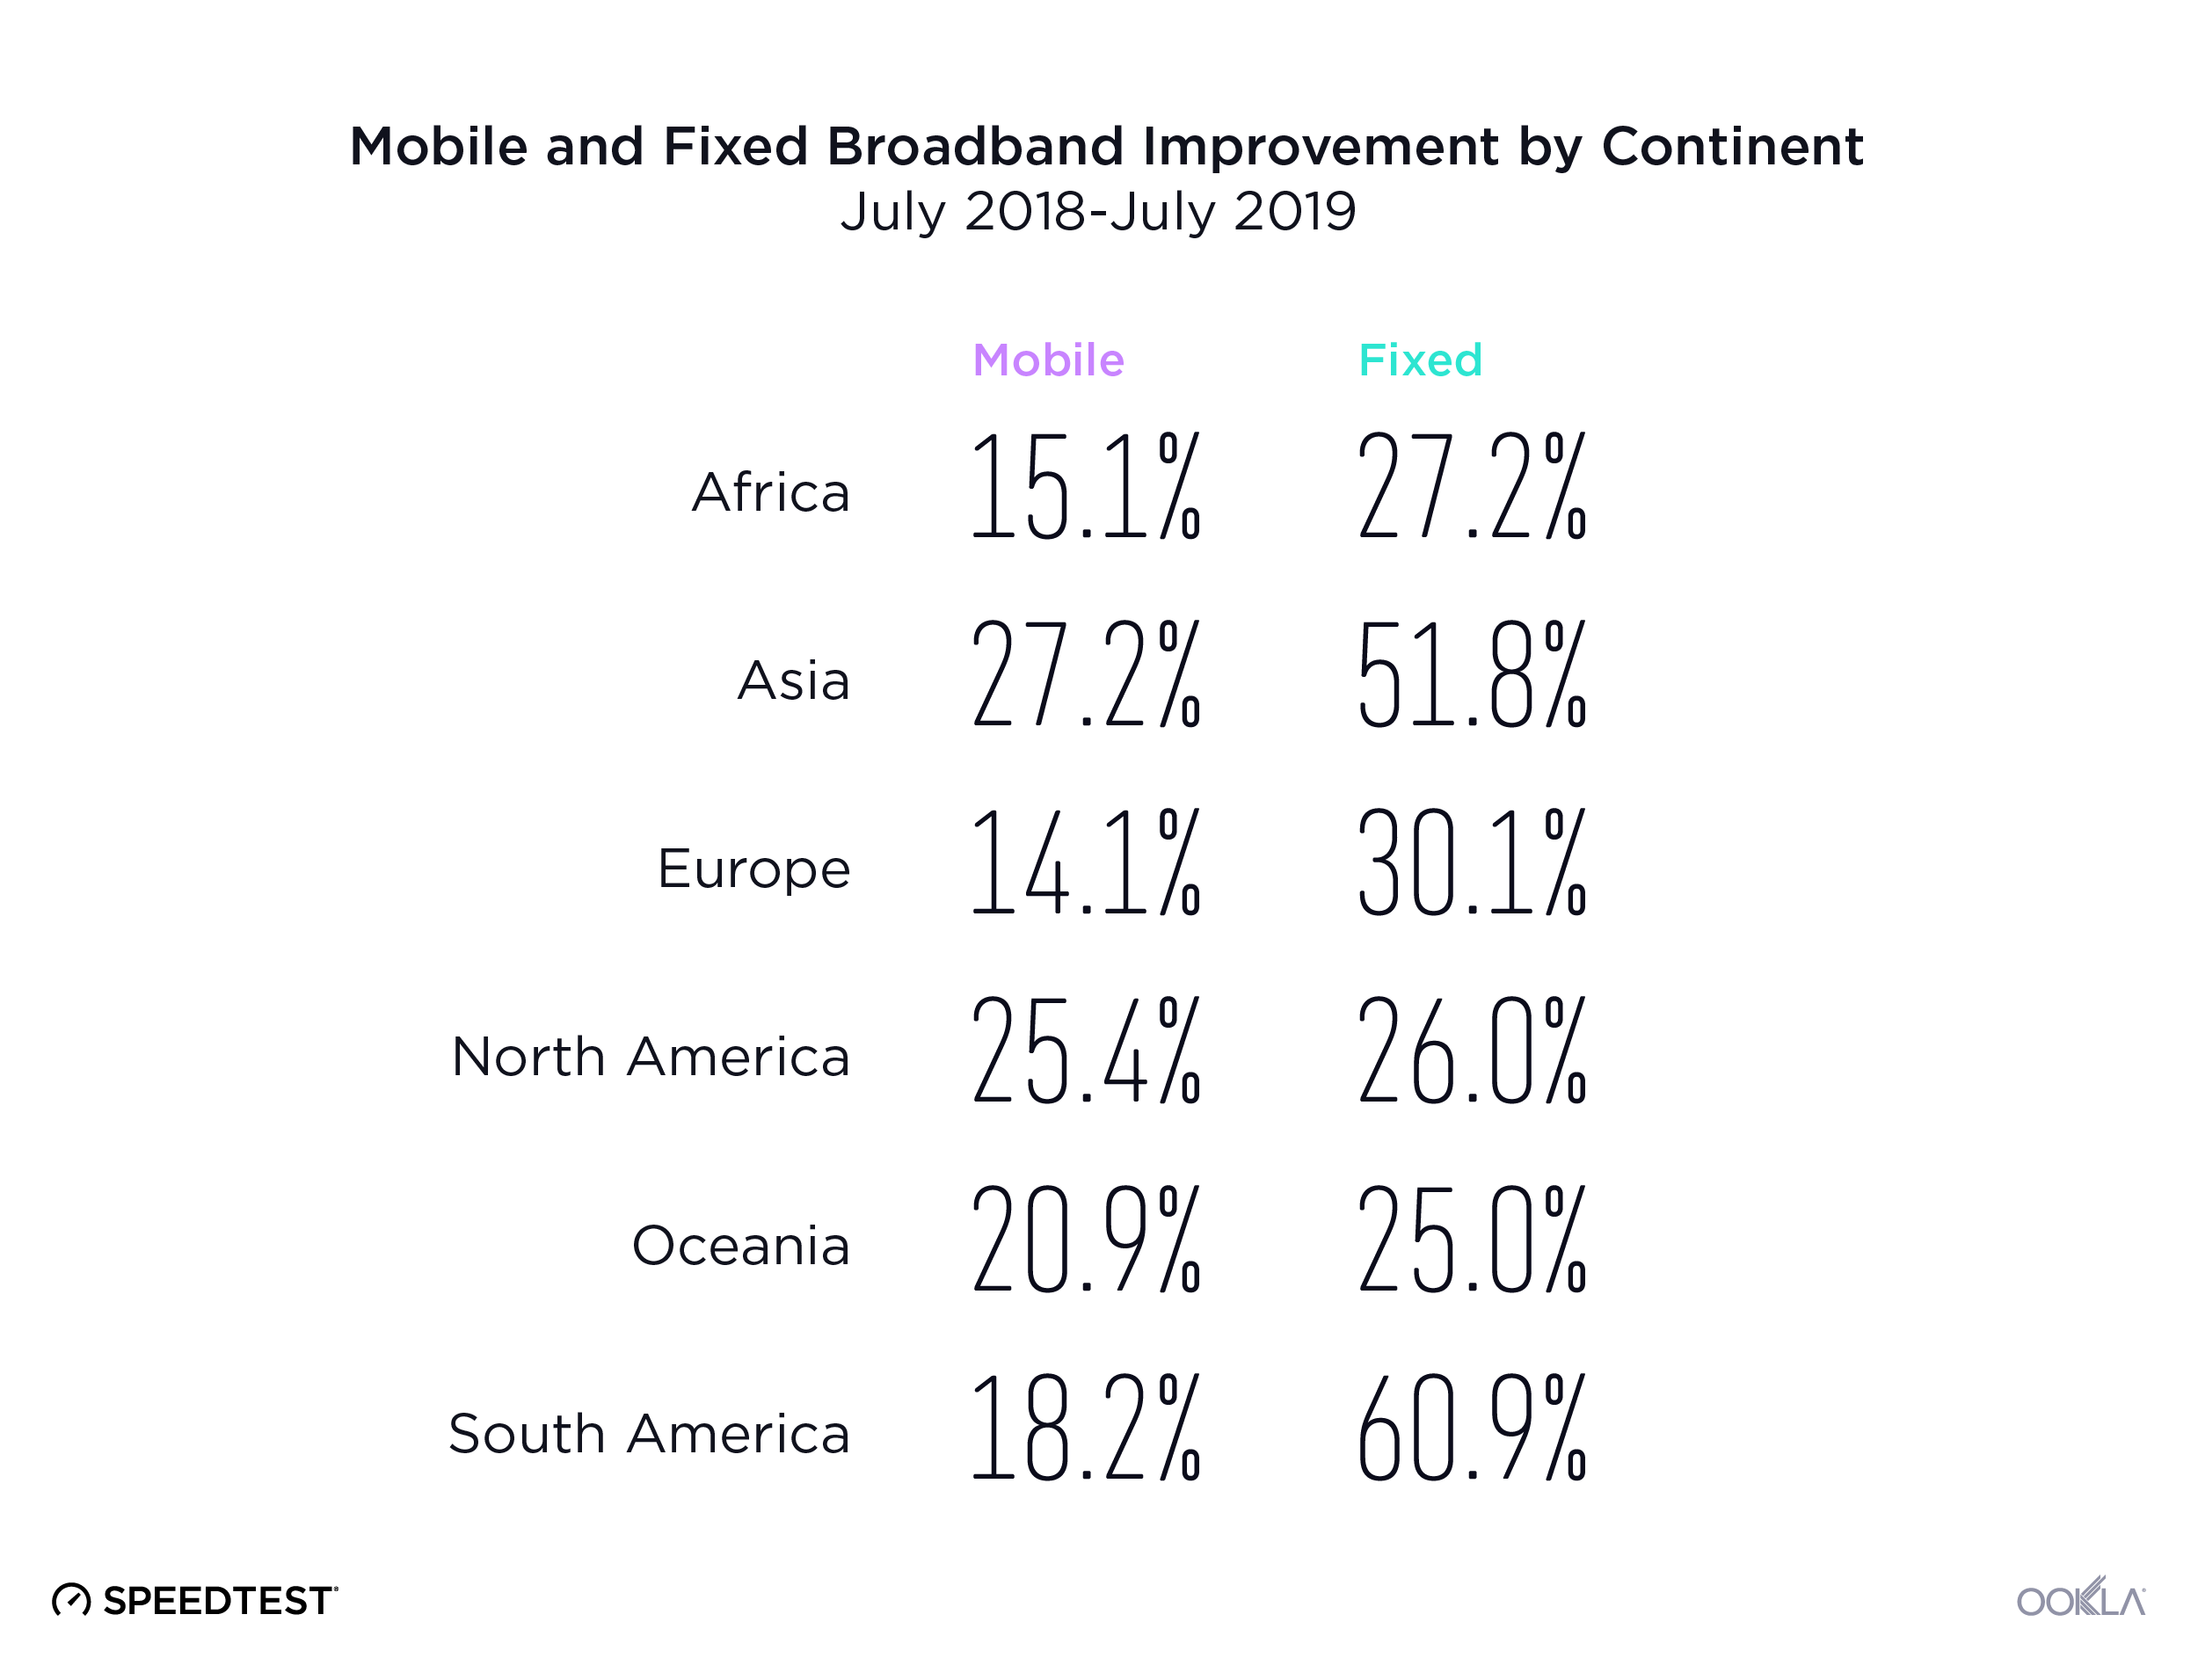
 When it comes to the internet, the news is mostly good for 2018. Download and upload speeds are increasing across the globe on both mobile and fixed broadband. 5G is on the horizon and gigabit service is expanding.