| December 18, 2022

Stable and Expanding: The State of Worldwide 5G in 2022


5G is no longer a new technology, however, consumers in many countries are still waiting to see the full benefits of 5G (or even to connect to 5G at all). We examined Speedtest Intelligence® data from Q3 2022 Speedtest® results to see how 5G performance has changed since last year, where download speeds are the fastest at the country level, and how satellite technologies are offering additional options to connect. We also looked at countries that don’t yet have 5G to understand where consumers are seeing improvements in 4G LTE access.

5G speeds were stable at the global level

Graphic of 5G median speed performance worldwide.

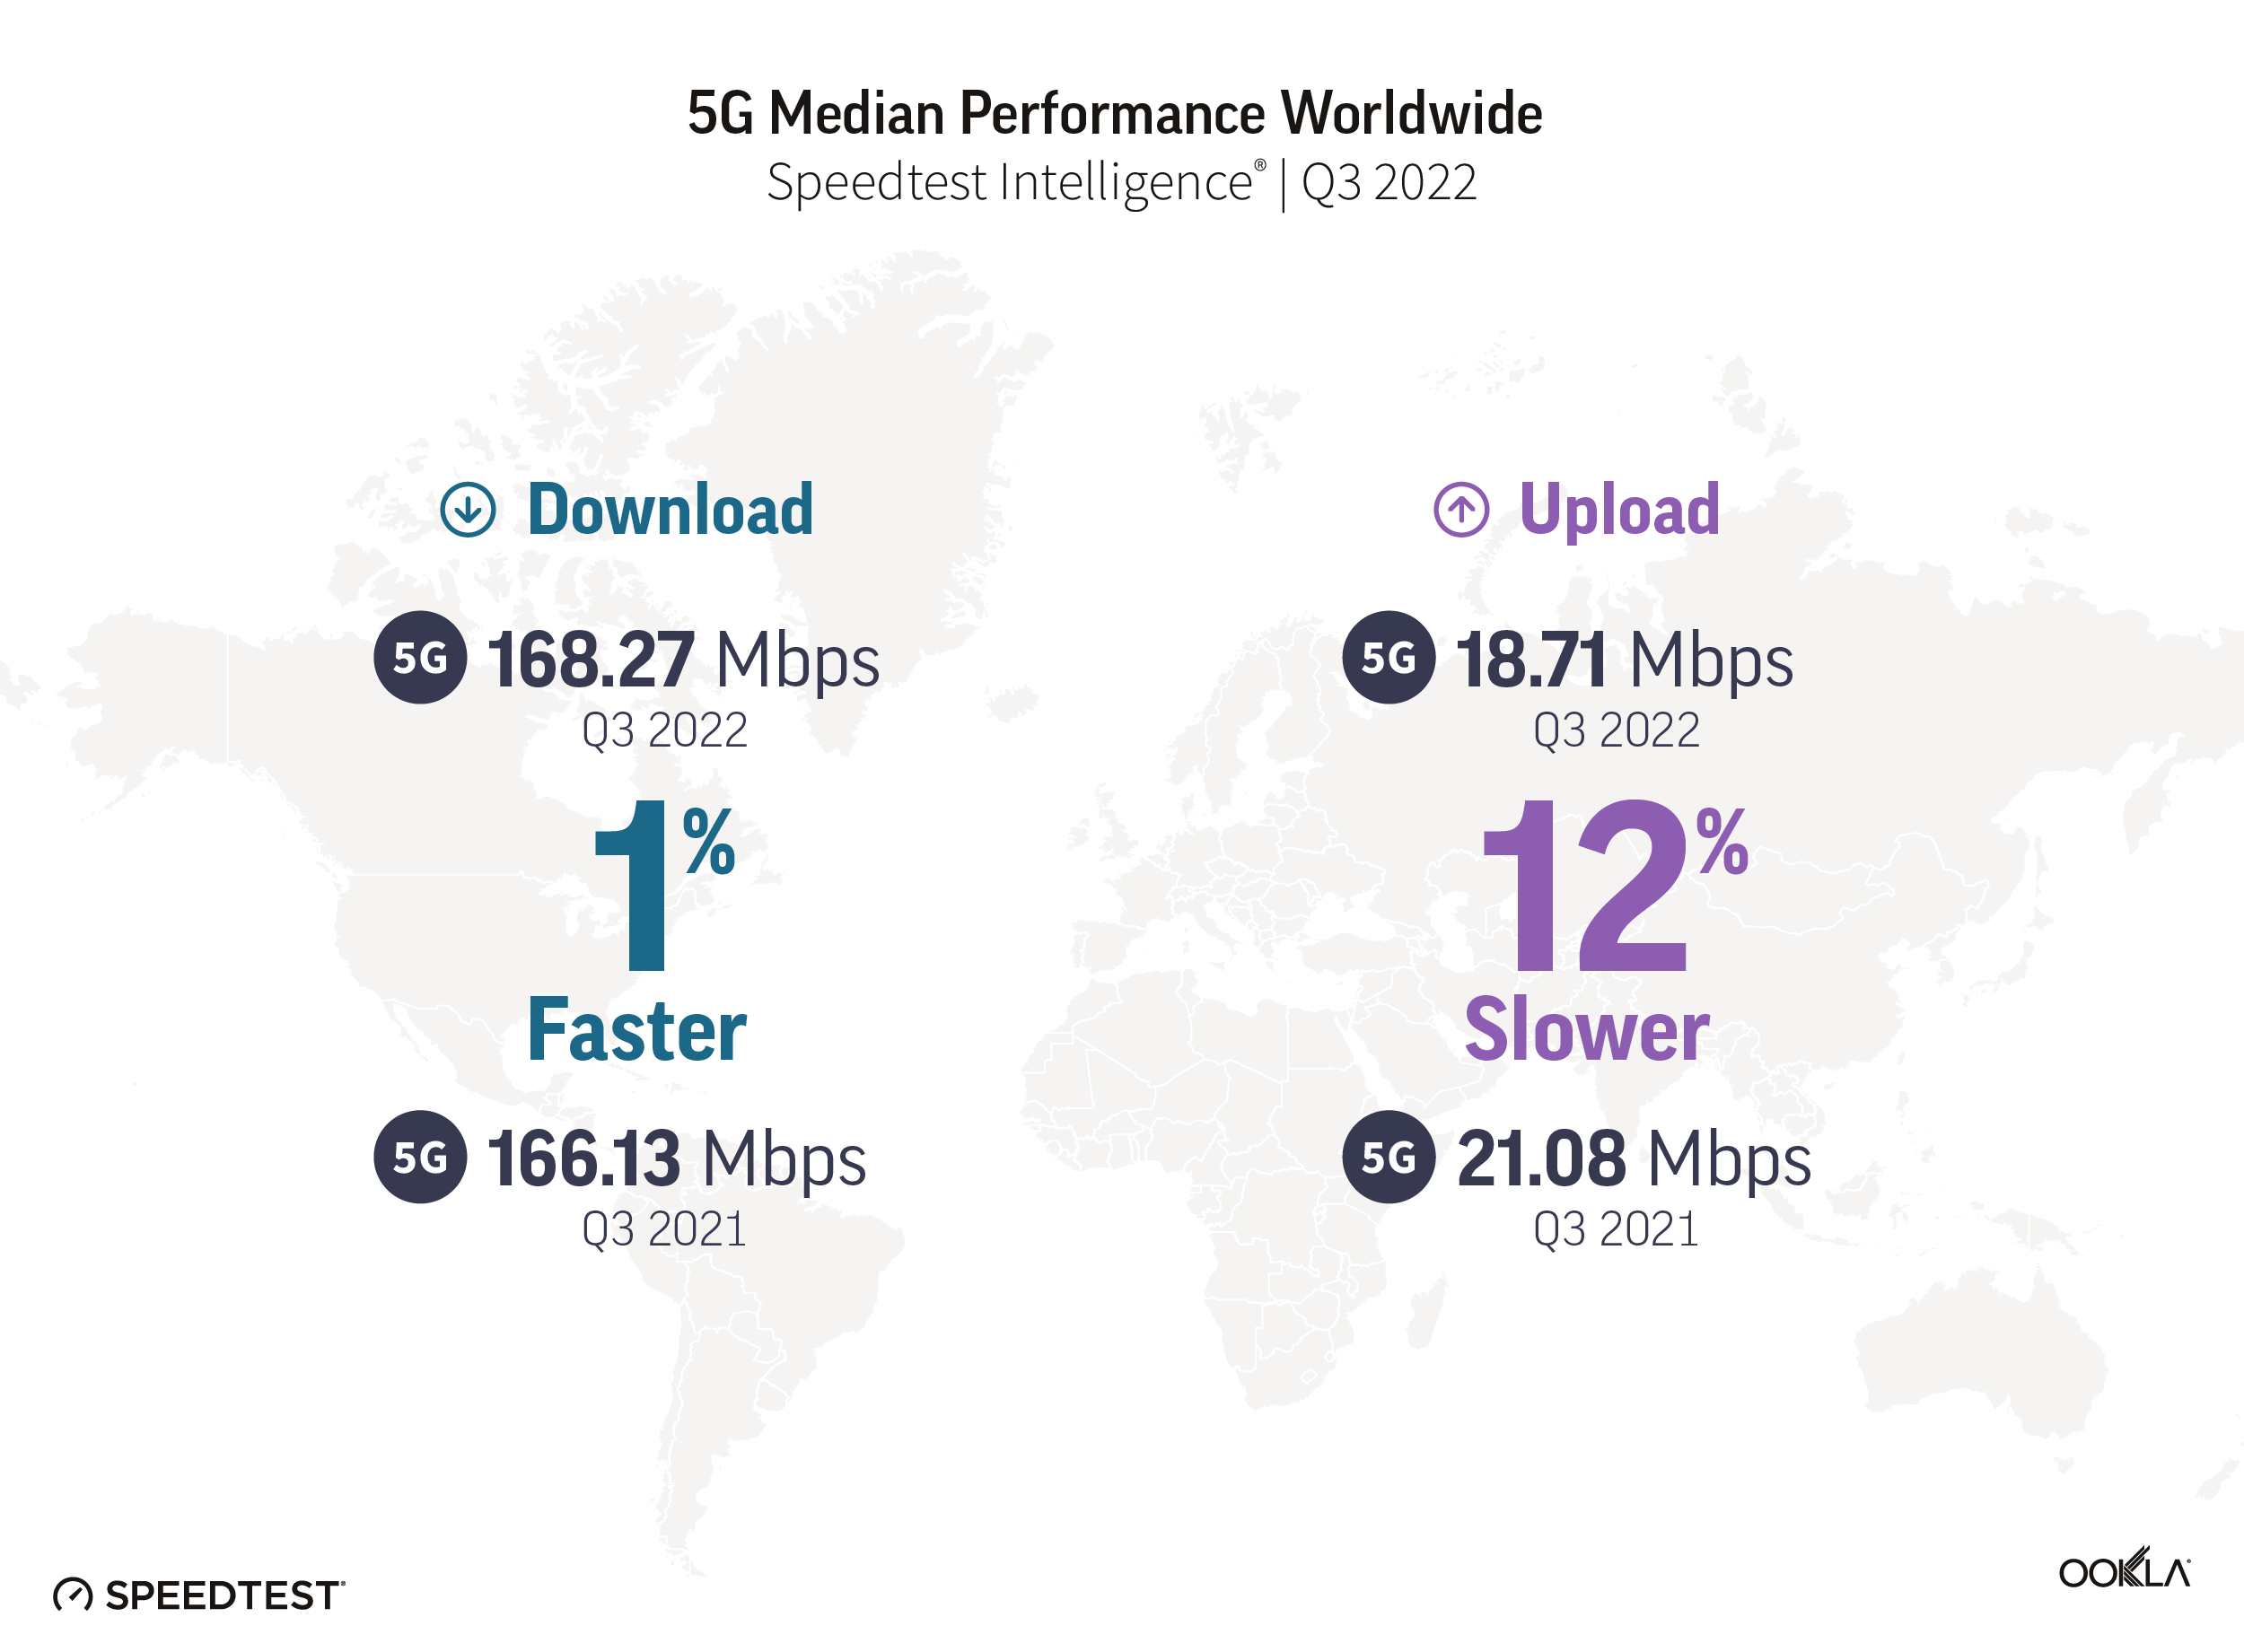
In 2021, we discussed how an expansion of 5G access led to a decline in overall speed at the global level. This year showed a stabilization in overall speed, even as 5G access broadened, with a median global 5G download speed of 168.27 Mbps in Q3 2022 as compared to 166.13 Mbps in Q3 2021. Median upload speed over 5G slowed slightly to 18.71 Mbps (from 21.08 Mbps) during the same period. According to the Ookla® 5G Map™, there were 127,509 5G deployments in 128 countries as of November 30, 2022, compared to 85,602 in 112 countries the year prior.

South Korea and the United Arab Emirates led countries for 5G speeds

Chart of fastest countries for median 5G download speed

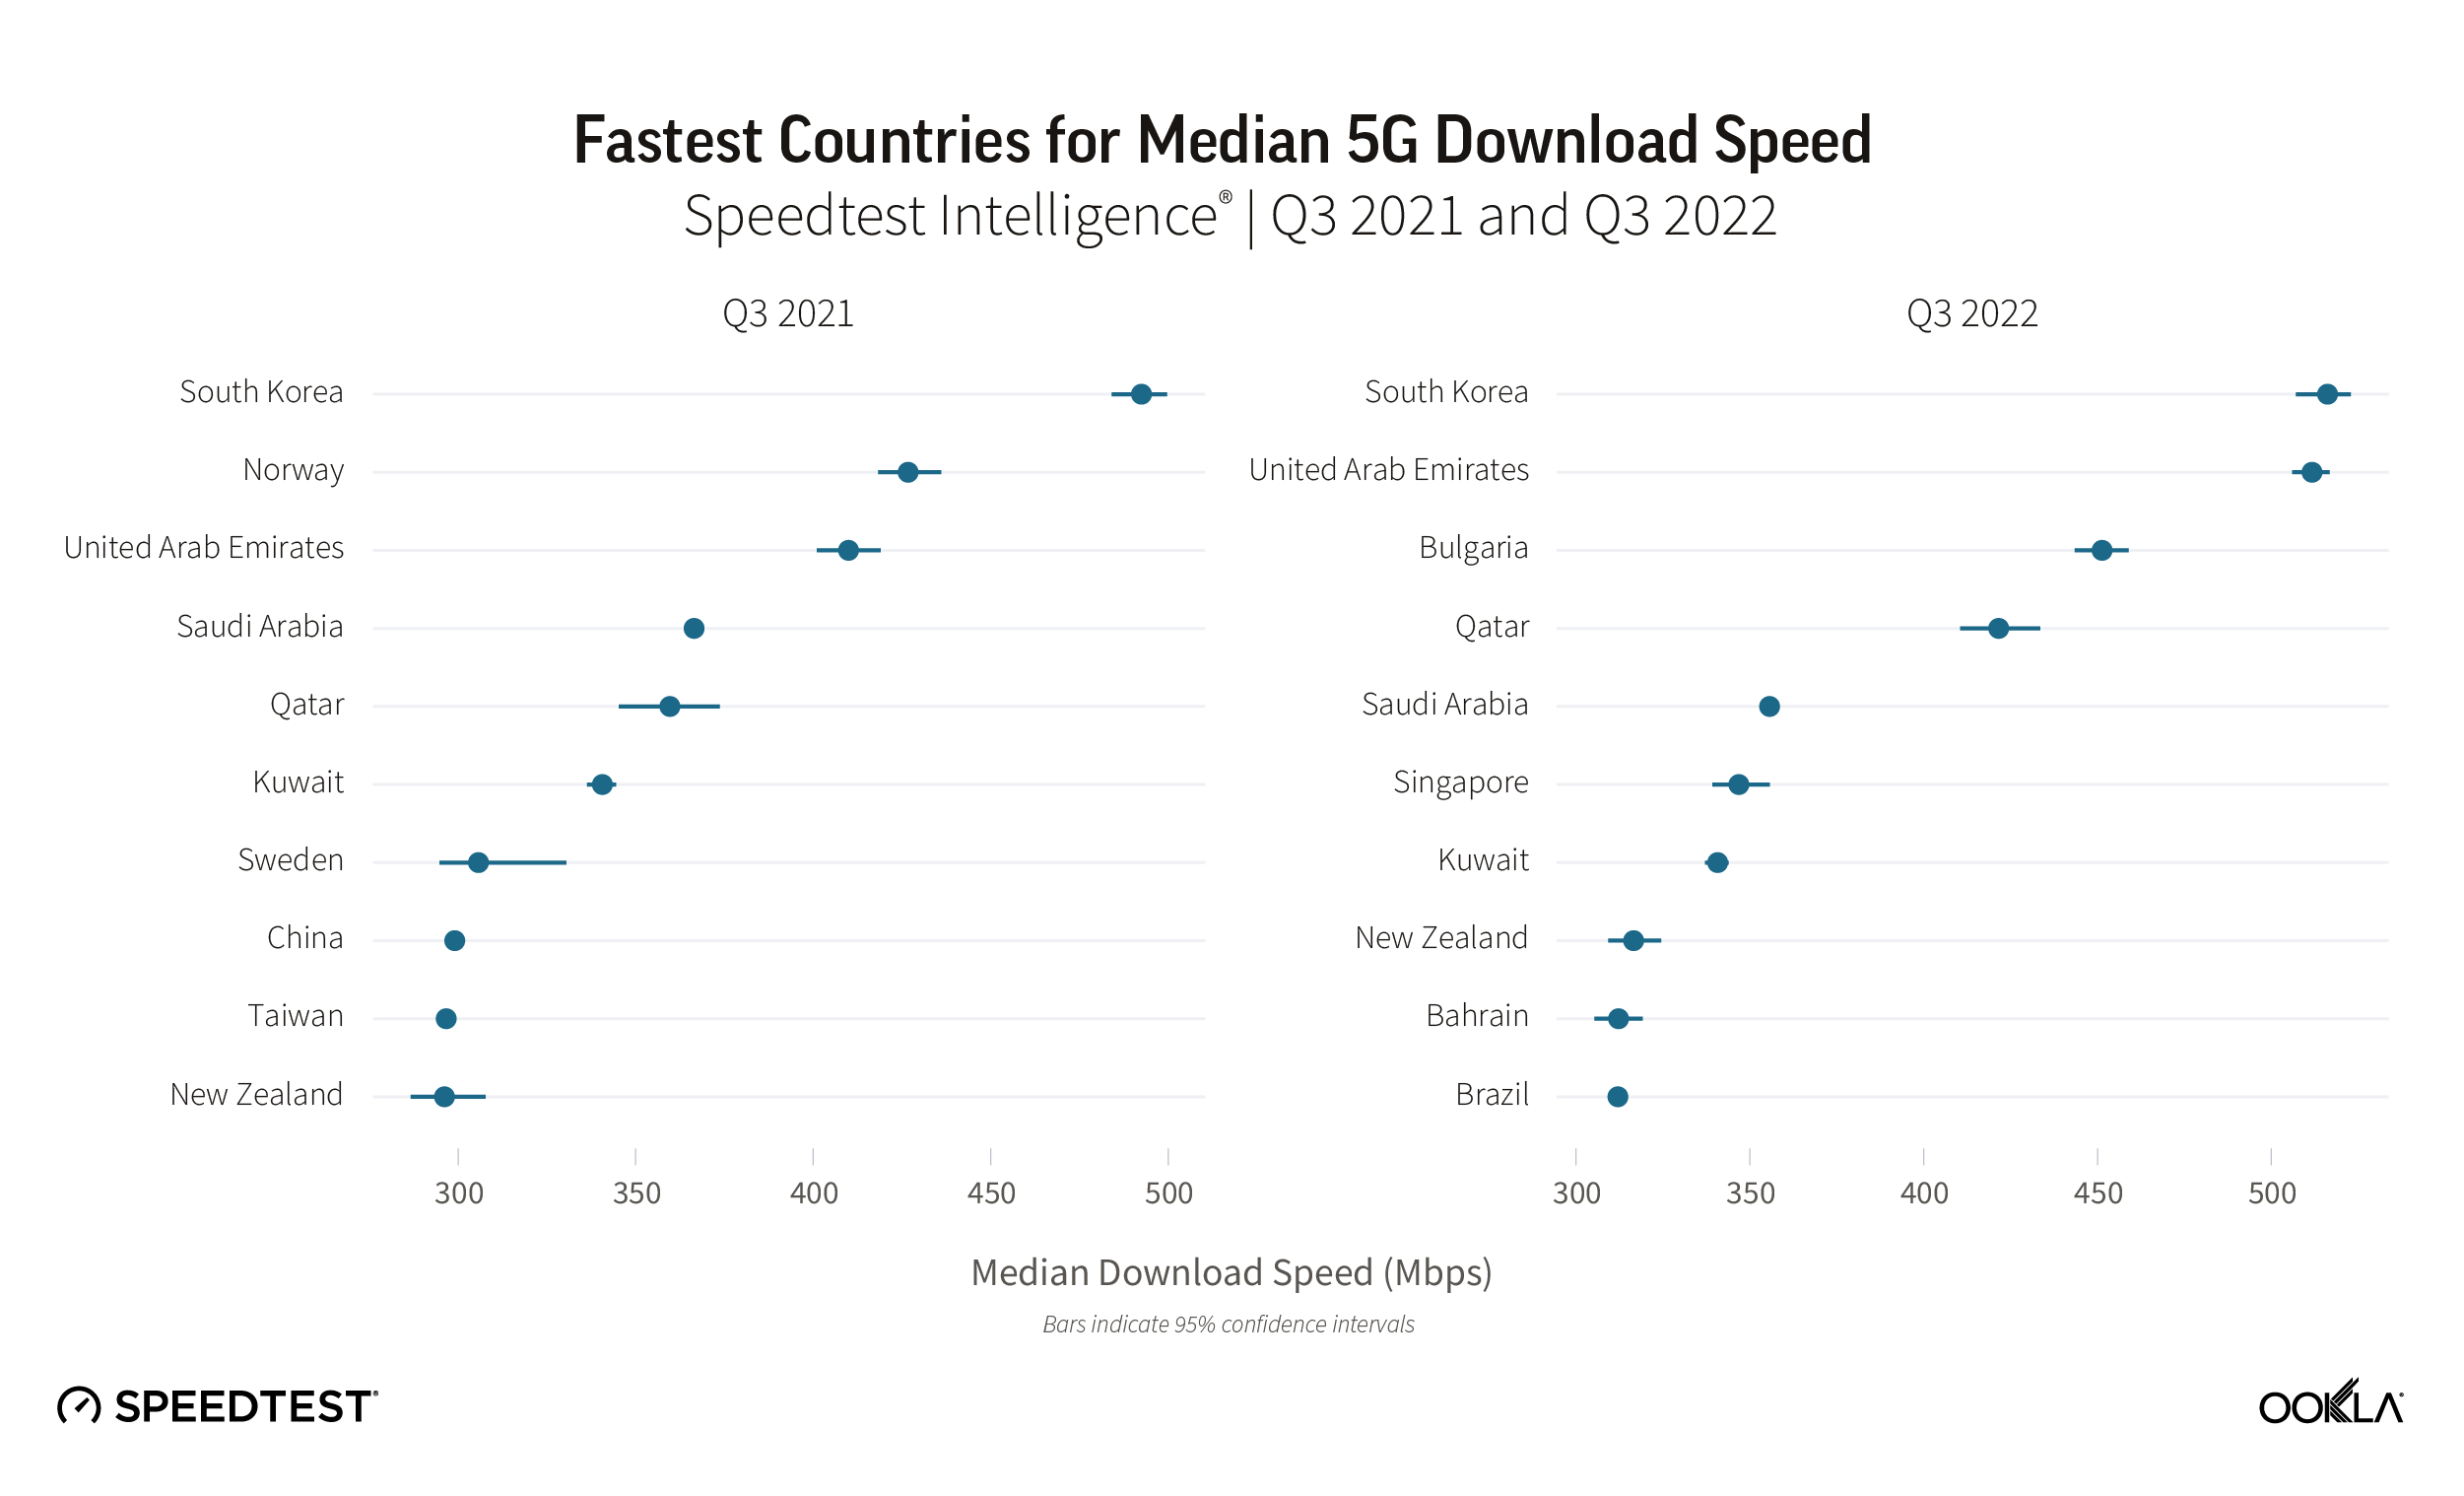
South Korea and the U.A.E. had the fastest median download speed over 5G at 516.15 Mbps and 511.70 Mbps, respectively, during Q3 2022, leading a top 10 list that included Bulgaria, Qatar, Saudi Arabia, Singapore, Kuwait, New Zealand, Bahrain, and Brazil. Bulgaria, Singapore, Bahrain, and Brazil were new to the top 10 in 2022, while Norway, Sweden, China, and Taiwan fell out of the top 10.

Satellite became more accessible but performance slowed

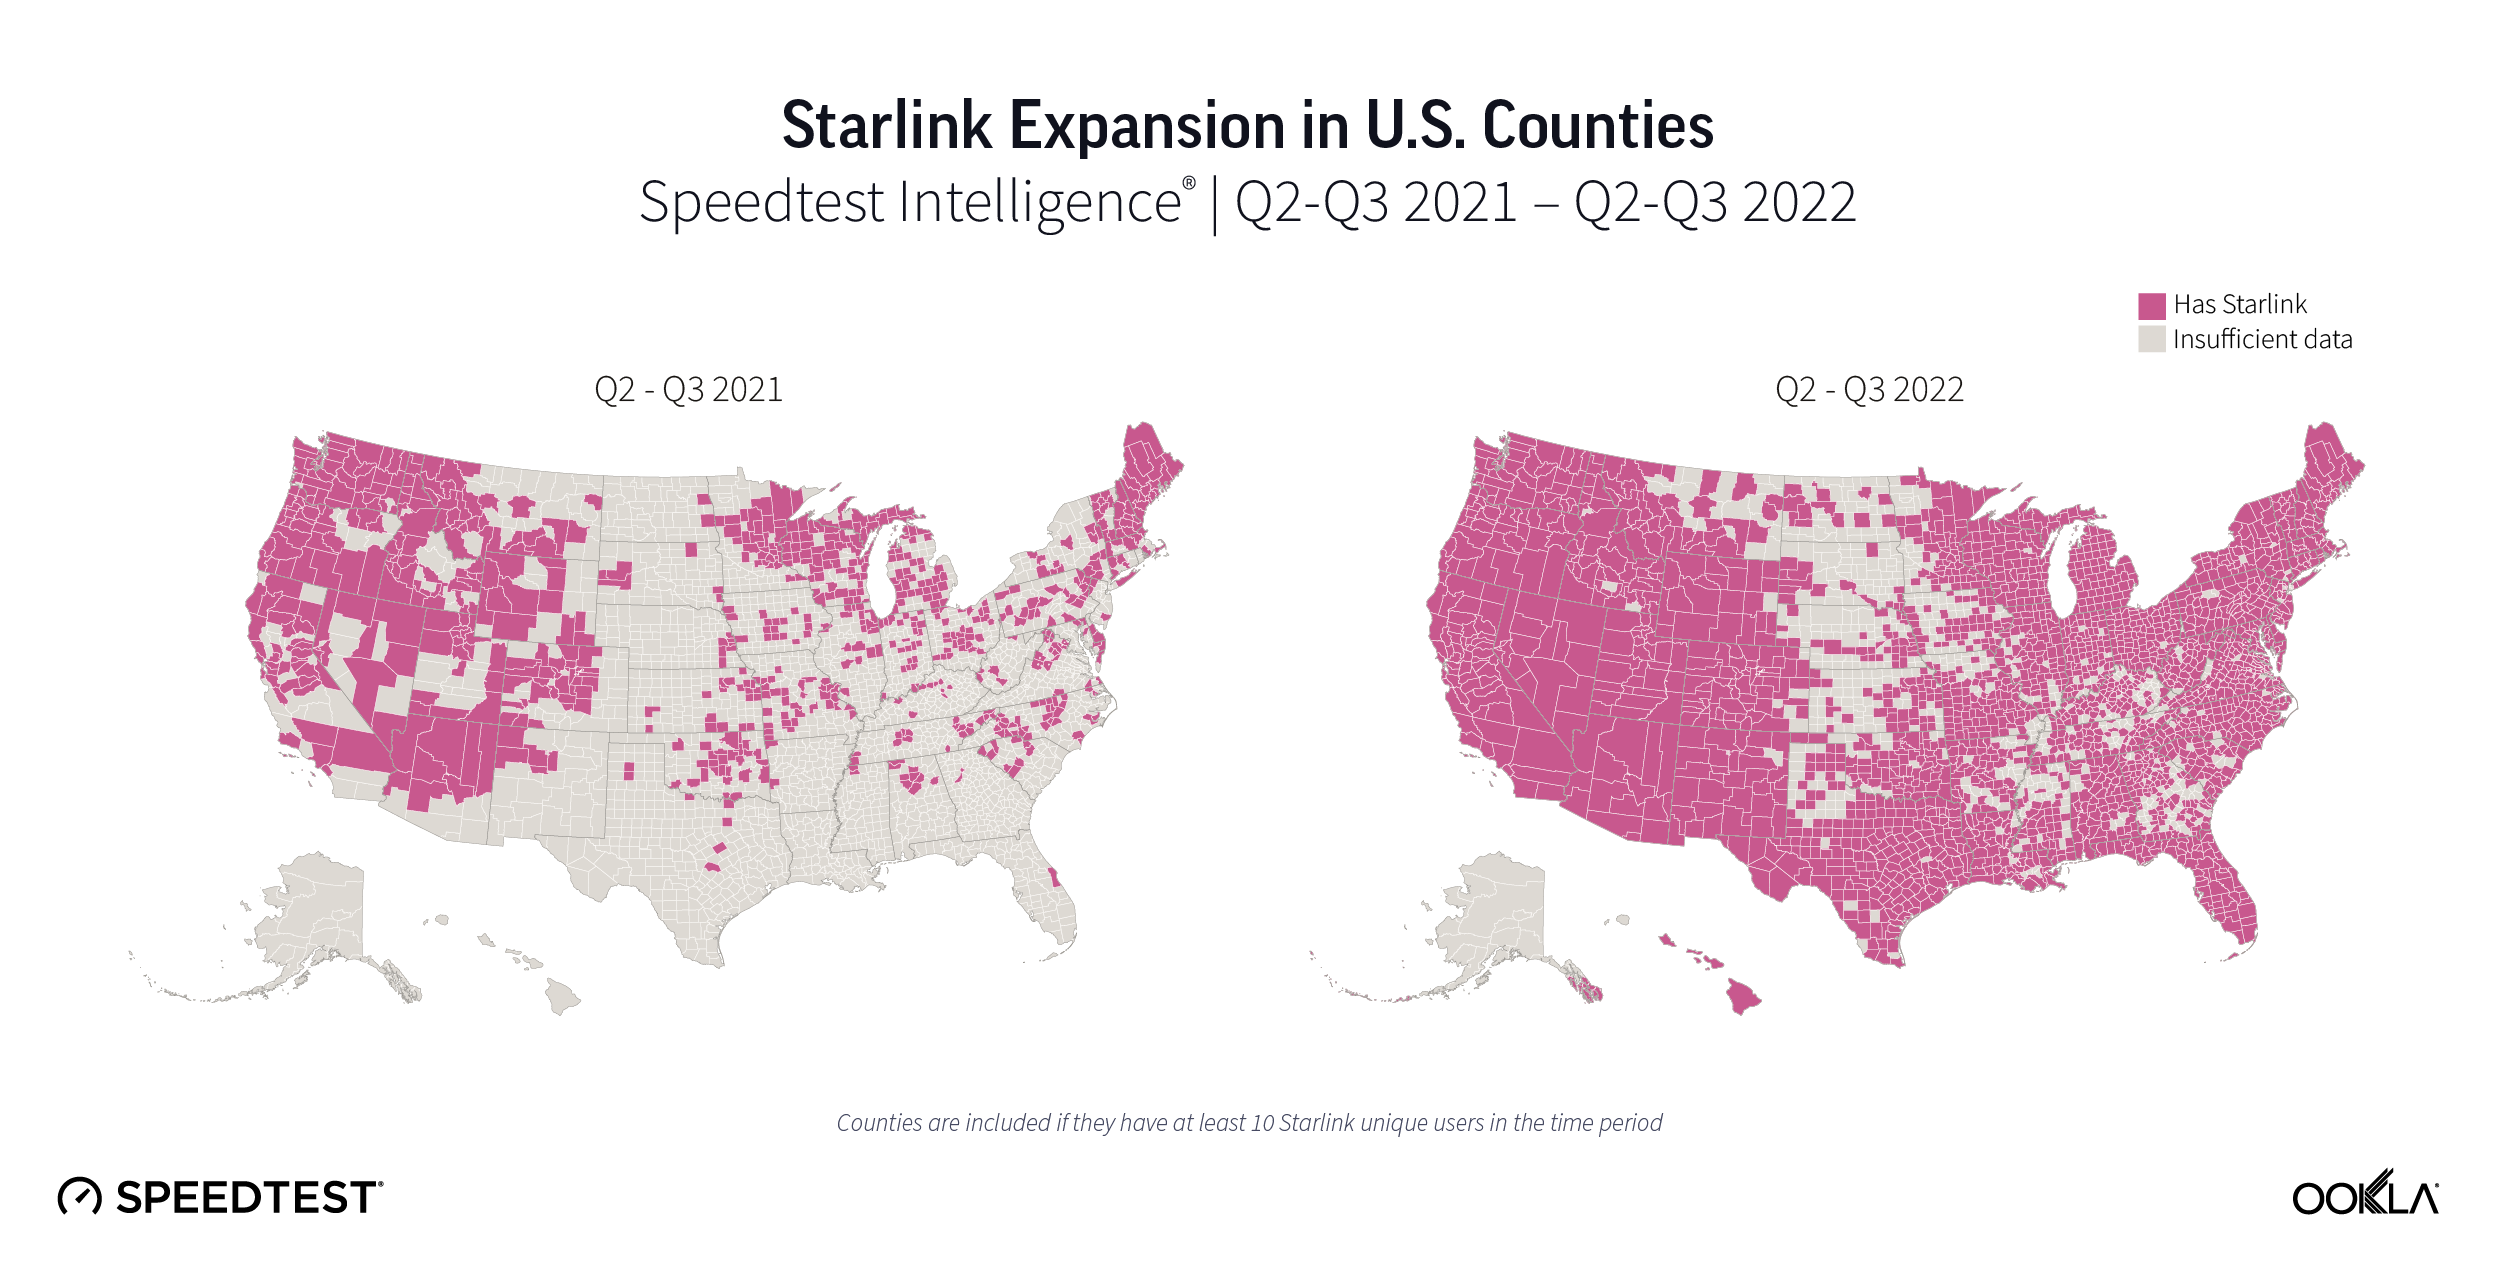
2022 saw a proliferation of fast, low-earth orbit (LEO) satellite internet from Starlink across the world. Q1 2022 saw Starlink speeds increase year over year in Canada and the U.S., with Starlink in Mexico having the fastest satellite internet in North America, Starlink in Lithuania the fastest in Europe, Starlink in Chile the fastest in South America, and Starlink in Australia the fastest in Oceania.

Q2 2022 saw Starlink speeds decrease in Canada, France, Germany, New Zealand, the U.K., and the U.S. from Q1 2022 as Starlink crossed the 400,000 user threshold across the world. Starlink in Puerto Rico debuted as the fastest satellite provider in North America. Starlink outperformed fixed broadband averages in 16 European countries. Starlink in Brazil had the fastest satellite speeds in South America. And Starlink in New Zealand was the fastest satellite provider in Oceania.

During Q3 2022, Starlink performance dipped once again from Q2 2022 in Canada and the U.S., while remaining about the same in Chile. Starlink in Puerto Rico and the U.S. Virgin Islands had the fastest satellite speeds in North America, while Starlink in Brazil again was the fastest satellite provider in South America.

With Viasat, HughesNet, and Project Kuiper set to launch huge LEO constellations in 2023, consumers around the world are poised to have more fast satellite internet options, particularly as the European Commission makes its own play for a constellation and Eutelsat and OneWeb potentially merging.

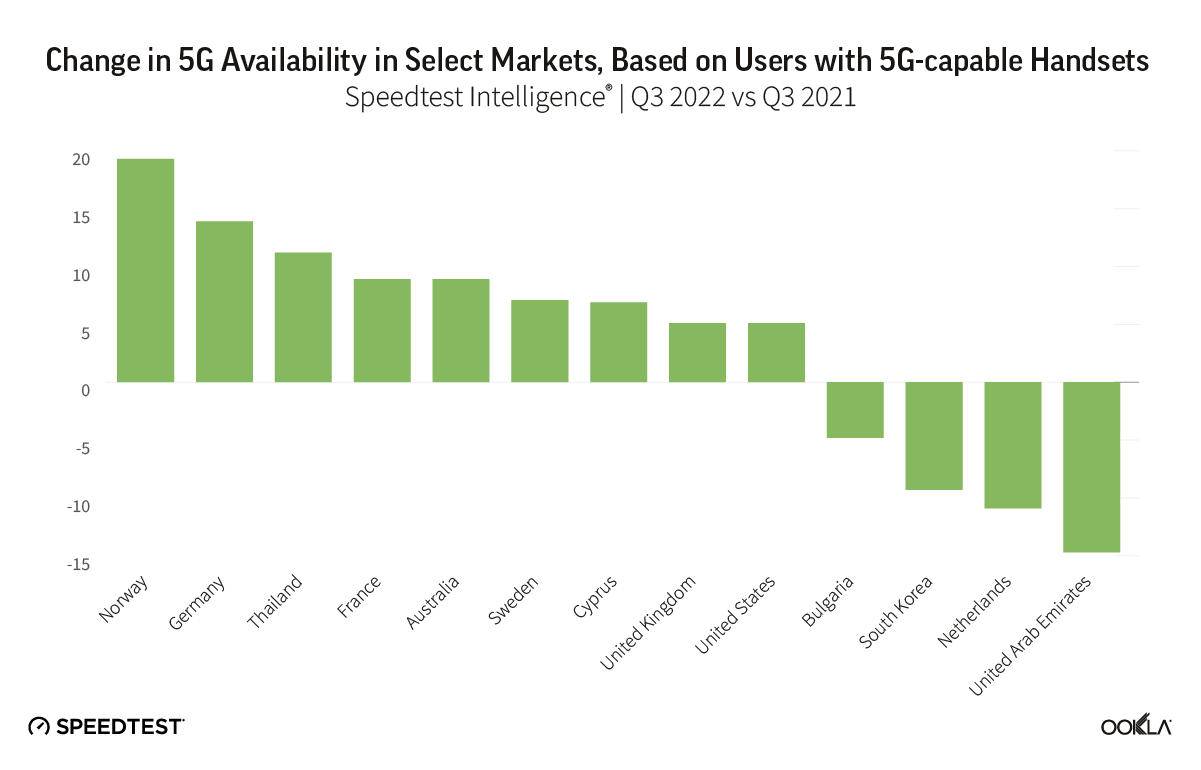
5G Availability points to on-going challenges

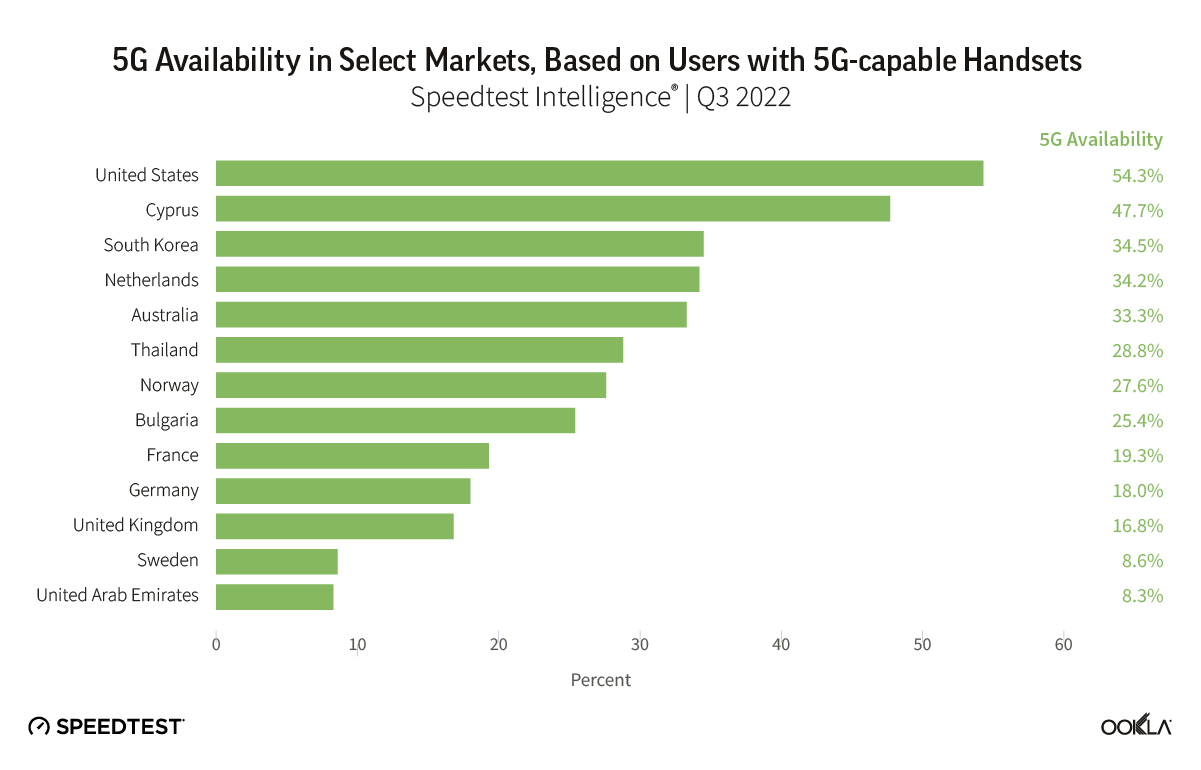
5G Availability measures the proportion of Speedtest users with 5G-capable handsets, who spend a majority of time connected to 5G networks. It’s therefore a function of 5G coverage and adoption. We see wide disparity in 5G Availability among markets worldwide, with for example the U.S. recording 54.3% in Q3 2022, well ahead of markets such as Sweden and the U.A.E., with 8.6% and 8.3% respectively.

Chart of 5G availability in select markets, based on users with 5G-capable handsets

Critical levers for mobile operators to increase 5G Availability include:

  • Increasing 5G coverage by deploying additional base stations
  • Obtaining access to, or refarming, sub-GHz spectrum, to help broaden 5G coverage, as sub-GHz spectrum has superior propagation properties than that of higher frequency spectrum bands.
  • Encouraging 5G adoption among users with 5G-capable handsets.

Speedtest Intelligence points to 5G adoption challenges in some markets, with 5G Availability dropping in Bulgaria, South Korea, the Netherlands, and the U.A.E. As more users acquire 5G-capable devices, operators need to balance their pricing models to ensure users have sufficient incentives to purchase a 5G tariff.

Chart of percentage change in 5G availability in select markets, based on users with 5G-capable handsets

Where 5G continues to fail to reach

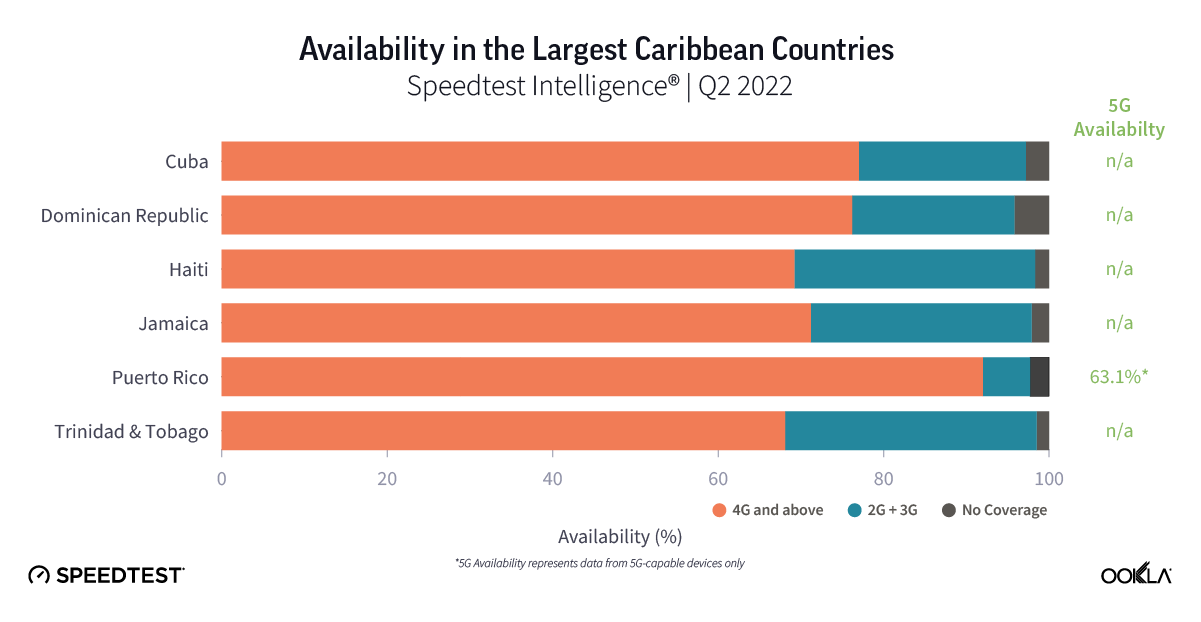
Speedtest Intelligence showed 29 countries in the world where more than 20% of samples were from 2G and 3G connections (combined) during Q3 2022 and met our statistical threshold to be included (down from 70 in Q3 2021). These are mostly countries where 5G is still aspirational for a majority of the population, which is being left behind technologically, having to rely on decades-old technologies that are only sufficient for basic voice and texting, social media, and navigation apps. We’re glad to see so many countries fall off this list, but having so many consumers on 2G and 3G also prevents mobile operators from making 4G and 5G networks more efficient. If operators and regulators are able to work to upgrade their users to 4G and higher, everyone will benefit.

Countries That Still Rely Heavily on 2G and 3G Connections
Speedtest IntelligenceⓇ | Q3 2021
Country 2G & 3G Samples
Central African Republic 76.2%
Turkmenistan 58.5%
Kiribati 51.6%
Micronesia 47.4%
Rwanda 41.1%
Belarus 39.7%
Equatorial Guinea 37.7%
Afghanistan 36.7%
Palestine 33.5%
Madagascar 27.5%
Sudan 27.4%
Lesotho 26.5%
South Sudan 26.3%
Benin 26.0%
Guinea 25.5%
Cape Verde 24.3%
Tonga 24.3%
Syria 23.4%
The Gambia 23.4%
Ghana 23.3%
Palau 22.9%
Niger 22.8%
Tajikistan 22.7%
Mozambique 22.4%
Guyana 21.8%
Togo 21.8%
Congo 21.1%
Moldova 20.8%
Saint Kitts and Nevis 20.0%

We were pleased to see the following countries come off the list from last year, having dropped below the 20% threshold: Algeria, Angola, Anguilla, Antigua and Barbuda, Armenia, Barbados, Bosnia and Herzegovina, Botswana, Burundi, Caribbean Netherlands, Cook Islands, Dominica, Ecuador, El Salvador, Ethiopia, Gabon, Grenada, Haiti, Honduras, Jamaica, Liberia, Mauritania, Namibia, Nigeria, Papua New Guinea, Saint Lucia, Saint Vincent and the Grenadines, Sierra Leone, Solomon Islands, Somalia, Suriname, Swaziland, Tanzania, Trinidad and Tobago, Uganda, Ukraine, Uzbekistan, Vanuatu, Venezuela, Yemen, Zambia, and Zimbabwe. While countries like Belarus, Cape Verde, Central African Republic, Guinea, Guyana, Madagascar, Palestine, Rwanda, South Sudan, Tajikistan, Togo, and Turkmenistan are still on this list, they have improved the percentage of their samples on these outmoded technologies when compared to last year by at least 10 points. Palestine improved by more than 50 points. 2G and 3G samples in Kiribati increased 3.2 points when comparing Q3 2022 to Q3 2021.

We’re glad to see performance levels normalize as 5G expands to more and more countries and access improves and we are optimistic that 2023 will bring further improvements. Keep track of how well your country is performing on Ookla’s Speedtest Global Index™ or track performance in thousands of cities worldwide with the Speedtest Performance Directory™.

Ookla retains ownership of this article including all of the intellectual property rights, data, content graphs and analysis. This article may not be quoted, reproduced, distributed or published for any commercial purpose without prior consent. Members of the press and others using the findings in this article for non-commercial purposes are welcome to publicly share and link to report information with attribution to Ookla.

| November 7, 2022

17 U.S. Airports With Supersonic Wi-Fi (And 12 that Are Still Stuck at the Gate)

The holiday travel season is fast approaching in the United States and with it the anticipation of spending more time than you’d hoped at the airport. To help you know whether you’ll have the speeds you need to freely stream videos or whether you’ll need to download those shows in advance, we’ve expanded our previous analysis to examine free airport Wi-Fi at 50 of the busiest airports in the U.S. We’ve also taken a look at some of the other Wi-Fi options available at airports across the country to see how you can get the best network experience (even if you have to pay for it).

Free Wi-Fi at 17 airports beat 100 Mbps

Chart of U.S. airports with over 100 Mbps internet speeds over free Wi-Fi

Speedtest Intelligence® shows Norman Y. Mineta San José International Airport, Cincinnati/Northern Kentucky International Airport, and San Francisco International Airport were among the fastest free airport Wi-Fi among the 50 busiest airports in the U.S. with median download speeds of 203.00 Mbps, 177.16 Mbps, and 162.38 Mbps, respectively, during Q3 2022. Daniel K. Inouye International Airport in Honolulu (158.05 Mbps) and Oakland International Airport (154.62 Mbps) rounded out the top five. All 17 of the airports at this performance level showed free airport Wi-Fi that’s capable of keeping the whole family entertained online for as long as your devices hold a charge.

Fort Lauderdale-Hollywood International Airport splits their free airport Wi-Fi among four separate SSIDs (the name of the network you log into), which we have listed separately in these results. The performance does not vary widely between them, but you will see that airport listed here and in the list below.

20 airports with 50-100 Mbps download speed over free airport Wi-Fi

Chart of U.S. airports with 50-100 Mbps internet speeds over free Wi-Fi

John Wayne Airport, two SSIDs at Fort Lauderdale-Hollywood, Detroit Metropolitan Airport, and Washington Dulles International Airport were at the top of the next performance tier for free airport Wi-Fi. Travelers at airports with Wi-Fi speeds in this range should have enough speed to adequately rebook flights as needed on one device while streaming distractions on another.

Note that Harry Reid International Airport in Las Vegas has two SSIDs on this list with comparable speeds. Philadelphia has a second SSID on the list below with a much lower speed, so you’ll want to make sure you’re connecting to “Free PHL Airport WiFi” when possible, rather than “Free PHL Airport WiFi-24”.

Pittsburgh and Houston have the slowest free airport Wi-Fi among 12 airports below 50 Mbps

Chart of U.S. airports with less than 50 Mbps internet speeds over free Wi-Fi

Internet performance might be an issue at airports on this lowest tier. While one device connected to a network that’s offering 20-40 Mbps might have no issues streaming 4K video, airports are notoriously high-volume places as travelers sit and wait for flights, mobile devices in hand for as long as it takes. The real issue is that on high traffic travel days (or worse, if there’s a weather delay) the connection might bog down. Airports at the bottom of our list — like Pittsburgh International Airport (5.23 Mbps median download speed) and George Bush Intercontinental Airport (8.79 Mbps) and William P. Hobby Airport (8.90 Mbps) in Houston — have the least leeway for performance to drop and still be usable, especially in an emergency situation when folks most want to connect.

Wi-Fi speeds decreased at four airports

Our most recent global analysis of free airport Wi-Fi included seven of these airports (over eight SSIDs, with Denver having two). The nominal download speed decreased when comparing Q1 2022 to Q3 2022 in four of those airports: Sea-Tac (32.06 Mbps drop), O’Hare (29.10 Mbps drop), Los Angeles (20.74 Mbps drop), and San Francisco (13.87 Mbps drop). Dallas/Fort Worth showed a 7.02 Mbps increase in median download speed over the same period. There was no meaningful difference in download speed between quarters at Hartsfield-Jackson and on both SSIDs at Denver. We generally expect speeds to improve over time as airports and internet service providers upgrade equipment. When airport Wi-Fi speeds decline we usually expect it’s due to that infrastructure not keeping up with increases in passenger volume or internet usage.

If you’re counting, you’ll see that we have data for 49 airports above, this is because there were insufficient samples at San Diego International Airport for us to analyze to our statistical standards.

Wi-Fi on other SSIDs

While most of the free airport Wi-Fi we saw had more than adequate speeds to do most things on your mobile device, there are other Wi-Fi options if you find that the free Wi-Fi is bogged down by too many users or if you just can’t find the popup to accept the terms and conditions required to connect to the local network. We looked at Speedtest® results across SSIDs to see if your best option might be Wi-Fi at an airport lounge or club or another option entirely.

Wi-Fi at airport lounges and clubs

We found Speedtest results for seven major airport lounge and club chains that serve a variety of airports. Wi-Fi is often free at these locations for folks who have paid for the privilege of lounge access, but median download speeds varied widely by airport within each brand so the Wi-Fi alone may not always be worth the price of admission.

The Alaska Lounge was the only lounge where we saw median download speeds in excess of 100 Mbps in all locations with sufficient samples to analyze, from 100.17 Mbps in Portland to 334.23 Mbps at LAX. The United Club showed everywhere from 57.98 Mbps at Dulles to 232.85 Mbps at SeaTac, and The Delta Sky Club ranged from 57.35 Mbps in Honolulu to 123.23 Mbps in Atlanta. American Airlines Lounge had median download speeds between 5.08 Mbps in Phoenix Sky Harbor and 74.94 Mbps at SFO and British Airways Lounge Wi-Fi download speed was between 25.00 Mbps at Dulles and 56.40 at Boston’s Logan Airport.

Non-airline lounges were equally variable with The Centurion Lounge featuring download speeds from 19.55 Mbps at SeaTac to 127.25 Mbps at George Bush Intercontinental, while The Club fluctuated from 12.90 Mbps in Orlando to 108.79 Mbps in New Orleans.

With such wide variations in Wi-Fi performance we can’t recommend any specific lounge. Your best bet is to take a Speedtest at your regular connections so you know what your options are next time you fly through.

Other Wi-Fi options

Of course there are still more companies that offer Wi-Fi at airports either as part of a tie-in with another business (like your mobile operator or credit card), by subscribing to a paid service, or as part of a larger deal with the airport. Our analysis turned up Speedtest results for three such Wi-Fi options at multiple airports in the U.S.: Boingo, Passpoint, and Skyfi. Median download speeds for Boingo were between 51.41 Mbps at LAX and 149.49 Mbps at Oakland. Passpoint Wi-Fi download speeds showed a low of 10.15 Mbps in Miami and a high of 106.59 Mbps in Oakland. And Skyfi’s median download speeds ranged between 50.15 Mbps in Orlando and 100.04 at LAX. It’s worth checking out which other Wi-Fi services you might have access to before you leave the house.

Overall, travelers should be pleased with the news on airport Wi-Fi in the U.S. Speeds are mostly good and there are a lot of options for travelers if one network gets crowded. Now you just have to remember to charge your devices before you pack them. If you’re traveling this holiday season, download the Speedtest app for Android or iOS before you go, then take a Speedtest at the airport to see how your experience compares.

Ookla retains ownership of this article including all of the intellectual property rights, data, content graphs and analysis. This article may not be quoted, reproduced, distributed or published for any commercial purpose without prior consent. Members of the press and others using the findings in this article for non-commercial purposes are welcome to publicly share and link to report information with attribution to Ookla.

| September 15, 2022

College Towns Where Internet Speeds Make the Grade (And Where They Fail)

It’s back to school time in the United States, and for many freshmen that means traveling to a brand new town to start your education. To help you know if the internet will be a help or a hindrance as you earn your degree, we analyzed internet performance in 100 college towns across the U.S. This list includes Speedtest Intelligence® data on median download and upload speeds from 100 towns with a large percentage of students where college is a major part of the industry.

While we worked to include a wide variety of college towns on our list, the list is far from comprehensive. If you’d like to see your school on the list next year, please take a Speedtest® then send your result to us via Twitter or Facebook. You can also start your college life on a responsible note by using our new Speedtest Performance Directory™ to check out expected speeds for internet service providers before you sign up for an extended contract.

College towns with the best (and worst) internet speeds

If you started your college search by looking for the top of the top, you’ll relate to the next three sections that highlight the college towns with the fastest speeds on 5G, all mobile technologies combined, and fixed broadband. By choosing a school in a town with great internet speeds, you’re giving yourself access to the fastest streaming and gaming experiences (and good performance for any online classes to boot). We’ve also included the locations with the slowest speeds. While you’ll see college towns broken out by population later in this article, these three sections combined data from all 100 schools on our list.

College towns with A+ and F- 5G speeds

Map of best and worst college towns for 5G speeds

With median download speeds over 300 Mbps, Manhattan, Kansas; Clemson, South Carolina; and College Park, Maryland topped our list of college towns with the fastest 5G in the U.S. during Q2 2022. Auburn, Alabama and Troy, New York rounded out the top five. Students in these places have every advantage when using 5G phones for school or play.

On the other end of the spectrum, Bowling Green, Kentucky; Fayetteville, Arkansas; Blacksburg, Virginia; Cheney, Washington; and Morgantown, West Virginia had the slowest download speeds over 5G. Students in these locations may want to consider if 5G is even worth the extra investment. Check the lists below to see how 5G performance compares to mobile performance on all technologies. It’s likely that the 5G performance will get better with time, but there’s no need to stretch your budget for a service that isn’t delivering in your area.

Overall mobile performance in college towns is sufficient

Map of best and worst college towns for mobile speeds

Tigers rejoice, because Clemson, South Carolina was among the fastest college towns for mobile on our list with a median download speed of 175.77 Mbps during Q2 2022. Tempe, Arizona; Kent, Ohio; College Park, Maryland; and Providence, Rhode Island filled out the top five. These towns all have excellent download speeds, far ahead of the 59.89 Mbps median mobile download speed in the U.S. during July 2022, according to the Speedtest Global Index™. In all, 52 of the college towns on our list showed a median download speed above this during Q2 2022.

Bennington, Vermont; Socorro, New Mexico; Kearney, Nebraska; Bowling Green, Kentucky; and Hanover, New Hampshire had the slowest download speeds on our list. While the download speeds in these places should be adequate for most phone uses, you probably won’t want to rely on tethering your mobile device to your computer for internet access.

Most college towns have acceptable fixed broadband speeds

Map of best and worst college towns for fixed broadband speeds

Grambling, Louisiana topped our list of college towns with a median download speed over fixed broadband of 333.65 Mbps during Q2 2022. Home to the HBCU Grambling State University, Grambling is a small town in north central Louisiana, and Grambling was 14% faster than Murfreesboro, Tennessee, the next fastest college town. Dover, Delaware; Chapel Hill, North Carolina; and Manchester, New Hampshire completed our list of top five fastest college towns for fixed broadband. Forty-seven out of the 100 college towns on our list had a Q2 2022 median download speed over fixed broadband that was faster than the median for the U.S. (159.31 Mbps) in July 2022, according to the Speedtest Global Index.

The slowest college towns on our list were Socorro, New Mexico; Cheney, Washington; Oberlin, Ohio; Tuskegee, Alabama; and Brookings, South Dakota. While the download speed in all but Socorro is within the acceptable range for most uses, anyone connecting more than one device at a time to a router (hello roommates!) is going to struggle with internet performance in these places.

Internet performance in large college towns

Everyone has a different college dream. Our “large college towns” list is for students who want more of a city experience than a town, with 19 locations that have 100,000 or more residents but still retain that college town feel. If your favorite college town is actually a suburb of a larger metropolitan area, look for that list below.

Chart of internet performance in large college towns in the U.S.

Manchester, New Hampshire; Huntsville, Alabama; Lincoln, Nebraska; and Providence, Rhode Island form the top of the list for large college towns with fast median download speeds over fixed broadband during Q2 2022. All four are home to multiple colleges and universities whose students can benefit from these super fast speeds. Even Columbia, Missouri, the place with the lowest median download speed on this list, exceeds the FCC minimum recommendation for broadband of 25 Mbps download. However, 10 of the cities on this list had lower speeds than the U.S. median of 159.31 Mbps in July 2022.

On mobile, Tempe, Arizona and Providence, Rhode Island had the fastest median download speeds among our large college towns list during Q2 2022. In all, eight of the colleges on this list had a median download speed over mobile during Q2 2022 that exceeded the U.S. median of 59.89 Mbps during July 2022. College Station, Texas; Fayetteville, Arkansas; Lincoln, Nebraska; Macon, Georgia; and Columbia, Missouri had the lowest mobile speeds on our list of large college towns, each coming in below 50 Mbps for median download speed.

Medium-sized college towns with fast internet speeds

Chart of internet performance in medium-sized college towns in the U.S.

College students looking for a slightly slower lifestyle might enjoy our medium-sized college town list. This list includes 26 locations where college is a major industry, there are 50,000-100,000 residents, and the city is not part of another metropolitan area.

Dover, Delaware; Jonesboro, Arkansas; and Rock Hill, South Carolina top the list of medium-sized college towns with fast fixed broadband speeds during Q2 2022. Eleven of the 26 places on this list exceeded the median download speed for fixed broadband in the U.S. (159.31 Mbps) during July 2022. Conway, Arkansas; Grand Forks, North Dakota; and Lawrence, Kansas had the slowest median download speeds over fixed broadband on this list during Q2 2022. While all three cities showed faster speeds than the FCC recommendation of 25 Mbps, students looking to use more than one device at a time (or to share an internet connection) may soon find the limits of these speeds.

Dover, Delaware led for mobile download speed on our list of medium-sized college towns during Q2 2022. Only nine of 26 places showed a faster median download speed over mobile during Q2 2022 than the U.S. median of 59.89 Mbps in July 2022. Bowling Green, Kentucky and Bozeman, Montana had the slowest median download speeds over mobile on this list. The speeds in these two places are still sufficient for ordinary use, but students will likely want to rely on fixed broadband for activities that require better performance (like opening 100 tabs to research a paper).

Small college towns with big internet performance

Chart of internet performance in small college towns in the U.S.

If you’ve always dreamed of living in a small town where the entire community seems to revolve around college life, our list of 29 small college towns might be where your heart lies. This list includes places with fewer than 50,000 residents where the college makes up a large part of the economy and the towns aren’t counted as part of a larger metropolitan area.

The Tigers led for fixed broadband and mobile speeds with Grambling, Louisiana (home of Grambling State University) easily topping the list of small college towns with fast fixed broadband (with a median download speed of 333.65 Mbps during Q2 2022). On the mobile side, Clemson, South Carolina (home of Clemson University) eclipsed the competition for download speed with a median of 175.77 Mbps.

Only eight of the 29 small college towns on our list bested the 159.31 Mbps median download speed for fixed broadband in the U.S. during July 2022. For mobile, 11 small college towns exceeded the 59.89 Mbps median download speed for the U.S.

Socorro, New Mexico had the slowest median download speed over fixed broadband by far, well under the FCC suggested 25 Mbps, and Socorro also placed among the slowest for mobile download speed. Looking at mobile, Bennington, Vermont had the lowest median download speed among small college towns. Students with mobile speeds this slow may need to lean heavily on their fixed broadband for both study and play.

Suburban college towns benefit from big city internet infrastructure

Chart of internet performance in suburban college towns in the U.S.

Sometimes you want a college town experience with easy access to the amenities of a big city. That’s where our list of suburban college towns comes in; large or small, each of the 26 places on this list is college-driven but is also close enough to (or part of) a major metropolitan area.

Murfreesboro, Tennessee; Chapel Hill, North Carolina; and New Brunswick, New Jersey had the fastest median download speeds on fixed broadband among our list of suburban college towns during Q2 2022. Kent, Ohio; College Park, Maryland; Troy, New York; and Waukesha, Wisconsin topped our list of mobile speeds in suburban college towns, each coming in with a median download speed above 100 Mbps during Q2 2022.

Proximity to the big city pays off for most of these locations with 16 of 26 suburban college towns showing a Q2 2022 median download speed faster than the 159.31 Mbps median for the U.S. during July 2022. The big city infrastructure effect was even more evident for mobile with 24 of 26 suburban college towns beating the 59.89 Mbps U.S. median for mobile speeds during July 2022.

Oberlin, Ohio had the slowest download speed by far of the suburban college towns we analyzed. While the 56.76 Mbps median speed beats the FCC broadband threshold of 25 Mbps, two or more devices trying to use a connection at that speed could struggle with mission critical activities like video calls home to the parents or the ex you left behind. Oberlin also placed at the bottom for mobile speeds along with Madison, New Jersey, the only two suburban college towns not to exceed the U.S. median.

We were pleased, for the most part, with the internet and mobile speeds we saw in U.S. college towns. There are a lot of options for schools in towns with fast connections and a couple where you could fall off the grid (should you so choose). Did we leave your college town off our list or are you seeing a radically different result in your college town? Take a Speedtest® on Android or iOS and tweet us your feedback. You can also check month-by-month performance for your town and compare expected speeds for internet providers in our new Speedtest Performance Directory.

Ookla retains ownership of this article including all of the intellectual property rights, data, content graphs and analysis. This article may not be quoted, reproduced, distributed or published for any commercial purpose without prior consent. Members of the press and others using the findings in this article for non-commercial purposes are welcome to publicly share and link to report information with attribution to Ookla.

| August 2, 2022

Find Out Which 50 Top European Vacation Destinations Have the Fastest Mobile Internet Speeds

Vacation season is upon us with millions of tourists already flocking to Europe’s top summer destinations despite the heat. Whether you’re a European looking for the best “staycation” or an American taking advantage of the exchange rates, our analysis of mobile internet performance in 50 popular destinations across the continent should help you see how well you will be able to connect (or disconnect, should you so choose) on vacation this summer.

We divided these towns and cities into four categories that might appeal to different types of travelers: big cities, beach life, cultural havens, and forest getaways. Then we compared Speedtest Intelligence® data for median download speeds and multi-server latency across each category. Of course many of the best vacation destinations belong in multiple categories, so be sure to check each list to find your favorite locale, and you’ll want to remember that your experience may vary based on your carrier’s roaming agreement.

“Big cities” with internet performance as exciting as the lifestyle

Oslo, Norway topped our list of 15 European vacation destinations full of big city excitement with the fastest mobile internet with a median download speed of 156.99 Mbps during Q2 2022. Perfect if you’re planning to do live updates from the Øya Festival. Two other Nordic cities rounded out the top three with Stockholm, Sweden showing a median download speed of 136.74 Mbps and Copenhagen, Denmark coming in at 133.16 Mbps. With speeds like these you should be able to host as many “see how glorious my vacation is?” video calls as you want.

There was a large gap between these three cities and the next fastest group, led by Lisbon, Portugal at 86.49 Mbps. Istanbul, Turkey and Rome, Italy had the lowest median download speeds on this list. These are still adequate mobile speeds, especially if you want to lean into the vacation experience and report back on it later (if ever).

Nicosia, Cyprus had the lowest median multi-server latency on our “big city” list at 17 ms during Q2 2022. This metric measures how quickly your device gets a response after you’ve sent out a request during three stages so you can understand if you’ll run into unnecessary lags in your connection. We’ve previously reported how latency in Europe increased while roaming, and higher latency could mean that you encounter glitches in video calls or even have to shut down apps to get your phone to respond in a timely fashion. Rome had the highest latency on this list.

Where internet speeds are fit for “beach life”

Nothing says summer like relaxing on the beach. If your beach vacation needs fast internet access, surf the web in Biarritz, France and Korčula, Croatia. These two locales had the fastest median download speeds on our beach life list during Q2 2022 at 155.65 Mbps and 133.67 Mbps, respectively, though this is not a statistically significant difference. Varna, Bulgaria and Faro, Portugal rounded out the top four at 104.00 Mbps and 101.74 Mbps, respectively.

Amalfi, Italy and Cefalù, Italy are good beach destinations if you’re looking for encouragement to log off. With median download speeds of 31.40 Mbps and 38.18 Mbps, respectively, during Q2 2022, your internet connection should be adequate (though less inspiring than the Tyrrhenian Sea).

Piran, Slovenia had the lowest median multi-server latency (20 ms) on this list while Cefalù had the highest (56 ms).

“Cultural havens” with research-ready internet speeds

Travelers looking for maximum culture and fast internet speeds can do no better than Tromsø, Norway, which had a median download speed on mobile of 251.52 Mbps during Q2 2022, almost 2.3x faster than runner-up Amsterdam, Netherlands. Whether you’ve traveled to the northernmost bit of Norway for the wooden houses, one of the many summer festivals, or just to escape the heat, you’ll have fast enough internet to thoroughly research all the places you can go if you extend your vacation.

At the other end of the spectrum, if you’re traveling to Yerevan, Armenia or Florence, Italy to enjoy the museums and other cultural highlights of either, you might want to take pictures instead. With median download speeds of 24.11 Mbps and 29.84 Mbps, respectively, these cities were the slowest on this list. All the more reason to immerse yourself in the sights and wait to connect to Wi-Fi before uploading your photos.

Helsingør, Denmark had the lowest median multi-server latency, while Edinburgh, Scotland, United Kingdom had the highest. High latency can impede the performance of your phone even when you’re in an area with great speeds — something to keep in mind if you’re relying on your phone to locate the next Fringe venue.

Navigate internet speeds in “forest getaways”

Some people swear by the forest for the best vacations, especially in the heat of summer. The Alpine cities of Innsbruck, Austria and Digne-les-Bains, France had the fastest median download speeds over mobile on our list of forest getaways during Q2 2022 at 87.34 Mbps and 67.30 Mbps, respectively, though there was no statistical winner between the two. There was also no statistically significant difference between the median download speeds in Zakopane, Poland (43.52 Mbps); Killarney, Ireland (35.90 Mbps); and Sighișoara, Romania (30.48 Mbps). While you may prefer to be offline in the woods, having a strong and fast internet connection available can help you navigate with GPS, check out the names of all the flora you’re encountering, or reach help in case of emergency.

Sighișoara and Killarney had the lowest median multi-server latency on this list at 24 ms and 25 ms, respectively. Digne had the highest latency at 36 ms.

Regardless of where you travel, mobile internet performance will affect your trip. We hope this list prepares you for the getaway you want. If we missed your favorite European vacation destination, take a Speedtest® on Android or iOS to show off your speeds and tweet us your suggestions for next year’s list or share your ideas via this Google form.

Ookla retains ownership of this article including all of the intellectual property rights, data, content graphs and analysis. This article may not be quoted, reproduced, distributed or published for any commercial purpose without prior consent. Members of the press and others using the findings in this article for non-commercial purposes are welcome to publicly share and link to report information with attribution to Ookla.

| July 12, 2022

Caribbean Advances Toward Digital Future but Some Are Left Behind

Mobile connectivity in the Caribbean is a growth industry with 28 million unique mobile subscribers as of Q2 2022, a market penetration of 63.7%, according to the GSMA, short of the global market penetration of 67.1%. Additionally, few Caribbean markets have 5G. In advance of the CANTO conference on July 17, we examined Q2 2022 data from the five most populous Caribbean countries as well as Puerto Rico to see how initiatives to enable digital evolution and transformation are progressing. We looked at country-level performance data as well as mobile availability statistics in each country.

Mobile performance varies widely across the Caribbean

At 46.84 Mbps, Puerto Rico had the fastest median mobile download speed by far when comparing the most populous Caribbean countries during Q2 2022 using Speedtest Intelligence®. This was at least a 43% improvement over Q2 2021. 5G is a big differentiator with only Puerto Rico and the Dominican Republic having commercial availability for 5G according to the Ookla® 5G Map and Trinidad and Tobago showing only limited 5G Availability. Puerto Rico was 35% faster for download speed than Jamaica, which fared well for median download speed, coming in second on this list at 32.77 Mbps, at least 20% faster than in Q2 2021. Trinidad and Tobago (27.57 Mbps), the Dominican Republic (19.67 Mbps), and Haiti (12.83 Mbps) followed. Cuba was far behind the other countries on this list with a mobile download speed of 5.78 Mbps, at least a 162% drop from Q2 2021.

Chart of mobile speeds in Caribbean countries

Trinidad and Tobago had the fastest median mobile upload speed among the most populous Caribbean countries during Q2 2022. At 10.54 Mbps, Trinidad and Tobago’s mobile upload speed was 24% faster than that in Jamaica (8.34 Mbps) and up at least 6% over Q2 2021. Puerto Rico (7.48 Mbps) followed, then Haiti (6.94 Mbps), the Dominican Republic (6.87 Mbps), and Cuba (3.71 Mbps). Cuba’s median upload speed was down at least 117% when comparing Q2 2021 to Q2 2022.

Chart of latency in Caribbean Countries

Trinidad and Tobago had the lowest median multi-server latency on our list during Q2 2022 at 33 ms followed by the Dominican Republic (52 ms), Jamaica (60 ms), Haiti (86 ms), Puerto Rico (89 ms). At 141 ms, Cuba’s latency was the highest.

Availability shows some populations are stuck with decades-old technologies

Data from Speedtest Intelligence in Q2 2022 shows that Puerto Rico had a 5G Availability, the proportion of users with 5G-capable devices who spend the majority of their time on 5G, of 63.1%. While we also saw 5G results in the Dominican Republic, there were insufficient 5G samples in the Dominican Republic to reliably analyze.

Chart of availability in Caribbean countries

Puerto Rico had the highest 4G Availability, the proportion of users who spend the majority of their time on 4G and above, among the most populous Caribbean countries at 92.0%. Cuba followed at 77.0%, then the Dominican Republic (76.2%), Jamaica (71.2%), Haiti (69.2%), and Trinidad and Tobago (68.1%).

Unfortunately, the other countries show a large number of users who are still relying on legacy mobile technologies. 3G and 2G are only sufficient for basic uses including: voice and texting, social media, and navigation apps. Users who want rich media experiences or video calling need access to 4G or higher.

2G and 3G Availability, the proportion of users who spend the majority of their time on 2G and 3G, was higher in Haiti (29.1%) and Trinidad and Tobago (30.4%) during Q2 2022 with no statistical difference between the two. Jamaica closely followed at 26.7%, then Cuba (20.2%), the Dominican Republic (19.6%), and Puerto Rico (5.7%) where both Liberty Mobile and T-Mobile have both recently sunsetted their 3G networks. Affordability of new handsets and more expensive subscription tiers could play a role in slow upgrades.

The Caribbean is certainly an exciting and growing telecom market. We’ll be interested to see what new initiatives come out of CANTO and how they help consumers in the region get closer to a digital future. Please stop by Booth 22 at CANTO to visit with us and discuss local provider performance and more.

Ookla retains ownership of this article including all of the intellectual property rights, data, content graphs and analysis. This article may not be quoted, reproduced, distributed or published for any commercial purpose without prior consent. Members of the press and others using the findings in this article for non-commercial purposes are welcome to publicly share and link to report information with attribution to Ookla.

| July 11, 2022

More Consumers are “Always On” Your Network, Here’s What They Need From You

We know the COVID-19 pandemic changed mobile user behavior, but new research commissioned by Ookla® shows just how much more consumers came to rely on their mobile connections. Ookla conducted a survey of five thousand mobile phone users from a diversity of demographic groups across Switzerland, the United Kingdom, and the United States to learn more about how they use their devices and how they view their mobile operators. Computer Weekly recently shared a look at what this looked like in the U.K. For this article, we’ve paired this information with Speedtest® data on consumer sentiment in all three countries to get a full picture of what consumers expect from their mobile operators today.

Key takeaways:

  • The percentage of consumers who describe themselves as always online grew from 30% to 69%.
  • Fewer than two-thirds of respondents are satisfied with customer service with “always on” customers at least twice as likely to report issues with customer service.
  • “Always on” consumers have different support needs, prioritizing a more well-rounded customer service experience.
  • Nearly half (47.4%) of customers who have had customer service issues in the past 18 months are likely to want to switch to another operator.

Increasing numbers of mobile customers are “always on”

The number of mobile customers who described themselves as always online grew from 30% in November 2019 to 69% in November 2021. Whereas consumers used to put down their phones for a variety of reasons, “always on” users are online for a variety of economic reasons (accessing customers and generating business, traffic information and remote working, social media, and information sharing) and lifestyle reasons (parenting and caregiving, health and fitness, and gaming). It’s no surprise then, that these valuable customers need reliable networks to keep up with the demands of their mobile internet use.

Chart of how more users are "always on" comparing 2019 versus 2021

Between 2019 and 2021 we saw a drop in users who were only “always on” for only economic reasons from 16% to 7%. Meanwhile, users who were “always on” for lifestyle reasons grew from 3% to 32%. The largest increases were in users who were “always on” for economic and lifestyle reasons.

Fewer than two-thirds of respondents satisfied with customer service

The 2020 American Customer Satisfaction Index found the telecom industry lags significantly in customer satisfaction. While customer service could be a key component of improving customer satisfaction, our survey revealed that fewer than two-thirds of respondents were satisfied with the customer service they received. Wait time had the lowest proportion of satisfied respondents (51%) while clarity of communication and multiple options for contact had the highest (62%). In addition, an operator-by-operator analysis showed that between 10% and 25% of customers of each operator had to submit a formal complaint. This obviously leaves significant room for improvement.

Chart of net satisfaction with operator customer service

“Always on” users have different support needs

With more customers categorizing themselves online all the time, it’s increasingly important that their network be available whenever they need it. It is also vital that they get the kind of customer support they need when they encounter a problem.

Chart of top three rated components of customer satisfaction

We asked respondents to rank the top three components of customer satisfaction that make for good customer service. While customers who are not “always on” are looking for well trained staff, a quick resolution, and clear communication, “always on” users are looking for a more well-rounded customer service experience. “Always on” users also prioritize short wait times, clear paths to resolution, multiple methods of communication, and that they feel valued as a customer.

This means operators with a robust support network that customers can comprehend and access in the ways that they prefer to communicate will win the customer service race — and consequently, customer retention. Our clients have seen this already with Spatialbuzz™, which allows mobile operators to identify, prioritize, and diagnose customer dissatisfaction areas in real time with quick, actionable resolutions.

“Always on” customers experience more problems with customer service

Chart of percentage of users who report customer service issues

“Always on” respondents in all three countries were at least twice as likely to report issues with customer service. The difference was especially pronounced in the U.K. where “always on” users were more than three times as likely to report customer service issues than their counterparts. This, plus the growth in the number of “always on” customers, poses a difficulty for mobile operators whose customer support programs have not evolved to meet these changing needs. If operators want to retain these key customers, there is work to be done.

Users who contact customer service are still likely to churn

The fact that customer service is a key factor in customer retention is no surprise, still our survey revealed that nearly half (47.4%) of customers who have had customer service issues in the past 18 months are likely to want to switch to another operator. The data tells us that even when issues are resolved, customers are often not satisfied with how they have been dealt with and still consider switching.

Infographic comparing customer satisfaction and likelihood to churn

Respondents in the U.S. were the most likely to consider switching (24-37%, depending on operator). Customers in the U.K. were open to switching (25%, 29%, 29%, and 32%, depending on operator) and those in Switzerland were slightly less likely to consider switching (25, 27%, and 32%, depending on operator).

As important as adequate customer service is, it’s clear that mobile operators need to meet customers’ needs before they have to resort to customer service. Providing a high level of network performance is important to this as is checking in with consumer sentiment, especially as consumers’ habits shift toward being “always on.”

Solving customer issues is not enough to retain your customer base. Those issues need to be resolved with care through clear communication and expertise in a timely manner. To learn more about Consumer SentimentTM data or how Spatialbuzz could help you connect with in-need customers faster and more efficiently, contact us.

Ookla retains ownership of this article including all of the intellectual property rights, data, content graphs and analysis. This article may not be quoted, reproduced, distributed or published for any commercial purpose without prior consent. Members of the press and others using the findings in this article for non-commercial purposes are welcome to publicly share and link to report information with attribution to Ookla.

| June 6, 2022

Analyzing Time of Day Internet Usage During Ramadan

Arabic | Français | Bahasa Indonesia | Bahasa Malaysia

Muslims across the world recently observed the month of Ramadan. During this sacred time, observing Muslims abstain from eating and drinking sunrise to sunset, acts of charity are encouraged, and work hours are often shortened. People often gather with friends and family during the evening meal, iftar, and new entertainment programming is often released for people to enjoy together. We were curious how this observance affected internet usage, so we analyzed Speedtest Intelligence® data from a variety of Muslim-majority countries around the world. We looked specifically at test volume during local fast times and iftar (when the fast is broken) and how those numbers compared to test volume during the month prior. 

Only some countries showed fewer tests during fast times

We analyzed Speedtest Intelligence data from Algeria, Bangladesh, Egypt, Indonesia, Malaysia, Morocco, Pakistan, Saudi Arabia, Somalia, Sudan, Tunisia, and Turkey during Ramadan to see how the distribution of Speedtest results between fast and iftar times varied by country. It should be noted that while all of the countries we surveyed have a majority Muslim population, the percentage of the population that is Muslim (and therefore likely to observe Ramadan) varies from Somalia (99.8%) to Malaysia (61.3%). 

Internet usage patterns changed during Ramadan 

Speedtest Intelligence showed that testing behavior changed during Ramadan when compared with the month prior. There was a decrease in the percentage of tests completed in the daytime between Ramadan and the month prior in all of the countries we surveyed. Somalia, Algeria, Saudi Arabia, and Tunisia showed the highest change in trends of daytime Speedtest results when comparing the fasting part of the day during Ramadan to daytime during the month prior. Malaysia, Bangladesh, Turkey, Indonesia, and Pakistan showed the smallest difference between the two periods. 

There was also an increase in the percentage of Speedtest results from iftar when comparing Ramadan to the month prior. Somalia and Algeria saw the largest increase when compared with the month prior. Malaysia, Bangladesh, Turkey, and Pakistan saw the smallest increases. This corresponds with the idea that people shift their online activity to iftar during Ramadan, connecting with friends and family, donating to charity, and enjoying the variety of new shows that networks release to coincide with the holiday.

This is a good reminder that every country has special events that their network operators need to prepare in advance for as we saw recently with Expo 2020 Dubai. If you’re interested in coverage of major network events from around the world, subscribe to Ookla® InsightsTM.


Analyse de l’utilisation d’internet en journée durant le Ramadan

Les Musulmans du monde entier ont récemment observé le mois du Ramadan. Pendant ce temps sacré, les Musulmans pratiquants ne mangent pas et ne boivent pas de l’aube au coucher du soleil, les actes de charité sont encouragés et les heures de travail sont souvent réduites. Les gens se retrouvent fréquemment entre amis et en famille pour le repas du soir, l’iftar, et de nouveaux programmes de divertissement sont souvent diffusés pour que les gens puissent en profiter ensemble. Nous étions curieux de savoir comment cette observance affectait l’utilisation d’Internet. Nous avons donc analysé les données de Speedtest Intelligence® provenant de divers pays à majorité musulmane dans le monde. Nous avons particulièrement examiné le volume des tests pendant les heures de jeûne locales et l’iftar (lorsque le jeûne est rompu), puis nous avons comparé ces chiffres au volume des tests du mois précédent.

Seuls quelques pays témoignent d’une réduction de tests pendant les périodes de jeûne

Nous avons analysé les données de Speedtest Intelligence provenant d’Algérie, du Bangladesh, d’Égypte, d’Indonésie, de Malaisie, du Maroc, du Pakistan, d’Arabie Saoudite, de Somalie, du Soudan, de Tunisie et de Turquie pendant le Ramadan pour voir comment la répartition des résultats de Speedtest entre les heures de jeûne et l’iftar variait selon les pays. Il convient de noter que si tous les pays étudiés ont une population majoritairement Musulmane, le pourcentage de la population Musulmane (et donc susceptible d’observer le ramadan) varie de la Somalie (99,8 %) à la Malaisie (61,3 %).

La Turquie, le Bangladesh, la Malaisie, l’Indonésie et le Pakistan ont montré un pourcentage plus élevé de résultats Speedtest pendant le jeûne que pendant l’iftar tout au long du Ramadan 2022. Les pourcentages de tests pendant le jeûne et l’iftar étaient presque équivalents au Maroc, en Égypte, en Algérie, en Tunisie et en Somalie. L’Arabie Saoudite et le Soudan avaient plus de résultats Speedtest pendant l’iftar que pendant le jeûne.

Les habitudes d’utilisation d’internet ont changé pendant le Ramadan

Speedtest Intelligence a montré que le comportement de test a changé pendant le Ramadan par rapport au mois précédent. Il y a eu une diminution du pourcentage de tests effectués dans la journée entre le Ramadan et le mois précédent dans tous les pays que nous avons étudiés. La Somalie, l’Algérie, l’Arabie Saoudite et la Tunisie ont enregistré la plus forte baisse du pourcentage de résultats de Speedtest effectués dans la journée lors de la comparaison entre la journée de jeûne au cours du Ramadan à la journée du mois précédent. La Malaisie, le Bangladesh, la Turquie, l’Indonésie et le Pakistan ont montré la plus petite différence entre les deux périodes.

Une augmentation du pourcentage de résultats Speedtest a été observée lors de l’iftar en comparant le Ramadan au mois précédent. La Somalie et l’Algérie ont connu la plus forte augmentation par rapport au mois précédent. La Malaisie, le Bangladesh, la Turquie et le Pakistan ont connu les plus faibles augmentations. Ces résultats correspondent à l’idée que les gens reportent leur activité en ligne à l’iftar pendant le Ramadan, pour passer du temps avec leurs amis et leur famille, faire des dons à des œuvres de charité et profiter de la variété des nouveaux programmes que les réseaux diffusent pour coïncider avec la période des fêtes.

Cette étude est un bon rappel que chaque pays a des événements spéciaux auxquels ses opérateurs de réseau doivent se préparer à l’avance, comme nous l’avons vu récemment avec l’Expo 2020 Dubaï. Si vous êtes intéressé par la couverture des grands événements réseau du monde entier, abonnez-vous à Ookla® Insights™.


Analisis Waktu Penggunaan Internet Selama Ramadan

Umat Islam di seluruh dunia baru-baru ini merayakan bulan Ramadan. Selama bulan suci ini, umat Islam menjalani ibadah puasa sejak matahari terbit hingga terbenam, banyak beramal, dan sering kali mengurangi jam kerja. Orang-orang berkumpul dengan teman dan keluarga saat makam malam, berbuka puasa, dan program hiburan baru seringkali dirilis untuk dinikmati bersama. Kami penasaran bagaimana kepatuhan ini memengaruhi penggunaan internet, jadi kami pun menganalisis data Speedtest Intelligence® dari berbagai negara mayoritas Muslim di seluruh dunia. Kami secara khusus mencermati volume tes pada waktu puasa dan berbuka (saat puasa dihentikan) setempat dan bagaimana perbandingan angka-angka tersebut dengan volume tes di bulan sebelumnya.

Hanya beberapa negara yang menunjukkan tes yang lebih sedikit di waktu puasa

Kami menganalisis data Speedtest Intelligence dari Aljazair, Bangladesh, Mesir, Indonesia, Malaysia, Maroko, Pakistan, Arab Saudi, Somalia, Sudan, Tunisia, dan Turki selama Ramadan untuk mencari tahu bagaimana distribusi hasil Speedtest antara waktu puasa dan waktu berbuka puasa bervariasi antarnegara. Perlu dicatat bahwa meskipun semua negara yang kami survei berpenduduk mayoritas Muslim, persentase penduduk yang beragama Islam (dan, karena itu, mungkin merayakan Ramadan) itu bervariasi, dari Somalia (99,8%) hingga Malaysia (61,3%).

Data dari Turki, Bangladesh, Malaysia, Indonesia, dan Pakistan menunjukkan persentase hasil Speedtest yang lebih tinggi selama waktu puasa dibandingkan waktu berbuka selama Ramadan 2022. Adapun menurut data dari Maroko, Mesir, Aljazair, Tunisia dan Somalia, persentase tes waktu puasa dan berbukanya kurang lebih sama. Sementara Arab Saudi dan Sudan hasil Speedtest-nya selama waktu berbuka lebih banyak daripada waktu puasa.

Pola penggunaan internet berubah selama Ramadan

Speedtest Intelligence menunjukkan bahwa perilaku pengujian berubah selama Ramadan jika dibandingkan dengan bulan sebelumnya. Terjadi penurunan persentase tes yang dilaksanakan pada siang hari antara bulan Ramadan dan bulan sebelumnya di semua negara yang kami survei. Somalia, Aljazair, Arab Saudi, dan Tunisia menunjukkan penurunan persentase hasil Speedtest terbesar di siang hari bulan Ramadan dibandingkan siang hari di bulan sebelumnya. Data dari Malaysia, Bangladesh, Turki, Indonesia, dan Pakistan menunjukkan selisih terkecil di antara kedua periode tersebut.

Juga terjadi peningkatan persentase hasil Speedtest mulai waktu berbuka puasa di bulan Ramadan dengan bulan sebelumnya. Somalia dan Aljazair mengalami peningkatan terbesar jika dibandingkan dengan bulan sebelumnya. Malaysia, Bangladesh, Turki, dan Pakistan mengalami peningkatan terkecil. Ini selaras dengan asumsi bahwa orang-orang mengalihkan aktivitas online mereka ke waktu berbuka selama Ramadan, berbaur dengan teman dan keluarga, bederma, dan menikmati berbagai acara baru yang dirilis oleh jaringan bertepatan dengan hari raya.​​

Ini adalah pengingat yang bagus bahwa setiap negara memiliki acara-acara khusus yang perlu dipersiapkan terlebih dulu oleh para operator jaringan seperti yang kita lihat baru-baru ini pada Expo 2020 Dubai. Jika Anda tertarik dengan liputan acara-acara jaringan utama dari seluruh dunia, silakan berlangganan Ookla® Insights™.


Menganalisis Masa Penggunaan Internet Semasa Bulan Ramadan

Orang islam di seluruh dunia baru-baru ini telah menyambut bulan Ramadan. Semasa bulan suci ini, mereka menahan diri dari makan dan minum bermula dari waktu matahari terbit hingga matahari terbenam, aktiviti kebajikan digalakkan, dan waktu bekerja kebiasaannya dipendekkan. Orang ramai biasanya akan berkumpul bersama-sama rakan dan keluarga semasa waktu berbuka puasa, iftar, dan rancangan hiburan baru sering disiarkan untuk ditonton dan dinikmati bersama-sama.

Kami ingin tahu bagaimana sambutan bulan Ramadan ini memberi kesan terhadap penggunaan internet, jadi kami telah menganalisis data Speedtest Intelligence® dari pelbagai negara dengan majoriti Muslim di seluruh dunia. Kami melihat secara khusus jumlah ujian semasa waktu berpuasa dan iftar (waktu berbuka puasa) tempatan dan membandingkan nilai tersebut dengan jumlah ujian semasa bulan sebelumnya.

Hanya beberapa negara yang menunjukkan bilangan ujian lebih rendah semasa waktu berpuasa

Kami telah menganalisis data Speedtest Intelligence dari Algeria, Bangladesh, Mesir, Indonesia, Malaysia, Maghribi, Pakistan, Arab Saudi, Somalia, Sudan, Tunisia, dan Turki semasa bulan Ramadan untuk melihat pengagihan keputusan Speedtest di antara waktu berpuasa dan iftar yang berbeza mengikut negara. Perlu dinyatakan bahawa, walaupun semua negara yang diselidik mempunyai penduduk majoriti Muslim, peratusan penduduk yang beragama Islam (dan oleh itu lebih berkemungkinan menyambut Ramadan) berbeza-beza dari Somalia (99.8%) ke Malaysia (61.3%).

Turki, Bangladesh, Malaysia, Indonesia, dan Pakistan menunjukkan peratusan keputusan Speedtest yang lebih tinggi semasa waktu berpuasa berbanding waktu berbuka semasa bulan Ramadan 2022. Peratusan ujian waktu berpuasa dan iftar adalah agak sama dengan Morocco, Mesir, Algeria, Tunisia dan Somalia. Saudi Arabia dan Sudan mempunyai keputusan Speedtest yang lebih tinggi semasa waktu berbuka berbanding waktu berpuasa.

Corak penggunaan Internet berubah semasa bulan Ramadan

Speedtest Intelligence menunjukkan bahawa tingkah laku ujian berubah semasa bulan Ramadan apabila dibandingkan dengan bulan sebelumnya. Terdapat penurunan dalam peratusan ujian yang dilengkapkan semasa waktu siang antara bulan Ramadan dan bulan sebelumnya dalam semua negara yang dikaji selidik. Somalia, Algeria, Saudi Arabia, dan Tunisia menunjukkan penurunan terbesar dalam peratusan keputusan waktu siang Speedtest apabila dibandingkan dengan waktu berpuasa semasa bulan Ramadan dengan waktu siang bulan sebelumnya. Malaysia, Bangladesh, Turki, Indonesia, dan Pakistan menunjukkan perbezaan terkecil di antara dua tempoh ini.

Terdapat juga peningkatan dalam peratusan keputusan Speedtest dari waktu iftar apabila membandingkan bulan Ramadan kepada bulan sebelumnya. Somalia dan Algeria mempunyai peningkatan terbesar apabila dibandingkan dengan bulan sebelumnya. Malaysia, Bangladesh, Turki, dan Pakistan mempunyai peningkatan terkecil. Ini selari dengan pendapat bahawa ramai yang menukar aktiviti dalam talian mereka kepada iftar semasa bulan Ramadan, berhubung dengan rakan dan keluarga, menderma kepada badan kebajikan, dan menikmati pelbagai rancangan baru yang disiarkan oleh rangkaian yang bersesuaian dengan sambutan ini.

Ini adalah satu peringatan yang baik bahawa setiap negara mempunyai peristiwa istimewa yang pengendali rangkaian perlu sediakan lebih awal seperti yang kita lihat baru-baru ini di Expo 2020 Dubai. Jika anda berminat dengan liputan acara rangkaian besar dari seluruh dunia, langganlah  Ookla® Insights™.

Ookla retains ownership of this article including all of the intellectual property rights, data, content graphs and analysis. This article may not be quoted, reproduced, distributed or published for any commercial purpose without prior consent. Members of the press and others using the findings in this article for non-commercial purposes are welcome to publicly share and link to report information with attribution to Ookla.

| May 18, 2022

Four U.S. Airports Top Our List of Fastest Free Airport Wi-Fi

The COVID-19 pandemic upended a lot of travel plans and put our series on airport Wi-Fi on hold. We’re excited to get back in the swing of things in time for the summer travel season, and we have fresh data for you on Wi-Fi speeds at some of the busiest airports in the world during Q1 2022. Our analysis focuses on Wi-Fi over mobile connections on free Wi-Fi provided by the individual airports and Wi-Fi at selected airport lounges. The good news is that every airport surveyed met the recommended speed for streaming on mobile. However, there was a large divide between the fastest airports on the list and the slowest.

Mobile Internet Speeds Over Free Wi-Fi at Select Airports

Speedtest Intelligence® showed four airports in the United States at the top of the list for free airport Wi-Fi. San Francisco International Airport showed a median download speed of 176.25 Mbps during Q1 2022, Seattle-Tacoma International Airport 171.01 Mbps, Dallas/Fort Worth International Airport 113.64 Mbps, and Chicago O’Hare International Airport 85.49 Mbps. Dubai International Airport, Hartsfield–Jackson Atlanta International Airport, Amsterdam Airport Schiphol, and Los Angeles International Airport followed. All of these airports are international hubs that passengers from around the world pass through on their way to all kinds of destinations. Flyers waiting for connecting planes at these airports should have no trouble with internet speeds. In case of video calls, upload speeds are even faster than downloads at all of these airports, and San Francisco and SeaTac had the fastest uploads on the list. There is a wide gap in median speeds between the free airport Wi-Fi at Los Angeles International Airport and the rest of the airports on our list.

Denver International has their Wi-Fi split between two SSIDs that serve different spectrum bands, both of which showed median download speeds between 44 and 46 Mbps. Connecting to the 5 GHz “- DEN Airport Free WiFi” will get you a faster median upload speed than “DEN Airport Free WiFi 2.4.” Charles de Gaulle also has two different SSIDs for their free airport Wi-Fi though travelers can select either, “*WIFI-AIRPORT” had slightly faster median speeds than “WIFI-AIRPORT-STANDARD.”

Turkey’s Istanbul Airport was next on the list with a median download speed of 31.08 Mbps and a median upload speed of 23.80 Mbps. Spain’s Madrid Barajas Airport was the top of the bottom of our list with a median download speed of 19.76 Mbps over free airport Wi-Fi.

Four of the bottom five airports on our list were in China. Shanghai Hongqiao International Airport was faster than the other Chinese airports on the list with a median download speed of 14.69 Mbps. Shenzhen Bao’an International Airport and Beijing Capital International Airport were next on our list and showed nearly identical median download and upload speeds over free airport Wi-Fi. Chengdu Shuangliu International Airport showed slightly slower download and upload speeds than both. Mexico City International Airport in Mexico had the slowest median download and upload speeds over free airport Wi-Fi of any airport on this list.

Wi-Fi in airport lounges is often faster than free airport Wi-Fi

Free Wi-Fi is very nice to have for catching up on your life back home or reliving the glory of your vacation pics as you upload them to your social media accounts, but if you’re looking for the fastest Wi-Fi in an airport, you may want to look into other options. In many cases we found that airport lounges had faster Wi-Fi, like the United Club in Chicago and San Francisco which boasted median download speeds of 246.17 Mbps and 244.37 Mbps, respectively, during Q1 2022. The fastest club Wi-Fi download speed at LAX was at the Alaska Lounge (238.59 Mbps).

Outside the U.S., Wi-Fi speeds at airport lounges ranged dramatically. The following lounges all showed faster median download speeds than the free Wi-Fi at their respective airports during Q1 2022: the Plaza Premium Lounge in Dubai (148.96 Mbps), the Grand Lounge Elite in Mexico City (125.12 Mbps), Privium at Amsterdam’s Schiphol (121.05 Mbps), the Emirates Lounge at Paris’ Charles de Gaulle (93.31 Mbps), and the Sala VIP Puerta de Alcalá in Madrid (50.28 Mbps).

This stronger performance at airport lounges should be expected because it’s much easier to configure Wi-Fi over a small area like a single airport lounge than it is to serve an entire airport with multiple terminals. Patrons of airport lounges are also paying for the privilege, whether by the day or the year, so their expectations are higher. We did not always find this to be the case, however, so take a Speedtest® if you feel like you are not getting what you are paying for.

We were glad to see that travelers at all these airports have fast enough Wi-Fi to stream video on mobile and that there are other options available for those who need faster internet. Airports have had a lot to focus on in the last couple of years and Wi-Fi was not at the top of the list. We hope that will change as passenger volumes return to normal. If you’re traveling this summer, take a Speedtest at the airport to see how your experience compares.

Ookla retains ownership of this article including all of the intellectual property rights, data, content graphs and analysis. This article may not be quoted, reproduced, distributed or published for any commercial purpose without prior consent. Members of the press and others using the findings in this article for non-commercial purposes are welcome to publicly share and link to report information with attribution to Ookla.

| February 16, 2022

This is How Fast Fiber is in Canada’s Provinces and Cities

Consumers want faster internet but they often wonder whether it’s worth the extra money to upgrade from services like DSL to fiber-optic broadband, sometimes referred to as fiber-to-the-home (FTTH). We’ve analyzed new data from Speedtest Intelligence® in Canada during Q4 2021 to help provide an answer for consumers as fiber connectivity expands across Canada. We’ve looked at speeds in provinces and in major cities in Canada.

Fiber upload speeds are up to 12x faster at the provincial level in Canada

Bell and TELUS serve different parts of the country with their fiber offerings so we’ve analyzed each province with an eye to how much faster the relevant fiber provider’s offerings are compared to the median speeds for all other fixed broadband providers combined.

Our analysis of Speedtest Intelligence data from all Canadian provinces during Q4 2021 showed that fiber from Bell and TELUS is faster than median speeds for all other fixed broadband providers combined. Bell Fiber was faster than the market average of other internet providers for median download speeds in New Brunswick (1.8x), Newfoundland (1.8x), Nova Scotia (1.9x), Ontario (2.4x), Prince Edward Island (3.1x), and Québec (3.3x). TELUS Fiber was faster than other fixed broadband in Alberta (1.9x) and British Columbia (1.4x).

Upload speed is the major differentiator for fiber compared to other fixed broadband technologies. Bell Fiber showed a huge advantage over other fixed broadband for median upload speeds in all provinces as follows: New Brunswick (7.4x), Newfoundland (10.9x), Nova Scotia (11.5x), Ontario (10.8x), Prince Edward Island (12.4x), and Québec (8.5x). TELUS Fiber was faster than other fixed broadband for upload speeds in Alberta (7.5x) and British Columbia (5.3x).

There were insufficient samples to analyze Bell Fiber, operating as Bell MTS, in Manitoba where the fixed broadband averages were 83.06 Mbps (download) and 16.13 Mbps (upload). Bell Fiber and TELUS Fiber don’t provide service in the following provinces, but we’ve provided their median fixed broadband speeds for comparison: Northwest Territories (55.63 Mbps download / 11.45 Mbps upload), Nunavut (insufficient data), Saskatchewan (68.43 Mbps / 17.04 Mbps), Yukon (43.96 Mbps / 10.56 Mbps). There is clearly a lot of room to expand fiber access to additional Canadian provinces, places that currently show lower fixed broadband speeds overall.

Infrastructure improvements like laying fiber are very expensive as they often require providers to dig up city streets to physically lay new lines. This often means that fiber deployments are limited to areas with high population density where providers are more likely to recoup costs. This means not everyone has access to this faster technology, but in areas where fiber exists, it could well be worth the upgrade. And with data on how much faster fiber is, perhaps consumers can push for more fiber access in underserved areas.

Fiber shows up to 11x advantage for upload speeds in major Canadian cities

A look at data from major cities in Canada during Q4 2021 showed that fiber speeds are  most often comparable to or faster than other fixed broadband. Median download speed on Bell Fiber was faster than other fixed broadband in Halifax (1.5x), London (1.8x), Montréal (3.2x), Québec City (3.2x), St. John’s (1.0x), and Toronto (2.3x). TELUS Fiber was faster for download speed than other fixed broadband in Calgary (1.2x), Edmonton (1.3x), and Vancouver (1.7x).

Fiber upload speeds tell a more dramatic story in major Canadian cities. Bell Fiber’s median upload speed was faster than other fixed broadband in Halifax (11.4x), London (8.6x), Montréal (9.4x), Québec City (7.3x), and Toronto (11.0x). Upload speed set TELUS Fiber apart as faster in Calgary (5.1x), Edmonton (5.6x), and Vancouver (6.6x).

If you’re considering upgrading to fiber, take a Speedtest®. Your results will show you if fiber might be an upgrade or if your service is fast enough for now. If you’re a fixed broadband provider who would like to work with Ookla for in-depth analysis of your fiber offerings versus other tariff plans, contact us.

Ookla retains ownership of this article including all of the intellectual property rights, data, content graphs and analysis. This article may not be quoted, reproduced, distributed or published for any commercial purpose without prior consent. Members of the press and others using the findings in this article for non-commercial purposes are welcome to publicly share and link to report information with attribution to Ookla.

| January 31, 2022

Ookla Data Hints C-Band Could Change Who’s Going to be Fastest in the U.S.

We recently covered how necessary the addition of C-band spectrum to the 5G strategies of Verizon Wireless and AT&T is for increased performance. We now have data from Speedtest Intelligence® to show exactly how much C-band has already affected 5G performance in the week following launch on January 19 and how that might impact our Ookla Market Report™ rankings next quarter.

U.S. mobile 5G download speeds increased 13% week over week

We saw a week-over-week increase in median 5G download speed of 13% when looking at all operators combined. AT&T and T-Mobile both had slight increases (1%) in median download speed over 5G for all operators when comparing the seven days starting January 12, 2022 to the week of January 19, 2022, with AT&T rising from 68.43 Mbps to 70.46 Mbps and T-Mobile increasing from 181.99 Mbps to 187.11 Mbps. This coincides with AT&T’s very selective rollout of C-band in eight markets and the fact that T-Mobile did not add new spectrum on January 19, though they did launch their 5G carrier aggregation that same day.

Verizon Wireless saw the greatest performance gain of 50% after the C-band rollout, from 76.51 Mbps during the week starting January 19 to 116.29 Mbps during the week of January 19. This massive improvement in speed shows the power of Verizon’s widespread deployment of C-band spectrum and C-band’s ability to deliver fast speeds. We also saw a large increase in testing for customers across the board, but especially Verizon customers who could have seen an ultra wide band icon show up on their phone for the first time after the launch.

This spike in testing is one reason we usually report on at least one quarter of data. However, if the trend in increased speed continues, Verizon Wireless could challenge T-Mobile for fastest download speed in our next Speedtest Global Index Market Analysis.

C-band’s effect on speeds differed across five cities

We also examined week-over-week performance in five of the cities where both Verizon and AT&T deployed C-band: Austin, Texas; Chicago, Illinois; Fort Worth, Texas; Houston, Texas; and Jacksonville, Florida. AT&T saw a 12% increase in median download speed over 5G in Austin, and Verizon Wireless saw statistically significant increases in Fort Worth (21%) and Jacksonville (28%). All other operator speeds over 5G were relatively flat in other listed locations with the exception of Houston where Verizon Wireless showed a dip from a high the prior week.

This could upset the market by the time of our next report

As mentioned above, if Verizon continues to capitalize on their C-band rollout and add additional deployments, we could well see an upset in the U.S. market rankings by the time of our next Speedtest Global Index Market Analysis. There may be additional upsets to come, because while AT&T saw a marginal impact on its initial C-Band launch, their [strategy to install C-band in tandem with recently acquired 3.45-3.55GHz frequency](https://www.fiercewireless.com/5g/att-plans-deploy-345-ghz-c-band-one-climb-tower-strategy) could revolutionize AT&T’s speeds in the second half of the year. Subscribe to Ookla Research™ to get the latest analyses delivered directly to your inbox.

Ookla retains ownership of this article including all of the intellectual property rights, data, content graphs and analysis. This article may not be quoted, reproduced, distributed or published for any commercial purpose without prior consent. Members of the press and others using the findings in this article for non-commercial purposes are welcome to publicly share and link to report information with attribution to Ookla.