| January 16, 2024

52 New Ookla Market Reports Available for Q4 2023

Ookla® Market Reports™ identify key data about internet performance in countries across the world. This quarter we’ve provided updated analyses for 52 markets using Speedtest Intelligence® and summarized the top takeaways below. Click through to the market report to see more details and charts about the countries you’re interested in, including the fastest fixed broadband providers and mobile operators, who had the most consistent service, as well as 5G and device performance in select countries during Q4 2023. Jump forward to a continent using these links:

Africa | Americas | Asia | Europe | Oceania

Africa

  • Côte d’Ivoire: Orange recorded the fastest median mobile and fixed download speeds during Q4 2023, at 30.13 Mbps and 65.90 Mbps, respectively. Moov Africa recorded the lowest mobile median multi-server latency at 83 ms, while CANALBOX recorded the lowest latency over fixed broadband at 70 ms. Of Côte d’Ivoire most populous cities, Abidjan had the fastest median fixed download speed of 58.88 Mbps.
  • Mozambique: Tmcel recorded the fastest mobile median download speed of 27.80 Mbps in Q4 2023, and also the highest mobile Consistency at 91.6%. Of Mozambique’s most populous cities, Maputo had the fastest median mobile and fixed download speeds at 26.33 Mbps and 14.65 Mbps, respectively. SpaceX’s Starlink recorded the fastest fixed broadband median download speed in Q4 2023 at 36.13 Mbps, along with the highest Consistency at 49.7%. Meanwhile, TVCABO recorded the lowest latency over fixed broadband at 16 ms.
  • Senegal: There was no winner of fastest median mobile performance in Senegal during Q4 2023, with Free and Orange both tied. Orange led the market for median fixed broadband download performance, with 21.46 Mbps in Q4 2023. Orange also had the lowest latency at 90 ms and highest Consistency of 45.4%. Of Senegal’s most populous cities, Dakar had the fastest median fixed download speed of 27.11 Mbps.

Americas

  • Argentina: Personal had the fastest median download speed over mobile at 36.59 Mbps, while also registering the lowest latency of 39 ms during Q4 2023. In the fixed broadband market, there was no statistically fastest network, with Movistar and Telecentro delivering median download speeds of 106.41 Mbps and 105.98 Mbps, respectively. Movistar recorded the lowest latency of 9 ms. Among Argentina’s most populous cities, Mendoza recorded the fastest mobile median download speed of 37.75 Mbps, while Buenos Aires recorded the fastest fixed download speed of 109.79 Mbps.
  • Belize: Digi had the fastest median mobile download and upload speeds of 17.50 Mbps and 9.28 Mbps, respectively during Q4 2023. Digi also recorded the highest Consistency of 80.3%, while smart! recorded the lowest median latency of 56 ms. There was no statistically fastest fixed network in the market based on download speed, however NEXGEN recorded the fastest median upload speed at 47.47 Mbps.
  • Canada: Bell was the fastest mobile operator in Canada with a median download speed of 121.33 Mbps in Q4 2023. Bell also had the fastest median 5G download speed at 194.23 Mbps. Rogers had the fastest median mobile upload speed of 15.10 Mbps, and the highest Consistency of 88.2%. Bell pure fibre was fastest for fixed broadband, recording a median download speed of 307.77 Mbps and a median upload speed of 264.97 Mbps. Bell pure fibre also recorded the highest Video Score, of 87.90. Of Canada’s most populous cities, St. John’s recorded the fastest median mobile download speed at 171.76 Mbps, while Fredericton recorded the fastest median fixed broadband download speed of 247.89 Mbps.
  • Colombia: Movistar was fastest for fixed broadband with a median download speed of 210.46 Mbps in Q4 2023. ETB had the lowest latency over fixed broadband at 7 ms. Of Colombia’s most populous cities, Cartagena recorded the fastest median fixed download speed of 146.74 Mbps.
  • Costa Rica: Claro had the fastest median download speed among mobile operators at 40.56 Mbps during Q4 2023. Liberty recorded the fastest median upload speed at 10.73 Mbps, the lowest mobile latency at 33 ms, and the highest Consistency at 78.6%. Metrocom was fastest for fixed broadband download and upload performance, at 225.94 Mbps and 179.66 Mbps, respectively. Metrocom also recorded the lowest latency, at 6 ms.
  • Dominican Republic: Claro had the fastest median download and upload speeds among mobile operators at 34.27 Mbps and 9.84 Mbps, respectively. Claro also recorded the highest Consistency, at 77.0%. Viva had the lowest mobile latency at 43 ms. SpaceX’s Starlink was fastest for fixed broadband download performance at 48.08 Mbps, while Claro recorded the fastest median upload speed at 25.38 Mbps, and the lowest latency at 41 ms. Altice recorded the highest fixed broadband Consistency, at 66.6%.
  • Ecuador: CNT recorded the fastest median mobile download speed during Q4 2023, at 26.22 Mbps, while Movistar recorded the lowest mobile multi-server latency at 41 ms. Netlife was fastest for fixed broadband, with a median download speed of 91.56 Mbps. Netlife also recorded the lowest latency over fixed broadband at 8 ms. Xtrim recorded the highest fixed broadband Consistency at 84.8%. Of Ecuador’s most populous cities, Santo Domingo recorded the fastest median mobile download speed of 31.58 Mbps, while Guayaquil recorded the fastest median fixed download speed of 88.59 Mbps.
  • El Salvador: Claro had the fastest median download speed among mobile operators in El Salvador, at 40.97 Mbps, along with the highest Consistency of 90.4%. Movistar registered the fastest median mobile upload speed of 13.35 Mbps and lowest latency at 73 ms. Cable Color recorded the fastest median fixed download speed at 55.57 Mbps, the top median upload speed at 57.04 Mbps, and the lowest median latency of 51 ms. Of El Salvador’s most populous cities, Santa Tecla showed the fastest median mobile and fixed download speeds during Q4 2023 at 39.27 Mbps and 54.98 Mbps respectively.
  • Guatemala: Claro was the fastest mobile operator in Guatemala during Q4 2023 with a median download speed of 41.63 Mbps and a median upload speed of 19.61 Mbps. Claro also had the highest Consistency at 87.9%, while also leading the market for 5G performance, with a median 5G download speed of 388.34 Mbps. Tigo recorded the lowest median mobile latency at 79 ms. SpaceX’s Starlink was fastest for median fixed download performance at 54.32 Mbps, while Cable Color was fastest for fixed upload performance at 33.45 Mbps. Cable Color also had the lowest median latency on fixed broadband at 27 ms. Claro recorded the highest fixed broadband Consistency at 73.1%. Of Guatemala’s most populous cities, Escuintla showed the fastest median mobile download speed during Q4 2023 at 44.16 Mbps, while Villa Nueva recorded the fastest median fixed download speed, at 60.83 Mbps.
  • Guyana: There was no winner of fastest median mobile performance in Guyana during Q4 2023, with ENet and Digicel posting median download speeds of 24.64 Mbps and 23.53 Mbps, respectively. ENet recorded the fastest median mobile upload speed at 18.49 Mbps and offered the lowest median latency at 143 ms. In the fixed broadband market, ENet recorded the fastest median download and upload speeds, of 70.20 Mbps and 52.25 Mbps, respectively, while also recording the lowest median latency of 130 ms. GTT recorded the highest fixed broadband Consistency during Q4 2023, at 69.2%.
  • Haiti: Digicel was the fastest mobile operator in Haiti with a median mobile download speed of 14.26 Mbps, a median upload speed of 10.52 Mbps, and Consistency of 67.2%. Natcom recorded the lowest mobile latency, of 62 ms. SpaceX Starlink had the fastest median fixed download speed at 41.73 Mbps. Natcom had the fastest median fixed upload speed at 31.89 Mbps, the lowest median fixed latency at 47 ms, and the highest fixed broadband Consistency of 64.0%.
  • Honduras: Claro recorded the fastest median mobile download and upload speeds during Q4 2023, of 53.06 Mbps and 16.22 Mbps, respectively, while also recording the highest Consistency at 87.2%. Tigo recorded the lowest median mobile latency at 93 ms. Claro had the fastest median fixed download speed at 47.26 Mbps during Q4 2023, and the highest fixed broadband Consistency at 80.2%. TEVISAT recorded the fastest median upload speed, of 22.36 Mbps, and the lowest median fixed latency at 20 ms. Of Honduras’ most populous cities, El Progreso recorded the fastest median mobile download speed during Q4 2023, of 41.69 Mbps, while Tegucigalpa showed the fastest median fixed download speed at 41.97 Mbps.
  • Jamaica: There was no winner of fastest median mobile download performance in Jamaica during Q4 2023, with Flow and Digicel tied. Digicel recorded the fastest median upload speed of 8.37 Mbps and highest Consistency of 81.9%. Flow had the lowest mobile median latency at 38 ms. SpaceX Starlink had the fastest median download speed over fixed broadband at 84.10 Mbps, and the highest fixed broadband Consistency at 77.8%. Digicel+ recorded the fastest median upload speed of 46.14 Mbps, while Flow recorded the lowest median fixed latency at 25 ms.
  • Mexico: Telcel had the fastest median download and upload speeds over mobile at 52.06 Mbps and 13.50 Mbps, respectively, and the operator also delivered the fastest median 5G download speed at 233.82 Mbps. Telcel also had the lowest mobile median latency at 62 ms and highest Consistency at 87.2%. Totalplay was fastest for fixed broadband with a median download speed of 88.87 Mbps and a median upload speed of 30.50 Mbps. Totalplay also had the lowest median fixed broadband latency at 28 ms and the highest Consistency at 84.0%. Among Mexico’s most populous cities, Monterrey recorded the fastest median mobile download speed of 38.36 Mbps, while Guadalajara recorded the fastest median fixed broadband speed of 80.32 Mbps.
  • Panama: MasMovil was the fastest mobile operator with median download and upload speeds of 27.24 Mbps and 15.18 Mbps, respectively, as well as the highest Consistency of 79.3%. Digicel recorded the lowest median mobile latency, at 34 ms. There was no winner of the fastest median fixed download performance, with both Tigo and MasMovil tied. MasMovil recorded the fastest median upload speed of 33.38 Mbps and the lowest median latency at 16ms. Among Panama’s most populous cities, David recorded the fastest median mobile download speed of 21.57 Mbps, while La Chorrera recorded the fastest median fixed broadband speed of 156.71 Mbps.
  • Peru: Claro was the fastest mobile operator in Peru with a median download speed of 23.30 Mbps during Q4 2023, and also had the highest mobile Consistency in the market with 80.6%.
  • Trinidad and Tobago: Digicel had the fastest median download speed over mobile at 33.29 Mbps and the highest Video Score in the market at 74.86. bmobile recorded the fastest median mobile upload speed of 12.17 Mbps, and the lowest median latency at 32 ms. Digicel+ had the fastest median fixed broadband download and upload speeds at 118.53 Mbps and 107.24 Mbps, respectively. Digicel+ also had the lowest median latency at 7 ms.
  • United States: T-Mobile was the fastest mobile operator with median download and upload speeds of 188.96 Mbps and 12.19 Mbps, respectively. T-Mobile also recorded the highest mobile Consistency at 87.3%, and the lowest median mobile latency of 50 ms. T-Mobile also led the market with the fastest median 5G download speed at 238.87 Mbps, as well as the lowest 5G latency of 48 ms. T-Mobile secured the highest Video Score across all technologies with 78.21, and for 5G, with a Video Score of 81.54. Cox led the market as the fastest fixed broadband provider with a median download speed of 261.27 Mbps, while AT&T Internet recorded the fastest median fixed upload speed of 195.64 Mbps, and Verizon had the lowest median latency over fixed broadband at 15 ms.
  • Uruguay: Antel was the fastest mobile operator in Uruguay during Q4 2023 with a median download speed of 117.79 Mbps, and recorded the lowest median latency of 44 ms.
  • Venezuela: Digitel was the fastest mobile operator with a median download speed of 14.37 Mbps and a median upload speed of 6.97 Mbps during Q4 2023. Digitel also recorded the highest Consistency in the market, with 68.0%, and the lowest median latency of 97 ms. Airtek Solutions had the fastest median fixed download and upload speeds of 94.76 Mbps and 94.89 Mbps, respectively. Airtek Solutions also recorded the highest fixed broadband Consistency of 86.0%, and the lowest median latency at 7 ms. Among Venezuela’s most populous cities, Maracaibo recorded the fastest median mobile and fixed download speeds of 17.17 Mbps and 82.35 Mbps, respectively.

Asia

  • Afghanistan: The fastest mobile operator in Afghanistan was Afghan Wireless with a median download speed of 6.68 Mbps in Q4 2023. The operator also had the lowest median latency at 77 ms and the highest Consistency of 51.0%.
  • Bangladesh: Banglalink was the fastest mobile operator in Bangladesh with a median download speed of 26.74 Mbps in Q4 2023. Banglalink also recorded the highest Consistency of 89.0% and the lowest median latency of 33 ms. DOT Internet was the fastest fixed broadband provider with a median download speed of 91.35 Mbps, while also recording the highest Consistency at 87.5% and the lowest median latency at 5 ms.
  • Bhutan: There was no statistical winner for fastest mobile download performance during Q4 2023 in Bhutan, with TashiCell and BT both tied with speeds of 31.52 Mbps and 28.15 Mbps, respectively. TashiCell recorded the lowest median mobile latency of 52 ms.
  • Brunei: There was no statistical winner for fastest mobile download performance during Q4 2023 in Brunei, with DST and Imagine both tied with speeds of 97.34 Mbps and 91.53 Mbps, respectively.
  • Cambodia: Cellcard recorded the fastest median mobile download speed at 33.74 Mbps during Q4 2023, while Metfone recorded the highest Consistency at 80.8% and the lowest median latency at 38 ms. MekongNet was the fastest fixed broadband provider, with a median fixed download speed of 48.29 Mbps. MekongNet also recorded the highest Consistency at 71.1%. OpenNet recorded the lowest median latency over fixed broadband, at 7ms.
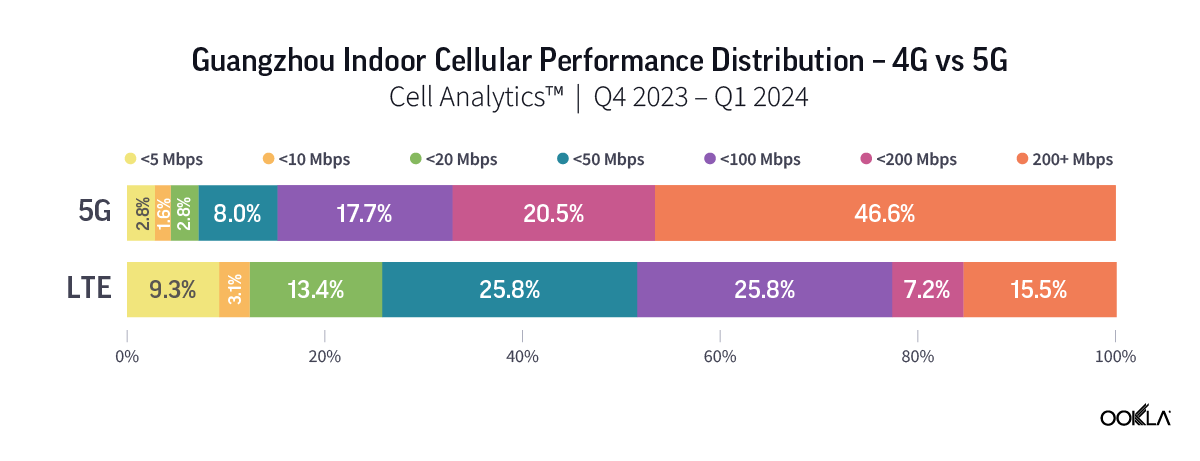
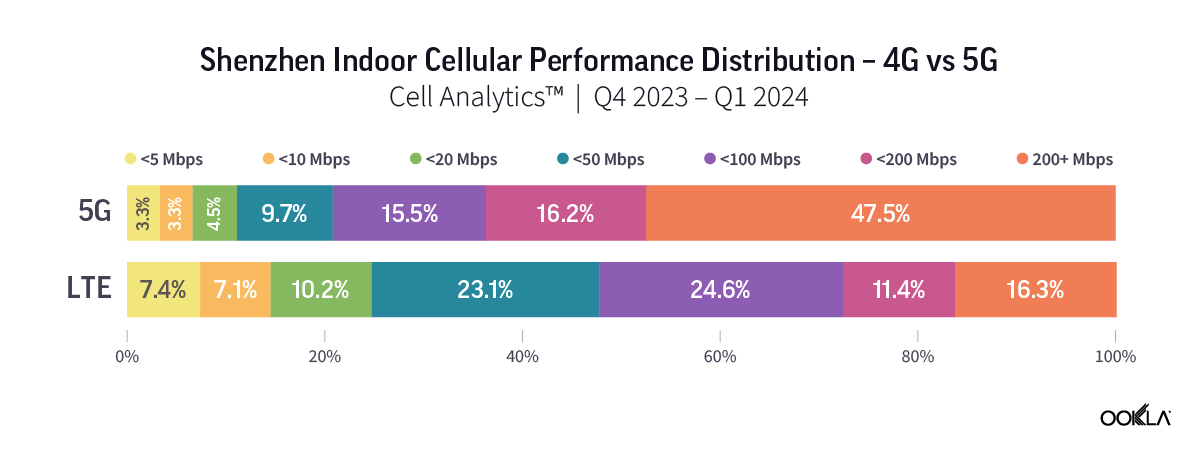
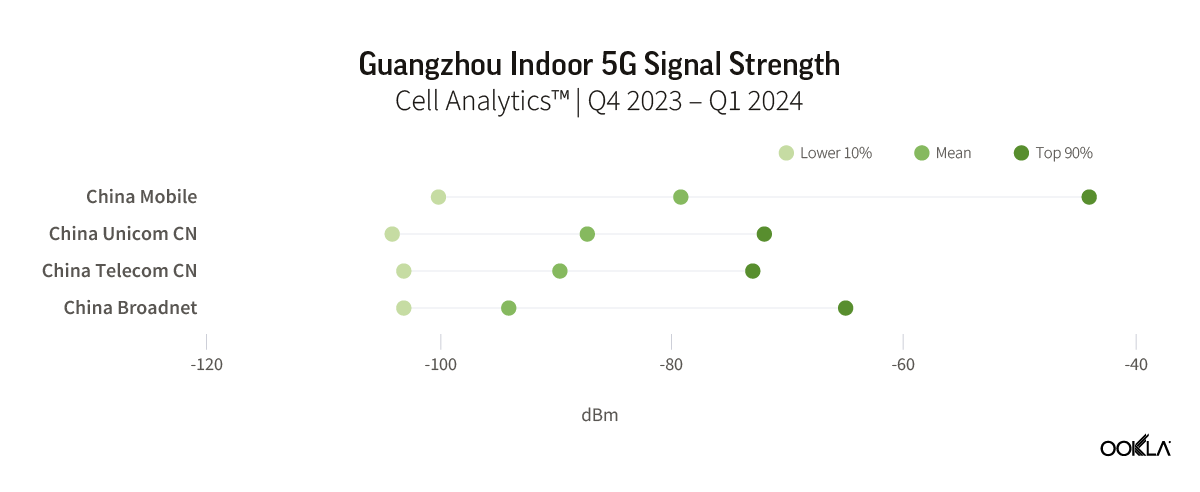
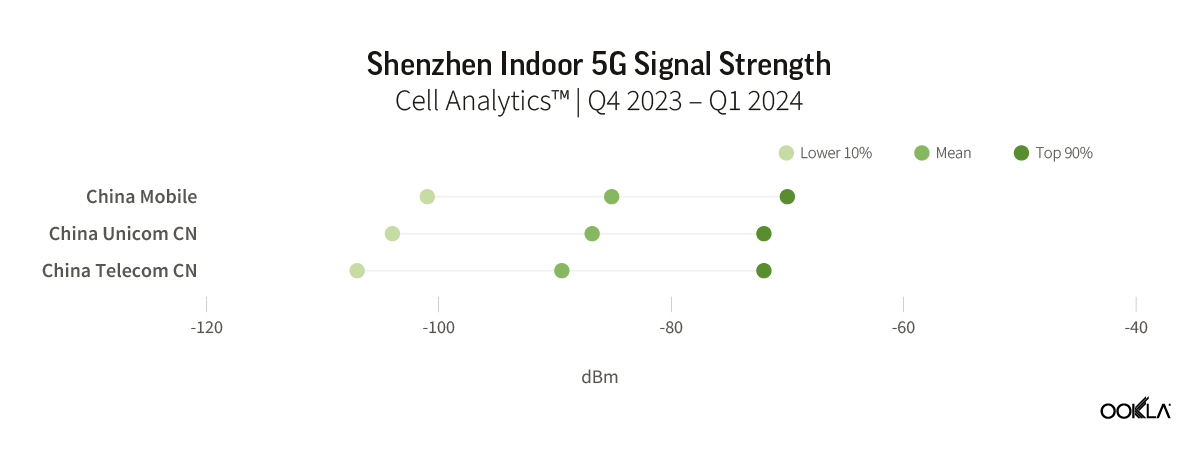
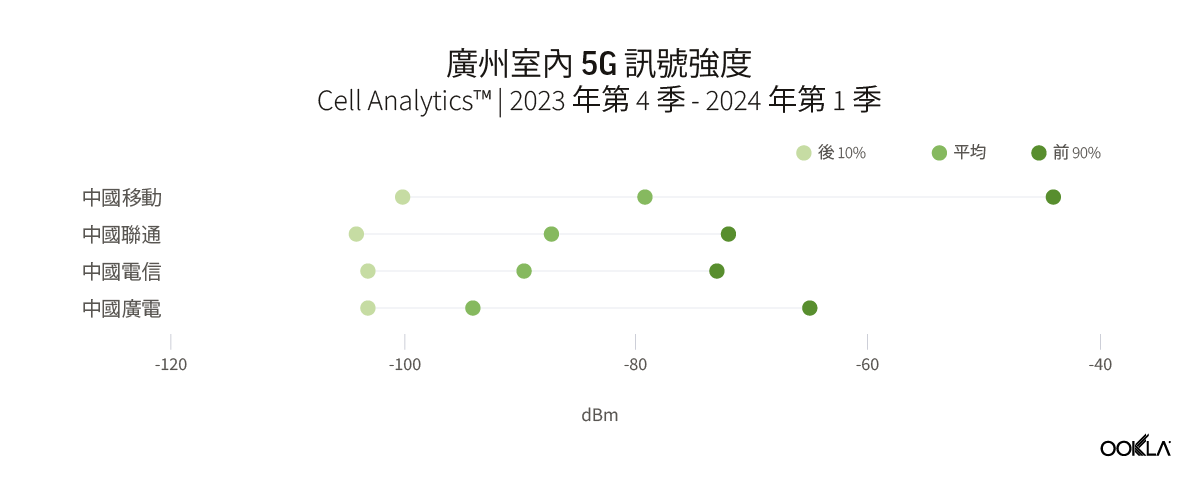
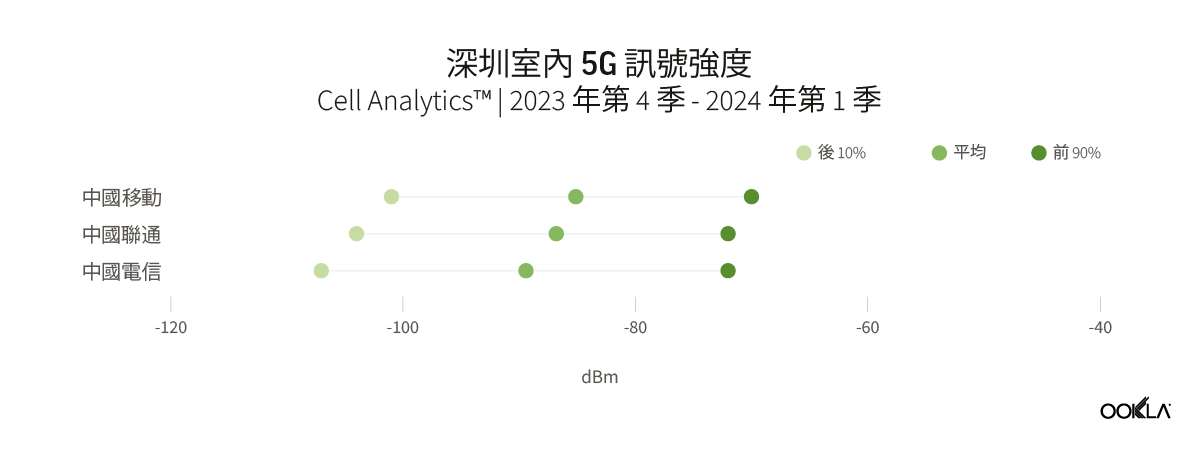
  • China: China Broadnet was the fastest mobile operator in China during Q4 2023, with a median download speed of 248.77 Mbps, and median 5G download speed of 305.61 Mbps. China Mobile recorded the lowest median mobile latency, at 42 ms. There was no statistical winner for fastest fixed download performance, with China Unicom and China Mobile both tied with speeds of 246.93 Mbps and 245.59 Mbps, respectively. China Mobile recorded the highest fixed broadband Consistency, of 93.4%, while China Telecom recorded the lowest median fixed broadband latency at 22 ms. Among China’s most populous cities, Beijing recorded the fastest median mobile download speed of 232.41 Mbps, while Tianjin recorded the fastest median fixed download speed of 326.07 Mbps.
  • Georgia: Geocell recorded the fastest mobile download performance during Q4 2023 in Georgia, at 50.52 Mbps, and the lowest mobile latency at 37 ms. MagtiCom had the fastest median fixed download speed at 27.81 Mbps and the highest Consistency of 66.5%. Among Georgia’s most populous cities, Tbilisi recorded the fastest median mobile download speed of 36.17 Mbps, while Rustavi recorded the fastest median fixed download speed of 27.38 Mbps.
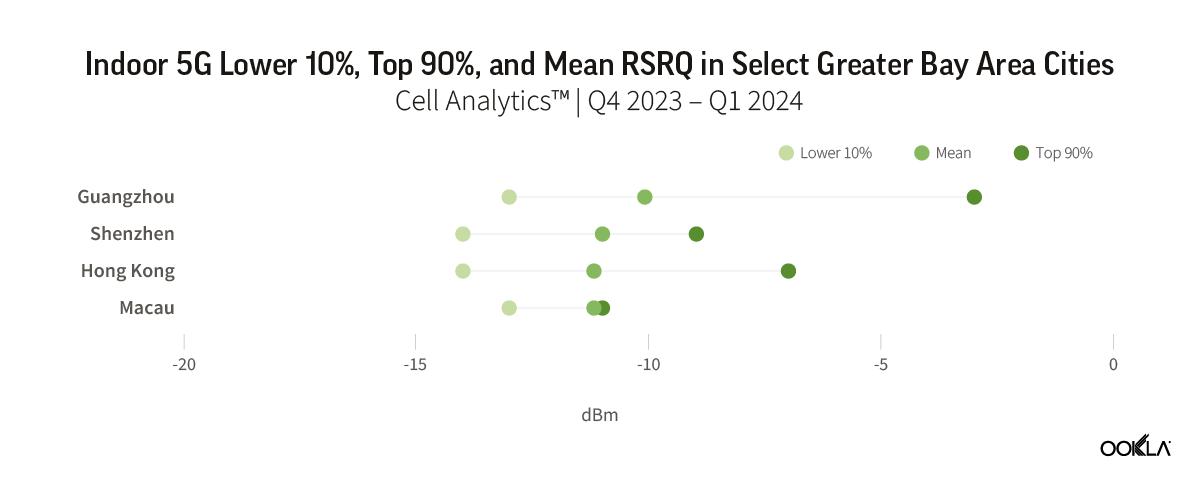
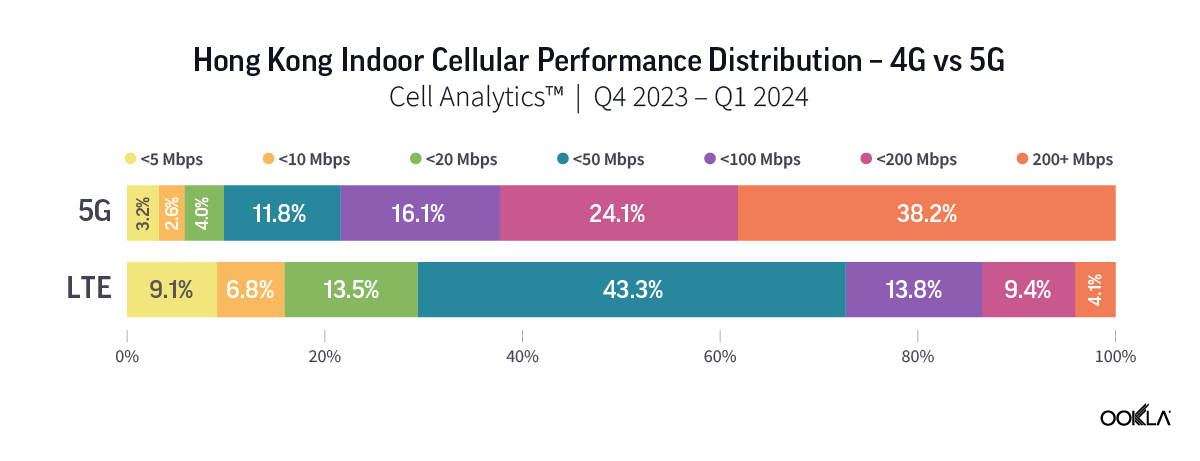
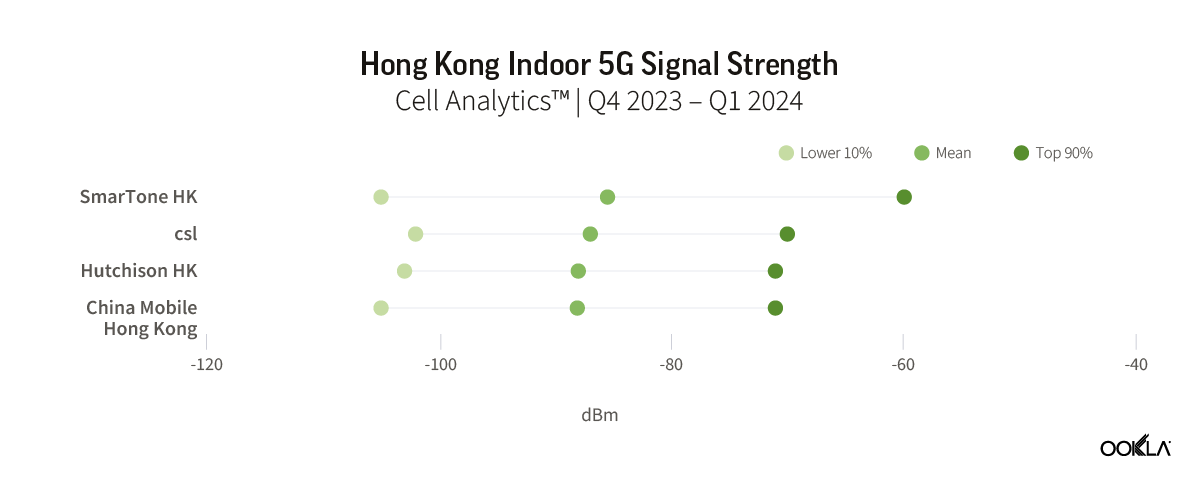
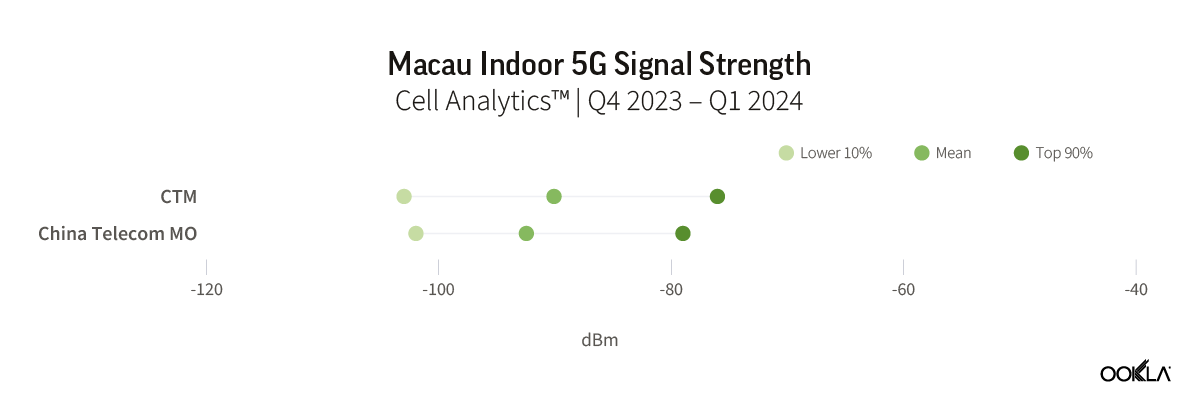
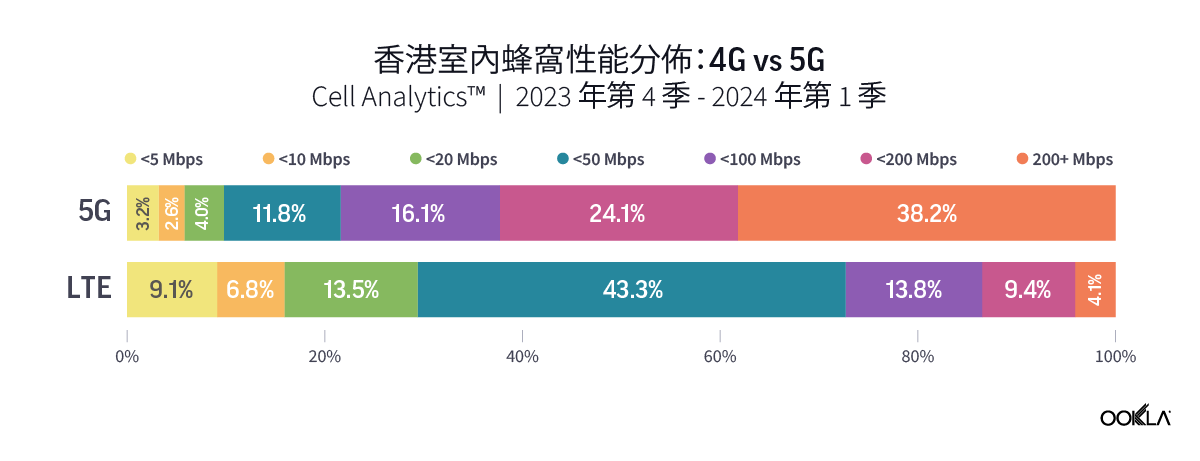
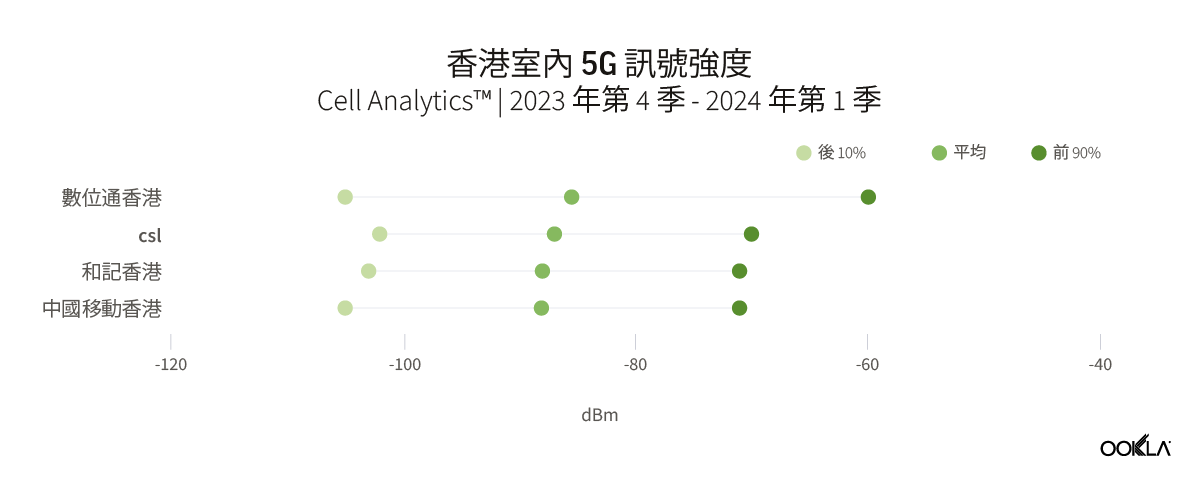
  • Hong Kong (SAR): China Mobile Hong Kong was the fastest mobile operator in Hong Kong (SAR) during Q4 2023, with a median download speed across all technologies of 98.94 Mbps, and a median download speed over 5G of 177.96 Mbps. csl recorded the fastest median mobile upload speed, at 16.89 Mbps.
  • Indonesia: Telkomsel was the fastest Indonesian mobile operator with a median download speed of 31.14 Mbps. Telkomsel also had the lowest median mobile latency at 45 ms.
  • Japan: Rakuten Mobile recorded the fastest mobile download and upload speeds during Q4 2023 in Japan, at 51.16 Mbps and 20.21 Mbps, respectively. Rakuten Mobile also recorded the highest Consistency in the market at 90.6%, while SoftBank recorded the lowest median latency at 43 ms. So-net had the fastest fixed download and upload speeds, at 296.29 Mbps and 219.53 Mbps, respectively, as well as the lowest median latency over fixed broadband at 9 ms. SpaceX Starlink recorded the highest fixed broadband Consistency in the market at 96.4%.
  • Kazakhstan: Tele2 recorded the highest mobile Consistency in Kazakhstan during Q4 2023 with 85.3% and the lowest median mobile latency at 39 ms.
  • Malaysia: TM was the fastest fixed broadband provider in Malaysia with a median download speed of 112.00 Mbps in Q4 2023. TIME recorded the lowest fixed broadband latency at 9 ms.
  • Pakistan: Jazz delivered the fastest median mobile download speed in Pakistan at 21.38 Mbps in Q4 2023. Zong recorded the highest mobile Consistency, at 83.2%, and the lowest median mobile latency of 45 ms. Transworld recorded the fastest median fixed broadband download speed at 22.08 Mbps and the highest Consistency at 46.1%, while Connect Communications recorded the lowest median fixed broadband latency at 12 ms.
  • Philippines: Smart delivered the fastest median mobile download speed in the Philippines at 37.64 Mbps in Q4 2023.
  • South Korea: SK Telecom recorded the fastest median mobile download speed at 192.67 Mbps, while also recording the highest Consistency in the market at 89.1%. LG U+ had the lowest median mobile latency in the market at 76 ms. In South Korea’s fixed broadband market, LG U+ delivered the fastest median download speed at 146.20 Mbps, and the lowest median latency of 57 ms.
  • Sri Lanka: There was no statistical winner for fastest mobile download performance during Q4 2023 in Sri Lanka, with Dialog and SLT-Mobitel both tied with speeds of 23.98 Mbps and 23.89 Mbps, respectively. Dialog delivered the lowest median mobile latency of 36 ms. SLT-Mobitel recorded the fastest fixed download speed of 37.46 Mbps, as well as the highest fixed broadband Consistency of 57.9% and the lowest fixed broadband latency at 13 ms.
  • Vietnam: Viettel was the fastest fixed provider in Vietnam during Q4 2023, with a median download speed of 107.40 Mbps. Viettel also recorded the highest fixed broadband Consistency at 94.8% and the lowest median fixed broadband latency of 4 ms.

Europe

  • Albania: Vodafone recorded the fastest median mobile download speed in Albania during Q4 2023, of 53.36 Mbps. One Albania recorded the highest mobile Consistency of 86.1%. Digicom was the fastest fixed broadband provider with a median download speed of 94.74 Mbps. Abissnet recorded the lowest fixed broadband latency, at 7 ms. Among Albania’s most populous cities, Vlorë recorded the fastest median mobile download speed of 75.34 Mbps, while Shkodër recorded the fastest median fixed download speed of 69.91 Mbps.
  • Belgium: Proximus recorded the fastest median mobile download speed in Belgium during Q4 2023, at 89.67 Mbps. Proximus also recorded the highest mobile Consistency in the market at 89.8%. There was no statistical winner for fastest fixed download performance, with Telenet and VOO both tied with speeds of 158.08 Mbps and 156.00 Mbps, respectively. VOO recorded the highest Consistency at 89.8%. Among Belgium’s most populous cities, Ghent recorded the fastest median mobile and fixed download speeds, of 168.89 Mbps and 90.14 Mbps, respectively.
  • Denmark: Telia was the fastest mobile operator in Denmark during Q4 2023, with a median download speed of 163.41 Mbps. Hiper was fastest for fixed broadband, with a median download speed of 277.56 Mbps.
  • Estonia: The fastest mobile operator in Estonia was Telia with a median download speed of 92.39 Mbps in Q4 2023. Elisa recorded the highest mobile Consistency of 91.9%. Elisa was the fastest fixed broadband provider, with a median download speed of 100.13 Mbps. Elisa also recorded the highest fixed broadband Consistency, of 86.3%. Infonet recorded the lowest median fixed broadband latency of 5 ms.
  • Finland: DNA had the fastest median mobile download speed at 113.57 Mbps in Q4 2023, and the highest Consistency of 95.4%. DNA also recorded the fastest median 5G download performance, at 247.54 Mbps. Telia recorded the lowest median mobile latency of 31 ms. Lounea was fastest for fixed broadband with a median download speed of 171.31 Mbps. Lounea also recorded the highest fixed broadband Consistency in the market at 91.5%, as well as the lowest median fixed broadband latency at 13 ms.
  • Germany: Telekom was the fastest mobile operator in Germany during Q4 2023, with a median download speed of 90.26 Mbps, as well as the top median download speed over 5G at 179.25 Mbps. Telekom also recorded the highest mobile Consistency in the market at 92.1% and the lowest median mobile latency of 38 ms. Deutsche Glasfaser recorded the fastest fixed broadband performance, with a median download speed at 201.43 Mbps. Deutsche Glasfaser also recorded the highest fixed broadband Consistency in the market at 90.5% and the lowest latency of 14 ms.
  • Latvia: There was no statistical winner for fastest mobile download performance in Latvia during Q4 2023, with BITĖ and LMT both tied with speeds of 81.56 Mbps and 81.11 Mbps, respectively. BITĖ recorded the highest mobile Consistency in the market of 91.3%, while LMT recorded the lowest mobile latency at 27 ms. Balticom was fastest for fixed broadband with a median download speed of 275.19 Mbps, while also leading with the highest fixed broadband Consistency of 93.7%, and the lowest median latency at 4 ms. Among Latvia’s most populous cities, Olaine recorded the fastest median mobile download speed, of 170.18 Mbps, while Salaspils recorded the fastest median fixed broadband download speed of 94.64 Mbps.
  • Lithuania: Telia was the fastest mobile operator in Lithuania during Q4 2023, with a median download speed of 116.58 Mbps in Q4 2023. Telia also recorded the highest Consistency in the market at 94.7%, and the lowest median mobile latency at 32 ms. Cgates was fastest for fixed broadband with a median download speed of 177.14 Mbps. Cgates also recorded the highest Consistency over fixed broadband in the market at 90.9%, while Penki recorded the lowest fixed broadband latency, at 4ms. Among Lithuania’s most populous cities, Panevėžys recorded the fastest median mobile download speed, of 106.34 Mbps, while Klaipėda recorded the fastest median fixed broadband download speed of 138.34 Mbps.
  • Poland: T-Mobile was the fastest mobile operator in Poland during Q4 2023, with a median download speed of 49.10 Mbps. T-Mobile also recorded the highest Consistency in the market at 88.4%. Plus recorded the fastest 5G performance in the market, with a median 5G download speed of 133.34 Mbps. Plus also recorded the lowest median mobile latency, at 43 ms. UPC was the fastest provider for fixed broadband with a median download speed of 232.36 Mbps, while Netia recorded the lowest fixed broadband latency, at 16 ms. Among Poland’s most populous cities, Łódź recorded the fastest median mobile download speed of  46.53 Mbps, while Wrocław recorded the fastest median fixed download speed of 172.86 Mbps.
  • Turkey: Turkcell was the fastest mobile operator in Turkey with a median download speed of 56.73 Mbps in Q4 2023, and Turkcell also recorded the highest Consistency of 91.3%. Türk Telekom had the lowest median mobile latency at 39 ms. TurkNet was fastest for fixed broadband, with a median download speed of 66.57 Mbps. TurkNet also recorded the lowest median fixed latency at 13 ms, and the highest Consistency at 81.5%. Among Turkey’s most populous cities, Istanbul recorded the fastest median download speeds across mobile and fixed, at 38.50 Mbps and 47.81 Mbps, respectively.

Oceania

  • New Zealand: There was no statistical winner for fastest mobile download performance during Q4 2023 in New Zealand, with One NZ and Spark both tied with speeds of 73.52 Mbps and 70.23 Mbps, respectively. 2degrees led the market with the highest Consistency of 91.0% and the lowest median mobile multi-server latency at 40 ms.

The Speedtest Global Index is your resource to understand how internet connectivity compares around the world and how it’s changing. Check back next month for updated data on country and city rankings, and look for updated Ookla Market Reports with 1H 2024 data in July.

Ookla retains ownership of this article including all of the intellectual property rights, data, content graphs and analysis. This article may not be quoted, reproduced, distributed or published for any commercial purpose without prior consent. Members of the press and others using the findings in this article for non-commercial purposes are welcome to publicly share and link to report information with attribution to Ookla.

| June 17, 2024

ISPs Driving Transformation in Broadband Performance Across the Caribbean

ISPs in the Caribbean have helped drive a step-change in performance across the region over the past four years. Fiber is at the forefront of this change, helping drive performance gains in terms of throughput and latency in leading markets such as Trinidad and Tobago, Bermuda, and the Cayman Islands, while Starlink’s LEO service is gaining a foothold in a number of islands too. Outside the leading Caribbean markets, performance varies significantly, but even among those lagging the regional average are advancing rapidly.

Key takeaways

  • Growing availability of faster broadband across the Caribbean. The last four years have seen a transformation in broadband performance in the Caribbean. Across the markets in this analysis, network Consistency – the share of Speedtest samples exceeding a threshold of 25 Mbps download and 3 Mbps upload – increased from 45.3% in Q1 2020, to 73.3% as of Q1 2024.
  • Fiber adoption driving performance gains. Trinidad and Tobago, Bermuda, and the Cayman Islands led the Caribbean region on fixed broadband performance, recording median download speeds of 110.26 Mbps, 109.79 Mbps, and 104.88 Mbps, respectively during Q1 2024. Strong fiber performance from a number of ISPs, including Digicel+ (across a range of markets), Amplia (Trinidad and Tobago), as well as Flow, Logic, and C3 Pure Fiber (Cayman Islands), helped drive this, with all recording median download speeds approaching or above 100 Mbps.
  • Latency performance varies hugely across the Caribbean. Key for real-time applications such as online gaming and video calling, latency performance varied significantly across the region. Thanks to the availability of fiber to most broadband users, markets such as Trinidad and Tobago hit median latency lows of just 15 ms in Q1 2024, while at the other end of the scale, markets such as Aruba and Haiti struggled with median latency approaching 100 ms.
  • Markets behind the curve are quickly catching up. The majority of Caribbean markets currently below the regional average for fixed network Consistency are catching up fast, led by markets such as the Dominican Republic, Sint Maarten, and the British Virgin Islands, which all increased network Consistency by more than 25 percentage points over the last two years. 

Fixed network performance varies dramatically across the Caribbean

Ookla Speedtest Intelligence® data shows a wide disparity in median fixed broadband performance across Caribbean markets, ranging from lows of 2.72 Mbps and 25.21 Mbps in Cuba and Sint Maarten respectively, to highs of 110.26 Mbps and 109.79 Mbps in Trinidad and Tobago, and Bermuda respectively. Median upload performance mimicked this trend, with a low of 1.02 Mbps for Cuba and a high of 89.15 Mbps in the Cayman Islands.

Fixed Broadband Performance Across Caribbean Markets
Speedtest Intelligence® | Q1 2024

Latency performance showed even greater variance, with some markets being able to access high-speed international links, and with others relying on multiple hops of undersea cables. Eight of the markets we examined recorded median multi-server latency below 50ms, with Trinidad and Tobago leading with 15ms, followed closely by Curaçao with 16ms. At the other end of the scale, a cluster of nine markets recorded latency ranging from 71 ms to 95 ms, while Cuba was the only market with median latency greater than 100 ms, recording 133 ms in Q1 2024. This marks an improvement year-on-year, down from 164 ms in Q1 2023, with the Arimao submarine cable (connecting Cuba to Martinique), helping drive some improvement, however, the island’s aging telecoms infrastructure continues to hold it back.

Fiber is the natural next step for many Caribbean ISPs

A number of Caribbean ISPs, led by groups such as Digicel, are transitioning to fiber access across their fixed operations. The transition from legacy broadband access technology to more modern, faster connections such as fiber takes time. In addition to network rollout and the significant public works this entails, operators and regulators need to ensure users are given enough incentive and education on the benefits of technologies such as fiber, in order to help drive adoption. Digicel+ in Bermuda stands out as a clear leader in the region on median download performance, followed by Digicel+ in Trinidad and Tobago. Beyond Digicel+, Logic, and C3 Pure Fiber in the Cayman Islands, and Amplia in Trinidad and Tobago all offered median download speeds approaching 100 Mbps. 

ISP Fiber Performance, Caribbean Markets
Speedtest Intelligence® | Q1 2024

Drive for broadband expansion puts leading Caribbean markets on par with the U.S. and Canada

Caribbean ISPs have made great strides in advancing the rollout of broadband services over the last four years. Ookla uses the network Consistency metric to gauge how prevalent acceptable broadband speeds are across a network, based on the percentage of Speedtest samples exceeding a threshold of 25 Mbps download and 3 Mbps upload performance. Cuba was rooted to the foot of the table based on Consistency, with just 4.0% of samples exceeding the threshold. Of the remaining Caribbean markets in this analysis, network Consistency climbed from 45.3% in Q1 2020 to 73.3% in Q1 2024.

The majority of Caribbean nations in this analysis recorded Consistency above 70% as of Q1 2024, with leading Caribbean nations such as Bermuda, Trinidad and Tobago, the Cayman Islands, Puerto Rico, and Barbados posting Consistency values approaching those of more advanced fixed markets in the Americas, such as the U.S. (89.8%) and Canada (88.7%).

Fixed Broadband Consistency Across Caribbean Markets
Speedtest Intelligence® | Q1 2024

This positive trajectory looks set to continue for many markets at the lower end of the scale too, as they look to catch up with their peers. The vast majority of those Caribbean markets recording less than 75% Consistency in Q1 2024, had increased their Consistency significantly over the past two years, led by Haiti, Sint Maarten, the British Virgin Islands and the Dominican Republic.

Change in Fixed Network Consistency, Select Caribbean Markets
Speedtest Intelligence® | Q1 2022 vs Q1 2024

Leading Caribbean markets face slowing Consistency growth and competition from non-traditional fixed ISPs

We see a mixed picture for leading Caribbean nations on further increases in network Consistency as they begin to approach other leading markets globally. Despite strong fixed broadband performance in many Caribbean markets, increases in network Consistency have been relatively static in some, including Bermuda, Aruba, and Grenada, which all saw network Consistency increase by less than 3 percentage points in the last two years. This indicates a tranche of users in these markets remain below the 25 Mbps download and 3 Mbps upload performance thresholds used in our measure of Consistency.

While growth will naturally slow as markets approach nationwide availability of fixed broadband services exceeding 25 Mbps download and 3 Mbps upload, operators in these markets need to zero in on locations where performance lags the rest of the market and identify root causes. For regulators, the priority may lie in encouraging the sunsetting of legacy fixed technologies, and facilitating the rollout and adoption of faster technologies such as fiber.

Change in Fixed Network Consistency, Leading Caribbean Markets
Speedtest Intelligence® | Q1 2022 vs Q1 2024

LEO satellite broadband is emerging as a viable home broadband alternative

We are beginning to see some alternative fixed broadband technologies make inroads within the Caribbean, following on the heels of their success in North America. While we see some instances of GEO and MEO satellite internet use across the Caribbean, the majority of satellite internet within the region, based on Speedtest samples, is from Starlink’s LEO service. Over the course of the last year (comparing Q1 2024 with Q1 2023), samples from Starlink among the markets in this analysis grew by 85.8%, and it continues to expand its service availability across Caribbean markets. According to its website, Starlink operates across a range of Caribbean markets, and of those included in this analysis, it is available in the Bahamas, Barbados, the Dominican Republic, Haiti, Jamaica, Puerto Rico, Trinidad and Tobago, and the U.S. Virgin Islands.

Starlink performed on par with, or faster than, the median download speed in each market it operated within, recording significant leads in the U.S. Virgin Islands and the Bahamas. However, Starlink does tend to lag the rest of the market on upload speeds and latency. While the cost of Starlink equipment and its subscriptions are often higher than for terrestrial broadband options, which will put it out of reach of some broadband users, it offers a viable alternative, especially in locations where legacy fixed broadband access is still prevalent, and where users prefer faster download performance.

Starlink Performance, Median Download Speed, Mbps
Speedtest Intelligence® | Q1 2024

With a range of cellular providers launching 5G across the Caribbean, we may begin to see 5G fixed-wireless (FWA) access begin to take root, as it has done in the U.S. Given the wide range of performance across the Caribbean, 5G FWA could offer users an uplift in speeds versus traditional fixed networks, and it will give cellular providers the opportunity to upsell home internet services to their existing mobile customer bases. While it’s still early days for these rival technologies, we’ll continue to monitor their progress and provide updates on the state of fixed broadband connectivity across the Caribbean. For more information about Ookla’s data and insights, please get in touch.

Ookla retains ownership of this article including all of the intellectual property rights, data, content graphs and analysis. This article may not be quoted, reproduced, distributed or published for any commercial purpose without prior consent. Members of the press and others using the findings in this article for non-commercial purposes are welcome to publicly share and link to report information with attribution to Ookla.

| June 3, 2024

Gigabit Internet is the New Competition Ground for ISPs in the Middle East

Several Middle Eastern countries, including Bahrain, Jordan, Qatar, and the U.A.E., have emerged as leaders in fiber deployment and adoption. The introduction of gigabit packages and the increase in entry-level speeds have significantly boosted their ranking in the Speedtest Global Index®  for fixed broadband. This article examines the factors driving performance in these countries, the initiatives of ISPs to enhance indoor performance, and key enablers for wider gigabit internet adoption in the region.

Key Takeaways:

  • According to Ookla’s Speedtest Intelligence®, the U.A.E. leads the Middle East in fixed broadband performance in Q1 2024. The U.A.E. achieved a median download speed of 270.91 Mbps and an upload speed of 124.37 Mbps. Meanwhile, Bahrain and Qatar saw significant improvements in download and upload speeds, while the median download speed in Jordan rose rapidly from a small base, surpassing Saudi Arabia by Q1 2024. 
  • ISPs are addressing indoor performance bottlenecks with more modern consumer premise equipment (CPE). In-premise connectivity is crucial to guarantee maximum throughput on-premise. That is why ISPs started bundling Wi-Fi 6 compatible CPEs and deploying fiber-to-the-room (FTTR) for ubiquitous gigabit wireless access indoors.
  • Affordability is a barrier to wider gigabit adoption in the Middle East. While geography, level of competition, and government policies all impact fiber deployment, affordability is key to unlocking faster speeds in the region. Making gigabit plans more accessible can help operators boost fiber subscribers and aspiring countries to move up the Speedtest Global Index.

The U.A.E. tops the Middle East in Speedtest Global Index for fixed broadband

The analysis focuses on countries in the Middle East that are leading in fiber coverage, adoption, and speed enhancements, namely Bahrain, Jordan, Qatar, Saudi Arabia, and the U.A.E. These achievements were thanks to significant progress by local ISPs in extending fiber coverage, encouraging migration to higher-speed plans, and making services more affordable. Government support has been vital in accelerating fiber roll-outs to keep pace with the demand for data services and to ensure universal access to high-speed internet as part of national broadband development strategies. 

As a result, these countries continue to improve their Speedtest Global Index rankings. For example, the U.A.E rose from 18th in June 2020 to the second position in March 2024. Jordan jumped from 64th to 33rd while Bahrain jumped up 32 places to 63rd in the Index over the same period. Qatar’s position fluctuated between 29 and 45, with steady improvements since 2021. Saudi Arabia’s speed increase rate has been more modest than in other markets, causing a drop in the global ranking by 11 places to 46th in March 2024. The country is the largest in the group, which makes fiber coverage more limited outside the big cities, while there is a relatively large base of legacy copper connections.

Speedtest Global Index™ Rankings for Fixed Broadband, Select Countries in the Middle East
Speedtest Intelligence® | June 2020-March 2024
Speedtest Global Index Rankings for Fixed Broadband, Select Countries in the Middle East

Fixed broadband performance improved as faster entry-level fiber plans and gigabit packages were introduced

According to Speedtest Intelligence, the U.A.E. leads the Gulf region in median download speeds at 270.91 Mbps in Q1 2024, more than double the Q3 2022 figure. This represents the largest speed improvement among the reviewed countries. The turning point came in Q4 2022 when ISPs lifted the minimum broadband package speed from 250 Mbps to 500 Mbps and offered aggressive discounts to encourage upselling to faster fiber packages. The median upload speed also saw notable improvement, reaching 124.37 Mbps in March 2024.

Median Download Speeds for Fixed Broadband, Select Countries in the Middle East
Speedtest Intelligence® | Q1 2022-Q1 2024
Median Download Speeds for Fixed Broadband, Select Countries in the Middle East

Bahrain and Qatar also experienced significant and rapid rises in median download speeds, reaching 83.09 Mbps and 135.34 Mbps, respectively. The ISPs in the two countries saw significant improvements in upload speeds too. Users in Qatar saw the biggest jump in median upload speed, tripling from Q1 2022 to Q1 2024 to 115.74 Mbps. In Bahrain, the median upload speed increased by over 2.7x but remained the lowest of the group at 20.70 Mbps.

In Bahrain, the telecoms regulator mandated ISPs to double the speed of entry-level fiber packages in April 2023 while maintaining the same wholesale prices. This immediately impacted the market, with median broadband download speeds jumping from 48.14 Mbps in Q1 2023 to 70.17 Mbps in Q2 2023 (over 40%).

Qatar was the first country in the GCC to offer 10 Gbps consumer broadband packages. However, Ooredoo and Vodafone maintained a relatively low download speed on entry-level tariffs at 100 Mbps. This changed in June 2023, when they raised the minimum speed to 1 Gbps while offering discounts on more expensive fiber packages. These initiatives resulted in a step change in download speeds, increasing by 41% in Q1 2024 compared to Q2 2023.

Jordan began ramping up its fiber infrastructure in 2013-2014, with strong take-up since 2019 driven by increased competition, extended coverage outside the capital, and rising demand due to the COVID-19 pandemic. The launch of Fibertech, a fiber wholesale company, in 2019 significantly boosted service competition and led to more accessible and affordable fiber services for consumers. Fibertech, set up as a joint venture between ISP Umniah and Jordan Electricity Company, covered 1.2 Million households by July 2023 and planned to reach 1.4 million premises, 70% of Jordan’s households, by the end of that year.

Fiber overtook fixed wireless access (FWA) and ADSL connections in Q2 2021 and represented 56% of fixed broadband connections by the end of 2022. Fiber maintained its upward trajectory, capturing 64% of the market in 3Q 2023 with 513,744 active connections according to the last reported data from the Telecommunication Regulatory Commission (TRC)). Local ISPs have also been increasing the speed of entry-level plans and offering gigabit packages. For example, Orange Jordan introduced 2 Gbps and 10 Gbps plans in May 2023.  This accelerated fiber take-up boosted the median speeds for both download and upload, reaching 130.41 Mbps and 108.08 Mbps, respectively, in Q1 2024. Notably, Jordan doubled its median upload speed in two years, narrowing the gap with its median download speed.

In Saudi Arabia, stc led the way by increasing the minimum download speed from 100 Mbps to 300 Mbps in the summer of 2022. Mobily followed suit in 2023 by doubling the speed of its entry-level package and introducing a 1 Gbps broadband plan during Q2 2023. Zain initially reserved higher download speeds (ranging from 200 Mbps to 500 Mbps) for customers on 2-year contracts, while those on 12-month contracts received speeds between 100 Mbps and 300 Mbps. However, in 2023, Zain merged its plans into a standard 18-month contract starting at 200 Mbps, with 1 Gbps at the high end. These initiatives began to impact the market in Q2 2023, when the median download speed surpassed 90 Mbps for the first time, reaching 108.95 Mbps by Q1 2024. Upload speeds also saw significant growth, rising to 53.75 Mbps during this period.

Speedtest Intelligence’s Enrichment API allows us to track the adoption and performance of individual fixed broadband technologies and assess their impact on the Saudi market. For example, the fiber share of stc Speedtest samples has been growing – fiber represented 75.4% of Speedtest samples in March 2024, up from 69.9% in Q4 2023. This increased fiber adoption contributed to raising overall fixed broadband performance across download, upload, and latency metrics and widened the performance gap with legacy DSL lines. This result also highlights the potential for further improvement if most samples (and by extension, customers) switch to fiber.

DSL and Fiber Performance, Saudi Arabia
Speedtest Intelligence® | Q4 2022 – Q1 2024
DSL and Fiber Performance, Saudi Arabia

Improving indoor coverage is key to ensuring maximum fiber performance delivery to customers

ISPs in the analyzed countries have rapidly expanded their fiber footprint and migrated customers to faster broadband services, helping to increase the median download speed. However, the last few meters indoors, closer to the end-users, can be a potential bottleneck to achieving maximum throughput. To address this, local ISPs have taken steps such as:

  • Offering upgraded CPEs that support Wi-Fi 6. The choice of Wi-Fi standards and spectrum bands directly influences indoor connectivity quality, throughput, and network coverage. Our recent analysis found that over one-third of test samples in the Gulf region reported using Wi-Fi 4 to connect to the fixed CPE. More ISPs are now offering Wi-Fi 6 compatible CPEs and including additional mesh Wi-Fi nodes at no extra costs to improve indoor coverage and speed.
  • Deploying fiber-to-the-room (FTTR). This relatively new technology involves deploying and extending fiber connectivity to each room, usually through transparent cables, to provide ubiquitous gigabit wireless access. ISPs started deploying this technology in East Asia to differentiate their broadband offering and it is now being adopted by ISPs in the Middle East, including Jordan (Umniah and Zain), Qatar (Ooredoo), Saudi Arabia (Salam, stc), and the U.A.E. (Etisalat by e&).

Making gigabit internet more accessible will unlock faster speeds and drive wider adoption

Countries with small landmasses and populations, and high urbanization, such as Singapore, the U.A.E., Hong Kong (SAR), Iceland, and Monaco, top the Global Speedtest Index. While such geographical and demographic characteristics give an advantage to smaller nations as they facilitate the deployment of fiber infrastructure, other factors including market competition, government support, and service affordability are key to driving mass adoption.

Many of the top 10 markets in the Global Speedtest Index have multiple ISPs competing which drives investments in better technology and continuous upgrades to attract customers. A competitive landscape benefits consumers because it helps to keep prices relatively low. It also accelerates increases in median speeds as ISPs tend to offer free speed upgrades to existing customers. For example, in Hong Kong (which had 28 licensed ISPs as of March 2024) and Singapore, gigabit broadband speeds have been available to residential customers since the early 2010s, and ISPs have eliminated sub-1 Gbps plans. As a result, 85% of residential homes in Singapore and 68.0% in Hong Kong have at least 1 Gbps services. Chile, Latin America’s leader in fixed line performance and fourth in the Speedtest Global Index in Q1 2024, has six ISPs with more than 5% market share, all of which are heavily focused on migrating customers to fiber.

Governments in these leading countries have also prioritized strong digital infrastructure development with significant investment in infrastructure. For example, China has pursued a state-coordinated infrastructure deployment program to promote economic development. In France, the government’s “France Très Haut Débit” initiative aimed to provide fiber optic access to all citizens by 2025 through public-private partnerships. The Singaporean government invested S$1 billion to build the infrastructure of its National Broadband Network (NBN) which supported speeds of up to 10 Gbps and reached more than 95% premises in 2013. In February 2023, it announced an additional investment of up to S$100 million to upgrade the NBN to enable more than half a million households to benefit from speeds of up to 10Gbps by 2028.

While the broadband infrastructure in some countries from the Middle East is gigabit internet-ready, the disparity in income and the high price of these packages hinder the adoption rate of high-speed broadband services. For example, a 1 Gbps fiber line in Hong Kong or Singapore could cost as little as $30 per month, and a plan with a similar speed starts at $100 per month in Qatar,  $150 in the U.A.E., $250 in Saudi Arabia, and $345 in Bahrain. This highlights the need to make gigabit plans more affordable if the operators want to boost fiber subscribers and countries aspire to move up the Speedtest Global Index.

As demand for high-speed internet continues to grow, we expect increased adoption of 10 Gbps speeds to support more demanding applications and improve the user experience. Work is underway in some developed markets to build higher-capacity broadband networks to enable new cases and make the infrastructure future-ready. For example, In March 2024, Hong Kong Telecom announced the availability of 50 Gbps lines for residential and business customers. This trend is slowly emerging in the Middle East – Etisalat by E& in the U.A.E and Ooredoo in Qatar announced early experiments with 50G PON technology. We anticipate continued innovation and competition in the region, driving further advancements that will ultimately benefit end-users by delivering faster and more affordable gigabit connectivity options.

For more information about Speedtest Intelligence data and insights, please contact us.

Ookla retains ownership of this article including all of the intellectual property rights, data, content graphs and analysis. This article may not be quoted, reproduced, distributed or published for any commercial purpose without prior consent. Members of the press and others using the findings in this article for non-commercial purposes are welcome to publicly share and link to report information with attribution to Ookla.

| June 12, 2024

Exploring 5G Indoor Connectivity Within the Greater Bay Area

繁體字

The Guangdong-Hong Kong-Macao Greater Bay Area (GBA) is one of the regions with the fastest urbanization process in China in the past 4 decades. With the highest concentration of skyscrapers in the world, operators in the region must prioritize seamless indoor and outdoor 5G coverage to optimize services and meet customer needs.

In this report, we use data from Cell Analytics™ to examine the 5G indoor performance and signal quality across Guangzhou, Shenzhen, Hong Kong, and Macau, the four major cities in GBA.

Key Takeaways

  • Guangzhou and Shenzhen showed better city-wide indoor 5G coverage and quality compared to Hong Kong and Macau. Guangzhou reported a mean RSRP of -82.89 dBm, with Shenzhen slightly lower at -86.96 dBm. Additionally, both cities boast better 5G indoor quality with scores of 10.09 dB and 10.98 dB, respectively. In contrast, Hong Kong’s mean RSRP was at -87.36 dBm, while Macau’s was at -91.02 dBm.
  • China Mobile in Guangzhou stands out for offering better indoor 5G coverage in the city. The operator reported a mean RSRP of -79.17 dBm, which is significantly better by approximately 8 dB compared to China Unicom’s mean RSRP of -87.2 dBm. There were only minor differences in 5G indoor signal strength between operators in the other cities, but in Macau, the operators had significantly weaker indoor signal strength than almost all other operators in the other selected cities.

Indoor 5G Traffic Continue to Rise Among the Greater Bay Area Cities

The Guangdong-Hong Kong-Macao Greater Bay Area, commonly known as the Greater Bay Area (GBA), comprises nine cities in the Guangdong region of China and the two Special Administrative Regions (SAR) of Hong Kong and Macau. These cities are connected by an extensive transportation network, including high-speed rail, bridges, and tunnels, due to their proximity. As a key economic and technological hub in China, the adoption of 5G technology has become a key driver in the region, enabling the transformation of various industries and promoting automation and digitalization. In our recent article, we delved into the factors driving the rollout of 5G technology and examined its performance in the GBA region.

Indoor coverage is particularly important for the major “core” cities of GBA; Guangzhou, Shenzhen, Hong Kong, and Macau, where high-rise buildings dominate the skyline and indoor spaces play essential roles in commercial and tourist activities. In this recent article, we touched on the different technical solutions to address indoor cellular coverage challenges. 

Chart of Top Cities with Highest Number of Buildings More Than 150 Meters Height

In order to assess the reach of 5G coverage inside buildings, we analyzed data from Ookla® Cell Analytics™ to measure the percentage of buildings in Hong Kong, Macau, Shenzhen, and Guangzhou with reported indoor 5G samples between Q1 2023 to Q4 2023. In this analysis, we have only considered buildings taller than 10 meters, which is the height of a typical three-story building or more.

Chart of Percentage of Buildings with 5G Coverage in the Greater Bay Area

The chart shows an increase in the number of buildings with detected indoor 5G samples for every quarter from Q1 2023 to Q4 2023 across all four cities. Guangzhou, Shenzhen, and Macau all had an increase of more than 30 percentage points between Q1 2023 and Q4 2023, while Hong Kong saw a rise of 21 percentage points within the same period. The significant increase in the number of 5G base stations in China and its Special Administrative Regions has been the driving force behind the growth of indoor traffic. The Ministry of Industry and Information Technology (MIIT) of China announced that there were 3.38 million 5G sites in China at the end of 2023, which would have included a significant number of dedicated 5G indoor sites.

As 5G traffic continues to proliferate, subscribers are increasingly demanding optimal indoor coverage to ensure a seamless experience. Meeting these expectations requires a comprehensive strategy by the service providers that accounts for the unique challenges of the different indoor environments in each city.

5G indoor coverage and quality differs across the core cities of the Greater Bay Area

Drilling down into Cell Analytics data at the city level from Q4 2023 to Q1 2024, we evaluated subscribers’ 5G indoor experience by measuring the average Reference Signal Received Power (RSRP) and Reference Signal Received Quality (RSRQ). RSRP represents the network signal strength received by a mobile phone. An RSRP value that exceeds -90 dBm indicates superior coverage. If the signal strength is between -90 dBm and -100 dBm, then network coverage is considered good. Below this range, expect slower download speeds and potential network disconnections. RSRQ is a metric used to evaluate the quality of the reference signal received by a device. A value of -10 dB or higher indicates excellent network quality while a value between -10 dB and -15 dB is considered good. An RSRQ value lower than -15 dB is poor or indicates no signal at all.

We compared the average RSRP and RSRQ for each of the four major cities in GBA and plotted out the range between the values of the Lower 10% and the Top 90% to examine the variations in the signal strength and quality of each city.

Chart of Indoor 5G Lower 10%, Top 90%, and Mean RSRP in Select Greater Bay Area Cities
Chart of Indoor 5G Lower 10%, Top 90%, and Mean RSRQ in Select Greater Bay Area Cities

Overall, the Chinese cities of Guangzhou and Shenzhen reported better city-wide 5G indoor coverage than those of Hong Kong and Macau. Guangzhou reported a weighted average RSRP of -82.9 dBm of all samples detected inside buildings, followed by Shenzhen with RSRP of -87.0 dBm. Both cities also reported better city-wide 5G indoor quality compared to Hong Kong and Macau, at -10.1 dB and -11.0 dB, respectively.

The data shows a substantial variance in performance and quality between the top and bottom 10% of users when connected to 5G indoors in these cities. The Upper 90% of samples in all cities had extremely good RSRP, ranging from -77 dBm in Macau to -62 dBm in Guangzhou. While the Lower 10% reported signal strength of around -104 dBm. This indicates that while, in general, users were experiencing reasonable 5G average speeds indoors, there are still hotspots with a concentration of users who are experiencing poor performance and coverage.

5G performance uplift accentuates the need for better indoor coverage

While today’s indoor 4G and Wi-Fi networks may meet the current connectivity demands, having dedicated in-building 5G networks provides a more seamless and efficient connectivity experience, bridging the gap between 4G’s inherent limitations in terms of latency and performance with the requirements of newer data-intensive use cases and low-latency applications.

Ookla’s data for Q4 2023 to Q1 2024 reveal a higher percentage of users experiencing significant performance improvement when connected to 5G networks indoors. In Guangzhou and Shenzhen, over 45% of indoor 5G samples achieved speeds of 200 Mbps or higher, while only approximately 15% of 4G users experienced the same speed. The percentage is much higher in Macau, where more than 60% of indoor 5G users were on speeds of more than 200 Mbps, as compared to only 7.8% for those on 4G indoor networks.

Significant variations in 5G coverage among operators in Guangzhou, while operators in other cities exhibit only minor differences

Given the increasing reliance on mobile services for commercial transactions, ensuring uninterrupted 5G connectivity within buildings is paramount for service providers and building owners, particularly in buildings with a high concentration of users. This can be achieved by deploying advanced technologies such as small cells, distributed antenna systems (DAS), and network function virtualization (NFV). This enhances the consumer experience and adds substantial value to businesses by enabling various digital services, such as 8K video, augmented and virtual reality, and the Internet of Things (IoT). The building tenants can also leverage the 5G network to connect video cameras, point-of-sale (PoS) devices, and signage systems, which can attract customers who rely on mobile services for digital store deals and commercial transactions.

Through Cell Analytics data, we compared the 5G signal strength (RSRP) of top operators in Guangzhou, Shenzhen, Hong Kong, and Macau from Q4 2023 to Q1 2024. For each location, we compare operators’ RSRP values of samples detected inside buildings with a height of more than 10 meters to determine which ones offer better 5G coverage.

In Guangzhou, China Mobile had the best indoor 5G coverage across the city. Their weighted mean RSRP was -79.2 dBm, which is around 8 dB stronger than China Unicom’s mean RSRP of -87.2 dBm. The Upper 90% of China Mobile’s 5G network users reported a strong signal strength with an RSRP of -44 dBm when they were indoors. This indicates that there could be more buildings with dedicated wireless 5G networks in the city.

Chart of Guangzhou Indoor 5G Signal Strength

The three service providers in Shenzhen reported a small variation in their 5G indoor signal strength. China Mobile had a slightly better mean RSRP at -85.1 dBm, compared to China Unicom’s -86.8 dBm and China Telecom’s -89.4 dBm. Overall, there is unlikely to be a significant difference in 5G coverage when indoors, and consumers in the city may not notice any major differences. During the period, there were insufficient samples available for China Broadnet to be included in the analysis.

Chart of Shenzhen Indoor 5G Signal Strength

In Hong Kong, much like what was observed in Shenzhen, the difference in average signal strength among the top four telecom operators was marginal. Between Q4 2023 and Q1 2024, the difference in the mean RSRP between the carriers was only 1.5 dB. SmarTone stood out slightly by having the highest RSRP at -85.5 dBm. This indicates a competitive and closely matched performance among the operators, with opportunities for further improvements in indoor connectivity and quality.

Chart of Hong Kong Indoor 5G Signal Strength

Macau is the most recent city in GBA to launch its 5G network, with CTM and China Telecom Macau receiving their 5G licenses in November 2022. In our previous report, we discussed how Macau, being a newly launched network, was rated higher than the other three cities in terms of overall 5G performance. However, the latest data reveals that in terms of indoor 5G signal strength, both operators are trailing behind other operators in the selected cities, except for China Broadnet in Guangzhou. Both CTM and China Telecom Macau reported 5G indoor mean RSCP lower than -90 dBm, with CTM at -90.1 dBm and China Telecom Macau at -92.5 dBm.

Chart of Macau Indoor 5G Signal Strength

The imperative of 5G indoor network expansion

With the increasing adoption of 5G technology, consumers are expecting faster network speeds and consistent connectivity. As most 5G data traffic is expected to occur indoors, prioritizing the expansion of indoor coverage is crucial for operators to meet users’ expectations. 5G indoor deployments are a strategic avenue for operators to monetize their investments through advances such as massive IoT (IoT), enhanced mobile broadband (eMBB), and fixed wireless access (FWA), which will all play an important role in transformation across sectors such as industrial automation, retail applications, and smart cities. The primary challenge lies in delivering consistent performance and quality across various indoor settings, where issues may be confined to certain floors or sections.

Regulators can have a proactive role in reducing bureaucratic hurdles and encouraging government-industry collaboration, such as promoting the parallel development of indoor and outdoor 5G coverage across the country. As a step towards prioritizing 5G indoor coverage, China’s Ministry of Industry and Information Technology (MIIT) mandated that operators share the mid-band spectrum (3.3-3.4 GHz) for indoor coverage to promote co-development and cost-sharing. 

There is also a significant push in the GBA to extend 5G coverage, making it readily available in public transport infrastructures. One such example is CSL, which provides 5G network coverage along the MTR lines in Hong Kong, with some routes utilizing dedicated 5G spectrum. 

Ookla can assist operators in identifying buildings or indoor venues with coverage or capacity issues using crowdsourced data and diagnosis. Powered by millions of signal measurements collected daily by Speedtest®, Cell Analytics provides intelligence about wireless service quality, RF measurements, data usage, user density, cell site locations, and much more. It helps operators to track their own and competitors’ performance and understand how new 5G deployments are affecting user experience and quality of service. To find out more about Cell Analytics, please get in touch.


探索大灣區 5G 網路室內鏈接

粵港澳大灣區 (GBA) 是過去 40 多年來,中國都市化最快的地區之一。該地區是全球摩天大樓最集中的地區,營運商必須優先考慮室內外 5G 無縫覆蓋,以優化服務並滿足客戶需求。

在本報告中,我們使用 Cell Analytics™ 的資料,檢驗廣州、深圳、香港和澳門這四個 GBA 主要城市的 5G 室內效能和訊號品質。

關鍵摘要

  • 與香港和澳門相比,廣州和深圳的全市室內 5G 覆蓋範圍和品質更好。廣州報告的平均 RSRP 為 -82.9 dBm,深圳略低,為 -87.0 dBm。此外,兩個城市的 5G 室內品質均較好,得分分別為 10.1 dB 和 11.0 dB。相比之下,香港的平均 RSRP 為 -87.4 dBm,而澳門為 -91.0 dBm。
  • 廣州移動因在該市提供更好的室內 5G 覆蓋而脫穎而出。該營運商的平均 RSRP 為 -79.17 dBm,以 8 dB 的差距,明顯優於中國聯通的平均 RSRP -87.2 dBm。其他城市營運商之間的 5G 室內訊號強度僅有微小差異,但在澳門,營運商的室內訊號強度明顯弱於其他選定城市的幾乎所有其他營運商。

大灣區城市室內 5G 流量持續上升

粵港澳大灣區普遍稱為大灣區 (GBA),由中國廣東地區九個城市及香港、澳門兩個特別行政區組成。由於鄰近,這些城市由廣泛的交通網絡連接起來,包括高鐵、橋樑和隧道。這裡是中國重要的經濟和技術中心,而 5G 技術的採用已成為該地區的關鍵驅動力,推動著各行各業轉型,並促進自動化和數位化。在我們最近的 文章中,我們深入研究了推動 5G 技術推出的因素,並研究了其在大灣區的表現。

室內涵蓋率對於 GBA 主要「中心」城市尤為重要,廣州、深圳、香港和澳門的高樓大廈主宰著天際線,室內空間在商業和旅遊活動中扮演著重要角色。在最近的這篇文章中,我們探討了解決室內蜂窩覆蓋挑戰的不同技術解決方案。

图形:最多建築物高度超過 150 公尺的城市

為了評估建築物內的 5G 涵蓋率,我們分析了 Ookla® Cell Analytics™ 的資料,以衡量在 2023 年第 1 季到 2023 年第 4 季期間,香港、澳門、深圳和廣州回報室內 5G 樣本的建築物比例。在此分析中,我們只考慮了高於 10 公尺的建築物,亦即典型三層樓以上建築的高度。

图形:大灣區 5G 覆蓋建築物比例

圖表顯示,從 2023 年第 1 季到 2023 年第 4 季,四個城市偵測到室內 5G 樣本的建築物數量,每一季均有增加。廣州、深圳和澳門在 2023 年第 1 季到 2023 年第 4 季期間的成長幅度均超過 30 個百分點,而香港在同一期間的成長幅度為 21 個百分點。 中國和特別行政區 5G 基地台數量大幅成長,是室內流量成長的驅動力。根據中國工業和資訊化部 (MIIT) 公告,在 2023 年底,中國有 338 萬座 5G 基地台,其中包括大量專用的 5G 室內基地台。

隨著 5G 流量持續激增,訂閱用戶為了獲得無縫的體驗,對最佳室內涵蓋率的要求也愈來愈高。滿足這些期望需要服務提供者制定全面的策略,以應對每個城市不同室內環境的獨特挑戰。

大灣區中心城市的 5G 室內涵蓋率與品質各不相同

我們深入研究 2023 年第四季至 2024 年第一季城市層級的 Cell Analytics 數據,透過測量平均參考訊號接收功率 (RSRP) 和參考訊號接收品質 (RSRQ) 來評估使用者的 5G 室內體驗。RSRP 代表手機接收到的網路訊號強度。RSRP 值超過 -90 dBm,表示涵蓋率優異。如果訊號強度在 -90 dBm 和 -100 dBm 之間,則認為網路覆蓋範圍良好。 低於此範圍,下載速度會變慢,並且可能會出現網路連線中斷的情況。RSRQ 是用於評估設備接收的參考訊號品質的指標。-10 dB 或更高的值表示網路品質極佳,介於 -10 dB 和 -15 dB 之間的值則是尚可。RSRQ 值低於 -15 dB 表示訊號較差或根本沒有訊號。

我們比較了 GBA 四個主要城市的平均 RSRP 和 RSRQ,並繪製出後 10% 與前 90% 之間的範圍,以檢視每個城市訊號強度和品質的差異。

图形:部分大灣區城市室內 5G 的後 10%、前 90% 和平均 RSRP

图形:部分大灣區城市室內 5G 的後 10%、前 90% 和平均 RSRQ

整體而言,中國城市廣州和深圳的 5G 室內覆蓋範圍優於香港和澳門。廣州報告在建築物內檢測到的所有樣本的加權平均 RSRP 為 -82.9 dBm,其次是深圳,RSRP 為 -87.0 dBm。與香港和澳門相比,這兩個城市的全市 5G 室內品質也更好,分別為 -10.1 dB 和 -11.0 dB。

資料顯示,這些城市中,前 10% 使用者和後 10% 的使用者在室內連接 5G 時,效能和品質有顯著差異。所有城市上 90%的樣本都具有非常好的 RSRP,範圍從澳門的-77 dBm 到廣州的-62 dBm。後 10% 的樣本則顯示訊號強度約為 -104 dBm。這說明雖然整體而言,使用者在室內能體驗到合理的 5G 平均速度,但在使用者集中的熱點,效能和涵蓋率體驗仍然不佳。

5G 性能提升凸顯對更好室內覆蓋的需求

雖然現在的室內 4G 和 Wi-Fi 網路可以滿足目前的連線需求,但擁有專用的室內 5G 網路,能夠提供更順暢、有效率的連線體驗,以滿足新的資料密集型使用案例和低延遲應用需求,彌補 4G 在延遲和效能方面的固有限制。

Ookla 2023 年第四季至 2024 年第一季的數據顯示,在室內連接 5G 網路時,體驗到效能顯著提升的用戶比例更高。在廣州和深圳,超過 45% 的室內 5G 樣本實現了 200 Mbps 或更高的速度,而只有約 15% 的 4G 使用者體驗到了相同的速度。該比例在澳門高出許多,室內 5G 使用者速度超過 200 Mbps 的比例超過 60%,4G 室內網路的使用者則僅有 7.8%。

廣州業者 5G 覆蓋差異較大,其他城市業者差異較小

由於商業交易愈來愈依賴行動服務,因此對服務提供者和建築物擁有者而言,確保建築物內的 5G 連線不中斷是首要之務,在使用者密集高的建築物中更是如此。這可以透過部署小型蜂窩、分散式天線系統 (DAS) 和網路功能虛擬化 (NFV) 等先進技術來實現。如此一來,就能夠提供 8K 影片、擴增實境和虛擬實境及物聯網 (IoT) 等多種數位服務,藉此提升用戶體驗,並為企業增加巨大價值。大樓租戶還可以利用 5G 網路連接攝影機、銷售點 (PoS) 設備和標牌系統,這可以吸引依賴行動服務進行數位商店交易和商業交易的客戶。

透過 Cell Analytics 資料,我們比較了廣州、深圳、香港和澳門頂尖營運商在 2023 年第 4 季到 2024 年第 1 季的 5G 訊號強度 (RSRP)。在每個地點,我們利用在超過 10 公尺高的建築物內偵測到的樣本,比較了營運商 RSRP 值,以判斷哪些城市提供的 5G 涵蓋率更佳。

在廣州,中國移動擁有全市最好的室內 5G 覆蓋範圍。他們的加權平均 RSRP 為 -79.2 dBm,比中國聯通的平均 RSRP -87.2 dBm 高出約 8 dB。中國移動前 90% 5G 網路使用者回報的室內訊號強度較強,為 RSRP -44 dBm。這表明該市可能會有更多擁有專用無線 5G 網路的建築物。

图形:廣州室內 5G 訊號強度

深圳的三家服務提供者報告其 5G 室內訊號強度略有差異。與中國聯通的 -86.8 dBm 和中國電信的 -89.4 dBm 相比,中國移動的平均 RSRP 略高,為 -85.1 dBm。總體而言,室內 5G 覆蓋範圍不太可能出現顯著差異,城市消費者可能不會注意到任何重大差異。在此期間,中國廣電沒有足夠的樣本可供分析。

图形:深圳室內 5G 訊號強度

在香港,與深圳的情況非常相似,四大電信業者之間的平均訊號強度差異微乎其微。2023 年第四季和 2024 年第一季之間,各載波之間的平均 RSRP 差異僅為 1.5 dB。SmarTone 的 RSRP 最高為 -85.5 dBm,稍微突出。這表明運營商之間的競爭和緊密匹配的表現,以及進一步改善室內連接和品質的機會。

图形:香港室內 5G 訊號強度

澳門是 GBA 最晚推出 5G 網路的城市,CTM 和中國電信 (澳門) 於 2022 年 11 月獲得 5G 執照。我們先前的報告討論過,澳門新推出的網路整體 5G 效能為何比其他三個城市更優異。然而,最新資料顯示,就室內 5G 訊號強度而言,除了廣州的中國廣電之外,這兩家營運商都落後於選定城市的其他營運商。CTM 和中國電信澳門均報告 5G 室內平均 RSCP 低於-90 dBm,其中 CTM 為-90.1 dBm,中國電信澳門為-92.5 dBm。

图形:澳門室內 5G 訊號強度

5G 室內網路擴容勢在必行

5G 技術日益普及,消費者對網路速度和連線穩定度的期望也隨之提高。由於大部分 5G 數據流量預計發生在室內,因此優先擴大室內覆蓋範圍對於營運商滿足用戶期望至關重要。營運商能夠經由 5G 室內部署這個策略途徑,透過大規模物聯網 (IoT)、增強型行動寬頻 (eMBB) 和固定無線接取 (FWA) 等先進技術,將投資變現。這些技術將在工業自動化、零售應用和智慧城市等領域的轉型中,佔有一席之地。主要挑戰在於在各種室內環境中提供一致的性能和質量,其中問題可能僅限於某些樓層或部分。

監管機構可以在減少官僚障礙和鼓勵政府與行業合作方面發揮積極作用,例如促進全國室內和室外 5G 覆蓋的並行發展。中國工業和資訊化部 (MIIT) 為了優先發展 5G 室內涵蓋率,要求營運商共享中頻段頻譜 (3.3-3.4 GHz),以促進共同開發和成本分攤。

大灣區也大力推動擴大 5G 覆蓋範圍,使其在公共交通基礎設施中隨時可用。其中一個例子是 CSL,他們在香港地鐵沿線提供 5G 網路涵蓋率,其中幾個路線使用了專用的 5G 頻譜。

Ookla 可以利用群眾外包的資料和診斷,協助營運商識別有涵蓋率或容量問題的建築物或室內場所。Cell Analytics 利用 Speedtest® 每天收集的數百萬個訊號測量資料,提供有關無線服務品質、RF 測量值、資料使用量、使用者密度、行動網路基地台位置等資訊的相關情報。它可以幫助營運商追蹤自己和競爭對手的表現,並了解新的 5G 部署如何影響用戶體驗和服務品質。要了解有關 Cell Analytics 的更多信息,請 與我們聯繫

Ookla retains ownership of this article including all of the intellectual property rights, data, content graphs and analysis. This article may not be quoted, reproduced, distributed or published for any commercial purpose without prior consent. Members of the press and others using the findings in this article for non-commercial purposes are welcome to publicly share and link to report information with attribution to Ookla.

| June 11, 2024

Downdetector Helped the Early Detection of Major Outages During the First Half of 2024

Since the beginning of 2024, there have been several high-profile outages causing service disruptions. Ookla’s Downdetector™ captured these events based on consumer reports, providing a unique perspective that can help us understand how they affect end-users. In this article, we analyze this data to assess the scale of selected outages, explore how they spread, and uncover interesting consumer behavior patterns.

Key takeaways

  • On February 22, 2024, AT&T experienced the largest operator outage in the world since 2020. Downdetector captured over 1.8 million reports related to AT&T’s nationwide outage reflecting its large scale. Ookla’s platform also helped alert Verizon and T-Mobile customers about the outage caused by AT&T to reduce unnecessary reports to their respective Downdetector pages.
  • In March 2024, Meta experienced one of the largest outages to date affecting several core services. Over 6.5 million reports were submitted in just over 2 hours related to Facebook on March 5th. A second outage in April 2024 highlighted the value of Downdetector to rapidly detect the outage for swift response times, as it identified the issue quickly through user reports, unlike traditional network and application testing solutions.
  • Telkom in South Africa witnessed a few network outages since March 2024: On May 13th, Telkom’s South African network experienced a temporary nationwide outage, causing customers to lose signal and access to their services. That outage followed a series of disruptions affecting subsea cables in Africa, highlighting the vulnerability of this critical communications infrastructure and the need for diversification and backup solutions such as satellite internet.

Services outages have been more in the news in recent months and have an ever-growing impact on consumers and businesses alike

In the past 18 months, several high-profile outages have disrupted services across several industries – from telecommunications (AT&T in the U.S.) and social media (Meta) to cloud services (Microsoft and AWS). These disruptions extend far beyond momentary inconvenience. As consumers increasingly depend on constant connectivity for communication, entertainment, and essential services like emergency response, the stakes are high. Businesses with a strong online presence and those reliant on cloud services are particularly vulnerable, risking productivity and revenue loss, as well as potential reputational damage.

Our digital infrastructure’s highly interconnected nature means a single outage can trigger a cascade of disruptions across various sectors. In today’s era of round-the-clock media and social platforms, even small disruptions can quickly escalate into significant crises, amplifying their visibility and impact.

It is therefore crucial to have systems in place to detect such events, manage outages, and develop a comprehensive contingency plan. By spotting anomalies early, service providers can isolate problems, minimize downtime, prevent escalations, and keep users informed throughout the outage. In this context, crowdsourced data can complement internal fault detection systems by assessing the outage’s scale and providing real-time information to affected users. Identifying priority areas allows for a more coordinated response, minimizing impact and protecting the company’s reputation.

Ookla’s Downdetector™ is the leading source for real-time status and outage information for thousands of services and websites around the world. Powered by unbiased, transparent user reports and problem indicators from around the web, it helps understand disruptions to vital services, empowering consumers, and informing businesses when customers are experiencing issues. The platform tracks over 14,000 services from around the world and receives reports from more than 200 million unique users. Users submit problem reports on Downdetector localized websites, which also collect indicators from social media and other web sources. These reports are then validated and analyzed in real-time to flag potential service disruptions and other problems. An incident is confirmed when the volume of reports significantly exceeds the typical baseline for a service. 

In the sections that follow, we leverage Downdetector data to analyze three outages that occurred during the first half of 2024 by tracing back their evolution, providing insightful analysis, and uncovering interesting consumer behavior trends.

AT&T experienced the largest operator outage in the world since 2020 according to Downdetector

AT&T, the largest mobile operator in the U.S.A. with over 240 million subscribers, experienced a nationwide network outage on February 22. This affected its mobile network, leaving thousands of users without voice, messaging, and data services for several hours. Based on the number of reports on Downdetector.com, this was the largest outage of any telecom operator in the world since November 2020.

At 2:45 AM CST on 22 February 22, 2024, Downdetector started receiving thousands of self-reported incidents related to AT&T services, far exceeding the baseline. Reports peaked at 73,502 at 8:15 AM CST as people started their day. In total, AT&T received nearly 1.8 million issue reports on Downdetector between 2:45 AM CST and 5:45 PM. The number of reports started to dwindle rapidly after 10:45 AM, returning to normal by day’s end. This outage also affected AT&T’s sub-brand, Cricket Wireless, with reports tailing off in the late afternoon.

Rivals Verizon and T-Mobile also had higher-than-normal report volumes but on a much lower scale. Self-reported incidents peaked at 7:00 AM CST at 4358 and 1990 for Verizon and T-Mobile, respectively. The majority of these reports resulted from customers trying to connect to AT&T customers since both operators confirmed their networks were operating normally. These consumers are not wrong, though: they were unable to use their service as intended. To reduce the number of reports, Verizon and T-Mobile customers visiting Downdetector.com were informed that the issues being reported were likely related to AT&T. Such proactive measures helped to alert customers unaware of issues with third-party services that affect their experience and avoid unnecessary support calls.

Chart of Outage Reports for AT&T, Verizon, and T-Mobile

Downdetector data points to an internal root cause within the AT&T network since no major cloud services provider, or popular online services, received a large number of reports at the same time as it did. The issues were reported from across the US, with users from Houston, Chicago, and Dallas generating the most reports. AT&T attributed the issue to a technical error in the application and execution of an incorrect process during the network expansion process. Initial concerns were about potential cyberattacks but there was no evidence to suggest that. The outage onset also corroborates with the explanation provided by AT&T that it occurred during typical maintenance hours in the very early morning. According to AT&T, three-quarters of the network was restored by the afternoon. 

The outage also meant that customers were unable to call emergency services. Some public services, such as the New York Police Department, could not use their phones connected to the AT&T network. However, AT&T’s FirstNet network for first responders such as the police and fire departments remained operational.

As a result of this incident, AT&T’s share price fell by 2% and it could face fines due to the inaccessibility of emergency services during the outage. AT&T also offered customers a $5 credit in compensation for the incident. This highlights the potential financial cost of service disruption if not managed efficiently and if the network is not quickly restored. 

Two months later to the day, AT&T experienced another, albeit more limited, outage that affected residents of Virginia and North Carolina due to equipment failure. The number of self-reported issues peaked at nearly 1300 in the morning of 22 May before subsiding one hour later.

Meta experienced one of the largest outages to date based on the number of services affected and the duration

On March 5, 2024, Meta experienced a widespread global outage impacting several of its core services including WhatsApp, Facebook, Facebook Messenger, Instagram, and Threads. The outage was first reported by mid-afternoon and began to clear at about 5:00 pm UTC, lasting about 2 hours. During this time, people could not log in to their Facebook accounts, with the site erroneously indicating that their passwords were no longer correct, sparking concerns about potential hacking.

Reports of issues with Meta’s services followed a similar trend:

  • Facebook reports started pouring into Downdetector around 03:15 PM UTC, peaking just 15 minutes later at over 2.35 million trouble notifications within that period. Between 3:15 PM and 5:15 PM, the total number of submitted reports exceeded 6.5 million.
  • For Instagram, the number of reports peaked at 529,140 at 3:30 PM UTC, with users reporting problems with the app.
  • People started reporting issues with Facebook Messenger‘s chatting services and problems logging in mid-afternoon, with a peak of 158,419 reports at 3:30 PM UTC.
  • Users on WhatsApp were comparatively much less affected by the outage, with only 25,312 reports between 3:00 PM and 5:30 PM, compared to 6.5 million for Facebook, over 1.8 million for Instagram, and 410,281 for Facebook Messenger.

Chart of Outage Reports for Meta's Services

Meta attributed the outage to an unspecified technical issue, with most users regaining access to its services by late afternoon. This episode highlights the potential risk of not quickly communicating about ongoing outages, raising customers’ concerns, and prompting them to change their passwords multiple times to regain access to their accounts, compounding incoming traffic to Meta platforms.

At the beginning of April, WhatsApp services went briefly offline again. Users could open the app and view their chats and history, but could not send or receive any messages. The same applied to Facebook Messenger; Instagram and Threads were less impacted. Starting at 6:10 PM UTC on April 3, 2024, Meta services, particularly WhatsApp, received many user reports on Downdetector. Between 6:00 PM and 8:30 PM UTC, WhatsApp reports amounted to over 1.7 million, much higher than that of Instagram at over 200,000 and Facebook at 35,721. Meta did not make an official statement explaining the cause of this outage.

Traditional network and application testing solutions did not detect this Meta outage because the network paths looked normal and did not exhibit any errors from the outside (using Ping-type tests). However, Downdetector identified the issue early thanks to user reports, highlighting the importance of quicker outage detection enabling faster response times.

Chart of Outage Reports for Meta's Services

Telkom in South Africa has witnessed a few network outages since March 2024

On May 13, 2024, a significant outage affected Telkom’s nationwide operations, leaving customers unable to use internet services, place calls, or send text messages. The service interruption began around 1:00 PM UTC, with user reports peaking between 1:00 PM and 3:00 PM UTC. During this window, approximately 48,433 outage reports were logged in Downdetector. Users also went to social media platforms such as X (formally Twitter) to voice their frustration. 

Although service was largely restored by 4:00 PM UTC, lingering issues persisted in some areas. Downdetector received reports well into the evening, indicating that certain users continued to face connectivity problems. In response to the inconvenience, Telkom offered all affected customers compensation of 1GB of data, valid for two days.

Chart of Outage Reports for Telkom

Analysis of the outage reported by Telkom subscribers revealed that 40% pertained to internet connectivity, while 35.2% related to mobile phone services. Almost a quarter of the complaints described the situation as a “total blackout” of the mobile network, suggesting an extensive disruption. The outage inevitably impacted access to popular online platforms, including TikTok, YouTube, and Netflix.

Chart of Outage Reports for Telkom, by Types

The root cause of Telkom’s outage on May 13, 2024, remains unspecified but it follows another disruption that occurred the day before and affected online services in South Africa and several countries on the east coast of the continent including Kenya, Tanzania, Rwanda, and Uganda. This broader disruption was attributed to damage to the undersea cable system that connects the region to the rest of the world. Customers reported slow internet speeds and intermittent service throughout the day.

A more extensive outage had previously impacted the Western and Southern parts of Africa, including South Africa, on March 14, 2024. This disruption was due to multiple failures of the undersea cables and resulted in significant economic repercussions. For example, banks were forced to close in several countries including Nigeria, and mobile users across the region faced sluggish speeds and interference with financial transactions.

Regardless of whether Telkom’s recent service disruption was directly related to the recent subsea cable damages or not, these events underscore the critical importance of this infrastructure in sustaining Africa’s connectivity with the globe and expose the vulnerabilities inherent in a communications network reliant on limited pathways. They also show the important role of South Africa in serving parts of the continent since big regional companies have data centers located in the country. 

The situation highlights the urgency for diversifying subsea cables and exploring alternative technologies, such as satellite internet from providers like Starlink, to serve as a contingency measure. However, even these technologies are not immune to challenges, as evidenced by the disruptions to Starlink in May 2024 due to a geomagnetic storm.

The network outages experienced by major service providers like Meta and AT&T emphasize that even the most extensive and relied-upon networks are susceptible to major service interruptions. Such disruptions can have a profound impact and disrupt critical services given consumers’ and businesses’ dependence on such infrastructure. The network disruptions faced by countries in Africa since March 2024 also highlight the economic risks linked to the limited number of subsea cables.

While infrastructure resilience improves over time, the complexity of modern systems means that organizations must proactively identify and mitigate network failures. Tools like Downdetector enable early detection, informed contingency planning, and transparent communication with concerned users – all essential for navigating outages and preserving user trust in an increasingly interconnected world.

If you would like to know more about Downdetector, please contact us.

Ookla retains ownership of this article including all of the intellectual property rights, data, content graphs and analysis. This article may not be quoted, reproduced, distributed or published for any commercial purpose without prior consent. Members of the press and others using the findings in this article for non-commercial purposes are welcome to publicly share and link to report information with attribution to Ookla.

| May 15, 2024

Qatar Shone During AFC Asian Cup 2023 on the Pitch and in Mobile 5G Performance

Following the FIFA World Cup® 2022, the first in the Middle East and the pioneering global football competition to be supported by 5G networks, Qatar welcomed an estimated 1.5 million fans for the 18th edition of the Asian Football Confederation’s (AFC) Asian Cup from 12 January to 10 February 2024. This article examines the performance of 5G networks in selected stadiums during the event and compares it to the 2022 FIFA World Cup and other major international sporting events in 2023 and 2024. 

Key takeaways

  • Qatar tops Ookla’s Speedtest Global Index®. Qatar moved into the top spot of the Speedtest Index in February 2024, surpassing the United Arab Emirates (UAE). This result showcases operators’ commitment to delivering the best network performance for visitors and residents.
  • Qatari stadiums delivered world-class 5G network performance. All six stadiums we tracked during the competition had a median download speed of at least 600 Mbps. The Ahmed bin Ali Stadium took a top spot with a speed of 964.33 Mbps, ranking favorably in the leaderboard of global sporting events, second only to the Super Bowl® in the U.S.
  • Superior network capabilities significantly enhanced web browsing and real-time online services. The high download speeds combined with ultra-low latency, under 34 ms across the stadiums, suggest that fans experienced minimal lag when streaming, video calling, or gaming online. The web browsing experience over 5G was excellent, evidenced by the low webpage load times ranging from 1.0 to 1.4 seconds.

Qatar was well-prepared for the AFC Asian Cup, drawing from its experience as the host of the 2022 FIFA World Cup 

Operators should prepare in advance and invest heavily in upgrading infrastructure in preparation for large sporting events. 5G is helping to transform the live event experience, creating a more engaging and interactive experience. Spectators and fans expect to share their experiences with friends and family through social media and stream the actions while watching live action from the pitch and replays from multiple angles and enjoy augmented reality games and services.

The AFC Asian Cup 2023 concluded in February 2024 with the host nation, Qatar, beating Jordan 3-1. Matches were played in nine stadiums across five cities as part of the international football tournament that involved 24 national teams.

It follows the successful organization of the World Cup 2022 in the country that saw 5G networks support 2.45 million cumulative stadium spectators and set a high standard, surpassing other major events like the French Open and Wimbledon in terms of 5G download speeds. The two local operators, Vodafone and Ooredoo, invested heavily in 5G infrastructure in preparation for this regional sporting event. 

The analysis covers eight stadiums across five cities. We used Speedtest Intelligence® to examine download and upload speeds and multi-server latencies for 5G within 200m of the stadiums’ center throughout the tournament for both operators combined. We also used Consumer QoE™ data with the same criteria to determine web page load time, reflecting the quality of supporters’ experiences, whether posting a picture or a message on Facebook or checking their live scores.

Map of Stadiums Analyzed with Speedtest Intelligence® and Consumer QoE™ During AFC Asia Cup 2023 in Qatar

Qatar outdid itself with ever better mobile 5G performance during AFC Asian Cup 2023

We used Speedtest Intelligence data to observe performance in the lead-up to and during the AFC Asian Cup. From September 2023 to February 2024, Qatar witnessed significant advancements in 5G network speed.  The median 5G download speed rose from 441.46 Mbps to 607.0 Mbps, and the upload speed increased from 24.79 Mbps to 36.66 Mbps. 

Chart of 5G Performance in Qatar

Qatar welcomed over 1 million visitors during the group stage, beating the previous AFC record achieved 20 years ago during the 2004 tournament in China. During that period, Ooredoo reported 190 TB of data volume while 5G usage share reached 50.1%. The tournament concluded with an estimated 1.5 million fans attending 51 games. The final match attracted over 86,000 fans at Lusail Stadium, where Ooredoo reported total data traffic of 35TB and delivered an average download speed of 244 Mbps and an upload speed of 50 Mbps.

These improvements contributed to elevating Qatar’s ranking to the number one position on the Speedtest Global Index® in February 2024, surpassing the United Arab Emirates, with a median download speed of 286.42 Mbps across all technologies. Qatar maintained its top spot in March 2024, following the Asian Cup, with a median download speed of 313.3 Mbps. To increase capacity and improve speed, operators have been deploying additional 5G sites and activating new 5G carriers, delivering exceptional network performance for their customers.

Qatari stadiums delivered world-class 5G network performance during the Asian Cup

Speedtest Intelligence data show that all six surveyed stadiums recorded a median 5G download speed of over 600 Mbps and a median upload speed of over 90 Mbps.  We identified two distinct groups based on their 5G performance:

  • The first group is where fans experienced the fastest speeds. It is led by Ahmed bin Ali Stadium, with a median download speed on 5G of 964.33 Mbps, followed by  Al-Janoub Stadium and Khalifa International Stadium, with median download speeds of 899.27 Mbps and 888.36 Mbps, respectively. 
  • The second group of stadiums had weaker performance overall but still commanded very high speeds, ranging from 602.20 Mbps for Education City Stadium to 730.73 Mbps for Al Bayt Stadium.

The leading stadiums in terms of median download speed also excelled in upload, with speeds exceeding 108 Mbps. Ahmed bin Ali Stadium and Al-Janoub Stadium had upload speeds of 110.46 Mbps and 110.87 Mbps, respectively. Education City Stadium was at the bottom of the list but still offered excellent download and upload speeds.

Chart of Median 5G Performance of Select Stadiums During AFC Asian Cup 2023 in Qatar

There has been a marked improvement in 5G network performance around the stadiums when comparing the 2023 AFC Cup to the FIFA World Cup in 2022. Al Janub Stadium, previously the top performer, saw an 18.7% increase in download speed to 757.77 Mbps. However, Ahmed bin Ali Stadium surpassed it with a 54.5% increase, reaching 964.33 Mbps in 2024. Khalifa International Stadium saw the most significant improvement since World Cup 2022, an increase in download speed to 888.36 Mbps. Al Bayt Stadium’s median download speed also climbed to 730.73 Mbps.

Chart of Median Download Speeds of Select Stadiums During AFC Asian Cup 2023 and FIFA World Cup 2022 in Qatar

Significant 5G performance improvements during the AFC Asian Cup propelled the six Qatari stadiums to rank favorably against other major sporting venues in the region and beyond, with the six surveyed stadiums used in AFC Cup 2023 just behind Allegiant Stadium in Las Vegas where the Super Bowl took place in 2024.

Chart of Median 5G Performance of Select Stadiums During AFC Asian Cup 2023 in Qatar

Latency is crucial for streaming, video calling, and online gaming and measures real-time online interactions. AFC stadiums had a tight range of multi-server latencies for 5G, except for Khalifa International Stadium. The latter had a lower latency at 20.3 ms, offering less lag and a better streaming experience than Al Bayt Stadium, which had a much higher latency at 33.8 ms. Fans in the other stadium experienced decent response times, ranging from 30.5 ms in Lusail Stadium to 32.7 ms in Education City Stadium.

Chart of Median 5G Multi-server Latency of Select Stadiums During AFC Asian Cup 2023 in Qatar

Web browsing performance across stadiums was excellent during the competition

We used Consumer QoE data to explore web page load time over 5G. These measurements reflect consumers’ real-world experiences of using the internet, like accessing social media sites and searching for information online. Accessing these services with little or no delay means less customer frustration and increased satisfaction. 

For this analysis, we included Abdullah bin Nasser bin Khalifa and Jassim bin Hamad Stadiums due to their larger data samples compared to Education City Stadium. The data shows that users experienced very quick webpage load times over 5G in all surveyed stadiums, with median load times ranging from 1.4 seconds to as low as 1.1 seconds. Fans in Abdullah bin Nasser bin Khalifa and Al-Janoub Stadiums enjoyed marginally faster webpage load times than those in other venues.

Chart of Internet Page Load Time of Select Stadiums During AFC Asian Cup 2023 in Qatar

The introduction of 5G has undoubtedly opened up new possibilities for enhancing the stadium experience for fans and spectators. Thanks to its high speed and low latency, 5G can enable more immersive and personalized experiences beyond traditional live viewing. Insights from the latest AFC Cup demonstrate how Qatar elevated its stadium mobile infrastructure to a world-class level, surpassing its notable efforts during the FIFA World Cup 2022.  This achievement also reflects the significant investments made by network operators to enhance 5G performance and ensure a great internet experience for fans and spectators alike.

To find out how Ookla’s crowdsourced data and analytical tools can help you track network performance during major sporting events, contact us.

Ookla retains ownership of this article including all of the intellectual property rights, data, content graphs and analysis. This article may not be quoted, reproduced, distributed or published for any commercial purpose without prior consent. Members of the press and others using the findings in this article for non-commercial purposes are welcome to publicly share and link to report information with attribution to Ookla.

| February 8, 2024

Introducing Speedtest® Hosted Layers for ArcGIS Online

Reliable connectivity is a cornerstone of daily life, powering communication, work, education, commerce, and critical emergency services (to name just a few). Yet many communities in both rural and congested areas lack reliable access to internet services.

Government officials, tasked with securing and allocating resources to improve broadband performance for unserved and underserved communities, need a clear picture of the state of connectivity in their jurisdiction to determine where digital divides exist. However, the federal, state, and local data that is currently used does not provide the scale and accuracy of measurements to ensure that all communities are properly represented in efforts to expand broadband access.

Based on millions of consumer-initiated tests taken every day, Speedtest® data provides regulators and government officials with an unparalleled, objective view into their constituents’ experiences when trying to access internet services. We are excited to announce that these insights are now easier than ever to access with the launch of Speedtest Hosted Layers for ArcGIS.

Visualize the state of connectivity using ArcGIS® Online

Many regulators and U.S. government officials utilize the GIS mapping platform, ArcGIS Online, to visualize datasets including national broadband published maps, demographic information, and the locations of important community anchor institutions. Government officials can now immediately add Speedtest Fixed and Mobile datasets to their analysis by leveraging Speedtest Hosted Layers for ArcGIS. This significantly reduces the integration effort and allows government officials to visualize pre-aggregated Speedtest data with existing layers at the national, state, county, census, and H3 Resolution-8 level.

The Speedtest hosted layers include real-world insights on the availability of networks and how these networks are performing. This is surfaced through key metrics including download speed, upload speed, latency, and jitter for all network providers in the area.

U.S. government officials can leverage the Speedtest Hosted Layers in ArcGIS to:

  • Immediately access fixed and mobile network insights in ArcGIS Online
  • Significantly reduce time-to-value by eliminating data ingestion and integration processes
  • Identify unserved and underserved areas and their applicable Broadband Serviceable Locations (BSLs) to support grant proposals and ensure proper funding
  • Monitor the progress of broadband deployments and performance of specific ISPs
  • Showcase the improvements in connectivity for external stakeholders

By painting a detailed picture of the current connectivity landscape based on the millions of daily consumer-initiatives tests taken with Speedtest, this crowdsourced data helps ensure unserved and underserved locations receive the funding needed to improve connectivity for all.

Want to ensure that your jurisdiction is getting the funding it needs? Inquire about the Speedtest Hosted Layers for ArcGIS today.

Ookla retains ownership of this article including all of the intellectual property rights, data, content graphs and analysis. This article may not be quoted, reproduced, distributed or published for any commercial purpose without prior consent. Members of the press and others using the findings in this article for non-commercial purposes are welcome to publicly share and link to report information with attribution to Ookla.

| April 2, 2024

Introducing Speedtest Insights™ for smarter, faster connectivity decisions

As the importance of connectivity has grown, understanding network performance and coverage has become essential for a broad group of stakeholders beyond just network engineers. Governments, regulators, infrastructure companies, and other enterprises outside of the traditional telecommunications space are now actively addressing connectivity challenges to pave the way for a more connected future.

While many tools exist for understanding network performance, most are built with network engineers in mind. The deep technical views that engineers require can be overly complex for users who just want straightforward connectivity insights. 

To that end, we are excited to announce the launch of our new product designed especially for this audience. Speedtest Insights™ helps you visualize connectivity on an intuitive map with user-friendly data — so that you can make connectivity decisions with clarity and confidence. 

See connectivity trends in the areas that matter most, no GIS skills required

With Speedtest Insights, no GIS skills are required to make informed decisions. View and compare network performance, mobile signal, and cell location data on an intuitive map-based platform.

Governments, regulators, infrastructure companies, and enterprises can leverage Ookla’s easy-to-use mapping interface to quickly understand connectivity at a high level or pinpoint precise areas of need. Speedtest Insights helps you: 

  • Visualize connectivity on an intuitive map with user-friendly data names and a simple “excellent, good, fair, poor” rating system
  • Eliminate guesswork about whether or not a network provides adequate service in an area and avoid costly in-person testing
  • Identify unserved and underserved areas to support grant proposals, win funding, and prioritize investment opportunities 

Measure real-world network performance and coverage

Every day, millions of consumer-initiated tests are taken with Speedtest by users around the world who want to understand their own connected experiences. Powered by the same crowdsourced Speedtest data, Speedtest Insights demonstrates real-world fixed and mobile network performance with metrics like Download Speed, Upload Speed, and Latency. 

You can also analyze Signal Strength and Signal Quality with signal data drawn from billions of crowdsourced daily network samples. Combined with Estimated Cell Locations, you can gain meaningful insight into the coverage of mobile networks. View 4G Signal Strength layered with 4G Cell Locations in the image below for a detailed view of mobile coverage in the U.K.

Real-world consumer-initiated data often differs from coverage data reported by carriers and provides a better look into how consumers are actually experiencing networks for more informed grant proposals and connectivity investment strategies.

Add administrative boundaries or other geographic areas to your map views such as counties, states/provinces, nations, and U.S. census tracts to get a better understanding of connectivity trends in the areas that matter most to you. View Fixed Download Speed layered with U.S. Census Tracts in the image below to identify census tracts that can be prioritized for broadband improvements.

Comprehensive performance and signal information within key geographic areas helps you monitor connectivity over time and ensure compliance with regulatory standards. With a wide range of customizable views, helpful features, and an easy-to-use interface, Speedtest Insights can help solve all of your connectivity challenges. 

Do you need to make smarter, faster connectivity decisions? Inquire here to get started with Speedtest Insights

Ookla retains ownership of this article including all of the intellectual property rights, data, content graphs and analysis. This article may not be quoted, reproduced, distributed or published for any commercial purpose without prior consent. Members of the press and others using the findings in this article for non-commercial purposes are welcome to publicly share and link to report information with attribution to Ookla.

| March 31, 2024

India's 5G Driving Improved Consumer Experience as Adoption Increases

India launched its first 5G network in October 2022, marking one of the most rapid nationwide 5G network deployments in the world. Moreover, India’s 5G network ranks among the top-performing networks globally. This article will analyze India’s 5G performance and evaluate whether the user experience has improved since the launch of 5G.

Key Takeaways

  • India ranked 14th globally in 5G median download speeds with 301.86 Mbps based on Q4 2023 data. Thanks to Reliance Jio and Bharti Airtel’s large-scale and swift deployment across the nation, India reached the top 15 markets with the fastest reported 5G median download speeds globally.
  • India’s country-wide 5G Availability increased throughout in 2023. 5G Availability improved from 28.1% in Q1 to 52.0% in Q4 2023, representing a 23.9 percentage point increase within a year. Reliance Jio’s 5G availability rate during Q4 2023 was 68.8%, 38.5 percentage points higher than Airtel’s 30.4%. 
  • India’s 5G network offers a superior experience in video streaming and mobile gaming compared to the existing 4G-LTE. Reliance Jio and Airtel’s 5G networks have improved video start times and reduced buffering compared to 4G LTE, clocking 5G video start times of 1.14 seconds and 1.29 seconds, respectively. In contrast, Reliance Jio’s 4G LTE video start time was 1.99 seconds and 1.73 seconds for Airtel. Mobile gamers also experienced improved median latency, with 77 ms and 92 ms for Reliance Jio and Airtel, respectively.
  • 5G Net Promoter Scores (NPS) in India continue to surpass those of 4G LTE. Operators’ 5G NPS continue to score positively compared to 4G, driven by improved performance. Reliance Jio and Airtel scored positively in their 5G NPS in Q4 2023, with similar NPS of 7.4 and 7.5, respectively. Both operators showed higher NPS on 5G compared to 4G LTE, with Reliance Jio seeing an uplift of 41.2 points on 5G compared to Airtel’s 37.6. 

Rapid and large-scale deployment boosts India’s 5G performance ranking 

The two largest operators in India, Reliance Jio and Bharti Airtel, have been the primary drivers of the 5G rollout in the country, making significant efforts to provide 5G coverage across the nation through rapid deployment. By the end of December 2023, India had more than four hundred thousand 5G base stations (BTSs) deployed nationwide, an increase of 7.7 times from January 2023, making it one of the fastest countries to roll out 5G globally. Ericsson forecasted that the number of 5G subscribers in India reached 130 million at the end of December 2023, compared to just over 10 million recorded at the close of 2022.

The large-scale and rapid deployment of the 5G network in India has been paying off by elevating India’s position in the list of countries providing the fastest 5G median download speed. Speedtest Intelligence® data shows that in Q4 2023, India was in the top 15 countries with the fastest 5G median download speeds globally, sitting in the 14th spot.

Chart of Median 5G Performance in Select Countries

The data shows that in Q4 2023, India recorded a 5G median download speed of 301.86 Mbps, slightly below Bulgaria’s speed of 306.44 Mbps. The GCC countries of the United Arab Emirates and Qatar led the fastest 5G markets globally during the period, with speeds of 654.59 Mbps and 516.79 Mbps, respectively. South Korea was the fastest Asia Pacific country, coming in third overall with a speed of 485.25 Mbps.

Median 5G download speed is 18 times that of 4G

India is a “mobile-first” market, with its mobile users consuming the highest data amount per smartphone globally. The average data traffic per smartphone in India is expected to increase further from 31 GB per month in 2023 to around 75 GB per month by 2029. Currently, 4G is the dominant mobile technology driving the demand for data. As more consumers adopt 5G, the preferred technology will gradually shift.

While the current 4G network in India may serve the daily connectivity needs of most mobile users, 5G technology offers a considerable performance uplift that can improve the user experience. When we compare 5G and 4G performance in India for Q4 2023, the 5G median download speed of 301.86 Mbps was 18 times faster than the 4G median download speed of 16.05 Mbps. Similarly, the 5G median upload speed (16.05 Mbps) was 5 times faster than 4G’s upload speed of 3.59 Mbps during the same period.

Chart of 4G and 5G Performance Comparison in India

While median 5G speed is a valuable measure to gauge the midpoint of the user experience on 5G networks, it does not provide a complete picture of the actual improvement over 4G. To further demonstrate the performance gap between 4G and 5G, we compared 4G median download speeds against the lower 10% of 5G speeds.

Chart of Comparison Trend Between 5G Lower 10% Against 4G Median Download Speed in India

Between Q4 2022 and Q4 2023, Speedtest Intelligence data revealed that users experiencing “slower” 5G speeds (i.e., speeds that fall in the lower 10% of 5G download speed samples) consistently had better speeds than the median download speed of 4G. 5G download speeds in the 10th percentile were more than twice that of the reported 4G median download speeds. In Q4 2023, the median download speed for 4G users was 16.05 Mbps, while the lower 10% of 5G users experienced speeds that were 2.4 times faster, at 38.21 Mbps or slower. 4G users migrating to 5G will notice the difference in performance, especially as they start to consume more data-intensive mobile applications and content.

5G Availability is rising, with Reliance Jio leading the way

In our previous report, we discussed the strategies of Reliance Jio and Bharti Airtel in expanding their 5G networks across India. Both operators have invested heavily in the rollout to make their networks available nationwide. Reliance Jio, the largest telecom operator in India, has implemented a 5G Standalone (5G SA) network for its 5G network from the beginning. On the other hand, Bharti Airtel has chosen to use a Non-Standalone (NSA) architecture for its 5G rollout at launch. For now, Airtel plans to employ 5G SA for fixed wireless access (FWA) services as traffic increases and eventually shift to a full 5G SA network in the long term. 

Ookla’s 5G Availability data from Speedtest Intelligence represents the percentage of 5G-active devices that spend the majority of their time connected to 5G networks. 5G Availability in India showed improvement throughout 2023, starting at 28.1% in Q1 2023 and rising to 52.0% in Q4 2023, representing a 23.9 percentage point increase within a year.

Chart of 5G Availability Trend in India

One of the main reasons for the increase in 5G Availability in India is the significant growth in 5G-capable smartphones. According to Counterpoint Research, India’s 5G smartphone shipment share crossed 52% in 2023, growing 66% year-on-year. The introduction of more affordable 5G-capable devices in the market has helped boost 5G adoption in the country. Canalys reported that in Q4 2023, devices in the US$100 to US$199 segment witnessed a growth of 168% in the country.

Using Speedtest Intelligence, we compared 5G Availability between these two operators during Q4 2023. Reliance Jio had the highest 5G Availability among the two at 68.8% during that period, ahead of Airtel, which reported 5G Availability of 30.3%. By leveraging a combination of low-band (700 MHz) and mid-band (3.5 GHz) spectrum, along with its extensive fiber network, Reliance Jio can provide its subscribers with a balance between coverage and performance.

Chart of 5G Availability by Providers in India

5G delivers improved video streaming experiences

While the operators are keen to grow their customer bases and prioritize migration toward higher-value post-paid subscribers, translating 5G performance gains into discernible improvements for the end-user experience is vital. Speedtest Intelligence Quality of experience (QoE) measurements provide valuable insights into consumers’ real-life connectivity and quality of experience across various services like web browsing, video streaming, gaming, and video conferencing. 

Network operators in India are actively working to enhance the value of consumer mobile subscriptions by focusing on video content delivery, just like other operators worldwide. The emergence of over-the-top (OTT) platforms has significantly changed the way Indian audiences watch videos, movies, and TV shows, thanks to the vast range of local content available. Ormax Media reported that India’s audience for OTT platforms is on a steady rise, reaching 481 million users in 2023, marking a 13.5% YoY increase from the previous year’s 424 million.

The video adaptive start time metric from Video Analytics in Speedtest Intelligence measures the time spent waiting for the video to start playing in the adaptive bitrate stage of the test, providing insight into consumers’ video streaming experience. 

Based on Q4 2023 data, the results showed that Reliance Jio and Airtel’s 5G networks offered faster video start times for customers than their 4G LTE networks. Reliance Jio’s 5G network reported a quicker video start time of 1.14 seconds than Airtel’s 5G network, which was 1.99 seconds. Reliance Jio’s customers experienced a more noticeable decrease in video start time from 4G to 5G, with a reduction of 0.85 seconds. Airtel’s consumers showed a slightly smaller improvement, with a difference of 0.44 seconds from 4G to 5G.

Chart of Video Adaptive Start Time in India

Mobile gaming benefits from 5G lower latency

The Indian online gaming industry has grown significantly at a CAGR of 28% over the last three years, reaching INR164 billion (US$1.9 billion) in 2023. India also boasts a substantial gaming community, with an estimated 425 million gamers in 2023, making it second only to China in terms of the world’s largest gaming community. Mobile gaming dominates India’s online gaming market, with an overwhelming 94% of the total gamer base actively engaging in mobile gaming experiences.

With such a large mobile gaming segment in India, 5G is expected to improve the gaming experience on mobile devices, further increasing its popularity. Boasting lower latency and improved throughput than previous mobile technologies, 5G allows for a better user experience, particularly for online gaming and cloud gaming services. 

Game Latency is a measure of lag time to popular gaming server locations. Latency affects a gamer’s reaction time and is essential in games that require quick reaction time. Based on Ookla’s Q4 2023 data, Reliance Jio had a lower latency of 77 ms on 5G compared to Airtel’s 92 ms. Both operators experienced better latency on 5G compared to 4G LTE. Reliance Jio’s latency improved by 29% on 5G compared to 4G (109 ms), whereas Airtel’s users experienced around a 15% improvement on 5G than 4G (108 ms).

Chart of Mobile Gaming Latency in India

Consumer sentiment towards 5G is positive but declining 

Network performance, availability, and quality are all factors that can impact a customer’s overall satisfaction with their service provider. Ookla measures Net Promoter Score (NPS), a gauge of customer satisfaction and loyalty. After completing a Speedtest, users are asked to rate the likelihood of recommending their service provider to friends or family on a 0-10 scale. These ratings are categorized into Detractors (score 0-6), Passives (score 7-8), and Promoters (score 9-10). NPS represents the percentage of Promoters minus the percent of Detractors displayed from -100 to 100. A score above 0 indicates that a provider’s audience is more loyal than not. 

In our recent article, we found that 5G users, on average, rated their network operator with NPS scores that were universally higher than those for 4G LTE users. The story is similar in India, where 5G NPS scores are on the positive end of the scale as opposed to scores for 4G. However, our data shows that, for all operators combined, 5G NPS in India has been decreasing quarterly. The difference in terms of uplift that 5G brings over 4G NPS score has decreased from 59.7 in Q4 2022 to 37.9 in Q4

Chart of Quarterly Net Promoter Score (NPS) in India

While it can be difficult to pinpoint the reasons behind 5G NPS declines, network performance isn’t the only factor that plays a role. Other factors can include customer care, pricing, and quality of other services. It’s also important to remember that as 5G scales in many of these early launch markets, the profile of 5G users is also changing from predominantly urban-based users to more of a mix of urban, suburban, and rural users, which brings additional coverage and performance challenges for network operators.

When comparing the 5G NPS scores of the two 5G operators in India, Ookla’s Speedtest Intelligence data shows that in Q4 2023, NPS for 5G users for both operators were similar, at 7.4 for Reliance Jio and 7.5 for Airtel. Reliance Jio’s 5G service recorded the largest difference in NPS when comparing users on its 4G LTE network to those on 5G during that period, with an uplift of 41.2 basis points. Airtel saw an increase of 37.6 basis points in its NPS score when comparing its 4G LTE network to its 5G network. That said, it’s worth noting that 5G NPS tends to decline as the initial excitement of the latest technology wears off, mirroring other early 5G markets.

Chart of 5G Net Promoter Score (NPS) in India

India has deployed its 5G network in record time, investing billions of dollars following its launch one and a half years ago. Additionally, the country is making significant progress in the adoption of the technology. While India rejoices in its rapid 5G deployment success, it is imperative that it continues to invest in new innovative services that are accessible to consumers to fulfill the promises and potential of 5G.

Both Reliance Jio and Airtel have introduced 5G Fixed Wireless Access (FWA) services, known as Jio AirFiber and Xstream AirFiber, respectively. These services are aimed at complementing their current 5G offerings as they explore new 5G use cases to monetize their investments. The operators are also looking to broaden their 5G service offerings to serve key enterprise verticals that demand highly reliable and low-latency communication. 

Vodafone Idea, the third-largest service provider in India, plans to launch its 5G services by mid-2024. Additionally, India’s Department of Telecommunications (DoT) will hold another spectrum auction in May 2024, offering more 5G bands to the market, thereby augmenting the 5G services available in India. Until then, we will continue to closely monitor the progress of 5G in India and see how performance and user experience evolve in the market. Subscribe to Ookla Research™ to be the first to read our analyses.

Ookla retains ownership of this article including all of the intellectual property rights, data, content graphs and analysis. This article may not be quoted, reproduced, distributed or published for any commercial purpose without prior consent. Members of the press and others using the findings in this article for non-commercial purposes are welcome to publicly share and link to report information with attribution to Ookla.

| March 19, 2024

Sunsetting Networks in Africa will be Gradual and More Selective Than in Other Regions

We recently examined operators’ plans for sunsetting 2G and 3G networks in the Middle East and North Africa (MENA) and highlighted the benefits and challenges of phasing out legacy networks. In contrast, Sub-Saharan Africa (SSA) is just beginning this journey, with South Africa leading the way compared to other large markets like Nigeria, as it aims to shut down 2G and 3G by 2027. This article examines the factors contributing to slower progress in SSA and suggests how operators might expedite the transition.

Key Takeaways:

  • Sunsetting is not yet a priority for most African operators. The shift from 2G/3G to more advanced technologies will be slower in Africa due to economic, social, and infrastructural factors as well as the strong dependence on existing legacy ecosystems. A gradual approach is recommended to maintain digital inclusiveness in Africa.
  • South Africa is the only country in SSA with an established plan to sunset 2G and 3G networks. Cell Analytics® data shows a large concentration of 2G and 3G users in suburban and rural areas as well as along transportation routes. South Africa plans to decommission these networks by 2027, but most countries, including Nigeria, have not yet set a date. We expect network sunsetting to be in full swing from 2030 onwards.
  • Operators should strike a balance between driving progress and maintaining the inclusivity of their services. African operators should continue to support and potentially expand their legacy networks to ensure continued access to critical communication services for most of the population while investing in the roll-out of 4G and 5G networks.

Network sunsetting could play a key role in addressing the growing demand for data and spectrum in Africa

More operators are contemplating turning off their 2G and/or 3G networks to refarm their existing spectrum and combine it with other bands to enhance 4G and 5G services, promising faster data speeds, lower latency, and enhanced connectivity. At the same time, operators seek to optimize spectrum utilization as it is a scarce and expensive resource. 

Our previous article delved into how decommissioning 2G or 3G networks can boost efficiency, reduce costs, and improve customer satisfaction. We also emphasized the importance of careful planning to minimize service disruption and potential financial and reputational damage.

2G and 3G network sunsetting across Africa is evolving very slowly, with no country on the continent having completed the transition yet. This delay in transitioning to newer network technologies has significant implications on the ability of the population to access high-speed internet which is vital for socio-economic development. It is important to explore the reasons behind the slow progress and identify potential strategies to overcome the challenges associated with sunsetting old networks.

3G remains the most prevalent network technology in SSA, but 4G will overtake it by 2027. The GSMA predicts that 3G’s share of connections will fall below 50% in 2025, while 2G adoption will decline under 10%. 4G connections will almost double between 2022 and 2030 to represent nearly half of the total, overtaking 3G by the end of 2027. Continued network upgrades and better device affordability will drive this surge. While 5G adoption will initially be slow, it is anticipated to gain momentum during the second half of the decade, reaching 17% by 2030. This shift will lead to a fourfold increase in mobile data traffic per smartphone by 2028, a higher rate than any other region, to 19 GB per month.

Network sunsetting is more important in SSA because of limited spectrum availability and the rapid growth in demand for faster-speed data services. As regulators released only a small quantity of spectrum, operators resorted to refarming existing spectrum bands to deploy 4G and 5G services. The low-frequency bands occupied by earlier network technologies are valuable due to their excellent propagation characteristics, making them ideal for fulfilling coverage obligations with 4G and 5G.

Network sunsetting in Africa is hampered by the prevalence of legacy infrastructure and the high cost of migrating customers

Many parts of the continent still heavily rely on legacy technology and will continue to do so in the short-to-medium term. This reliance makes the transition to newer generation networks more challenging and costly. In 2023, 3G represented 55% of mobile connections in SSA and is expected to represent a third of total connections by 2030. 

This shows that many revenue-generating customers are still on legacy networks. Operators are understandably hesitant to risk service disruptions and incur the significant investment and planning required to upgrade the infrastructure, which will make the transition more challenging and lengthier. Besides, 3G was launched less than a decade ago in several countries. In Burundi, Cameroon, Ethiopia, and Liberia, some operators have only introduced 3G services since 2019 or later, meaning the network costs have not yet been fully amortized. 

In the enterprise sector, Africa hosts millions of machine-to-machine (M2M) devices, some of them in difficult-to-reach geographies or embedded in cars and equipment, making replacement or upgrades challenging. For example, South Africa had 11.5 million M2M connections in Q3 2022, according to the Independent Communications Authority of South Africa (ICASA), while Kenya recorded more than 1.5 million M2M connections in Q3 2023.

Despite the expansion of mobile networks in many African countries, coverage gaps persist, posing a connectivity challenge. If operators decide to rush the decommissioning of older networks, they could leave many people losing mobile access, thus widening the digital divide. 2G is particularly suitable for the region’s large rural population because 2G base stations can provide good coverage across large distances. That is why in many African countries, 2G coverage of the population has reached or exceeded 90% while that of 3G and 4G lag behind.

The prevalence of basic and feature phones across the continent is another barrier. Handset compatibility issues with newer technologies and the higher costs of smartphones and data plans represent significant hurdles for low-income populations, complicating the transition process.

Finally, operators may face regulatory challenges when retiring old technologies. Spectrum freed from legacy networks may not be readily available for new networks after the switch-off if it is tied to a specific technology. Repurposing it for modern networks can also be a bureaucratic and time-consuming process.

African operators can adopt different strategies to address challenges that hinder the sunsetting process

The challenges outlined above contribute to the slower rate of network sunsetting in Africa compared to other regions. However, operators can employ various strategies to facilitate the decommissioning process while mitigating the negative impact on revenue and brand.

The decision to sunset one network before another should be informed by market conditions, including the number of customers that use legacy networks, the cost of maintaining their operations, and the dependency of enterprise services on these networks. In either case, it is important to adopt a phased approach to sunsetting, prioritizing areas with higher 4G coverage first, before moving to rural and remote regions. This approach will help to minimize disruption and allow users more time to prepare for the transition.

Operators could encourage subscribers to upgrade to newer devices that support 4G and 5G networks through incentives such as handset trade-in programs or subsidies for low-income individuals. They should couple it with awareness campaigns to educate subscribers about the benefits of newer networks and the steps they need to take to ensure a smooth migration.

Operators should also communicate early about potential service disruptions and the timeline for the switch-off to make the necessary adjustments to their M2M systems. For example, they could offer incentives or subsidies to upgrade to 4G-grade M2M technologies, such as LTE-M, which offer longer usable life, larger operating range, and higher data rates. Offering assistance to enterprises to address any network compatibility and reliability issues during and after the migration is also essential. The regulator should be involved in the discussions around sunset plans as it may require operators to maintain some capacity and coverage for critical IoT infrastructure.

For spectrum reuse, operators should lobby the regulators for technology-neutral licenses, enabling them to use the old spectrum once released. Reducing regulatory constraints and requirements will help to improve network coverage and reduce capital expenditure. A recent GSMA report highlights that countries in Africa that adopted technology-neutral licensing have seen a 30% rise in mobile internet penetration, and a 74% improvement in 4G coverage, in contrast to 24% and 57%, respectively, for countries without such licensing.

Network sunsetting is not yet a priority in Africa given the prevalence of 2G and 3G connections

2G will likely remain important during the rollout of 4G and 5G for years to come because it supports essential consumer services in Africa, including voice, basic information, and mobile money transactions. As 4G provides a much better data experience than 3G, operators will likely consider sunsetting 3G before 2G. We used Speedtest Intelligence’s “Availability” data to get the percentage of users with a service-active device who spend the majority of their time connected to 2G and 3G in Nigeria and South Africa, the two largest markets in Sub-Saharan Africa by revenue. This data is a proxy for the relative penetration of 2G and 3G in these markets. Since customer-initiated Speedtest® measurements require a relatively modern phone, samples reported as 2G or 3G indicate the unavailability of 4G and 5G coverage rather than actual 2G and 3G usage. As such, we rely on this data solely to gauge the relative penetration of 2G and 3G in these markets. 

Speedtest Intelligence® data showed that the 2G/3G share of connections has been trending down in Nigeria and South Africa throughout 2023. By February 2024, 3G penetration in Nigeria was at 7.4% and in South Africa at 4.3%, with 2G penetration significantly lower at 0.7% and 0.4%, respectively. This suggests that more subscribers in Nigeria than in South Africa spend the majority of their time on 2G/3G.

According to the Nigerian Communications Commission (NCC), 67.6% of subscribers used 2G or 3G as of December 2023. ICASA in South Africa does not publish detailed mobile connection technology data. However, we can estimate that 2G/3G subscribers accounted for around 35-40% of total connections in South Africa at the end of 2023 based on Speedtest Intelligence and NCC data. Since South Africa is the most developed mobile market in SSA, the penetration of legacy networks is expected to be much higher in less developed markets.

Chart of Share of2G and 3G Samples of Total in Nigeria
Chart of Share of2G and 3G Samples of Total in South Africa

Network sunsetting is not yet on the table for Nigerian operators

Nigeria’s journey with 5G began in December 2022 with the auctions for 5G licenses using the 3500 MHz spectrum band. MTN and ISP Mafab Communications emerged as winners. Airtel acquired its 5G license about a year later. MTN launched 5G in September 2022, initially in seven cities, expanding to 300 cities by the end of 2023. Despite this, 5G adoption has been limited, with 4G capturing a growing market share and 5G representing just 1.0% of mobile subscribers by the end of 2023.

This is mainly due to limited 5G coverage, device affordability, and customer demand. ITU’s report shows that while 94% and 87% of the population had access to 2G and 3G coverage, respectively, only 6% could access 5G at the end of 2022. Furthermore, 58% of the urban population had a smartphone at the end of 2022, compared to only 32% in rural areas, according to the GSMA.

Call Analytics® identified areas with 2G and 3G concentration between February 2023 and January 2024 in high-population centers, Abuja, Ibadan, and Lagos. The red dots on the map pinpoint customers connected to 2G and 3G because they have SIM cards not provisioned for LTE (including roamers), lack 4G coverage, or use devices incompatible with 4G.

Data shows that mobile operators still heavily rely on 2G and 3G networks to provide connectivity across city centers, suburban regions, rural areas, and along transport routes. With the rising cost of living, people are expected to reduce their data usage and continue using 2G and 3G devices due to budget constraints and increasing mobile phone prices. Notably, Nigeria’s annual inflation rate reached a nearly 30-year high of 28.9% in December 2023 due to currency devaluation, reduction of subsidies, and foreign exchange liberalization. 

The combination of high living expenses and Nigeria’s extensive geography suggests the full transition to modern networks will be slow and gradual while 2G and 3G networks remain in operation for the foreseeable future. This is evidenced by MTN and Airtel’s renewal of their 2100MHz spectrum license in 2022, primarily for 3G uses while progressing with 5G deployment. An operator can choose to repurpose that spectrum for 4G and 5G in the future or use dynamic spectrum sharing to share it between different technologies. 

South Africa plans to turn off 2G and 3G by the end of 2027

Local operators have long awaited the release of new spectrum to enhance 4G services and launch 5G. Faced with this delay, Vodacom and MTN introduced 5G services in May and June 2020 using the emergency spectrum granted by ICASA during COVID-19 and refarming some of their existing spectrum assets on 2G and 3G.

The much-anticipated spectrum auction was finally completed in March 2022 with spectrum bands across 700 MHz, 800 MHz, 2.6 GHz, and 3.5 GHz bands awarded to six operators Cell C, Liquid Intelligent Technologies, MTN, Rain, Telkom, and Vodacom. 

Cell Analytics’ Service Availability maps show that 2G and 3G remain prevalent in suburban and rural areas of major cities like Cape Town, Johannesburg, and Pretoria. While South Africa leads SSA in 4G and 5G penetration, 3G is still widespread and offers a satisfactory experience for basic use cases like checking the news. 2G is less relevant since it supports mainly voice services but occupies a valuable sub-1Ghz spectrum which could be repurposed for more efficient technologies.

In light of this, the Department of Communications and Digital Technologies (DCDT) proposed a plan in 2022 to sunset 2G and 3G networks to free up spectrum for 5G and future technologies. Initially, the plan aimed to shut down 2G and 3G networks by the end of June 2024 and March 2025, respectively. The DCDT subsequently extended the deadlines twice to give more time for the operators to prepare for the transition. The most recent amendment was in February 2024, scheduling the phase-out to begin in June 2025 and conclude by the end of 2027. It will also include new spectrum auctions, likely to take place in 2024

The revised deadline seems to be more practical, but it still needs to be discussed with all the stakeholders to make sure that the end-users and businesses don’t face any challenges during this transition. The DCDT will allow operators to choose which network to switch off first. Based on operators’ current positions on network retirement, 3G will likely be the first to go:

  • Vodacom’s initial plan was to end 3G services before 2G, but their latest stance is less definitive. Their decision will significantly impact Cell C, whose contract customers use Vodacom’s network.
  • Telkom has already shut down most 2G services as they account for less than 1% of its traffic.
  • MTN suggested that 3G should be shut down before 2G, as migrating 2G devices to 4G will take longer than moving from 3G. This presents a challenge as MTN has the highest proportion of 3G samples in South Africa, (according to Speedtest data) at 6.35% in January 2024 compared to 3.4% for Vodacom and 3.3% for Telkom.

A phased approach to retiring networks, with consideration for affordability and coverage, is essential to maintain digital inclusiveness

The sunsetting of 2G and 3G networks is a global trend, led by developed countries. It promises to bring benefits like faster data speeds, improved connectivity, and more efficient spectrum usage. Yet, Sub-Saharan Africa trails in this transition because of the heavy reliance on legacy networks, the cost barrier to the operators and consumers, and the unequal distribution of new network infrastructure, especially in poorer regions. 

2G and 3G networks form the backbone of mobile communications for a large proportion of the population, enabling vital services such as voice and mobile money transactions. Operators thus face the challenge of investing in advanced network rollouts while maintaining and even expanding their legacy networks to ensure everyone has access to communication services. 

Using network analytical tools such as Ookla’s Speedtest Intelligence and Cell Analytics can provide valuable insights to help prepare for network decommissioning. These tools can track the progress of the switch off, and monitor its impact on network and spectrum usage as well as gauge consumer sentiment, ensuring that the transition to 4G and 5G is as smooth and beneficial.

Ookla retains ownership of this article including all of the intellectual property rights, data, content graphs and analysis. This article may not be quoted, reproduced, distributed or published for any commercial purpose without prior consent. Members of the press and others using the findings in this article for non-commercial purposes are welcome to publicly share and link to report information with attribution to Ookla.