| December 18, 2019

A Global Look at Mobile Modem Market Share and Device Performance

Analysts discuss the latest devices all the time, but rarely is enough attention paid to the phone’s real powerhouse — the modem. We were interested to see how market share for modem manufacturers divides up on a global level, so we investigated device data from Speedtest IntelligenceTM during Q3 2019. We also looked at how popular phones performed in different markets, including a look at 5G phones in 5G countries.

Global modem market share

Ookla_Global-Modem-Market-Share_1219-2

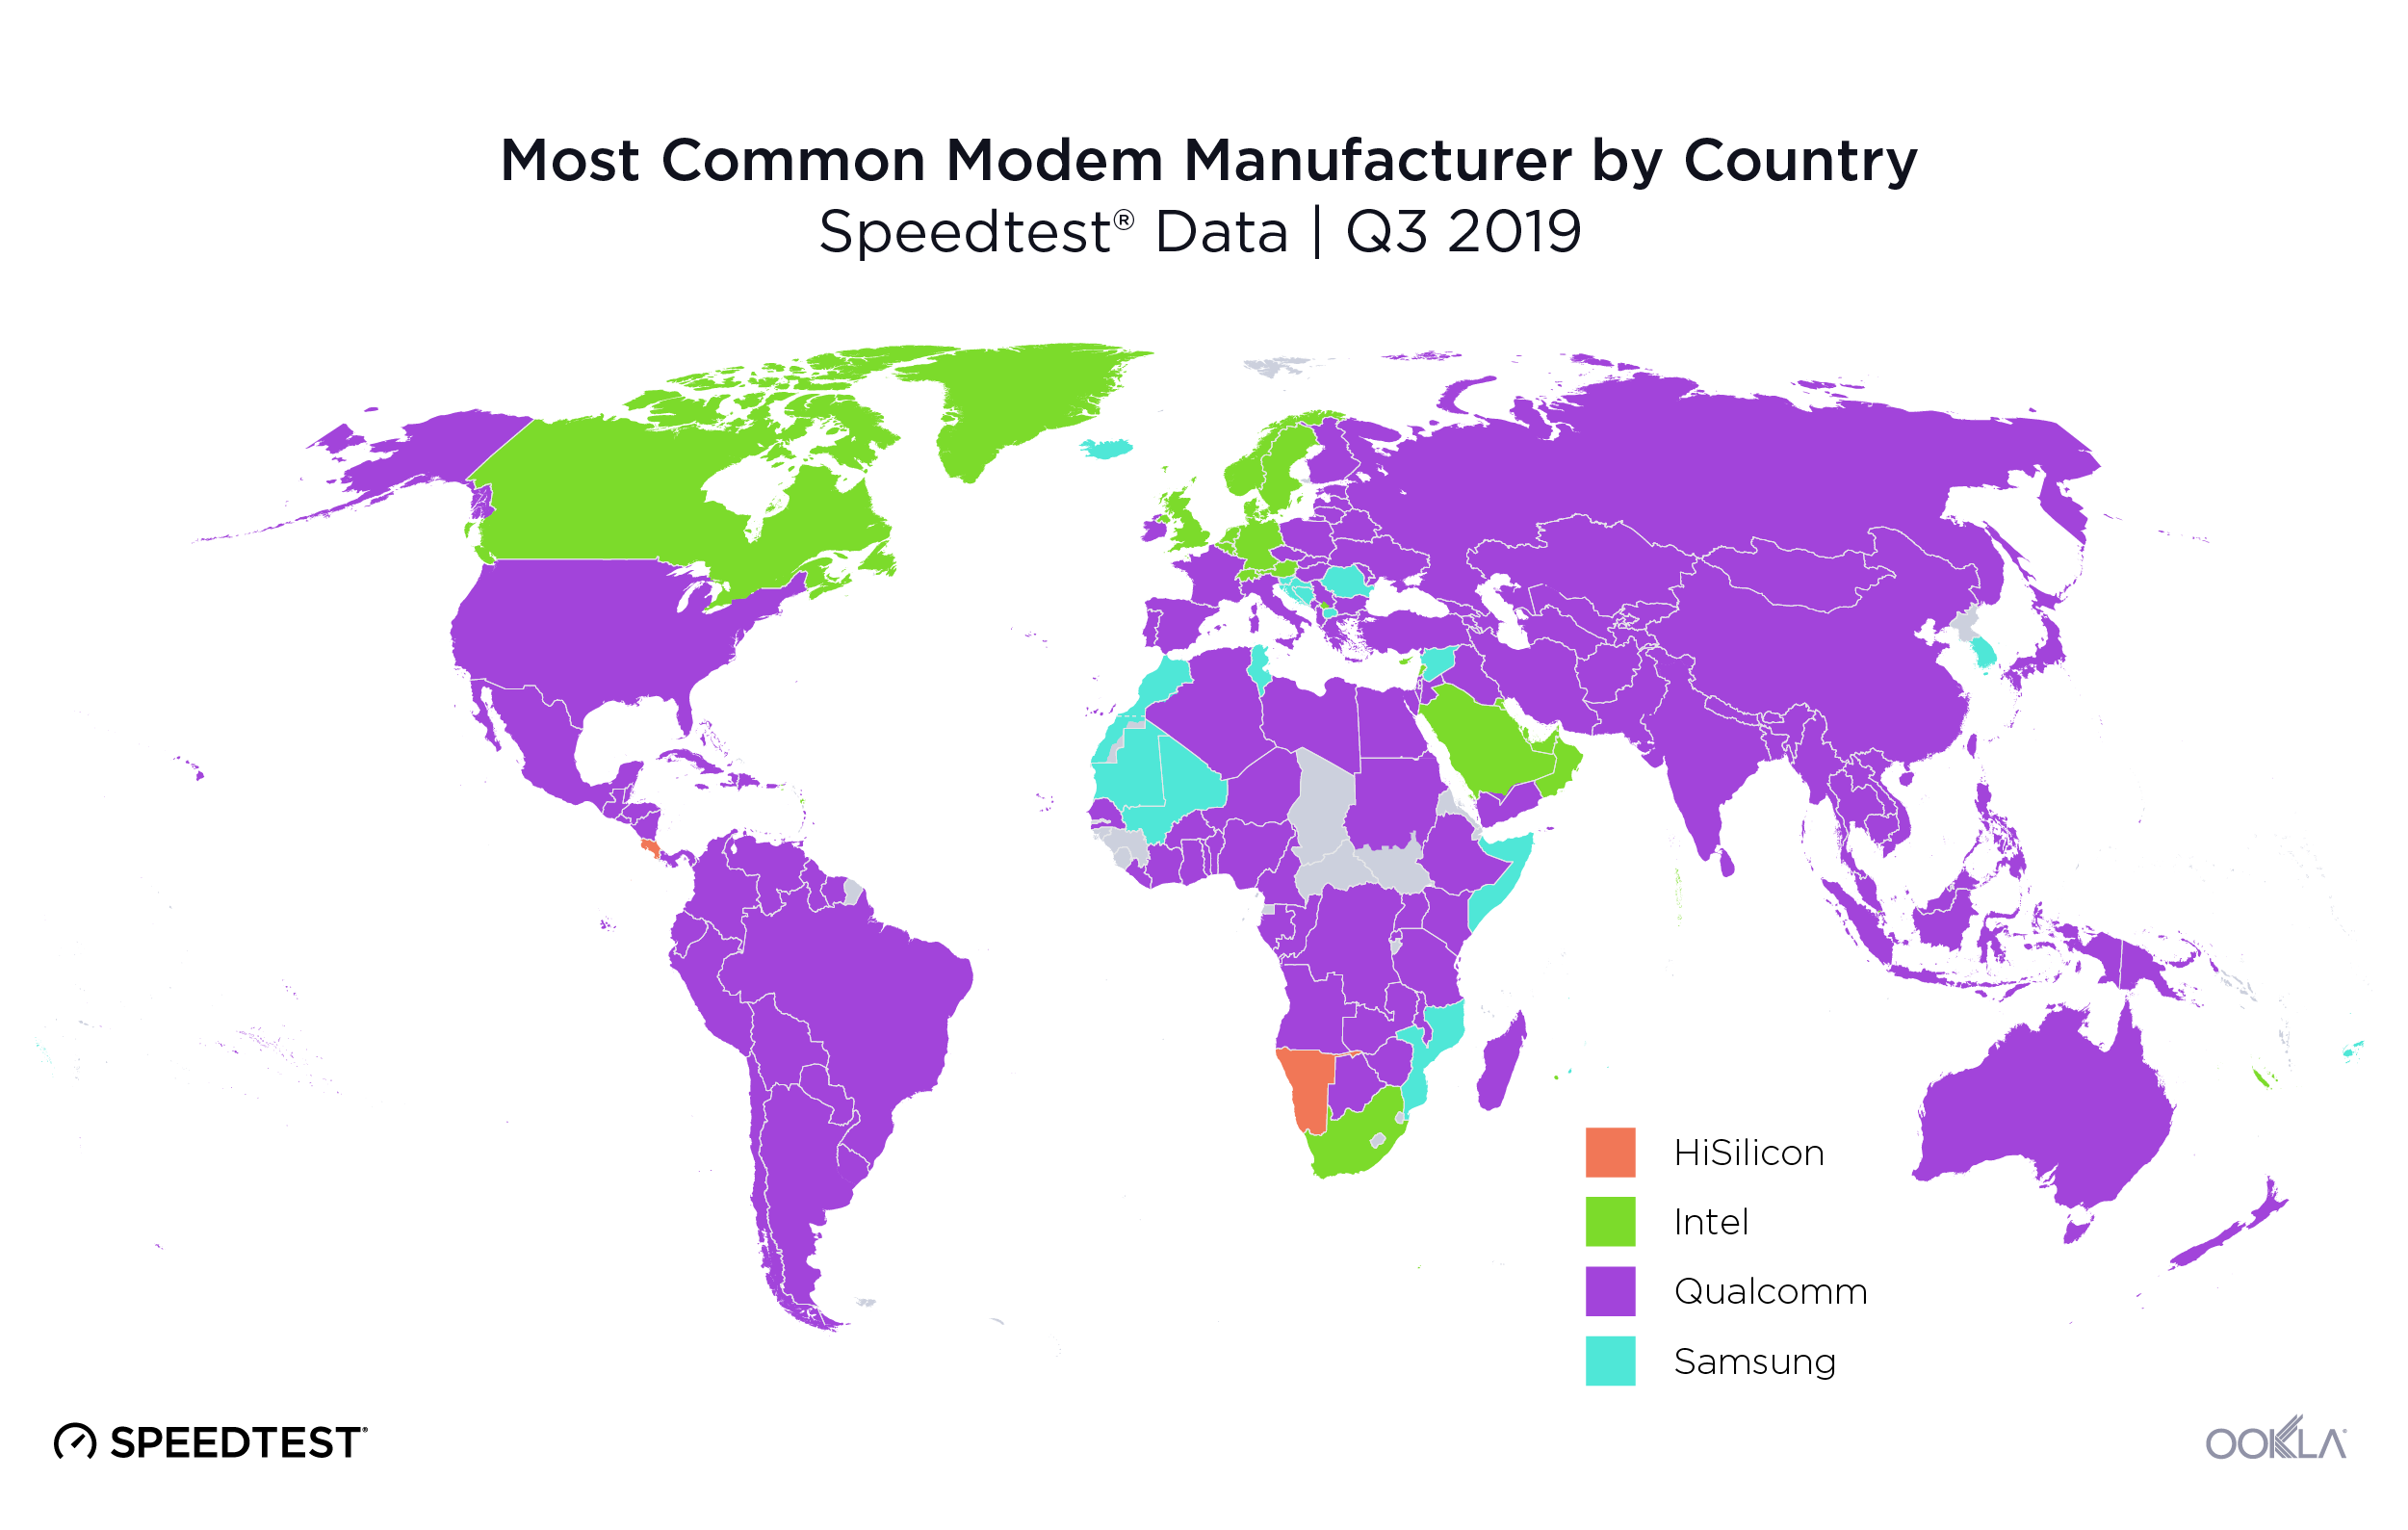
Speedtest data showed Qualcomm was the most common modem manufacturer in 133 countries during Q3 2019 — the highest market share was in Hong Kong with 73.6% of the devices analyzed showing Qualcomm modems. Qualcomm’s slimmest majority was in Botswana with 25.6% of devices analyzed showing Qualcomm modems.

This is not surprising as Qualcomm chipsets power many flagship devices sold around the world. In the U.S., virtually all Android OEMs use Qualcomm-powered chipsets. The latest Qualcomm Snapdragon 855+ mobile platform with Snapdragon X24 integrated LTE modem (up to 2Gbps) powers popular devices from Samsung, LG and OnePlus. It’s worth noting that Qualcomm has multi-year licensing deals with multiple OEMs based in China, namely Vivo, OPPO, Lenovo, Xiaomi and OnePlus, providing their complete modem-to-antenna solutions for optimal RF performance. This includes valuable RF Front End (RFFE) components such as power amplifiers, envelope trackers, RF switches, filters and antenna tuners.

These OEMs also have access to Qualcomm’s first and second generation 5G modems. As of right now, Qualcomm is also the only chipset manufacturer providing modem-to-antenna solutions for 5G millimeter wave (mmWave) deployments, providing all-in-one mmWave antenna modules that contain radio transceiver, RFFE and phased array antenna.

Intel was the most common modem manufacturer in 32 counties during Q3 2019. The highest percentage of devices with Intel modems was seen in Greenland at 55.6%. Intel’s slimmest majority was in South Africa with 28.6% of devices analyzed showing Intel modems. Intel’s main customer in the smartphone space is Apple. Starting in 2016, Apple began powering some iPhone devices with Intel’s flagship LTE chipsets, and since 2018, all iPhones have Intel’s cellular chipsets.

Samsung was the most common modem manufacturer in 16 countries during Q3 2019. South Korea had the highest percentage of devices with Samsung modems at 53.8%. Samsung’s slimmest majority was in Mozambique with 29.1% of devices analyzed powered by Samsung modems. Samsung’s Exynos LTE modem is seen in variants of Samsung’s Galaxy S and Note devices. Except in the Americas and China, most of Samsung’s flagship S10 and Note 10 devices around the world are powered by Samsung’s own Exynos 982x SoC (system on a chip), with an integrated LTE Category 20 modem capable of download speeds of up to 2 Gbps.

Speedtest data showed HiSilicon as the most common modem manufacturer in two countries during Q3 2019. In Costa Rica, 32.4% of devices analyzed showed HiSilicon modems, and in Namibia that number was 27.6%. HiSilicon is a semiconductor company based in Shenzhen and fully owned by Huawei. Huawei integrates its own flagship modem into its flagship P and Mate series devices. These devices have a large user base in Europe, the Middle East and Asia.

Device performance is affected by market factors

A phone’s performance is always going to depend on the conditions within its specific market. Factors affecting network performance can include: geography, cell site and population density, the amount of wireless spectrum deployed and the overall capabilities of user equipment seeded to market. Multiple factors can impact the performance of a device, including: varying degrees of RF transparency in the materials used for device chassis, variations in RF front-end and antenna design complexity and whether the baseband processor is more or less capable of handling network tasks. We used Speedtest data to analyze how three popular phones — the Apple iPhone Xs, the Huawei Mate 20 Pro and the Samsung Galaxy S10 — performed in specific markets around the world during Q3 2019. We excluded data from devices with fewer than 100 samples in a market during the period.

Mean-DL-Speeds-on-Flagship-Phones

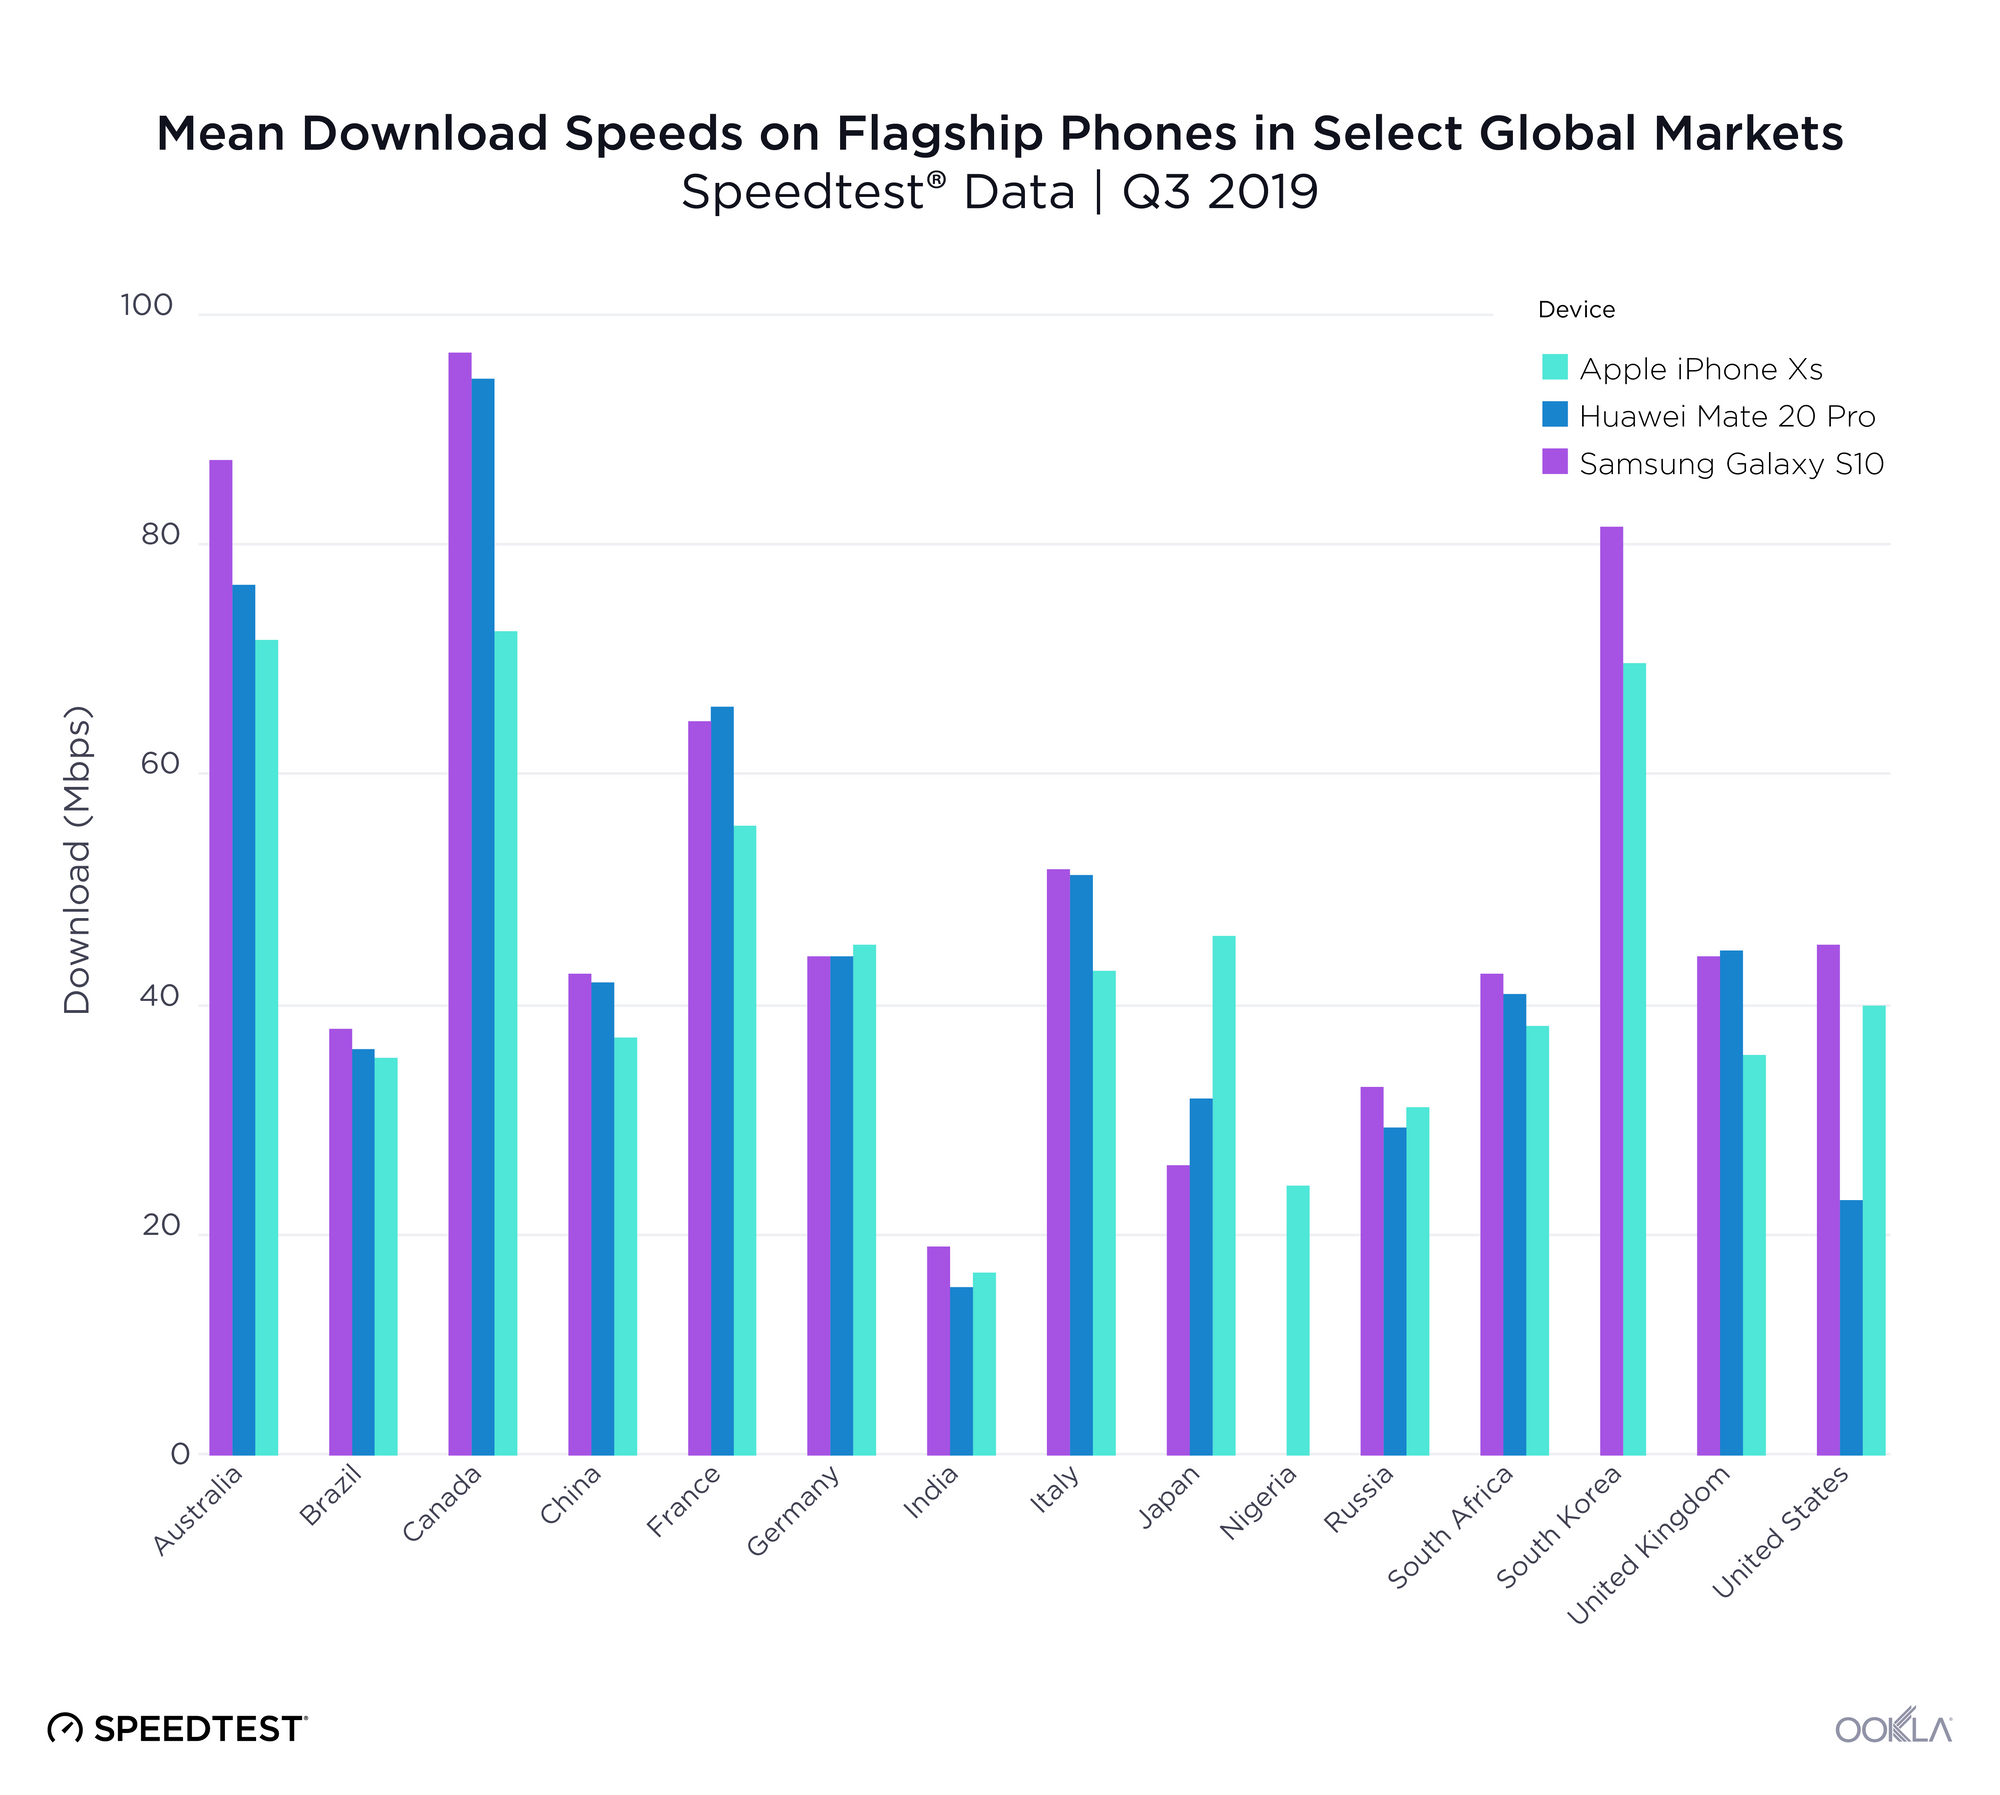
The Samsung Galaxy S10 was the fastest of these three devices in all but five markets during Q3 2019. However, the mean download speed on the Galaxy S10 varied between 18.06 Mbps in India and 95.91 Mbps in Canada. The Huawei Mate 20 Pro showed the fastest mean download speed of these three devices in France and the U.K. during Q3 2019 and often placed second in the remaining markets on the list. Mean download speed on the Mate 20 Pro during Q3 2019 ranged from 14.57 Mbps in India to 93.66 Mbps in Canada.

Apple’s iPhone Xs was at a slight disadvantage in this comparison, as it came out in 2018 where the other devices debuted in 2019. Because the iPhone 11 was not fully seeded to markets in Q3 2019, we considered its predecessor, the iPhone Xs, in this analysis. The iPhone Xs showed the fastest mean download speed in Germany, Japan and Nigeria during Q3 2019. Mean download speeds on the iPhone Xs varied from 15.92 Mbps in India to 71.72 Mbps in Canada.

Device performance in 5G markets

5G currently offers the pinnacle of mobile performance. We looked at 5G-capable devices in markets where 5G exists to see how download speeds compare. These results include Speedtest results on all technologies, not just 5G, which means averages also reflect consumers using 5G phones with a 4G connection.

Mean-DL-Speeds-on-5G-Phones

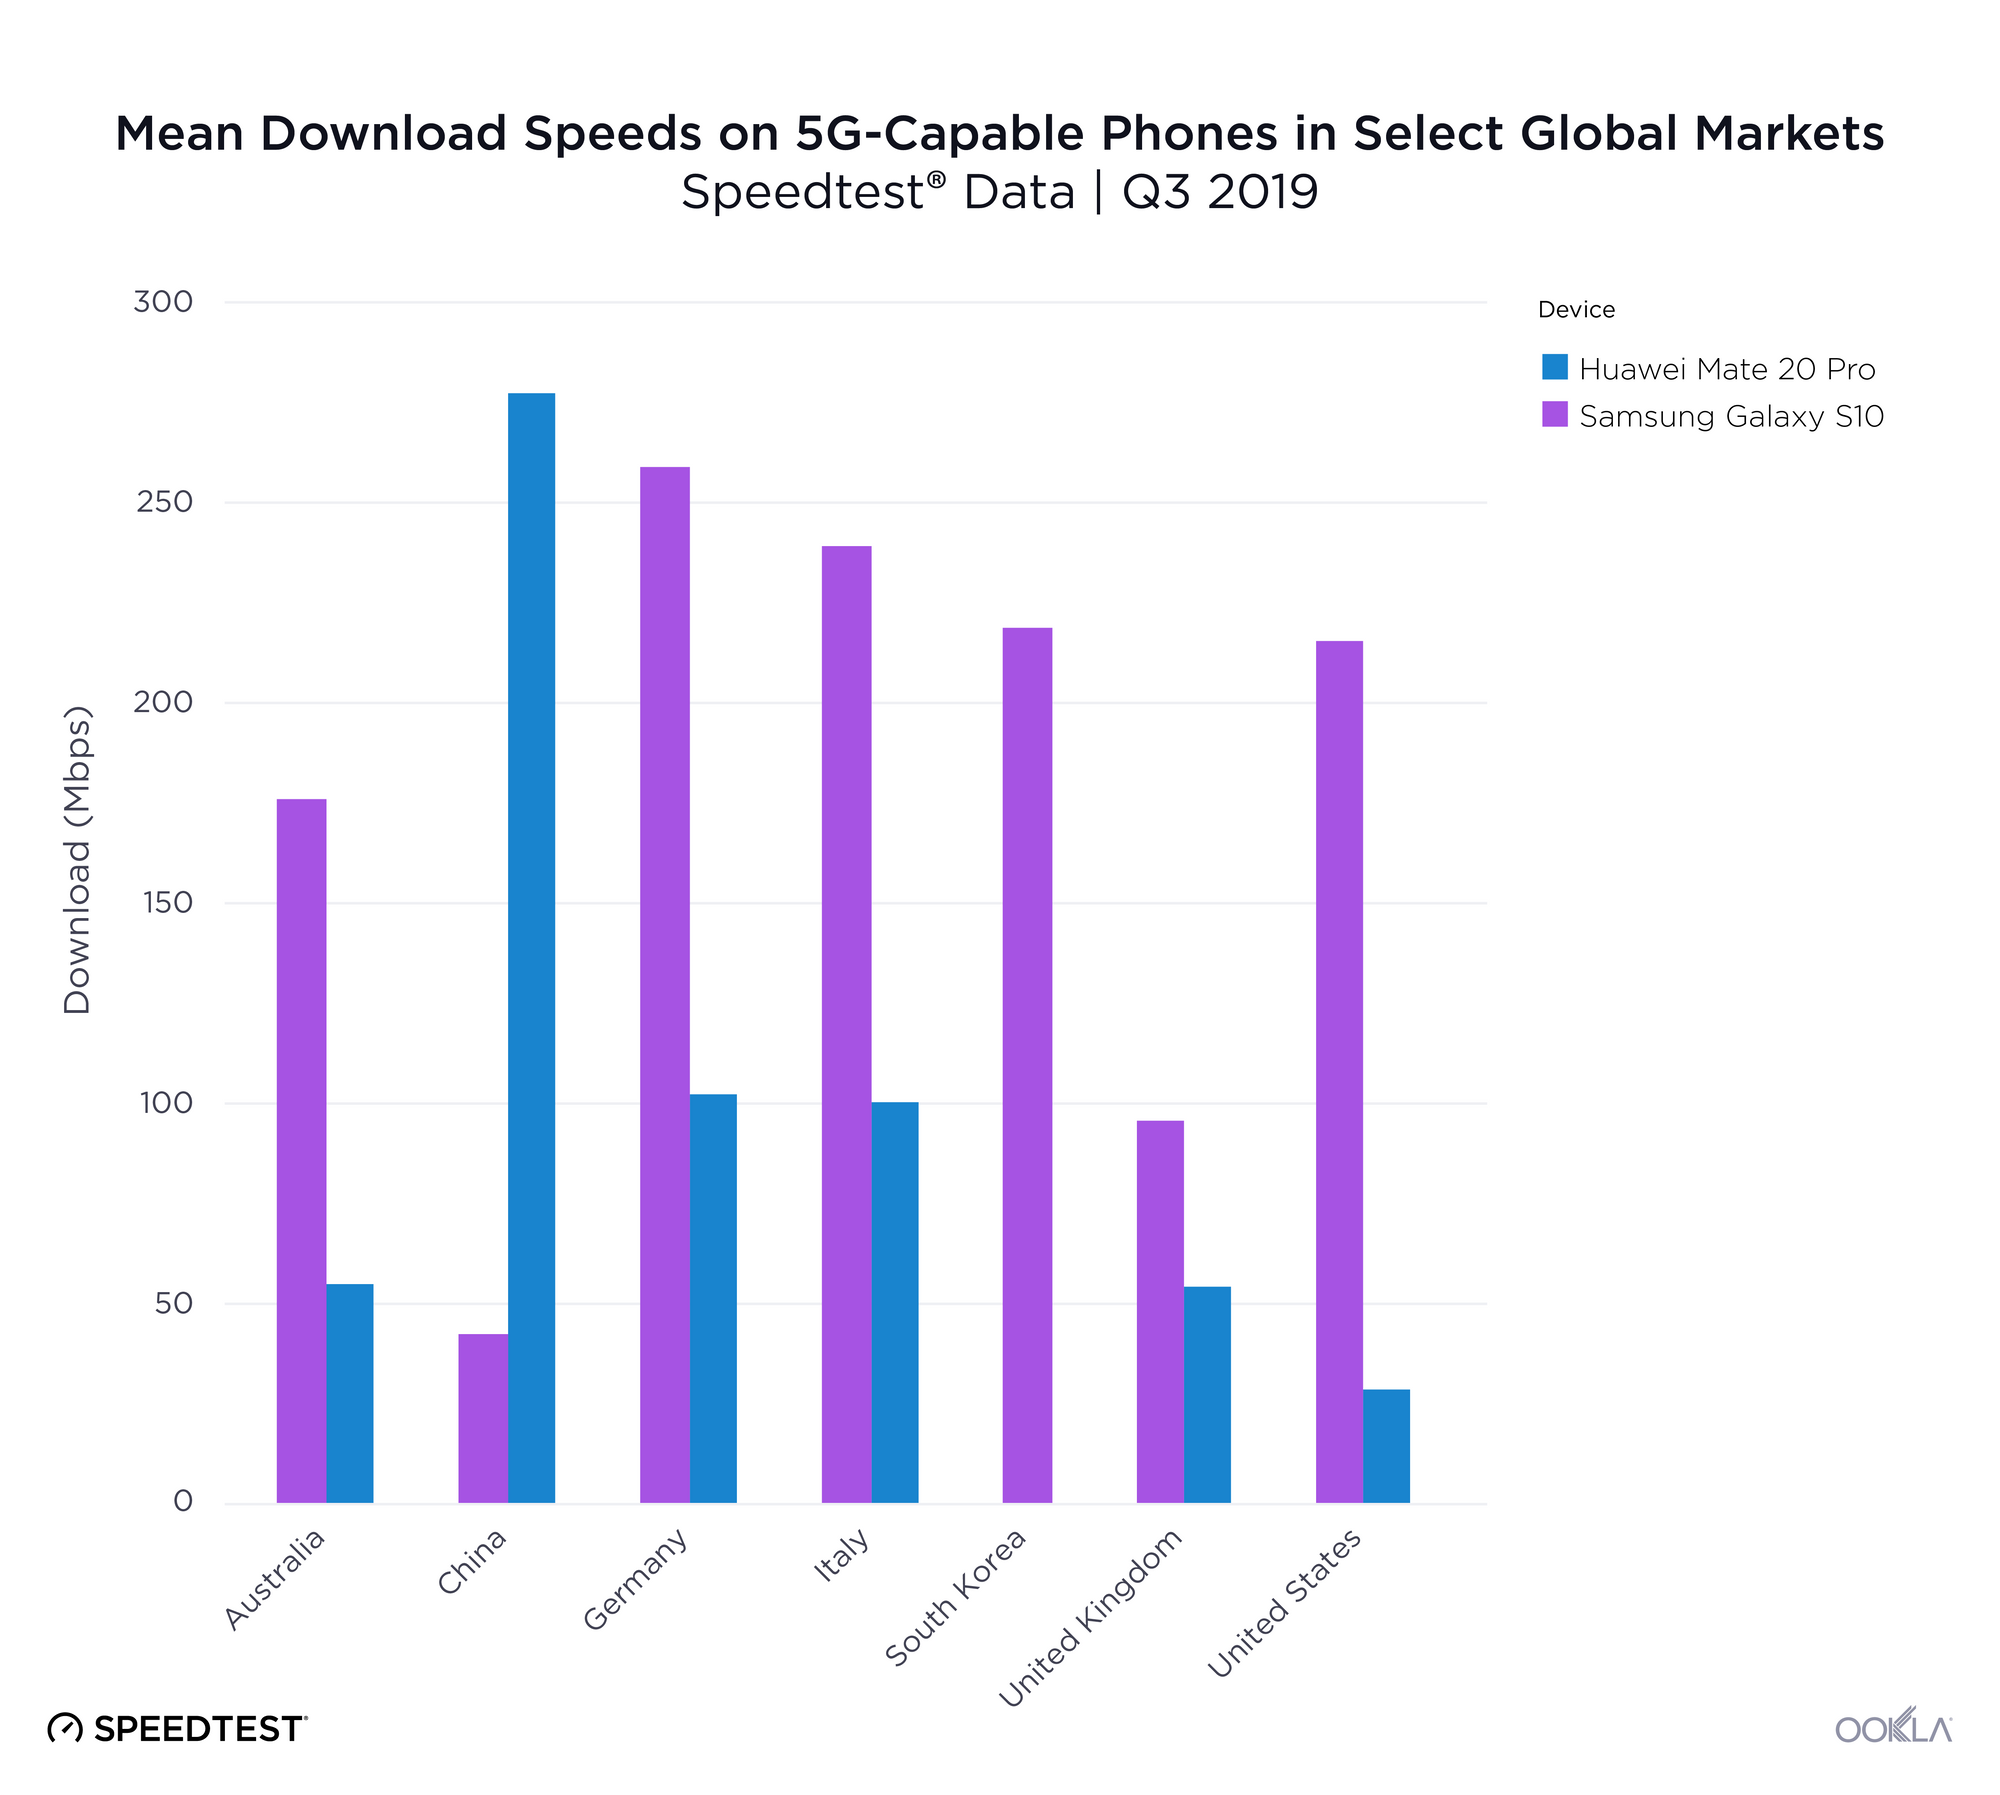
Both the Samsung Galaxy S10 5G and the Huawei Mate 20 X 5G showed mean download speeds in excess of 200 Mbps in some markets during Q3 2019. However, there’s clearly some difference in which devices are supported by which operators, as not all operators in 5G markets are offering 5G equally (if at all). Related, the Samsung Galaxy S10 5G models sold in the U.S. and China are powered by Qualcomm’s first-generation Snapdragon X50 5G modem, while other 5G markets receive the variant powered by Samsung’s in-house Exynos 5100 5G modem.

Mobile operators continue to incentivize consumers to upgrade to newer and more capable devices to ensure a more efficient use of spectrum assets for network operators. This leads to an improved utilization of shared resources, faster overall speeds and better quality of experience.

We’re looking forward to updating these analyses as more markets adopt 5G and as newer and even faster phones are released. For more information about how our device data can help you, contact us.

Ookla retains ownership of this article including all of the intellectual property rights, data, content graphs and analysis. This article may not be quoted, reproduced, distributed or published for any commercial purpose without prior consent. Members of the press and others using the findings in this article for non-commercial purposes are welcome to publicly share and link to report information with attribution to Ookla.

| April 26, 2022

The Case for Private Networks in India

The recent recommendation from the Telecom Regulatory Authority of India (TRAI) around providing an enabling framework for enterprises to build their own private networks is in line with other 5G markets, where governments are looking to drive the digitization of key industries. However, Indian operators see this as limiting their return on investment in the 5G spectrum. Looking at the example of private networks across Europe, and Germany in particular, we believe that Indian telcos shouldn’t see TRAI’s proposal as a threat. Rather, they should use the buzz around the spectrum for verticals as a way to get enterprises interested in digitalization.

The overall financial health of the Indian telecom industry remains fragile. Furthermore, operators’ ability to invest in upgrading their network is negatively impacted by low average revenue per user (ARPU) levels and high regulatory costs. As a result, India’s mobile performance is affected. According to the Speedtest Global Index™, in March 2022 India ranked 120 (out of 142 countries) with a 13.67 Mbps median mobile download speed vs. the global average of 29.96 Mbps. The 5G network rollout will require intensive capital  investment and allowing enterprises to have access to dedicated spectrum can potentially limit operators’ 5G-addressable revenue.

The case for 5G in manufacturing

On the consumer side, 5G will boost Indian mobile performance, as we have postulated in our recent article, new 5G launches in Asia Pacific point to a potential 10x increase in median download speeds (5G vs 4G-LTE). However, 5G will also deliver socioeconomic benefits in India, on account of a number of 5G use cases that could enable new applications across all sectors. According to GSMA Intelligence, 5G is expected to contribute around $455 billion to the Indian economy over the next 20 years, accounting for more than 0.6% of GDP by 2040. One of the sectors that stands to benefit from 5G is the manufacturing sector, representing 20% of the total benefit. Retail, ICT and agricultural sectors should also benefit.

The Indian government has already zeroed in on making India’s manufacturing sector more competitive on a global scene. As such, the “Make in India” goal is to make India self-reliant and also to increase the share of the manufacturing sector to 25% of GDP “in the coming years.”

As of now, this is a distant goal. China is still the world’s manufacturing superpower, accounting for 29% of global manufacturing output in 2020, followed by Japan (17%) and Germany (5%). All of these countries have embarked on digitization strategies.

In addition, manufacturing companies look to optimize and control production processes, improve safety, and reduce costs in order to maximize the return on investment. The COVID-19 pandemic has exacerbated existing challenges and pain points for manufacturers, highlighting the need to improve supply-chain resilience and boost production speed and flexibility. However, even before the pandemic, the manufacturing sector was undergoing digital transformation – the so-called fourth industrial revolution or Industry 4.0, referring to the use of technologies such as machine learning, edge computing, IoT, digital twins, and new networks to aid automation and enable data exchange.

According to Ericsson, typical revenue increases when manufacturers digitize their processes come from increased throughput and quality (2–3%), while typical cost savings originate from improved capital efficiency (5–10%) and decreased manufacturing costs (4–8%). A proportion of manufacturers will need dedicated network resources to meet their transformation goals and ensure data isolation and security. According to the GSMA Intelligence Enterprise in Focus 2020 survey, 22% of manufacturers require location-specific coverage (e.g. factory, campus).

Historically, Wi-Fi has been the connectivity choice for private networks. However, mobile technologies such as 4G/LTE and 5G are better suited to Operational Technologies’ network requirements of high volume, high reliability, mobility, and always-on operations. 5G and 5G Standalone in particular offers the most benefits related to eMBB, massive IoT, and critical IoT. Additionally, enterprises decided to deploy proprietary networks to have more control over their networks; the increased security offered by isolating their data from public networks is an attractive benefit.

Private networks aren’t new 

A number of countries are looking to private networks to address Industry 4.0 objectives and awarding spectrum for vertical use e.g. Germany, Japan and France. According to GSA data, as of February 2022 there were 656 organizations deploying LTE or 5G private mobile networks. GSA’s data points to the manufacturing sector as a strong adopter of private mobile networks, with 111 identified companies involved in known pilots or deployments, which is up from 51 at the start of 2021.

Dedicated spectrum available for private mobile networks has already been allocated in France, the United States, Germany, Japan, and the United Kingdom. Germany is considered to be a poster child for Industry 4.0. Afterall, the term “Industry 4.0” was coined at Hannover Messe over a decade ago. It is therefore only natural to look to Germany and its approach to private networks. In Germany, the national regulatory authority (BnetzA) is promoting industrial policy and reserved 100 MHz in the 3,700-3,800 MHz for local networks, noting that the spectrum can be used in particular for Industry 4.0. “By awarding spectrum for local 5G networks, we are creating scope for innovation for enterprises,” stated Jochen Homann, Bundesnetzagentur President. As of April 15, 2022, the Federal Network Agency (BNetzA) received a total of 208 applications for the allocation of frequencies for local 5G networks and granted the same amount.

We have commented on how the private networks landscape is developing in Europe here. Simply assigning spectrum to verticals isn’t enough to drive market adoption. In an upcoming analysis, we will discuss how the French government has prioritized 5G as an avenue to drive digital transformation of the economy via a number of funds. According to the GSA, there were a total of 66 private networks all together in France, Germany, and Japan, despite enterprises being able to acquire spectrum since 2019.

Despite the 208 applications that BNetzA received, the GSA has counted 45 private networks in Germany, with a majority distributed between three verticals: manufacturing (14), power and water utilities (11), and devices testing and lab as a service (seven).

It is important to note that globally, as per the latest GSA data, only 21% of networks were 5G only, and mostly composed of test networks. Until the 5G device ecosystem matures, the majority of private networks will remain 4G/LTE, though using equipment that is 5G ready. Only after the availability of industrial-feature-rich 5G release 16 chipsets, which will happen in the next few years, will the 5G deployments move beyond trials and proof of concept into full scale deployments. Germany is an outlier here: 5G and 5G SA are making headways in Germany. Audi, KUKA, Volkswagen, and Siemens take an active role in testing and deploying 5G SA private networks utilizing localized spectrum in the 3500 MHz band (n78).

The many routes to market

TRAI has proposed an enabling framework for enterprises to build their own private networks via a range of deployment scenarios, including spectrum leasing and dedicated spectrum. The Cellular Operators Association of India (COAI) representing major telecom companies such as Bharti Airtel Ltd, Reliance Jio Infocomm Ltd, and Vodafone Idea Ltd. opposed this, stating that TRAI should: “Disallow private enterprise networks for the financial viability and orderly growth of the telecom industry, which is more than capable of delivering  these services to businesses”.

Yes and no. Operators can utilize various deployment models, from public dedicated networks through hybrid networks (network slicing, public/private campus, private RAN with public core) to private networks. Within these various models, network slicing and edge computing add the benefits of QoS, privacy, security, and specific SLAs.

When it comes to private networks, the typical rules of engagement no longer apply, and with network virtualization continuing, the ecosystem of vendors has expanded beyond traditional telco players. Just recently Cisco entered this crowded market that already consists of operators, hyperscalers, startups, and equipment vendors. Amazon’s introduction of AWS Private 5G network is a good example of the growing “coopetition” trend. In some cases, AWS would work with operators to provide 5G core and edge computing capabilities, while in some others, it could compete to offer end-to-end solutions. Nokia is looking to address the enterprise demand in India via working with network operators, but also by working directly with enterprises, as Ricky Corker, Chief Customer Experience Officer, Nokia recently stated.

We can draw lessons by looking at the approach that European operators took when addressing the enterprise opportunity. Deutsche Telekom has been offering campus network solutions for enterprises since 2019, and now operates more than ten such local networks based on 5G non-standalone technology or LTE across Germany. In January 2022, the operator expanded its offering to include location-specific 5G mobile networks for companies based on 5G Standalone Technology (5G SA), powered by the Ericsson Private 5G portfolio. The operator can also position itself as a systems integrator (SI) for 5G private networks for Industry 4.0 by utilizing T-Systems’ credentials and its deal with AWS.

Similarly, Vodafone takes an active role in deploying private networks, and distinguishes three degrees of industrial control depending on a private network setup.

In the first scenario, a dedicated mobile private network (MPN) brings total control to the enterprise because everything stays on site. There is no interoperability with public networks. This is particularly well suited for mission- or business-critical applications that don’t need to interface with the public internet.

The second option is a hybrid private network, which is a blend of public and private infrastructure. It enables interoperability with public networks for those devices and users which move outside the private network, while at the same time giving the end user a choice regarding where the data is stored.

The third option, a virtual private network, uses a dedicated slice of a public 5G network. End-user control over the setup is reduced, but compared to the public network it has a dedicated network resource, and allows for greater data isolation, security and privacy, and further SLA customization (availability and reliability). According to Marc Sauter, head of mobile private networks for Vodafone’s business division, network slicing hinges on future releases of the 5G standard, available from next year. “That is when virtual private networks will be more relevant, and a new market will open up with smaller customers.” Vodafone is also very vocal about the importance of the ecosystem, and working on innovation. In its innovation hub in Milan, Vodafone works with developers and startups, and large companies can play around with 5G use cases.

Leveraging existing credentials and forming partnerships to go beyond core competencies can open up new markets for operators. Partners’ ecosystem is key, and to be successful,  operators need to partner across the ecosystem. As enterprises’ needs vary, having a broad portfolio of vendors that can address various verticals, technological, and coverage needs will only stimulate the growth of the market.

Indian telcos have already embarked on this journey. Airtel has partnered with Tech Mahindra for a joint 5G innovation lab to develop “Make in India” use cases for the local and global markets, including customized enterprise-grade private networks. These services will combine Airtel’s integrated connectivity portfolio of 5G ready mobile network, fiber, SDWAN, and IoT along with Tech Mahindra’s SI capabilities.Meanwhile, Vodafone Idea (Vi) joined forces with A5G Networks to enable industry 4.0 and smart mobile edge computing in India. They have jointly set up a pilot private network in Mumbai using existing 4G spectrum.

Rather than seeing spectrum for verticals as a threat, operators can use it as a way to get enterprises, in particular manufacturing companies, interested in digitalization. According to the FICCI-EFESO survey, 36% of organizations will implement “Use of Industry 4.0 technologies for predicting failures in machines, products and processes” in the next 1-2 years, while 22% have already done so. The opportunity is there for the taking.

To learn more about how Ookla® has worked with operators and industries to help plan for 5G growth, contact us.

Ookla retains ownership of this article including all of the intellectual property rights, data, content graphs and analysis. This article may not be quoted, reproduced, distributed or published for any commercial purpose without prior consent. Members of the press and others using the findings in this article for non-commercial purposes are welcome to publicly share and link to report information with attribution to Ookla.

| August 16, 2020

Problems on the 37th Floor: Analyzing In-Building Network Performance and Coverage (Webinar)

Drive testing and walk testing are useful for capturing isolated snapshots of network performance and quality, but not efficient ways to discover where users are having problems connecting. Mobile network operators must understand where users are experiencing poor indoor network performance or a weak 5G signal to provide consumers with good quality of service. It is especially important to understand performance issues in densely populated urban areas with many tall high-rise buildings, because indoor service issues can sometimes be limited to specific floor groups.

In the upcoming Ookla® webinar, we’ll share three real-world use cases where operators in Asia can improve performance and coverage with Cell Analytics™ data on user density and traffic, indoor vs. outdoor performance and 5G network metrics.

Read on to discover how operators can monitor 5G networks and identify problem buildings and cells with crowdsourced data — and don’t miss the webinar on Wednesday, August 26 at 12:00 GMT+8 (9:30 Mumbai, 11:00 Bangkok, 12:00 Singapore/Kuala Lumpur/China, 13:00 Tokyo, 14:00 Sydney).


1. Monitor your 5G network performance and coverage as well as competitors’

As mobile network operators invest heavily in 5G, it’s critical to monitor progress and compare network coverage and performance to that of your competitors. Powered by hundreds of millions of signal measurements collected daily by Speedtest®, Cell Analytics provides intelligence about wireless service quality, RF measurements, data usage, user density, cell site locations and much more, including 5G network metrics. By tracking your own and competitors’ performance, you can understand where new 5G deployments are impacting user experience and quality of service.

5G-HK-SS-RSRP-1

3hk-5g-ss-rsrp-2

In the above example, we can see China Mobile Hong Kong provides 5G coverage over a much larger area than the 3 Hong Kong network.

2. Identify problem buildings and cells with crowdsourced data — and prioritize efforts to improve them

Cell Analytics makes it easy to identify buildings where users are experiencing issues and to prioritize which network improvements will have the most impact. By looking at user density (both indoor and outdoor), you can understand where the highest volume of users are impacted and determine which cell sites need low-cost or no-cost adjustments to improve service.

Mumbai-LTE-RSRP-1

In-Building-User-Density-Mumbai-1

In the above example, we see Nirlon Knowledge Park, a busy office park in Mumbai with very high user density, but very low LTE signal level on the Jio network. By comparing these views, Jio can discover opportunities to improve in-building performance and coverage in popular locations.

3. Analyze network performance in tall buildings, down to individual floor groups

With new z-axis views in Cell Analytics, it is possible to determine the altitudes at which users experience poor network quality or performance. By analyzing which floor groups within a building are showing network issues, you can identify good buildings for DAS or other capacity expansion.

NTTDoCoMo-LTE-Tokyo-2

In the above example, we can see that the upper floors of several buildings are experiencing poor quality on the NTT DoCoMo network in Tokyo.

To see in-depth recommendations for the operators in the above scenarios, don’t miss the webinar on August 26 at 12:00 GMT+8. If you cannot make the presentation, you can register to receive a video recording after the live event. We look forward to showing you how to leverage real-world data to make better network decisions and answering any questions you may have. Register now

Ookla retains ownership of this article including all of the intellectual property rights, data, content graphs and analysis. This article may not be quoted, reproduced, distributed or published for any commercial purpose without prior consent. Members of the press and others using the findings in this article for non-commercial purposes are welcome to publicly share and link to report information with attribution to Ookla.

| September 28, 2021

TRAI Attempts to Kick-Start the Indian Fixed Broadband Market


Key takeaways

  • New fixed broadband speed categories of “Basic”, “Fast” and “Super-fast” throw the performance of Indian States under the spotlight.
  • Ookla® Speedtest Intelligence® data shows only 2.5% of current Indian fixed connections fail to meet TRAI’s new 2 Mbps broadband grade.
  • Delhi tops the list for “Super-fast” broadband connections (>300 Mbps), but that equates to a mere 1.5% of its connections; the remaining states fare worse, with Sikkim recording zero.
  • Rajasthan tops the list for “Fast” broadband connections (50 Mbps – 300 Mbps) at 45.9% of connections, while Gujarat and Maharashtra lag far behind with 19.8% and 25.8%, respectively.
  • Rural locations fare worse than urban, but the gap is not as large as expected, with 3.4% of rural connections failing to achieve broadband speeds, versus 2.3% of urban connections.

TRAI redefines broadband in India

TRAI, the Telecom Regulatory Authority of India, recently published a raft of recommendations as part of a “RoadMap to Promote Broadband Connectivity and Enhanced Broadband speed.” These are designed to help achieve the goals of the National Digital Communications Policy (NDCP-2018), which targets universal broadband provision of 50 Mbps, as well as breaking into the top-50 of the ITU’s ICT Development Index, by 2022.

The most prominent of these recommendations targets increased fixed broadband network rollout and adoption. According to TRAI, current broadband penetration levels in India are approximately 55%. Mobile accounts for the lion’s share of this, having grown strongly since the launch of 4G, while the Indian fixed broadband market remains underpenetrated, at approximately 9.1% of Indian households at the end 2020.

The details include a wide range of proposals designed to alleviate network deployment challenges, in particular relating to Right of Way (RoW) permissions, as well as encouraging India’s multitude of cable TV providers to offer broadband services. In addition, TRAI proposed a pilot Direct Benefit Transfer scheme, to subsidize broadband service in rural locations. Beyond these proposals, TRAI also recommended:

  • A change to India’s definition of broadband (for fixed and mobile), increasing from the current 512 Kbps to 2 Mbps from the point-of-presence (POP) of the service provider, to the subscriber
  • New categories of fixed broadband speed beyond this new baseline, including:
    • “Basic” (2-50 Mbps),
    • “Fast” (50-300 Mbps) and
    • “Super-fast” (>300 Mbps)

TRAI’s new speed tiers to drive improved internet performance

New speed tiers align India with ITU’s IDI Index

For TRAI, the introduction of a new minimum speed alongside speed tiers, helps it bring its definition of broadband into the present, while also allowing it to monitor and report on a key plank of the NDCP-2018 — India’s advancement up the ITU’s ICT Development Index (IDI).

Broadband definitions vary widely around the world in terms of throughput , from the original OECD definition of a minimum of 256 Kbps, which is still used in many markets, to markets such as the U.S., where even the current minimum of 25 Mbps download and 3 Mbps upload is no longer considered sufficient. Part of the rationale for TRAI’s recommended increase to the minimum download speed is that the 512 Kbps threshold introduced in 2013 can no longer handle even basic internet use cases. This has been thrown into sharp relief by the pandemic, which forced an unprecedented number of people to learn and work from home. In effect, traffic inflation has raised the minimum download speed for basic internet services in TRAI’s estimation to 2 Mbps. Furthermore, the introduction of speed tiers will allow Indian broadband performance to be linked to a new indicator the ITU has introduced within its ICT Development Index (IDI), in which the Indian Government is targeting a top-50 place by 2022.

Vast majority of fixed broadband connections already meet the new minimum speed threshold

Speedtest uses the Speedtest Server Network™, a global network of high-performance servers, ready to test the maximum sustained throughput of the user’s connection (download and upload speeds) and report back on key network health metrics. There are Speedtest servers in virtually every country and major population center worldwide, which means we can accurately reflect the service provided from the operator’s POP to the end-user. Our data shows only 0.5% of Indian fixed subscribers did not have access to broadband speeds under the old definition. The new definition doesn’t shift the needle much, increasing that underserved proportion of subscribers to 2.5% as of Q2 2021.

ookla_consumer-percentage_india_0921-01

The natural conclusion from the above chart is that TRAI should consider a higher speed threshold for its definition of broadband. When the United States Federal Communications Commission (F.C.C.) changed their definition of broadband in 2015, the proportion of U.S. households without access to broadband speeds hit 20%. However, with fixed broadband penetration in India below 10% of households, TRAI’s new definition serves as a marker in the sand, designed to track performance as the fixed broadband market begins to unlock.

Much emphasis is placed on the myriad of cable TV providers already present in the market, with TRAI’s recommendation on AGR fees, alongside other remedies, designed to encourage them to branch out and provide broadband to their customer bases. However, as detailed in TRAI’s submission to the DoT, many of these cable companies are sub-scale and rely on out-dated network infrastructure. If and when they start signing up internet customers, we may well see the proportion of users that fall below the broadband definition increase.

Wide variation in performance among Indian states

Access to India’s new broadband speed categories varies widely from state to state. The new minimum threshold for broadband only renders an additional 2% of households without access to broadband speeds, however this is skewed by India’s more populous states and cities. At a state/union territory level, this value varies from a low of 1.6% in Delhi, to a high of 7.6% in the largely rural State of Sikkim. This split continues when we look at the new broadband speed categories, with over 70% of connections in the States of Gujarat and Maharashtra falling into the “Basic” speed category, while almost half of connections in the States of Delhi, Rajasthan, Tamil Nadu, Chandigarh and Kamataka were at least “Fast” (>50 Mbps). The availability of “Super-fast” broadband in India is very low, ranging from a high of 1.5% of connections in Delhi, to 0% in Sikkim.

ookla_consumer-percentage_india_states_0921-01

Urban-rural performance gap not as wide as expected

Indian fixed broadband penetration remains low and is heavily skewed towards urban areas. While 65.1% of the Indian populace live in rural areas (based on World Bank estimates for 2020), TRAI data shows that they account for a mere 5.6% of total fixed broadband connections. A comparison of Speedtest Intelligence data against rural and urban locations (based on India’s 2011 census) fails to show a large disparity between the two when looking at TRAI’s new speed categories, with 58.7% of connections in urban areas falling within the “Basic” speed category, compared to 61.7% in rural areas.

ookla_consumer-percentage_india_urban_0921-01

A more detailed segmentation of performance between rural and urban areas shows a wider performance gap, with rural locations tending to have a higher proportion of connections supporting speeds of less than 25 Mbps, while urban locations had a much higher share of connections with speeds greater than 100 Mbps. This is understandable given the lack of a modern fixed network infrastructure in many parts of rural India, coupled with challenges that the country’s ambitious BharatNet infrastructure project has encountered.

Our data shows that many connections currently sit at the boundary between “Basic” and “Fast” broadband, and this should serve as encouragement to India’s providers to boost fixed network performance and thereby drive mass market adoption of “Fast” broadband.

New speed categories to provide more clarity on network performance to Indian consumers

In addition to driving faster speeds and improved availability of fixed broadband, these changes will bring more clarity for Indian consumers when selecting a fixed broadband subscription. At Ookla, we’re fully aware that reporting on network speeds helps spur network operator competition and infrastructure investment. Introducing speed categories goes one step further, as operators in countries that have implemented this will naturally begin to include these speed categories in their marketing and products. They will also target network investment at increasing the proportion of their footprint that supports higher-tier broadband speeds.

For the Indian government and TRAI, this move will provide much needed visibility into the state of broadband within India, to better track performance and the reach of different access technologies, and to target and tweak remedies and incentives to spur further adoption.

Ookla retains ownership of this article including all of the intellectual property rights, data, content graphs and analysis. This article may not be quoted, reproduced, distributed or published for any commercial purpose without prior consent. Members of the press and others using the findings in this article for non-commercial purposes are welcome to publicly share and link to report information with attribution to Ookla.

| December 12, 2017

The World’s Internet Speeds Increased More than 30% in 2017. Are You Keeping Up?

In a world where business and life are increasingly fast and global, you want to know if your country’s internet is up to speed. In August, we launched Speedtest Global IndexTM to provide you that objective look at internet performance around the world. Knowing what your speeds are and how they compare to your neighbors’ makes for a good story, but what was missing was a benchmark. To provide you that worldwide context, we’re introducing Global Speed, the average internet speed of the world, to the top of the Speedtest Global Index.

You can still use the Speedtest Global Index to see download and upload speeds by country and rank who’s fastest and slowest. Here we’ve paired data about those individual country speeds over the past year with the new global averages call out which countries have improved most over the past year, who’s shown the least improvement and what speeds are like in the world’s most populous countries. Read on to see who’s winning the internet speed race and who has a lot of catching up to do.

The comparisons here are based on Speedtest data from November 2016-November 2017. We used the same monthly threshold for this article that we do for inclusion in the Speedtest Global Index: to be ranked in each category, countries must have at least 670 Speedtest results from unique users on mobile and at least 3,333 for fixed broadband. Although we use the word “country” throughout, you will notice some regions like Hong Kong and Puerto Rico that are large or autonomous enough to call out as separate entities, even though they are not separate countries. Global speeds are a weighted average of all samples from around the world.

Global download speeds are up more than 30% across the board

With a mean global speed of 20.28 Mbps, mobile downloads increased 30.1% over the last 12 months and mobile uploads increased 38.9%. A global average of 40.11 Mbps makes fixed broadband downloads 97.8% faster than mobile and this speed increased 31.6% during the same period. Uploads over fixed broadband showed the smallest increase of 25.9%.

Global Internet Speeds
November 2016 – November 2017
Download: November 2017 Average (Mbps) Download: Year Over Year Increase Upload: November 2017 Average (Mbps) Upload: Year Over Year Increase
Mobile 20.28 30.1% 8.65 38.9%
Fixed 40.11 31.6% 19.96 25.9%

In November 2017, 119 countries boasted a faster mobile download speed than the global average while 134 were slower. On the fixed broadband side, 71 countries and regions beat the global average download speed and 185 were slower. As we reported last week, gigabit Speedtest results are rolling in from across the planet, but their distribution across continents is wildly uneven.

Most improved countries

It was a good year for Laotian mobile speeds. With a 249.5% jump in mobile download speeds, Laos showed the largest improvement in the world. Vietnam came in second with an increase of 188.7% and Trinidad and Tobago was third at 133.1%. All of the countries listed on the table below are to be commended for making mobile internet faster.

Countries with the Largest Improvement
Mobile Download Speed

November 2016 – November 2017
Year Over Year Increase November 2017 Speed (Mbps)
Laos 249.5% 13.77
Vietnam 188.7% 19.54
Trinidad and Tobago 133.1% 11.68
Hong Kong (SAR) 102.6% 35.64
Lebanon 92.3% 24.50
Cyprus 90.2% 26.14
Republic of the Union of Myanmar 81.0% 11.72
Costa Rica 80.9% 7.89
Cambodia 70.5% 14.97
Sudan 68.9% 9.85

The tiny island of Reunion, a region of France off the coast of Africa, saw the largest improvement in download speed over fixed broadband in the world with a gain of 141.5%. Guatemala was second at 116.7% and Ghana third at 82.1%.

Countries with the Largest Improvement
Fixed Broadband Download Speed

November 2016 – November 2017
Year Over Year Increase November 2017 Speed (Mbps)
Reunion 141.5% 62.64
Guatemala 116.7% 12.04
Ghana 82.1% 18.96
Peru 80.1% 16.48
India 76.9% 18.82
Panama 76.6% 28.62
Italy 72.1% 31.58
Libya 67.6% 3.84
Argentina 62.2% 15.49
Kenya 60.9% 15.59

In some countries, notably Libya, a small gain in megabits per second (Mbps) can result in a large percentage increase. Although the actual performance improvement is small, we’re glad to see speeds moving in the right direction.

Speeds in some countries declined

On the flip side, there were far too many countries and regions where internet speeds decreased. The devastation of Puerto Rico’s mobile infrastructure by Hurricane Maria surely contributed to the island’s 39.8% drop in mobile download speed during the past twelve months. Uzbekistan saw a decline of 31.8% and Côte d’Ivoire 26.1%.

Countries with the Smallest Improvement
Mobile Download Speed

November 2016 – November 2017
Year Over Year Change November 2017 Speed (Mbps)
Puerto Rico -39.8% 8.53
Uzbekistan -31.8% 6.47
Côte d’Ivoire -26.1% 10.95
Brunei -23.4% 9.83
Thailand -19.7% 13.38
Iraq -16.8% 3.12
Algeria -10.8% 7.19
Nigeria -8.4% 9.90
Bangladesh -7.4% 4.97
Morocco -6.3% 15.03

Algeria saw the largest decrease in download speed over fixed broadband speed in the world at 23.9%. Dips of 9.1% in Ecuador and 6.5% in Latvia were less troubling but still moving in the wrong direction.

Countries with the Smallest Improvement
Fixed Broadband Download Speed

November 2016 – November 2017
Year Over Year Change November 2017 Speed (Mbps)
Algeria -23.9% 3.76
Ecuador -9.1% 10.40
Latvia -6.5% 47.25
Tunisia -3.2% 6.90
Iraq -1.1% 7.87
Syria -0.3% 7.12
Taiwan 0.5% 42.32
Maldives 1.0% 12.04
Namibia 1.2% 9.74
Jamaica 1.5% 19.11

Performance in the world’s most populous countries

With 57% of the world’s population, any internet performance improvements seen in the world’s ten most populous countries have a wide reach. Pakistan came out on top of the world’s largest countries with a 56.2% jump in mobile download speed during the past 12 months. India came in second in this category at 42.4% and Brazil third at 27.6% .

World’s Most Populous Countries
Improvement in Mobile Downloads

November 2016 – November 2017
Year Over Year Change November 2017 Speed (Mbps)
Pakistan 56.2% 13.08
India 42.4% 8.80
Brazil 27.6% 16.25
Japan 23.5% 21.67
United States 22.0% 26.32
Russia 19.2% 15.80
Indonesia 18.1% 9.73
China 3.3% 31.22
Bangladesh -7.4% 4.97
Nigeria -8.4% 9.90

At the other end of the spectrum, Nigeria’s mobile download speed actually dropped 8.4% and Bangladesh’s dipped 7.4%. China showed only a modest 3.3% increase in mobile download speed in 2017.

On the fixed broadband side, India came out on top of the world’s most populous countries for improvements to download speed during the past 12 months with an increase of 76.9%, beating China’s second place 42.3% increase and a 37.3% gain in the U.S.

World’s Most Populous Countries
Improvement in Fixed Broadband Downloads

November 2016 – November 2017
Year Over Year Change November 2017 Speed (Mbps)
India 76.9% 18.82
China 42.3% 61.24
United States 37.3% 75.94
Japan 20.7% 73.51
Indonesia 18.9% 13.38
Brazil 18.5% 17.80
Pakistan 15.5% 6.13
Russia 14.6% 36.90
Bangladesh 13.7% 16.14
Nigeria 3.8% 9.53

Nigeria again came out at the bottom of the world’s largest countries, this time with a 3.8% increase in download speed over fixed broadband.

We’ll revisit global internet speeds periodically here on our blog, but you can keep up to date on the latest trends in worldwide internet speeds by visiting the Speedtest Global Index. It’s updated every month with individual country data and, now, global averages. Keep track of your country’s performance and see how you rank against the world.

Ookla retains ownership of this article including all of the intellectual property rights, data, content graphs and analysis. This article may not be quoted, reproduced, distributed or published for any commercial purpose without prior consent. Members of the press and others using the findings in this article for non-commercial purposes are welcome to publicly share and link to report information with attribution to Ookla.

| August 21, 2019

Examining Vodafone Idea Performance One Year After the Merger

When Vodafone India merged with Idea Cellular, the company promised a better network and new technology that would result in improved performance. So has it? We analyzed Speedtest IntelligenceTM data from August 2018 – July 2019 to find out. Because Vodafone and Idea still maintain separate brands, we’ve considered their data separately, but the trends in their performance are similar.

How mobile speeds have changed in India

vodafone-graph-1

Speedtest results show that mobile download speeds in India improved on average for all the top mobile operators over the period of August 2018 – July 2019, with Airtel holding onto the title of fastest operator throughout these 12 months.

However, a month-by-month view reveals a more interesting story. After May 2019, mean mobile download speeds for both Airtel and Jio started a decline that continued through July 2019. Meanwhile, Vodafone saw a decline in mean mobile speed from November 2018 through January 2019, after which they recovered to significantly increase download speed to effect a year-over-year improvement of 23.6%. Mobile download speeds on Idea improved in every month except December 2018, for a year-over-year improvement of 51.2%. In comparison, Airtel’s download speed increased 7.7% during the same period and Jio’s download speed went up 10.8%.

Operators meeting the Acceptable Speed Ratio

vodafone-graph-2

One measure of a mobile operator’s performance is how consistently they provide speeds at or above 5 Mbps, which is fast enough for consumers to reliably use mobile devices to stream HD video. We call this the Acceptable Speed Ratio (ASR).

Looking at mobile performance in India over the past year, Airtel had the highest ASR in every single month, with an ASR for the year of 70.4%. Despite a dip in January, Vodafone had the second highest ASR throughout the year with an average ASR of 60.3%. Jio held third place for ASR until April 2019, when they were overtaken by a steadily improving Idea. On average, though, Jio ranked third for ASR for the year at 54.5% while Idea’s ASR for the year was 52.5%.

How mobile and fixed broadband speeds compare in India

vodafone-graph-3

Looking at India as a whole, mean mobile download speed increased 16.2% in India last year. While this percentage alone may appear strong, it represents an improvement of less than 1.5 Mbps over 12 months. Also worrying, the country’s average mobile download speed declined after May 2019. 5G can’t come soon enough.

Meanwhile, India’s download speed over fixed broadband achieved a 25.3% increase during the past 12 months, a 6.21 Mbps improvement. Jio saw the largest increase in mean download speed over fixed broadband among top providers during the past 12 months with a 120.1% increase. BSNL increased 74.2%, GTPL 32.1%, Airtel 23.8%, YOU Broadband 13.9%, and ACT 12.0%. Hathway’s mean download speed over fixed broadband fell 0.2%. ACT was the fastest provider for each of the 12 months we examined.

India’s global ranking for mobile speeds is falling

vodafone-graph-4

Looking at the Speedtest Global IndexTM, India ranks poorly for mobile download speed when compared with neighboring countries and fell further behind throughout the past year. India ranked better for fixed broadband when compared to neighboring countries, though that rank, too, has slipped over the past 12 months. We’ll be interested to see if Jio’s plan to launch fiber-to-the-home (FTTH) in September improves the national average speed for fixed broadband.

Based on mobile download speed and ASR, Vodafone Idea customers are definitely benefitting from last year’s merger. Which is good, because the increase in mobile download speeds in India as a whole was nominal and not keeping pace with the rise in download speed over fixed broadband. Worse, India’s mobile download speed is not keeping up with a general global improvement. We hope continued investments by mobile operators will turn mobile speeds around even before 5G finally launches in India. We’ll continue to watch for increases in performance and to see how the coming FTTH expansion affects India’s fixed broadband speeds.

Ookla retains ownership of this article including all of the intellectual property rights, data, content graphs and analysis. This article may not be quoted, reproduced, distributed or published for any commercial purpose without prior consent. Members of the press and others using the findings in this article for non-commercial purposes are welcome to publicly share and link to report information with attribution to Ookla.

| September 17, 2019

What Happens to the Internet When Mobile Providers Go Down

You may have experienced the panic that happens when you realize you can’t get a connection on your phone. Most of us in these moments will try several ways of getting online before rushing to Downdetector® to see if our mobile operator is out of service or if it’s just us. Having access to data from both Downdetector and Speedtest® gives us unique insight into how network outages impact the internet as a whole, and in this article we’re exploring that impact in several key markets around the world.

The outages we explored

We looked specifically for recent outages that affected mobile networks in a variety of countries around the globe. The outages we explored were in Brazil (Vivo — 12,994 reports on August 22), Canada (Rogers and Freedom Mobile — 35,685 reports July 7-8), Italy (Iliad — 3,018 reports on June 21), India (Vodafone-Idea — 1,386 reports on July 17), the Netherlands (KPN Mobile, T-Mobile and Vodafone — 92,391 reports on June 24), Sweden (Tele2 — 7,275 reports June 17-19) and the United States (T-Mobile — 95,267 reports on September 6).

Working hypotheses

We had three hypotheses when we set out to do this analysis based on what we would expect to happen in a prolonged, near-total mobile outage:

  1. Mobile speeds would increase during an outage (for those who could connect) because there would be significantly less network congestion.
  2. Fixed broadband speeds would not change during an outage.
  3. The number of mobile Speedtest results would increase on the day of the outage as users tried to troubleshoot their connections.
  4. The number of fixed broadband Speedtest results would also increase on the day of the outage as people switched from mobile to fixed broadband to try and connect.

As with any real-world experiment there are many variables that can affect the results but for which we cannot control. Each of these outages varied in duration, cause and totality — factors which affect potential outcomes.

Mobile Outages Affect Download Speed in Different Ways

We compared each operator’s mean download speed over mobile on the day of the outage with their mean speed during that month to see if our hypothesis held. Results were mixed.

How Mobile Outages Affect Mobile Speed

In India and the U.S., mobile download speeds did increase very slightly for each provider on the day of the outage when compared with the monthly average. Both of these outages were localized within the country with the Indian outage centering around Ahmedabad and the U.S. outage falling on the East Coast.

On the other hand, mobile download speeds in Brazil and Italy were lower on the day of the outage than the monthly average. Significantly so in Italy. In both of these instances the mobile operator was experiencing a geographically widespread outage.

The outage in Canada revealed two different stories as download speed decreased slightly during the outage for Rogers customers and increased for customers of Freedom Mobile. Results were also mixed in the Netherlands with Vodafone customers seeing a significantly higher download speed, KPN Mobile customers seeing a slightly higher speed and T-Mobile customers seeing a decrease in download speed.

The outage in Sweden occurred in three waves over three separate days:

Downdetector view of June 2019 Tele2 Outage Peaks

We looked at each separately and found that mobile download speed on Tele2 increased during the smaller first and last waves. Meanwhile, mean download speed decreased during the largest middle outage.

Fixed broadband speeds show only slight variations

We measured download speed over fixed broadband at the country level both on the day(s) of the outages and compared that number with the average download speed for the appropriate month.

How Mobile Outages Affect Fixed Broadband Speed

Our hypothesis about fixed speeds not changing during mobile outages proved mostly true. Although download speed over fixed broadband did decrease in Italy and the Netherlands during their country-wide outages, the decrease was very small. In Canada there was virtually no difference in speed between the day of the outage and the monthly average.

Download speed over fixed broadband was faster during the outages in all other countries we examined. However, the differences were not large enough to rule out day-to-day fluctuations in speed.

Speedtest results usually increase during outages

We also compared the number of Speedtest results over both mobile and fixed broadband during the outages with the daily averages in each country for the appropriate month.

Effect of Mobile Outages on Number of Speedtest Results

Our hypothesis that the number of mobile Speedtest results would increase on the day of an outage held mostly true. Exceptions were Canada and two days of the Swedish outage. Fixed broadband Speedtest results also mostly increased, except in Canada and the Netherlands, but for the most part only very minimally.

Contact us to learn how data from Downdetector and Speedtest can help you before, during and after an outage.

Ookla retains ownership of this article including all of the intellectual property rights, data, content graphs and analysis. This article may not be quoted, reproduced, distributed or published for any commercial purpose without prior consent. Members of the press and others using the findings in this article for non-commercial purposes are welcome to publicly share and link to report information with attribution to Ookla.

| October 21, 2019

Exploring Recent Trends in the India Telecom Market

With the release of new fiber-to-the-home services and a strong push by providers to bring 4G to more parts of the country, we decided to check in and see how fixed broadband speed, mobile speed and 4G Availability have looked over the last two quarters in India.

Our analysis includes performance data from 21,096,823 consumer-initiated tests taken with Speedtest® and coverage data from over 2.5 billion coverage scans on 2,436,758 devices during Q2-Q3 2019.

For the first time ever we are also making available for download a detailed report on performance by operator including an in-depth look at peak time performance. Download the full report.

Mobile and fixed speeds are increasing at the country level

India-Mobile-Fixed-Speeds-in-Largest-Markets--1-
Mean fixed broadband download speeds in India rose 16.5% during Q2-Q3 2019 and topped 34.07 Mbps in September. Compared to Bangladesh, which saw a similar rate of improvement but lower speeds at 24.02 Mbps, and Pakistan, where speeds stayed relatively flat between 8.54 and 9.14 Mbps, India is the regional leader in mean download speed.

With Reliance Jio’s rollout of its new GigaFiber service in India in early September, we will likely continue to see country-wide speeds increase. (Download the full report to compare Jio’s monthly fixed download speeds before and after the launch of GigaFiber.)

However, mobile download speeds were relatively flat in India, fluctuating between 10.63 Mbps and 11.18 Mbps during Q2-Q3 2019. Regionally, India’s mobile performance is marginally faster than Bangladesh’s, which saw average speeds max out at 10.43 Mbps, and somewhat slower than Pakistan’s top speeds of 15.55 Mbps.

4G Availability continues to improve in India

India’s mobile providers are still trying to provide consistent 4G coverage across the country. We compared coverage data for over 231,274,713 samples from Speedtest Android users across Indian mobile operators in Q2-Q3 2019 to benchmark India’s 4G Availability against other markets in the region.

India-4G-Availability-by-Country

4G Availability is the percentage of an operator’s known locations where a device has access to LTE service (including roaming). India’s 4G Availability was relatively high at 87.9% across providers during Q2-Q3 2019. That means that Speedtest users had access to LTE service at 87.9% of surveyed locations. For comparison, 4G Availability was 58.9% in Pakistan and 58.7% in Bangladesh during the same period.

Fixed broadband speeds show wide disparities between India’s largest cities

In a country as large as India, country-wide averages factor in many regional differences. To get a clearer picture of how consumers experience the internet across the country, we looked at fixed and mobile download speeds in the 15 largest cities in India during Q2-Q3 2019.

Ookla_Internet-Speeds-in-India---Largest-Cities-2

Chennai had by far the fastest mean download speed over fixed broadband (51.07 Mbps), followed by Bengaluru (42.50 Mbps) and Hyderabad (41.68 Mbps). The slowest download speeds on our list were measured in Nagpur (20.10 Mbps), followed by Pune (22.78 Mbps) and Kanpur (23.20 Mbps).

Mobile download speeds — which include all cellular technologies — showed somewhat less variation from city to city. Mumbai (11.87 Mbps), Indore (11.80 Mbps), Visakhapatnam (11.74 Mbps), Hyderabad (11.48) and Kolkata (11.46 Mbps) had the fastest mobile download speeds. The slowest mean download speed on our list was measured in Lucknow (8.94 Mbps).

Want to see which ISPs and mobile operators were fastest in each city, plus a breakdown of how operators perform at peak times of network congestion, based on signal metrics? Download the full report.

Ookla retains ownership of this article including all of the intellectual property rights, data, content graphs and analysis. This article may not be quoted, reproduced, distributed or published for any commercial purpose without prior consent. Members of the press and others using the findings in this article for non-commercial purposes are welcome to publicly share and link to report information with attribution to Ookla.

| February 11, 2019

Analyzing India’s 4G Availability: Including a Look at the 15 Largest Cities

It’s a good time to be a mobile customer in India with Airtel expanding its LTE service in major cities using the 900 MHz band and Jio making continuous progress on its mission to provide 4G coverage to all Indians. All this good news made us want to check in to see what cellular availability in India currently looks like.

We analyzed General Availability and 4G Availability using coverage data from 250,138,853 samples on 595,034 enabled devices during Q3-Q4 2018. General Availability is the percentage of an operator’s known locations where a device has access to any kind of service (including roaming). 4G Availability is then the percentage of an operator’s known locations where a device has access to LTE service (including roaming). We compared these results across Indian mobile operators to see which provides the best availability.    

Cellular service is widely available across India

General Availability statistics are good for all of India’s major mobile operators. In a country where there are only 1.33 fixed broadband subscriptions per 100 people, access to mobile internet is critical. Jio’s General Availability was best, with users finding service in 99.3% of locations. Airtel was second at 99.1%, followed closely by Vodafone (99.0%) and Idea (98.9%).

Percentage of Locations With Cellular Service
India | Q3-Q4 2018
Operator General Availability (%)
Jio 99.3
Airtel 99.1
Vodafone 99.0
Idea 98.9

As you can see from the map below, most areas in India are covered by at least one of the country’s four largest mobile operators.

All-Carrer-Map-Animate-1

Coverage data relies on the presence of a user in a location, so it’s normal to see the majority of results that show coverage (seen in blue) coming from the most populated areas. When a sample is taken and a user does not have cellular coverage (seen in red), that data is transmitted later. Areas that show no dot are places where no coverage data was collected. These gaps often correspond with national parks or other remote areas that people visit less frequently.

Jio showed the densest pattern of coverage samples for General Availability across India, with only a few areas where coverage data showed no service.

Airtel’s pattern of coverage samples showed only slightly less areas with coverage. Airtel had only slightly more “no service” areas, particularly in Maharashtra, Uttar Pradesh and Himachal Pradesh.

Idea and Vodafone had a similar density of coverage samples showing coverage, but were strong in different parts of the country. Idea showed more density in Andhra Pradesh and Madhya Pradesh, while Vodafone was stronger in Tamil Nadu and West Bengal. Neither showed a large number of “no service” areas.

4G availability in India depends on your mobile operator

LTE connections, while widely available in much of India, depend heavily on which mobile operator a consumer has chosen. At a country-level, Jio shows an impressive 98.8% 4G Availability. That means that a Jio customer has access to LTE service at 98.8% of surveyed locations. Airtel is second at 90.0%, followed by Vodafone (84.6%) and Idea (82.8%).

Percentage of Locations with LTE Service
India | Q3-Q4 2018
Operator 4G Availability (%)
Jio 98.8
Airtel 90.0
Vodafone 84.6
Idea 82.8

Coverage data from the four largest mobile operators reveals that LTE is not available in all the areas that general cell service is in India. This is especially true in the center of the country, in Sikkim and in the Andaman Islands.

LTE-Carrer-Map-Animate-2

Except for a few red spots at the edges of Uttarakhand, Rajasthan, Sikkim and the Andaman Islands, Jio’s 4G Availability map is nearly identical to their General Availability map.

Airtel’s 4G Availability map is still very dense, but shows gaps in LTE coverage in many areas of the country including portions of Maharashtra, Madhya Pradesh and Karnataka.

As we saw with overall scores, the 4G Availability map for Vodafone reveals that the operator’s LTE coverage is not as robust as their overall coverage. We saw major gaps in Vodafone’s LTE in Karnataka in particular and smaller gaps in northeastern India in general (with the exception of the most populated areas of West Bengal).

Idea’s 4G Availability map shows gaps in LTE service across the country, especially in less densely populated areas.

4G Availability does not equal fast speeds

Until 5G is rolled out, LTE is the fastest connection type available to consumers. India shows us, however, that 4G Availability does not automatically equate to fastest service. To compare which of India’s largest mobile operators is fastest, we’ve used Speed ScoreTM, a combined measure of download and upload speed that incorporates several tiers of performance.

Comparing Speeds for India’s Largest Mobile Operators
Q3-Q4 2018
Operator Speed Score (all cell) Speed Score (4G LTE)
Airtel 10.34 11.23
Vodafone 8.19 9.13
Jio 7.11 7.11
Idea 6.20 7.02

Airtel was the fastest mobile operator in India during Q3-Q4 2018, regardless of whether a customer was on LTE or not. The ranking of the other operators does not change based on LTE use with Vodafone taking second fastest, Jio third and Idea fourth.

As the above table shows, Jio’s commitment to LTE remained unwavering as demonstrated by the fact that the operator’s Speed Score did not change when looking at all technologies or on LTE alone. We cannot say why Jio’s speeds were slower than those of Airtel and Vodafone, but it’s likely a combination of network congestion and users accessing the Jio network with slower phones.

We’ll be interested to see how these numbers improve in the near term as operators continue to build out their networks.

How general and LTE availability look in India’s largest cities

Country-wide averages can hide a lot of information. To get a clearer picture of the customer experience across the country, we looked at General and 4G Availability as well as operator speeds in the 15 largest cities in India.

General Availability is strong

india-general-avail-map-1

General Availability was good (in the 98-99% range) for India’s largest mobile operators in most of India’s 15 largest cities. Airtel showed General Availability of 99% or higher in all 15. Jio’s lowest score (in Jaipur) was still high at 98.9%. Vodafone’s only score below 99% was in Kolkata (97.9%). Idea, on the other hand, showed General Availability scores below 99% in six cities: Hyderabad (98.8%), Delhi (98.3%), Jaipur (98.0%), Kolkata (97.9%), Visakhapatnam (97.9%) and Indore (96.6%).

While these scores are all good, consistent mobile service is important to quality of life. If a consumer is living in one of the small sections of these cities that are not well served by their mobile operator it could mean they don’t have access to internet at home, school or where they do business.

4G Availability is all over the map

India’s largest mobile operators were not nearly as consistent with their 4G Availability in India’s largest cities during Q3-Q4 2018 as they were with General Availability. The exception was Jio, which still only showed one city (Jaipur) that was barely below 99%. This is no surprise given Jio’s 98.8% country-wide 4G Availability.

india-4g-avail-map-2

Airtel’s 4G Availability ranged from 92.9% in Visakhapatnam to 97.5% in Bengaluru. Vodafone’s 4G Availability ranged from 74.9% in Hyderabad to 98.0% in Ahmedabad, with two cities in the 70-79.9% band and one in the 80-89.9% band. Idea had the widest spread in 4G Availability — from 38.8% in Delhi to 96.2% in Bengaluru. This includes one city in the 60-69.9% band and three in the 80-89.9% band.

Taking a weighted average of the 4G Availability scores based on number of samples, Kanpur showed the best 4G Availability in India during Q3-Q4 2018 at 98.2%. Bengaluru and Lucknow tied for second and third at 97.6%. Delhi was at the bottom of the list with 93.0%, Kolkata second to last at 95.4% and Pune third to last at 95.9%.

The availability of LTE in India’s largest cities contrasts with our analysis of fixed broadband speeds from last year, which found Chennai, Bengaluru and Hyderabad on top. In that analysis, Delhi ranked fifth, Kanpur fourth to last and Lucknow in the middle.

How a combined Vodafone-Idea could change the map

Vodafone and Idea merged in 2018, but the brands continue to operate independently. If that were to change, we’d expect to see better General Availability for all customers as the two brands’ coverage areas are complementary. 4G Availability would also improve, but not immediately to the level of that of Jio or Airtel because many gaps would remain. In the long run, though, combining operations could allow the two brands to reallocate resources and invest in better LTE coverage, particularly in Karnataka.

Interested in learning more about General Availability and 4G Availability? Schedule a demo at  Mobile World Congress or come see us in Hall 2 at Stand 2I25.

Ookla retains ownership of this article including all of the intellectual property rights, data, content graphs and analysis. This article may not be quoted, reproduced, distributed or published for any commercial purpose without prior consent. Members of the press and others using the findings in this article for non-commercial purposes are welcome to publicly share and link to report information with attribution to Ookla.

| April 2, 2019

How 100+ Million Additional Users Affects a Network: Mobile Speeds and 4G Usage During the Kumbh Mela

Millions of Hindus gather in one of four locations in India on a twelve year cycle to participate in the Kumbh Mela, the largest religious gathering in the world. Though the focus of the festival is a series of ritual baths in sacred waters, pilgrims and tourists use their mobile phones to help them navigate and to find friends and family in the immense crowds.

This year the Ardh Kumbh Mela in Prayagraj drew over 100 million visitors, and India’s largest mobile carriers have rolled out various mobile programs to help pilgrims. We were curious to analyze how well mobile networks held up. We’ve examined mobile speeds and 4G usage in and around Prayagraj from January 14-March 4, 2019.

How the top four operators performed at the Kumbh Mela

As mentioned above, India’s largest mobile operators put significant preparation into serving the massive influx of pilgrims during the Kumbh Mela. Airtel deployed Massive MIMO to expand network capacity, Jio launched an app that included real-time info on events and a family locator, and Vodafone-Idea offered an RFID tag to help locate children.

Mobile Speeds at the Kumbh Mela
Prayagraj, India | January 14-March 4, 2019
Connection Type Mean Download (Mbps) Mean Upload (Mbps) Mean Latency (ms)
Airtel 15.83 4.67 52
Jio 8.04 4.79 104
Vodafone 7.61 3.03 68
Idea 5.16 3.93 77

Airtel’s emphasis on increasing capacity paid off in speed with their mean download speed in the vicinity of the Kumbh Mela coming in 96.9% faster than that of second-place Jio. Vodafone was third and Idea a distant fourth.

Speeds decrease when traveling between states

Mobile operators in India use different MCC/MNC codes in different parts of the country, which allows us to differentiate speeds for customers who are “roaming” between telecom circles. In most cases these telecom circles correspond to states and union territories, but some represent only portions of a state or combinations of multiple states.

We compared speeds experienced during the time of the Kumbh Mela for customers from eastern Uttar Pradesh with those visiting this area from elsewhere in the country. We omitted data for the Kerala and North East (which comprises most of the North Eastern states) telecom circles for reasons of sample size.

India_Kumbh-Mela_Mobile_Speeds_map-2

Customers visiting from seven telecom circles (Rajasthan, Madya Pradesh, Karnataka, Delhi, UP West, Punjab and Andhra Pradesh) showed faster mean download speeds in eastern Uttar Pradesh than local customers. The Rajasthan telecom circle showed the fastest mean download speed when “roaming” in UP East at 9.10 Mbps, 9.6% faster than the local UP East download speed.

Customers visiting in UP East from 12 telecom circles (Himachal Pradesh, Kolkata, Haryana, Maharashtra and Goa, Assam, Jammu and Kashmir, Gujarat, Tamil Nadu, West Bengal, Odisha, Bihar and Mumbai) saw slower mean download speeds than local UP East customers. The Himachal Pradesh telecom circle showed the slowest mean download speed when “roaming” in UP East at 6.15 Mbps, 25.9% slower than the local UP East download speed.

Even when “roaming” across states, people remain on 4G

We also compared the percentage of time customers spent on 4G in their home telecom circles with the time spent on 4G when they were “roaming” in UP East during the Kumbh Mela. Time spent on 4G includes on- and off-network connections. We excluded the Assam, Jammu and Kashmir, Kerala, North East, and Himachal Pradesh telecom circles for insufficient data.

Time Spent on 4G in Home Telecom Circle and While Roaming Domestically
India | January 14-March 4, 2019
Telecom Circle Time on 4G at Home Time on 4G in UP East Difference
West Bengal 81.8% 92.2% 12.7%
Odisha 92.9% 96.8% 4.2%
UP West 85.9% 89.2% 3.9%
Bihar 90.6% 92.8% 2.4%
Delhi 84.3% 86.2% 2.3%
Kolkata 89.0% 89.7% 0.7%
Haryana 90.2% 90.5% 0.4%
UP East 90.0% 90.0% 0.0%
Rajasthan 89.7% 89.3% -0.4%
Andhra Pradesh 88.0% 87.5% -0.6%
Tamil Nadu 88.7% 87.8% -0.9%
Maharashtra and Goa 82.6% 81.2% -1.7%
Punjab 89.9% 87.4% -2.8%
Gujarat 87.7% 85.3% -2.8%
Mumbai 88.0% 83.8% -4.7%
Madhya Pradesh 89.8% 84.1% -6.4%
Karnataka 91.0% 84.9% -6.7%

The percentage of time consumers spent on 4G was remarkably similar in their home telecom circles and when “roaming” in UP East. The outliers were customers from West Bengal (who were connected to 4G 12.7% more frequently in UP East than when they were at home) and those from Madhya Pradesh and Karnataka (who were connected to 4G 6.4% and 6.7% less frequently, respectively, than they were at home).

Managing an influx of 100 million or more additional people is an amazing feat for a mobile network and India’s top four mobile operators held up relatively well. Customers from some parts of the country even saw a faster download speed than the locals. 4G usage also held up relatively well no matter which part of the country Indian pilgrims were visiting from.

Ookla retains ownership of this article including all of the intellectual property rights, data, content graphs and analysis. This article may not be quoted, reproduced, distributed or published for any commercial purpose without prior consent. Members of the press and others using the findings in this article for non-commercial purposes are welcome to publicly share and link to report information with attribution to Ookla.