| February 11, 2020

New Consumer Sentiment Data Reveals Relationship Between Network Performance and Customer Satisfaction

At Ookla® we believe speeds are a foundational measure of customer experience. But what happens when a customer is getting great speeds and still isn’t happy with their provider? Would that provider even know? This is why we ask Speedtest® users to rate their provider on a five-star scale at the end of a test. The resulting data forms the core of Consumer SentimentTM, a new dashboard in Speedtest Intelligence®. With Consumer Sentiment, we can gauge customer satisfaction and pair that information with performance data to get a full picture of customer experience.

We analyzed Consumer Sentiment data on ratings from the United States in Q4 2019 to gauge some of the nuances of customer satisfaction.

Overall customer satisfaction varies widely by location and operator

Ookla’s five-star rating system gauges a customer’s overall satisfaction with a provider’s service and brand. Comparing ratings data across the home states of the top four mobile operators in the U.S., we saw that customers’ perception of their operators varies between the states.

chart-mobile-ops-ratings-us

Speedtest Intelligence shows T-Mobile consistently had among the best ratings with their highest average rating (3.7) in Kansas and their lowest (3.5) in both Texas and Washington. Average customer ratings for AT&T ranged between a low of 2.9 in their home state of Texas to a high of 3.5 in Washington State. Sprint’s highest average rating (3.8) was in their home state of Kansas, while their lowest rating (2.7) was in Texas. Verizon’s highest rating (3.4) was in Kansas and New York, while their lowest (2.9) was in Washington.

Kansas showed the highest ratings for almost all operators, with the exception of AT&T which was 0.1 higher in Washington than in Kansas. Texas showed the lowest. This Consumer Sentiment data from Speedtest Intelligence forms a jumping off point for providers to investigate what else might be going on in those locations, whether it’s infrastructure that needs improvement or a perception challenge.

Performance data plus Consumer Sentiment tells a broader story

We paired Speedtest Intelligence data on mean download speed in each of the states considered with Consumer Sentiment ratings to see how speed might affect customer satisfaction.
Ookla_Download_Speeds_Customer_Ratings_Mobile_Operators_US_0220
We found that having the fastest mean download speed in a location does not necessarily indicate that an operator will have the highest Consumer Sentiment ratings. In two states, Kansas and Washington, the operator with the fastest speed also had (or tied for) the highest rating. In New York, however, Verizon had the fastest speed, while T-Mobile had the highest rating. In Texas, Sprint had the fastest speed and the lowest rating.

Analyzing performance at different ratings tiers

To better understand the relationship between network performance and customer satisfaction, we broke out performance results by star ratings. Looking more deeply at mean performance data at each ratings tier, we can see that consumers with higher speeds and lower latency generally gave higher ratings.

chart-mean-fixed-download

chart-mean-fixed-upload-1

chart-mean-fixed-latency-5

Location alone does not account for satisfaction

Based on the “happy Kansas, unhappy Texas” data above, it might be easy to assume that satisfaction is regional. However, such an assumption could cause a provider to overlook important nuances of customer contentment. For example, an examination of Consumer Sentiment ratings data from the five boroughs of New York City reveals that satisfaction varied among the boroughs and between ratings by mobile and fixed customers.

chart-mobile-ops-ratings-nyc

A fixed broadband provider might think Manhattan was the unhappiest borough of all, when in fact they had the highest Consumer Sentiment ratings among mobile customers. The story in Queens was the opposite, with that borough showing the highest overall satisfaction for fixed broadband we saw in all of New York City. Meanwhile, their overall satisfaction on mobile was among the lowest reported.
Ookla_Mobile_Fixed_Speeds_Ratings_NYC_0220
As we saw above with the state data, the locations with the fastest speeds were not necessarily the locations with the highest Consumer Sentiment ratings.

There is much more to explore here, and Consumer Sentiment in Speedtest Intelligence gives providers a new layer of data to understand how consumers’ real-life experience impacts their satisfaction. Consumer Sentiment can be tracked over time and benchmarked against competitors, without the overhead of custom market research. Curious how satisfied your customers are with their overall network performance? Request a demo of the new Consumer Sentiment dashboard in Speedtest Intelligence.

Ookla retains ownership of this article including all of the intellectual property rights, data, content graphs and analysis. This article may not be quoted, reproduced, distributed or published for any commercial purpose without prior consent. Members of the press and others using the findings in this article for non-commercial purposes are welcome to publicly share and link to report information with attribution to Ookla.

| January 6, 2020

Football Playoffs Take Out Sports Betting Site FanDuel

The NFL playoffs are an inopportune time for a fantasy sports and betting site like FanDuel to be down, but a period of increased usage is exactly what can take a website out of commission. Downdetector® reports that FanDuel crashed on January 4, 2020 and January 5, 2020, just when football fans were reaching near peak excitement for the season. We have data on when FanDuel went down, how severe those outages were and where frustrated users were located.

How the outages played out

FanDuel Outages During Playoffs per Downdetector®
January 4-5, 2020
Date Reports Approx. Duration of Reports (Hours)
January 4, 2020 (outage 1) 1140 1.25
January 4, 2020 (outage 2) 5757 3.50
January 5, 2020 2248 7.00

January 4 (outages 1 and 2)

The Texans had barely started playing the Bills on Saturday, January 4 when reports of FanDuel being down started rolling in, primarily from Chicago, Brooklyn and Pittsburgh. This outage was relatively short, but then so was the reprieve.

New outage reports spiked right about kickoff time for the Titans v. Patriots. This outage was both more severe, showing 5 times as many reports, and lasted longer. Sports fans in Philadelphia, Pittsburgh and Indianapolis provided the highest number of outage reports.

Pennsylvania and Indiana are two states where FanDuel users can legally bet online.

January 5

On Sunday, January 5, it was the Seahawks v. Eagles that gave FanDuel the most trouble with an outage that started right before kickoff and petered along for about 7 hours. The highest concentration of reports came from Pennsylvania, home territory of the Eagles.

Will FanDuel be ready for The Big Game?

Outages are not isolated incidents, and previous outages on November 28 and December 29 could have been warning signals for FanDuel site managers. We hope these issues don’t pop up again when fans around the world tune into the Big Game on February 2, but we can’t say for certain.

If you’re concerned about outages on your site, Downdetector can help. Downdetector helps reduce downtime by providing data on regions and services affected that can point to a root cause. Learn more about how Downdetector can help you.

Ookla retains ownership of this article including all of the intellectual property rights, data, content graphs and analysis. This article may not be quoted, reproduced, distributed or published for any commercial purpose without prior consent. Members of the press and others using the findings in this article for non-commercial purposes are welcome to publicly share and link to report information with attribution to Ookla.

| July 12, 2017

Analyzing Internet Speeds at the Busiest Airports in North America

The last time we analyzed internet speeds at airports in North America, we focused entirely on the busiest airports in the U.S. As part of our series on the fastest airports around the world, this time we’re expanding to include the busiest airports across the entire North American continent.

Using Speedtest data from March-May 2017, we’re ranking free airport Wi-Fi and cellular speeds at 30 airports from Calgary to Panamá City. For airports we’ve examined before, we’ve also included details on how much their speeds have improved, or (sadly) declined.

Fastest airport Wi-Fi

Free airport Wi-Fi is clearly an expectation travelers have at North American airports and many airports are rising to the challenge. Once again, Denver International’s Wi-Fi is fast. In fact, downloads at Denver’s airport are 27% faster than the last time we crunched the numbers. Even better, it’s the fastest Wi-Fi we’ve seen at any airport on the planet. Second fastest in North America and (as far as airports we’ve examined in Africa, Asia, Europe and North America) second fastest in the world is Vancouver International Airport.


Flyers at international airports in Philadelphia, San Francisco, Seattle-Tacoma and Calgary should also be delighted with the free airport Wi-Fi they see at those hubs—all of which are faster than any free airport Wi-Fi we saw in Asia, Europe or Africa. Though mostly slower than the average mobile Wi-Fi download speed in the U.S. (57.31 Mbps) and Canada (51.17 Mbps), travelers at these airports should have no complaints about Wi-Fi speeds.

Wi-Fi download speeds at airports in Boston, Dallas-Fort Worth and Mexico City are about as fast as those in Moscow or Seoul. Miami’s speed is similar to that in Delhi. Meanwhile the speeds in Toronto, Atlanta and Montréal were slower than any Wi-Fi we saw in Africa, though comparable to many airports in China. The Wi-Fi at Benito Juárez is 87% faster than Mexico’s country average for mobile Wi-Fi of 14.81 Mbps.

We were delighted to see how much some airports had improved their Wi-Fi download speeds in the last 6 months. San Francisco, in particular, offered a 718% improvement. Boston was up 283%, LaGuardia increased 145% and Orlando 124%. And then there are the airports where Wi-Fi got slower: Miami, Chicago, and Newark all saw double-digit drops.

We saw no tests on the published free airport Wi-Fi SSIDs in San Salvador, Cancún, Panamá City and San José. Guadalajara did not seem to have free airport Wi-Fi.

Fastest airport cell

Canada’s airports rule when it comes to the fastest cellular service at airports in North America. Of the top five airports with the fastest download speeds over cellular, only one (Detroit) is located in the U.S., and pretty close to the Canadian border at that. That makes sense considering Canada has the fastest cellular download speeds for the country as a whole (33.40 Mbps) of any of the countries included in this analysis. Vancouver and Toronto had particularly fast cellular download speeds, faster than any other airports we’ve examined, including those in Munich or Rome.


Of the next 10 fastest airports for cellular downloads, Mexico City is the only one not in the U.S. Ranging from nearly 20 Mbps to just over 30 Mbps, download speeds at these airports most closely resemble those in South Africa.

It’s a little surprising how many major U.S. airports have cellular download speeds that are about half as slow as the country-wide average of 22.64 Mbps during the same time period. Monseñor Óscar Arnulfo Romero International Airport in San Salvador fares better with a download speed that’s more than twice as fast as the El Salvadorean average of 8.13 Mbps.

Elsewhere on the continent, airport speeds more closely mirror country averages. Of the airports we looked at in Mexico, both Benito Juárez and Guadalajara closely straddle the country average of 19.75 Mbps, while Cancún falls a little behind. Tocumen is only somewhat slower than the 13.03 Mbps average download speed in Panamá and Juan Santamaría International Airport in San José is barely above Costa Rica’s 3.37 Mbps.

The 60% improvement in cellular download speeds at Denver International is impressive and Phoenix Sky Harbor, LaGuardia, George Bush Metropolitan and Detroit Intercontinental all showed double-digit increases. Disappointing, though is the fact that cellular download speeds decreased at 9 of the 30 airports we’d previously surveyed.

Wi-Fi or cell?

The answer to this question very much varies depending on which airport you’re at, providing you’re somewhere that both free airport Wi-Fi and cellular service are available.


Canadian airports have such great cellular speeds that you can skip the Wi-Fi. Even though Wi-Fi is technically faster in Calgary. And you’re better off with Wi-Fi in Mexico City.

U.S. airports are all over the map when it comes to choosing Wi-Fi or cell. Nothing beats the Wi-Fi download speed at the Denver airport and, in general, Wi-Fi tends to be faster than cell speeds at airports in the western (but not southwestern) U.S. Wi-Fi is better than cell throughout the northeastern U.S. Meanwhile, airports from Houston to Orlando have better cellular service. But then you’re back to Wi-Fi in Miami.

Regional trends

Canada

Canada has great cellular speeds overall but the Wi-Fi varies a lot by airport. It’s poor at the two easternmost airports we looked at and wonderfully fast at the two westernmost airports.

Central America

Free Wi-Fi is a no-go at the Central American airports we looked at and cellular speeds varied widely depending on the country.

Mexico

Cellular service is a safe bet in Mexico. Though free Wi-Fi is faster at Benito Juárez International Airport, it’s either not available or untested at the other two airports we surveyed and the cellular speeds aren’t terrible at any of the three.

United States

Because we looked at so many airports in the U.S., it became difficult to draw larger trend lines through the data. Unless you’re at LaGuardia or LAX, cellular speeds are pretty good. Free Wi-Fi is generally available, though slow in Atlanta, Minneapolis, Orlando and Phoenix. We’re excited that cellular speeds are getting better in most places and mystified by the places where Wi-Fi is even slower than before.

Do these findings mirror your experience? Do you want us to check out other airports? Take a Speedtest on iOS or Android to help us all better understand internet performance around the globe.

Editor’s note: This article was updated on July 14, 2017 to include data on Vancouver Airport’s Wi-Fi once the SSID was confirmed.

Ookla retains ownership of this article including all of the intellectual property rights, data, content graphs and analysis. This article may not be quoted, reproduced, distributed or published for any commercial purpose without prior consent. Members of the press and others using the findings in this article for non-commercial purposes are welcome to publicly share and link to report information with attribution to Ookla.

| August 21, 2018

Which College Campus Scores the Fastest Wi-Fi?

It’s back to school in the U.S., which can only mean it’s time for the college football season. We care about those long-standing rivalries as much as you do, and we couldn’t wait until game day to pit our favorite teams against each other. So we found a new angle for all that “my team is better than yours” energy: who has the fastest campus Wi-Fi speeds?

To get a pregame answer to “who’s the best?” we looked at download speed for all Wi-Fi Speedtest results. We limited data to those from the internet service provider (ISP) for each campus for the first half of 2018. For context, the average Wi-Fi download speed in the U.S. was 81.91 Mbps during Q1-Q2 2018.

Old Wagon Wheel (October 5, 2018)

Utah vs BYU

Utah is home to the first big grudge match of the year and it’s here that we find Utah State’s Wi-Fi is more than twice as fast as BYU’s. Sorry, Cougars! It’s worth noting that Utah State has the fastest Wi-Fi of any campus discussed in this article. Utah State’s Wi-Fi is even 36.8% faster than the average Wi-Fi download speed for the state of Utah in Q1-Q2 2018.

Florida State–Miami (October 6, 2018)

Florida vs Miami

Our next matchup pits the Florida State Seminoles against the Miami Hurricanes in a rivalry that’s often one of the most-watched football games. If you’re watching that game over Wi-Fi, though, you’ll want to do it from the Tallahassee campus because their Wi-Fi is 24.5% faster than what you’ll find at the University of Miami. Even though that’s 24.2% slower than the state of Florida’s average Wi-Fi speed of 75.96 Mbps during the same period.

Red River Showdown (October 6, 2018)

Texas Vs Oklahoma

For over 100 years, the Oklahoma Sooners have been battling the Texas Longhorns. We can’t say who will win the THREE trophies awarded to the winner of this year’s game, but we can say that on the Wi-Fi front it’s Texas for the win (though both schools have speeds worth bragging about).

Third Saturday in October (October 20, 2018)

Tennessee Vs Alabama

When Alabama’s Crimson Tide meets the Tennesseee Volunteers on the field in Knoxville this year, they will be coming from behind (at least when it comes to Wi-Fi speeds). That’s because the average download speed on the University of Tennessee campus network is 42.7% faster than at Alabama.

World’s Largest Outdoor Cocktail Party (October 27, 2018)

Georgia Vs Florida

What will the crowd be discussing as they tailgate in advance of the Florida-Georgia game? Georgia Bulldog fans might be bragging about their Wi-Fi speeds, which are 23.8% faster than those at the University of Florida. Don’t bring it up among the Florida Gators, though. Unless you want ‘em to get fighting mad.

Saban Bowl (November 3, 2018)

LSU Vs Alabama

We already know from the Third Saturday in October that Wi-Fi speeds are a sore subject for Alabama fans. Hopefully they’ll have won the game against the Tennessee Volunteers because their Wi-Fi matchup with the LSU Tigers is even more brutal. The average download speed over Wi-Fi on the Louisiana State University network is 137.4% faster than on Alabama’s.

Bedlam Series (November 10, 2018)

Oklahoma Vs Oklahoma State

The Oklahoma Sooners couldn’t beat the Texas Longhorns when it came to Wi-Fi download speed, but they’ve got the Oklahoma State Cowboys nicely handled with a 14.5% lead in this intrastate rivalry. Still, considering that the average Wi-Fi download speed for the state of Oklahoma was 67.58 Mbps during the same period, both these schools are doing well.

Big Game (November 17, 2018)

Cal Vs Standord
The California Golden Bears have met the Stanford Cardinal team on the field 120 times but we’re pretty sure this is the first time they’re face to face on Wi-Fi speeds. We were a little surprised to find how thoroughly California trounces Stanford with an 87.8% lead when it comes to download speed. For comparison, the state of California showed a mean Wi-Fi download speed of 87.71 Mbps in Q1-Q2 2018.

The Game (November 17, 2018)

Yale Vs Harvard

If Wi-Fi was football (and we admit it’s not), it would take a hail mary for Harvard to beat Yale with Wi-Fi speeds like these. We’re not going to rub in this defeat by calculating the percentage here.

The Crosstown Showdown (November 17, 2018)

UCLA Vs USC

Yes, we know no one actually calls it this, but it’s catchy, right? We love to see a close match-up like this when it comes to Wi-Fi speeds. If download was the only determinant, the Victory Bell would be painted blue (this year) to honor UCLA’s win. Both schools well outpace L.A.’s average Wi-Fi download speed of 86.17 Mbps during the same period.

Apple Cup (November 23, 2018)

As Ookla’s headquarters are located in Seattle, this one’s personal for us. All dirt roads may lead to Pullman, but the office Dawgs have to concede that Wazzu has the better Wi-Fi download speed. With an average download speed of 94.34 Mbps over Wi-Fi for Washington state as a whole, both schools have some room to make up.

Civil War (November 23, 2018)

Oregon Vs Oregon State
Oregon may lead this 124-year-old rivalry when it comes to football games, but the Oregon State Beavers have it when it comes to Wi-Fi download speed with a 66.6% lead over the Oregon Ducks. For comparison, the average Wi-Fi download speed in Oregon state was 82.25 Mbps during the same period.

Clean, Old-Fashioned Hate (November 24, 2018)

Georgia Vs Georgia Tech

Clean, old-fashioned hate indeed. The Wi-Fi contest between Georgia and Georgia Tech is technically too close to call. Well done Georgia Bulldogs and Georgia Tech Yellow Jackets! Both schools are relatively far behind the state of Georgia’s average of 80.02 Mbps for Wi-Fi downloads in Q1-Q2 2018.

Duel in the Desert (November 24, 2018)

If the Territorial Cup was awarded for fastest Wi-Fi, it would go to the Arizona Wildcats who have a 62.6% lead in download speed over the Arizona State Sun Devils (and the fourth fastest campus Wi-Fi of any school in this article). In case you’re wondering, the average Wi-Fi download speed in the state of Arizona was 83.71 during the same period.

Iron Bowl (November 24, 2018)

Auburn Vs Alabama

Poor Alabama, if you didn’t have so many rivalries… Auburn for the win here as the Tigers come in with a blazing fast Wi-Fi download speed on their campus network. At least Alabama’s Crimson Tide rocks football? The state of Alabama’s average download speed over Wi-Fi was 58.58 Mbps.

Notre Dame–USC (November 24, 2018)

Notre Dame Vs USC

We’re sorry to say that Notre Dame would not be awarded the Jeweled Shillelagh if this game was based on Wi-Fi speed, as the USC Trojans dominate with an 83.0% faster download speed on their campus network than the Fighting Irish.

Paul Bunyan’s Axe (November 24, 2018)

Minnesota Vs Wisconsin

No one was worried about Wi-Fi when the Minnesota Golden Gophers and the Wisconsin Badgers first met on the field back in 1890. Wisconsin should start worrying now, though, because the download speed on Minnesota’s campus network is less than half of what Wisconsin enjoys.

Backyard Brawl (September 3, 2022)

Pittsburgh Vs W. Virginia

You might have to wait until 2022 to watch the Pittsburgh Panthers kick off against the West Virginia Mountaineers, but we can tell you right now which of the two campuses has the fastest Wi-Fi: West Virginia University by 76.8%.

Texas–Texas A&M (in memoriam)

Texas Vs Texas

Unless there’s some conference rearrangement, we may never get to watch Texas A&M’s Aggies play the Texas Longhorns again. But this rivalry dies hard in Texas (and anywhere else fans bleed orange or maroon). If the campuses were to face off today using Wi-Fi download speed alone, the Longhorns would have it. Hook ‘em.

Both campuses do well to beat the state of Texas’s 88.85 Mbps average download speed over Wi-Fi.

A full look at the campus Wi-Fi standings

To understand where the campus Wi-Fi networks we examined rank overall, we compiled all the above results. Oregon State takes first place, Utah State second and Yale third. On the other end of the spectrum, the University of Alabama was in last place, Harvard was second to last and the University of Pittsburgh third to last.

Campus Wi-Fi Speeds
Speedtest Data | Q1-Q2 2018
Campus Mean Download (Mbps)
Oregon State University 128.90
Utah State University 125.46
Yale 124.74
University of Arizona 119.52
University of Texas, Austin 116.56
Auburn University 115.14
UCLA 114.09
Texas A&M 105.78
University of Minnesota 104.24
University of Southern California 102.83
University of Oklahoma 100.58
University of California, Berkeley 96.86
Oklahoma State University 87.86
Louisiana State University 87.56
University of Oregon 77.37
Washington State University 75.49
Arizona State University 73.50
West Virginia University 71.91
University of Washington 68.84
Brigham Young University 67.42
University of Georgia 66.51
Georgia Tech 66.31
Ohio State University 62.14
Florida State University 57.58
University of Notre Dame 56.18
University of Florida 53.08
University of Tennessee 52.63
Stanford 51.57
University of Wisconsin, Madison 50.13
University of Miami 46.25
University of Pittsburgh 40.67
Harvard 37.16
University of Alabama 36.88

Is your favorite team not listed here (ahem, Clemson, Michigan, Lehigh)? Take a Speedtest using the Wi-Fi on your campus network, and we’ll check back next year to see how the rivalries stack up.

Ookla retains ownership of this article including all of the intellectual property rights, data, content graphs and analysis. This article may not be quoted, reproduced, distributed or published for any commercial purpose without prior consent. Members of the press and others using the findings in this article for non-commercial purposes are welcome to publicly share and link to report information with attribution to Ookla.

| January 31, 2018

Which Mobile Carrier Won Sunday’s Big Football Game?

Football’s biggest game is this weekend and we’re excited to hear if all the reported mobile and Wi-Fi investments at U.S. Bank Stadium are up to the challenge on Sunday. We’ll follow up on that next week, but in the meantime we’re limbering up by checking out mobile internet speeds at the Eagles’ and Patriots’ home stadiums over the season. We’re also offering a preview of the performance we’ve seen at U.S. Bank Stadium so far this season.

We looked at stadium speeds for August 1, 2017 through January 30, 2018 and compared speeds by carrier using Speed Score — a combined measure of each provider’s download and upload speed at the 10th, 50th and 90th percentiles — on modern devices (i.e. not your grandfather’s flip phone).

Lincoln Financial Field, home of the Eagles

If we were handicapping teams based on mobile speeds at their home fields, the Eagles would be in sore shape for Sunday. Although Verizon had the best speeds of the season, the carrier’s Speed Score at Lincoln Financial Field was 63.6% lower than it was at Gillette Stadium. Still, Verizon’s Speed Score was 59.2% higher than AT&T’s, 121.3% higher than Sprint’s and 220.7% higher than T-Mobile’s.


Speedtest Cellular Internet Results

Lincoln Financial Field | 2017 Season
Carrier speeds based on Speed Score for modern devices

Carrier Speed Score
Verizon Wireless 27.90
AT&T 17.52
Sprint 12.61
T-Mobile 8.70

Gillette Stadium, where the Patriots go to win

The Patriots won’t need to stage one of their famous comebacks to claim a win for mobile internet speeds on their home turf. Looking at speeds at Gillette Stadium, Verizon wins again with the fastest Speed Score of them all. Add to that every major carrier had faster speeds here than they did in Philadelphia. Verizon was 174.4% faster in Foxborough than in Philly, AT&T was 25.2% faster, Sprint jumped 143.9% and T-Mobile saw a 173.0% increase in Speed Score when comparing their performance at Gillette Stadium with that at Lincoln Financial Field.


Speedtest Cellular Internet Results

Gillette Stadium | 2017 Season
Carrier speeds based on Speed Score for modern devices

Carrier Speed Score
Verizon Wireless 76.56
Sprint 30.76
T-Mobile 23.75
AT&T 21.93

U.S. Bank Stadium, the place to be on Sunday

The U.S. Bank Stadium in Minneapolis was designed with big events like Sunday’s football game in mind from the capacity, to the readerboards to the app. But what we’re really interested in is the tech. With Wi-Fi access points literally built into the railings, U.S. Bank Stadium should be the ideal place to live-stream any game or event. As for cellular, there’s a distributed antenna system that should keep fans connected.

Season internet speeds play-by-play

Examining internet performance at U.S. Bank Stadium for all home games during the regular stadium, the impressive speeds bode well for the big day.

Team cellular vs. team Wi-Fi

Cellular speeds at U.S. Bank Stadium far exceeded the U.S. average throughout the 2017 football season. On the date with the slowest speeds, September 24, downloads were still 62.6% faster than the average for the U.S. during that month and 5.9% faster than Minneapolis’s average download speed for September 2017.


Speedtest Cellular and Mobile Wi-Fi Results

U.S. Bank Stadium | 2017 Season
Stadium speeds based on mean speeds for all results

Day Cell – Mean Download (Mbps) Cell – Mean Upload (Mbps) Wi-Fi – Mean Download (Mbps) Wi-Fi – Mean Upload (Mbps)
Sep 11, 2017 59.61 23.14 27.87 28.45
Sep 24, 2017 38.99 18.30 21.65 25.75
Oct 1, 2017 41.98 21.35 21.82 28.07
Oct 15, 2017 62.54 23.54 29.37 25.92
Oct 22, 2017 53.05 26.83 30.01 29.11
Nov 19, 2017 69.02 24.97 22.03 25.38
Dec 17, 2017 59.25 22.05 18.84 17.65
Dec 31, 2017 63.15 22.88 14.10 16.41

Meanwhile, the Wi-Fi might be free at U.S. Bank Stadium and the average speed does exceed that of the free Wi-Fi we’ve seen at many North American airports, including LAX and JFK, but it’s still not as fast as we’d hoped. Especially given all the hype. Free Wi-Fi is a great resource to have, but in most cases you’ll get faster speeds using your mobile carrier’s network on game day.

Carrier performance

T-Mobile had the fastest Speed Score at U.S. Bank Stadium. On average, T-Mobile was 18.6% faster than Verizon, 65.1% faster than AT&T and 107.4% faster than Sprint.


Speedtest Cellular Internet Results

U.S. Bank Stadium | 2017 Season
Carrier speeds based on Speed Score for modern devices

Carrier Speed Score
T-Mobile 87.44
Verizon Wireless 73.74
AT&T 52.96
Sprint 42.15

What to expect during the big game

Our technical evangelist, Milan Milanović, dug a little deeper into some upgrades mobile carriers have been working on to make sure their networks are game-ready. Here’s what he found:

  • AT&T’s upgrades include deploying over 800 antennas throughout the stadium, providing a more than 200% increase in capacity. Additional legacy spectrum assets have been refarmed (Band 5) and coupled with advanced LTE technologies. AT&T is expected to keep up with the increased traffic demand.
  • Verizon has added 48% more antenna nodes at the stadium, which are largely invisible (tucked under the seats, handrails, etc.). In addition to over 50 MHz of deployed capacity, Verizon is activating Higher Order MIMO and Higher Order Modulation together with three-channel carrier aggregation. You could say Verizon has their game face on.
  • Sprint’s network within the stadium also relies on 800 nodes and a distributed antenna system (DAS) powered by small cells. This will deliver 40 MHz of TDD capacity in the 2.5 GHz frequency band. Sprint will rely on two-channel carrier aggregation in the downlink to provide required downlink capacity. It will be interesting to see if this network configuration will be sufficient to support the inevitable spike in upload traffic, especially during halftime.
  • T-Mobile has increased the node capacity within the stadium by a factor of 30 in addition to the already deployed 4×4 MIMO, 256 QAM and three-channel carrier aggregation LTE techniques. They have also allocated additional spectrum assets to LTE in order to provide 45 MHz of downlink capacity, upgraded backhaul at and around the event and centralized radio access technology by the way of uplink CoMP (Coordinated Multipoint). This centralized radio access technology is designed to improve uplink data rates and network efficiency, with the added benefit of extending a smartphone’s battery life.

His assessment for fans on the big day? Bring your best devices for the best performance (for you and others). Users with smartphones equipped with four receive antennas will be able to experience the fastest speeds possible. In the process, they’ll also contribute to higher network efficiency by virtue of more quickly completing tasks that improve spectrum resource utilization and therefore the overall capacity of the network. Sunday’s event will also be a test of which operator has most aggressively seeded these highly efficient handsets into the hands of consumers.

Game day stats

You’ve probably seen the wide swing in reported speeds from the big game, and, now that Eagles fans have almost recovered from Sunday’s celebration, we’re here to set the record straight.

Cellular speeds

Looking at speeds at U.S. Bank Stadium between 3:30 p.m. and 8 p.m. on Sunday, we found that the mean cellular download speed at the stadium was faster than we’d seen at any game, all season long. Not a lot faster, but, given the 7.2 terabytes of data used during Sunday’s game, we’re impressed.


Speedtest Cellular Internet Results

U.S. Bank Stadium | During the Big Game
Stadium speeds based on mean speeds for all results

Day Cell – Mean Download (Mbps) Cell – Mean Upload (Mbps)
Feb 4, 2018 69.09 15.93

Which carrier won?


Speedtest Cellular Internet Results

U.S. Bank Stadium | During the Big Game
Carrier speeds based on Speed Score for modern devices

Carrier Speed Score
T-Mobile 114.72
AT&T 58.54
Verizon Wireless 50.66
Sprint 33.24

Comparing carriers based on Speed Score between 3:30 p.m. and 8 p.m. on Sunday, T-Mobile not only came out on top, but they trounced their season average, with a 31.2% jump in speeds. T-Mobile’s game-winning Speed Score was also 96.0% faster than runner-up AT&T who came in second and saw a 10.5% increase in speeds on game day.

Despite significant efforts on the technology side, the other two major carriers saw declines in Speed Scores on the big day. Verizon Wireless came in third and saw a 31.3% decrease from their season average while Sprint’s fourth-place finish was 21.1% slower than their all-season number.

How ‘bout that Wi-Fi?

We could not find any Speedtest results on “#USBANKSTADIUM”, the stadium’s reported Wi-Fi SSID, which leads us to believe that the powers that be switched the SSID to “#SBFAN” for the big event. If this is the case, the game day Wi-Fi download speed at U.S. Bank Stadium was in the low to mid range of what we saw during the rest of the season.


Speedtest Mobile Wi-Fi Results

U.S. Bank Stadium | During the Big Game
Stadium speeds based on mean speeds for all results

Day Wi-Fi – Mean Download (Mbps) Wi-Fi – Mean Upload (Mbps)
Feb 4, 2018 20.71 23.36

Was the big game worth the big investment? Likely. Huge crowds hungry to share the experience on social media can clog up networks and destroy cellular speeds. We’ll be interested to see how this year’s performance changes carriers’ playbooks for 2019.!

Ookla retains ownership of this article including all of the intellectual property rights, data, content graphs and analysis. This article may not be quoted, reproduced, distributed or published for any commercial purpose without prior consent. Members of the press and others using the findings in this article for non-commercial purposes are welcome to publicly share and link to report information with attribution to Ookla.

| February 3, 2020

Verizon Rocks Mobile Speeds at the Big Game in Miami

More than 65,000 people watched the Kansas City Chiefs beat the San Francisco 49ers live at the Hard Rock Stadium in Miami yesterday. All those fans on their phones sharing the halftime experience with folks back home used massive amounts of data as they livestreamed and posted to social media. Every year this event presents a major challenge to mobile operators who this year added 5G to the mix. We’re here to report on which operator had the fastest speeds and the lowest latency on game day and what indoor coverage looked like in the Miami area.

Stadium-Heatmap

Mobile operators had their game face on

This is no ordinary sporting event, and operators have been working for many months on their playbooks for providing the best possible performance at Hard Rock Stadium. Highlights include:

Verizon Wireless’s download speeds beat out competitors’

We compared the big four U.S. mobile operators from two hours prior to kick-off to 30 minutes after the game ended to see who won. Here’s what we saw:

Overall Cellular Performance at Hard Rock Stadium
Speedtest® Data | February 2, 2020
Operator Mean Download Speed (Mbps) Mean Upload Speed (Mbps) Latency (ms)
Verizon Wireless 297.18 9.81 59
T-Mobile 121.93 30.34 34
Sprint 114.93 6.20 51
AT&T 103.68 8.38 46

Sprint’s home team might have won the game, but Verizon triumphed when it came to mobile download speeds, coming in 143.7% faster than second-place T-Mobile when considering Speedtest® results over all technologies. Sprint had the third fastest mean download speed in this category and AT&T came in fourth.

Focusing on their 5G game really helped Verizon take the day when considering overall speeds as T-Mobile had the fastest mean download speed (66.35 Mbps) on LTE. Sprint was second on LTE with a mean download speed of 56.16 Mbps, AT&T third at 39.18 Mbps and Verizon fourth at 30.67 Mbps. We break out 5G speeds for each operator below.

T-Mobile’s mean upload speed over all technologies was far better than competitors’. Upload speed is especially important at big events like this as fans try to share their game day experience with those not in the stadium.

T-Mobile also had the lowest latency, coming in 26.0% faster than second-place AT&T. Sprint was third for latency and Verizon fourth.

For comparison, the mean download speed over mobile in the U.S. in January 2020 was 41.23 Mbps, upload was 10.55 Mbps and latency was 46 ms.

5G for the win

5G is the biggest story in mobile these days, and all four operators came prepared to deliver their best game to customers with 5G-capable phones and compete for bragging rights during this high profile event.

5G Performance at Hard Rock Stadium
Speedtest® Data | February 2, 2020
Operator 5G Download Speed (Mbps) 5G Upload Speed (Mbps) 5G Latency (ms)
Verizon Wireless 646.17 9.86 91
T-Mobile 348.33 28.89 32
Sprint 225.78 15.39 15

Verizon easily beat T-Mobile and Sprint when it came to mean download speed over 5G during the big game. Verizon came in last, however, for both mean upload speed over 5G and latency. T-Mobile showed the fastest mean upload speed over 5G and Sprint had the best latency on 5G. While we did see 5G Speedtest results for AT&T during the game, there were fewer than 10, the minimum threshold we set for this event.

Hard Rock Stadium Wi-Fi was a viable option

In 2019, fans at Mercedes-Benz Stadium in Atlanta used over 24 TB of data on the stadium Wi-Fi network on game day with an average Wi-Fi download speed of 30.98 Mbps. To get a baseline on the Miami experience, we looked at Wi-Fi performance during the Bengals v. Dolphins matchup on December 22, 2019.

Wi-Fi Performance at Hard Rock Stadium
Speedtest® Data | February 2, 2020
Mean Download Speed (Mbps)Mean Upload Speed (Mbps)Mean Latency (ms)

Stadium Wi-Fi – December 22, 2019 56.48 62.64 7
Stadium Wi-Fi – Big Game 37.43 46.55 9
Verizon Wi-Fi – Big Game 36.81 40.91 7

Wi-Fi at the stadium did show some game day stresses yesterday, with a mean download speed 33.7% slower than the December 22 game. Mean upload speed dropped 25.7% and latency was up 28.6%.

Verizon also provided Wi-Fi for their customers during the big game yesterday, and the mean download speed was comparable to that on the stadium’s SSID. Mean upload speed on Verizon’s SSID was 12.1% slower than on the stadium’s, but Verizon’s Wi-Fi latency was also lower, showing a 22.2% improvement over stadium Wi-Fi.

It’s worth noting that mean upload speed in all cases was faster than that on download. This is impressive and helpful to fans trying to livestream their experience for friends back home.

Indoor mobile coverage in Miami

Stadium speed is very important, however most attendees will spend the bulk of their time in hotels and at tourist attractions in and around Miami. We used Cell Analytics to assess indoor coverage at 9,128 buildings in the Miami metro area during Q3-Q4 2019 to see who had good indoor coverage (signal strength of greater than -115 dBm) in the most buildings.

Indoor Mobile Coverage in Miami Metro Area
Cell AnalyticsTM Data | Q3-Q4 2019
Operator % of Buildings with Good Coverage % of Buildings with Best Coverage
Verizon 97.7% 29.1%
T-Mobile 97.2% 36.9%
AT&T 94.2% 22.7%
Sprint 92.5% 11.2%

Verizon showed good coverage in more buildings than any other operator at 97.7%, followed by T-Mobile at 97.2%, AT&T at 94.2% and Sprint at 92.5%.

We also examined who had the best coverage in each building and found that T-Mobile provided the strongest coverage in 36.9% of buildings analyzed. Verizon had the strongest coverage in 29.1% of buildings analyzed, AT&T was strongest in 22.7%, and finally Sprint was strongest in 11.2%.

Learn how Ookla® can help you determine if your network is prepared for the massive crowds that accompany a marquee event and analyze how your network performs both indoors and out, down to the building level.

Ookla retains ownership of this article including all of the intellectual property rights, data, content graphs and analysis. This article may not be quoted, reproduced, distributed or published for any commercial purpose without prior consent. Members of the press and others using the findings in this article for non-commercial purposes are welcome to publicly share and link to report information with attribution to Ookla.

| March 14, 2019

Ditch the Lag: Cities with Great Gaming Culture and Low Ping

Yes, you can game from anywhere with an internet connection. But if you’re at all competitive, it’s nice to play from somewhere with low ping and fast internet speeds. Plus when you need to leave the house, it’s extra nice to know you’re also surrounded by gamer culture. We’ve examined February 2019 Speedtest results in 35 cities that are known for their esports events, gaming conferences, game companies and more to find out who has the advantage and ranked them based on their ping.

The top contenders

Eleven_Gaming_Cities_0219

First place Bucharest, Romania is home to super-low ping, a lightning fast download speed and a thriving gaming culture. From Bucharest Gaming Week (which includes the CS:GO Southeast Europe Championship and the FIFA National Tournament) to their numerous local game studios, Bucharest is a great place to be a gamer whether you’re online or out and about.

The next five gaming cities with the lowest pings are all in Asia. Hangzhou, China comes in second overall with a fast ping and world-class download speeds. This city is so devoted to its gamers that it opened a $280 million gaming “city” in 2018 and plans 14 new esports arenas before 2022. Coming in third, Chengdu, China has an equally low ping to our first two contenders and serves as one of two host locations in China for the Global Mobile Game Confederation (GMGC). Both Hangzhou and Chengdu are also franchise holders in the Overwatch League, giving local gaming fans something to cheer about. Fourth place Singapore, host of the 5th Annual GameStart Convention in October 2018, had only a slightly slower ping than the first four cities and the fastest download speed of any of the cities we considered.

South Korea is home to the fifth and sixth best cities for gamers. A satellite city of Seoul, Seongnam-si boasts the Pangyo Techno Valley (a.k.a. the Silicon Valley of Korea) and numerous game development companies. Perfect for a city with a 9 ms ping. Though Incheon’s ping was a little slower at 12 ms, gamers there can console themselves with the city’s gamer cred — the 2018 League of Legends World Championship was held in Incheon’s Munhak Stadium.

Coming in at number seven, Budapest, Hungary is an emerging game city, having hosted its first big esports event (the V4 Future Sports Festival) in 2018, but a 12 ms ping makes them a strong contender. More established Malmö, Sweden is number eight with a slightly slower average download speed but the city is headquarters to Massive Entertainment, creators of Tom Clancy’s The Division series, Far Cry 3, Assassin’s Creed: Revelations and many more.

Vancouver, Canada, North America’s only qualifier for the top gaming cities list, comes in at number nine with a 12 ms ping and many gaming companies including the Canadian arms of Nintendo of Canada and EA (Electronic Arts). We included both Shanghai, China and Moscow, Russia on the top gamer cities list as both had a 12 ms ping as well, though the internet speeds in Shanghai are superior. Shanghai will also host the International Dota 2 in 2019 while Moscow is known for Epicenter.

The rest of the pack

Notably absent from the list above is most of the western hemisphere. Cities in North America were held back by their high pings. Cities in South America suffered from high pings and also slow internet speeds — something that esports leagues have complained is a barrier to investment.

Our full list of gaming cities provides wider geographical representation, even if the internet performance is not always as stellar. You’ll find Los Angeles in 27th place, behind Seattle, Boston and Las Vegas. And São Paulo, Brazil has the best showing in Latin America at 23rd.

Internet Performance in 35 Cities with a Gaming Culture
Speedtest Results | February 2019
City Ping (ms) Mean Download (Mbps) Mean Upload (Mbps)
Bucharest, Romania 8 172.13 126.57
Hangzhou, China 8 125.93 29.54
Chengdu, China 8 101.92 33.80
Singapore 9 196.43 200.08
Seongnam-si, South Korea 9 155.25 114.83
Incheon, South Korea 12 139.84 102.91
Budapest, Hungary 12 132.72 54.46
Malmö, Sweden 12 126.28 105.67
Vancouver, Canada 12 117.55 50.23
Shanghai, China 12 75.14 30.06
Moscow, Russia 12 64.56 63.59
Oslo, Norway 13 115.46 69.03
Hong Kong, Hong Kong (SAR) 14 167.59 161.14
Zürich, Switzerland 14 144.36 109.39
Seattle, United States 15 138.50 79.88
Stockholm, Sweden 15 134.16 93.83
Auckland, New Zealand 15 92.05 53.30
Toronto, Canada 16 134.75 67.42
Boston, United States 17 152.42 60.87
Las Vegas, United States 17 141.69 41.22
Chennai, India 17 48.40 42.93
Cologne, Germany 18 63.77 18.36
São Paulo, Brazil 18 46.43 21.57
Jakarta, Indonesia 18 17.88 10.21
Mumbai, India 19 23.40 19.26
Paris, France 20 161.04 93.68
Los Angeles, United States 20 121.00 23.57
London, United Kingdom 20 63.58 23.18
Rio de Janeiro, Brazil 20 36.50 13.33
Buenos Aires, Argentina 21 34.31 6.40
Katowice, Poland 22 83.99 20.91
Mexico City, Mexico 25 37.66 15.39
Sydney, Australia 25 34.20 9.61
Santiago, Chile 26 56.13 18.49
Tokyo, Japan 28 99.24 101.90

Of course, die-hard gamers will know that a low ping in your city won’t necessarily save you if you’re playing on a distant server.

What’s the ping like in your city? Take a Speedtest and see if your connection is hurting your gameplay.

Ookla retains ownership of this article including all of the intellectual property rights, data, content graphs and analysis. This article may not be quoted, reproduced, distributed or published for any commercial purpose without prior consent. Members of the press and others using the findings in this article for non-commercial purposes are welcome to publicly share and link to report information with attribution to Ookla.

| May 18, 2022

Four U.S. Airports Top Our List of Fastest Free Airport Wi-Fi

The COVID-19 pandemic upended a lot of travel plans and put our series on airport Wi-Fi on hold. We’re excited to get back in the swing of things in time for the summer travel season, and we have fresh data for you on Wi-Fi speeds at some of the busiest airports in the world during Q1 2022. Our analysis focuses on Wi-Fi over mobile connections on free Wi-Fi provided by the individual airports and Wi-Fi at selected airport lounges. The good news is that every airport surveyed met the recommended speed for streaming on mobile. However, there was a large divide between the fastest airports on the list and the slowest.

Mobile Internet Speeds Over Free Wi-Fi at Select Airports

Speedtest Intelligence® showed four airports in the United States at the top of the list for free airport Wi-Fi. San Francisco International Airport showed a median download speed of 176.25 Mbps during Q1 2022, Seattle-Tacoma International Airport 171.01 Mbps, Dallas/Fort Worth International Airport 113.64 Mbps, and Chicago O’Hare International Airport 85.49 Mbps. Dubai International Airport, Hartsfield–Jackson Atlanta International Airport, Amsterdam Airport Schiphol, and Los Angeles International Airport followed. All of these airports are international hubs that passengers from around the world pass through on their way to all kinds of destinations. Flyers waiting for connecting planes at these airports should have no trouble with internet speeds. In case of video calls, upload speeds are even faster than downloads at all of these airports, and San Francisco and SeaTac had the fastest uploads on the list. There is a wide gap in median speeds between the free airport Wi-Fi at Los Angeles International Airport and the rest of the airports on our list.

Denver International has their Wi-Fi split between two SSIDs that serve different spectrum bands, both of which showed median download speeds between 44 and 46 Mbps. Connecting to the 5 GHz “- DEN Airport Free WiFi” will get you a faster median upload speed than “DEN Airport Free WiFi 2.4.” Charles de Gaulle also has two different SSIDs for their free airport Wi-Fi though travelers can select either, “*WIFI-AIRPORT” had slightly faster median speeds than “WIFI-AIRPORT-STANDARD.”

Turkey’s Istanbul Airport was next on the list with a median download speed of 31.08 Mbps and a median upload speed of 23.80 Mbps. Spain’s Madrid Barajas Airport was the top of the bottom of our list with a median download speed of 19.76 Mbps over free airport Wi-Fi.

Four of the bottom five airports on our list were in China. Shanghai Hongqiao International Airport was faster than the other Chinese airports on the list with a median download speed of 14.69 Mbps. Shenzhen Bao’an International Airport and Beijing Capital International Airport were next on our list and showed nearly identical median download and upload speeds over free airport Wi-Fi. Chengdu Shuangliu International Airport showed slightly slower download and upload speeds than both. Mexico City International Airport in Mexico had the slowest median download and upload speeds over free airport Wi-Fi of any airport on this list.

Wi-Fi in airport lounges is often faster than free airport Wi-Fi

Free Wi-Fi is very nice to have for catching up on your life back home or reliving the glory of your vacation pics as you upload them to your social media accounts, but if you’re looking for the fastest Wi-Fi in an airport, you may want to look into other options. In many cases we found that airport lounges had faster Wi-Fi, like the United Club in Chicago and San Francisco which boasted median download speeds of 246.17 Mbps and 244.37 Mbps, respectively, during Q1 2022. The fastest club Wi-Fi download speed at LAX was at the Alaska Lounge (238.59 Mbps).

Outside the U.S., Wi-Fi speeds at airport lounges ranged dramatically. The following lounges all showed faster median download speeds than the free Wi-Fi at their respective airports during Q1 2022: the Plaza Premium Lounge in Dubai (148.96 Mbps), the Grand Lounge Elite in Mexico City (125.12 Mbps), Privium at Amsterdam’s Schiphol (121.05 Mbps), the Emirates Lounge at Paris’ Charles de Gaulle (93.31 Mbps), and the Sala VIP Puerta de Alcalá in Madrid (50.28 Mbps).

This stronger performance at airport lounges should be expected because it’s much easier to configure Wi-Fi over a small area like a single airport lounge than it is to serve an entire airport with multiple terminals. Patrons of airport lounges are also paying for the privilege, whether by the day or the year, so their expectations are higher. We did not always find this to be the case, however, so take a Speedtest® if you feel like you are not getting what you are paying for.

We were glad to see that travelers at all these airports have fast enough Wi-Fi to stream video on mobile and that there are other options available for those who need faster internet. Airports have had a lot to focus on in the last couple of years and Wi-Fi was not at the top of the list. We hope that will change as passenger volumes return to normal. If you’re traveling this summer, take a Speedtest at the airport to see how your experience compares.

Ookla retains ownership of this article including all of the intellectual property rights, data, content graphs and analysis. This article may not be quoted, reproduced, distributed or published for any commercial purpose without prior consent. Members of the press and others using the findings in this article for non-commercial purposes are welcome to publicly share and link to report information with attribution to Ookla.

| August 26, 2021

How to Identify and Resolve Network Issues in Real-Time [Webinar]


Drive testing has historically been a time-consuming, expensive and labor-intensive effort — but it doesn’t have to be. With recent advances in crowdsourced network insights, revolutionary new live testing capabilities and real-time analytics, some of the leading operators in the U.S. have drastically cut the time and budget they spend finding and fixing network issues.

The upcoming Ookla® webinar on September 9 will show how Network Optimization and RAN teams can combine crowdsourced network data with surgical drive and walk testing to make immediate network improvements in the areas that matter most to consumers. Read on to learn how mobile network operators can save countless hours and dollars with this new approach to live testing.


Use Crowdsourced network data to pinpoint areas with high user counts and poor signal or throughput

It’s impossible to drive test every street and walk test every building — but crowdsourced network data allows you to see real-world connectivity where it matters most to customers. Powered by hundreds of millions of daily performance, coverage and signal measurements from Speedtest®, Ookla Cell Analytics™ provides unparalleled intelligence about wireless service quality, RF measurements, data use, indoor vs. outdoor performance, cell site locations and much more.

By looking at user density, mobile operators can understand where the highest volume of customers are impacted by poor signal or throughput. After you’ve prioritized the areas where network improvements will have the most impact on subscribers, you can send your field testing team to conduct more targeted analysis on-site.

With Cell Analytics, we can scan wide regions to identify and prioritize problem areas. In this case, we looked at a wireless network in Las Vegas and quickly saw that the Paris Las Vegas Hotel & Casino has lots of users, but the network has very poor quality there (LTE RSRQ and SNR) and also low data speeds, despite having good coverage throughout the property.

Mobile-User-Density-in-Las-Vegas

The poor quality extends from the ground floor through the upper floors of the building. We can also see that the operator has a cell site on the property.

Indoor-LTE-RSRQ

From the crowdsourced data in Cell Analytics, we can also see that the 1900 and 2100 MHz bands are most heavily used throughout the property.

Most-Frequent-Band

eNodeB 80024 and 80155 are serving most frequently on the property, although some others are also seen.

LTE-Most-Frequent-Cell

LTE-Most-Frequent-Cell-2

Armed with this knowledge, the mobile network operator can send someone to conduct a quick walk test of the building.

Perform targeted drive and walk tests for problem areas with real-time analytics

In the past, drive and walk testing could be prohibitively expensive for smaller network operators. For example, let’s say you’re an operator with 40,000 sites, and a tester spends an average of five hours per site at $50/hr. Testing every site in your network would cost upwards of $10 million per year. Ookla Wind™ (Wireless Intelligence On Demand) offers a revolutionary approach to drive and walk testing with affordable devices, real-time analytics and no time spent on post-processing.

As we saw above, Ookla’s Cell Analytics allows us to identify the “symptoms” of poor network performance. Specific indoor areas in the main lobby and casino floor inside the Paris Las Vegas Hotel & Casino showed poor signal-to-interference-and-noise-ratio (SINR) and low throughput performance. Upon completing a surgical walk-test of the same areas using the Ookla Wind handset based network measurement platform, the operator was able to diagnose the issue.

Below we can see it was clear that the indoor area lacked any 5G connectivity. This, coupled with no carrier aggregation, low MIMO utilization and lower modulation scheme due to poor SINR, all contribute to poor throughput.

real-time-walk-test-view-2

Given the large number of handover attempts in our walk-test, the recommended next step for the operator is to address the pilot and reference signal pollution in the area and to establish clear dominance to improve the network performance. By utilizing Ookla Wind, a remote engineer could analyze the data in real-time and make these adjustments to the network while the tester is still on site. This should save you hours or days that would otherwise be spent waiting for post-processing to happen.

Processed-Report

The webinar on Thursday, September 9 at 9 a.m. PDT (12 p.m. EDT / 4 p.m. GMT) will show you how to combine crowdsourced network data with surgical drive and walk testing to make immediate network improvements. Don’t miss it. A recording will be provided for registrants who can’t tune in to the live presentation.


Ookla retains ownership of this article including all of the intellectual property rights, data, content graphs and analysis. This article may not be quoted, reproduced, distributed or published for any commercial purpose without prior consent. Members of the press and others using the findings in this article for non-commercial purposes are welcome to publicly share and link to report information with attribution to Ookla.

| May 13, 2020

Indoor Coverage is a Public Safety Priority

Connecting people with emergency services reached a pinnacle of simplicity when 911 was rolled out as an emergency number across the United States. With one number, people in distress could get the help they needed dispatched as soon as possible. As increasing numbers of households have cut the cord on their traditional landline telephones, 80% of 911 calls are now placed via cell phone. Emergency calls need to connect 100% of the time, which makes mobile coverage, first and foremost, a public safety issue.

Understanding which buildings fall short of providing adequate service can assist local governments in working with building owners and mobile operators to make needed improvements. This falls into two broad categories: First Responder Push to Talk systems, and Commercial Mobile Services used by both Public Safety Agencies and the general public.

Poor indoor coverage impacts public safety

If someone is in distress and unable to place an outgoing call, first responders will not be aware there is an emergency that requires their response. For this reason, the Safer Buildings Coalition defines three pillars of in-building safety communications:

  • Mobile 911 Calls Must Get Out with Location Accuracy
  • Mobile Mass Notifications Must Get In
  • First Responder Communications Must Work

If a building cannot deliver these basic characteristics, the environment puts the occupants and the property itself at risk.

Determining a precise location can be a significant challenge if the device does not have an unobstructed view of the sky. As more GPS satellites can “see” the device, the more accurate the location the system can provide. Work is underway by industry leaders and public safety agencies to improve indoor location, but since it is a complex issue unto itself, this article will focus solely on indoor wireless network coverage.

Why indoor coverage is challenging

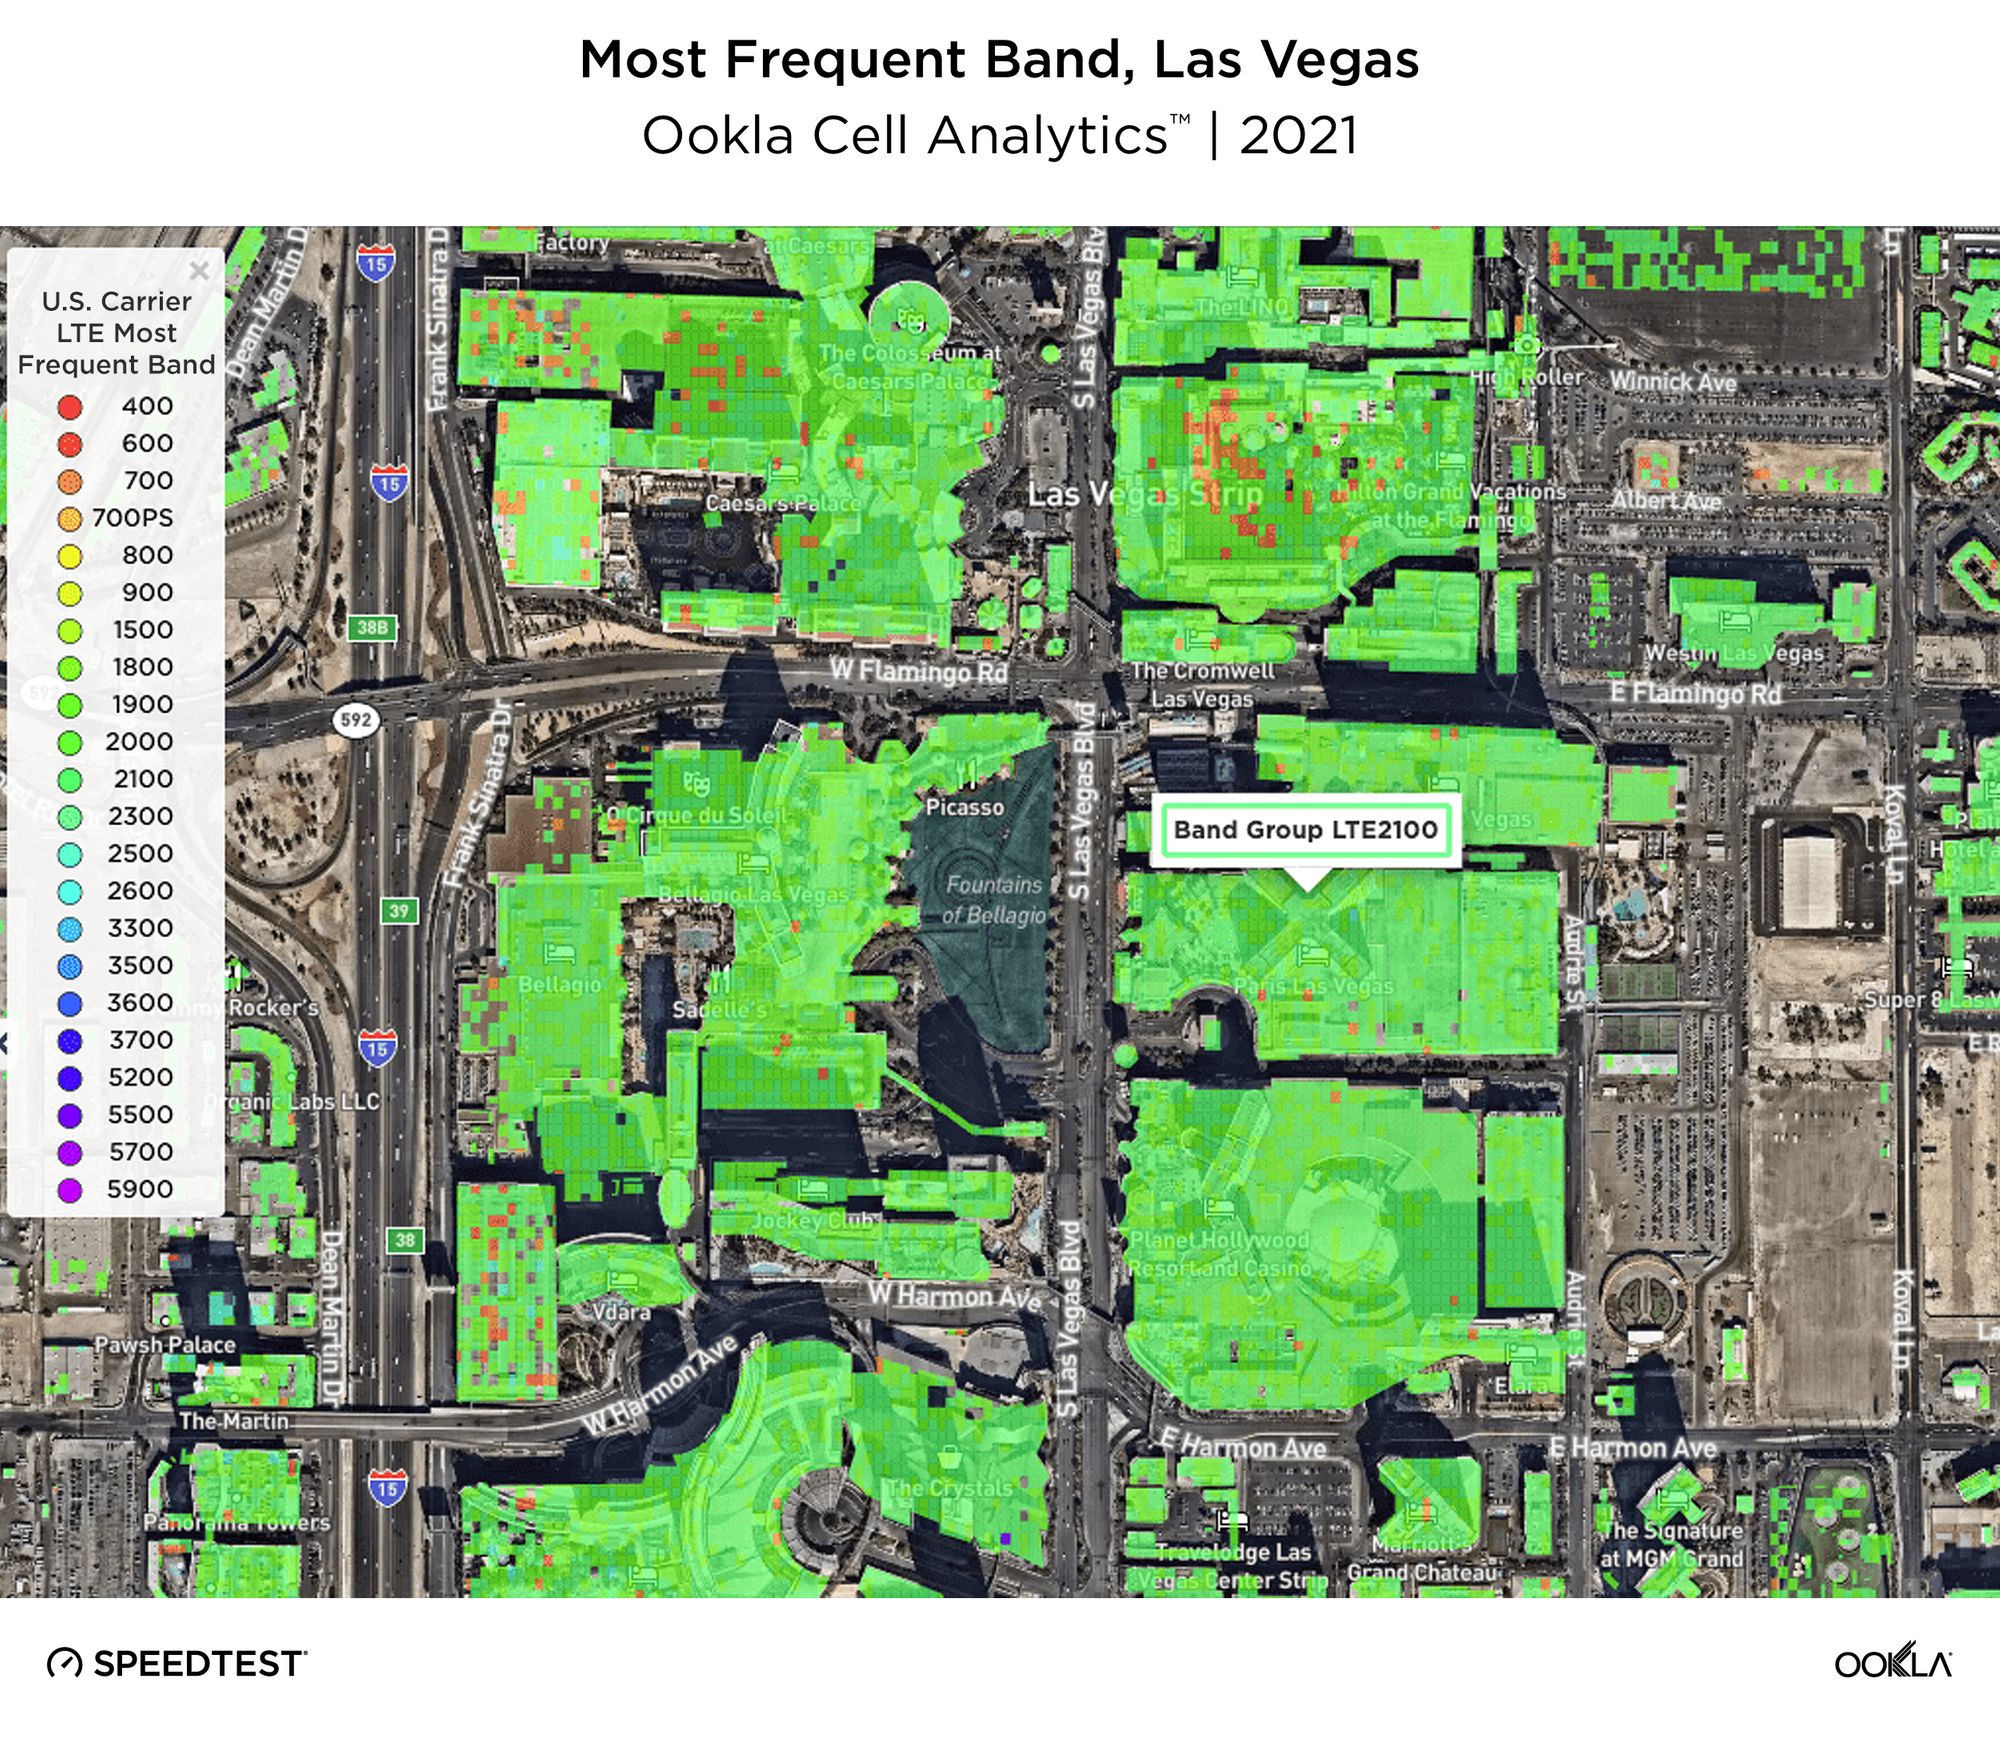
Anyone who’s ever tried to place a call from an elevator is not surprised that indoor coverage can be much worse than outdoor coverage. And the deeper into a building you go, the worse the signal typically gets. Penetrating walls is difficult for a cellular signal, though some of the spectrum blocks that mobile companies have licenced are better for this task than others. Low band (longer wavelengths) spectrum tends to be much better at penetrating concrete and brick than high band (shorter wavelength) spectrum.

Low-e glass can inhibit signals

Another factor in poor indoor signal strength is often windows. The introduction of low-e glass has provided huge energy savings for building owners and is positive for the environment. However, the unintended effect is a negative impact on wireless communications.
SBC-Low-E-Glass_Illustration-1

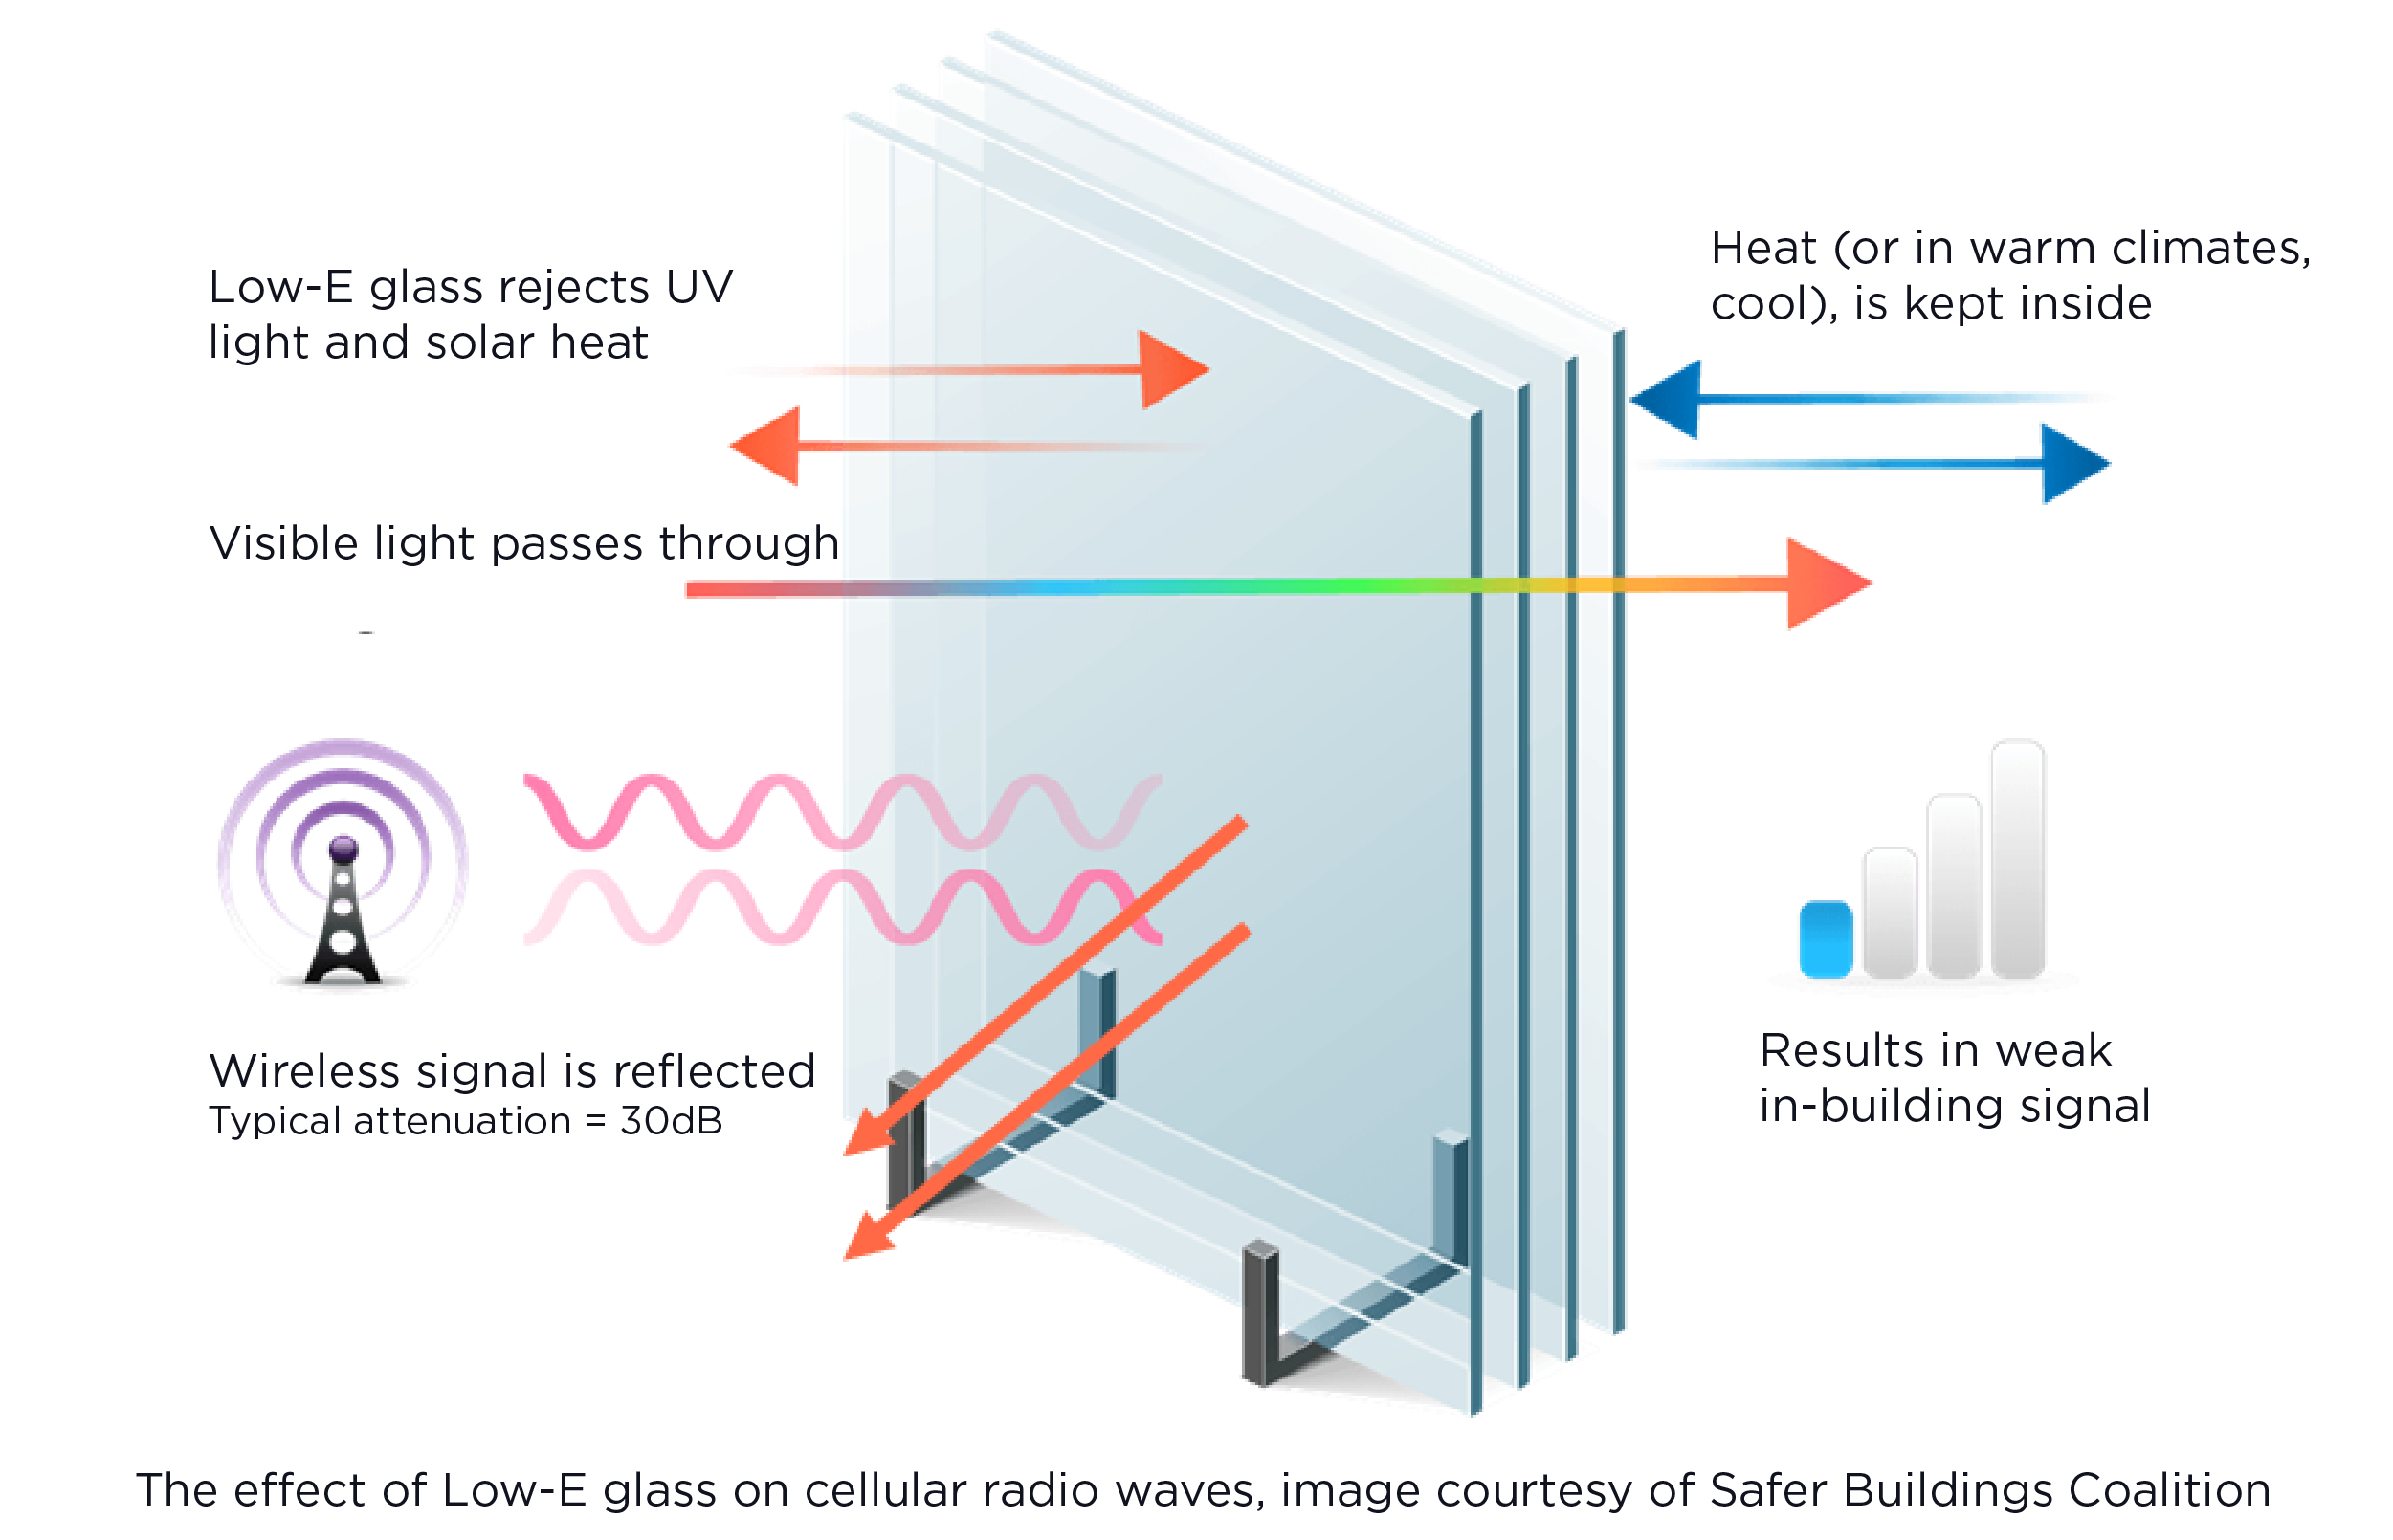
How glass compares to other building materials in shielding the interior from wireless signals depends upon the type of glass. The chart below offers some surprising comparisons. The attenuation column represents the reduction in the amplitude of the signal. For this example we use 900 MHz, a common low-band spectrum used throughout most of the world and considered to be better at building penetration than higher band frequencies.
building_material_effect_cellular_signals_0520

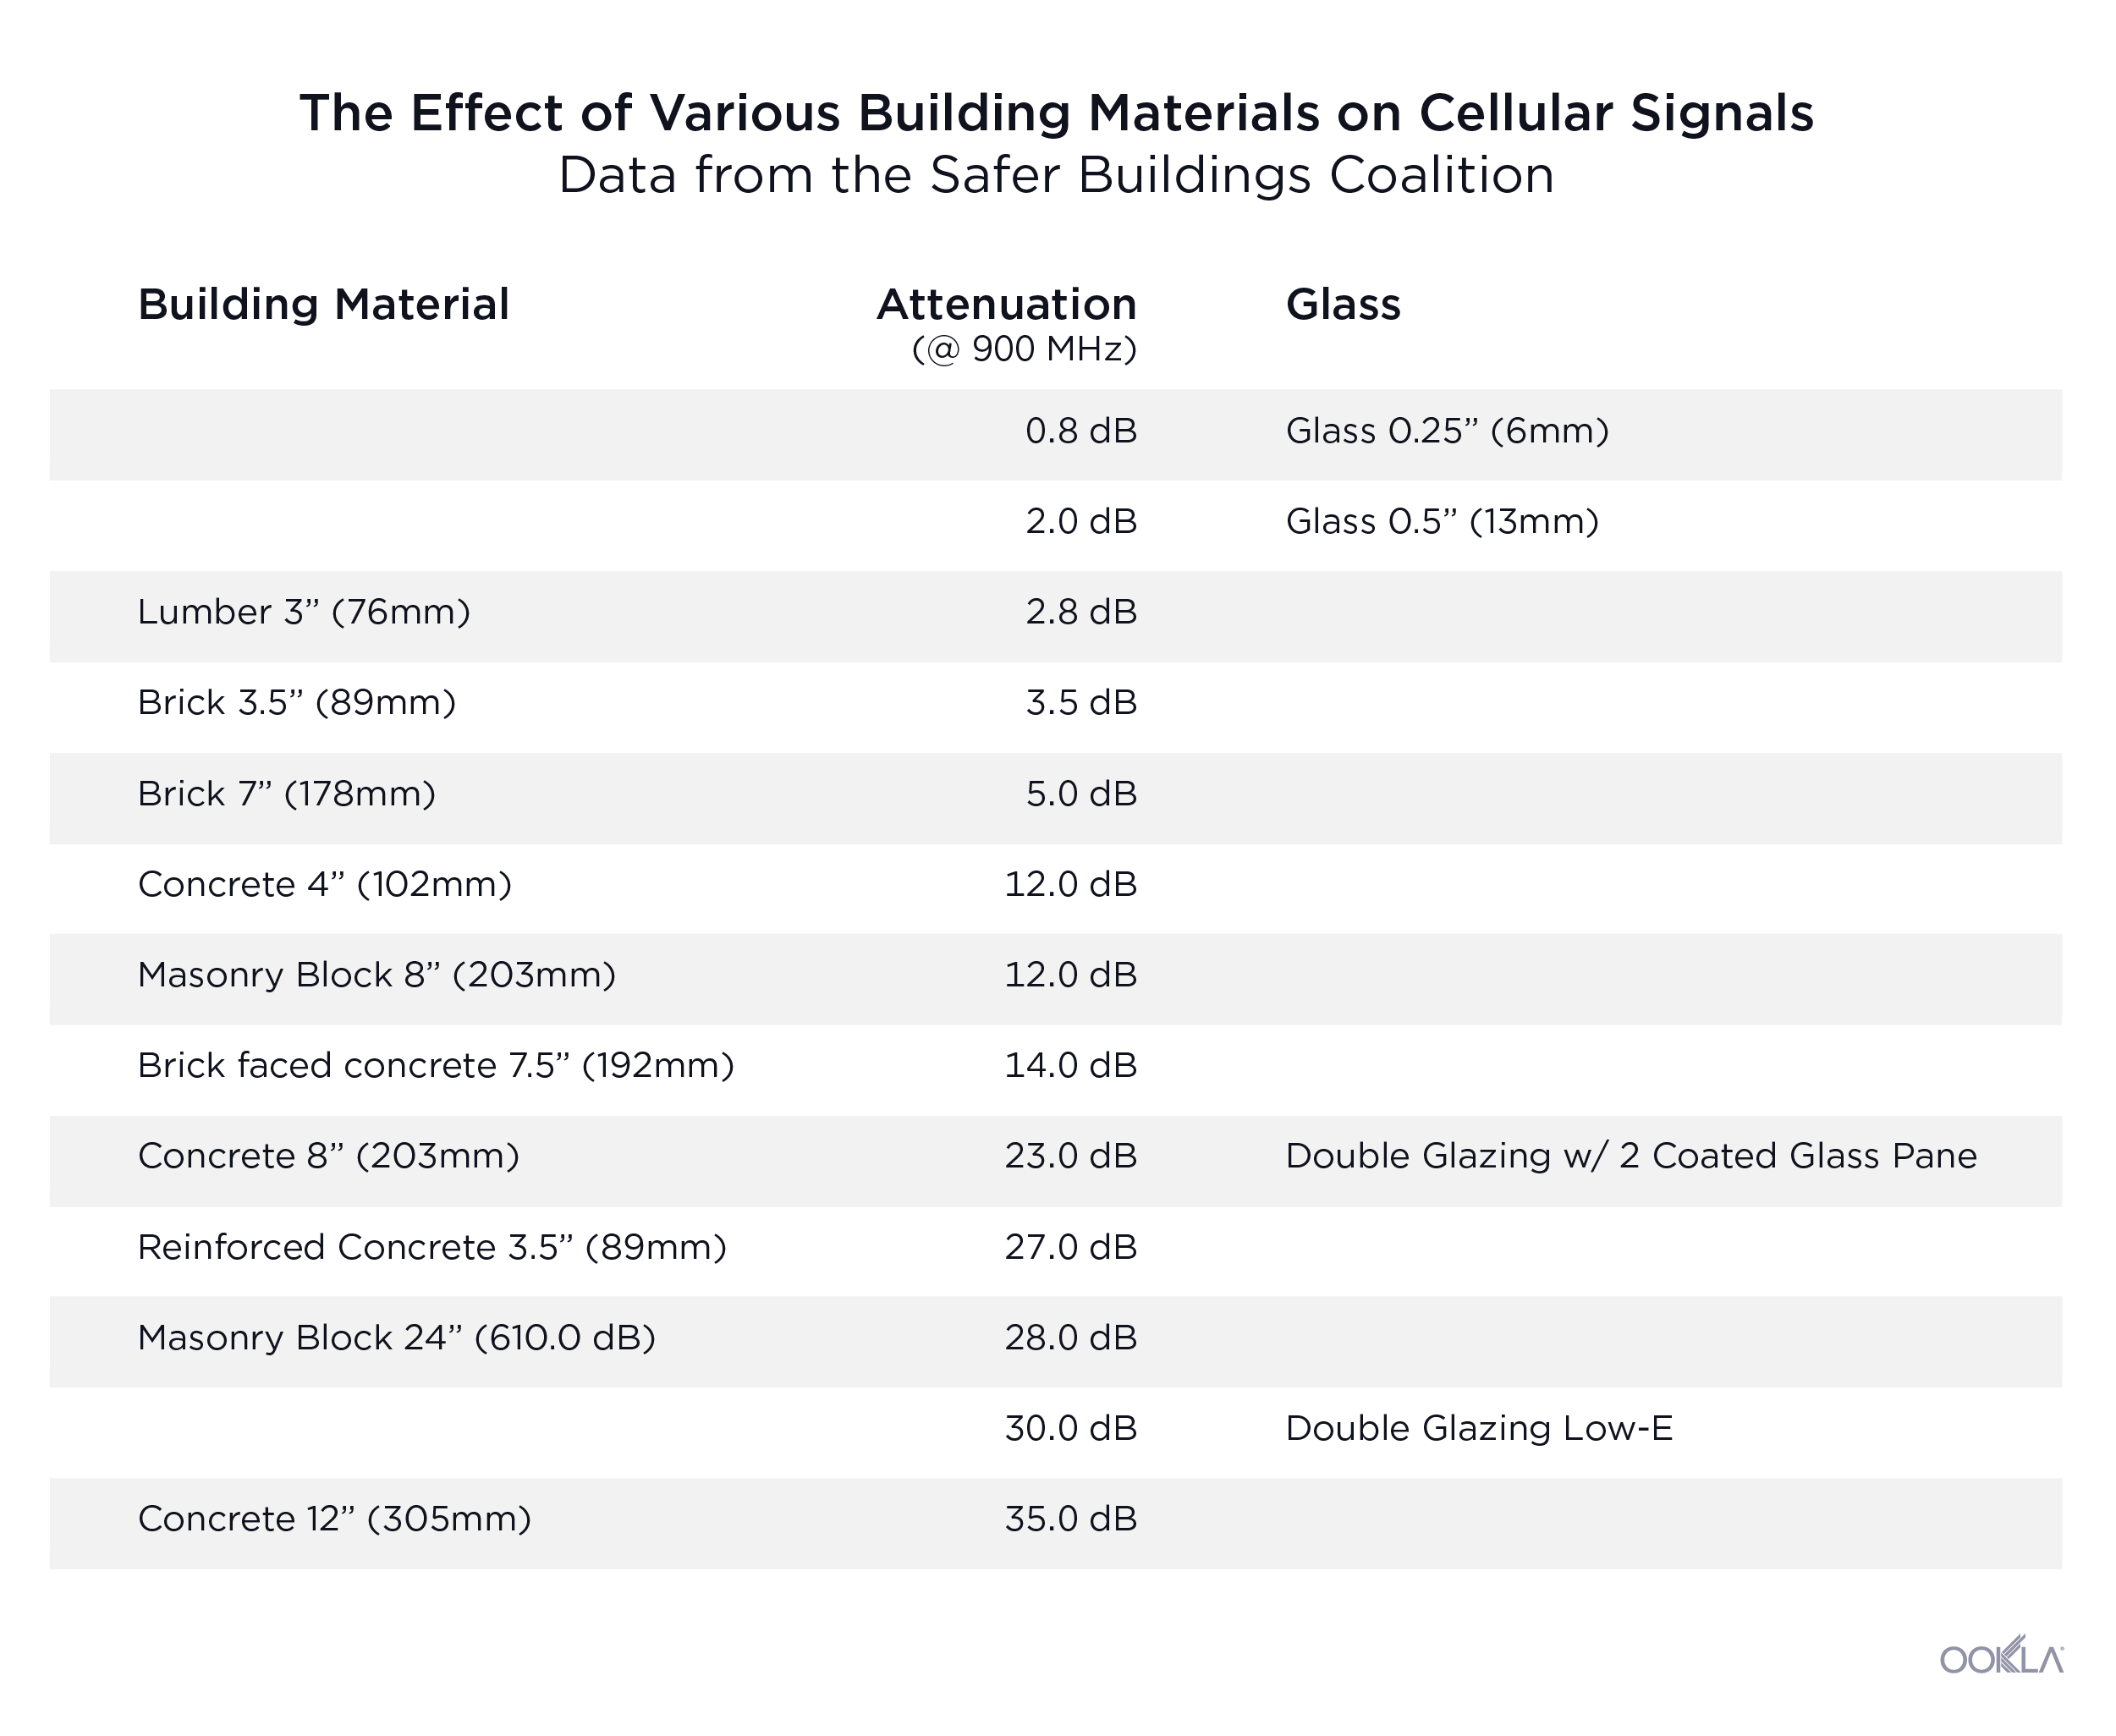
The more energy efficient the glass, the more the signal level is reduced. Consider that for each 3 dB attenuation (loss), the signal strength is reduced by half. A 6 dB attenuation means a 75% loss in signal; at 9 dB, an 87.5% loss. As this reduction is exponential, the double glazing low-e glass, near the bottom of the chart, represents a signal reduction of 99.9%.

It’s not uncommon to see someone who is struggling to maintain a call walk toward the window in an attempt to improve their reception. If a building has installed energy efficient glass, most of the available signal may well be coming through the walls. If this person is trying to connect to emergency services, the results could be tragic.

How first responders get coverage

After an initial investment by the federal government, billions of dollars are currently being spent by AT&T to build the new FirstNet network, bringing prioritized broadband telecommunications to the nation’s first responders. State and local governments are also investing to upgrade equipment. This new network is using a dedicated spectrum band (Band 14, also known as the Upper 700 MHz D-block) and also provides prioritized access to the AT&T commercial bands as needed during an emergency.

With fewer users compared to a commercial network, the FirstNet network will experience less congestion and, therefore, a higher signal quality than those serving hundreds of millions of users and devices.

With the addition of High-Power User Equipment (HPUE) Power Class 1, the FirstNet devices can transmit on Band 14 at up 31 dBm. This is a significant increase from the standard 23 dBm (Power Class 3). This can improve FirstNet coverage in fringe areas by up to 80%. Specifically, the ability for the cell site to better “hear” the user equipment can be the difference between a dropped or completed VoLTE call, delivered text message, or the transfer of mission critical data.

While FirstNet is being built into the robust system that has been promised, first responders still use their proprietary Land Mobile Radio (LMR) networks as their primary means of voice communication. Portable cell sites are also available in some circumstances to supplement wireless coverage where needed.

What’s being done to help the public

A significant federal effort has been underway during the past decade to improve wireless coverage in rural areas, but poor wireless coverage can be experienced in big cities as well. The wireless networks were originally designed to work well in a “mobile” environment – namely outdoors while in moving vehicles or walking. As indoor usage has grown, the networks have densified and greater efforts have been made to provide a signal strong enough to penetrate buildings.

Most single-family residential structures will typically be made from materials such as lumber and brick which the chart above shows as contributing to a minimal loss of signal. Buildings with a greater population density, such as multi-family residential and high-rise commercial structures, will typically employ thicker construction material in order to achieve the strength required to bear the weight of multiple floors.

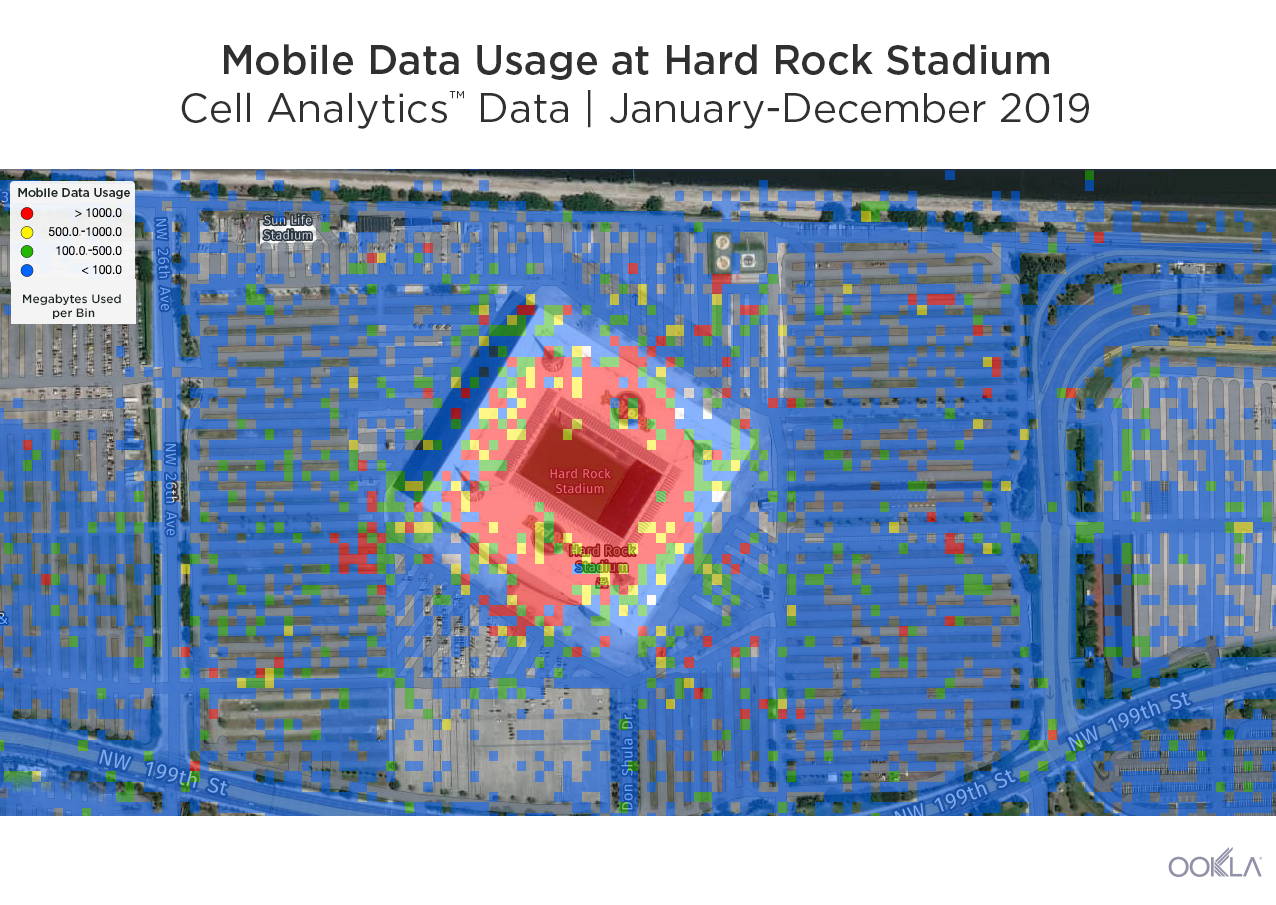
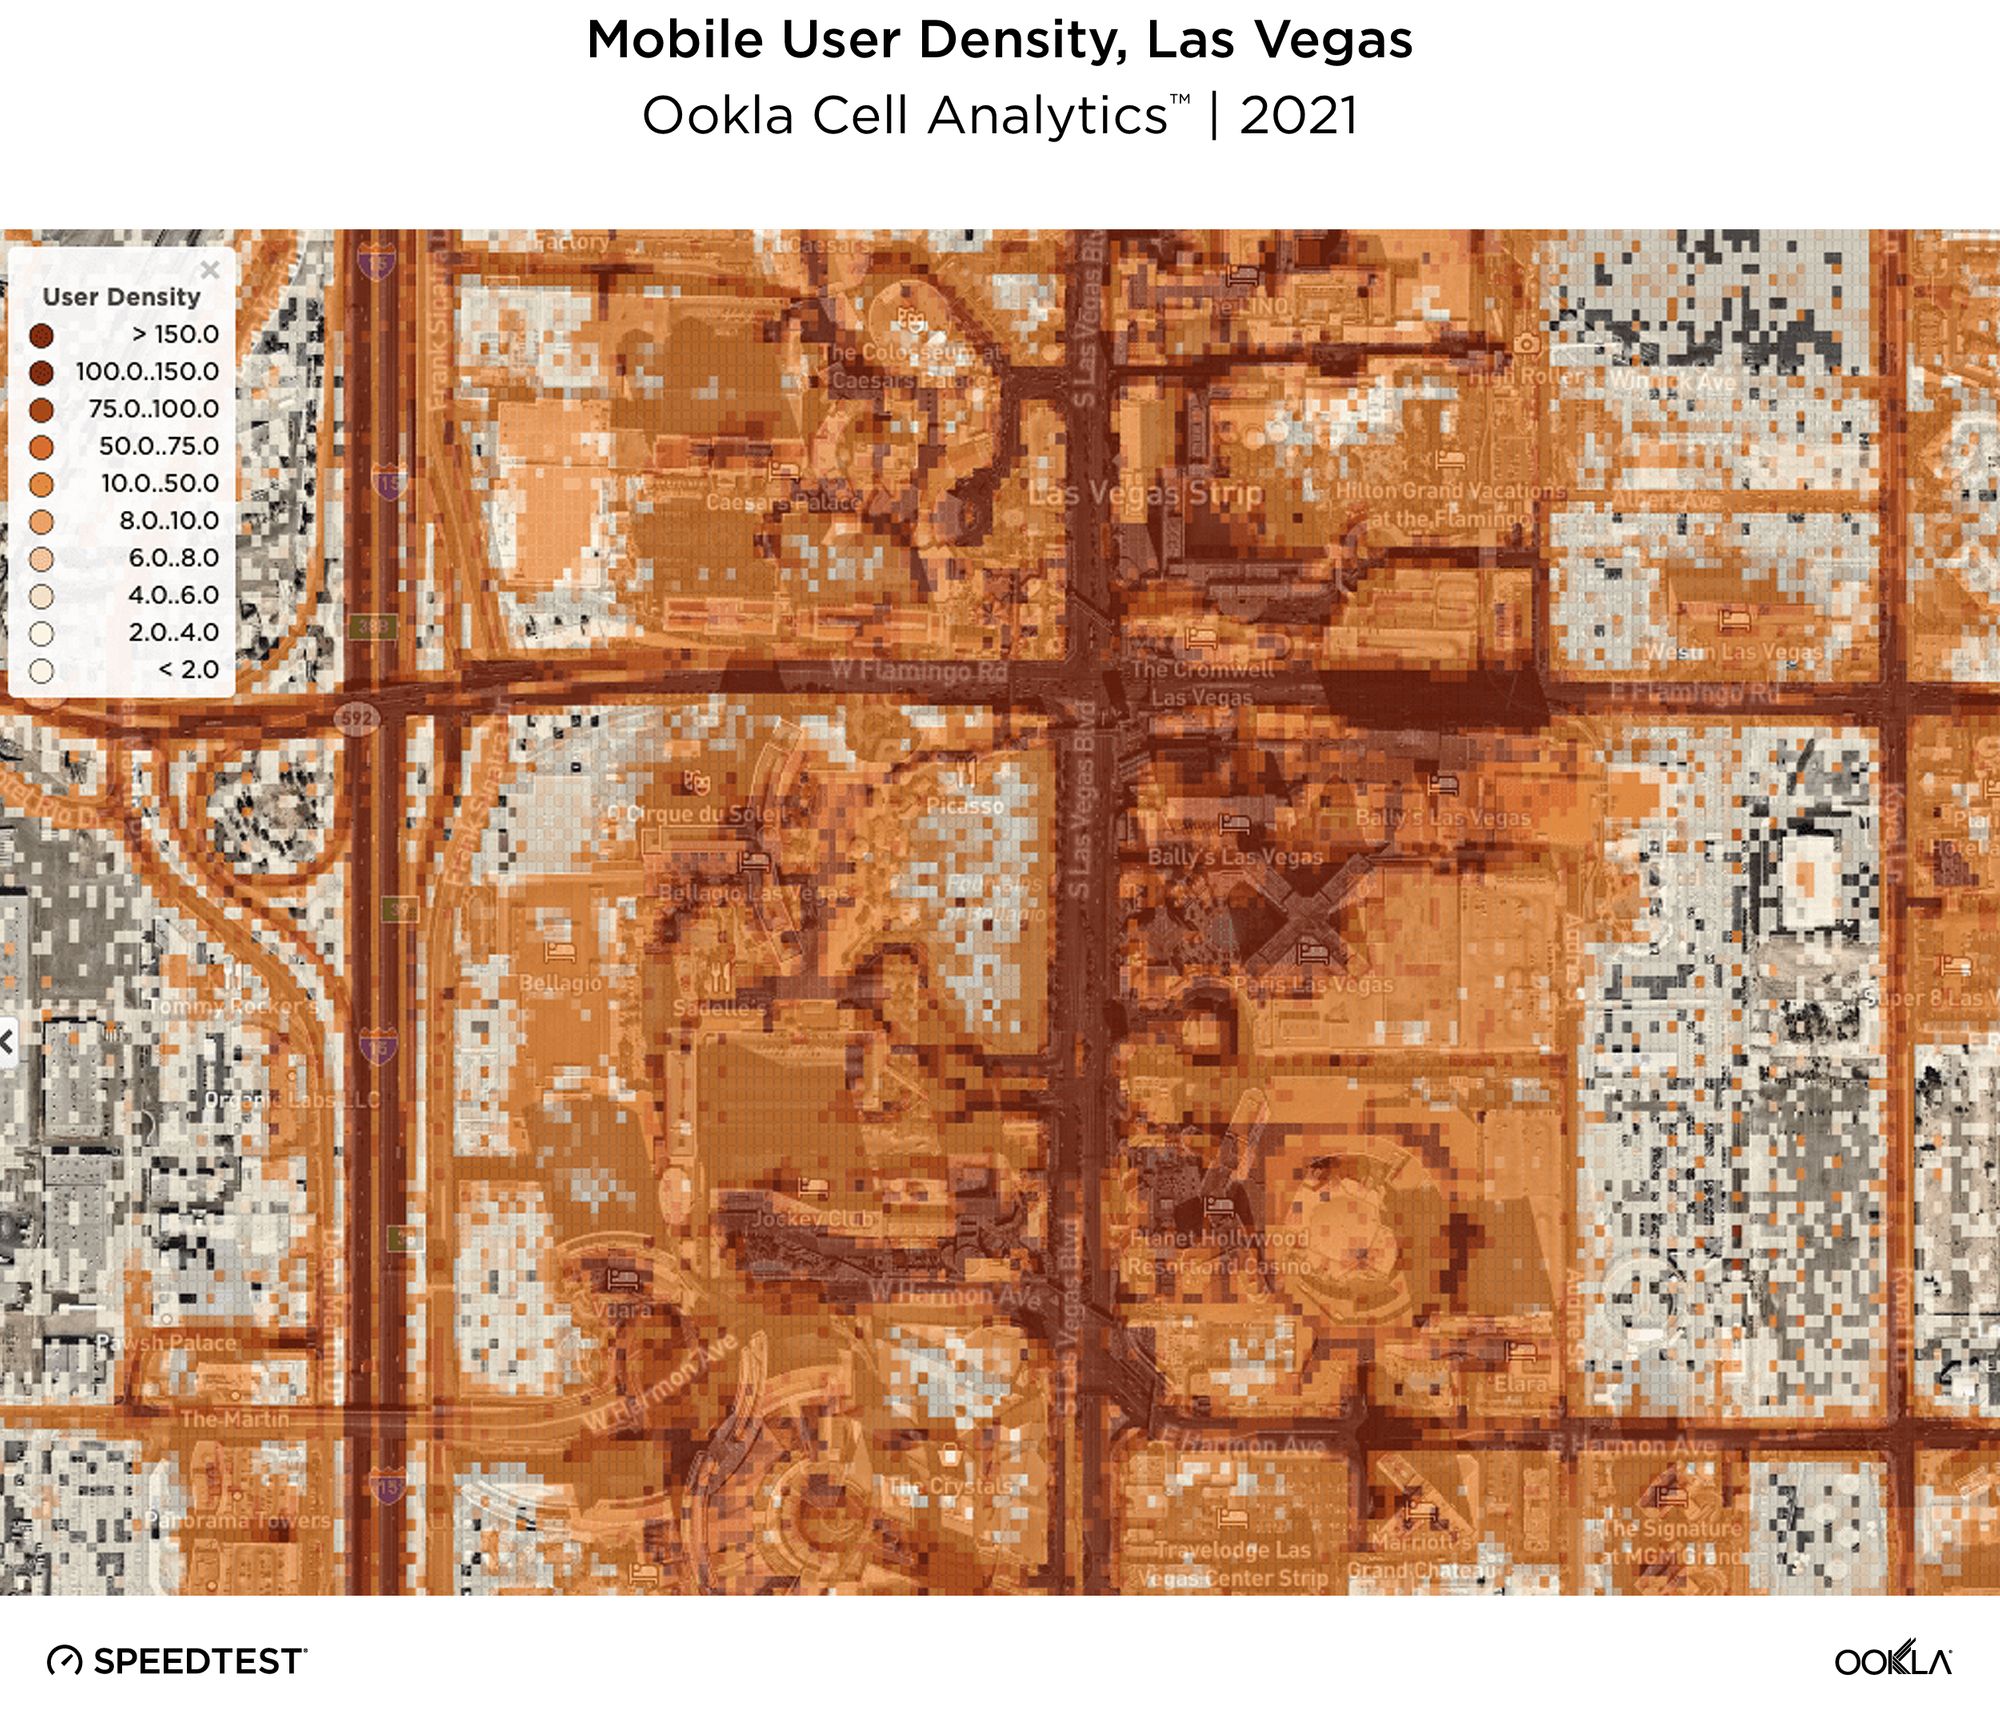
Even where signal strength is strong, high demand on the network can impact user experience. These larger buildings mean more network users per square meter and that, in turn, creates added strain on signal quality. Wrap that building in eco-friendly low-e glass and poor wireless service shouldn’t be a surprise.
outside_signal_strength_philadelphia
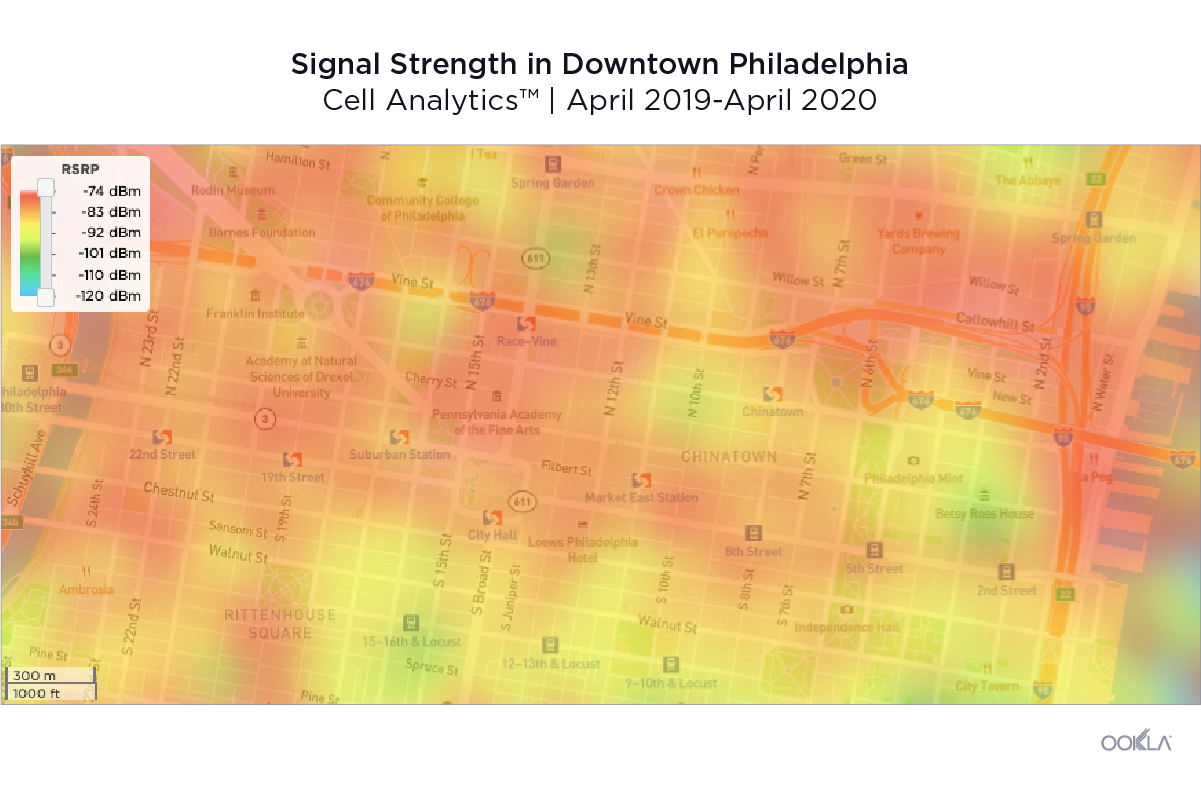
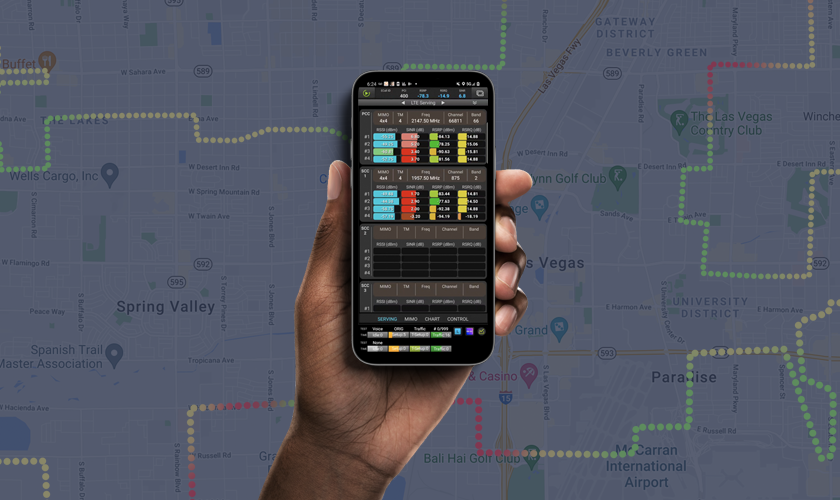
The above image from Ookla’s Cell AnalyticsTM portal depicts a gradient heatmap of the outdoor signal strength provided by the Verizon Wireless network in downtown Philadelphia. The crowdsourced readings are averaged over the past twelve months. Red and orange represent a very high signal strength, whereas green to blue represent a lower signal strength. It is clear that Verizon has made significant investments in their Philadelphia network.

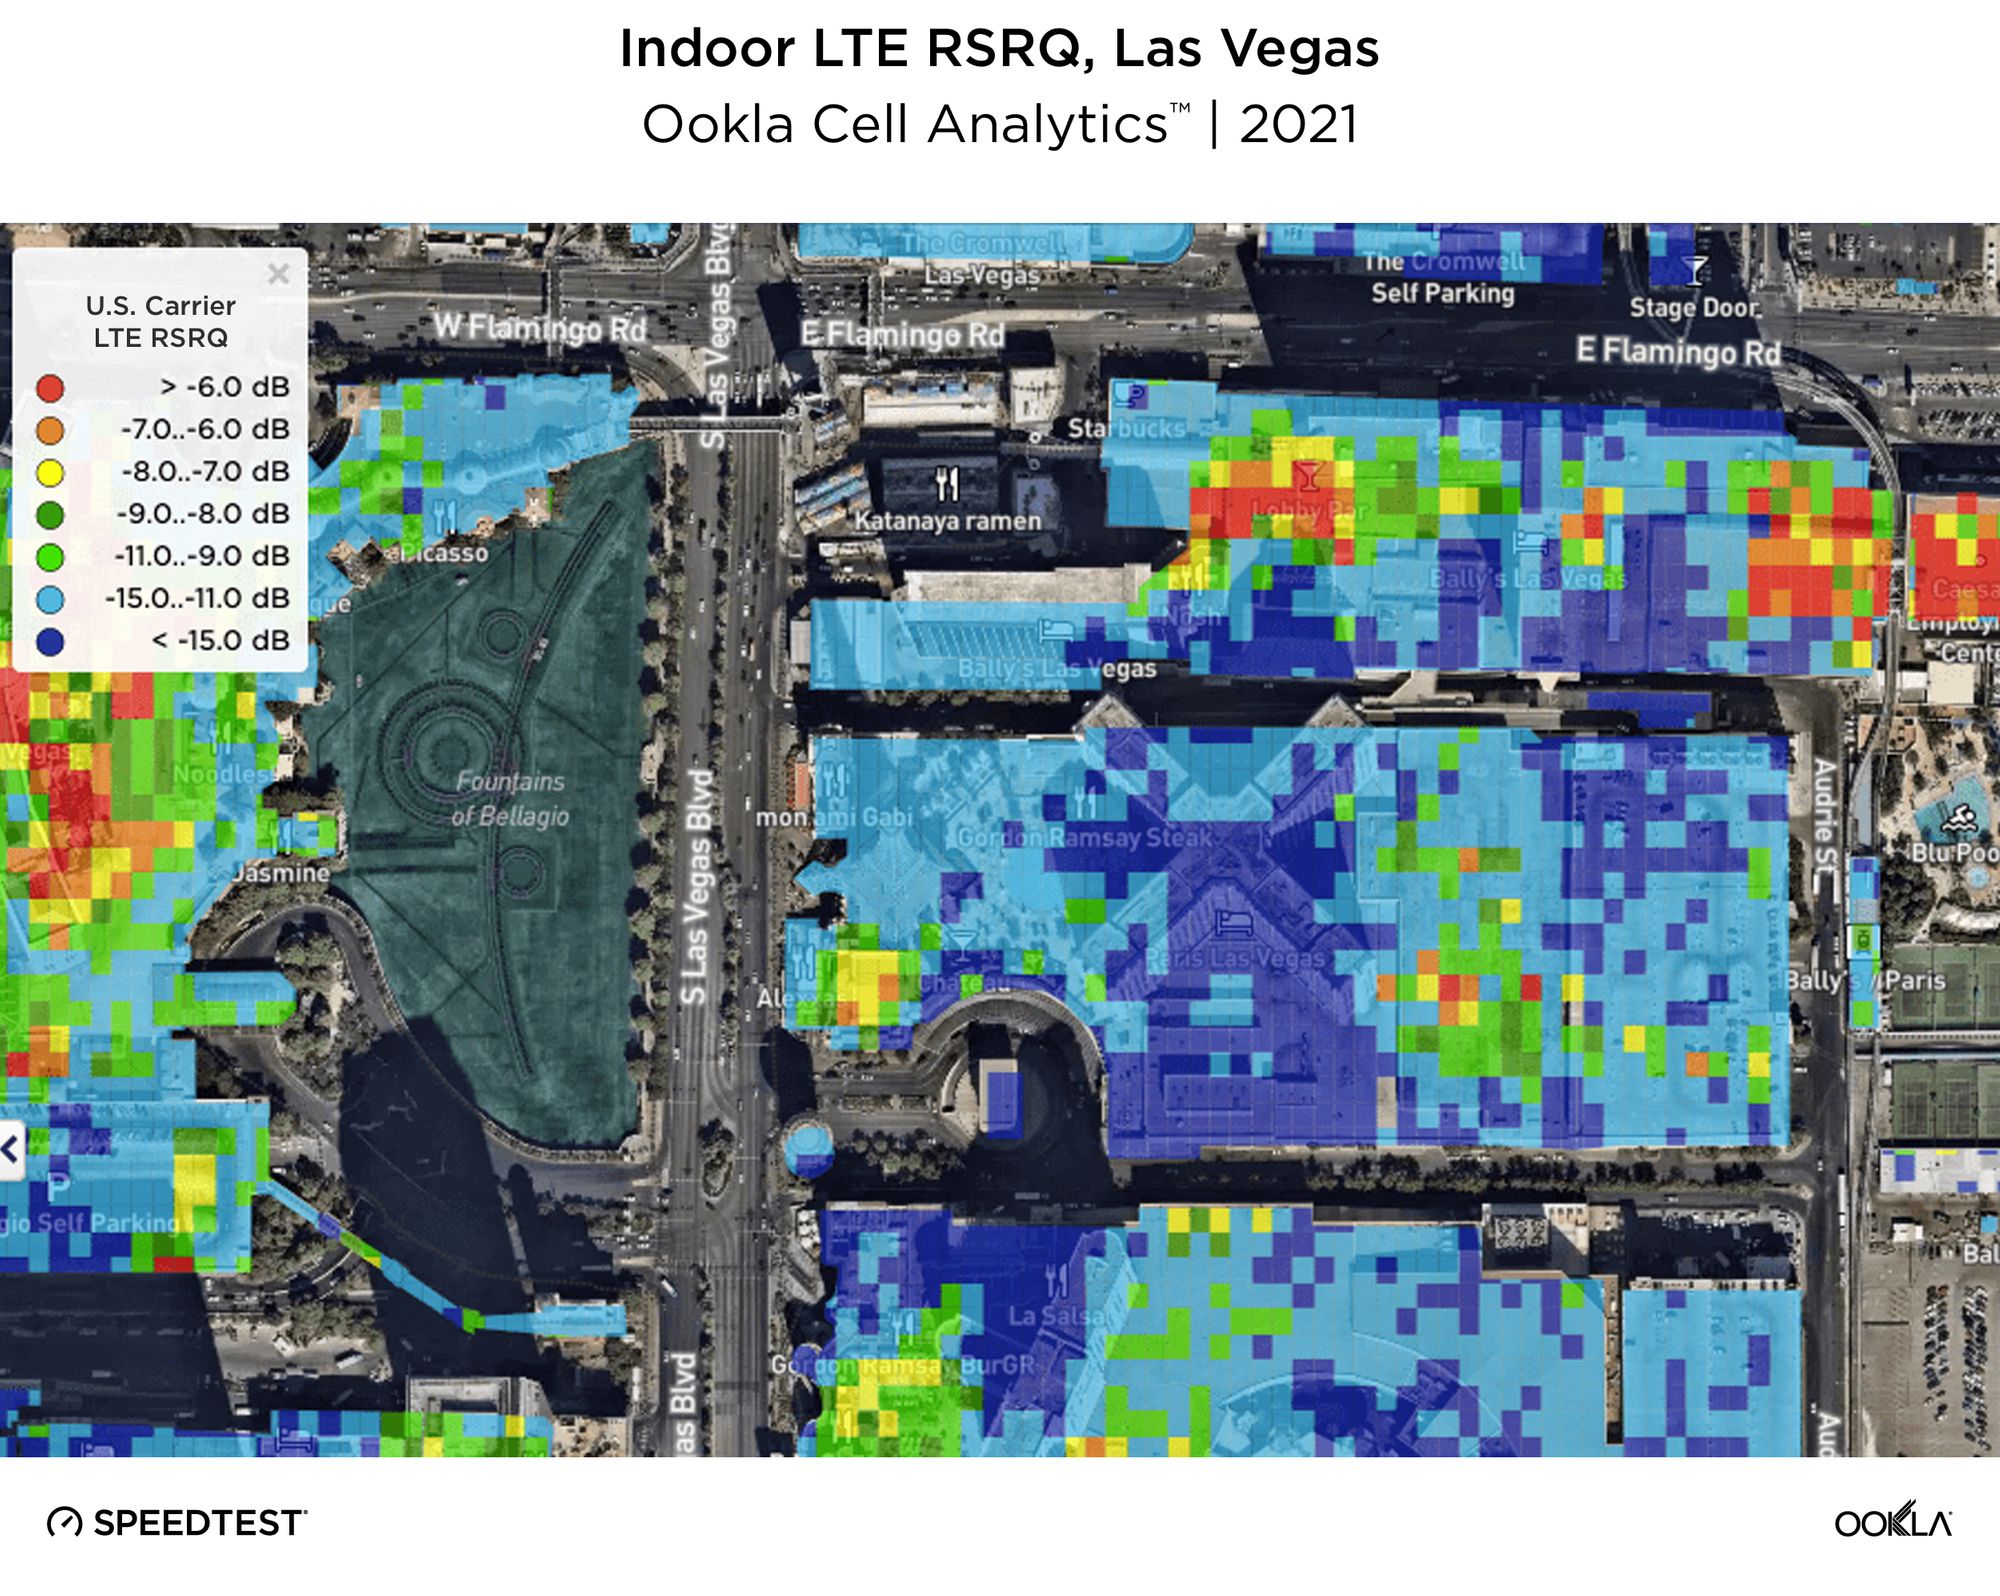
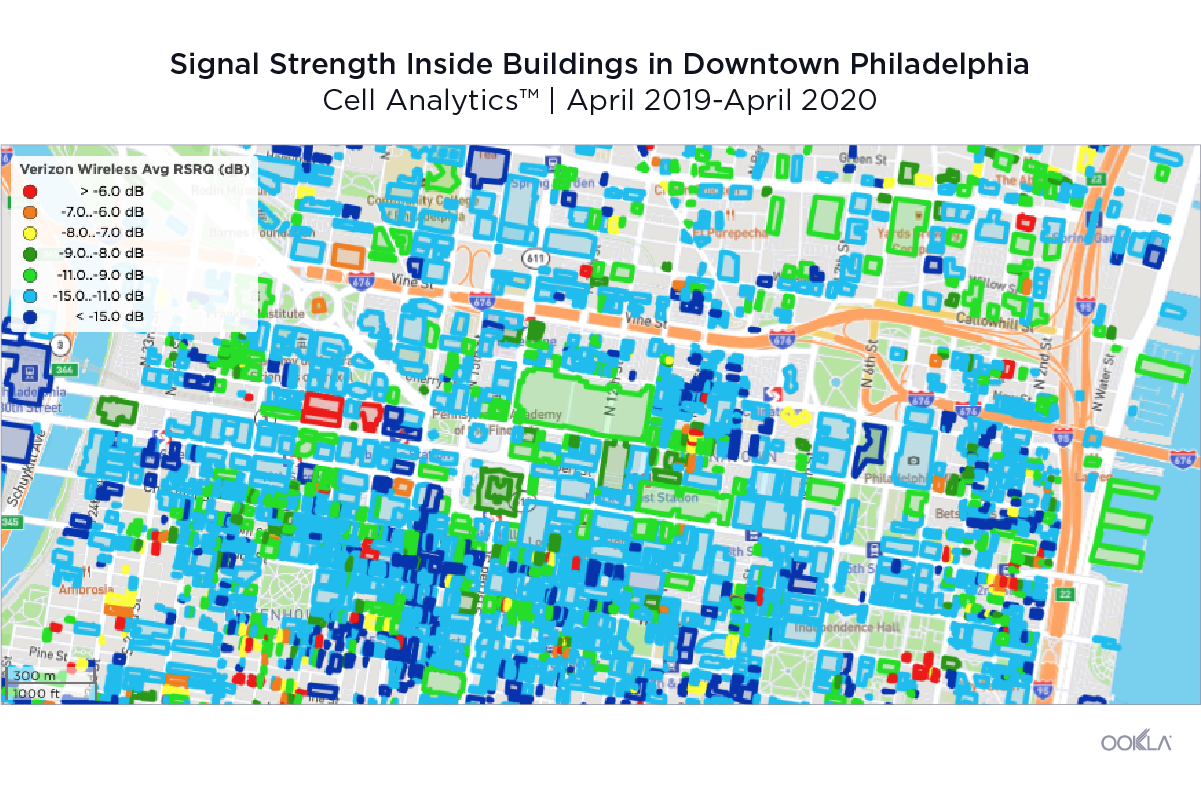
Providing high quality indoor coverage is much more difficult. Over the same twelve-month period, using Cell Analytics Pro building layers, we can view the same area in downtown Philadelphia with each building outlined in a color representing the average signal quality from readings captured inside each structure. It is clear that many buildings show an average signal quality rated as poor. Every mobile operator experiences these difficulties.
inside_signal_strength_philadelphia

How we can solve this public safety dilemma

Understanding which buildings fall short of providing adequate service can assist local governments in working with building owners and mobile operators to make needed improvements. This falls into two broad categories: First Responder Push to Talk systems and Commercial Mobile Services used by both Public Safety Agencies and the general public.

The solutions used today for First Responder Push to Talk systems are Distributed Antenna Systems (DAS) and signal boosters. For commercial mobile services, DAS, Booster Systems and Small Cells can be deployed based on individual use case. CBRS is a future Private LTE offering that is currently being developed and deployed in the United States.

Distributed Antenna Systems (DAS)

There have been solutions on the market for many years now, but the economic viability varies depending upon the use case. A DAS effectively deploys a miniature cellular network throughout a structure. DAS are very effective and have been deployed in large buildings, arenas and stadiums, but they are not appropriate for smaller buildings.

Signal boosters

Many companies make boosters that can capture outdoor signals from a nearby tower site then route them to repeaters inside of a building. This can solve a problem with signal strength and is more common for Public Safety LMR than cellular. This solution tends to be less expensive than installing a DAS network. However, if there is a need for higher capacity, a signal booster can actually exacerbate an issue by routing additional traffic to a cell site that may already be overloaded.

Small cells

Small cells are much in the news. Those being mounted to streetlights and other municipal structures are meant primarily to increase outdoor coverage at the ground level. This is particularly true with the new millimeter wave spectrum (extremely high frequencies) being used for some 5G deployments. These deployments will greatly improve coverage and quality on sidewalks and in vehicles, but mmWave is not designed to penetrate buildings.

Small cells can also be installed indoors, greatly improving floor by floor coverage in taller buildings. Using high-band (mmWave) spectrum also means that the high efficiency windows can block signals from escaping, lessening the chance that a small cell within one building would leak signal that could interfere with a different system in a neighboring building.

CBRS

The recently approved CBRS (Citizens Broadband Radio Service) technology promises to bring private LTE service to commercial buildings. Instead of depending upon the national wireless operators to provide a strong indoor coverage, an enterprise can deploy a solution to meet their specific needs, much like they have done with Wi-Fi.

So, what do most of the solutions above have in common? They are often deployed by the building owners, managers or commercial tenants. Although we will certainly see the mobile operators deploy solutions where the ROI justifies the cost, it will be up to the organizations that use wireless services every day in their businesses to underwrite the expense. The game-changer with CBRS is that a significant portion of the spectrum is unlicensed, therefore, coordination with a wireless operator is not required.

The game-changer with CBRS is that building owners have an opportunity to own and control the spectrum inside their own buildings, giving them more control over the quality delivered to their tenants and visitors. They will also have more visibility into call patterns and other data usually available only to the wireless carriers.

Building codes need to change

If the goal is to improve safety by ensuring the callers can reach 911 in an emergency and that first responders can maintain adequate coverage when being called to an emergency, then building codes must reflect this need. Sprinkler systems were initially installed to protect property from damage. The first fire code for sprinkler systems was written in 1896. As statistics began to show the death rate in buildings with these systems were dramatically lower, they became required in new construction. The requirement to retrofit existing buildings with sprinkler systems varied greatly from city to city and state to state.

As the cost to deploy indoor coverage technology declines, public safety officials within each local government should be considering how to implement code changes that will improve access to emergency communications. This process will take many years, so it is important to have empirical data to help prioritize which structures are most at risk. This may be a national issue, but it will be solved at the local level, one building at a time.

My thanks to John Foley at Safer Buildings Coalition for his assistance on this article.

Ookla retains ownership of this article including all of the intellectual property rights, data, content graphs and analysis. This article may not be quoted, reproduced, distributed or published for any commercial purpose without prior consent. Members of the press and others using the findings in this article for non-commercial purposes are welcome to publicly share and link to report information with attribution to Ookla.