| October 17, 2023

51 New Ookla Market Reports Available for Q3 2023

Ookla® Market Reports™ identify key data about internet performance in countries across the world. This quarter we’ve provided updated analyses for 51 markets using Speedtest Intelligence® and summarized a few top takeaways below. Click through to the market report to see more details and charts about the countries you’re interested in, including the fastest fixed broadband providers and mobile operators, who had the most consistent service, and 5G and device performance in select countries during Q3 2023. Jump forward to a continent using these links:

Africa | Americas | Asia | Europe | Oceania

Africa

  • Côte d’Ivoire: Orange recorded the fastest median mobile and fixed download speeds during Q3 2023, at 24.33 Mbps and 66.84 Mbps, respectively. Moov Africa recorded the lowest median multi-server latency over fixed broadband at 122 ms. Of Côte d’Ivoire most populous cities, Bouake had the fastest median fixed download speed of 59.22 Mbps, just ahead of Abidjan with 58.44 Mbps.
  • Mozambique: There were no statistical winners for fastest median mobile download speed during Q3 2023, with Vodacom and Tmcel delivering median download speeds of 31.16 Mbps and 27.89 Mbps, respectively. Tmcel recorded the lowest mobile multi-server latency at 52 ms and the highest Consistency at 91.8%. Of Mozambique’s most populous cities, Maputo had the fastest median mobile and fixed download speeds at 28.71 Mbps and 12.57 Mbps, respectively. SpaceX’s Starlink recorded the fastest fixed broadband median download speed in Q3 2023 at 53.98 Mbps, along with the highest Consistency at 60.3%. Meanwhile, TVCABO recorded the lowest median multi-server latency over fixed broadband at 14 ms.
  • Senegal: There was no winner of fastest median mobile performance in Senegal during Q3 2023, with Orange and Free both tied. Orange led the market for median fixed broadband download performance, with 21.68 Mbps in Q3 2023. It also had the lowest median multi-server latency at 85 ms and highest Consistency of 45.3%. Of Senegal’s most populous cities, Dakar had the fastest median fixed download speed of 26.08 Mbps.

Americas

  • Argentina: Personal had the fastest median download speed over mobile at 36.63 Mbps, while also registering lowest mobile multi-server latency at 39 ms during Q3 2023. In the fixed broadband market, there was no statistically fastest network, with Movistar and Telecentro delivering median download speeds of 102.55 Mbps and 101.96 Mbps, respectively. Movistar recorded the lowest multi-server latency of 10 ms. Among Argentina’s most populous cities, La Plata recorded the fastest mobile download speed of 35.48 Mbps, while Buenos Aires recorded the fastest fixed download speed of 105.50 Mbps.
  • Belize: Digi had the fastest median mobile download and upload speeds of 17.23 Mbps and 10.38 Mbps, respectively during Q3 2023. Digi also recorded the highest Consistency of 81.5%, while smart! recorded the lowest median mobile multi-server latency of 55 ms. NEXGEN had the fastest median download and upload speeds over fixed broadband in Belize at 48.27 Mbps and 47.29 Mbps, respectively.
  • Canada: Bell was the fastest mobile operator in Canada with a median download speed of 100.77 Mbps in Q3 2023. Bell also had the fastest median 5G download speed at 183.06 Mbps. Rogers had the fastest median mobile upload speed of 11.44 Mbps, and the highest Consistency of 82.9%. Bell pure fibre was fastest for fixed broadband, recording a median download speed of 286.08 Mbps and a median upload speed of 244.64 Mbps. Of Canada’s most populous cities, St. John’s recorded the fastest median mobile download speed at 158.19 Mbps, while Fredericton recorded the fastest median fixed broadband download speed of 238.49 Mbps.
  • Colombia: Movistar was fastest for fixed broadband with a median download speed of 181.42 Mbps in Q3 2023. ETB had the lowest median multi-server latency over fixed broadband at 9 ms. Of Colombia’s most populous cities, Cartagena recorded the fastest median fixed download speed of 125.15 Mbps.
  • Costa Rica: Claro had the fastest median download and upload speeds among mobile operators at 52.38 Mbps and 12.56 Mbps, respectively. Liberty had the lowest mobile multi-server latency at 33 ms and the highest Consistency at 80.1%. Metrocom was fastest for fixed broadband download and upload performance, at 213.77 Mbps and 157.89 Mbps, respectively.
  • Dominican Republic: Claro had the fastest median download and upload speeds among mobile operators at 32.22 Mbps and 9.27 Mbps, respectively. Viva had the lowest mobile multi-server latency at 44 ms. SpaceX’s Starlink was fastest for fixed broadband download performance at 49.21 Mbps, while Claro recorded the fastest median upload speed at 14.81 Mbps, as well as the lowest multi-server latency at 40 ms. Of the Dominican Republic’s most populous cities, Santo Domingo recorded the fastest median mobile and fixed download speeds of 37.43 Mbps and 44.92 Mbps, respectively.
  • Ecuador: There was no winner of fastest median mobile performance in Ecuador during Q3 2023, with CNT and Claro posting median download speeds of 28.00 Mbps and 26.65 Mbps, respectively. Movistar recorded the lowest mobile multi-server latency, of 40 ms. Netlife was fastest for fixed broadband, with a median download speed of 90.31 Mbps. Netlife also recorded the lowest multi-server latency over fixed broadband at 8ms.
  • El Salvador: Claro had the fastest median download speed among mobile operators at 41.26 Mbps, along with the highest Consistency of 88.5%. Movistar registered the lowest median multi-server latency in El Salvador at 59 ms. Cable Color recorded the fastest median fixed download speed at 54.91 Mbps, the top median upload speed at 49.87 Mbps, and the lowest median multi-server latency of 42 ms.
  • Guatemala: Claro was the fastest mobile operator in Guatemala with a median download speed of 37.39 Mbps and a median upload speed of 20.43 Mbps. Claro also had the highest Consistency at 86.1%, while also leading the market for 5G performance, with a median 5G download speed of 370.97 Mbps. SpaceX’s Starlink was fastest for median fixed download performance at 56.91 Mbps, while Cable Color was fastest for fixed upload performance at 28.96 Mbps. Cable Color also had the lowest median multi-server latency on fixed broadband at 34 ms.
  • Guyana: There was no winner of fastest median mobile performance in Guyana during Q3 2023, with ENet and Digicel posting median download speeds of 32.48 Mbps and 28.01 Mbps, respectively. ENet recorded the fastest median mobile upload speed at 18.03 Mbps and offered the lowest median multi-server latency at 137 ms. In the fixed broadband market, ENet recorded the fastest median download and upload speeds, of 61.46 Mbps and 39.75 Mbps, respectively.
  • Haiti: Digicel was the fastest mobile operator in Haiti with a median mobile download speed of 13.77 Mbps, a median upload speed of 9.92 Mbps, and Consistency of 67.4%. SpaceX Starlink had the fastest median fixed download speed at 50.18 Mbps. Natcom had the fastest median fixed upload speed at 32.10 Mbps and the lowest median fixed multi-server latency at 41 ms.
  • Honduras: Claro had the fastest median download and upload speeds over mobile at 54.06 Mbps and 15.75 Mbps, respectively. Claro also had the lowest mobile median multi-server latency at 89 ms and highest Consistency at 88.4%. Claro recorded the fastest median fixed broadband download speed of 46.11 Mbps, while TEVISAT had the fastest median upload speed of 21.30 Mbps and lowest median multi-server latency of 32 ms.
  • Jamaica: There was no winner of fastest median mobile download performance in Jamaica during Q3 2023, with Digicel and Flow tied. Digicel recorded the fastest median upload speed of 9.55 Mbps and highest Consistency of 85.8%. Flow had the lowest mobile median multi-server latency at 36 ms. SpaceX Starlink had the fastest median download speed over fixed broadband at 79.85 Mbps.
  • Mexico: Telcel had the fastest median download speed over mobile at 50.81 Mbps, and the operator also delivered the fastest median 5G download speed at 223.06 Mbps. Telcel also had the lowest mobile median multi-server latency at 63 ms and highest Consistency at 87.1%. Totalplay was fastest for fixed broadband with a median download speed of 88.28 Mbps and upload speed of 30.60 Mbps. Totalplay also had the lowest median multi-server latency at 27 ms. Among Mexico’s most populous cities, Monterrey recorded the fastest median download speeds on both mobile and fixed, at 39.47 Mbps and 77.94 Mbps, respectively.
  • Panama: MasMovil was the fastest mobile operator with median download and upload speeds of 23.66 Mbps and 15.49 Mbps, respectively, as well as the highest Consistency of 80.6%. MasMovil was also the fastest fixed network provider, with a median download speed of 147.50 Mbps and a median upload speed of 30.12 Mbps.
  • Peru: Claro was the fastest mobile operator with a median download speed of 22.27 Mbps,and Claro also had the highest mobile Consistency in the market with 80.3%.
  • Trinidad and Tobago: Digicel had the fastest median download speed over mobile at 34.92 Mbps and highest Consistency of 89.4%. Digicel+ had the fastest median fixed broadband download and upload speeds at 114.20 Mbps and 105.21 Mbps, respectively. Digicel+ also had the lowest median multi-server latency at 7 ms, as well as the highest Video Score at 82.35.
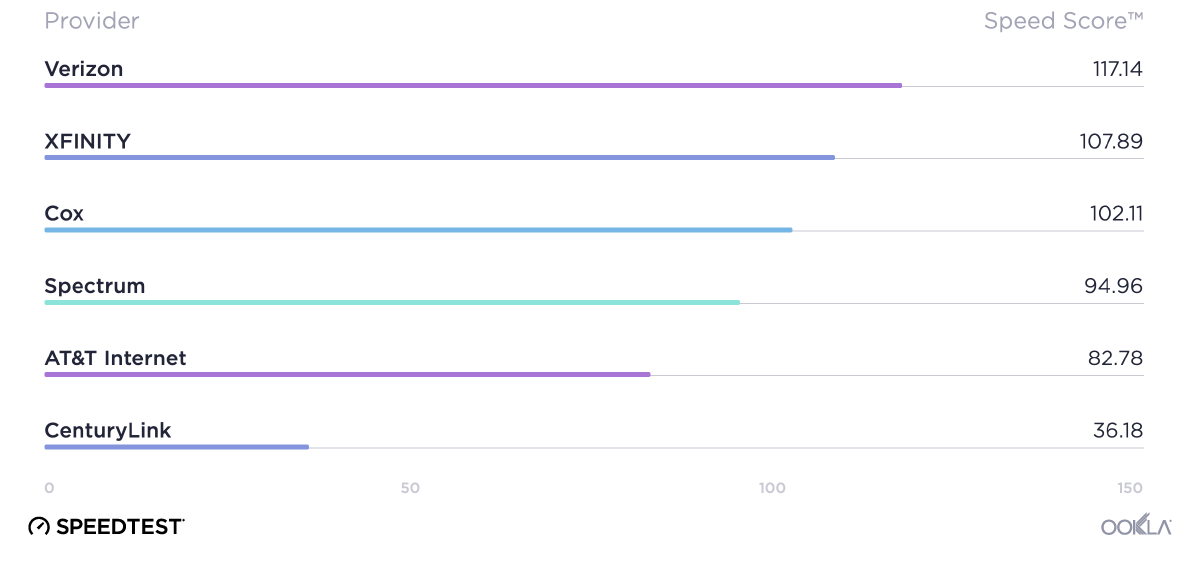
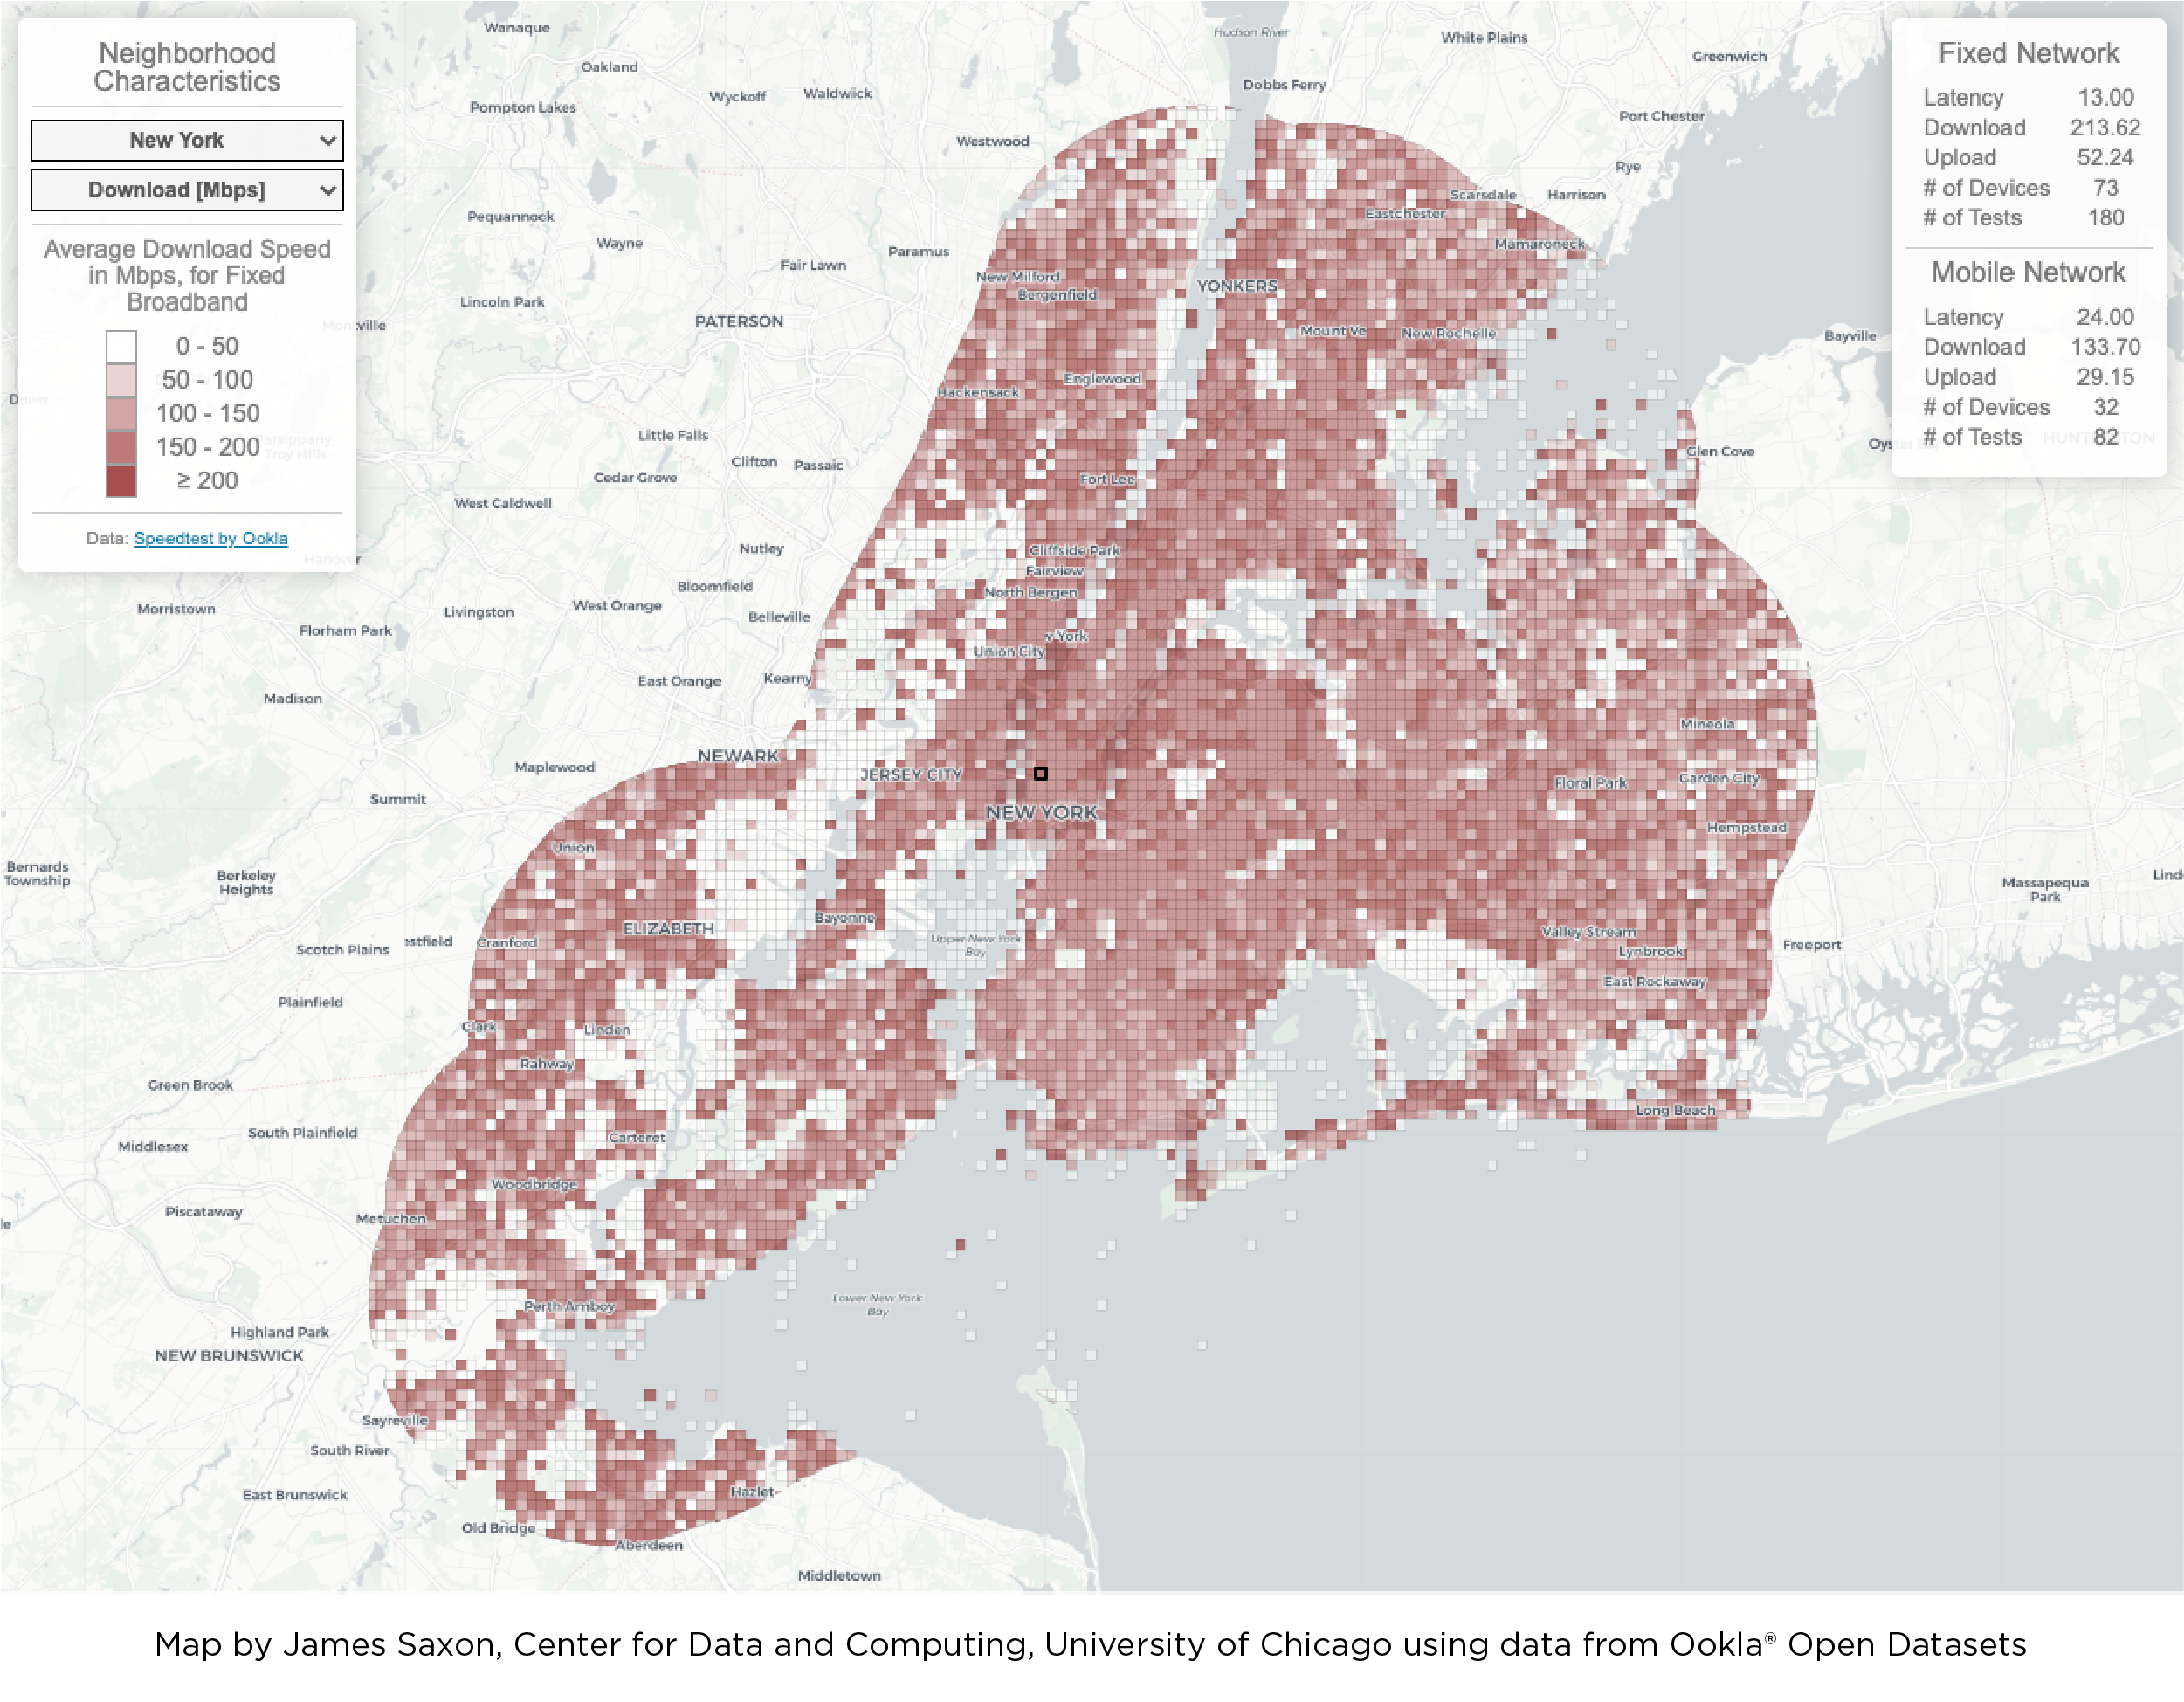
  • United States: T-Mobile was the fastest mobile operator with a median download speed of 163.59 Mbps. T-Mobile also had the fastest median 5G download speed at 221.57 Mbps, as well as the lowest 5G multi-server latency of 50 ms. Cox led the market as the fastest fixed broadband provider with a median download speed of 260.09 Mbps, while AT&T Internet recorded the fastest median fixed upload speed of 188.60 Mbps, and Verizon had the lowest median multi-server latency on fixed broadband at 16 ms.
  • Uruguay: Antel was the fastest mobile operator with a median download speed of 182.79 Mbps, and Antel also had the lowest median multi-server latency of 42 ms.
  • Venezuela: Digitel was the fastest mobile operator with a median download speed of 13.53 Mbps and a median upload speed of 6.54 Mbps. Digitel also recorded the highest Consistency in the market, with 66.2%, and the lowest median multi-server latency of 95 ms. Airtek Solutions had the fastest fixed median download speed of 82.79 Mbps, upload speed of 88.09 Mbps, and the lowest median multi-server latency at 7 ms.

Asia

  • Afghanistan: The fastest mobile operator in Afghanistan was Afghan Wireless with a median download speed of 6.38 Mbps. The operator also had the lowest median multi-server latency at 74 ms and the highest Consistency of 52.3% in Q3 2023.
  • Bangladesh: Banglalink was the fastest mobile operator in Bangladesh with a median download speed of 25.03 Mbps in Q3 2023. Banglalink also recorded the highest Consistency of 85.3% and the lowest median multi-server latency of 35ms. DOT Internet was the fastest fixed broadband provider with a median download speed of 90.20 Mbps, while also recording the highest Consistency at 85.6% and the lowest median multi-server latency at 5 ms.
  • Bhutan: There was no statistical winner for fastest mobile download performance during Q3 2023 in Bhutan, with BT and TashiCell both tied.
  • Brunei: There was no statistical winner for fastest mobile download performance during Q3 2023 in Brunei, with DST and Imagine both tied.
  • Cambodia: Cellcard recorded the fastest median mobile download speed at 31.76 Mbps during Q3 2023, while Metfone recorded the highest Consistency at 81.0% and the lowest median multi-server latency at 38 ms. There was no statistical winner among top providers in Cambodia for median fixed download speed, with SINET and MekongNet both tied.
  • China: China Mobile was the fastest mobile operator with a median download speed of 179.81 Mbps, and highest Consistency of 95.6%. China Broadnet recorded the fastest median 5G download speed at 297.59 Mbps. China Unicom was fastest for fixed broadband at 208.59 Mbps. Among China’s most populous cities, Beijing recorded the fastest median mobile download speed of 220.21 Mbps, while Tianjin recorded the fastest median fixed download speed of 284.90 Mbps.
  • Georgia: There was no statistical winner for fastest mobile download performance during Q3 2023 in Georgia, with Geocell and Magti both tied. Geocell recorded the lowest median mobile multi-server latency at 41 ms, while Magti recorded the highest mobile Consistency with 88.0%. MagtiCom had the fastest median fixed download speed at 27.80 Mbps during Q3 2023. It also recorded the highest Consistency, of 66.3%, and the lowest median multi-server latency at 12 ms. Among Georgia’s most populous cities, Gori recorded the fastest median mobile download speed of 39.01 Mbps, while Tbilisi recorded the fastest median fixed download speed of 26.98 Mbps.
  • Indonesia: Telkomsel was the fastest Indonesian mobile operator with a median download speed of 31.04 Mbps. Telkomsel also had the lowest median mobile multi-server latency at 45 ms.
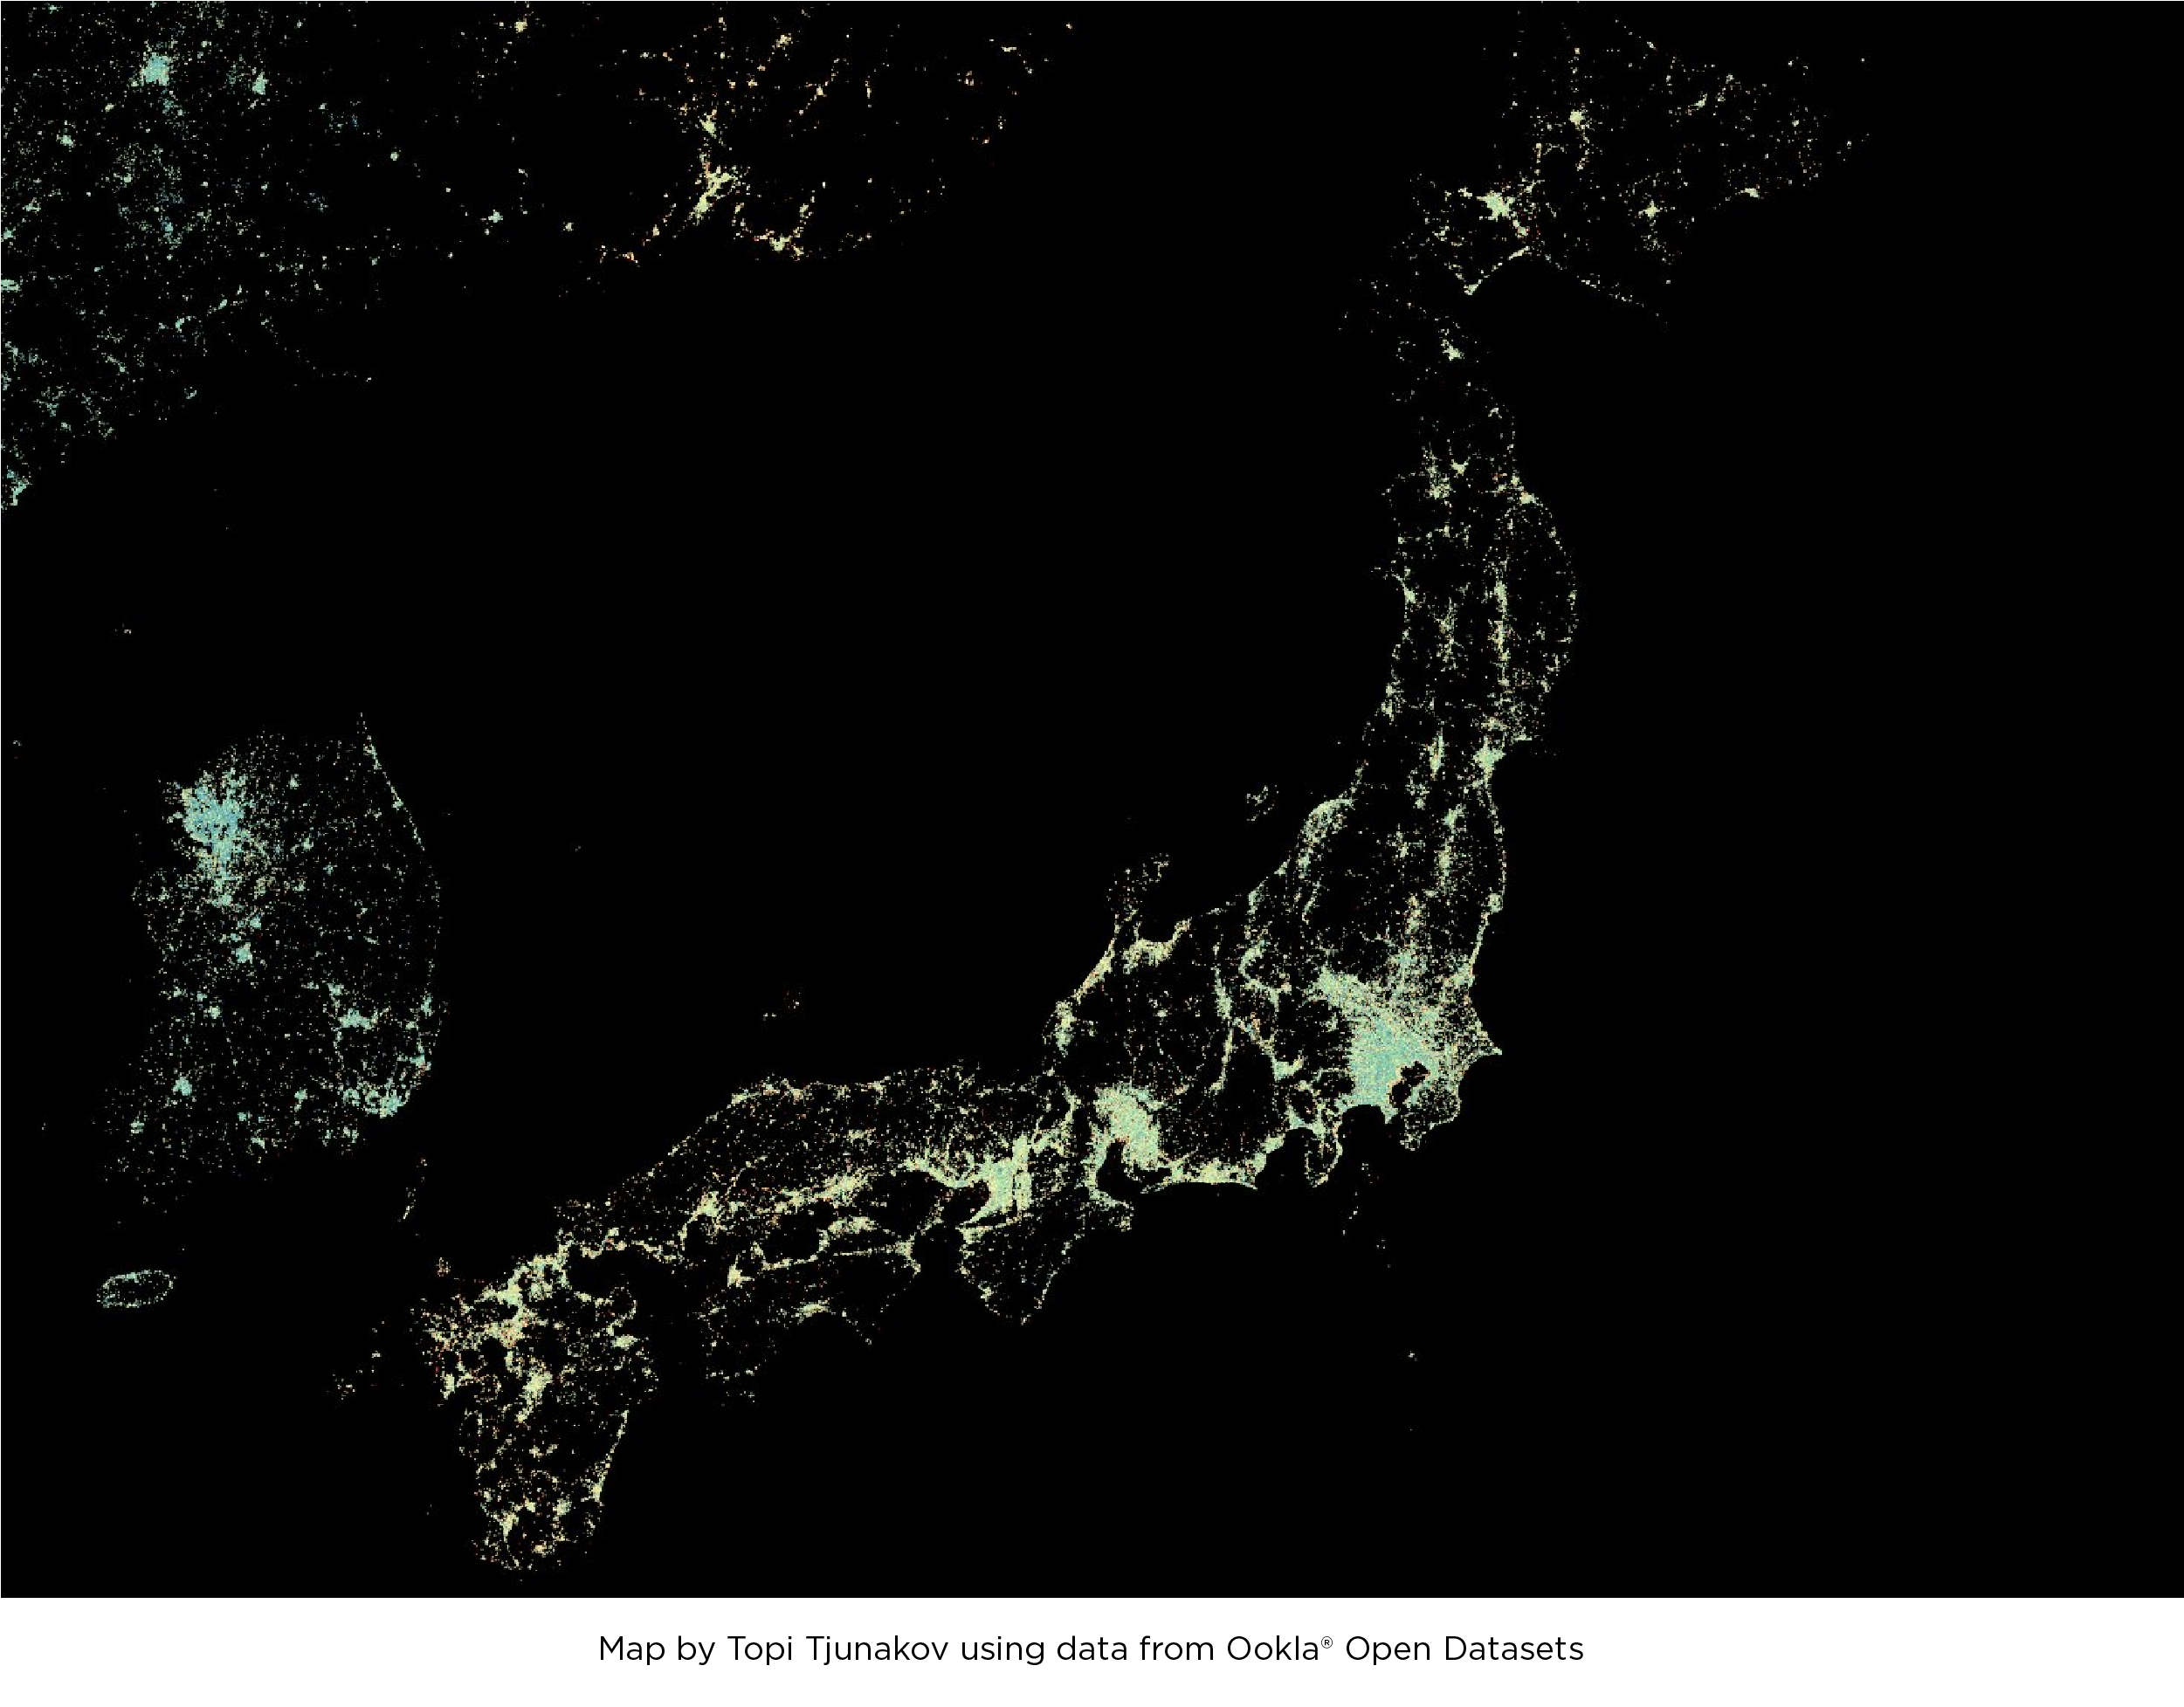
  • Japan: Rakuten Mobile recorded the fastest mobile download and upload speeds during Q3 2023 in Japan, at 46.98 Mbps and 19.34 Mbps, respectively. The operator also recorded the highest Consistency in the market at 90.4%, while SoftBank recorded the lowest median multi-server latency at 44 ms. So-net had the fastest fixed download and upload speeds, at 270.59 Mbps and 213.43 Mbps, respectively, as well as the lowest median multi-server latency over fixed broadband at 9 ms.
  • Malaysia: TIME was the fastest fixed broadband provider in Malaysia with a median download speed of 110.23 Mbps. TIME also recorded the highest Consistency in the market with 88.5% and the lowest multi-server latency at 9 ms.
  • Pakistan: Jazz delivered the fastest median mobile download speed in Pakistan at 20.63 Mbps in Q3 2023 and the highest Consistency of 80.5%. Zong recorded the lowest median mobile multi-server latency of 52 ms. Transworld had the fastest median fixed broadband download speed in Pakistan at 18.91 Mbps and the highest Consistency at 40.1%.
  • Philippines: Smart delivered the fastest median mobile download speed in the Philippines at 35.56 Mbps in Q3 2023.
  • South Korea: SK Telecom recorded the fastest median mobile download and upload speeds at 174.80 Mbps and 17.94 Mbps, respectively, while also recording the highest Consistency in the market at 86.3%. LG U+ had the lowest median mobile multi-server latency in the market at 66 ms. In South Korea’s fixed broadband market, LG U+ delivered the fastest median download and upload speeds at 148.56 Mbps and 96.53 Mbps, respectively. LG U+ also recorded the lowest median multi-server latency of 38 ms.
  • Sri Lanka: SLT-Mobitel delivered the fastest mobile and fixed download speed in Sri Lanka at 21.78 Mbps and 35.70 Mbps respectively in Q3 2023. Dialog had the lowest median mobile multi-server latency at 35 ms, while SLT-Mobitel recorded the lowest fixed broadband multi-server latency at 13 ms and the highest Consistency at 56.4%.
  • Turkey: Turkcell was the fastest mobile operator in Turkey with a median download speed of 57.60 Mbps, and the operator also recorded the highest Consistency of 90.8%. Türk Telekom had the lowest median mobile multi-server latency at 41 ms. TurkNet was fastest for fixed broadband, with a median download speed of 64.31 Mbps. TurkNet also recorded the lowest median fixed multi-server latency at 13 ms, and highest Consistency at 80.6%. Among Turkey’s most populous cities, Istanbul recorded the fastest median download speeds across mobile and fixed, of 41.22 Mbps, and 44.38 Mbps, respectively.
  • Vietnam: Vinaphone had the fastest median mobile download speed in Q3 2023, at 54.74 Mbps. Vinaphone also had the lowest median mobile multi-server latency at 34 ms and the highest Consistency at 94.7%. Viettel was the fastest fixed provider with a median download speed of 109.77 Mbps. Viettel also recorded the lowest median fixed broadband multi-server latency of 7 ms and the highest Consistency at 91.4%.

Europe

  • Albania: There was no statistical winner for fastest mobile download performance during Q3 2023 in Albania, with One Albania and Vodafone tied. One Albania recorded the highest Consistency of 84.5%, while Vodafone recorded the lowest median multi-server latency at 35 ms. Digicom was the fastest fixed broadband provider with a median download speed of 93.98 Mbps, while also recording the highest Consistency at 87.9%. Among Albania’s most populous cities, Elbasan recorded the fastest median mobile download speed of 65.31 Mbps, while Vlorë recorded the fastest median fixed download speed of 56.98 Mbps.
  • Belgium: Proximus recorded the fastest median mobile download speed during Q3 2023, at 88.76 Mbps. Proximus also recorded the highest mobile Consistency in the market at 89.4%. Telenet had the fastest median fixed download speed at 149.77 Mbps, while VOO recorded the highest Consistency at 89.2%. Among Belgium’s most populous cities, Ghent recorded the fastest median mobile download speed of 213.88 Mbps, while Antwerp offered the fastest median fixed download speed of 88.93 Mbps.
  • Denmark: YouSee was the fastest mobile operator in Denmark with a median download speed of 131.88 Mbps in Q3 2023. Hiper was fastest for fixed broadband, with a median download speed of 274.54 Mbps.
  • Estonia: The fastest mobile operator in Estonia was Telia with a median download speed of 89.65 Mbps in Q3 2023. Elisa was the fastest fixed broadband provider, with a median download speed of 97.27 Mbps, while Infonet recorded the lowest median fixed broadband multi-server latency of 5 ms.
  • Finland: DNA had the fastest median mobile download speed at 100.55 Mbps in Q3 2023 and the highest Consistency of 91.9%. Telia recorded the lowest median mobile multi-server latency of 32 ms. Lounea was fastest for fixed broadband with a median download speed of 122.03 Mbps. Lounea also recorded the highest Consistency in the market at 92.3%, as well as the lowest median fixed broadband multi-server latency at 11 ms.
  • Germany: Telekom was the fastest mobile operator in Germany during Q3 2023, with a median download speed of 91.53 Mbps, as well as the top median download speed over 5G at 182.50 Mbps. Telekom also recorded the highest Consistency in the market at 90.7% and the lowest median mobile multi-server latency of 39 ms. Deutsche Glasfaser recorded the fastest fixed broadband performance, with a median download speed at 191.89 Mbps. It also recorded the highest Consistency in the market at 89.8% and the lowest fixed broadband multi-server latency of 14 ms.
  • Latvia: BITĖ was the fastest mobile operator in Latvia during Q3 2023, with a median download speed of 81.00 Mbps and the highest Consistency in the market of 89.3%. LMT recorded the lowest mobile multi-server latency at 27 ms. Balticom was fastest for fixed broadband with a median download speed of 256.37 Mbps. Balticom also had the highest fixed broadband Consistency of 92.5% and the lowest median fixed broadband multi-server latency at 4 ms.
  • Lithuania: Telia was the fastest mobile operator in Lithuania during Q3 2023, with a median download speed of 117.76 Mbps in Q3 2023. Telia also recorded the highest Consistency in the market at 92.8%. Cgates was fastest for fixed broadband with a median download speed at 167.30 Mbps. Cgates also recorded the highest Consistency over fixed broadband in the market at 90.1%.
  • Poland: T-Mobile was the fastest mobile operator in Poland during Q3 2023, with a median download speed of 50.31 Mbps. T-Mobile also recorded the highest Consistency in the market at 86.8%. Plus recorded the fastest 5G performance in the market, with a median 5G download speed of 146.01 Mbps. UPC was the fastest provider for fixed broadband with a median download speed of 228.57 Mbps in Q3 2023. Among Poland’s most populous cities, Łódź recorded the fastest median mobile download speed of 52.92 Mbps, while Wrocław recorded the fastest median fixed download speed of 163.04 Mbps.
  • Switzerland: Salt was the fastest fixed broadband provider in Switzerland, with a median download speed of 384.65 Mbps. Salt also had the highest Consistency in the market at 94.8% and the lowest median multi-server latency over fixed broadband at 8 ms.

Oceania

  • New Zealand: One NZ was the fastest mobile operator in New Zealand during Q3 2023, with a median download speed of 74.20 Mbps. 2degrees led the market with the highest Consistency of 91.0% and the lowest median mobile multi-server latency at 41 ms.

The Speedtest Global Index is your resource to understand how internet connectivity compares around the world and how it’s changing. Check back next month for updated data on country and city rankings, and look for updated Ookla Market Reports with Q4 2023 data in January.

Ookla retains ownership of this article including all of the intellectual property rights, data, content graphs and analysis. This article may not be quoted, reproduced, distributed or published for any commercial purpose without prior consent. Members of the press and others using the findings in this article for non-commercial purposes are welcome to publicly share and link to report information with attribution to Ookla.

| October 22, 2020

ICYMI: Ookla Data and Research from September 2020

Highlights from the Speedtest Global IndexTM

Global-Index-Tweet-Image-Sept-2020
These are the top stories from September 2020:

  • Croatia is back up to 11th place on mobile after a two-month slump.
  • Denmark’s relatively steady increase in fixed broadband speeds over the last 13 months has them ranked seventh.
  • There was no change in the rankings of the top four countries on mobile and the top three on fixed broadband from August.

New Market Analyses

Canada

TELUS showed the fastest Speed Score on mobile during Q3 2020 while Rogers was fastest on fixed broadband. Québec City had the fastest mean mobile download speed while London was fastest for fixed broadband.

Malaysia

Maxis had the fastest Speed Score on mobile during Q1-Q2 2020 while TIME was fastest for fixed broadband. Nusajaya had the fastest mean download speed over mobile while Shah Alam was fastest for fixed broadband.

Taiwan

Chunghwa Telecom showed the highest 4G Availability in Taiwan during Q1-Q2 2020.

Turkey

Turkcell was the fastest mobile provider in Turkey during Q3 2020 while Turksat Kablo was the fastest ISP.

United Kingdom

EE had the fastest Speed Score on mobile during Q3 2020 while Virgin Media was fastest on fixed broadband. Three showed the fastest median download speed on 5G. Cardiff had the fastest mean download speed on mobile while Edinburgh was fastest for fixed broadband. Read our latest article debunking misleading claims in the U.K.

United States

AT&T was the fastest mobile operator in the U.S. during Q3 2020 while Verizon was the fastest fixed broadband ISP. Fort Wayne, Indiana had the fastest mobile download speed on our list and Austin, Texas was the fastest city for fixed broadband.

Articles worth a second look

Announcing Ookla Open Datasets

map
This is your chance to crunch Ookla’s data on global network performance. Use our new open dataset to create a project that illustrates internet performance where you live.

How Georgia is Leveraging Cell Analytics to Enable Virtual Classrooms

classroom
Ookla helped the Georgia Department of Education to find the best locations to deploy school buses with mobile Wi-Fi hotspots to bridge the connectivity gap for remote learning.

Read our latest white paper

How to Improve In-Building Network Performance and Coverage with Crowdsourced Data

buildings
This guide for RAN engineering teams will show you how to use crowdsourced data to analyze in-building network performance and coverage — and how to prioritize the network improvements that have the most impact on your customers.

Ookla retains ownership of this article including all of the intellectual property rights, data, content graphs and analysis. This article may not be quoted, reproduced, distributed or published for any commercial purpose without prior consent. Members of the press and others using the findings in this article for non-commercial purposes are welcome to publicly share and link to report information with attribution to Ookla.

| September 8, 2021

Despite All Odds, Global Internet Speeds Continue Impressive Increase


“A lot has changed” we wrote in our 2019 global roundup of internet speeds based on the Speedtest Global Index. Little did we know how much was about to change. But two things remain the same: the internet is getting faster and the Speedtest Global Index is still a fantastic resource for tracking improvements on a global and country level (if we do say so ourselves). Today we’re taking a look back at how much internet speeds have increased over the past four years and which countries have seen some of the largest gains.

Mobile download speed jumped 59.5% over the last year globally, fixed broadband up 31.9%

The global mean of download speeds improved over the last 12 months on both mobile and fixed broadband to 55.07 Mbps and 107.50 Mbps, respectively, in July 2021. Mobile saw an increase of 59.5% when comparing July 2020 to July 2021 and fixed broadband saw an increase of 31.9%, according to the Speedtest Global Index.

ookla_global-index_world-speeds_0921-1

Looking further back, mean download speed over mobile was 98.9% faster in July 2021 than in July 2019, 141.4% faster when comparing July 2021 to July 2018, and 194.0% faster when comparing July 2021 to June 2017, the month we began tracking speeds on the Speedtest Global Index. Over the last two years there were only two months when the global average for mobile download speed did not show an upward slope: February and March 2020. Speeds began increasing again in April 2020, but did not recover to pre-February levels until May 2020. This coincides with initial lockdowns due to COVID-19 in many countries.

On fixed broadband, mean download speed was 68.2% faster in July 2021 than in July 2019, 131.3% faster in July 2021 than in July 2018, and 196.1% faster in July 2021 than in June 2017. There was a similar dip in download speed over fixed broadband in March of 2020 as we saw on mobile. The speed increased again in April 2020 but did not recover to a pre-March level until April 2020.

Top 10 rankings are somewhat constant over three years, U.S. and Canada slip off in 2021

There has been surprising parity of which countries continue to occupy the top 10 spots on the Speedtest Global Index in July of each year. However, the lists for mobile and fixed broadband are radically different, with only one country (South Korea) showing up on both lists in 2021.

ookla_fastest-countries_mobile_0921

The United Arab Emirates and South Korea maintain their first and second place rankings for mobile in both 2020 and 2021 and China and Qatar merely flip-flop for third and fourth place. It’s interesting to see Australia and Canada decline in the rankings although their speeds have increased dramatically during the past three years. 5G is shifting mobile rankings where even countries with 5G (which few countries had in 2019) need a strong 5G focus to maintain their presence at the top of the list lest they be outpaced by other countries with larger investments in 5G.

ookla_fastest-countries_fixed_0921

The fixed broadband rankings are more dynamic than those on mobile. Monaco traveled up and down the top 10 from sixth place in 2019 to 10th in 2020 to first place in 2021. Singapore ranked first or second in all three years and Hong Kong (SAR) was in the top four. Romania was solidly in fifth place while South Korea dropped lower in the ranking every year. Chile and Denmark both debuted in the top 10 in 2021 and the United States dropped off the list.

Most of the top 10 countries perform well for fixed and mobile

We were curious to see if countries that made the top 10 in July 2021 for either mobile or fixed broadband were also performing well on the other medium, so we plotted the percentage difference from the global average for mobile download speed against download speed on fixed broadband. Note that the global average increased between 2020 and 2021 and that Liechtenstein and Monaco are not included in this comparison as they did not have sufficient samples to be listed on both axes.

2020/2021 chart of leading country performance again global averages

Most countries that made the top 10 in July 2021 for either mobile or fixed broadband were performing well over the global average for both at that point in time. South Korea and the U.A.E. stood out with mean mobile download speeds that were more than 240% faster than the global average and fixed broadband downloads that were more than 70% faster than the global average. China’s mobile download speed was more than 180% faster than the global average and the country was more than 70% faster than the global average for fixed broadband. Switzerland’s mobile and fixed broadband download speeds were close to 100% faster than the global average.

Chile and Thailand are in a quadrant that shows both had faster than average fixed broadband download speeds, but their mobile download speeds were slower than the global average in July 2021. Australia, Bulgaria, Cyprus and Saudi Arabia were in the opposite quadrant with faster than average mobile speeds and below average fixed broadband speeds.

Comparing the chart for July 2021 to that of July 2020, we saw a wide variety of outcomes. Countries with increases compared to the global average on mobile and fixed broadband included Australia, Cyprus, Denmark, Hong Kong, Romania and the U.A.E. Chile and Norway showed dramatic increases compared to the global average on fixed broadband and declines on mobile. Bulgaria, China, Kuwait, Saudi Arabia and Switzerland increased on mobile but showed little change on fixed. South Korea and Qatar increased on mobile compared to the global average and declined on fixed. Singapore and Thailand declined on both mobile and fixed broadband compared to the global average.

We’re interested to see how global speeds and rankings change over time as individual countries and their providers choose to invest in different technologies. Track your country’s performance using monthly updates on the Speedtest Global Index. Check the Ookla 5G Map for up-to-date information on 5G deployments where you live, and if you want more in-depth analyses, subscribe to Ookla Research.

Ookla retains ownership of this article including all of the intellectual property rights, data, content graphs and analysis. This article may not be quoted, reproduced, distributed or published for any commercial purpose without prior consent. Members of the press and others using the findings in this article for non-commercial purposes are welcome to publicly share and link to report information with attribution to Ookla.

| January 31, 2022

Ookla Data Hints C-Band Could Change Who’s Going to be Fastest in the U.S.

We recently covered how necessary the addition of C-band spectrum to the 5G strategies of Verizon Wireless and AT&T is for increased performance. We now have data from Speedtest Intelligence® to show exactly how much C-band has already affected 5G performance in the week following launch on January 19 and how that might impact our Ookla Market Report™ rankings next quarter.

U.S. mobile 5G download speeds increased 13% week over week

We saw a week-over-week increase in median 5G download speed of 13% when looking at all operators combined. AT&T and T-Mobile both had slight increases (1%) in median download speed over 5G for all operators when comparing the seven days starting January 12, 2022 to the week of January 19, 2022, with AT&T rising from 68.43 Mbps to 70.46 Mbps and T-Mobile increasing from 181.99 Mbps to 187.11 Mbps. This coincides with AT&T’s very selective rollout of C-band in eight markets and the fact that T-Mobile did not add new spectrum on January 19, though they did launch their 5G carrier aggregation that same day.

Verizon Wireless saw the greatest performance gain of 50% after the C-band rollout, from 76.51 Mbps during the week starting January 19 to 116.29 Mbps during the week of January 19. This massive improvement in speed shows the power of Verizon’s widespread deployment of C-band spectrum and C-band’s ability to deliver fast speeds. We also saw a large increase in testing for customers across the board, but especially Verizon customers who could have seen an ultra wide band icon show up on their phone for the first time after the launch.

This spike in testing is one reason we usually report on at least one quarter of data. However, if the trend in increased speed continues, Verizon Wireless could challenge T-Mobile for fastest download speed in our next Speedtest Global Index Market Analysis.

C-band’s effect on speeds differed across five cities

We also examined week-over-week performance in five of the cities where both Verizon and AT&T deployed C-band: Austin, Texas; Chicago, Illinois; Fort Worth, Texas; Houston, Texas; and Jacksonville, Florida. AT&T saw a 12% increase in median download speed over 5G in Austin, and Verizon Wireless saw statistically significant increases in Fort Worth (21%) and Jacksonville (28%). All other operator speeds over 5G were relatively flat in other listed locations with the exception of Houston where Verizon Wireless showed a dip from a high the prior week.

This could upset the market by the time of our next report

As mentioned above, if Verizon continues to capitalize on their C-band rollout and add additional deployments, we could well see an upset in the U.S. market rankings by the time of our next Speedtest Global Index Market Analysis. There may be additional upsets to come, because while AT&T saw a marginal impact on its initial C-Band launch, their [strategy to install C-band in tandem with recently acquired 3.45-3.55GHz frequency](https://www.fiercewireless.com/5g/att-plans-deploy-345-ghz-c-band-one-climb-tower-strategy) could revolutionize AT&T’s speeds in the second half of the year. Subscribe to Ookla Research™ to get the latest analyses delivered directly to your inbox.

Ookla retains ownership of this article including all of the intellectual property rights, data, content graphs and analysis. This article may not be quoted, reproduced, distributed or published for any commercial purpose without prior consent. Members of the press and others using the findings in this article for non-commercial purposes are welcome to publicly share and link to report information with attribution to Ookla.

| August 27, 2019

Where to Find the Fastest Airport Wi-Fi in the U.S. and Canada in 2019

We’re back with our annual survey of the fastest airport Wi-Fi in the U.S. and Canada. This year we’re sharing data on twice as many airports, as well as looking at which non-airport-sponsored SSIDs are your fastest choice. Whether you’re taking one last summer vacation or booking business trips for the fall, this guide should help you find the fastest airport internet connections.

Our analysis is based on Speedtest IntelligenceTM data from 51 of the largest airports in the U.S. and Canada during Q1-Q2 2019.

Fastest airport Wi-Fi

We looked first at mean download and upload speeds over the airport’s Wi-Fi SSID to see which airports are prioritizing fast speeds.

Honolulu’s Daniel K. Inouye International Airport makes its debut on the list this year at the very top of the rankings. With a mean download speed of 145.12 Mbps, Honolulu’s Wi-Fi was 37.5% faster than second-place Chicago Midway (which was also new to the list). These two airports unseated Sea-Tac, last year’s winner for fastest airport Wi-Fi. Ranking third, Sea-Tac’s mean download speed over Wi-Fi actually fell 4.4% since our last analysis. Nashville International and Phoenix Sky Harbor rounded out the top five

airport-update-chart1-1

Calgary placed 17th overall but showed the fastest airport Wi-Fi of the five Canadian airports we examined. Montréal–Pierre Elliott Trudeau International Airport had the slowest Wi-Fi among Canadian airports again this year, but their mean download speed jumped 154.4% since our last analysis.

We were excited to see that while we more than doubled the number of airports on the list this year, the number with Wi-Fi download speeds less than 10 Mbps fell. The airport with the slowest Wi-Fi was Louis Armstrong New Orleans International Airport, followed by Salt Lake City International Airport, Houston’s William P. Hobby Airport, Southwest Florida International Airport in Fort Myers, and Norman Y. Mineta San José International Airport.

Both Denver and San Francisco split their Wi-Fi between two separate SSIDs that appear to cater individually to 5 GHz and 2.4 GHz devices. In both of these cases we’ve chosen to list the faster of the two SSIDs. Fort Lauderdale has four different Wi-Fi SSIDs for four different terminals. We aggregated the speeds from those SSIDs to report a mean.

Comparing speeds on other Wi-Fi SSIDs at major airports

Airport-provided Wi-Fi is not always your fastest option. This year we also looked for alternate Wi-Fi SSIDs to see which is fastest at each airport. Access to some of these SSIDs may require memberships or day passes, so you can use the information below to decide whether or not to make that investment.

Fastest Wi-Fi SSIDs at 51 Largest Airports in U.S. and Canada
Speedtest IntelligenceTM | Q1-Q2 2019
Airport Fastest SSID Mean Download (Mbps) % Faster than Airport SSID
Austin–Bergstrom International Airport Boingo Hotspot 80.99 0.2%
Baltimore–Washington International Airport Boingo Hotspot 81.91 1.7%
Calgary International Airport YYC-Free-WiFi 69.22
Charlotte Douglas International Airport CLT Free WiFi 47.68
Chicago Midway International Airport _Free_MDW_Wi-Fi 105.51
Chicago O’Hare International Airport united_club 124.96 93.9%
Cleveland Hopkins International Airport CLE-GUEST 52.88
Dallas Love Field DAL Free WiFi 43.56
Dallas/Fort Worth International Airport TheCenturionLounge 70.29 28.8%
Daniel K. Inouye International Airport HNL Free WiFi 145.12
Denver International Airport – DEN Airport Free WiFi 88.47
Detroit Metropolitan Airport Boingo Hotspot 62.28 0.2%
Edmonton International Airport EIA_FREE_WIFI 51.44
Fort Lauderdale–Hollywood International Airport MedallionNet 41.98 237.5%
George Bush Intercontinental Airport united_club 156.73 1117.8%
Hartsfield–Jackson Atlanta International Airport DeltaSkyClub 111.89 69.8%
Indianapolis International Airport IND PUBLIC WiFi 71.14
John F. Kennedy International Airport TWA 161.66 221.5%
John Wayne Airport JWAFREEWIFI 79.91
Kansas City International Airport KCI_FREE_WiFi 38.28
LaGuardia Airport _Free LGA Wi-Fi 79.40
Logan International Airport Passpoint Secure 58.64 26.8%
Los Angeles International Airport united_club 156.91 122.3%
Louis Armstrong New Orleans International Airport #MSY-Free_Wifi 4.42 337.6%
McCarran International Airport McCarran WiFi 44.56
Miami International Airport Avianca_VIP 55.58 55.4%
Minneapolis–Saint Paul International Airport Boingo Hotspot 82.11 34.8%
Montréal–Pierre Elliott Trudeau International Airport VIP 44.37 172.0%
Nashville International Airport Boingo Hotspot 100.42 3.6%
Newark Liberty International Airport united_club 120.31 133.0%
Norman Y. Mineta San José International Airport XFINITY 26.81 208.2%
Oakland International Airport OAK Free WiFi 90.95
Orlando International Airport skyclub 63.06 47.1%
Philadelphia International Airport American Airlines lounge Wi-Fi 79.37 73.3%
Phoenix Sky Harbor International Airport Free PHX Boingo WiFi 93.47
Portland International Airport flypdx 38.47
Raleigh–Durham International Airport RDU Free WiFi 24.80
Ronald Reagan Washington National Airport FlyReagan 81.72
Sacramento International Airport flysacramento 37.26
Salt Lake City International Airport DeltaSkyClub 18.70 699.1%
San Antonio International Airport SAFreeWiFi 47.83
San Diego International Airport #SANfreewifi 85.30
San Francisco International Airport united_club 151.10 175.3%
Seattle–Tacoma International Airport Alaska Lounge 102.26 3.6%
Southwest Florida International Airport RSWiFly 7.51
St. Louis Lambert International Airport *STL_FREE_WIFI 60.20
Tampa International Airport TPA 19.50
Toronto Pearson International Airport Plaza Premium Lounge 38.52 25.3%
Vancouver International Airport @yvrairport 58.97
Washington Dulles International Airport united_club 185.86 150.2%
William P. Hobby Airport Free Airport WIFI 7.30

The airport’s own SSID was the fastest option for Wi-Fi at 26 airports.

At the other 25 airports, airport lounges (both those affiliated with airlines and other private entities) often topped the pack. We saw that “united_club” was the fastest SSID at six airports and “DeltaSkyClub” at two. “Alaska Lounge,” “American Airlines lounge Wi-Fi,” “Avianca_VIP,” “MedallionNet” and “Plaza Premium Lounge” were each the fastest SSID at one airport.

“Boingo Hotspot” was the fastest SSID at five airports and “Passpoint Secure” (a Boingo service) at one. It’s interesting that at airports where we saw both the “Boingo Hotspot” and “Passpoint Secure” SSIDs, mean download speeds on the “Boingo Hotspot” SSID were routinely faster.

How airline lounges fare for Wi-Fi

We won’t pretend to compare most of the amenities available at various airline lounges, but we do have data on which have the fastest Wi-Fi. We compared mean download speeds over Wi-Fi SSIDs affiliated with airlines and airport lounges to see which memberships you might want to consider.

The United Club has fast Wi-Fi at Dulles, LAX, George Bush Intercontinental, San Francisco, O-Hare and Newark, with mean download speeds well above 100 Mbps. At LAX, the mean download speed of 156.91 Mbps on “united_club” is 263.2% faster than “American Airlines lounge Wi-Fi.” Similarly, “united_club” is 158.9% faster than “American Airlines lounge Wi-Fi” at Chicago O’Hare. United’s more general SSID, “United_Wi-Fi” is slow — 97.3% slower than “united_club” in Houston, and 93.3% slower in Newark.

American Airlines had the fastest lounge Wi-Fi at JFK with a mean download speed of 103.61 Mbps. At Philadelphia International the lounge saw a mean download speed of 79.37 Mbps. It was slower at Miami International Airport, LAX and Chicago O’Hare, however, with mean download speeds in the mid-to-upper 40s. At Phoenix Sky Harbor and Dallas-Fort Worth, though, download speed at the American Airlines Lounge was closer to the mid 20s.

Delta operates three separate SSIDs in Atlanta with “DeltaSkyClub” having the fastest downloads at 111.89 Mbps, “Delta_Guest” at 86.42 Mbps and “DeltaWiFi” at 28.65. In Detroit “DeltaSkyClub” delivered a download speed of 42.12 Mbps and 35.64 Mbps in Minneapolis. Downloads were even slower on this SSID at LaGuardia, Salt Lake City, Sea-Tac, JFK and LAX, with mean speeds that ranged from 15.91 Mbps to 23.20 Mbps.

The Alaska Lounge was the fastest at Sea-Tac with a mean download speed of 102.26 Mbps. The Avianca VIP Lounge was the fastest at Miami International with 55.58 Mbps.

TWA had the fastest Wi-Fi at JFK by far, outpacing other airline-affiliated SSIDs by at least 60 Mbps. Also at JFK, JetBlue’s “Fly-Fi” was slow at 9.83 Mbps but 61.1% faster than “JetBlue Hotspot.”

Wherever your travels may take you, remember the number one rule of Wi-Fi: if the connection is not secured, your data isn’t either. Once you’re safely at your gate (or chilling in the lounge), take a Speedtest so we can bring you an updated version of this list next year

Ookla retains ownership of this article including all of the intellectual property rights, data, content graphs and analysis. This article may not be quoted, reproduced, distributed or published for any commercial purpose without prior consent. Members of the press and others using the findings in this article for non-commercial purposes are welcome to publicly share and link to report information with attribution to Ookla.

| May 23, 2023

U.S. Airports Have Fastest Free Airport Wi-Fi, Chinese Airports Have Faster Mobile

The summer travel season is about to officially begin across the northern hemisphere and we’re back with fresh data for our series on airport Wi-Fi performance. This year we examined mobile Wi-Fi on free Wi-Fi provided by the individual airports as well as mobile speeds at some of the busiest airports in the world during Q1 2023. While airports in the United States top the list of fastest free airport Wi-Fi, the fastest mobile speeds we saw were in China. Read on for a specific look at internet performance including: download speed, upload speed, and latency.

U.S. airports have fastest airport Wi-Fi

Speedtest Intelligence® showed two U.S. airports at the top of the list for free airport Wi-Fi with Fort Lauderdale’s Hollywood International Airport Terminal 3 and San Francisco International Airport showing median download speeds of 157.60 Mbps and 156.66 Mbps, respectively, during Q1 2023. This represented a small drop for SFO since our November analysis but an increase for FLL. Dallas/Fort Worth International Airport (143.42 Mbps), John F. Kennedy International Airport (136.06 Mbps), and Seattle–Tacoma International Airport (136.02 Mbps) rounded out the top five with three additional SSIDs from FLL following closely behind with median download speeds from 122.07 Mbps to 134.62 Mbps.

Chart of Mobile Internet Performance Over Free Wi-Fi at Select Airports

As we’ve seen in most recent analyses, the airports with the fastest Wi-Fi are international hubs that passengers from around the world pass through on their way to all kinds of destinations. If you are connecting through any of these airports, you should have no trouble with internet speeds this fast. In case of video calls, upload speeds are even faster than downloads at almost all of these airports, and SFO had the fastest uploads on the list.

Hartsfield–Jackson Atlanta International Airport and SEA had the lowest median multi-server latency on Wi-Fi of any of the airports surveyed during Q1 2023. This means your device should see very little delay when relaying information across the web.

Shanghai tops Wi-Fi performance at global airports

Shanghai Pudong International Airport was the fastest non-U.S. airport on our list with a fastest median download speed of 118.67 Mbps. Charles de Gaulle Airport in Paris (98.82 Mbps), Amsterdam Airport Schiphol (82.83 Mbps), Dubai International Airport (67.21 Mbps), and Frankfurt Airport (59.10 Mbps) followed for median download speeds at non-U.S. airports. All of these airports have internet speeds that qualify as at least good, which means you should be okay unless you want to try multi-player gaming (which is probably not your first choice on an airport layover anyway). Both Mexican airports on our list showed speeds in the slow range, so log off early and enjoy your vacation if you’re at the airport in Cancún or Mexico City.

Chinese airports have fastest mobile speeds

Get ready to connect to local mobile service or tether your phone to your laptop if you’re traveling through airports in Shanghai and Beijing and have access to 5G. Not only did Shanghai Pudong International Airport, Beijing Capital International Airport, and Beijing Daxing International Airport have the fastest median downloads over mobile on our list at 308.51 Mbps, 304.87 Mbps, and 300.70 Mbps, respectively, during Q1 2023 — the mobile speeds at these airports were dramatically faster than the airport Wi-Fi. Salt Lake City International Airport (282.21 Mbps) and Hangzhou Xiaoshan International Airport (259.86 Mbps) rounded out the top five.

Chart of Mobile Network Performance at Select Airports

While latency on mobile was generally higher than that on Wi-Fi, these same three Chinese airports (PEK, PKX, and PVG) also showed the lowest median multi-server latency on mobile during Q1 2023, indicating that your internet experience at these airports will have the least lag. Airports outside the U.S. performed better for latency overall with the top 16 airports for latency all located outside North America. CUN had the highest latency on mobile.

We were able to include more airports in the mobile analysis because there were more mobile samples to analyze at those airports than there were samples over Wi-Fi.

Airport Wi-Fi or mobile? Connecting on your next trip

Save yourself time by using this checklist to decide whether to try out the Wi-Fi or simply use the local mobile network. We compared internet performance on free airport Wi-Fi with median download speeds over mobile for the 38 airports we have both Wi-Fi and mobile data for during Q1 2023. Twenty-one airports had faster mobile internet than airport Wi-Fi. Twelve airports had faster Wi-Fi than mobile, and four airports showed only a slight distinction between Wi-Fi and mobile so we gave both the green check marks.

Chart Comparing Airport Wi-Fi and Mobile Speeds at Select Airports

Airport Wi-Fi has come a long way since we started this series in 2017. We hope your connections are smooth and if you’re traveling this summer, take a Speedtest® at the airport to see how your experience compares.

Ookla retains ownership of this article including all of the intellectual property rights, data, content graphs and analysis. This article may not be quoted, reproduced, distributed or published for any commercial purpose without prior consent. Members of the press and others using the findings in this article for non-commercial purposes are welcome to publicly share and link to report information with attribution to Ookla.

| July 8, 2020

U.S. Internet Speeds Increase 15.8% on Mobile and 19.6% on Fixed Broadband

The Q2 2020 Speedtest® United States Market Report by Ookla® is based on Speedtest Intelligence® data from over 1.6 million unique mobile user devices and 18.9 million fixed broadband devices performing more than 85.1 million consumer-initiated tests on Speedtest apps in the U.S. during the period.

Data from Speedtest Intelligence reveals median download speed over mobile in the U.S. increased 15.8% between Q2 2019 and Q2 2020 to 29.00 Mbps. The median upload speed for mobile was 5.74 Mbps, down 15.2% from Q2 2019.

Median download speed over fixed broadband increased 19.6% during the last year to 86.04 Mbps in Q2 2020, and median upload speed increased 1.5% to 11.86 Mbps in Q2 2020.

We saw a decline in mobile and fixed broadband download speeds in early March as consumer behavior shifted in response to the pandemic. Speeds have since rebounded on both mobile and fixed broadband. Read our week-by-week view of COVID-19’s impact on internet performance.

AT&T is fastest and most consistent

US_Report_Fastest_Mobile_Provider_June_2020

With a Speed Score of 41.23, AT&T was the fastest operator in competitive geographies in the U.S. during Q2 2020. AT&T also had the highest Consistency Score with 79.7% of Speedtest® results meeting or exceeding speed thresholds of 5 Mbps for download and 1 Mbps for upload.

To learn more about how operators performed for 4G Availability and latency, read the full report.

Mobile operators doubled down on 5G

All major U.S. operators were focused on implementing 5G over the past year.
AT&T continued to roll out its millimeter wave “5G+” network in parts of major cities. In addition, AT&T repurposed its 850 MHz low-band spectrum, previously used for 3G service, in parts of 30 states to offer improved 5G coverage.

Verizon launched new 5G markets and expanded its millimeter wave “Ultra Wideband” 5G footprint in parts of 35 cities. Verizon recently completed Dynamic Spectrum Sharing (DSS) field trials, and is expected to start leveraging its sub-6GHz spectrum for 5G by the end of the year.

In June 2019, T-Mobile launched their millimeter wave 5G in parts of six markets, followed by the nationwide rollout of 5G in the 600 MHz band to cover more than 200 million users. With the successful completion of the Sprint merger, T-Mobile accelerated the rollout of 5G in the 2.5 GHz band, which became commercially available in Philadelphia and New York City.

For specific information about how flagship phones performed and how speeds compare by manufacturer, read the full report.

Verizon has the fastest fixed broadband

US_Fastest_Fixed_Providers_June_2020
With a Speed Score of 117.14, Verizon had the fastest fixed broadband in the U.S. during Q2 2020. Verizon also had the lowest median latency at 9 ms. Spectrum provided the most consistent internet experience with a Consistency Score of 84.4%.

D.C. fastest for mobile, New Jersey for fixed

Analyzing performance at the state level, the District of Columbia showed the fastest median download speed on mobile during Q2 2020, while New Jersey showed the fastest median download speed over fixed broadband during the same period.

Pittsburgh, Pennsylvania was the fastest city in the U.S. for mobile during Q2 2020 while Kansas City, Missouri was the fastest city for fixed broadband.

Read our full report for full rankings in all fifty states and the 100 most populous cities in the country. We also include data on providers’ performance in states and major cities.

Ookla retains ownership of this article including all of the intellectual property rights, data, content graphs and analysis. This article may not be quoted, reproduced, distributed or published for any commercial purpose without prior consent. Members of the press and others using the findings in this article for non-commercial purposes are welcome to publicly share and link to report information with attribution to Ookla.

| December 5, 2018

Best Metros for Remote Workers: Where Fast Internet Meets Affordable Homes

“Work from anywhere with an internet connection” is a common refrain in today’s growing tech economy. If you want both a fast internet connection and an affordable home, use this list to discover the location of your new remote “office.”

Looking at Speedtest data from the 100 largest Metropolitan Statistical Areas (MSAs) in the U.S. during September 2018, we ranked each by their Speed Score over fixed broadband. Speed Score is a weighted measure of mean download and upload speeds that also considers performance at the lowest and highest tiers.

We then partnered with Zillow to compare our rankings to their data on median home value. Cities that ranked comparatively high for Speed Score and low for median home value made our list. The results present some interesting opportunities for digital nomads looking for a new home base.

Map-Legend-Speed-Score-3

Chattanooga takes the number one spot with a blend of fast internet speeds and affordable housing stock that make working from home (WFH) easy and appealing. Shreveport is number two and Kansas City places third. Five of the top ten metros were located in the Southeast and three in the Southwest. The western U.S. was notably absent from the top ten.

More affordable and fast cities if you plan to work from home

If you didn’t find your new best life on the map above, here is the full list of 25 places remote workers should consider. Each has the fast internet speeds that will keep you connected and the affordable home values that could help you reimagine your budget.

25 Best Cities for Remote Workers
Where fast internet meets affordable real estate

Based on September 2018 data from Speedtest and Zillow

WFH Rank MSA Name Speed Score Gigabit? Median Home Value
1 Chattanooga, TN-GA 151.23 Y $141,700
2 Shreveport, LA 107.66 N $103,300
3 Kansas City, MO-KS 128.76 Y $195,900
4 El Paso, TX 90.47 N $120,800
5 Pittsburgh, PA 102.14 Y $146,200
6 San Antonio, TX 119.97 Y $201,400
7 Oklahoma City, OK 95.13 Y $144,200
8 Jacksonville, FL 113.16 Y $210,200
9 Piedmont Triad, NC 89.50 Y $137,000
10 Charlotte-Gastonia, NC 115.59 Y $221,100
11 York, PA 103.04 Y $180,100
12 Wilmington, DE-NJ-MD 110.73 Y $219,800
13 Harrisburg, PA 100.22 Y $172,300
14 Raleigh-Durham, NC 128.91 Y $263,400
15 Houston, TX 104.94 Y $206,900
16 Syracuse, NY 82.75 N $128,800
17 Philadelphia, PA 110.86 Y $238,400
18 Baton Rouge, LA 90.86 Y $162,400
19 Davenport-Rock Island-Moline, IA/IL 83.85 Y $129,800
20 Wichita, KS 87.14 Y $143,600
21 Youngstown-Warren, OH 72.48 N $89,900
22 Louisville, KY-IN 91.04 Y $170,400
23 Richmond, VA 110.72 Y $235,900
24 Atlanta, GA 104.45 Y $216,700
25 Baltimore, MD 111.66 Y $260,500

The Southeast picks up another seven metros when looking at the full list of the 25 best metros for remote workers with a grand total of 12. North Carolina is home to three. As the Louisville, KY MSA straddles a regional border, we counted it in both the Southeast and the Midwest.

The Midwest and the Northeast are each home to five metros that made our list of best places to WFH. While the metros in the Midwest are spread widely, there’s a tight concentration of contenders in southeastern Pennsylvania. Pair those with Baltimore, MD and Wilmington, DE and you have a nice cluster of places to work from home that are a mere train ride away from one of a certain mega retailer’s new headquarters.

Four metros on our list of 25 best metros for remote workers are in the Southwest, three of which are in Texas. Sadly, the western U.S. loses out completely. Though left coast tech hubs like Silicon Valley and Seattle have access to internet speeds that make developers drool, high median home prices keep them out of the running. Instead, these digital strongholds are fast becoming the kinds of places that remote workers flee in the great rush toward more livable second cities.

Nine of the metros on our list are located in the rust belt. Could an economic resurgence be in the cards in these former manufacturing powerhouses? Maybe. What is certain is that these metros all contain two important ingredients to attract the kinds of people who innovate, create and build.

Do they have gigabit?

We all love fast internet, but not all metros have the infrastructure in place to offer gigabit speeds. If you need (or want) these super-fast speeds for work (or play), the “Gigabit?” column shows a “Y” for all metros where we saw at least 100 samples where download speeds exceeded 750 Mbps. Only four of the metros on our list failed to meet that threshold.

Of course access to gigabit is not always uniform across cities, so check with local internet service providers (ISPs) to verify these speeds are available at your new address.

Seeking out your own remote work haven? Zillow can help you find just the right place for your new home office. Just make sure you ask the seller to take a Speedtest before closing escrow.

Ookla retains ownership of this article including all of the intellectual property rights, data, content graphs and analysis. This article may not be quoted, reproduced, distributed or published for any commercial purpose without prior consent. Members of the press and others using the findings in this article for non-commercial purposes are welcome to publicly share and link to report information with attribution to Ookla.

| January 21, 2021

New Year, Great Data: The Best Ookla Open Data Projects We’ve Seen So Far


When we announced Ookla® Open Datasets from Ookla For Good™ in October, we were hoping to see exciting projects that raise the bar on the conversation about internet speeds and accessibility — and you delivered. From analyses of internet inequity in the United States to measures of data affluence in India, today we’re highlighting four projects that really show what this data can do. We also have a new, simpler tutorial on how you can use this data for your own efforts to improve the state of networks worldwide.

Highlighting the digital divide in the U.S.

Jamie Saxon with the Center for Data and Computing at the University of Chicago married Ookla data on broadband performance with data from the American Community Survey to create interactive maps of the digital divide in 20 U.S. cities. These maps provide views into many variables that contribute to internet inequities.

Ookla_open_datasets_James_Saxon_0121-1

Building a data affluence map

Raj Bhagat P shows how different variables can be combined with this map of data affluence that combines data on internet speeds and device counts in India.

Ookla_open_datasets_Raj-Bhagat-P_0121-1

Internet speeds are beautiful

This map of fixed broadband speeds across Europe from Boris Mericskay shows that internet performance can be as visually stunning as a map of city lights.

Ookla_open_datasets_Boris-Mericskay_0121-1

Topi Tjunakov created a similar image of internet speeds in and around Japan.

Ookla_open_datasets_Topi-Tjunakov_0121-1

Use Ookla Open Datasets to make your own maps

This section will demonstrate a few possible ways to use Ookla Open Datasets using the United Kingdom as an example. The ideas can be adapted for any area around the world. This tutorial uses the R programming language, but there are also Python tutorials available in the Ookla Open Data GitHub repository.

library(tidyverse)
library(patchwork)
library(janitor)
library(ggrepel)
library(usethis)
library(lubridate)
library(colorspace)
library(scales)
library(kableExtra)
library(knitr)
library(sf)

# colors for plots
purple <- "#A244DA"
light_purple <- colorspace::lighten("#A244DA", 0.5)
green <- colorspace::desaturate("#2DE5D1", 0.2)
blue_gray <- "#464a62"
mid_gray <- "#ccd0dd"
light_gray <- "#f9f9fd"

# set some global theme defaults
theme_set(theme_minimal())
theme_update(text = element_text(family = "sans", color = "#464a62"))
theme_update(plot.title = element_text(hjust = 0.5, face = "bold"))
theme_update(plot.subtitle = element_text(hjust = 0.5))

Ookla Open Datasets include quarterly performance and test count data for both mobile networks and fixed broadband aggregated over all providers. The tests are binned into global zoom level 16 tiles which can be thought of as roughly a few football fields. As of today, all four quarters of 2020 are available and subsequent quarters will be added as they complete.

Administrative unit data

I chose to analyse the mobile data at the Nomenclature of Territorial Units for Statistics (NUTS) 3 level (1:1 million). These administrative units are maintained by the European Union to allow for comparable analysis across member states. NUTS 3 areas mean:

  • In England, upper tier authorities and groups of unitary authorities and districts
  • In Wales, groups of Principal Areas
  • In Scotland, groups of Council Areas or Islands Areas
  • In Northern Ireland, groups of districts

To make a comparison to the U.S. administrative structure, these can be roughly thought of as the size of counties. Here is the code you’ll want to use to download the NUTS shapefiles from the Eurostat site. Once the zipfile is downloaded you will need to unzip it again in order to read it into your R environment:

# create a directory called “data”
dir.create("data")
use_zip("https://gisco-services.ec.europa.eu/distribution/v2/nuts/download/ref-nuts-2021-01m.shp.zip", destdir = "data")

uk_nuts_3 <- read_sf("data/ref-nuts-2021-01m.shp/NUTS_RG_01M_2021_3857_LEVL_3.shp/NUTS_RG_01M_2021_3857_LEVL_3.shp") %>%
  filter(CNTR_CODE == "UK") %>%
  st_transform(4326) %>%
  clean_names() %>%
  mutate(urbn_desc = case_when( # add more descriptive labels for urban variable
    urbn_type == 1 ~ "Urban",
    urbn_type == 2 ~ "Intermediate",
    urbn_type == 3 ~ "Rural"
  ),
  urbn_desc = factor(urbn_desc, levels = c("Urban", "Intermediate", "Rural")))

# contextual city data
uk_cities <- read_sf("https://opendata.arcgis.com/datasets/6996f03a1b364dbab4008d99380370ed_0.geojson") %>%
  clean_names() %>%
  filter(fips_cntry == "UK", pop_rank <= 5)

ggplot(uk_nuts_3) +
  geom_sf(color = mid_gray, fill = light_gray, lwd = 0.08) +
  geom_text_repel(data = uk_cities, 
                           aes(label = city_name, geometry = geometry), 
                           family = "sans", 
                           color = blue_gray, 
                           size = 2.2, 
                           stat = "sf_coordinates",
                           min.segment.length = 2) +
  labs(title = "United Kingdom",
       subtitle = "NUTS 3 Areas") +
  theme(panel.grid.major = element_blank(),
        panel.grid.minor = element_blank(),
        axis.text = element_blank(),
        axis.title = element_blank())

plot_uk-1-1

Adding data from Ookla Open Datasets

You’ll want to crop the global dataset to the bounding box of the U.K. This will include some extra tiles (within the box but not within the country, i.e. some of western Ireland), but it makes the data much easier to work with later on.

uk_bbox <- uk_nuts_3 %>%
  st_union() %>% # otherwise would be calculating the bounding box of each individual area
  st_bbox()
  

Each of the quarters are stored in separate shapefiles. You can read them in one-by-one and crop them to the U.K. box in the same pipeline.

# download the data with the following code:

use_zip("https://ookla-open-data.s3.amazonaws.com/shapefiles/performance/type=mobile/year=2020/quarter=1/2020-01-01_performance_mobile_tiles.zip", destdir = "data")
use_zip("https://ookla-open-data.s3.amazonaws.com/shapefiles/performance/type=mobile/year=2020/quarter=2/2020-04-01_performance_mobile_tiles.zip", destdir = "data")
use_zip("https://ookla-open-data.s3.amazonaws.com/shapefiles/performance/type=mobile/year=2020/quarter=3/2020-07-01_performance_mobile_tiles.zip", destdir = "data")
use_zip("https://ookla-open-data.s3.amazonaws.com/shapefiles/performance/type=mobile/year=2020/quarter=4/2020-10-01_performance_mobile_tiles.zip", destdir = "data")

# and then read in those downloaded files
mobile_tiles_q1 <- read_sf("data/2020-01-01_performance_mobile_tiles/gps_mobile_tiles.shp") %>%
  st_crop(uk_bbox)
mobile_tiles_q2 <- read_sf("data/2020-04-01_performance_mobile_tiles/gps_mobile_tiles.shp") %>%
  st_crop(uk_bbox)
mobile_tiles_q3 <- read_sf("data/2020-07-01_performance_mobile_tiles/gps_mobile_tiles.shp") %>%
  st_crop(uk_bbox)
mobile_tiles_q4 <- read_sf("data/2020-10-01_performance_mobile_tiles/gps_mobile_tiles.shp") %>%
  st_crop(uk_bbox)

As you see, the tiles cover most of the area, with more tiles in more densely populated areas. (And note that you still have tiles included that are outside the boundary of the area but within the bounding box.)

ggplot(uk_nuts_3) +
  geom_sf(color = mid_gray, fill = light_gray, lwd = 0.08) +
  geom_sf(data = mobile_tiles_q4, fill = purple, color = NA) +
  geom_text_repel(data = uk_cities, 
                           aes(label = city_name, geometry = geometry), 
                           family = "sans", 
                           color = blue_gray, 
                           size = 2.2, 
                           stat = "sf_coordinates",
                           min.segment.length = 2) +
  labs(title = "United Kingdom",
       subtitle = "Ookla® Open Data Mobile Tiles, NUTS 3 Areas") +
  theme(panel.grid.major = element_blank(),
        panel.grid.minor = element_blank(),
        axis.text = element_blank(),
        axis.title = element_blank())

tile_map-1-3

Now that the cropped tiles are read in, you’ll use a spatial join to determine which NUTS 3 area each tile is in. In this step, I am also reprojecting the data to the British National Grid (meters). I’ve also added a variable to identify the time period (quarter).

tiles_q1_nuts <- uk_nuts_3 %>%
  st_transform(27700) %>% # British National Grid
  st_join(mobile_tiles_q1 %>% st_transform(27700), left = FALSE) %>%
  mutate(quarter_start = "2020-01-01")

tiles_q2_nuts <- uk_nuts_3 %>%
  st_transform(27700) %>%
  st_join(mobile_tiles_q2 %>% st_transform(27700), left = FALSE) %>%
  mutate(quarter_start = "2020-04-01")

tiles_q3_nuts <- uk_nuts_3 %>%
  st_transform(27700) %>%
  st_join(mobile_tiles_q3 %>% st_transform(27700), left = FALSE) %>%
  mutate(quarter_start = "2020-07-01")

tiles_q4_nuts <- uk_nuts_3 %>%
  st_transform(27700) %>%
  st_join(mobile_tiles_q4 %>% st_transform(27700), left = FALSE) %>%
  mutate(quarter_start = "2020-10-01")

In order to make the data easier to work with, combine the tiles into a long dataframe with each row representing one tile in one quarter. The geometry now represents the NUTS region, not the original tile shape.

tiles_all <- tiles_q1_nuts %>%
  rbind(tiles_q2_nuts) %>%
  rbind(tiles_q3_nuts) %>%
  rbind(tiles_q4_nuts) %>%
  mutate(quarter_start = ymd(quarter_start)) # convert to date format

With this dataframe, you can start to generate some aggregates. In this table you’ll include the tile count, test count, quarter and average download and upload speeds.

Exploratory data analysis

aggs_quarter <- tiles_all %>%
  st_set_geometry(NULL) %>%
  group_by(quarter_start) %>%
  summarise(tiles = n(),
            avg_d_mbps = weighted.mean(avg_d_kbps / 1000, tests), # I find Mbps easier to work with
            avg_u_mbps = weighted.mean(avg_u_kbps / 1000, tests),
            tests = sum(tests)) %>%
  ungroup()


knitr::kable(aggs_quarter) %>%
  kable_styling()

aggregates_table_kj

We can see from this table that both download and upload speeds increased throughout the year, with a small dip in upload speeds in Q2. Next, you’ll want to plot this data.

ggplot(aggs_quarter, aes(x = quarter_start)) +
  geom_point(aes(y = avg_d_mbps), color = purple) +
  geom_line(aes(y = avg_d_mbps), color = purple, lwd = 0.5) +
  geom_text(aes(y = avg_d_mbps - 2, label = round(avg_d_mbps, 1)), color = purple, size = 3, family = "sans") +
  geom_text(data = NULL, x = ymd("2020-02-01"), y = 47, label = "Download speed", color = purple, size = 3, family = "sans") +
  geom_point(aes(y = avg_u_mbps), color = light_purple) +
  geom_line(aes(y = avg_u_mbps), color = light_purple, lwd = 0.5) +
  geom_text(aes(y = avg_u_mbps - 2, label = round(avg_u_mbps, 1)), color = light_purple, size = 3, family = "sans") +
  geom_text(data = NULL, x = ymd("2020-02-05"), y = 14, label = "Upload speed", color = light_purple, size = 3, family = "sans") +
  labs(y = "", x = "Quarter start date",
       title = "Mobile Network Performance, U.K.",
       subtitle = "Ookla® Open Datasets | 2020") +
  theme(panel.grid.minor = element_blank(),
        panel.grid.major = element_blank(),
        axis.title.x = element_text(hjust=1)) +
  scale_y_continuous(labels = label_number(suffix = " Mbps", scale = 1, accuracy = 1)) +
  scale_x_date(date_labels = "%b %d")

line_up_down-1

Examining test counts

We also saw above that the number of tests decreased between Q1 and Q2 and then peaked in Q3 at a little over 700,000 before coming back down. The increase likely followed resulted from interest in network performance during COVID-19 when more people started working from home. This spike is even more obvious in chart form.

ggplot(aggs_quarter, aes(x = quarter_start)) +
  geom_point(aes(y = tests), color = purple) +
  geom_line(aes(y = tests), color = purple, lwd = 0.5) +
  geom_text(aes(y = tests - 6000, label = comma(tests), x= quarter_start + 5), size = 3, color = purple) +
  labs(y = "", x = "Quarter start date",
       title = "Mobile Test Count, U.K.",
       subtitle = "Ookla® Open Datasets | 2020") +
  theme(panel.grid.minor = element_blank(),
        panel.grid.major = element_blank(),
        axis.title.x = element_text(hjust=1),
        axis.text = element_text(color = blue_gray)) +
  scale_y_continuous(labels = comma) +
  scale_x_date(date_labels = "%b %d")

line_tests-1-1

Data distribution

Next, I wanted to check the distribution of average download speeds.

ggplot(tiles_all) + 
  geom_histogram(aes(x = avg_d_kbps / 1000, group = quarter_start), size = 0.3, color = light_gray, fill = green) + 
  scale_x_continuous(labels = label_number(suffix = " Mbps", accuracy = 1)) +
  scale_y_continuous(labels = comma) +
  facet_grid(quarter_start ~ .) +
  theme(panel.grid.minor = element_blank(), 
        panel.grid.major = element_blank(), 
        axis.title.x = element_text(hjust=1),
        axis.text = element_text(color = blue_gray),
        strip.text.y = element_text(angle = 0, color = blue_gray)) + 
  labs(y = "", x = "", title = "Mobile Download Speed Distribution by Tile, U.K.", 
       subtitle = "Ookla® Open Datasets | 2020")

histogram-1-1

The underlying distribution of average download speeds across the tiles has stayed fairly stable.

Mapping average speed

Making a quick map of the average download speed in each region across the U.K. is relatively simple.

# generate aggregates table
nuts_3_aggs <- tiles_all %>%
  group_by(quarter_start, nuts_id, nuts_name, urbn_desc, urbn_type) %>%
  summarise(tiles = n(),
            avg_d_mbps = weighted.mean(avg_d_kbps / 1000, tests), # I find Mbps easier to work with
            avg_u_mbps = weighted.mean(avg_u_kbps / 1000, tests),
            tests = sum(tests)) %>%
  ungroup()
ggplot(nuts_3_aggs %>% filter(quarter_start == "2020-10-01")) +
  geom_sf(aes(fill = avg_d_mbps), color = blue_gray, lwd = 0.08) +
  scale_fill_stepsn(colors = RColorBrewer::brewer.pal(n = 5, name = "BuPu"), labels = label_number(suffix = " Mbps"), n.breaks = 4, guide = guide_colorsteps(title = "")) +
  theme(panel.grid.minor = element_blank(),
        panel.grid.major = element_blank(),
        axis.title.x = element_text(hjust=1),
        legend.text = element_text(color = blue_gray),
        axis.text = element_blank()) +
  labs(title = "Mobile Download Speed, U.K.", subtitle = "Ookla® Open Datasets | Q4 2020")

choropleth-1-1

As you can see, the areas around large cities have faster download speeds on average and the lowest average download speeds are typically in more rural areas.

Rural and urban analysis

People are often interested in the difference between mobile networks in urban and rural areas. The Eurostat NUTS data includes an urban indicator with three levels: rural, intermediate and urban. This typology is determined primarily by population density and proximity to a population center.

ggplot(uk_nuts_3) +
  geom_sf(aes(fill = urbn_desc), color = light_gray, lwd = 0.08) +
  geom_text_repel(data = uk_cities, 
                           aes(label = city_name, geometry = geometry), 
                           family = "sans", 
                           color = "#1a1b2e", 
                           size = 2.2, 
                           stat = "sf_coordinates",
                           min.segment.length = 2) +
  scale_fill_manual(values = c(purple, light_purple, green), name = "", guide = guide_legend(direction = "horizontal", label.position = "top", keywidth = 3, keyheight = 0.5)) +
  labs(title = "U.K., NUTS 3 Areas") +
  theme(panel.grid.major = element_blank(),
        panel.grid.minor = element_blank(),
        axis.text = element_blank(),
        axis.title = element_blank(),
        legend.position = "top")

rural_urban_reference-1

Data distribution overall and over time

When you aggregate by the urban indicator variable different patterns come up in the data.

# generate aggregates table
rural_urban_aggs <- tiles_all %>%
  st_set_geometry(NULL) %>%
  group_by(quarter_start, urbn_desc, urbn_type) %>%
  summarise(tiles = n(),
            avg_d_mbps = weighted.mean(avg_d_kbps / 1000, tests), # I find Mbps easier to work with
            avg_u_mbps = weighted.mean(avg_u_kbps / 1000, tests),
            tests = sum(tests)) %>%
  ungroup()

As you might expect, the download speeds during Q4 are faster in urban areas than in rural areas – with the intermediate ones somewhere in between. This pattern holds for other quarters as well.

ggplot(rural_urban_aggs %>% filter(quarter_start == "2020-10-01"), aes(x = avg_d_mbps, y = urbn_desc, fill = urbn_desc)) +
  geom_col(width = .3, show.legend = FALSE) +
  geom_jitter(data = nuts_3_aggs, aes(x = avg_d_mbps, y = urbn_desc, color = urbn_desc), size = 0.7) + 
  geom_text(aes(x = avg_d_mbps - 4, label = round(avg_d_mbps, 1)), family = "sans",  size = 3.5, color = blue_gray) +
  scale_fill_manual(values = c(purple, light_purple, green)) +
  scale_color_manual(values = darken(c(purple, light_purple, green))) +
  scale_x_continuous(labels = label_number(suffix = " Mbps", scale = 1, accuracy = 1)) +
  theme(panel.grid.minor = element_blank(),
        panel.grid.major = element_blank(),
        axis.title.x = element_text(hjust=1),
        legend.position = "none",
        axis.text = element_text(color = blue_gray)) +
  labs(y = "", x = "", 
       title = "Mobile Download Speed Distribution by NUTS 3 Area, U.K.", 
       subtitle = "Ookla® Open Datasets | 2020")  

rural_urban_bar-1-2
Interestingly though, the patterns differ when you look at a time series plot. Urban mobile networks steadily improve, while the intermediate and rural areas saw slower average download speeds starting in Q2 before going back up after Q3. This is likely the result of increased pressure on the networks during stay-at-home orders (although this graph is not conclusive evidence of that).

ggplot(rural_urban_aggs) +
  geom_line(aes(x = quarter_start, y = avg_d_mbps, color = urbn_desc)) +
  geom_point(aes(x = quarter_start, y = avg_d_mbps, color = urbn_desc)) +
  # urban label
  geom_text(data = NULL, x = ymd("2020-02-01"), y = 50, label = "Urban", color = purple, family = "sans", size = 3) +
  # intermediate label
  geom_text(data = NULL, x = ymd("2020-02-15"), y = 35, label = "Intermediate", color = light_purple, family = "sans", size = 3) +
  # rural label
  geom_text(data = NULL, x = ymd("2020-01-15"), y = 26, label = "Rural", color = green, family = "sans", size = 3) +
  scale_color_manual(values = c(purple, light_purple, green)) +
  scale_x_date(date_labels = "%b %d") +
  scale_y_continuous(labels = label_number(suffix = " Mbps", scale = 1, accuracy = 1)) +
  theme(panel.grid.minor = element_blank(),
        panel.grid.major = element_blank(),
        axis.title.x = element_text(hjust=1),
        legend.position = "none",
        axis.text = element_text(color = blue_gray)) +
  labs(y = "", x = "Quarter start date", 
       title = "Mobile Download Speed by NUTS 3 Urban-Rural Type, U.K.", 
       subtitle = "Ookla® Open Datasets | 2020") 

rural_urban_line-1-1

When you repeat the same plot but map the test count to the site of the point, you can see why the overall download speed increased steadily. The number of tests in urban areas is much higher than in intermediate and rural areas, thus pulling up the overall average.

ggplot(rural_urban_aggs) +
  geom_line(aes(x = quarter_start, y = avg_d_mbps, color = urbn_desc)) +
  geom_point(aes(x = quarter_start, y = avg_d_mbps, color = urbn_desc, size = tests)) +
  # urban label
  geom_text(data = NULL, x = ymd("2020-02-01"), y = 50, label = "Urban", color = purple, family = "sans", size = 3) +
  # intermediate label
  geom_text(data = NULL, x = ymd("2020-02-15"), y = 35, label = "Intermediate", color = light_purple, family = "sans", size = 3) +
  # rural label
  geom_text(data = NULL, x = ymd("2020-01-15"), y = 26, label = "Rural", color = green, family = "sans", size = 3) +
  scale_color_manual(values = c(purple, light_purple, green)) +
  scale_x_date(date_labels = "%b %d") +
  scale_y_continuous(labels = label_number(suffix = " Mbps", scale = 1, accuracy = 1)) +
  theme(panel.grid.minor = element_blank(),
        panel.grid.major = element_blank(),
        axis.title.x = element_text(hjust=1),
        legend.position = "none",
        axis.text = element_text(color = blue_gray)) +
  labs(y = "", x = "Quarter start date", 
       title = ("Mobile Download Speed by NUTS 3 Urban-Rural Type, U.K."), 
       subtitle = "Ookla® Open Datasets | 2020",
       caption = "Circle size indicates test count")  

rural_urban_line_size-1-1

Spotlighting regional variances

Parsing the data by specific geographies can reveal additional information.

bottom_20_q4 <- nuts_3_aggs %>% 
  filter(quarter_start == "2020-10-01") %>% 
  top_n(n = -20, wt = avg_d_mbps) %>%
  mutate(nuts_name = fct_reorder(factor(nuts_name), -avg_d_mbps))
map <- ggplot() +
  geom_sf(data = uk_nuts_3, fill = light_gray, color = mid_gray, lwd = 0.08) +
  geom_sf(data = bottom_20_q4, aes(fill = urbn_desc), color = mid_gray, lwd = 0.08, show.legend = FALSE) +
  geom_text_repel(data = uk_cities, 
                           aes(label = city_name, geometry = geometry), 
                           family = "sans", 
                           color = blue_gray, 
                           size = 2.2, 
                           stat = "sf_coordinates",
                           min.segment.length = 2) +
  scale_fill_manual(values = c(purple, light_purple, green), name = "", guide = guide_legend(direction = "horizontal", label.position = "top", keywidth = 3, keyheight = 0.5)) +
  labs(title = NULL,
       subtitle = NULL) +
  theme(panel.grid.major = element_blank(),
        panel.grid.minor = element_blank(),
        axis.text = element_blank(),
        axis.title = element_blank(),
        legend.position = "top")
barplot <- ggplot(data = bottom_20_q4, aes(x = avg_d_mbps, y = nuts_name, fill = urbn_desc)) +
  geom_col(width = .5) +
  scale_fill_manual(values = c(purple, light_purple, green), guide = guide_legend(direction = "horizontal", label.position = "top", keywidth = 3, keyheight = 0.5, title = NULL)) +
  scale_x_continuous(labels = label_number(suffix = " Mbps", scale = 1, accuracy = 1)) +
  theme(panel.grid.minor = element_blank(),
        panel.grid.major = element_blank(),
        axis.title.x = element_text(hjust=1),
        legend.position = "top",
        axis.text = element_text(color = blue_gray)) +
  labs(y = "", x = "", 
       title = ("Slowest 20 NUTS 3 Areas by Download Speed, U.K."), 
       subtitle = "Ookla® Open Datasets | Q4 2020") 
# use patchwork to put it all together
barplot + map

bottom_20-1-2
Among the 20 areas with the lowest average download speed in Q4 2020 there were three urban areas and six intermediate. The rest were rural.

top_20_q4 <- nuts_3_aggs %>% 
  filter(quarter_start == "2020-10-01") %>% 
  top_n(n = 20, wt = avg_d_mbps) %>%
  mutate(nuts_name = fct_reorder(factor(nuts_name), avg_d_mbps))
top_map <- ggplot() +
  geom_sf(data = uk_nuts_3, fill = light_gray, color = mid_gray, lwd = 0.08) +
  geom_sf(data = top_20_q4, aes(fill = urbn_desc), color = mid_gray, lwd = 0.08, show.legend = FALSE) +
  geom_text_repel(data = uk_cities, 
                           aes(label = city_name, geometry = geometry), 
                           family = "sans", 
                           color = blue_gray, 
                           size = 2.2, 
                           stat = "sf_coordinates",
                           min.segment.length = 2) +
  scale_fill_manual(values = c(purple, light_purple, green), name = "", guide = guide_legend(direction = "horizontal", label.position = "top", keywidth = 3, keyheight = 0.5)) +
  labs(title = NULL,
       subtitle = NULL) +
  theme(panel.grid.major = element_blank(),
        panel.grid.minor = element_blank(),
        axis.text = element_blank(),
        axis.title = element_blank(),
        legend.position = "top")
top_barplot <- ggplot(data = top_20_q4, aes(x = avg_d_mbps, y = nuts_name, fill = urbn_desc)) +
  geom_col(width = .5) +
  scale_fill_manual(values = c(purple, light_purple, green), guide = guide_legend(direction = "horizontal", label.position = "top", keywidth = 3, keyheight = 0.5, title = NULL)) +
  scale_x_continuous(labels = label_number(suffix = " Mbps", scale = 1, accuracy = 1), breaks = c(50, 100)) +
  theme(panel.grid.minor = element_blank(),
        panel.grid.major = element_blank(),
        axis.title.x = element_text(hjust=1),
        legend.position = "top",
        axis.text = element_text(color = blue_gray)) +
  labs(y = "", x = "", 
       title = "Fastest 20 NUTS 3 Areas by Mobile Download Speed, U.K.", 
       subtitle = "Ookla® Open Datasets | Q4 2020") 
top_london <- ggplot() +
  geom_sf(data = uk_nuts_3 %>% filter(str_detect(fid, "UKI")), fill = light_gray, color = mid_gray, lwd = 0.08) +
  geom_sf(data = top_20_q4 %>% filter(str_detect(nuts_id, "UKI")), aes(fill = urbn_desc), color = mid_gray, lwd = 0.08, show.legend = FALSE) +
  geom_text_repel(data = uk_cities %>% filter(city_name == "London"), 
                           aes(label = city_name, geometry = geometry), 
                           family = "sans", 
                           color = "black", 
                           size = 2.2, 
                           stat = "sf_coordinates",
                           min.segment.length = 2) +
  scale_fill_manual(values = c(purple, light_purple, green), name = "", guide = guide_legend(direction = "horizontal", label.position = "top", keywidth = 3, keyheight = 0.5)) +
  labs(title = NULL,
       subtitle = NULL) +
  theme(panel.grid.major = element_blank(),
        panel.grid.minor = element_blank(),
        axis.text = element_blank(),
        axis.title = element_blank(),
        legend.position = "top",
        panel.border = element_rect(colour = blue_gray, fill=NA, size=0.5))
top_map_comp <- top_map + inset_element(top_london, left = 0.6, bottom = 0.6, right = 1, top = 1)

top_barplot + top_map_comp

top_20-1-1
Meanwhile, all of the fastest 20 NUTS 3 areas were urban.

What else you can do with this data

Don’t forget there are also more tutorials with examples written in Python and R. Aside from what I showed here, you could do an interesting analysis looking at clustering patterns, sociodemographic variables and other types of administrative units like legislative or school districts.

We hope this tutorial will help you use Ookla’s open data for your own projects. Please tag us if you share your projects on social media using the hashtag #OoklaForGood so we can learn from your analyses.

Ookla retains ownership of this article including all of the intellectual property rights, data, content graphs and analysis. This article may not be quoted, reproduced, distributed or published for any commercial purpose without prior consent. Members of the press and others using the findings in this article for non-commercial purposes are welcome to publicly share and link to report information with attribution to Ookla.

| September 5, 2023

College Towns Where Mobile Gaming Makes the Grade (And Where it Fails)

August means back to school in the northern hemisphere and students across the United States are settling into carefully chosen schools, ready to embark on new adventures. While they may have chosen those schools based on academics, athletics, and even location, there may be a hidden benefit for some students: great mobile gaming. We analyzed Speedtest Intelligence® from 100 college towns across the U.S. with a large percentage of students where college is a major part of the industry to look for the kind of mobile performance that lends itself to a strong mobile gaming experience. We also took a sidebar look at 10 schools that are known for their varsity esports programs to see how they stack up.

Introducing Game Score

We know what online gamers care most about: low “ping” in competitive games, voice chat quality and stability, quickly downloading new games and patches, live streaming, and cloud gaming. We developed Game Score to provide insight into the metrics that matter most to that game experience: download speed, upload speed, and latency and jitter measurements taken to real-world game servers. Game Score includes calculations on median performance as well as 10th and 90th percentile performance to provide a trustworthy assessment of expected network performance.

College towns with the best (and worst) mobile gaming experience

Speedtest Intelligence data from Q2 2023 reveals that three states: Maryland, Michigan, and California contain most of the top 10 college towns from our list for mobile Game Score on all cellular technologies for all providers combined.

Mobile Game Score in Select U.S. College Towns
Speedtest Intelligence® | Q2 2023
A map of the United States with map markers over select college towns. Hovering over a map marker reveals the name of the town and its Mobile Game Score.

Top college towns for mobile gaming

Students living in College Park, Maryland; Annapolis, Maryland; East Lansing, Michigan; Berkeley, California; and Ann Arbor, Michigan can expect top mobile gaming performance, though all the towns on this list do very well. Dover represented for Delaware, State College for Pennsylvania, and Providence for Rhode Island. Madison, New Jersey very narrowly missed out on the top 10. Click the map above for performance information in each town.

These would all be good towns to try your skill at MOBAs like League of Legends, real-time strategy games like StarCraft II, or Battle Royales like Call of Duty: Warzone or Fall Guys where the game mechanics typically rely on real-time communication or reaction. Who knows, your new virtual friends and rivals could be the start of your new IRL community.

College towns where mobile game performance lags

The 10 college towns with the lowest game scores based on Speedtest® data from Q2 2023 are more geographically distributed than the top 10. Socorro, New Mexico had the lowest Game Score on this list, followed by Anchorage, Alaska; Bozeman, Montana; Starkville, Mississippi; and Hanover, New Hampshire. Missoula, Montana; Fayetteville, Arkansas, Bowling Green, Kentucky; Middlebury, Vermont; and College Station, Texas rounded out the bottom 10. These college towns might be better suited for games where players try to best themselves, like practicing math with Sudoku or brushing up on adulting with a game like Florence.

Mobile gaming in places with top varsity esports programs

We took a close look at mobile Game Score in Q2 2023 for 10 locations that are home to colleges with some of the top varsity esports programs.

Mobile Game Score in Select Varsity Esports Locations
Speedtest Intelligence® | Q2 2023
A map of the United States with map markers over select college towns. Hovering over a map marker reveals the name of the town and its Mobile Game Score.

Berkeley, California, home to UC Berkeley, had the highest Game Score on this list. It was also the only location that made both the “college towns” and “varsity esports” lists, with most of these places primarily known for more than their universities. Irvine, California, second on this list, is home to UC Irvine. Dallas, Texas, home of UT Dallas, may have room to complain to the administration about their mobile performance as they had the lowest Game Score on this list. Akron, Ohio (University of Akron); St. Louis, Missouri (Maryville University); and Oxford, Ohio (Miami University) followed closely.

Most notable for the competitive nature of esports is the range of performance here, with nine of these varsity esports university towns showing mobile game scores that would not qualify them for the top 10 in the U.S. overall.

We’re excited for your feedback on mobile gaming where you’re at, so please take a Speedtest on Android or iOS then send your thoughts and results to us via Twitter or Facebook. We’re also interested in your suggestions for what locations to cover next year. You can also check month-by-month performance for your town and compare expected speeds for internet providers in the Speedtest Performance Directory, and if you’re struggling to connect to an online game at all, check out Downdetector® for details on service outages.

If you’re a network operator interested in Game Score performance on your network, contact us.

Ookla retains ownership of this article including all of the intellectual property rights, data, content graphs and analysis. This article may not be quoted, reproduced, distributed or published for any commercial purpose without prior consent. Members of the press and others using the findings in this article for non-commercial purposes are welcome to publicly share and link to report information with attribution to Ookla.