| August 21, 2019

Examining Vodafone Idea Performance One Year After the Merger

When Vodafone India merged with Idea Cellular, the company promised a better network and new technology that would result in improved performance. So has it? We analyzed Speedtest IntelligenceTM data from August 2018 – July 2019 to find out. Because Vodafone and Idea still maintain separate brands, we’ve considered their data separately, but the trends in their performance are similar.

How mobile speeds have changed in India

vodafone-graph-1

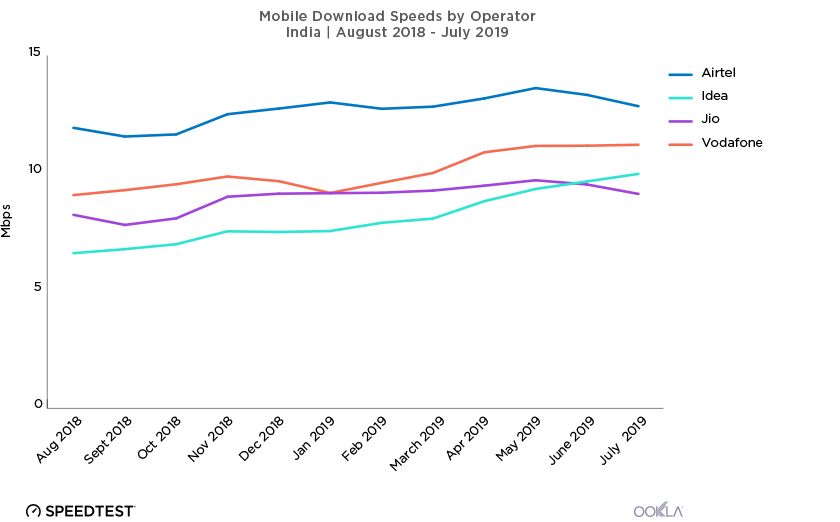
Speedtest results show that mobile download speeds in India improved on average for all the top mobile operators over the period of August 2018 – July 2019, with Airtel holding onto the title of fastest operator throughout these 12 months.

However, a month-by-month view reveals a more interesting story. After May 2019, mean mobile download speeds for both Airtel and Jio started a decline that continued through July 2019. Meanwhile, Vodafone saw a decline in mean mobile speed from November 2018 through January 2019, after which they recovered to significantly increase download speed to effect a year-over-year improvement of 23.6%. Mobile download speeds on Idea improved in every month except December 2018, for a year-over-year improvement of 51.2%. In comparison, Airtel’s download speed increased 7.7% during the same period and Jio’s download speed went up 10.8%.

Operators meeting the Acceptable Speed Ratio

vodafone-graph-2

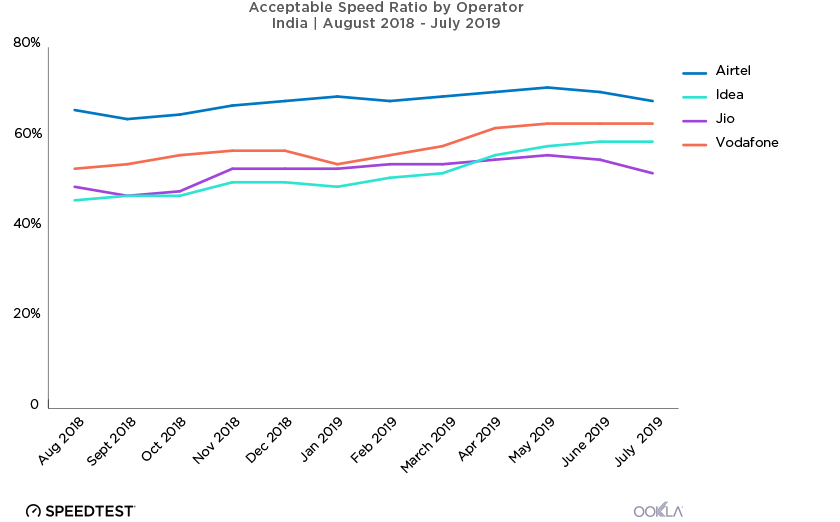
One measure of a mobile operator’s performance is how consistently they provide speeds at or above 5 Mbps, which is fast enough for consumers to reliably use mobile devices to stream HD video. We call this the Acceptable Speed Ratio (ASR).

Looking at mobile performance in India over the past year, Airtel had the highest ASR in every single month, with an ASR for the year of 70.4%. Despite a dip in January, Vodafone had the second highest ASR throughout the year with an average ASR of 60.3%. Jio held third place for ASR until April 2019, when they were overtaken by a steadily improving Idea. On average, though, Jio ranked third for ASR for the year at 54.5% while Idea’s ASR for the year was 52.5%.

How mobile and fixed broadband speeds compare in India

vodafone-graph-3

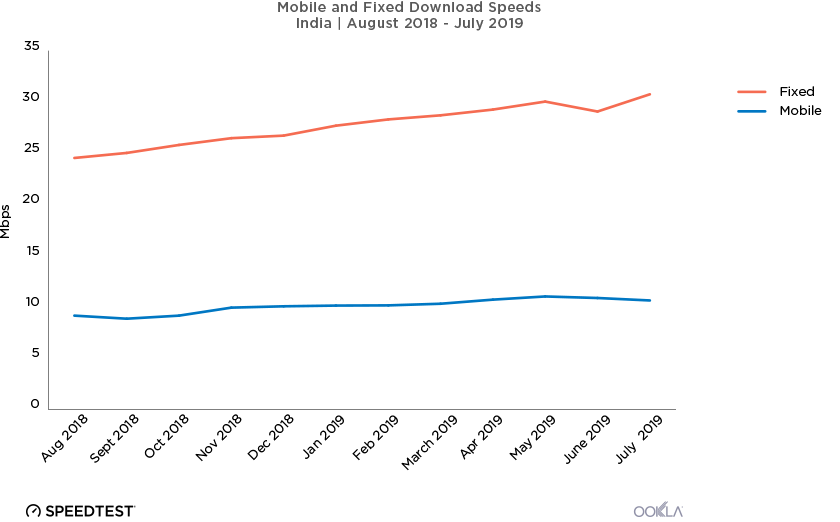
Looking at India as a whole, mean mobile download speed increased 16.2% in India last year. While this percentage alone may appear strong, it represents an improvement of less than 1.5 Mbps over 12 months. Also worrying, the country’s average mobile download speed declined after May 2019. 5G can’t come soon enough.

Meanwhile, India’s download speed over fixed broadband achieved a 25.3% increase during the past 12 months, a 6.21 Mbps improvement. Jio saw the largest increase in mean download speed over fixed broadband among top providers during the past 12 months with a 120.1% increase. BSNL increased 74.2%, GTPL 32.1%, Airtel 23.8%, YOU Broadband 13.9%, and ACT 12.0%. Hathway’s mean download speed over fixed broadband fell 0.2%. ACT was the fastest provider for each of the 12 months we examined.

India’s global ranking for mobile speeds is falling

vodafone-graph-4

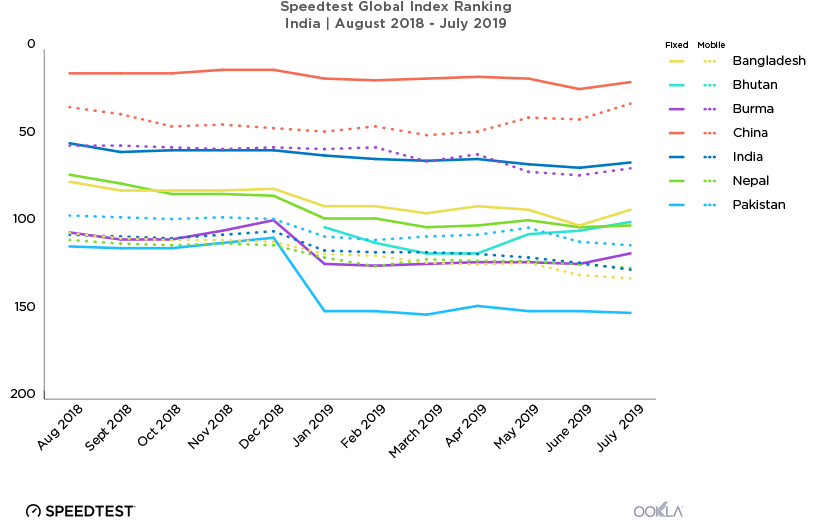
Looking at the Speedtest Global IndexTM, India ranks poorly for mobile download speed when compared with neighboring countries and fell further behind throughout the past year. India ranked better for fixed broadband when compared to neighboring countries, though that rank, too, has slipped over the past 12 months. We’ll be interested to see if Jio’s plan to launch fiber-to-the-home (FTTH) in September improves the national average speed for fixed broadband.

Based on mobile download speed and ASR, Vodafone Idea customers are definitely benefitting from last year’s merger. Which is good, because the increase in mobile download speeds in India as a whole was nominal and not keeping pace with the rise in download speed over fixed broadband. Worse, India’s mobile download speed is not keeping up with a general global improvement. We hope continued investments by mobile operators will turn mobile speeds around even before 5G finally launches in India. We’ll continue to watch for increases in performance and to see how the coming FTTH expansion affects India’s fixed broadband speeds.

Ookla retains ownership of this article including all of the intellectual property rights, data, content graphs and analysis. This article may not be quoted, reproduced, distributed or published for any commercial purpose without prior consent. Members of the press and others using the findings in this article for non-commercial purposes are welcome to publicly share and link to report information with attribution to Ookla.

| July 24, 2019

Touring Mobile Performance with the Speedtest Global Index

Lire en français

At Ookla we celebrate speed and the individuals and companies that dedicate their lives to being the fastest at whatever they do. That’s why this month’s big race in France is so exciting. To cheer all the worn out tires that go into making a great event, we compared the mobile performance of cyclists’ home countries using the Speedtest Global IndexTM. We also looked at download speed in the race’s start and stop cities to see which has the best internet speed advantage.

Which countries’ mobile speeds are breaking away from the main group

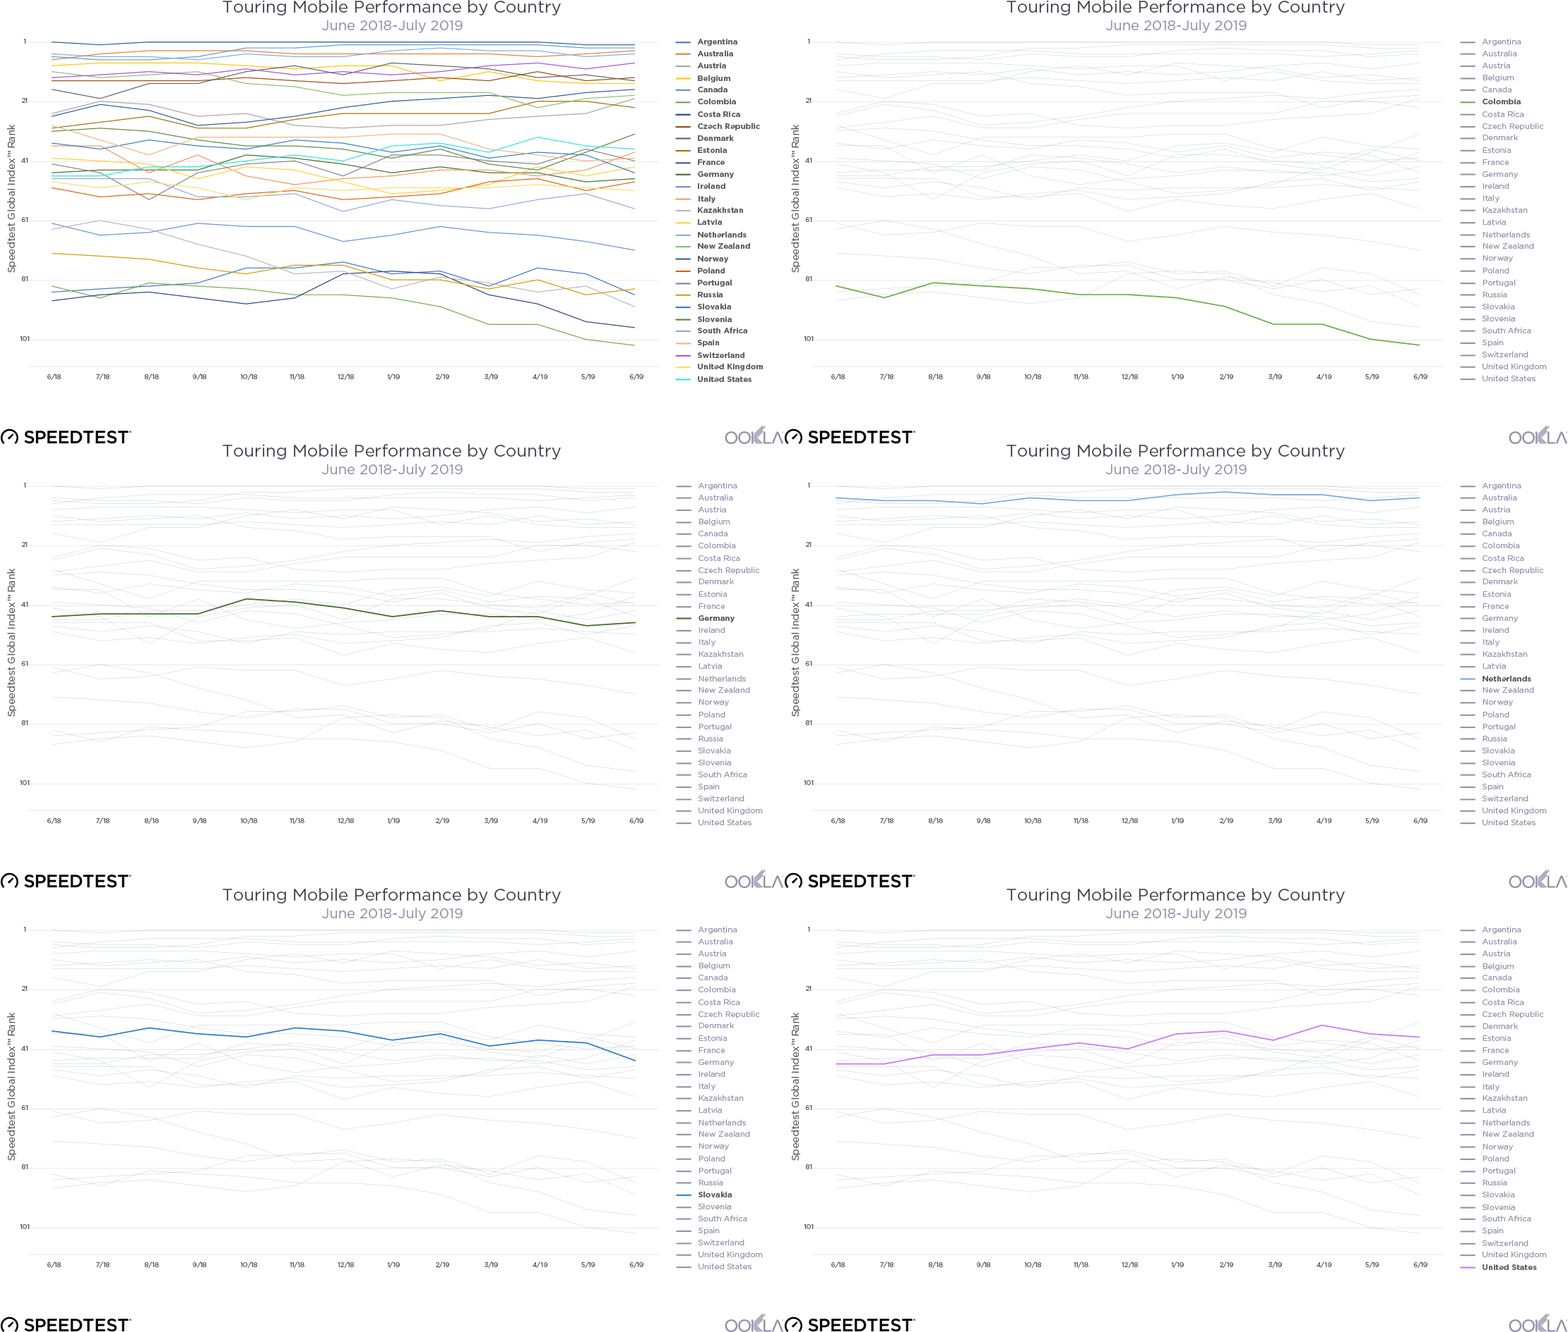
The Speedtest Global Index ranks countries based on their download speeds over mobile and fixed broadband. To honor the big race, we narrowed that field to just the countries competing this year and looked at their mobile performance over the past 12 months. We had to leave Eritrea off the list as there were not sufficient samples in the country during the time period to qualify for the Speedtest Global Index.

mobile-performance-chart-final

Mobile speeds in Norway have exploded to the point that they’ve led the pack every single month for the past year. Even when Norway slipped to second in the world for mobile, behind South Korea, they still led all the countries currently touring. Canada’s mobile speeds started strong and rallied to surpass Australia and the Netherlands. These four countries were up in front of the pack for the entire year.

Up next in the chasing group, there was a lot more movement. France started a long climb in September 2018 that took them from 29th in the world for mobile download speed to 17th. This also helped France pass New Zealand and Austria. Belgium started strong but then they fell back in the bunch. The Czech Republic regrouped slightly in April to improve their ranking to a career high of 11, but recently they’ve fallen back to just above where they ranked 12 months ago.

All the way back in the broom wagon, Colombia fell behind early and couldn’t find their second wind. Costa Rica’s decline started later but still left them in second to last place.

Mobile performance in Tour cities

Cyclists and fans are visiting many different cities for the different stages of the race. We compared mean download speeds over mobile in some of the start and stop cities during Q2 2019 to see which were in front and which were chasing. Note that according to the Ookla 5G MapTM, no cities in France or Belgium have commercially-available 5G as of this writing.

Mobile Performance in Tour Start and Stop Cities
Speedtest Data | Q2 2019
City Mean Download (Mbps) Mean Upload (Mbps)
Saint-Étienne, France 60.99 13.08
Reims, France 59.05 13.95
Nancy, France 58.48 14.66
Mulhouse, France 57.60 13.57
Toulouse, France 55.31 12.68
Belfort, France 53.46 13.19
Tarbes, France 53.26 12.92
Pau, France 52.27 13.14
Nîmes, France 51.10 12.84
Rambouillet, France 51.09 12.13
Colmar, France 50.52 13.97
Mâcon, France 48.57 14.42
Paris, France 46.76 11.18
Brussels, Belgium 45.81 16.56
Albi, France 44.49 12.22
Chalon-sur-Saône, France 42.99 12.89
Saint-Dié-des-Vosges, France 35.44 11.93
Gap, France 27.77 8.24

Saint-Étienne led a tight pack that included Reims, Nancy and Mulhouse which all showed mobile download speeds above 57 Mbps. Toulouse, Belfort, Tarbes, Pau, Nîmes, Rambouillet and Colmar were chasing with mobile download speeds between 50 and 56 Mbps.

We hope that last-place Gap and second-to-last Saint-Dié-des-Vosges were regrouping rather than taking a rest day as they showed mobile download speeds that were significantly slower than the rest of the cities.

Not all locations had sufficient samples to be included in our list, so if you want to know what mobile speeds are like at the Pont du Gard (or anywhere else), take a Speedtest on Android or iOS.

Chapeau to all the teams! May the rest of the race feel flat and fast.


Embarquez pour le tour des performances mobiles avec le Speedtest Global Index

Chez Ookla, nous vouons une véritable passion à la vitesse. Et alors que la Grande Boucle bat son plein en France, nous comptons bien la célébrer comme il se doit ! En parallèle de la lutte acharnée que se livrent les valeureuses équipes, nous avons comparé les performances mobiles des pays d’origine des coureurs en utilisant le Speedtest Global IndexTM. Nous avons également mesuré la vitesse de téléchargement dans les villes-étapes pour découvrir laquelle peut se vanter de disposer du meilleur débit Internet.

Performances mobiles : quels pays s’échappent du peloton ?

Le Speedtest Global Index classe les pays en fonction de leur vitesse de téléchargement haut débit mobile et fixe. Pour rendre hommage au Tour, nous avons uniquement examiné les performances mobiles des pays en lice au cours des douze derniers mois. L’Érythrée n’est malheureusement pas au rendez-vous en raison d’un nombre d’échantillons de données insuffisant.

mobile-performance-chart-final

Grâce à une vitesse de téléchargement mobile ultrarapide, la Norvège a trusté la première place du classement tout au long de l’année. Si le pays a rétrogradé à la deuxième place mondiale juste derrière la Corée du Sud, il a littéralement survolé les débats dans le cadre de notre compétition. De son côté, le Canada a démarré fort, en parvenant même à dépasser l’Australie et les Pays-Bas. Ces quatre pays ont réussi une formidable échappée tout au long de l’année.

Derrière, le groupe de poursuivants s’est organisé pour réduire l’écart. Grâce à une folle remontée en septembre 2018, la France est passée de la 29e à la 17e place mondiale, coiffant au poteau la Nouvelle-Zélande et l’Autriche. Après un très bon départ, la Belgique s’est malheureusement retrouvée engluée dans le peloton. La République Tchèque a mis un petit coup d’accélérateur en avril pour atteindre la 11e place (une première !). Elle a ensuite connu une baisse de régime qui l’a vu terminer juste au-dessus de son classement de l’année dernière.

En queue de peloton, la Colombie a rapidement été distancée et n’est jamais parvenue à trouver un second souffle. Malgré ses bonnes intentions, le Costa Rica a quant à lui fini avant-dernier.

Performances mobiles dans les villes-étapes

Les coureurs et les fans visitent de nombreuses villes lors des différentes étapes du Tour. Nous avons comparé les vitesses moyennes de téléchargement mobile dans certaines de ces villes au cours du deuxième trimestre 2019 afin d’établir un classement. Notez que selon l’Ookla 5G MapTM, aucune ville de France ou de Belgique ne propose actuellement la 5G.

Performances mobiles dans les villes-étapes
Données Speedtest Data | Deuxième trimestre 2019
Ville Débit descendant moyen (Mbps) Débit ascendant moyen (Mbps)
Saint-Étienne, France 60,99 13,08
Reims, France 59,05 13,95
Nancy, France 58,48 14,66
Mulhouse, France 57,60 13,57
Toulouse, France 55,31 12,68
Belfort, France 53,46 13,19
Tarbes, France 53,26 12,92
Pau, France 52,27 13,14
Nîmes, France 51,10 12,84
Rambouillet, France 51,09 12,13
Colmar, France 50,52 13,97
Mâcon, France 48,57 14,42
Paris, France 46,76 11,18
Bruxelles, Belgique 45,81 16,56
Albi, France 44,49 12,22
Chalon-sur-Saône, France 42,99 12,89
Saint-Dié-des-Vosges, France 35,44 11,93
Gap, France 27,77 8,24

Au coude-à-coude avec Reims, Nancy et Mulhouse, Saint-Étienne s’est imposée dans un groupe relevé affichant une vitesse de téléchargement mobile supérieure à 57 Mbps. Dans son sillage, Toulouse, Belfort, Tarbes, Pau, Nîmes, Rambouillet et Colmar ont fait bonne figure avec une vitesse comprise entre 50 et 56 Mps.

Gap et Saint-Dié-des-Vosges, respectivement dernier et avant-dernier, n’ont jamais semblé pouvoir suivre le rythme du peloton, avec une vitesse bien inférieure à celle des autres villes.

Faute d’un nombre d’échantillons de données suffisant, cette liste n’est pas exhaustive. Si vous souhaitez connaître la vitesse de téléchargement mobile de Pont du Gard ou de toute autre ville, effectuez un Speedtest sur Android ou iOS.

Un grand bravo à toutes les équipes ! Nous vous souhaitons bonne chance pour le reste de la course !

Ookla retains ownership of this article including all of the intellectual property rights, data, content graphs and analysis. This article may not be quoted, reproduced, distributed or published for any commercial purpose without prior consent. Members of the press and others using the findings in this article for non-commercial purposes are welcome to publicly share and link to report information with attribution to Ookla.

| June 20, 2019

The Guide to Speedtest Metrics

Editor’s note: A new, updated version of this article is here.

At Ookla we are always researching new and better metrics to describe internet performance and coverage. Today we’re offering an in-depth look at the definitions of our current metrics and how they can help you better understand your network. We’ll also discuss how this affects our upcoming U.S. Mobile Market Report.

Here are some quick links if you want to skip ahead:

Internet performance metrics for mobile and fixed broadband

Speed Score

Speed is an important measure of an internet connection. We created Speed Score to fully account for the range of speeds a provider offers in a single metric. This makes it easier to compare mobile operators and ISPs on several measures of speed using one metric.

Speed Score incorporates a measure of each provider’s download and upload speed to rank network speed performance (90% of the final Speed Score is attributed to download speed and the remaining 10% to upload speed because online experiences are typically more affected by download speed). Speed Score uses a modified trimean to take speeds from the 10th percentile, 50th percentile (also known as the median), and 90th percentile, and combine them in a weighted average using a 1:2:1 ratio, respectively. We place the most emphasis on the median speeds as those represent what most network providers’ customers will experience on a day-to-day basis.

Competitive Geography

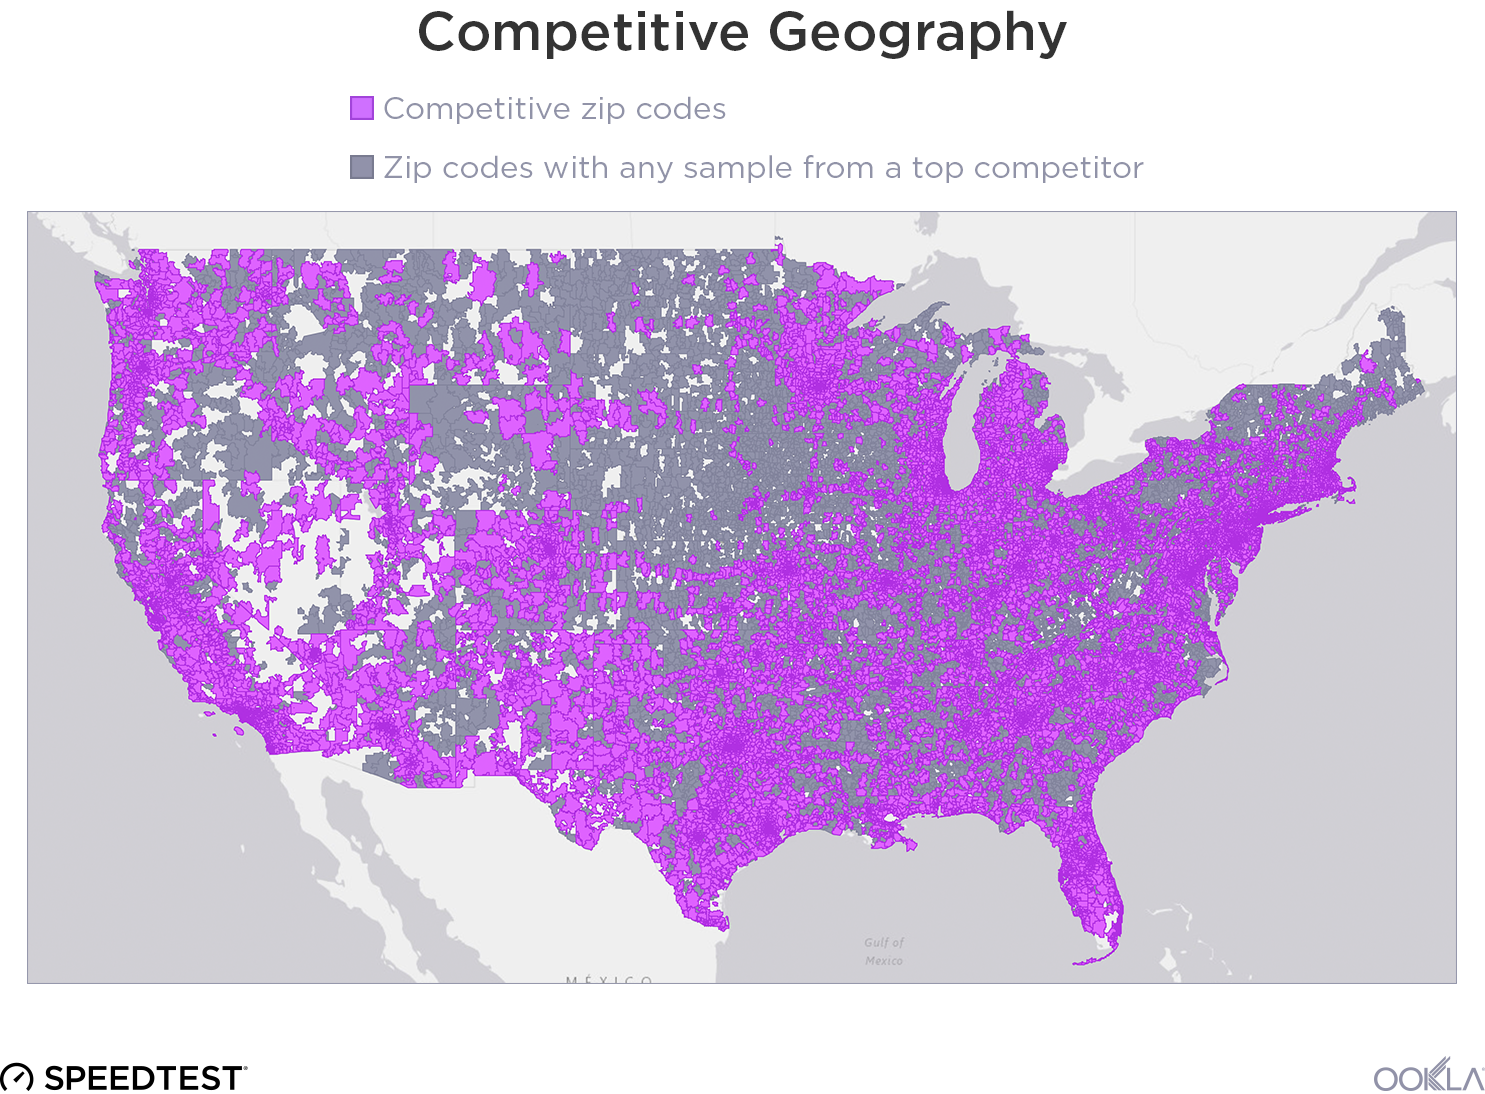
Not all providers serve the same geographic area. Some focus their efforts more in urban areas, where economies of scale make fast speeds easier and cheaper to provide. Others also serve vast rural areas, where it’s more difficult and expensive to provide fast speeds. We’re introducing a new Competitive Geography filter to ensure a balanced comparison of national wireless operators by eliminating geographic outliers. We will be using Competitive Geography for the first time in the 2019 Speedtest U.S. Mobile Market Report by Ookla.

To meet the definition of “competitive” in the U.S., a zip code must contain samples from at least three top national competitors (those who have at least 3% of market share at a national level), but no competitor can have more than 2/3 of the samples in that zip code. Operators are considered present in a zip code if they have at least 3% of the samples in the area and show samples on multiple devices. Limiting any operator from having more than 2/3 of samples ensures actual competition in a zip code rather than including areas where one competitor dominates the market.

competitive-geography-map-6

Acceptable Speed Ratio

While we think fast speeds are paramount, ensuring a minimum acceptable experience is also a worthy measure of a network’s quality. The Acceptable Speed Ratio (ASR) measures what percent of each provider’s download data samples are HD-capable (equaling or exceeding 5 Mbps) on mobile or 4K-capable (equaling or exceeding 25 Mbps) on fixed broadband. The higher a provider’s ASR, the more likely a subscriber will consistently enjoy acceptable internet speeds.

Mean (or average)

We use “mean” and “average” interchangeably unless specifically stated otherwise.

Coverage metrics for mobile broadband

Fast speeds only matter if you actually have coverage. Ookla collects hundreds of millions of coverage scans daily from Android Speedtest users from around the world. An operator’s geographic coverage is determined using a sample of scans received from devices on that operator’s network in each 100 m2 area. Because coverage is a spatially-focused metric, only scans with precise and legitimate location information are included as we build samples that normalize data by user, operator, location and timeframe.

Coverage and availability metrics require that scans have been received from multiple devices in each area represented. For more information on our sampling and aggregation methodologies, read this article.

Coverage Score

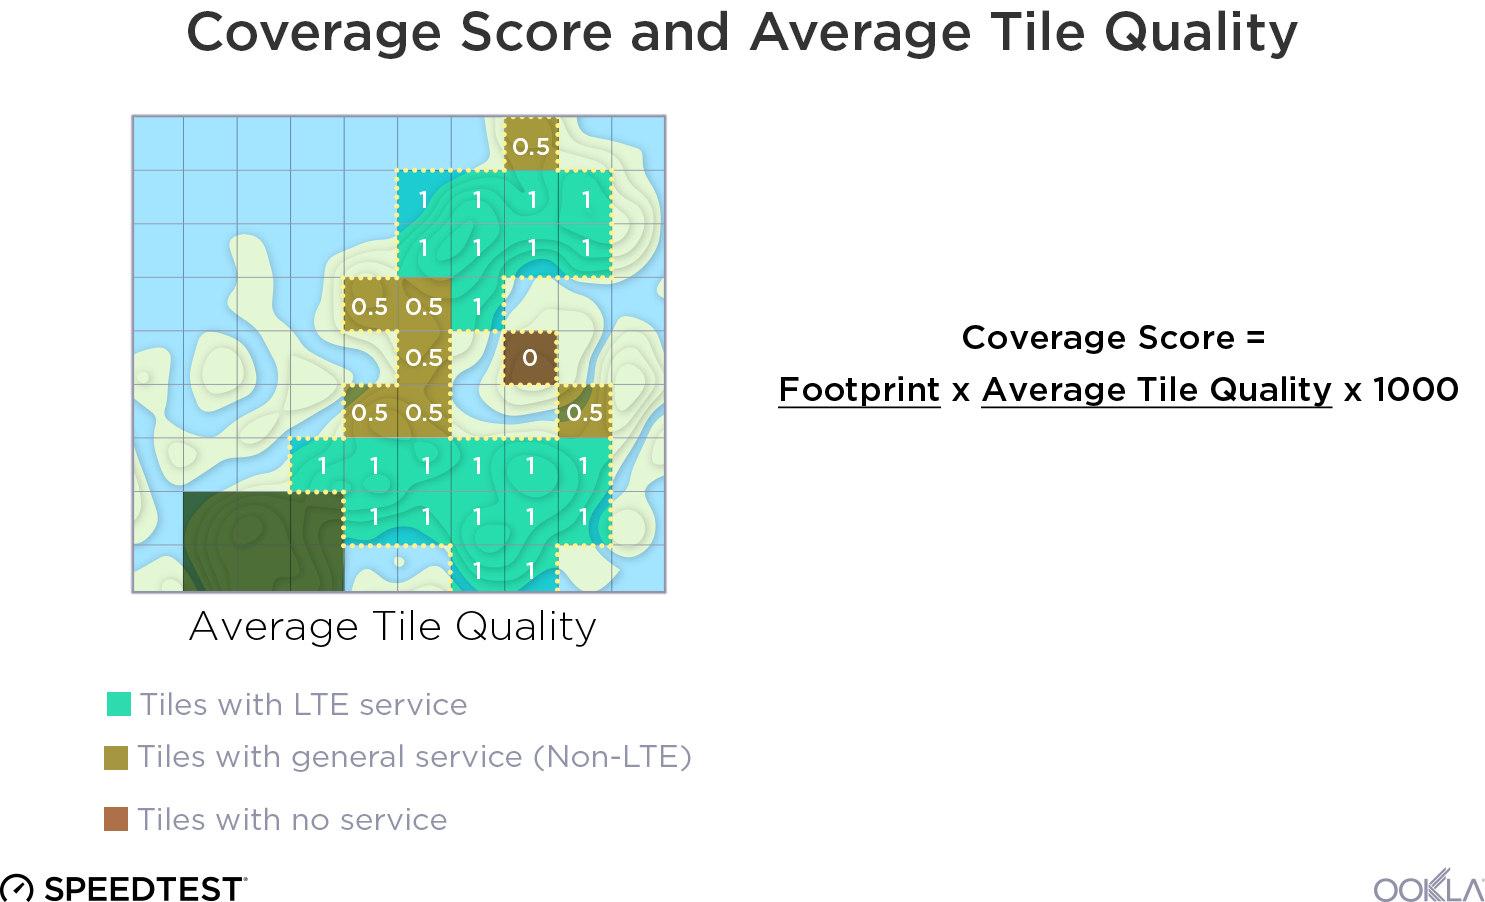
We created Coverage Score to account for both the quality and coverage of service for mobile operators. Coverage Score multiplies the proportion of locations in which an operator was seen with service (its footprint) against the average tile quality score (based on availability metrics) among all locations in which that operator is present. Coverage Score has a range of 0 to 1000 to avoid any potential for confusion that the Coverage Score represents a percentage of an area or population with coverage.

tile-quality-map-1

Coverage Score is not comparable across different countries because it is strongly tailored to the unique geography of each market.

Availability

Whether or not service is available is closely tied to coverage. We divide our data on availability into three separate views: General Availability, 4G Availability, and On-Network Availability. These metrics indicate how likely a user, on average, is to have service available in the places they go. They are individually defined as:

  • General Availability

    The percentage of an operator’s known locations where a device has access to any kind of service (including roaming).
  • 4G Availability

    The percentage of an operator’s known locations where a device has access to 4G LTE service (including roaming).
  • On-Network Availability

    The percentage of an operator’s known locations where a device has access to service from that operator.

Time Spent

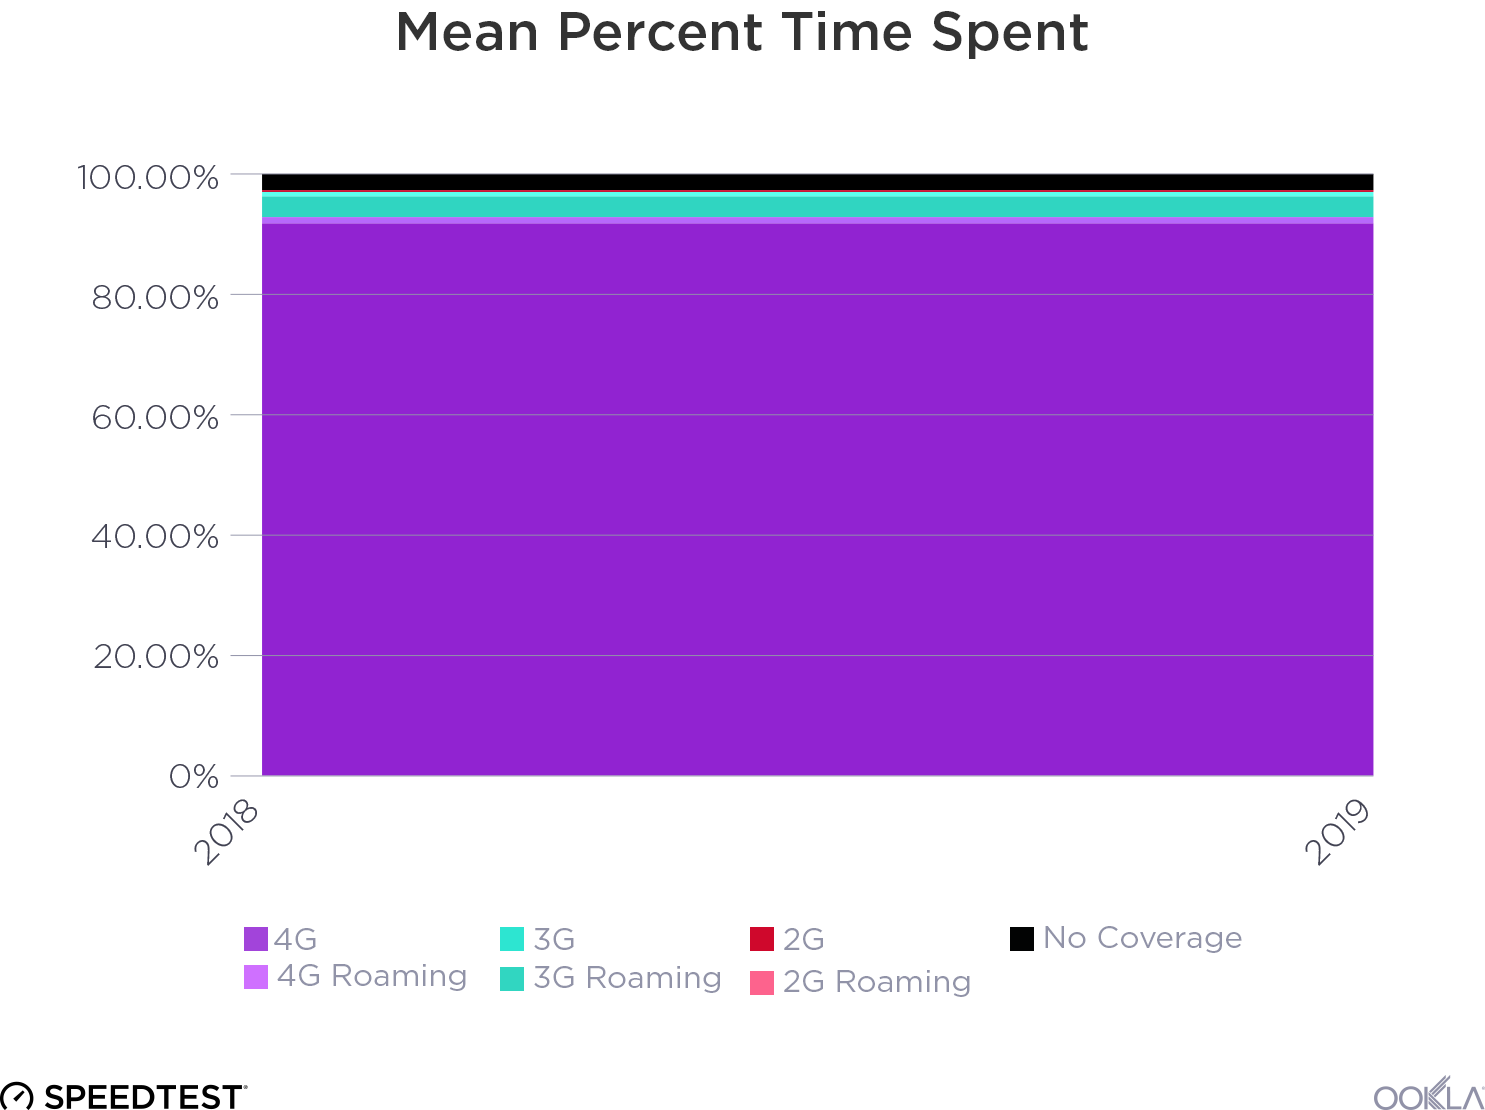
While it might be easy to assume that a user connects to a 4G signal 100% of the time, actual experience varies. We use Time Spent to give mobile operators insight into the percent of time that an average user spends on a given cellular technology both on and off of their subscriber (SIM) network. For example, we could see that users in one area are using 74% 4G, 6% Roaming 4G and 20% 3G. This can help pinpoint gaps in LTE coverage, among other things.

mean-time-spent-1

Time Spent uses coverage scans to construct daily timelines for each device. Then, daily per-device durations on subscriber network, active network and cellular technology are calculated for a given area of interest. Next, the percent time spent on cellular technology per-device based on the area and time period of interest are determined. Finally, average percent time over devices for a subscriber network are aggregated to give the final metrics seen in Speedtest Intelligence.

Operational definitions

Now that you have a full understanding of the metrics we use to discuss internet performance, consistency and coverage, we want to make sure that you also understand a few key phrases we often use in our articles and reports.

Top providers

Top providers are all operators and ISPs with 3% or more of total test samples in the market for the period. We use this designation when analyzing providers to ensure that the providers we designate as fastest, most consistent or having the best coverage are also providers that most consumers in the area actually have access to.

Modern devices

Modern devices are the most common devices capable of connecting to the most modern cellular network type broadly available in each country. In most cases this is LTE, but we define modern devices on a market-by-market basis. We use modern devices when calculating Speed Score for operators so that they aren’t negatively impacted if they happen to have a subscriber base that’s more likely to use older technology.

Footprint

Footprint is the fraction of locations within a given market, across all operators in that market, where a device has access to service. We use Footprint in calculating in Coverage Score. Operators with a relatively small footprint will have a lower Coverage Score than competitors with equal availability and a larger footprint. We require that an operator’s footprint in their market is at least 30% before we will calculate a Coverage Score, however, to indicate that the operator is generally available to the public.

We hope this quick reference guide will give you deeper insight into the metrics we present on Speedtest InsightsTM. We also have further information on 5G and a glossary that contains some general terms used when discussing internet performance across the industry. For specific information about what our data has to say about your market, learn more about Speedtest Intelligence.

Ookla retains ownership of this article including all of the intellectual property rights, data, content graphs and analysis. This article may not be quoted, reproduced, distributed or published for any commercial purpose without prior consent. Members of the press and others using the findings in this article for non-commercial purposes are welcome to publicly share and link to report information with attribution to Ookla.

| June 19, 2019

5G Drives South Korea to the Top of World Ranking for Mobile Speeds

한국어로 읽기

As of May 2019, South Korea ranks first in the world for mobile download speed according to the Speedtest Global IndexTM. Norway previously held the number one spot, but with a mean download speed of 76.74 Mbps in May 2019, South Korea was 13.0% faster. While Norway has moved to second place, Telenor Norway maintains Ookla’s award for Fastest Network. South Korea’s May 2019 download speed is also a 79.7% increase over that in May 2018, when the country ranked 14th in the world. The Speedtest Global Index compares country-level averages of results from all providers on a monthly basis using data generated by consumer-initiated tests taken with Speedtest®.

SK-global-index-graphic-4

5G adoption in South Korea is rapid

South Korean mobile operators launched 5G services on April 3, 2019. Since then over 1 million subscribers have signed up for 5G. As of today, the Ookla 5G MapTM is showing that 73 cities in South Korea have 5G available at some level. Follow @Ookla5GMap to track deployments as they are identified.

5G dramatically boosts speeds

According to data from Speedtest Intelligence® SK Telecom has the fastest mean download speed on 5G capable devices in South Korea during May 2019 at 165.37 Mbps. LG U+ was second at 159.42 Mbps and KT was third at 130.01 Mbps. This represents a dramatic increase compared to Speedtest data from March, before 5G was commercially available in South Korea, when SK Telecom showed a mean download speed of 68.93 Mbps, LG U+ was at 48.05 Mbps and KT was 45.65 Mbps.

Speedtest Intelligence is your key to seeing how 5G is shaping mobile speeds in South Korea and around the world. Learn more here.


대한민국을 모바일 속도 전 세계 1위로 올려놓은 5G

Speedtest Global IndexTM에 따르면, 2019년 5월에 대한민국이 모바일 다운로드 속도에서 세계 1위를 차지했습니다. 평균 다운로드 속도 76.74Mbps는 이전 1위였던 노르웨이를 무려 13%나 앞서는 수치입니다. 노르웨이가 2위로 내려앉았지만 Telenor Norway는 Ookla 가장 빠른 네트워크 어워드를 사수했습니다. 대한민국의 2019년 5월 다운로드 속도는 세계 14위를 기록했던 전년도 5월보다 79.7% 성장한 수치이기도 합니다. Speedtest Global Index는 소비자가 Speedtest®를 사용하여 시작한 테스트에서 얻은 데이터를 사용하여 모든 통신사의 국가별 평균 결과를 월 단위로 비교합니다.

SK-global-index-graphic-KR-1

대한민국의 놀라운 5G 보급 속도

대한민국의 모바일 통신사에서 5G 서비스를 출시한 2019년 4월 3일 이래로 1백만 명이 넘는 이용자가 5G 서비스에 가입했습니다. Ookla 5G MapTM을 통해 오늘 날짜로 대한민국의 73개 도시에 5G망이 어느 정도 수준으로 보급되어 있는지 확인할 수 있습니다. @Ookla5GMap을 팔로우하여 5G 보급 현황을 추적하십시오.

획기적으로 빨라진 속도를 제공하는 5G

Speedtest Intelligence®의 데이터에 따르면, 2019년 5월 대한민국에서 5G 호환 장치 기준 최고 평균 다운로드 속도는 SK텔레콤의 165.37Mbps입니다. 2위는 159.42Mbps의 LG U+, 3위는 130.01Mbps의 KT가 차지했습니다. 이는 5G가 대한민국에 보급되기 전인 3월 Speedtest 데이터와 비교했을 때 놀라울 정도로 크게 상승한 수치입니다. 당시 측정한 SK텔레콤의 평균 다운로드 속도는 68.93Mbps, LG U+는 48.05Mbps, KT는 45.65Mbps였습니다.

Speedtest Intelligence를 통해 5G가 대한민국과 전 세계의 모바일 속도에 어떠한 변화를 가져오고 있는지 확인할 수 있습니다. 여기에서 자세히 알아보십시오.

Ookla retains ownership of this article including all of the intellectual property rights, data, content graphs and analysis. This article may not be quoted, reproduced, distributed or published for any commercial purpose without prior consent. Members of the press and others using the findings in this article for non-commercial purposes are welcome to publicly share and link to report information with attribution to Ookla.

| June 3, 2019

Too Big to Fail? Downdetector Shows a Tidal Wave of Outages When Popular Cloud Services Go Down

The rise and consolidation of cloud services is increasing the internet’s dependence on a few key service providers. Yesterday Downdetector™, an Ookla company, showed a major outage to Google and Google properties including YouTube, Gmail, Google Drive, the Google Play store, Google Hangouts, Nest and Google Cloud began on June 2, 2019 at 10:49 AM EDT (6:49 PM UTC). Overall we saw 463,054 reports for that list of services alone. The outage duration varied by service, lasting for one hour and 50 minutes on YouTube and about the same amount of time on Google Cloud before the volume dropped significantly, indicating that the outage had been mostly resolved.

google-properties-3

The fact that other web services that use Google Cloud, including Snapchat (1,967,700 Downdetector reports), Crunchyroll (72,690 reports), Discord (30,914 reports) and Vimeo (11,645 reports), were also affected points to a much bigger issue. The promise of Google Cloud was an increase in overall stability because cloud services are supposed to be best in class. Instead, we have created a few core cloud services that can bring down large portions of the internet. The recent failures of Facebook and Google Cloud have illustrated that these services have become “too big to fail.” When they do fail, it’s important to the internet as a whole that these services get back online as soon as possible.

Downdetector helps Ookla with outages

Of course, the last thing we want is to see a spike in outage reports for Speedtest on Downdetector, but it happens. When it does, as it did this morning, Downdetector plays a critical role in helping us reduce downtime by providing data on regions and services affected that can point to a root cause. Downdetector is also a place where we can communicate directly with consumers to let them know that we’ve seen the outage and our engineering team is on top of resolving it as soon as possible. This saves our customers frustration and it saves us money in support costs.

Learn more about how Downdetector can help you.

Ookla retains ownership of this article including all of the intellectual property rights, data, content graphs and analysis. This article may not be quoted, reproduced, distributed or published for any commercial purpose without prior consent. Members of the press and others using the findings in this article for non-commercial purposes are welcome to publicly share and link to report information with attribution to Ookla.

| May 30, 2019

Mobile Speeds, 4G Availability and Coverage in Latin America’s Largest Markets

Leer en español | Leia em Português

Major markets in Latin America, in most cases, saw double-digit percent increases in mean mobile download speeds during the past year. While the only 5G deployments we’ve yet seen in Latin America are in Uruguay and Brazil, operators across the continent are working to expand 4G LTE and prepare for future technologies. Using data from Speedtest Intelligence we’ve examined mobile download speeds to see which countries are fastest and which are quickly improving. We’ve also analyzed which countries offer the best access to 4G and which operators are leading the way in speeds and coverage. For further context, we’ve included a look at speeds and 4G Availability in Central America.

Mobile speeds improved in most of Latin America’s major markets

As we saw last year, Peru had the fastest mean download speed of the group during Q1 2019, and the third largest year-over-year increase. Argentina showed the largest percentage increase and came in fourth during Q1 2019. Mexico is the exception with a second-place download speed but a 4% decline in mobile speed since last year.

Mobile Speeds in Latin America’s Largest Markets
Q1 2019 | Speedtest Data
Country Mean Download (Mbps) % Change YOY
Peru 23.07 15.4%
Mexico 22.02 -4.0%
Brazil 21.30 25.7%
Argentina 19.78 37.5%
Chile 18.47 13.6%
Colombia 17.36 10.3%

Fastest mobile operators

We also looked at the fastest mobile operator in each country during Q1 2019 using Speed ScoreTM (a weighted trimean that combines download and upload speeds) for top providers (operators with 3% or larger market share) on modern devices.

Claro, the Mexican-owned telecommunications company, achieved the highest Speed Score in Peru, Chile and Brazil. In Peru this was due to the combination of 700 MHz LTE and 300 Mbps LTE-A service. In Chile, Claro is mainly using the 700 MHz and 2600 MHz spectrum. Claro uses 700 MHz in Brazil to augment the existing 1800 MHz and 2600 MHz networks, and additional capacity is available in places like Rio de Janeiro where Claro has deployed a 1 Gbps capable License Assisted Access (LAA) network in select locations.

Fastest Operators in Latin America’s Largest Markets
Q1 2019 | Speedtest Data
Country Mobile Operator Speed ScoreTM
Argentina Personal 23.16
Brazil Claro 29.48
Chile Claro 23.53
Colombia TigoUNE 17.78
Mexico Telcel 26.20
Peru Claro 28.43

Personal delivered the fastest speeds in Argentina via 700 MHz, 1700 MHz and 2600 MHz plus carrier aggregation. Personal now provides service in over 1,350 towns and cities, having added 390 new locations in 2018. TigoUNE in Colombia launched LTE-Advanced speeds of up to 230 Mbps in parts of Bogota and Medellín. Mexico’s fastest operator, Telcel, has quietly started deploying gigabit class LTE to 76 cities throughout Mexico.

Cellular service is widely available while 4G Availability varies

Speedtest data shows that mobile users in Latin America’s largest markets were able to find service in 96% or more of surveyed locations. Chile showed the best General Availability at 99.7%. Colombia was second and Peru third. Brazil came in last for General Availability with 96.9%.

4G Availability in Latin America’s Largest Markets
Q1 2019 | Speedtest Data
Country General Availability 4G Availability
Chile 99.7% 78.9%
Colombia 99.3% 59.3%
Peru 99.2% 87.4%
Argentina 98.7% 76.9%
Mexico 98.3% 76.7%
Brazil 96.9% 54.9%

On the other hand, a mobile user’s ability to consistently access 4G is highly dependent on which country they live in. Customers in Peru have the best chance of connecting to LTE with a 4G Availability of 87.4%. Chile, Argentina and Mexico all show 4G Availability in the mid- to upper-70s. Brazil showed the worst 4G Availability in Latin America’s largest markets with mobile users accessing LTE a majority of the time in only 54.9% of surveyed locations.

Mobile operators with the best coverage

Coverage can be as important as speeds, especially in countries with large rural areas and/or difficult terrains. To better understand who offers the best coverage in a country, Ookla aggregates a score for coverage based on where each operator offers service and the average quality of service in those areas. The higher an operator’s Coverage ScoreTM for a given area, the more locations in that overall area where the operator has high quality service.

We looked at which of the top providers showed the best coverage in each country and found that Telcel, a subsidiary of América Móvil, in had the highest Coverage Score in Mexico during Q1 2019. Another América Móvil subsidiary, Claro had the best coverage in both Colombia and Argentina. Telefónica subsidiary Movistar topped the list in Peru and Chile and Vivo, also a subsidiary of Telefónica, had the best coverage in Brazil. Coverage Score is not comparable across countries due to differing geographies.

Operators with Best Coverage in Latin America’s Largest Markets
Q1 2019 | Speedtest Data
Country Mobile Operator Coverage ScoreTM
Argentina Claro 570
Brazil Vivo 547
Chile Movistar 690
Colombia Claro 638
Mexico Telcel 816
Peru Movistar 697

How Central American mobile speeds and availability compare

Smaller markets in Latin America also show interesting dynamics. While some parts of Central America have struggled with poverty, political unrest and corruption, others have not. What’s interesting is that mobile speeds and 4G Availability aren’t always hindered by these conditions in the ways that we might expect.

Mobile Speeds and Availability in Central America
Q1 2019 | Speedtest Data
Country Mean Download (Mbps) General Availability 4G Availability
Belize 23.30 99.4% 67.5%
Costa Rica 19.22 99.5% 45.7%
El Salvador 8.79 99.9% 34.9%
Guatemala 16.75 99.9% 65.9%
Honduras 21.29 99.5% 51.4%
Nicaragua 20.13 99.8% 45.8%
Panama 9.74 99.8% 74.4%

The good news is good. Belize showed the fastest mean download speeds over mobile in Central America in Q1 2019, faster even than those in Peru. Mobile download speeds in Honduras, Nicaragua and Costa Rica were also particularly strong and would place them in the mid- to upper-range if we combined Central America with the list of largest markets. General Availability is above 99% in all Central American countries and Panama showed the best 4G Availability at 74.4%.

The bad news is not great. While mean mobile download speeds in Panama and El Salvador are fast enough to stream HD video, they are much slower than in Latin America’s largest markets and place these countries in line with speeds experienced in Haiti. El Salvador also showed the lowest 4G Availability in Central America at 34.9%. 4G Availability in Nicaragua and Costa Rica was also relatively low at 45.8% and 45.7%, respectively.

We’ll continue watching these markets to see how improving speeds change rankings and how network enhancements affect 4G Availability. If you are interested in detailed views of these metrics and more, learn more about Speedtest Intelligence.


Velocidades, disponibilidad de 4G y cobertura de la telefonía móvil en los mercados más importantes de América Latina

En la mayoría de los casos, los principales mercados de América Latina experimentaron aumentos de dos dígitos en las velocidades medias de descarga móvil durante el año pasado. Mientras que la única implementación de 5G que se ha visto en América Latina se realizó en Uruguay, los operadores de todo el continente están trabajando para expandir el 4G LTE y prepararse para las tecnologías futuras. Con datos de Speedtest Intelligence, examinamos las velocidades de descarga móvil para ver en qué países son más rápidas y en cuáles están mejorando rápidamente. También analizamos qué países ofrecen el mejor acceso al 4G y qué operadores son los líderes en velocidad y cobertura. Para ofrecer un mayor contexto, incluimos un breve análisis de la disponibilidad de 4G en América Central.

Las velocidades móviles mejoraron en la mayoría de los principales mercados de América Latina

Como observamos el año pasado, Perú tuvo la velocidad media de descarga más rápida del grupo durante el primer trimestre de 2019 y el tercer mayor aumento interanual. Argentina mostró el mayor aumento porcentual y quedó cuarta durante el primer trimestre de 2019. México es la excepción, con el segundo lugar en velocidad de descarga, pero una disminución del 4 % en la velocidad móvil respecto del año pasado.

Velocidades móviles en los mercados más importantes de América Latina
Primer trimestre de 2019 | Datos de Speedtest
País Descarga media (Mbps) Porcentaje de cambio interanual
Perú 23,07 15,4%
México 22,02 -4,0%
Brasil 21,30 25,7%
Argentina 19,78 37,5%
Chile 18,47 13,6%
Colombia 17,36 10,3%

Operadores de telefonía móvil más rápidos

También analizamos el operador de telefonía móvil más rápido en cada país durante el primer trimestre de 2019 con Speed ScoreTM (un trimeano ponderado que combina las velocidades de carga y descarga) entre los principales proveedores (operadores con una cuota de mercado del 3 % o superior) en dispositivos modernos.

Claro, la compañía de telecomunicaciones mexicana, logró el mayor Speed Score en Perú, Chile y Brasil. En Perú, esto se debió a la combinación de los servicios LTE de 700 MHz y LTE-A de 300 Mbps. En Chile, Claro utiliza principalmente el espectro de 700 MHz y 2600 MHz. Claro emplea 700 MHz en Brasil para aumentar las redes existentes de 1800 MHz y 2600 MHz, y ofrece capacidad adicional disponible en lugares como Río de Janeiro, donde ha implementado una red de acceso asistido por licencia (LAA, License Assisted Access) con capacidad de 1 Gbps en lugares seleccionados.

Operadores de telefonía móvil más rápidos en los mercados más importantes de América Latina
Primer trimestre de 2019 | Datos de Speedtest
País Operador de telefonía móvil Speed ScoreTM
Argentina Personal 23,16
Brasil Claro 29,48
Chile Claro 23,53
Colombia TigoUNE 17,78
México Telcel 26,20
Perú Claro 28,43

Personal ofreció las velocidades más rápidas en Argentina con 700 MHz, 1700 MHz y 2600 MHz más Carrier Aggregation. Personal ya brinda sus servicios en más de 1350 pueblos y ciudades, después de sumar 390 nuevas localidades en 2018. En Colombia, TigoUNE lanzó velocidades de LTE-Advanced de hasta 230 Mbps en áreas de Bogotá y Medellín. El operador más rápido de México, Telcel, ha comenzado a implementar LTE de clase Gigabit en 76 ciudades de todo México.

El servicio celular está ampliamente disponible, pero la disponibilidad de 4G varía

Según los datos de Speedtest, los usuarios de telefonía móvil en los mercados más importantes de América Latina pudieron encontrar servicio en el 96 % o más de los lugares encuestados. Chile mostró la mejor disponibilidad general, con el 99,7 %. Colombia ocupó el segundo lugar y Perú, el tercero. Brasil quedó último en disponibilidad general, con el 96,9 %.

Disponibilidad de 4G en los mercados más importantes de América Latina
Primer trimestre de 2019 | Datos de Speedtest
País Disponibilidad general Disponibilidad de 4G
Chile 99,7% 78,9%
Colombia 99,3% 59,3%
Perú 99,2% 87,4%
Argentina 98,7% 76,9%
México 98,3% 76,7%
Brasil 96,9% 54,9%

Por otro lado, la capacidad de un usuario móvil de obtener un acceso constante a 4G depende ampliamente del país en el que vive. Los clientes en Perú tienen la mayor probabilidad de conectarse a LTE con una disponibilidad de 4G del 87,4 %. Chile, Argentina y México muestran una disponibilidad de 4G de entre el 75 y el 79 %. Brasil tuvo la peor disponibilidad de 4G entre los mercados más importantes de América Latina, ya que los usuarios de telefonía móvil obtuvieron acceso a LTE la mayor parte del tiempo en solo el 54,9 % de los lugares encuestados.

Operadores de telefonía móvil con la mejor cobertura

La cobertura puede ser tan importante como las velocidades, especialmente en países con grandes zonas rurales o terrenos difíciles. Para ayudar a comprender mejor quién ofrece la mejor cobertura en cada país, Ookla calcula una puntuación por cobertura basada en dónde brinda servicio cada operador y la calidad promedio del servicio en esas áreas. Cuanto mayor es la puntuación de Coverage ScoreTM de un operador para un área determinada, más son las ubicaciones de esa área general en las que el operador presta un servicio de alta calidad.

Analizamos cuál de los principales operadores brindó la mejor cobertura en cada país y concluimos que Telcel, una subsidiaria de América Móvil, obtuvo la mayor puntuación de Coverage Score en México durante el primer trimestre de 2019. Otra subsidiaria de América Móvil, Claro, tuvo la mejor cobertura tanto en Colombia como en Argentina. Una subsidiaria de Telefónica, Movistar, encabezó la lista en Perú y Chile, y Vivo, también subsidiaria de Telefónica, tuvo la mejor cobertura en Brasil. Debido a las diferentes geografías, las puntuaciones de Coverage Score no son comparables entre diferentes países.

Operador con mejor cobertura en los mercados más importantes de América Latina
Primer trimestre de 2019 | Datos de Speedtest
País Operador de telefonía móvil Coverage ScoreTM
Argentina Claro 570
Brasil Vivo 547
Chile Movistar 690
Colombia Claro 638
México Telcel 816
Perú Movistar 697

Comparación con las velocidades y la disponibilidad de la telefonía móvil en América Central

Los mercados más pequeños de América Latina también muestran dinámicas interesantes. Si bien en algunas partes de América Central ha habido dificultades relacionadas con la pobreza, la inestabilidad política y la corrupción, en otras no ha sido así. Resulta interesante destacar que las velocidades móviles y la disponibilidad de 4G no siempre se ven afectadas por estas condiciones de la manera que se podría esperar.

Velocidades y disponibilidad móviles en América Central
Primer trimestre de 2019 | Datos de Speedtest
País Descarga media (Mbps) Disponibilidad general Disponibilidad de 4G
Belice 23,30 99,4% 67,5%
Costa Rica 19,22 99,5% 45,7%
El Salvador 8,79 99,9% 34,9%
Guatemala 16,75 99,9% 65,9%
Honduras 21,29 99,5% 51,4%
Nicaragua 20,13 99,8% 45,8%
Panamá 9,74 99,8% 74,4%

Las buenas noticias son buenas. Belice exhibió las velocidades medias de descarga más rápidas de la telefonía móvil en América Central en el primer trimestre de 2019, superando incluso a las de Perú. Las velocidades de descarga móvil en Honduras, Nicaragua y Costa Rica también fueron especialmente potentes y colocarían a estos países en el rango medio a superior si combináramos América Central con la lista de los mercados más importantes. La disponibilidad general supera el 99 % en todos los países centroamericanos, y Panamá exhibió la mejor disponibilidad de 4G, con el 74,4 %.

Las malas noticias no son alentadoras. Si bien las velocidades medias de descarga móvil en Panamá y El Salvador son lo suficientemente rápidas como para transmitir videos en HD, son mucho más lentas que en los mercados más importantes de América Latina y colocan a estos países en línea con las velocidades experimentadas en Haití. El Salvador también exhibió la menor disponibilidad de 4G en América Central, con el 34,9 %. La disponibilidad de 4G en Nicaragua y Costa Rica también fue baja en términos relativos, con el 45,8 % y el 45,7 %, respectivamente.

Continuaremos atentos a estos mercados para ver cómo la mejora de las velocidades cambia las clasificaciones y de qué manera las mejoras en la red afectan la disponibilidad de 4G. Si desea obtener un análisis detallado de estas métricas y datos adicionales, consulte más información sobre Speedtest Intelligence.


Velocidades móveis, disponibilidade 4G e cobertura nos maiores mercados da América Latina

Os principais mercados da América Latina, na maioria dos casos, registraram aumentos de dois dígitos nas velocidades médias de download de dispositivos móveis durante o ano passado. Embora as únicas implantaçãoes 5G vistas na América Latina tenham sido realizadas no Uruguai e no Brasil, operadoras de todo o continente estão trabalhando para expandir o 4G LTE e se preparar para as próximas tecnologias. Usando dados do Speedtest Intelligence, examinamos as velocidades de download de dispositivos móveis para ver quais países são mais rápidos e quais estão melhorando rapidamente. Analisamos também quais países oferecem o melhor acesso ao 4G e quais operadoras lideram em termos de velocidade e cobertura. Por conta de um contexto mais abrangente, incluímos as velocidades e a disponibilidade do 4G na América Central.

As velocidades de dispositivos móveis melhoraram na maioria dos principais mercados da América Latina

Como vimos no ano passado, o Peru teve a velocidade média de download mais rápida do grupo durante o primeiro trimestre de 2019, e o terceiro maior aumento em relação ao ano anterior. A Argentina apresentou o maior aumento percentual e ficou em quarto lugar no primeiro trimestre de 2019. O México é a exceção, com o segundo lugar em velocidade de download, mas uma queda de 4% na velocidade de dispositivos móveis desde o ano passado.

Velocidades móveis nos maiores mercados da América Latina
1º trimestre de 2019 | Dados do Speedtest
País Download médio (Mbps) % de alteração de ano a ano
Peru 23,07 15,4%
México 22,02 -4,0%
Brasil 21,30 25,7%
Argentina 19,78 37,5%
Chile 18,47 13,6%
Colômbia 17,36 10,3%

Operadoras móveis mais rápidas

Também analisamos a operadora móvel mais rápida em cada país durante o primeiro trimestre de 2019 usando o Speed ScoreTM (um ajuste ponderado que combina velocidades de download e upload) para os principais provedores (operadoras com participação de mercado de 3% ou mais) em dispositivos modernos.

A Claro, empresa de telecomunicações mexicana, alcançou o maior Speed Score no Peru, no Chile e no Brasil. No Peru, isso se deveu àcombinação do serviço LTE de 700 MHz e LTE-A de 300 Mbps. No Chile, a Claro utiliza principalmente o espectro de 700 MHz e 2600 MHz. A Claro usa 700 MHz no Brasil para aumentar as redes existentes de 1800 MHz e 2600 MHz, e há mais capacidade disponível em lugares como o Rio de Janeiro, onde a Claro implantou uma rede de Acesso Licenciado e Assistido (LAA) com capacidade de 1 Gbps em locais selecionados.

Operadoras mais rápidas nos maiores mercados da América Latina
1º trimestre de 2019 | Dados do Speedtest
País Operadora móvel Speed ScoreTM
Argentina Personal 23,16
Brasil Claro 29,48
Chile Claro 23,53
Colômbia TigoUNE 17,78
México Telcel 26,20
Peru Claro 28,43

A Personal forneceu as velocidades mais rápidas na Argentina com 700 MHz, 1700 MHz e 2600 MHz, além da agregação de operadoras. A Personal presta serviços em mais de 1.350 cidades, com 390 novos locais em 2018. A TigoUNE, na Colômbia, lançou velocidades LTE-Advanced de até 230 Mbps em partes de Bogotá e Medellín. A operadora mais rápida do México, a Telcel, começou sem alarde a implantar o LTE de classe gigabit em 76 cidades em todo o México.

O serviço de celulares está amplamente disponível, enquanto a disponibilidade do 4G varia

Os dados do Speedtest mostram que os usuários de dispositivos móveis nos maiores mercados da América Latina conseguiram encontrar serviços em 96% ou mais dos locais pesquisados. O Chile apresentou a melhor disponibilidade geral, com 99,7%. A Colômbia ficou em segundo e o Peru em terceiro. O Brasil ficou em último lugar, com disponibilidade geral de 96,9%.

Disponibilidade do 4G nos maiores mercados da América Latina
1º trimestre de 2019 | Dados do Speedtest
País Disponibilidade geral Disponibilidade do 4G
Chile 99,7% 78,9%
Colômbia 99,3% 59,3%
Peru 99,2% 87,4%
Argentina 98,7% 76,9%
México 98,3% 76,7%
Brasil 96,9% 54,9%

Por outro lado, a capacidade de um usuário de dispositivos móveis de acessar de modo consistente o 4G depende muito do país em que ele mora. Os clientes do Peru têm a melhor chance de se conectar ao LTE, com uma disponibilidade de 87,4% para o 4G. A disponibilidade do 4G no Chile, na Argentina e no México ultrapassa os 70%. O Brasil tem a pior disponibilidade do 4G entre os maiores mercados da América Latina, com usuários móveis acessando o LTE na maior parte do tempo em apenas 54,9% dos locais pesquisados.

Operadoras móveis com a melhor cobertura

A cobertura pode ser tão importante quanto a velocidade, especialmente em países com grandes áreas rurais e/ou terrenos de difícil acesso. Para entender melhor quem oferece a melhor cobertura em um país, a Ookla agrega uma pontuação para cobertura com base no local em que cada operadora oferece serviço e na qualidade média do serviço nessas áreas. Quanto maior o Coverage ScoreTM de um operador para uma determinada área, mais locais nessa área geral o operador terá um serviço de alta qualidade.

Analisamos quais dos principais provedores apresentaram a melhor cobertura em cada país e descobrimos que a Telcel, uma subsidiária da América Móvil, teve o maior Coverage Score no México durante o primeiro trimestre de 2019. Outra subsidiária da América Móvil, a Claro, teve a melhor cobertura na Colômbia e na Argentina. A Movistar, subsidiária da Telefónica, liderou a lista no Peru e no Chile, e a Vivo, também subsidiária da Telefónica, teve a melhor cobertura no Brasil. O Coverage Score não é comparável entre países por causa das diferenças entre as regiões geográficas.

Operadora com melhor cobertura nos maiores mercados da América Latina
1º trimestre de 2019 | Dados do Speedtest
País Operadora móvel Coverage ScoreTM
Argentina Claro 570
Brasil Vivo 547
Chile Movistar 690
Colômbia Claro 638
México Telcel 816
Peru Movistar 697

Como as velocidades e a disponibilidade dos dispositivos móveis da América Central se saem na comparação

Os mercados menores na América Latina também apresentam dinâmicas interessantes. Enquanto algumas partes da América Central lutam contra a pobreza, a agitação política e a corrupção, outras não têm esses problemas. O interessante é que a disponibilidade do 4G e as velocidades dos dispositivos móveis nem sempre são prejudicadas por essas condições da maneira que poderíamos esperar.

Velocidades móveis e disponibilidade na América Central
1º trimestre de 2019 | Dados do Speedtest
País Download médio (Mbps) Disponibilidade geral Disponibilidade do 4G
Belize 23,30 99,4% 67,5%
Costa Rica 19,22 99,5% 45,7%
El Salvador 8,79 99,9% 34,9%
Guatemala 16,75 99,9% 65,9%
Honduras 21,29 99,5% 51,4%
Nicarágua 20,13 99,8% 45,8%
Panamá 9,74 99,8% 74,4%

A boa notícia é boa. Belize mostrou a mais rápida média de velocidade de download em dispositivos móveis da América Central no primeiro trimestre de 2019, mais rápida até do que no Peru. As velocidades de download em dispositivos móveis em Honduras, na Nicarágua e na Costa Rica também foram bem sólidas e colocariam esses países em uma faixa de média a alta se combinássemos a América Central com a lista dos maiores mercados. A disponibilidade geral está acima de 99% em todos os países da América Central, e o Panamá mostrou a melhor disponibilidade do 4G, com 74,4%.

A má notícia não é nada boa. Embora as velocidades médias de download em dispositivos móveis no Panamá e em El Salvador sejam rápidas o suficiente para transmitir vídeo em alta definição, elas são muito mais lentas do que nos maiores mercados da América Latina e colocam esses países alinhados com as velocidades experimentadas no Haiti. El Salvador também apresentou a menor disponibilidade de 4G da América Central, com 34,9%. A disponibilidade do 4G na Nicarágua e na Costa Rica também foi relativamente baixa, com 45,8% e 45,7%, respectivamente.

Continuaremos prestando atenção a esses mercados para ver como a melhoria da velocidade muda a classificação e como os aprimoramentos da rede afetam a disponibilidade do 4G. Se você estiver interessado em visualizações detalhadas dessas métricas e muito mais, saiba mais sobre o Speedtest Intelligence.
Ookla retains ownership of this article including all of the intellectual property rights, data, content graphs and analysis. This article may not be quoted, reproduced, distributed or published for any commercial purpose without prior consent. Members of the press and others using the findings in this article for non-commercial purposes are welcome to publicly share and link to report information with attribution to Ookla.

| April 10, 2019

Analyzing the U.S. Mobile Speed Landscape in Q1 2019

Last week AT&T announced they were the fastest wireless network in the U.S. based on Ookla’s analysis of average download speed data collected from Speedtest in Q1 2019. We pride ourselves on the depth and accuracy of our data, so today we are digging deeper into the methodology and analysis behind the claim to provide additional clarity.

Q1 2019 mobile speed results

The four major U.S. carriers achieved the following average Q1 download speeds across all devices:

Speedtest Data on Mean Download Speeds for Major Operators
United States | Q1 2019
Operator Mean Download (Mbps)
AT&T 34.65
T-Mobile 34.11
Verizon Wireless 33.07
Sprint 31.21

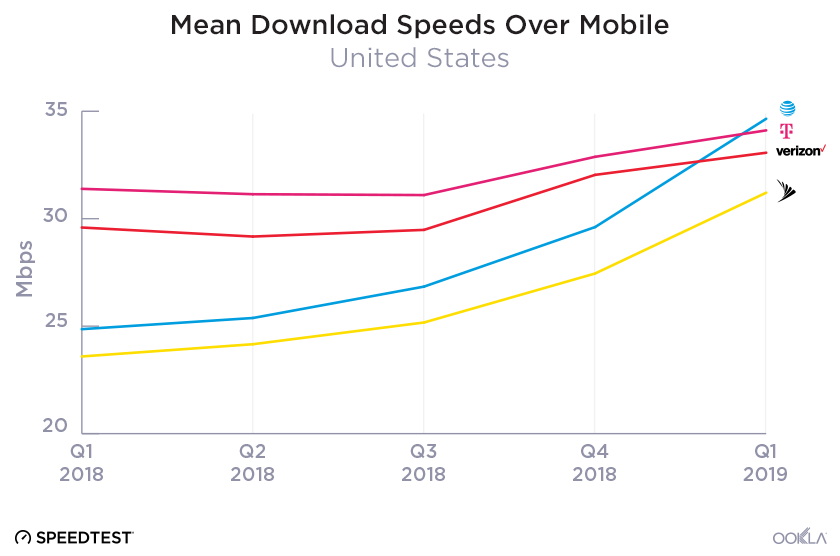
As we tracked data on mobile download speeds in the U.S. throughout the quarter, it became very clear to us that AT&T was likely to become the frontrunner. As you can see from the graph below, the steep increase in AT&T’s mean download speed continues a trend that started in Q4 2018.

mean-speeds

In the final week of Q1, we also observed an increase in faster tests taken on AT&T’s network. Upon investigation, we discovered that this correlated with the release of iOS 12.2 and the roll out of AT&T’s 5G E icon. We also found that the increase in tests was coming from device models that would have started to display the 5G E icon, such as the newer generations of iPhone (XR, XS Max, XS, X, 8, 8 Plus), indicating that consumers were seeing the new icon and taking a test to see what speeds they were getting. Even excluding data from the last week of the month, AT&T still had the fastest LTE network in the nation during Q1.

AT&T also showed strong speeds on Android throughout the quarter. For instance, looking at the most popular Android device in Q1 (the Samsung Galaxy S9) we see AT&T coming in first with a mean download speed of 44.90 Mbps, an 11.2% increase over the prior quarter.

A conclusion is only as good as the data behind it. This is why Ookla does not validate national claims based on less than a quarter’s worth of data. User experiences on their respective networks can be influenced by a wide variety of factors that ebb and flow over short periods of time, particularly when evaluated at the national scale. Ookla mitigates these influences by looking at trends over a longer period of time and only considering one sample per device during that time.

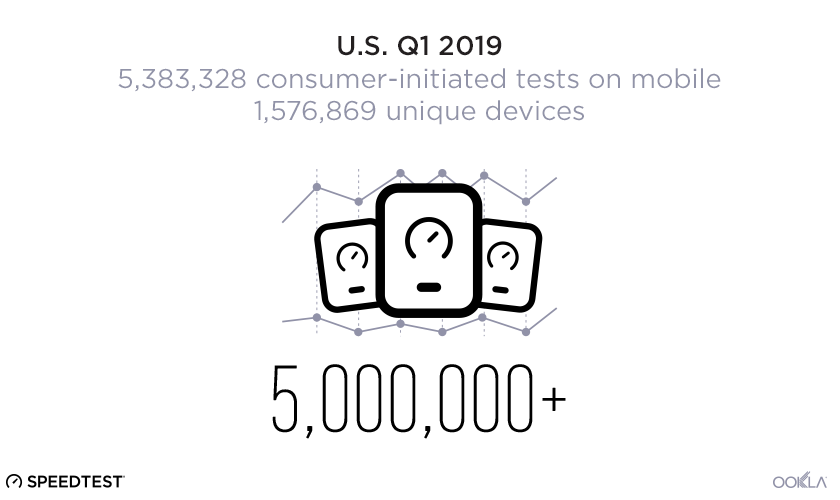
Data volume is also key. Consumer-initiated testing gives Speedtest a huge volume of data from which we can accurately assess the performance of mobile operators. During the entirety of Q1 in the U.S., we saw over 5 million consumer-initiated mobile network tests taken on over 1.5 million unique devices across all operators.

5-million-tests-1

Understanding how to interpret different reports

There are many companies that claim expertise in the measurement of speed and it can be hard for consumers to wade through the wide array of information out in the marketplace. At Ookla, we want you to be empowered with detailed information about our test, methodology, sample sizes and more so that you can compare it to others who claim to measure speed.

Measuring speed is in our DNA (and name). Our entire company began with a purpose built focus on speeds via the Speedtest platform and grew from there. We are proud of the fact that consumers trust Speedtest so much that they actively initiate over 10 million tests per day, with over 23 billion tests taken to date.

While there are other apps on the market that measure speed in the foreground, none has an adequate user base to produce a volume of data that is representative of the market as a whole.

The importance of testing speed on both iOS and Android

Every mobile operator has a different breakdown of device platforms used by their customer base. In the U.S. during Q1, we saw the following distribution in our database of Speedtest results:

Speedtest Data on iOS Usage Across Major Mobile Operators
United States | Q1 2019
Operator % Devices iOS
AT&T 70%
Sprint 54%
T-Mobile 49%
Verizon Wireless 62%

This wide adoption of iOS in the U.S. makes the ability to test the speed of a network on both iOS and Android crucial to accurately representing the full picture. While every operator has customers on both iOS and Android, tests taken on AT&T in our database during Q1 2019 show a staggering 70% of devices were using the iOS platform. This is likely because AT&T was Apple’s exclusive partner when the first version of the iPhone initially launched and, as a result, has retained a larger than typical iOS customer base.

A dedicated foreground test that saturates a connection is the most accurate way to measure speeds on both iOS and Android devices. Speedtest offers free applications on both iOS and Android that are optimized to measure the specific intricacies of a mobile internet connection in the foreground.

Because iOS limits the use of background activity, testing methodologies that rely on background testing are limited in the information they can gather. Testing methodologies that rely so heavily on data from Android aren’t able to fully represent the large portions of the U.S. customer base that uses iOS.

Further U.S. market analysis coming in 2019

Many changes are coming to the U.S. mobile market in the coming year, including numerous 5G rollouts that could radically alter speeds available to consumers in major markets. In smaller markets, such as states and cities, we will continue to focus on the convergence of high performance and coverage. We’ll examine all of this and more in our upcoming annual report publishing this summer, which will include a comprehensive look at our data on nationwide speeds, coverage metrics and consumer perception.

Editor’s note: This article was updated on April 10 to add additional context about performance on Android and clarify a sentence.

Ookla retains ownership of this article including all of the intellectual property rights, data, content graphs and analysis. This article may not be quoted, reproduced, distributed or published for any commercial purpose without prior consent. Members of the press and others using the findings in this article for non-commercial purposes are welcome to publicly share and link to report information with attribution to Ookla.

| April 2, 2019

How 100+ Million Additional Users Affects a Network: Mobile Speeds and 4G Usage During the Kumbh Mela

Millions of Hindus gather in one of four locations in India on a twelve year cycle to participate in the Kumbh Mela, the largest religious gathering in the world. Though the focus of the festival is a series of ritual baths in sacred waters, pilgrims and tourists use their mobile phones to help them navigate and to find friends and family in the immense crowds.

This year the Ardh Kumbh Mela in Prayagraj drew over 100 million visitors, and India’s largest mobile carriers have rolled out various mobile programs to help pilgrims. We were curious to analyze how well mobile networks held up. We’ve examined mobile speeds and 4G usage in and around Prayagraj from January 14-March 4, 2019.

How the top four operators performed at the Kumbh Mela

As mentioned above, India’s largest mobile operators put significant preparation into serving the massive influx of pilgrims during the Kumbh Mela. Airtel deployed Massive MIMO to expand network capacity, Jio launched an app that included real-time info on events and a family locator, and Vodafone-Idea offered an RFID tag to help locate children.

Mobile Speeds at the Kumbh Mela
Prayagraj, India | January 14-March 4, 2019
Connection Type Mean Download (Mbps) Mean Upload (Mbps) Mean Latency (ms)
Airtel 15.83 4.67 52
Jio 8.04 4.79 104
Vodafone 7.61 3.03 68
Idea 5.16 3.93 77

Airtel’s emphasis on increasing capacity paid off in speed with their mean download speed in the vicinity of the Kumbh Mela coming in 96.9% faster than that of second-place Jio. Vodafone was third and Idea a distant fourth.

Speeds decrease when traveling between states

Mobile operators in India use different MCC/MNC codes in different parts of the country, which allows us to differentiate speeds for customers who are “roaming” between telecom circles. In most cases these telecom circles correspond to states and union territories, but some represent only portions of a state or combinations of multiple states.

We compared speeds experienced during the time of the Kumbh Mela for customers from eastern Uttar Pradesh with those visiting this area from elsewhere in the country. We omitted data for the Kerala and North East (which comprises most of the North Eastern states) telecom circles for reasons of sample size.
India_Kumbh-Mela_Mobile_Speeds_map-2

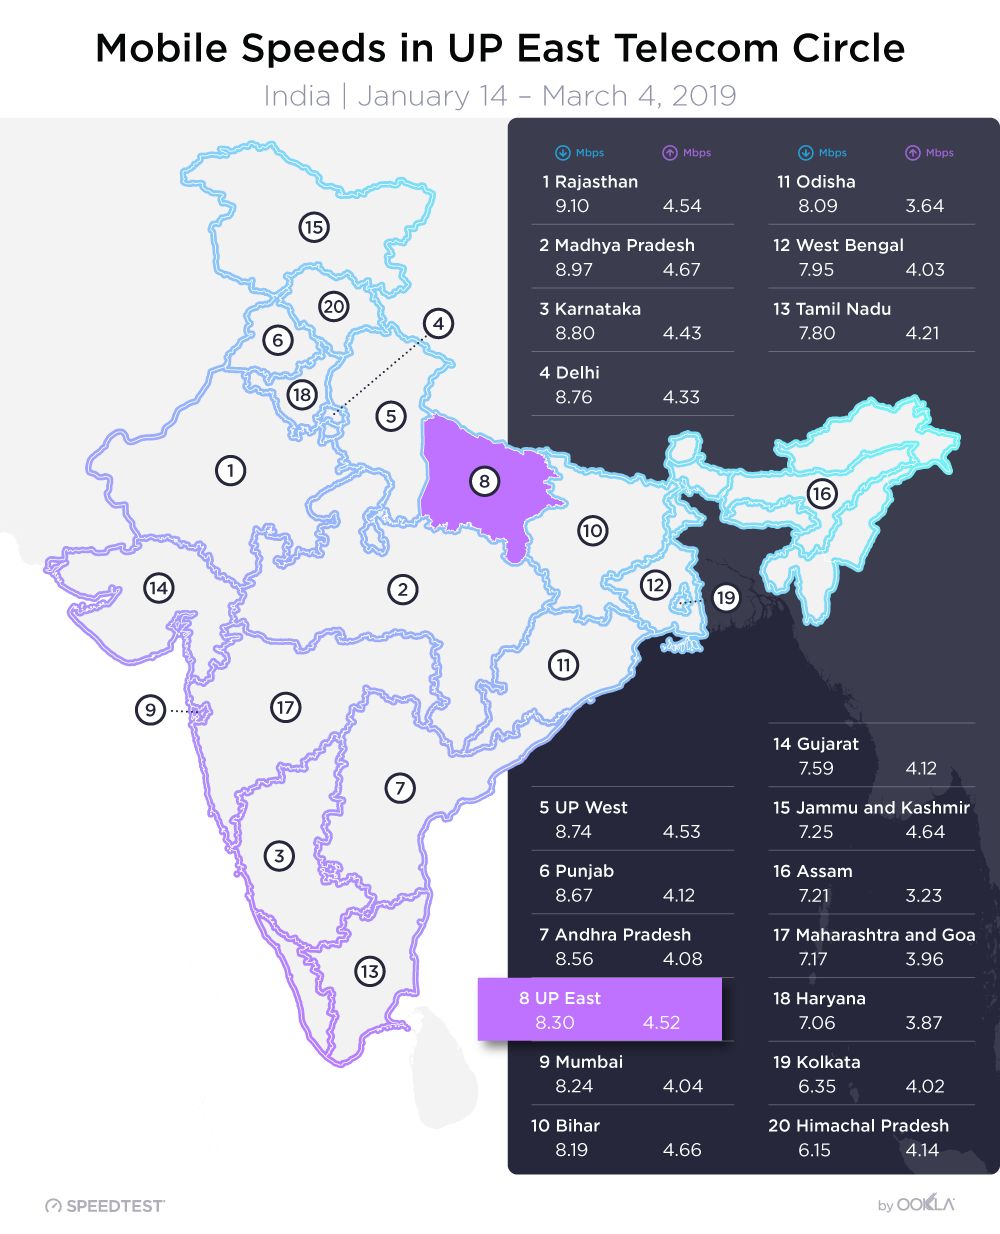
Customers visiting from seven telecom circles (Rajasthan, Madya Pradesh, Karnataka, Delhi, UP West, Punjab and Andhra Pradesh) showed faster mean download speeds in eastern Uttar Pradesh than local customers. The Rajasthan telecom circle showed the fastest mean download speed when “roaming” in UP East at 9.10 Mbps, 9.6% faster than the local UP East download speed.

Customers visiting in UP East from 12 telecom circles (Himachal Pradesh, Kolkata, Haryana, Maharashtra and Goa, Assam, Jammu and Kashmir, Gujarat, Tamil Nadu, West Bengal, Odisha, Bihar and Mumbai) saw slower mean download speeds than local UP East customers. The Himachal Pradesh telecom circle showed the slowest mean download speed when “roaming” in UP East at 6.15 Mbps, 25.9% slower than the local UP East download speed.

Even when “roaming” across states, people remain on 4G

We also compared the percentage of time customers spent on 4G in their home telecom circles with the time spent on 4G when they were “roaming” in UP East during the Kumbh Mela. Time spent on 4G includes on- and off-network connections. We excluded the Assam, Jammu and Kashmir, Kerala, North East, and Himachal Pradesh telecom circles for insufficient data.

Time Spent on 4G in Home Telecom Circle and While Roaming Domestically
India | January 14-March 4, 2019
Telecom Circle Time on 4G at Home Time on 4G in UP East Difference
West Bengal 81.8% 92.2% 12.7%
Odisha 92.9% 96.8% 4.2%
UP West 85.9% 89.2% 3.9%
Bihar 90.6% 92.8% 2.4%
Delhi 84.3% 86.2% 2.3%
Kolkata 89.0% 89.7% 0.7%
Haryana 90.2% 90.5% 0.4%
UP East 90.0% 90.0% 0.0%
Rajasthan 89.7% 89.3% -0.4%
Andhra Pradesh 88.0% 87.5% -0.6%
Tamil Nadu 88.7% 87.8% -0.9%
Maharashtra and Goa 82.6% 81.2% -1.7%
Punjab 89.9% 87.4% -2.8%
Gujarat 87.7% 85.3% -2.8%
Mumbai 88.0% 83.8% -4.7%
Madhya Pradesh 89.8% 84.1% -6.4%
Karnataka 91.0% 84.9% -6.7%

The percentage of time consumers spent on 4G was remarkably similar in their home telecom circles and when “roaming” in UP East. The outliers were customers from West Bengal (who were connected to 4G 12.7% more frequently in UP East than when they were at home) and those from Madhya Pradesh and Karnataka (who were connected to 4G 6.4% and 6.7% less frequently, respectively, than they were at home).

Managing an influx of 100 million or more additional people is an amazing feat for a mobile network and India’s top four mobile operators held up relatively well. Customers from some parts of the country even saw a faster download speed than the locals. 4G usage also held up relatively well no matter which part of the country Indian pilgrims were visiting from.

Ookla retains ownership of this article including all of the intellectual property rights, data, content graphs and analysis. This article may not be quoted, reproduced, distributed or published for any commercial purpose without prior consent. Members of the press and others using the findings in this article for non-commercial purposes are welcome to publicly share and link to report information with attribution to Ookla.

| March 14, 2019

Ditch the Lag: Cities with Great Gaming Culture and Low Ping

Yes, you can game from anywhere with an internet connection. But if you’re at all competitive, it’s nice to play from somewhere with low ping and fast internet speeds. Plus when you need to leave the house, it’s extra nice to know you’re also surrounded by gamer culture. We’ve examined February 2019 Speedtest results in 35 cities that are known for their esports events, gaming conferences, game companies and more to find out who has the advantage and ranked them based on their ping.

The top contenders

Eleven_Gaming_Cities_0219

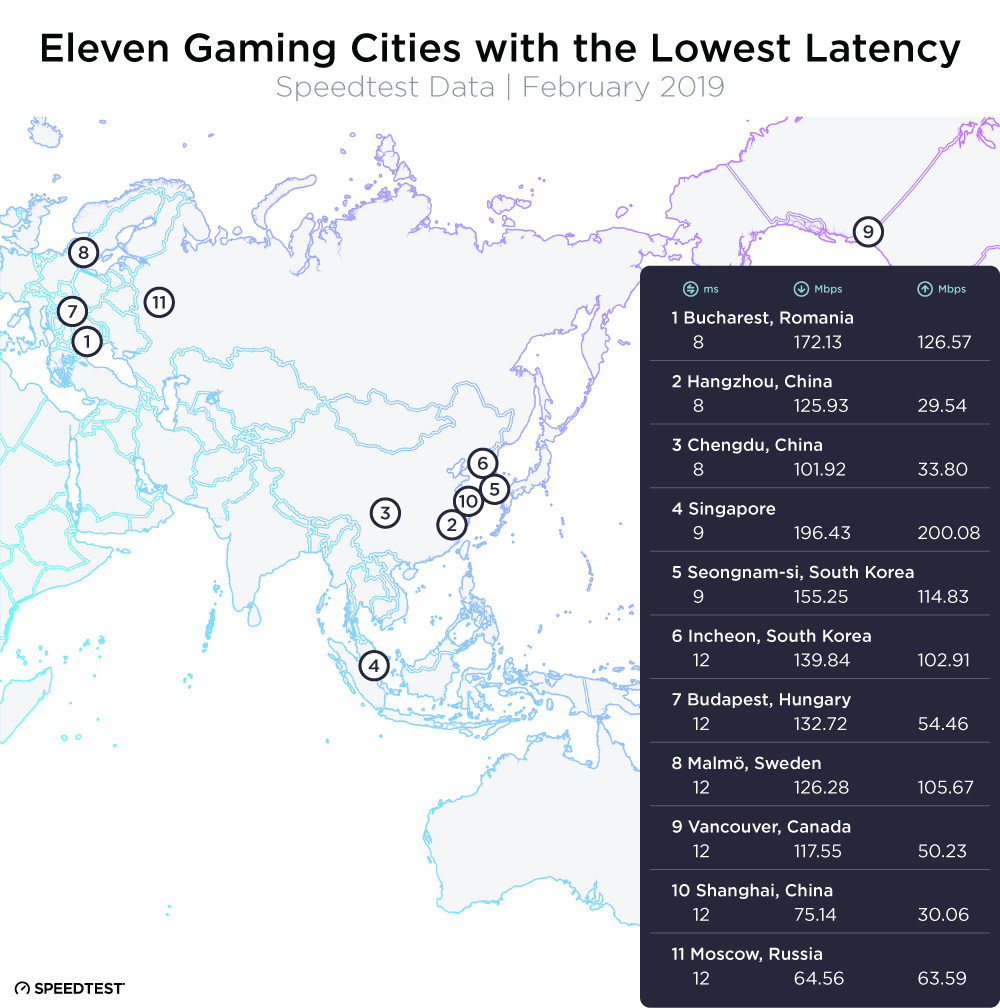
First place Bucharest, Romania is home to super-low ping, a lightning fast download speed and a thriving gaming culture. From Bucharest Gaming Week (which includes the CS:GO Southeast Europe Championship and the FIFA National Tournament) to their numerous local game studios, Bucharest is a great place to be a gamer whether you’re online or out and about.

The next five gaming cities with the lowest pings are all in Asia. Hangzhou, China comes in second overall with a fast ping and world-class download speeds. This city is so devoted to its gamers that it opened a $280 million gaming “city” in 2018 and plans 14 new esports arenas before 2022. Coming in third, Chengdu, China has an equally low ping to our first two contenders and serves as one of two host locations in China for the Global Mobile Game Confederation (GMGC). Both Hangzhou and Chengdu are also franchise holders in the Overwatch League, giving local gaming fans something to cheer about. Fourth place Singapore, host of the 5th Annual GameStart Convention in October 2018, had only a slightly slower ping than the first four cities and the fastest download speed of any of the cities we considered.

South Korea is home to the fifth and sixth best cities for gamers. A satellite city of Seoul, Seongnam-si boasts the Pangyo Techno Valley (a.k.a. the Silicon Valley of Korea) and numerous game development companies. Perfect for a city with a 9 ms ping. Though Incheon’s ping was a little slower at 12 ms, gamers there can console themselves with the city’s gamer cred — the 2018 League of Legends World Championship was held in Incheon’s Munhak Stadium.

Coming in at number seven, Budapest, Hungary is an emerging game city, having hosted its first big esports event (the V4 Future Sports Festival) in 2018, but a 12 ms ping makes them a strong contender. More established Malmö, Sweden is number eight with a slightly slower average download speed but the city is headquarters to Massive Entertainment, creators of Tom Clancy’s The Division series, Far Cry 3, Assassin’s Creed: Revelations and many more.

Vancouver, Canada, North America’s only qualifier for the top gaming cities list, comes in at number nine with a 12 ms ping and many gaming companies including the Canadian arms of Nintendo of Canada and EA (Electronic Arts). We included both Shanghai, China and Moscow, Russia on the top gamer cities list as both had a 12 ms ping as well, though the internet speeds in Shanghai are superior. Shanghai will also host the International Dota 2 in 2019 while Moscow is known for Epicenter.

The rest of the pack

Notably absent from the list above is most of the western hemisphere. Cities in North America were held back by their high pings. Cities in South America suffered from high pings and also slow internet speeds — something that esports leagues have complained is a barrier to investment.

Our full list of gaming cities provides wider geographical representation, even if the internet performance is not always as stellar. You’ll find Los Angeles in 27th place, behind Seattle, Boston and Las Vegas. And São Paulo, Brazil has the best showing in Latin America at 23rd.

Internet Performance in 35 Cities with a Gaming Culture
Speedtest Results | February 2019
City Ping (ms) Mean Download (Mbps) Mean Upload (Mbps)
Bucharest, Romania 8 172.13 126.57
Hangzhou, China 8 125.93 29.54
Chengdu, China 8 101.92 33.80
Singapore 9 196.43 200.08
Seongnam-si, South Korea 9 155.25 114.83
Incheon, South Korea 12 139.84 102.91
Budapest, Hungary 12 132.72 54.46
Malmö, Sweden 12 126.28 105.67
Vancouver, Canada 12 117.55 50.23
Shanghai, China 12 75.14 30.06
Moscow, Russia 12 64.56 63.59
Oslo, Norway 13 115.46 69.03
Hong Kong, Hong Kong (SAR) 14 167.59 161.14
Zürich, Switzerland 14 144.36 109.39
Seattle, United States 15 138.50 79.88
Stockholm, Sweden 15 134.16 93.83
Auckland, New Zealand 15 92.05 53.30
Toronto, Canada 16 134.75 67.42
Boston, United States 17 152.42 60.87
Las Vegas, United States 17 141.69 41.22
Chennai, India 17 48.40 42.93
Cologne, Germany 18 63.77 18.36
São Paulo, Brazil 18 46.43 21.57
Jakarta, Indonesia 18 17.88 10.21
Mumbai, India 19 23.40 19.26
Paris, France 20 161.04 93.68
Los Angeles, United States 20 121.00 23.57
London, United Kingdom 20 63.58 23.18
Rio de Janeiro, Brazil 20 36.50 13.33
Buenos Aires, Argentina 21 34.31 6.40
Katowice, Poland 22 83.99 20.91
Mexico City, Mexico 25 37.66 15.39
Sydney, Australia 25 34.20 9.61
Santiago, Chile 26 56.13 18.49
Tokyo, Japan 28 99.24 101.90

Of course, die-hard gamers will know that a low ping in your city won’t necessarily save you if you’re playing on a distant server.

What’s the ping like in your city? Take a Speedtest and see if your connection is hurting your gameplay.

Ookla retains ownership of this article including all of the intellectual property rights, data, content graphs and analysis. This article may not be quoted, reproduced, distributed or published for any commercial purpose without prior consent. Members of the press and others using the findings in this article for non-commercial purposes are welcome to publicly share and link to report information with attribution to Ookla.

| March 7, 2019

13 Simple Ways to Put Your Speedtest Result to Work

So you took a Speedtest… now what? It’s fun to measure how fast your internet connection is, but you may not realize that you can take those results a step further. We’ve gathered some fantastic ways to put your newfound information to use so you can save yourself time, money and data.

But first a very quick primer on internet testing and what speeds you should be looking for. Skip ahead if you’re already a pro.

How Speedtest works

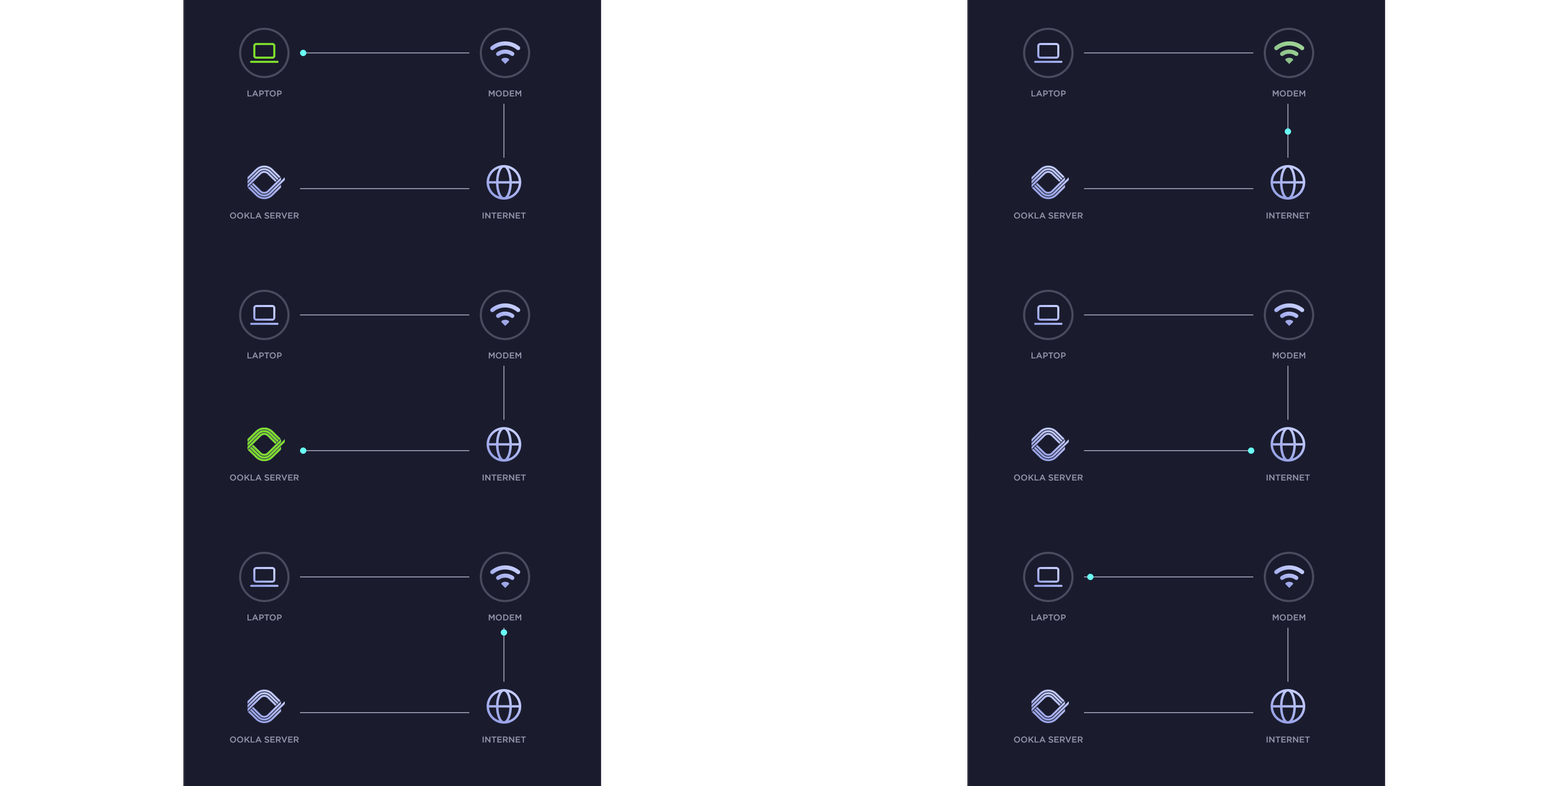
Once you press “Go,” Speedtest sends packets of data up from your device to our network of local servers and back again. This measures the actual speed your connection is experiencing for downloads and uploads and also shows your ping (the time it takes for your connection to respond after you make a request).

how-speedtest-works-3

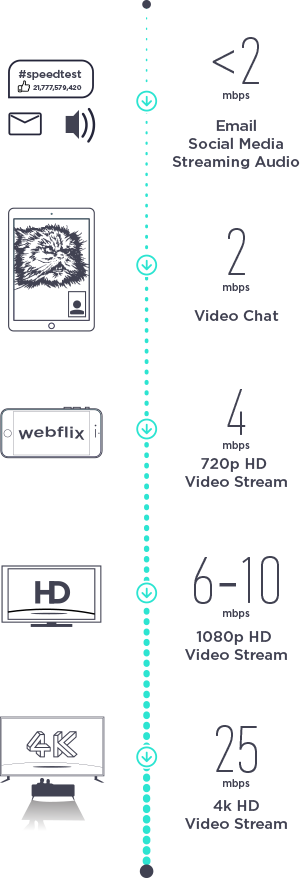
Not all speeds are created equal. You need a much faster connection for streaming video than you do for emailing, for example. Here’s a general guide:


Tips to get the most out of your Speedtest result

Get extra mileage out of your Speedtest result with these simple ideas.

Make work easy

Prepare for video calls

You need strong upload and download speeds for all those video conferences that are rapidly becoming the norm in today’s business environment. Take a Speedtest to make sure that your upload speed is at least 2 Mbps so you don’t drop a call with a very important client.

Work remotely (and efficiently)

Take a Speedtest to see which coffee shops will keep you connected while you “work from home.”

Know when to upload large files

If you frequently upload large files — videographers, photographers and architects, we’re looking at you — you know how very long that can take. Before you resign yourself to a lifetime of overnight uploads, experiment with Speedtest throughout the week to see when your upload speeds are best and worst. Then use that information to streamline your workflow.

Network testing and improvement

Troubleshoot your connection

Sometimes it feels like your connection is lagging. But how do you know if it’s your computer, your Wi-Fi extender, your router or something else holding you back? Run Speedtest from different devices in different scenarios (connected to Wi-Fi, hard-wired, in different rooms, etc.) to better understand where your chokepoints are. If nothing helps, try these troubleshooting tips.

Negotiate with your Internet Service Provider (ISP)

If you feel like you’re paying for a lot more speed than you’re getting, take a Speedtest. Then share the result with your ISP to see if they can help you spot neighborhood bottlenecks or maybe adjust your bill to match the speeds you’re actually receiving. Our test is your independent verification of actual speeds.

Compare mobile service

One of the best ways to see which mobile operator is right for you is to get a group of people with different operators to run Speedtest from their phones all at the same time in the same location. You’ll get quick insight into who’s really fastest in your area.

Choose a mobile operator

With background sampling turned on, Android users can see a map of which operators have the best coverage in places that matter to you. That could be at home, work, during your commute or in your favorite leisure spot.

Entertainment and leisure

Save your data

A Speedtest result can tell you whether the Wi-Fi when you’re out and about is good enough to turn your cellular connection off. If it is, you can stream content to your heart’s content without using up your data allowances.

Rate your hotel

The Wi-Fi may be free, but is it good? Take a Speedtest to see if you’re getting a real benefit or if you’re better off paying for a connection somewhere else next time.

Make sure your vacation rental is Wi-Fi-ready

Ask your potential host to share a Speedtest result from the property so you know whether you’ll have to wait until you get home to post all those vacation pics.

Boast about your gigabit connection

You love that you have the fastest connection on the block (or even in the neighborhood). Take a Speedtest and then casually share your results somewhere everyone can see.

Get game-ready

Test your ping to make sure you’re not going to get knocked out early by lag. Your gameplay deserves better than that.

Gain peace of mind

Let’s be real, sometimes it helps just to have independent verification that there really is a problem. Take a Speedtest the next time your connection is lagging and take heart… it isn’t you.

Excited to try some of these out? Try Speedtest today on the web, Android or iOS. If you’re really serious about your internet testing, check out our desktop apps.

Ookla retains ownership of this article including all of the intellectual property rights, data, content graphs and analysis. This article may not be quoted, reproduced, distributed or published for any commercial purpose without prior consent. Members of the press and others using the findings in this article for non-commercial purposes are welcome to publicly share and link to report information with attribution to Ookla.