
Apple’s 5G-capable iPhone 12 is the latest step in the continuous cycle of new technical specifications, new network components, new (or refarmed) radio spectrums and compatible user equipment that aim to deliver enhanced 5G user experience. At Ookla®, we are fortunate to have a front-row seat to observe these advances and we were thrilled when Apple announced its first 5G devices on October 13, 2020. Given the popularity of Apple’s devices, this release marks a major milestone on the way to 5G becoming mainstream.
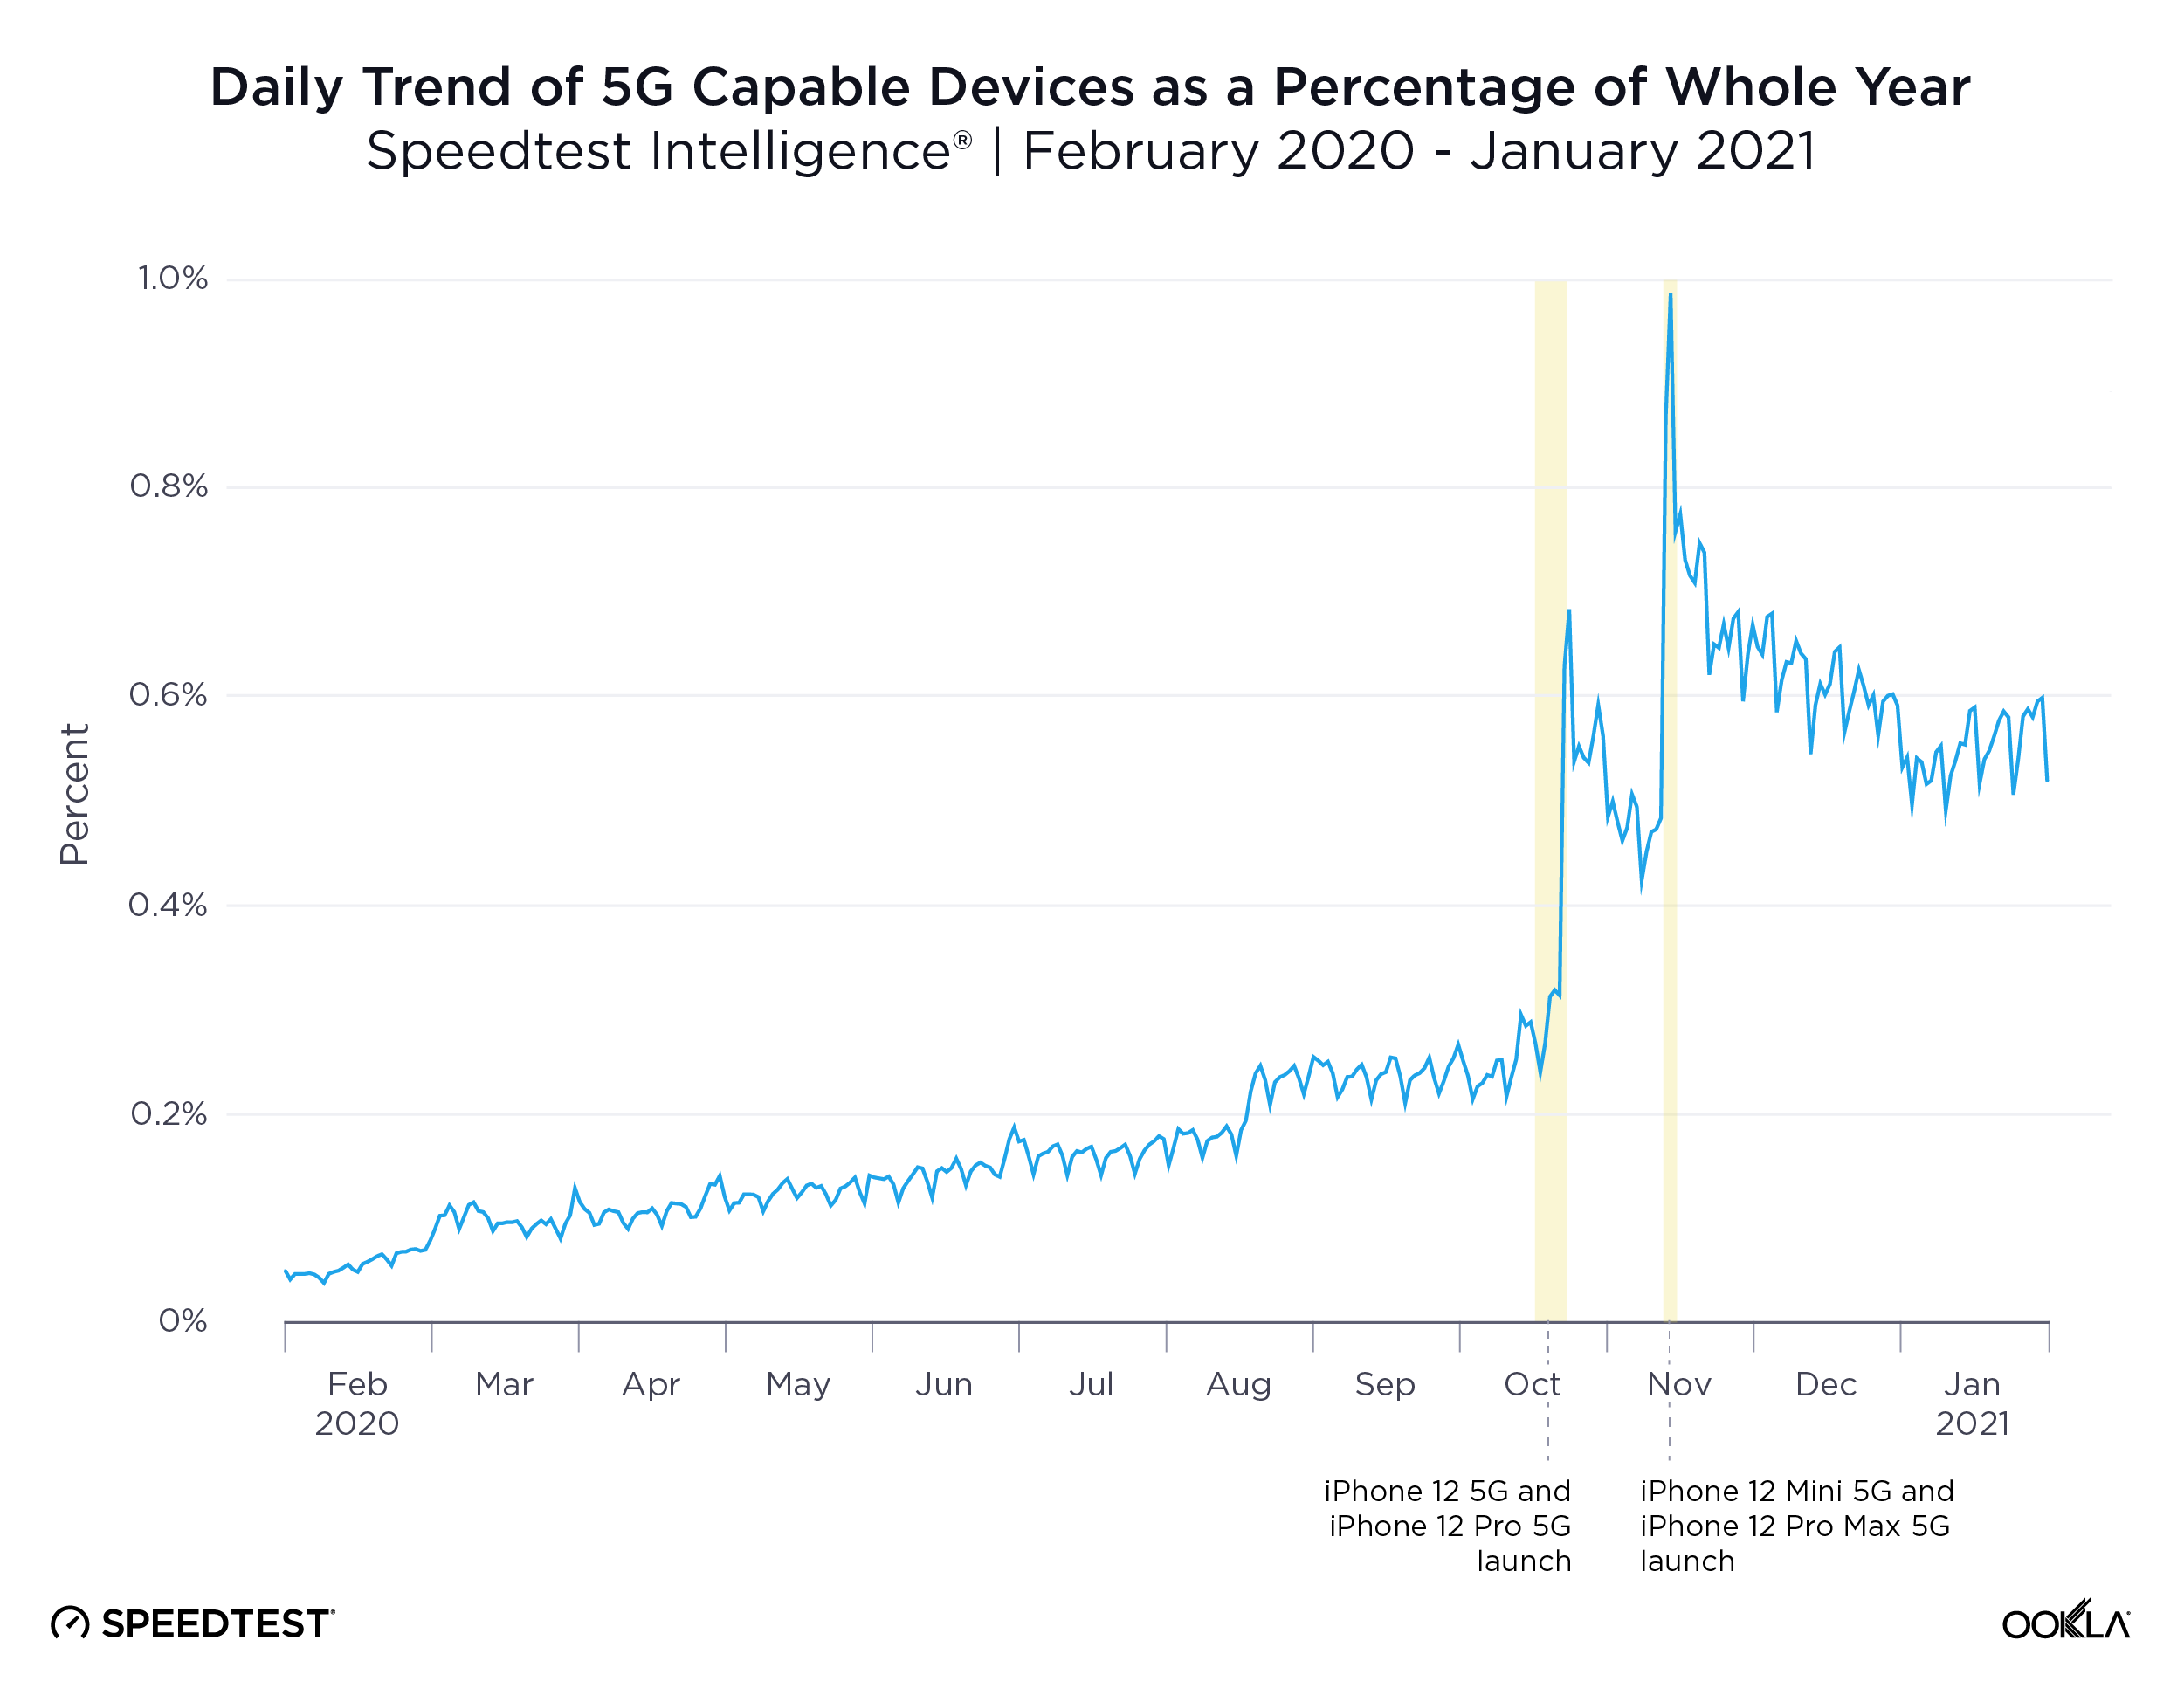
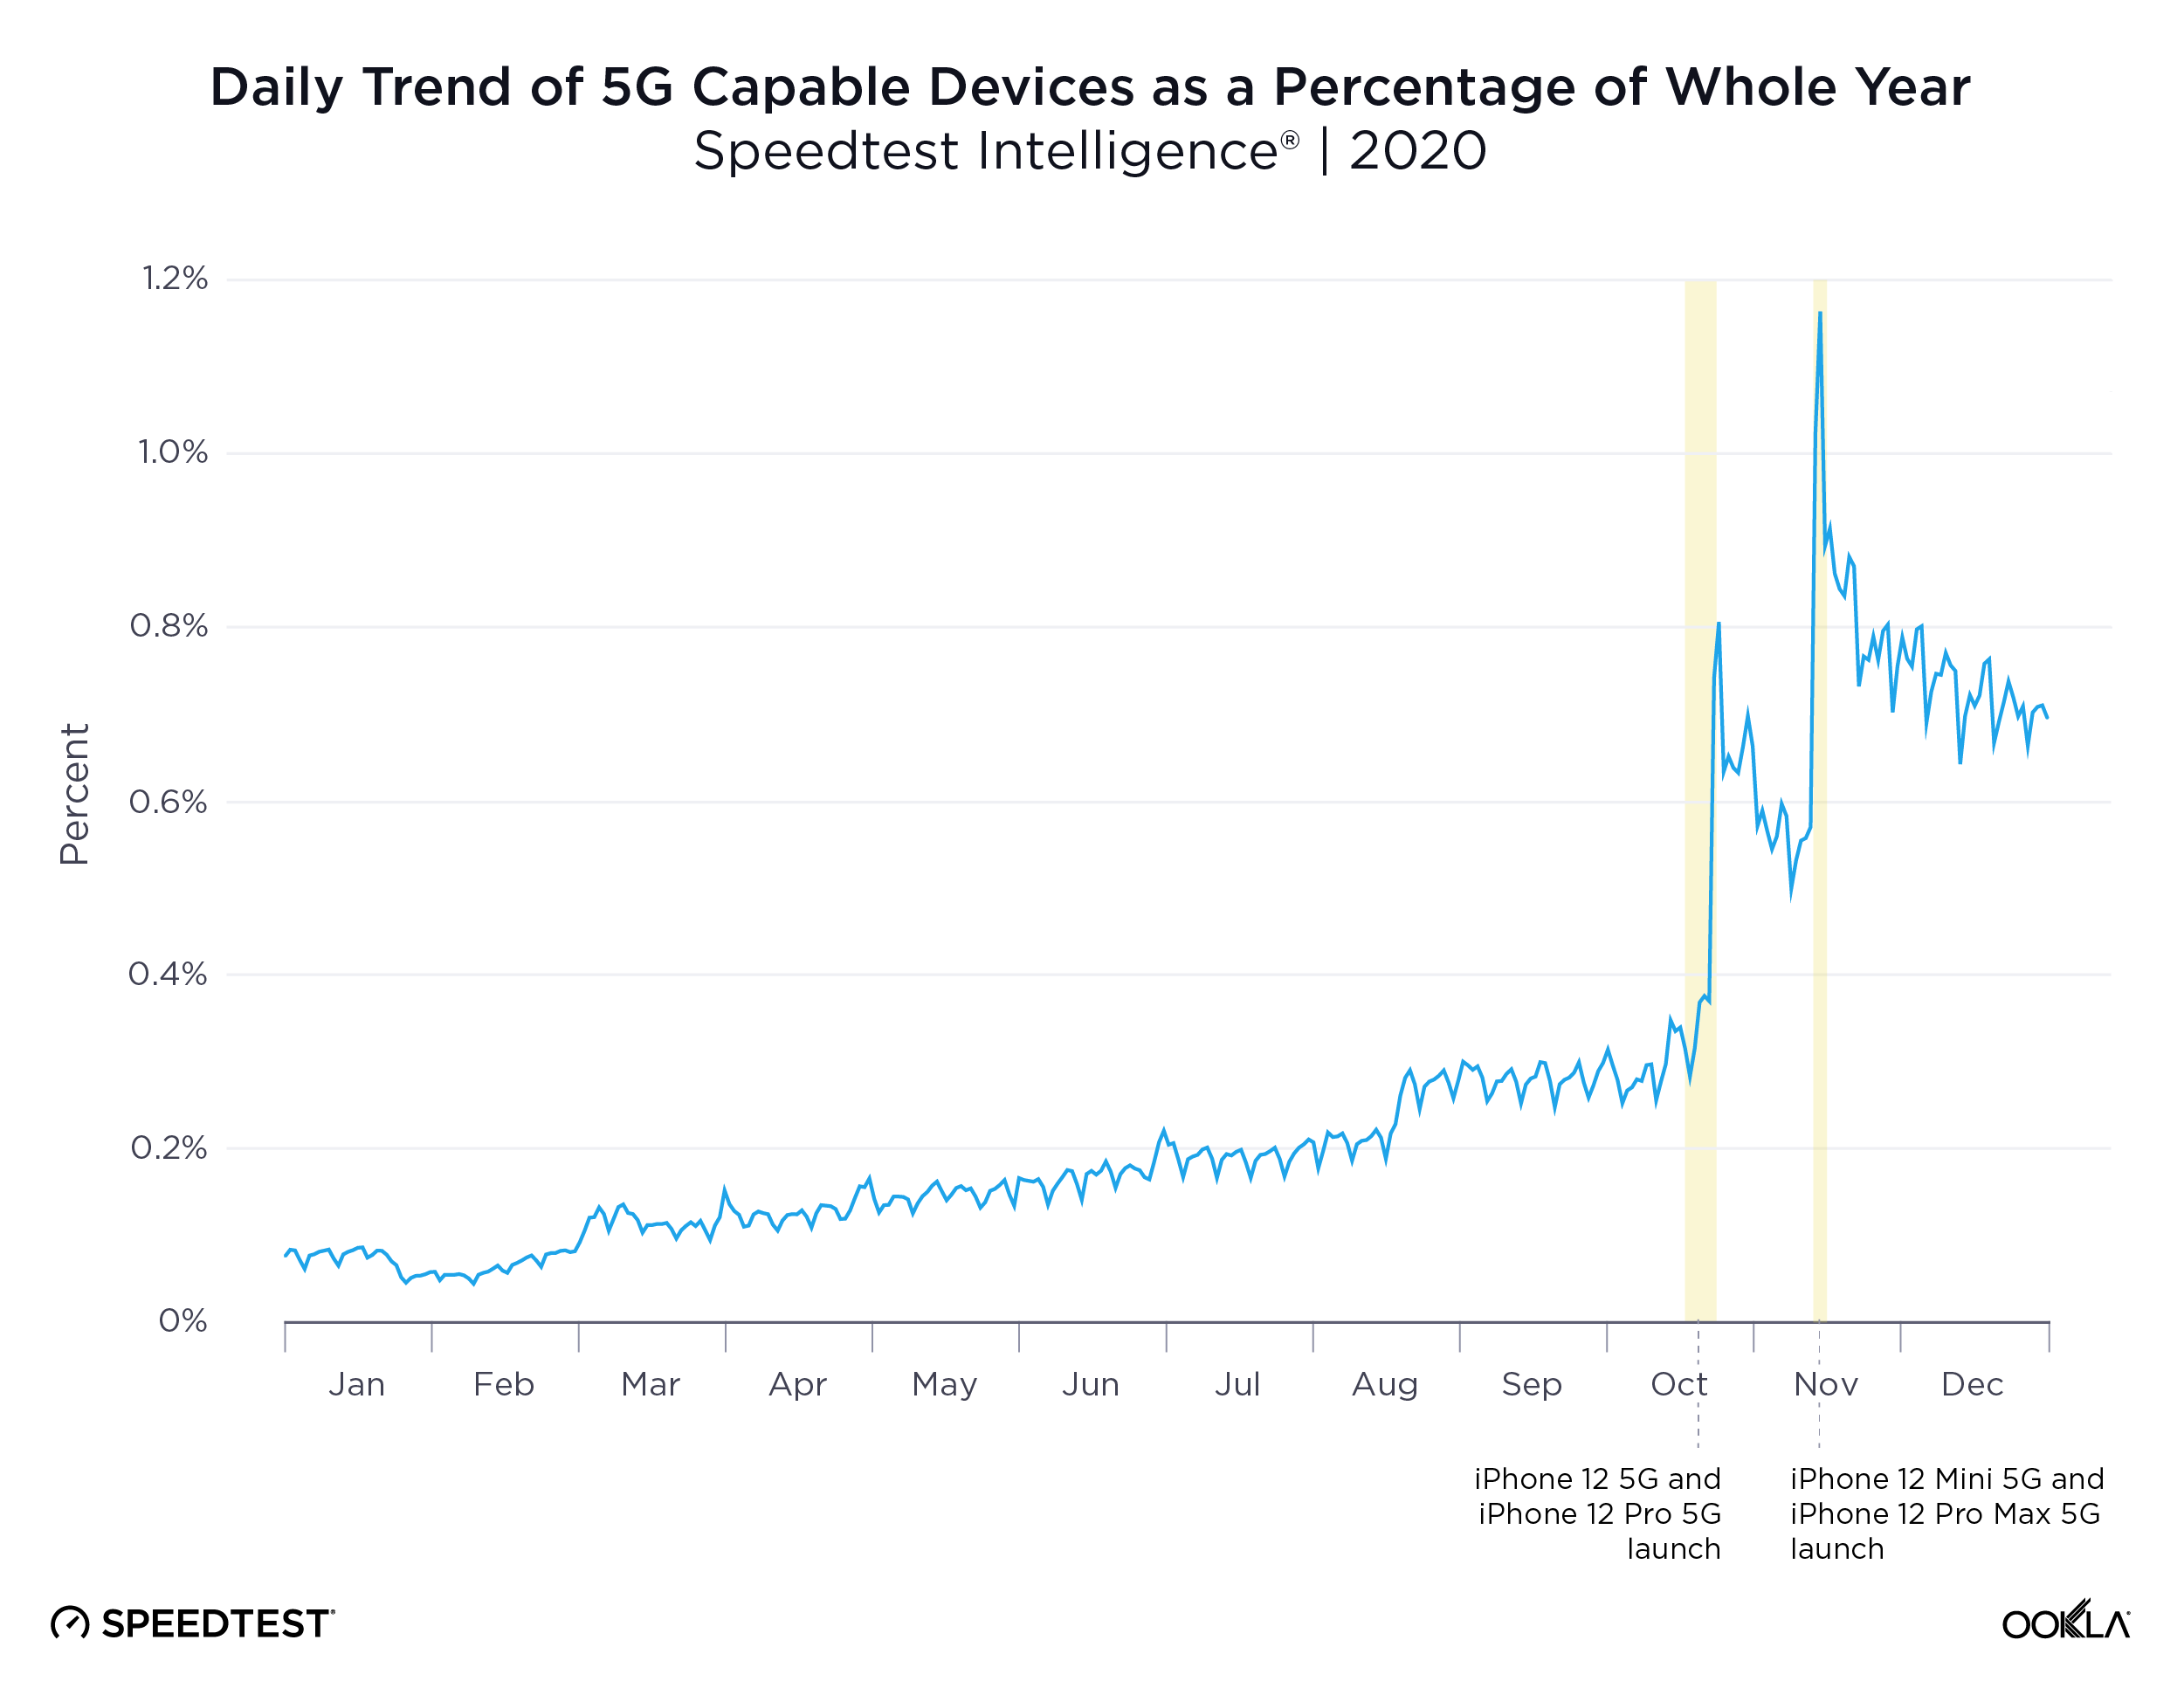
iPhone 12 launch drives spikes in 5G testing
The daily count of unique devices worldwide that are capable of connecting to 5G jumped dramatically when each new iPhone 12 variant launched. We saw a 138.3% increase when comparing the day the iPhone 12 5G and iPhone 12 Pro 5G were released to the mean of the previous week. On the day the iPhone 12 Mini 5G and iPhone 12 Pro Max 5G launched, there was a further 44.3% increase over that one-day spike.
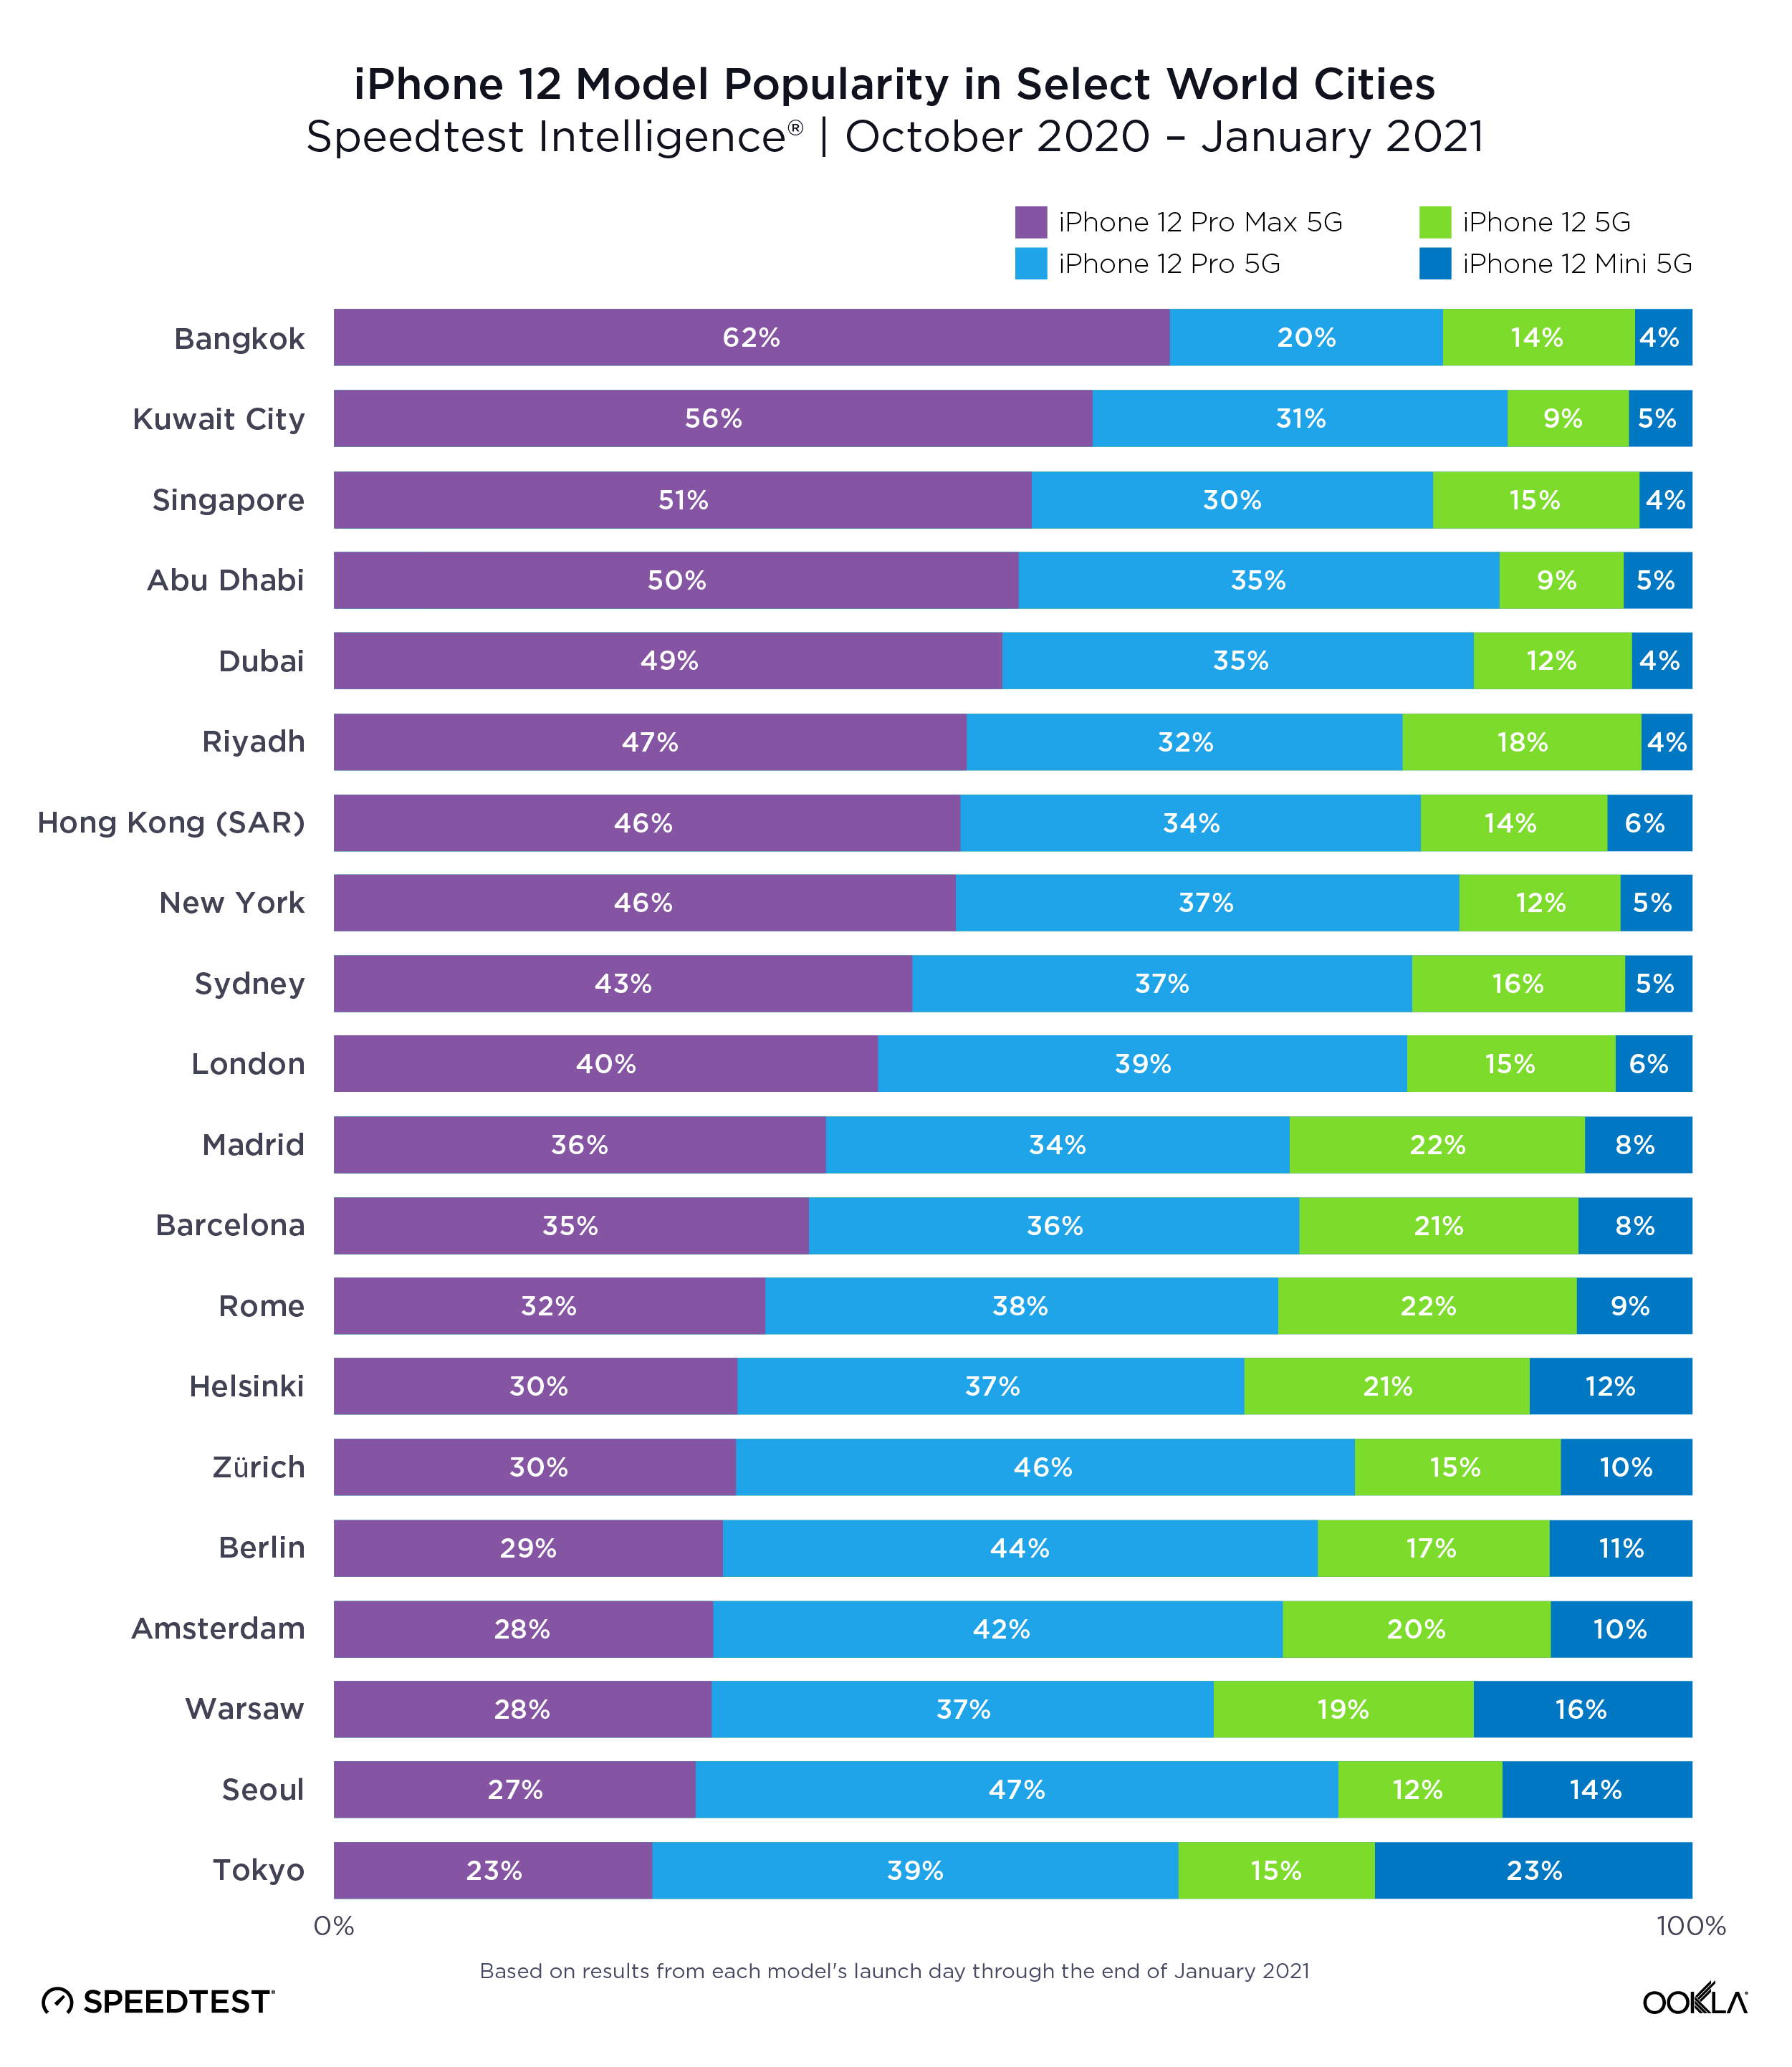
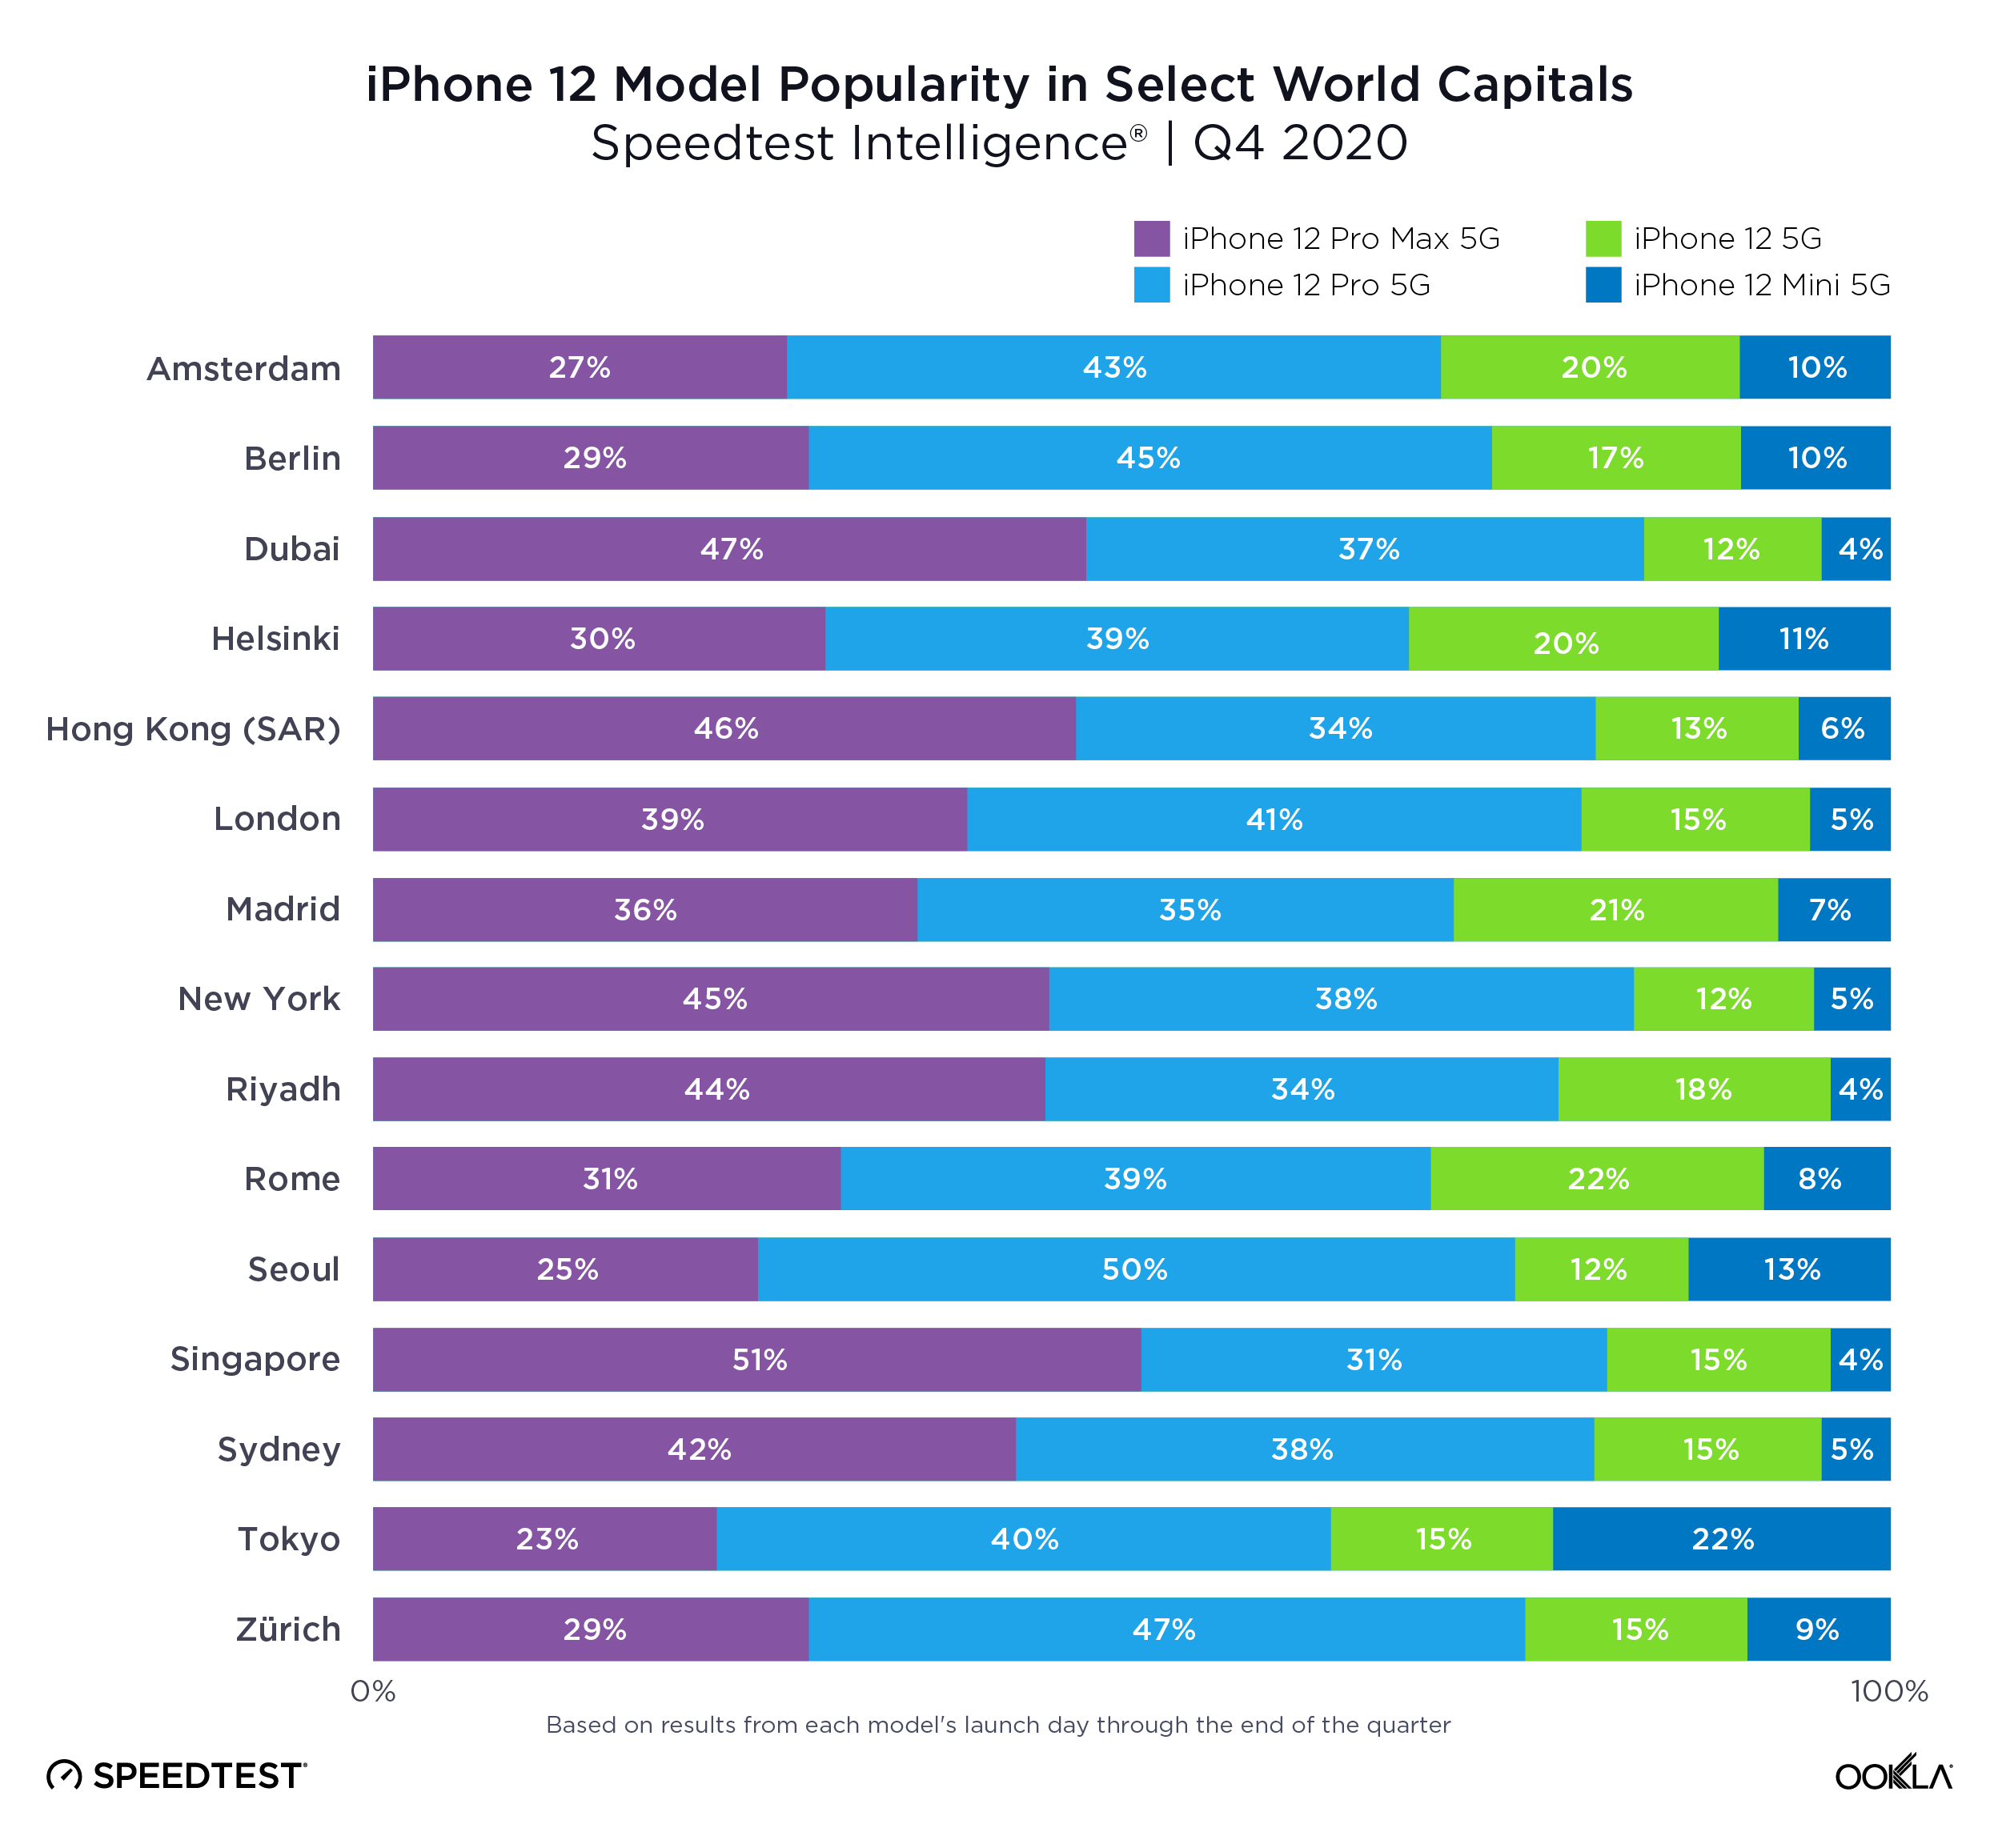
Pro 5G and Pro Max 5G are the most popular iPhone 12 models
We examined Speedtest® results from the launch date of each model through the end of the year to see which iPhone 12 models are the most popular in 15 major cities across the globe. We found that most Speedtest users have opted for the “Pro” models. The iPhone 12 Pro Max 5G showed the highest number of samples among iPhone models in Singapore, Dubai, Hong Kong, New York, Riyadh and Sydney. The iPhone 12 Pro 5G showed the most samples in London, Madrid, Rome, Helsinki, Zürich, Berlin, Amsterdam, Seoul and Tokyo. While the more affordable models were less popular than the Pro models across all the cities on our list, the iPhone 12 Mini saw the most adoption in Tokyo and the iPhone 12 5G saw the most adoption in Rome.
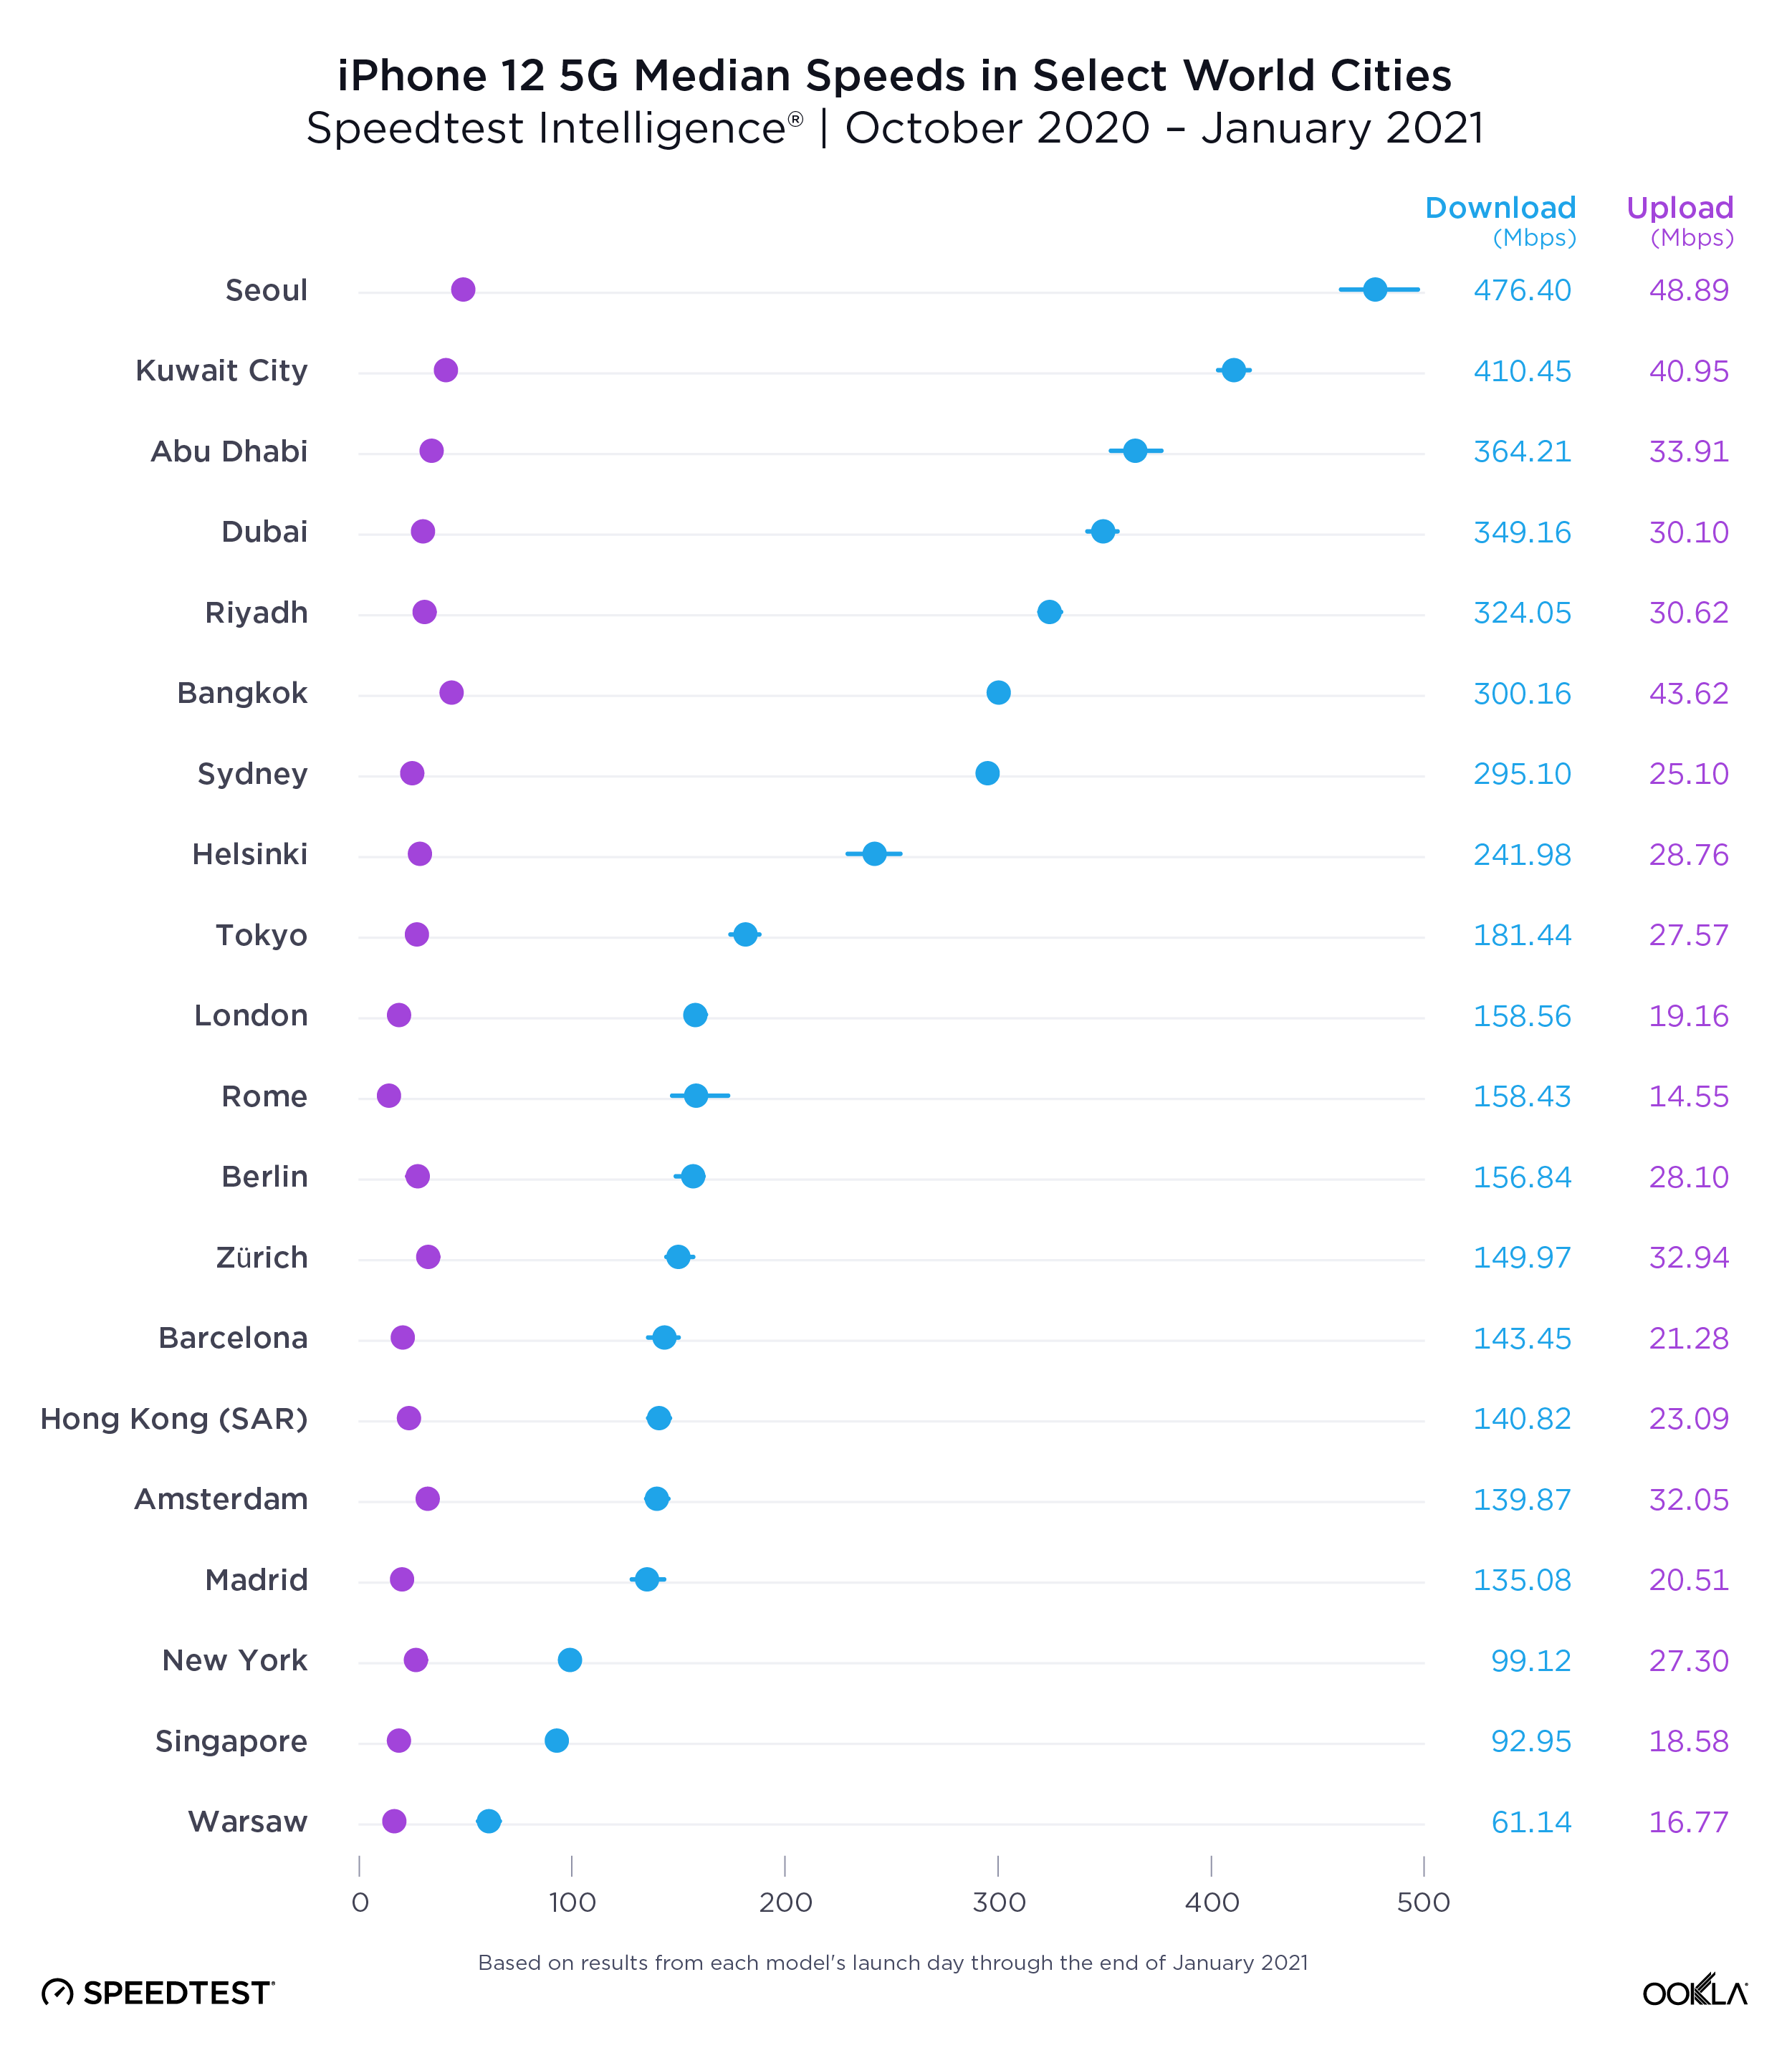
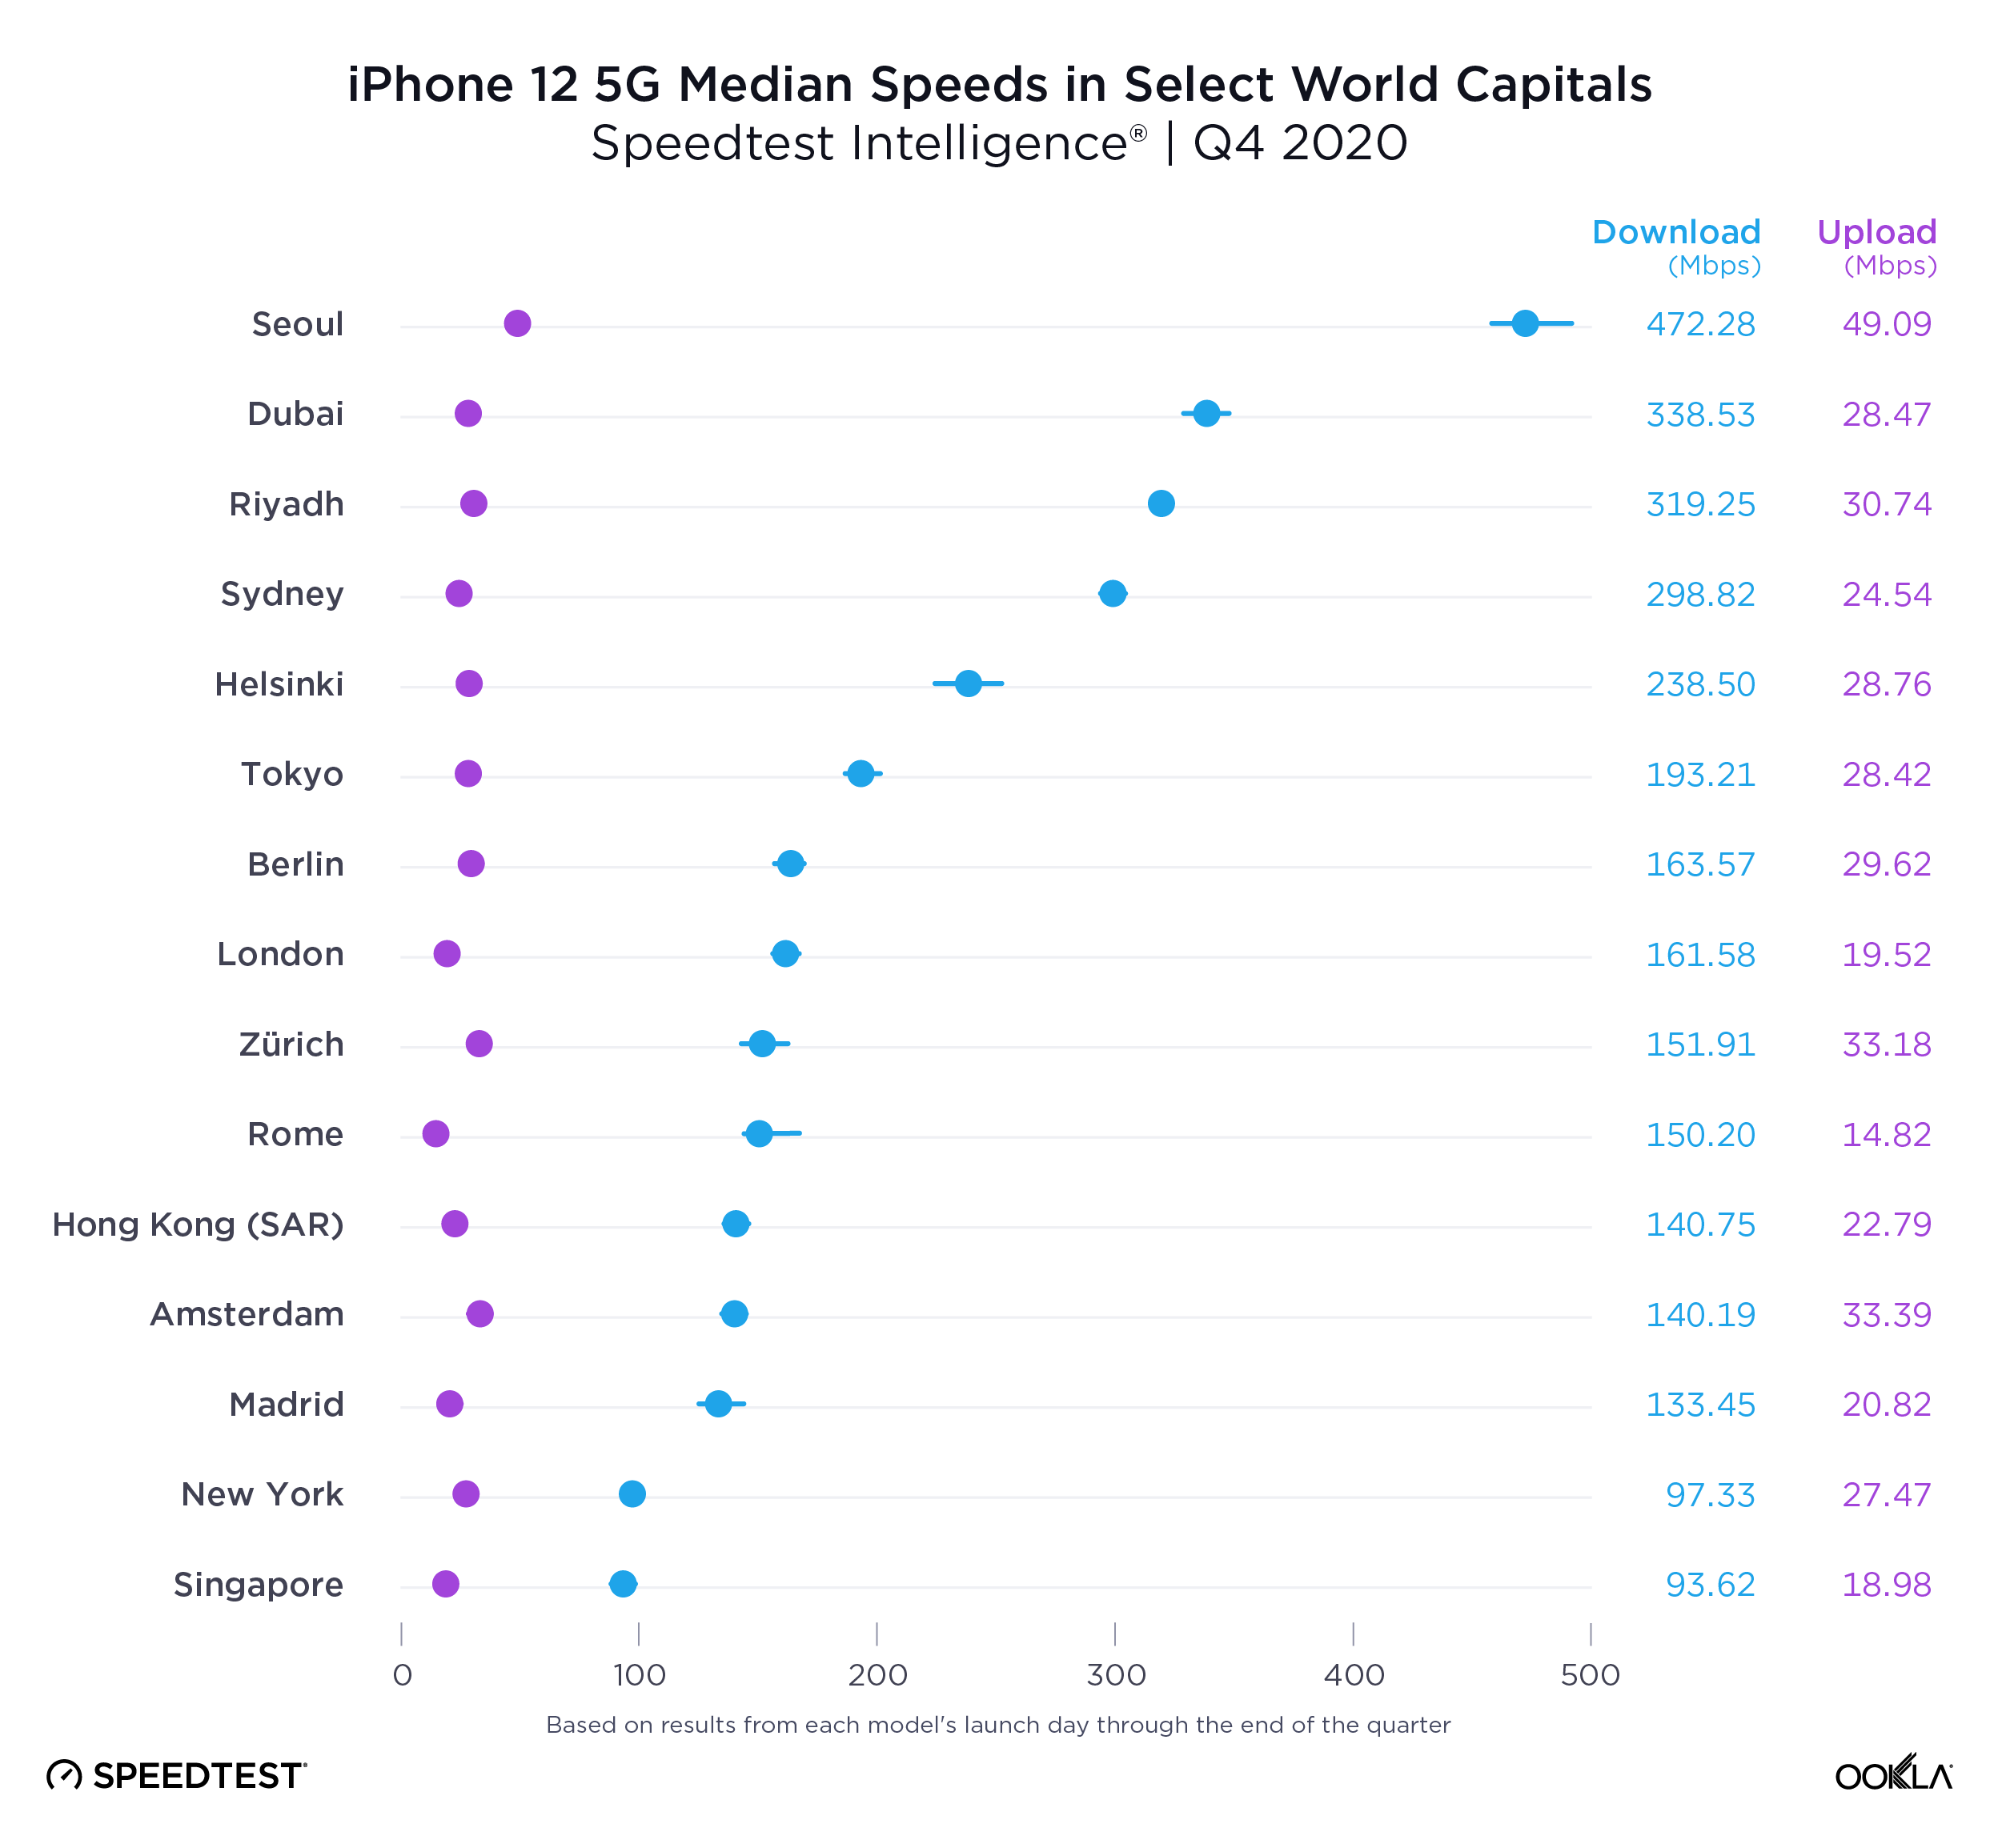
Seoul tops list of iPhone 12 5G speeds
We analyzed Speedtest Intelligence® data for iPhone 12 devices in the same 15 cities and found that Seoul had the fastest median speed over 5G, followed by Dubai and Riyadh. Seoul also had the fastest upload speed by a considerable margin. This is not a surprise given reports that there are more than 100K 5G base stations in South Korea. It is interesting to note that European cities are relatively close to each other in terms of median download and upload speeds. That is good news for the 5G action plan of the European Commission and their target of having uninterrupted 5G coverage on major terrestrial transport paths by 2025.
Each of these markets utilizes its own unique approach to 5G. Today, the United States is the only market where iPhone 12 models support 5G high-bands, namely n260 and n261. This is to support existing commercial 5G deployments in the mmWave spectrum across all three Tier 1 operators.
Elsewhere on the globe mid-band (specifically the 3300-3800 MHz range in most countries) is the most common frequency range for initial 5G roll-outs. There are several reasons for this, ranging from principles of electromagnetic wave propagation to marketing strategies. High-band frequency ranges (above 24 GHz with 400-800 MHz contiguous bandwidth) can do wonders in terms of download speeds, but due to limited propagation characteristics, it can be challenging to provide a mmWave coverage layer across entire markets. In order to mitigate this well-known challenge, operators tend to rely on the lower frequency bands for coverage and selectively deploy mmWave applications in targeted areas (such as high-traffic locations).
Depending on market dynamics and spectrum availability, most providers choose non-standalone (NSA) 5G configuration with an LTE anchor. Operators with limited amounts of FR1 spectrum tend to use dynamic spectrum sharing (DSS), a feature which allows both LTE and New Radio (NR) operation on the same slice of spectrum at the same time. This feature enables a relatively easy deployment of 5G coverage layers, and is a stepping stone to standalone 5G (5G SA). In addition to these commonly observed strategies, a few operators are considering pushing the limits of digital convergence with open radio access networks (RAN).
No matter which strategy an operator chooses, one important fact about 5G does not change: access to a trio of low, mid and high bands and a strategy for rolling out 5G SA is critical. Deployment of the 5G SA core unlocks the potential of enhanced mobile broadband (eMBB), ultra-reliable low latency communication (uRLLC) and massive machine type communications (mMTC).
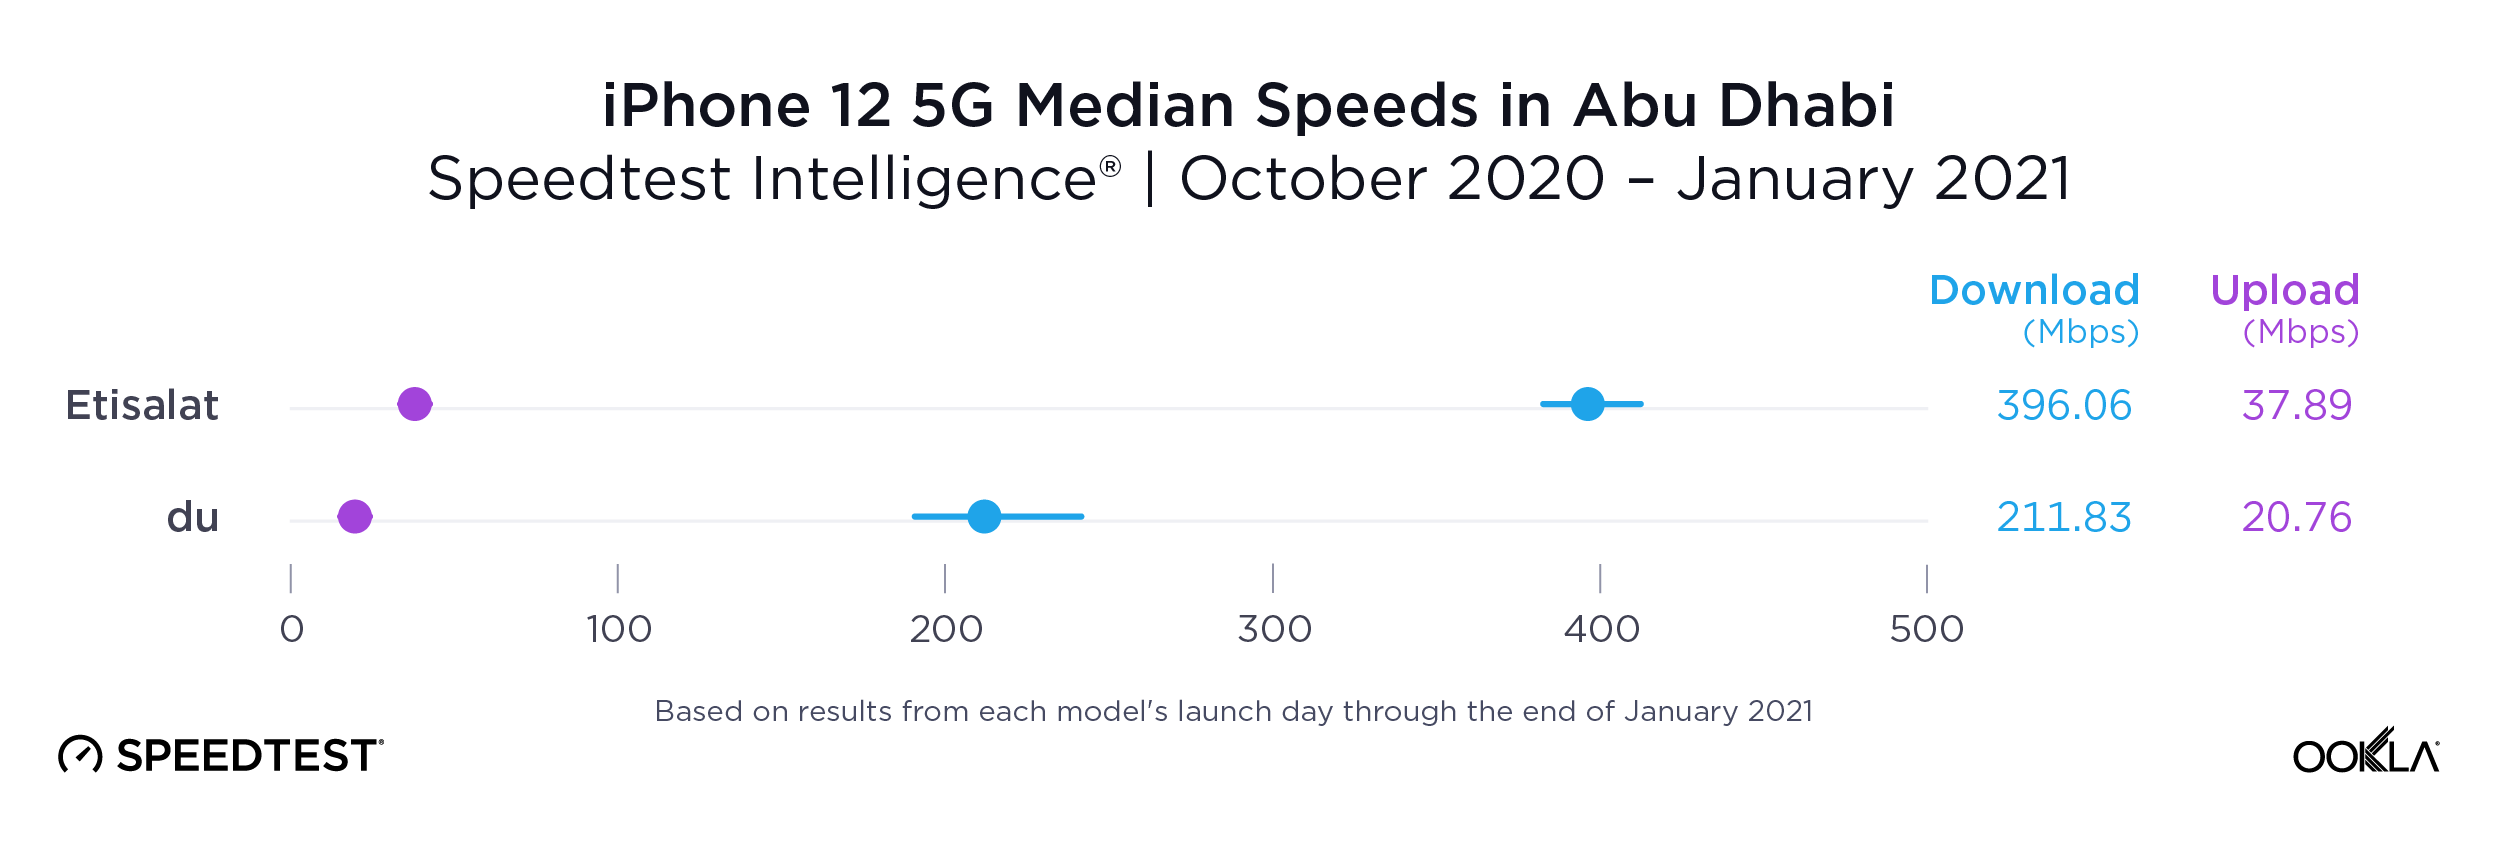
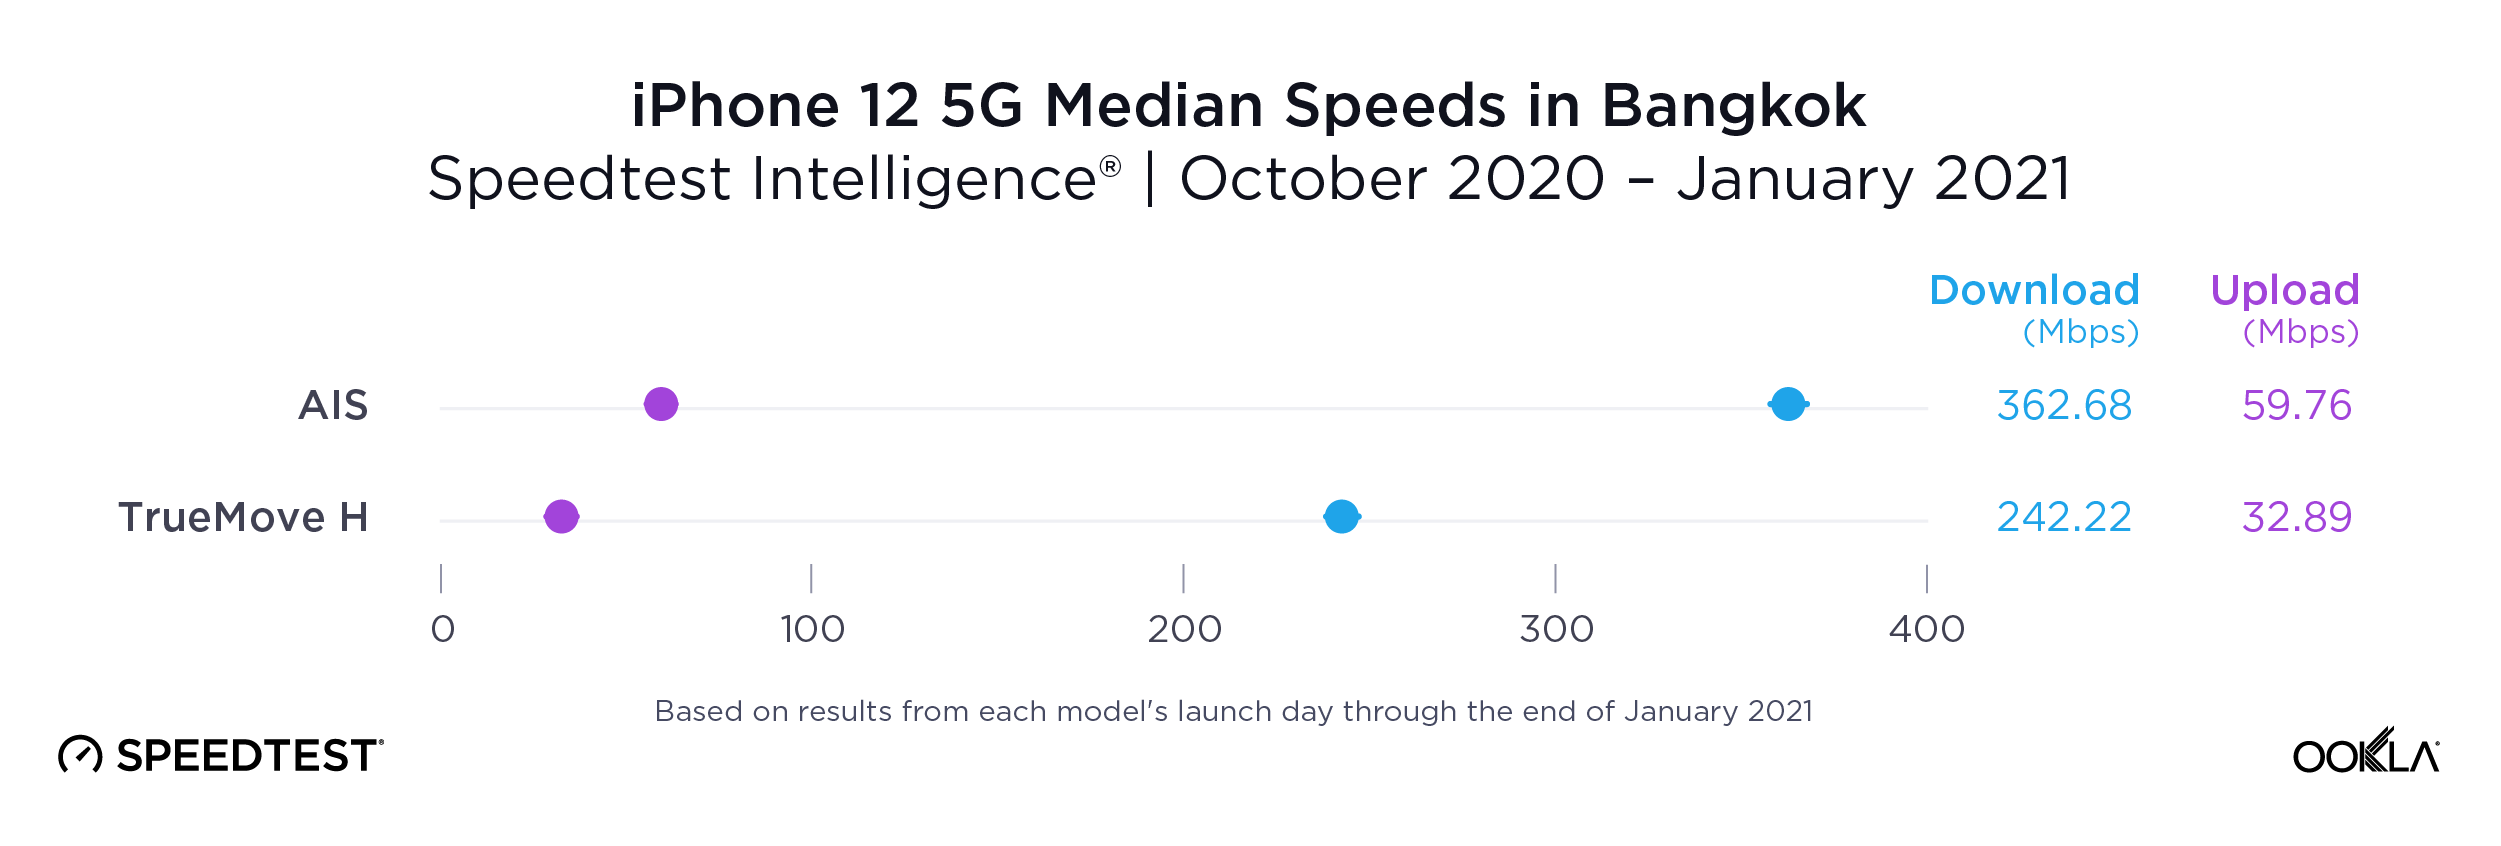
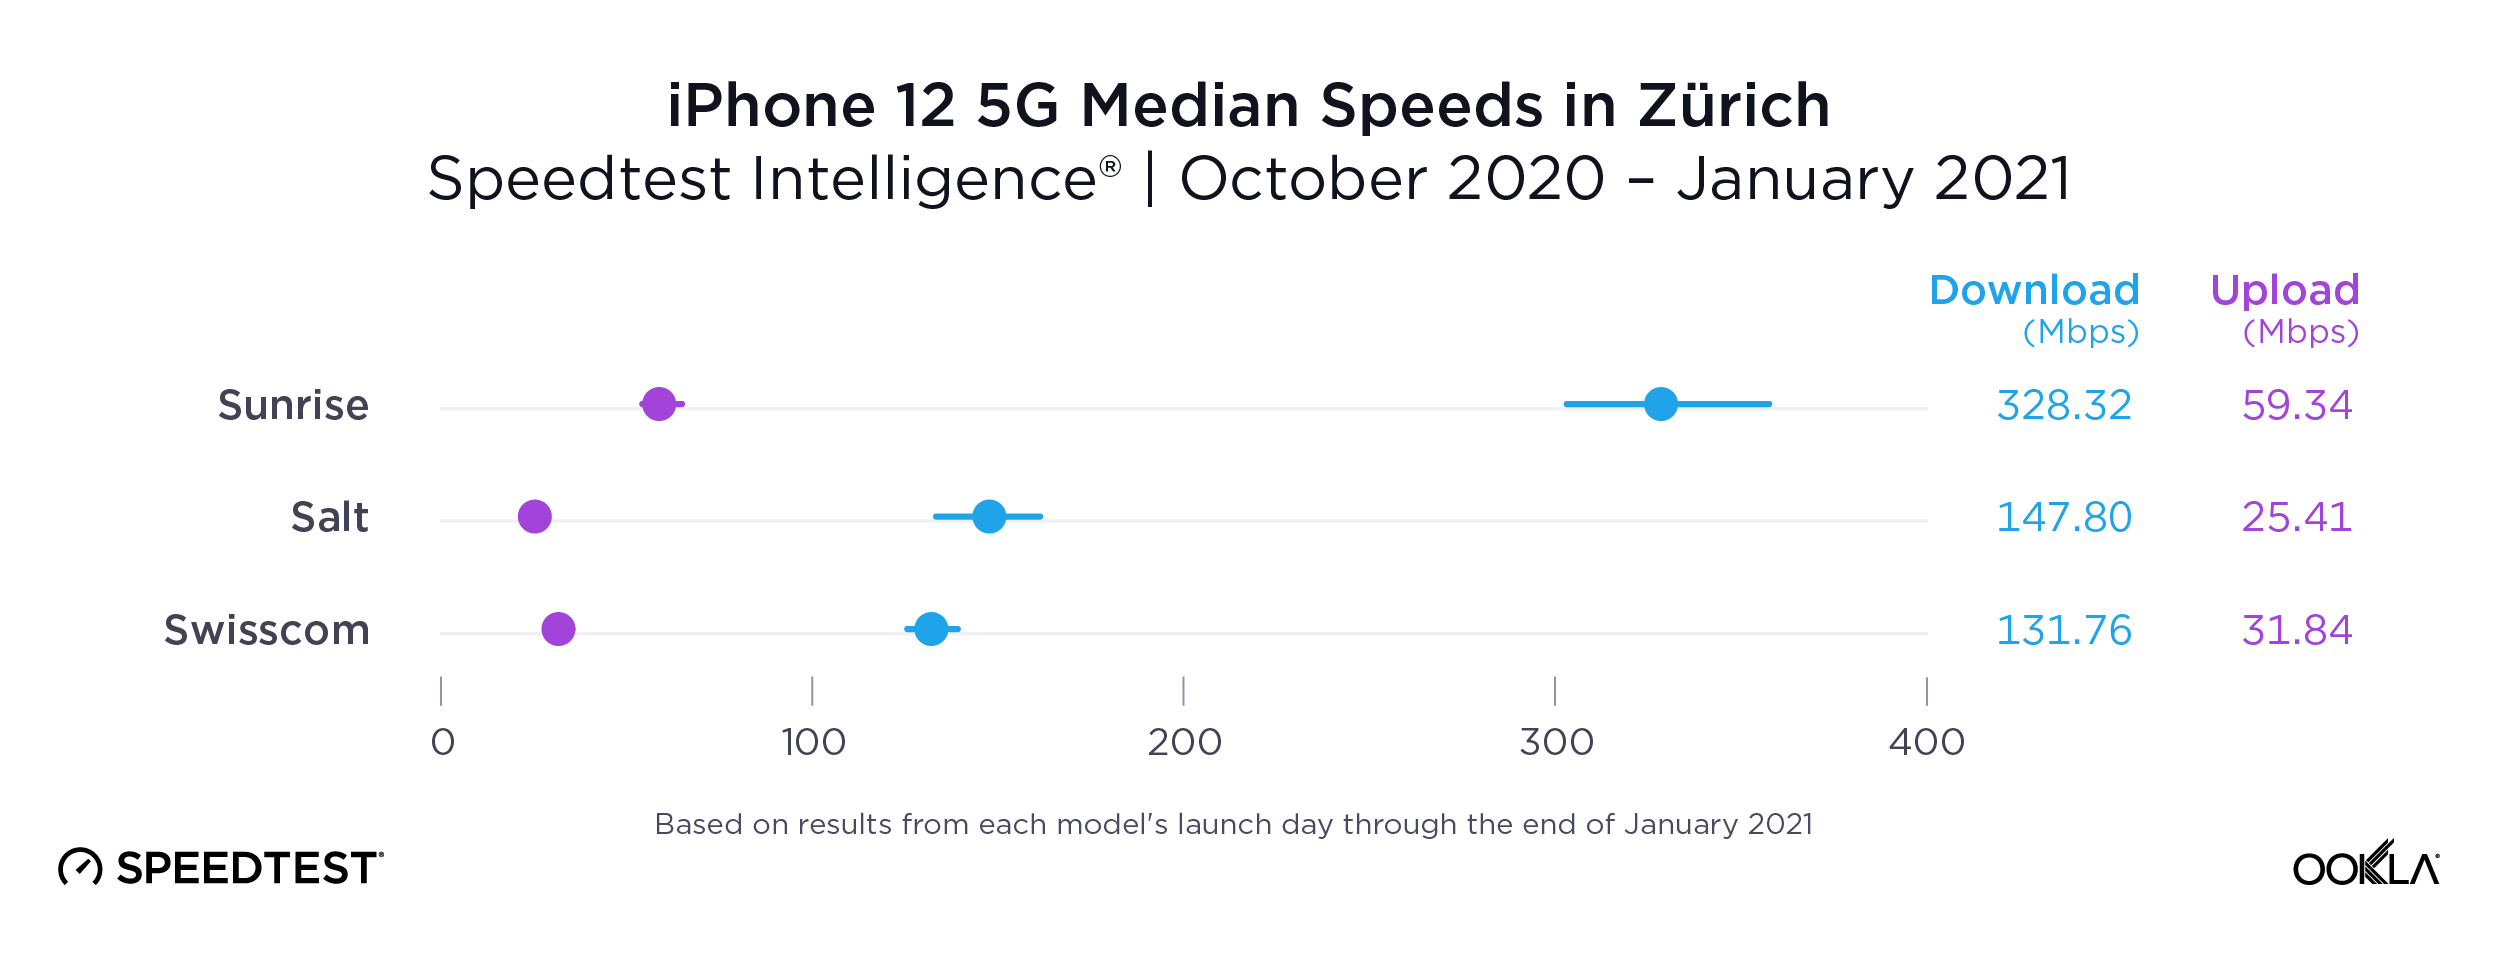
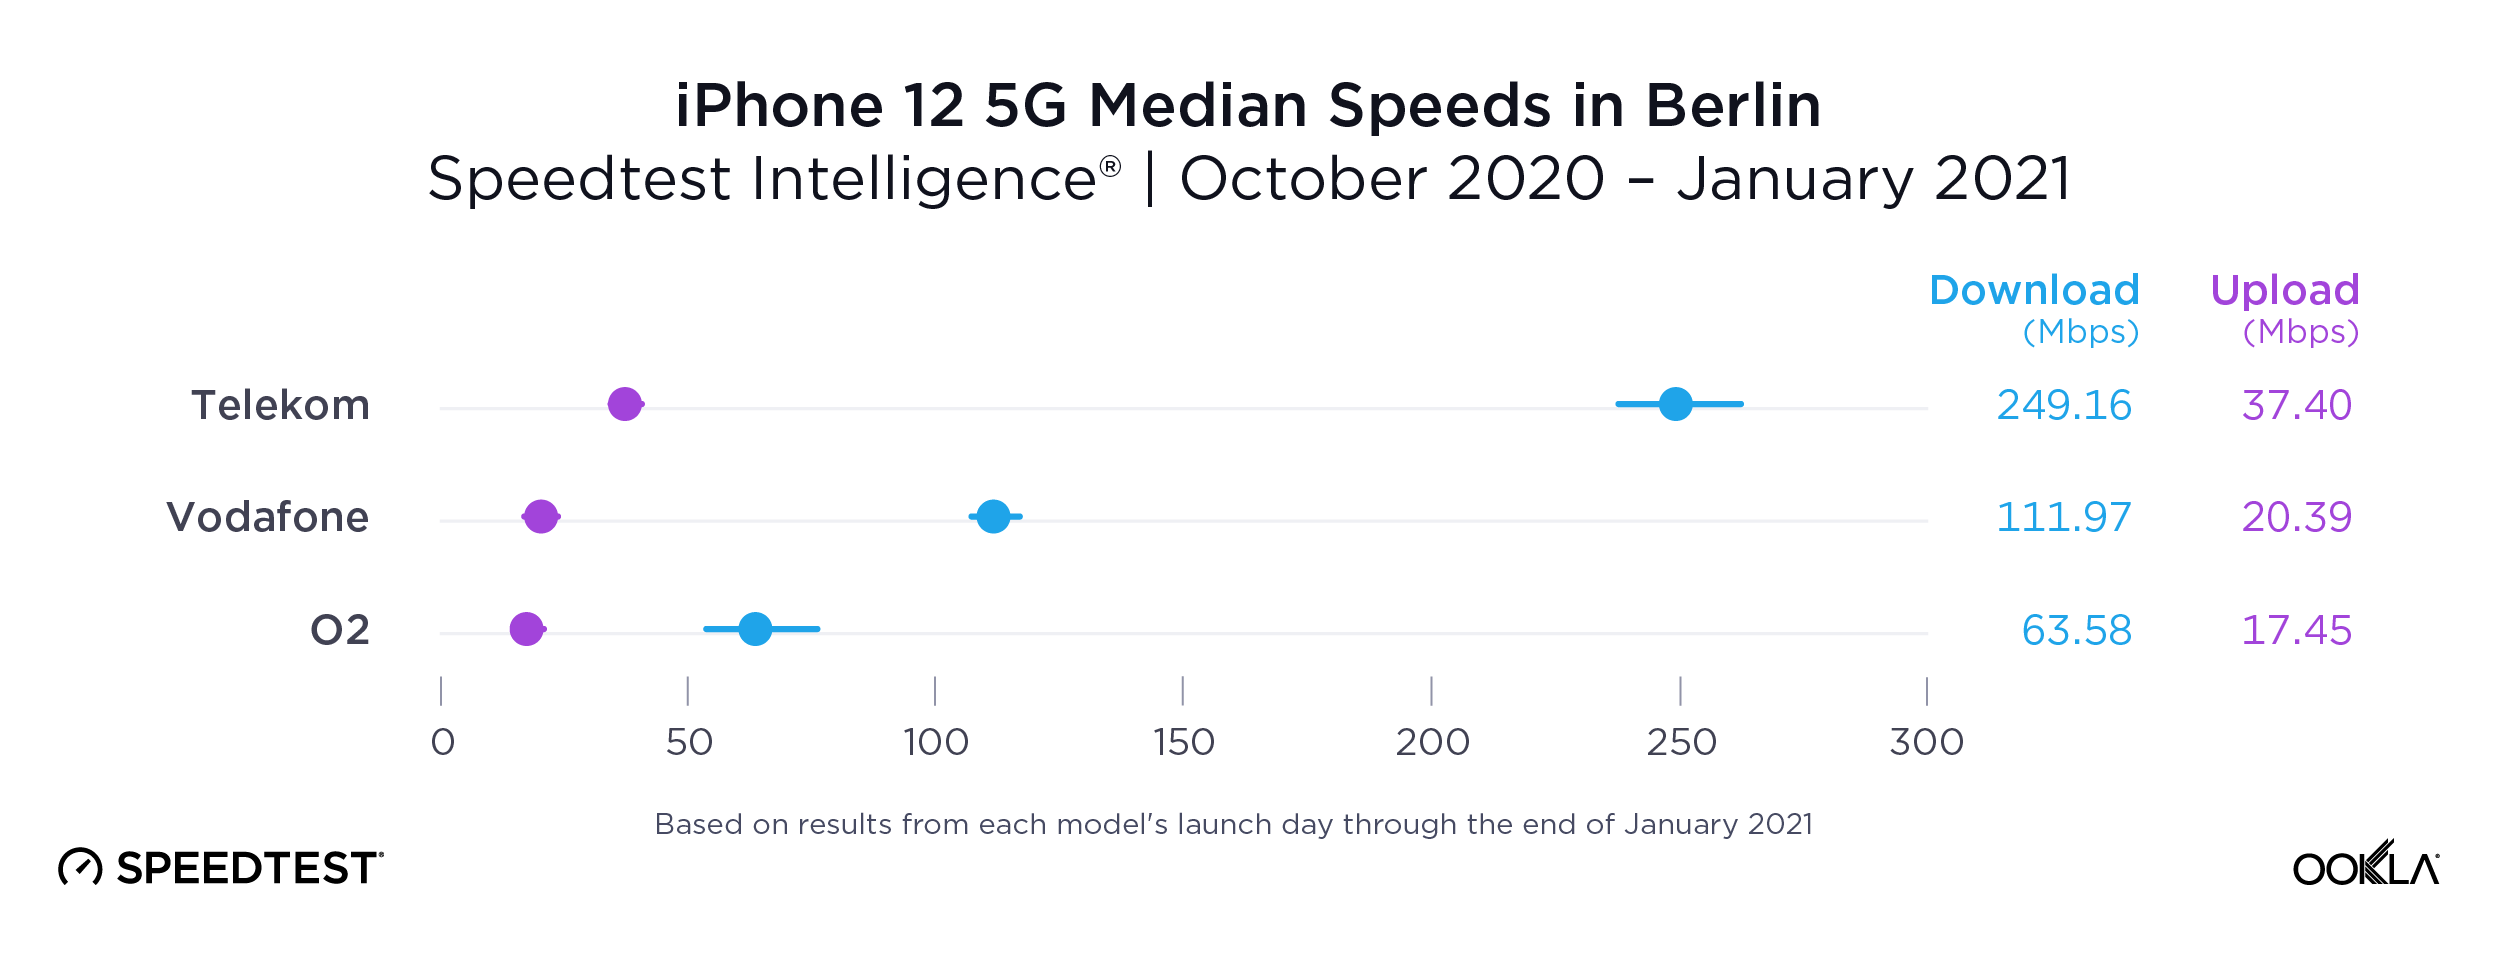
Operator breakdown: iPhone 12 performance in select cities
5G deployments vary greatly from country to country, depending on spectrum allocated and the particular channel bandwidths each operator has deployed. This makes comparisons between countries difficult, as these factors directly impact the peak 5G speeds achievable in that market. However, looking at four major cities, we can see that performance by operator also varies.

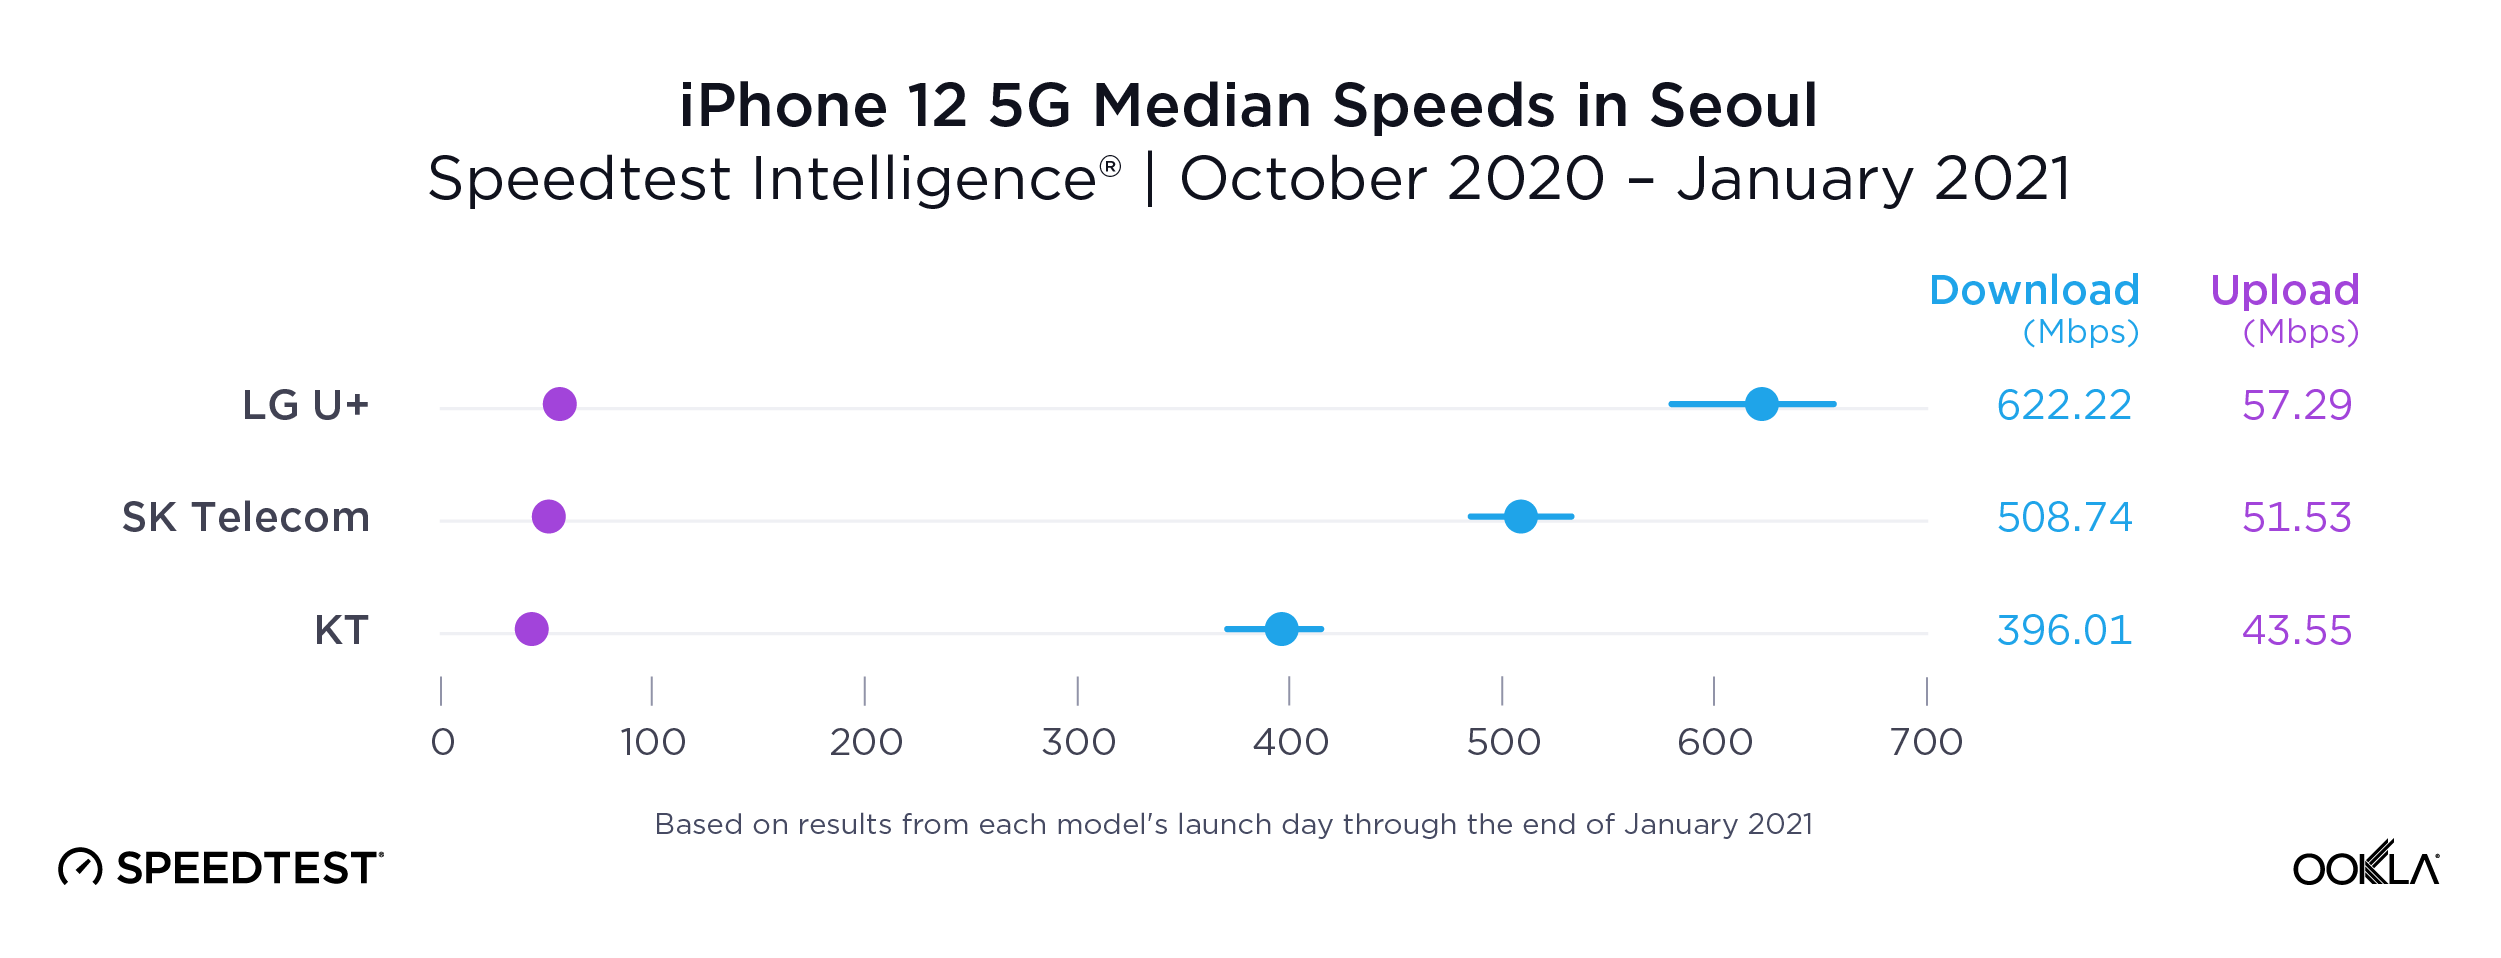
In Seoul, the fastest city for 5G on the list above, the 3.5 GHz (Band n78) is used with 80 to 100 MHz channels per operator, and B2C mmWave (which would add a whopping 800 MHz channels per operator) is on the horizon. Here, LG U+ showed the fastest median download speed over 5G on the iPhone 12 in Seoul at 625.03 Mbps. SK Telecom was second and KT third.

The three Hong Kong mobile operators that launched commercial 5G networks on April 1, 2020 ranked fastest for iPhone 12 5G median download speed rankings in Hong Kong. China Mobile HK, the only 5G network provider in Hong Kong that has acquired 3.3 GHz (3380-3400 MHz) and 3.5 GHz (3400-3460 MHz) continuous bandwidth spectrum was the fastest of these three at 212.77 Mbps. CSL and 3 Hong Kong were a close second and third, respectively. SmarTone, which launched its 5G network a month later, was fourth.
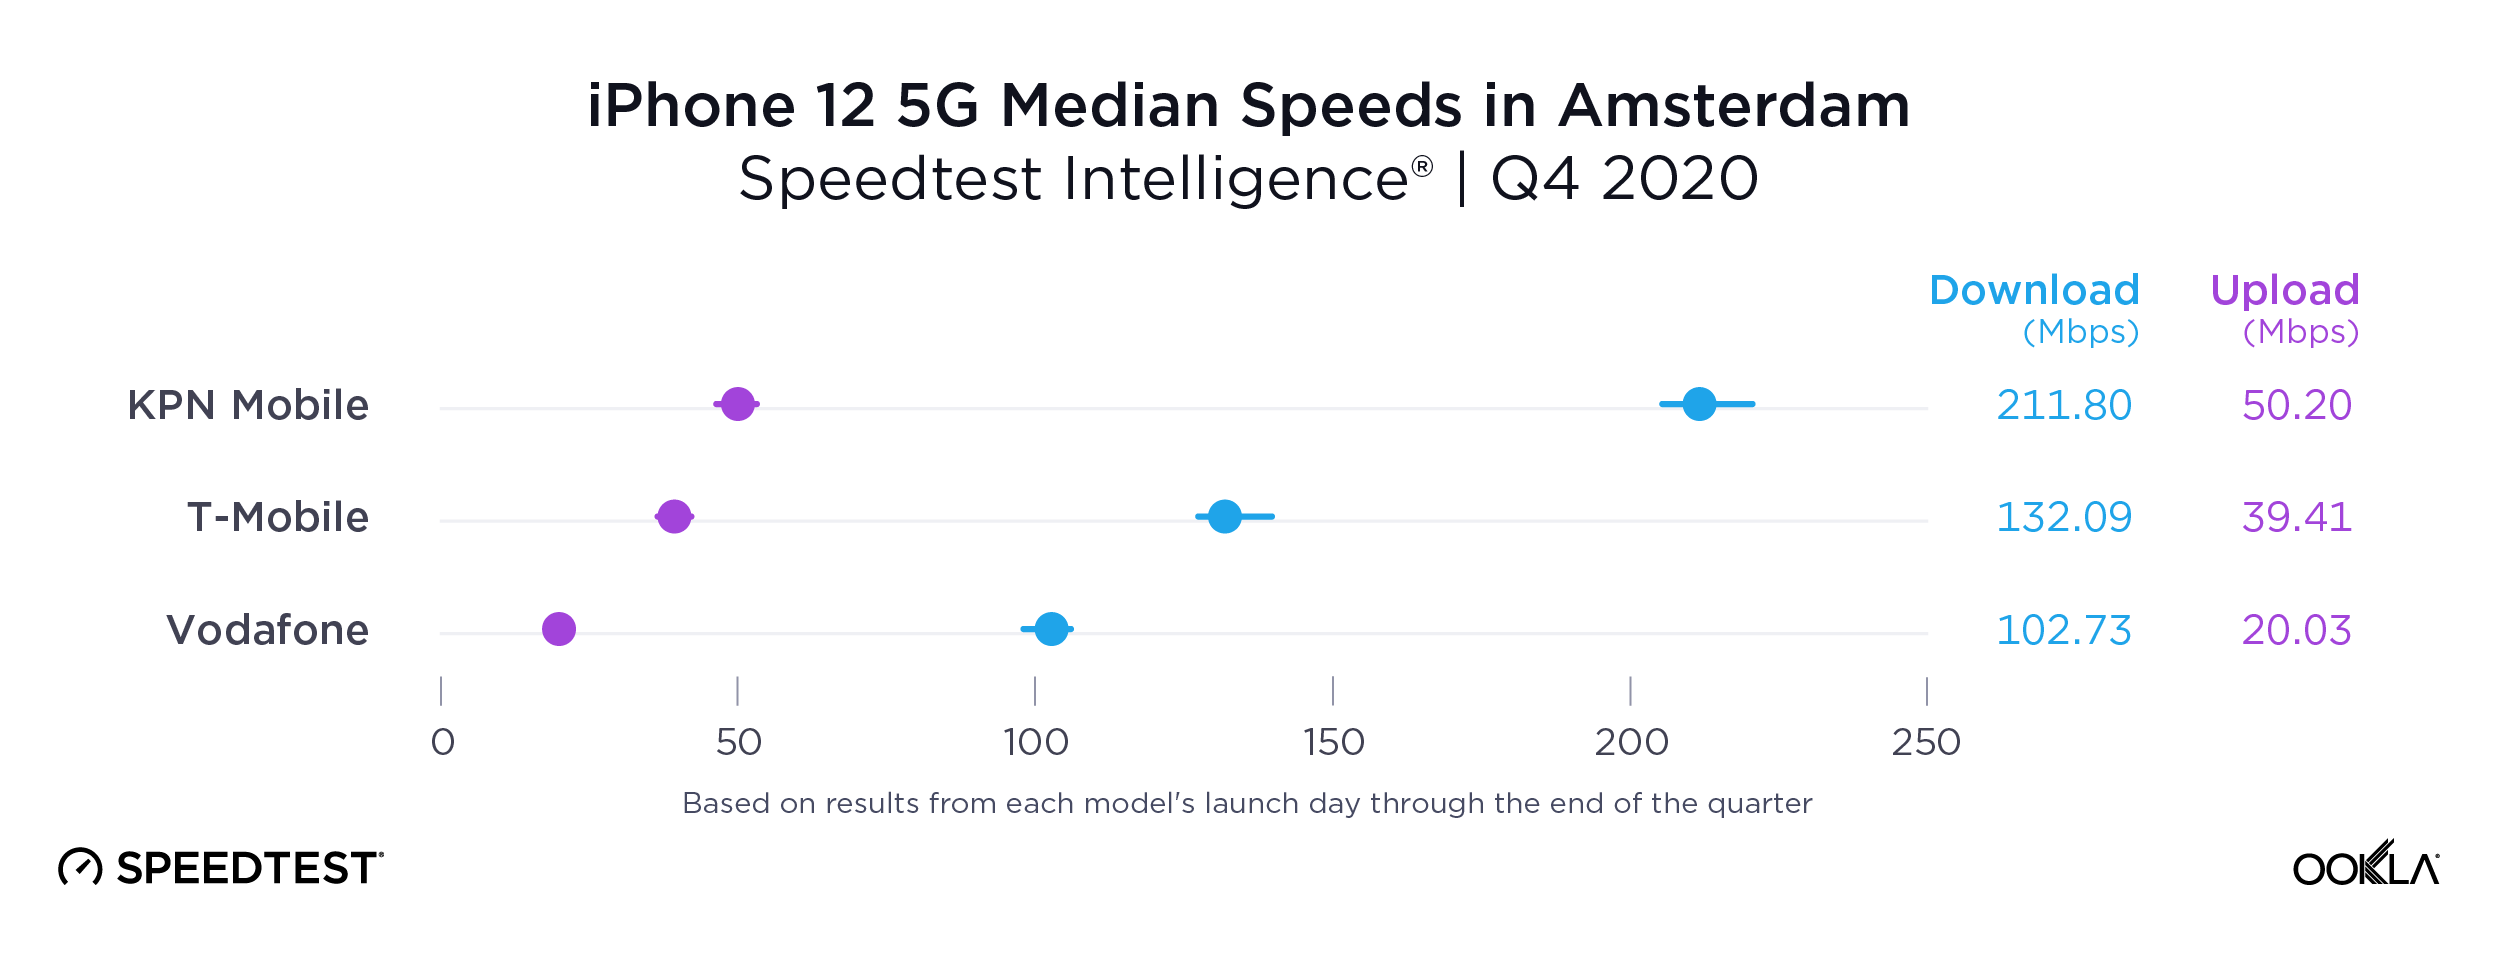
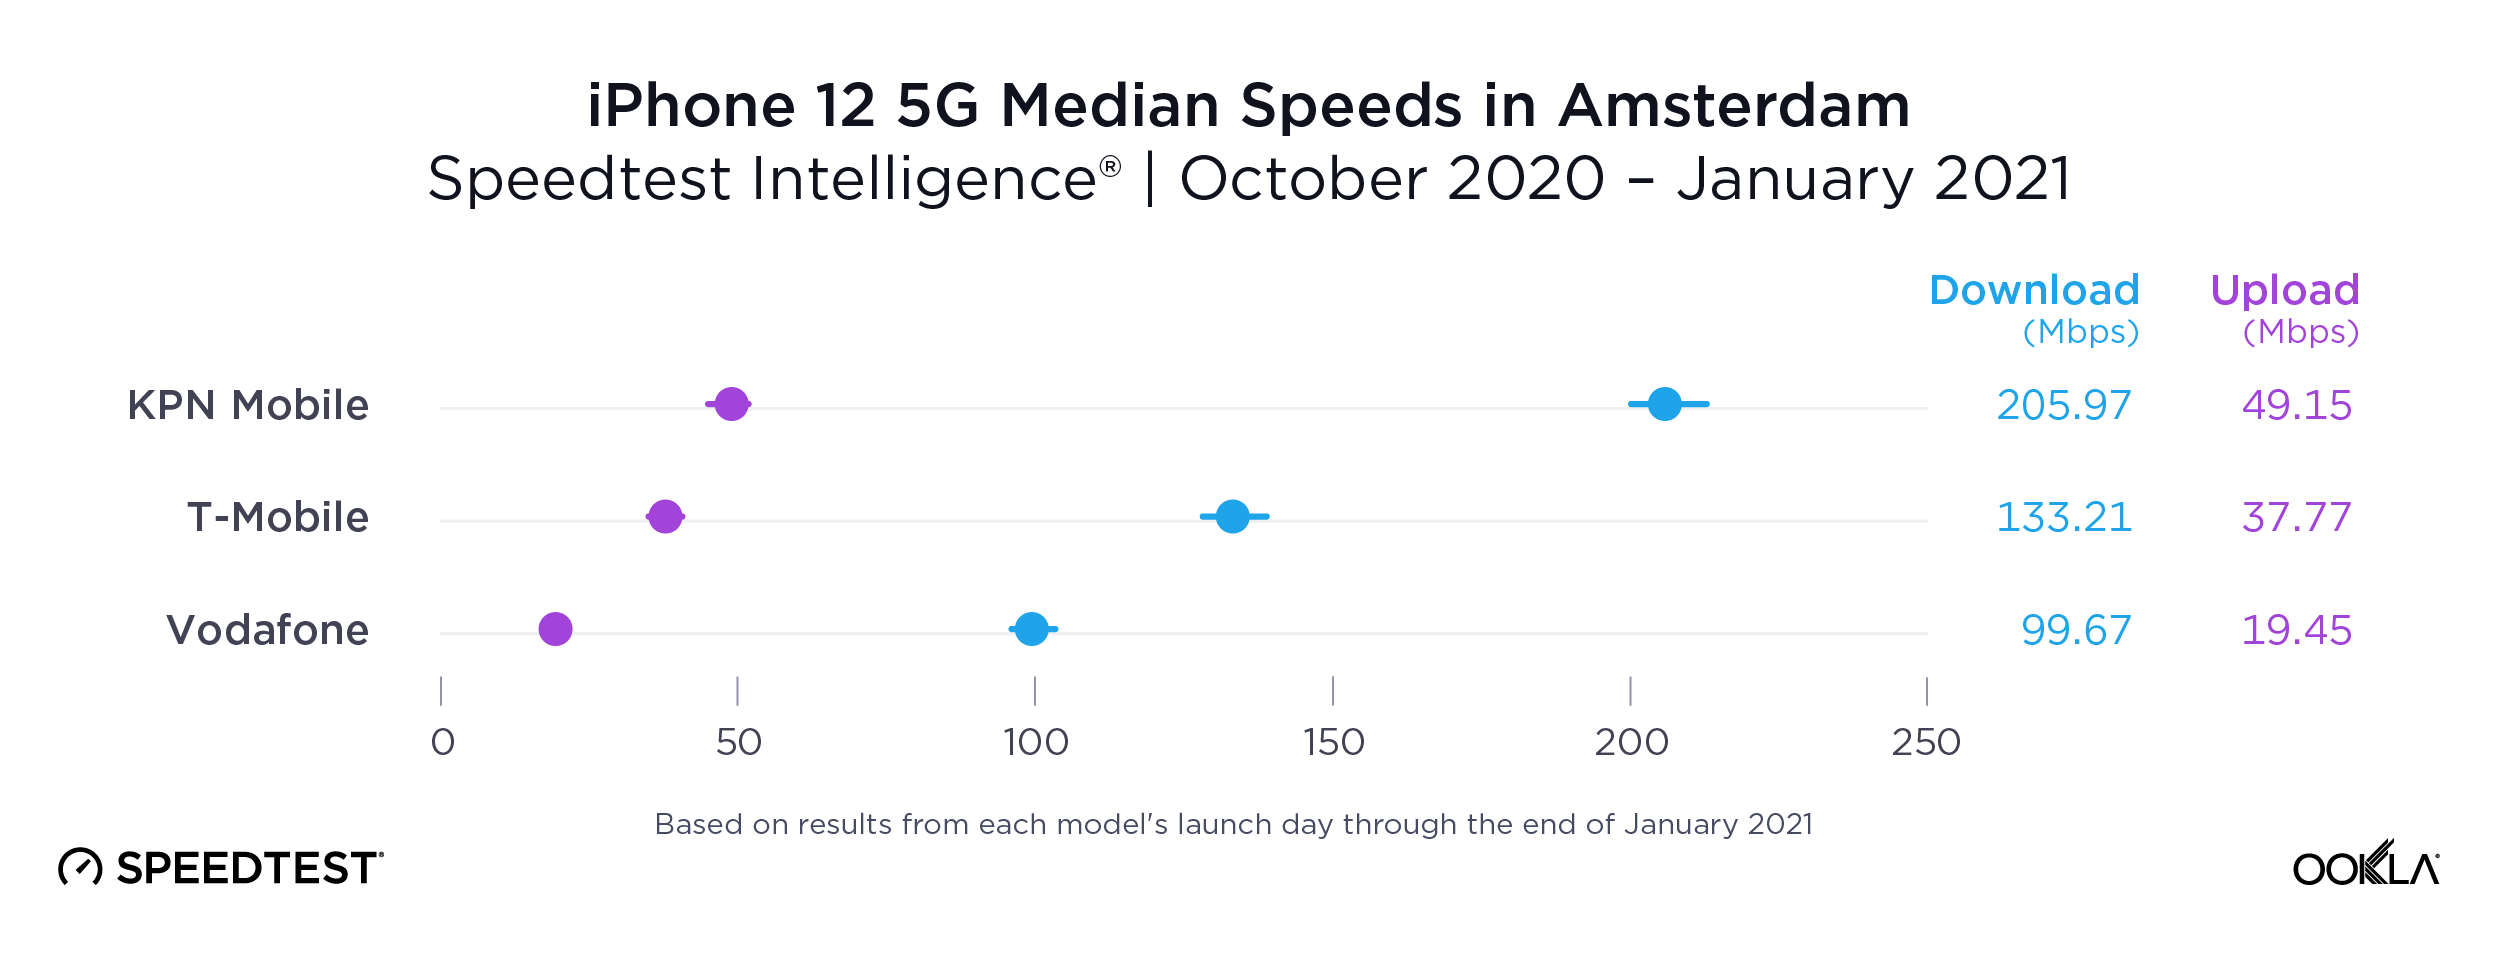
The 3.5 GHz band is not yet available in the Netherlands, but this did not slow down Dutch operators in launching their commercial 5G networks in 2020. According to Speedtest Intelligence data, KPN Mobile was comfortably at the top, with a median download speed of 211.80 Mbps over 5G using the iPhone 12 in Amsterdam during Q4 2020. T-Mobile was second and Vodafone third.
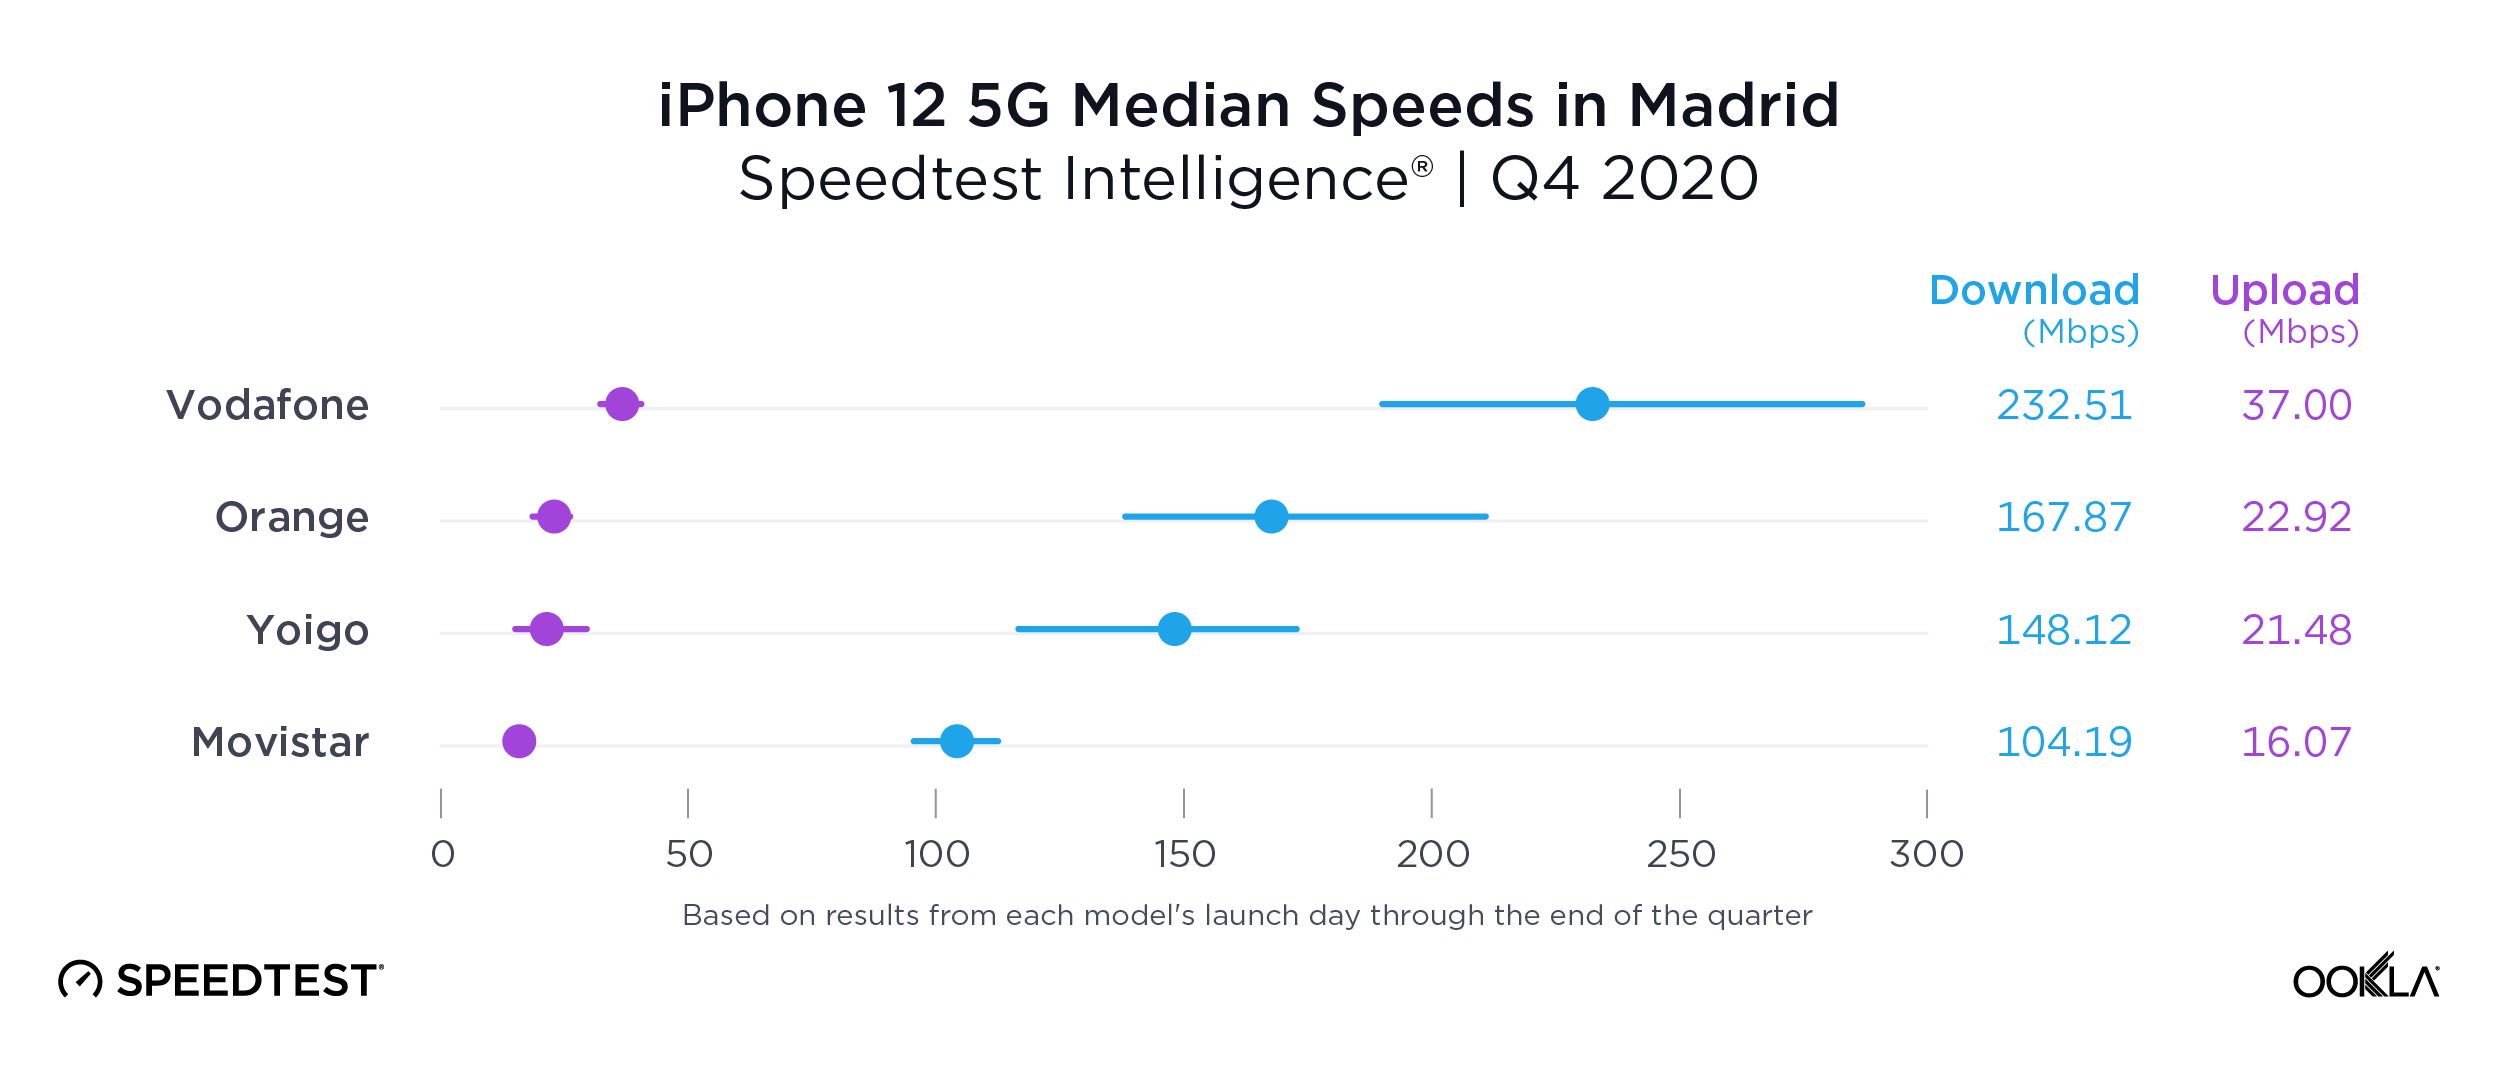
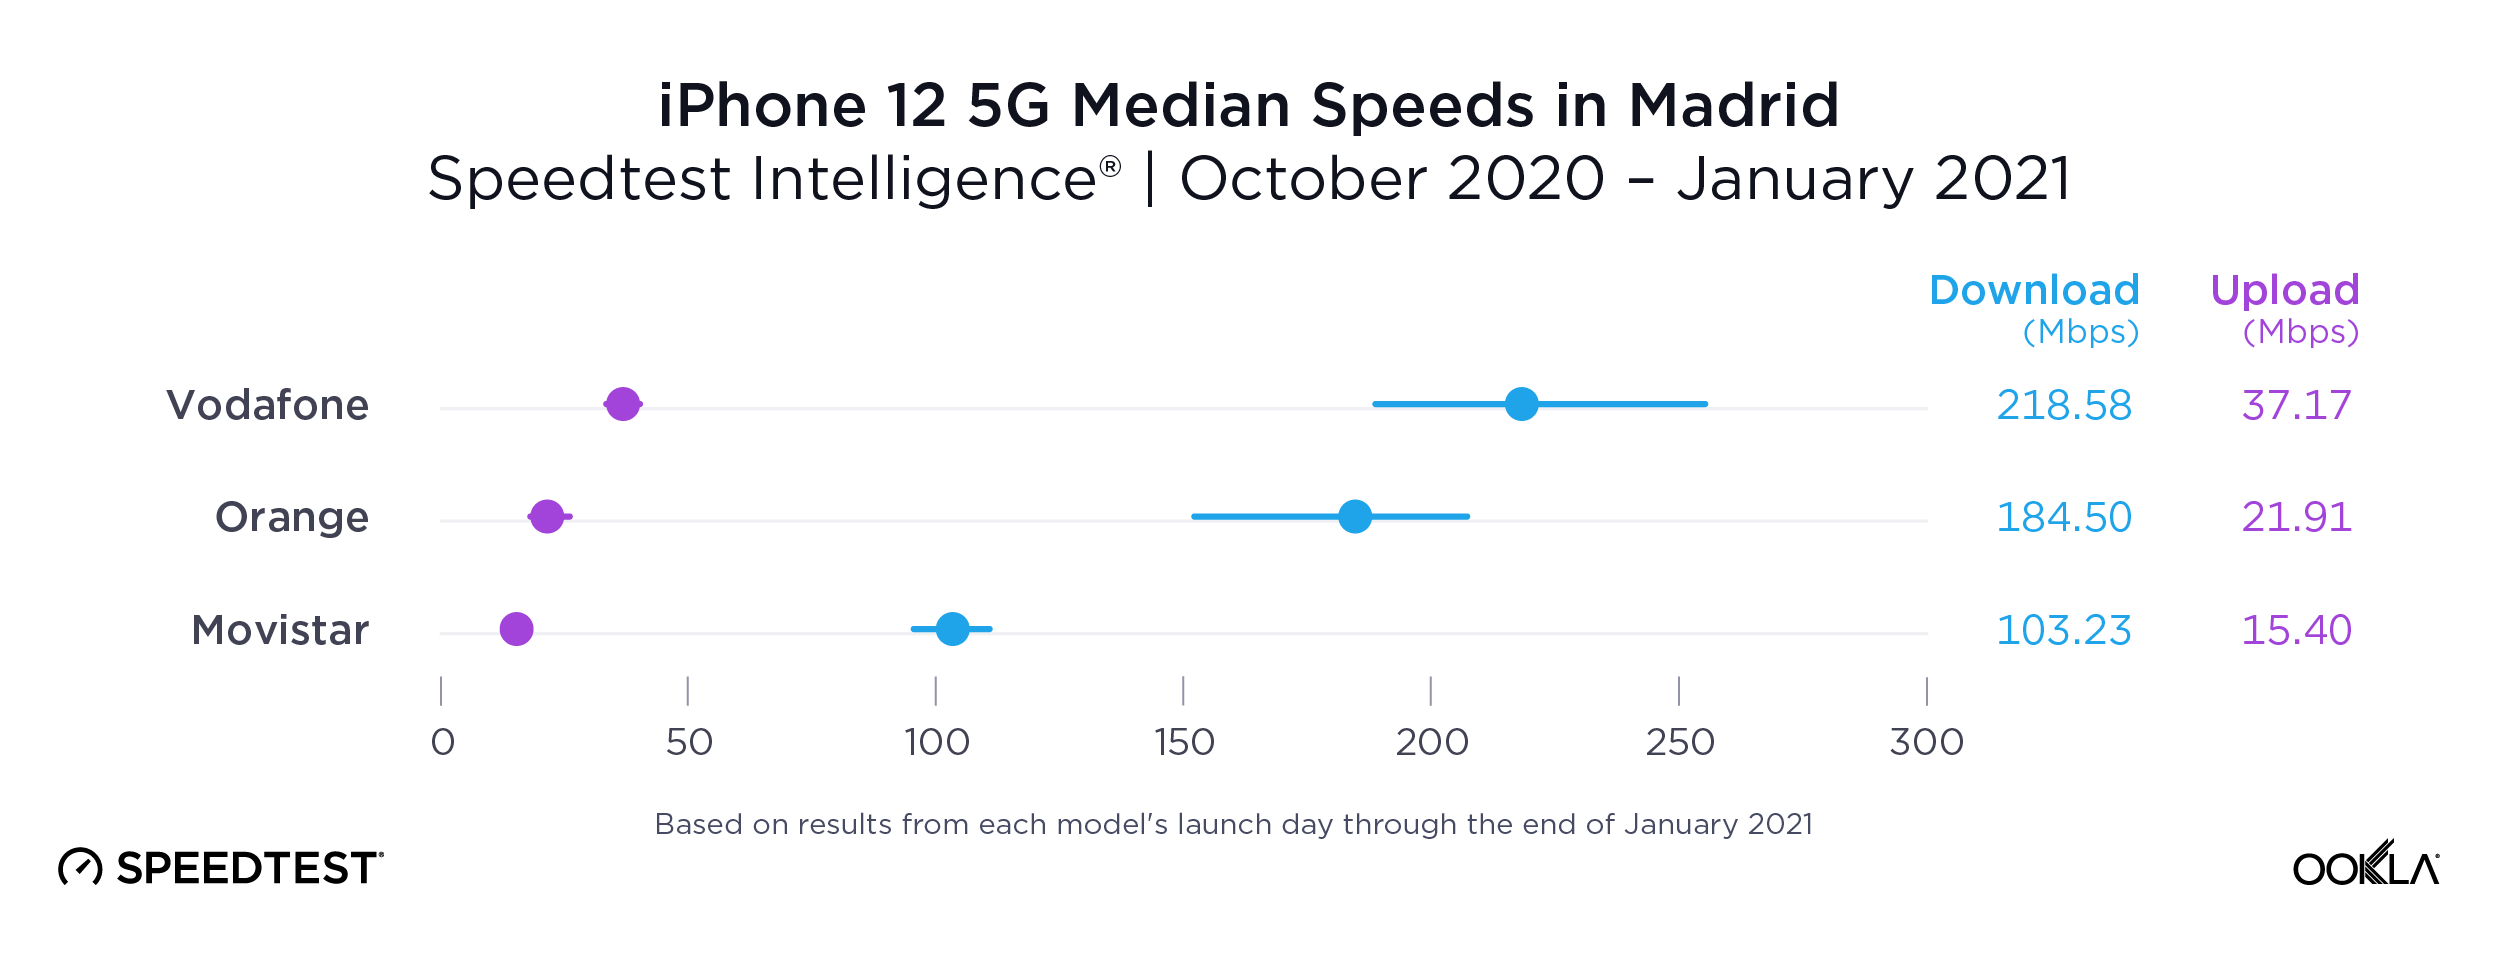
While Spanish operators currently benefit from the n78 band, the next step is expected to be the delayed addition of low bands (700 MHz). In Madrid, Vodafone showed the fastest median download speed over 5G using the iPhone 12 during Q4 2020 at 232.51. Orange was second fastest, Yoigo third and Movistar at fourth.
We will continue to monitor how Apple’s 5G-capable devices impact the global market. Contact us to learn more about how Speedtest Intelligence can help you understand the latest developments in your market.
Ookla retains ownership of this article including all of the intellectual property rights, data, content graphs and analysis. This article may not be quoted, reproduced, distributed or published for any commercial purpose without prior consent. Members of the press and others using the findings in this article for non-commercial purposes are welcome to publicly share and link to report information with attribution to Ookla.