| March 13, 2020

Tracking COVID-19’s Impact on Global Internet Performance (Updated July 20)

We are no longer updating this article as internet speeds in most countries have stabilized to pre-pandemic levels. For ongoing information about internet speeds in specific countries, visit the Speedtest Global IndexTM or contact our press team.

Ookla® closely monitored the impact of COVID-19 on the performance and quality of global mobile and broadband internet networks in the early days of the pandemic. We shared regular information based on Ookla data to assist in the understanding of this unprecedented situation. You can still download the July 20, 2020 CSV here which contains all the public data we tracked in this article. If you are looking for information on internet or online service outages, please check Downdetector®.

Ookla retains ownership of this article including all of the intellectual property rights, data, content graphs and analysis. This article may not be quoted, reproduced, distributed or published for any commercial purpose without prior consent. Members of the press and others using the findings in this article for non-commercial purposes are welcome to publicly share and link to report information with attribution to Ookla.

| June 16, 2020

June is Already a Tough Month for International Mobile Operators

On June 15, Downdetector® received numerous reports that T-Mobile was down in the United States. The peak of the outage reports on that day came in around 12:00 pm, PST. There were 113,980 reports during that peak. Soon after, users began reporting issues with AT&T and Verizon (and other smaller operators) as well, though in much smaller numbers (3,861 and 8,619 reports, respectively, at around 1:30 pm, PST).
Downdetector_Outage_T-mobile_effects_0620-2

The relative volume of reports by other operators shown in this chart suggests that, while the major outage was on T-Mobile’s network, customers of other operators may also have been impacted when they tried to contact T-Mobile customers and encountered errors. While we cannot definitively identify the root causes of yesterday’s issues reported by customers of all major U.S. mobile operators, it is valuable for operators to know when their customers are experiencing connectivity difficulties so they can respond appropriately. Even if the root issue does not exist within their network. Access to detailed information about all the outages in a particular ecosystem, as provided on Downdetector, can help consumers and customer support providers focus on where the actual problem lies.

We saw a similar effect in the United Kingdom on June 9 when Vodafone suffered an outage. Downdetector data indicated 9,686 reports from users during the peak at 4:45 GMT. At around the same time, EE users submitted 411 reports to Downdetector while we saw 519 reports from O2 customers and 322 reports from customers of Three in separate spikes throughout the same day.
Downdetector_Outage_Vodafone_effects_0620-1

This is a good reminder that if you’re encountering difficulty in connecting with your mobile operator, it’s worth checking Downdetector as well as trying other online services and apps to see where the real outage lies.

Ookla retains ownership of this article including all of the intellectual property rights, data, content graphs and analysis. This article may not be quoted, reproduced, distributed or published for any commercial purpose without prior consent. Members of the press and others using the findings in this article for non-commercial purposes are welcome to publicly share and link to report information with attribution to Ookla.

| January 4, 2021

Slack Starts the New Year Late


2021 started with a sigh today as workers across the globe rushed back to their desks only to find that Slack was down. Users flocked to Downdetector® to report problems with Slack across the globe just after 7:00 a.m. Pacific. Issues were reported in Asia (Japan), Australia, Europe (Finland, France, Germany, Italy, the Netherlands, Poland, Russia, Spain, Sweden and the United Kingdom), North America (United States and Canada) and South America (Brazil). The most frequently reported issue was the inability to connect at all and the majority of reports came from the U.S.

Downdetector_Slack_Outage_1020

Although the spike has passed and the outage seems to be resolving itself, the service is not fully operational yet. Now might be a good time to take a breath and catch up on all that post-holiday email. The little red notification will be back on your desktop soon enough.

Downdetector data can help your team resolve service issues faster and improve customer experience when an outage occurs, which becomes all the more important during periods of high usage. Contact us here to learn how your network operations center can get faster outage detection.

Ookla retains ownership of this article including all of the intellectual property rights, data, content graphs and analysis. This article may not be quoted, reproduced, distributed or published for any commercial purpose without prior consent. Members of the press and others using the findings in this article for non-commercial purposes are welcome to publicly share and link to report information with attribution to Ookla.

| January 12, 2021

2020 Recap: How the Internet Held Up During a Global Pandemic


There was major concern last year that the internet might fail under the pressure of increased use as COVID-19 drove unparalleled waves of remote work and schooling. We watched internet performance carefully using data from Speedtest Intelligence® as conditions changed in different areas of the world. Now we’re back to assess what happened during the year as a whole.

A note on the methodology: 5G launches drove up mean internet speeds on mobile in many countries. For this reason we’ve simplified our view to include only median speeds, which are less subject to being skewed by especially fast 5G tests.

Mobile speeds dipped in many G20 countries in the spring of 2020

Mobile-Broadband-Speeds-in-G20-Countries_0121

Median download speeds over mobile in many G20 countries dropped at some point during 2020. Countries that saw month-to-month declines during the spring include: Australia, Canada, France, India, Italy, Saudi Arabia, South Korea, Spain and Turkey. China saw a decline in mobile speed in February while Japan suffered a drop in June and July. Argentina, Brazil, Indonesia, Russia and the United Kingdom showed only very minor decreases, while speeds in Germany, Mexico, South Africa and the United States remained unchanged or increased.

Despite the drops, almost all G20 countries saw higher median download speeds over mobile in December 2020 than they had in January 2020. Median download speed over mobile increased 76.3% in China during that time. Germany saw a 62.8% increase, the United States 56.9%, South Korea 55.5% and Saudi Arabia 48%. Turkey saw a 0.7% decrease in median download speed over mobile during the same period.

Despite interim dips, fixed broadband improved in all G20 countries during 2020

Fixed-Broadband-Speeds-in-G20-Countries_0121

There were notable dips in median download speeds over fixed broadband in many countries during the spring of 2020. G20 countries that saw these declines on a monthly basis include: Argentina, Canada, France, India, Indonesia, Italy, Japan, South Korea, Spain, Turkey and the United States. Brazil, China, Germany and Russia notably showed only increases in month-to-month median download speed over fixed broadband during this time. Other countries showed only very minor decreases.

Perhaps most important, all G20 countries saw higher median download speeds over fixed broadband in December 2020 than they had in January 2020. Median download speed over fixed broadband increased 51.9% in Brazil during that time. France saw a 48.3% increase, Japan 46.5%, Saudi Arabia 43.7% and South Africa 40%. South Korea saw the smallest increase in median download speed over fixed broadband over the same period at 8.1%.

We are impressed, on the whole, with how well the internet held up to the massive scale of increased use during the past year. Of course, month-by-month, country-level views are averages that might not reveal problems with specific mobile operators or internet service providers on individual days. If you want to assess how your internet connection is performing right now, take a Speedtest®. And if you are unable to connect to a specific service on the internet, check Downdetector® to see the status of that service.

Ookla retains ownership of this article including all of the intellectual property rights, data, content graphs and analysis. This article may not be quoted, reproduced, distributed or published for any commercial purpose without prior consent. Members of the press and others using the findings in this article for non-commercial purposes are welcome to publicly share and link to report information with attribution to Ookla.

| December 14, 2021

Find Out if 5G is Worth the Upgrade: A Multi-Country Analysis

The holidays are nearly here and with them the desire to treat yourself or a loved one to an upgraded phone, just because. The first question you’re likely to ask yourself as you browse new models is “To 5G or not to 5G?” Once you check the Ookla 5G Map to see if your operator has deployed 5G in your area, you’ll probably want to know if the 5G speeds are worth the extra cost. We’ve analyzed Speedtest Intelligence® data from the most popular Android and iPhone devices around the world during Q3 2021 to help you see if it’s worth the upgrade. Click a country from the list to jump down to the related analysis.

Australia | Bahrain | Canada | China
France | Japan | Saudi Arabia | South Africa
South Korea | United Arab Emirates | United Kingdom | United States
Our analysis includes data on the five 4G Android devices in each country with the largest number of results during Q3 2021 as well as the five most popular 5G-capable Android devices. We have also compared the iPhone 13 to the iPhone 11. Even the fastest device can only perform at the level of the network it’s on. For that reason, speeds for the same device vary widely from country to country in the data below. Remember that speeds can also vary within a country and the performance you see will depend on the infrastructure in your area.

Australia

5G Samsung devices more than twice as fast as most popular 4G devices in Australia

Although only a year separates the release of the Samsung Galaxy S10 series and the S20 series devices, the latter were definitely faster in Australia during Q3 2021. Even the slowest 5G-capable device on this list, the Galaxy S20+ 5G was much faster than the fastest 4G phone, the Galaxy S10+.

ookla_android_performance_australia_1121-01

iPhone 13 wallops iPhone 11 for speed in Australia

Australians who recently upgraded their iPhone 11 for an iPhone 13 would have seen a more than 4X increase in median download speed during Q3 2021. If speed is your number one concern, this upgrade is necessary.

ookla_iphone_performance_australia_1121-01

Bahrain

5G Samsung variants live up to the hype in Bahrain

Fewer 5G-capable phones made our list in Bahrain during Q3 2021 due to sample counts, but those that did roundly outperformed the most popular 4G devices. The median download speed of 5G-capable devices on this list was more than two times faster than the median for 4G devices on this list.

ookla_android_performance_bahrain_1121-01

iPhone 12 85% faster than iPhone 11 in Bahrain

There weren’t sufficient samples to analyze performance of the brand new iPhone 13 in Bahrain during Q3 2021, but median download speed on the iPhone 12 was 85.0% faster than that on the iPhone 11.

ookla_iphone_performance_bahrain_1121-01

Canada

Not all 5G Android devices offer a massive improvement in Canada

Q3 2021 data from Canada shows that 5G isn’t the only way to get a fast connection. While the fastest 5G-capable device among the top five most popular (the Samsung Galaxy S21 Ultra 5G) offered very fast median download speeds, two 4G devices (the Note10+ and the S10+) were nearly as fast as the slowest 5G-capable device on this list (the S20 Fan Edition 5G). To upgrade or not is definitely a question here of which device you are upgrading from and which you plan to upgrade to.

ookla_android_performance_canada_1121-01

iPhone 13 more than three times as fast as the iPhone 11 in Canada

Canadians looking for fast mobile performance on Apple devices will enjoy an upgrade to the iPhone 13 whose median download speed in Q3 2021 was more than three times as fast as that on the iPhone 11.

ookla_iphone_performance_canada_1121-01

China

5G offers major advantages on Android in China

There is no question as to whether consumers with one of the five most popular 4G Android devices would see faster speeds with one of the five most popular 5G Android devices. The 4G devices on this list saw median download speeds in the 22.00 to 34.00 Mbps range during Q3 2021 while the 5G-capable devices showed median download speeds between 155.87 Mbps (Xiaomi Mi 10 5G) and 280.22 Mbps (Huawei Mate 40 Pro 5G).

ookla_android_performance_china_1121-01

iPhone 13 more than ten times faster than iPhone 11 in China

China was home to the largest performance increase when comparing the iPhone 11 to the iPhone 13. Median download speed on the iPhone 13 was more than ten times faster during Q3 2021 than on the iPhone 11. Some of this difference may reflect market conditions where users in more rural areas have older phones and poorer infrastructure, but it’s still an impressive difference.

ookla_iphone_performance_china_1121-01

France

French 5G offers a decent speed boost on Android

The most popular 4G devices in France showed median download speeds between 37.67 Mbps (Samsung Galaxy S8) and 51.36 Mbps (S20 Fan Edition) during Q3 2021. These were easily topped by the 5G-capable devices which showed median download speeds of 73.73 Mbps (Xiaomi Mi 10T Pro 5G) to 92.10 Mbps (Xiaomi Mi 11 5G).

ookla_android_performance_france_1121-01

iPhone 13 more than three times faster than iPhone 11 in France

French consumers who upgraded from the iPhone 11 to the iPhone 13 during Q3 2021 would have tripled their median download speed potential on the 5G-capable iPhone 13.

ookla_iphone_performance_france_1121-01

Japan

Android 5G devices are faster in Japan, but not always fast

The most popular 4G devices in Japan during Q3 2021 were much slower than the most popular 5G-capable devices. Speedtest Intelligence showed median download speeds on 4G devices ranging from 19.75 Mbps (Xiaomi Redmi Note 9S) to 26.57 Mbps (Oppo Reno A). Even the slowest 5G-capable device on this list, the Xiaomi Mi 11 Lite 5G at 43.63 Mbps, was 56% faster than the fastest 4G devices. However, the fastest 5G-capable device on this list, the Sony Xperia 1 II 5G, was twice as fast as that at 94.85 Mbps.

ookla_android_performance_japan_1121-01

iPhone 13 more than twice as fast as iPhone 11 in Japan

In Japan, the median download speed of the iPhone 13 was more than twice as fast as that over the iPhone 11 during Q3 2021. This was one of the smallest differences in performance between the iPhone 11 and 13 that we saw in our analysis.

ookla_iphone_performance_japan_1121-01

Saudi Arabia

5G Android devices are much faster than 4G in Saudi Arabia

Median download speeds on the most popular 5G-capable devices were fast in Saudi Arabia compared to most other markets. 5G-capable speeds ranged from 174.43 Mbps for the Samsung Galaxy S20 Ultra 5G to 261.21 Mbps for the S21 Ultra 5G. 5G is definitely worth the upgrade in Saudi Arabia.

ookla_android_performance_saudi-arabia_1121-2-01

iPhone 13 was more than five times faster than the iPhone 11 in Saudi Arabia

Not only did Saudi Arabia show the second fastest median download speed over iPhone 13 during Q3 2021, the iPhone 13 was also more than five times faster than the iPhone 11.

ookla_iphone_performance_saudi-arabia_1121-01

South Africa

5G shows a small improvement over 4G on Android in South Africa

The most popular 4G devices in South Africa showed a wide range of median download speeds during Q3 2021, from 18.00 Mbps (Huawei P20 Lite) to 40.69 Mbps (Samsung Galaxy Note10+). South Africa’s median download speeds on the most popular 5G devices were among the lowest we saw, from 43.09 Mbps on the Samsung Galaxy Note20 5G to 67.09 Mbps on the S21 Ultra 5G.

ookla_android_performance_south-africa_1121-01

iPhone 12 was almost twice as fast as the iPhone 11 in South Africa

There weren’t sufficient samples in South Africa to analyze the iPhone 13, so we compared the iPhone 12 to the iPhone 11. The median download speed on the iPhone 12 was almost twice as fast as that on the iPhone 11 during Q3 2021.

ookla_iphone_performance_south-africa_1121-01

South Korea

4G Android devices in South Korea are fast, 5G even faster

The median download speeds we saw on the most popular 4G devices in South Korea during Q3 2021 rivaled the 5G speeds in South Africa with speeds ranging from 53.74 Mbps on the Samsung Galaxy Note8 to 60.41 Mbps on the S9+. However, median performance on 5G-capable devices was even faster. There was a wide variety in speeds among the most popular 5G-capable with the S10 5G showing a median download speed of 102.61 Mbps and the S21 Ultra 5G coming in at 221.18 Mbps. 5G is worth the upgrade in South Korea and consumers have a variety of high-performing devices to choose from.

ookla_android_performance_south-korea_1121-01

iPhone 12 more than three times faster than iPhone 11 in South Korea

South Korea did not have enough samples from the new iPhone 13, so we compared the iPhone 12 to the iPhone 11. Not only was the iPhone 12 more than three times faster for median download speed than the iPhone 11 during Q3 2021, South Korea’s iPhone 12 download speed beat iPhone 13 download speed in five of the countries we analyzed: Canada, France, Japan, U.K. and the U.S.

ookla_iphone_performance_south-korea_1121-01

United Arab Emirates

U.A.E. had the fastest speeds on Android 5G devices

While the median download speeds across 4G devices in the U.A.E. during Q3 2021 handily beat those of all the other countries in this analysis, the country’s 5G download speeds were even faster. We can see from this data that some of the 4G devices can perform much better when on a faster network. Even the slowest 4G device on this list, the Huawei P30 Pro, had a median download speed of 68.26 Mbps in U.A.E. compared to 30.20 Mbps in the U.K. on the same device.

ookla_android_performance_uae_1121-2-01-1

A similar story can be told for 5G devices where the U.A.E. was competing only with Saudi Arabia and South Korea for the fastest median performance on devices listed during Q3 2021. The Samsung Galaxy S21 5G showed a median download speed of 285.39 Mbps in the U.A.E. compared to 215.10 Mbps in South Korea while the Galaxy S21 Ultra 5G showed a median download speed of 269.09 Mbps in the U.A.E. and 261.21 Mbps in Saudi Arabia.

iPhone 13 more than four times faster than iPhone 11 in U.A.E.

Not only did the U.A.E. have the fastest median download speed over iPhone 13 that we saw in this analysis, the 485.59 Mbps download speed was faster than any phone in any country that we analyzed in Q3 2021. The iPhone 13 capitalized on fast 5G in the U.A.E. to have a median download speed that was more than four times faster than that of the iPhone 11.

ookla_iphone_performance_uae_1121-01

United Kingdom

5G represents a solid improvement over 4G on Android devices in the U.K.

Consumers upgrading from one of the most popular 4G devices in the United Kingdom to one of the most popular 5G-capable devices would have seen a 2-3X increase in median download speed during Q3 2021. This is in part because the 4G devices on this list were slower in the U.K. than elsewhere in the world during Q3 2021 as 4G speeds have stagnated in the U.K. For example, the Samsung Galaxy S8 showed a median download speed of 24.20 Mbps in the U.K., 37.67 Mbps in France and 46.31 Mbps in Canada. All five of the 5G-capable devices that we analyzed in both the U.S. and the U.K. were faster in the U.K. during Q3 2021.

ookla_android_performance_uk_1121-01

iPhone 13 more than five times faster than the iPhone 11 in the U.K.

Our analysis of Speedtest Intelligence data from Q3 2021 showed that the iPhone 13 had a median download speed that was more than five times faster than that on the iPhone 11. This makes the iPhone 13 very much worth the upgrade if speed is your main concern.

ookla_iphone_performance_uk_1121-01

United States

5G Android devices were twice as fast as 4G in the U.S.

The most popular 4G devices in the U.S. were about half as fast for median download speed as the most popular 5G-capable devices during Q3 2021. The Samsung Galaxy S21 Ultra 5G showed the highest median download speed among these devices at 69.78 Mbps, compared to the fastest 4G device surveyed, the Note10+ at 35.98 Mbps. That said, 5G-capable devices in the U.S. underperformed when compared to other countries, except Japan and South Africa.

ookla_android_performance_us_1121-01

iPhone 13 nearly three times as fast as the iPhone 11 in the U.S.

Data from Speedtest Intelligence reveals that median download speed on the iPhone 13 was nearly three times as fast as that on the iPhone 11 in the U.S. during Q3 2021.

ookla_iphone_performance_us_1121-01

Our analysis shows that increased speed is one of the benefits of upgrading your 4G phone to a 5G-capable one, regardless of where you live but not all countries see the same speed increases. Customers in Saudi Arabia, the U.A.E, China and South Korea will see especially good performance if upgrading an Android phone. The U.A.E., Saudi Arabia, China and Australia have especially good speeds on the iPhone 13. Whatever choice you make for your next phone, take a Speedtest® on Android or iOS to make sure your mobile operator is delivering the speeds you want to see.

Ookla retains ownership of this article including all of the intellectual property rights, data, content graphs and analysis. This article may not be quoted, reproduced, distributed or published for any commercial purpose without prior consent. Members of the press and others using the findings in this article for non-commercial purposes are welcome to publicly share and link to report information with attribution to Ookla.

| September 15, 2022

College Towns Where Internet Speeds Make the Grade (And Where They Fail)

It’s back to school time in the United States, and for many freshmen that means traveling to a brand new town to start your education. To help you know if the internet will be a help or a hindrance as you earn your degree, we analyzed internet performance in 100 college towns across the U.S. This list includes Speedtest Intelligence® data on median download and upload speeds from 100 towns with a large percentage of students where college is a major part of the industry.

While we worked to include a wide variety of college towns on our list, the list is far from comprehensive. If you’d like to see your school on the list next year, please take a Speedtest® then send your result to us via Twitter or Facebook. You can also start your college life on a responsible note by using our new Speedtest Performance Directory™ to check out expected speeds for internet service providers before you sign up for an extended contract.

College towns with the best (and worst) internet speeds

If you started your college search by looking for the top of the top, you’ll relate to the next three sections that highlight the college towns with the fastest speeds on 5G, all mobile technologies combined, and fixed broadband. By choosing a school in a town with great internet speeds, you’re giving yourself access to the fastest streaming and gaming experiences (and good performance for any online classes to boot). We’ve also included the locations with the slowest speeds. While you’ll see college towns broken out by population later in this article, these three sections combined data from all 100 schools on our list.

College towns with A+ and F- 5G speeds

Map of best and worst college towns for 5G speeds

With median download speeds over 300 Mbps, Manhattan, Kansas; Clemson, South Carolina; and College Park, Maryland topped our list of college towns with the fastest 5G in the U.S. during Q2 2022. Auburn, Alabama and Troy, New York rounded out the top five. Students in these places have every advantage when using 5G phones for school or play.

On the other end of the spectrum, Bowling Green, Kentucky; Fayetteville, Arkansas; Blacksburg, Virginia; Cheney, Washington; and Morgantown, West Virginia had the slowest download speeds over 5G. Students in these locations may want to consider if 5G is even worth the extra investment. Check the lists below to see how 5G performance compares to mobile performance on all technologies. It’s likely that the 5G performance will get better with time, but there’s no need to stretch your budget for a service that isn’t delivering in your area.

Overall mobile performance in college towns is sufficient

Map of best and worst college towns for mobile speeds

Tigers rejoice, because Clemson, South Carolina was among the fastest college towns for mobile on our list with a median download speed of 175.77 Mbps during Q2 2022. Tempe, Arizona; Kent, Ohio; College Park, Maryland; and Providence, Rhode Island filled out the top five. These towns all have excellent download speeds, far ahead of the 59.89 Mbps median mobile download speed in the U.S. during July 2022, according to the Speedtest Global Index™. In all, 52 of the college towns on our list showed a median download speed above this during Q2 2022.

Bennington, Vermont; Socorro, New Mexico; Kearney, Nebraska; Bowling Green, Kentucky; and Hanover, New Hampshire had the slowest download speeds on our list. While the download speeds in these places should be adequate for most phone uses, you probably won’t want to rely on tethering your mobile device to your computer for internet access.

Most college towns have acceptable fixed broadband speeds

Map of best and worst college towns for fixed broadband speeds

Grambling, Louisiana topped our list of college towns with a median download speed over fixed broadband of 333.65 Mbps during Q2 2022. Home to the HBCU Grambling State University, Grambling is a small town in north central Louisiana, and Grambling was 14% faster than Murfreesboro, Tennessee, the next fastest college town. Dover, Delaware; Chapel Hill, North Carolina; and Manchester, New Hampshire completed our list of top five fastest college towns for fixed broadband. Forty-seven out of the 100 college towns on our list had a Q2 2022 median download speed over fixed broadband that was faster than the median for the U.S. (159.31 Mbps) in July 2022, according to the Speedtest Global Index.

The slowest college towns on our list were Socorro, New Mexico; Cheney, Washington; Oberlin, Ohio; Tuskegee, Alabama; and Brookings, South Dakota. While the download speed in all but Socorro is within the acceptable range for most uses, anyone connecting more than one device at a time to a router (hello roommates!) is going to struggle with internet performance in these places.

Internet performance in large college towns

Everyone has a different college dream. Our “large college towns” list is for students who want more of a city experience than a town, with 19 locations that have 100,000 or more residents but still retain that college town feel. If your favorite college town is actually a suburb of a larger metropolitan area, look for that list below.

Chart of internet performance in large college towns in the U.S.

Manchester, New Hampshire; Huntsville, Alabama; Lincoln, Nebraska; and Providence, Rhode Island form the top of the list for large college towns with fast median download speeds over fixed broadband during Q2 2022. All four are home to multiple colleges and universities whose students can benefit from these super fast speeds. Even Columbia, Missouri, the place with the lowest median download speed on this list, exceeds the FCC minimum recommendation for broadband of 25 Mbps download. However, 10 of the cities on this list had lower speeds than the U.S. median of 159.31 Mbps in July 2022.

On mobile, Tempe, Arizona and Providence, Rhode Island had the fastest median download speeds among our large college towns list during Q2 2022. In all, eight of the colleges on this list had a median download speed over mobile during Q2 2022 that exceeded the U.S. median of 59.89 Mbps during July 2022. College Station, Texas; Fayetteville, Arkansas; Lincoln, Nebraska; Macon, Georgia; and Columbia, Missouri had the lowest mobile speeds on our list of large college towns, each coming in below 50 Mbps for median download speed.

Medium-sized college towns with fast internet speeds

Chart of internet performance in medium-sized college towns in the U.S.

College students looking for a slightly slower lifestyle might enjoy our medium-sized college town list. This list includes 26 locations where college is a major industry, there are 50,000-100,000 residents, and the city is not part of another metropolitan area.

Dover, Delaware; Jonesboro, Arkansas; and Rock Hill, South Carolina top the list of medium-sized college towns with fast fixed broadband speeds during Q2 2022. Eleven of the 26 places on this list exceeded the median download speed for fixed broadband in the U.S. (159.31 Mbps) during July 2022. Conway, Arkansas; Grand Forks, North Dakota; and Lawrence, Kansas had the slowest median download speeds over fixed broadband on this list during Q2 2022. While all three cities showed faster speeds than the FCC recommendation of 25 Mbps, students looking to use more than one device at a time (or to share an internet connection) may soon find the limits of these speeds.

Dover, Delaware led for mobile download speed on our list of medium-sized college towns during Q2 2022. Only nine of 26 places showed a faster median download speed over mobile during Q2 2022 than the U.S. median of 59.89 Mbps in July 2022. Bowling Green, Kentucky and Bozeman, Montana had the slowest median download speeds over mobile on this list. The speeds in these two places are still sufficient for ordinary use, but students will likely want to rely on fixed broadband for activities that require better performance (like opening 100 tabs to research a paper).

Small college towns with big internet performance

Chart of internet performance in small college towns in the U.S.

If you’ve always dreamed of living in a small town where the entire community seems to revolve around college life, our list of 29 small college towns might be where your heart lies. This list includes places with fewer than 50,000 residents where the college makes up a large part of the economy and the towns aren’t counted as part of a larger metropolitan area.

The Tigers led for fixed broadband and mobile speeds with Grambling, Louisiana (home of Grambling State University) easily topping the list of small college towns with fast fixed broadband (with a median download speed of 333.65 Mbps during Q2 2022). On the mobile side, Clemson, South Carolina (home of Clemson University) eclipsed the competition for download speed with a median of 175.77 Mbps.

Only eight of the 29 small college towns on our list bested the 159.31 Mbps median download speed for fixed broadband in the U.S. during July 2022. For mobile, 11 small college towns exceeded the 59.89 Mbps median download speed for the U.S.

Socorro, New Mexico had the slowest median download speed over fixed broadband by far, well under the FCC suggested 25 Mbps, and Socorro also placed among the slowest for mobile download speed. Looking at mobile, Bennington, Vermont had the lowest median download speed among small college towns. Students with mobile speeds this slow may need to lean heavily on their fixed broadband for both study and play.

Suburban college towns benefit from big city internet infrastructure

Chart of internet performance in suburban college towns in the U.S.

Sometimes you want a college town experience with easy access to the amenities of a big city. That’s where our list of suburban college towns comes in; large or small, each of the 26 places on this list is college-driven but is also close enough to (or part of) a major metropolitan area.

Murfreesboro, Tennessee; Chapel Hill, North Carolina; and New Brunswick, New Jersey had the fastest median download speeds on fixed broadband among our list of suburban college towns during Q2 2022. Kent, Ohio; College Park, Maryland; Troy, New York; and Waukesha, Wisconsin topped our list of mobile speeds in suburban college towns, each coming in with a median download speed above 100 Mbps during Q2 2022.

Proximity to the big city pays off for most of these locations with 16 of 26 suburban college towns showing a Q2 2022 median download speed faster than the 159.31 Mbps median for the U.S. during July 2022. The big city infrastructure effect was even more evident for mobile with 24 of 26 suburban college towns beating the 59.89 Mbps U.S. median for mobile speeds during July 2022.

Oberlin, Ohio had the slowest download speed by far of the suburban college towns we analyzed. While the 56.76 Mbps median speed beats the FCC broadband threshold of 25 Mbps, two or more devices trying to use a connection at that speed could struggle with mission critical activities like video calls home to the parents or the ex you left behind. Oberlin also placed at the bottom for mobile speeds along with Madison, New Jersey, the only two suburban college towns not to exceed the U.S. median.

We were pleased, for the most part, with the internet and mobile speeds we saw in U.S. college towns. There are a lot of options for schools in towns with fast connections and a couple where you could fall off the grid (should you so choose). Did we leave your college town off our list or are you seeing a radically different result in your college town? Take a Speedtest® on Android or iOS and tweet us your feedback. You can also check month-by-month performance for your town and compare expected speeds for internet providers in our new Speedtest Performance Directory.

Ookla retains ownership of this article including all of the intellectual property rights, data, content graphs and analysis. This article may not be quoted, reproduced, distributed or published for any commercial purpose without prior consent. Members of the press and others using the findings in this article for non-commercial purposes are welcome to publicly share and link to report information with attribution to Ookla.

| April 10, 2023

Senators Move to Fix the Broadband Map: Here’s How You Can Submit Crowdsource Data

A lot of energy has been expended in the last several months to dispute the FCC National Broadband Map. The focus has been on two primary issues:

  • The first is a disagreement about the number of broadband service locations (BSLs) that exist in each state. Only residential buildings are eligible and many multi-dwelling units (MDUs) are considered a single location.
  • The second issue regards how many of those locations do not have access to broadband service. Those with throughput speeds less than 25 Mbps download and 3 Mbps upload are considered unserved. Locations served with speeds less than 100 down and 20 up are considered underserved.

These counts are important because the number of total locations and unserved locations in each state will define how much funding each state receives of the over $42 billion available through the Broadband, Equity, Access and Deployment Program (BEAD).

The Infrastructure Investment and Jobs Act (IIJA) that established this program was bipartisan, and so is the concern over the current state of the map. The deadline to challenge the accuracy of these location counts passed in January, but many state broadband offices and the legislators that represent them have made it clear they were unhappy with the process. Some of them felt that there was simply not enough time to analyze the data after gaining access to it.

New legislation proposed to “fix” the map

The demand to fix the map became increasingly serious on Friday, March 31, 2023, as Senators Jacky Rosen (D-NV) and John Thune (R-SD) introduced the “Accurate Map for Broadband Investment Act.” Calling the current map “deeply flawed,” the bill aims to provide additional time to challenge the number of BSLs as well as which ones are considered unserved or underserved.

Everyone expects the FCC map to forever be a work in progress as communities grow and networks expand. It has already improved from its first release and it will continue to get better. As we approach a moment in time that will divide up a finite funding pool, accuracy on the metrics has real monetary consequences. Once allocations are made, it will be up to NTIA to work with each state to fund broadband infrastructure projects and connect communities. However, the dollars each state has to work with won’t change.

The newly proposed legislation would add seven more months to the challenge process for states and other interested parties to dispute the map’s accuracy. To ensure that broadband projects aren’t brought to a complete halt, 20% of the funding would be made available on the original timetable, delaying assignment to states of the remaining funds while more scrutiny is applied to the underlying data.

Multiple bites at the apple

There are two agencies, not just one, that will impact which communities get broadband infrastructure assistance and how soon they get it. Up until now, providing input to the FCC for corrections to the map has been the primary focus. But NTIA will be responsible for working with each state broadband office to identify areas of need and approve project awards. These plans will certainly evolve as new evidence is presented.

During the first phase of their mapping effort, the only significant challenges to the map the FCC accepted were for the number of broadband service locations and individual reports of availability not matching those reported by ISPs. There were certainly some individual challenges submitted, but many states were frustrated at the lack of public awareness and participation. Through NTIA, state offices were always going to get a second bite at the apple as far as getting funding to the right communities. Depending upon the outcome of the Rosen/Thune legislation, states may get an extra bite from the FCC apple as well.

Confusion over crowdsource data

The Commission defined a process for crowdsource data to be presented as evidence to support that reported service availability and performance was less than claimed. However, many filers have found this process unclear or difficult, notably in regard to the requirement that all submissions include Broadband Serviceable Location (BSL) identification numbers. To make this process even more difficult, the only file types accepted as additional evidence were formats that lacked geospatial awareness. In other words, they could not easily be imported into a mapping system.

As of late February, the FCC now accepts JSON files in addition to those formats already approved (PDF, DOC, DOCX, JPG and PNG). This new format can include columns for longitude and latitude, making it easier to include crowdsource data evidence, and has the added benefit of making analysis by the FCC significantly more efficient.

Multipurpose research

Crowdsource data evidence has multiple target audiences. The very same evidence developed to submit to the FCC can be used to work with NTIA during the next phase. NTIA is very familiar with how crowdsource data is employed to define “indicators of need,” and used data from Ookla®, M-Lab, and Microsoft extensively to build their National Broadband Availability Map a couple of years ago.

These federal agencies have been the primary concern, but local interests will become very vocal as projects are chosen. Which communities receive grants and in what priority may be vigorously debated. ISPs that compete for expansion areas will need to prove a track record, and the states will need independent evidence on how well they are serving their existing customers. And those providers that stretched the truth on the level of service they actually provide will fight being overbuilt. States should be preparing for local challenges to their own decisions.

Crowdsource data provides the largest pool of evidence to understand the quality of service being delivered to a community. Hundreds of millions of tests across the country means that even less populated states have hundreds of thousands of points to analyze and better understand the availability and performance of each serving network.

How to support your claim with crowdsource data

Crowdsource data from Ookla Speedtest® measurements can easily be overlaid with FCC maps to produce the needed evidence that indicates where services don’t meet minimum broadband standards. Through crowdsource data submissions, broadband offices can dispute existing maps, advocate for federal funding eligibility, and assist federal officials in their mission to improve broadband availability and performance.

Below are some helpful tips for submitting crowdsource data for disputed areas in a format that can meet FCC requirements.

Step 1: Identify Broadband Serviceable Locations (BSLs)

As an example, we are going to focus on an area near Durango, Colorado — a mountainous area that is both difficult and expensive to cover. We start by looking at all of the BSLs represented in the FCC’s map within the area of interest for early 2023.

Map of Broadband Service Locations (BSLs) in Durango, Colorado

Step 2: Overlay FCC hexagon system with BSLs

Next, we overlay the BSLs with hexagons where the FCC defines broadband service as being available. The darker the hexagon, the more ISPs claiming to provide service in that area.

Map of Hexagons of Broadband Service Availability in Durango, Colorado

Step 3: Layer Speedtest data with FCC hexagon system and BSLs 

By layering Speedtest data from fixed terrestrial operators on top of the hexagons, we can see that Durango and Durango West have high test densities. There are many households packed closely together, making those areas more viable to justify the cost of building high-speed services to them from a purely economic standpoint. Location accuracy for most tests is under 100 meters, so tests will grid into bins measuring approximately 1002 meters (this varies based upon latitude). If there are multiple tests within each bin, they will stack, and we are showing the fastest recorded speed on the top in this view. Speedtest measurements shown are for the four quarters (Q1-Q4, 2022) immediately previous to the published FCC data.

Map of Speedtest Data Layered with FCC Data in Durango, Colorado

Step 4: Create clusters to see Speedtest data at scale within the FCC hexagon system

To get an idea of the actual volume of Speedtest data we’re looking at, we created a clustered version demonstrating where the number of tests are much greater. Some hexagons have 100+ tests, and a few hexagons have no tests, usually because there are fewer households.

Map of Clusters of Speedtest Data in Durango, Colorado

Step 5: View Speedtest performance within the FCC hexagon system

Using that methodology, we can show how the aggregated test results appear within the hexagons defined by the FCC. The red hexagons (levels 8 and 9) demonstrate where the median speed is not meeting FCC minimum standards for broadband. This helps you get an idea of the overall experiences people are having, as well as the maximum speeds experienced in an area referencing the stacked tests previously shown.

Map of Median Speed for Test in FCC-defined Hexagons in Durango, Colorado

Step 6: Create a polygon of Speedtest data with BSLs 

Next, create a polygon that surrounds the community or specific area of interest. Many ISPs have created polygons to capture all of the BSLs that fall within their territories for their service area and technology submissions. In our discussions with the FCC, staffers have suggested following a similar approach for crowdsource submissions.

Map of Polygon of Underserved BSLs in Durango, Colorado

Step 7: Export the polygon of BSLs as a CSV file

Next, export a CSV file of the locations that are within the polygon, including the Location ID, as directed in the instructions defined by the Broadband Data Task Force (BDTF). The entire FCC submission process has been built around identifying these location IDs for each BSL.

Map of Polygon of BSLs in Durango, Colorado

Step 8: Export the polygon of Speedtest data as a JSON file

Using the same polygon, select and export the Speedtest results as a JSON file, including speed and latency measurements, ISP names, timestamps, anonymized user ID, and source test ID.

Map of Polygon of Speedtest Data in Durango, Colorado

Step 9: Submit the files to the FCC 

Submit the CSV file as well as the JSON file as additional evidence to the FCC along with any other documents supporting your dispute of the service availability, using one of the accepted file formats. This may include maps defining the area being disputed, documents from residents claiming inadequate or no service, and any other pertinent information.

Step 10: Be prepared to use the evidence to partner with NTIA

The FCC maps will ultimately define how many dollars go to NTIA to determine state funding. NTIA is preparing to use the same map fabric and BSL data as that used by the FCC. This will allow collaboration with all the above parties and will assist with reconciling the differences between the federal stakeholders. You can utilize this same data as you work with NTIA to demonstrate where you would like to focus funding as well as resolving local disputes on broadband availability.

Want to learn more? Watch our recent webinar

We hosted a webinar on March 30, 2023 titled “Using Crowdsource Broadband Data to Dispute FCC Maps”. In this webinar, a panel of experts came together to discuss common challenges in the mapping process and successful broadband mapping projects. Panelists included Jamie Hoffman, Program Manager at the West Virginia Department of Economic Development, Patrick Ryan, Senior Solution Engineer, Telecommunications at Esri, Tom Reid, President at Reid Consulting Group and me, Bryan Darr, VP of Government Affairs at Ookla.

You can watch the recording of the recent webinar here.

Ookla retains ownership of this article including all of the intellectual property rights, data, content graphs and analysis. This article may not be quoted, reproduced, distributed or published for any commercial purpose without prior consent. Members of the press and others using the findings in this article for non-commercial purposes are welcome to publicly share and link to report information with attribution to Ookla.

| February 21, 2023

European 5G Performance Trails its International Peers

The European Union’s Digital Decade target is rather ambitious. It wants gigabit connectivity for everyone and ubiquitous 5G coverage by the end of 2030 to assist with digital transformation. When we reflected on 5G progress last year, we concluded that Europe had fallen behind its international peers. In this article, we will assess 5G progress across Europe.  

  • Europe trails others’ performance. Although more spectrum has been awarded over the past year, European 5G performance trailed the likes of the UAE and South Korea. 
  • 5G Availability is on the up. Whilst still behind its international peers, 5G adoption has increased during 2022. This, combined with the greater availability of 5G smartphones and the rollout of 5G networks using low-band spectrum, resulted in higher 5G Availability across most European countries. 
  • A tale of two Europes. In the Nordics and some Eastern European markets (Bulgaria and Cyprus) 5G outperformed the big 5 European economies (U.K., Germany, France, Spain, and Italy). Operators call for more consolidation and regulatory intervention to facilitate 5G investment. 
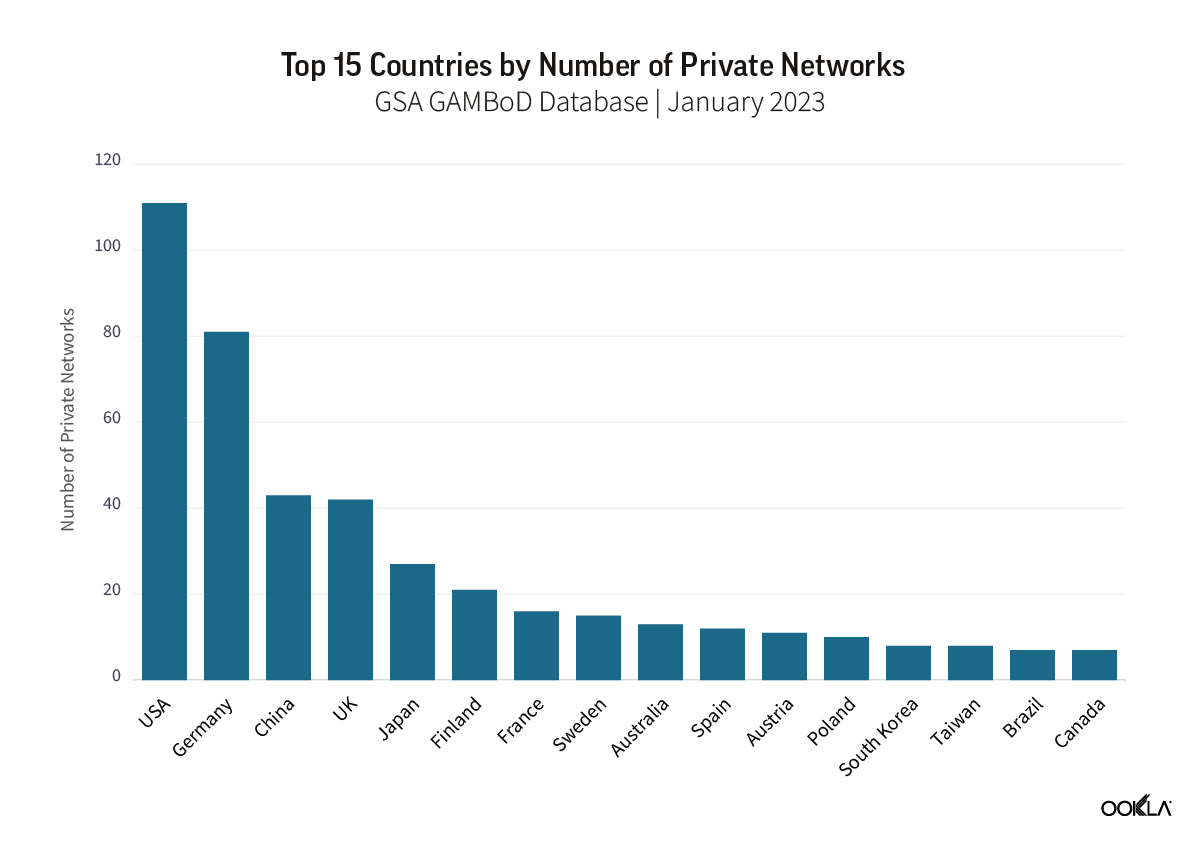
  • A hotbed for private networks. European governments and regulators are keen supporters of enterprise digitization efforts, and 5G is heralded as a key enabler to assist with that. Over 40% of all private networks worldwide are in Europe, a growing proportion of which are utilizing 5G. 

Mid-band is most assigned spectrum across Europe

As per the European Commission’s 2016 5G Action Plan, EU countries are meant to make low-band (700 MHz) spectrum available for use by June 30, 2020, and mid- (3.6 GHz) and high-band/mmWave (26 GHz) spectrum by December 31, 2020. At the EU level, there are the so-called 5G pioneer bands. These are the changes compared to when we last reviewed 5G spectrum assignments across Europe: 

  • Four countries still needed to assign spectrum last year. Now, Poland is the only one without dedicated 5G spectrum. 
  • Over the course of last year, three more countries awarded spectrum across all of the 5G pioneer bands, making a grand total of eight countries. 
  • Four more countries awarded spectrum across both low- and mid-band spectrum, tallying up the count to 17.
  • Mid-band spectrum is the most popular spectrum band, with 28 countries already awarded mid-band spectrum — an additional five to when we last took stock. The remaining countries, Poland and Netherlands, will finally auction the 3.5 GHz spectrum in the summer of 2023.
  • 26 countries auctioned spectrum in the 700 MHz bands, compared to 21 a year ago.
  • Eight countries have awarded mmWave spectrum thus far. Spain is the only addition in 2022, raising €36 million. 

map of european spectrum award in 5g pinoeer bands


Legacy networks give way to 4G LTE and 5G 

5G pioneer bands are not the only frequencies that operators use to deploy 5G. As operators shut down legacy networks, they can refarm sub-3GHz frequencies for 4G LTE or 5G. European operators tend to support 2G in the short term, phasing out 3G networks instead. MNOs also look to optimize their network operations, and the upkeep of legacy networks comes with additional cost and complexity.

The rate of network shutdowns is increasing. So far, across Europe, 21 operators across 11 countries have retired 3G networks compared to only two 2G network shutdowns. 2G is still needed to support M2M/IoT use cases, e.g. ongoing long-term enterprise contracts with utility providers. In contrast, operators see less traffic carried over 3G networks hence the desire to retire them. For example, Magyar Telekom noted 2.3% and 0.84% of total voice and data traffic on the 3G network. Proximus stated that 2% of its data traffic uses 3G, while Telenet/Base shared that 3G devices account for just 1% of its network. Looking ahead, 43 operators across 26 countries announced their plans to switch off 2G networks, and 37 operators in 21 countries will pull the plug on 3G.

5G adoption lags, 5G performance doesn’t impress either 

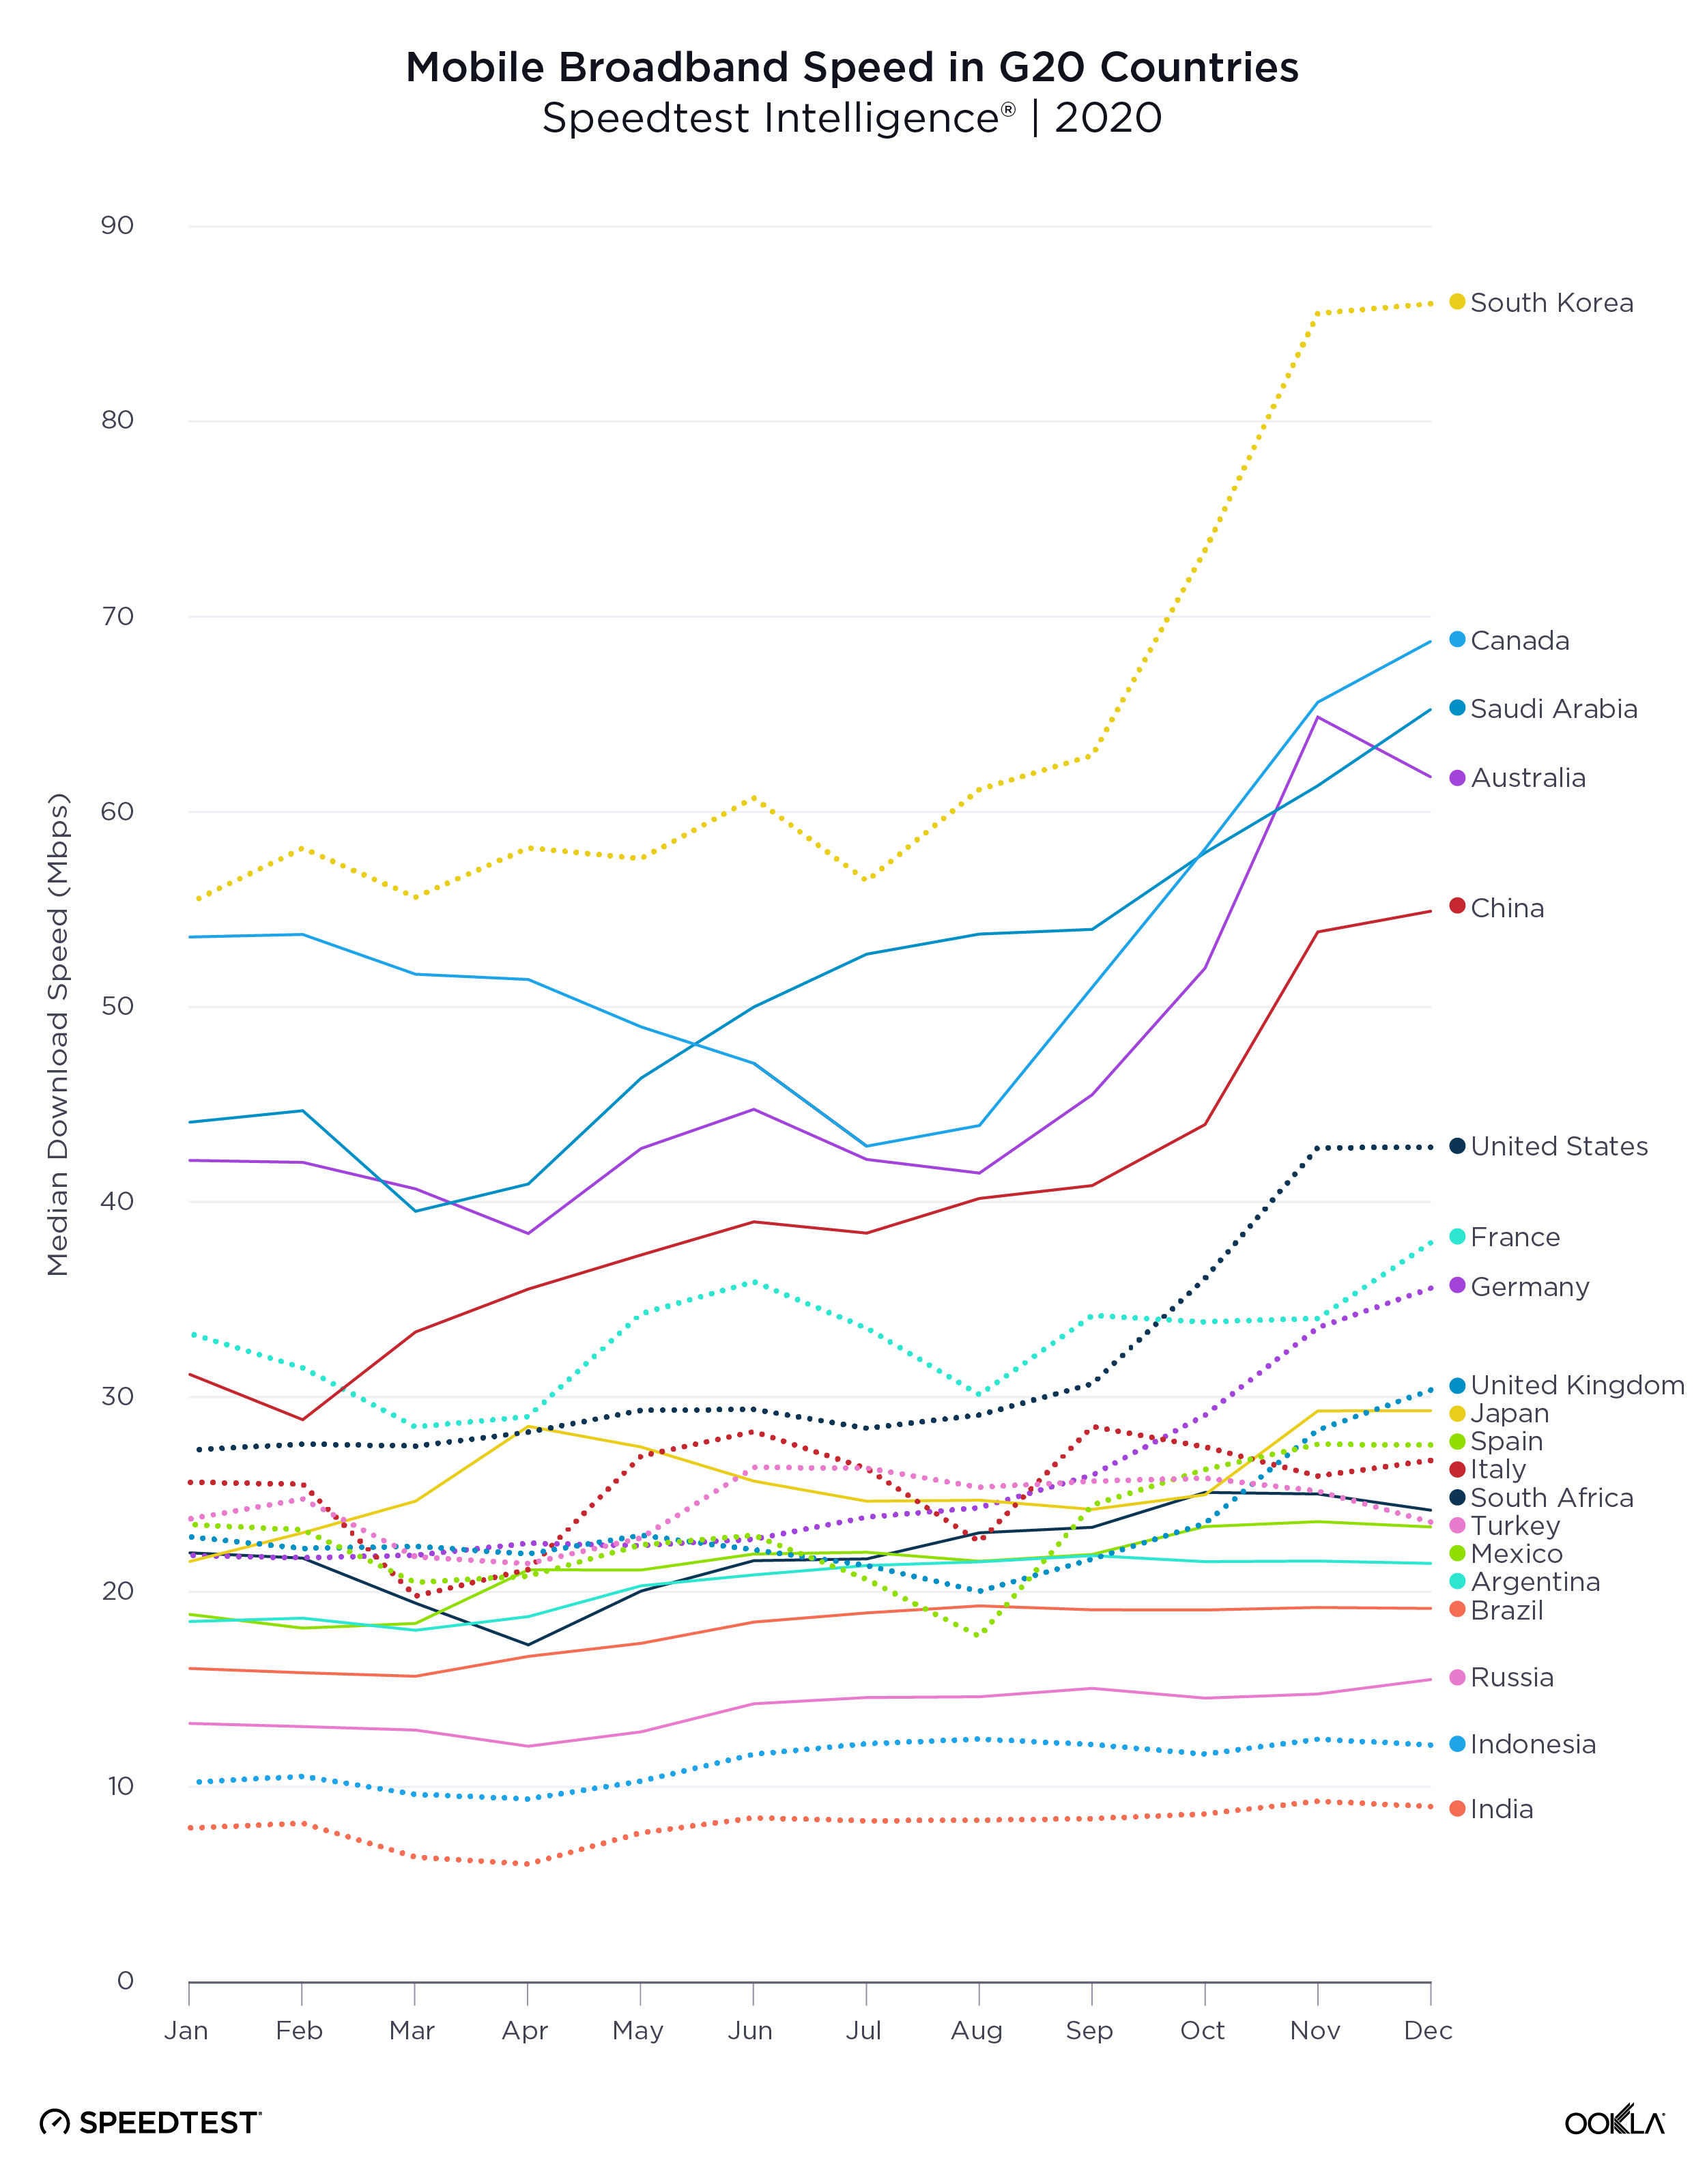
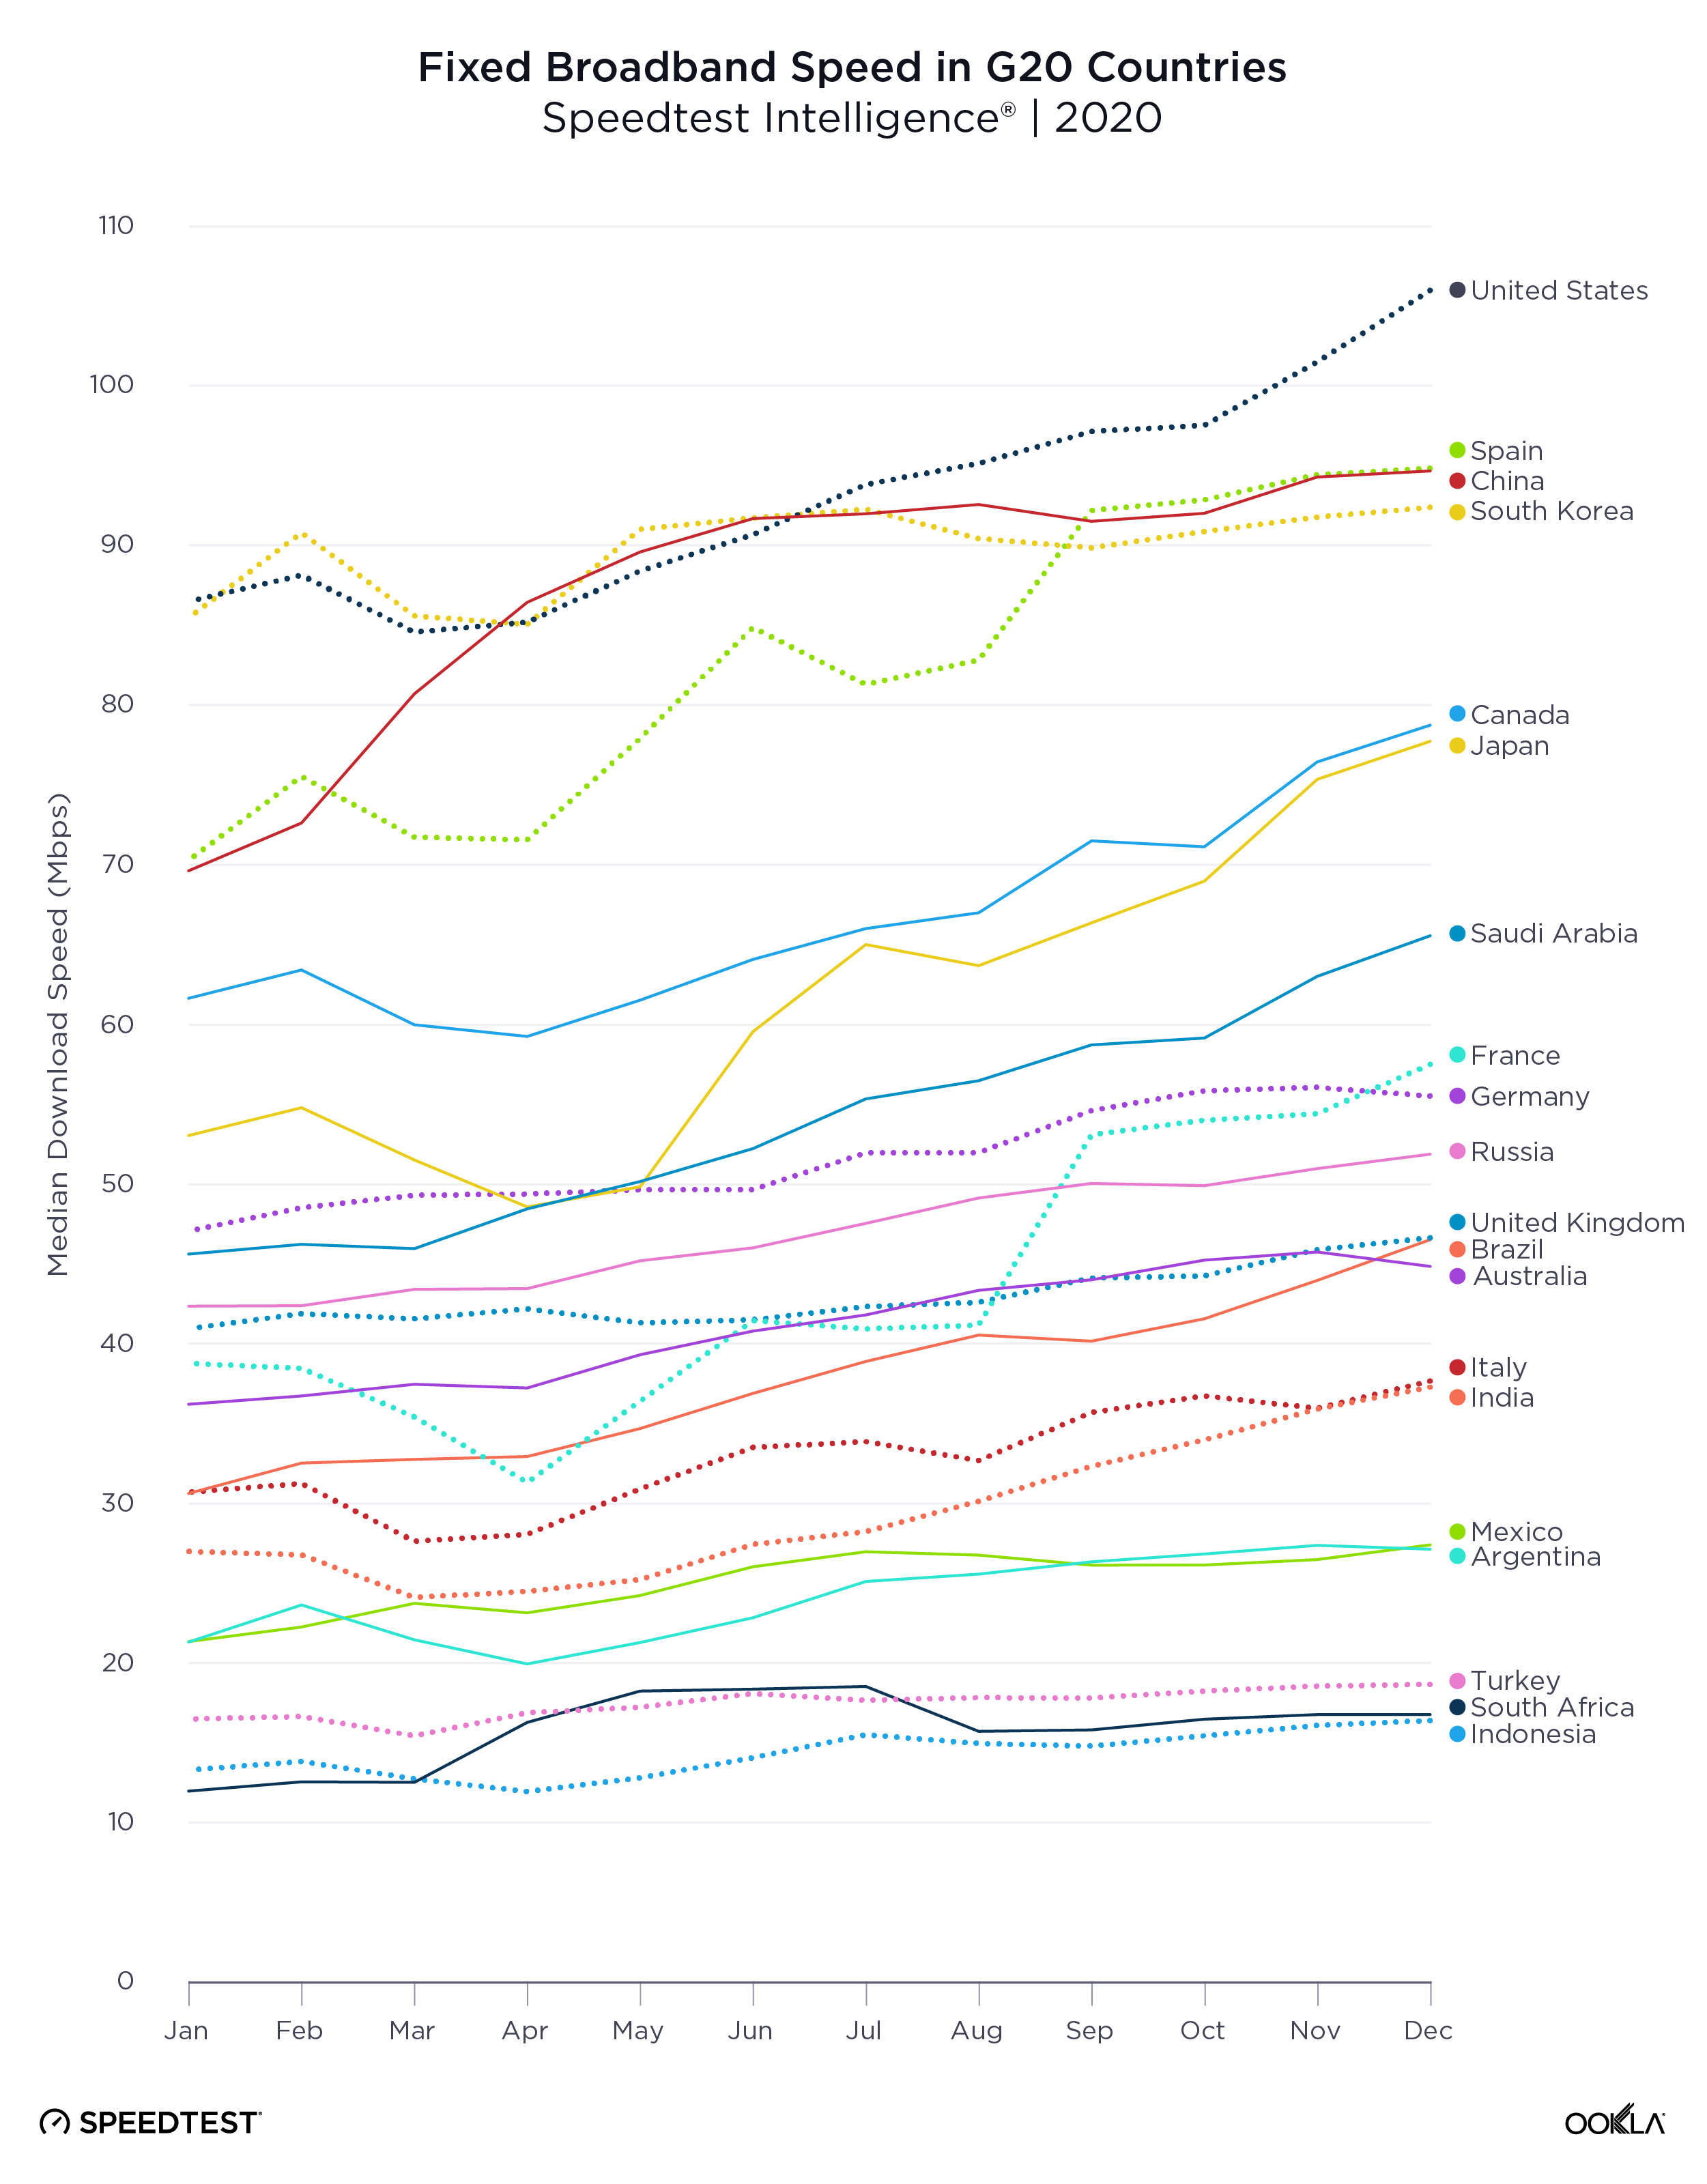
Most European countries have commercial 5G networks in place. However, 5G adoption across Europe lags behind its global peers. According to GSMA Intelligence, in Q4 2022, 5G uptake in Europe accounted for 7.4 % of total mobile connections, a substantial increase over the Q4 2021 level of 2.5%. Across European countries, 5G adoption is at most 21% (Switzerland), compared to 43.1% in the United States, 42.4% in South Korea, China (36.3%), Australia (30.1%), and Japan (28.5%).

chart of 5g performance in europe with select international comparisons


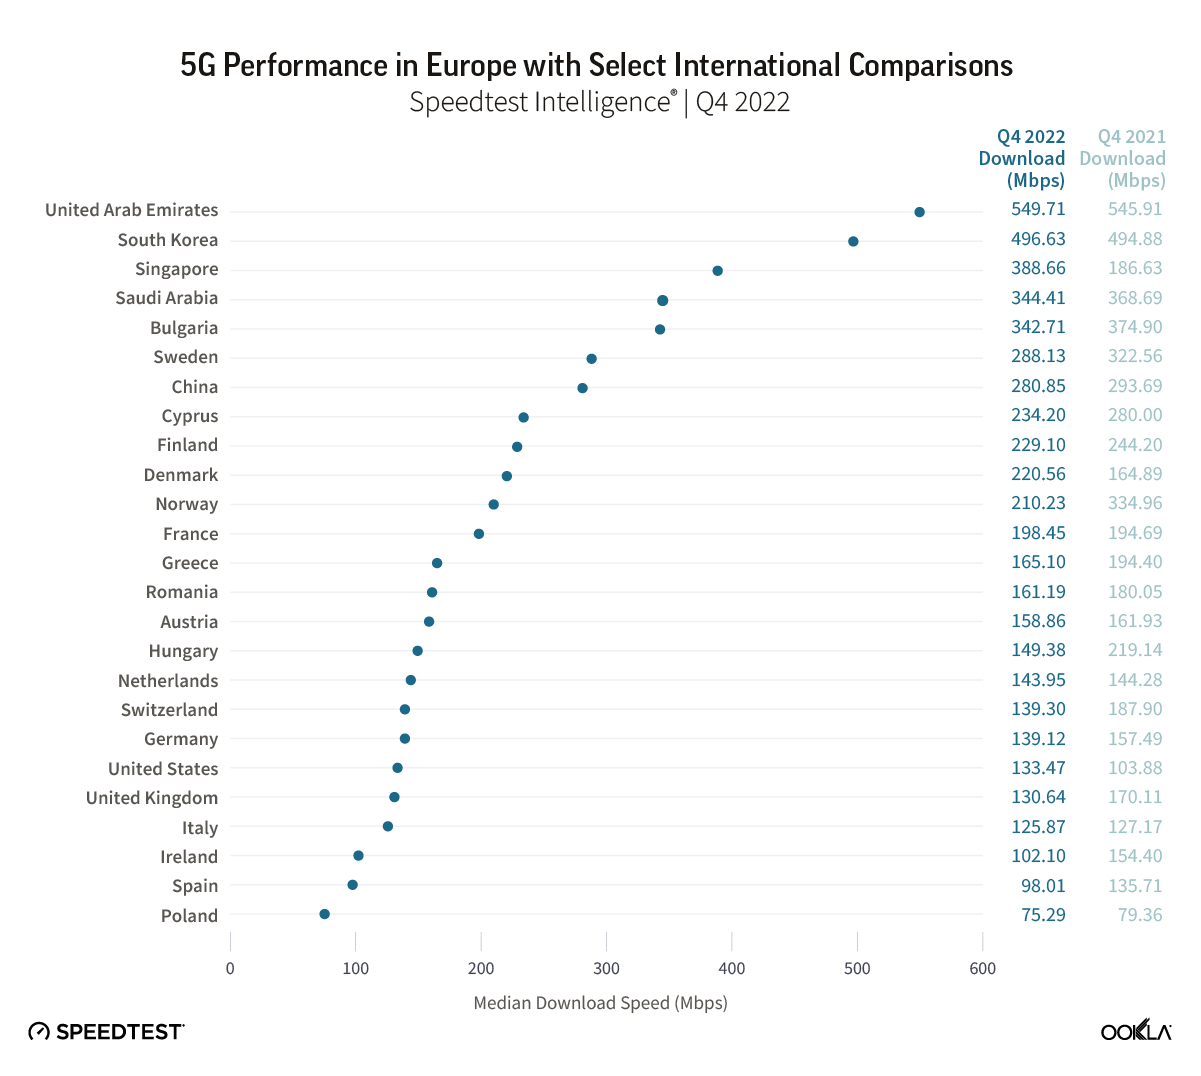
Our recent article identified four broad clusters of 5G performance based on Speedtest Intelligence® data. Most European countries achieved median 5G download speeds under 200 Mbps, placing them within the 5G Improvers category. Bulgaria was the only country that made it into the 5G Leaders category, which includes the likes of the UAE, South Korea, Singapore, and Qatar, with a median 5G download speed of 342.71 Mbps, a slight decrease compared to last year (374.90 Mbps in Q4 2021). Five countries made it into the High Performers cluster, achieving a median 5G download speed exceeding 200 Mbps: Sweden, Cyprus, Finland, Denmark, and Norway. Interestingly enough, the big five European economies (U.K., Germany, France, Spain, and Italy) were outperformed by the Nordics and two Southern Eastern European markets (Bulgaria and Cyprus). The Nordics have always played a leading role in European telecoms, but the 5G performance gap between them and the big five points to challenges in those markets. 

Across most of Europe, median 5G speeds have actually decreased. This isn’t surprising, as increased adoption leads to higher network congestion, but other factors are at play. Operators feel the pressure of the economic crisis, higher energy costs, and reduced consumers’ spending power. Europe also suffers from fragmentation, low ARPU levels brought about by intense competition, and Capex levels that are half that of the U.S. and Canada. A report by the European Court of Auditors estimates the deployment cost of 5G across all EU member states at around €400 billion. Operators are yet to see additional revenue coming from 5G that can support that level of investment. The optimal market structure and role of governments in supporting the rollout of 5G remains a heavily debated topic as operators’ M&A activities heat up.

chart of top 5g performing providers in europe


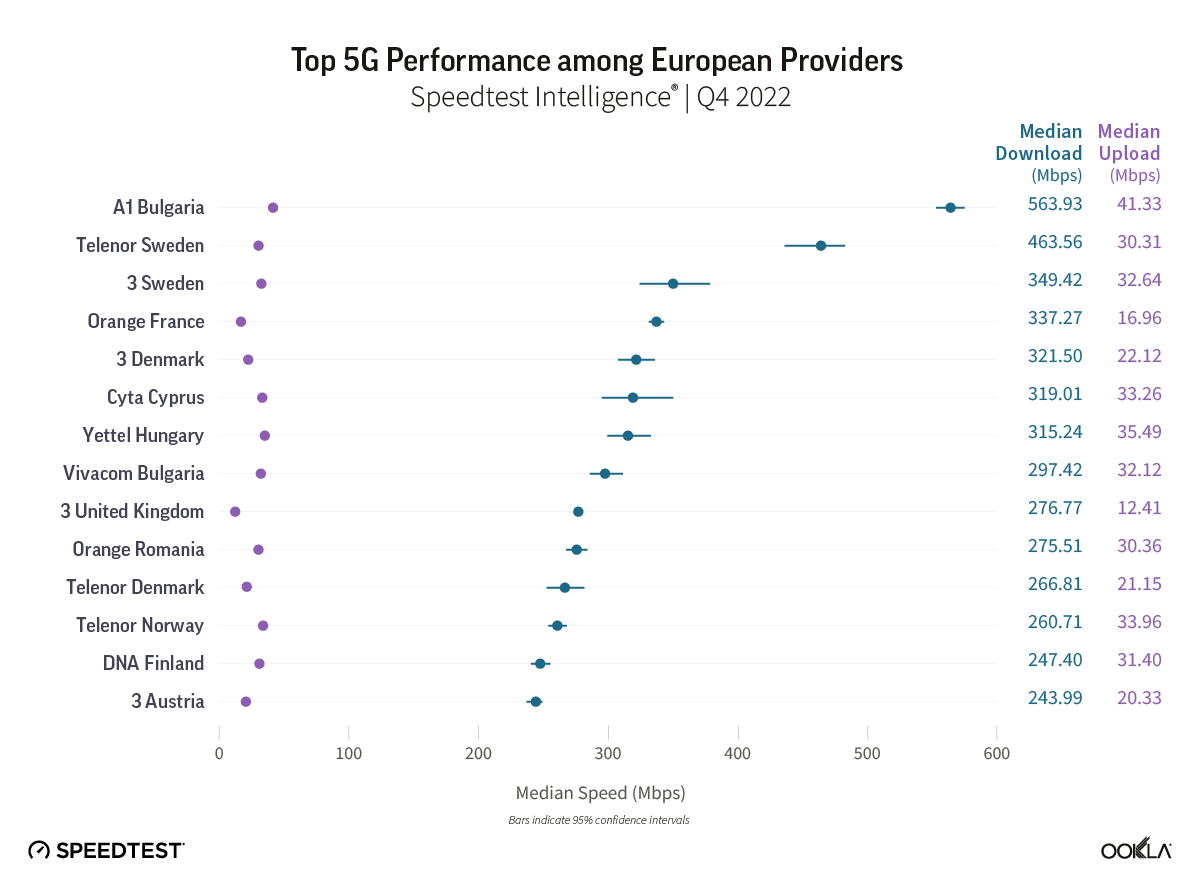
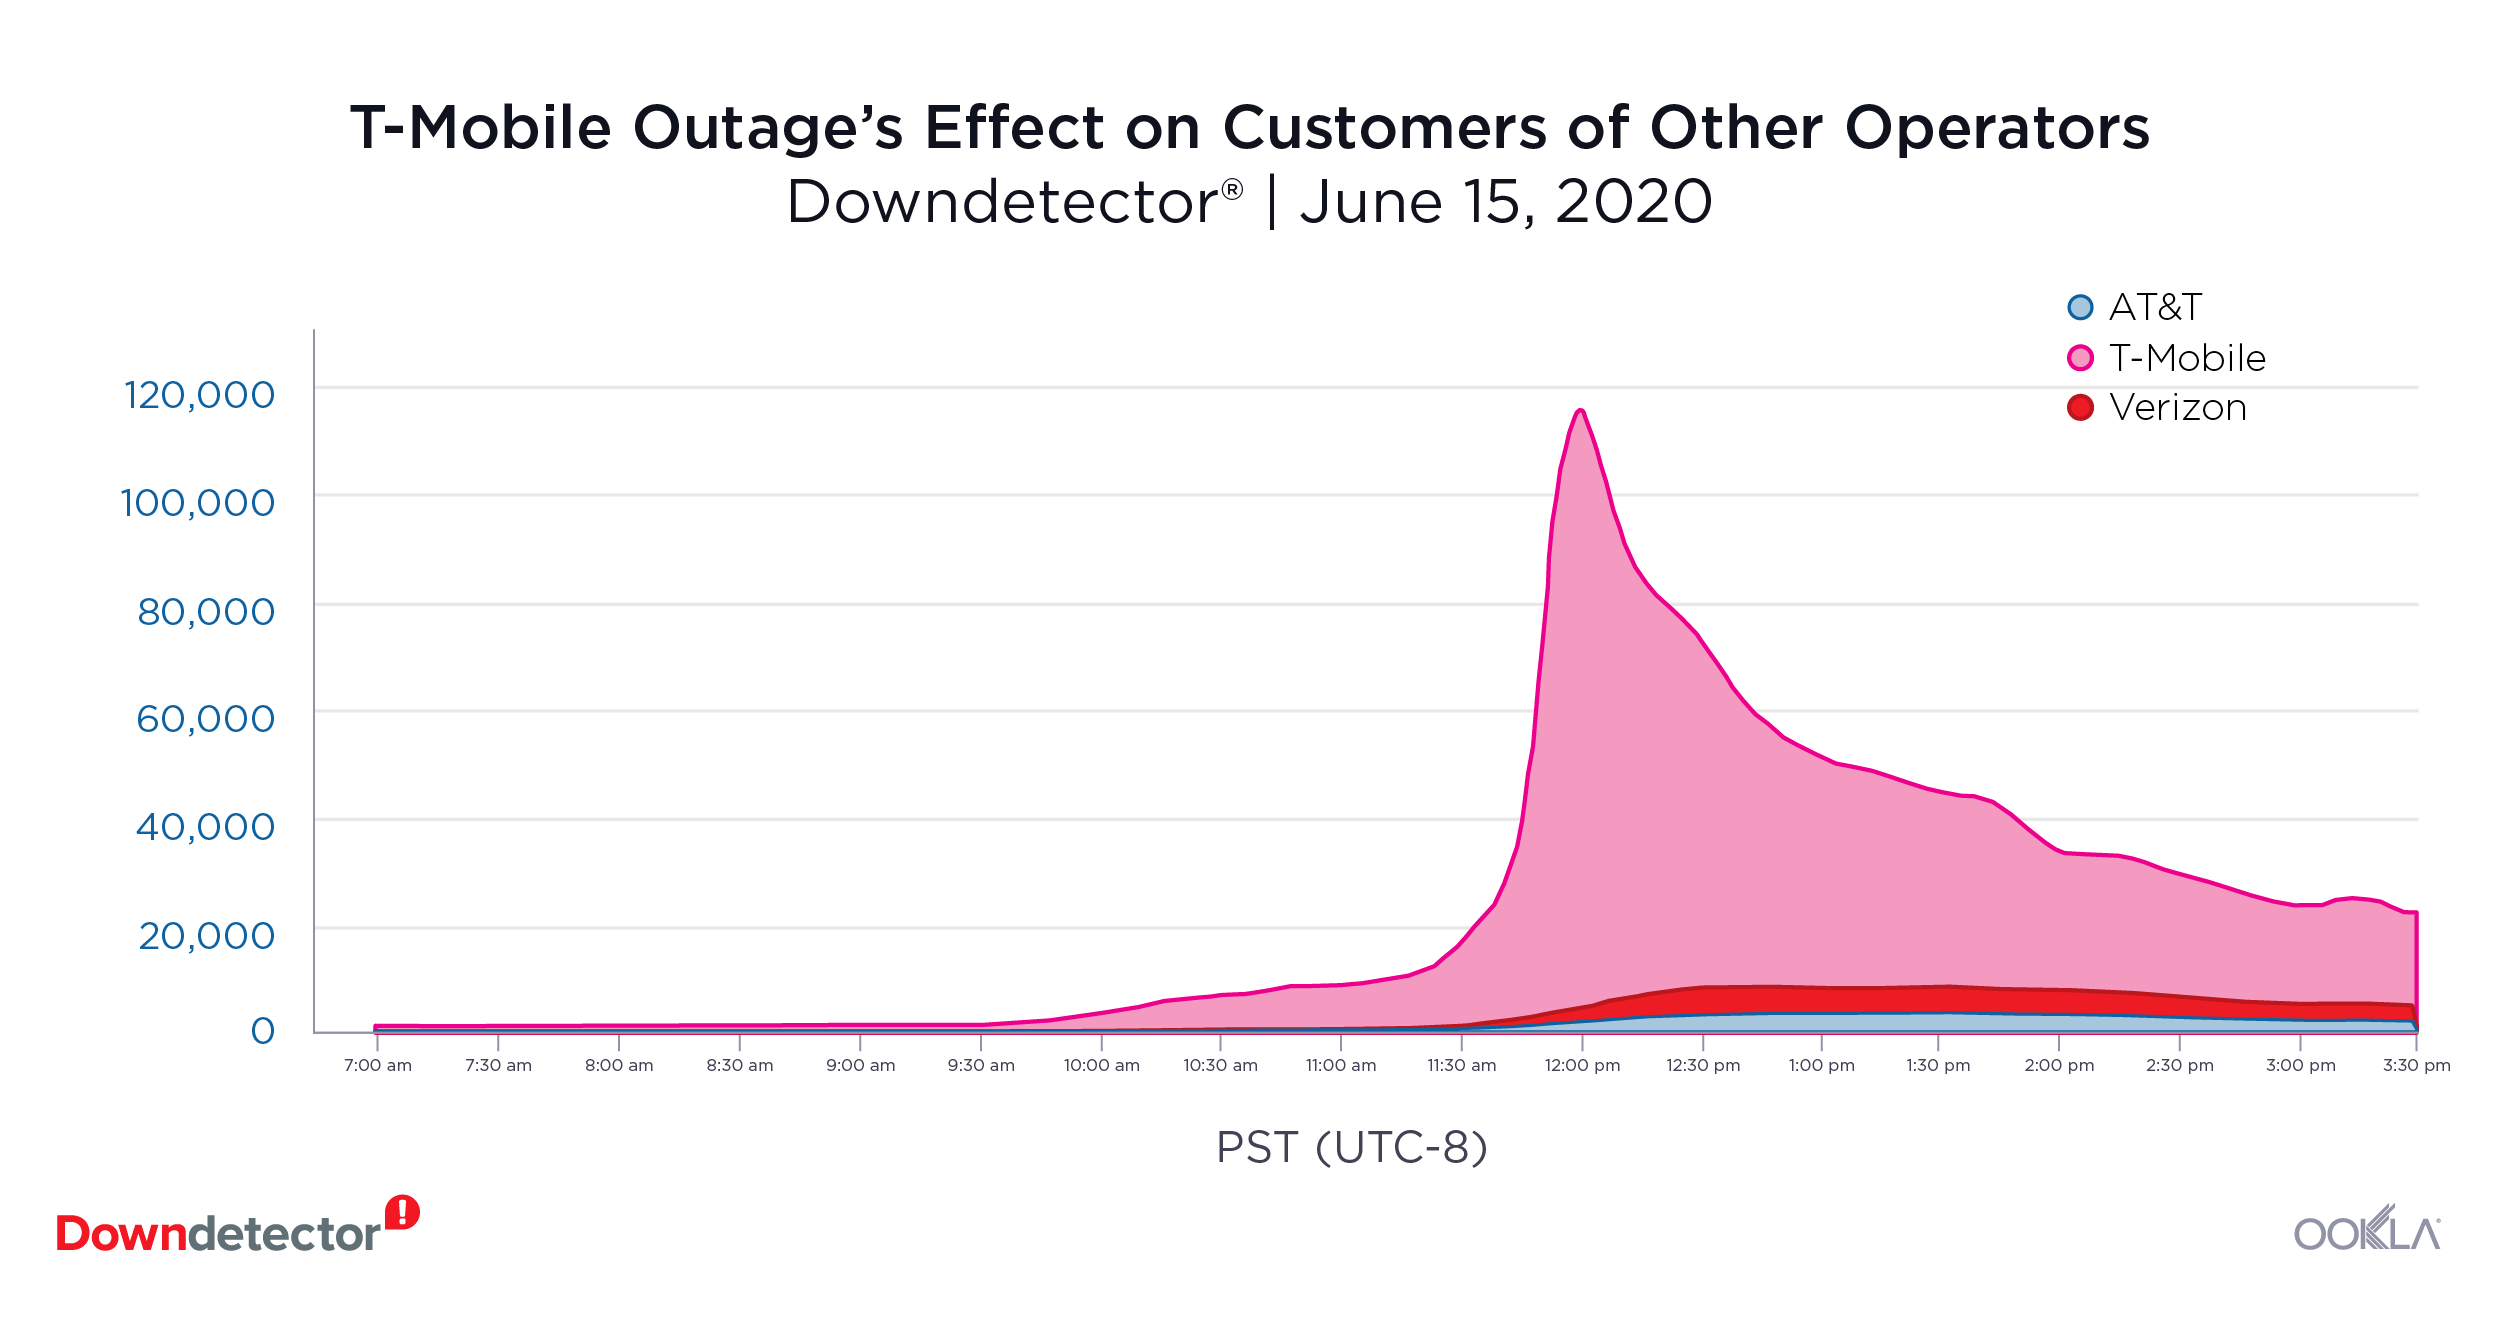
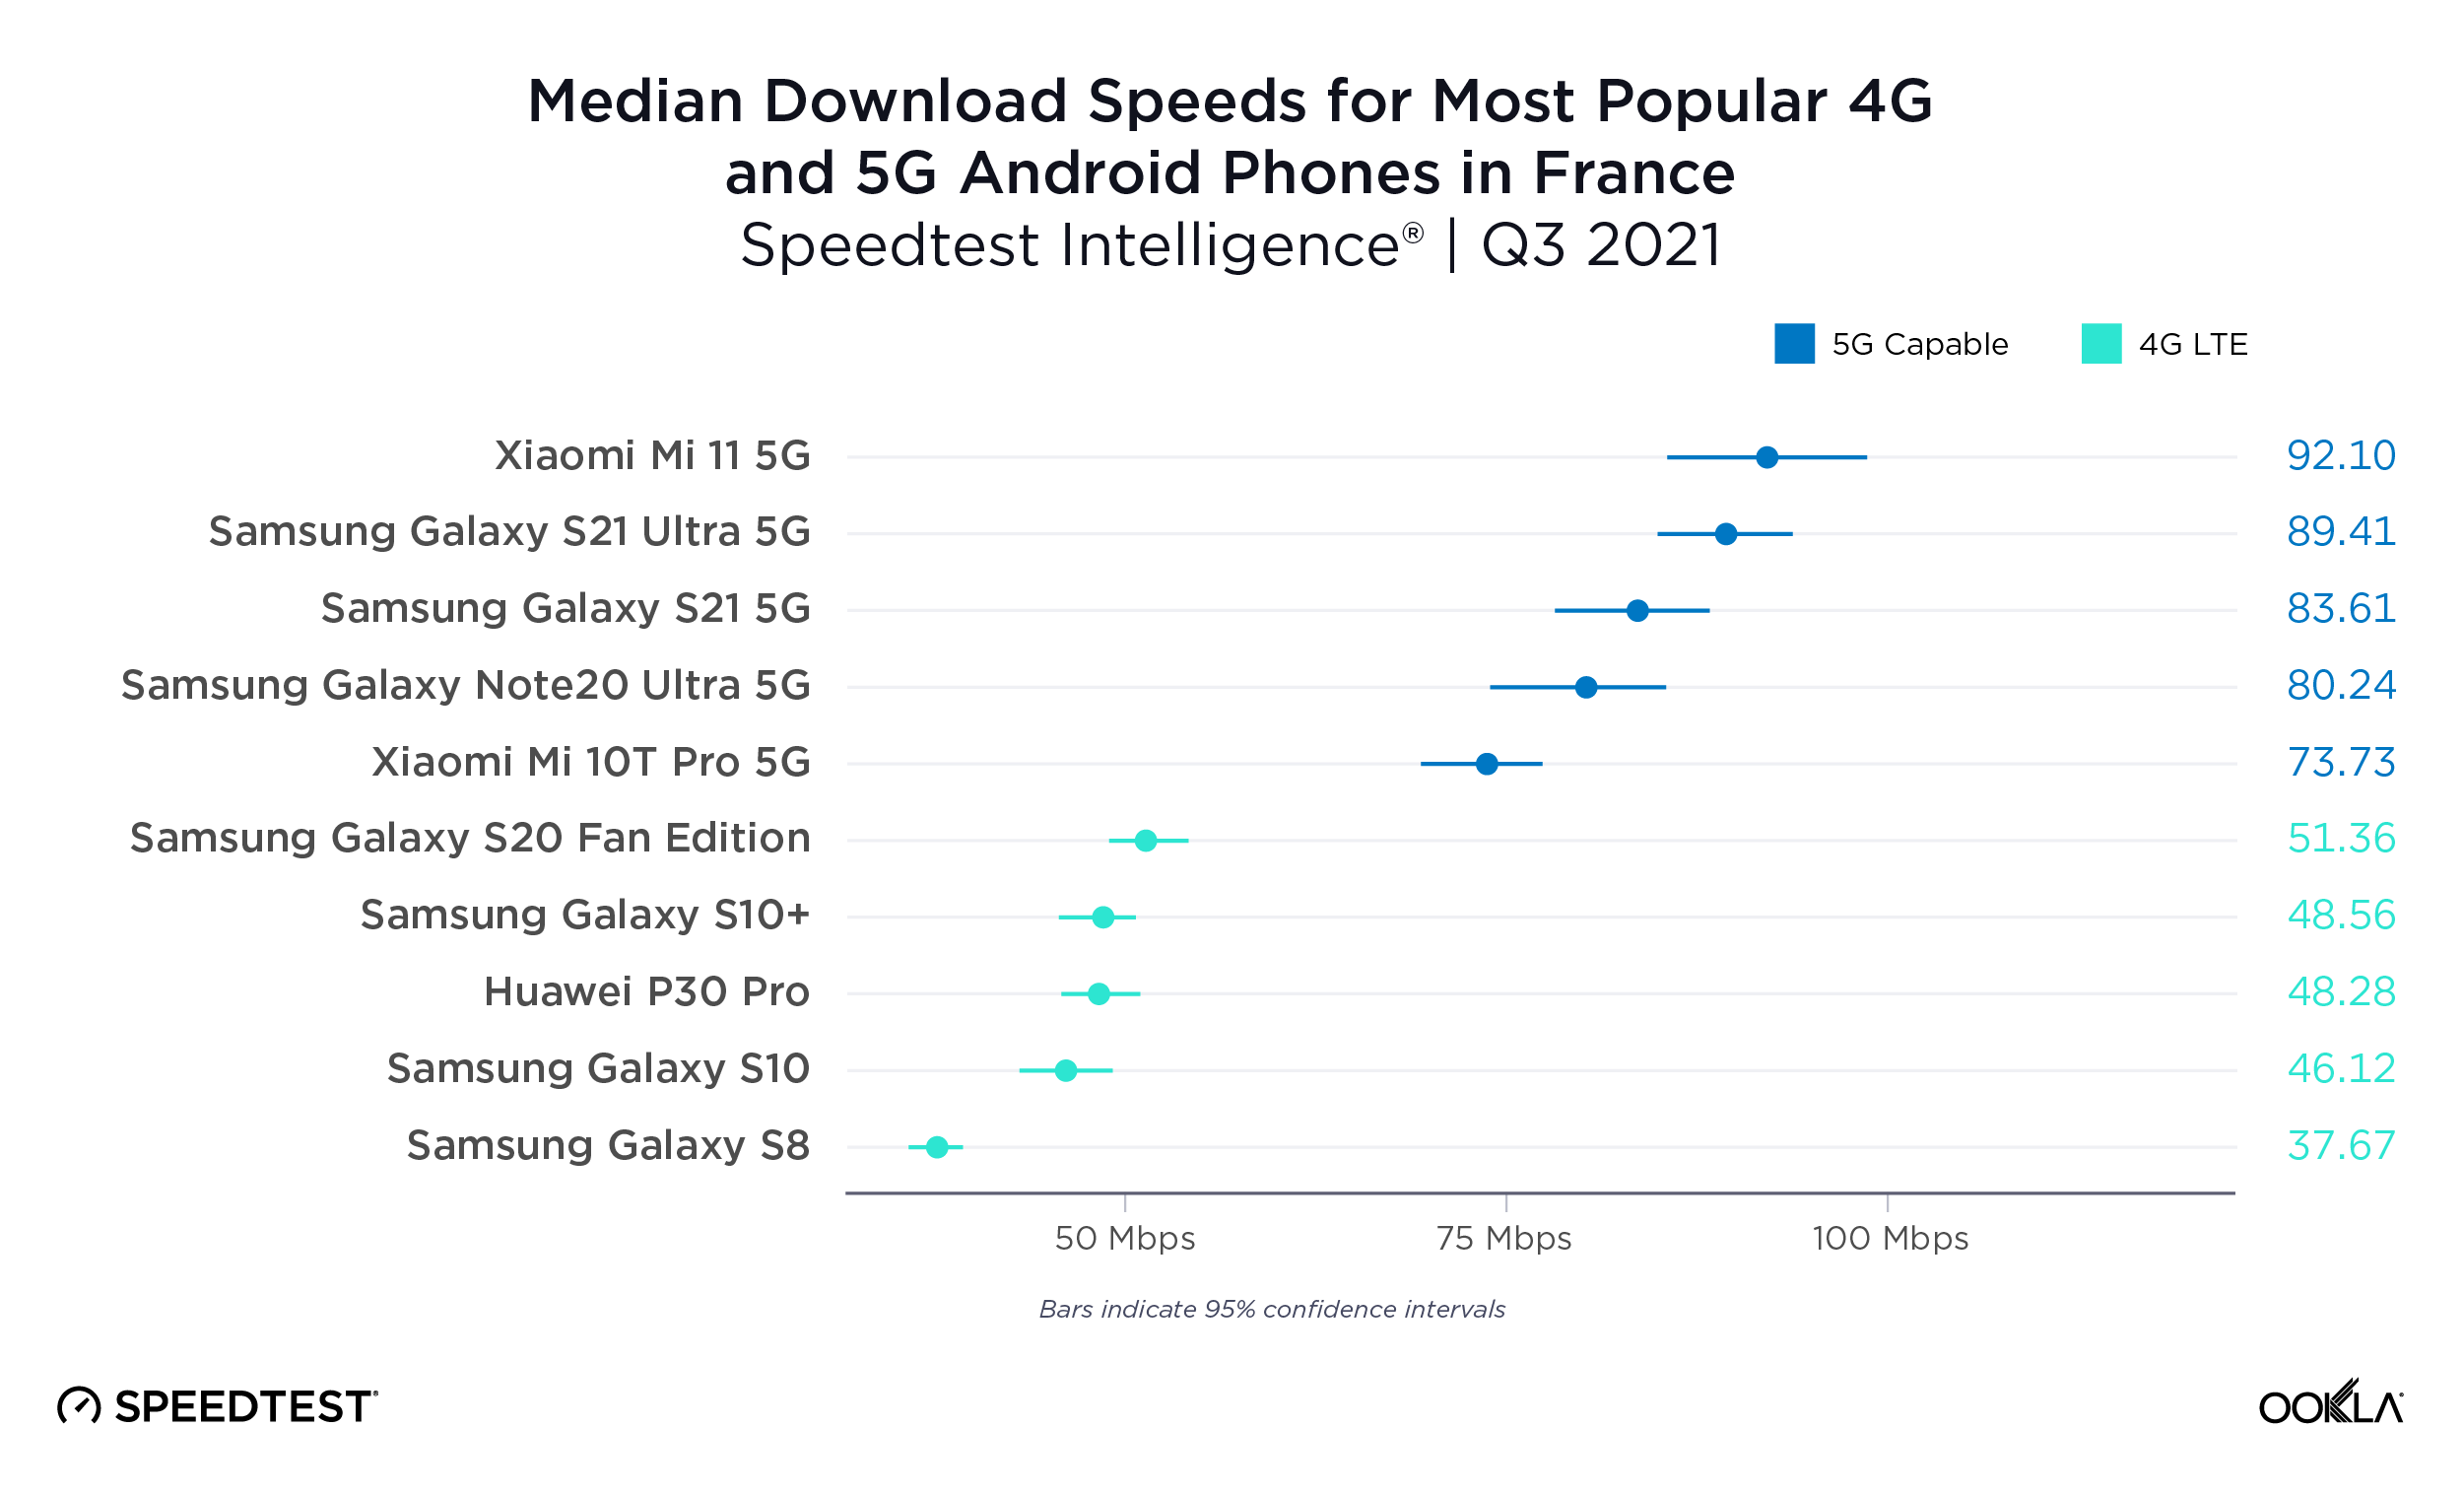
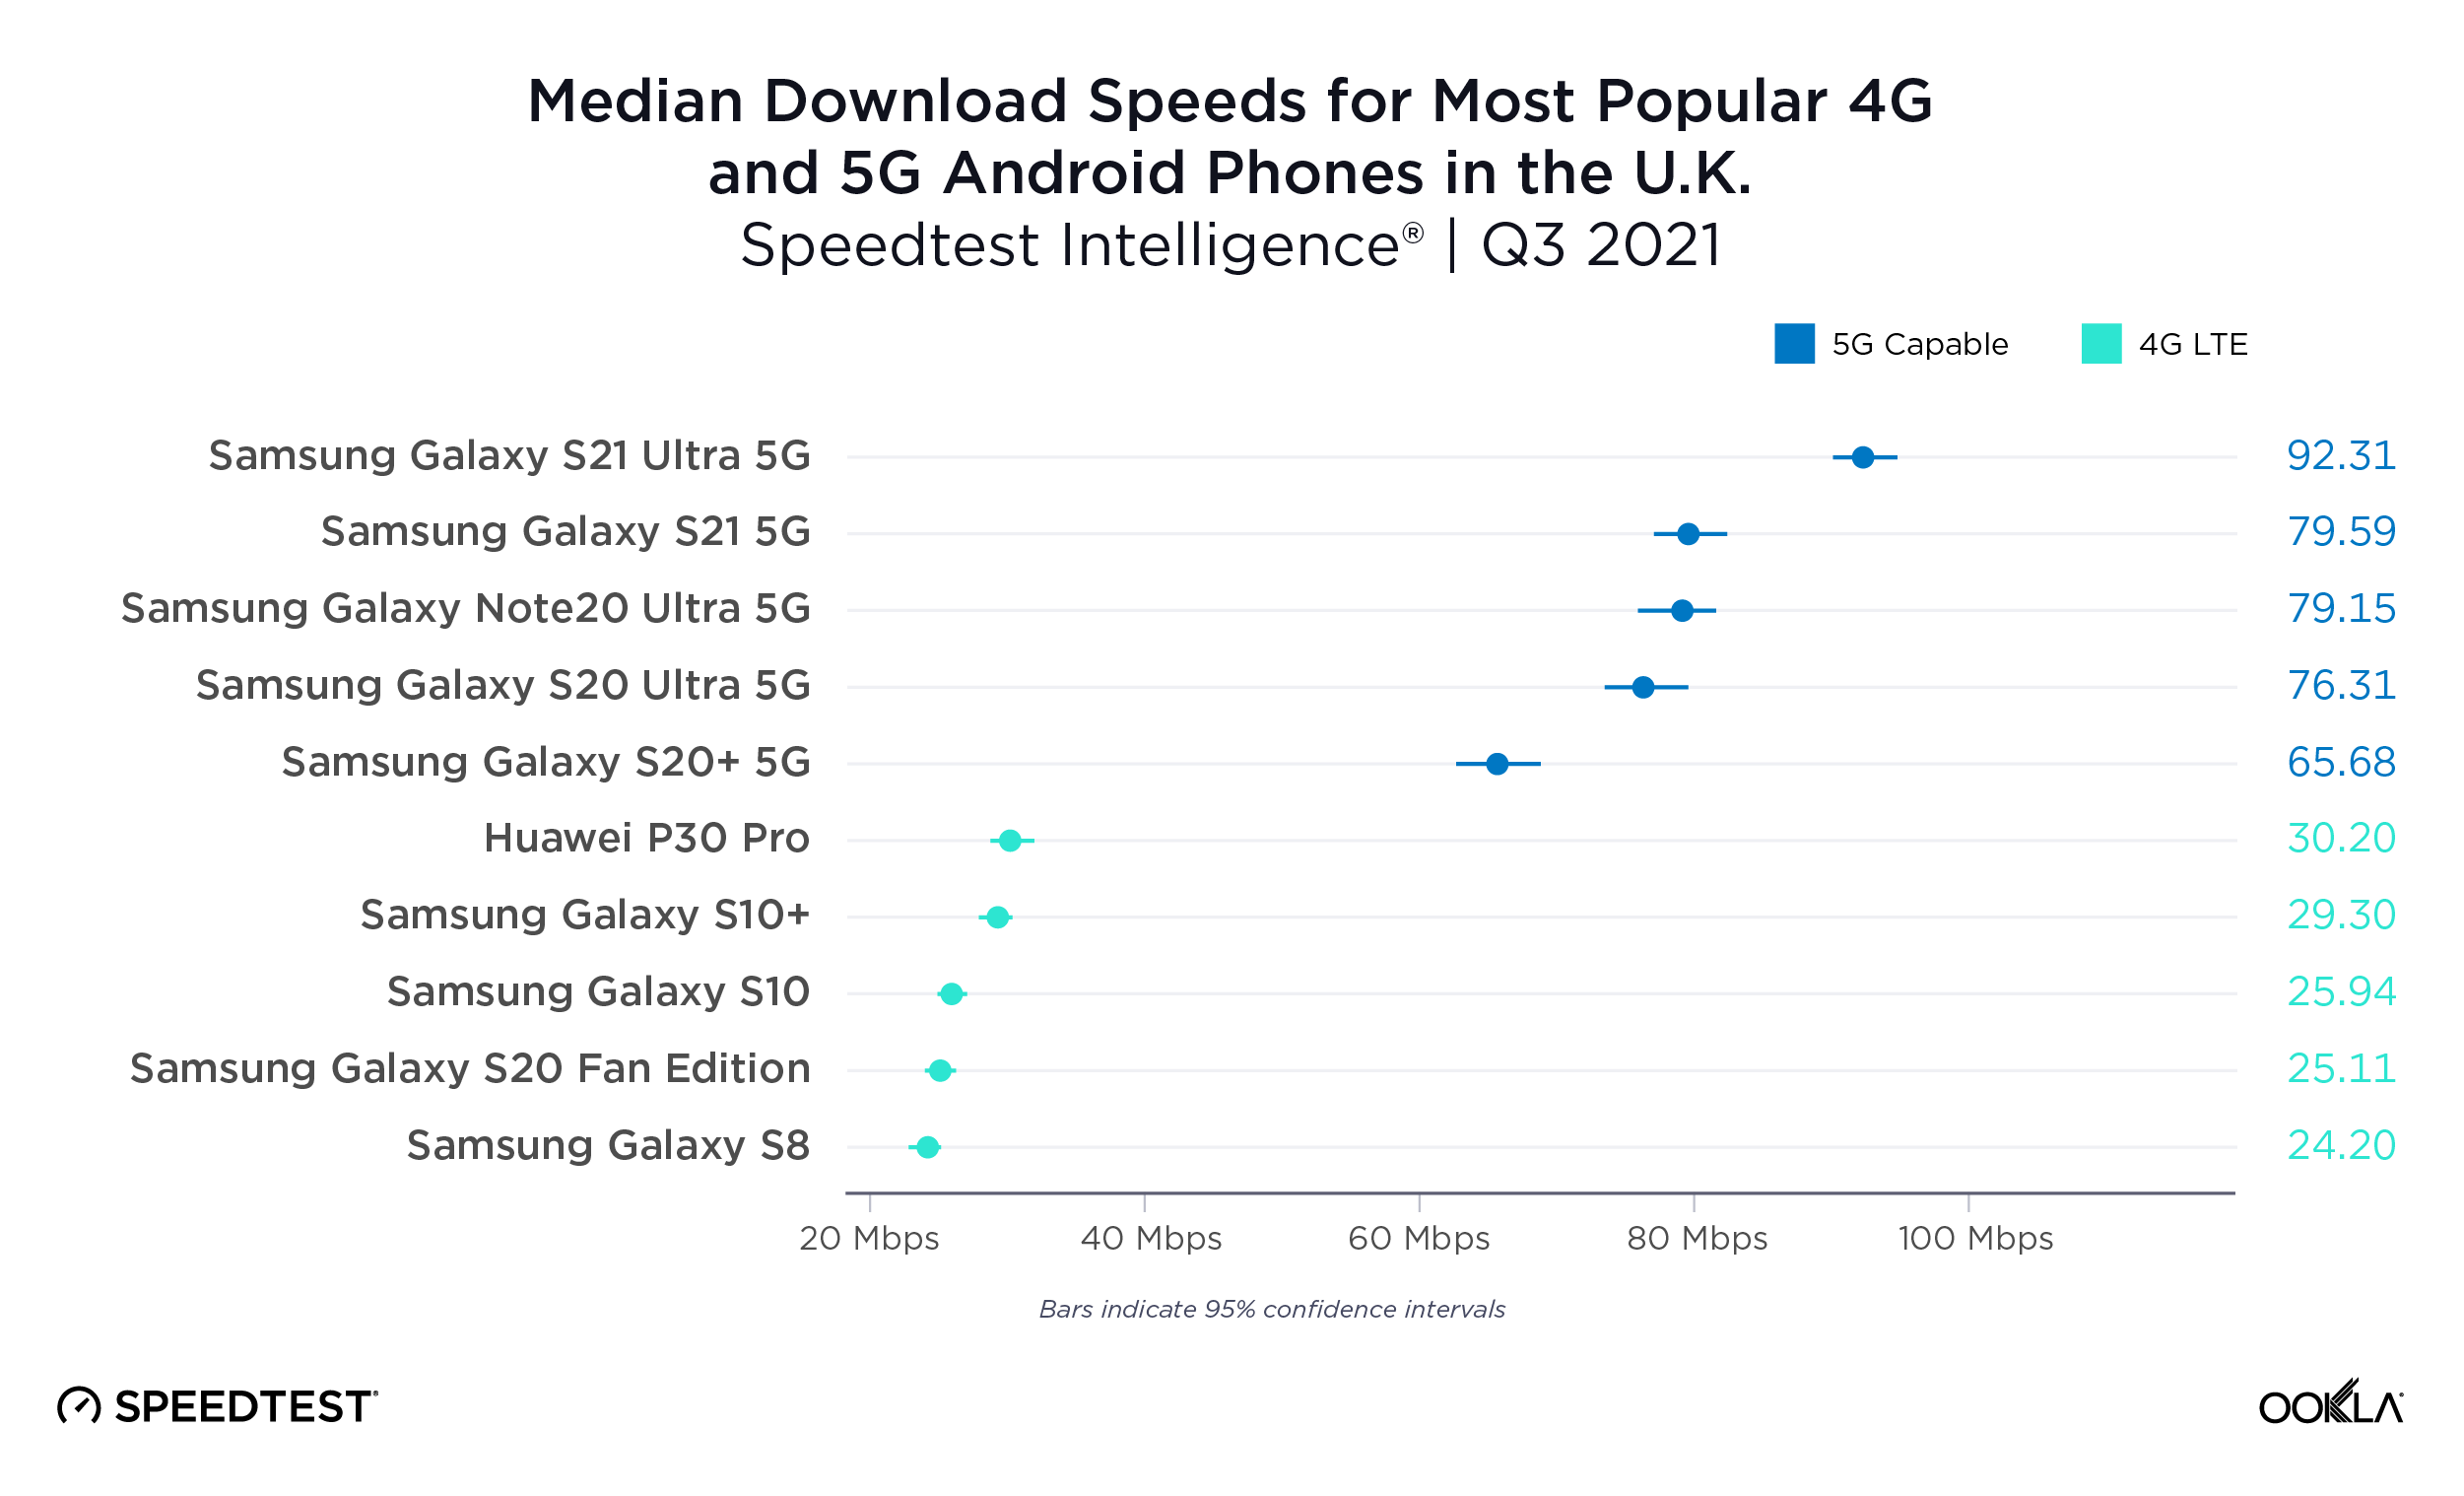
Operators’ performance tells an interesting story as there are vast differences between countries and even within a country. The Nordics operators’ 5G performance tends to rank highly compared to other European countries thanks to having access to dedicated 5G spectrum and supportive regulatory environment. Denmark and Sweden have a greater level of network sharing as two operators share Multi-Operator Core Networks (MOCNs) and spectrum. In some countries, operators have to adhere to conditions stipulated by the 5G license, either in terms of network coverage or the number of 5G sites. For example, in France, each operator had to deploy 3,000 5G sites by the end of 2022. Challenger mobile operators often outperform incumbents — strong results from Three in the chart above are proof of that. 

5G Availability shows improvement

chart of 5g availablity in europe with select international comparisons


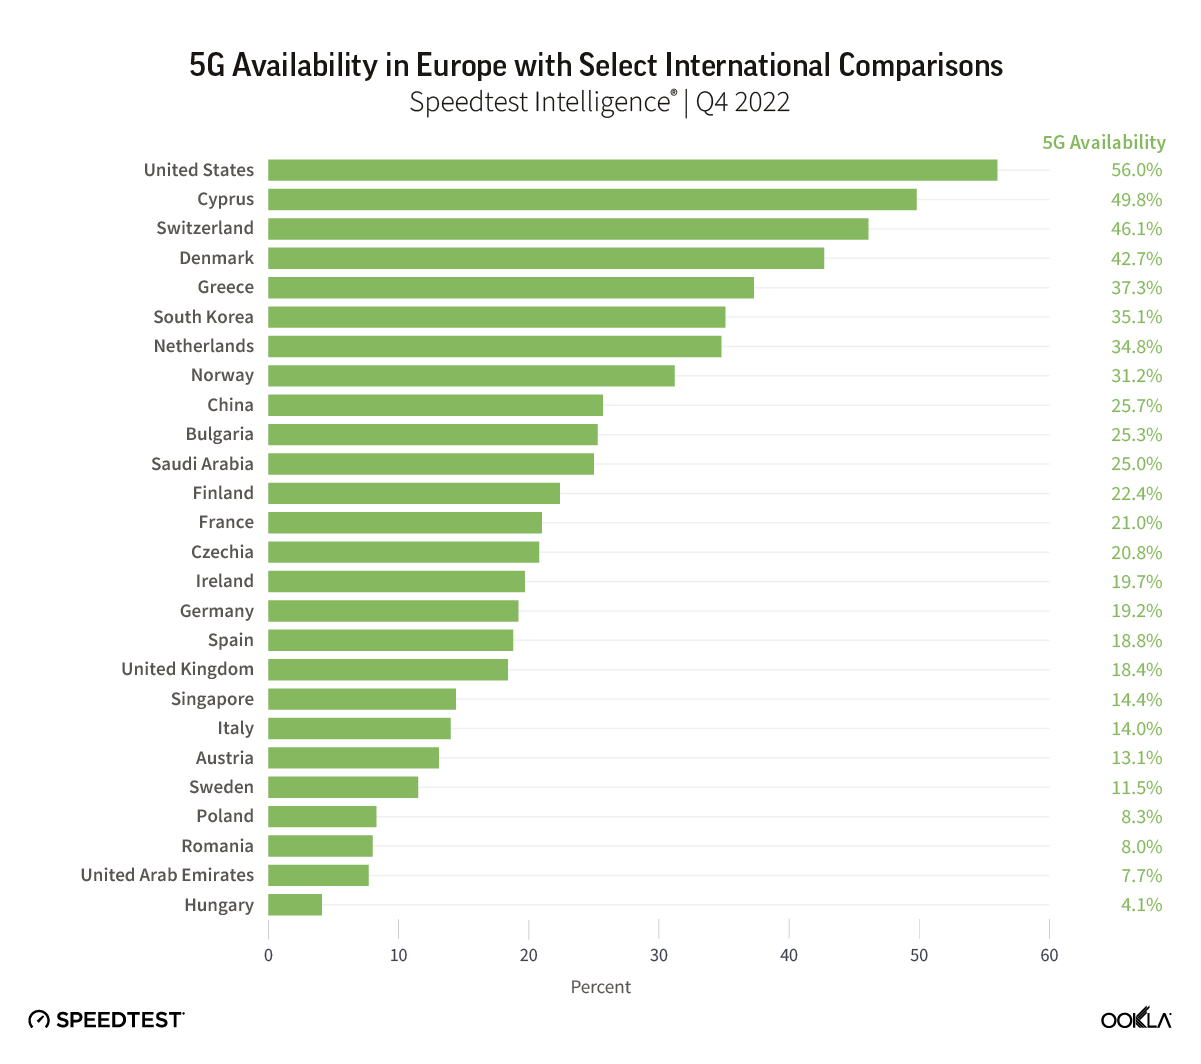
Given the growth in 5G adoption, not surprisingly, 5G Availability (the percentage of users on 5G-capable devices that spend most of the time with access to 5G networks) has been on the rise too. 5G Availability is a function of 5G network coverage, and 5G tariff and 5G-capable device adoption. At 56%, the U.S. continues to have the highest level of 5G Availability, having started 5G deployment in the 600 MHz (low band) range and with a large pool of customers owning 5G capable devices. The 600 MHz frequency band has further reach compared to 700 MHz and even the LTE mid-band. Within Europe, 5G Availability exceeds 40% in three countries: Cyprus, Switzerland, and Denmark, but the range is broad across those countries. Cyta Cyprus has reached 67.1% 5G Availability in Q4 2022, thanks to extending 5G coverage to 100% of Cypriots. Swisscom ranks highly too, with 61% Availability in Q4 2022. Its 2022 Annual Report notes that the operator covers 99% of the Swiss population with a basic version of 5G (using Dynamic Spectrum Sharing, which borrows capacity from its LTE spectrum) and 74% with 5G + (delivered using mid-band spectrum). 

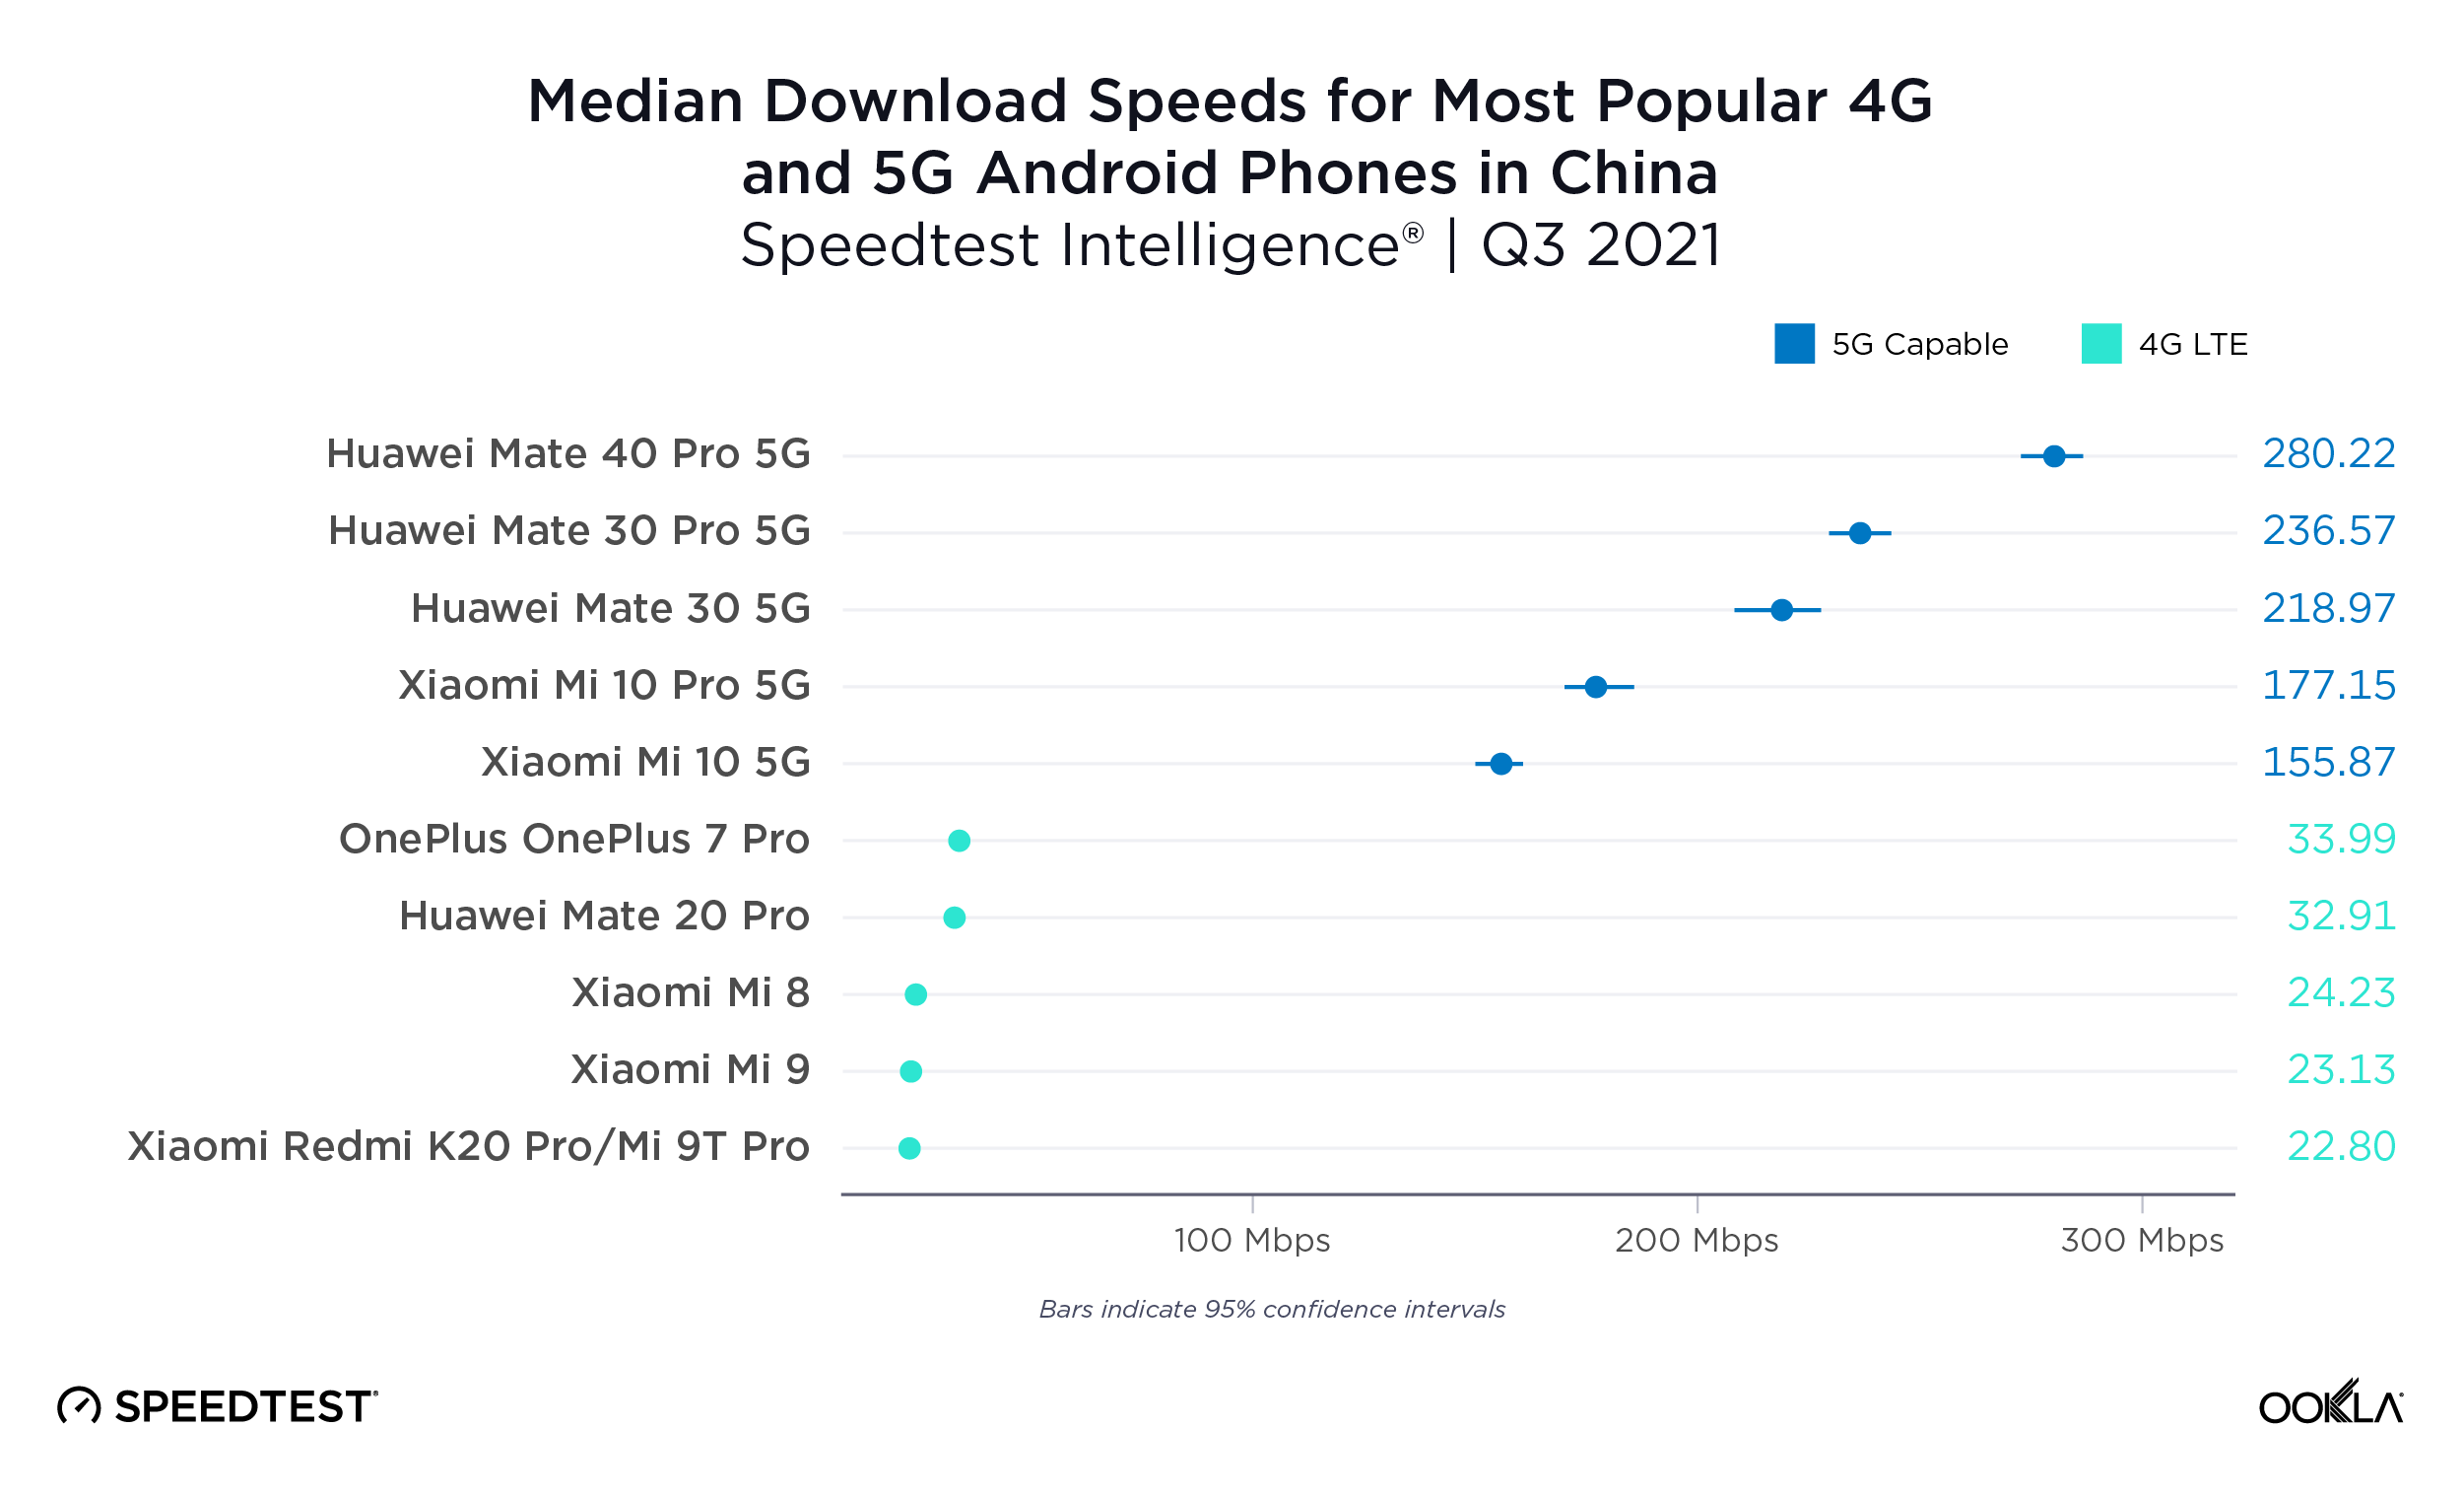
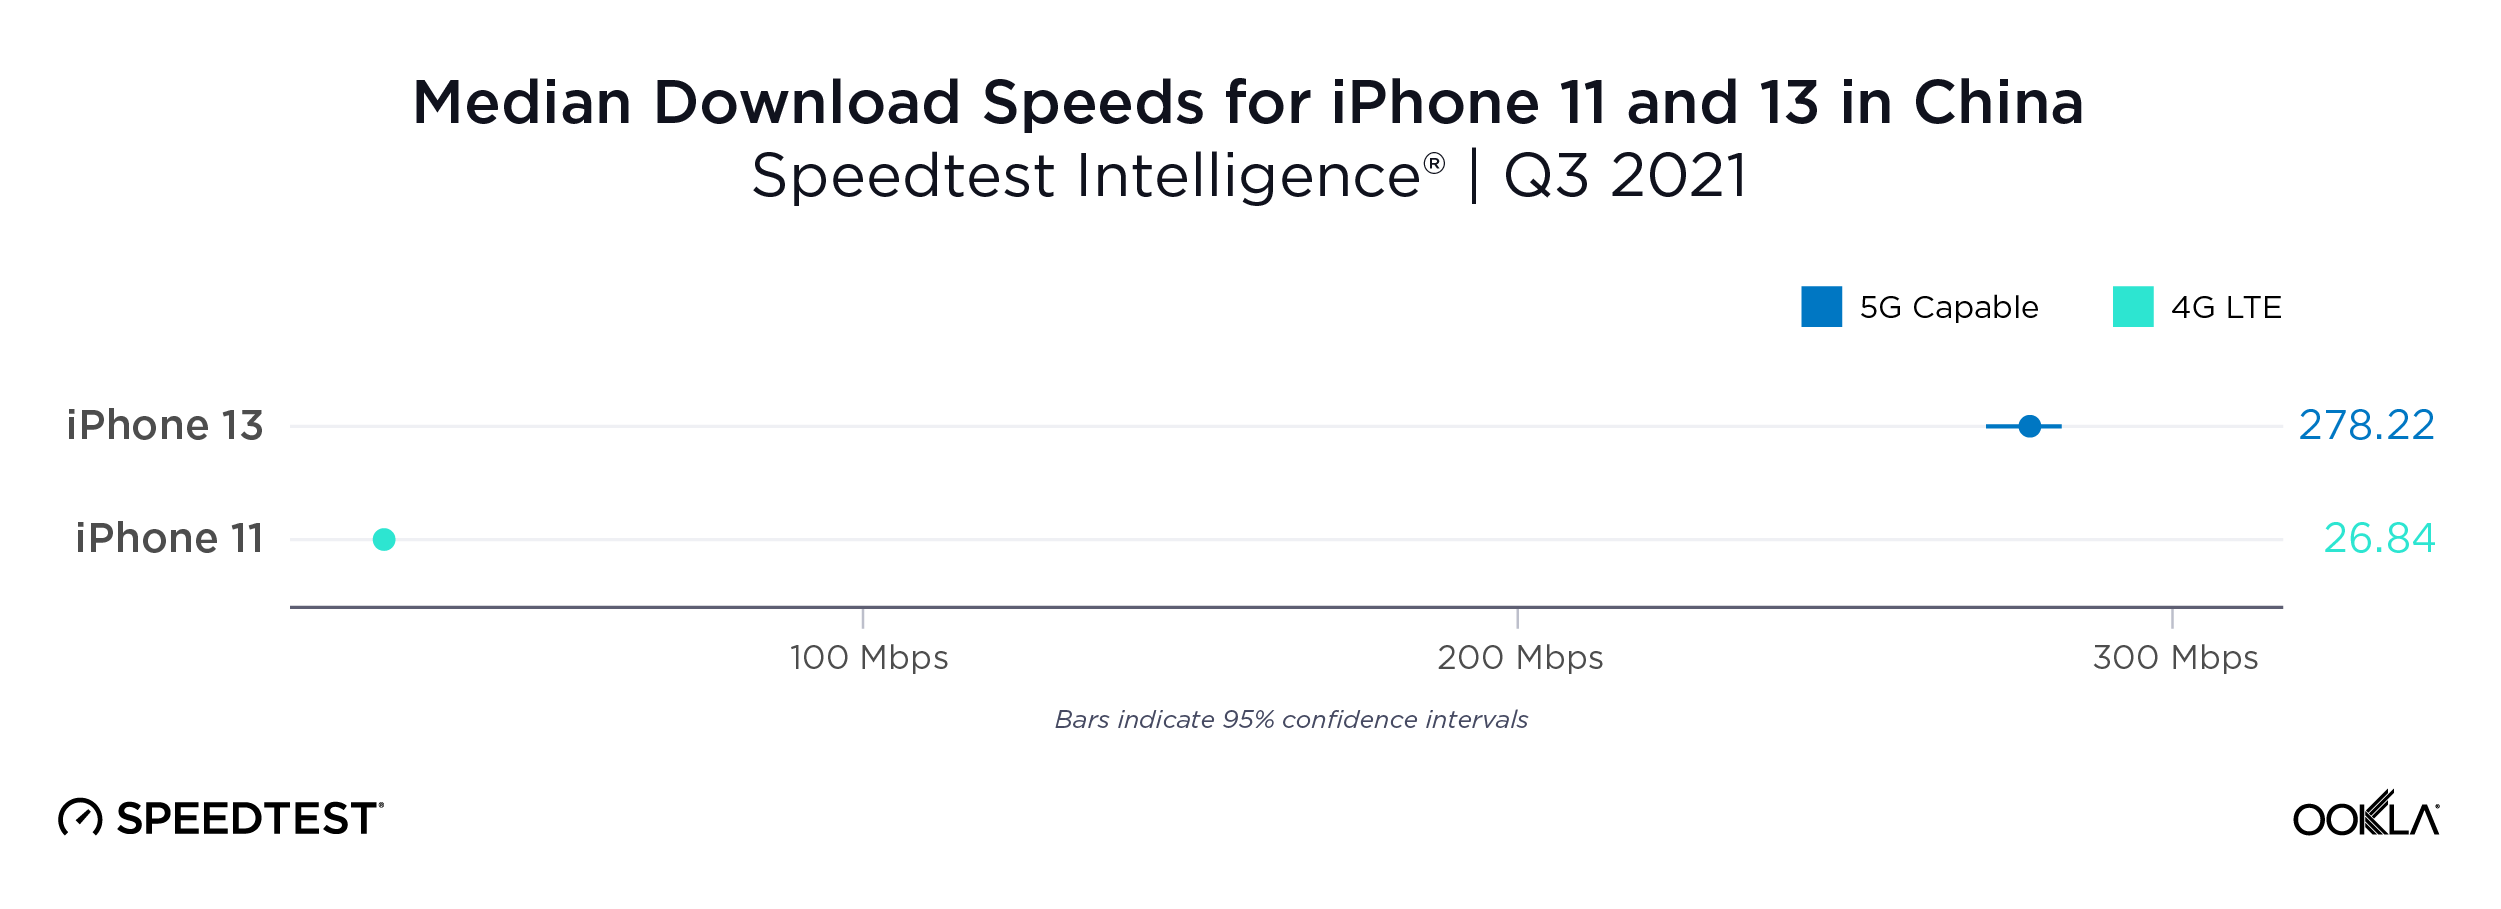
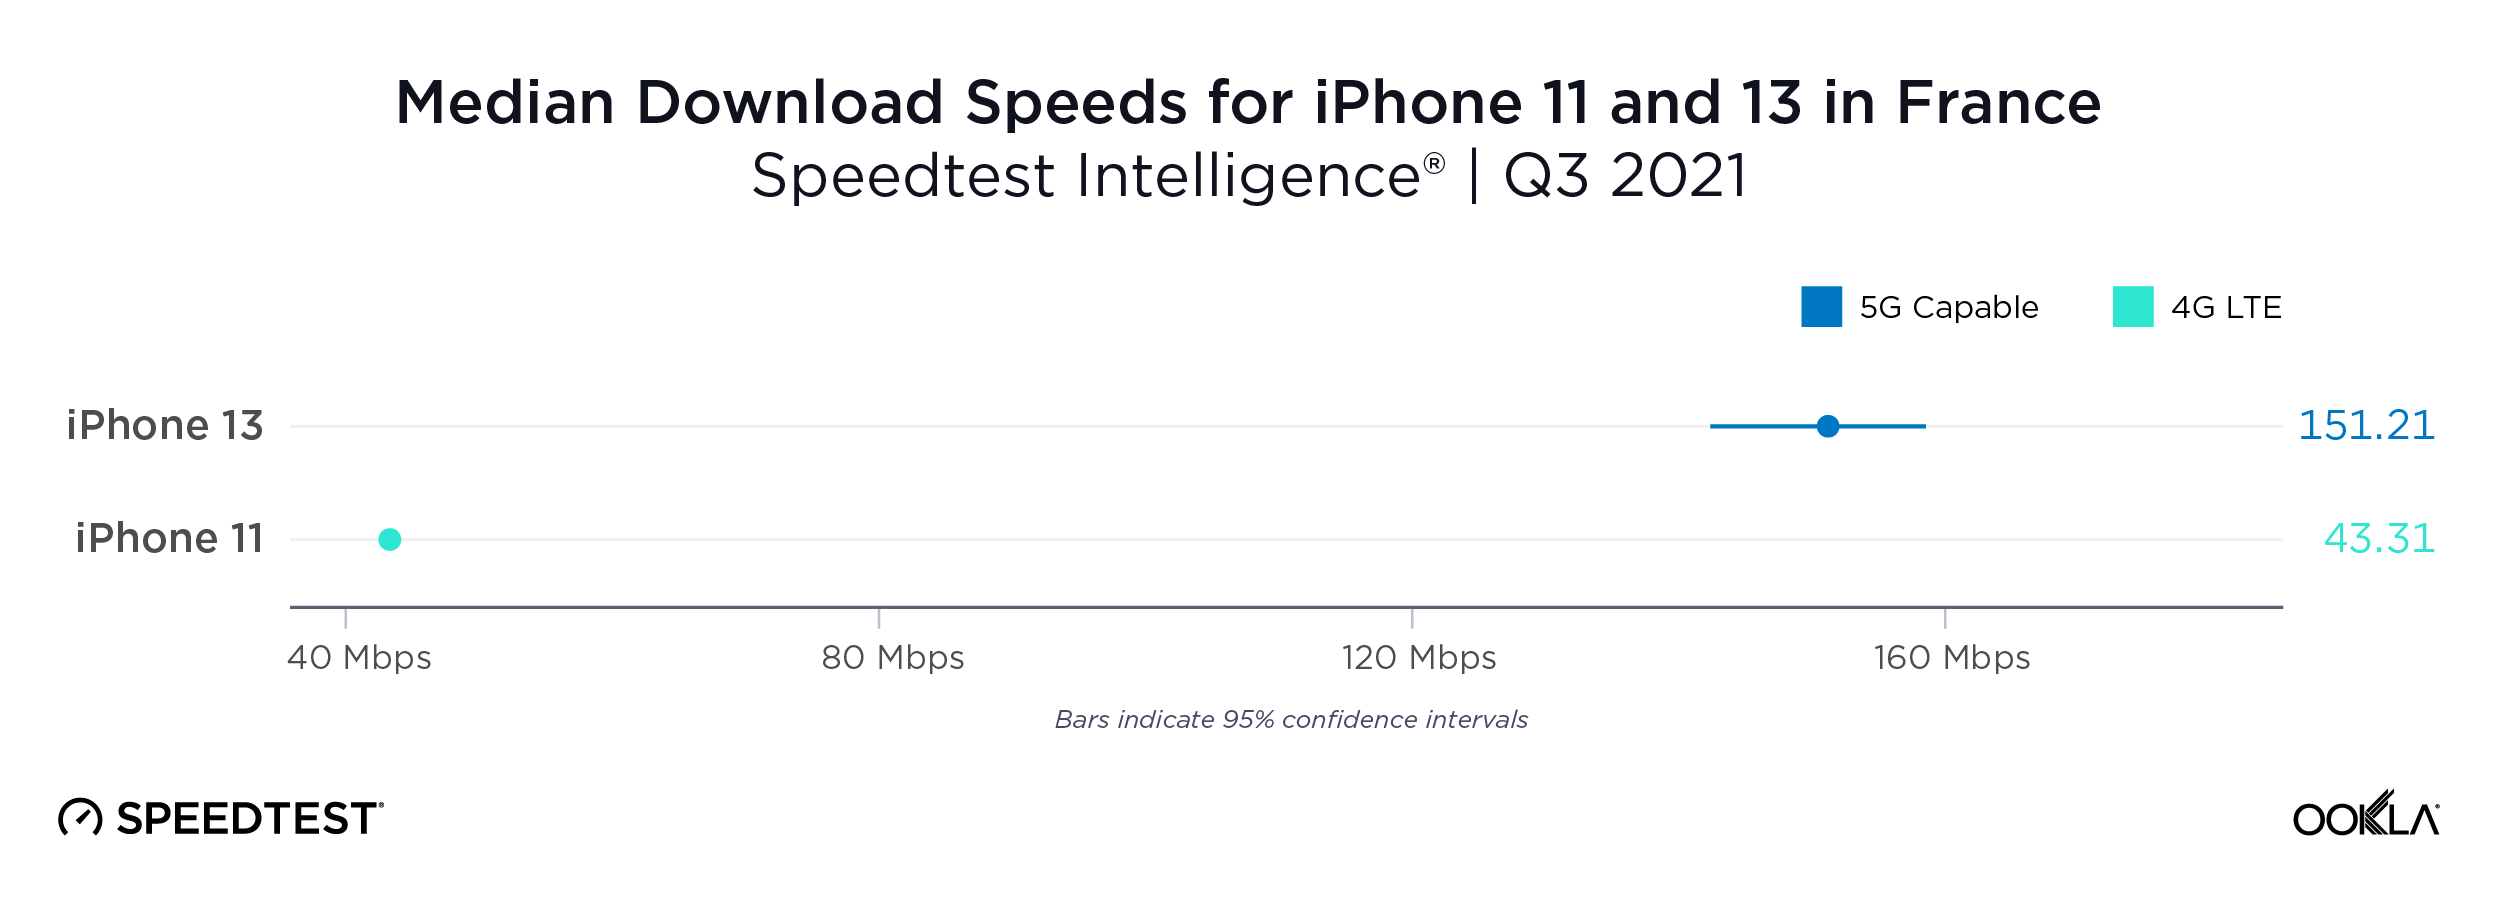
One critical component driving 5G Availability is the affordability and availability of 5G-capable smartphones. According to Counterpoint Research, in Q4 2022, 5G smartphone sales across Europe totaled 26.8 million, equivalent to 67% of total smartphone sales, compared to 84% in North America and 87% across China, Japan, and South Korea. Europe still needs to catch up to other advanced markets in smartphone adoption. Within Europe, there is also wide variation, with Germany at 90%, Sweden at 88%, the UK at 86%, and Eastern European markets at 49%. Over time, smartphone sales will translate into a more extensive installed base of 5G devices and share of overall subscriptions.charts of 5g sales across select eupropean markets and 5g smartphones as proportional of total smartphone sales

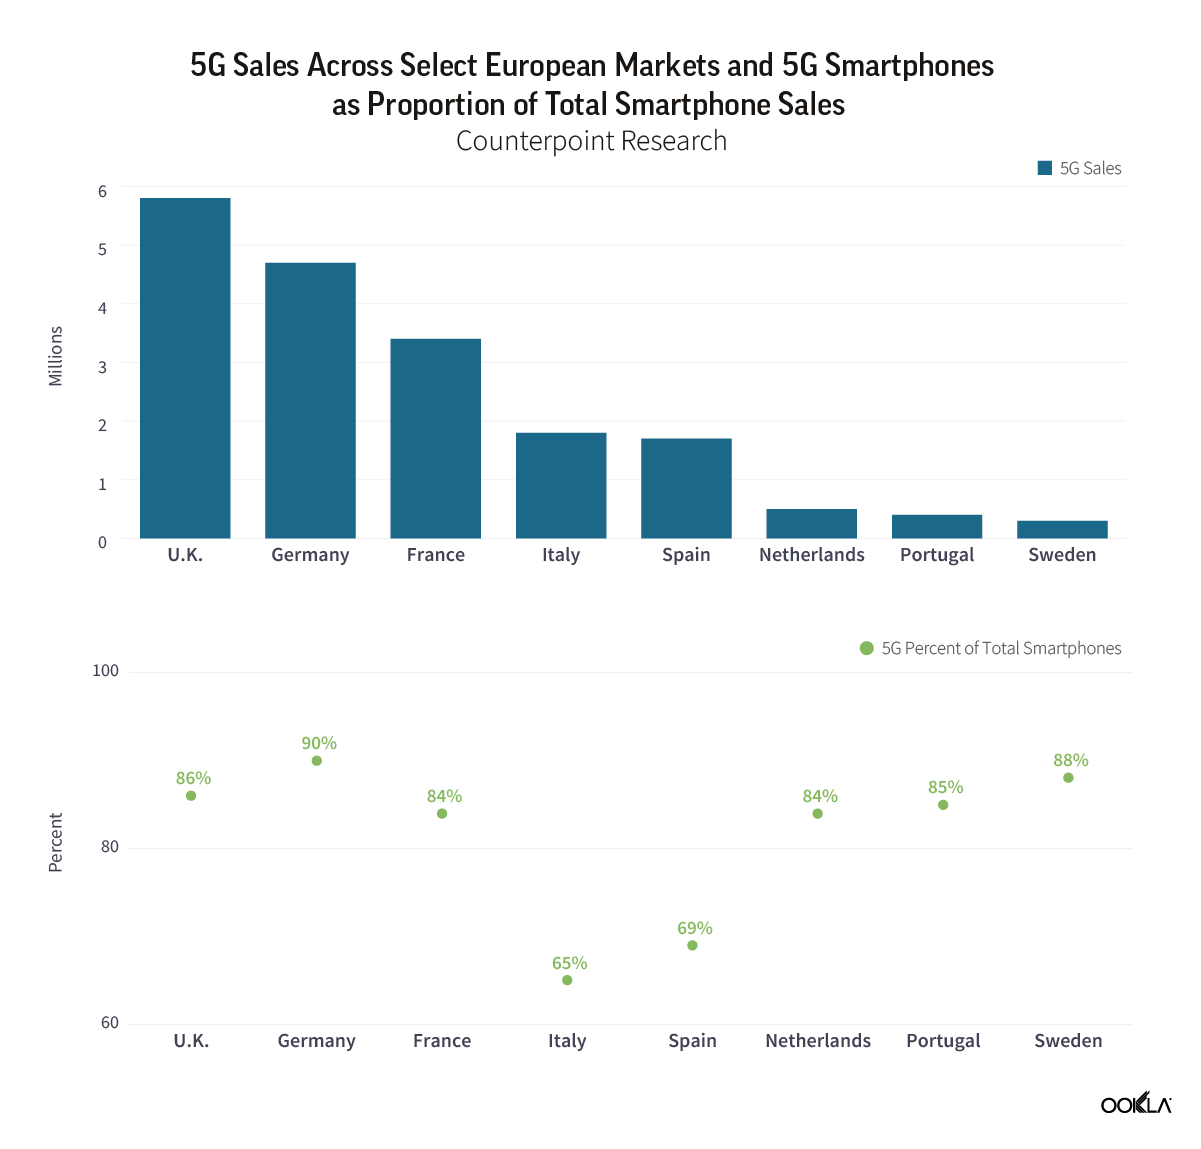
A glimmer of hope for 5G investments

As per the EU Commission’s 5G Action plan, operators should extend 5G networks to all urban areas and major roads and railways by 2025 and populated areas by 2030. For Europe to catch up with its peers and to achieve its digital ambitions, it needs more investment. Operators frequently call for a more supportive policy and regulatory ecosystem to stimulate Capex. During Ookla’s Southeast Europe Regulatory Summit, Professor Konstantinos Masselos, President of Hellenic Telecommunications and Post Commission and BEREC Chair 2023, recognized that Europe is still behind the rest of the world, there is a need to fill the gap for investments, and Europe needs to solve demand issues and cost-effectiveness while not forgetting sustainability.

According to Assembly Research, an issue that came to the fore during 2022 was ‘fair share’ – i.e. the idea that tech companies should contribute to telecoms network costs. Many large telcos believe that deploying Europe’s digital infrastructure should be more evenly distributed among those generating traffic (and costs). However, some smaller operators and access seekers, such as MVNOs, are concerned by the possible implications of fair share, arguing that it could create a competitive distortion that puts them at a disadvantage. In addition, an October 2022 report by BEREC found little evidence that large content and application providers should contribute towards the cost of building telecom networks, considering that this model could risk harming Europe’s internet ecosystem.

Nevertheless, the European Commission is considering potential changes to how networks are funded. Commissioner Thierry Breton is poised to launch the EC’s fair share consultation at MWC23, which will reportedly outline proposals on Big Tech’s contribution towards telecoms network costs. Whether the European telcos’ lobbying campaign will bear fruit, only time will tell. But this will also depend on how well telcos outline what ‘fair share’ should look like. In Assembly’s view, the next step is to develop a practical means of implementing fair share, one which telcos have yet to set out in detail. In response to the EC’s forthcoming consultation, the onus is on operators to present compelling, justifiable policy actions, including how contributions to network costs should be calculated and applied.

European regulators support enterprise digitization efforts 

Digitization of different sectors of the economy is key to supporting sustainable development and climate goals. However, enterprise requirements differ. Some prefer to retain control over their networks, isolating them from the public network. Private mobile networks play an important role in broader digital transformation and addressing Industry 4.0 objectives. According to GSA, there were 954 private networks globally, of which almost half were in Europe (405). In terms of the number of private networks, the U.S. ranked first internationally, Germany was second, and the U.K. came fourth, followed by Japan, Finland, France, and Sweden. All of these countries embarked on digitization strategies to strengthen their position as manufacturing hubs, and it is no coincidence that these are also the markets where enterprises can purchase dedicated spectrum.

chart of top 15 countries by number of private networks

Historically, Wi-Fi has been the connectivity choice for private networks. However, mobile technologies such as 4G LTE and 5G are better suited to Operational Technologies’ network requirements of high volume, high reliability, mobility, and always-on operations. In Europe, almost half of the private networks run on 4G LTE (44%), 21% use a mix of 4G and 5G, with 5G accounting for close to 30% of deployments. As we have noted before, the introduction of industrial chipsets, based on Release 16, scheduled to come to market in 2023, will stimulate the private 5G networks market too.

Furthermore, regulators are creating an encouraging environment for enterprises to deploy their own networks to support their digital transformation targets. A dedicated spectrum for private mobile networks has already been allocated to industry players in France, the U.S., Germany, Japan, and the U.K., among others. Recently, Norwegian regulator Nkom opened up a 3.8 – 4.2 GHz band for interested parties to apply for a license to offer private 5G networks. Germany spearheads the Industry 4.0 movement, with some of the country’s biggest industrial players awarded their own 5G spectrum and experimenting with private 5G networks to address their particular needs. Other countries that look to support their national manufacturers standing in the global marketplace look to follow, as we have discussed the case for private networks in India.

Ookla will be at MWC Barcelona 2023 — visit us at our Stand 2i28 in Hall 2 to talk with us about telco trends and to learn about Ekahau’s private 5G offering. If you are interested in what are the new and exciting use cases as we enter the 5G Advance era, join us at the 5G Futures Summit. In the meantime, please contact us if you’re interested in discovering more about Ookla Speedtest Intelligence and its wealth of fixed and mobile consumer-initiated data and insights.


Ookla retains ownership of this article including all of the intellectual property rights, data, content graphs and analysis. This article may not be quoted, reproduced, distributed or published for any commercial purpose without prior consent. Members of the press and others using the findings in this article for non-commercial purposes are welcome to publicly share and link to report information with attribution to Ookla.

| December 5, 2022

The United States — Ripe for Converged Networks

Key messages

  • Moves by mobile operators in the U.S. to offer fixed-wireless home broadband services are further blurring the lines between fixed and mobile networks. Cable operators in the U.S. are responding to this competitive challenge by driving the U.S. market further towards convergence, in the form of fixed-mobile bundling. This trend is driving greater competition in the market, lower prices, and more choice for consumers.
  • Speedtest Intelligence® data shows opportunities for cable companies and the big-three national operators to leverage positions of strength in one access technology to cross-sell to consumers and drive adoption of bundled services.
  • U.S. operators should look to European operators’ experiences with service bundling, where they have been shown to reduce churn and offer ARPU uplift opportunities, but require operators shift from a focus purely on price, to driving improvements in the consumer experience.
  • Fixed and mobile networks are already being used in tandem. For example in the U.K. BT includes a SIM within its Halo routers to offer redundancy to its fixed broadband customers. And already in the U.S. Comcast utilizes its XFINITY Wi-Fi hotspot network to provide high capacity coverage for its customers, allowing it to improve network performance in areas where 5G signal typically struggles to penetrate, while also offloading mobile traffic to its fixed network.
  • Looking to the future, we anticipate more strategic moves to drive improved consumer experiences as the convergence of fixed and mobile networks continues. The emerging set of Wireless Wireline Convergence (WWC) standards being developed by 3GPP and the BBF offer up some unique capabilities, but as ever, vendor and operator support will be key.

Blurring the lines between fixed and mobile networks

Fixed and mobile networks are becoming increasingly complementary, extending the reach of internet connectivity, performance, and reliability. Fixed networks support wireless devices through Wi-Fi offload in the home and via public and operator Wi-Fi access points, often in locations where cellular signals face propagation challenges. Additionally, wireless networks can provide cellular redundancy to fixed broadband services, often via a SIM added to the router.

Cable companies have offered mobile services for some time now via MVNO agreements, (Cox is set to be the latest example), and are able to utilize their Wi-Fi hotspot networks to offer greater coverage and capacity to subscribers. Ookla® data indicates that for markets such as the U.S. that have widespread fixed broadband penetration, mobile users spend approximately 75% of time on average connected to Wi-Fi networks, as opposed to wireless networks. This number ranged from a low of 67.5% for T-Mobile, to a high of 80.0% for cable operator Comcast’s XFINITY. This helped XFINITY and Spectrum rank as fastest overall mobile service across their respective service areas when considering 5G and Wi-Fi access combined.

On the flip side of the coin, the growth in fixed-wireless access (FWA), particularly via higher-speed 5G spectrum, offers an alternative to existing fixed networks. In the U.S., fixed wireless is already being used to cover locations that would  be too costly to lay fiber to reach, and is also being offered as a competitive alternative to existing fixed networks. Both Verizon and T-Mobile have championed this approach, and are seeing strong growth in their respective fixed-wireless customer bases, although fixed wireless still represents a small proportion of overall fixed broadband subscribers.

Fixed and wireless technologies also play an important role in today’s backhaul networks, with fiber instrumental in extending the reach and capacity of mobile networks, and microwave point-to-point wireless connections still common in many parts of the world for backhaul. Throw satellite connectivity into the mix via the growth of LEO constellations, and it’s clear that there’s no one-size-fits-all solution for providing universal connectivity — a blend of technologies is required.

Fixed-mobile bundling — initially focused on cost savings for consumers

The growth of fixed-mobile (convergent) bundles in the U.S. is occurring amidst a slowing of the global economy, with inflation running into double digits in many markets, pushing them towards a possible recession. This could well spur the adoption of fixed-mobile bundles in the U.S., paralleling the experience of many European markets during the last prolonged economic downturn which began in 2008. In this economic environment, a number of European operators introduced convergent bundles, offering them at an overall discount to the discrete underlying services. 

While not prevalent in all European markets, fixed-mobile bundles have taken hold in many key markets, championed by regional powerhouses including Telefonica and Orange. Orange even goes so far as to highlight convergence as the “bedrock of our strategy,” and has pursued M&A across Europe in order to combine fixed and mobile assets in order to pursue a convergent strategy. 

Initially, European operators pursuing convergent bundles saw a reduction in churn, as including more services within a bundle for multiple people in a household made these customers stickier. Over time, operators looked to drive increased ARPU by including additional services, particularly broadcast television and video streaming. For consumers, fixed-mobile bundles also offer managerial benefits, adding the convenience of a single bill for all telecoms services in a household and gives the account holder more control over telecoms expenditure as a result.

More recently, in European markets where fixed and mobile bundles have become commonplace, we’re seeing moves to expand the value offered to customers, to avoid ARPU erosion. For Movistar, this included a recent rebrand of its Fusion offering to MiMovistar, and a move to include services such as health, gaming, and security. The key lesson for U.S. telcos is to avoid a race to the bottom that will harm margins and ultimately investment. Instead, telcos should focus on extending the value delivered from fixed-mobile bundles. For cable companies with MVNO agreements driving Wi-Fi offload for their mobile customers can help improve performance. It also keeps wholesale costs down, allowing them to be more aggressive with their mobile pricing.

U.S. fixed-mobile service overlap — battle lines drawn

To estimate the current overlap in fixed and mobile subscriptions by provider and look at bundling opportunities within the U.S.,  we used Speedtest Intelligence data to show the share of Speedtest® samples for mobile devices conducted via wireless networks versus Wi-Fi. Cable operators Spectrum (Charter) and XFINITY (Comcast) show very high degrees of overlap, as explained by their sales model where mobile is not offered as a standalone service, but only as an add-on to their fixed broadband subscriptions services.

Overlap in fixed and wireless subscriptions (Q3 2022 | Speedtest® Data)
WIRELESS WIRELINE
AT&T
T-Mobile Verizon Spectrum XFINITY Other
AT&T Wireless 20.5% 0.1% 4.9% 21.7% 21.2% 31.6%
T-Mobile 11.2% 0.2% 7.8% 24.9% 26.1% 29.9%
Verizon Wireless 9.2% 0.1% 10.9% 23.1% 21.3% 35.3%
Spectrum 2.2% 0.1% 1.0% 85.7% 2.0% 9.1%
XFINITY 2.4% 0.1% 1.3% 2.1% 87.5% 6.7%

Three main takeaways emerge from the data:

  1. AT&T has a larger wireline footprint than Verizon, and this shows over 20% of its wireless customers also access AT&T’s fixed broadband service according to Ookla Speedtest data versus Verizon’s 10.9%. Both companies have opportunities to drive further mobile uptake among their fixed user bases.
  2. T-Mobile has a greenfield opportunity for fixed wireless, where strong 5G network performance should help it capitalize on both mobile and fixed net additions.
  3. Sizeable proportions of the big three’s mobile user base (in excess of 40%) accessing fixed Wi-Fi via either Charter or Comcast, represent a significant opportunity for the cable companies to expand their mobile user bases.

Beyond fixed-mobile bundling — driving experiential improvements to network service

The advent of 5G, alongside the COVID-19 pandemic, has helped drive growth in the use of data intensive services including video calling, video streaming, and mobile gaming. As these services continue to grow in popularity, and as consumers begin to demand more immersive extended reality (XR) experiences that push the boundaries of today’s networks, so operators will need to improve the performance of both fixed and mobile networks, while also looking to opportunities for network convergence to support enhanced service experiences and reduced operational costs.

High-throughput 5G service utilizes higher frequency spectrum bands than has been used for previous generations of mobile technology. These spectrum bands have lower propagation properties, particularly in-building, mandating that operators further densify their networks to offer consistent performance. Operator Wi-Fi hotspot networks can offer an alternative to this, providing a secure fixed network connection in locations where 5G signals can often degrade. In the U.S., cable companies have also begun to offer differentiated network speeds to their mobile subscribers when connected to their Wi-Fi networks, provisioning faster network speeds to capable smartphones.

Standards bodies have also identified a need to help drive fixed-mobile convergence. The development of Wireless Wireline Convergence (WWC) standards by 3GPP and the Broadband Forum (BBF) seeks to allow operators to converge existing fixed and mobile technology stacks using a common 5G core network. In doing so, operators will move to a single control plane for fixed and mobile sessions, enabling them to offer customers seamless connectivity via fixed and mobile access while also allowing them to aggregate the performance of both access networks to help drive enhanced performance and reliability. In doing so, this will allow operators to streamline the set of network functions and processes required to operate their networks, while also allowing them to simplify their Operational and Business Support Systems (OSS and BSS).

Leading operators such as Deutsche Telekom and BT are actively moving in this direction, with Deutsche Telekom in September conducting a proof of concept lab trial of WWC standards to steer traffic from a 5G residential gateway and route traffic along the entire wireline access chain to the core network. According to Ahmed Hafez, VP of network convergence at Deutsche Telekom, “convergence will allow us to optimize our network assets and deliver new, differentiated service experiences to our customers regardless of the access used.” BT has also signaled its intent to move to a single transport and core network serving both fixed and mobile services as it looks to accelerate the convergence of its mobile and fixed services in the U.K. under a single brand, EE.

While it’s clear that pioneers in the industry are looking to push the envelope on fixed-mobile convergence, there’s still a long way to go. We look forward to more operator trials of WWC standards, but ultimately it will also require the vendor ecosystem to integrate these standards in their product roadmaps to help spur adoption. If you’re interested to find out more about Ookla Speedtest Intelligence, and its wealth of fixed and mobile consumer initiated data and insights, please get in touch.

Ookla retains ownership of this article including all of the intellectual property rights, data, content graphs and analysis. This article may not be quoted, reproduced, distributed or published for any commercial purpose without prior consent. Members of the press and others using the findings in this article for non-commercial purposes are welcome to publicly share and link to report information with attribution to Ookla.

| December 18, 2019

A Global Look at Mobile Modem Market Share and Device Performance

Analysts discuss the latest devices all the time, but rarely is enough attention paid to the phone’s real powerhouse — the modem. We were interested to see how market share for modem manufacturers divides up on a global level, so we investigated device data from Speedtest IntelligenceTM during Q3 2019. We also looked at how popular phones performed in different markets, including a look at 5G phones in 5G countries.

Global modem market share

Ookla_Global-Modem-Market-Share_1219-2

Speedtest data showed Qualcomm was the most common modem manufacturer in 133 countries during Q3 2019 — the highest market share was in Hong Kong with 73.6% of the devices analyzed showing Qualcomm modems. Qualcomm’s slimmest majority was in Botswana with 25.6% of devices analyzed showing Qualcomm modems.

This is not surprising as Qualcomm chipsets power many flagship devices sold around the world. In the U.S., virtually all Android OEMs use Qualcomm-powered chipsets. The latest Qualcomm Snapdragon 855+ mobile platform with Snapdragon X24 integrated LTE modem (up to 2Gbps) powers popular devices from Samsung, LG and OnePlus. It’s worth noting that Qualcomm has multi-year licensing deals with multiple OEMs based in China, namely Vivo, OPPO, Lenovo, Xiaomi and OnePlus, providing their complete modem-to-antenna solutions for optimal RF performance. This includes valuable RF Front End (RFFE) components such as power amplifiers, envelope trackers, RF switches, filters and antenna tuners.

These OEMs also have access to Qualcomm’s first and second generation 5G modems. As of right now, Qualcomm is also the only chipset manufacturer providing modem-to-antenna solutions for 5G millimeter wave (mmWave) deployments, providing all-in-one mmWave antenna modules that contain radio transceiver, RFFE and phased array antenna.

Intel was the most common modem manufacturer in 32 counties during Q3 2019. The highest percentage of devices with Intel modems was seen in Greenland at 55.6%. Intel’s slimmest majority was in South Africa with 28.6% of devices analyzed showing Intel modems. Intel’s main customer in the smartphone space is Apple. Starting in 2016, Apple began powering some iPhone devices with Intel’s flagship LTE chipsets, and since 2018, all iPhones have Intel’s cellular chipsets.

Samsung was the most common modem manufacturer in 16 countries during Q3 2019. South Korea had the highest percentage of devices with Samsung modems at 53.8%. Samsung’s slimmest majority was in Mozambique with 29.1% of devices analyzed powered by Samsung modems. Samsung’s Exynos LTE modem is seen in variants of Samsung’s Galaxy S and Note devices. Except in the Americas and China, most of Samsung’s flagship S10 and Note 10 devices around the world are powered by Samsung’s own Exynos 982x SoC (system on a chip), with an integrated LTE Category 20 modem capable of download speeds of up to 2 Gbps.

Speedtest data showed HiSilicon as the most common modem manufacturer in two countries during Q3 2019. In Costa Rica, 32.4% of devices analyzed showed HiSilicon modems, and in Namibia that number was 27.6%. HiSilicon is a semiconductor company based in Shenzhen and fully owned by Huawei. Huawei integrates its own flagship modem into its flagship P and Mate series devices. These devices have a large user base in Europe, the Middle East and Asia.

Device performance is affected by market factors

A phone’s performance is always going to depend on the conditions within its specific market. Factors affecting network performance can include: geography, cell site and population density, the amount of wireless spectrum deployed and the overall capabilities of user equipment seeded to market. Multiple factors can impact the performance of a device, including: varying degrees of RF transparency in the materials used for device chassis, variations in RF front-end and antenna design complexity and whether the baseband processor is more or less capable of handling network tasks. We used Speedtest data to analyze how three popular phones — the Apple iPhone Xs, the Huawei Mate 20 Pro and the Samsung Galaxy S10 — performed in specific markets around the world during Q3 2019. We excluded data from devices with fewer than 100 samples in a market during the period.

Mean-DL-Speeds-on-Flagship-Phones

The Samsung Galaxy S10 was the fastest of these three devices in all but five markets during Q3 2019. However, the mean download speed on the Galaxy S10 varied between 18.06 Mbps in India and 95.91 Mbps in Canada. The Huawei Mate 20 Pro showed the fastest mean download speed of these three devices in France and the U.K. during Q3 2019 and often placed second in the remaining markets on the list. Mean download speed on the Mate 20 Pro during Q3 2019 ranged from 14.57 Mbps in India to 93.66 Mbps in Canada.

Apple’s iPhone Xs was at a slight disadvantage in this comparison, as it came out in 2018 where the other devices debuted in 2019. Because the iPhone 11 was not fully seeded to markets in Q3 2019, we considered its predecessor, the iPhone Xs, in this analysis. The iPhone Xs showed the fastest mean download speed in Germany, Japan and Nigeria during Q3 2019. Mean download speeds on the iPhone Xs varied from 15.92 Mbps in India to 71.72 Mbps in Canada.

Device performance in 5G markets

5G currently offers the pinnacle of mobile performance. We looked at 5G-capable devices in markets where 5G exists to see how download speeds compare. These results include Speedtest results on all technologies, not just 5G, which means averages also reflect consumers using 5G phones with a 4G connection.

Mean-DL-Speeds-on-5G-Phones

Both the Samsung Galaxy S10 5G and the Huawei Mate 20 X 5G showed mean download speeds in excess of 200 Mbps in some markets during Q3 2019. However, there’s clearly some difference in which devices are supported by which operators, as not all operators in 5G markets are offering 5G equally (if at all). Related, the Samsung Galaxy S10 5G models sold in the U.S. and China are powered by Qualcomm’s first-generation Snapdragon X50 5G modem, while other 5G markets receive the variant powered by Samsung’s in-house Exynos 5100 5G modem.

Mobile operators continue to incentivize consumers to upgrade to newer and more capable devices to ensure a more efficient use of spectrum assets for network operators. This leads to an improved utilization of shared resources, faster overall speeds and better quality of experience.

We’re looking forward to updating these analyses as more markets adopt 5G and as newer and even faster phones are released. For more information about how our device data can help you, contact us.

Ookla retains ownership of this article including all of the intellectual property rights, data, content graphs and analysis. This article may not be quoted, reproduced, distributed or published for any commercial purpose without prior consent. Members of the press and others using the findings in this article for non-commercial purposes are welcome to publicly share and link to report information with attribution to Ookla.