
| September 22, 2021

The Infrastructure Investment and Jobs Act Could Improve Internet Access for Those Who Need it Most


Investment in broadband infrastructure in the United States is long overdue. The past two years have revealed how critical the internet is to daily life for everyone, and yet far too many people don’t have adequate speeds and service, even in wealthier areas like Loudoun County, Virginia, near Washington, D.C. The bipartisan omnibus infrastructure bill is a once-in-a-generation opportunity to address the digital inequities plaguing our country by connecting millions of Americans with critical services that many of us take for granted.

Ookla strongly supports the passage of the Infrastructure Investment and Jobs Act. As we all look on to see if this bill will successfully pass the United States House of Representatives, we’ve taken a close look at what the bill could mean for internet connectivity in the U.S. and why this bill is essential to bridging the digital divide.

17% of counties do not have access to “adequate” internet speeds

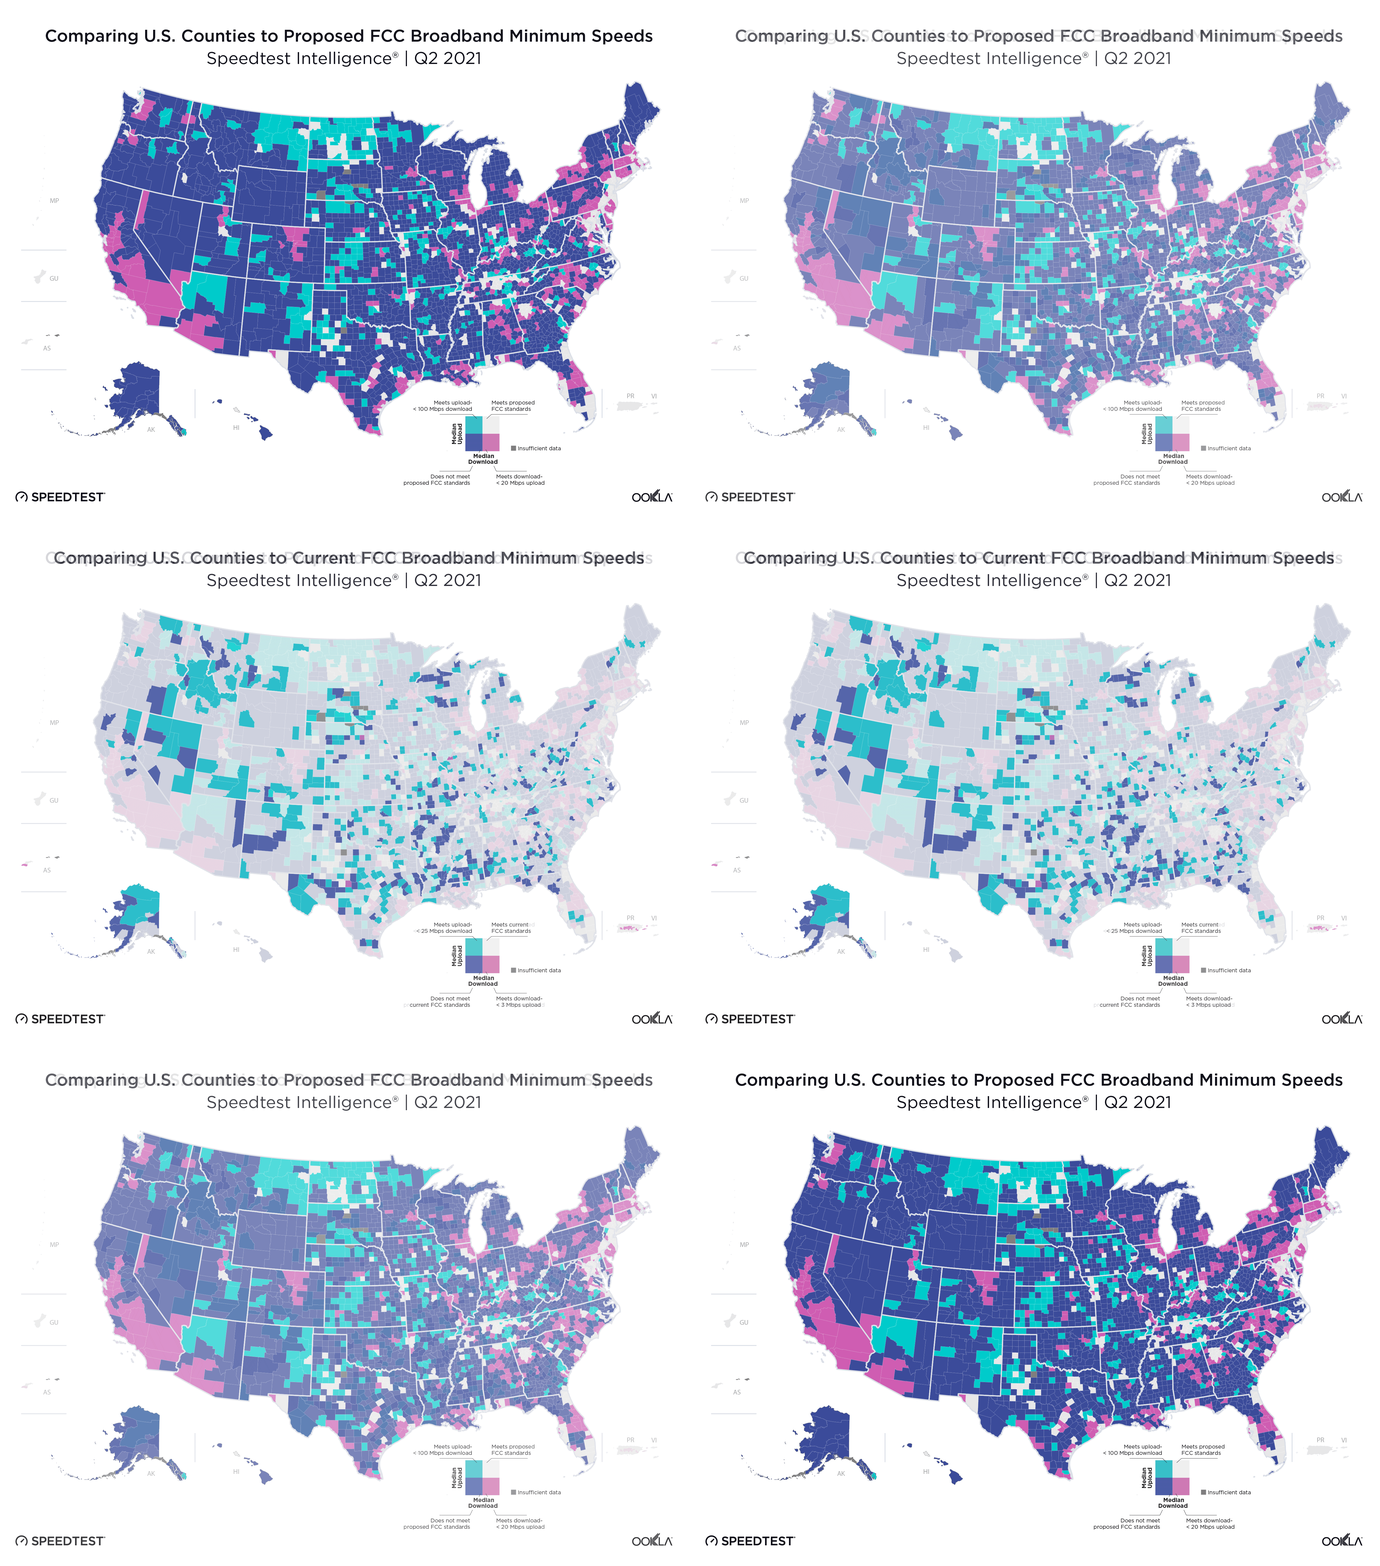
Data from Speedtest Intelligence® shows that 17% of counties with sufficient samples didn’t meet the minimum median speeds for the current FCC definition of broadband (25 Mbps download / 3 Mbps upload) in Q2 2021.

Worse, if you’ve ever tried to have a video call while someone was doing anything else online, you know that a download speed of 25 Mbps will likely result in massive lags for at least one of those users, if you can stay connected at all. That’s why the Senate bill will incentivize network expansion funding for networks offering speeds of 100 Mbps download and 20 Mbps upload or more. While these speeds are a far better benchmark for our modern and evolving lives, 92% of counties with sufficient samples did not meet this new proposed threshold in Q2 2021.
ookla_fcc_minimum_speeds_Counties_0921

The maps above show which counties do meet the current and proposed FCC minimums. While more than 80% of U.S. counties met the FCC’s current broadband minimum in Q2 2021, the counties that don’t are in the places that are already deeply economically disadvantaged — rural areas including Appalachia and the deep South.

The map for proposed speeds shows the less than 10% of counties that met the proposed 100 Mbps download / 20 Mbps upload speed in Q2 2021 were largely in urban areas. We saw other urban counties with high download speeds and some Midwest counties with high upload speeds stand out as having met half the requirement, but those places will need more investment to reach the proposed standard.

Of course, determining where best to direct broadband investment requires a much more granular approach, but examining data aggregated by county is a great way to compare connectivity across the entire country. Some counties shown as having adequate service will have pockets needing investment. For the purpose of this high-level view, should an entire county average throughput speeds below federal broadband definitions, it is assuredly in need of assistance.

What the Infrastructure Investment and Jobs Act does for broadband infrastructure and working to end digital disparity

Our careful review of the Infrastructure Investment and Jobs Act shows the provisions that could specifically put the U.S. on the path to being a global leader in internet connectivity:

  • Increase deployment. The bill currently allocates $42.45 billion for deploying improved internet infrastructure. Each state will receive a minimum of $100 million and U.S. territories split another $100 million. Up to 5% of funds may be used for planning and mapping. This would allow state and local governments to look closely at what areas are unserved or underserved by broadband in their jurisdictions and actually build the infrastructure to connect them.
  • Expand the Emergency Broadband Benefit (EBB). This program, originally funded at $6 billion, currently provides subsidies to low-income households to directly pay for broadband. The bill would devote $14.2 billion to funding $30/month subsidies for those who qualify. The program would be renamed the “Affordable Connectivity Program” and increases in funding would be allowed over time. This would continue to connect some of the most economically vulnerable families to the internet.
  • Fund the Digital Equity Grant Act. $2.75 billion is included to pay for the "State Digital Equity Capacity Grant" and the "Digital Equity Competitive Grant" programs which finance state and nonprofit programs to increase connectivity and improve digital equity.
  • Redefine broadband levels. The bill would formally recategorize “Unserved” locations as those having access to internet slower than 25 Mbps download / 3 Mbps upload. Locations where 80% of people or more lack access to 100 Mbps download / 20 Mbps upload would be labeled “Underserved.” This is critical in acknowledging the level at which most people in the U.S. need access to the internet today.
  • Increase funding to the Tribal Broadband Connectivity Fund. An additional $2 billion would go to building broadband infrastructure to and across tribal lands.
  • Increase funding to the Rural Utilities Service. This program to serve rural communities would receive an additional $2 billion for the Distance Learning, Telemedicine and Broadband Program.
  • Subsidize the Middle Mile Infrastructure Deployment Plan. The bill provides $1 billion for this vital infrastructure that connects individual internet users with the backbone of the internet. At a cost of tens of thousands of dollars per mile, this may not go far enough, but it is a start.
  • Finance Private Activity Bonds. $600 million is written into the bill to back private financing of broadband efforts.
  • Expand the definition of “anchor institutions.” Places like schools, libraries and healthcare facilities have long been considered locations people could go to in order to access broadband when they don’t have access at home. This bill expands that list to include: public safety entities, institution of higher education, public housing and community support organizations. This expanded list of anchor institutions increases the number of places community members can access broadband and the institutions are eligible for funding to provide that broadband.

Failing to invest in broadband infrastructure is failing the future of the U.S. economy

The COVID-19 pandemic revealed how critical adequate internet access is in a modern society as everything from routine medical visits to everyday education and millions of jobs went online. Some of that may shift back to in-person, but we can not and should not forget the disparities in internet access that were revealed during this time. The U.S. often holds itself out as an example for the world and the past year and a half have shown woeful cracks in broadband equity.

If the U.S. House of Representatives fails to pass this bill, they are abandoning millions of Americans to a future of falling behind. Poorly connected towns will fail because businesses that need broadband will go elsewhere. Poorly connected students will fall farther behind their classmates that have quality internet. Poorly connected workers will miss out on high-paying jobs. And poorly connected patients will put additional strain on our healthcare system without telehealth access. From connecting with teachers and co-workers in a video chat to streaming entertainment, access to adequate broadband makes participation in modern life possible.

The U.S. Congress must pass this bill. Whether you believe it is a moral imperative to address the digital inequities in our country as well as throw a lifeline to rural communities, or you simply view this as a strategic opportunity to maintain our position as a global leader, the time to act is now.

Ookla retains ownership of this article including all of the intellectual property rights, data, content graphs and analysis. This article may not be quoted, reproduced, distributed or published for any commercial purpose without prior consent. Members of the press and others using the findings in this article for non-commercial purposes are welcome to publicly share and link to report information with attribution to Ookla.

| December 3, 2020

Prioritizing Broadband Funding to Close the Digital Divide [Webinar]

Improving broadband access is a priority for legislators and policy makers, and the shift to working and learning from home has highlighted the deep digital divide across the United States — particularly in rural areas. Congress will likely allocate more dollars to ensure that every citizen has high-speed internet access in the coming year. Federal, state and local governments need accurate data on broadband availability and network performance in order to prioritize broadband development in underserved areas. With this information, government officials can ensure that they are maximizing their dollars and serving their constituents appropriately.

The upcoming Ookla® webinar on December 16 will share how network data from Ookla Speedtest® can give you deep insights into broadband availability and performance within your jurisdiction — and help you fund development efforts in the communities that need it most. Read on to learn more about prioritizing broadband funding.


Accurately determine where constituents can (or cannot) access adequate broadband

Policymakers have historically had to rely on fixed broadband deployment data from the FCC’s Form 477 to try to understand broadband access within their jurisdictions. This data is generally at least a year old by the time it reaches the hands of a policymaker — and in 2020, the government has delayed the latest update. It is crucial to look at the most robust, comprehensive and up-to-date data available on the networks to get a clear picture of broadband speeds and understand which communities aren’t being adequately served. Millions of users in the U.S. rely on Speedtest to test the performance of their networks — and the resulting data paints an accurate picture of where users can and cannot connect with internet that meets the FCC minimum thresholds of 25 Mbps download speed and 3 Mbps upload speed.

Use crowdsourced data on network speeds and availability to prioritize broadband funding

The webinar will show how Speedtest datasets can be filtered and analyzed to determine specific locations where constituents can’t access the speeds they need for remote learning and working from home. We will discuss why precise geolocation of network speed results is critical to understanding which communities need better broadband access — and how looking at ZIP codes alone may lead to underserved communities within those very ZIP codes.

Speedtest data can help policymakers eliminate costly data collection and analysis for areas that already have adequate service by pinpointing where internet service providers (ISPs) are actually delivering services that meet or exceed the current definition of broadband. Resources can instead be allocated to areas that show a clear need for broadband infrastructure investment.

The webinar on Wednesday, December 16 at 9 a.m. Pacific (12 p.m. Eastern) will show you how to analyze, filter and understand data from Speedtest to make informed spending decisions. Don’t miss it. A recording will be provided for registrants who can’t tune in to the live presentation. Register now.

Ookla retains ownership of this article including all of the intellectual property rights, data, content graphs and analysis. This article may not be quoted, reproduced, distributed or published for any commercial purpose without prior consent. Members of the press and others using the findings in this article for non-commercial purposes are welcome to publicly share and link to report information with attribution to Ookla.

| December 10, 2020

Massive Expansions and Huge Improvements in Speed: The Worldwide Growth of 5G in 2020

The rapid expansion of 5G in countries across the globe was a bright spot in a year that needed one. But just how great is the news? We examined Speedtest Intelligence® data from over 60.5 million Speedtest® results during Q3 2020 to see how much speeds have improved, where download speeds are the fastest at the country and capital level, where 5G deployments have increased and what worldwide 5G coverage looks like now. We also looked at countries where 5G doesn’t yet reach to understand where good news might be on the horizon.

We have only included countries with commercially available 5G on these lists in order to provide a more accurate view of the performance consumers can reasonably expect. While our data shows results for many countries where 5G is not yet commercially available, these tests are likely results from engineers testing their own networks. In addition, we’re only providing analysis for countries with more than 200 samples during Q3 2020. The bars shown in our charts are 95% confidence intervals, which represent the range of values in which the true value is likely to be. Countries marked in tables with an asterisk first launched 5G commercially in 2020.

5G downloads were 954% faster than 4G at the global level

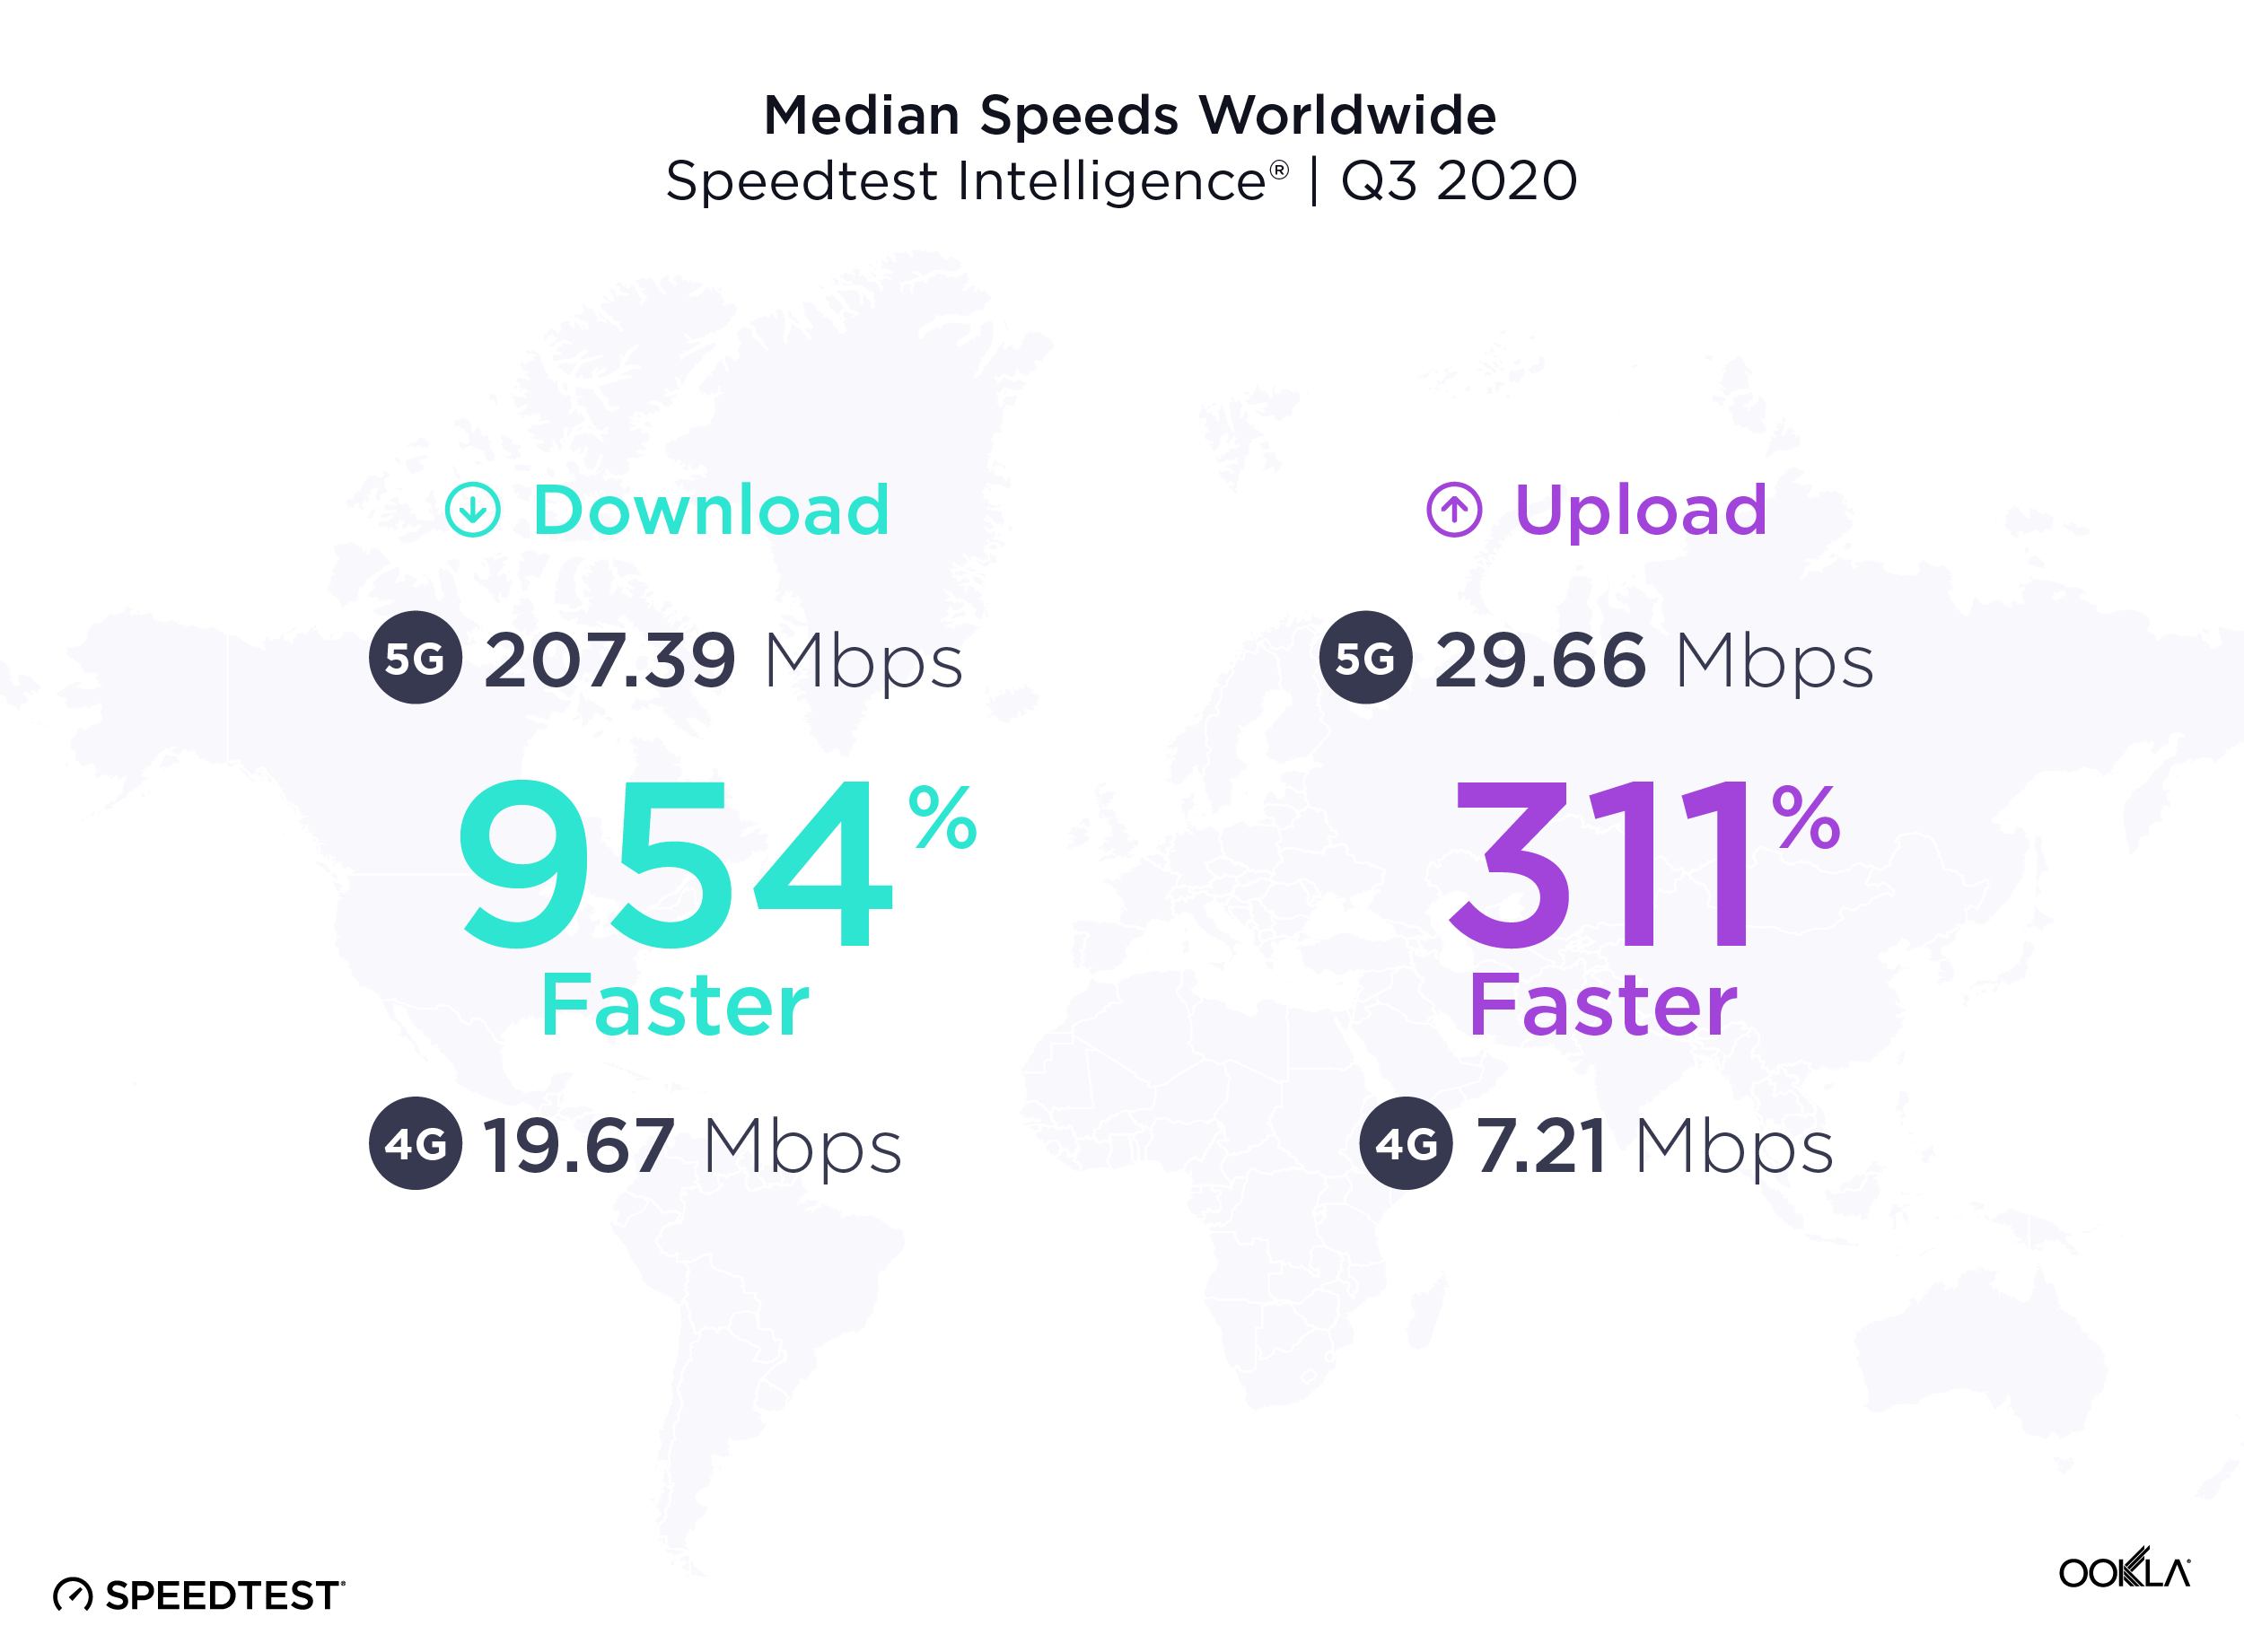
The worldwide median download speed over 5G was 954% faster than that over 4G during Q3 2020. Median upload speed over 5G was 311% faster than that over 4G. Consumers are eagerly adopting the new technology and many have wanted to measure the full throughput capacity of their network connection. In Q3 2020 alone, there were 4,324,788 Speedtest results over 5G.
Median-Speeds-Worldwide_1220-1

United Arab Emirates had the fastest 5G

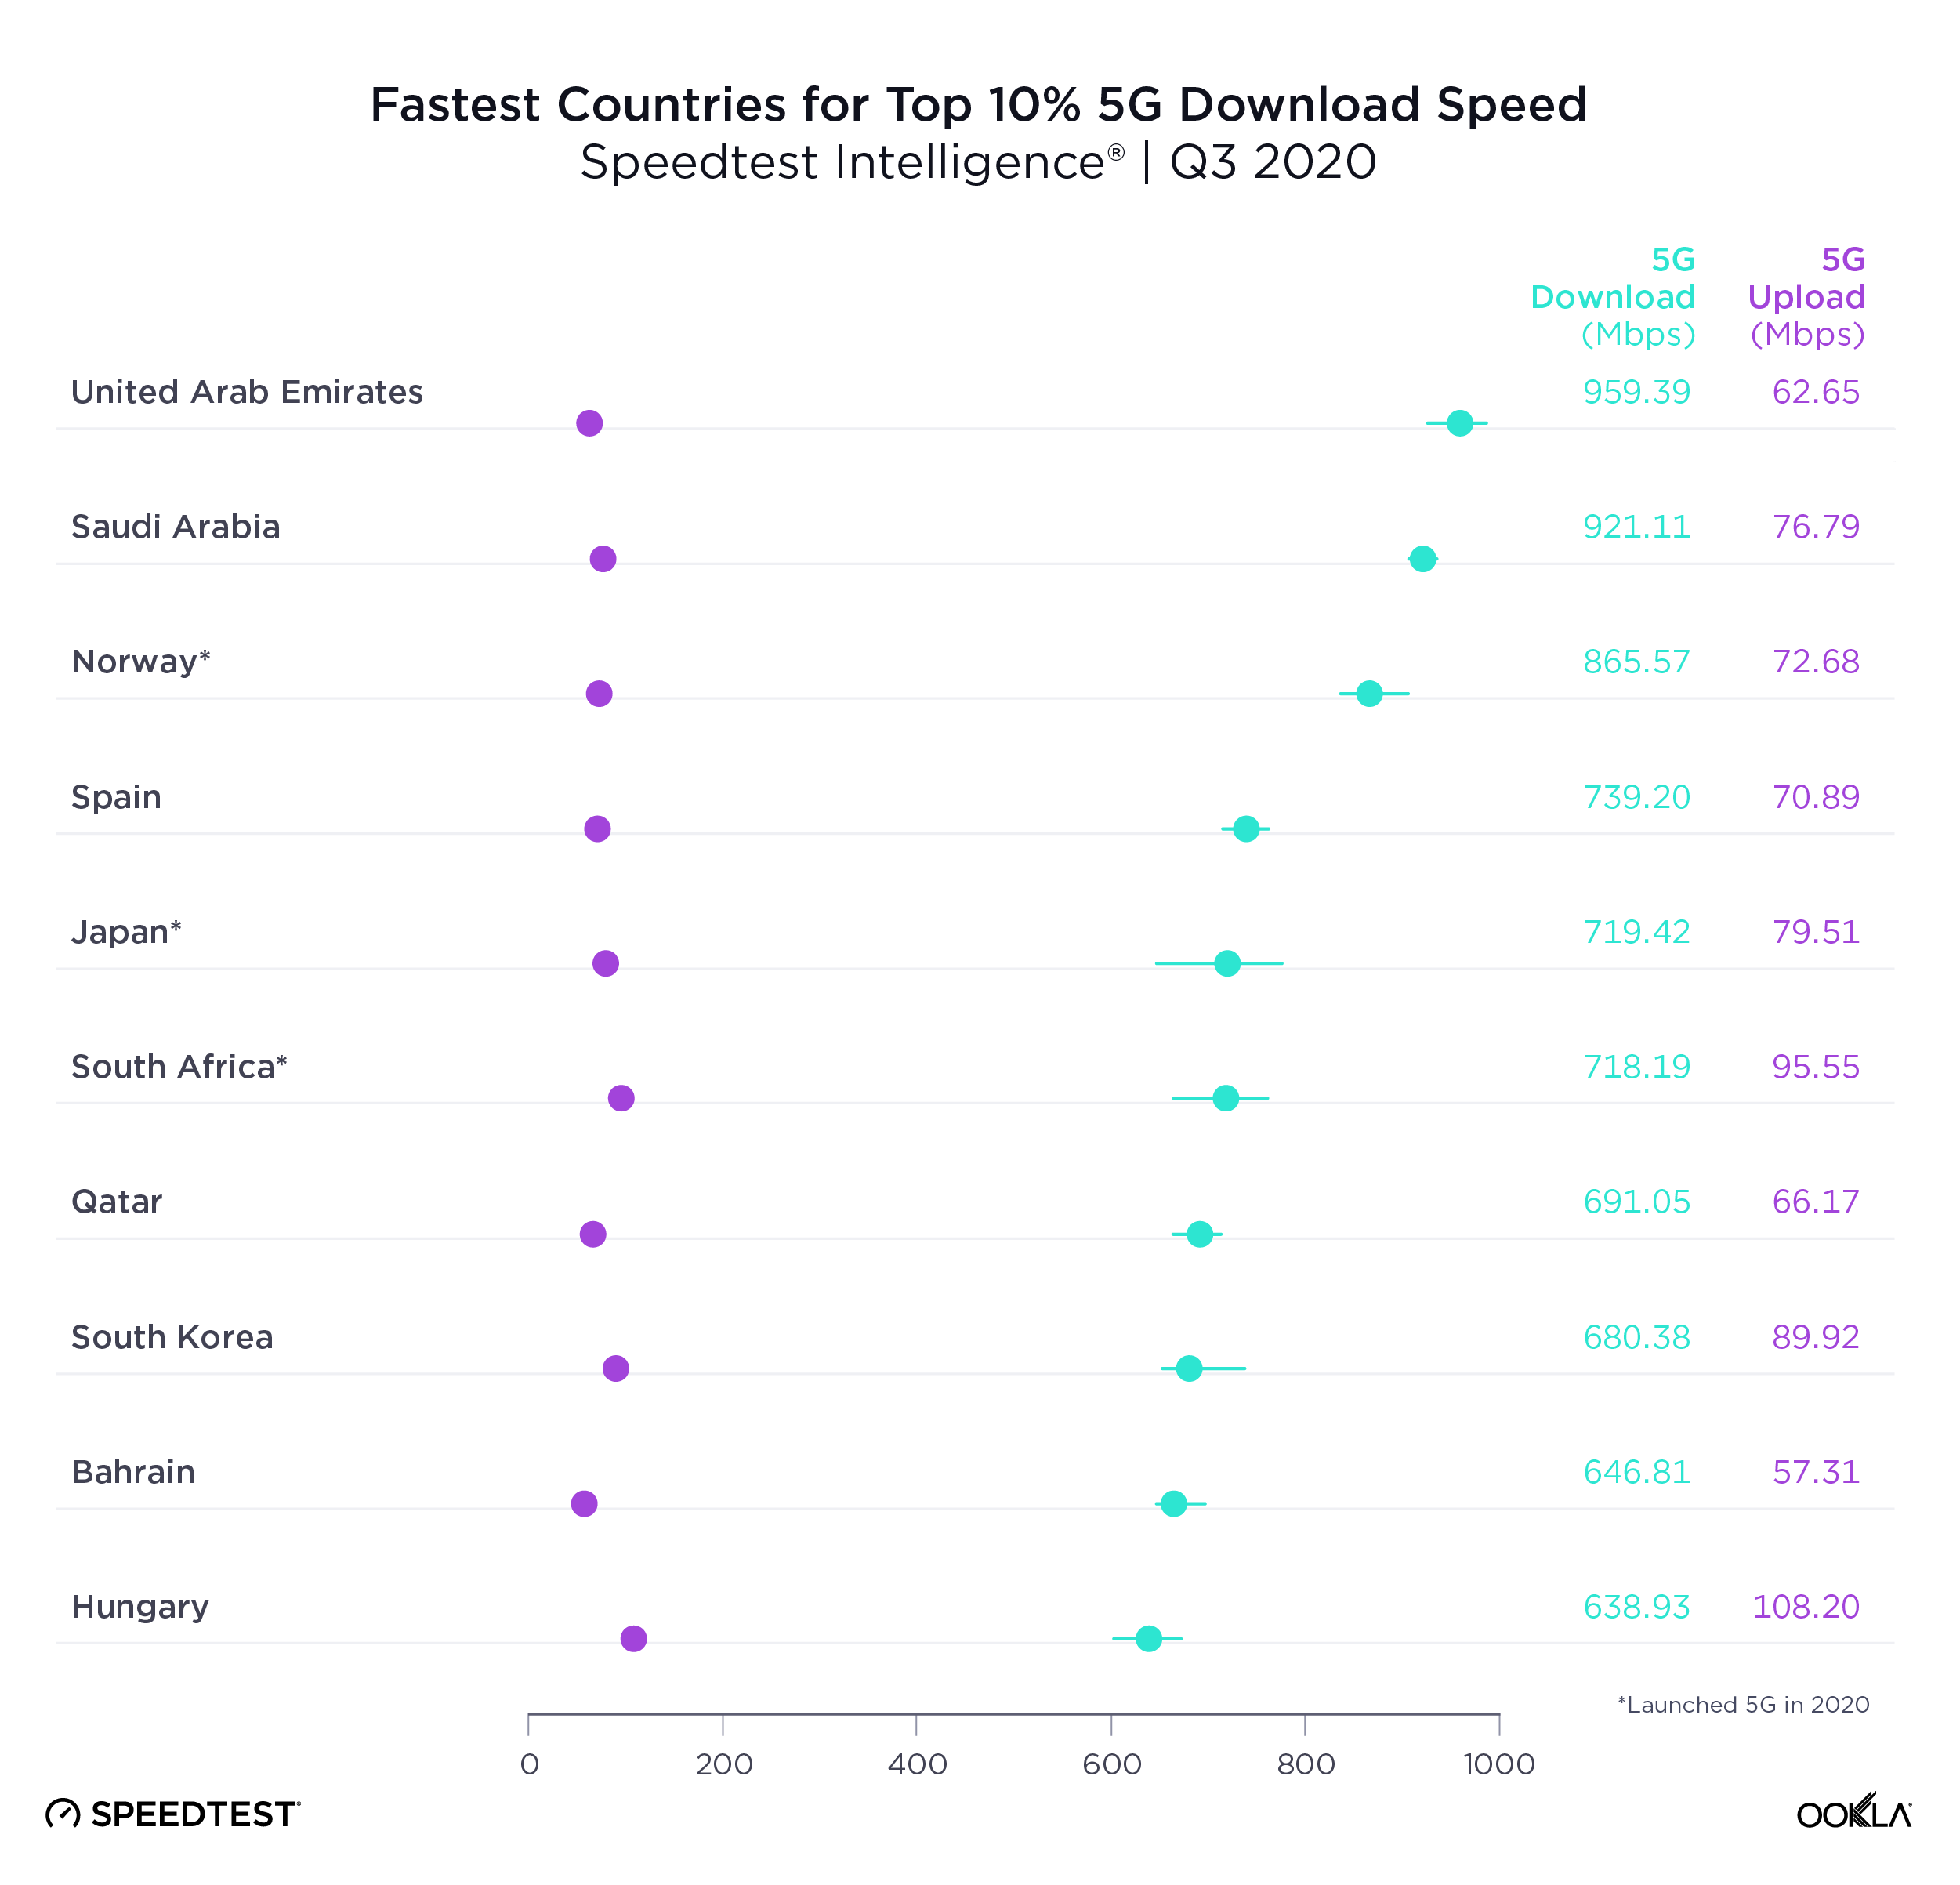
United Arab Emirates topped the list of countries with the fastest top 10% 5G download speed in Q3 2020. Top 10% (or 90th percentile) measures the speeds seen by the fastest 10% of users and is a way to gauge what each country’s networks are capable of. Saudi Arabia was second for top 10% 5G download speed, Norway third, Spain fourth and Japan fifth.
Fastest-Countries-Top-5G-Download-Speed_1220-2

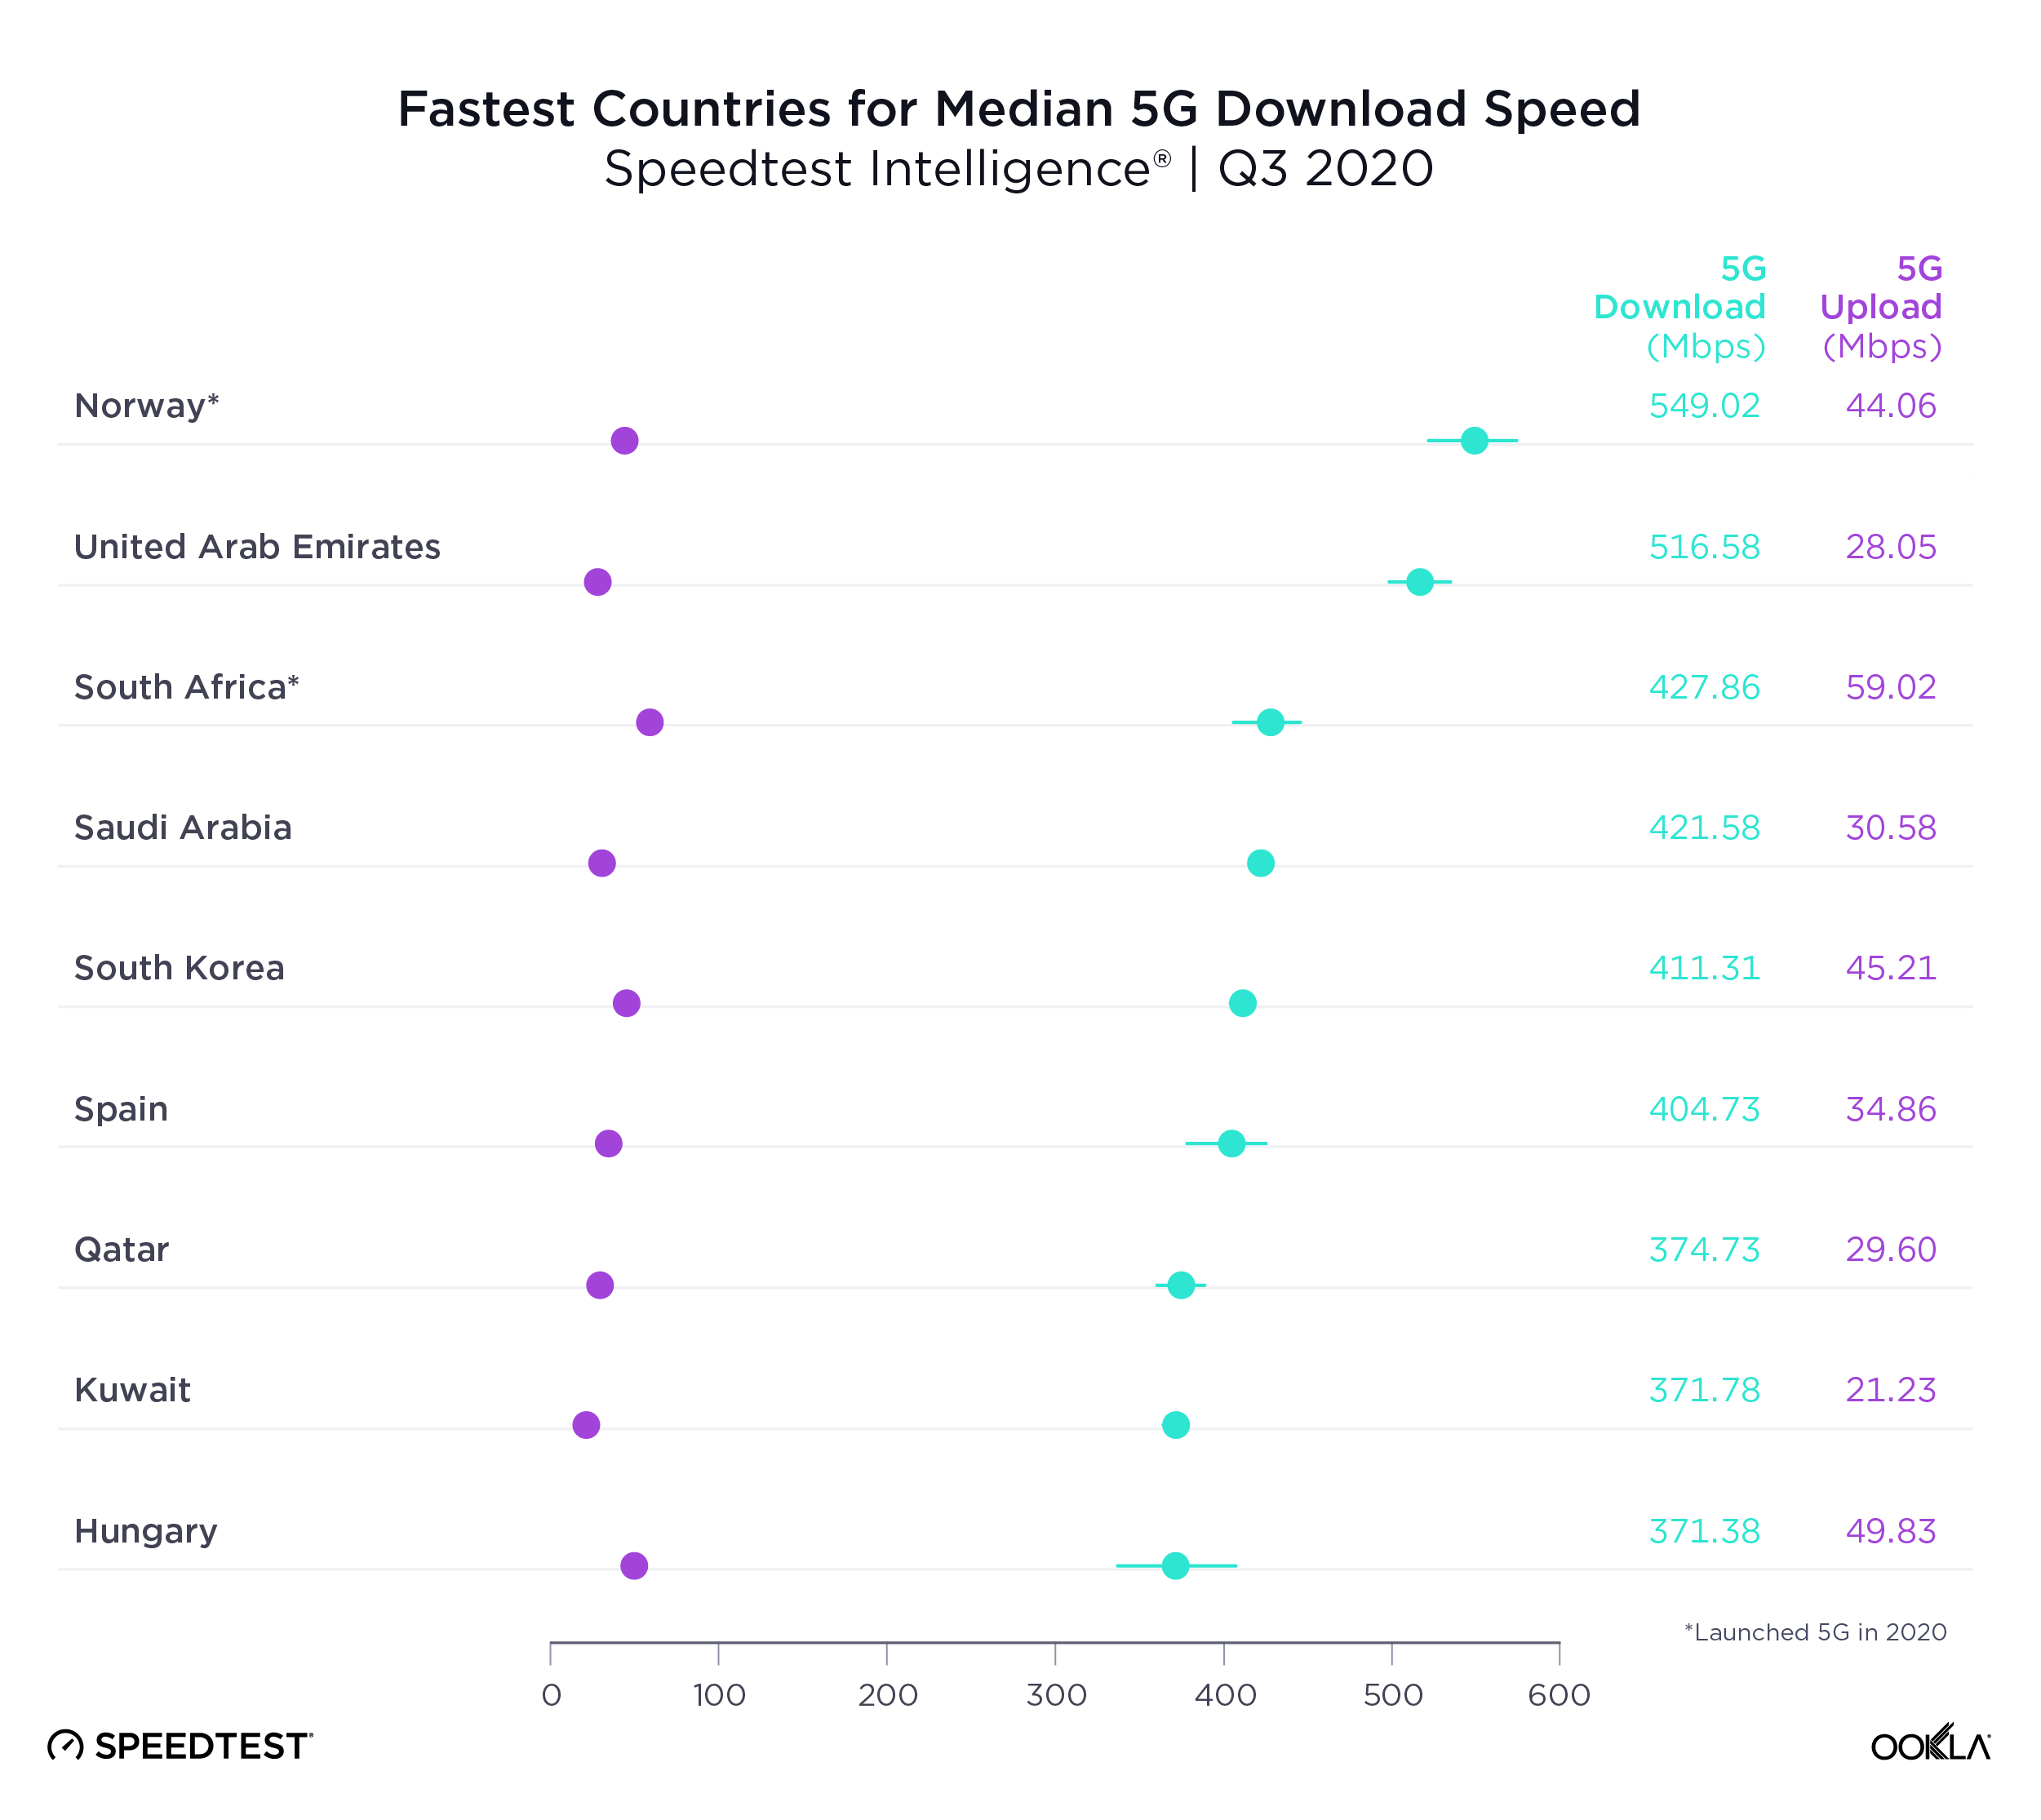
Another way to measure 5G performance is to look at median 5G download speed, which is a better predictor of the kind of performance most 5G customers can expect. Norway was the country with the fastest median download speed over 5G during Q3 2020. U.A.E. was second in this category, South Africa third, Saudi Arabia fourth and Spain fifth.
Fastest-Countries-Median-5G-Download-Speed_1220-2

It’s notable that Japan was on the list of 10 countries with the fastest top 10% 5G download speed but not on the list of 10 countries with the fastest median download speed over 5G. No matter how fast a country’s mobile infrastructure is, many other factors go into median 5G speeds, including device adoption and spectrum allocation.

Abu Dhabi tops list of 5G speeds in world capitals

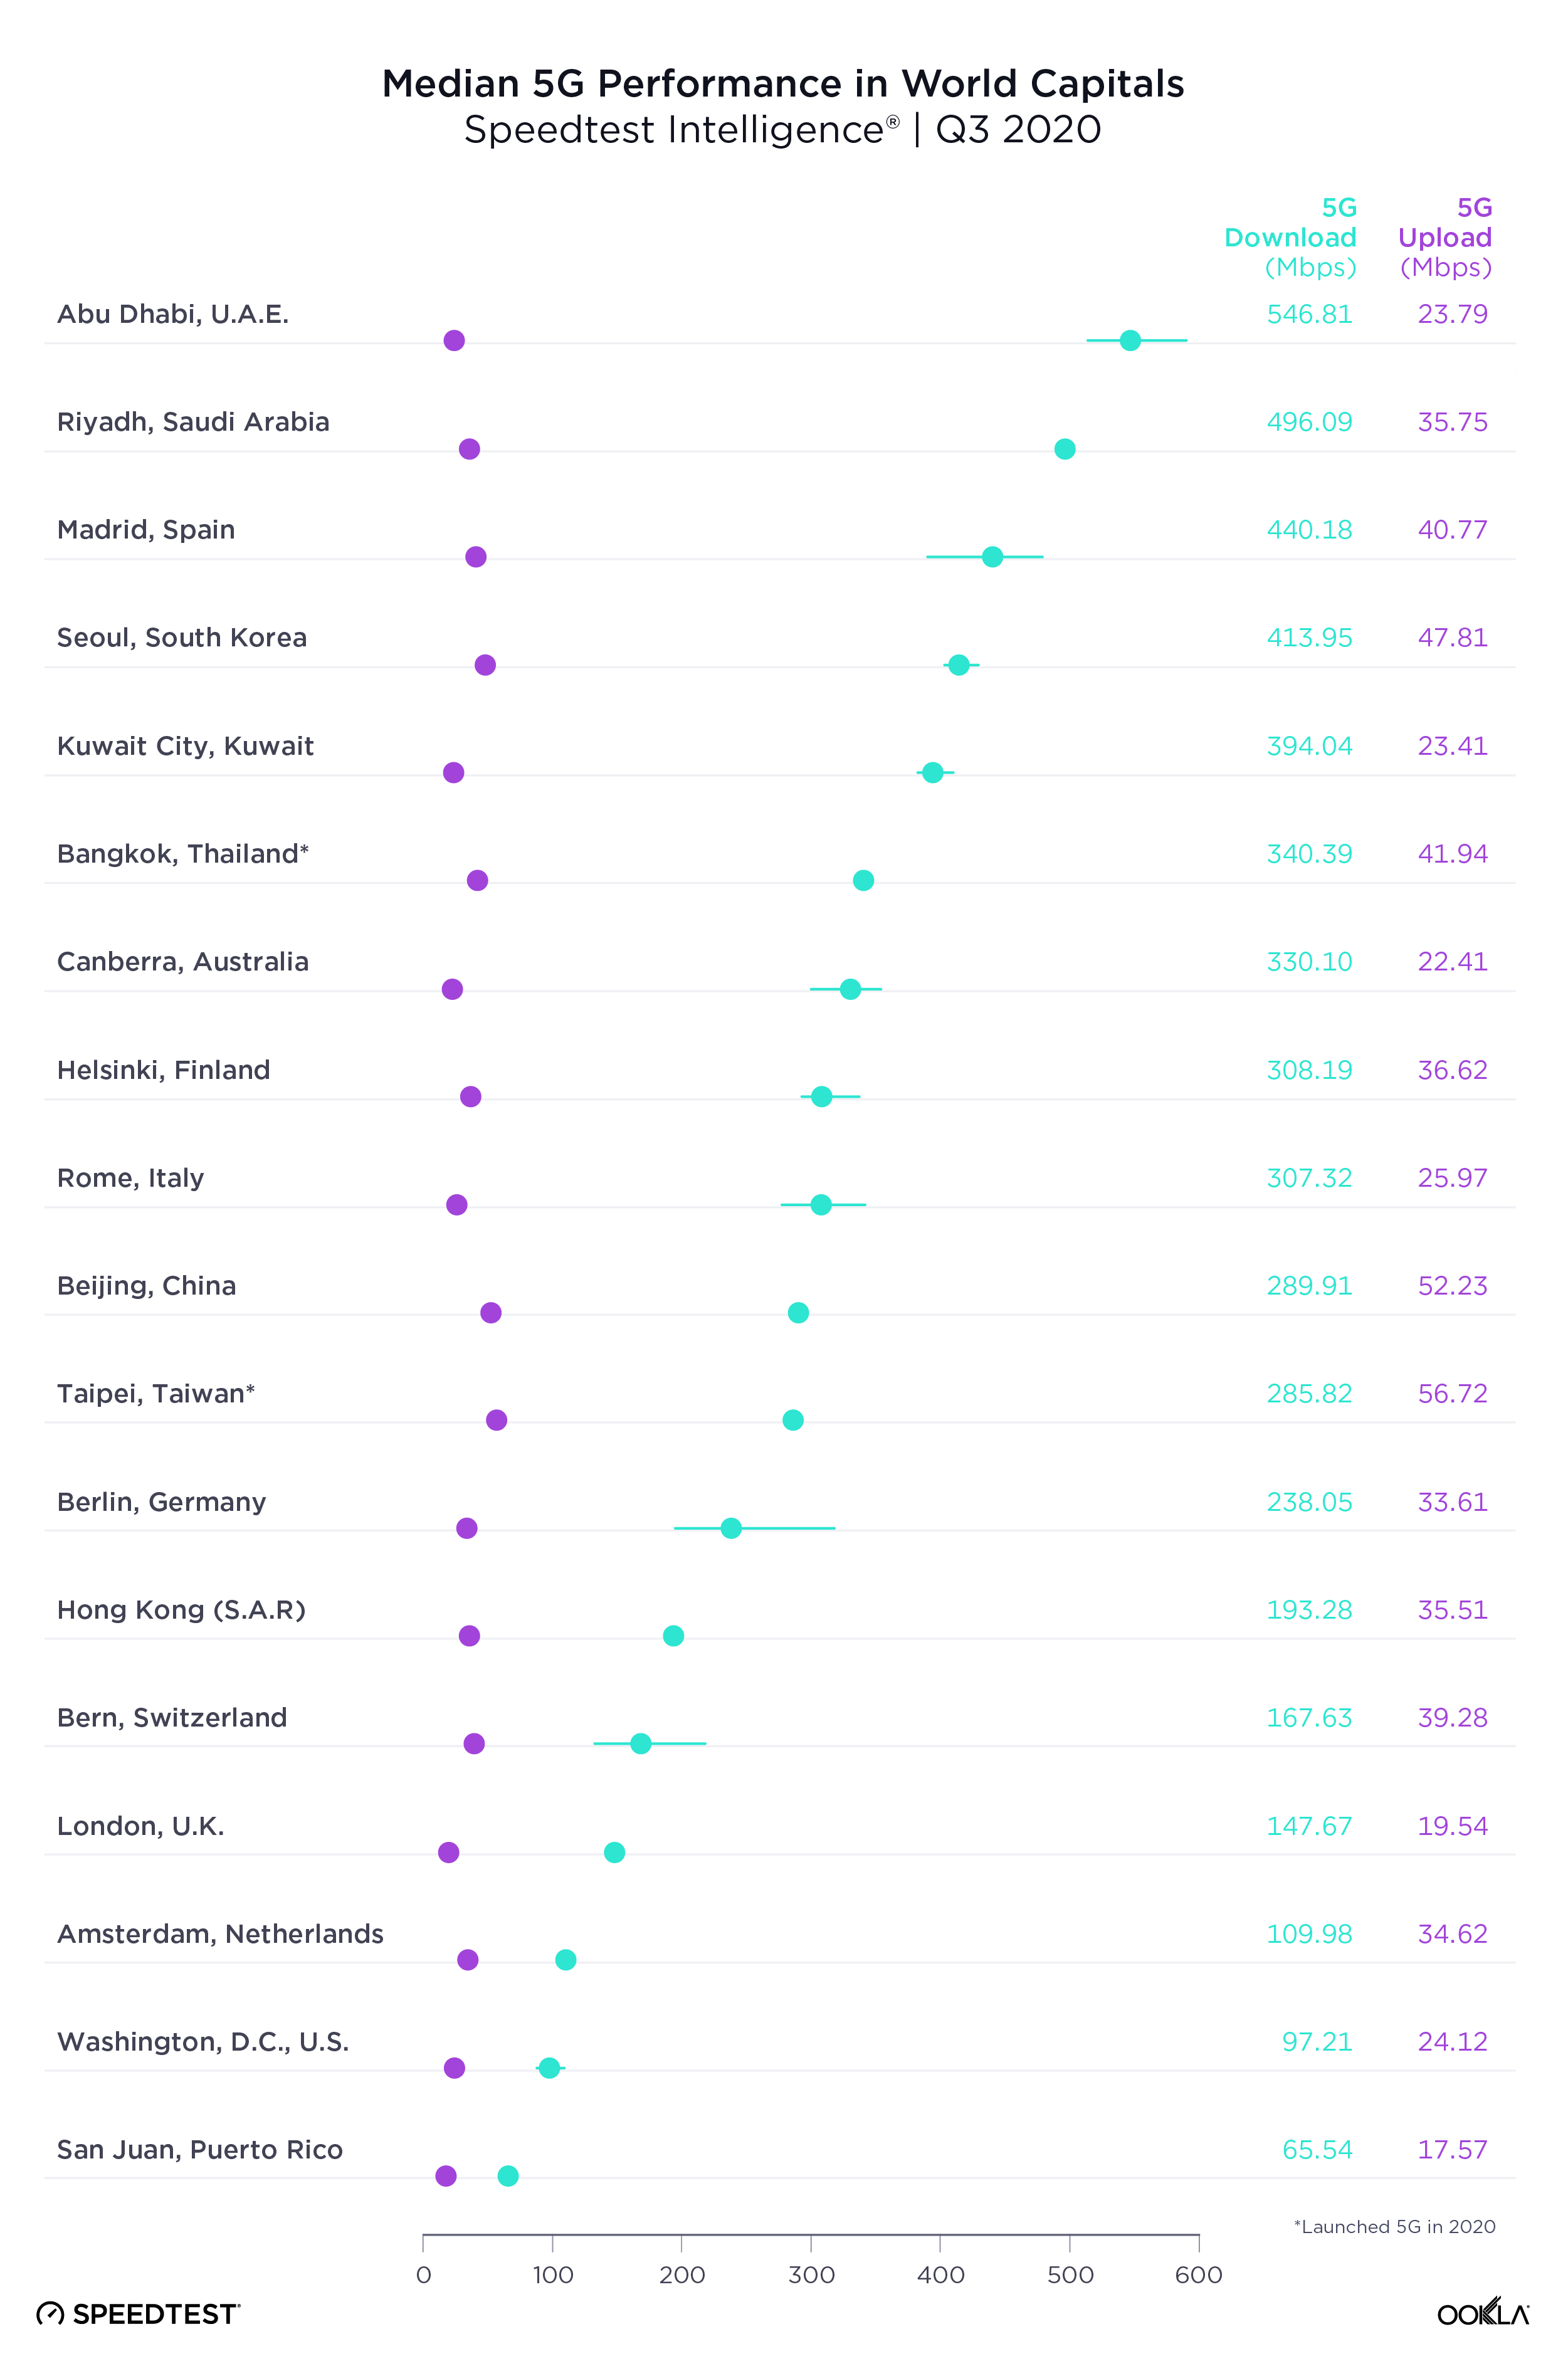
Our examination of 5G performance for 18 world capital cities with 5G during Q3 2020 found that Abu Dhabi had the fastest median download speed over 5G at 546.81 Mbps. Riyadh was second, Madrid third, Seoul fourth and Kuwait City fifth. As we saw at the country level, median upload speed was much lower than download speed.
Median-5G-Performance-Capitals_1220-2

How 5G performance and time spent compare within regions

We looked more closely at 5G performance across several intergovernmental organizations and trade blocs to get a better sense of how countries are performing in comparison to their neighbors and trade partners. We also calculated Time Spent on 5G, the proportion of time that users with 5G-capable devices spent on 5G, for each country.

Italy had the fastest 5G among G7 countries, U.S. the slowest

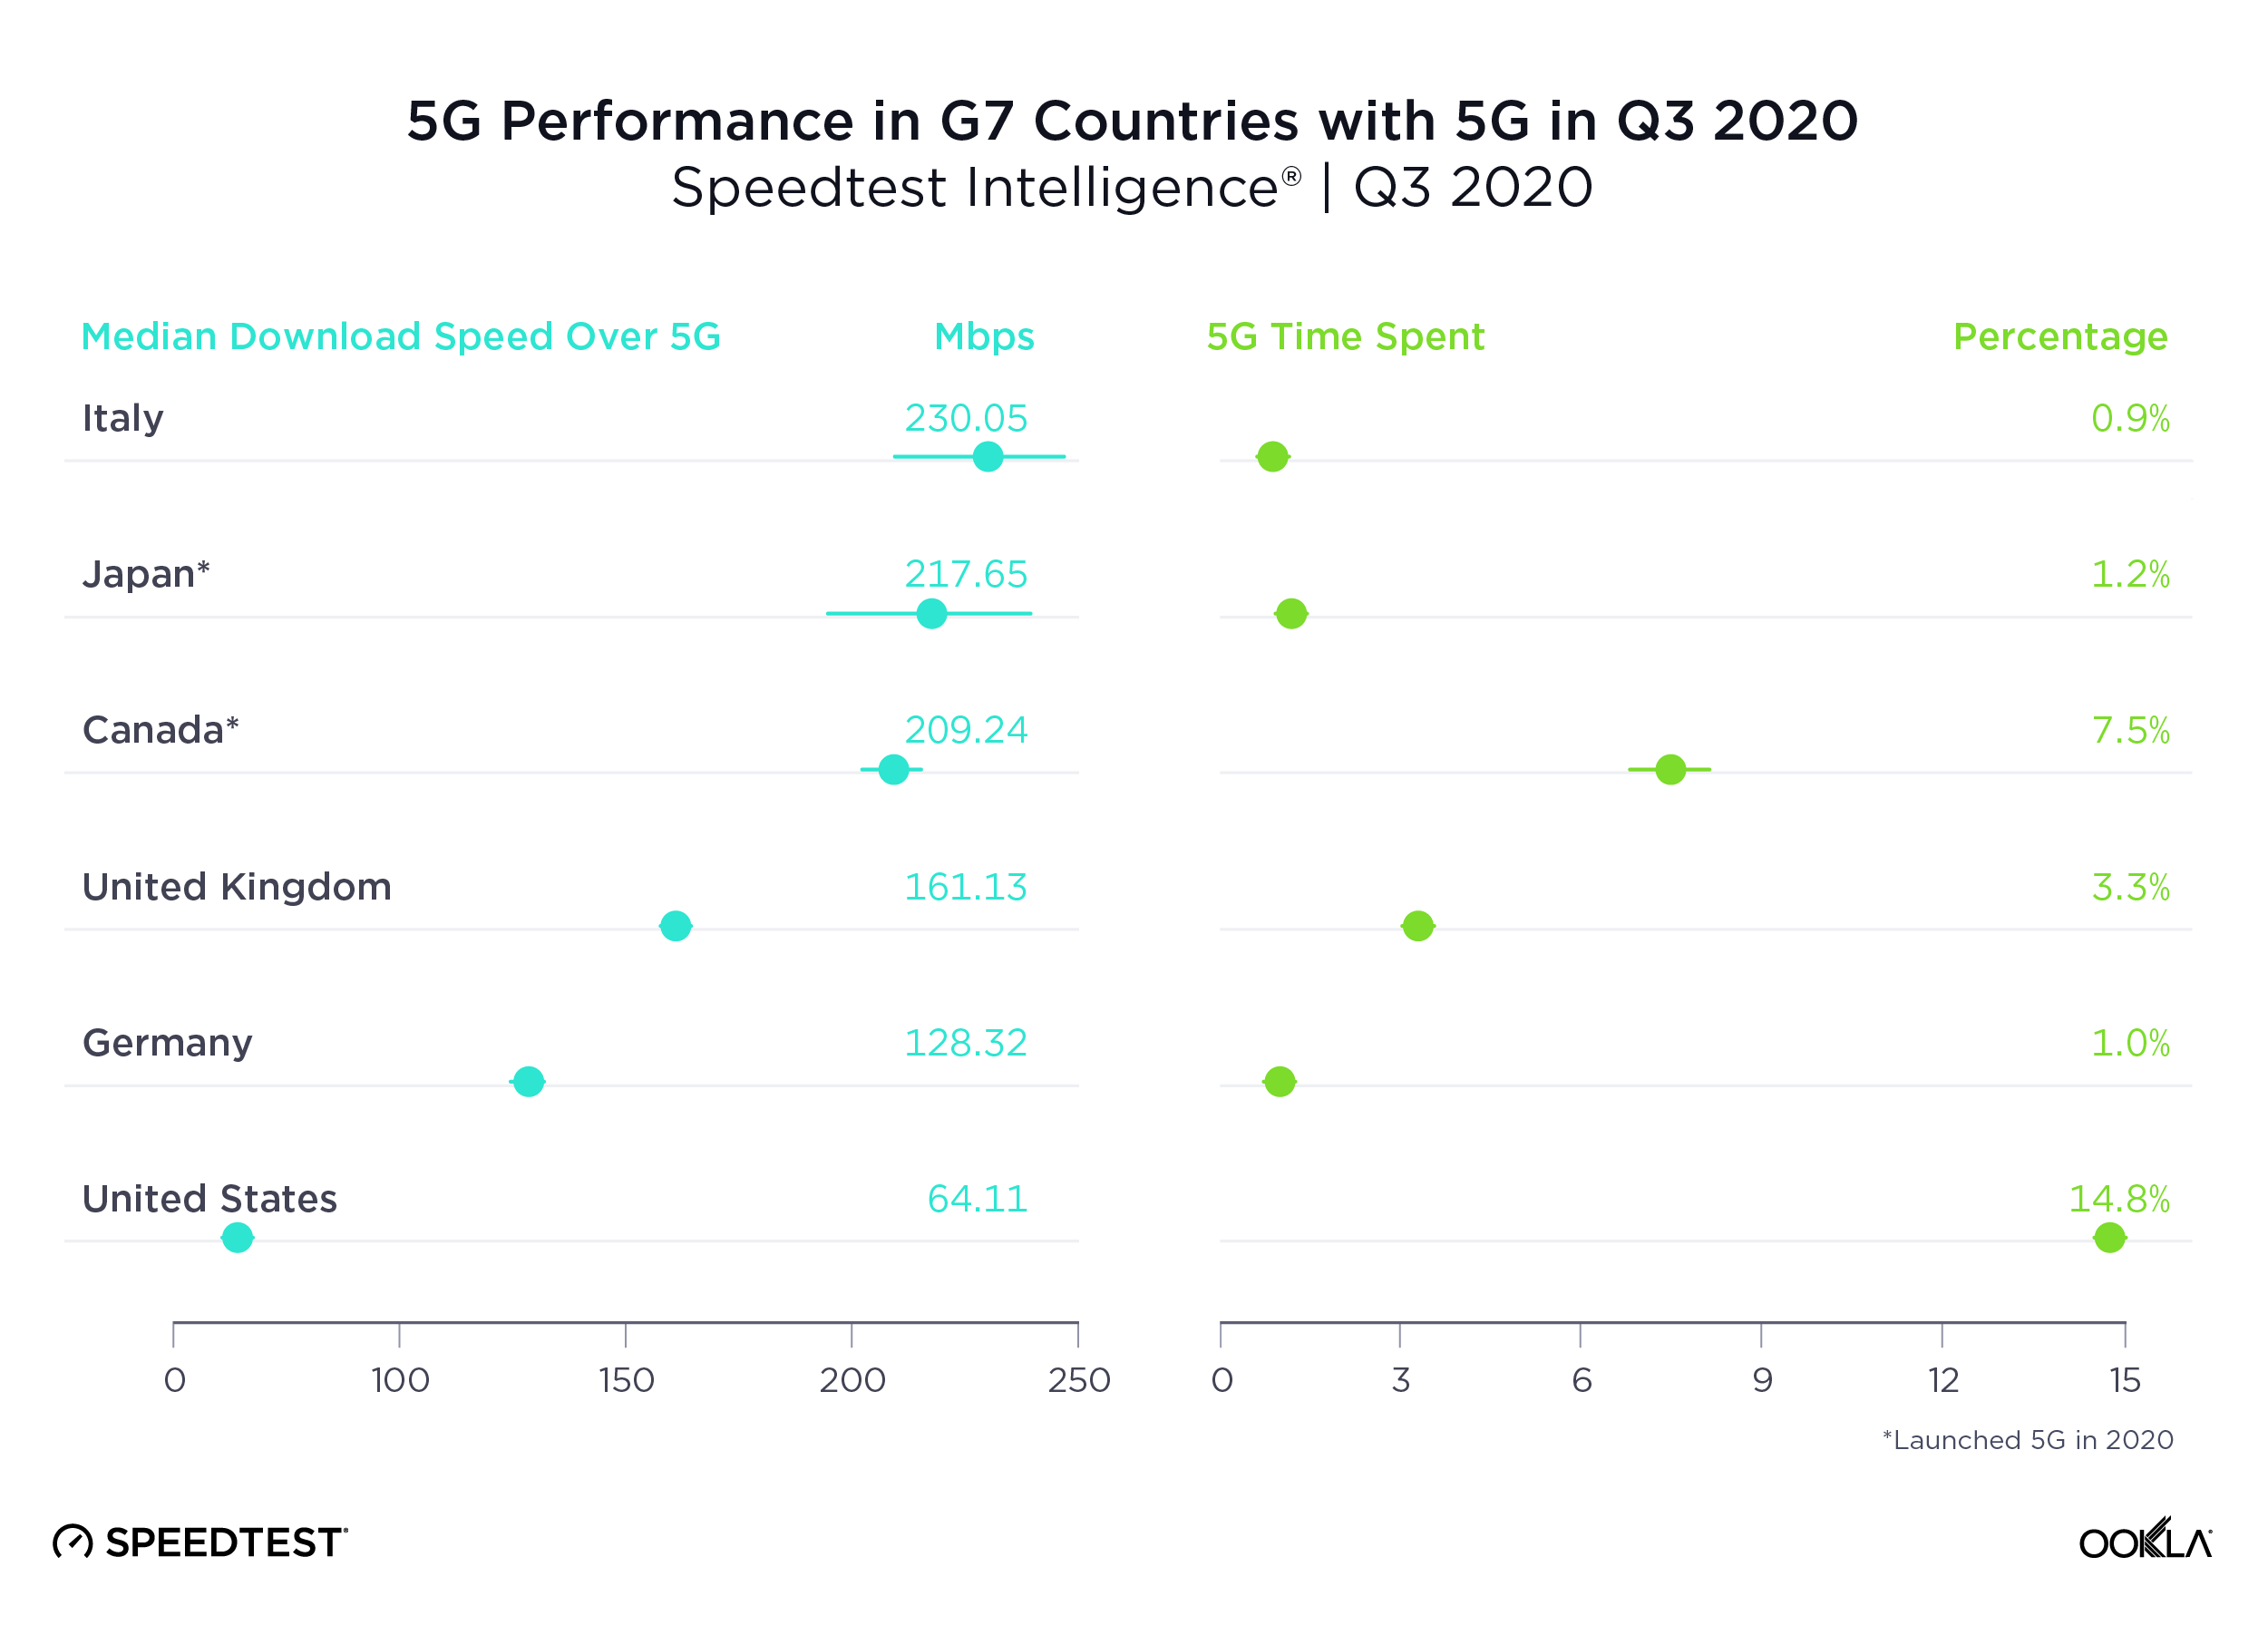
Italy had the fastest median download speed over 5G of all the G7 countries. Japan was second, Canada third, the U.K. fourth and Germany fifth. The U.S. had the highest Time Spent on 5G, followed by Canada. For a deeper analysis of 5G in the U.K., read our previous coverage. Because France launched commercially available 5G only within the last couple of weeks, we have not included it on this table.
5G-Performance-G7-Countries_1220

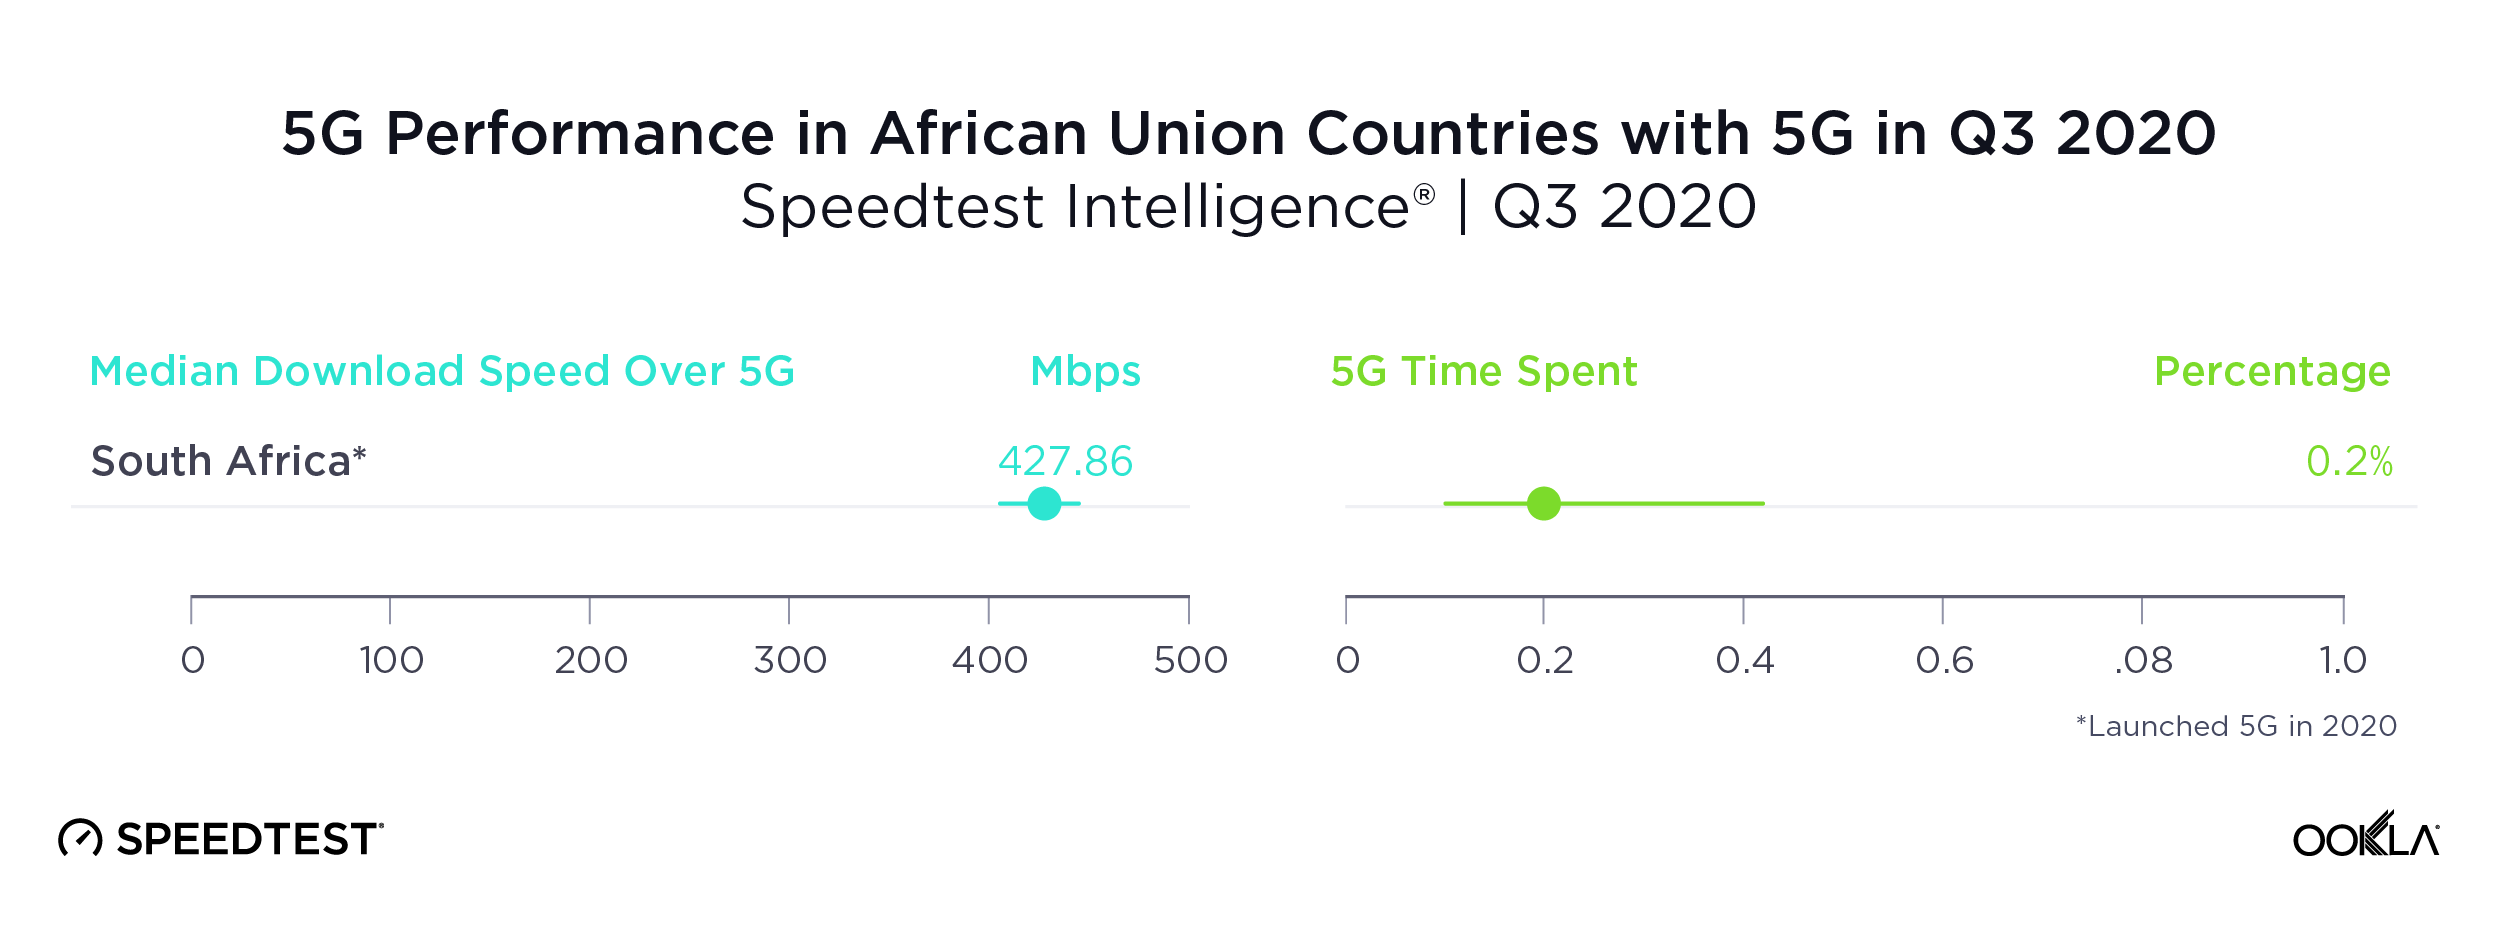
South Africa was the only country in the African Union with sufficient 5G to rate

As we saw above, South Africa’s impressive median download speed over 5G ranked the country third in the world during Q3 2020. South Africa was only one of two countries in the African Union to have commercially available 5G during Q3 2020. The other, Madagascar, did not have sufficient samples to properly analyze. Time Spent on 5G in South Africa was very low, an indication that 5G is not yet widely available there.
5G-Performance-Africa_1220

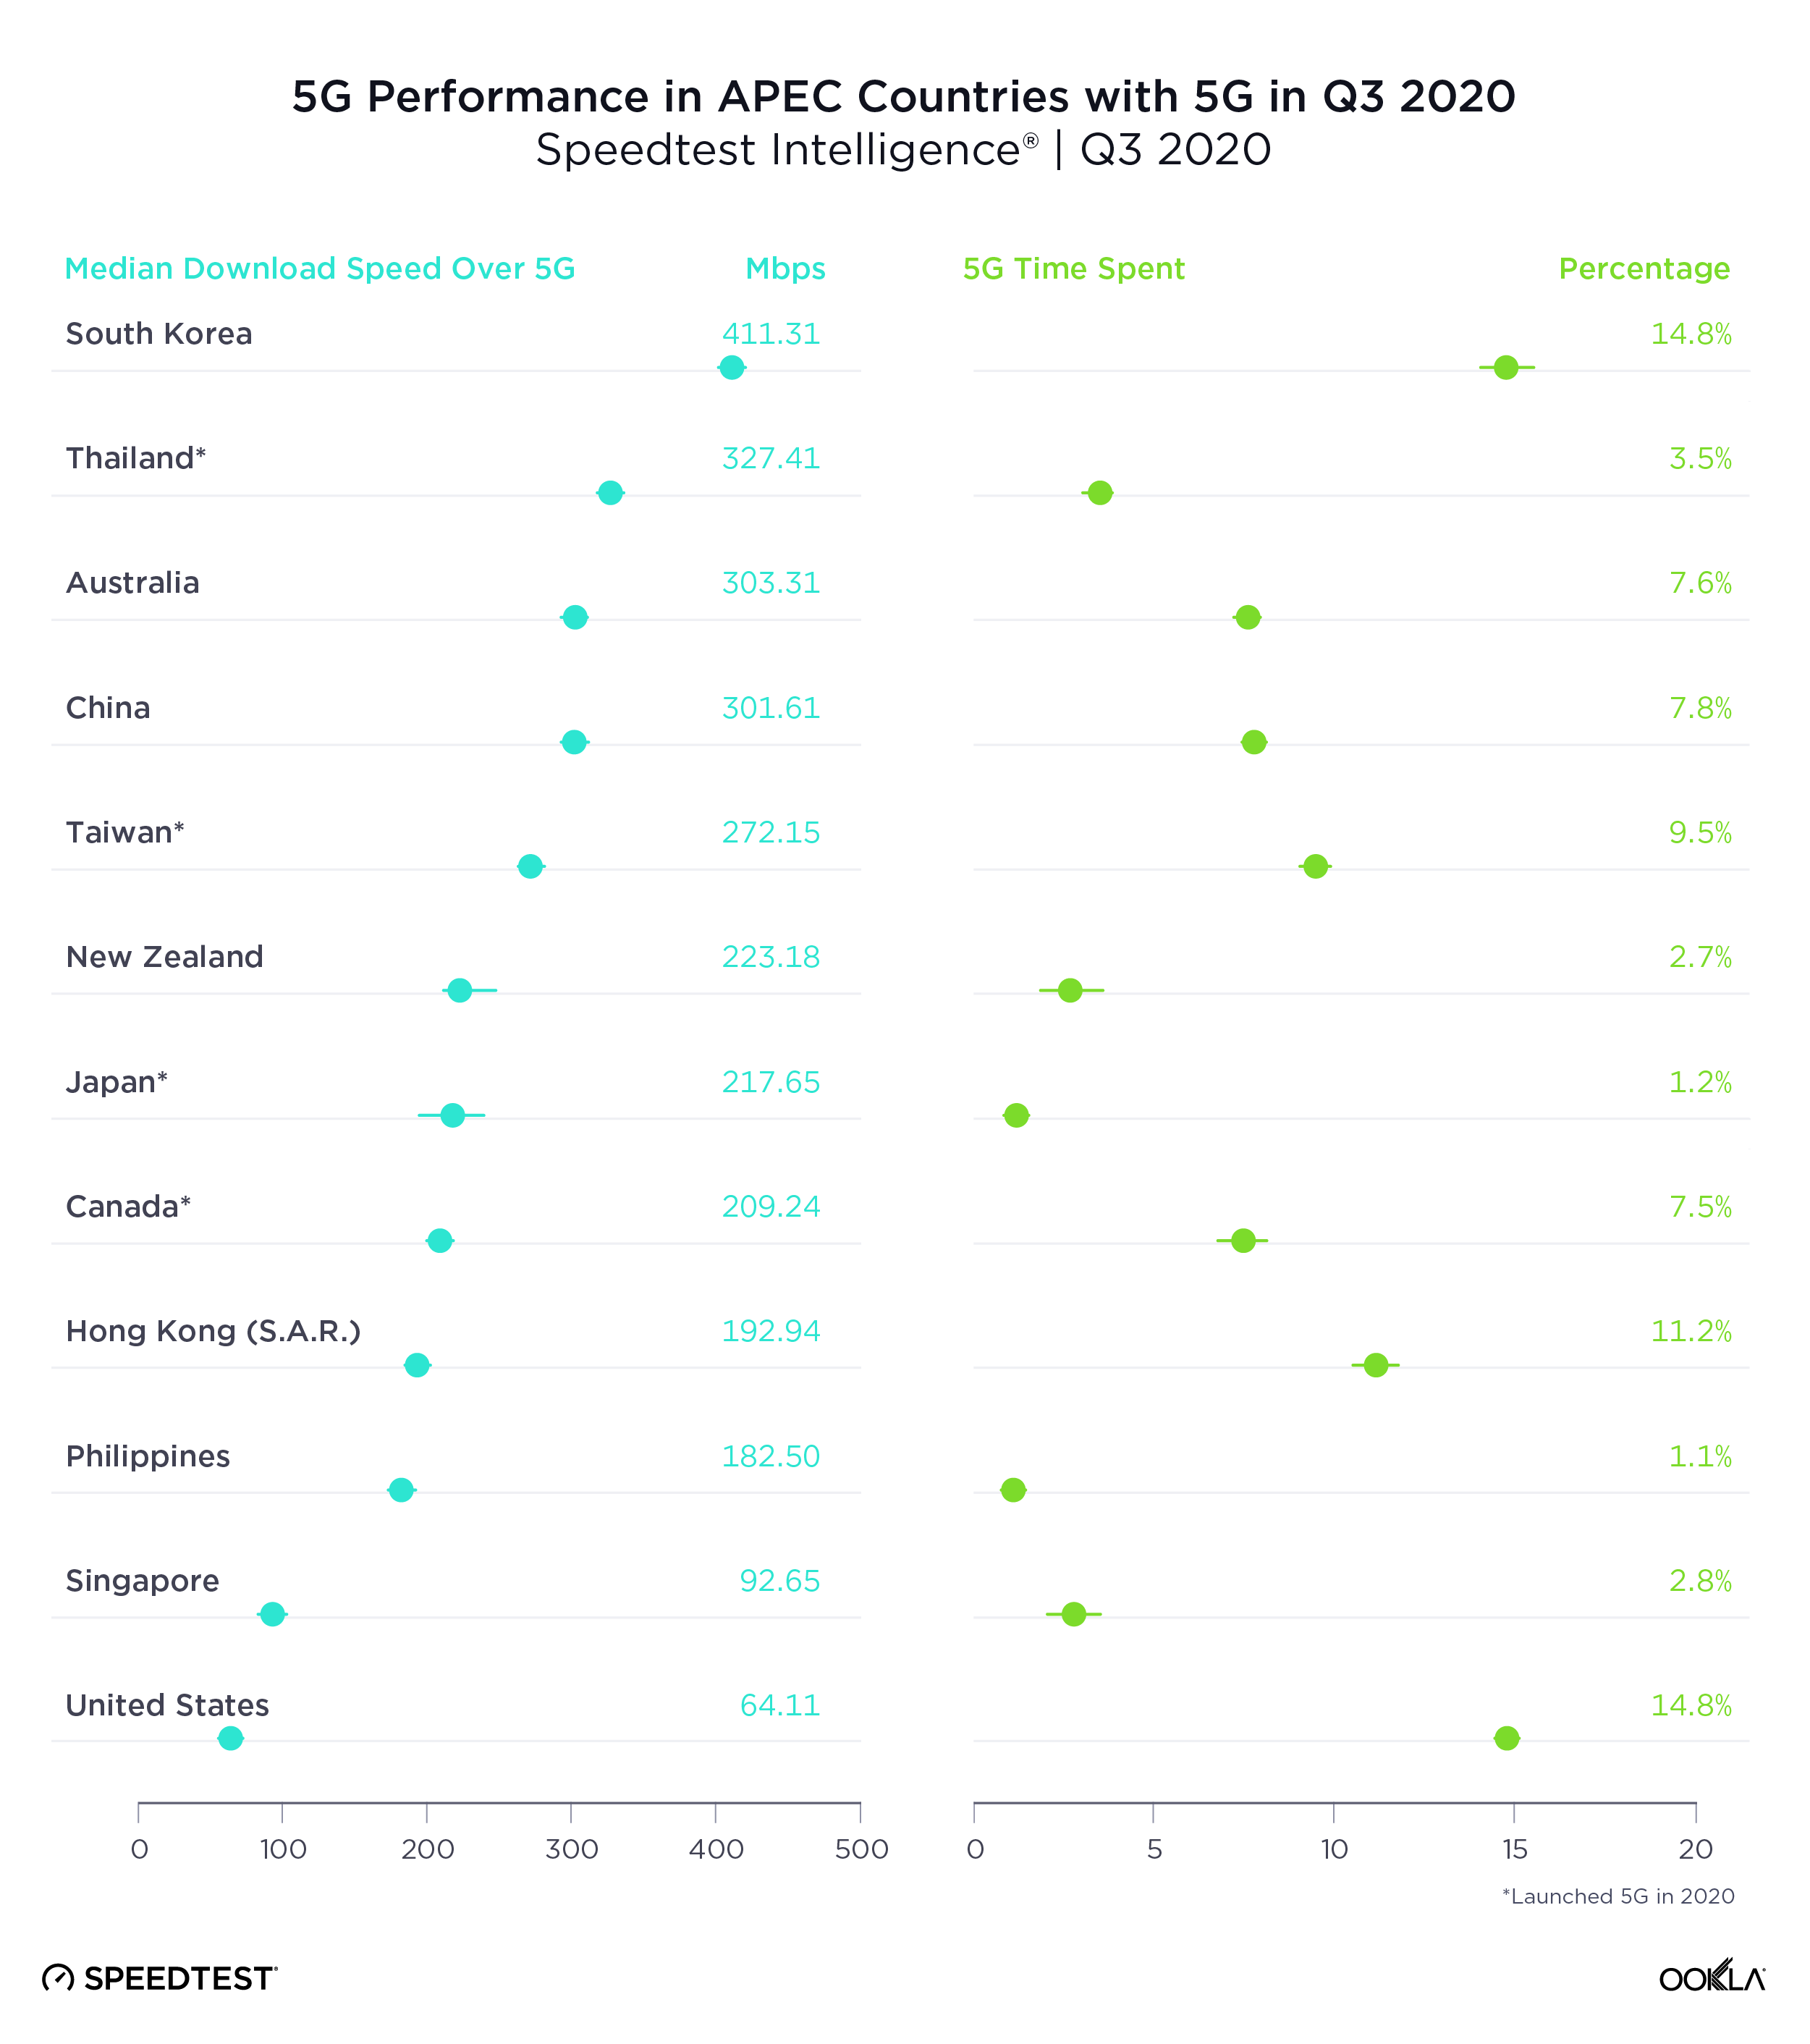
South Korea had the fastest 5G in APEC countries, U.S. the slowest

A median download speed over 5G of 411.11 Mbps put South Korea comfortably at the top of Asia-Pacific Economic Cooperation (APEC) countries with the fastest 5G during Q3 2020. Thailand was second, Australia third, China fourth and Taiwan fifth. 5G speeds represented the largest improvement over 4G in the Philippines where the median download speed over 4G during Q3 2020 (9.36 Mbps) was substantially lower than that of other countries on this list.

South Korea and the U.S. tied for highest Time Spent on 5G among APEC countries during Q3 2020, followed by Hong Kong and Taiwan.
5G-Performance-APEC_1220

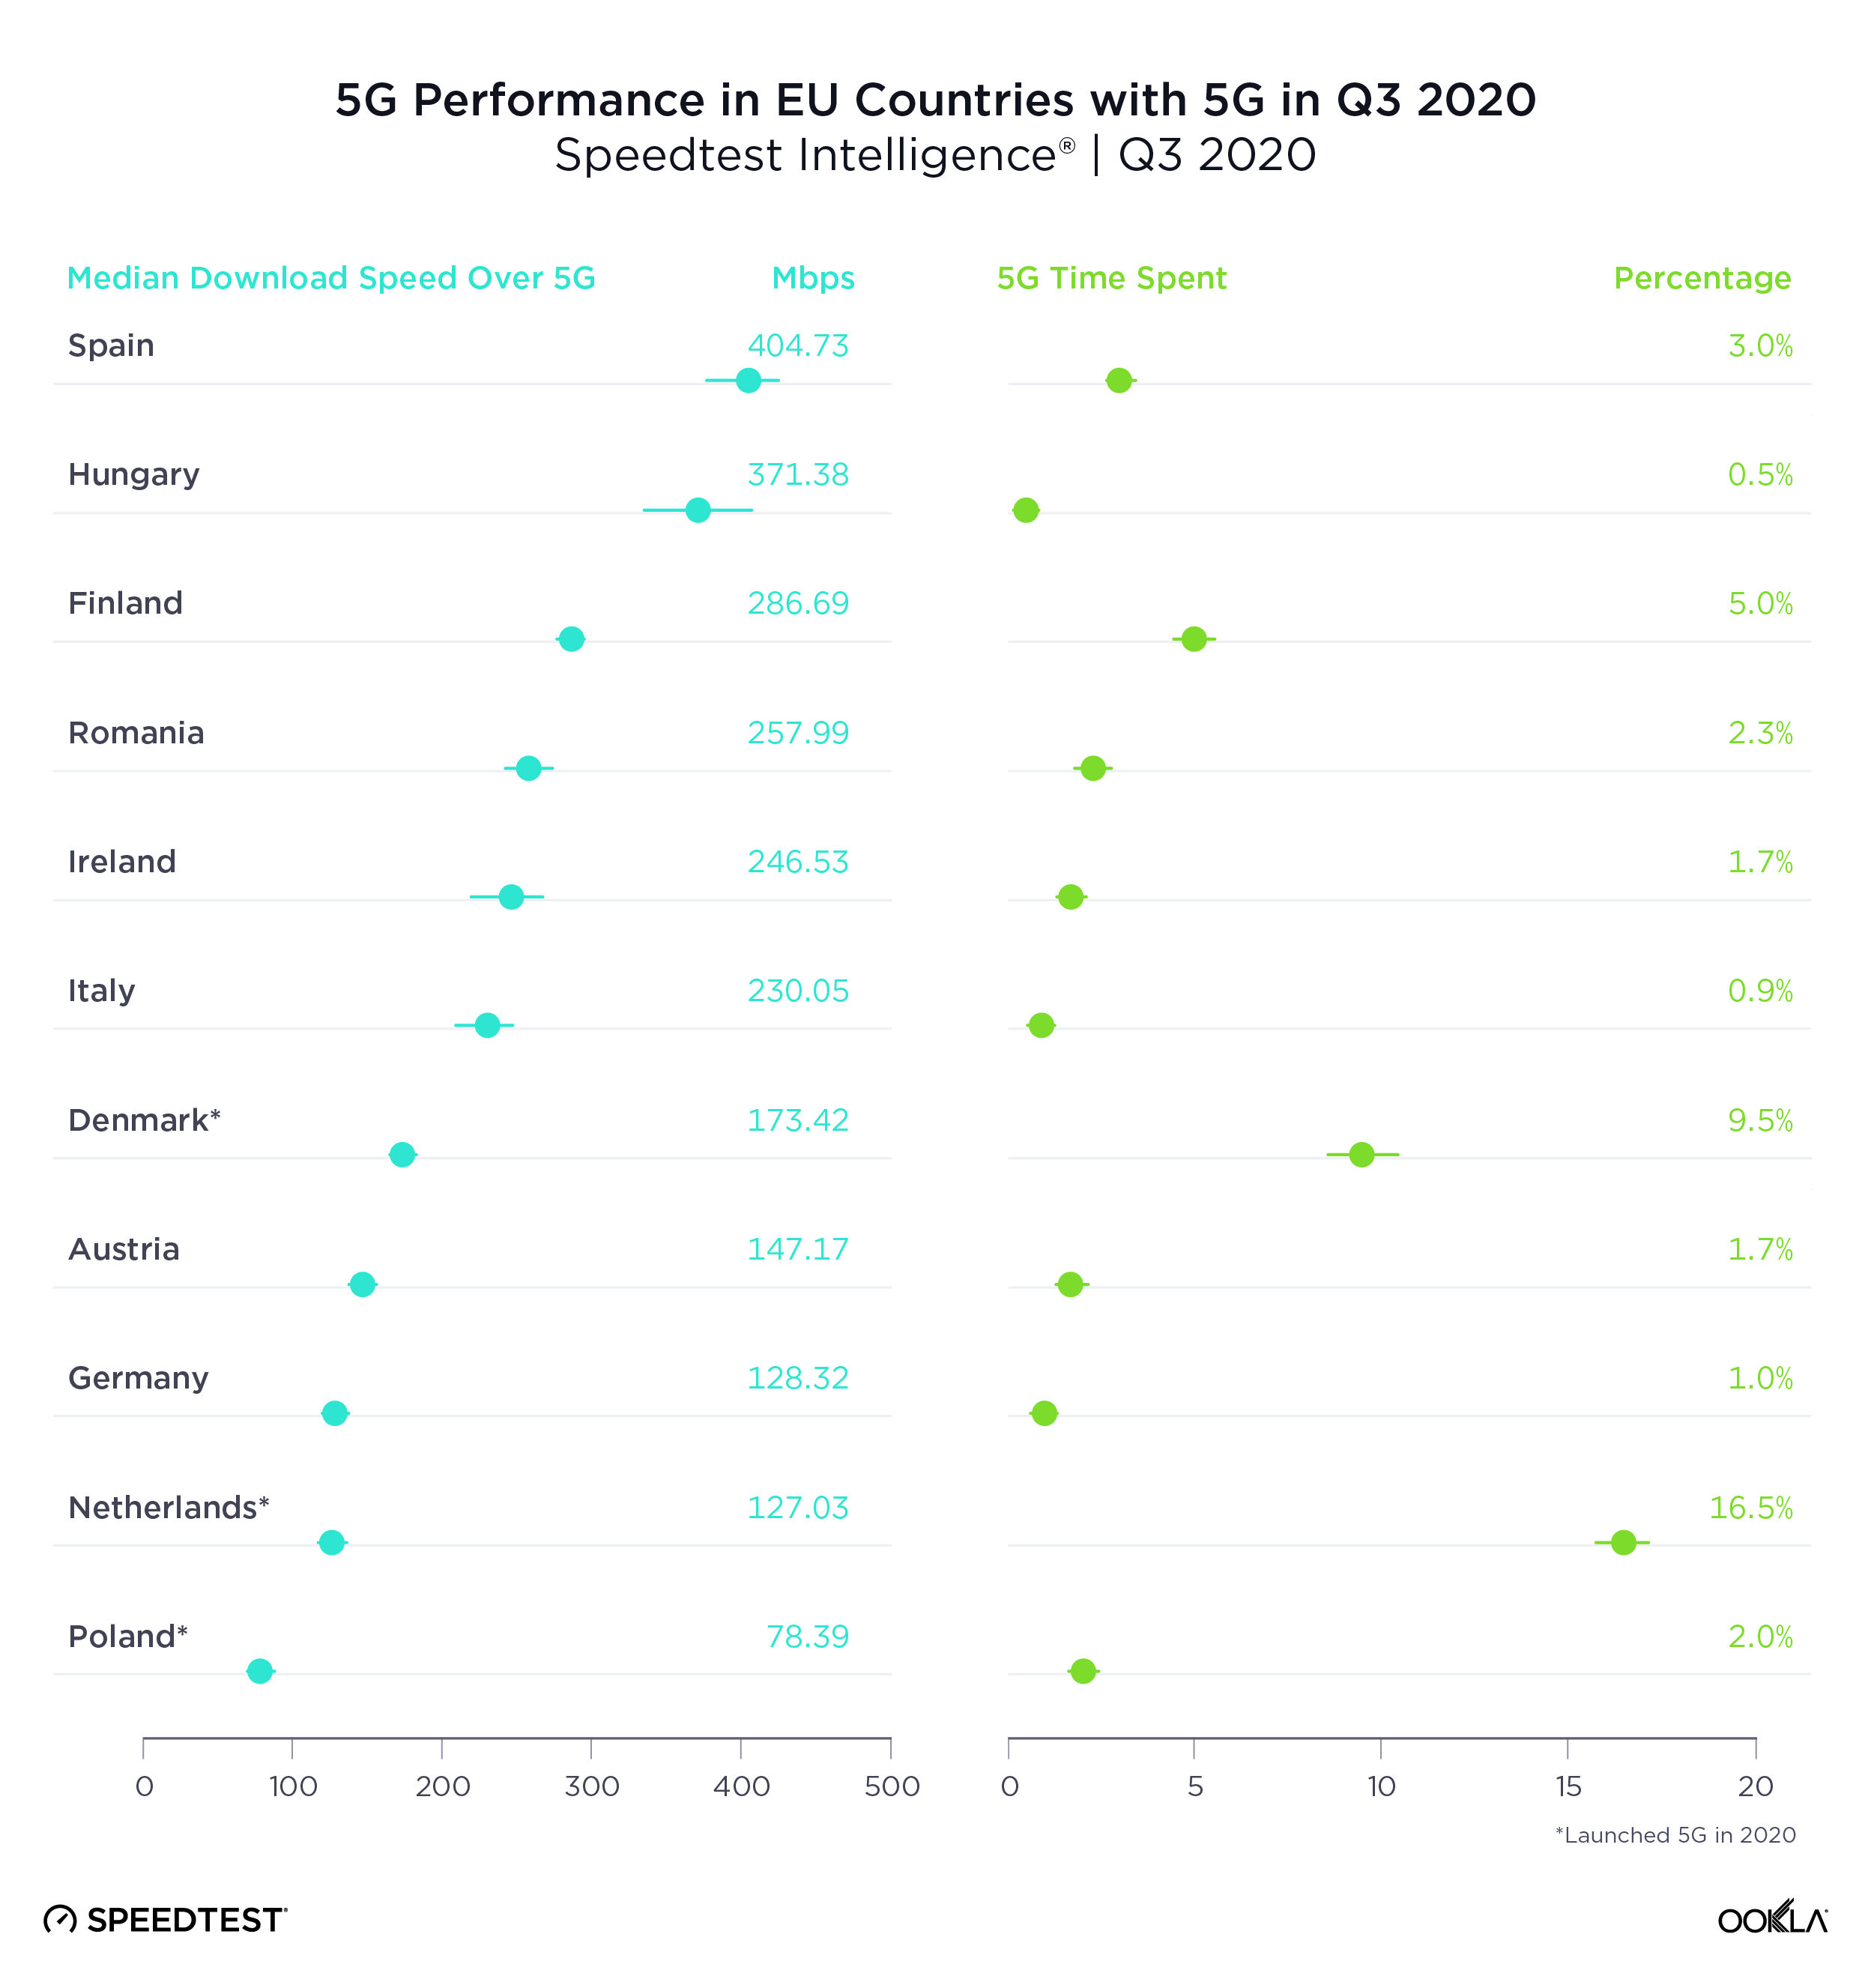
Spain had the fastest 5G in the E.U., Poland the slowest

Spain showed the fastest median download speed over 5G among the 11 European Union (E.U.) countries with sufficient 5G samples to rank during Q3 2020. Hungary was second, Finland third, Romania fourth and Ireland fifth. Spain’s median download speed over 5G also represented the largest gain over 4G among all of these countries, partially because Spain had the second slowest median download speed over 4G. France is not included on this list because 5G did not become commercially available in the country until after Q3 2020.

The Netherlands had the highest Time Spent on 5G among E.U. countries during Q3 2020, indicating that customers with 5G phones are able to spend far more time on 5G there than in other E.U. countries. Denmark was second for Time Spent on 5G among EU countries in Q3 2020 and Finland third.
5G-Performance-EU_1220

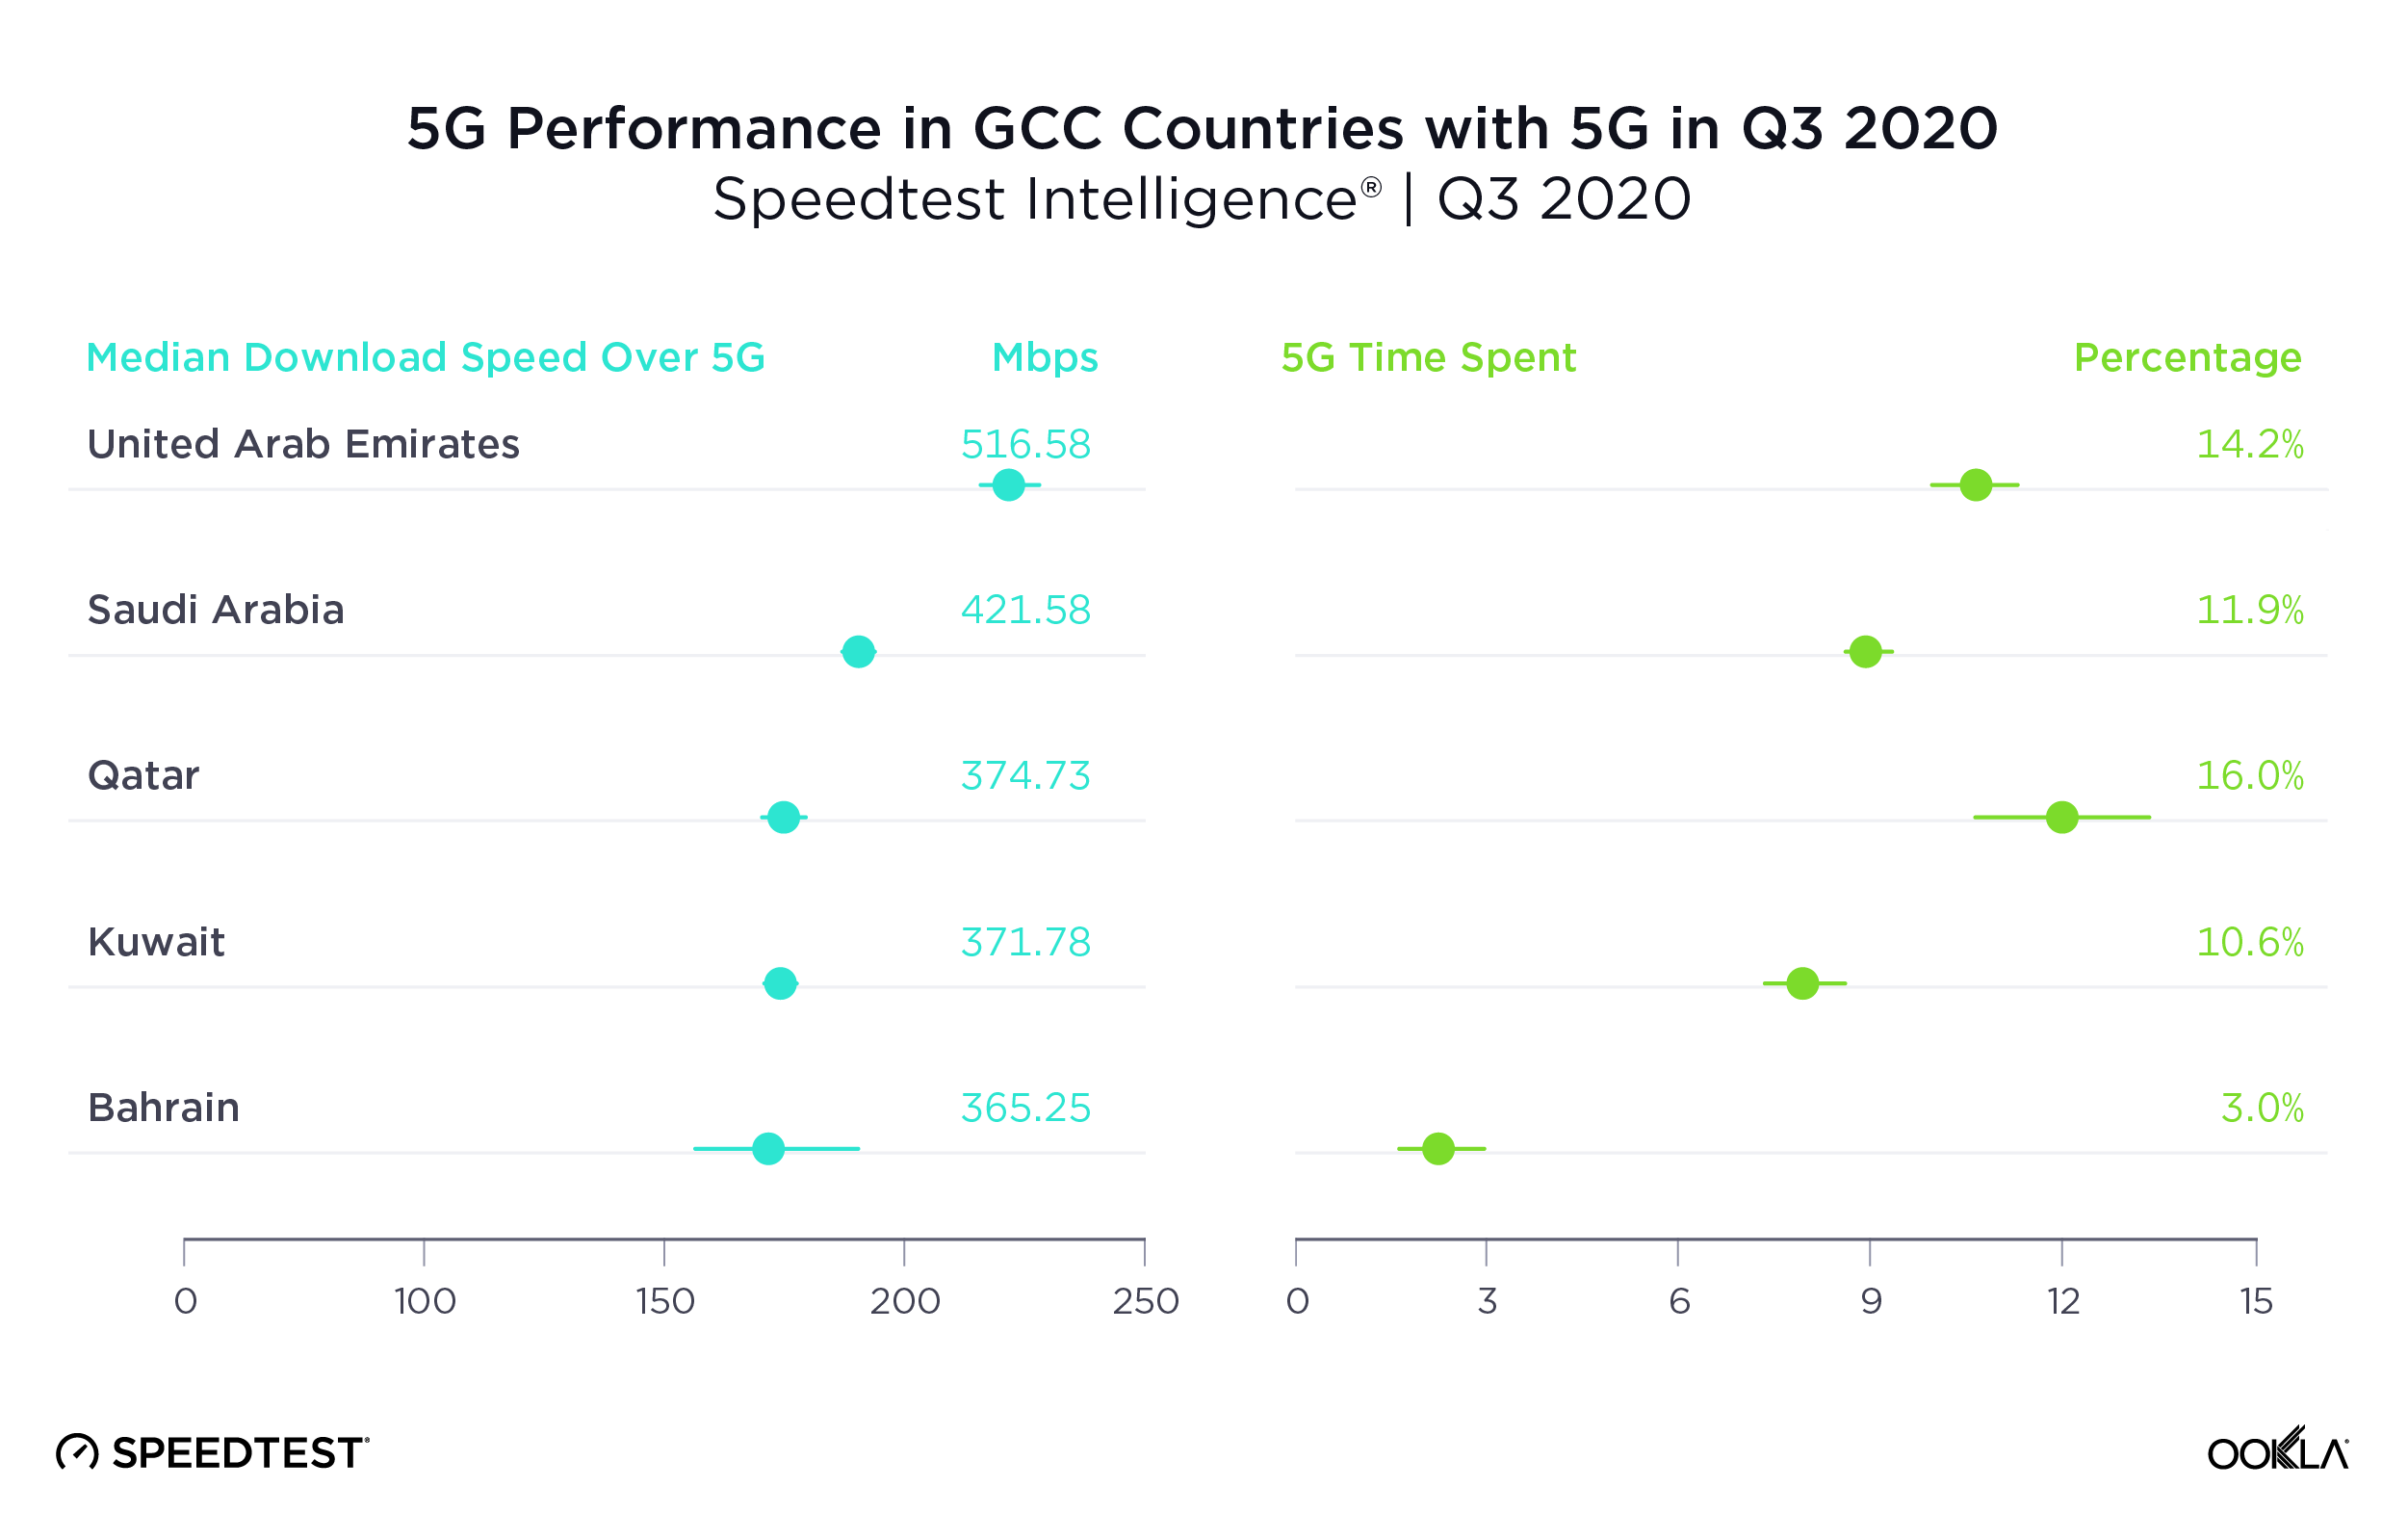
U.A.E had the fastest 5G in Gulf Cooperation Council Countries

With the second fastest median download speed over 5G in the world, U.A.E. was also the Gulf Cooperation Council (GCC) country with the fastest 5G during Q3 2020. Saudi Arabia was second and Qatar third. While Oman does have commercially available 5G, there were insufficient samples in the country during Q3 2020 to properly analyze performance.

5G represented the largest improvement over 4G in Kuwait and Bahrain, countries that had slower median download speeds over 4G than their neighbors.

Time Spent on 5G was relatively high in all the GCC countries on this list, except Bahrain, when compared to other countries in the world during Q3 2020. Qatar showed the highest Time Spent on 5G among GCC countries in Q3 2020 at 16.0%. U.A.E. was second and Saudi Arabia third.
5G-Performance-GCC_1220

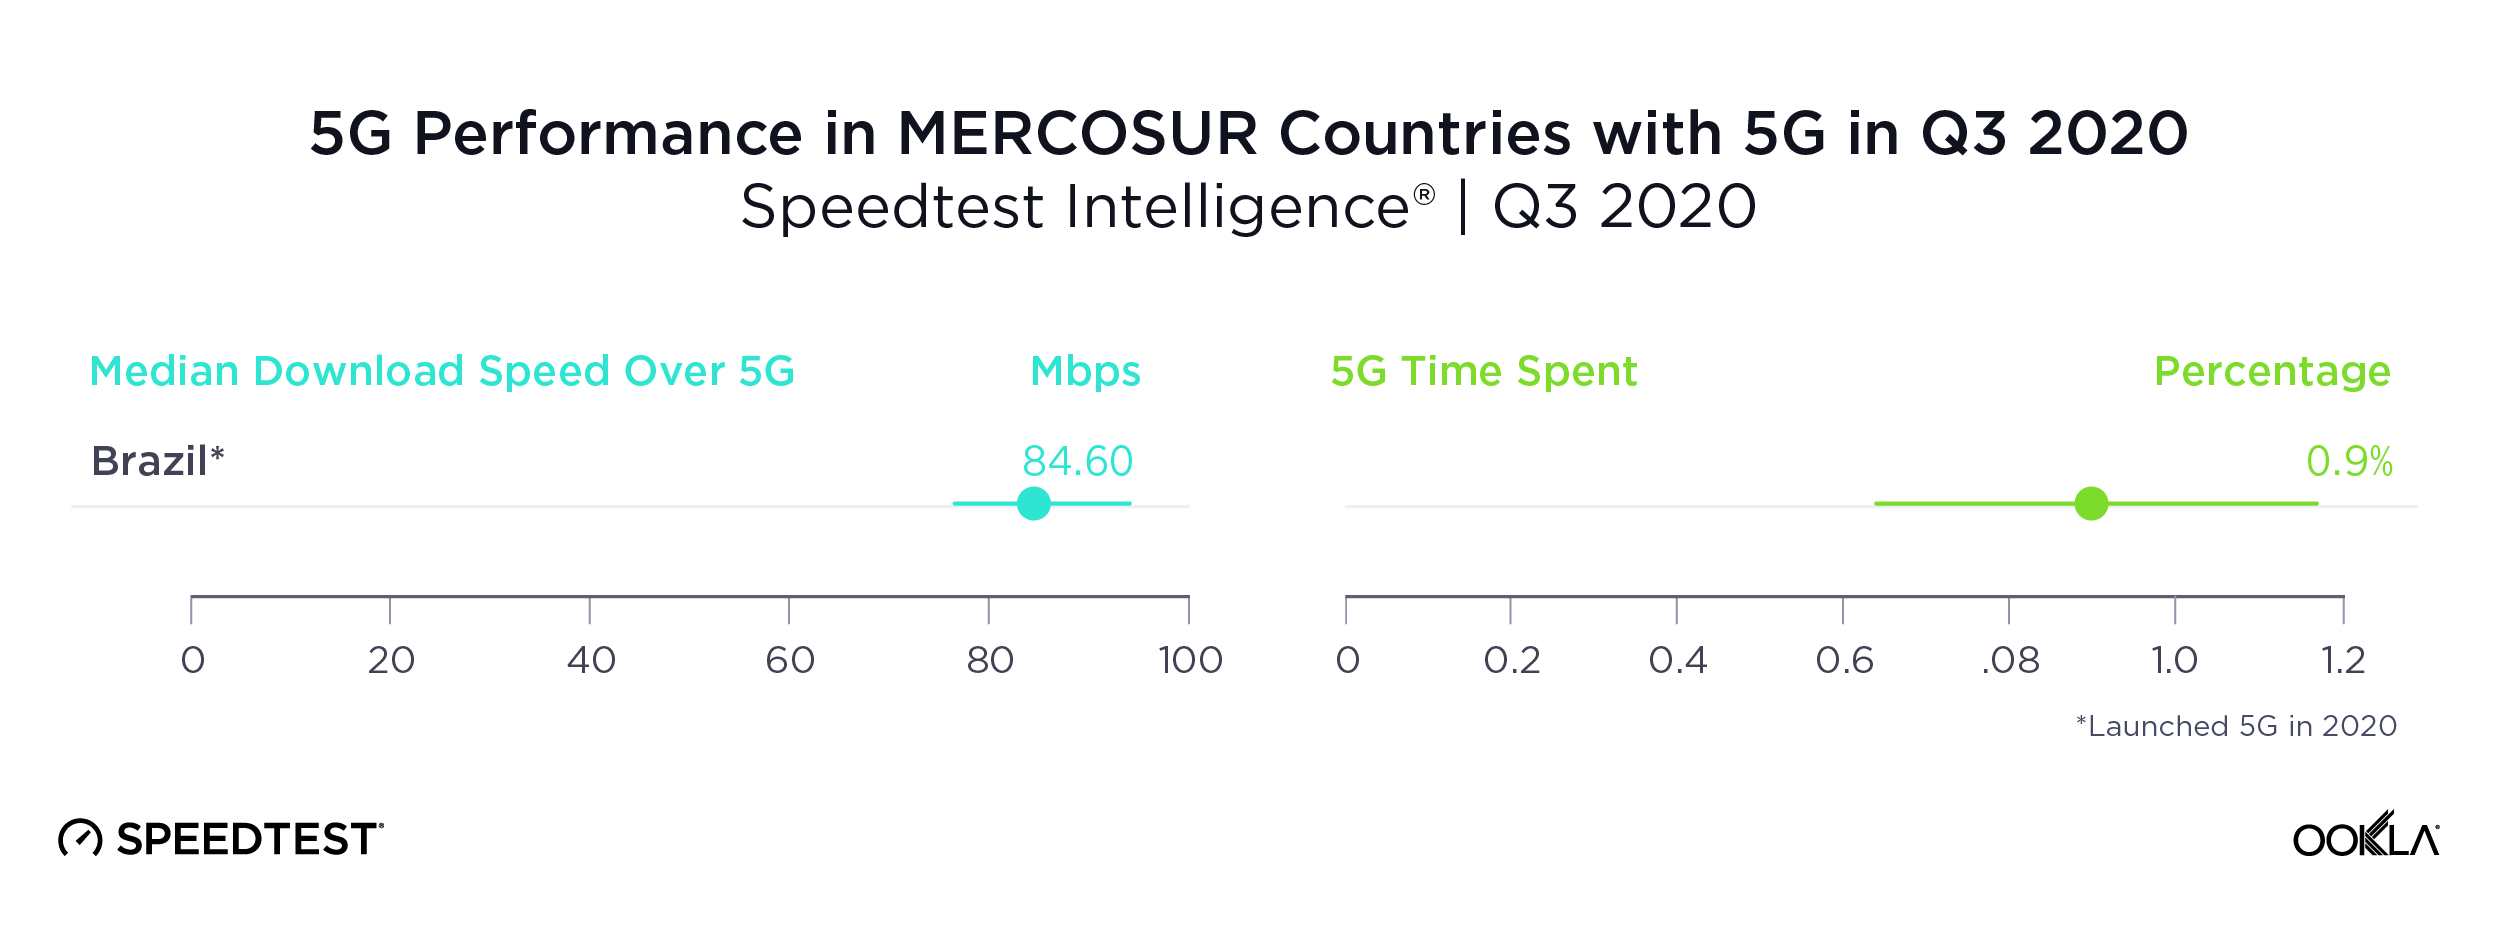
Brazil was the only MERCOSUR country with sufficient 5G to rate

Brazil’s median download speed over 5G of 84.60 Mbps during Q3 2020 may not seem fast for 5G, but it still puts Brazil well ahead of other countries in the Southern Common Market (MERCOSUR), most of which do not yet have 5G at all. We did see 5G results in Colombia, but there were insufficient samples to properly compare.

Time Spent on 5G in Brazil during Q3 2020 was not quite one percent, indicating that customers do not have much access to 5G yet.
5G-Performance-MERCOSUR_1220

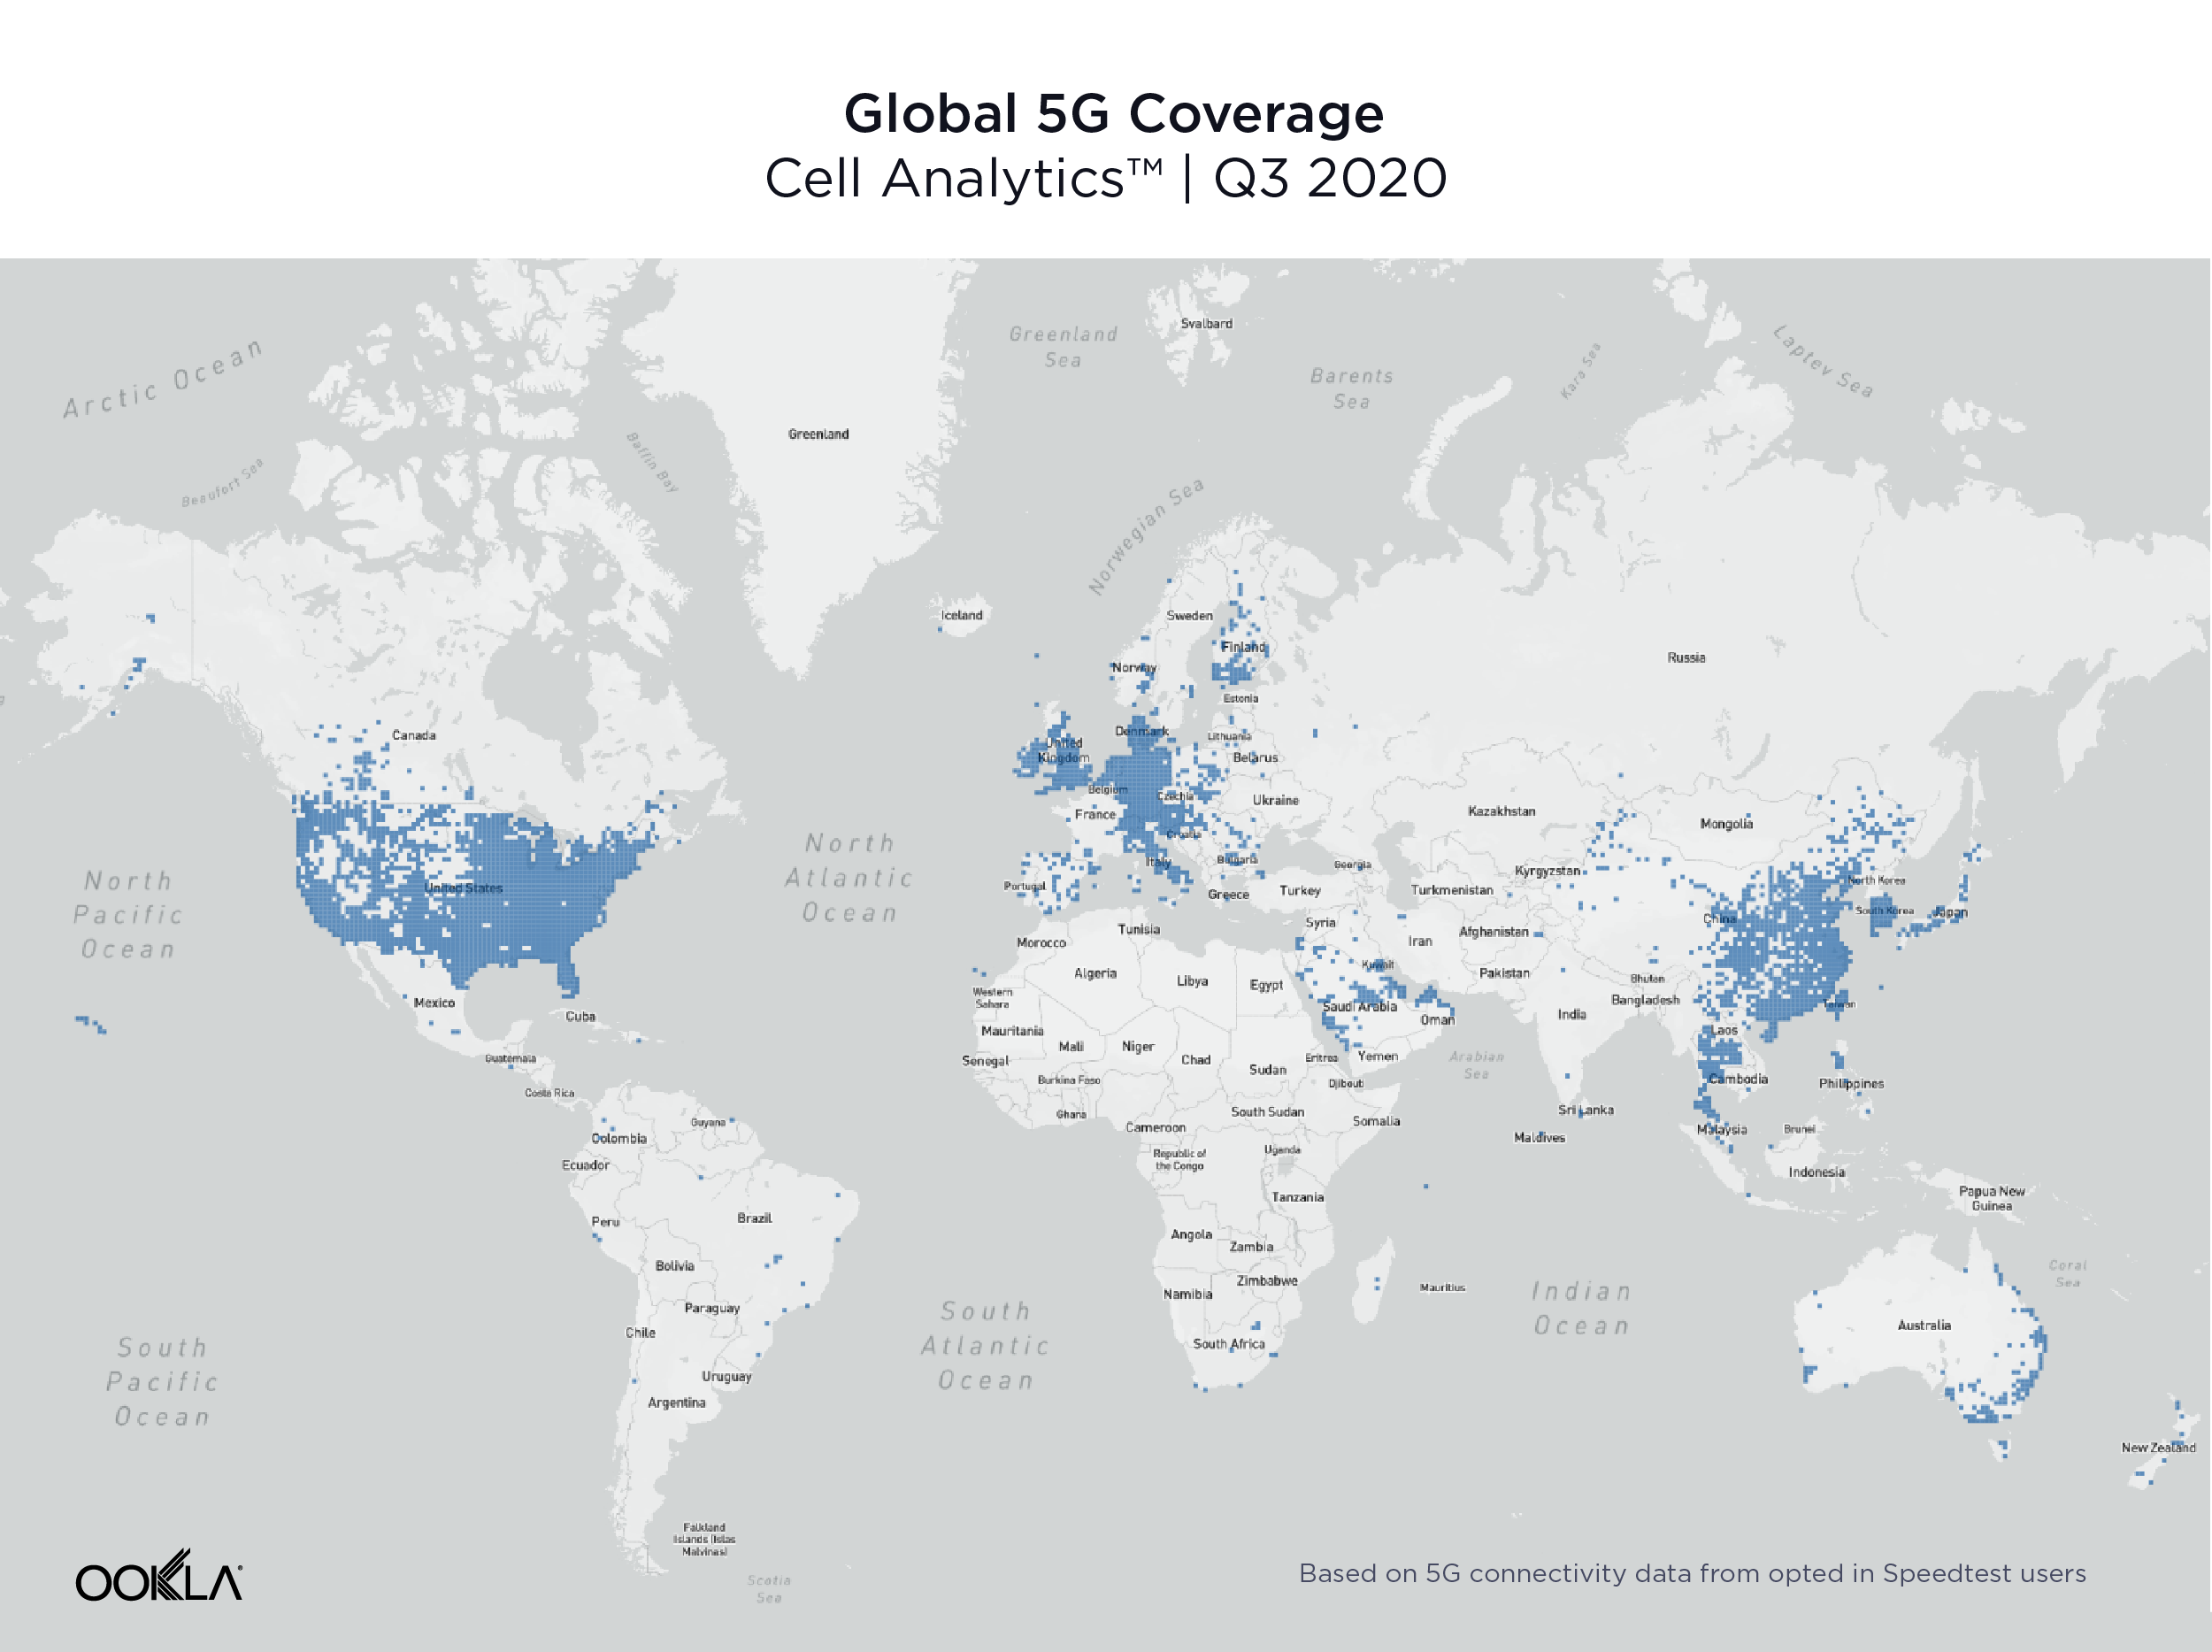
The U.S., Europe and Asia see widespread 5G coverage

Data from Cell Analytics™ shows a global view of 5G coverage in Q3 2020. This map, based on 5G connectivity data for opted-in Speedtest users, shows that 5G is spreading rapidly across the U.S., Europe, the Arabian Peninsula and Asia. In other regions, 5G is primarily available in larger cities, if at all.
Global-5G-Coverage_1220

99 countries worldwide had 5G, in 14,643 total cities

The number of countries with 5G deployments increased 62.3% between Q3 2019 and Q3 2020, with 99 countries having 5G deployments at the end of Q3 2020, according to the Ookla 5G Map™. There were 14,643 cities worldwide with 5G deployments at the end of Q3 2020, a 1,671% increase over Q3 2019. The total number of deployments worldwide was 17,046. The counts here and throughout this section include commercially available 5G as well as 5G networks with limited availability and those in pre-release.

Countries with the Most 5G Cities
Ookla 5G Map™ | Q3 2020
Country Numbers of Cities with 5G
United States 7,583
Germany 2,312
Austria 1,104
Netherlands* 1,009
Switzerland 554
Thailand* 325
Ireland 214
Puerto Rico 187
United Kingdom 169
Kuwait 97

The U.S. had the most cities with 5G deployments at the end of Q3 2020 with 7,583. Germany was second, Austria third, the Netherlands fourth and Switzerland fifth. A deployment is when a provider has some level of 5G presence in a city. A city can have multiple deployments when more than one provider is present.

Countries with the Largest Growth in Number of Deployments
Ookla 5G Map™ | Q3 2020
Country 5G Deployments as of Q3 2020 % Change Q3 2020 vs Q3 2019
Netherlands* 1,071 50,350%
Thailand* 451 32,401%
United States 7,808 21,566%
Germany 2,417 11,460%
Canada* 93 7,600%
Austria 1,173 4,918%
Ireland 236 4,180%
Poland 81 3,150%
Japan* 75 2,050%
Oman 50 2,000%

The Netherlands showed the largest percentage change in the number of 5G deployments between Q3 2019 and Q3 2020 with a 50,350% jump from two deployments in Q3 2019 to 1,071 in Q3 2020. Thailand saw the second largest percentage increase, the U.S. third, Germany fourth and Canada fifth.

Most early trials and commercial deployments of 5G spectrum allocations around the world have been centered around fallow swaths of the mid-band (3.3 GHz – 4.2 GHz) spectrum. With the recent commercialization of Dynamic Spectrum Sharing (DSS) across all major 5G infrastructure vendors, there is now increasing demand for 5G support on many existing 4G frequencies, ranging from 600 MHz to 2.5 GHz. In unique 5G markets like Japan, there is an additional need for the 4.5 GHz band as well as the millimeter wave (FR2).

In the United States, early deployments leveraged millimeter wave frequency bands in the 28 GHz and the 39 GHz, which delivered impressive speeds in a very constrained footprint. The rapid 5G deployment in the 600 MHz band has added a substantial nationwide 5G footprint — and with that, much wider 5G availability for many more Americans. With the recent merger between T-Mobile and Sprint, the deployment of 2.5 GHz spectrum has been significantly accelerated, which should improve both network efficiency and user experience on T-Mobile’s network. Additionally, next year’s availability of 5G Carrier Aggregation will allow T-Mobile to combine 600 MHz with 2.5 GHz to deliver improved 5G speeds on top of the existing nationwide footprint. In addition, DSS has recently been deployed by AT&T and Verizon, which allows operators to choose from existing low-band spectrum assets (850 MHz) and deliver both LTE and 5G at the same time. This feature alone doesn’t add a significant boost in perceived user experience, but will certainly improve the 5G footprint.

China showed the highest percentage of 5G test samples

Another way to measure 5G adoption is to look at the proportion of samples taken over 5G relative to the total number of samples on all technologies. Speedtest Intelligence is uniquely positioned to measure global growth in 5G because of the worldwide adoption of Speedtest apps. China had the highest percentage of 5G Speedtest results compared to other mobile technology types in Q3 2020 at 18.9%. South Korea was second, Hong Kong third, Puerto Rico fourth and Qatar fifth.

Countries with the Most 5G
Speedtest Intelligence® | Q3 2020
Country 5G Samples as a % of Total
China 18.9%
South Korea 15.8%
Hong Kong (S.A.R.)* 7.9%
Puerto Rico 6.7%
Qatar 5.7%
United States 5.5%
Netherlands* 4.9%
United Arab Emirates 4.6%
Kuwait 4.6%
Australia 4.2%

What 5G will look like in 2021

With recently announced device chipset advancements expected in 2021, including 5G Carrier Aggregation, operators will be able to combine two 5G frequency bands in the sub-6GHz (FR1) range, allowing not only faster speeds, but also greater coverage. More importantly, the ability to combine Frequency Division Duplexing (FDD) and Time Division Duplexing (TDD) FR1 channels will enable operators to leverage low-band frequencies (sub-1GHz) for uplink transmissions (user device to cell site), while combining the low-band with the mid-band (2.5 GHz, 3.5 GHz) on the downlink. This should significantly expand the availability of fast 5G download speeds across larger geographies.

Similarly, DSS — which is a stepping stone to standalone 5G and allows for the simultaneous delivery of 4G and 5G technology on the same spectrum slice — will enable operators to combine already-deployed FDD spectrum with dedicated mid-band spectrum for an enhanced standalone 5G experience. This will unlock the full potential of 5G networks, such as ultra low latency and network slicing, while delivering an improved mobile experience to users.

Where 5G fails to reach

During Q3 2020 Speedtest Intelligence showed 55 countries in the world (with more than 200 samples) where more than 20% of samples were from 2G and 3G connections (combined). These are countries where, in many cases, 5G is still aspirational. As excited as we are about the expansion of 5G, we do not want to see these countries left behind.

Countries That Still Rely Heavily on 2G and 3G Connections
Speedtest Intelligence® | Q3 2020
Country 2G & 3G Samples 4G Samples
Turkmenistan 74.9% 25.1%
Rwanda 52.3% 47.7%
Iraq 49.4% 50.6%
Belarus 46.5% 53.5%
Afghanistan 46.0% 54.0%
Antigua and Barbuda 40.2% 59.8%
Tajikistan 40.2% 59.8%
Suriname 39.7% 60.3%
Haiti 37.7% 62.3%
Syria 37.5% 62.5%
Ghana 36.0% 64.0%
Ethiopia 35.0% 65.0%
Mozambique 34.7% 65.3%
Benin 34.3% 65.7%
Angola 34.1% 65.9%
El Salvador 32.5% 67.5%
Moldova 31.8% 68.2%
Venezuela 30.3% 69.7%
Tanzania 30.0% 70.0%
Papua New Guinea 29.5% 70.5%
Jamaica 29.4% 70.6%
Sudan 29.2% 70.8%
Algeria 29.0% 71.0%
Namibia 28.5% 71.5%
Zimbabwe 28.5% 71.5%
Somalia 28.4% 71.6%
Nicaragua 28.1% 71.9%
Armenia 28.1% 71.9%
Bosnia and Herzegovina 28.1% 71.9%
Uzbekistan 27.8% 72.2%
Cameroon 27.5% 72.5%
Zambia 27.4% 72.6%
Uganda 26.6% 73.4%
Trinidad and Tobago 26.6% 73.4%
Honduras 26.5% 73.5%
Bangladesh 26.3% 73.7%
Burkina Faso 26.0% 74.0%
Ukraine 25.8% 74.2%
Nigeria 25.7% 74.3%
DR Congo 24.6% 75.4%
Costa Rica 24.3% 75.7%
Botswana 24.1% 75.9%
Libya 22.9% 77.1%
Azerbaijan 22.9% 77.1%
Ecuador 22.8% 77.2%
Mali 22.4% 77.6%
Mongolia 21.8% 78.2%
Maldives 21.6% 78.4%
Mauritius 21.3% 78.7%
Tunisia 21.0% 79.0%
Belize 20.7% 79.3%
Laos 20.5% 79.5%
Kenya 20.3% 79.7%
Paraguay 20.1% 79.9%
Côte d’Ivoire 20.0% 80.0%

In markets where 4G layers haven’t been deployed or substantially covered, end users fall back to the circuit-switched network (2G, 3G). These decades-old network technologies should be sufficient for basic voice and texting, social media, and navigation apps, but cannot deliver rich media experiences or video calling. Unfortunately, many countries on this list are places where consumers rely primarily on mobile phones for their internet connectivity.

5G is radically changing the speeds and capabilities of mobile networks around the world. If the current growth rate continues, it won’t be long before most nations have access to 5G. But there are nations and subsets of subscribers who may not see the benefits of 5G for years to come. We will continue reporting on 5G achievements across the globe and watching speeds in general on the Speedtest Global Index™.

Ookla retains ownership of this article including all of the intellectual property rights, data, content graphs and analysis. This article may not be quoted, reproduced, distributed or published for any commercial purpose without prior consent. Members of the press and others using the findings in this article for non-commercial purposes are welcome to publicly share and link to report information with attribution to Ookla.

| September 17, 2019

What Happens to the Internet When Mobile Providers Go Down

You may have experienced the panic that happens when you realize you can’t get a connection on your phone. Most of us in these moments will try several ways of getting online before rushing to Downdetector® to see if our mobile operator is out of service or if it’s just us. Having access to data from both Downdetector and Speedtest® gives us unique insight into how network outages impact the internet as a whole, and in this article we’re exploring that impact in several key markets around the world.

The outages we explored

We looked specifically for recent outages that affected mobile networks in a variety of countries around the globe. The outages we explored were in Brazil (Vivo — 12,994 reports on August 22), Canada (Rogers and Freedom Mobile — 35,685 reports July 7-8), Italy (Iliad — 3,018 reports on June 21), India (Vodafone-Idea — 1,386 reports on July 17), the Netherlands (KPN Mobile, T-Mobile and Vodafone — 92,391 reports on June 24), Sweden (Tele2 — 7,275 reports June 17-19) and the United States (T-Mobile — 95,267 reports on September 6).

Working hypotheses

We had three hypotheses when we set out to do this analysis based on what we would expect to happen in a prolonged, near-total mobile outage:

  1. Mobile speeds would increase during an outage (for those who could connect) because there would be significantly less network congestion.
  2. Fixed broadband speeds would not change during an outage.
  3. The number of mobile Speedtest results would increase on the day of the outage as users tried to troubleshoot their connections.
  4. The number of fixed broadband Speedtest results would also increase on the day of the outage as people switched from mobile to fixed broadband to try and connect.

As with any real-world experiment there are many variables that can affect the results but for which we cannot control. Each of these outages varied in duration, cause and totality — factors which affect potential outcomes.

Mobile Outages Affect Download Speed in Different Ways

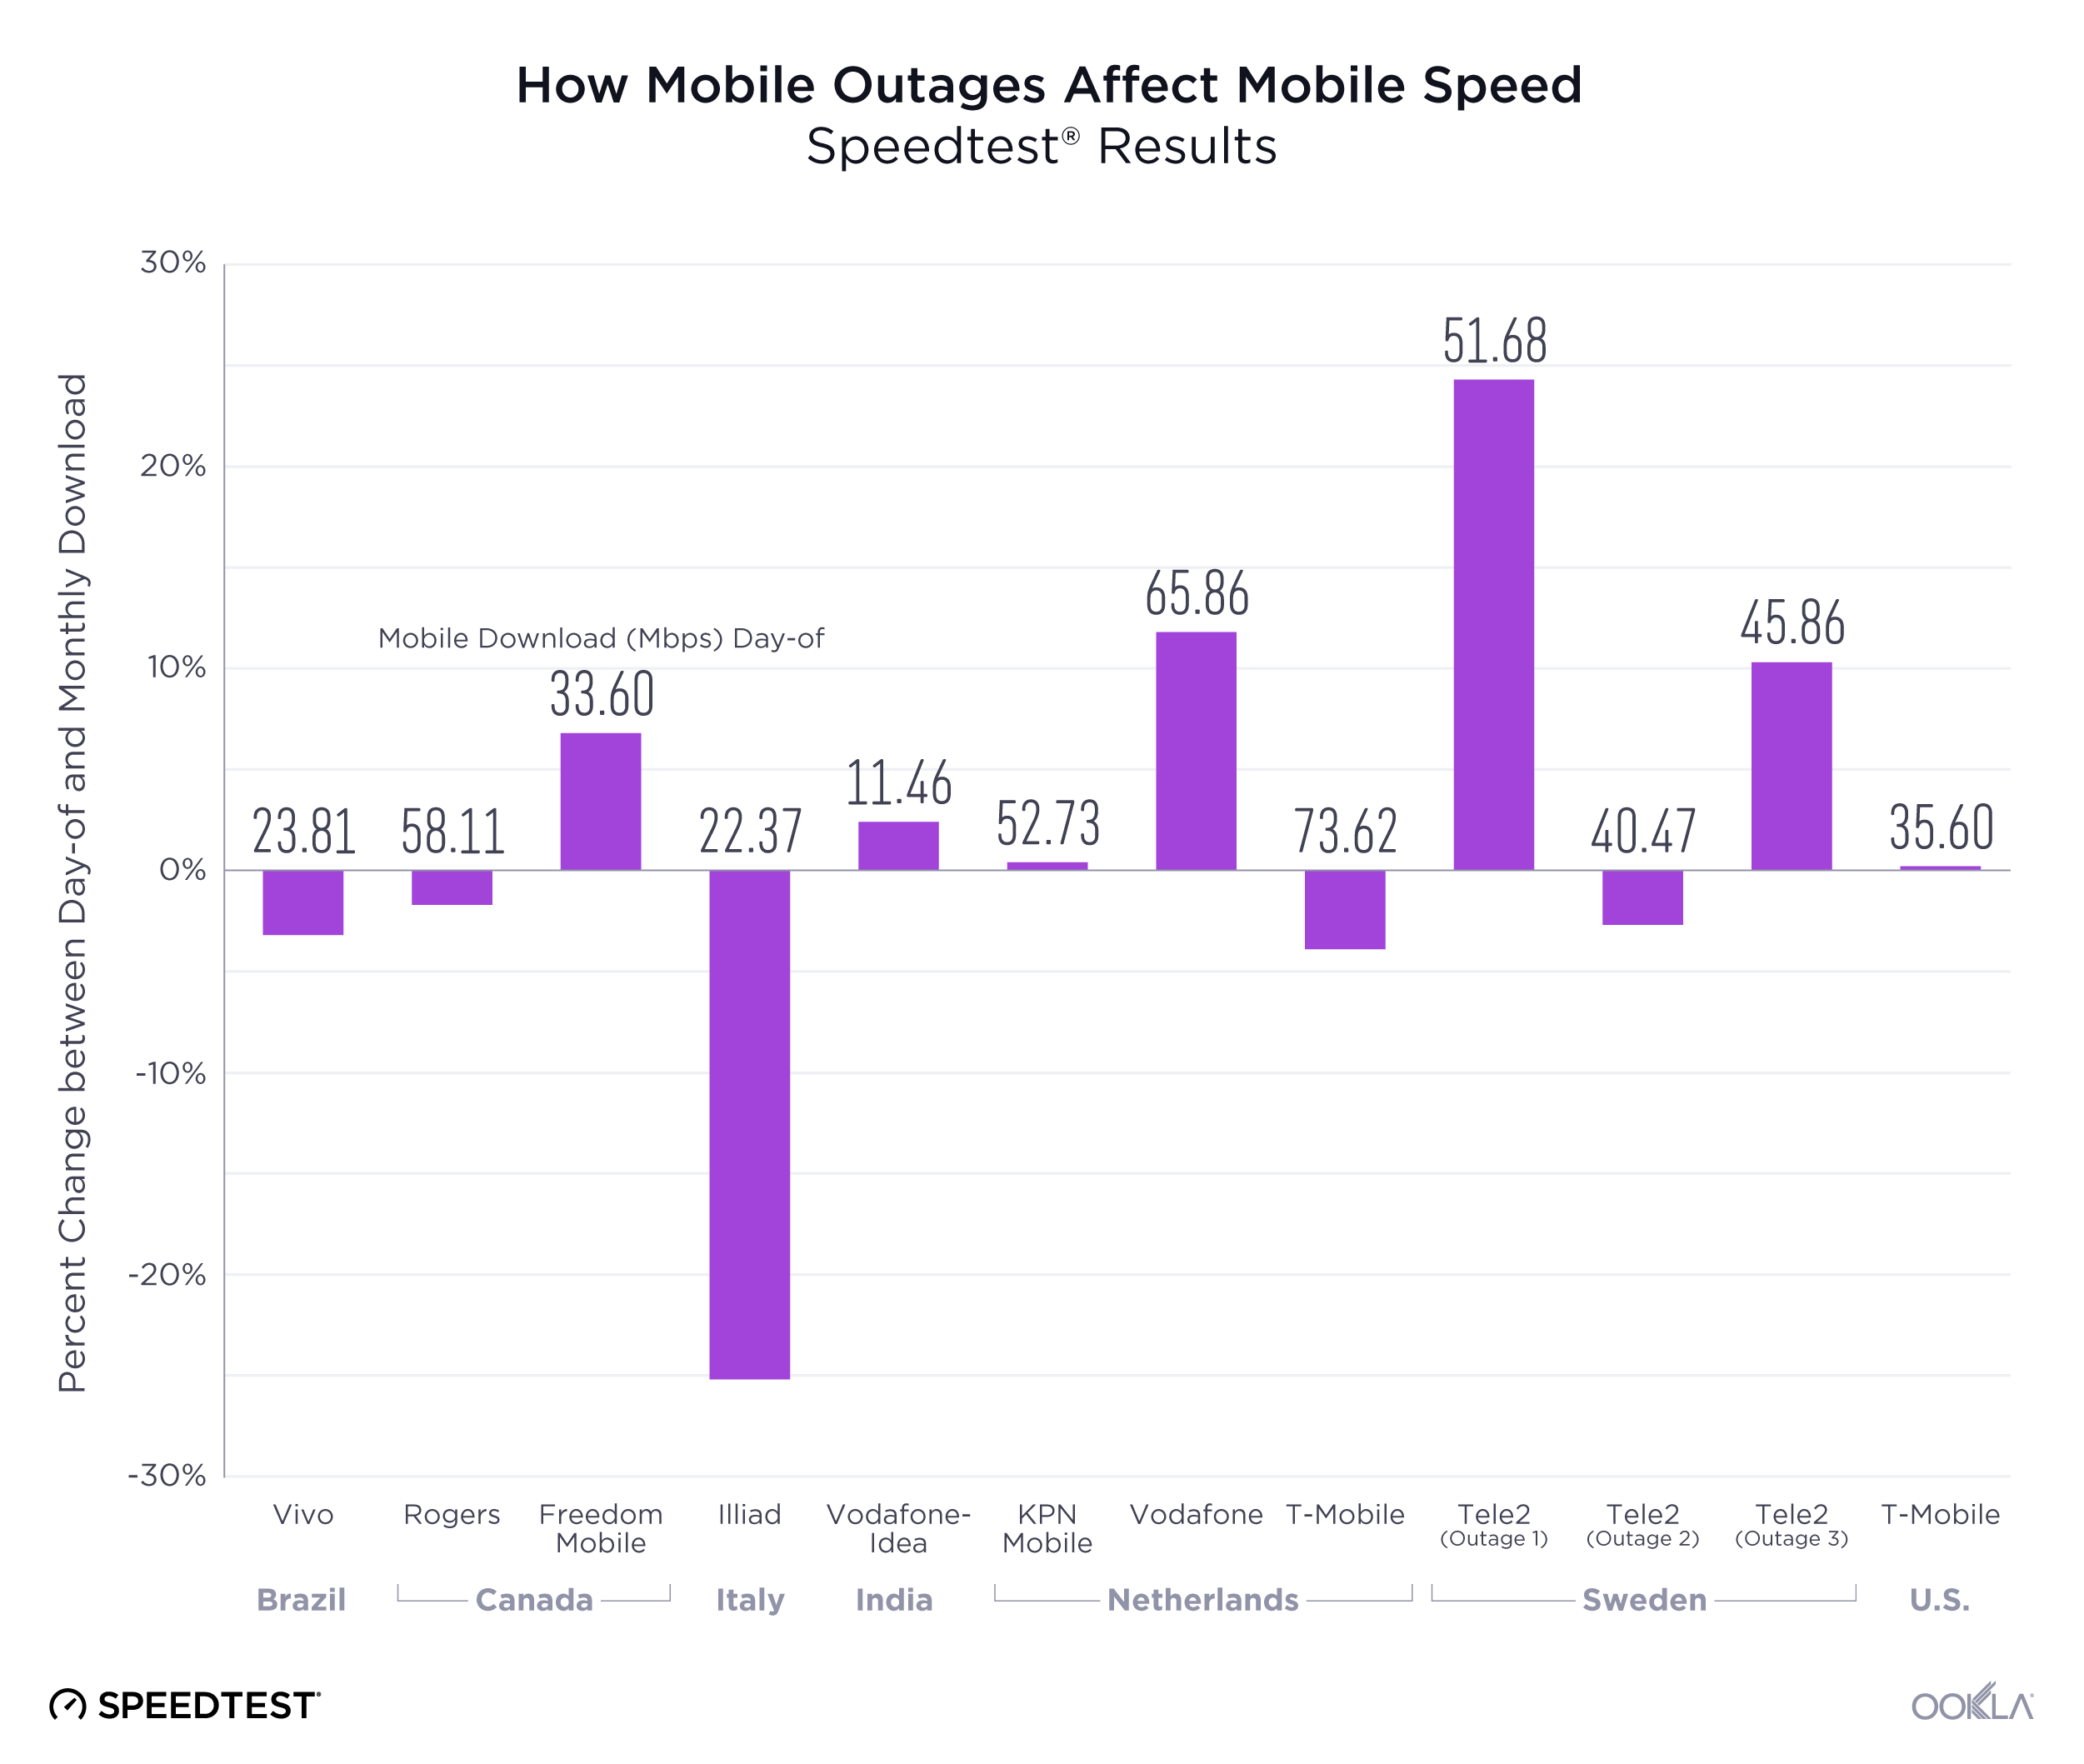
We compared each operator’s mean download speed over mobile on the day of the outage with their mean speed during that month to see if our hypothesis held. Results were mixed.

How Mobile Outages Affect Mobile Speed

In India and the U.S., mobile download speeds did increase very slightly for each provider on the day of the outage when compared with the monthly average. Both of these outages were localized within the country with the Indian outage centering around Ahmedabad and the U.S. outage falling on the East Coast.

On the other hand, mobile download speeds in Brazil and Italy were lower on the day of the outage than the monthly average. Significantly so in Italy. In both of these instances the mobile operator was experiencing a geographically widespread outage.

The outage in Canada revealed two different stories as download speed decreased slightly during the outage for Rogers customers and increased for customers of Freedom Mobile. Results were also mixed in the Netherlands with Vodafone customers seeing a significantly higher download speed, KPN Mobile customers seeing a slightly higher speed and T-Mobile customers seeing a decrease in download speed.

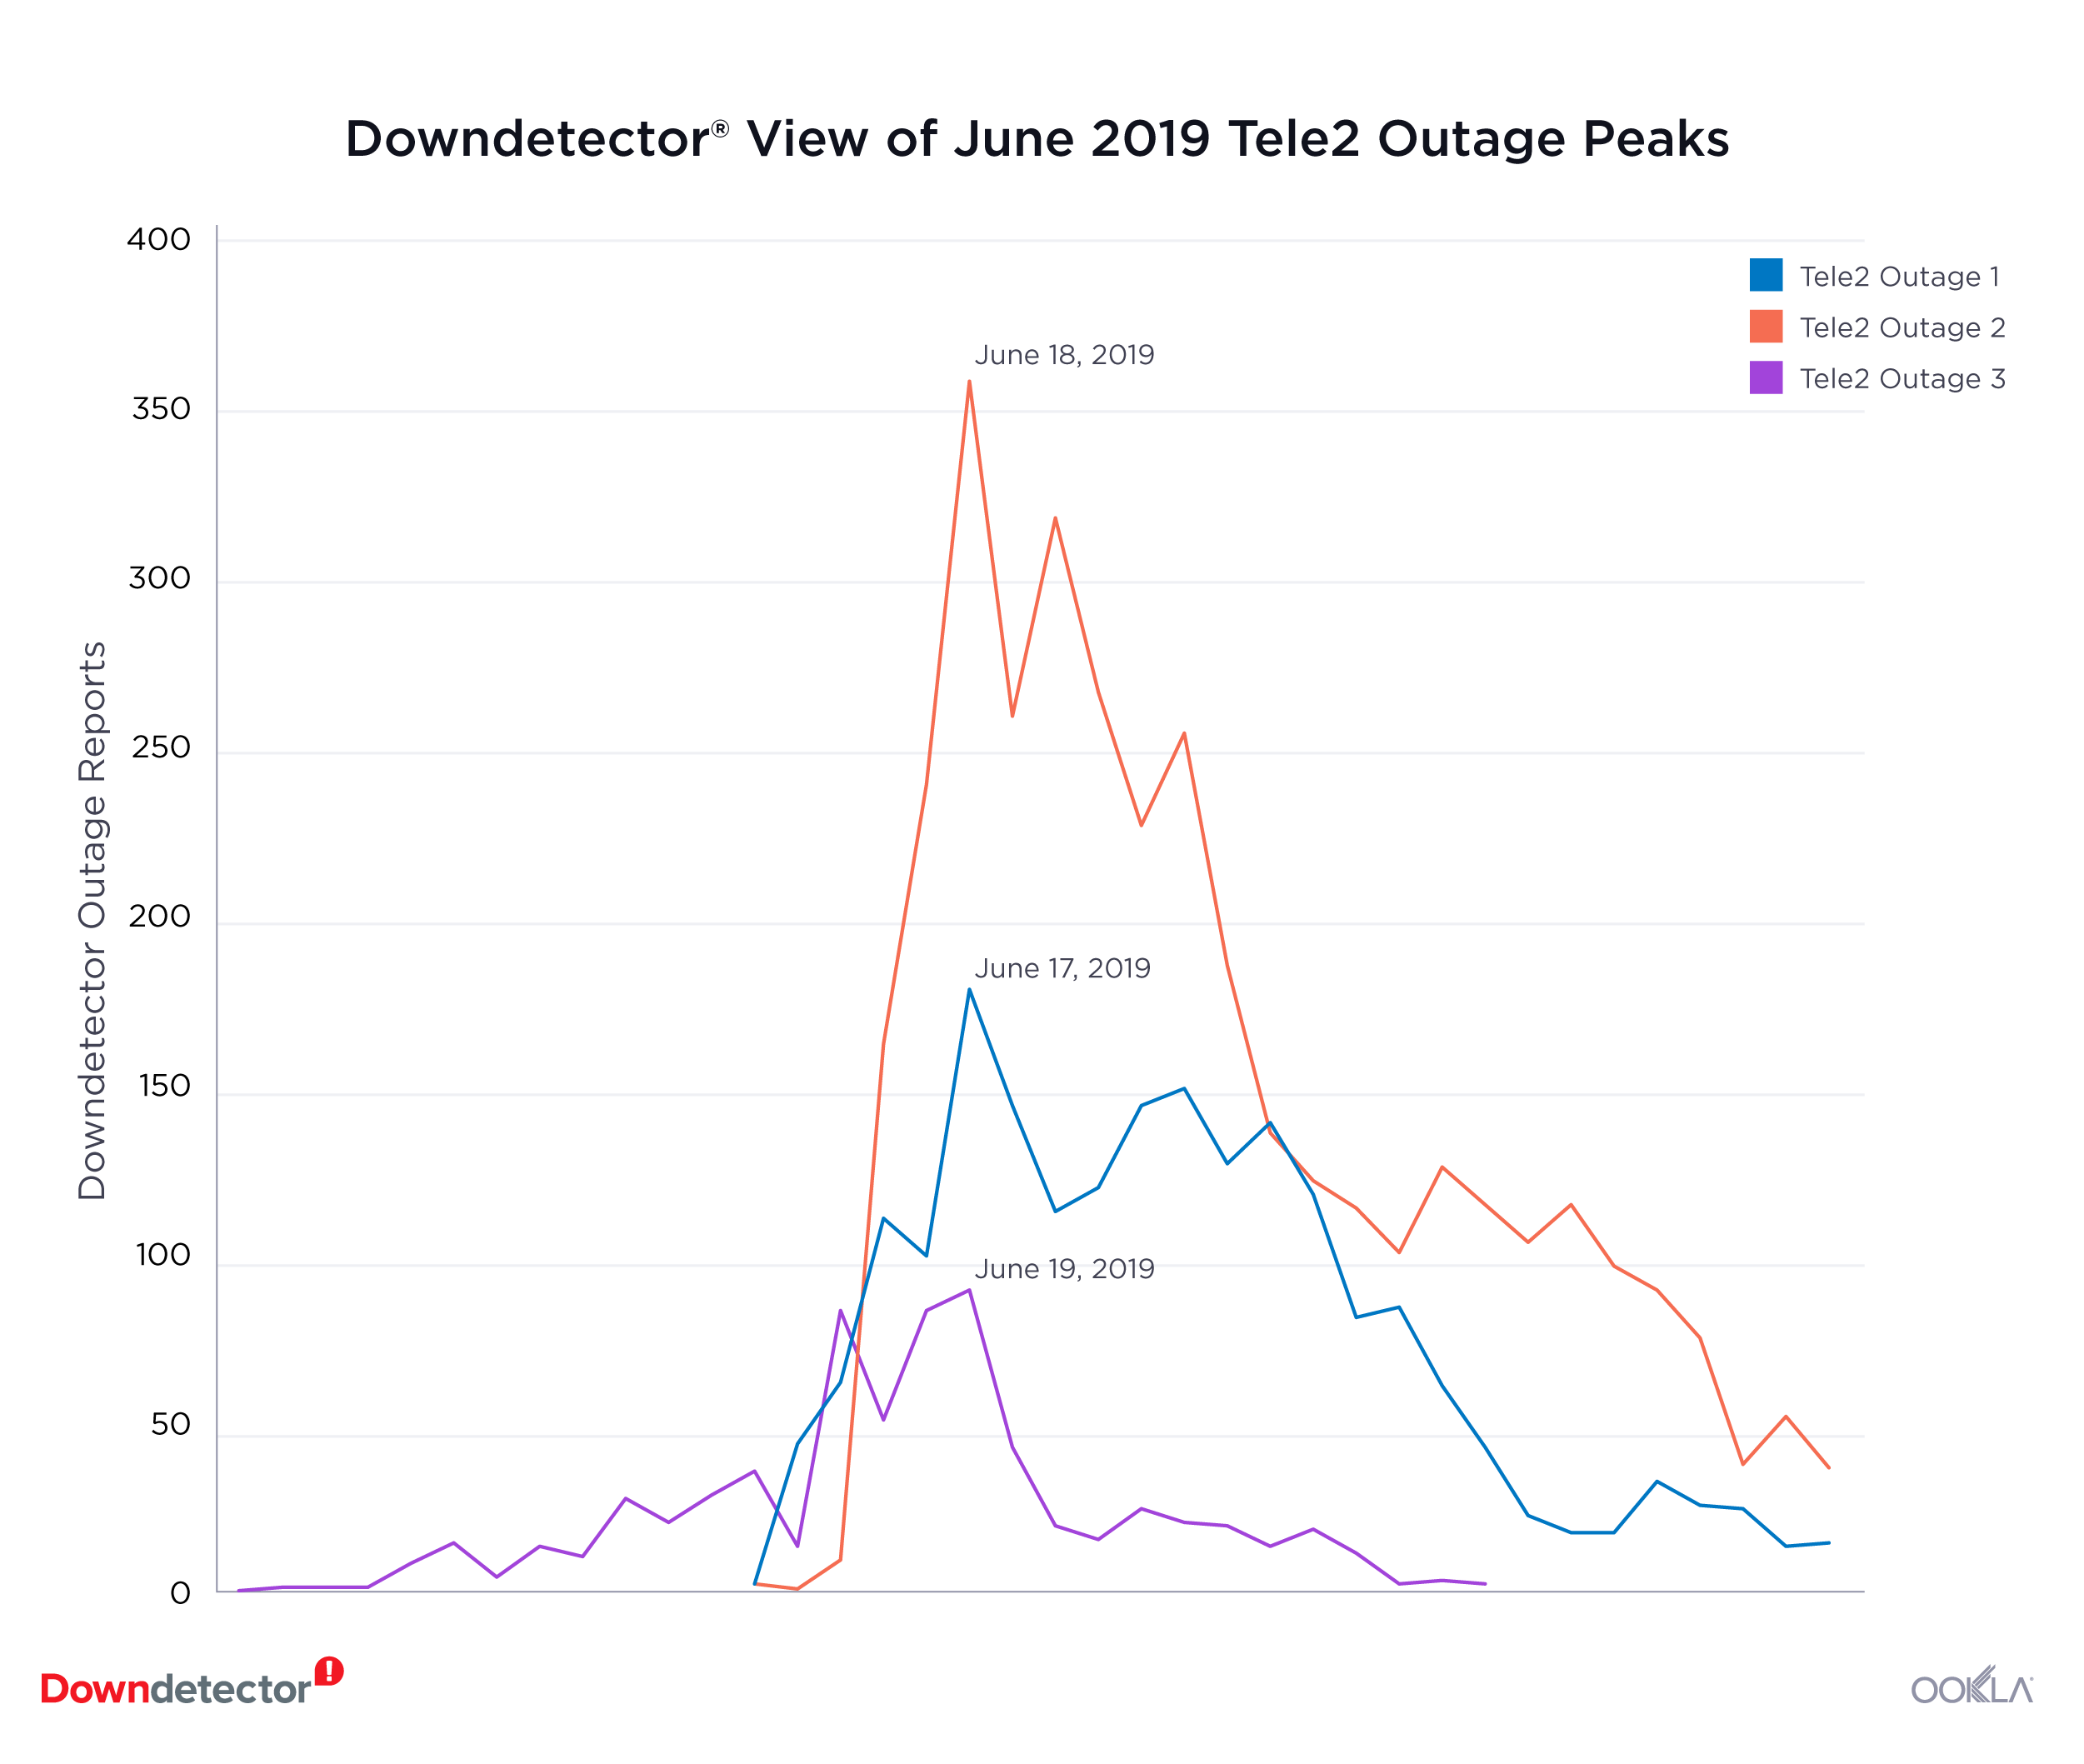
The outage in Sweden occurred in three waves over three separate days:

Downdetector view of June 2019 Tele2 Outage Peaks

We looked at each separately and found that mobile download speed on Tele2 increased during the smaller first and last waves. Meanwhile, mean download speed decreased during the largest middle outage.

Fixed broadband speeds show only slight variations

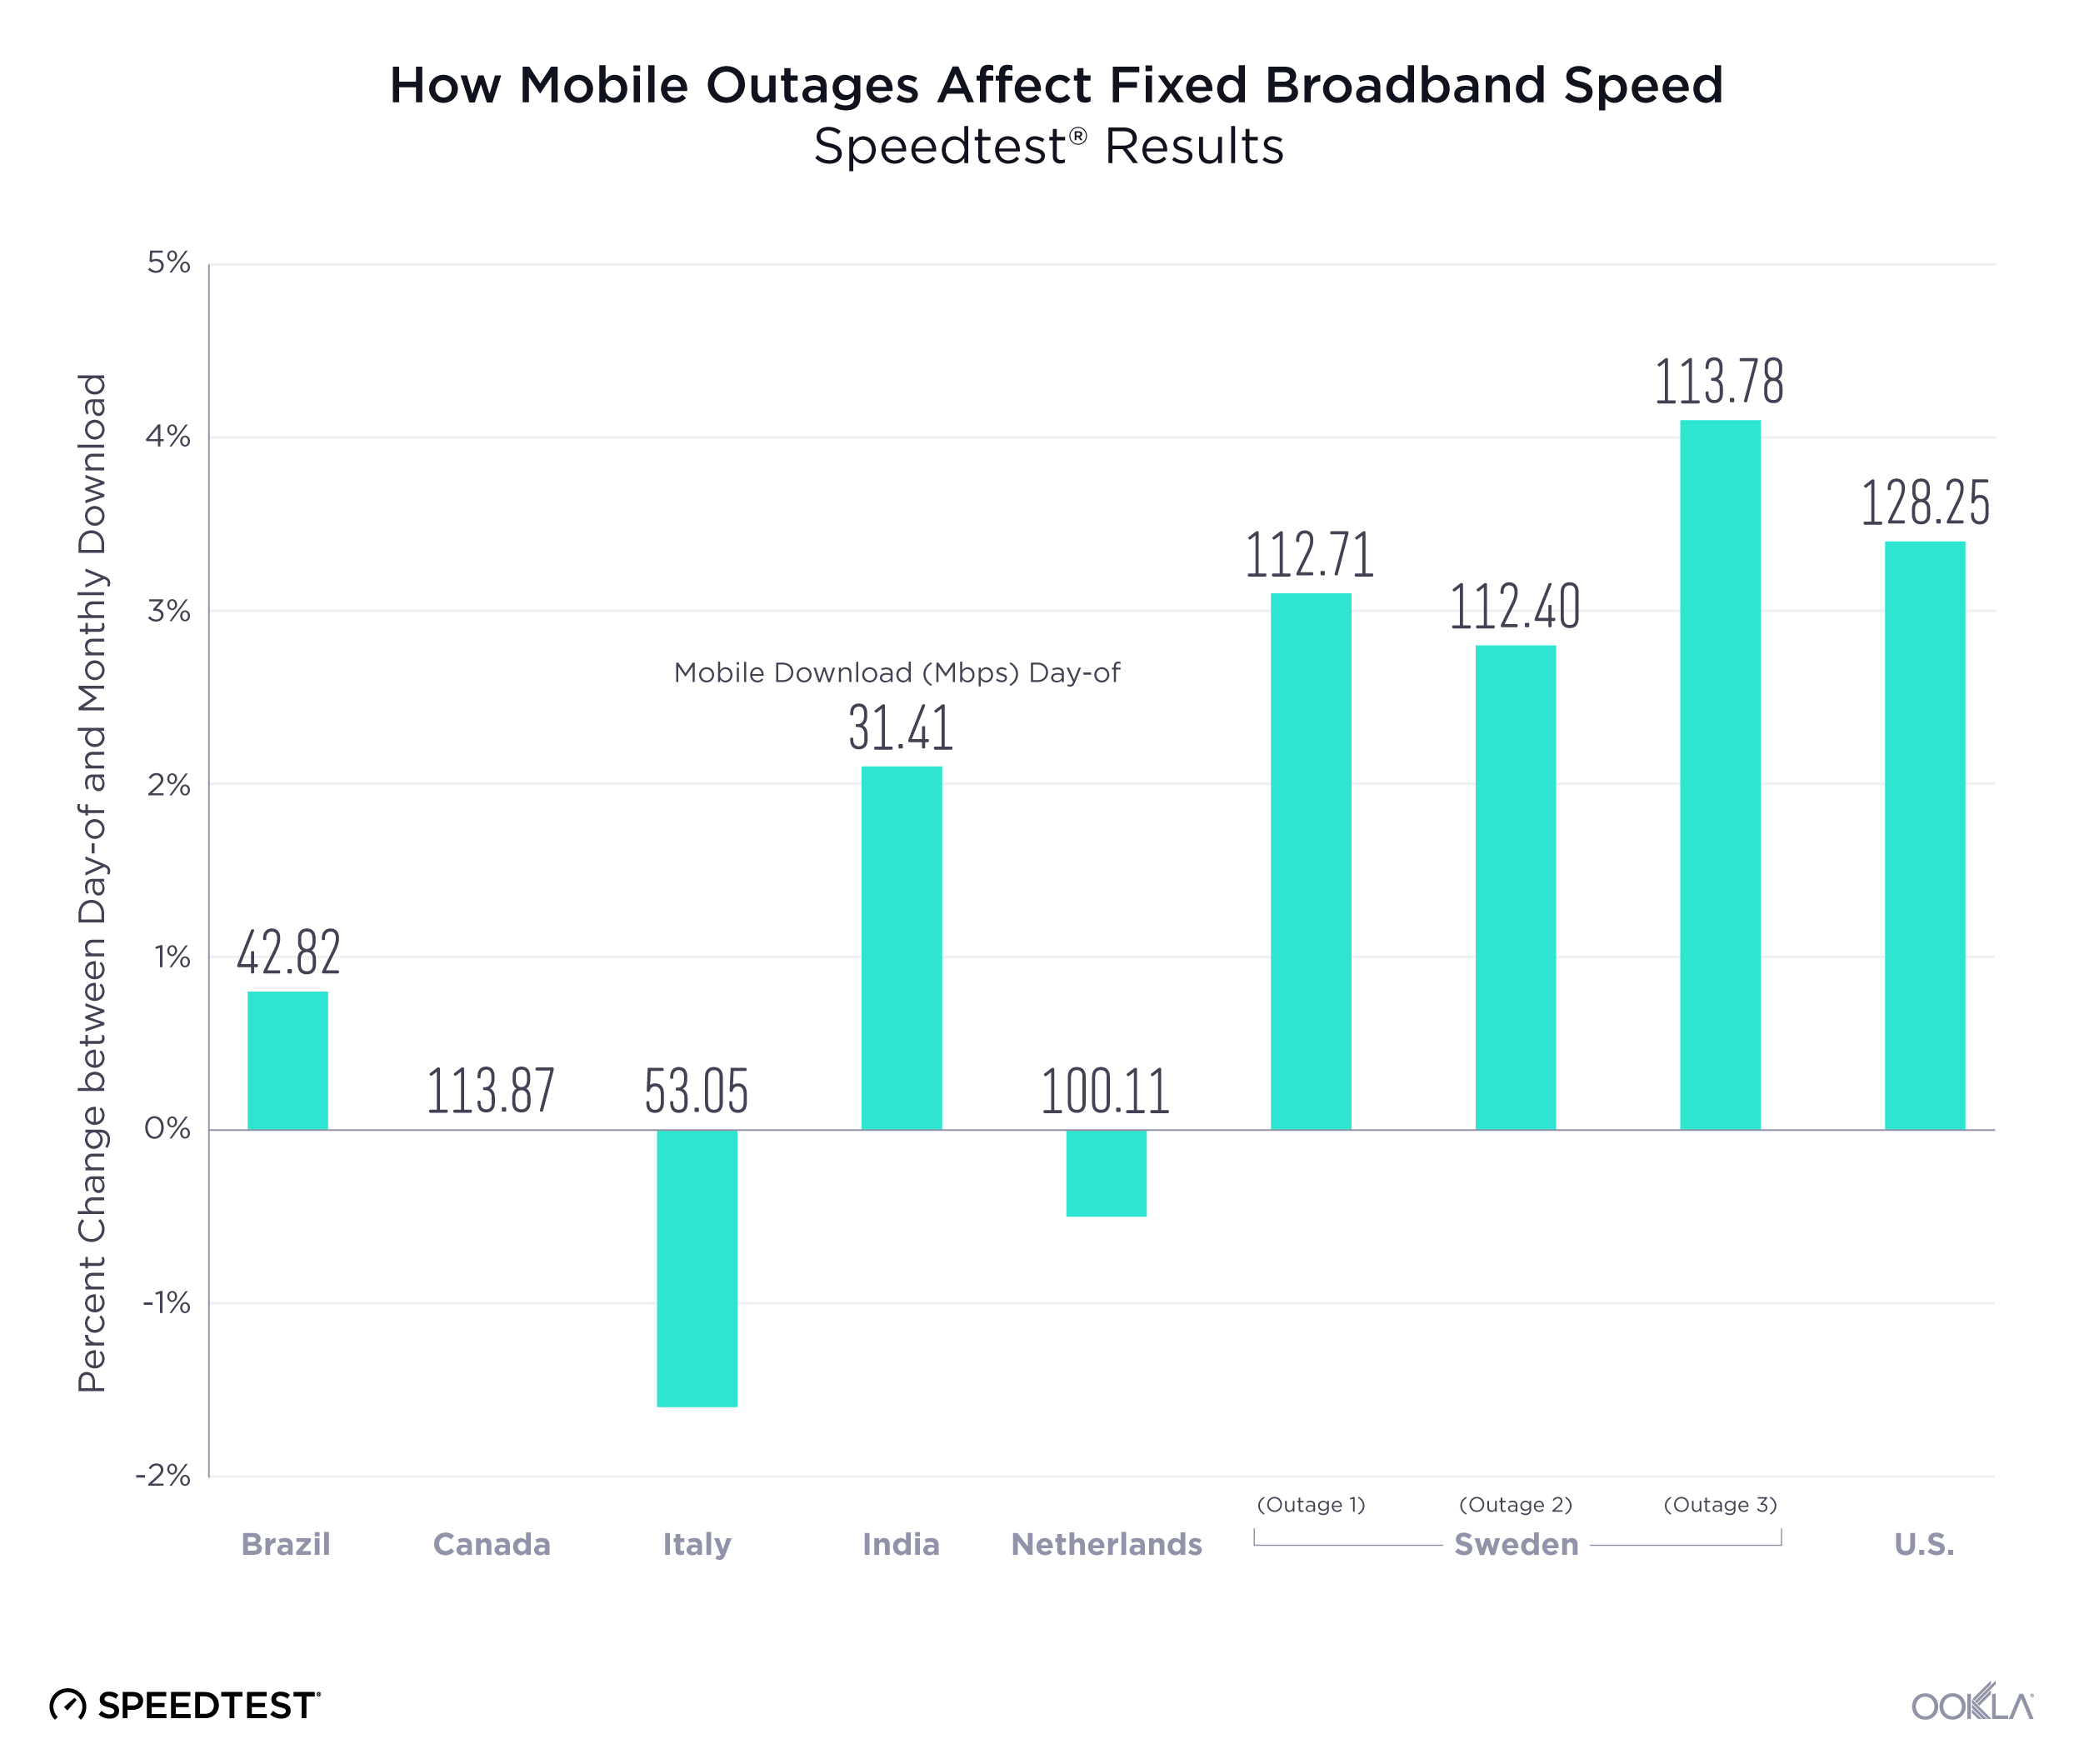
We measured download speed over fixed broadband at the country level both on the day(s) of the outages and compared that number with the average download speed for the appropriate month.

How Mobile Outages Affect Fixed Broadband Speed

Our hypothesis about fixed speeds not changing during mobile outages proved mostly true. Although download speed over fixed broadband did decrease in Italy and the Netherlands during their country-wide outages, the decrease was very small. In Canada there was virtually no difference in speed between the day of the outage and the monthly average.

Download speed over fixed broadband was faster during the outages in all other countries we examined. However, the differences were not large enough to rule out day-to-day fluctuations in speed.

Speedtest results usually increase during outages

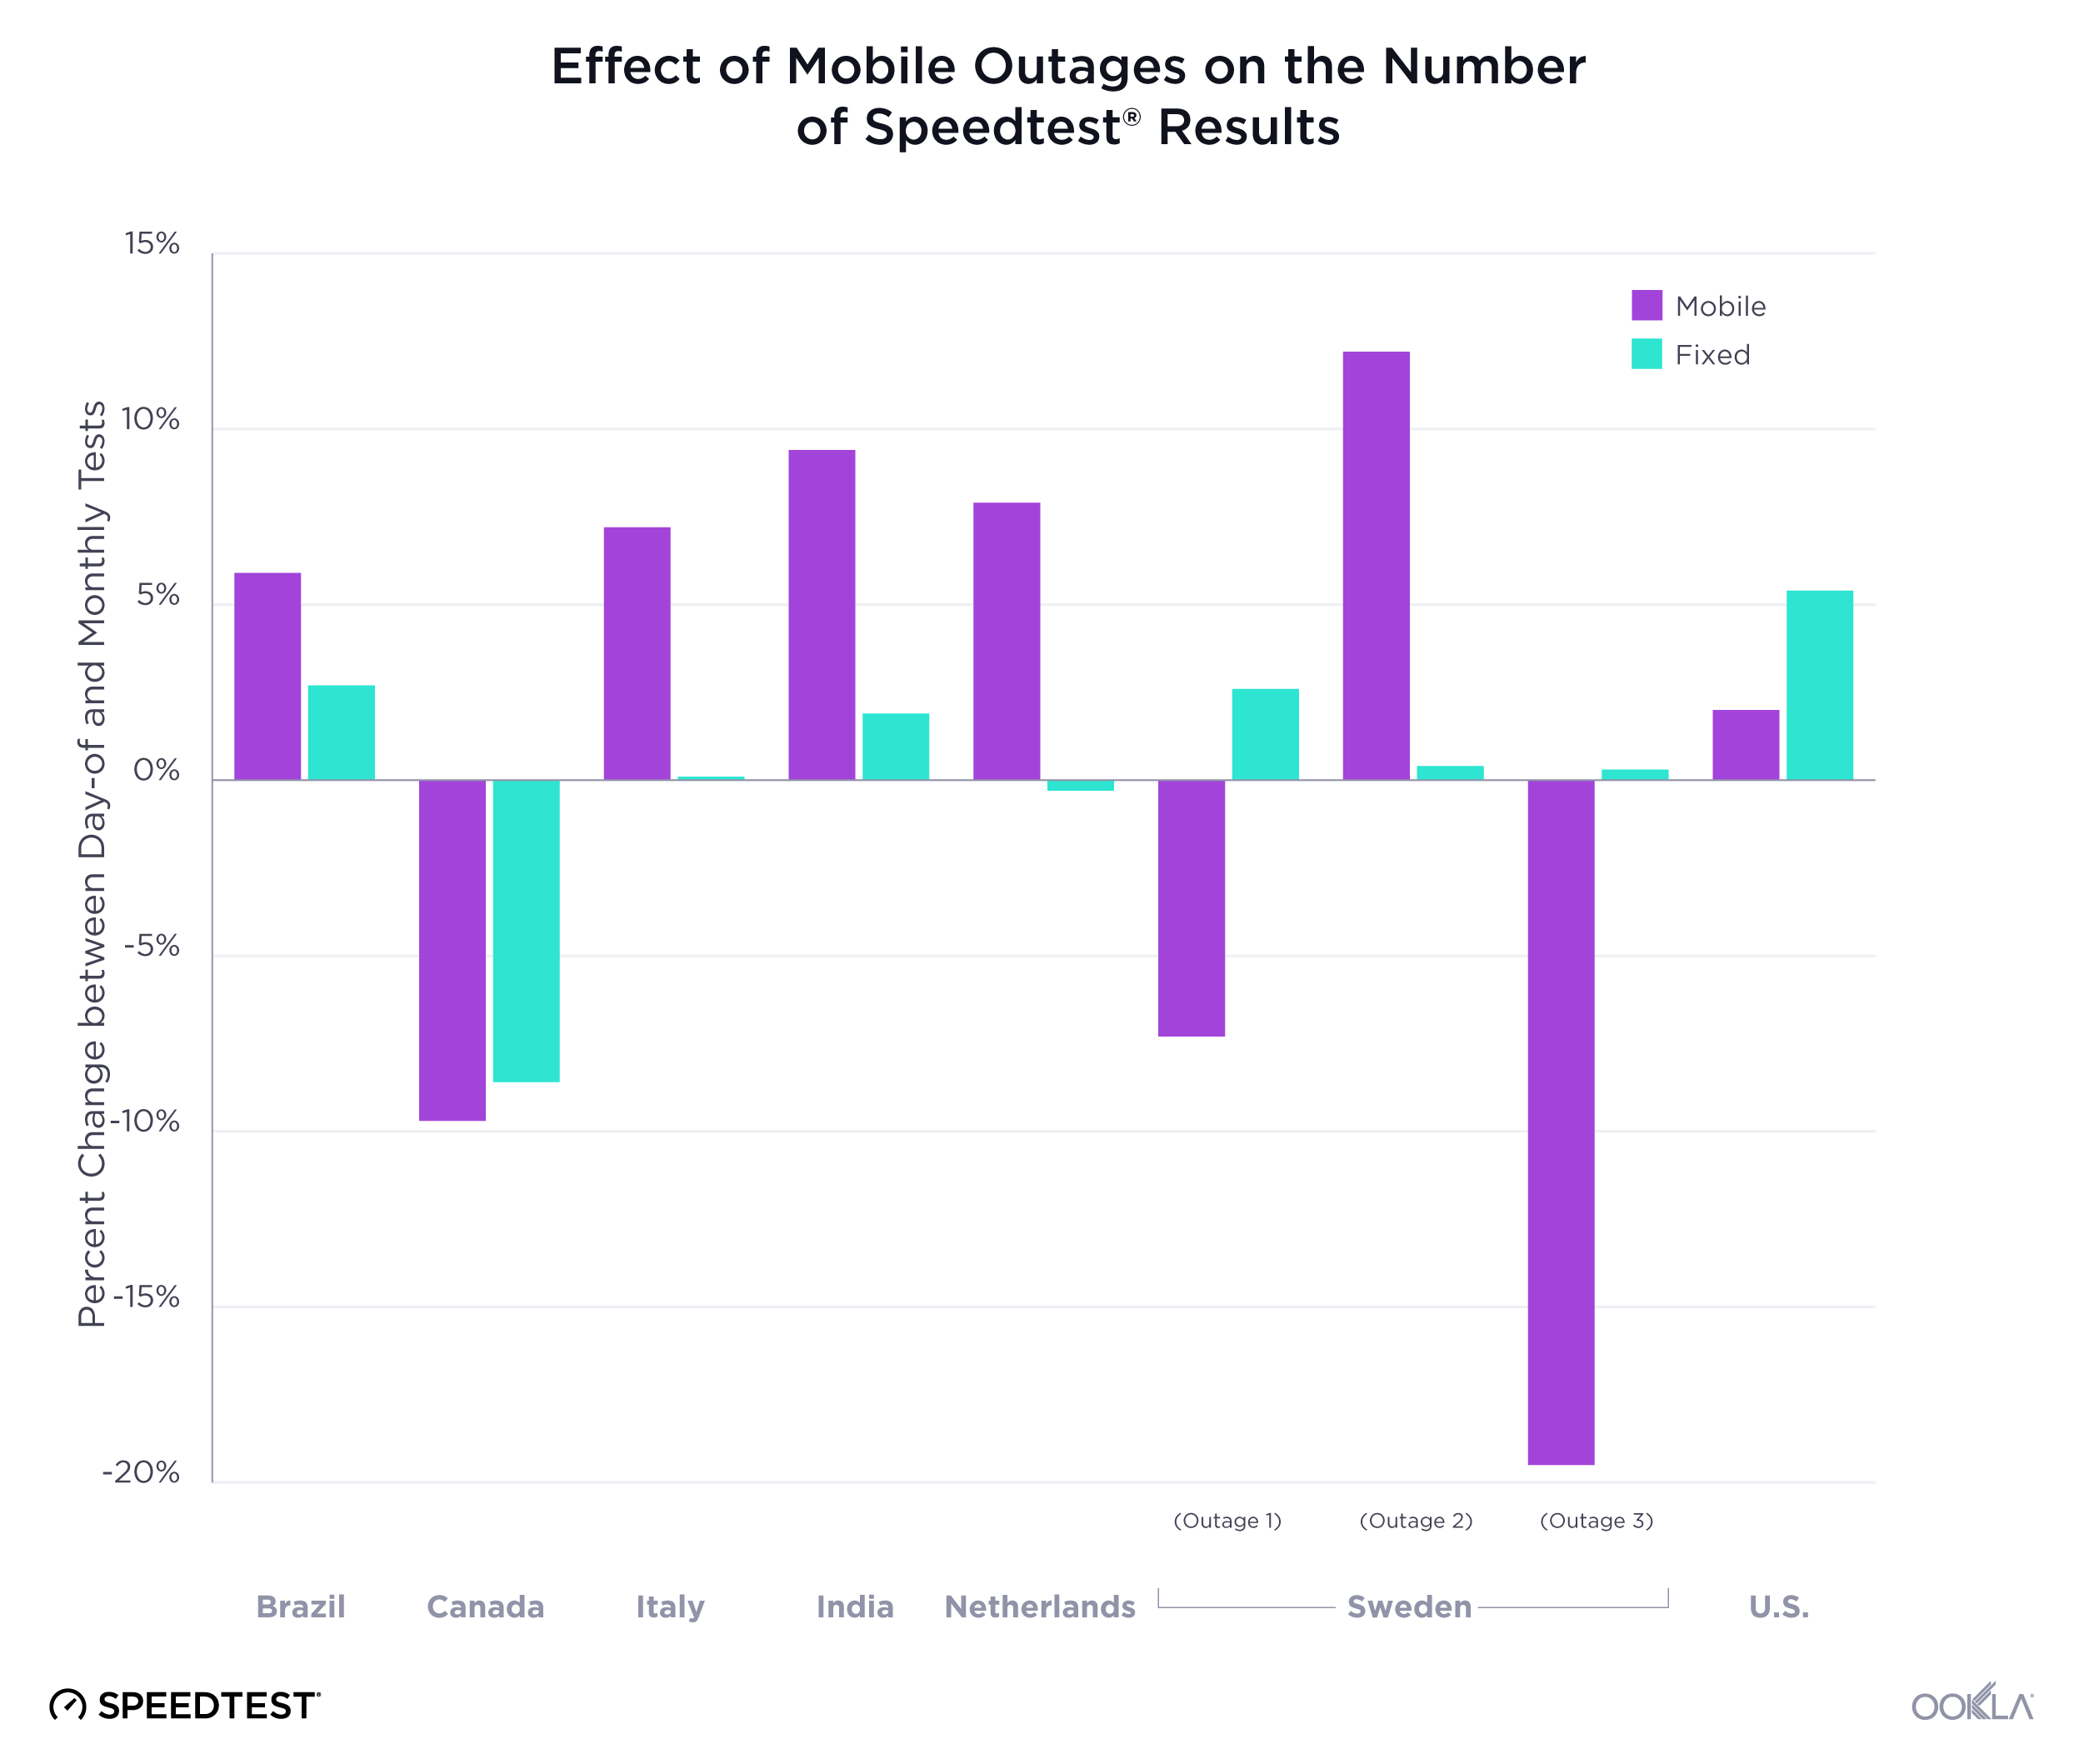
We also compared the number of Speedtest results over both mobile and fixed broadband during the outages with the daily averages in each country for the appropriate month.

Effect of Mobile Outages on Number of Speedtest Results

Our hypothesis that the number of mobile Speedtest results would increase on the day of an outage held mostly true. Exceptions were Canada and two days of the Swedish outage. Fixed broadband Speedtest results also mostly increased, except in Canada and the Netherlands, but for the most part only very minimally.

Contact us to learn how data from Downdetector and Speedtest can help you before, during and after an outage.

Ookla retains ownership of this article including all of the intellectual property rights, data, content graphs and analysis. This article may not be quoted, reproduced, distributed or published for any commercial purpose without prior consent. Members of the press and others using the findings in this article for non-commercial purposes are welcome to publicly share and link to report information with attribution to Ookla.

| October 1, 2019

How 5G is Changing the Global Mobile Landscape

Five months ago, we started using the Ookla 5G MapTM to track 5G across the world. In the months since, 5G deployments have increased exponentially — where we saw 294 around the world in May, today there are more than that in Switzerland alone. Today we’re exploring where 5G is gaining the most traction, including an analysis of how much faster 5G is than 4G in various markets.

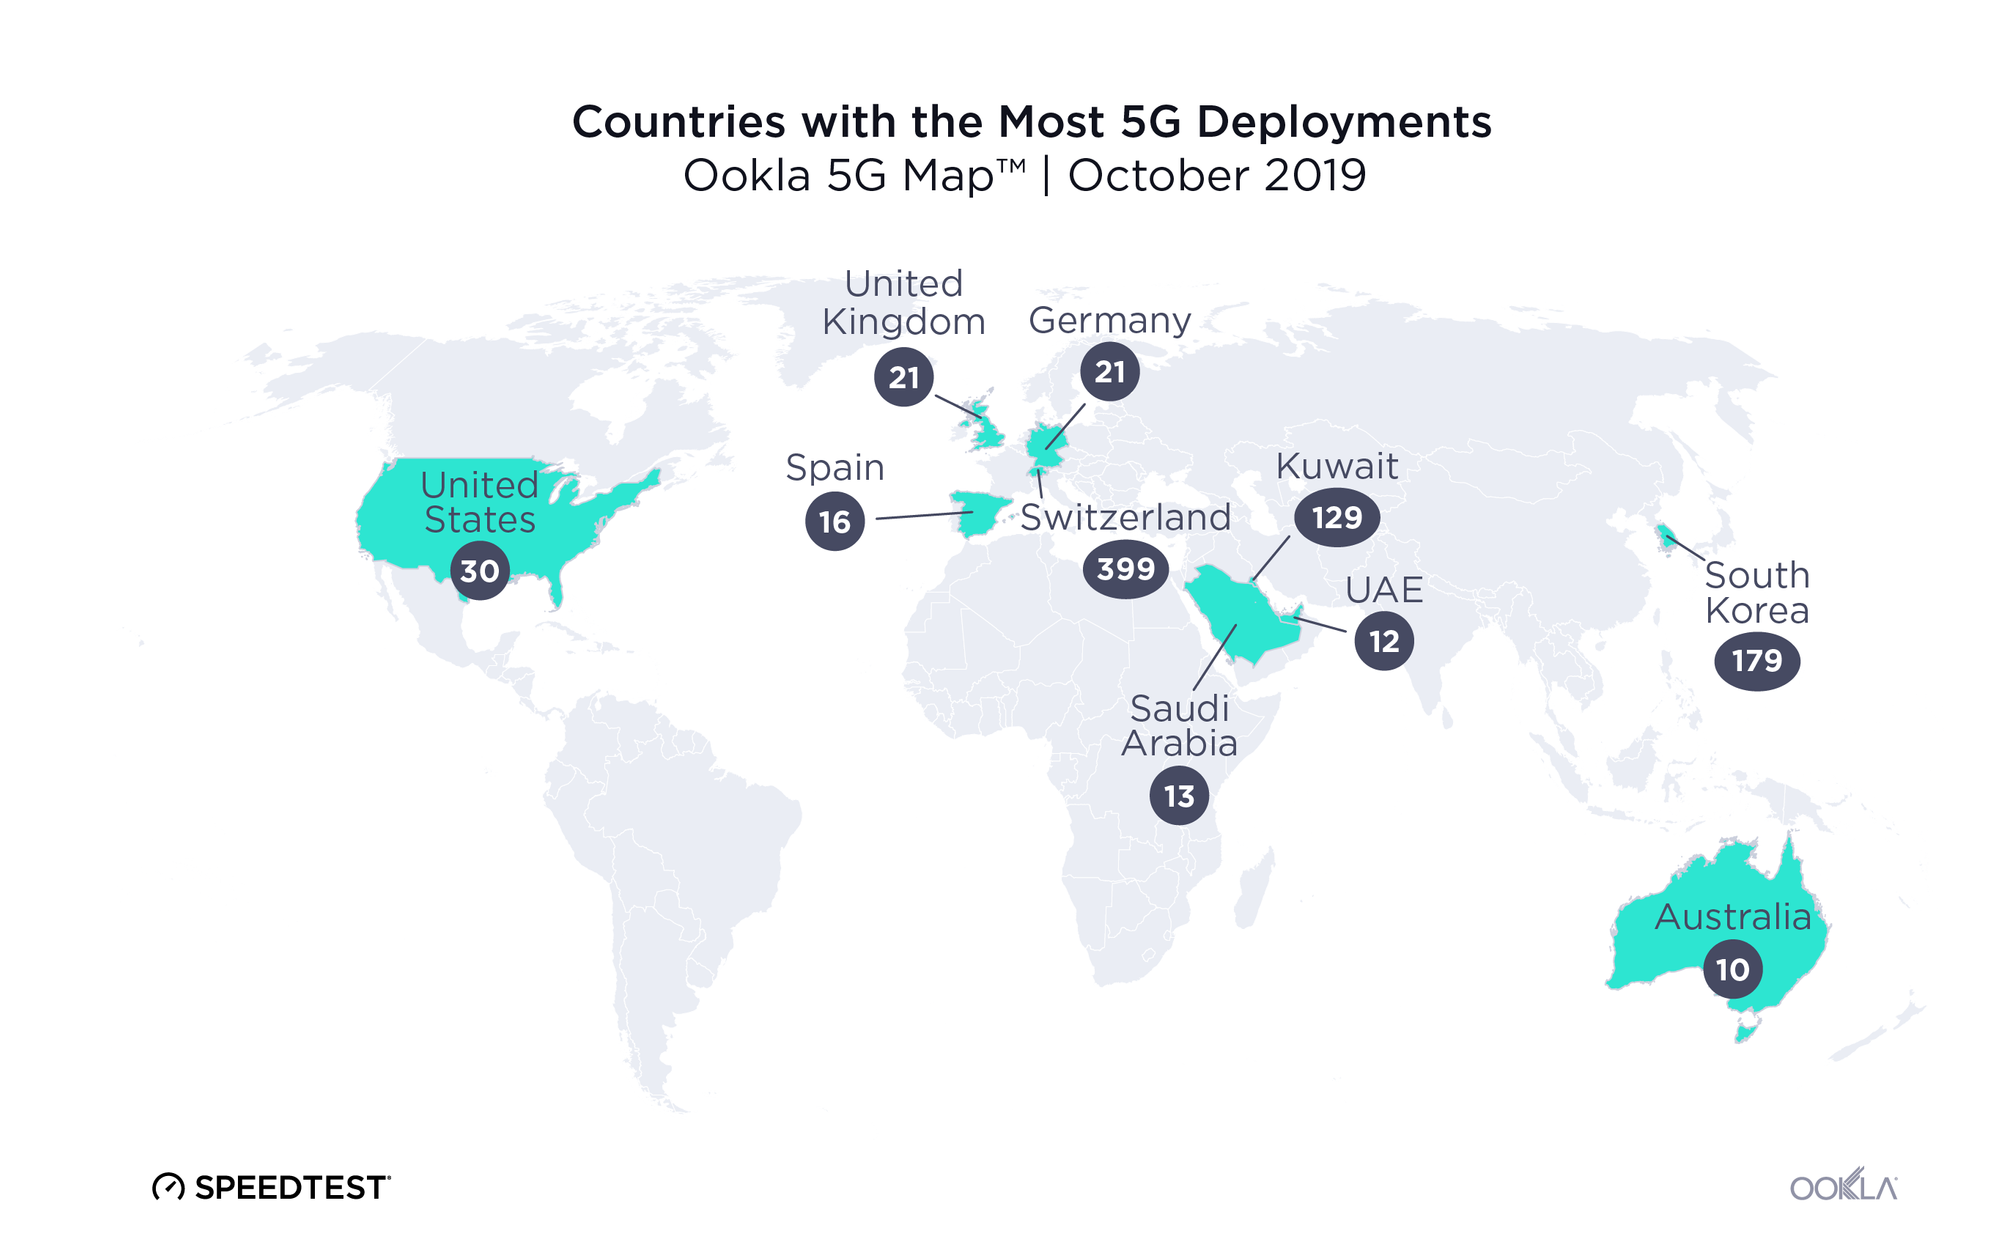
Countries with the most 5G deployments

The Ookla 5G Map reveals that Switzerland is winning the race of 5G expansion with more than twice as many commercially available deployments as second-place South Korea. Kuwait has the third largest number of 5G deployments in the world.

Ookla_Countries-with-the-most-5G-deployments-2

It’s interesting to note that of the world’s six largest economies, three do not have commercially available 5G at all (China, Japan and India). China does have 29 locations where 5G is in pre-release (with 5G network hardware in place but not yet accessible to consumers). Japan is expected to launch 5G in 2020 and 5G will likely be available in India in 2021.

The other three largest economies (the U.S., Germany and the U.K.) do feature among the 10 countries with the most commercially available 5G deployments, although they individually have many fewer deployments than Switzerland, South Korea and Kuwait.

5G downloads are at least 300% faster than 4G

In theory, 5G could eventually offer download speeds about 1300% faster than those on 4G. Real-world factors affect those numbers, though, so we examined data from Speedtest IntelligenceTM to see what consumers actually experienced in several key markets between June and August 2019.

Comparing Mean Speeds on 5G and 4G
Speedtest Results | June-August 2019
Country 4G Download (Mbps) 4G Upload (Mbps) 5G Download (Mbps) 5G Upload (Mbps) % Difference Download
Australia 60.59 16.37 258.18 33.25 326.1%
Bahrain 28.80 13.43 311.41 29.43 981.3%
Kuwait 34.02 18.36 352.93 23.24 937.4%
Qatar 62.27 17.57 303.57 36.78 387.5%
Saudi Arabia 42.11 16.50 395.04 33.75 838.1%
South Korea 64.79 14.66 393.07 30.33 506.7%
Switzerland 50.65 20.10 362.75 43.12 616.2%
United Arab Emirates 59.23 20.12 334.27 32.07 464.4%
United Kingdom 31.03 11.47 181.87 18.34 486.1%
United States 34.33 9.98 477.42 21.93 1290.7%

The mean download speed over 5G was fastest in the U.S. and also showed the largest percent difference when compared with mean download speed over 4G. Saudi Arabia had the second fastest mean download speed over 5G with South Korea coming in a close third. On the other end of the spectrum, the U.K. had the slowest mean download speed over 5G. Australia was the second slowest and Bahrain third slowest. Bahrain showed the second highest percent improvement when comparing 4G and 5G download speeds, though, and Kuwait was third. Australia showed the lowest percent increase between 4G and 5G download speeds and Qatar had the second lowest.

Mean upload speeds over 5G are less remarkable, though in almost every country we analyzed they represent a 50-120% improvement over those available on 4G. Kuwait was the exception, with only a 26.6% improvement in mean upload speed when using 5G rather than 4G. The U.S. and Bahrain were nearly tied for most improved with increases of 119.7% and 119.1%, respectively, when comparing mean upload speed on 5G to that on 4G. Switzerland had the fastest mean upload speed over 5G, Qatar was second and Saudi Arabia third. Mean upload speed over 5G was the slowest in the U.K., second slowest in the U.S. and third slowest in Kuwait.

5G Share of 4G/5G Speedtest Samples
June-August 2019
Country % 5G
South Korea 12.72%
Australia 1.31%
United Arab Emirates 0.65%
Kuwait 0.64%
Switzerland 0.59%
Qatar 0.43%
United Kingdom 0.30%
United States 0.20%
Bahrain 0.09%
Saudi Arabia 0.03%

The 5G share of the tests taken on either 4G or 5G differs widely among the countries on our list. South Korea was clearly on top with 5G accounting for nearly 13% of Speedtest 4G/5G samples. This is not surprising given that one South Korean mobile operator already has 1 million 5G subscribers. Australia had the second largest percentage of 5G tests and the U.A.E. third. Saudi Arabia had the smallest percentage of 5G results.

Ookla is your go-to resource for ongoing 5G analysis

Ookla will continue to analyze 5G speeds as operators across the globe make this significant improvement in their networks. We’re uniquely capable of measuring 5G speeds because Speedtest uses a client and server testing engine capable of measuring high-speed connections (up to 10 Gbps) that dynamically scales the number of connections to the server in order to saturate and accurately measure the client-side connection. This allows us to measure the full extent of real-world performance and overcome the effects of network bottlenecks such as TCP slow start and means we are unique in our ability to measure 5G.

In addition, Ookla has partnered with operators and device manufacturers all over the world to implement accurate in-app 5G detection — even as Android Pie, which powers the current generation of 5G devices, does not natively identify 5G connection types. Through this approach, we’re able to properly configure the parameters of a Speedtest and measure 5G tests.

Keep watching this space for future analyses or contact us to learn more about how our data can help you.

To get a broader understanding of how 5G is changing the mobile landscape, read our previous coverage here:

Ookla retains ownership of this article including all of the intellectual property rights, data, content graphs and analysis. This article may not be quoted, reproduced, distributed or published for any commercial purpose without prior consent. Members of the press and others using the findings in this article for non-commercial purposes are welcome to publicly share and link to report information with attribution to Ookla.

| January 15, 2020

Power is Key to Mobile Network Recovery After Earthquakes in Puerto Rico

Mobile connectivity is crucial in the wake of a natural disaster as consumers seek to connect with loved ones and vital services. This is made all the more difficult by the fact that natural disasters can also wreak havoc on the infrastructure that supports that connectivity, including electrical power. In order to support recovery efforts, we used Speedtest® data from before and after the major recent earthquakes in Puerto Rico to see how mobile users were affected and where network connectivity currently stands.

While it was reported that power plants automatically shut off for safety following the quake on Monday, January 6 at 6:32 a.m. local time, we do not see the same effect to mobile networks during that time as we did when power plants were then reportedly damaged in the Tuesday, January 7 quake that struck at 4:24 a.m. local time. Not all power plants were yet fully online by the time of the quake on Saturday, January 11 at 8:54 a.m. Electricity is essential to power cellular networks and not all cell sites have on-site power generators. We explore the various impacts of these power outages below.

Signal measurements and test volumes dropped after Tuesday’s quake

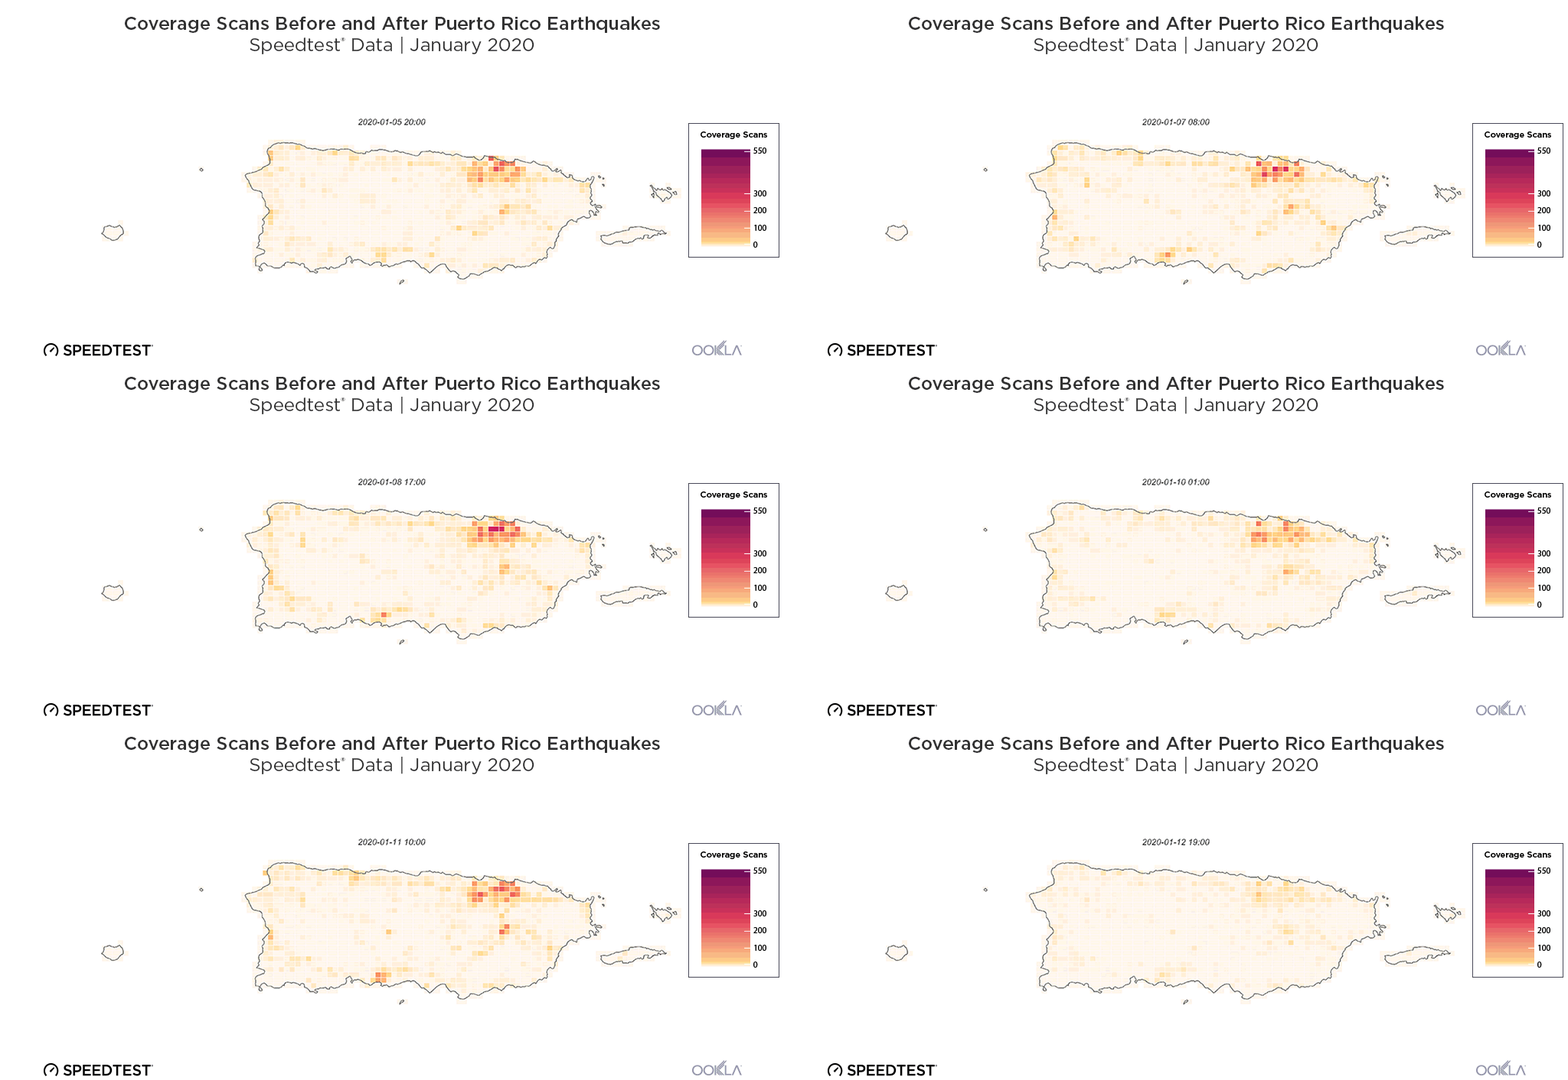
An hourly timelapse from the time before the first major earthquake on Monday, January 6, through the second (Tuesday, January 7) and third (Saturday, January 11) show the number of passive signal measurements from Android devices on the island of Puerto Rico.

Coverage scans timelapse

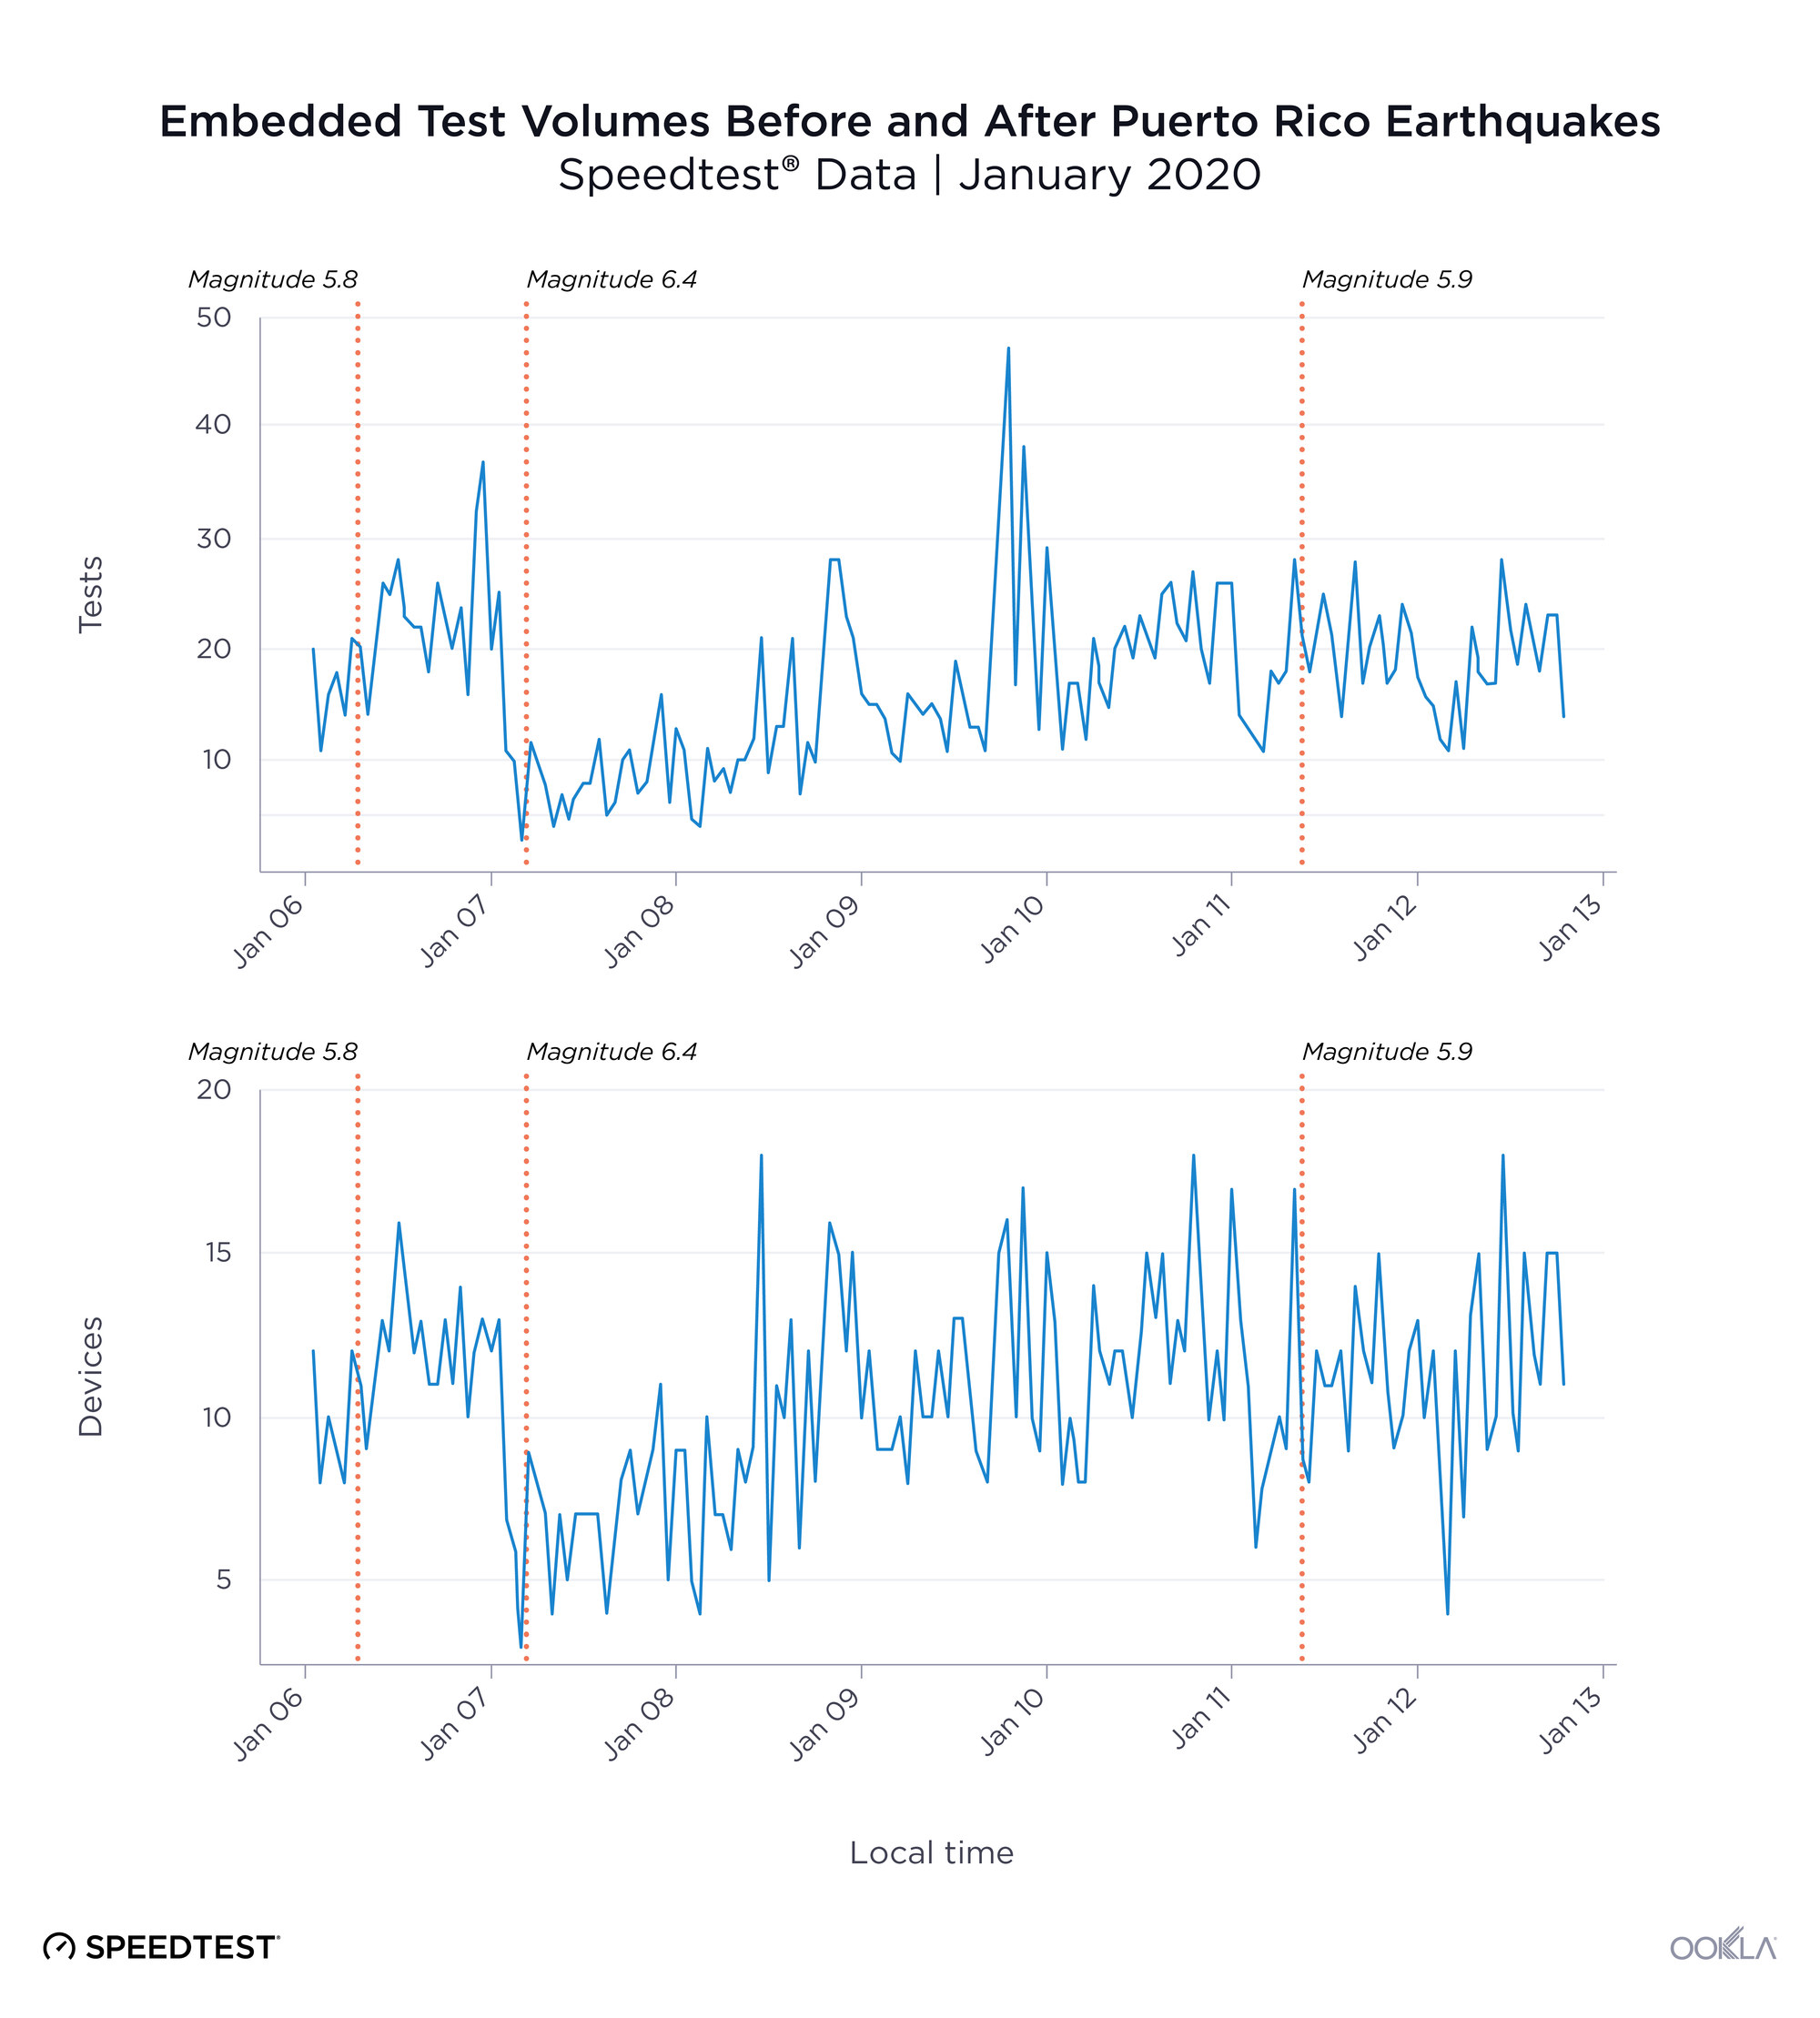
We see a similar pattern of scans throughout the period, but the volume of samples declines following each of the three quakes.

PR-Embedded-Volumes-Devices-Tests-4

Embedded tests also dropped off after the Tuesday, January 7 earthquake. These come from devices (including: routers, gateways, modems, test and measurement devices and IoT Devices) that use Speedtest PoweredTM to monitor connectivity by running a Speedtest, usually on a regular schedule. Except when the power is out.

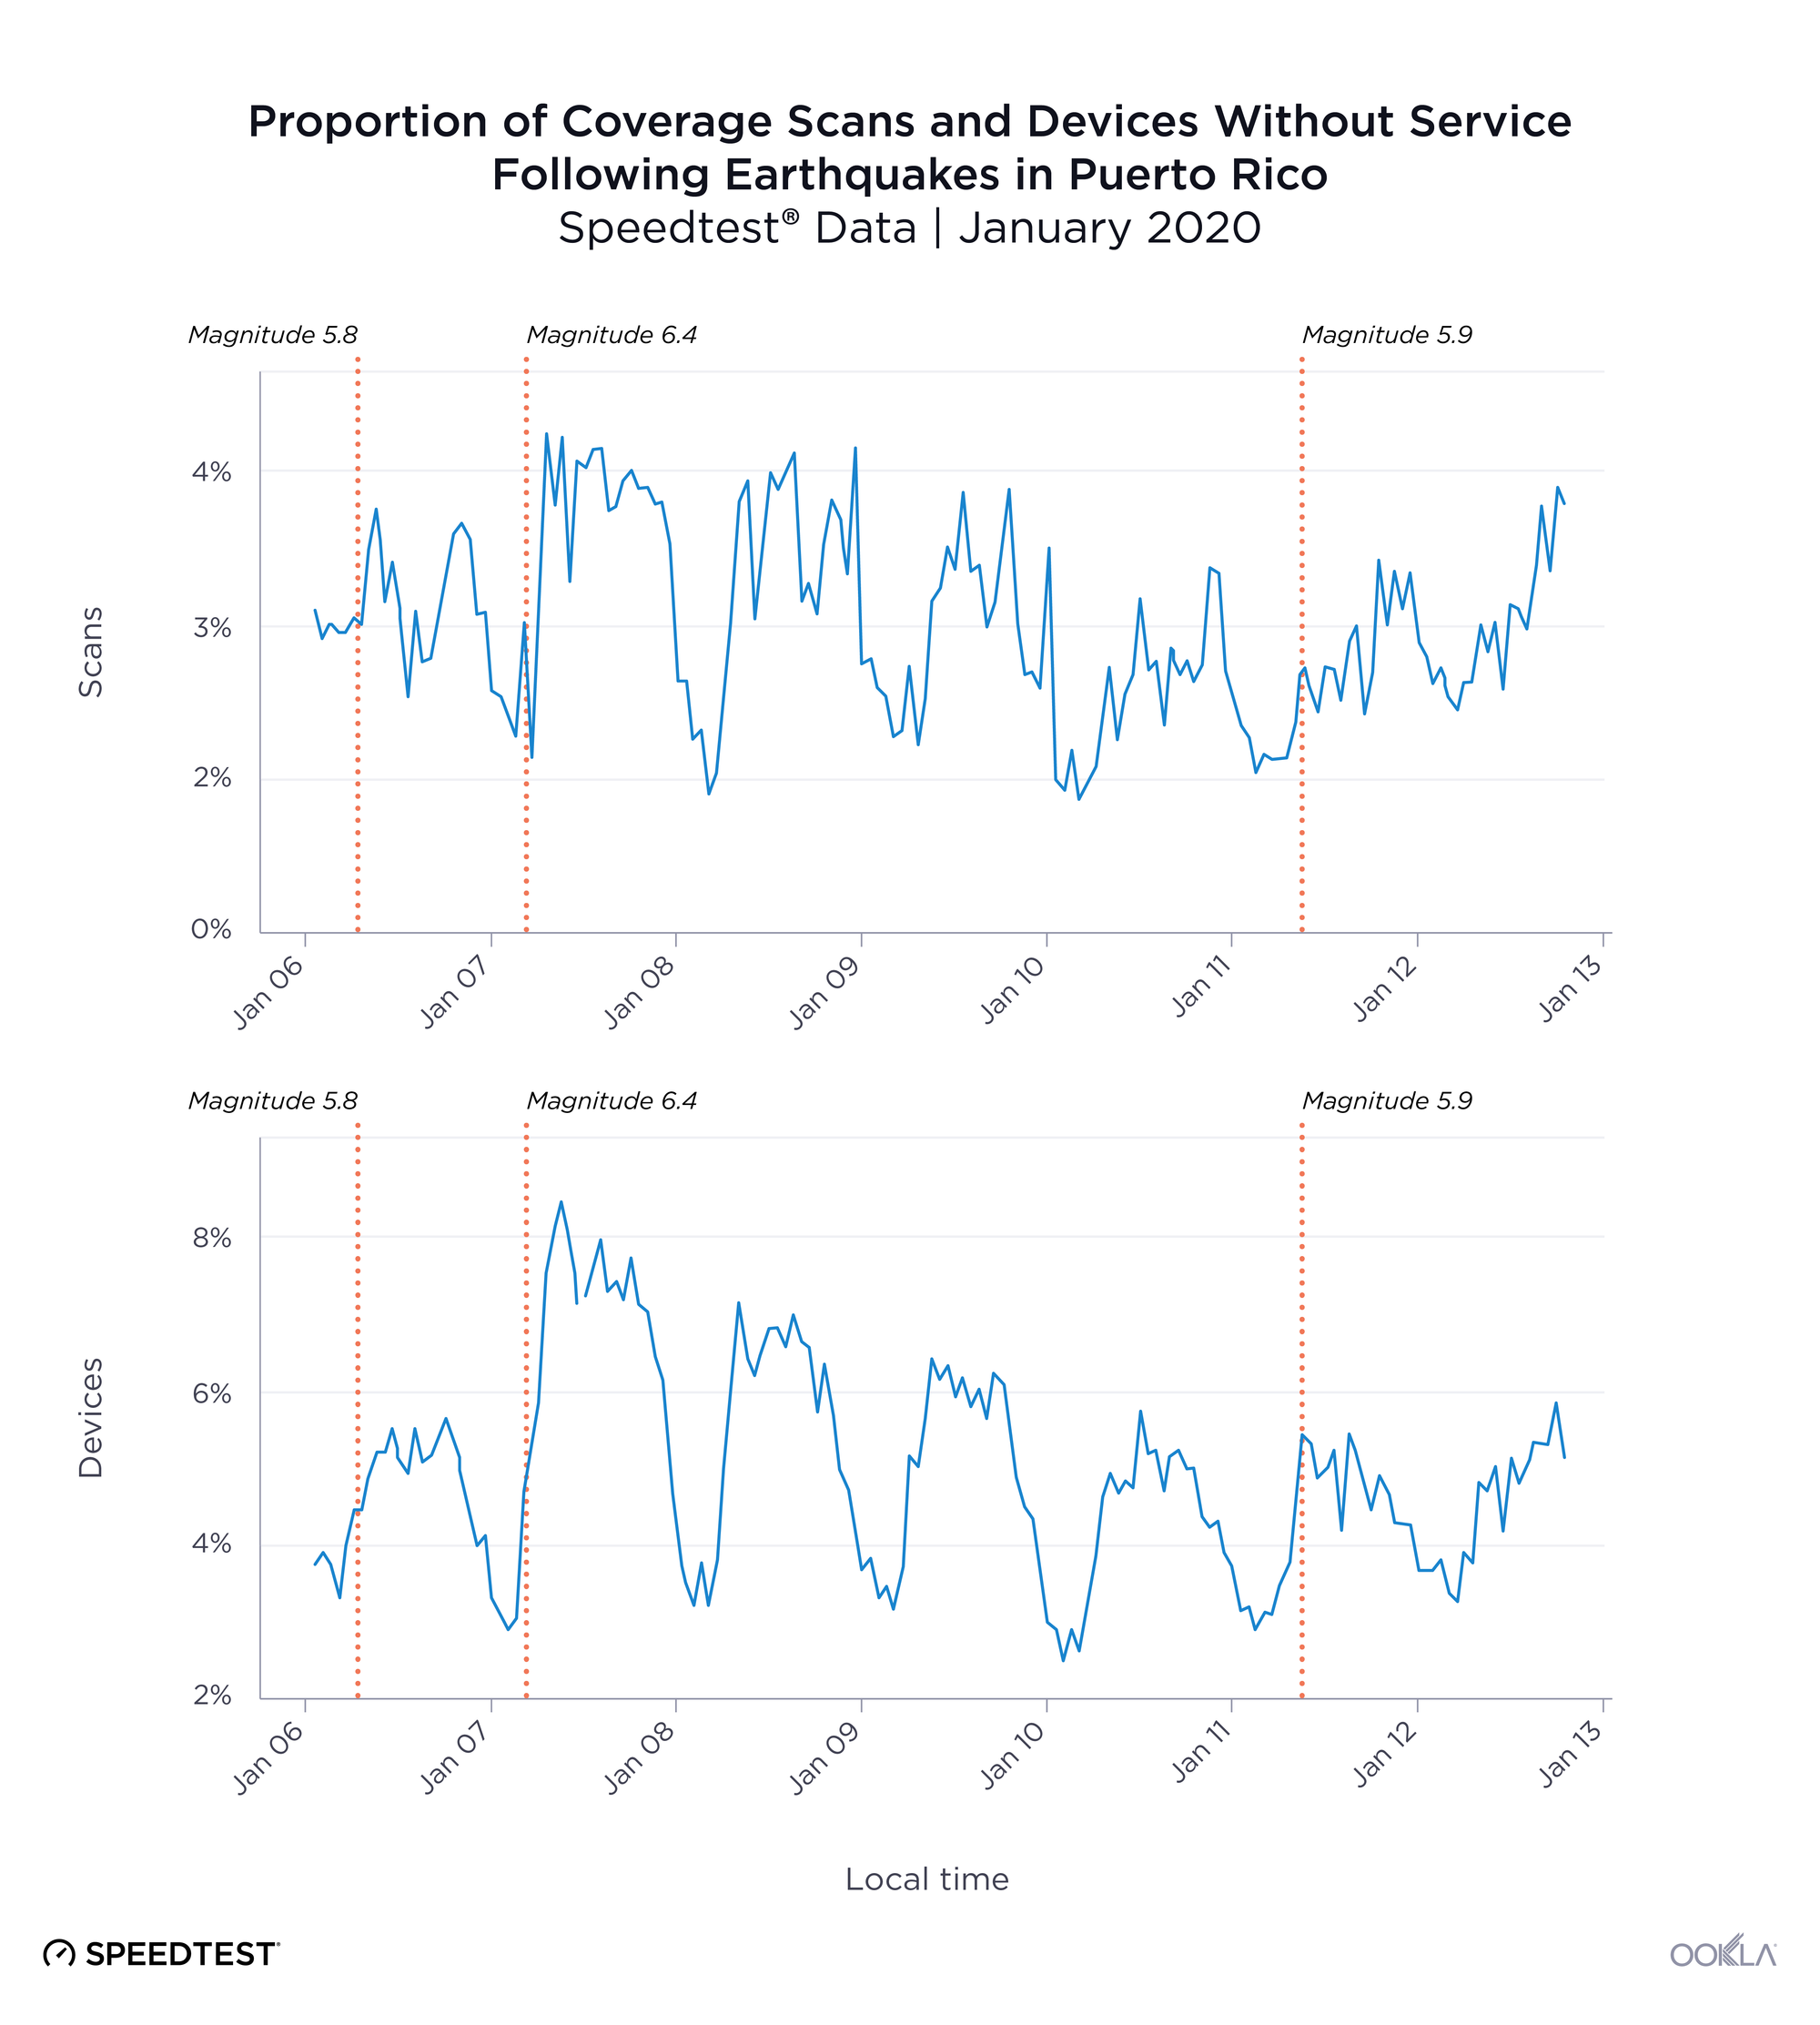
No service status jumped after Tuesday’s quake

PR-No-Service-Scans-Devices

The proportion of scans and devices with no service in Puerto Rico show a large jump after the earthquake on Tuesday, January 7 compared with the time period following the Monday, January 6 quake. This shows that the real impact to mobile networks was a result of the quake on Tuesday, January 7, likely because of power outages, and that networks were slowly recovering in the days after.

It looks as though scans and devices with no service were trending upward following the quake on Saturday, January 11 as well, though full data was still trickling in as this article was being written.

Battery level fell when devices were disconnected from power

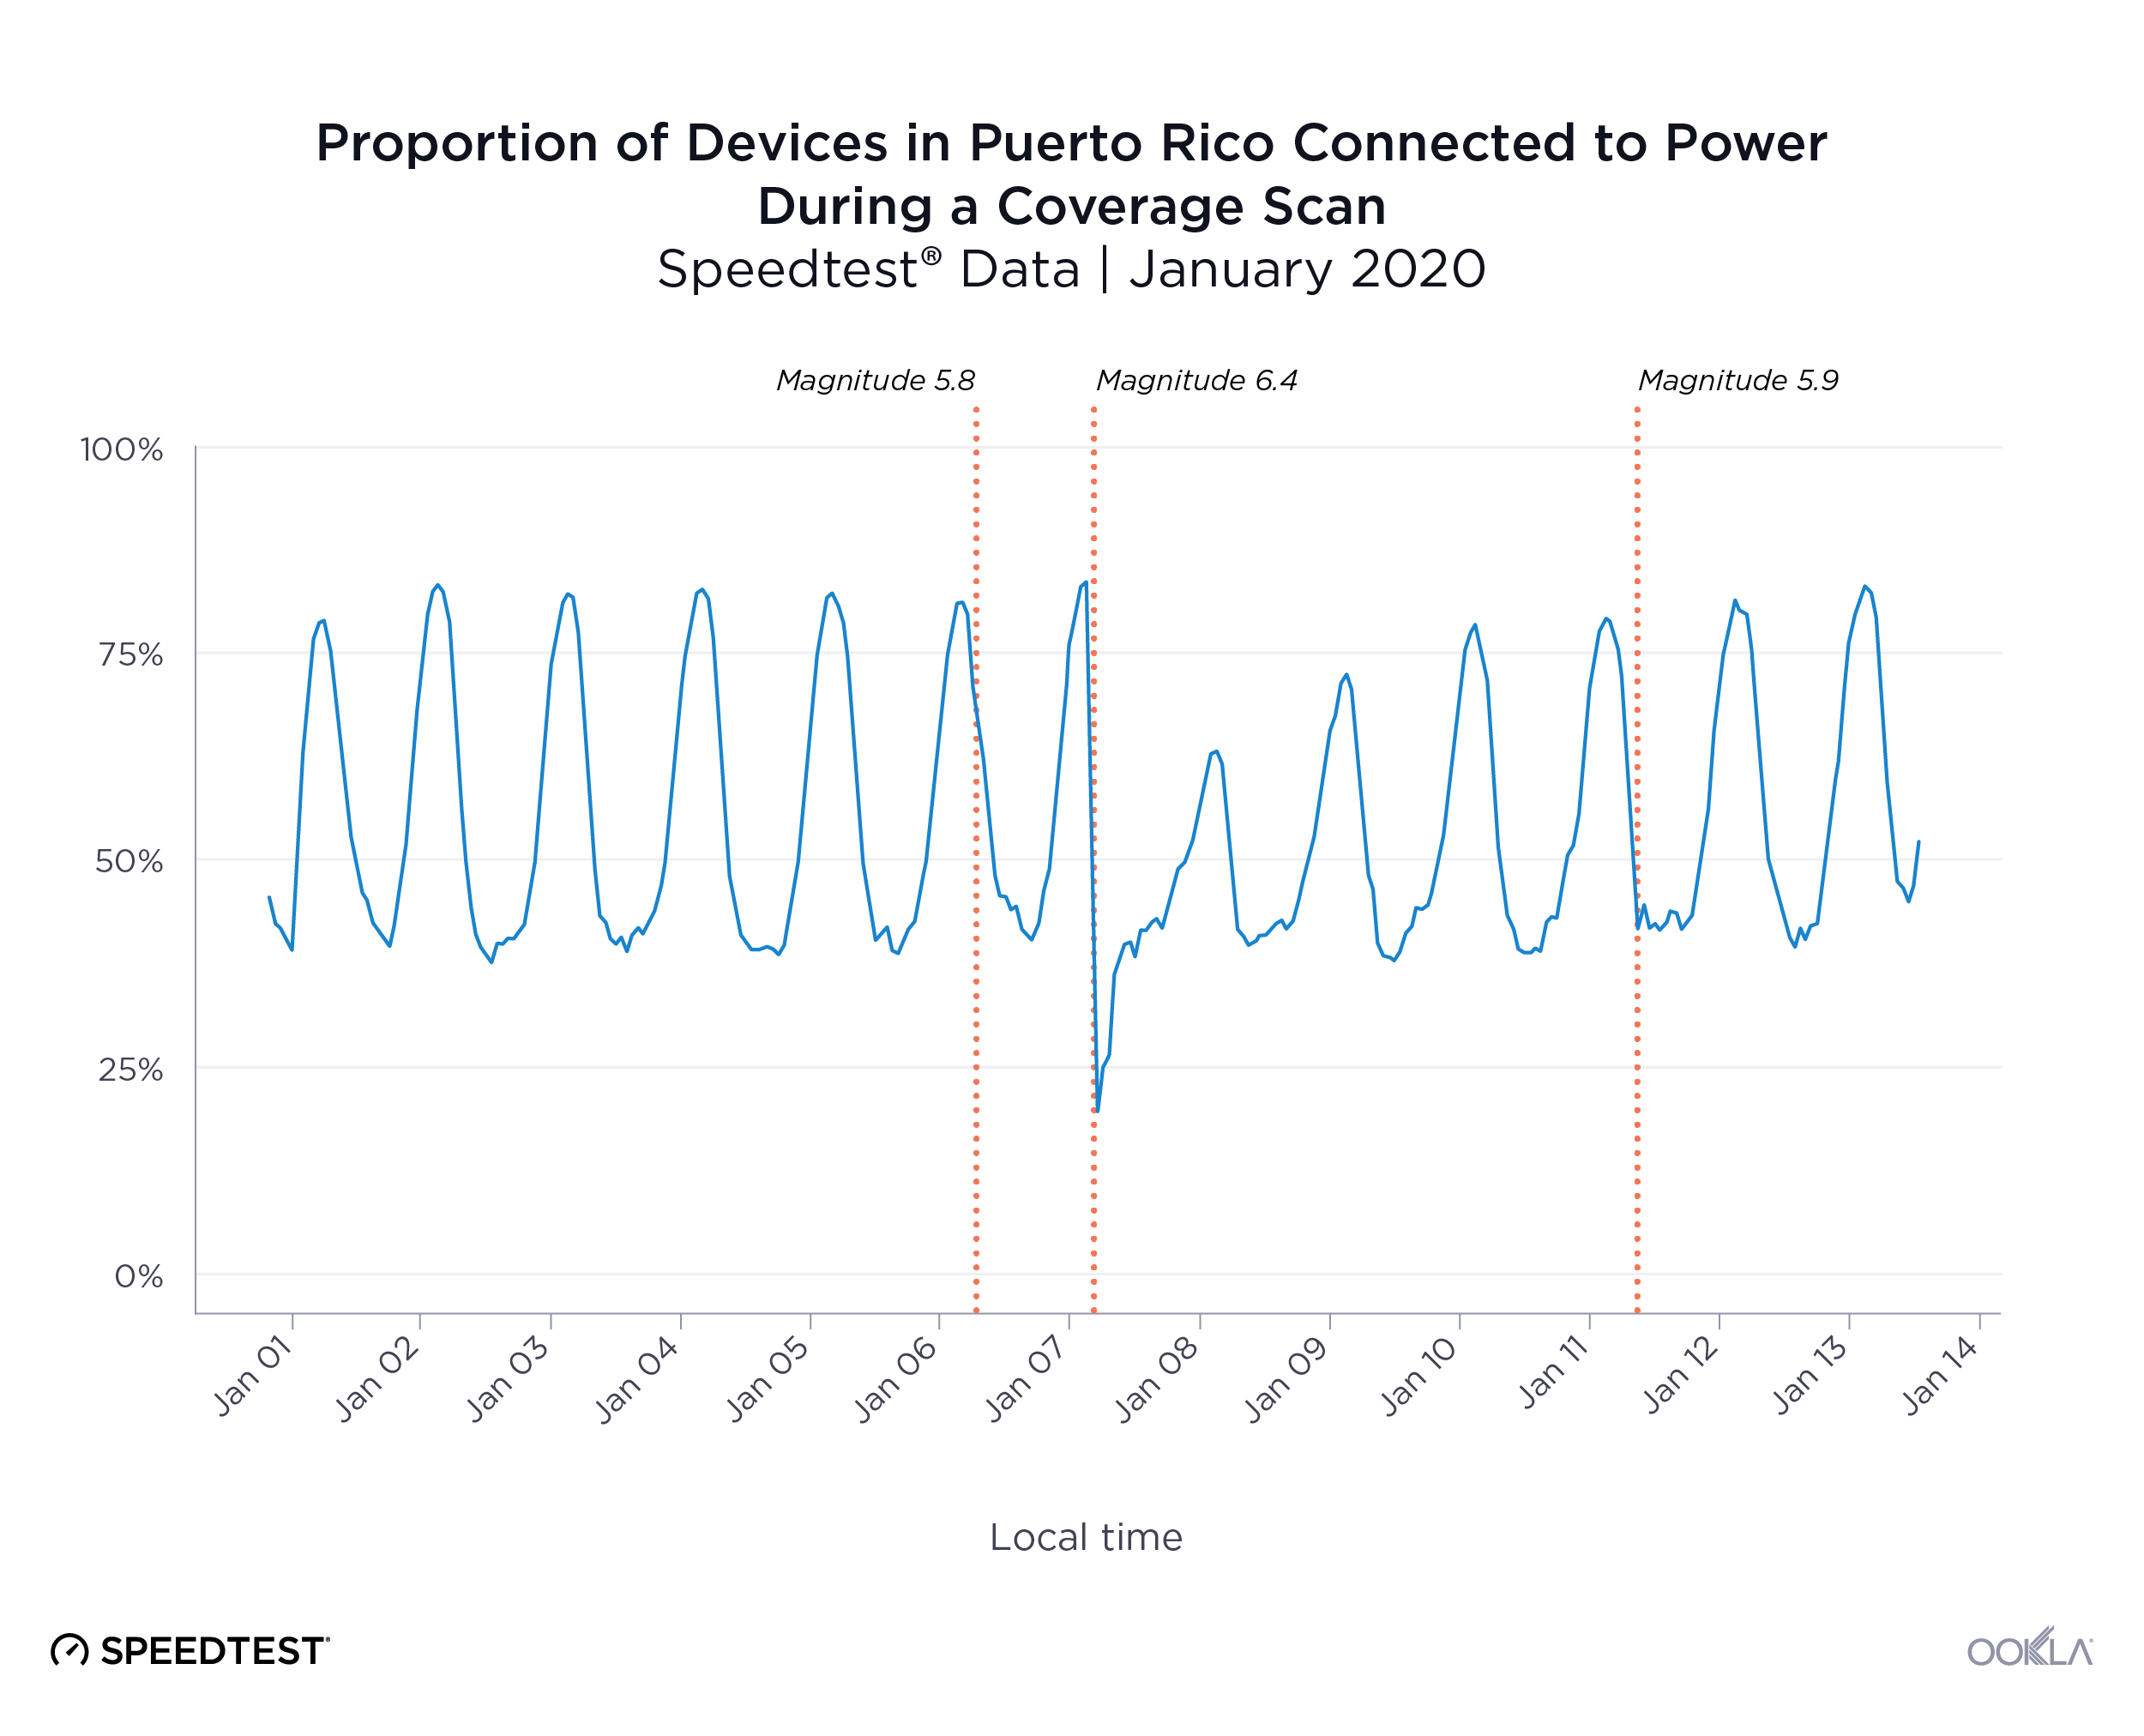
For signal to matter, a device needs to have battery or the ability to charge. We used Speedtest data to analyze the proportion of devices that were connected to power during a coverage scan during the month of January.
Proportion-of-Devices-Connected-Puerto-Rico_0120-4
Before and after the earthquake on Monday, January 6, we see a fairly consistent daily pattern where between 30% and 85% of devices are connected to power during a scan. Immediately following the quake on Tuesday, January 7, there is a sharp drop in devices connected to power. The pattern had still not fully recovered when the third major quake hit on the morning of Saturday, January 11. There also appeared to be a longer than average dip in devices connected to power immediately following Saturday’s quake, but the pattern looks to be normalizing in the days since.

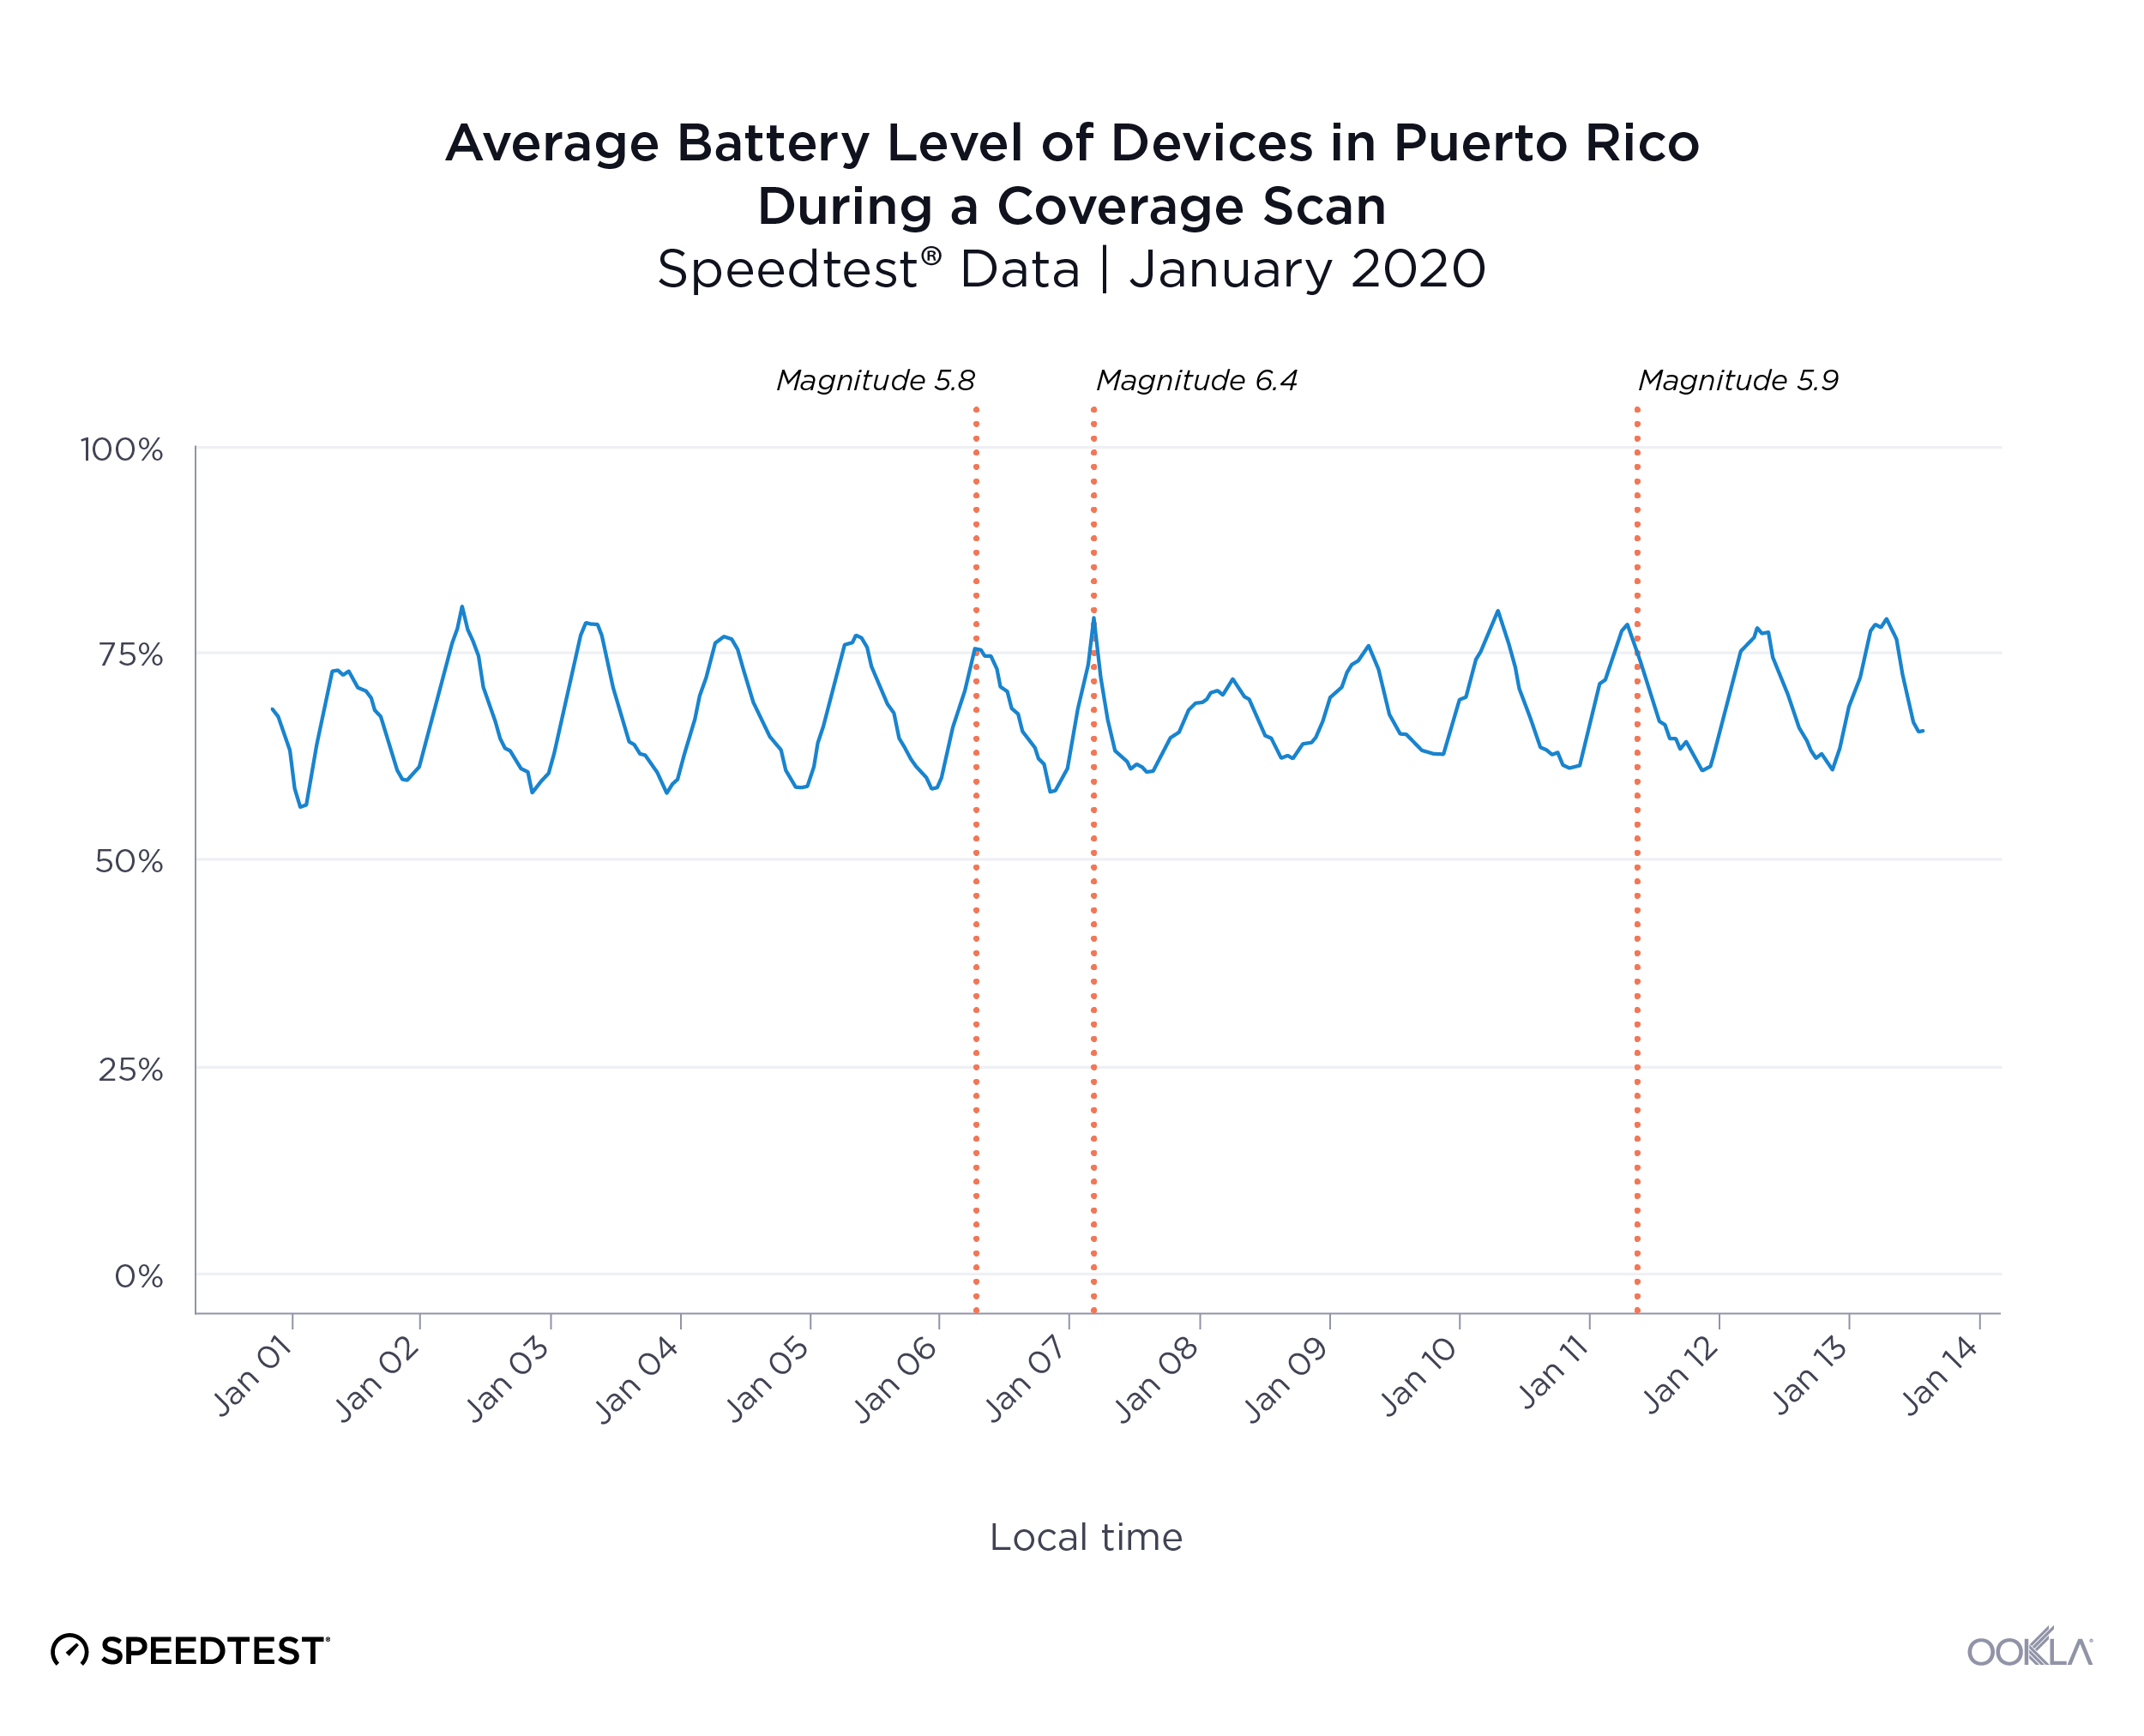
The disruption in devices connected to power after the January 7 quake then affected average battery life of unplugged devices. This drop in average battery level reflects devices that had been charging when the power went out. We can also see that the average battery level didn’t return to a normal cycle until Friday, January 10.

Average-Battery-Level-of-Devices-Puerto-Rico_0120-2

While these battery observations may appear straight-forward, they are important to highlight because they illuminate the cascading connectivity challenges that communities face in times of crisis.

Natural disasters can happen anywhere. In places like Puerto Rico, where the power grid is still suffering from the effects of Hurricane Maria, the effects of additional natural disasters on critical mobile networks can be especially challenging. Full power was expected to have been restored to the island on Sunday.

At Ookla, we share data pro bono in times of need that can help assist recovery in a number of ways. If you are an operator or regulator assisting with rebuild efforts in Puerto Rico that could use Ookla data to aid your immediate efforts, please inquire for more information.

Ookla retains ownership of this article including all of the intellectual property rights, data, content graphs and analysis. This article may not be quoted, reproduced, distributed or published for any commercial purpose without prior consent. Members of the press and others using the findings in this article for non-commercial purposes are welcome to publicly share and link to report information with attribution to Ookla.

| January 28, 2020

Mobile Experience in the Caribbean: Where Roaming Doesn’t Sink Speeds


Winter’s on in the northern hemisphere, and travelers from all over are booking cruises to the Caribbean for a little sun. If a phone figures into that fabulous vacation, it’s important to know where mobile roaming speeds will slow down the fun. We examined Speedtest® data from Q4 2019 for five popular Caribbean destinations to see which country has the best roaming speed, how roaming affects latency and how country of origin affects results.

Roaming speeds excel in the French Antilles

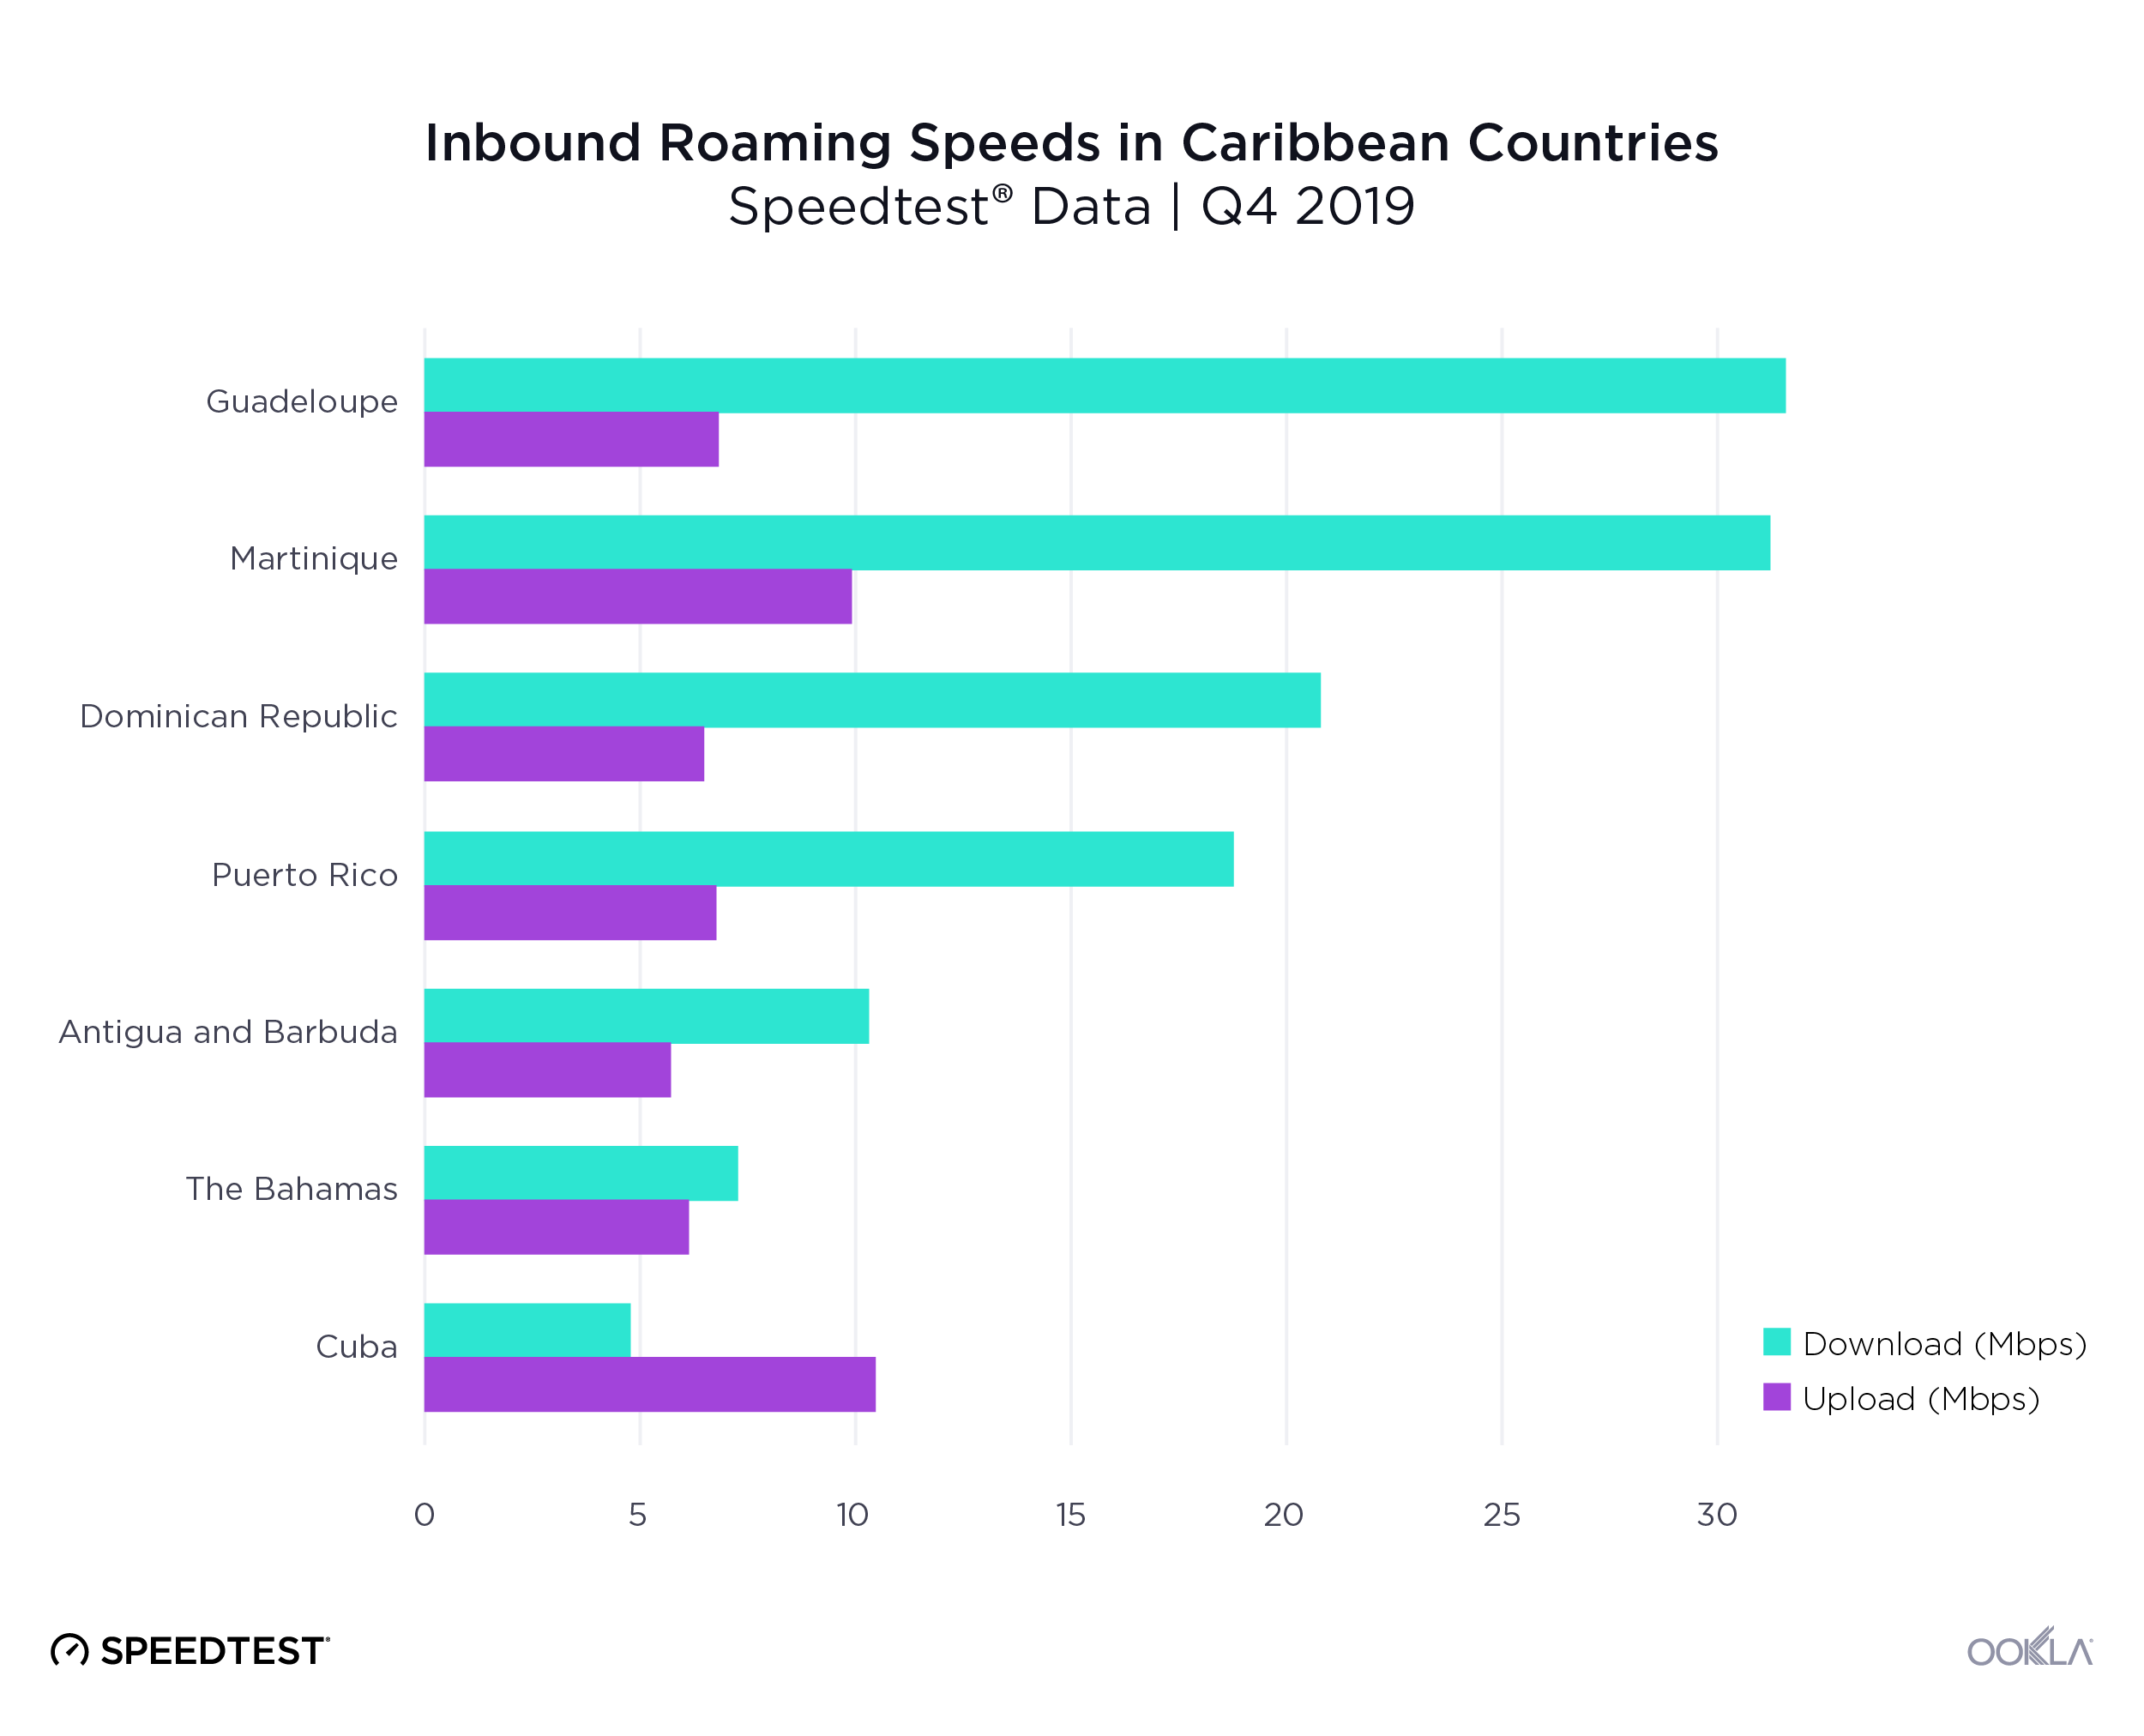
Roaming agreements are complex arrangements negotiated between individual mobile operators on a country-by-country basis. For travelers this means that mobile speeds can be very unpredictable abroad. Speedtest data showed Guadeloupe and Martinique had the fastest mean inbound roaming download speeds of all the countries on our list during Q4 2019.
Ookla-Inbound-Roaming-Speeds-Caribbean_0120
On the other hand, visitors to Cuba and The Bahamas saw the slowest mean download speeds while roaming during Q4 2019.

Local speed does not predict roaming speed

We expect to see slow roaming speeds in countries with slow mobile speeds overall, because roaming relies on in-country networks. However, when we look only at the percent difference between roaming and local speeds, we see that local speed was not the only indicator of roaming speed.

Comparing Inbound Roaming Speeds to Local Speeds in the Caribbean
Speedtest® Data | Q4 2019
Country Local Download (Mbps) % Decrease Download When Roaming Local Upload (Mbps) % Decrease Upload When Roaming
Cuba 28.45 82.9% 12.98 19.4%
Antigua and Barbuda 41.66 75.5% 13.18 56.4%
The Bahamas 23.21 68.8% 11.99 49.0%
Guadeloupe 46.33 31.6% 12.52 45.8%
Puerto Rico 27.46 31.3% 10.83 37.4%
Dominican Republic 26.58 21.8% 10.49 37.9%
Martinique 32.59 4.2% 10.37 4.1%

For example, Antigua and Barbuda’s mean local download speed was the second fastest on our list during Q4 2019, but that figure represents a 75.5% decrease in mean roaming download speed. The result is that Antigua and Barbuda ranked third to last for mean roaming download speed during Q4 2019. Cuba showed the largest decrease in mean download speed between roaming and local at 82.9%. Martinique showed the smallest decrease at 4.2%.

Roaming’s effect on latency

Latency is a major pain point for consumers who are roaming outside of their home country. Roaming signals are routed from the country a consumer is visiting to their country of origin and then back to where they physically are with their phones.

Comparing Inbound Roaming to Local Latency in Caribbean Countries
Speedtest® Data | Q4 2019
Country Roaming Latency (ms) Local Latency (ms) % Increase Latency When Roaming
Cuba 472 100 372.0%
Guadeloupe 289 80 261.3%
Martinique 289 99 191.9%
Dominican Republic 216 35 517.1%
Puerto Rico 174 52 234.6%
Antigua and Barbuda 149 28 432.1%
The Bahamas 149 32 365.6%

Latency while roaming was highest by far in Cuba during Q4 2019. Roaming latency represented a 372.0% increase over local latency, which was also higher in Cuba than any other country on this list. The high roaming latency in both Guadeloupe and Martinique is likely both because local latency is higher there and because the majority of samples we saw in those locations were roamers from France, so the signals for roamers had to cross an ocean, twice.

Antigua and Barbuda and The Bahamas were tied for the lowest latency we saw for consumers roaming in the Caribbean during Q4 2019. These two countries also had the lowest local latencies during this period.

Performance varies widely by roamer’s origin and destination

Mobile Roaming Speeds and Latency for U.S. Consumers in Three Caribbean Markets
Speedtest® Data | Q4 2019
Country Roaming Download (Mbps) % Decrease Download When Roaming Roaming Upload (Mbps) % Decrease Upload When Roaming Roaming Latency (ms) % Increase Latency When Roaming
Dominican Republic 21.43 19.4% 5.98 43.0% 144 311.4%
Puerto Rico 19.74 28.1% 6.43 40.6% 172 230.8%
The Bahamas 7.20 69.0% 6.20 48.3% 143 346.9%

Although Puerto Rico is a U.S. territory, visitors from the 50 states of the union had a faster mean download speed roaming in the Dominican Republic than they did in Puerto Rico during Q4 2019. Both were slower than the U.S. average download of 38.74 Mbps during that period.

Roaming download speed for U.S. visitors to The Bahamas were much slower than those seen in the other two locations and 19.4% slower than the mean download speed for residents of The Bahamas. Latency for U.S. roamers was also much higher in Puerto Rico than it was in either The Bahamas or the Dominican Republic. For comparison, mean latency in the U.S. was 47 ms during the same period.

Roaming upload speeds for U.S. visitors were much more similar between the three destinations than we saw on the download side. All were much slower than the mean upload speed in the U.S. of 11.19 Mbps during Q4 2019.

Mobile Roaming Speeds and Latency for French Consumers in Two Caribbean Markets
Speedtest® Data | Q4 2019
Country Roaming Download (Mbps) % Decrease Download When Roaming Roaming Upload (Mbps) % Decrease Upload When Roaming Roaming Latency (ms) % Increase Latency When Roaming
Guadeloupe 35.65 23.1% 7.53 39.9% 285 256.3%
Martinique 31.22 4.2% 9.94 4.1% 289 191.9%

French visitors to Guadeloupe and Martinique experienced similar speeds and latency roaming in both locations, despite the sharp difference in local speeds. Considering the mean download speed in France was 44.19 Mbps and upload was 10.94 Mbps during the same period, these roaming speeds require a bit of an adjustment, but not painfully so. Latency, on the other hand, will require users to pack their patience, as mean latency in France during this same period was 41 ms.

Guadeloupe, Martinique, the Dominican Republic and Puerto Rico are among the best Caribbean destinations if roaming performance is a factor in choosing a cruise. Either way, multi-island travelers should be prepared for a variety of mobile roaming experiences in a variety of countries and aboard ships where roaming uses the ship’s cellular or Wi-Fi network.

If you’re a mobile operator interested in improving roaming performance to make your country even more attractive to foreign visitors, learn more about how Speedtest IntelligenceTM can help you.

Ookla retains ownership of this article including all of the intellectual property rights, data, content graphs and analysis. This article may not be quoted, reproduced, distributed or published for any commercial purpose without prior consent. Members of the press and others using the findings in this article for non-commercial purposes are welcome to publicly share and link to report information with attribution to Ookla.
| April 10, 2019

Analyzing the U.S. Mobile Speed Landscape in Q1 2019

Last week AT&T announced they were the fastest wireless network in the U.S. based on Ookla’s analysis of average download speed data collected from Speedtest in Q1 2019. We pride ourselves on the depth and accuracy of our data, so today we are digging deeper into the methodology and analysis behind the claim to provide additional clarity.

Q1 2019 mobile speed results

The four major U.S. carriers achieved the following average Q1 download speeds across all devices:

Speedtest Data on Mean Download Speeds for Major Operators
United States | Q1 2019
Operator Mean Download (Mbps)
AT&T 34.65
T-Mobile 34.11
Verizon Wireless 33.07
Sprint 31.21

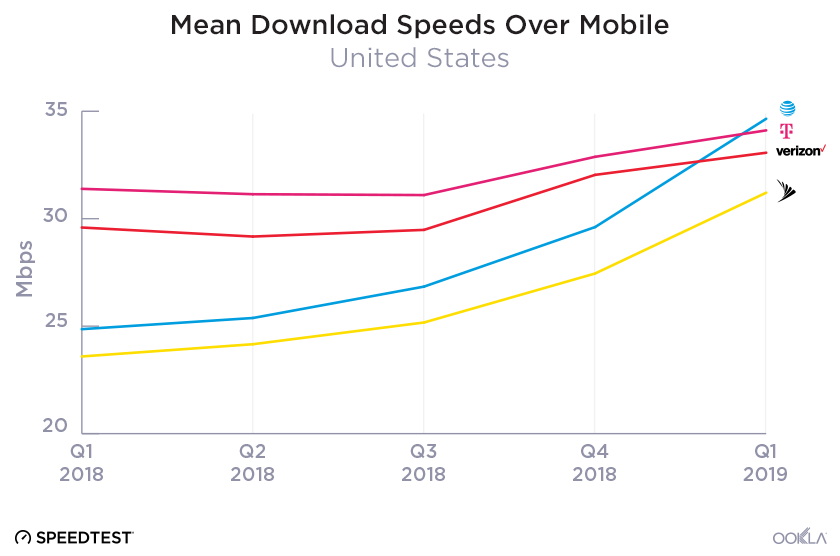
As we tracked data on mobile download speeds in the U.S. throughout the quarter, it became very clear to us that AT&T was likely to become the frontrunner. As you can see from the graph below, the steep increase in AT&T’s mean download speed continues a trend that started in Q4 2018.

mean-speeds

In the final week of Q1, we also observed an increase in faster tests taken on AT&T’s network. Upon investigation, we discovered that this correlated with the release of iOS 12.2 and the roll out of AT&T’s 5G E icon. We also found that the increase in tests was coming from device models that would have started to display the 5G E icon, such as the newer generations of iPhone (XR, XS Max, XS, X, 8, 8 Plus), indicating that consumers were seeing the new icon and taking a test to see what speeds they were getting. Even excluding data from the last week of the month, AT&T still had the fastest LTE network in the nation during Q1.

AT&T also showed strong speeds on Android throughout the quarter. For instance, looking at the most popular Android device in Q1 (the Samsung Galaxy S9) we see AT&T coming in first with a mean download speed of 44.90 Mbps, an 11.2% increase over the prior quarter.

A conclusion is only as good as the data behind it. This is why Ookla does not validate national claims based on less than a quarter’s worth of data. User experiences on their respective networks can be influenced by a wide variety of factors that ebb and flow over short periods of time, particularly when evaluated at the national scale. Ookla mitigates these influences by looking at trends over a longer period of time and only considering one sample per device during that time.

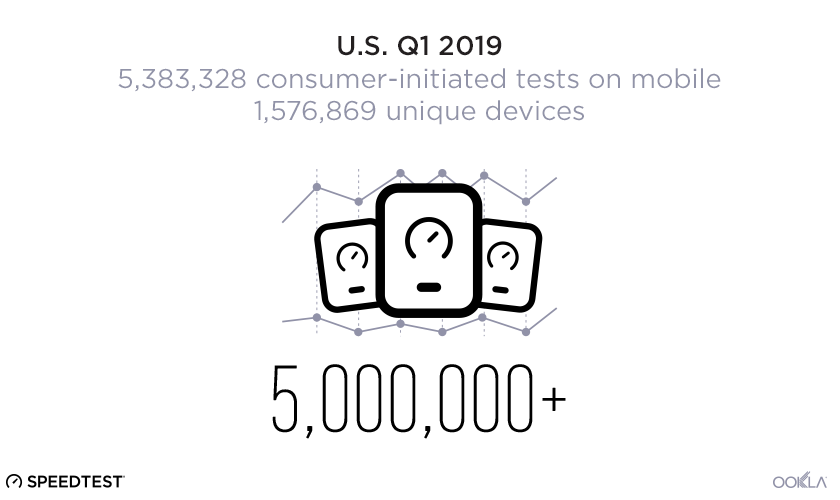
Data volume is also key. Consumer-initiated testing gives Speedtest a huge volume of data from which we can accurately assess the performance of mobile operators. During the entirety of Q1 in the U.S., we saw over 5 million consumer-initiated mobile network tests taken on over 1.5 million unique devices across all operators.

5-million-tests-1

Understanding how to interpret different reports

There are many companies that claim expertise in the measurement of speed and it can be hard for consumers to wade through the wide array of information out in the marketplace. At Ookla, we want you to be empowered with detailed information about our test, methodology, sample sizes and more so that you can compare it to others who claim to measure speed.

Measuring speed is in our DNA (and name). Our entire company began with a purpose built focus on speeds via the Speedtest platform and grew from there. We are proud of the fact that consumers trust Speedtest so much that they actively initiate over 10 million tests per day, with over 23 billion tests taken to date.

While there are other apps on the market that measure speed in the foreground, none has an adequate user base to produce a volume of data that is representative of the market as a whole.

The importance of testing speed on both iOS and Android

Every mobile operator has a different breakdown of device platforms used by their customer base. In the U.S. during Q1, we saw the following distribution in our database of Speedtest results:

Speedtest Data on iOS Usage Across Major Mobile Operators
United States | Q1 2019
Operator % Devices iOS
AT&T 70%
Sprint 54%
T-Mobile 49%
Verizon Wireless 62%

This wide adoption of iOS in the U.S. makes the ability to test the speed of a network on both iOS and Android crucial to accurately representing the full picture. While every operator has customers on both iOS and Android, tests taken on AT&T in our database during Q1 2019 show a staggering 70% of devices were using the iOS platform. This is likely because AT&T was Apple’s exclusive partner when the first version of the iPhone initially launched and, as a result, has retained a larger than typical iOS customer base.

A dedicated foreground test that saturates a connection is the most accurate way to measure speeds on both iOS and Android devices. Speedtest offers free applications on both iOS and Android that are optimized to measure the specific intricacies of a mobile internet connection in the foreground.

Because iOS limits the use of background activity, testing methodologies that rely on background testing are limited in the information they can gather. Testing methodologies that rely so heavily on data from Android aren’t able to fully represent the large portions of the U.S. customer base that uses iOS.

Further U.S. market analysis coming in 2019

Many changes are coming to the U.S. mobile market in the coming year, including numerous 5G rollouts that could radically alter speeds available to consumers in major markets. In smaller markets, such as states and cities, we will continue to focus on the convergence of high performance and coverage. We’ll examine all of this and more in our upcoming annual report publishing this summer, which will include a comprehensive look at our data on nationwide speeds, coverage metrics and consumer perception.

Editor’s note: This article was updated on April 10 to add additional context about performance on Android and clarify a sentence.

Ookla retains ownership of this article including all of the intellectual property rights, data, content graphs and analysis. This article may not be quoted, reproduced, distributed or published for any commercial purpose without prior consent. Members of the press and others using the findings in this article for non-commercial purposes are welcome to publicly share and link to report information with attribution to Ookla.