Internet connectivity continues to speed ahead for people around the world, especially as countries prioritize and improve mobile and fixed broadband networks. That’s nowhere more apparent than on the Speedtest Global Index™, which tracks countries’ internet speeds and the overall global median internet speeds. Last year, we took a look at the state of the internet speeds over the years, and today we’re back to see how most of 2022 fared from November 2021 to November 2022, and what countries made our top 10 fastest mobile and fixed broadband lists.
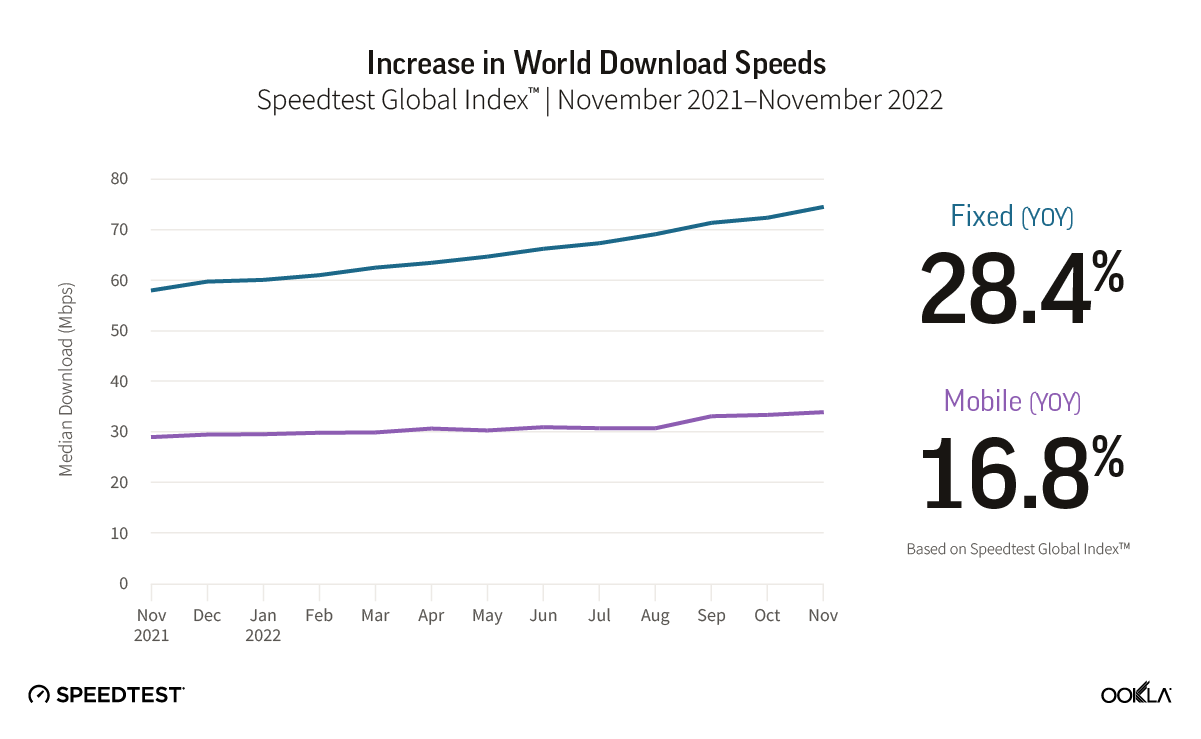
Mobile download speed jumped nearly 17% over the last year globally, fixed broadband up at least 28%
The improvement of global median download speeds has been somewhat asymmetrical over the past year on the Speedtest Global Index. Fixed broadband speeds made greater strides over the past year than mobile download speeds, with fixed broadband speeds becoming at least 28% faster and mobile becoming nearly 17% faster from November 2021 to November 2022. Gains in upload speed were even more pronounced with mobile becoming at least 9% faster and fixed broadband becoming at least 30% faster. Latency, which is becoming an increasingly important metric, decreased on mobile over the course of the year from 29 ms in 2021 to 28 ms in 2022, while fixed broadband latency remained the same at 10 ms.
Top 10 rankings remain relatively constant over the past year, U.A.E. joins fixed broadband list and Denmark, Macau (SAR), and Brunei race ahead for mobile during 2022
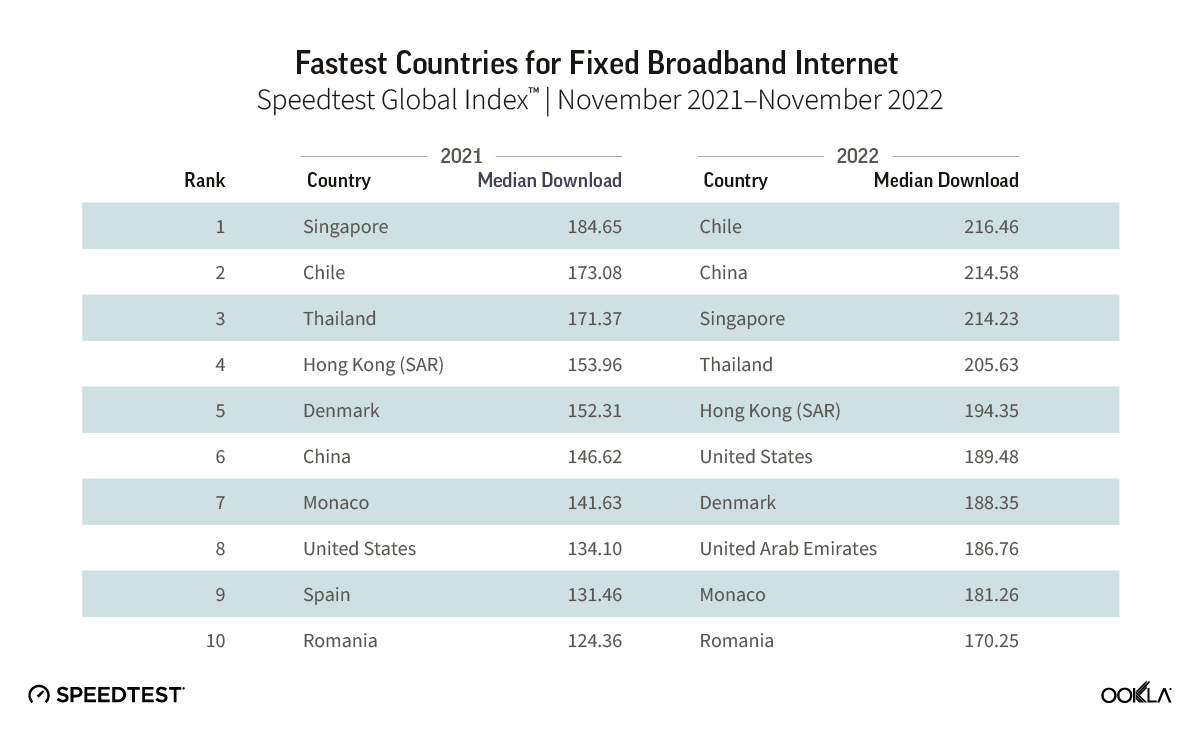
Chile raced ahead on fixed broadband
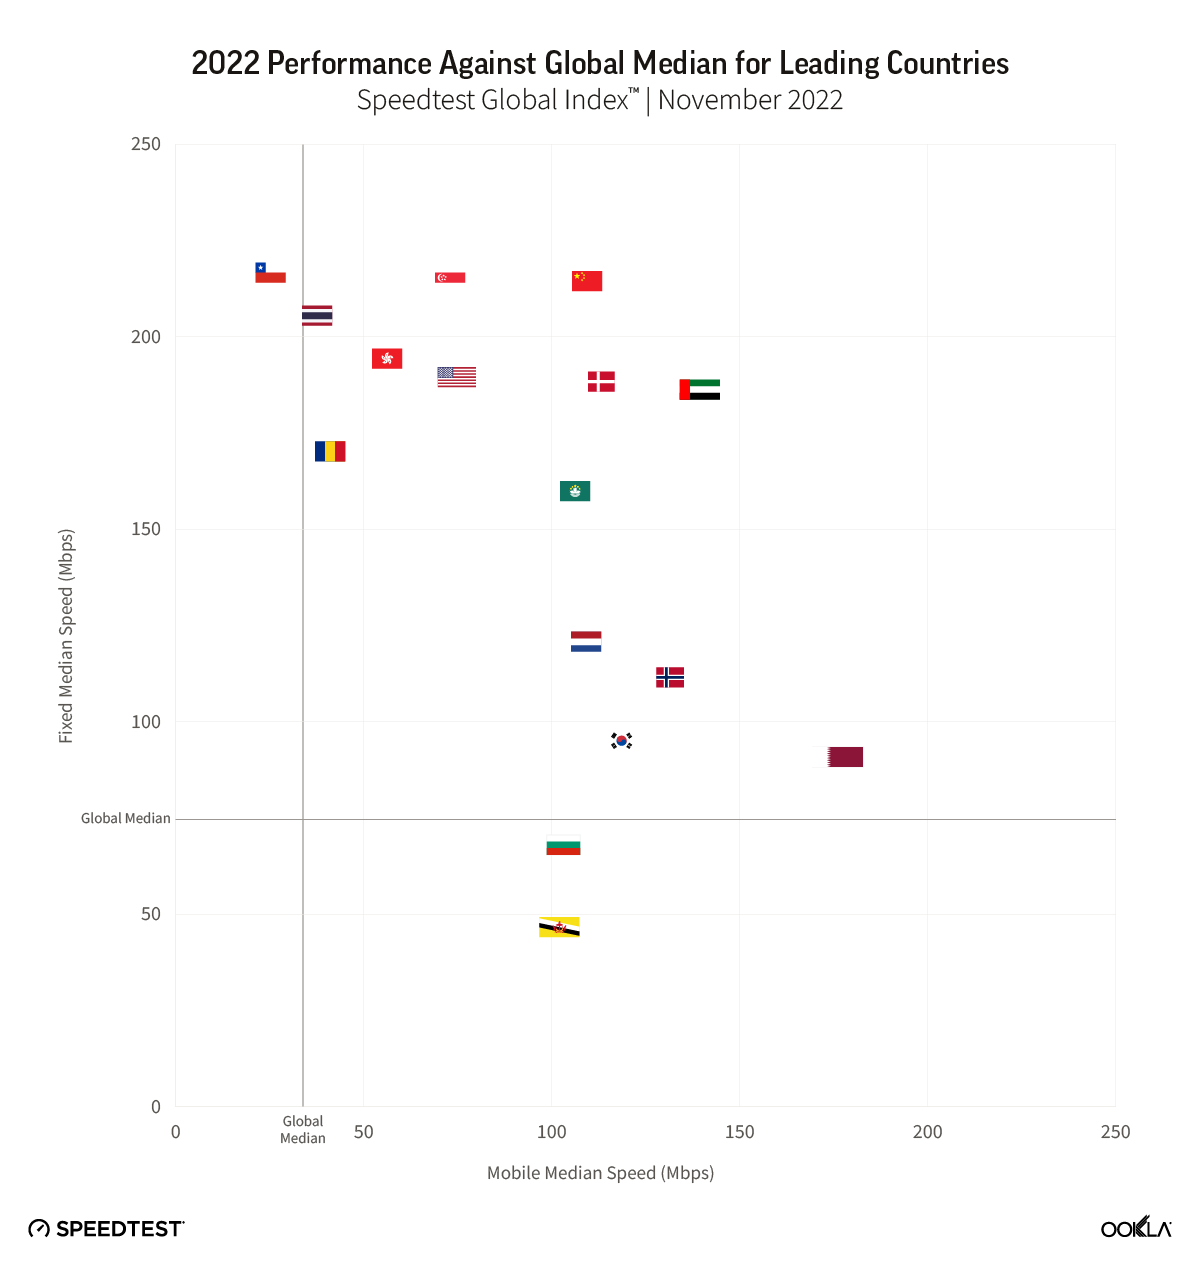
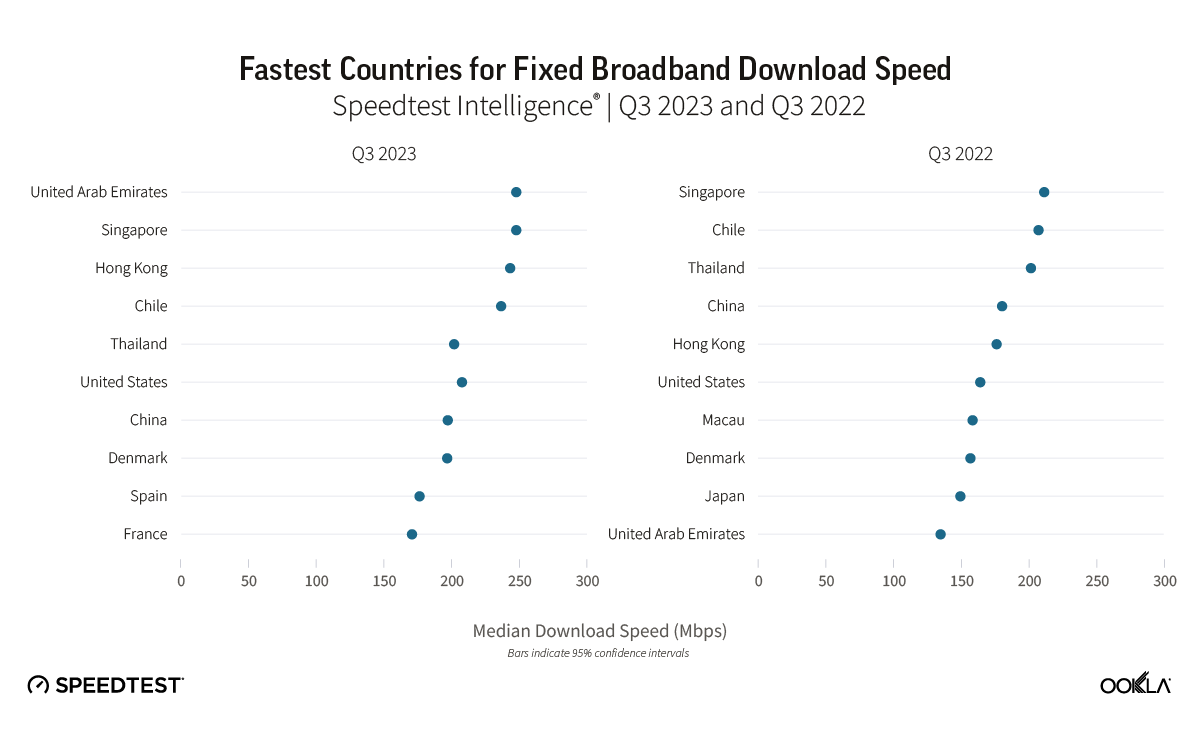
The competition for the fastest fixed broadband was neck-and-neck on the Speedtest Global Index during 2022, with Chile (216.23 Mbps) taking top honors and China (214.23 Mbps) and Singapore (214.23 Mbps) a hair behind. Over the course of the year, the top 10 countries for fastest fixed broadband remained relatively the same while each country jostled up and down the list for fixed broadband superiority. Only Spain was replaced from the top 10 with the U.A.E. taking its place. Notably, China jumped four places from sixth to second, improving its median download speed from 146.62 Mbps in 2021 to 214.58 Mbps in 2022. Romania’s tenth place finish in 2022 would have earned fourth place in 2021, showing how fast these countries are all prioritizing improved fixed broadband speeds.
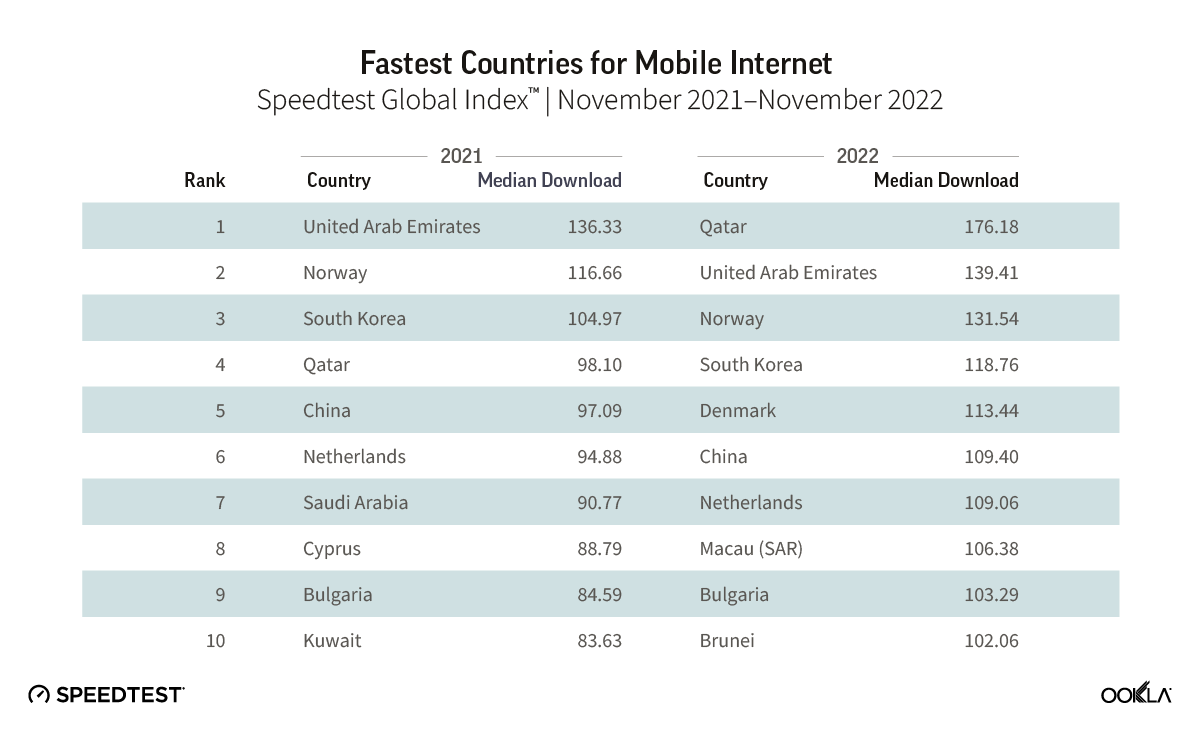
Qatar soars to first for fastest mobile country
Ahead of hosting the FIFA World Cup 2022®, Qatar rocketed to first place on the Speedtest Global Index with a median download speed of 176.18 Mbps in November 2022 from 98.10 Mbps in November 2022. Next on the list was the U.A.E. at 139.41 Mbps, which had the fastest median download speed in November 2021. Notably, all 10 countries on our November 2022 list had median mobile download speeds greater than 100 Mbps. New to our 2022 list Denmark (113.44 Mbps), Macau (SAR) (106.38 Mbps), and Brunei (102.36 Mbps) replaced Saudi Arabia, Cyprus, and Kuwait from our 2021 list.
Most of the top 10 countries perform well for fixed and mobile
Out of the 17 countries appearing on either the fastest fixed broadband or mobile Speedtest Global Index top 10s during November 2021 — with China, Denmark, and the U.A.E. appearing on both lists — all but Monaco met the statistical threshold to be included to look at overall fixed and mobile performance. Looking at the remaining 16 countries, most every country on both lists performed relatively well against the global median for both fixed and mobile, which appear as gray lines in the image above. Three countries underperformed a global median: Brunei and Bulgaria for fixed, and Chile for mobile. Thailand performed at about roughly the global median for mobile, as did Romania.
We’re excited to see how global speeds and rankings change over the next year as individual countries and their providers choose to invest and expand different technologies, particularly in 5G and fiber. Be sure to track your country’s and check in on our monthly updates on the Speedtest Global Index. If you want more in-depth analyses and updates, subscribe to Ookla Research™.
Ookla retains ownership of this article including all of the intellectual property rights, data, content graphs and analysis. This article may not be quoted, reproduced, distributed or published for any commercial purpose without prior consent. Members of the press and others using the findings in this article for non-commercial purposes are welcome to publicly share and link to report information with attribution to Ookla.
The Federal Aviation Administration (FAA) had a major service disruption early yesterday morning, affecting many travelers in the United States. Data from Downdetector® shows all of the major airlines experienced a spike in user-reported issues around the time of the outage, with a sharp rise in problem reports just before 8:00 a.m. EST. While the FAA had a nationwide computer outage that delayed the departure of hundreds of flights, Downdetector data shows all of the major airlines in the U.S. began to experience upticks in user-reported issues (mostly delays) starting at around 7:30 a.m. EST, and peaking at about 9:30 a.m. EST, and dropping in frequency shortly after that.
At 8:50 a.m. EST, the FAA lifted the stop on flights taking off, with NBC News reporting more than 6,500 flights delayed. While the problem reports started to subside after about an hour, travelers who were flying yesterday felt the aftershocks of the FAA ground stop as airlines tried to make up for the delay and travelers scrambled to reach connecting flights on time. While this issue may have been unavoidable, data from Downdetector could have alerted aviation stakeholders much more quickly, saving time, resources, and mean-time to resolution.
Downdetector Enterprise™ can help your company monitor third-party services your business relies on, such as CDN providers, so you know immediately when they go down. Using Downdetector’s real-time alerts you can quickly adjust communications to better serve your customers. Contact us here to learn how your network operations, DevOps, engineering and customer care teams can get faster outage detection. Read more here about the different types of outages and what contributes to them.
Editor’s Note: Graph was updated on January 12, 2023 to better clarify the graphic.
Ookla retains ownership of this article including all of the intellectual property rights, data, content graphs and analysis. This article may not be quoted, reproduced, distributed or published for any commercial purpose without prior consent. Members of the press and others using the findings in this article for non-commercial purposes are welcome to publicly share and link to report information with attribution to Ookla.
Ookla® Market Reports™ identify key data about internet performance in countries across the world. This quarter we’ve provided updated analyses for 44 markets using Speedtest Intelligence® and summarized a few top takeaways below. Click through to the market report to see more details and charts about the countries you’re interested in, including the fastest fixed broadband providers and mobile operators, who had the most consistent service, and 5G and device performance in select countries during Q4 2022. Jump forward to a continent using these links:
Argentina: Personal had the fastest median download speed over mobile (31.65 Mbps) and Movistar was fastest for fixed broadband (92.83 Mbps).
Belize: NEXGEN had the fastest median download over fixed broadband in Belize at 47.84 Mbps. Digi had the fastest median mobile download speed at 14.07 Mbps.
Canada: There was no fastest mobile operator in Canada. Rogers was fastest for fixed broadband (249.08 Mbps).
Colombia: Movistar was fastest for fixed broadband at 141.32 Mbps.
Dominican Republic: Claro had the fastest median download speed among mobile operators at 32.80 Mbps. SpaceX’s Starlink was fastest for fixed broadband at 50.40 Mbps.
Ecuador: The fastest mobile operator was CNT with a median download speed of 32.65 Mbps. Netlife was fastest for fixed broadband (67.57 Mbps).
El Salvador: Claro had the fastest median download speed over mobile in El Salvador at 34.37 Mbps.
Guatemala: Claro was the fastest mobile operator with a median download speed of 32.56 Mbps.
Guyana: ENet was the fastest fixed broadband provider (56.50 Mbps), while Digicel was the fastest mobile operator (30.49 Mbps).
Jamaica: Flow overtook Digicel+ as the fastest fixed broadband provider in Jamaica with a median download speed of 48.88 Mbps.
Mexico: Telcel had the fastest median download speed over mobile at 43.04 Mbps. Totalplay was fastest for fixed broadband (80.36 Mbps).
Peru: Claro was the fastest mobile operator with a median download speed of 22.08 Mbps, while Win delivered the fastest fixed broadband download speed (111.02 Mbps).
Trinidad and Tobago: Digicel had the fastest median download speed over mobile at 34.58 Mbps. Digicel+ had the fastest median fixed broadband download speed at 93.43 Mbps.
United States: T-Mobile was the fastest mobile operator with a median download speed of 151.37 Mbps. XFINITY overtook Spectrum as the fastest fixed broadband provider at 226.18 Mbps.
Afghanistan: The fastest mobile operator in Afghanistan was Afghan Wireless (6.82 Mbps).
Bangladesh: Banglalink was the fastest mobile operator in Bangladesh with a median download speed of 19.00 Mbps.
Bhutan: TashiCell had the fastest median download speed over mobile at 25.81 Mbps.
Brunei: Imagine was the fastest mobile operator in Brunei at 111.09 Mbps.
Cambodia: SINET had the fastest median download speed over fixed broadband (41.86 Mbps). Cellcard was fastest over mobile at 28.69 Mbps.
China: China Mobile was the fastest mobile operator with a median download speed of 147.45 Mbps. China Unicom was fastest for fixed broadband at 214.17 Mbps.
Indonesia: Telkomsel was the fastest Indonesian mobile operator at 20.85 Mbps.
Pakistan: Transworld had the fastest median fixed broadband download speed in Pakistan at 17.89 Mbps. Jazz was fastest over mobile at 20.84 Mbps.
Philippines: Smart delivered the fastest mobile download speed in the Philippines (32.16 Mbps).
Singapore: Singtel had the fastest median download speed over mobile at 120.24 Mbps.
Sri Lanka: SLT-Mobitel delivered the fastest mobile and fixed broadband speeds in Sri Lanka at 19.98 Mbps and 33.49 Mbps, respectively.
Vietnam: Viettel was the fastest mobile and fixed broadband provider with a median download speed over mobile of 46.52 Mbps and 87.89 Mbps for fixed broadband.
Albania: Vodafone was the fastest mobile operator with a median download speed of 45.89 Mbps. Digicom was fastest for fixed broadband (81.80 Mbps).
Austria: Magenta had the fastest median fixed broadband download speed (156.33 Mbps).
Belgium: Telenet had the fastest median download speed over fixed broadband at 131.96 Mbps, while Telenet/BASE had the fastest median download speed over mobile at 69.40 Mbps.
Denmark: YouSee was the fastest mobile operator in Denmark with a median download speed of 129.39 Mbps. Hiper was fastest for fixed broadband at 249.76 Mbps.
Estonia: The fastest mobile operator in Estonia was Telia with a median download speed of 80.48 Mbps. Elisa was fastest over fixed broadband at 85.98 Mbps.
Finland: DNA had the fastest median download speed over mobile at 91.56 Mbps. Lounea was fastest for fixed broadband at 105.57 Mbps.
Germany: Telekom was the fastest mobile operator in Germany with a median download speed of 90.33 Mbps. Vodafone was fastest for fixed broadband at 116.19 Mbps.
Latvia: LMT delivered the fastest median download speed over mobile at 71.84 Mbps. Balticom was fastest for fixed broadband at 219.23 Mbps.
Lithuania: The mobile operator with the fastest median download speed was Telia with 112.03 Mbps. Cgates was fastest for fixed broadband at 142.96 Mbps.
Malta: The fastest mobile operator in Malta was GO at 71.90 Mbps, while the fastest fixed broadband provider was Melita at 121.43 Mbps.
Poland: Orange had the fastest median download speed over mobile at 44.12 Mbps. UPC was fastest for fixed broadband at 205.62 Mbps.
Switzerland: Swisscom delivered the fastest median download speed over mobile at 100.71 Mbps, while Salt blazed ahead on fixed broadband at 355.71 Mbps.
Turkey: Turkcell was the fastest mobile operator in Turkey with a median download speed of 52.78 Mbps. TurkNet was fastest for fixed broadband at 55.82 Mbps.
Australia: Telstra was the fastest mobile operator in Australia with a median download speed of 96.16 Mbps.
New Zealand: MyRepublic had the fastest median download speed over fixed broadband in New Zealand at 283.27 Mbps.
The Speedtest Global Index is your resource to understand how internet connectivity compares around the world and how it’s changing. Check back next month for updated data on country and city rankings, and look for updated Ookla Market Reports with Q1 2023 data in April.
Ookla retains ownership of this article including all of the intellectual property rights, data, content graphs and analysis. This article may not be quoted, reproduced, distributed or published for any commercial purpose without prior consent. Members of the press and others using the findings in this article for non-commercial purposes are welcome to publicly share and link to report information with attribution to Ookla.
2023 Mobile World Congress (MWC) starts next week in Barcelona and Ookla® has new mobile data to prepare for your connected experience in and around MWC as you take in the Gaudí sights, the delicious food, and everything Barcelona has to offer. Last year, we looked at various landmarks around the city, and this year we’re back using Ookla Cell Analytics™ to highlight 4G LTE and 5G signal strength and signal quality, download throughput, and user density data at Camp Nou, Fira Gran Via, and La Sagrada Familia. In addition to network performance, coverage, and signal data, we’ve also included User Experience data on web browsing, teleconferencing, and video performance in the Barcelona province of Catalonia.
Camp Nou shows good signals don’t necessarily translate into a good connected experience
First up, we have Camp Nou, the sacred ground for famed soccer team, FC Barcelona. Unfortunately, you won’t be able to catch a game in Barcelona during MWC 2023. But if you visit Camp Nou to see all of their trophies and take in the storied atmosphere, you might have some trouble video chatting your experience to make your friends jealous. Looking at 4G LTE RSRP signal strength (ranging from -87 dBm to -100 dBm) and RSRQ signal quality (ranging from -11 dB to -14 dB) during Q4 2022, which shows that even though operators cover the stadium reasonably well, issues such as interference, poor RSRQ, and capacity do not allow for better speeds. Looking at the 4G LTE download throughput map, we see that median download speeds generally range from 5 to 100 Mbps, though there are more spots that have 5 Mbps or less in the stadium than anything higher than 100 Mbps.
Camp Nou also shows how far we’ve come since COVID-19 lockdowns
Furthermore, as you can see from the maps above — life’s back to normal at Camp Nou after COVID lockdowns in Q1 2021 when fans weren’t allowed to attend games. The user density is very dense in dark orange throughout the stadium when looking at data from the start of the soccer season in Q3 2022, while during Q1 2021 there were hardly any users in the stadium at all.
Fira Gran Via (home to MWC) has great coverage and throughput
While you’re visiting Ookla at MWC at Hall 2, Stand 2i28, you’ll get to experience some seriously fast 5G speeds as you take a Speedtest® on your iOS or Android devices at our booth, where we’ll also have other demos on hand, including Speedtest Intelligence®, Downdetector®, Cell Analytics, and more.
Comparing 4G LTE RSRP signal strength during Q1 2022 to 4G LTE RSRP signal strength during Q4 2022, we see the strong consistency of operator coverage over time. Furthermore, during Q1 2022 (and MWC 2022), the 5G download throughputs experienced at Fira Gran Via are very fast with many, if not most, speeds being greater than 500 Mbps with pockets of throughputs over 750 Mbps in most of the convention center. These show that operators have made 5G investments at the venue to ensure visitors have an excellent connected experience, whereas 5G speeds around the Fira Gran Via are a little slower, with many locations showing 5G download throughputs of only 100 to 500 Mbps.
La Rambla shows 5G’s potential compared to 4G LTE
La Rambla is Barcelona’s most popular pedestrian street, which showcases Barcelona’s Gothic Quarter and astute commitment to urbanism. A major tourist destination, as well as an important street for locals, La Rambla is full of shops, restaurants, and excellent connectivity as you can see below.
Looking at the 4G LTE RSRP signal strength maps during Q3 2022 (which is the peak of the tourist season) and the period covering the last three months, we see that most operators’ signal strength improves slightly, with only Yoigo seeing a slight decline over time. With fewer tourists in the off seasons, that may be a sign of shifting user patterns or optimization changes. It’s clear every operator has prioritized the area and is delivering strong signals.
Looking at 4G LTE vs. 5G download throughput during Q3 2022, we see a stark contrast and evidence that 5G is typically much faster than 4G LTE on La Rambla. As you can see, 5G reaches speeds over 100 Mbps throughout much of La Rambla, with concentrated areas of speeds over 500 Mbps around Catalonia Square near the top of the map, which has a few throughputs of over 750 Mbps. While there are still some slower areas of 5G download throughput, almost all of the 4G LTE download throughputs range between 5 to 100 Mbps with a few areas of fast 4G LTE over 100 Mbps near the center of the map, all of which will allow you to access social media, stream audio and video, and download apps quickly.
User Experience data in Cell Analytics sheds light on mobile user experience in Catalonia’s Barcelona province
Finally, looking at Catalonia’s Barcelona province, we examine latency, video conferencing latency, and page load time over the past year.
Data collected over the last year shows Movistar had a median latency at 116 ms, followed by Yoigo (119 ms), Vodafone (123 ms), and Orange (124 ms) in the Barcelona province of Catalonia. Median video conferencing latency showed Yoigo at 44 ms, while Movistar was next (45 ms), followed by Vodafone (48 ms), and Orange (54 ms), which are all more than plenty to be able to have a video call. Median page load time was tight with Yoigo at 1,123 ms and Movistar at 1,126 ms. Vodafone followed at 1,193 ms, and Orange followed at 1,221 ms. Importantly, all operators still came in under a 2016 benchmark Google found where 53% of users will abandon a website if it doesn’t load in under 3 seconds.
Cell Analytics can help you optimize your network where it will most improve consumer experience
We hope this tour of mobile coverage and performance at a few of Barcelona’s landmarks shows you how useful Cell Analytics is for benchmarking and improving your network. For more details, watch our recent webinar, Discover Hidden Network Problems Using Real-World QoS and QoE Measurements. To learn more about Cell Analytics, including the newly available User Experience and Radio Network Coverage modules, please inquire today or come by Hall 2, Stand 2i28 at MWC for a demo.
Ookla retains ownership of this article including all of the intellectual property rights, data, content graphs and analysis. This article may not be quoted, reproduced, distributed or published for any commercial purpose without prior consent. Members of the press and others using the findings in this article for non-commercial purposes are welcome to publicly share and link to report information with attribution to Ookla.
The new Samsung Galaxy S23, S23+, and S23 Ultra models launched February 17 and Ookla® is here today to see how they’ve performed over 5G against their predecessor S22 models. Our analysis looks at data from the first month after launching in 12 of the largest mobile markets with an established 5G market and the highest number of connected mobile devices during Q4 2022 according to GSMA. Previously, in October 2022, we used Speedtest Intelligence® to look at 5G performance data right after the launches of the iPhone 14 and Samsung Galaxy Z Fold4 in various countries.
Note that device data differs across markets due to a variety of factors, including: 5G investments by governments and mobile operators, different 5G spectrum allocations by operator, 5G Availability, the number of and different kinds of 5G deployments, and other differences, including mobile 5G plans. Read on to learn more and see whether or not you should upgrade your Samsung S22 to a newer model.
Key takeaways:
The Samsung S23 models only statistically outperformed corresponding S22 models in Germany and two out of three models in the United States for 5G download speed, but the S23 looks poised to be faster as further 5G adoption and build out continues and more spectrum is allocated for 5G across the C-band and mmWave frequencies.
Key improvements to the new Galaxy S23 models
You want to know if the latest technology is worth the price of an upgrade when you’re looking for a new phone. The S23, S23+, and S23 Ultra have various upgrades, but when it comes to performance, here’s a quick list of what’s different between the new and older models.
All Samsung Galaxy S23 vs. S22 models
The Samsung S23 models have a Qualcomm Snapdragon 8 Gen 2, while the Samsung S22 models have a Samsung Snapdragon 8 Gen 1
The S23 has a bigger battery capacity at 3,900 mAh over the S22’s 3,700 mAh
The S23 has slightly better ultra-wide and front cameras and video recording capabilities
Samsung Galaxy S23+ vs. S22+ models
The S23+ has expanded storage capacity at a base level of 256 GB (which can be upgraded to 512 GB) over the S22+’s base of 128 GB
The S23+ has a bigger battery capacity at 4,700 mAh over the S22+’s 4,500 mAh
The S23+ has slightly better ultra-wide and front cameras and video recording capabilities
Samsung Galaxy S23 Ultra vs. S22 Ultra models
The S23 Ultra has expanded storage capacity at a base level of 256 GB (which can be upgraded to 512 GB) over the S22 Ultra’s base of 128 GB
The S23 Ultra has much better main camera, with up to 200 MP vs. the S22 Ultra’s maximum of 108 MP
Samsung Galaxy S23 performance in the world’s largest mobile device markets
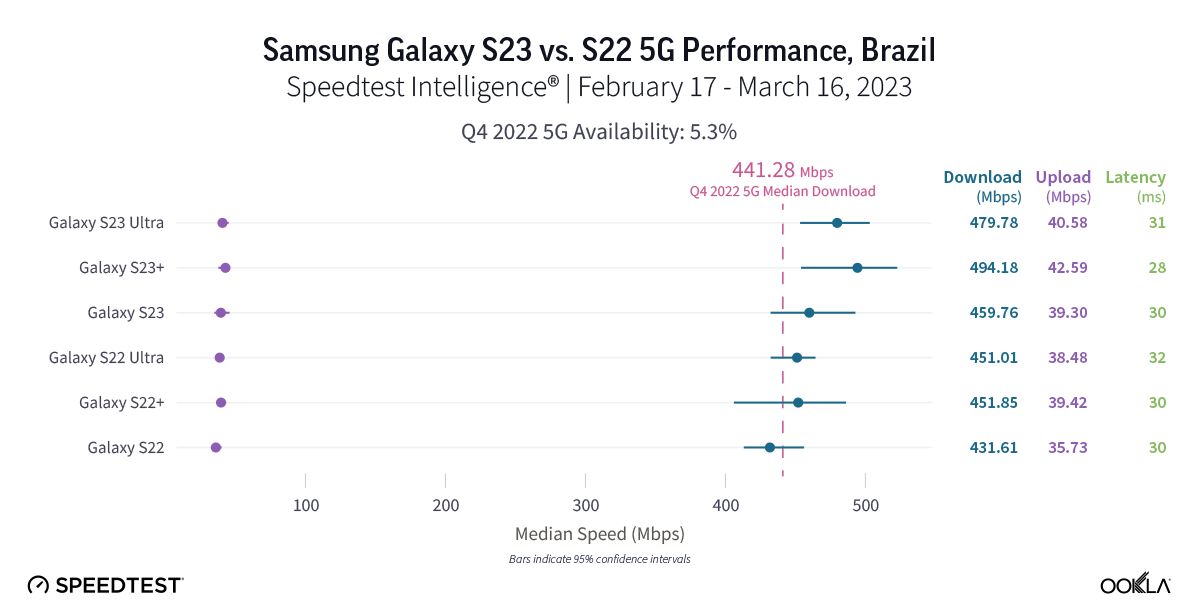
Brazilian S22 and S23 users saw seriously fast 5G speeds (even though 5G Availability remains low)
Speedtest Intelligence shows that the new S23 models were not yet statistically faster than the older S22 models in Brazil during the first month of launch, but they did exceed the median 5G download speed in Brazil during Q4 2022. Despite that, every S22 and S23 model had blazing fast speeds in Brazil, with median 5G download speeds faster than 400 Mbps. The S22 had a median download speed of 431.61 Mbps, the S22 Ultra was at 451.01 Mbps, and the S22+ at 451.85 Mbps. While the S23 models were not statistically faster than their S22 counterparts, the S23 had a median download speed of 459.76 Mbps, the S23 Ultra at 479.78 Mbps, and the S23+ at 494.18 Mbps. 5G upload speeds showed a similar trend, with no statistically faster S22 or S23 model, but with S22 models ranging from 35.73 Mbps to 39.42 Mbps and S23 models ranging from 39.30 Mbps to 42.59 Mbps. Multi-server latency — the latency you should expect to encounter more generally when your network is not under heavy load — ranged from 28.01 ms to 31.78 ms across all models over 5G.
Recommendation: BrazilianGalaxy S22 users should consider upgrading your phone if you can get 5G access; you’re going to get fast speeds and the new features of the S23, especially the camera of the S23 Ultra, may be worth it alone.
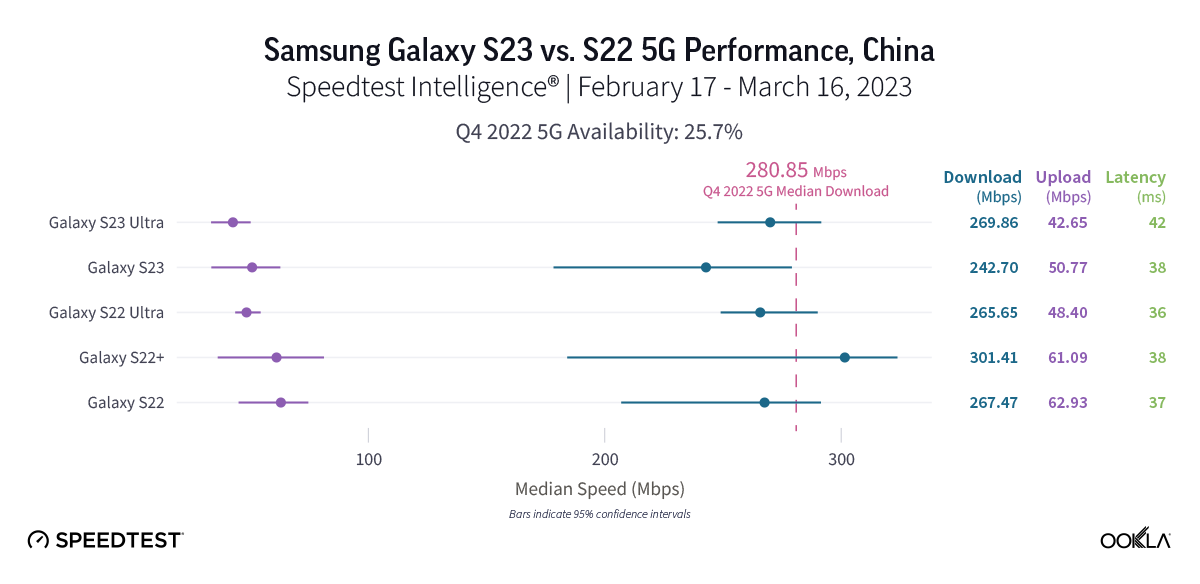
Chinese S23 users haven’t quite seen an improved 5G experience over S22 users
Data from the first month since the Samsung S23 launching illuminates that S23 models did not statistically outperform S22 models over 5G in China, and S23 models also didn’t quite exceed the Q4 2022 median 5G download speed. The S22 had a median 5G download speed of 267.47 Mbps, the S22 Ultra was similar at 265.65 Mbps, and the S22+ was at 301.41 Mbps. The S23 showed a median 5G download speed at 242.70 Mbps, while the S23 Ultra had a median download speed of 269.86 Mbps. 5G upload speeds on S22 models ranged from 48.40 Mbps to 62.93 Mbps, while the S23 and S23 Ultra were at 50.77 Mbps and 42.65 Mbps, respectively. While the S23 models showed lower median multi-server latency over 5G, there was no statistical winner between the S22 and S23 models. The S23+ did not meet the statistical threshold for inclusion in our analysis in China.
Recommendation: ChineseGalaxy S22 users should wait to upgrade your phone until speeds improve, unless the new S23 model hardware upgrades have you wanting a new phone.
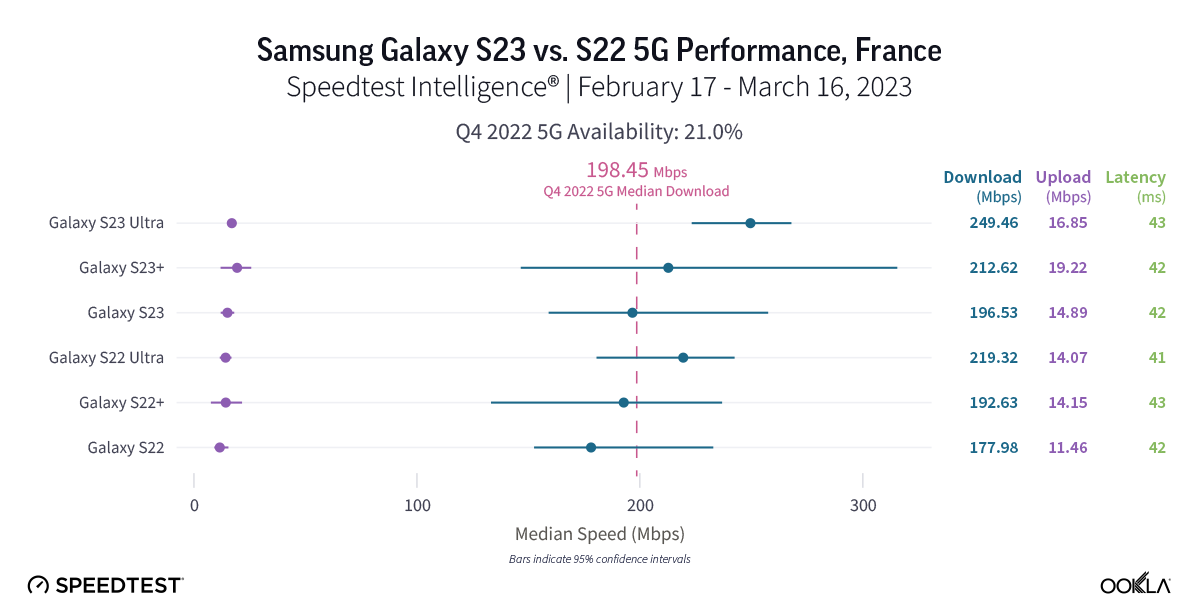
French S23 users saw promising 5G results, S22 users might want to wait to upgrade
There was no statistically faster Samsung Galaxy S22 or S23 model over 5G in France during the first month of the S23’s release. However, median 5G download speeds for the S22 models ranged from 177.98 Mbps to 219.32 Mbps, while the S23 models ranged from 196.53 to 249.46 Mbps. 5G upload speeds showed a similar story, with no statistical winner. Upload speeds on S22 models ranged from 11.46 Mbps to 14.15 Mbps, and upload speeds on S23 models ranged from 14.89 Mbps to 19.22 Mbps. 5G multi-server latency was virtually the same for both models, which all ranged from 41.40 ms to 43.24 ms.
Recommendation: FrenchGalaxy S22 users who want faster speeds might want to wait to upgrade your phone, but the new features of the S23 may make upgrading very tempting.
German Samsung Galaxy S22 users should feel confident upgrading to S23 models
Speedtest Intelligence reveals that German S23 users experienced faster 5G download speeds than their S22 counterparts during the first month of S23 availability across all models. The S23 outperformed the S22 for median 5G download speed, 147.26 Mbps to 112.01 Mbps, the S23 Ultra outperformed the S22 Ultra 141.56 Mbps to 124.45 Mbps, and the S23+ outperformed the S22+ 174.74 Mbps to 128.69 Mbps. Upload speeds had a bit more parity with the S22 models showing a range of 5G upload speeds from 20.47 Mbps to 26.10 Mbps, while the S23 models showed a range from 23.59 Mbps to 31.64 Mbps. Multi-server latency over 5G showed no statistical winner for either model but ranged from 36.76 ms to 38.58 ms.
Recommendation: GermanyGalaxy S22 users shouldn’t hesitate to run to your operator to immediately upgrade your phone to an S23 model for faster speeds and better features.
Samsung Galaxy S23 users in Italy saw mixed 5G results after launch
New Speedtest Intelligence data reveals that while the basic S23 model outperformed the S22 model over 5G in Italy for median download speed 178.67 Mbps to 128.53 Mbps during the first month after launch, the S23 Ultra and S23+ models didn’t statistically outperform their S22 counterparts. That held true for upload speeds as well, with the S23 recording a median 5G upload speed of 21.73 Mbps to the S22’s 15.50 Mbps, while the S23 Ultra and S23+ weren’t statistically faster than the S22 Ultra and S22+, respectively. All of the S23 and S22 models during the first month of the S23 launch, except the S22 base model, were statistically faster than the 5G median download speed in Italy during Q4 2022. Median multi-server latency showed closer parity, with S22 models ranging from 45.02 ms to 47.79 ms, and S23 models ranging from 43.50 ms to 48.24 ms.
Recommendation: Unless you want a basicGalaxy S23 model and have consistent 5G access in Italy, you might want to wait to upgrade your phone to the S23 models unless you really want the new features.
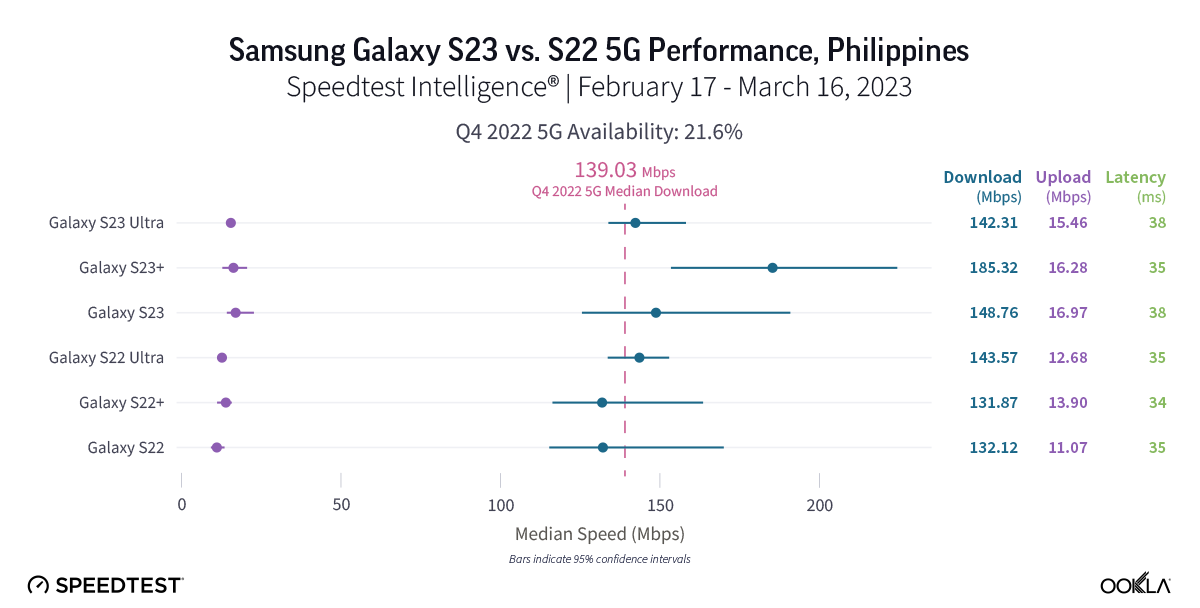
Samsung Galaxy S23 showed 5G potential in the Philippines
Fresh data from Speedtest Intelligence shows that while the S23 and S23+ had faster median 5G download speeds than their S22 counterparts during the first month of the S23’s launch, there were no statistical winners between the models in the Philippines. The S23 models’ median 5G download speeds ranged from 142.31 Mbps to 185.32 Mbps, while the S22 models ranged from 131.87 Mbps to 143.57 Mbps. Median 5G upload speed for the S23 Ultra was faster than its S22 Ultra counterparts at 15.46 Mbps to 12.68 Mbps, respectively. There were no statistical winners for median multi-server latency over 5G, though the S22 models ranged from 35.42 ms to 38.39 ms, while the S23 models ranged from 34.29 ms to 35.31 ms.
Recommendation: FilippinoGalaxy S22 users should upgrade their phones to the S23 models if they want new features, but shouldn’t expect faster speeds and a better experience quite yet.
Polish Samsung S23 models had a promising debut over 5G
Speedtest Intelligence data shows Poland had some of the slowest median 5G download speeds on Samsung S23 and S22 models among the countries we surveyed. While the new S23 models had a higher median 5G download speed than their counterparts during the first month after launching, there were no statistically significant faster speeds. The S23 models ranged from 83.74 Mbps to 98.99 Mbps, while the S22 models ranged from 75.70 Mbps to 80.43 Mbps. Upload speeds were similarly faster, but not statistically so, with S22 models ranging from 16.89 Mbps to 19.62 Mbps and S23 models ranging from 19.94 Mbps to 24.25 Mbps. Median multi-server latency over 5G was a mixed bag, with the new S23+ actually having a higher latency than the S22+ 44.25 ms to 38.37 ms, respectively. The other two models were too close to call.
Recommendation: PolishGalaxy S22 users can upgrade their phones to the S23 models for the new features, but might not yet experience faster 5G speeds on the new models.
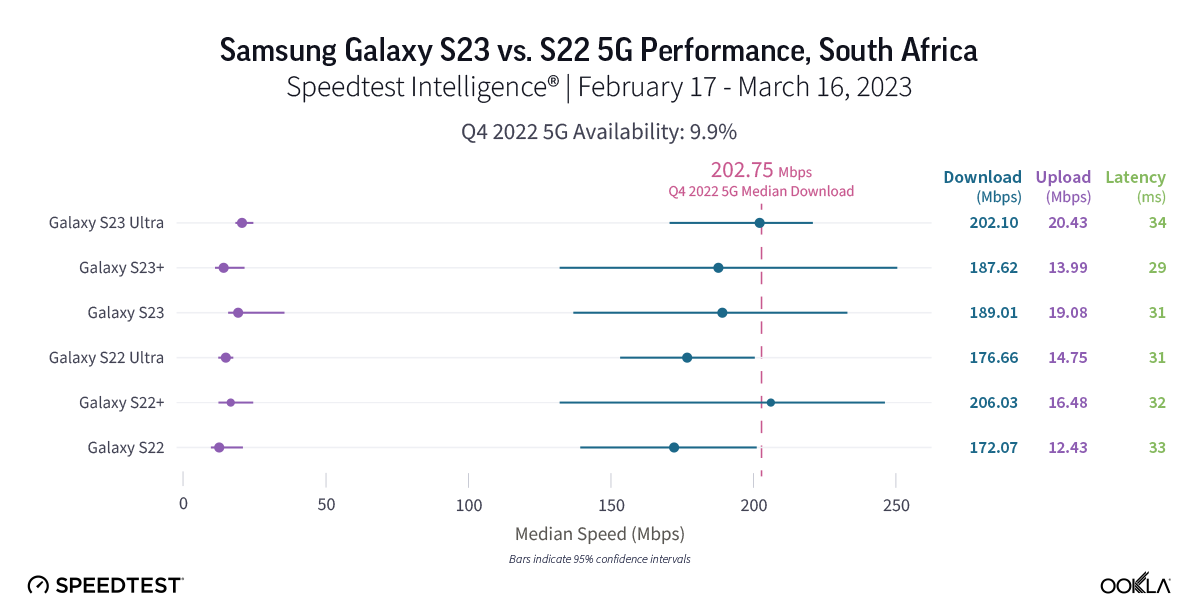
Samsung S23 models in South Africa don’t live up to the hype just yet
Speedtest Intelligence reveals that the new S23 models weren’t yet statistically faster than their S22 counterparts over 5G in South Africa during the first month after launch. S22 models had median 5G download speeds that ranged from 172.07 Mbps to 206.03 Mbps, while the S23 models ranged from 187.62 Mbps to 202.10 Mbps. There was one bright note — the median 5G upload speed for the S23 Ultra was faster than the S22 Ultra 20.43 Mbps to 14.75 Mbps. Median multi-server latency showed parity over 5G for the S22 models and S23 models. The S22 models ranged from 29.06 ms to 33.75 ms, while the S23 models ranged from 31.41 ms to 32.92 ms.
Recommendation: South AfricanGalaxy S22 users should probably wait to upgrade their phones to the S23 models if they are looking for faster 5G experience, but the S23 features may outweigh the parity in speeds between models.
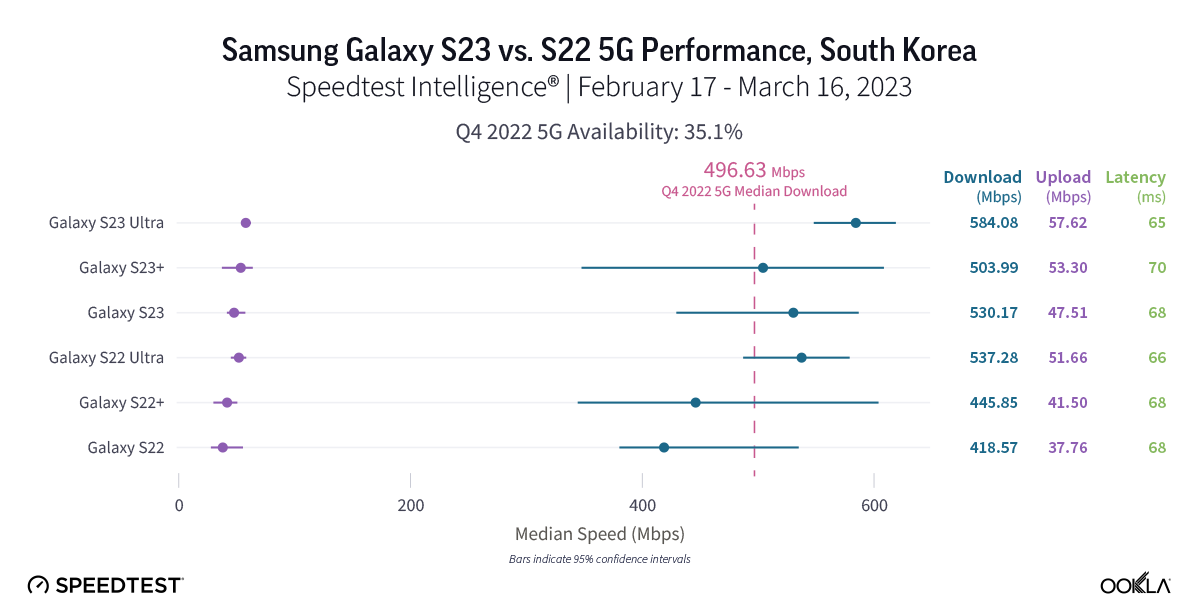
South Koreans saw fast 5G speeds on the new Samsung Galaxy S23 models
Home to Samsung, South Korea showed some of the fastest 5G speeds on our list. Every S23 model had a faster median 5G download speed than the corresponding S22 models, but statistical winners remained elusive during the first month after launch, which we expect will probably change upon more adoption in the near future. S22 models recorded median 5G download speeds between 418.57 Mbps and 537.28 Mbps, while the S23 models ranged from 503.99 Mbps and 584.08 Mbps. Upload speeds were similarly impressive — though with no statistically faster median 5G upload speeds than another — with S22 models ranging from 37.76 Mbps to 51.66 Mbps over 5G, and S23 models ranging from 47.51 Mbps to 57.62 Mbps. Median multi-server latency over 5G showed ranges from 65.00 ms to 69.81 ms for the S22 models, and a range of 66.13 ms to 68.15 ms for the S23 models.
Recommendation: If you’re a South KoreanGalaxy S22 user, you can probably expect slightly faster speeds if you upgrade to the new S23 models, but an upgrade for the new features, especially for the new S23 Ultra camera, might be more justified.
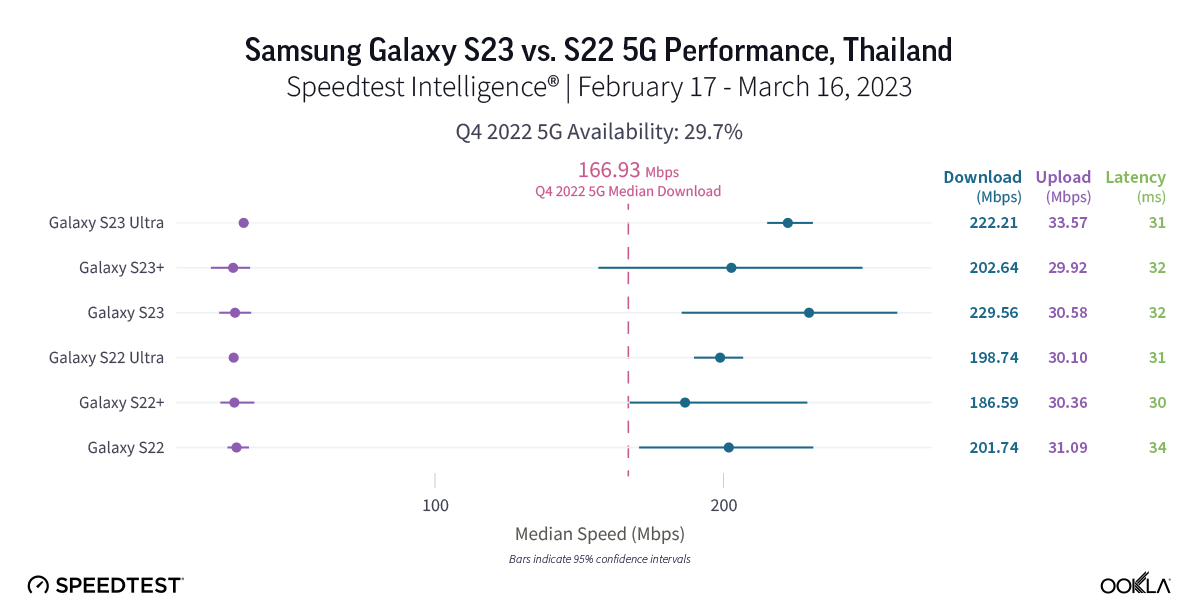
Thai Samsung Galaxy S22 and S23 users saw faster 5G speeds than the median average during Q4 2022
Speedtest Intelligence shows that the Samsung Galaxy S23 Ultra was the only S23 model to achieve faster median 5G speeds than its predecessor in Thailand during the first month after launching. The S23 Ultra outperformed the S22 Ultra 222.21 Mbps to 198.74 Mbps over 5G for download speed and 33.57 Mbps to 30.10 Mbps for upload speed, respectively. The S23 and S23+ were not statistically faster, though the S23+ and S23 had median 5G download speeds of 202.64 Mbps and 229.56 Mbps, respectively. Median 5G multi-server latency showed close parity with the S22 ranging from 31.06 ms to 32.34 ms and the S23 ranging from 30.40 ms to 34.14 ms.
Recommendation: ThaiGalaxy S22 Ultra users should feel confident in upgrading your phones to the S23 Ultra, especially for the new features. If you are a S22 and S22+ 5G user, you should absolutely consider upgrading, but might not yet see faster speeds.
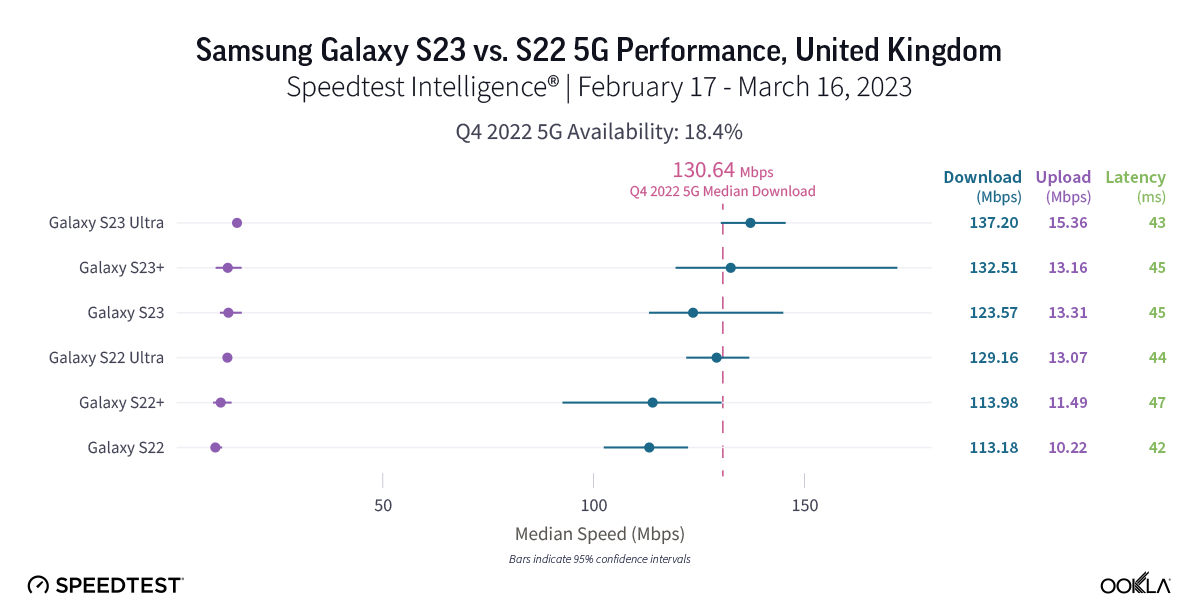
Samsung Galaxy S23 results showed potential in the United Kingdom, but you still may want to wait to upgrade
New 5G data from the U.K. reveals that while the new Samsung Galaxy S23 models have higher median download speeds, the S23 models are not statistically faster than the S22 models. The S22 models had median 5G download speeds that ranged from 113.18 Mbps to 129.16 Mbps, and the S23 models ranged from 123.57 Mbps to 137.20 Mbps. 5G download speeds in the U.K. weren’t the slowest we saw among the countries we surveyed, but they were quite close to Poland’s bottom-tier results. The S23 Ultra was one stand-out performer, which had a faster median 5G upload speed than the S22 Ultra at 15.36 Mbps to 13.07 Mbps, though the other models weren’t significantly faster, but came close. Median multi-server latency over 5G was too statistically close to call, with the S22 models between 43.04 ms and 45.09 ms, and the S23 models between 41.77 ms and 46.63 ms.
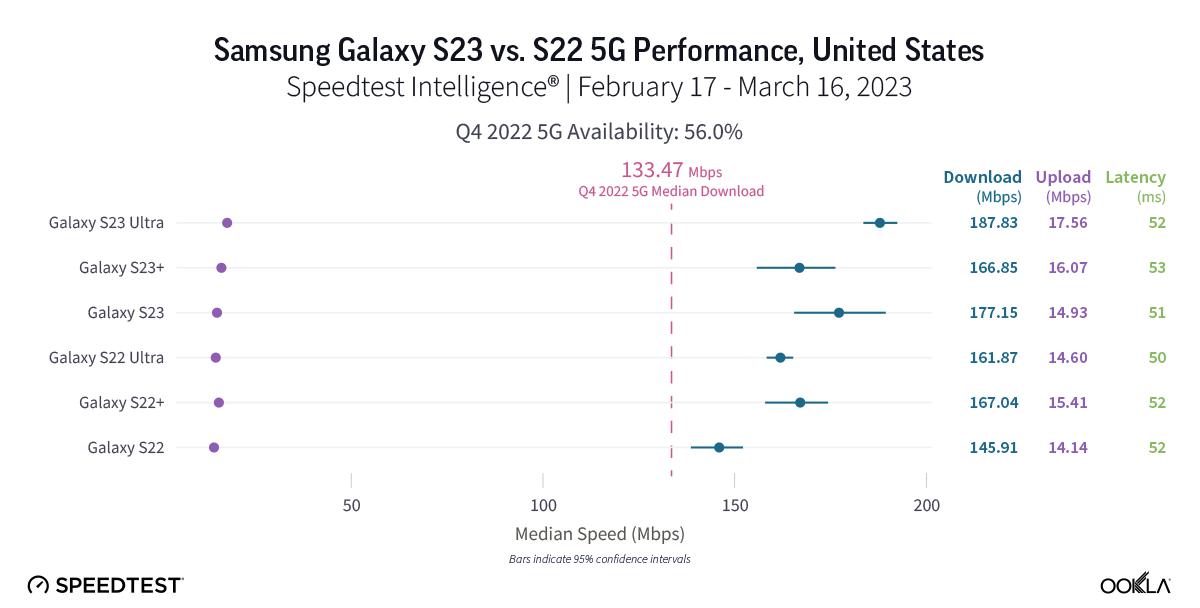
If you have 5G and a Samsung Galaxy S22 in the United States, don’t hesitate to upgrade to an S23 model
New data from Speedtest Intelligence reveals that during the first month of the Samsung Galaxy S23 series’ availability, the S23 and S23 Ultra outperformed the S22 and S22 Ultra for 5G download speeds, respectively, while the S23+ and S22+ were statistically too close to call. The S23 raced ahead of the S22 177.15 Mbps to 145.91 Mbps, and the S23 Ultra was faster than the S22 Ultra at 187.83 Mbps to 161.87 Mbps. All of the S22 and S23 models outperformed the median 5G download speed in the U.S. during Q4 2022. The Samsung S23 Ultra was the only S23 model to statistically outperform its counterpart for median 5G upload speeds, with an upload speed of 17.56 Mbps to 14.60 Mbps. The S23 and S23+ were too close to call. Looking at median multi-server latency over 5G, the S23 Ultra edged ahead of its S22 Ultra counterpart 50.44 ms to 51.52, while the other S23 didn’t have a statistical leg up.
Recommendation: U.S.Samsung Galaxy S22 users shouldn’t hesitate to upgrade to the S23 models, especially for the new features and hardware — particularly if you want the S23 Ultra’s 200 MP camera. With 5G networks increasingly getting faster, we suspect the S23 models have yet to see their full potential in the U.S., too.
The Speedtest® Android app can help benchmark your device’s 5G performance
After promising launches that have seen the Samsung Galaxy S23 models pull ever-so-slightly ahead in the U.S. and Germany, you can track how the Samsung Galaxy S23 performs on our next release of Ookla Market Reports™. If you recently upgraded your phone, be sure to download the Android Speedtest app to make sure you are getting the speeds you need along with access to video testing. We’ll be back throughout the year with fresh data on new phone launches, so if you’re considering upgrading your phone, be on the lookout for a new Ookla® device report.
Ookla retains ownership of this article including all of the intellectual property rights, data, content graphs and analysis. This article may not be quoted, reproduced, distributed or published for any commercial purpose without prior consent. Members of the press and others using the findings in this article for non-commercial purposes are welcome to publicly share and link to report information with attribution to Ookla.
Ookla® Market Reports™ identify key data about internet performance in countries across the world. This quarter we’ve provided updated analyses for 47 markets using Speedtest Intelligence® and summarized a few top takeaways below. Click through to the market report to see more details and charts about the countries you’re interested in, including the fastest fixed broadband providers and mobile operators, who had the most consistent service, and 5G and device performance in select countries during Q1 2023. Jump forward to a continent using these links:
Cameroon: Speedtest Intelligence reveals that MTN had the fastest median mobile download speed in Cameroon at 14.46 Mbps during Q1 2023. blue had the lowest median mobile multi-server latency at 184 ms.
Ethiopia: Safaricom had the fastest median mobile download speed at 32.81 Mbps during Q1 2023. Ethio Telecom had the lowest median mobile multi-server latency at 55 ms.
Tanzania: There were no winners over fastest fixed broadband and mobile in Tanzania during Q1 2023. Dar es Salaam had the fastest median mobile download speed among Tanzania’s most populous cities at 28.73 Mbps during Q1 2023.
Argentina: Personal had the fastest median download speed over mobile (32.62 Mbps) and Movistar was fastest for fixed broadband (94.26 Mbps). Movistar had the lowest median multi-server latency over fixed broadband at 12 ms.
Belize: NEXGEN had the fastest median download over fixed broadband in Belize at 47.35 Mbps. Digi had the fastest median mobile download speed at 18.39 Mbps.
Canada: Bell was the fastest mobile operator in Canada with a median download speed of 111.11 Mbps at Q1 2023. Bell also had the fastest median 5G download speed at 183.29 Mbps. Bell pure fibre was fastest for fixed broadband (281.94 Mbps).
Colombia: Movistar was fastest for fixed broadband with a median download speed of 151.74 Mbps. ETB had the lowest median multi-server latency over fixed broadband at 8 ms.
Dominican Republic: Claro had the fastest median download speed among mobile operators at 32.01 Mbps. Viva had the lowest mobile multi-server latency at 43 ms. SpaceX’s Starlink was fastest for fixed broadband at 45.65 Mbps.
Ecuador: The fastest mobile operator was CNT with a median download speed of 30.82 Mbps. Netlife was fastest for fixed broadband (71.82 Mbps). Fibramax had the lowest multi-server latency over fixed broadband at 9 ms.
El Salvador: Claro had the fastest median download speed over mobile in El Salvador at 39.09 Mbps.
Guatemala: Claro was the fastest mobile operator in Guatemala with a median download speed of 33.13 Mbps. Claro also had the highest Consistency with 84.5% of results showing at least a 5 Mbps minimum download speed and 1 Mbps minimum upload speed.
Guyana: ENet was the fastest fixed broadband provider (60.27 Mbps), while Digicel was the fastest mobile operator (35.60 Mbps). ENet also had the lowest median multi-server latency over fixed broadband at 120 ms.
Haiti: Digicel was the fastest mobile operator in Haiti with a median mobile download speed of 11.12 Mbps. SpaceX Starlink had the fastest fixed broadband internet at 46.76 Mbps. Natcom had the lowest median mobile multi-server latency at 62 ms.
Jamaica: Flow was the fastest fixed broadband provider in Jamaica with a median download speed of 50.50 Mbps. Flow also had the lowest median multi-server latency at 36 ms.
Mexico: Telcel had the fastest median download speed over mobile at 45.54 Mbps. Totalplay was fastest for fixed broadband (78.94 Mbps) and had the lowest median multi-server latency at 26 ms.
Peru: Claro was the fastest mobile operator with a median download speed of 22.39 Mbps. Apple devices had the fastest median download speed among top device manufacturers at 29.68 Mbps.
Suriname: Telesur had the fastest median download speed over mobile at 51.18 Mbps. There was no winner over fixed broadband, but Digicel+ had the lowest median multi-server latency at 57 ms.
Trinidad and Tobago: Digicel had the fastest median download speed over mobile at 37.56 Mbps. Digicel+ had the fastest median fixed broadband download speed at 94.27 Mbps and the lowest median multi-server latency at 7 ms.
United States: T-Mobile was the fastest mobile operator with a median download speed of 165.22 Mbps. T-Mobile also had the fastest median 5G download speed at 220.70 Mbps. Spectrum edged out XFINITY as the fastest fixed broadband provider with a median download speed of 234.80 Mbps. Verizon had the lowest median multi-server latency on fixed broadband at 15 ms.
Afghanistan: The fastest mobile operator in Afghanistan was Afghan Wireless (5.92 Mbps), which also had the lowest median multi-server latency at 84 ms.
Bangladesh: Banglalink was the fastest mobile operator in Bangladesh with a median download speed of 21.94 Mbps. DOT Internet was fastest over fixed broadband at 89.50 Mbps and had the lowest median multi-server latency at 5 ms.
Bhutan: There was no fastest mobile operator in Bhutan during Q1 2023, but BT had the lowest median multi-server latency at 66 ms.
Brunei: There was no statistical winner on mobile during Q1 2023, but Apple devices had the fastest median download speed at 113.48 Mbps.
Cambodia: SINET had the fastest median download speed over fixed broadband (42.00 Mbps). Cellcard was fastest over mobile at 32.05 Mbps.
China: China Mobile was the fastest mobile operator with a median download speed of 138.95 Mbps. China Mobile also had the fastest median mobile 5G download speed at 291.24 Mbps. China Unicom was fastest for fixed broadband at 221.07 Mbps.
Georgia: MagtiCom had the fastest median fixed broadband speed in Georgia at 27.65 Mbps during Q1 2023. MagtiCom also had the lowest median multi-server latency at 11 ms. Geocell was fastest over mobile at 40.81 Mbps.
Indonesia: Telkomsel was the fastest Indonesian mobile operator with a median download speed of 24.48 Mbps. Telkomsel also had the lowest median mobile multi-server latency at 45 ms.
Japan: NTT DoCoMo was the fastest mobile operator with a median download speed of 48.86 Mbps during Q1 2023. So-net had the fastest fixed broadband speed at 282.13 Mbps, as well as the lowest median multi-server latency at 9 ms.
Malaysia: TIME was the fastest fixed broadband provider in Malaysia (107.56 Mbps) and had the lowest multi-server latency at 9 ms.
Pakistan: Transworld had the fastest median fixed broadband download speed in Pakistan at 16.23 Mbps. Jazz was fastest over mobile at 21.93 Mbps. Zong had the lowest median mobile multi-server latency at 46 ms.
Philippines: Smart delivered the fastest mobile download speed in the Philippines (33.39 Mbps).
Singapore: Singtel had the fastest median download speed over mobile at 119.66 Mbps. StarHub had the lowest median mobile multi-server latency at 26 ms. SingTel had the fastest fixed broadband speed (263.13 Mbps).
South Korea: KT delivered the fastest median download speed over fixed broadband in South Korea at 145.28 Mbps. SK Telecom had the fastest mobile speed at 194.41 Mbps.
Sri Lanka: SLT-Mobitel delivered the fastest mobile and fixed broadband speeds in Sri Lanka at 20.62 Mbps and 44.76 Mbps, respectively. Dialog had the lowest median mobile multi-server latency at 36 ms.
United Arab Emirates: Etisalat had the fastest median fixed download speed (255.01 Mbps) and median mobile download speed (184.58 Mbps) in the UAE during Q1 2023. Etisalat also had the fastest median 5G download speed at 672.04 Mbps and lowest median multi-server latency at 35 ms.
Albania: ONE overtook Vodafone as the fastest mobile operator in Albania with a median download speed of 48.44 Mbps during Q1 2023. ONE also had the lowest median mobile multi-server latency at 34 ms. Digicom was fastest for fixed broadband (87.71 Mbps).
Belgium: Telenet had the fastest median download speed over fixed broadband at 135.65 Mbps, while Telenet/BASE had the fastest median download speed over mobile at 69.48 Mbps.
Denmark: YouSee was the fastest mobile operator in Denmark with a median download speed of 137.28 Mbps. Hiper was fastest for fixed broadband at 258.41 Mbps.
Estonia: The fastest mobile operator in Estonia was Telia with a median download speed of 91.34 Mbps. Telia had the lowest median multi-server latency on mobile at 30 ms. Elisa was fastest over fixed broadband at 92.20 Mbps.
Finland: DNA had the fastest median download speed over mobile at 101.59 Mbps. Lounea was fastest for fixed broadband at 107.84 Mbps and had the lowest median multi-server latency at 11 ms.
Germany: Telekom was the fastest mobile operator in Germany with a median download speed of 96.61 Mbps. Deutsche Glasfaser overtook Vodafone as the fastest fixed broadband provider at 183.20 Mbps. Deutsche Glasfaser also had the lowest median multi-server latency at 14 ms.
Latvia: While there was no fastest mobile operator in Latvia during Q1 2023, Balticom was fastest for fixed broadband with a median download speed of 238.41 Mbps. Balticom also had the lowest median fixed broadband multi-server latency at 4 ms.
Lithuania: The mobile operator with the fastest median download speed was Telia at 109.53 Mbps. Cgates was fastest for fixed broadband at 151.33 Mbps.
Poland: UPC was the fastest provider for fixed broadband with a median download speed of 214.34 Mbps. There was no statistical winner over mobile during Q1 2023.
Switzerland: Salt blazed ahead for the fastest fixed broadband with a median download speed of 367.36 Mbps. Salt also had the lowest median multi-server latency over fixed broadband at 8 ms.
Turkey: Turkcell was the fastest mobile operator in Turkey with a median download speed of 51.76 Mbps. Türk Telekom had the lowest median mobile multi-server latency at 38 ms. TurkNet was fastest for fixed broadband at 58.85 Mbps.
New Zealand: MyRepublic had the fastest median download speed over fixed broadband in New Zealand at 287.90 Mbps. There were no statistical winners among top mobile operators.
The Speedtest Global Index is your resource to understand how internet connectivity compares around the world and how it’s changing. Check back next month for updated data on country and city rankings, and look for updated Ookla Market Reports with Q2 2023 data in July.
Editor’s note: This article was updated on April 18 to exclude data from Vietnam while we continue to investigate anomalies in the market.
Ookla retains ownership of this article including all of the intellectual property rights, data, content graphs and analysis. This article may not be quoted, reproduced, distributed or published for any commercial purpose without prior consent. Members of the press and others using the findings in this article for non-commercial purposes are welcome to publicly share and link to report information with attribution to Ookla.
Taking advantage of remote work in another country is the dream for many. Who hasn’t imagined themselves sipping fresh squeezed juice on a gorgeous tropical beach during a team call, cozying up next to a crackling fire in a European castle while pouring over a spreadsheet, or even just working anywhere that isn’t the office or our home couch? COVID-19 made working remotely more readily an option for some, and 51 countries have even gone so far as to create remote work or “digital nomad” visas. Today, Ookla® brings you fresh data on how these countries’ internet compares so you can start planning a long-term escape from your current reality.
Using Speedtest Intelligence®, we looked for remote work countries with the fastest internet, tropical countries with remote work visas and fast internet, fastest European countries for remote work, countries where you won’t lose your connection, and seven affordable remote work countries with good internet. Read on to start planning your next life adventure.
Digital nomad countries with seriously fast internet
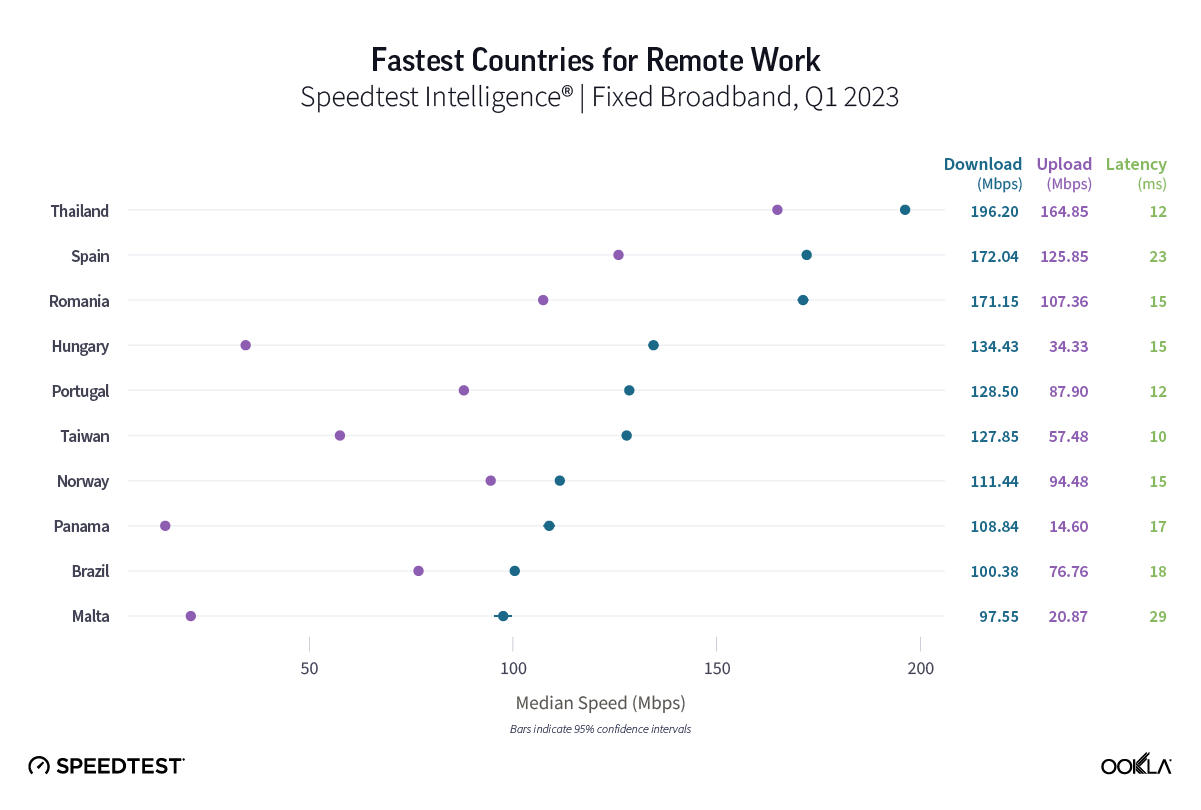
Getting the fast download speeds you need to do your daily tasks should be the least of your worries when you work abroad. Thailand had the fastest fixed broadband speeds among countries that have remote work visas with a median download speed of 196.20 Mbps and a median upload speed of 164.85 Mbps during Q1 2023. With speeds like those, you’ll be able to eat your Guay Teow while gaming, streaming multiple 4K videos, and uploading videos of your adventures with no issues (and you should be able to work, too).
Spain (172.04 Mbps) and Romania (171.15 Mbps) were next on our list of fastest remote work destinations, followed by Hungary (134.43 Mbps), Portugal (128.50 Mbps), Taiwan (127.85 Mbps), Norway (111.44 Mbps), Panama (108.84 Mbps), and Brazil (100.38 Mbps), which all had median download speeds over 100 Mbps during Q1 2023. Rounding out our list of fastest remote work countries are Malta (97.55 Mbps) and Bermuda (97.20 Mbps). If speed is of the utmost importance to you while you work and live in another country, rest assured that these countries can handle the bandwidth you need.
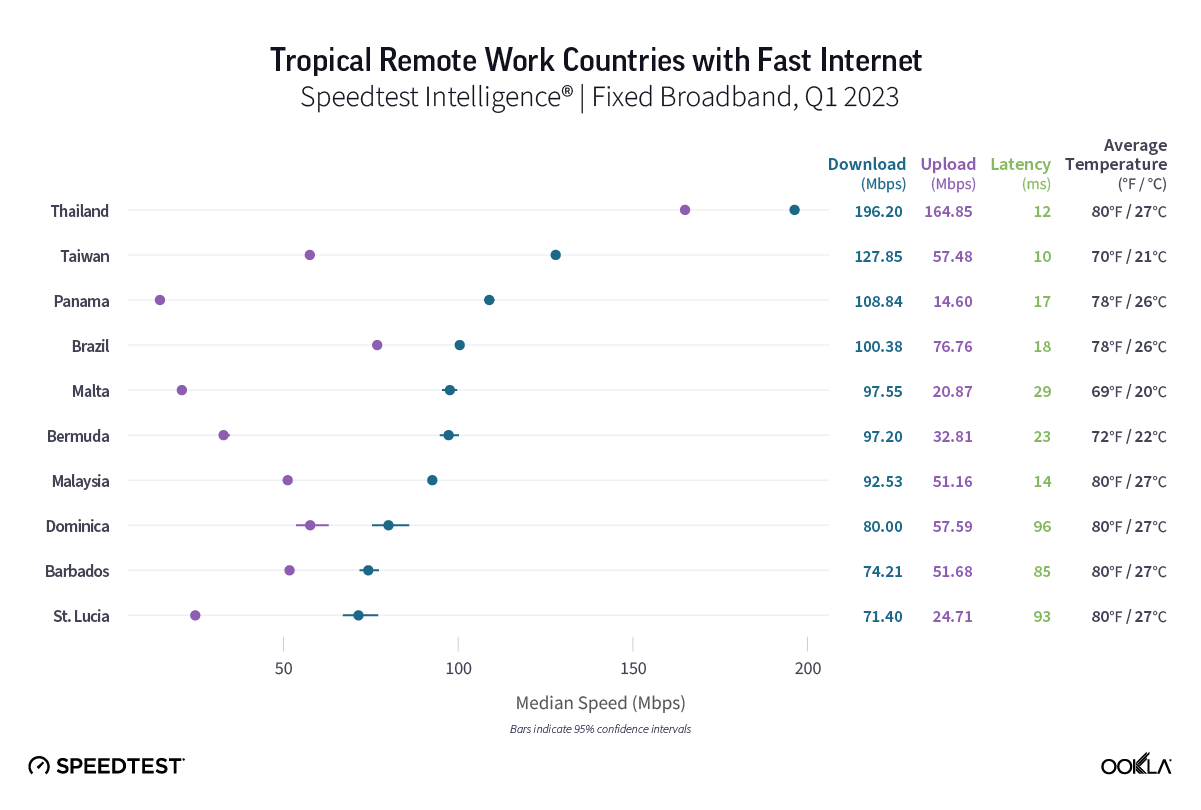
Soak up the sun with fast internet in these beachy countries with remote work visas
If you dream of a remote work escape and prefer tropical, sunny beaches where you can sip piña coladas, we’ve got you covered (though don’t forget your sunblock when you venture outside!) Twenty-seven countries have digital nomad visas, average temperatures above 65° F (roughly 18° C), and beach access. Unsurprisingly, Thailand, again takes the top spot with a median download speed of 196.20 Mbps, followed by Taiwan (127.85 Mbps), Panama (108.84 Mbps), Brazil (100.38 Mbps), Malta (97.55 Mbps), Bermuda (97.20 Mbps), Malaysia (92.53 Mbps), Dominica (80.00 Mbps), Barbados (74.21 Mbps), and St. Lucia (71.40 Mbps). Grenada (65.25 Mbps), Costa Rica (65.07 Mbps), and Montserrat (63.22 Mbps) followed closely behind the top 10.
If you choose to work remotely from one of these countries, we’ll be jealously awaiting you sharing your Speedtest® results on Twitter as you work from the beach, take a dip in the ocean during your break, and relax with a cool ocean breeze as your biggest worry in the world.
These European countries with remote work visas had the fastest internet speeds
Maybe you’ve been watching all the Eurovision or have been dreaming of jetting off to European locations every weekend. Luckily for you, 16 European countries offer some version of a remote work visa. Speedtest Intelligence data reveals that Spain had the fastest median download speed at 172.04 Mbps during Q1 2023. Romania, Hungary, Portugal, and Norway followed with median download speeds above 100 Mbps. Malta (97.55 Mbps), Germany (82.05 Mbps), Latvia (77.76 Mbps), Estonia (64.80 Mbps), and Czechia (55.97 Mbps) rounded out the top 10, with Cyprus (53.71 Mbps) coming up just behind. Regardless of which European country you choose, you’ll be a few hours away from multiple countries with plenty to do and eat!
10 remote work countries where you won’t lose your connection
You shouldn’t have to stress about your internet connection while you’re working abroad — especially if you have to video chat often. So we used Speedtest Intelligence data to examine the Consistency — calculated by the percentage of results showing at least a 25 Mbps download speed and 3 Mbps upload speed over fixed broadband — in countries with remote work visas during Q1 2023. While there was no statistically highest Consistency, Thailand had a Consistency of 89.8%, Romania 89.7%, and Taiwan 89.5%. Norway followed at 87.3%, then Malaysia, Brazil, Portugal, Hungary, Spain, and Bermuda rounding out the top 10. Rest assured if you choose one of these countries, you should be able to stream and video chat while you work. Just remember to mute that movie during your team call.
Seven affordable places with good internet for digital nomads on a budget
Internet speed and consistency are important for remote work — but they’re not everything when you’re deciding where you want to spend your next adventure. If you’re looking for an affordable location to spend your time, save some money, and get good internet, we’ve got you covered.
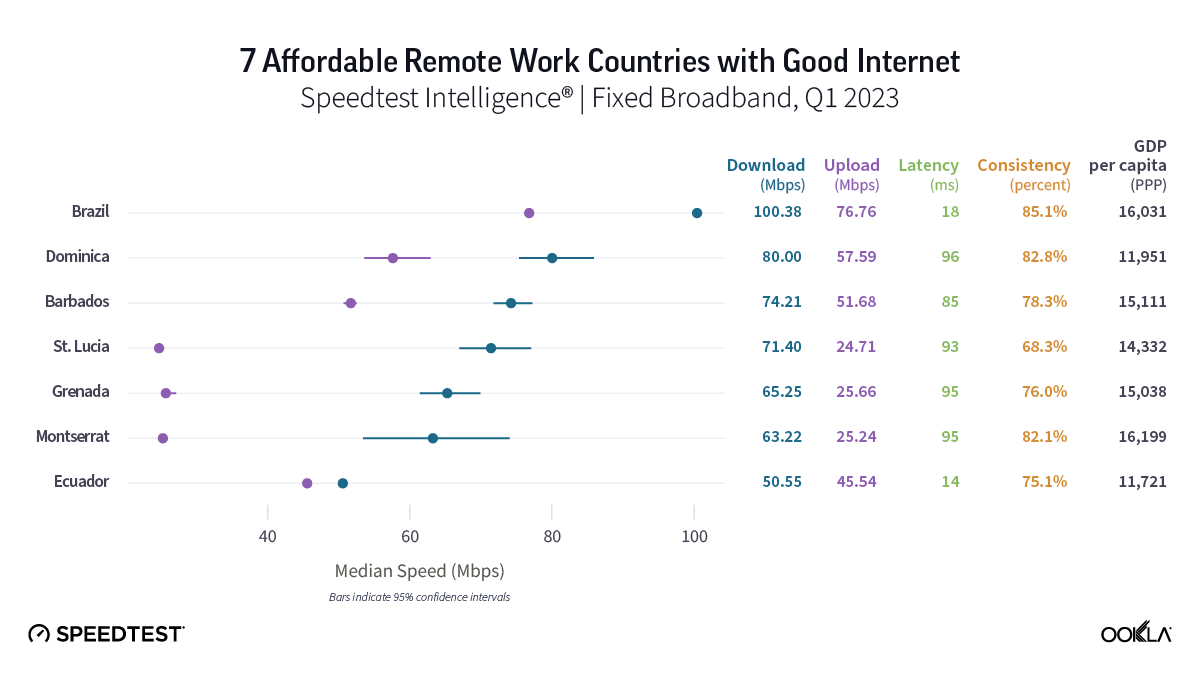
We used thresholds of 50 Mbps download, 10 Mbps upload, and under 100 ms latency to designate a country of having “good” internet — these speed thresholds are minimums to what should allow you to stream in 4K, video chat, and do most work-related tasks. The latency threshold number is high, but cheap, fast internet with super low latency is not common enough. We compared that list against World Bank data for GDP per capita (PPP) from 2021 which adjusts for cost of living, and narrowed down countries that have less than the world average of $18,607. Seven countries qualified for inclusion on our list based on those criteria: Barbados, Brazil, Dominica, Ecuador, Grenada, Montserrat, and St. Lucia.
Brazil had the fastest download speed at 100.38 Mbps on our affordable countries for remote work list, followed by Dominica (80.00 Mbps), Barbados (74.21 Mbps), St. Lucia (71.40 Mbps), Grenada (65.25 Mbps), Montserrat (63.22 Mbps), and Ecuador, which eked out a place on this list at 50.55 Mbps. Every country on this list had a median upload speed above 20 Mbps. All of the countries had a Consistency higher than 70%, except St. Lucia, which was just under at 68.3%. If latency, which causes the kind of lag that can make video calls frustrating, is a major concern, only Ecuador (14 ms) and Brazil (18 ms) had latencies under 20 ms.
Regardless of where you choose to work remotely among these seven countries, you should have access to internet that can keep you on top of what you need to do at work, while you save some cash, live well, and hit the beach, since all of these countries have average temperatures above 70° F (21°C). You might just have to brush up on your Spanish, Creole, Patois, or Portuguese to really get an immersive experience, but you should sleep easy knowing that you can live well and continue to work online.
What do you need to know before applying for a remote work visa?
Currently, there are 51 countries that offer some form of a remote work visa. The requirements for these visas vary widely across each country, but generally there are a few key things you’ll need to know before you choose a country to apply to.
First, you need to decide where you are going! Besides checking internet performance, you’ll want to research how long a remote visa can last, how much money you are going to have to earn to qualify, what costs you’ll be looking at, options to renew the visa, and what kind of fees you’ll need to pay along the way. At a minimum, you’ll need a passport.
You often can’t just show up and start working remotely; for a long-term stay, you’ll need to apply for a visa (along with any family members you might want to bring along). Approval isn’t straightforward — you may need to prove your income, translate documents, get documents notarized, and even make a minimum amount of money each month. Once approved, you’ll typically pay a fee for each family member you are bringing, and you should make certain if you have any additional fees or taxes you’ll be liable to pay throughout your stay.
Once you have your visa in order, you’ll need to figure out your living situation — whether that is something longer term, or moving around a country, you’ll want to keep any requirements of your visa up to date. Do your due diligence while you apply so you don’t find yourself in an unpredictable situation you could have avoided.
Ookla has the resources you need to plan your remote work trip
We hope this short guide will help you choose the right remote work experience to help you feel fulfilled. If you want to learn more about the internet experience in any of the countries we mentioned, or even find city data or internet provider data for your remote work journey, check out the Speedtest Performance Directory™. If you’re struggling to find a decent internet provider in your area, check out our satellite internet series to see if there is a fast satellite internet connection available. And don’t forget to download the Speedtest app for Mac, Windows, or Linux to make sure you’re getting the speeds you need to continue working remotely!
Ookla retains ownership of this article including all of the intellectual property rights, data, content graphs and analysis. This article may not be quoted, reproduced, distributed or published for any commercial purpose without prior consent. Members of the press and others using the findings in this article for non-commercial purposes are welcome to publicly share and link to report information with attribution to Ookla.
The Australian Football League (AFL) Finals start this weekend and with the Pies holding off late challenges from the Lions and Port Adelaide to secure the top of the ladder — here at Ookla® we’re sure every team vying for a spot in the Grand Final at the MCG on Sept. 30 is sure to put on a show for fans across the country. With such a great footy season in 2023, the Finals are set to be a breathtaking, best-in-world spectacle, and Ookla wanted to find out which stadium’s mobile experience made fans the real winners this year.
Methodology
We used Speedtest Intelligence® to examine download and upload speeds and multi-server latencies for all mobile technologies and 5G at AFL stadiums with a 100-meter zone around the stadium from the start of the season in Q1 2023 through Q2 2023. We also used Consumer QoE™ data with the same criteria to determine the web page load time at each stadium to see which footy fans were racing ahead to post their team’s come-from-behind wins first, and which fans were left in a lurch waiting for web pages to load to check their rival’s scores.
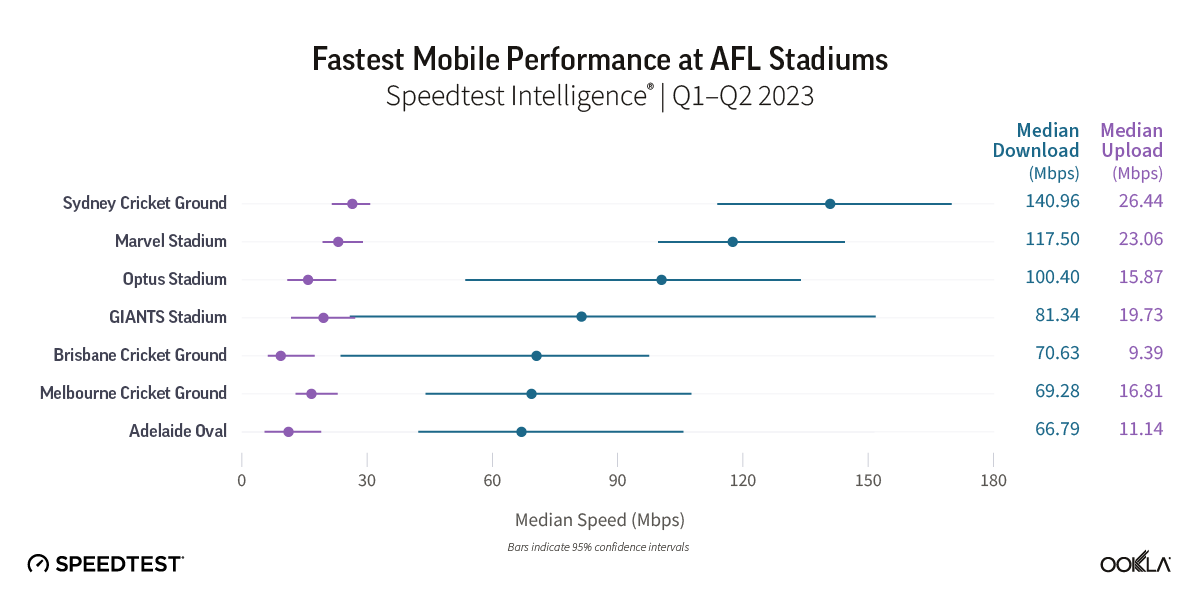
These AFL stadiums had the fastest download speeds in 2023
While Sydney are out to avenge their stinging 2022 Grand Finals loss to Geelong, Swans fans should at least feel great knowing the Sydney Cricket Ground had one of the fastest median download speed of any stadium we surveyed with a download speed at 140.96 Mbps during Q1-Q2 2023. The SCG also had one of the fastest median upload speeds at 26.44 Mbps during Q1-Q2 2023, ensuring fans were getting all the latest real-time updates, and posting their photos and videos with relative ease.
Marvel Stadium was a runner up for both download and upload speeds at 117.50 Mbps and 23.06 Mbps during Q1-Q2 2023, with fans of the mighty Blues, the Dons, the Roos, the Saints, and the Bulldogs all sharing runner-up honors in the Docklands in Melbourne. Next on our list was Optus Stadium in Perth with Fremantle and West Coast fans experiencing a median download speed of 100.40 Mbps, followed by GIANTS Stadium in western Sydney at 81.34 Mbps, the Gabba in Brisbane at 70.63 Mbps, the MCG in Melbourne at 69.28 Mbps, and the Adelaide Oval at 66.79 Mbps. The GMHBA in Geelong and Heritage Bank Stadium in Gold Coast didn’t have enough samples to be included in this ranking.
These AFL stadiums with the fastest 5G download speeds were too close to call, but fans in NSW are the true winners
Looking at download speeds over 5G during Q1-Q2 2023, there was no statistically fastest 5G download speed among AFL stadiums we surveyed. However, every stadium we evaluated except the Gabba had median 5G download speeds over 100 Mbps, with the Gabba having a median download speed of just 92.08 Mbps. While there was no winner over 5G, GIANTS Stadium saw a median 5G download speed at 182.61 Mbps, the SCG at 171.43 Mbps, Marvel Stadium at 166.66 Mbps, Optus Stadium at 133.82 Mbps, and the MCG at 122.62 Mbps. The Adelaide Oval, the GMHBA, and Heritage Bank Stadium didn’t have enough 5G samples to be included.
Fans at Marvel Stadium were able to upload their videos from matches the fastest, with the fastest median 5G upload speed at 34.27 Mbps. The SCG (29.02 Mbps), MCG (27.35 Mbps), and GIANTS Stadium (27.16 Mbps) followed with median 5G upload speeds greater than 20 Mbps.
Note that some 5G plans may have limited 5G access and 5G coverage varies by provider.
Multi-server latencies showed good parity between stadiums
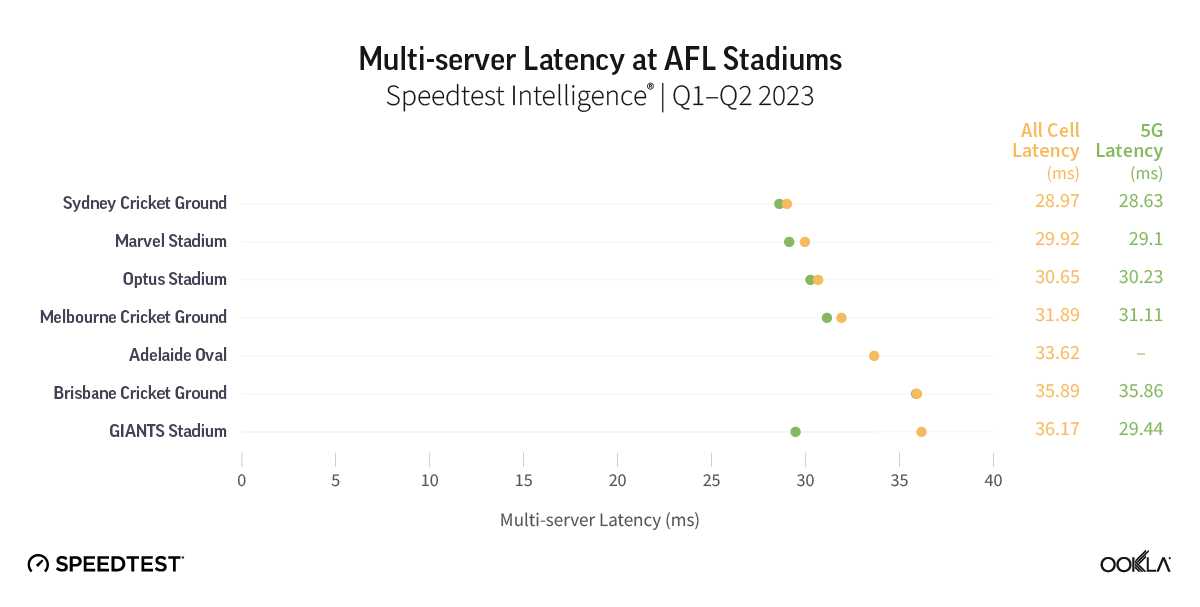
Latency, also known as ping, is the reaction time of your network’s roundtrip connection, which is particularly important for streaming, video chats, and online gaming. For those footy fans who might be video chatting and bragging to their friends about their seats (or more likely their team winning against their friend’s team), latency is increasingly a very important measure for real-time online interactions.
Much like the middle of the ladder this season, the AFL stadiums we surveyed had a tight range of multi-server latencies for all mobile technologies combined with the SCG having the lowest at 28.97 ms and GIANTS Stadium having the highest at 36.17 ms. Multi-server latencies over 5G were about the same, with the SCG being the lowest at 28.63 ms and the Gabba having the highest at 35.86 ms. With lower latencies indicating a more responsive network, those looking to livestreaming a last second winner at the SCG might have a slightly better experience for their friends with less lag than those at the Gabba.
These stadiums had the fastest mobile web page load time experience
Speed and latency are important, but they’re not the only thing footy fans need from their mobile network while watching their team battling it out on the oval.
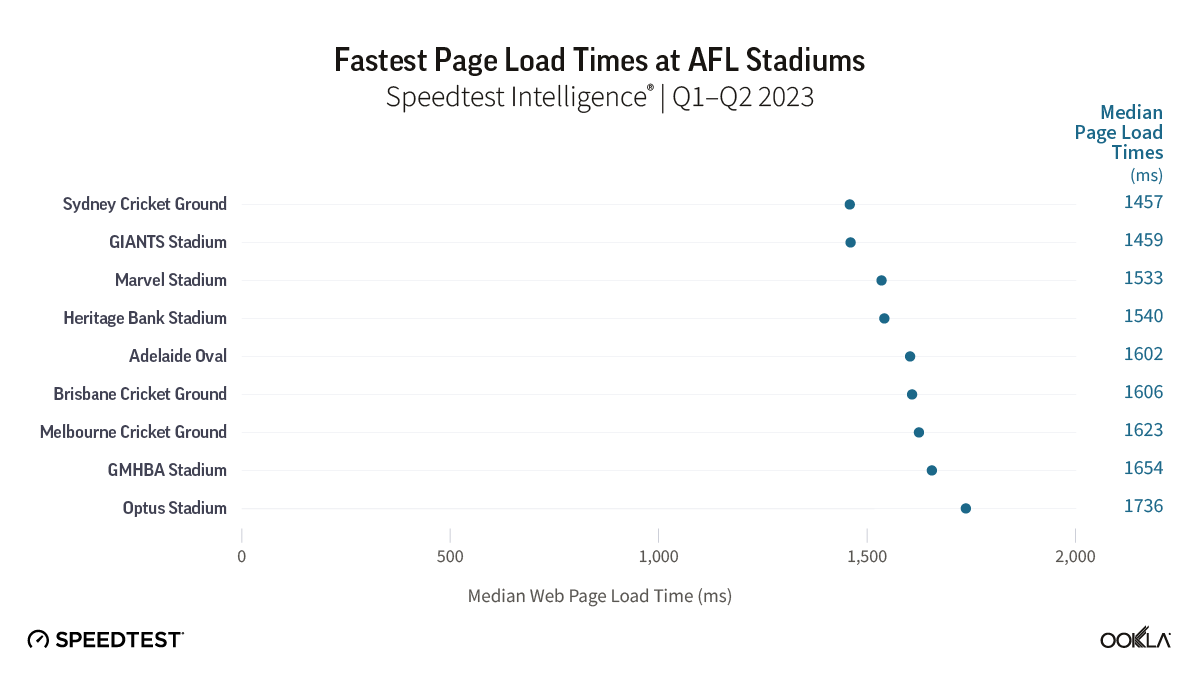
Using Consumer QoE data, we looked at web page load time data, which reflects consumers’ real-world experiences of trying to use the internet, to see the stadiums where fans could access websites like social media without any delay. A lower web page load time means fans wait less for websites to load and can get straight to bragging to their friends about their team’s come from behind victory. With a 2016 Google research study reporting 53% users leave a webpage if it takes more than three seconds to load, fast page load times are very important when gauging mobile users’ experience using their network. We’re happy to report all of the stadiums we surveyed fell under this benchmark during Q1-Q2 2023, with some fans experiencing slightly faster load times than others.
The SCG and GIANTS stadium led the pack once again, with a median page load time of 1,457 ms (1.457 seconds) and 1,459 ms (1.459 seconds), respectively, though there was no statistical winner. Marvel Stadium (1,533 ms) and Heritage Bank Stadium (1,540 ms) followed, with the Adelaide Oval (1,602 ms), the Gabba (1,606 ms), the MCG (1,623 ms), and GMHBA Stadium (1,654 ms) all having a median page load time under 1,700 ms. Optus Stadium was the only AFL stadium to have a page load time over 1,700 ms, leaving Dockers and Eagle fans waiting just a hair longer than their eastern Aussie counterparts.
Going to the Finals or Grand Final? Take a Speedtest® and show us your results
If you’re a supporter of Brisbane, Carlton, Collingwood, GWS, Melbourne, Port Adelaide, St. Kilda, or Sydney, and you’re headed to a Finals match — we’re very jealous of you — here at Ookla we’d love to see how your experience stacks up to our findings. Before you head to the nearest oval, download the Speedtest app for your iOS or Android device to test your real-world network experience, and be sure to take a Speedtest while you’re cheering on your team wherever you may be. After the match, share your Speedtest result with us on Twitter or Facebook — and let us know who you support!
Want to learn more about mobile and fixed broadband internet in your area? Head over to the Speedtest Performance Directory to learn more about internet performance in your area and see if you’ve got a goal of a provider or you’re just scoring a behind.
Ookla retains ownership of this article including all of the intellectual property rights, data, content graphs and analysis. This article may not be quoted, reproduced, distributed or published for any commercial purpose without prior consent. Members of the press and others using the findings in this article for non-commercial purposes are welcome to publicly share and link to report information with attribution to Ookla.
As 5G adoption increases, consumers and businesses expect the same level of coverage and performance wherever they go. Yet, the characteristics of 5G, which typically operates in mid-band frequencies of 1.8 GHz to 3.5 GHz, pose a challenge for indoor coverage, as these frequencies struggle to penetrate walls and windows depending on the materials used in construction. Therefore, operators need to invest in additional solutions to enhance indoor coverage and potentially offload onto in-building Wi-Fi systems.
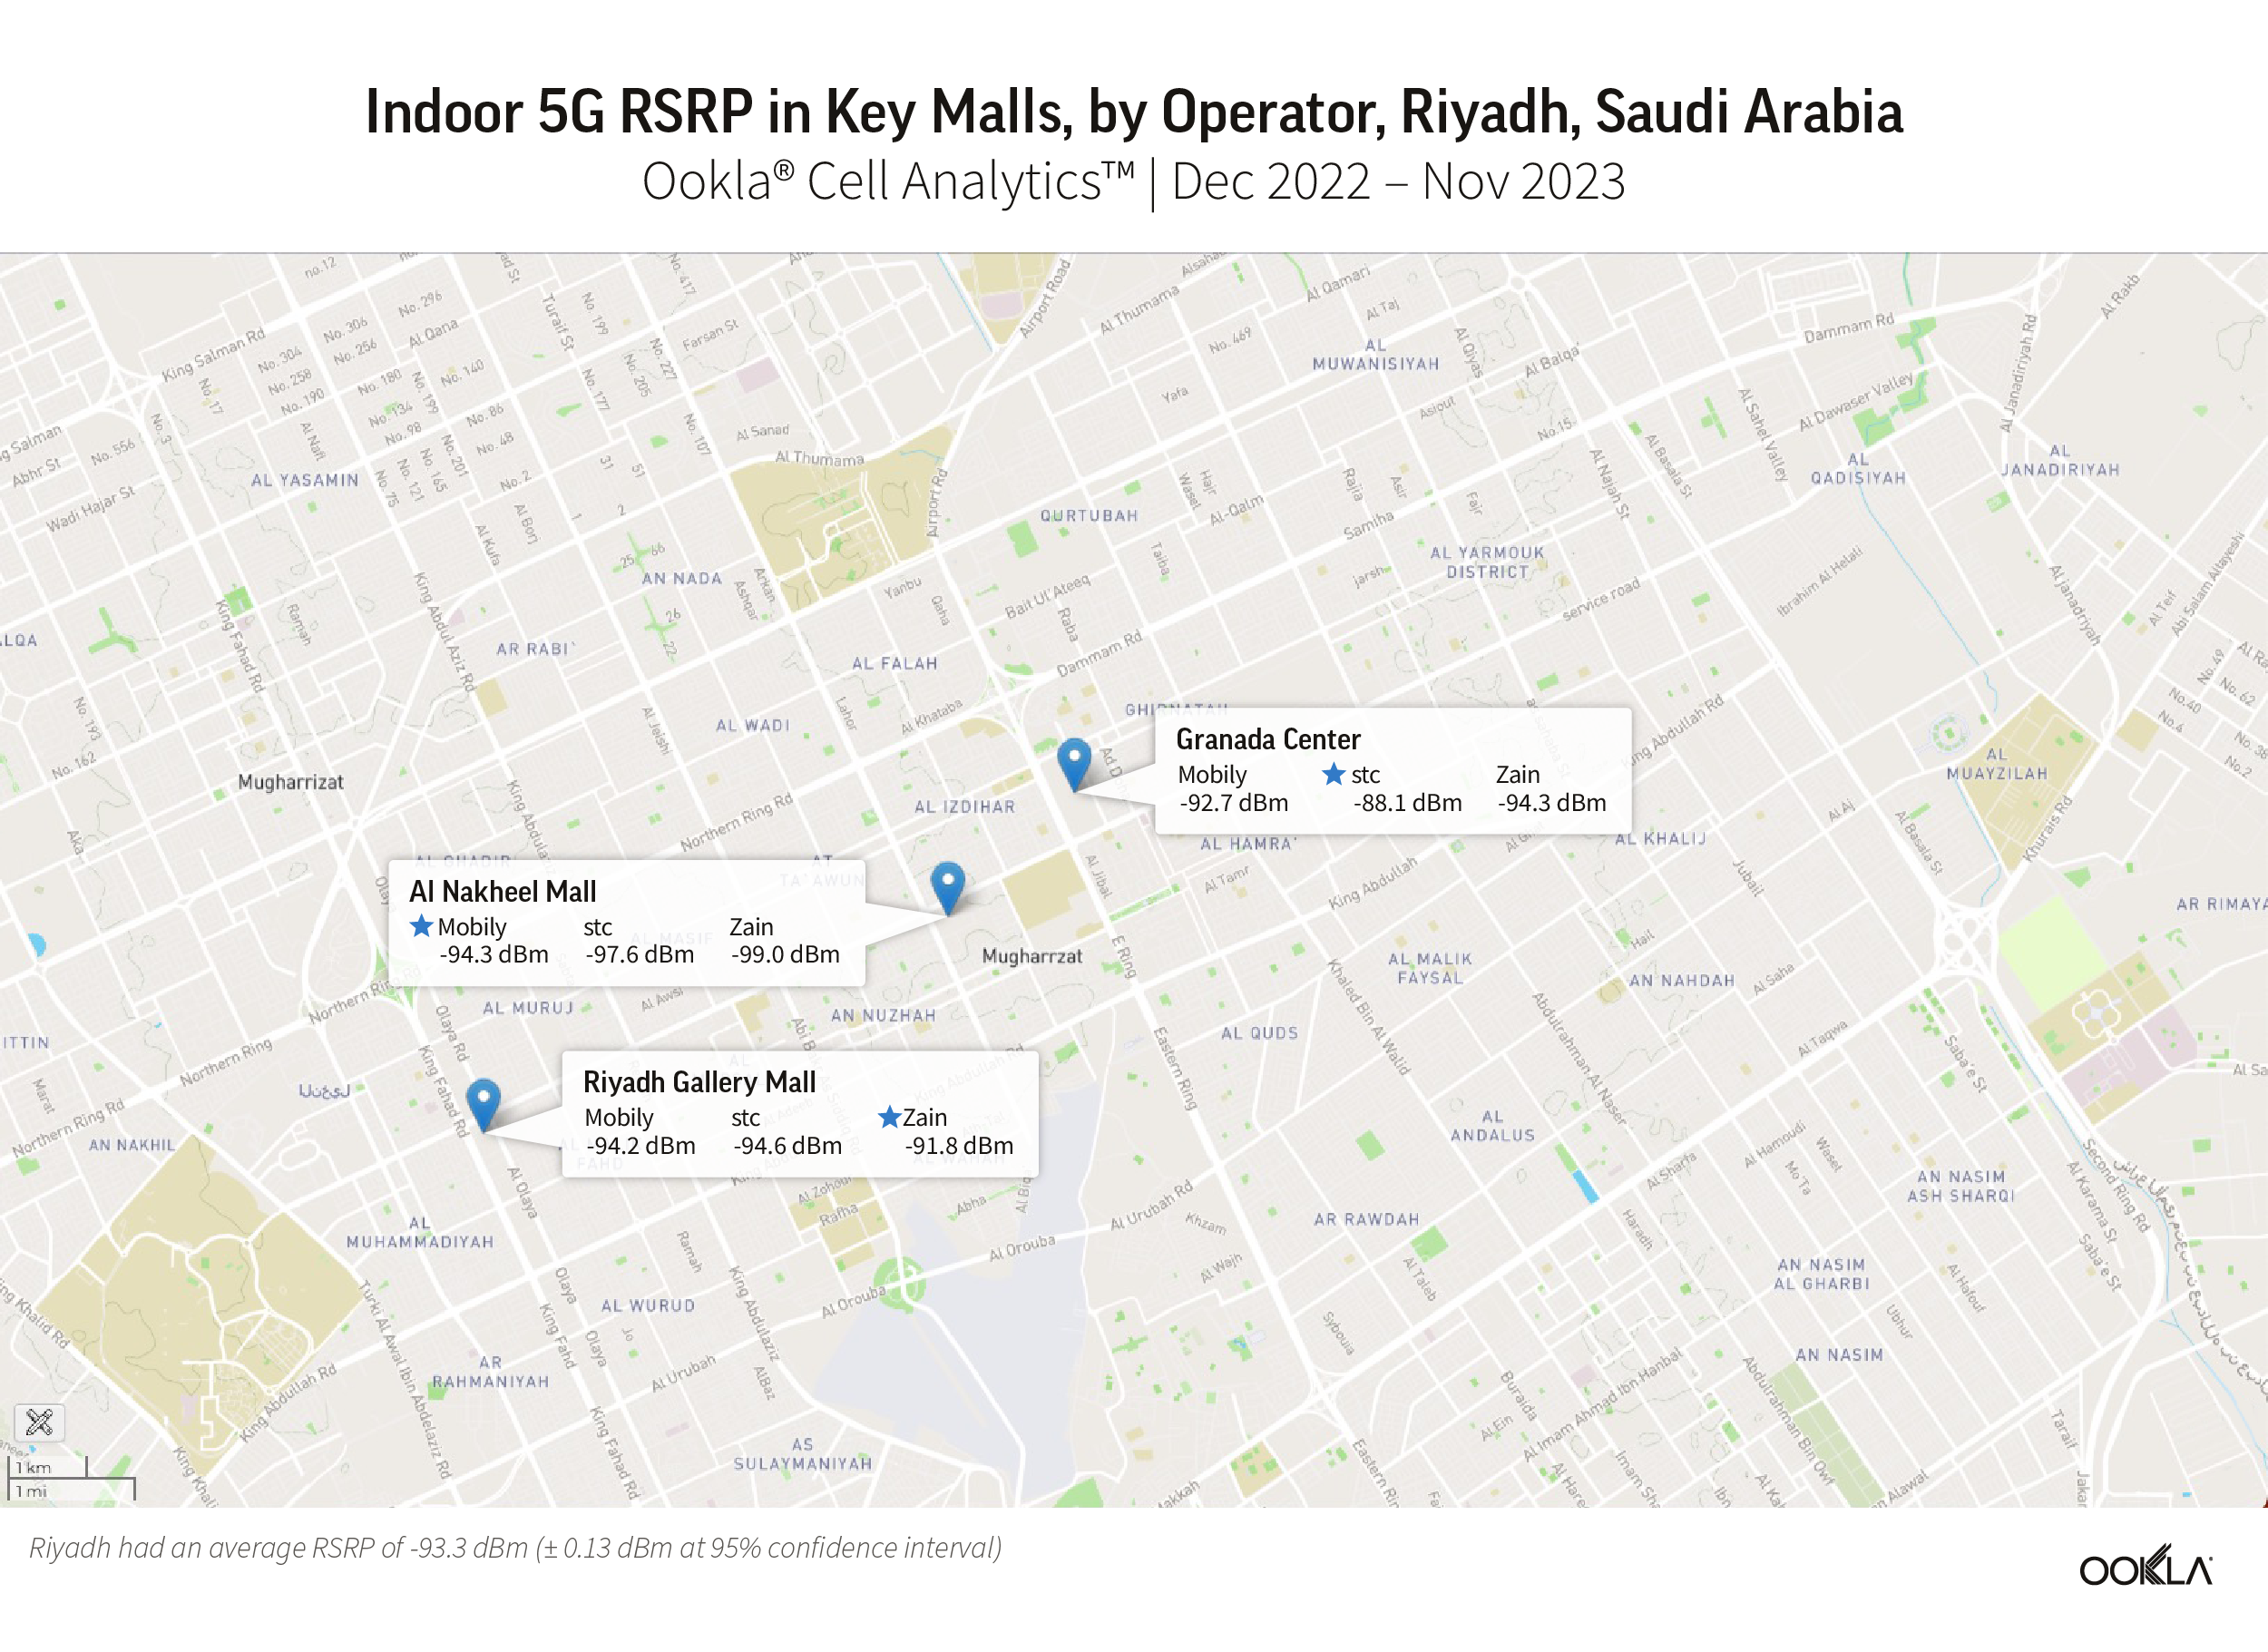
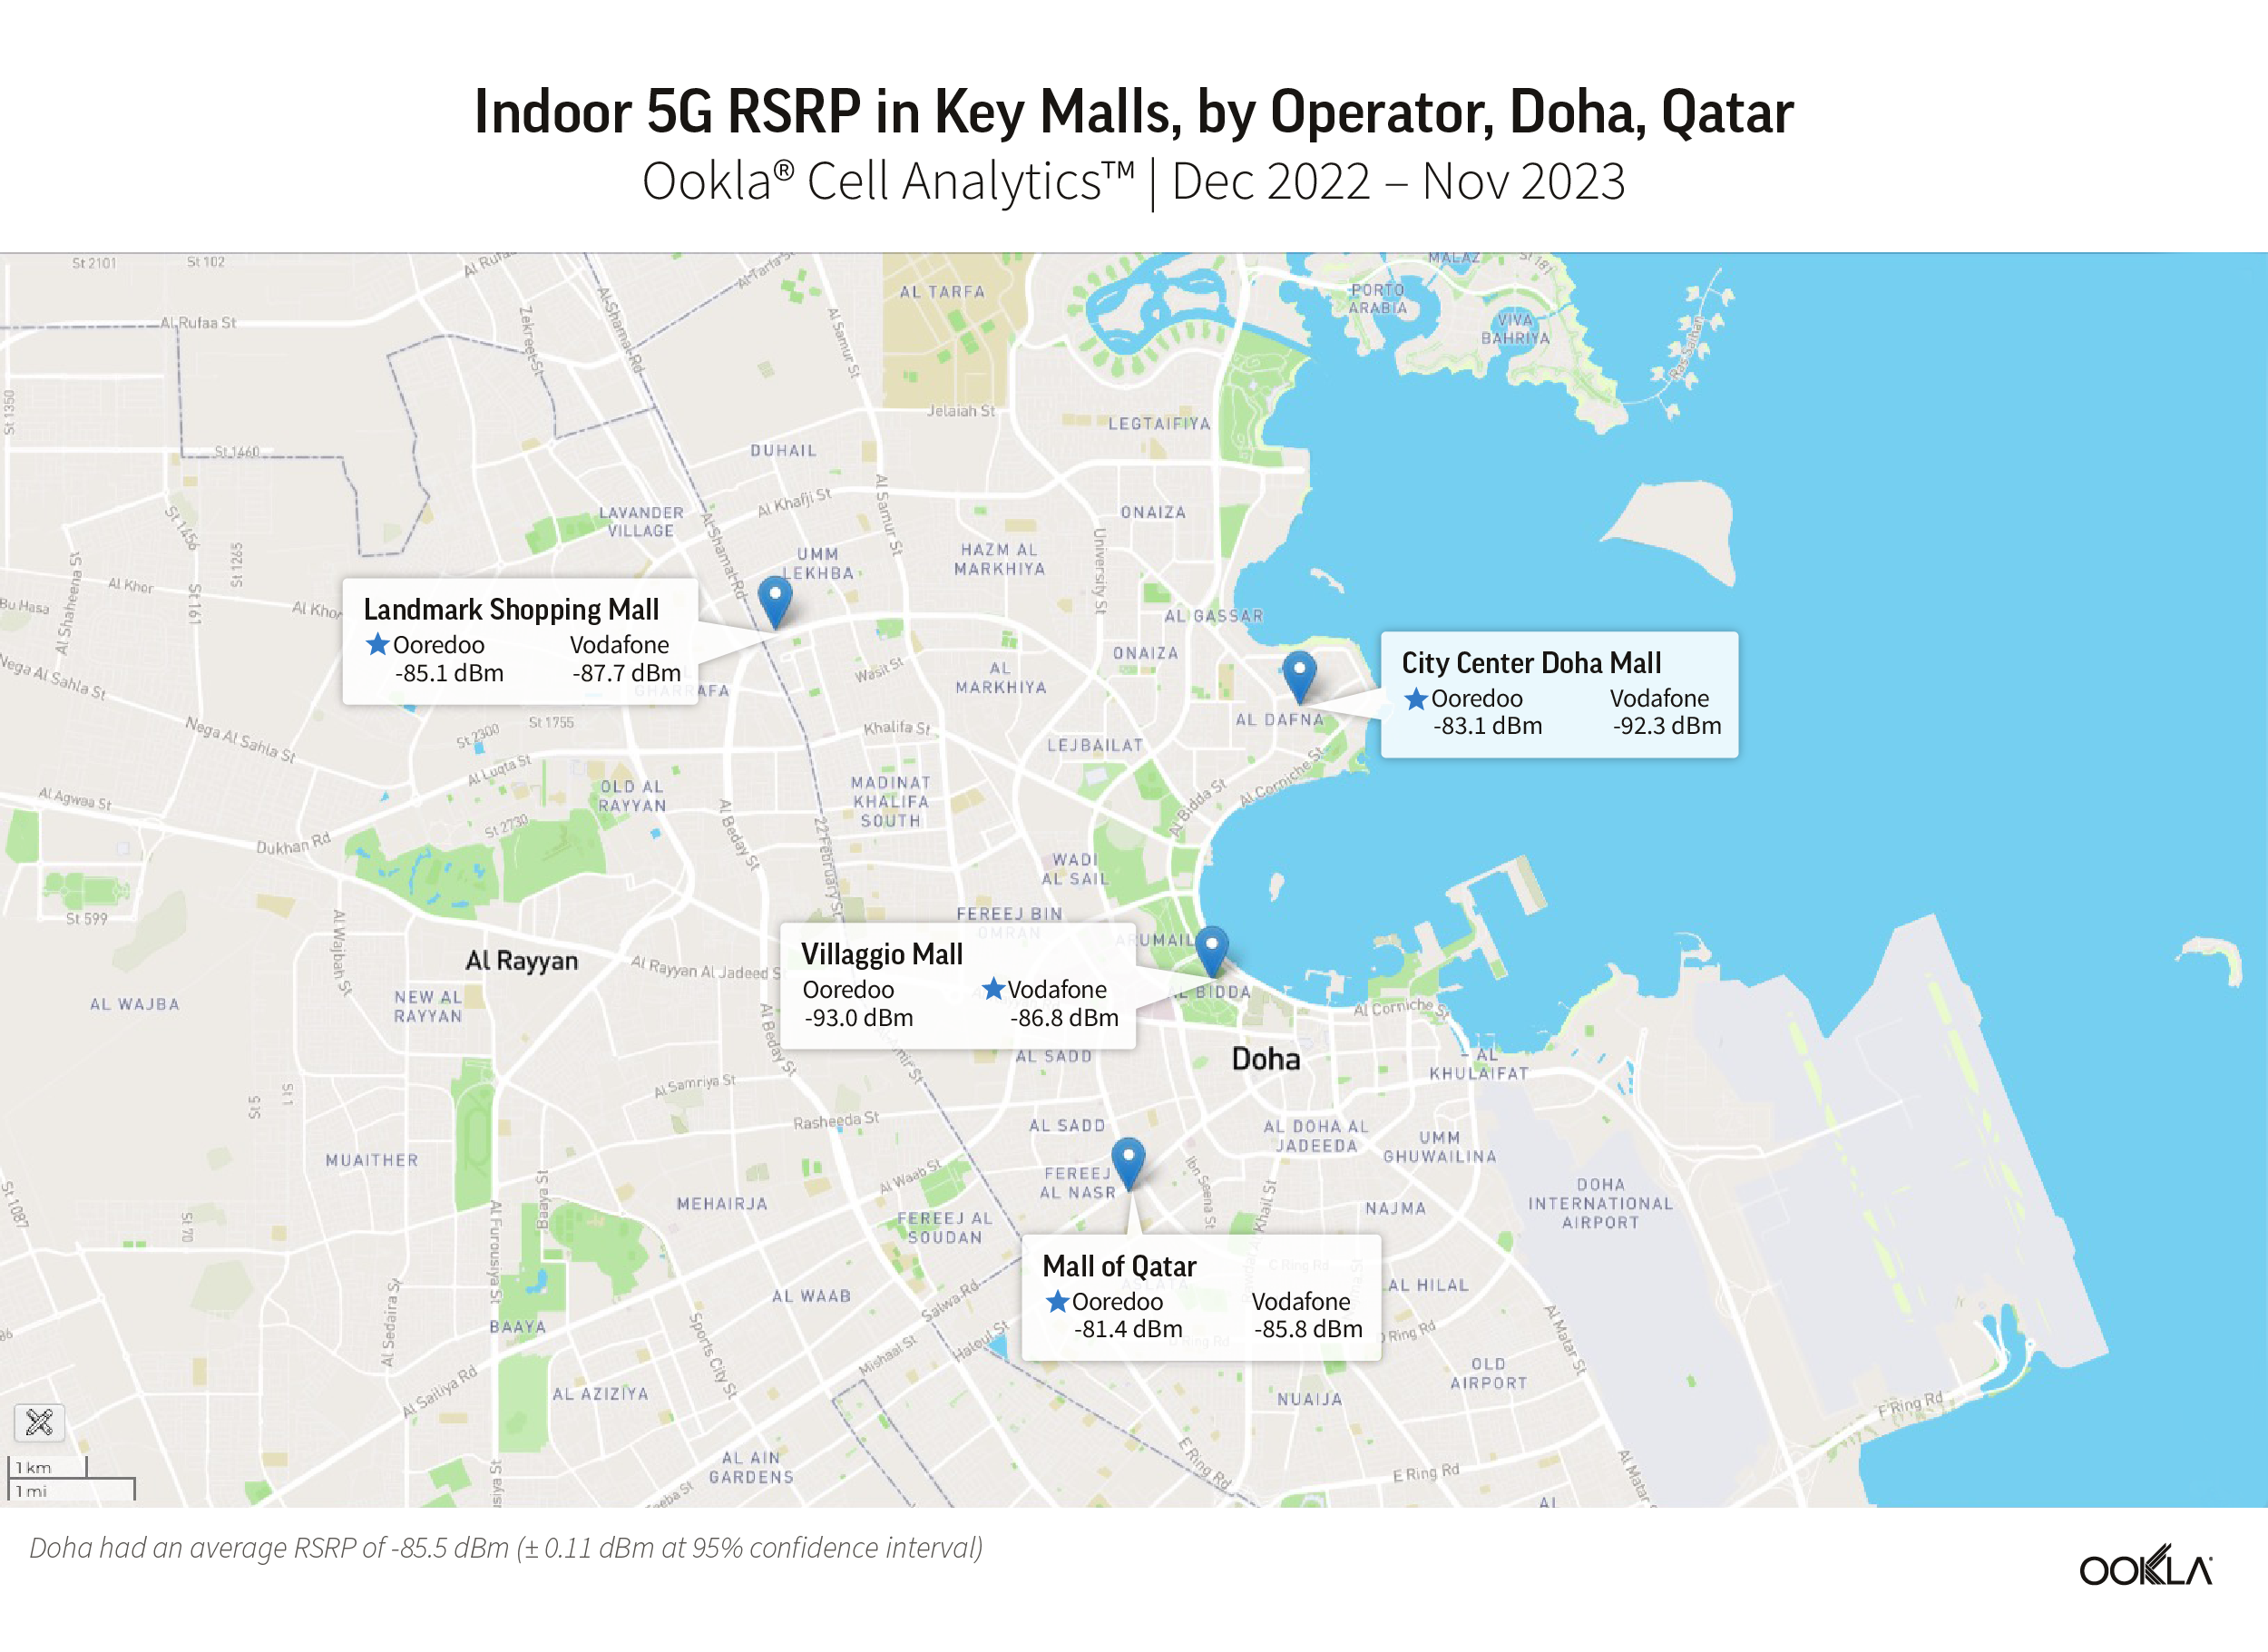
In the Gulf region, where shopping malls are central to the economic and social lifestyle, bridging the indoor-outdoor coverage gap is ever more important. In this article, we use data from Cell Analytics™ to benchmark indoor 5G coverage provided by seven mobile operators across 28 malls in Qatar (Doha), Saudi Arabia (Jeddah and Riyadh), and the U.A.E. (Abu Dhabi and Dubai) based on crowdsourced measurements collected between December 2022 and November 2023.
Key takeaways
Good indoor coverage is vital for 5G more than for previous generations. Indoor 5G coverage is more crucial than ever since people spend 90% of their time indoors, and an increasing number of consumers and businesses depend on its availability and expect near gigabit speeds wherever they are.
Top U.A.E. malls have superior indoor 5G coverage compared to top malls in Qatar and Saudi Arabia. du leads the way in the U.A.E. (particularly in Abu Dhabi), while in Saudi Arabia, Mobily has the edge in terms of the number of malls where it has better indoor 5G coverage. In Qatar, Ooredoo comes first for indoor coverage and its lead over Vodafone is more evident than in the other two countries.
Efficient deployment of indoor network coverage solutions requires addressing non-technical challenges. Beyond cost and technical factors, operators must anticipate other issues when aiming to improve indoor coverage, such as site acquisition and permission and compliance, all of which can be facilitated through regulatory measures.
5G underscores the importance of indoor coverage more than previous generations of mobile technologies
Before 4G, mobile networks were designed primarily for outdoor voice coverage. That is why outdoor deployment took precedence over indoor coverage in previous generations of mobile networks since coverage maps were important marketing collateral to grow market shares. With 5G, consumers and businesses expect high-speed and consistent mobile connectivity everywhere. As they rely heavily on continuous 5G availability, operators are pressured to deliver a similar quality of experience indoors and outdoors. Delivering consistent high-speed data connectivity across both indoor and outdoor networks is far more challenging since the performance of a 5G network is limited by interference.
5G is also the main data growth driver of usage for the operators and most of the usage is likely to be generated indoors. According to Ericsson, we spend 90% of our time indoors, and up to 80% of our data is consumed indoors. Therefore, operators should strive to improve coverage and capacity indoors if they want to capitalize on data growth, reduce churn, and support new consumer and business use cases.
Indeed, 5G enables a wide range of applications because it supports high bandwidth, low latency, and high device density. As 5G adoption increases, there will be more use cases where an excellent indoor 5G experience will be essential to end users and commercially beneficial to the operators.
Technical and commercial reasons also explain why indoor 5G performance is typically inferior to outdoors. The mid-band frequencies (1.8 GHz to 3.5 GHz) used in 5G deployment do not effectively penetrate walls and windows. The increasing use of insulating materials and metal structures further hamper the propagation of radio waves. Furthermore, indoor network systems need to be designed to fit within the site-specific requirements for antenna placement, connectivity, and power distribution systems, minimize interference with careful coordination between adjacent sites, and connect more customers per square meter than outdoors which impacts network performance.
Commercially, operators have prioritized outdoor coverage because it requires less CAPEX and OPEX per subscriber compared to indoor coverage and has a better return on investment. Additionally, operators need to adapt their indoor network solution to suit different venues and building configurations, find other service providers to share deployment costs with, and convince venue owners to offset some of them.
Technical solutions exist to address the 5G coverage gap
Spectrum is arguably the most influential factor for 5G coverage and speed. High frequencies (shorter wavelengths) carry data faster but have a shorter range than lower frequencies, leading to lower coverage levels and inferior indoor quality of service.
Operators can opt for higher towers to cover a large area to compensate for the shorter range or adjust spectrum usage in specific areas to maximize coverage while not too negatively impacting performance.
Alternative technical solutions also exist to address indoor cellular coverage challenges (see table below). Most of these solutions were designed originally for 3G and 4G but were upgraded by increasing their power and the number of antennas to enable greater performance and improve spectral and energy efficiency. However, deploying some of these solutions can be complex and costly. For example, a DAS that supports MIMO costs multiple times a typical outdoor macro site. They may also lead to unnecessary duplication of infrastructure if operators do not share their assets.
Examples of solutions to improve indoor 5G coverage
Solution
Description
Limitations
Amplifiers
• Strengthen a weak external cellular signal by amplifying it inside the building
• Could cause interferences with signals from the macro cells
Small cells (microcells, picocells, and femtocells)
• Low-power antennas that provide localized coverage and add capacity in dense locations • Connected to the macro cell through backhaul
• More suitable for small indoor areas (e.g. a room or floor), not shopping malls • Not cost-effective to cover a large area
Distributed Antenna System (DAS)
• Set of antennas distributed around a venue to amplify the signal and provide consistent coverage and capacity throughout • DAS is connected to one or more base stations via cable
• Could be expensive and complex to deploy and upgrade due to the multiple radio heads and cable connections required
Private LTE/5G Networks
• Localized cellular networks deployed to offer customized indoor coverage and capacity solutions • Cater to specific indoor environments such as factories, warehouses, and corporate offices
• Acquiring dedicated spectrum is challenging and costly • Deployment complexity and cost can make it prohibitive for smaller organizations • Navigating regulatory frameworks can be challenging
Indoor 5G coverage is more vital in Gulf countries because shopping malls play an essential economic and social role
The Gulf region has been a global 5G pioneer. Most countries have attained nationwide 5G coverage by 2023. 5G penetration among mobile users has also skyrocketed since the beginning of 2022. It reached 28.11%, 22.48%, and 26.86% in Qatar, Saudi Arabia, and the U.A.E. in Q3 2023, according to GSMA Intelligence.
Indoor network coverage is arguably more critical in the Gulf region. The high temperatures and long summers mean that people spend most of their time indoors, especially in shopping centers. These malls are the heart of the economic, social, and cultural life in the region for residents and tourists alike.
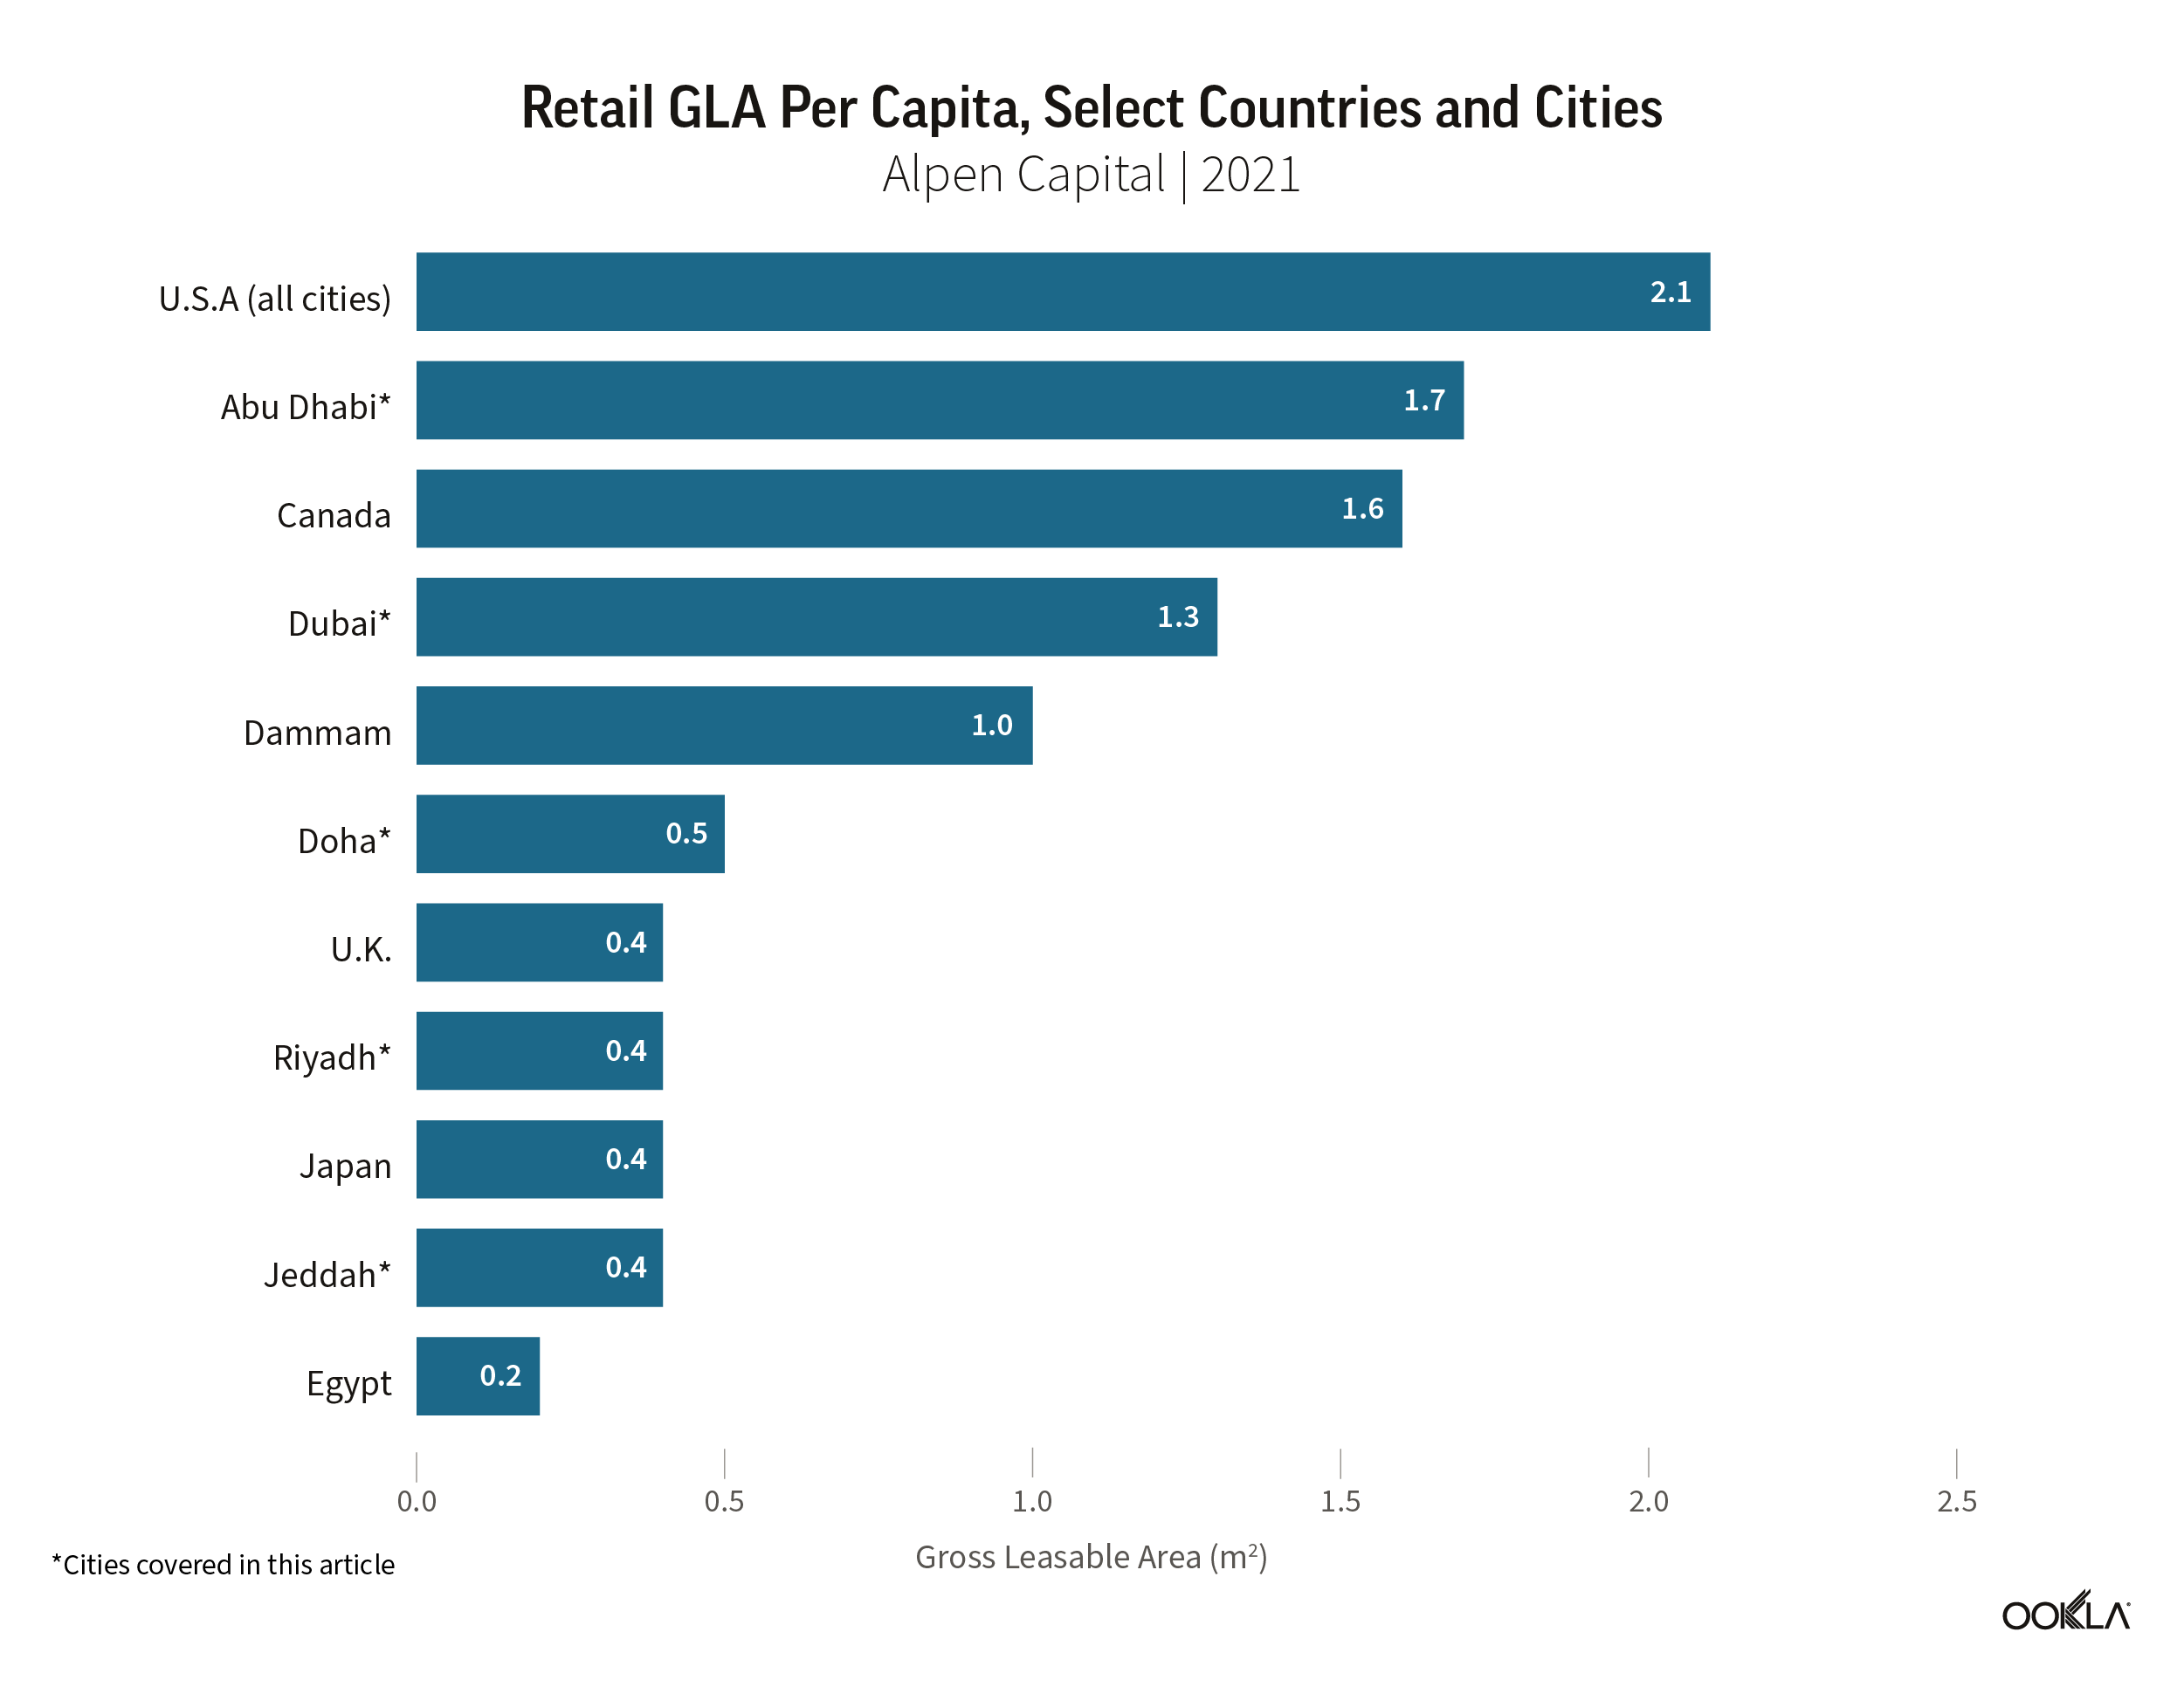
Aided by retail-friendly policies, such as low taxes and late opening times, malls experienced a boom in footfall and retail transactions. Despite the rapid rise in online shopping, especially after COVID-19 lockdowns, brick-and-mortar remains a pillar of national economies and accounts for the largest share of all retail transactions. The retail segment has also room to grow further as the retail gross leasable area (GLA) per capita across major GCC cities remains below that of developed markets like the U.S.A., despite being higher than other markets in the Middle East and North Africa.
5G connectivity inside the malls is not just crucial for consumers but also businesses. Stores can use the network to connect video cameras, point-of-sale (PoS) devices, and signage systems. Good indoor connectivity also enables shops to offer a hybrid retail experience, combining physical and digital sales channels. For example, customers can order items online for in-store pick-up. Indeed, nearly 60% of surveyed shoppers in the U.A.E. use their smartphones in-store to research products, compare prices, or look for offers. Excellent indoor 5G coverage also underpins future in-mall experiences that mix physical and digital interactions through technologies like AR/VR.
Operators and venue owners can also benefit from offering seamless connectivity in the malls. For example, operators can improve their brand image and prestige by associating themselves with iconic venues such as Dubai Mall in Dubai, Mall of Qatar in Doha, and Mall of Arabia in Jeddah. For landlords, exceptional indoor coverage and quality can serve as a key differentiator for the mall, potentially resulting in higher rental rates.
Operators can offload onto Wi-Fi as an alternative to extending 5G indoors, provided these systems are designed, optimized, and operated with equivalent quality of experience, using, for example, Ekahau®. While many malls in the region have Wi-Fi infrastructure, we believe that 5G complements rather than competes with Wi-Fi. Direct access to a 5G network offers more convenience for consumers and is intrinsically more secure than 4G or Wi-Fi.
The latest generations of Wi-Fi technology, including Wi-Fi 6 and Wi-Fi 7, are likely to play a more pivotal role in enhancing indoor coverage thanks to their improved performance, higher speeds, and increased capacity. Wi-Fi’s seamless integration with cellular coverage enables the offloading of cellular traffic in congested areas, maintains connectivity in deep indoor locations, and provides a robust and interconnected network experience for users.
Major differences in indoor 5G coverage quality between malls, operators, and countries in the Gulf region
In this analysis, we examine the variations in the strength of indoor 5G coverage across select shopping malls in Qatar, Saudi Arabia, and the U.A.E.. We use data from Cell Analytics based on crowdsourced measurements of consumers’ mobile devices worldwide. The tool captures RF measurement and data usage, both indoors and outdoors, enabling us to benchmark signal metrics and generate user density and competitive coverage difference maps.
We use the average Reference Signal Received Power (RSRP) as a measure of network coverage. RSRP represents the network signal strength received by a mobile phone. An RSRP value that exceeds -90 dBm indicates superior coverage. If the signal strength is between -90 dBm and -100 dBm then network coverage is considered good. Lower RSRP values signify lower download speeds and an increased probability of network disconnection.
In the sections below, we examine 5G RSRP measurements inside major malls in Qatar (Doha), Saudi Arabia (Jeddah and Riyadh), and the U.A.E. (Abu Dhabi and Dubai) from December 2022 to November 2023. For each location, we compare operators’ RSRP values to determine which ones offer superior 5G coverage. We included locations where we received sufficient samples to achieve a confidence level of 95%.
du commands a lead in indoor 5G coverage in more U.A.E. malls than Etisalat by e&
The U.A.E. emerged as the fastest 5G market globally in Q2 2023, according to Ookla® Speedtest Intelligence®. This achievement was facilitated by an almost nationwide 5G coverage of the population. Both operators, du and Etisalat by e&, have sought to continually enhance customer experience by improving network coverage and quality.
du reported 98.5% 5G coverage of the population in November 2023 and attributed much of its CAPEX to 5G deployment and specifically to enhancing indoor coverage. For example, it has installed small cell antennas in apartments and offices and expanded DAS in new mall locations. It also launched 5G Standalone (SA) and Voice over New Radio (VoNR) in 2023.
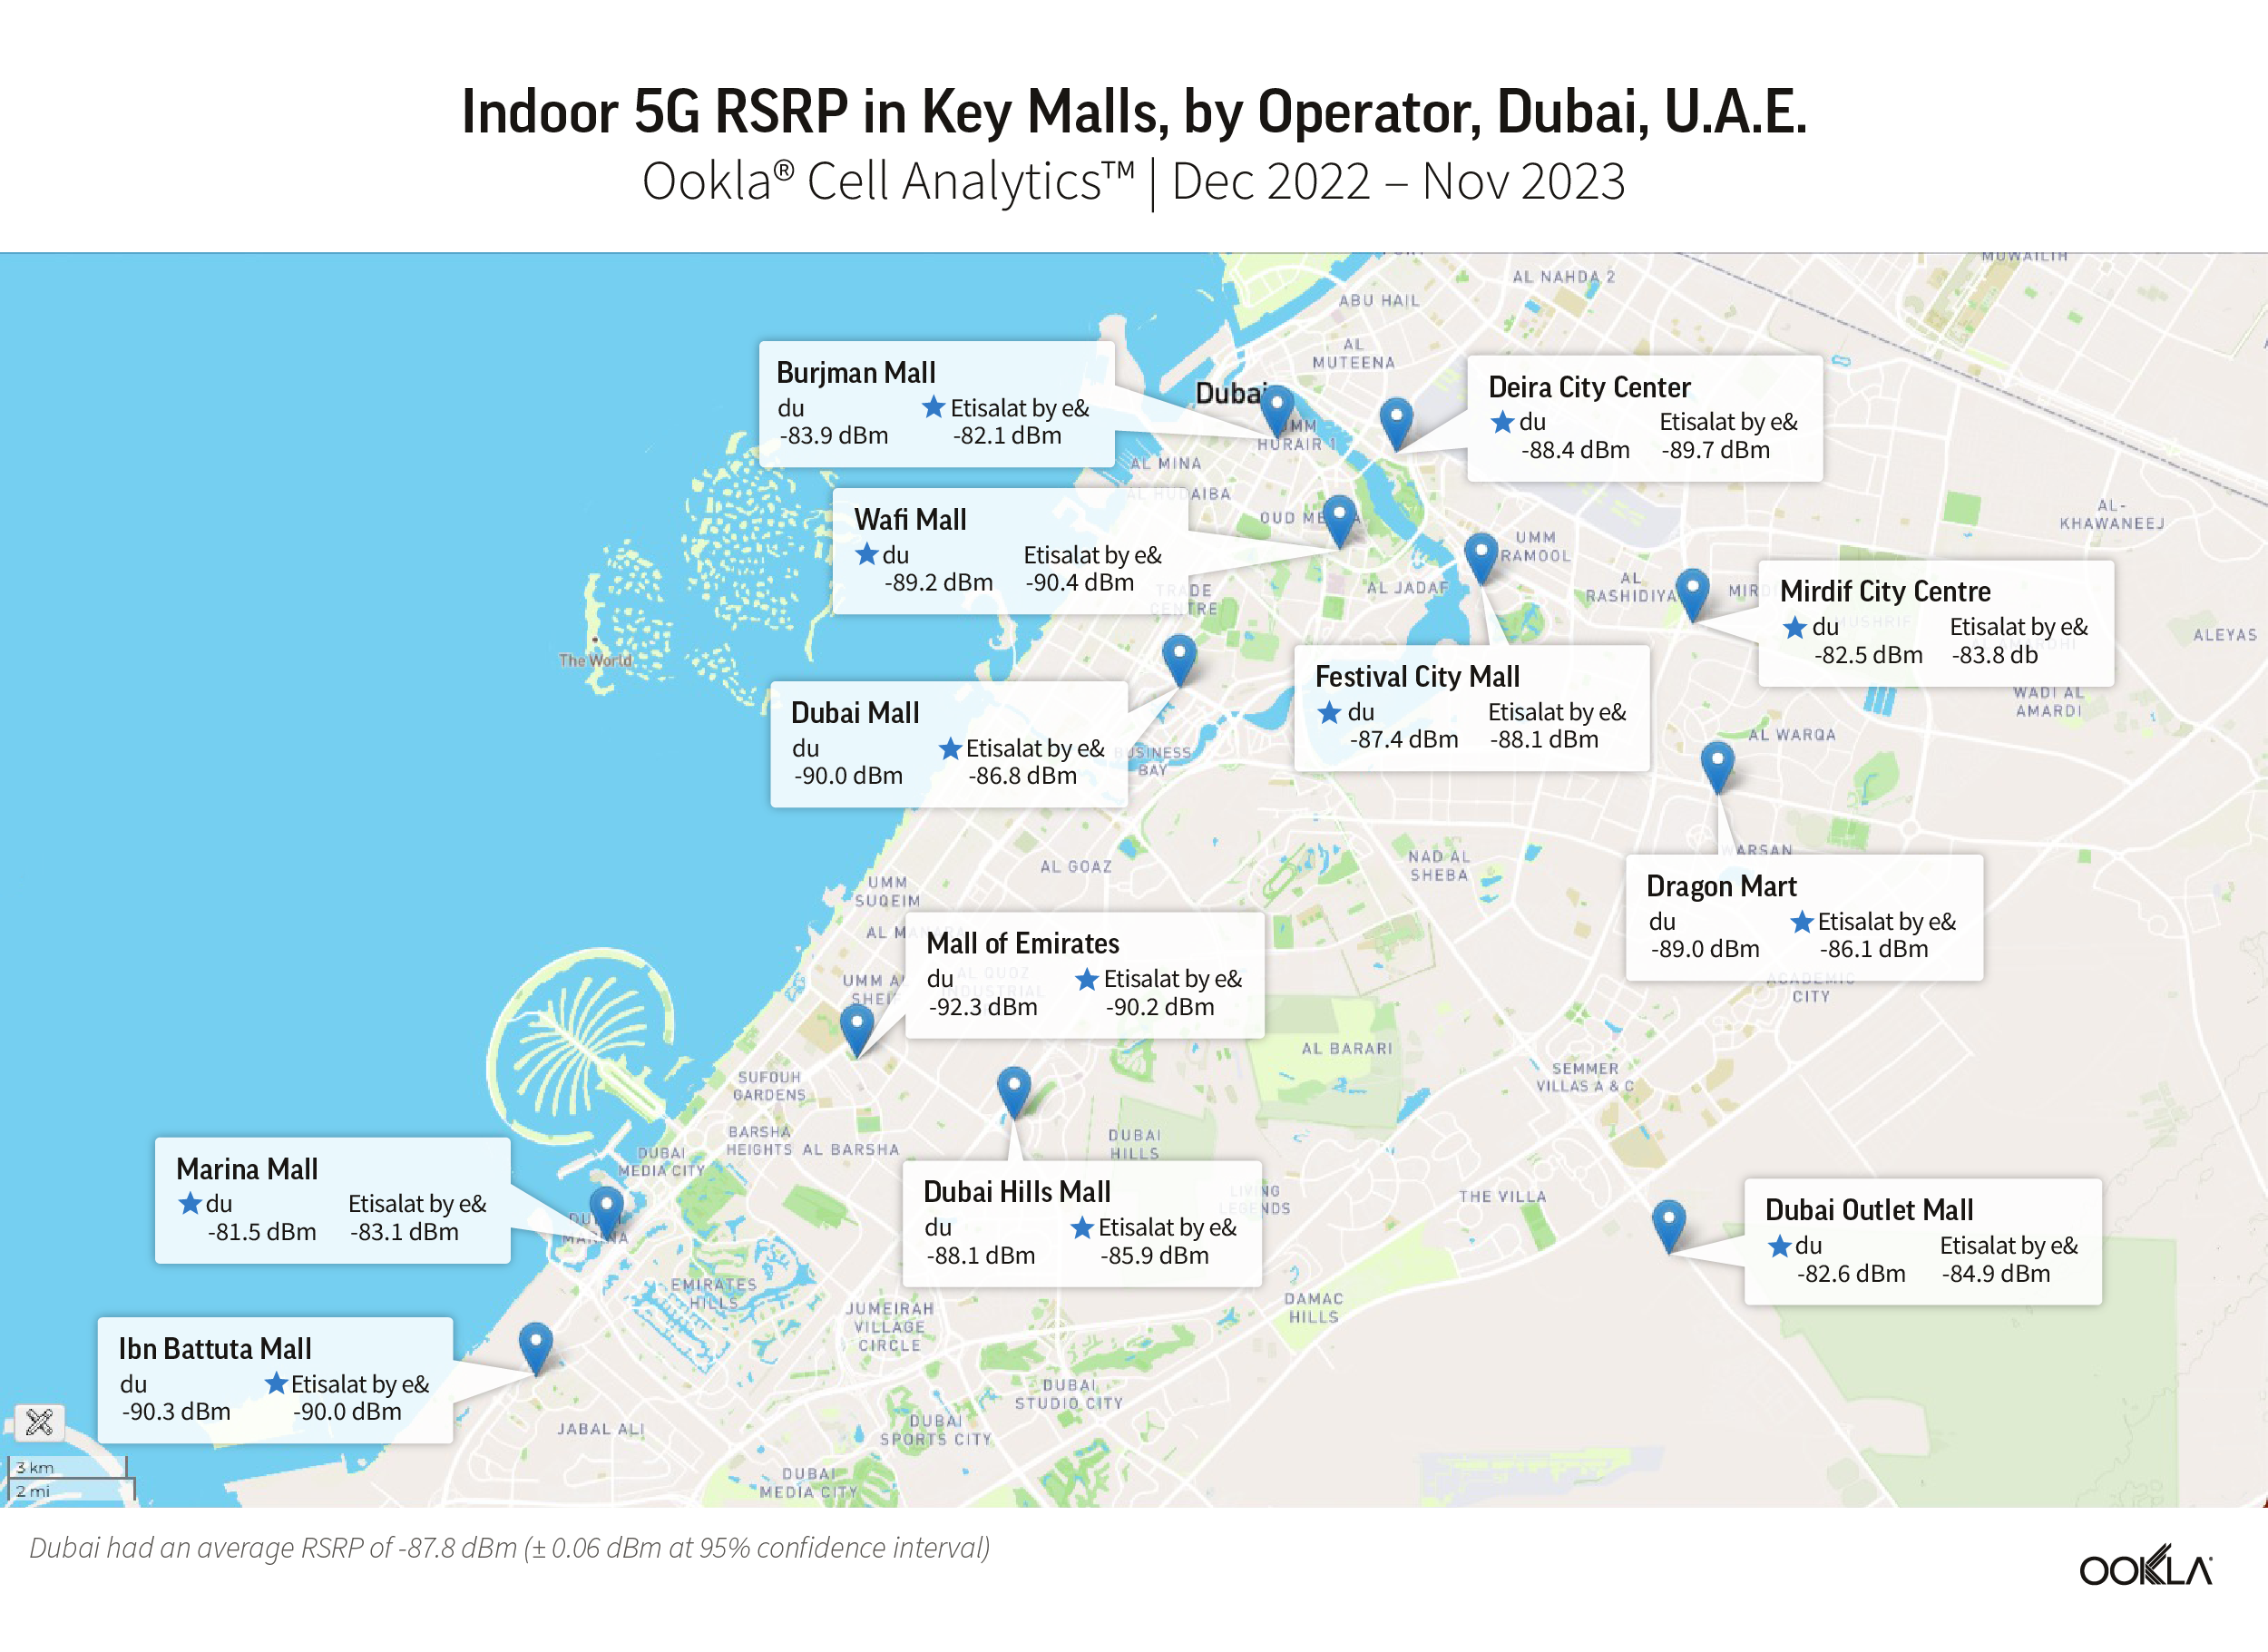
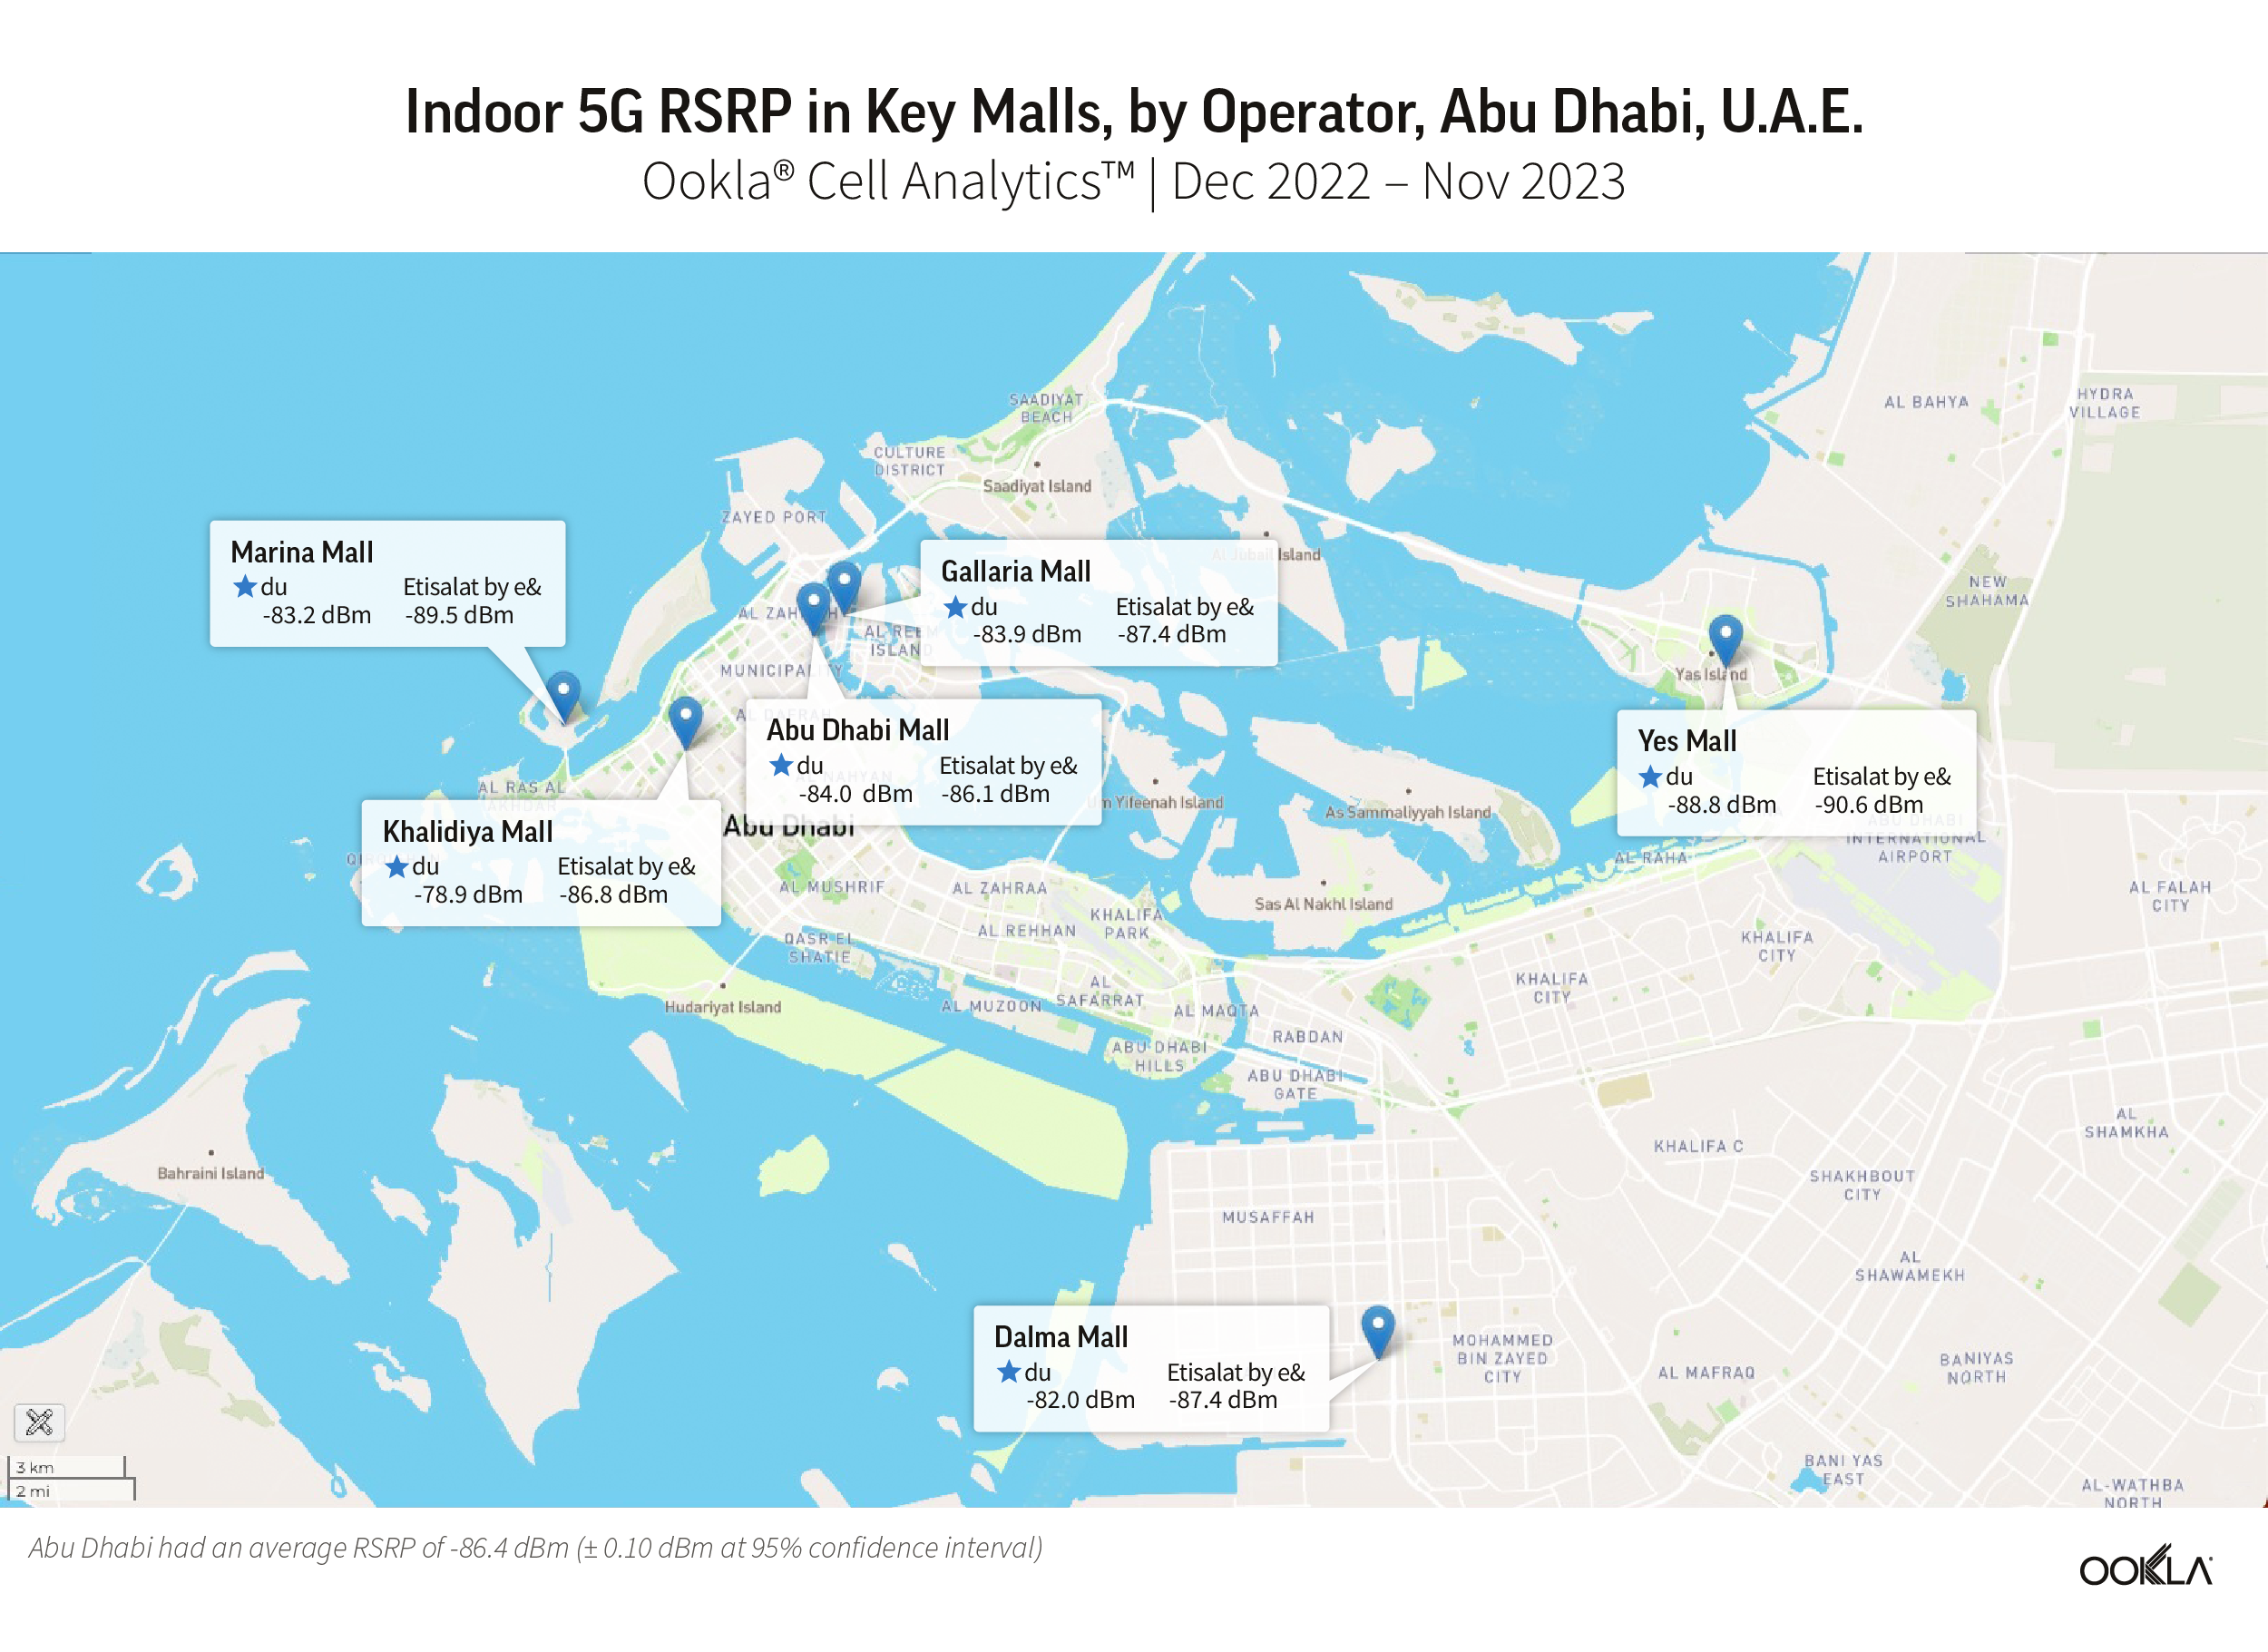
The chart below depicts indoor 5G RSRP values for du and Etisalat by e&, across 12 malls in Dubai and six others in Abu Dhabi. Both operators have the same number of malls in Dubai where they lead in indoor coverage. In Abu Dhabi, du consistently outperformed Etisalat by e& in terms of indoor coverage in all the malls we reviewed.
Overall, top U.A.E. malls have better indoor 5G coverage than those in Qatar and Saudi Arabia. The weighted average RSRP per mall is at least -86 dBm in 9 out of the 18 locations analyzed, suggesting excellent indoor coverage. However, in some locations, such as Ibn Battuta Mall, Mall of Emirates (for both operators), Wafi Mall and Yas Mall (for Etisalat by e&), and Dubai Mall (for du), the signal power is equal or less than -90 dBm.
du consistently outperforms Etisalat by e& in indoor 5G coverage across all the six malls in Abu Dhabi. For example, du is 10% better than Etisalat by e& in Khalidiya Mall and 8% better in Marina Mall.
The difference in signal power in Dubai locations is generally smaller, implying that consumers are unlikely to perceive a difference in 5G coverage while shopping there. For example, the RSRP gap between operators is inferior to 1.5 dBm in Deira City Mall, Festival City Mall, Ibn Battuta Mall, Mirdif City Centre, and Wafi Mall. This could be because both operators share the same indoor coverage infrastructure in these malls to avoid duplication and to reduce costs.
Mobily and Zain are the frontrunners for indoor 5G coverage in Saudi malls
The Saudi Communications, Space & Technology Commission (CST) reported that 5G coverage reached 97 governorates in March 2023 (out of 136 governorates), up from 84 a year earlier. This is a substantial jump from the 35 governorates it first reported in Q2 2020.
This improvement is partially driven by the ongoing release of suitable spectrum for 5G. Indeed, operators had access to low-band spectrum (700 MHz and 800 MHz) from 4G that they could reuse for 5G, and auctions for 2.3 GHz, 2.6 GHz, and 3.5 GHz bands were completed in 2019. The CST also plans to auction 600 MHz, 700 MHz, and 3800 MHz bands in Q1 2024.
Operators have steadily invested in 5G infrastructure. stc reported that it provides 5G coverage to over 90% of its mobile site locations in major cities. In October 2023, it announced significant network investments to extend its reach to over 75 cities and governorates.
The two charts below show indoor 5G RSRP values for Mobily, stc, and Zain across three malls in Riyadh and three others in Jeddah. Despite the large investments in 5G infrastructure and access to low-band spectrum, Cell Analytics reveals a weighted average RSRP of -95.5 dBm across the six surveyed malls, which is significantly lower than the weighted averages in Qatar and the U.A.E. at -85.3 dBm and -87.4 dBm, respectively.
Saudi Arabia is home to the five malls with the poorest indoor 5G coverage among the 28 malls analyzed in this article. The RSRP weighted averages ranged from -98.8 dBm in Al Salam Mall in Jeddah to -93.8 dBm in Riyadh Gallery Mall in Riyadh (the other lagging malls are Mall of Arabia and Red Sea Mall in Jeddah, and Al Nakheel Mall in Riyadh).
Mobily had better indoor 5G coverage than its competitors in three malls while Zain outperformed them in two of the malls. Mobily is quite ahead of its competitors in Mall of Arabia, one of the biggest malls in Saudi Arabia, with an RSRP of -92.8 dBm, a signal strength that is 6.5 dBm higher than Zain’s and 8.8 dBm stronger than stc’s.
Zain leads Mobily in two malls, Riyadh Gallery Mall and Red Sea Mall, by 2.4 dBm and 1.7 dBm, respectively. On the other hand, stc leads in 5G coverage inside Granada Center with an RSRP of -88.1 dBm, the highest signal power among the analyzed malls in Saudi Arabia. The RSRP difference between the three operators in the other malls varies between 3.3 dBm and 4.6 dBm, which suggests that operator choice can affect signal reception when shopping in these venues.
Ooredoo leads in 5G coverage inside the malls in Qatar
Likewise, Vodafone nearly doubled its radio network sites, upgraded the existing sites’ technologies, and increased 5G coverage, especially indoors. It reported that over 1188 TB of data were consumed across all stadiums during the World Cup. These initiatives helped to make Vodafone the world’s fastest mobile network operator in 2022. By June 2023, 85% of Vodafone’s 2250 radio network sites were 5G enabled.
The chart below shows indoor 5G RSRP values for Ooredoo and Vodafone across four malls in Doha. It reveals that Ooredoo delivered superior indoor coverage in all of them, except for Villaggio Mall, where Vodafone outperformed.
The difference in RSRP is highest in City Center Doha Mall where Ooredoo was ahead of Vodafone by 9.2 dBm. In the country’s largest shopping center, the Mall of Qatar, the difference in indoor signal strength between the two operators is sizable, standing at 4.4 dBm. However, since both operators offer excellent coverage simultaneously, with an RSRP of -81.4 and -85.8 for Ooredoo and Vodafone, respectively, consumers are unlikely to perceive a difference in coverage.
Operators need to consider non-technical aspects when deploying indoor solutions
Measures should be in place to encourage operators to make indoor network deployments more efficient. For instance, the Chinese government mandated that operators share the mid-band spectrum (3.3-3.4 GHz) for indoor coverage to promote co-development and cost-sharing. In Europe, mobile network operators (MNOs) share indoor networks deployed by neutral hosts, such as Cellnex, with a revenue model based on charging the venue or building owner for the network instead of the operator.
In the United States, the primary ownership model for DAS often involves a combination of ownership by neutral host operators, MNOs, and venue owners depending on agreements, partnerships, and specific needs of the venue or location. Neutral host operators often play a significant role in deploying shared DAS infrastructure, while venue owners, managers, or MNOs may also have ownership stakes or involvement in specific deployments to enhance indoor wireless coverage.
Beyond cost and technical considerations, operators need to carefully address other factors and practical challenges before and during the implementation of an indoor network coverage solution. These include site acquisition and permission, physical space and aesthetics, and regulatory compliance needs.
Regulators can have a proactive role in reducing bureaucratic hurdles and encouraging government-industry collaboration. For example, in South Korea, the regulator promotes the parallel development of indoor and outdoor 5G coverage across the country. Another example is the Telecom Regulatory Authority of India (TRAI) which recently requested industry views on the mechanism to rate digital connectivity in buildings. TRAI’s initiative illustrates the importance of devising standard guidelines, incentivizing investments in in-building infrastructure, and ultimately ensuring seamless and reliable indoor connectivity for consumers and businesses.
Ookla can support operators and venue owners in improving indoor cellular coverage
As consumers’ expectations for network speed and consistent connectivity rise with the advent of 5G, operators should prioritize addressing indoor coverage issues to improve customer experience, drive data usage, and outperform their competitors.
As more consumers and businesses rely on 5G, an excellent indoor 5G experience will become even more essential. It will also pave the way for innovations that blend in-store with digital experiences. The future of physical malls in the region hinges on their ability to adopt new technologies and use them to transform the consumer experience.
Ookla can assist operators in identifying buildings or indoor venues with coverage or capacity issues using crowdsourced and controlled test data and the execution of precise walk tests for diagnosis. Cell Analytics helps to identify specific indoor areas with low signal-to-interference-and-noise ratio (SINR) and signal quality (RSRQ), causing sluggish data speeds despite adequate coverage (RSRP).
Equipped with this knowledge, mobile network operators can promptly deploy personnel for on-site walk-tests using Wind™, Ookla’s handheld walk-and-drive controlled testing platform. Wind enables testers to simulate user behavior while meticulously capturing detailed RF data in the background and processing it in near-real time. This allows operators to implement corrective actions to boost network performance within any venue.
An alternative to deploying in-building 5G systems is to selectively offload usage to Wi-Fi provided these systems are designed, optimized, and operated to deliver an equivalent quality of experience – this can be done using Ekahau.
Ookla retains ownership of this article including all of the intellectual property rights, data, content graphs and analysis. This article may not be quoted, reproduced, distributed or published for any commercial purpose without prior consent. Members of the press and others using the findings in this article for non-commercial purposes are welcome to publicly share and link to report information with attribution to Ookla.
To gain insight into the current performance of networks, we analyzed Speedtest® data in Q3 2023. Our analysis compares changes in 5G performance to the previous year, identifies the top 10 countries with the best performance, and discusses customer satisfaction with 5G. We also ranked countries based on the performance of their fixed networks and investigated the connectivity gap across the world.
Global 5G download speed improved. The median global 5G download speed experienced a substantial 20% increase in Q3 2023, reaching 203.04 Mbps, compared to 168.27 Mbps in Q3 2022. This improvement aligns with a significant rise in global 5G subscriptions, indicating positive progress in user adoption of 5G and the performance of 5G networks.
Top 5G performers have shifted. The top 10 countries for 5G performance witnessed notable changes, with the United Arab Emirates claiming the top spot, surpassing South Korea. Malaysia, India, and the Dominican Republic also made significant strides, showcasing a dynamic shift in the global 5G landscape.
Speedtest user ratings indicate room for 5G improvement. Despite advancements in 5G technology, there has been a decline in the Net Promoter Score (NPS) among 5G users. Factors contributing to this dissatisfaction could include unmet expectations and discrepancies between actual 5G speeds and advertised speeds.
Fixed Networks Advancements. On a global scale, fixed networks demonstrated significant performance improvement, with a 19% increase in median download speed (83.95 Mbps) and a 28% increase in upload speed (38.32 Mbps) in Q3 2023 compared to the previous year. This highlights the ongoing transition to more advanced broadband technologies, particularly Fiber-to-the-Home (FTTH).
The imperative of closing the connectivity gaps. Despite improvements in global connectivity, there are still areas that fall outside of network coverage. Speedtest® data highlights disparities in internet performance between fixed and mobile networks across different regions, emphasizing the importance of addressing connectivity challenges worldwide.
5G Networks
Global 5G download speed improvements
The median global 5G download speed has experienced a noteworthy surge, registering a 20% increase and reaching 203.04 Mbps in Q3 2023, compared to 168.27 Mbps in Q3 2022, according to Speedtest Intelligence® data. This improvement coincides with a substantial rise in global 5G connections, reaching 1.4 billion according to GSMA Intelligence, representing a 65% year-on-year increase from 872 million a year ago.
In terms of upload speed and latency, only a very modest improvement of 1% occurred. Median 5G upload speeds reached 18.93 Mbps in Q3 2023, compared to 18.71 Mbps in the same period last year; multi-server latency, a critical metric for network responsiveness, improved from 45 ms in Q3 2022 to 44 ms in Q3 2023.
Speedtest users experiencing the top 10% of 5G download speeds globally have seen a 9% increase, rising from 525.54 Mbps in Q3 2022 to 573.12 Mbps in Q3 2023. However, speeds have not yet reached Gigabit levels, primarly because of network economics. 5G was originally designed to deliver peak data rates of up to 20 Gbps based on IMT-2020 requirements, but we are still a ways off before gigabit speeds become the new normal. For instance, symmetrical download, upload speeds, and ultra-low latency haven’t been realized, partially because the vast majority of 5G networks are not ‘true 5G’ as they have been deployed in Non-Standalone (NSA) mode, meaning they rely on a 4G LTE network core. According to GSA, over 40 operators have launched 5G standalone (SA) in public networks, but the rollout is not yet complete. Nevertheless, the industry is actively exploring the prospect of 5G Advanced, which promises symmetrical upload and download speeds and ultra-low latency, signaling a proactive stance ahead of the eventual transition to 6G.
Malaysia joined South Korea and the U.A.E at 5G speeds podium
During Q3 2023, the United Arab Emirates and South Korea stood out as leaders in 5G performance, boasting the fastest median 5G download speeds globally at 592.01 Mbps and 507.59 Mbps, respectively. Our top 10 list also includes Malaysia, Qatar, Brazil, the Dominican Republic, Kuwait, Macau, Singapore, and India. The shift in the top 10 rankings reveals dynamic changes, with Malaysia, the Dominican Republic, and India making significant strides, while Bulgaria, Saudi Arabia, New Zealand, and Bahrain dropped out of the rankings.
The U.A.E showcased a 14% increase in its median 5G download speed, reaching 592.01 Mbps in Q3 2023, up from 511.68 Mbps in Q3 2022, allowing the U.A.E to take the top spot from South Korea. Key factors contributing to the U.A.E.’s 5G leadership include fierce market competition driven by Etisalat and du, resulting in extensive 5G coverage and widespread access to 5G services. Additionally, the allocation of a 100 MHz of contiguous spectrum, as discussed in our 5G spectrum article, has played a pivotal role in achieving faster speeds, lower latency, and improved spectral efficiency.
The regional shift in 5G performance leadership is noteworthy. In 2022, half of the top 10 countries were from the Middle East, while in 2023, the same proportion hailed from the Asia Pacific region. Our analysis suggests that early adopters in the Asia Pacific region have outperformed major European markets in 5G performance, due to factors such as early spectrum availability and supportive government policies.
Malaysia’s remarkable achievement in reaching the third spot globally for 5G download speed, with a reported speed of 485.24 Mbps in Q3 2023, is particularly noteworthy. Despite launching its nationwide 5G network less than two years ago, Malaysia’s unconventional deployment strategy has proven effective. India has also made a significant leap, with its median 5G download speed of 312.26 Mbps allowing India to reach the top 10 worldwide. The country’s climb of 72 places on the Speedtest Global Index™ between September 2022 and August 2023 is primarily credited to the launch of 5G. Following a 5G spectrum auction in India, operators have successfully addressed network congestion issues by offloading 4G traffic onto 5G networks.
In Brazil, 5G download speed increased 1.4 times, jumping from 312.09 Mbps in Q3 2022 to 443.93 Mbps in Q3 2023. Before Brazil’s 5G spectrum auction, operators had offered 5G using DSS since July 2020. While DSS can provide broad 5G coverage, its speeds are often similar to those on 4G LTE networks. In November of 2021, however, Brazil’s multi-band 5G spectrum auction closed, which not only generated BRL47.2 billion ($8.5 billion) in total commitments, but it also allowed operators to deliver much faster speeds on dedicated 5G spectrum compared to DSS. National operators – Telefonica Brasil (Vivo), Claro Brazil, and TIM Brazil – ended up with 40 MHz or 50 MHz in the 2.3 GHz spectrum band and 100 MHz each in the 3.5 GHz band. The subsequent simultaneous activation of 5G networks in July 2022 marked a transformative moment with the continuous expansion of 5G services to 623 municipalities by December 2023. An upcoming spectrum auction expects to improve Brazil’s 5G standing even further.
The Dominican Republic’s entry into the top 10 fastest 5G countries was marked by its official launch of 5G services in December 2021, making it the first Caribbean nation and the third in Latin America to adopt a 5G network.
Disparity Between 5G Performance and Consumer Perception
The Net Promoter Score (NPS) is a tool that gauges customer loyalty and satisfaction. At the end of Speetest, users may be asked to answer “How likely is it that you would recommend [provider] to a friend or colleague?” on a scale from 0-10. Net Promoter Scores are applied to both users and providers. Users are categorized into Detractors (score 0-6), Passives (score 7-8), and Promoters (score 9-10). NPS is the percent of Promoters minus the percent of Detractors and is displayed in the range from -100 to 100. Providers are ranked in descending order of NPS. NPS categorizes users into Detractors (those that score 0-6), Passives (scores between 7 and 8), and Promoters (scores of 9-10). NPS represents the percentage of Promoters minus the percent of Detractors displayed in the range from -100 to 100.
In our article discussing whether 5G was meeting customer expectations, we found that 5G users typically rate their network operator with NPS scores universally higher than those for 4G LTE users. In Q3 2023, that trend continued, as 5G users that were on 5G network when answering the NPS question still scored higher than those on 4G across all markets analyzed. It isn’t surprising given that at a global level, 5G had a 637% better median download speed than 4G and a 130% better median upload speed.
While 5G NPS still outpaces scores on 4G, our data shows that 5G NPS has been decreasing annually. This could point to the fact that excitement about 5G as a new technology is waning as users become used to faster speeds, or as customers await new use cases that can take advantage of the faster speeds that 5G can provide. After all, we are still waiting for that killer app for 5G, the way the video and streaming were for 4G.
While it is difficult to fully explain the reasons behind the 5G NPS decrease without further research, we can clearly see that network performance isn’t the only factor at play influencing NPS declines. Others can include customer care, pricing, and other services. For example, in South Korea, one of the first countries to launch 5G with one of the world’s fastest speeds, consumers scored 5G networks -41.47 in Q3 2023 compared to -20.51 in Q3 2022.
In March 2021, South Korean consumers launched a class action suit against operators because they felt they were being misled by the promises of 5G in the country. Recently, South Korea’s antitrust regulator fined three 5G operators a total of 33.6 billion won ($25.06 million) for making exaggerated claims about the level of performance their networks could achieve. South Korean operators claimed consumers could experience theoretical 5G speeds, which are not practically achievable in a “real world” environment, as factors such as spectrum usage, network densification, user location, and device capability significantly affect actual performance. Our data shows that the top 10% of 5G users in South Korea experienced speeds of 1.004 Gbps in Q3 2023, which, although impressive, are far lower than the advertised 20 Gbps speeds.
Fixed Networks
Fiber driving fixed performance gains
On a global scale, fixed networks have demonstrated significant advancements, achieving a median download speed of 83.95 Mbps and an upload speed of 38.32 Mbps in Q3 2023, per Speedtest Intelligence data. This signifies a substantial 19% improvement in download speed and an impressive 28% enhancement in upload speed compared to those in 2022. This also indicates that more fixed connections have migrated to fiber networks.
According to the World Broadband Association (WBBA) report titled “Next Generation Broadband Roadmap 2023 to 2030” Fiber-to-the-Home (FTTH) is identified as the natural progression from copper-based xDSL broadband networks. The shift towards FTTH varies across different countries and regions, but the industry is committed to embracing more advanced and efficient broadband technologies.
Oftentimes, despite improvement in underlying broadband technology, Wi-Fi is the bottleneck that reduces customer experience. Our research has shown that Wi-Fi performance can lag behind ethernet in markets where advanced cable and fiber connections are replacing legacy broadband technology (such as DSL or coax cable). Wi-Fi speeds typically range from 30-40% of ethernet, indicating a need to accelerate the adoption of more advanced Wi-Fi technologies and optimize the home network environment.
The UAE, Singapore, and Hong Kong are in the lead for fixed
The United Arab Emirates (UAE) and Singapore led the way in fixed network performance.
The UAE achieved a median download speed of 247.63 Mbps in Q3 2023, representing a notable 1.83 times increase compared to the previous year. Most customers in the UAE have access to fiber networks, and additional measures have been implemented by operators in the region to enhance internet speeds, such as increasing the minimum download speed from 250 Mbps to 500 Mbps and offering price discounts to incentivize users to upgrade to higher-tier plans.
Singapore also leads on the 2023 Fiber Development Index (FDI), with maximum scores in seven of the nine metrics. Singapore, along with Qatar and South Korea, has achieved 100% FTHH coverage. One of the reasons for this success, besides having a smaller area, is that Singapore’s regulator mandates building owners and real estate developers to provide adequate space, facilities, and accessibility for network operators to pre-install fiber networks.
Hong Kong also demonstrated significant progress, with a 37% increase in median download speed and a 40% increase in upload speed. To track broadband adoption, the Office of the Communications Authority (OFCA) in Hong Kong monitors broadband adoption by advertised speed and technology mix; as of August 2023, 66% of residential clients already subscribed to the Internet with a download speed equal to or greater than 1 Gbps.
Chile has seen a 14% improvement in median download speed and a 29% improvement in upload speed on the back of a greater fiber adoption. Chile has been the top-performing fixed broadband market across Latin America, consistently outperforming other regional markets but over the last three years, it has also closed the performance gap with other leading markets globally. Chile’s strong fixed broadband performance — an anomaly in the region — is primarily due to strong competition among Chilean ISPs. Chile has seven ISPs with over 5% market share, all heavily focused on migrating customers to fiber.
Thailand is a newcomer to the ranking as FTTH continues to grow strongly. FTTH constitutes an impressive 95% of fixed broadband users in Thailand, equivalent to around 58.96% of household penetration. Operators have been actively rolling out fiber in adherence to the Digital Thailand National Policy.
In the United States, there has been a 26% improvement in median download speed and a 7% improvement in upload speed. In this very competitive market, with a range of access technologies vying for customers, a combination of migration to fiber, 5G fixed-wireless access (FWA), and faster cable connections is helping drive higher performance levels. In line with the demand for faster network performance in the market, the FCC recently announced that it is seeking input on a planned increase to its definition of broadband/high-speed internet to 100 Mbps download and 20 Mbps upload, up from the current 25 Mbps download and 3 Mbps upload standard.
As discussed in our recent article, several European countries are making substantial progress in offering high-speed broadband. Across Europe, Denmark had the fastest median download speed for fixed broadband (196.43 Mbps), followed by Spain (176.08 Mbps) and France (170.51 Mbps). Denmark experienced a 25% improvement in median download speed and a 16% improvement in upload speed. Spain also showed significant improvement, with a 32% increase in median download speed and a 29% increase in upload speed. France exhibited even stronger progress, with a 53% increase in median download speed and a 41% increase in upload speed. The speed gains we’ve seen in Spain and France are correlated with an increase in fiber adoption; for example, Spain boasts nearly 90% fiber optic coverage, thanks to private initiatives and government support, while France expects a full-fiber rollout by 2025.
Connectivity for All
The imperative of closing the connectivity gap
Massive investments are being made to bridge the connectivity gap as recognition of connectivity as a fundamental human right is growing. According to a WBBA Whitepaper, a high level of broadband penetration is critical to the country’s socioeconomic development. However, it’s not only about being connected to the network per se; the quality of that broadband connection is equally crucial. Unlike other utility services like gas and electricity, where quality is generally stable, with broadband, the quality of the network experience is crucial to ensure users can benefit fully from multiple applications.
To assess the digital divide, we mapped mobile and fixed internet performance using data from the Open Data Initiative, which Ookla provides as part of Ookla for Good.
“>
“>
Determining where a digital divide exists is a complex issue that involves identifying where network infrastructure is located, where people need connectivity, and how affordable it is. Although it can be challenging to dig into a specific location, it is evident that there are varying levels of Internet performance worldwide. A quick glance at our data shows that fixed broadband customers are more likely to experience faster networks (measured as an average download speed of 100 Mbps and above) than mobile across the Americas and Europe. The opposite is true for mobile networks across Africa and APAC, where mobile networks are often the primary means of connectivity. Compared to urban areas, rural communities are often ill-equipped for broadband access. Due to a lack of bandwidth (and therefore slower speeds), people in these areas need help doing many things on the internet, such as streaming videos. The US regulator FCC defines broadband in the United States as access to 25 Mbps download and 3 Mbps upload speeds. Areas without those speeds are classified as broadband “digital deserts,” even if those areas have internet access. Although broadband definitions can vary considerably from country to country, we can see in the next section that many areas fall outside any standards of connectivity globally.
Despite the world becoming increasingly connected, many rural and remote areas still struggle to access the internet. For example, large swathes of South America and Africa fall outside terrestrial network coverage. As discussed in our recent article, cellular networks are critical to connecting individuals and businesses as internet access in Africa is predominantly mobile. Before we can start discussing 5G, connecting communities with the internet in general is a priority. Affordable 4G smartphones and targeted financing for under-served demographics are key for bridging the digital divide and reducing poverty, as a World Bank study found that 4G coverage can help cut poverty by up to 4.3%.
“>
“>
5G technology can potentially replace fixed internet access in situations where the cost of fiber deployments is high and rolling out traditional fixed broadband networks isn’t commercially viable. However, in countries like Indonesia, satellite technology may be a more effective solution for connecting remote areas. While 5G Fixed Wireless Access (FWA) and satellite technology can complement each other, the adoption of satellite technology is currently limited by factors such as coverage, device affordability, and service cost. As revealed in our recent article, Starlink outperforms GEO satellites and is a suitable replacement for fixed networks in rural areas. While it may not match the leading cable or fiber providers in terms of median speeds or multi-server latency, satellite internet provides a viable alternative in places where cable and fiber access networks are unavailable. This is mainly due to a more consistent distribution of download performance across Speedtest samples, unlike FWA and DSL-based services, where performance is impacted by the distance from the cell site or exchange/DSLAM.
Fixed and mobile network operators across the globe widely use Speedtest data to enhance Internet quality, improve accessibility, and inform network expansion. The United States Federal Communications Commission and the Malaysian Communications and Multimedia Commission rely on Speedtest data to ensure accountability of telecommunications entities and allocate funds for rural and urban connectivity development. Ookla also licenses data to NGOs and educational institutions to help bridge the digital divide between areas with and without modern Internet access. Our mapping data is used to track results and determine whether broadband infrastructure can handle growth as more people connect devices and technologies demand more bandwidth. We are also actively involved in discussing best practices for ensuring digital transformation and connectivity for all in the APAC region, Central Asia, and Europe. If you are interested in working with us, please reach out.
Ookla retains ownership of this article including all of the intellectual property rights, data, content graphs and analysis. This article may not be quoted, reproduced, distributed or published for any commercial purpose without prior consent. Members of the press and others using the findings in this article for non-commercial purposes are welcome to publicly share and link to report information with attribution to Ookla.