| February 16, 2023

Spectrum: An Essential Ingredient to Ensure Good 5G Performance

We have recently written about 5G performance at length, ranked the countries, looked at operators’ 5G strategies, and even commented on consumers’ perception of 5G performance. Most recently, we commented on the state of the worldwide 5G in 2022 and the fastest 5G mobile devices. This article will examine the relationship between spectrum and 5G performance.

Key takeaways:

  • Based on Speedtest Intelligence® data, we can see a significant variance between countries in median 5G speed, with four broad clusters of 5G performance emerging: 5G Leaders, High Performers, Improvers, and 5G Outliers. 
  • 5G performance depends heavily on the operator’s 5G spectrum holding.
  • The larger the allocation of the C-band spectrum, the faster the 5G download speed, with the contiguous spectrum enhancing performance further. 
  • Operators with access to 100 MHz of contiguous spectrum, e.g., in the U.A.E. and South Korea, led the 5G global ranking in Q4 2022 with a median download speed of 516.15 Mbps and 511.70 Mbps, respectively.
  • Access to low-band spectrum is just one factor that impacts 5G Availability. 

Four tiers of 5G performance 

Looking at market-level Speedtest Intelligence data, we can see significant variance in median 5G download speeds between the 52 countries we analyzed. We identified four broad clusters of 5G performance as measured by median 5G download speed.
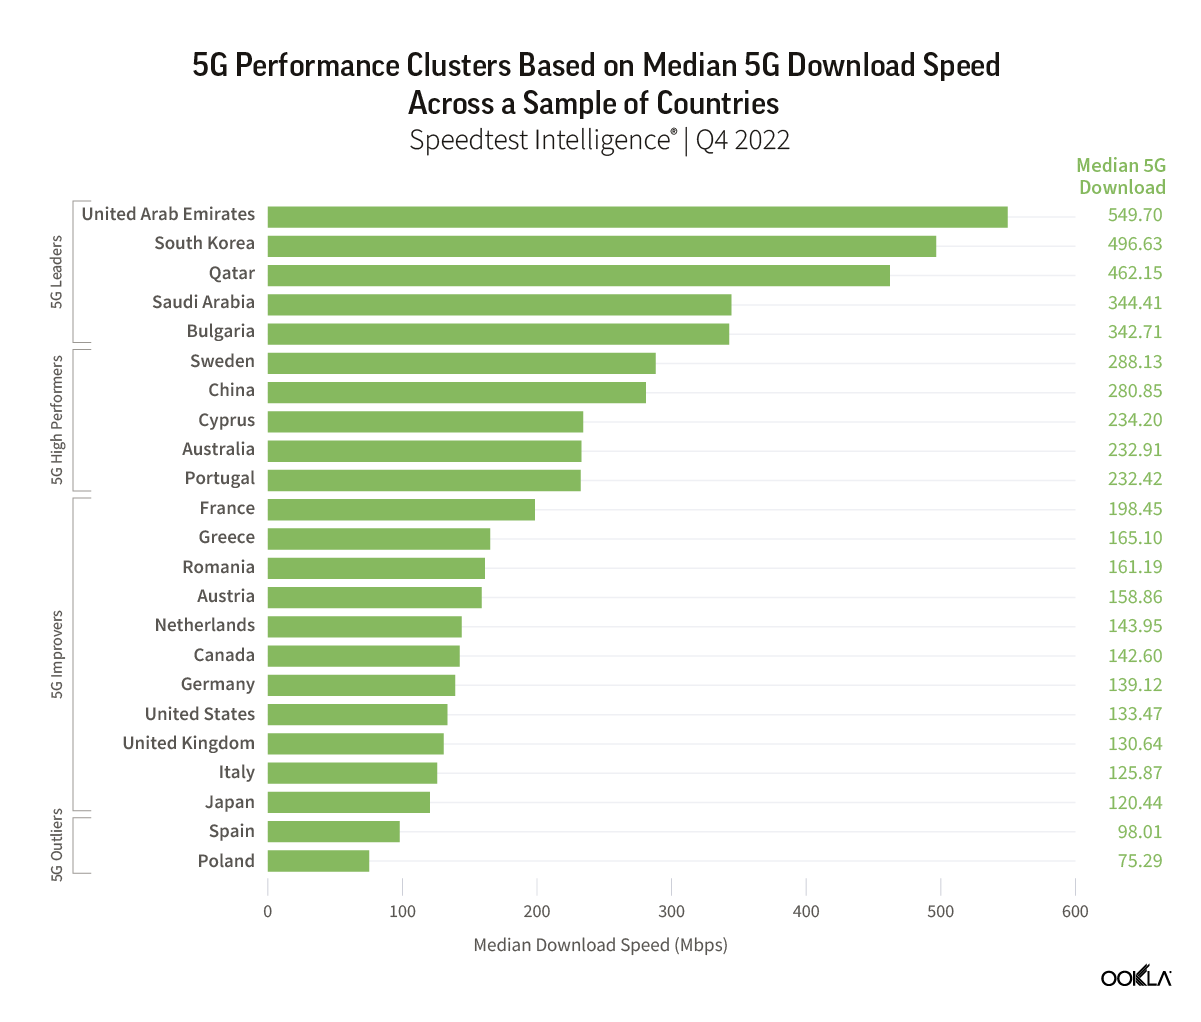
chart of 5g performance clusers basd on median 5g download speed across a sample of countries5G Leaders: > 300 Mbps

These markets are the 5G pioneers, being among the first to launch 5G services, and are continually pushing the boundaries of 5G performance with median download speeds typically greater than 300 Mbps. High-performant 5G markets have allocated substantial amounts of spectrum for 5G use, particularly with wide allocations in the coveted C-band, and have assigned and, in some cases, begun limited use of mmWave spectrum. In some cases, we see a trade-off between 5G performance and 5G Availability (the proportion of time users with 5G capable devices spend connected to 5G networks).

5G High Performers: 200 – 300 Mbps

These markets share many of the characteristics of 5G leaders, having made an adequate spectrum allocation for 5G use and fostered competition between operators, which has helped spur network investment. However, they lag behind 5G Leaders based on their level of network densification. They typically use Dynamic Spectrum Sharing (DSS), which allows operators to share spectrum between network generations, but it can weigh on performance. Median 5G download performance in these markets typically ranges from 200 Mbps to 300 Mbps. We don’t generally see as much of a trade-off between performance and 5G Availability in these markets. 

5G Improvers: < 200 Mbps

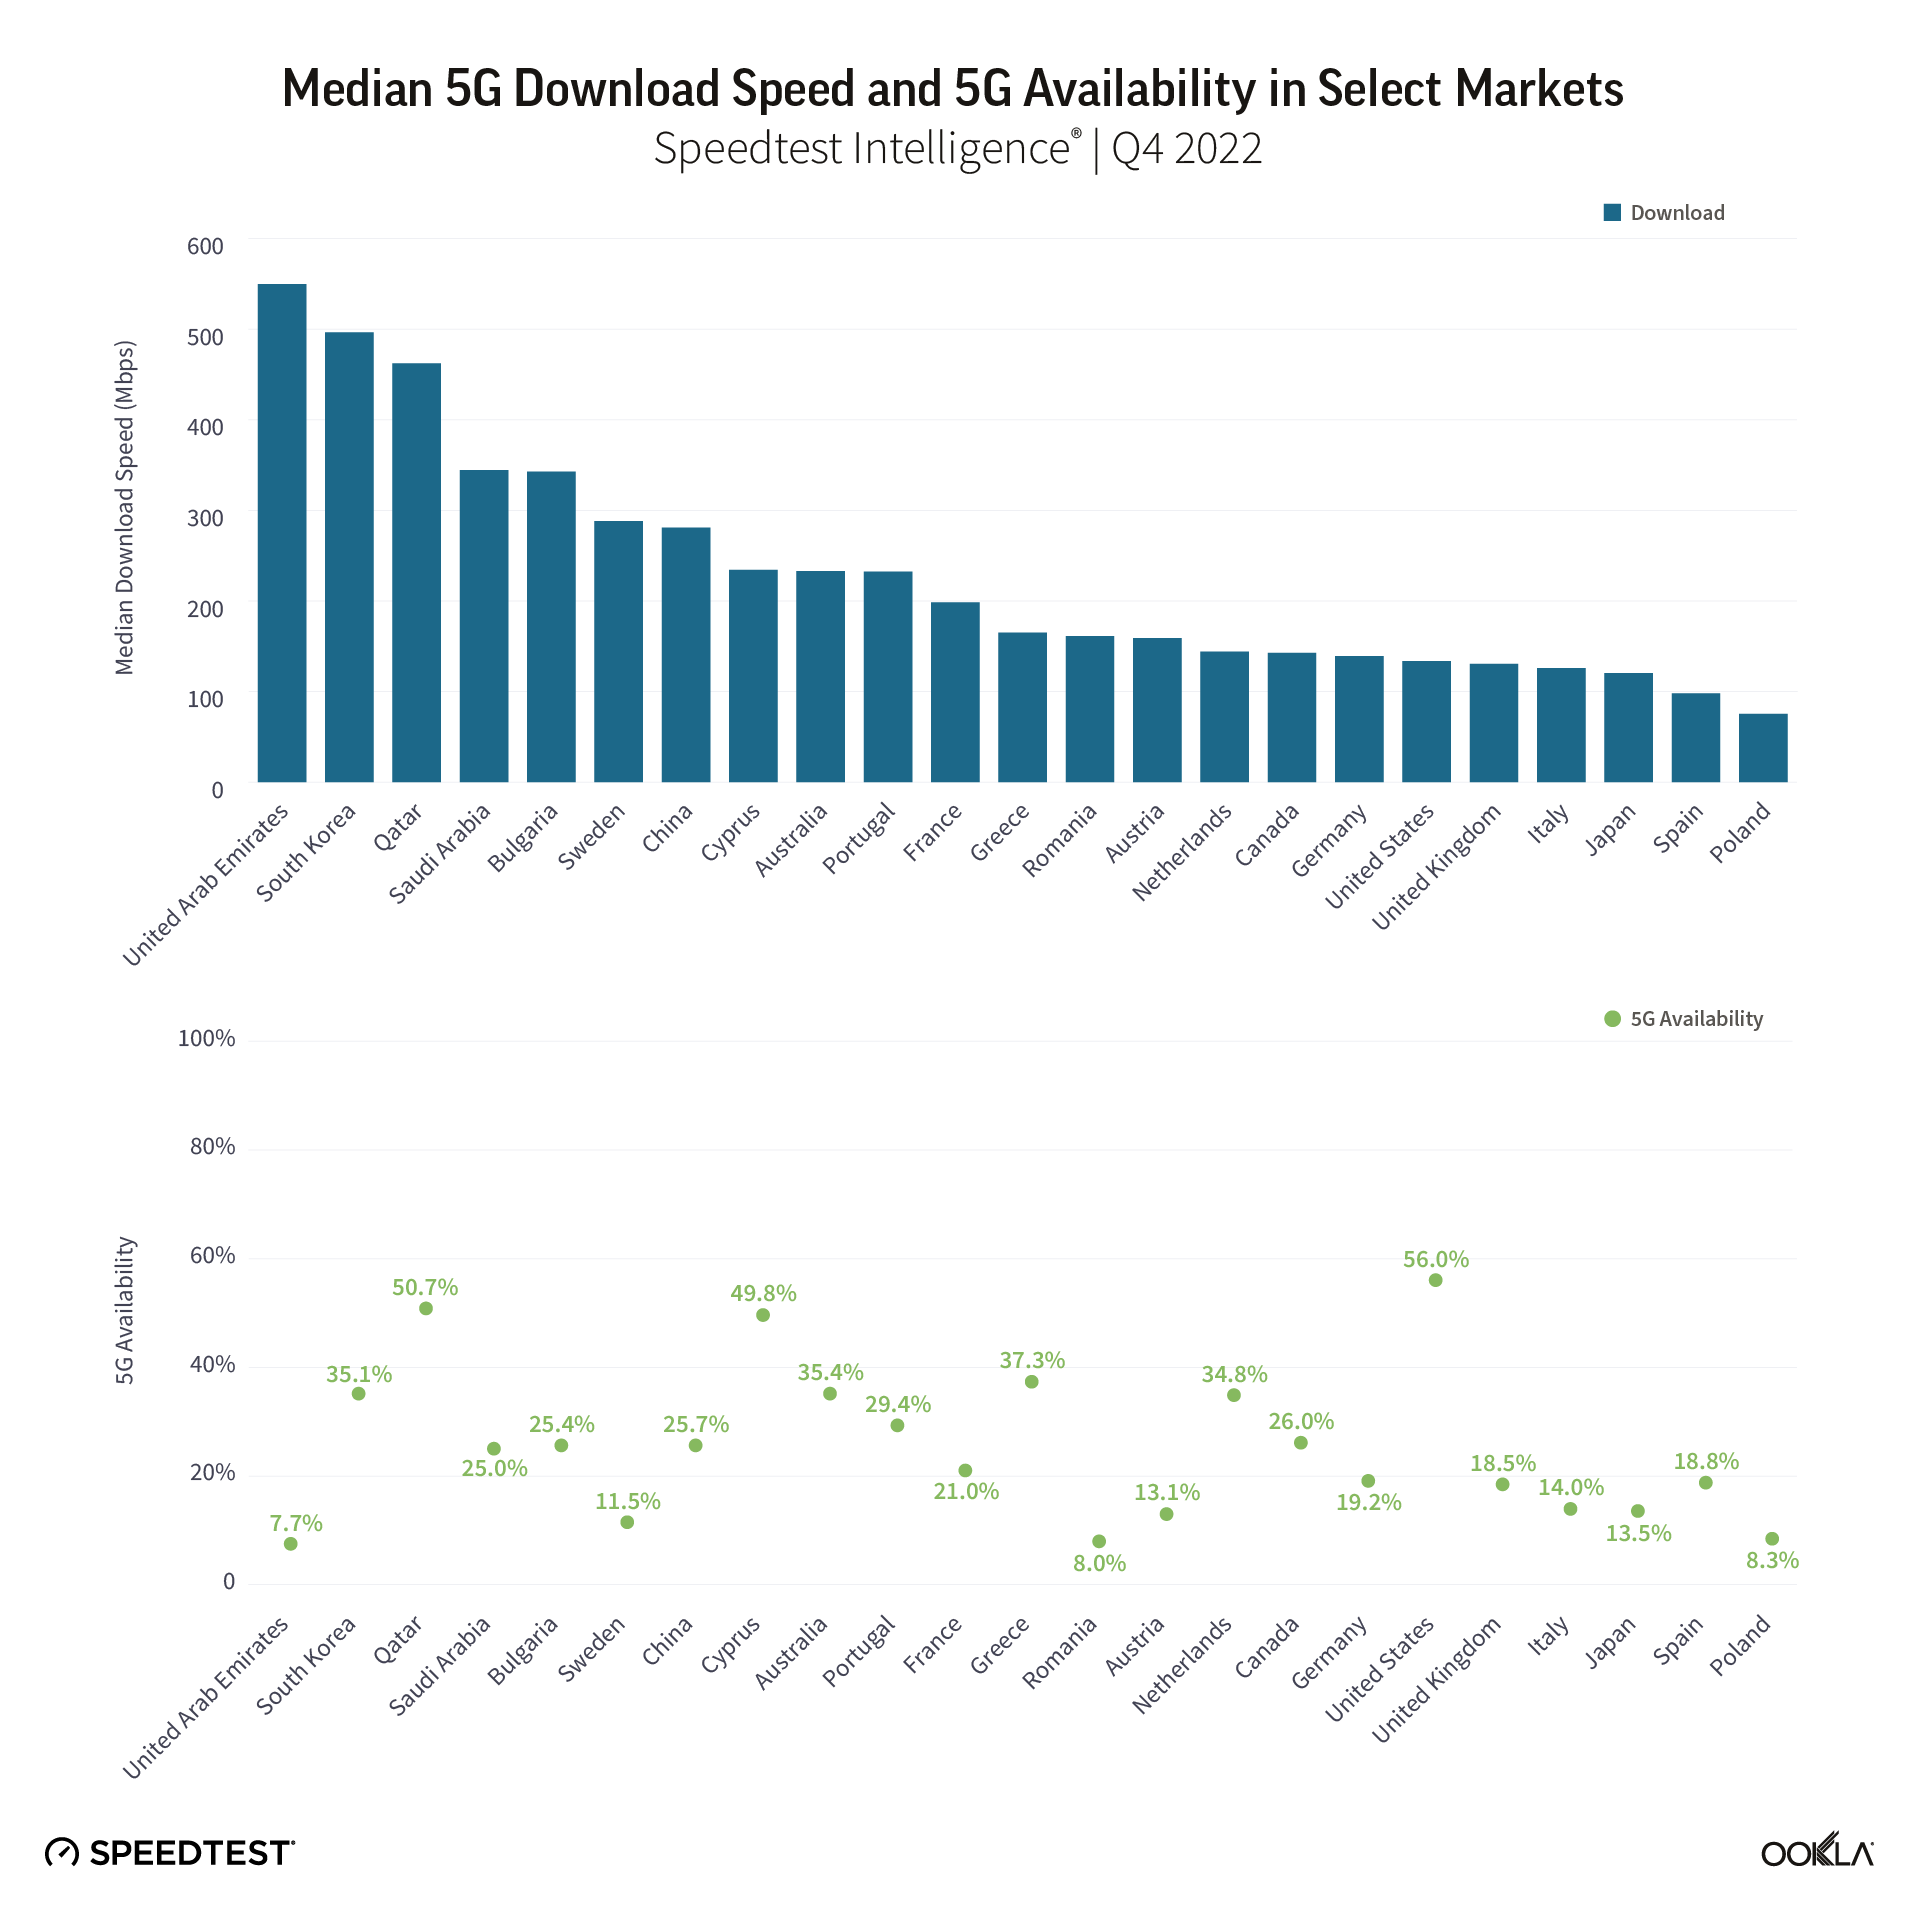
These markets typically have limited C-band availability or a regulatory environment promoting strong price competition, with operator investment constrained. As a result,  median 5G download speeds are between 100- 200 Mbps in these markets. In some cases — for example, in the U.S. and U.K., we see 5G spectrum allocations (based on spectrum currently in use) giving a significant advantage to one player in the market, which has then sought to capitalize on this through aggressive 5G network deployment. Furthermore, with the exception of the U.S., which had a 5G Availability of 56.0% in Q4 2022, 5G Improvers all have 5G Availability in the low double digits, ranging from 13.5% in Japan to 19.2% in Germany. 

5G Outliers

Only in a few markets did 5G performance drop below 100 Mbps. Polish performance can be explained by the lack of a dedicated 5G spectrum; Polkomtel trading under the Plus brand, utilizing 50 MHz of spectrum in the 2.6 GHz band, and all other operators deploying 5G using DSS in the 2.1 GHz spectrum band. Spain, on the other hand, has assigned spectrum across all three bands, with C-band blocks ranging from 80MHz (MasMovil) to 110 MHz (Orange), and most recently, awarded mmWave too. However, operators focus on meeting coverage obligations that rely heavily on the 700 MHz band. For example, Movistar’s 5G network reached a total of 1,719 municipalities at the end of 2022, equivalent to 83% of the population. 

Fast 5G and good 5G Availability don’t always go hand in hand  

chart of medan 5g and availability in select markets

Using Speedtest Intelligence data, we examined a relationship between the country’s 5G median download speed and 5G Availability. And for the most part, there isn’t one. Fast networks don’t immediately come with high 5G Availability. For example, the U.A.E. and South Korea have topped our ranking in terms of the fastest median download speed over 5G at 549.70 Mbps and 496.63 Mbps, respectively, during Q4 2022. Yet, when it comes to 5G Availability, the U.S. came first in the ranking at 56.0% in Q4 2022, South Korea’s 5G Availability stood at 35.1%, while the U.A.E recorded a 5G Availability of 7.7% in Q4 2022. 

All eyes on spectrum

The key to understanding 5G is understanding operators’ 5G spectrum holding. There are two key considerations to keep in mind when discussing the spectrum for 5G: speed performance and geographical coverage. Regulators assign 5G spectrum across three spectrum ranges: low, mid (lower mid-band and upper/C-band), and high (mmWave).

Low-band (sub-1GHz) spectrum can travel farther, cover a greater geographical region, and provide deeper penetration within buildings, given its good propagation characteristics. But, the low band spectrum cannot deliver “true” 5G speeds, peaking at 100 Mbps median download speed. Another challenge is that these frequency bands are in high demand and in low supply, and in some countries, still used for analog television. 

Mid-band spectrum (1-6 GHz spectrum) is the so-called “sweet spot” for 5G, especially the upper mid-band (C-band), which offers the best of both worlds in terms of coverage and capacity.

Existing networks such as 2G, 3G, and 4G already use the lower mid-band. This spectrum band has been the 4G data traffic capacity layer, often used in Frequency Division Duplex (FDD) mode. FDD is a technique that uses separate frequency bands at the transmitter and receiver sides. For example, the U.S. and China used the 2.6 GHz spectrum band in Time Division Duplex (TDD) mode to drive their 5G deployment. Most counties will use TDD for 5G network rollout. This means that the 5G base station and end-user device use the same channel to transmit simultaneously, potentially creating interference issues while allowing more flexibility. Furthermore, this spectrum band will grow in importance as legacy networks are retired and spectrum refarmed.

The upper mid-band, especially 3.3 GHz to 3.8 GHz (otherwise known as C-band), offers a good combination of propagation and capacity. 3GPP standards currently support a 100 MHz wide channel and a maximum bandwidth of 400 MHz in carrier aggregation mode.

The high band, also called the millimeter wave (mmWave), spectrum can deliver super-fast speeds (thinking gigabits) but has limited range. Recently we published an article looking at the mmWave performance and recent developments.

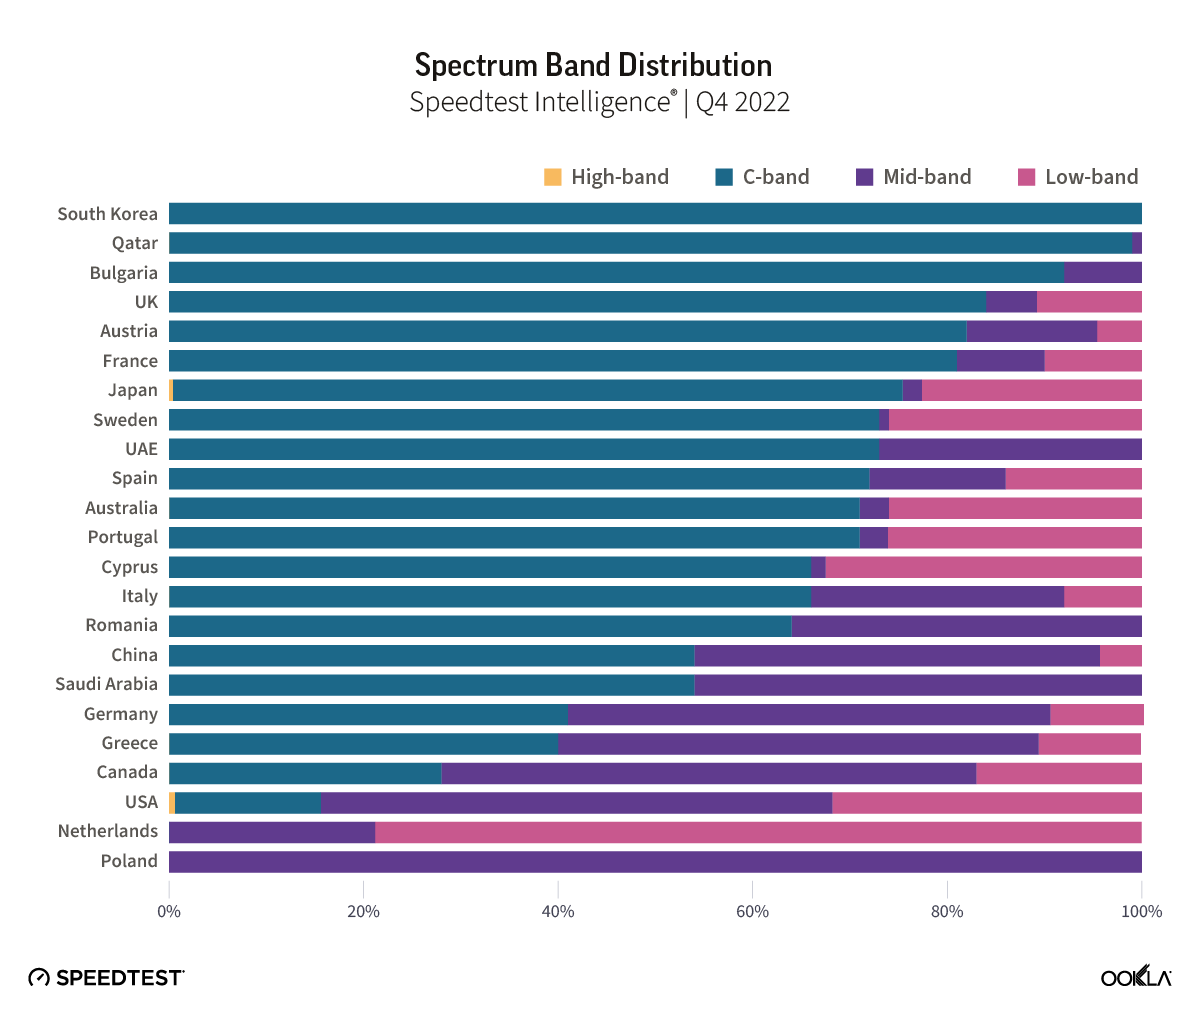
Using Speedtest Intelligence background data, we can gain insights into which spectrum bands operators use for 5G. 

chart of spectrum band distribution

  • High band (mmWave) accounted for less than 1% of the scans in four countries: Japan, U.S., Qatar, and Australia.
  • Most countries used the mid-band spectrum.
    • C-band spectrum is used by all countries that have allocated it (21 out of 23 countries), with a notable exception of the Netherlands and Poland, which will finally auction the 3.5 GHz spectrum, set to take place in the summer of 2023. 
    • All countries we have analyzed, bar South Korea, use lower mid-band partially due to operators switching off their legacy networks (2G/3G) and refarming their existing spectrum holdings to support 5G networks rollout.
  • Low band was used by 78% of analyzed countries (18 out of 23) across our sample. 

Addressing spectral challenges via DSS and CA comes at a cost

The ITU minimum technical requirements to meet 5G performance requirements identify at least 100 MHz channel per operator and up to 1 GHz per operator in mmWave bands. This, however, is only sometimes the case. We can see imbalances in terms of operators’ performance within a country, which can be partially explained by having larger spectral resources. For example, Three UK benefited from having the largest, dedicated 5G spectrum — 140 MHz of frequency across several 5G spectrum bands, including a 100 MHz block of continuous spectrum in the 3.3-3.8 GHz band, which positions it well in terms of median download speeds compared to other U.K. operators.

In the absence of a dedicated 5G spectrum or to supplement the existing spectrum, operators can use two technologies to aid their 5G deployment: Dynamic Spectrum Sharing (DSS) and Carrier Aggregation (CA). DSS enables operators to allocate spectrum flexibly across low-, mid-, and high-bands and switch between LTE and 5G New Radio depending on network demand. However, there is a downside to that in terms of 5G performance. For example, in Poland, apart from Plus, all other operators deployed 5G using DSS in the 2.1 GHz spectrum band, which can partially explain why they have lower speeds.

Conversely, CA enables operators to use two or more bands together, integrating them as one big block to deploy 5G. This allows for the aggregation of non-contiguous spectrum blocks, but it impacts performance by introducing latency and signaling overhead. 

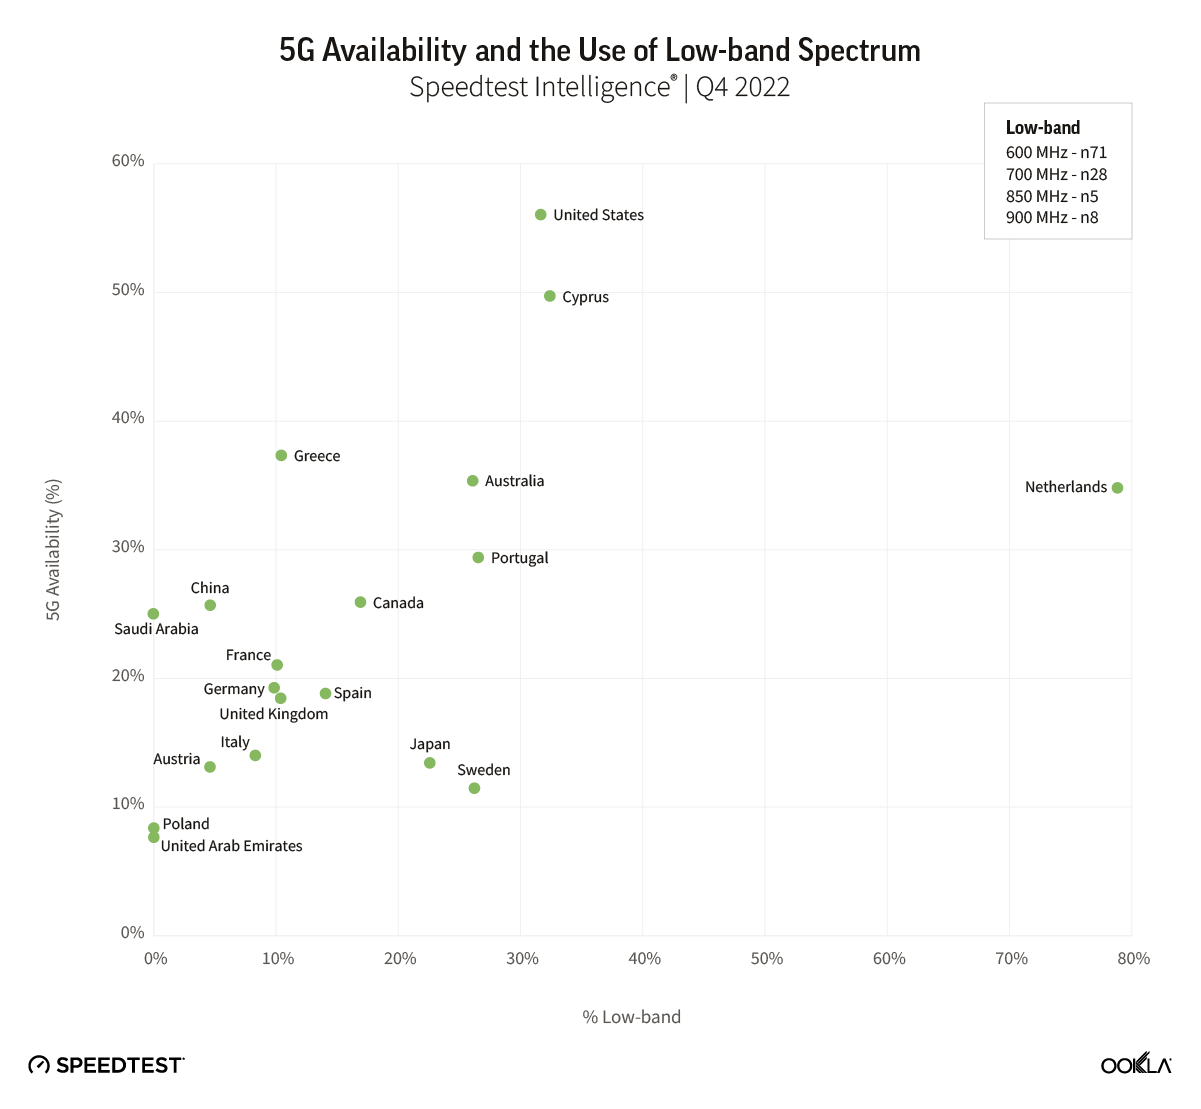
Access to low-band spectrum has a positive impact on 5G Availability, but it is not the only factor at play

chart of 5g availability and the use of low-band spectrum

Ookla® data indicates that 5G coverage, which is often enabled by having access to a dedicated low-band spectrum (600 – 900 MHz), is just one part of the puzzle when it comes to 5G Availability. Low-band (700 MHz) spectrum, initially used for LTE, is now allocated to 5G because it allows extended coverage. According to the GSA, the 700 MHz spectrum band is particularly precious. GSA’s data shows that spectrum at 700 MHz has generated an average of $0.309/MHz/pop in assignments and auctions since 2015, significantly above the average price for C-band. For example, India’s highly anticipated 5G spectrum auction garnered $0.380MH/pop for 700 MHz compared to $0.031/MHz/pop for C-band. 

Qatar, Saudi Arabia, South Korea, and the U.A.E. don’t have any 5G devices using low-band spectrum simply because there has been no spectrum assigned in this band to 5G services. During the initial 5G auction in 2016, South Korea’s 700 MHz spectrum remained unsold. 

Other essential aspects driving 5G Availability are the affordability and availability of 5G-capable smartphones, 5G tariffs, and end-user demand. Case in point, despite the lack of low-band spectrum, South Korea reached a 5G Availability of 35.1% in Q4 2022, driven by customer adoption and 5G network densification. According to the Ministry of Science and ICT, in November 2022, there were 27.5 million 5G subscriptions in South Korea, equivalent to 36% of all mobile subscriptions. According to its Communication Agency, there are 215,000 5G base stations, which translates into 319 people per 5G base station, nearly seven times more than the EU and 13 times more than the U.S.

A country’s geography impacts 5G coverage too. For example, in addition to having access to low band spectrum, the Netherlands benefits from being flatter and more densely populated, resulting in a greater ability to expand 5G coverage. 

Another factor at play is the spectrum license conditions that stipulate coverage requirements, for instance, as part of the 700MHz licenses in the Netherlands, there is a minimum speed of 8 Mbps in 98% of the cases in each municipality of the country in 2022.

While the relationship between low-band spectrum and 5G Availability is not a direct one, we wanted to investigate whether there is a link between the median 5G download speed and the C-band spectrum. 

Larger the share of the C-Band spectrum, the faster the 5G download speed

chart of 5g download speed and the use of c-band spectrum

Our analysis found that access to C-band spectrum typically translates into a faster median 5G download speed. Unsurprisingly, operators are keen to deploy 5G services using C-band spectrum. According to GSA, since the end of 2015, 54 countries have auctioned, assigned, or renewed licenses for C-band spectrum. 

All eyes on 5G Leaders

Countries where operators solely rely on the mid-band spectrum for 5G, and where 5G services have been available for more than 13 quarters have achieved over 300 Mbps median download speed in Q4 2022. Bulgaria is an exception, having launched services just over two years ago. We can also conclude that operators’ overall spectrum holding and whether they have access to a contiguous spectrum matters, too. Contiguous spectrum helps achieve faster speeds, lower latency, and improved spectral efficiency. 

U.A.E.: Emirati operators – Etisalat and Du –  use two carrier spectrum in the 3.5 GHz and 2.5 GHz frequency range, each carrier at 100 MHz, to establish a 5G network. This results in speeds exceeding 500 Mbps. The U.A.E. had a median 5G download speed of 511.70 Mbps in Q4 2022. 

South Korea: KT and SKT bought a 100 MHz channel each in 2018. In July 2022, LG+ secured an additional 20 MHz C-band spectrum, bringing its total spectrum holding to 100 MHz. Alongside the 5G spectrum auction, the government outlined the rollout milestones for the operators’ 3.5 GHz rollout: 22,500 base stations by the end of 2021, 45,000 by the end of 2023, and 150,000 at completion. Thanks to that, South Korea has the most base stations per population. South Korea is one of the early adopters of 5G, having commercialized 5G in 2019 and over a third of all mobile subscriptions on 5G. One of the reasons behind South Korea’s fast-paced 5G adoption is the support from the government, which adopted the 2021 action plan for the “Digital New Deal” to support 5G development and a wider digital transformation. 

Qatar: Qatar, clocking a median 5G download speed of 462.15 Mbps and 5G Availability of 50.7% in Q4 2022, delivers the best of the worlds — good speeds and 5G Availability. In November 2022, Qatar’s Communications Regulatory Authority (CRA) amended the mobile licenses held by Vodafone Qatar and Ooredoo Qatar in early 2019, authorizing each operator to utilize 100 MHz of C-band spectrum and committing them to roll out commercial 5G networks before the end of 2020 in all densely populated areas. Operators’ heavy investment into their network to achieve near-universal service coverage and incentives to migrate users to 5G networks has paid off. We have closely monitored 5G performance during the recent World Cup. Not only did Qatari 5G networks manage to withstand the additional network load that World Cap brought, but it has also improved in performance, with the median 5G download performance hitting 472.13 Mbps in November 2022. 

Saudi Arabia: Operators in the KSA have access to more than 1000 MHz of licensed spectrum for IMT use in the low- and mid-band ranges. Saudi regulator – CST (Communication, Space and Technology Commission) – championed data-driven, evidence-based policy decisions to enable a 5G rollout by conducting analysis of spectrum usage, the performance of various bands, and existing network infrastructure to see where investments had been made within certain bands (e.g., extra capacity in specific bands in urban areas and coverage of rural areas using adequate bands). If you would like to find out more, read this case study

Bulgaria: In April 2021, Vivacom Bulgaria won 100 MHz in the 3.7-3.8 GHz band for BGN4.6 million (€2.35 million). Vivacom utilizes DSS, combining frequencies in 1.8, 2.1, and 3.6 GHz bands for 5G. A1 Bulgaria, on the other hand, uses a dedicated 100 MHz band.

We will continue to monitor 5G performance across the world and investigate the factors that impact 5G performance. If you want to learn more about 5G performance, head to Ookla ResearchTM and subscribe to our newsletter to stay up to date with our latest analyses. 

Ookla retains ownership of this article including all of the intellectual property rights, data, content graphs and analysis. This article may not be quoted, reproduced, distributed or published for any commercial purpose without prior consent. Members of the press and others using the findings in this article for non-commercial purposes are welcome to publicly share and link to report information with attribution to Ookla.

| February 28, 2023

5G in India: 25 Times Faster than 4G

5G has been in place in India for over four months and already it’s having a tremendous impact on the state of mobile in the country compared to last October when we commented on initial 5G speeds just after 5G networks launched. 

Key takeaways

  • India’s mobile speeds increased by 115%. India has climbed 49 places on the Speedtest Global Index™ since launching 5G, from 118th in September 2022 to 69th in January 2023. Ookla® data shows improvement in LTE speeds for both Jio and Airtel since the launch of 5G services, as all their investments into network modernization are paying off.
  • Median 5G download speeds are 25 times faster than 4G. 5G performance has increased across early 5G adopters in most of the telecom circles, Kolkata achieved the fastest median 5G download speeds in January 2023 at above 500 Mbps. Jio experienced a top median 5G download speed of 506.25 Mbps in Kolkata, while Airtel of 268.89 Mbps in Delhi. 
  • 5G Availability increased 55-fold. Airtel and Jio have ambitious targets in terms of 5G network rollout. From 5G networks’ inception, 5G Availability across 5G-capable devices has steadily increased, reaching 8.0% for Airtel and 5.1% for Jio.
  • 5G is further impacting the competitive landscape. We can see Speedtest® users migrating away from Vi, which has been further stimulated by the operator’s inability to launch 5G.

5G will benefit Digital India

Speedtest Intelligence® data shows that median download speeds across India increased by 115%  since before the 5G launch, from a 13.87 Mbps median download speed in September 2022 to 29.85 Mbps in January 2023. As a result, India’s position on the Speedtest Global Index improved by 49 places from 118th in September 2022 to 69th in January 2023. This puts India ahead of some of the G20 countries, such as Mexico, Russia, and Argentina, and its neighbors: Indonesia, Bangladesh, Sri Lanka, and Pakistan. India is also catching up with the likes of Turkey (a 30.98 Mbps median download speed/65th place on the Speedtest Global Index), South Africa (34.71 Mbps/58th place), and Brazil (35.85 Mbps/57th place).

chart of global index ranking among select countries

There are over half a billion internet users in India, making it the second-largest online market worldwide, just behind China. India has already made significant progress in terms of mobile broadband growth. One of the key reasons behind the acceleration in adoption was the launch of the Digital India initiative in 2015, which made government services digitally available to citizens. Digital India’s goal is to transform India into a digital society and economy. Since its launch, almost 270 million Indians have been connected to the internet via mobile internet. This was enabled by expanding mobile broadband networks, particularly using 4G technology. Now, 5G is stepping in to play a role in enabling digital transformation across multiple sectors of the Indian economy. GSMA Intelligence forecasts that 5G could contribute $455 billion to GDP by 2040. 

Median 5G download speed is 25 times that of 4G 

map of median 5g download speed by telecom circles, all operators combined

When 5G was first launched in October 2022, there was a wide disparity in the early 5G network performance users were experiencing on 5G-capable devices; median 5G download speeds oscillated between 512.57 Mbps (Gujarat) and 19.23 Mbps (Uttar Pradesh West) as the 5G networks build out started. In fact, in nine telecom circles: Andhra Pradesh, Kolkata, North East, Haryana, Rajasthan, Bihar, Punjab, Kerala, and Uttar Pradesh West, the median 5G download speed was below 100 Mbps because networks were very much at the testing stage. Four months on, in January 2023, 5G median download speeds had greatly increased across all of the telecom circles — exceeding 200 Mbps everywhere except Jammu and Kashmir, with Kolkata clocking speeds over 500 Mbps. 

5G investment has also propelled an increase in 4G LTE speeds thanks to the modernization of the underlying infrastructure. When we compare 5G and 4G performance in January 2023: 

  • median 5G download speed is 25 times that of 4G LTE (338.12 Mbps vs. 13.30 Mbps), and
  • median 5G upload speed is 4.5 times 4G LTE (19.65 Mbps vs 3.55 Mbps)

We see improvements in LTE speeds (both for Airtel & Jio) in multiple cities as they are offloading 4G traffic onto their 5G network, therefore reducing 4G network congestion.  This has to be caveated by the fact that these are still early days for 5G in India, and 5G performance will most likely decrease once those networks are commercially available. 

Jio and Airtel are expanding their 5G networks

map of median 5g download speed by teleocm circles, jio and airtel

Jio’s $25 bn investment seems to be paying off. In January 2023 Jio achieved median 5G download speeds above 400 Mbps across ten telecom circles. Jio’s True 5G network is based on a 5G Standalone (5G SA), which doesn’t rely on a 4G LTE network. While Jio’s initial 5G speeds fluctuated massively – from low single-digit to speeds well above 800 Mbps, which pointed to the operator recalibrating its networks, Jio’s 5G performance has stabilized over the past four months. In January 2023, Jio’s 5G early adopters experienced speeds ranging from 246.49 Mbps median download speed in Himachal Pradesh to 506.25 Mbps in Kolkata. 

Airtel looks to 5G to offload capacity from 4G to 5G. Gopal Vittal, MD & CEO of Bharti Airtel Limited, mentioned during the latest quarterly results call that “between 25% to 35% of traffic is already getting offloaded on 5G from 4G.” Airtel deployed 5G in a Non-Standalone mode (5G NSA) – the operator stated that commercial trials using NSA give a 30% higher coverage than SA. In January 2023, Airtel’s 5G early adopters experienced speeds ranging from a 78.13 Mbps median download speed in Kolkata to 268.89 Mbps in Delhi. 

Operators have already committed a significant amount of capex towards 5G. One of the key challenges Indian telcos face is low ARPU levels, which came in below Rs 200 ($2.41) in Q3 FY 2023 results: Airtel led the pack at Rs 193 ($2.33), Jio followed at Rs 178.2 ($2.15), Vi at Rs 135 ($1.63). Recently, Airtel has removed its based Rs 99 ($1.20) plan across 17 circles, with the new base plan priced at Rs 155 ($1.87). The other two operators have not followed the lead yet. While this could lead to churn, it could help solidify ARPU as Airtel plans to use 5G to migrate customers to higher-value postpaid plans. 

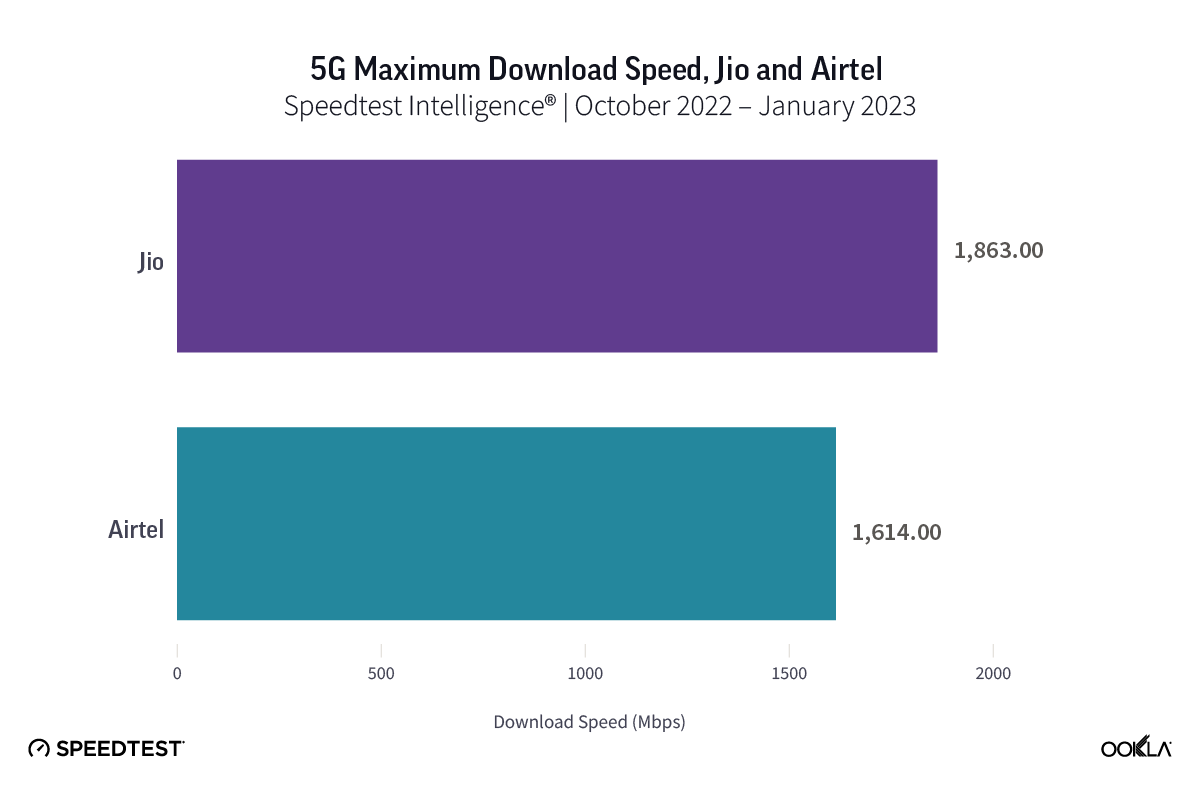
chart of 5g maximum download speed, jio and airtel

Median 5G performance allows us to understand the midpoint of user experience on 5G networks, but it doesn’t paint the full picture. Using Speedtest data we can see that operators have achieved maximum download speeds exceeding 1.6 Gbps – close to speeds that operators in the United States achieved using mmWave spectrum

Spectrum is not the only factor affecting 5G performance 

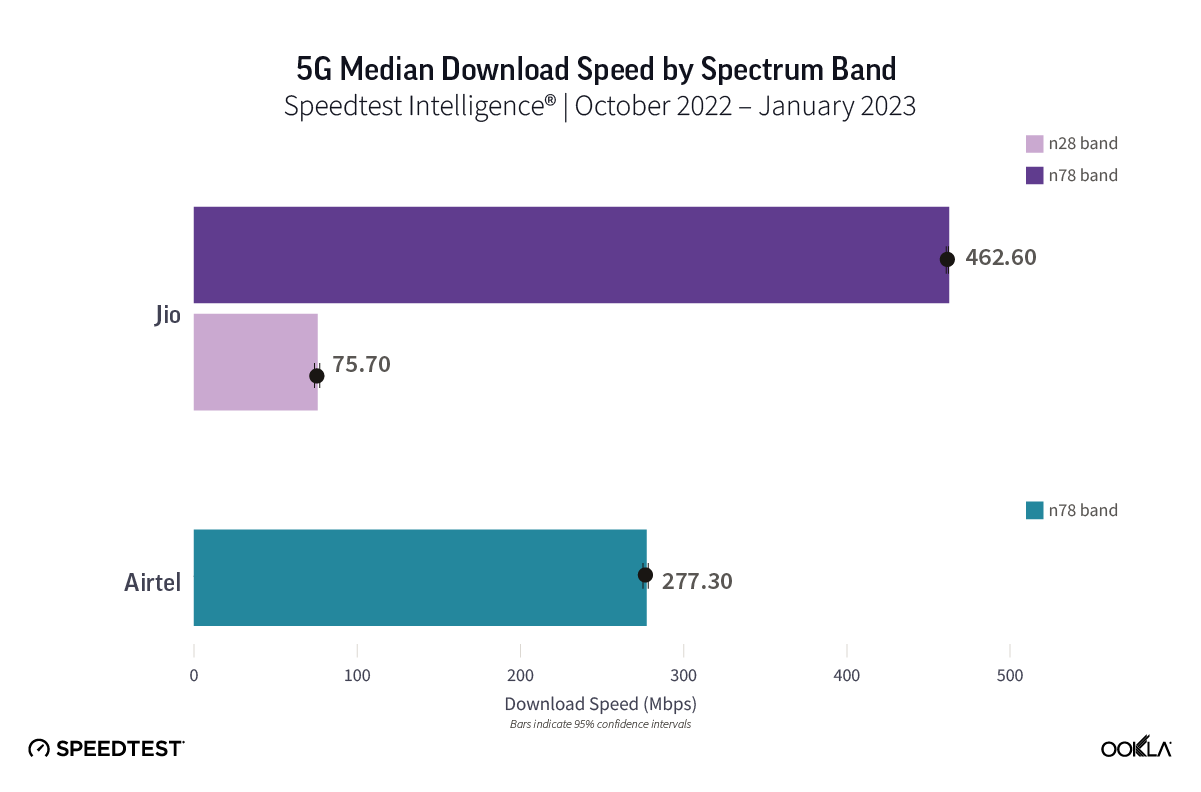
chart of 5g median download speed by spectrum band

Operators’ spectrum holding affects their speeds; we have recently commented on the relationship between low- and C-band spectrum and 5G performance. A similar holds true in India. Using Speedtest Intelligence data, we can see that Jio’s 5G performance differs depending on the spectrum band it uses. Jio’s 5G network using the C-band (n=78) results in a 462.60 Mbps median download speed. When Jio’s 5G network uses the lower – 700 MHz frequency band (n=28), the so-called coverage band, the median download speed was 75.70 Mbps. This, however, doesn’t necessarily explain the difference in performance between Jio and Airtel, which also uses the C-band spectrum. Airtel deployed 5G utilizing only its C-band spectrum holding in an NSA (Non-Standalone Mode), and it clocks a median 5G download speed of 277.30 Mbps. 

There is another factor at play that can explain the difference in performance between the operators – the type of backhaul network they are using. Indian operators heavily rely on terrestrial wireless backhaul solutions. While fiber penetration in backhaul networks is increasing, according to the DoT, only a third of mobile towers are connected with fiber – versus the National Broadband Mission’s goal of 70% being connected by 2024. The reason why this presents a challenge in the face of 5G rollout is that the capacity per tower site has to increase substantially to accommodate 5G traffic requirements, which in turn requires fiberized backhaul. E-band spectrum, which operators received last year, helps but isn’t enough to support a 5G rollout.  

There are various challenges related to laying fiber, including right-of-way (RoW) access and availability of stable power that operators have to overcome. Airtel looks to AI to understand where most of its traffic is located and plans its network roll-out strategy accordingly. 

5G Availability in India increased 55 times

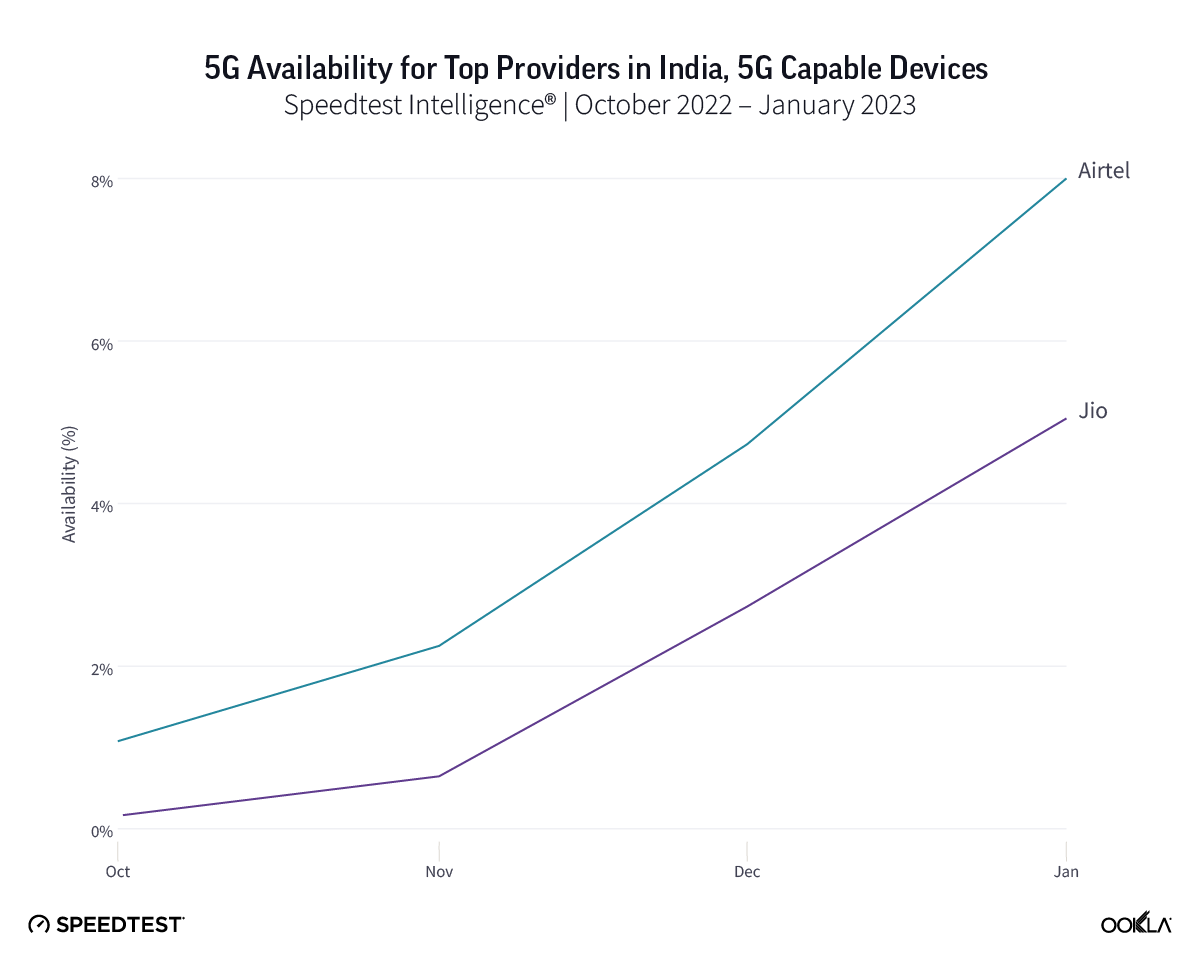
chart of 5g availability for top providers in india, 5g capable devices

Speedtest Intelligence data shows that 5G Availability – the proportion of users with 5G-capable devices that use 5G network – had increased 55 times between September 2022, when 5G Availability stood at 0.1%, and January 2023, when it reached 5.5%. Operators already have an existing base of consumers owning 5G-capable devices. During the latest quarterly call, Airtel shared that about 11% of their smartphones are 5G ready. Airtel users with 5G smartphones can access Airtel 5G Plus services at no additional cost using their existing 4G SIM cards. Airtel is busy carrying out a 5G network rollout, planning to go live in about 300 cities by March 2023 and to cover all urban areas by March 2024.  

Jio also has ambitious targets for 5G network deployment, it recently stated that it is on track to complete the pan-India 5G rollout by December 2023, having already deployed over 25,000 sites across 700MHz and 3.5 GHz bands. Jio’s customers can connect to 5G at no additional cost upon receiving the 5G Welcome offer, which is extended to users with 5G-enabled smartphones who subscribe to a plan or Rs239 or higher. The existing 4G SIM will also connect to the 5G network. There is a need to do a software upgrade for older models of smartphones to be able to connect to Jio’s 5G SA network. 

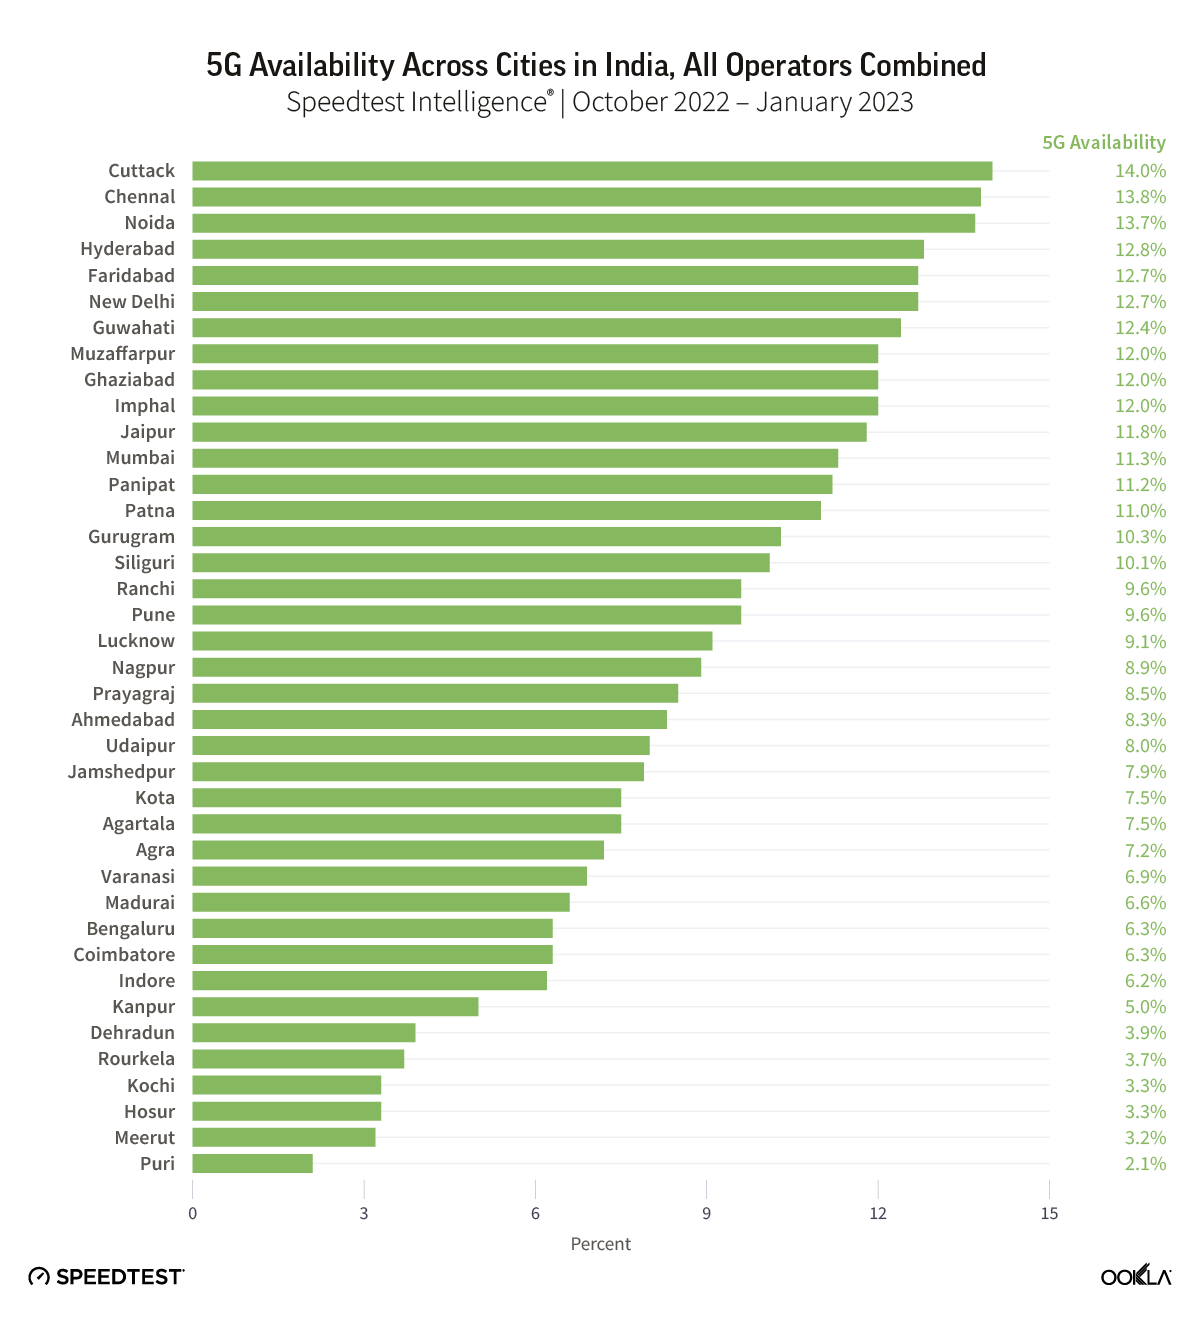
chart of 5g availability across cities in India, all operators combined

During the early days of 5G – in October 2022 – we could see 5G device testing in just over a dozen of cities. Only three cities had a 5G Availability exceeding 2% – namely, the capital, New Delhi, Hyderabad, and Siliguri. Fast forward to January 2023, and 5G Availability exceeded 2% across 39 cities where both Jio and Airtel had rolled out their networks. 5G Availability across three cities was above 13%, namely in Cuttack, Chennai, and Noida.  

5G will further change the competitive landscape in India

chart of cumulative monthly percentage change in the number of speedtest® users

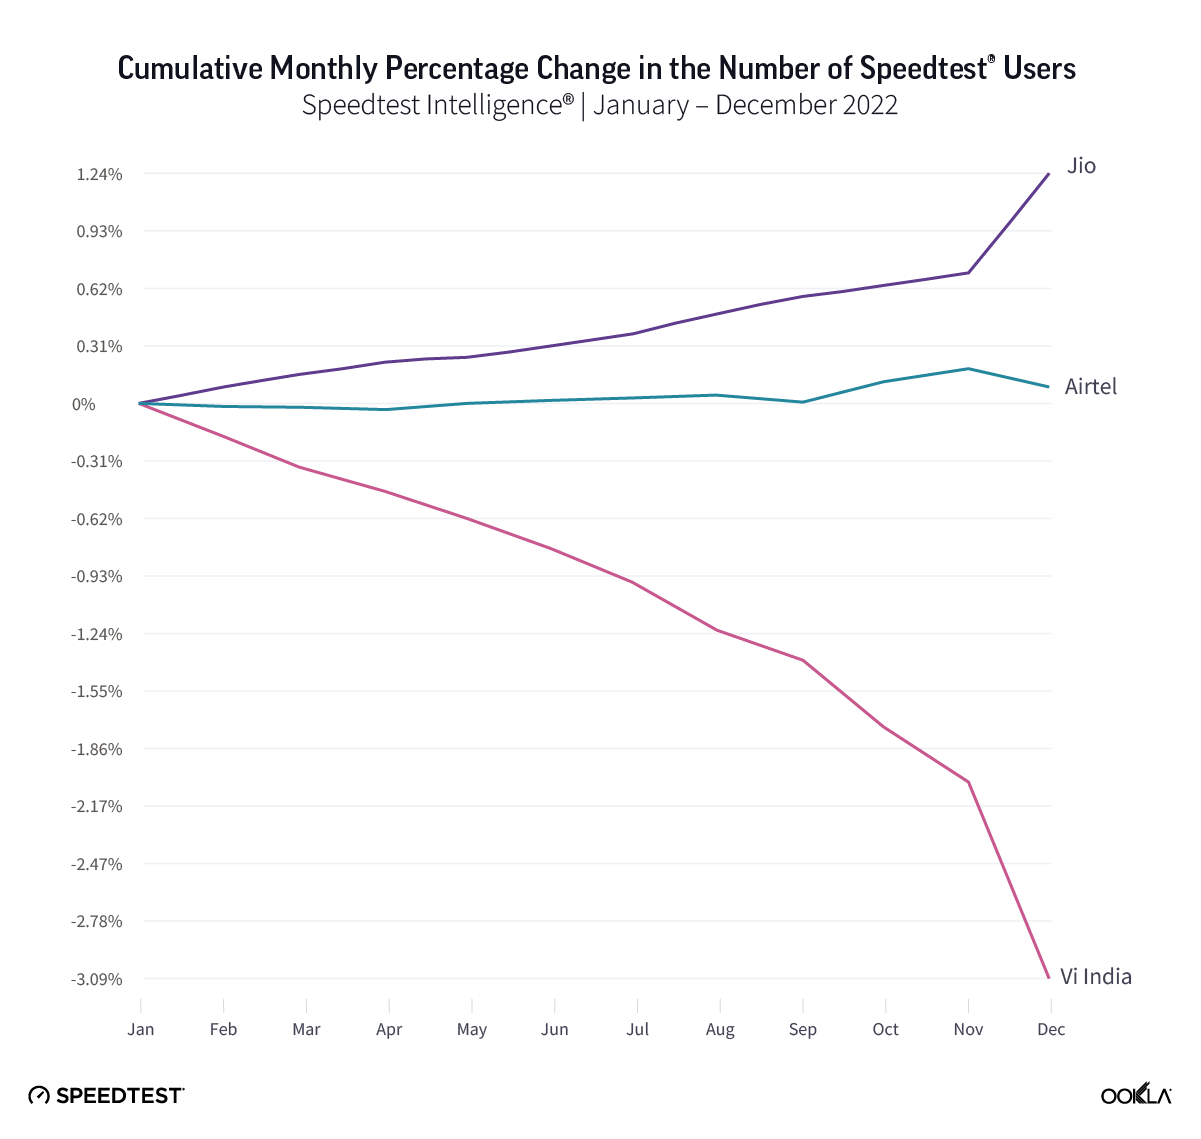
Based on our data, we can infer churn pattern of Speedtest users from January to December 2022, we can see that Vi India has been losing users throughout 2022, following the 5G launch, the disconnections increased significantly. On the other hand, Jio has been adding new users. This has been validated by the latest data released by TRAI, which shows a similar trend: Vodafone Idea had negative 2.5m net additions in December 2022, compared to Reliance Jio (1.7 million net adds) and Bharti Airtel (1.5 million net adds). 

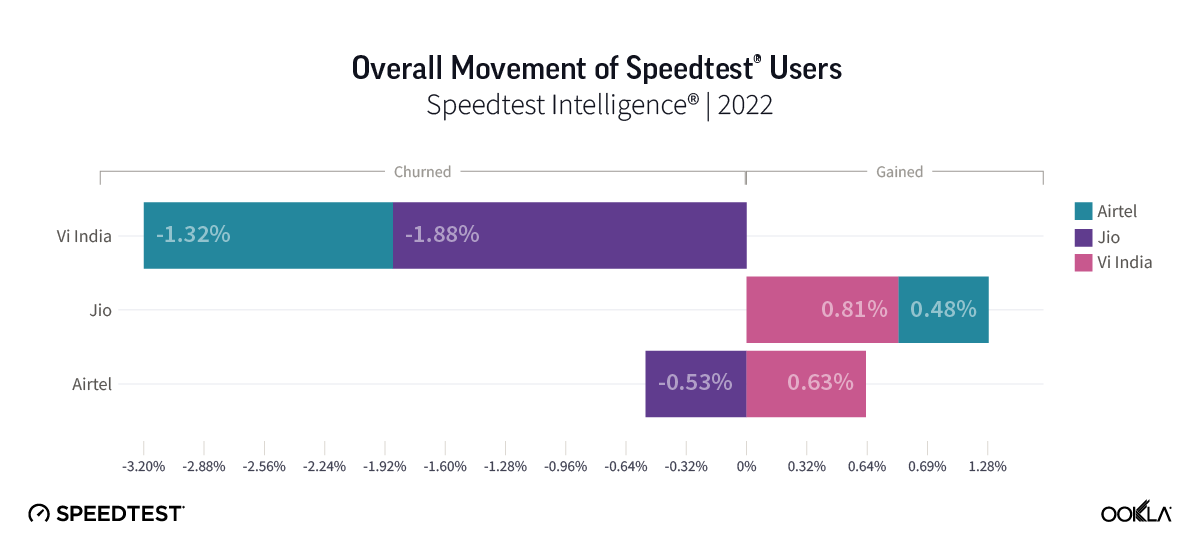
We can also gain insights into where consumers move when changing their network providers. Most of Vi’s customers have moved away to Jio (1.88%) and Airtel (1.32%). Jio gained around 1.3% of customers from Airtel & Vi India. In comparison, Airtel has lost 0.53% to Jio but gained 0.63% from Vi over the same period of time.

chart of overall movement of speedtest® users

We will continue to monitor 5G performance in India, see how operators scale networks, and assess the real-world performance as more consumers will get online with 5G devices. If you want to learn more, subscribe to Ookla Research™ to be the first to read our analyses.

Methodology note:

Speedtest® is designed to fully saturate a user’s connection, which uniquely allows us to accurately measure the maximum speeds available. This is especially important for 5G connections, which can be capable of tremendous speeds. Speedtest simultaneously measures download speeds from multiple servers in order to ensure that a connection is being fully utilized.

Ookla retains ownership of this article including all of the intellectual property rights, data, content graphs and analysis. This article may not be quoted, reproduced, distributed or published for any commercial purpose without prior consent. Members of the press and others using the findings in this article for non-commercial purposes are welcome to publicly share and link to report information with attribution to Ookla.
| May 17, 2023

ISPs Need to Do More to Improve Wi-Fi Performance in the Home

Key messages

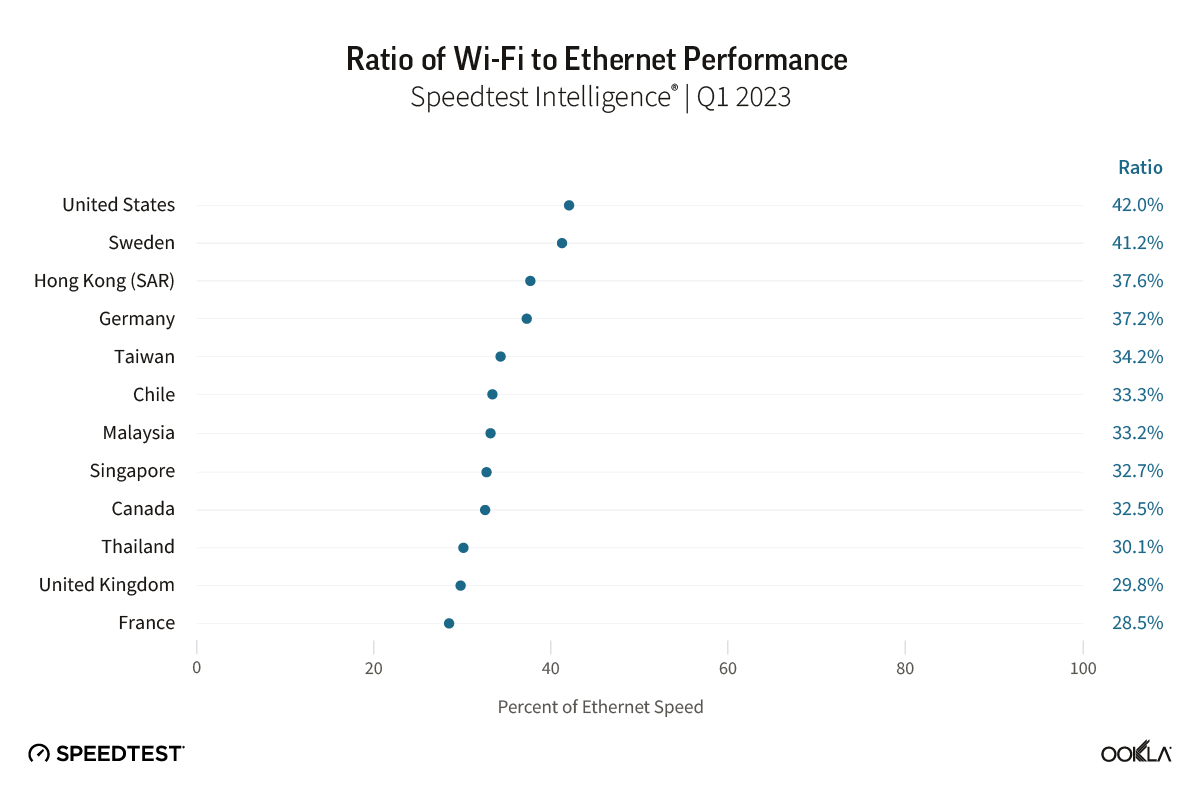
  • Wi-Fi woes continue. Ookla® Speedtest Intelligence® data shows Wi-Fi performance continues to lag behind ethernet performance within home networks in many advanced fixed broadband markets, with Wi-Fi speeds typically ranging from between 30-40% of ethernet speeds during Q1 2023.
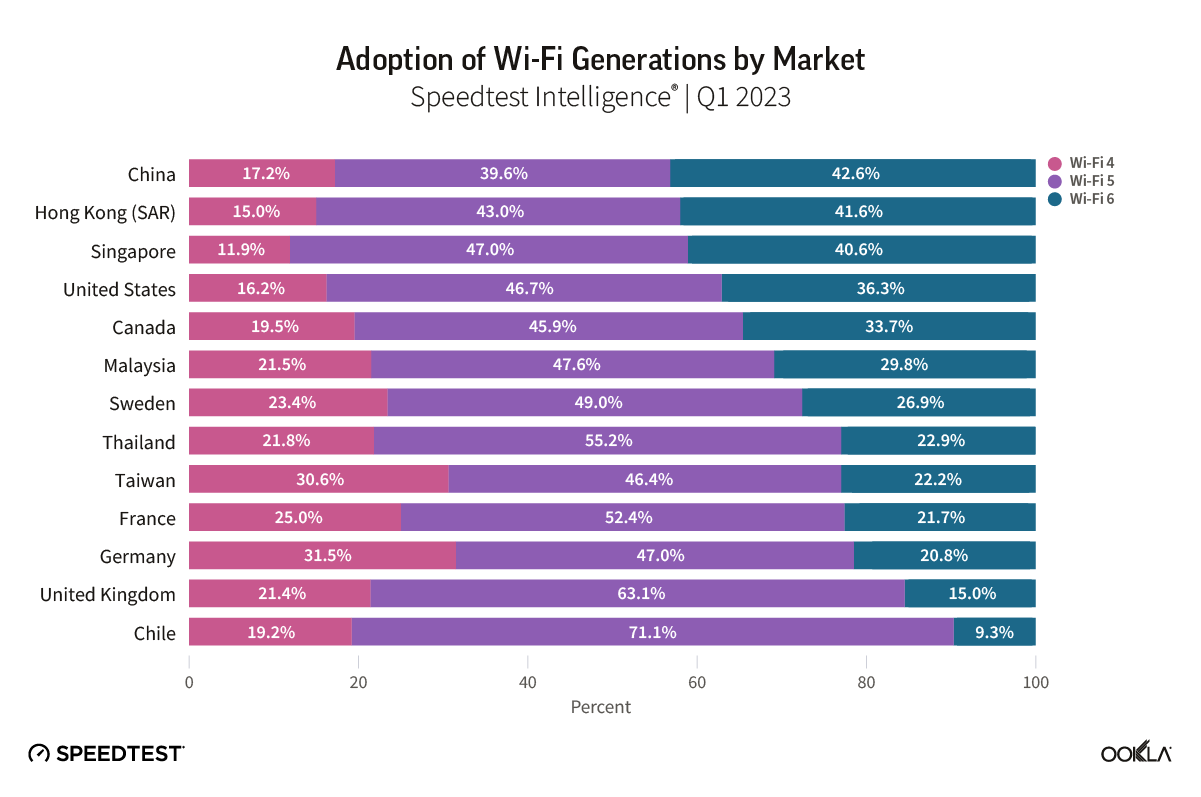
  • Developed Asian and North American markets lead the charge to Wi-Fi 6/6E. Wi-Fi 4 and 5 remain the dominant Wi-Fi access technologies globally, accounting for a combined 89% of Speedtest® samples during Q1 2023. However, a number of advanced fixed broadband markets are rapidly migrating to Wi-Fi 6 and 6E, with China, Hong Kong (SAR), Singapore, Canada, and the U.S. leading the charge.
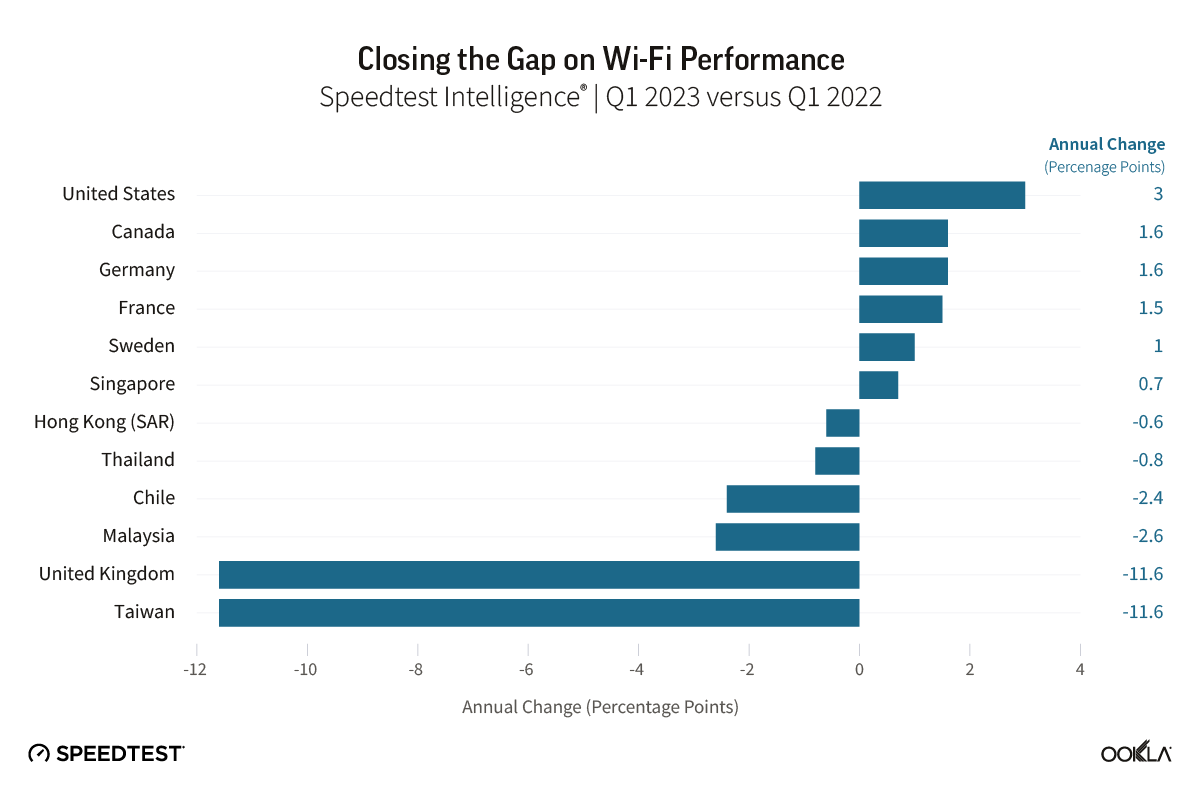
  • Growing Wi-Fi 6/6E adoption helps narrow the gap in Wi-Fi performance. In markets such as Canada, France, Germany, Singapore, Sweden, and the U.S., where the transition to fiber is more advanced, and where ISPs are actively driving adoption of Wi-Fi 6/6E routers, we see Wi-Fi performance closing the gap to ethernet. However, more needs to be done in other markets, where migration to more advanced fixed access networks is exposing the limitations of the installed base of Wi-Fi routers.
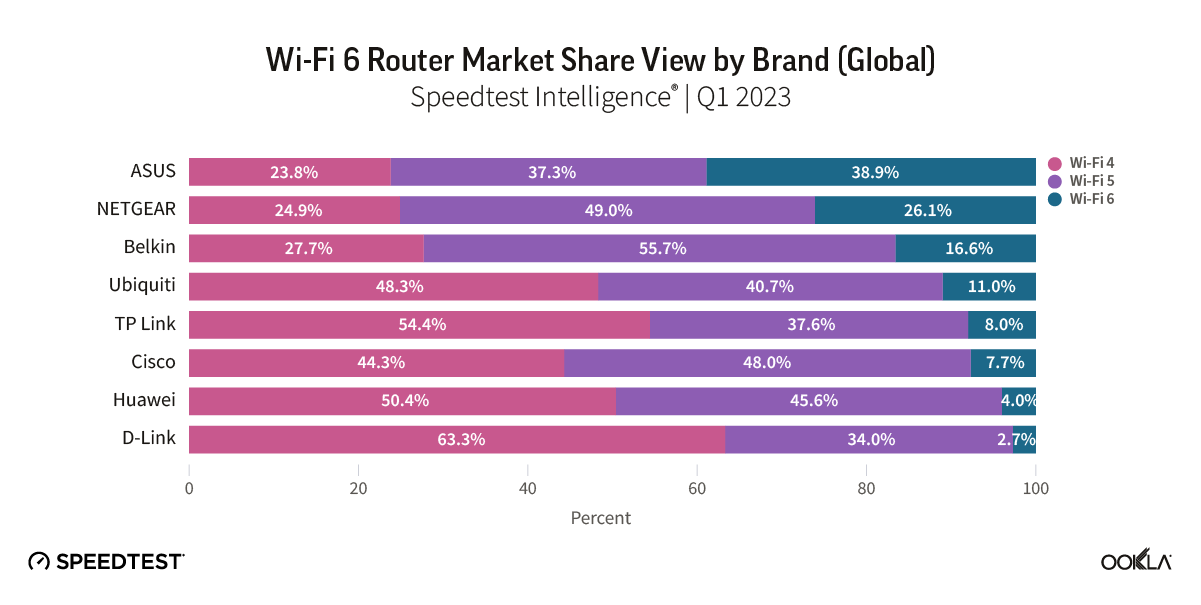
  • Router vendors pushing the envelope with Wi-Fi 7 capable launches. ASUS leads the market for Wi-Fi 6/6E routers among Speedtest samples, and both ASUS and other leading router vendors have been quick to launch Wi-Fi 7 capable routers. Despite this, Wi-Fi 6 and 6E remain the growing component of their installed bases. ASUS leads the market according to Speedtest Intelligence with 39% of its routers we sampled supporting Wi-Fi 6/6E during Q1 2023, well ahead of second placed NETGEAR with 26%.
  • Smartphone device support indicates Wi-Fi 6/6E should remain the immediate focus for ISPs. With the two largest smartphone vendors globally, Samsung and Apple, currently shunning Wi-Fi 7, ISPs waiting to see if they can leapfrog Wi-Fi 6E to Wi-Fi 7 should stay their hands. The fact that China still needs to allocate the 6 GHz spectrum band — key for Wi-Fi 6E and 7 — for unlicensed use is also significant, and appears to have weighed on the Wi-Fi 6E adoption among China’s leading Android smartphone manufacturers.

Wi-Fi performance continues to lag ethernet within the home

ISPs in advanced fixed broadband markets are increasingly looking to offer more advanced Wi-Fi routers and solutions such as mesh networks, which are designed to improve Wi-Fi coverage and performance. However, Speedtest Intelligence data shows that more needs to be done to improve Wi-Fi performance, which typically ranged from between 30-40% of ethernet speeds. Median Wi-Fi performance as measured by Speedtest will tend to lag behind median ethernet performance, depending on distance of the end-user device from the router, including any obstacles and signal interference the Wi-Fi signal needs to traverse to reach the device.

Chart of Ratio of Wi-Fi to Ethernet Performance

Our analysis of Speedtest Intelligence data reveals that driving greater adoption of more advanced Wi-Fi routers can help ISPs narrow the gap between Wi-Fi and ethernet performance, with ISPs in Canada, France, Germany, Singapore, Sweden, and the U.S. already successfully doing so over the past year.

Chart of Closing the Gap on Wi-Fi Performance

Despite this, the results are not always positive, with the gap between Wi-Fi and ethernet performance widening, in particular in the U.K. and Taiwan. Where markets are rapidly migrating from more legacy fixed broadband technology to advanced cable and fiber connections, Wi-Fi performance can lag relative to ethernet, indicating a need to accelerate the adoption of more advanced Wi-Fi technologies.

Older generations of Wi-Fi 4 and Wi-Fi 5 remain dominant globally

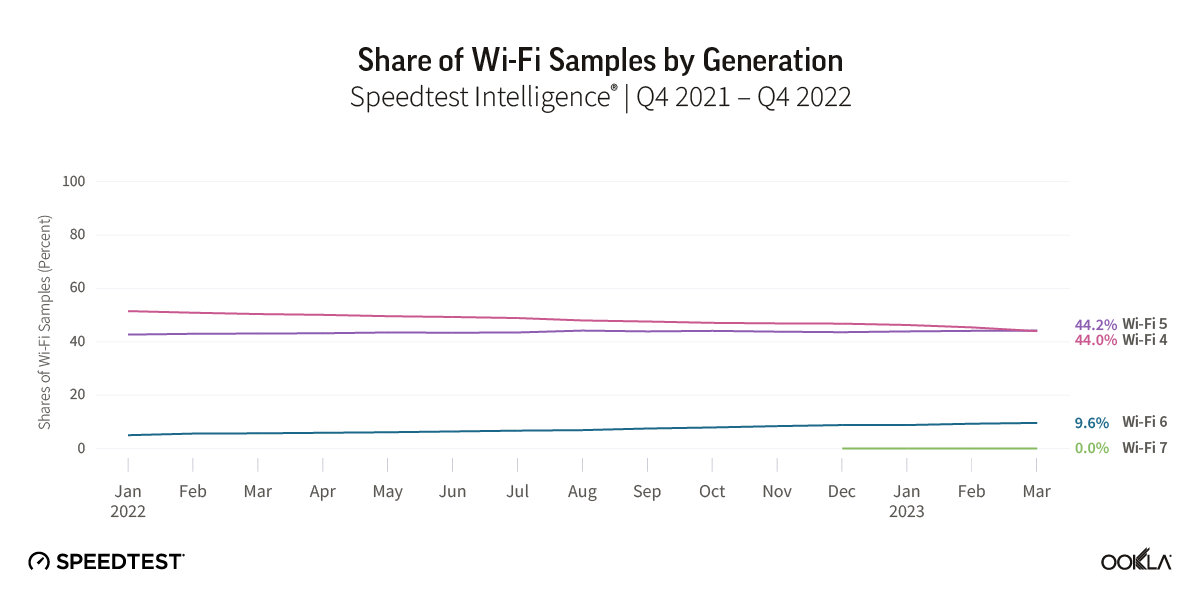
While much of the focus of the device ecosystem is on spurring adoption of the latest Wi-Fi standards, there is a long way to go before even Wi-Fi 6 becomes a dominant standard globally. Based on Speedtest Intelligence data, the proportion of Wi-Fi tests by generation (a good proxy for adoption) shows that Wi-Fi 4 and Wi-Fi 5 remain the dominant router technology, with Wi-Fi 6 representing just under 10% as of February 2023, and Wi-Fi 7 showing very few samples. The share of samples from Wi-Fi 4 routers has fallen by 6 ppts year-over-year, while Wi-Fi 5’s share of samples has marginally increased.

Chart of Share of wi-Fi Samples by Generation

Asian and North American ISPs lead the charge to Wi-Fi 6 and beyond

ISPs are the main driver behind the adoption of new Wi-Fi standards, as highlighted by a 2022 study by Parks Associates, which found that 52% of U.S. consumers acquired their router from their ISP. Rolling out more advanced routers to their customer bases enables them to take advantage of the increased performance of newer generations of Wi-Fi technology, and helps to ensure ISPs deliver faster speeds, particularly over fiber access networks.

Adoption of Wi-Fi 6 varies by market, even among the most developed fixed broadband markets globally. ISPs in a number of advanced fixed markets have already begun offering Wi-Fi 6E routers to their customer bases, with ISPs in North America in particular moving in this direction, including Bell Canada, Rogers, Telus, Verizon, XFINITY, Charter, and Frontier, as well as leading ISPs in advanced Asian and European markets.

Markets in Asia led the way on Wi-Fi 6 adoption, with China and Hong Kong both recording 42% adoption, followed by Singapore with 37%. Outside of Asia, North America showed the next highest level of adoption, with the U.S. and Canada recording 32% and 30%, respectively. European fixed markets lagged behind, with adoption ranging from 13% in the U.K., to 24% in Sweden. For markets such as Chile, which placed towards the top of the Ookla Speedtest Global Index™ for median fixed broadband speeds, a relatively low-level of Wi-Fi 6 adoption (8% in Q4 2022) signals further opportunity for ISPs in the market to boost performance.

Chart of Adoption of Wi-Fi Generations by Market

The fastest growing markets, in terms of increasing share of Wi-Fi 6 of Speedtest samples year-over-year in Q1 2023, were Canada and Malaysia (+15 ppts), Singapore (+14 ppts), and Hong Kong (+12 ppts). While there was considerable variance between ISPs within each market, leading ISPs such as SmarTone (Hong Kong), DiGi (Malaysia), and ViewQwest (Singapore), are prompting a competitive response so that even ISPs with lower levels of Wi-Fi 6 adoption are prioritizing the technology and seeing adoption grow steadily.

CountryISPWi-Fi 6 %, Q1 2023
Hong Kong (SAR)SmarTone62.4%
CanadaBell pure fibre57.3%
SingaporeViewQwest53.7%
SingaporeMyRepublic50.3%
MalaysiaDigi50.2%
MalaysiaMaxis49.0%
Hong Kong (SAR)NETVIGATOR44.2%
CanadaRogers43.4%
SingaporeM141.7%
SingaporeSingTel41.4%
CanadaTelus PureFibre41.0%
Hong Kong (SAR)HKBN41.0%
CanadaShaw39.0%
SingaporeStarHub35.6%
Hong Kong (SAR)HGC30.0%
MalaysiaTIME28.8%
MalaysiaTM21.5%

In addition to providing newer routers, ISPs are increasingly positioned to help consumers solve Wi-Fi performance issues in the home, such as offering mesh Wi-Fi solutions. For some ISPs, this has even taken precedence over offering newer Wi-Fi 6E routers, as they look to improved coverage within the home as a faster route to improving Wi-Fi performance. 

In the U.K., BT has prioritized whole-home coverage over Wi-Fi 6E with its BT Complete Wi-Fi (mesh) offer, despite the U.K. regulator Ofcom having released the lower portion of the 6 GHz band for unlicensed use in 2020. In Canada, Telus, while having recently released a Wi-Fi 6E router for its broadband users, also offers its WiFi Plus package, which includes professional installation and “wall-to-wall coverage” throughout the home. Rogers also offers guaranteed Wi-Fi coverage throughout the home, as well as Wi-Fi 6E routers. Plume offers a subscription-based service, HomePass, across a number of markets, which allows users to add additional access points to help eradicate not-spots or poor Wi-Fi signal within the home and also offers solutions for ISPs looking to improve their Wi-Fi offerings. In Hong Kong, China Mobile Hong Kong (CMHK) was the first ISP in the market to offer a fiber-to-the-room service, while it and other ISPs such as NETVIGATOR offer consumers the option to subscribe to multiple channels over fiber with separate IP addresses, allowing them to divide their activities across channels and thereby help avoid congestion.

To capture the full performance benefits of Wi-Fi 6E and Wi-Fi 7, countries must allocate 6 GHz spectrum for unlicensed use, therefore allowing Wi-Fi devices to access this higher frequency, higher capacity spectrum, and utilize wider channels. At present, according to the Wi-Fi Alliance, allocation of the lower portion of the 6 GHz spectrum band (5,925 MHz to 6,425 MHz) is common among developed economies, with some notable exceptions in some developed markets in Asia and Asia Pacific, in particular China, while allocation of the full 6 GHz band is more limited, available across North America and some Latin American markets, as well as Saudi Arabia and South Korea.

Wi-Fi 7 on the horizon as router vendors continue to push the envelope on performance

Wi-Fi performance continues to scale, and with Wi-Fi 7 routers and smartphones having launched in the second half of 2022, that trend is set to continue. In addition to higher throughput, successive Wi-Fi generations also support lower latency, helping to better support higher quality video streaming, cloud gaming, and future use cases linked to concepts such as the Metaverse and other uses of extended reality (XR).

The major silicon vendors, Broadcom, Qualcomm, and Mediatek, were quick to update their solutions to support the emerging Wi-Fi 7 standard, and hardware vendors have followed suit. Chinese vendor H3C was the first to launch with its H3C Magic BE18000 Wi-Fi 7 router in July 2022, and it has since been followed by other major vendors including tp-link, ASUS, and more recently NETGEAR. However, the prices of early Wi-Fi 7 routers that take advantage of Wi-Fi 7’s range of enhanced performance capabilities will be a barrier to entry for many, with tp-link’s flagship Archer BE900 currently retailing at a cost of $699.99. 

Speedtest Intelligence data shows minimal Wi-Fi 7 adoption as of March 2023, however we are likely to see the same vendors drive Wi-Fi 7 adoption that are currently leading on Wi-Fi 6. Based on global Speedtest Intelligence samples, we see ASUS leading the market in Wi-Fi 6 penetration, with 39% of samples recorded using Wi-Fi 6 compatible routers. NETGEAR and Belkin followed, but for the remaining major router vendors, Wi-Fi 6 penetration currently stands at close to 10% or below. Wi-Fi 6E remains a small but growing subset of Wi-Fi 6 certified devices, currently standing at 7.7% of products based on the latest Wi-Fi Alliance data. Of these, a majority are either routers or smartphones, with an almost even split between the two.

Chart of Wi-Fi 6 Router Market Share view by Brand (Global)

Smartphone support indicates ISPs should focus on Wi-Fi 6E for now

With Samsung releasing its Galaxy S23 range in February 2023 without Wi-Fi 7 support, and Apple’s latest iPhone 14 smartphones limited to Wi-Fi 6, it’s clear that, for now, ISPs should prioritize the rollout of Wi-Fi 6/6E among their customer bases rather than consider leapfrogging to Wi-Fi 7. The Xiaomi Mi13 Pro was the first Wi-Fi 7 capable smartphone to hit the market, launching in December 2022, although it was limited to Wi-Fi 6E initially, requiring a software update to enable Wi-Fi 7. The availability of Wi-Fi 7 supporting Android smartphones will grow through 2023, enabled by SoCs from leading vendor Qualcomm with its flagship Snapdragon 8 Gen 2, and MediaTek with its Dimensity 9200. Apple, on the other hand, lags on the latest Wi-Fi standard support, with the iPhone 14 series featuring Wi-Fi 6, and with its fall 2023 models rumored to be adding Wi-Fi 6E to their feature list.

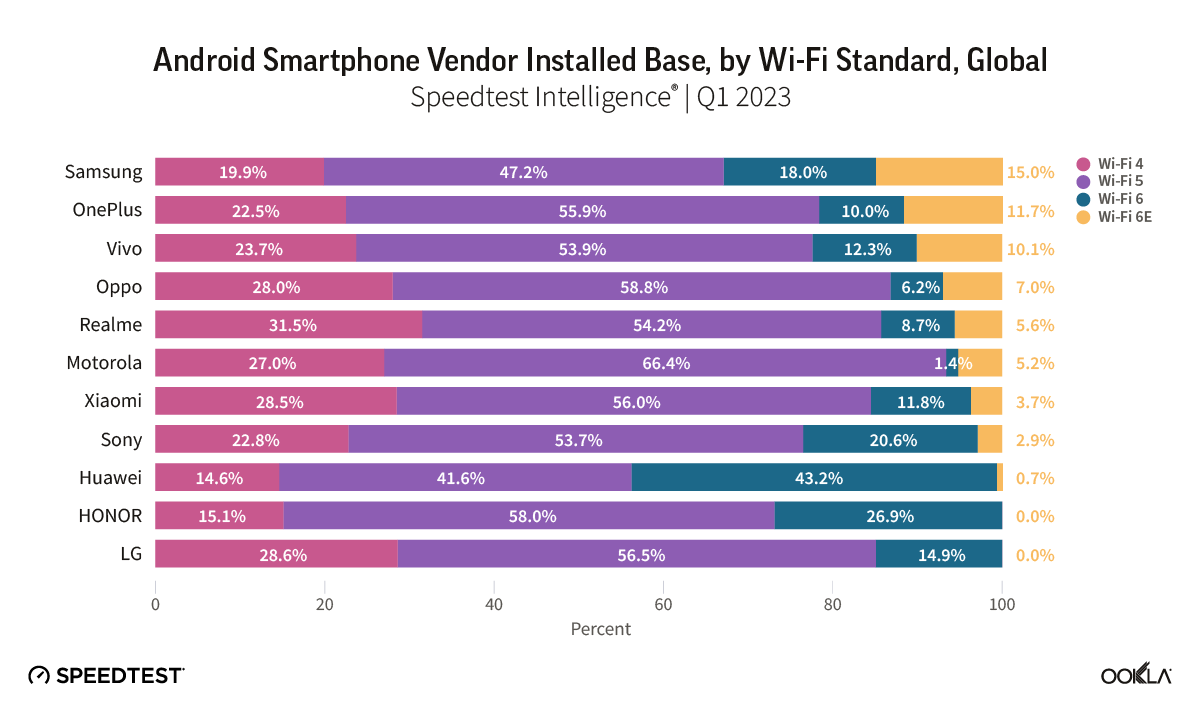
Chart of Android Smartphone Vendor Installed Base, by Wi-Fi Standard, Global

Samsung, as the leading Android smartphone vendor globally, has the largest installed base of smartphones supporting Wi-Fi 6 and Wi-Fi 6E, and has stolen a march on its main rivals Xiaomi, OPPO, and Vivo. While the major Chinese smartphone vendors have launched Wi-Fi 7 compatible devices, the lack of assignment of 6 GHz spectrum for unlicensed use in China does appear to have held them back relative to brands such as Samsung and ASUS.

The outlook for Wi-Fi in the home

It’s clear from the gap between Wi-Fi and ethernet performance that ISPs need to do more to improve the customer experience for Wi-Fi users within the home. Part of the solution lies in rolling out more advanced generations of Wi-Fi technology, given Wi-Fi 4 and 5 remain the dominant technologies deployed globally. However, evidence linking increased adoption of Wi-Fi 6 to overall Wi-Fi closing the gap to ethernet performance is mixed, and validates the approach of ISPs looking to also offer mesh networking Wi-Fi solutions. Contact us to find out more about how Ookla Research can help you monitor the performance of your networks, and stay ahead of the competition.

Ookla retains ownership of this article including all of the intellectual property rights, data, content graphs and analysis. This article may not be quoted, reproduced, distributed or published for any commercial purpose without prior consent. Members of the press and others using the findings in this article for non-commercial purposes are welcome to publicly share and link to report information with attribution to Ookla.
| June 4, 2023

Swiss Operators Sacrifice Speed for Coverage Gains

When we have commented on 5G performance across Europe, we noted that across most of Europe, median 5G speeds have actually decreased, while 5G Availability has increased. The story is very much the same in Switzerland, with additional pressures brought about by having to adhere to strict Electromagnetic Field (EMF) regulations. 

Key takeways

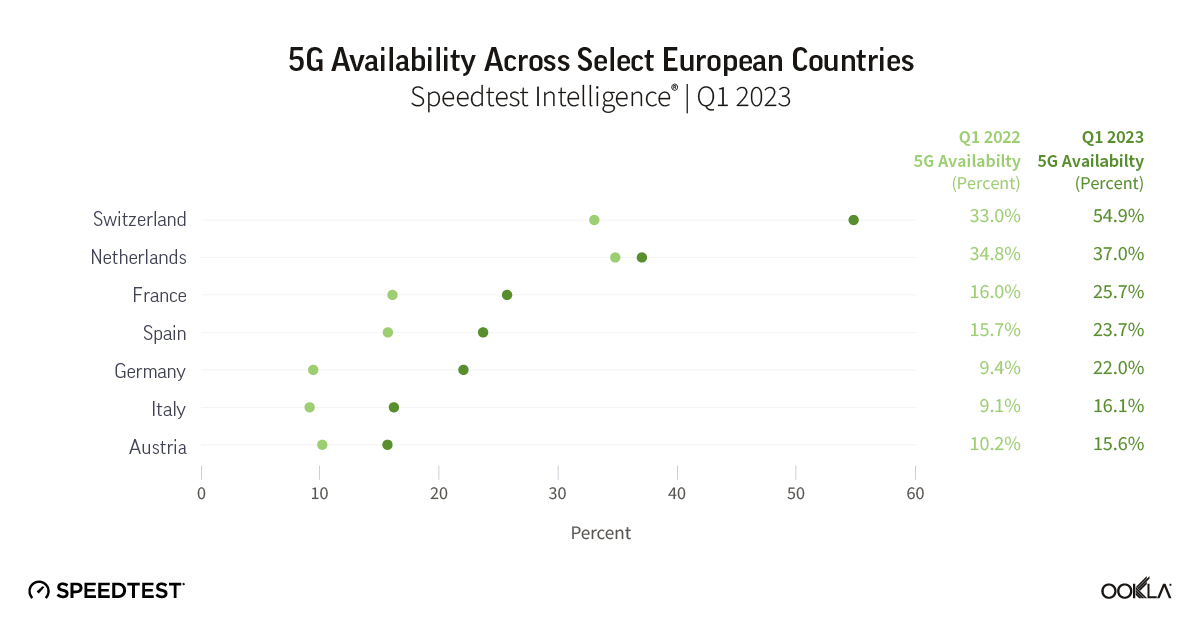
  • 5G Availability is up. Driven by regulatory obligations, 5G coverage is on the rise in Switzerland, improving 5G Availability and the country’s ranking amongst its peers, such as the Netherlands, France, and Spain. In Q1 2023, Switzerland’s 5G Availability was 54.9%, up from 33% in Q1 2022. 
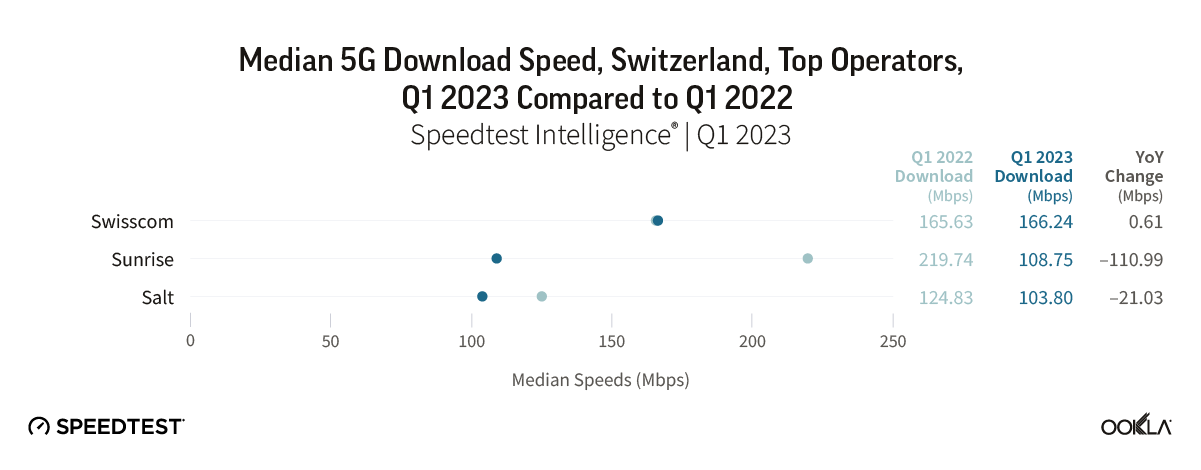
  • 5G speeds decline. In terms of median 5G download speeds, Switzerland saw the most significant decrease amongst its neighbors, with the country’s median 5G download speed falling by around 40 Mbps, from 172.69 Mbps in Q1 2022 to 132.10 Mbps in Q1 2023. Sunrise’s 5G speeds dropped the most across all Swiss operators.
  • 5G positively impacts QoE and NPS. Our QoE data shows that 5G delivers better results for video streaming and web browsing than 4G and Wi-Fi. Additionally, Net Promoter Scores (NPS) have been higher for users on 5G than those on 4G. 

Switzerland leads its peers on 5G Availability

Chart of 5G Availability Across Select European Countries

According to Speedtest Intelligence®, Switzerland has shown significant progress in expanding its 5G availability, with the percentage of users on 5G-capable devices accessing 5G networks most of the time increasing from 33% in Q1 2022 to 54.9% in Q1 2023. Despite operating with strict Electromagnetic Field (EMF) regulations, Switzerland has managed to implement 5G while still adhering to safety standards that protect the public from EMF exposure. The majority of European Union countries follow the International Commission on Non-Ionizing Radiation Protection (ICNIRP) recommendations, which are set at a level 50 times lower than the threshold where health damage has been proven. However, Switzerland’s regulations are even more stringent than those of the EU.

Swiss 5G performance trailing that of its neighbors

Chart of Median 5G Download Speed across Select European Countries

In our recent article, we analyzed Speedtest Intelligence® data to categorize 5G performance into four major groups: 5G Leaders ( > 300 Mbps), High Performers (200 – 300 Mbps), Improvers (< 200 Mbps), and 5G Outliers. Except for France, all countries on the chart above had median 5G download speeds below 200 Mbps, placing them in the “5G Improvers” category. While 5G speeds in Austria and Italy improved slightly, most countries we looked at experienced year-on-year decreases in median 5G download speeds. Switzerland had the most significant decline, dropping from 172.69 Mbps in Q1 2022 to 132.10 Mbps in Q1 2023. There are several reasons for the decline in 5G performance, including increased adoption leading to higher network congestion, economic pressure on operators, higher energy costs, and reduced spending power for consumers.

Sunrise 5G speeds dropped the most as operators focus on extending coverage

Switzerland was the first European country to commercially launch 5G, doing so in April 2019. The country’s telecom regulator, ComCom, conducted a spectrum auction for bands including 700 MHz, 1400 MHz, and 3500 MHz. By the end of 2024, those with 700 MHz spectrum must make 5G available to at least 50% of the population, while those with the 1.4 and 3.5 GHz bands must make 5G accessible to at least 25% of the population by the same deadline. 

In addition to acquiring new spectrum, operators can also refarm spectrum from existing legacy 2G/3G networks for 4G/5G. Swisscom switched off 2G in April 2021 and plans to shutter its 3G network by the end of 2025. This strategy allows Swisscom to refarm its legacy spectrum for 4G and 5G networks as “only 1.1% of mobile data traffic still runs on the 3G network, yet the technology occupies around 10% of the antenna capacity (ONIR)”. 

Due to ONIR legal conditions, cell site transmit power is limited, and operators look to use it as efficiently as possible. They had previously complained that the Ordinance on Protection from Non-ionising Radiation (ONIR) is ten times as strict as European Union regulations. Despite these challenges, Swisscom achieved 61.7% 5G Availability in Q1 2023. Swisscom’s Q1 2023 results note that the operator covers 99% of the Swiss population with a basic version of 5G (using Dynamic Spectrum Sharing, which borrows capacity from its 4G LTE spectrum) and 75% with 5G + (delivered using mid-band spectrum). The operator aims for nationwide 5G+ coverage by 2025.

Salt, which shuttered its 2G service in early 2023, announced that it is covering 99.9% of the territory of Switzerland with 3G, 4G, and 5G. 

Sunrise also discontinued 2G in early 2023 and plans to decommission its 3G networks to free up spectrum and improve network efficiency. According to the latest data from Sunrise, the company provides high-speed 5G to over 1,048 cities/towns and basic 5G to over 96.7% of the population. Our data shows that Sunrise prioritized 5G coverage over performance. Sunrise’s 5G Non-Standalone (NSA) network promotes ENDC (E-UTRAN New Radio – Dual Connectivity). In situations where a 5G NR layer is not present, 5G coverage is reported on user devices, but those users saw decreased performance as their devices were actually still on 4G.

Chart of Median 5G Download Speed, Switzerland, Top Operators

Beyond bandwidth – all eyes on latency 

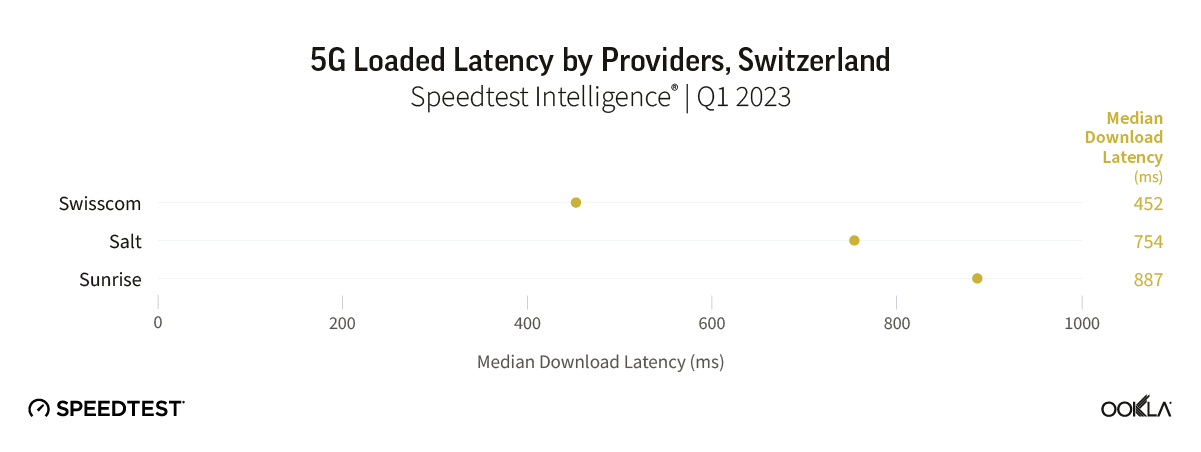
Bandwidth alone isn’t everything when it comes to a good consumer experience. Latency is just as important, especially for services like gaming, AR/VR, the Metaverse, and other apps that require quick responses. Ookla has introduced a new measure called loaded latency, which helps identify the origin of latency problems. Loaded latency is measured during data-heavy download and upload portions of Speedtest, which can reveal issues when multiple applications are running on the same connection. For example, high download latency may occur when someone in the household is installing a large game, while high upload latency can happen when someone is uploading a video to the cloud. 

Chart of 5G Loaded Latency by Providers, Switzerland

Smooth gameplay without interruptions or buffering is crucial for gamers, which is why low latency is important. Indeed, high latency can cause gameplay to stop altogether. According to a study by Deloitte, 45% of people in Switzerland played video games at least once in the last six months, which is lower than the European average of 55%. Swiss gamers spend an average of 8 hours per week playing video games, compared to Europe’s average of 15 hours per week. While Swiss users may not game as much as their European counterparts, the door is wide open for operators to promote gaming and other immersive experiences such as AR/VR and the broader metaverse market. In early 2023, the Swiss Metaverse Association (Metassociation) was established as a private-public partnership to bring major industry players together, encourage innovation, and position Switzerland as a leading metaverse location. Sunrise and Swisscom are both founding members of the Metasssociation as they look for new avenues to generate revenue.

5G delivers better Quality of Experience (QoE) compared to 4G 

The Ookla Consumer QoE™ platform provides valuable insights into the quality of the user experience across various services like web browsing, video streaming, gaming, and video conferencing. With digital services in Switzerland (e-banking, streaming, etc) seeing high usage, we looked at performance differences between 4G, 5G, and Wi-Fi technologies for a few services to see which generation of technology offered the best QoE 

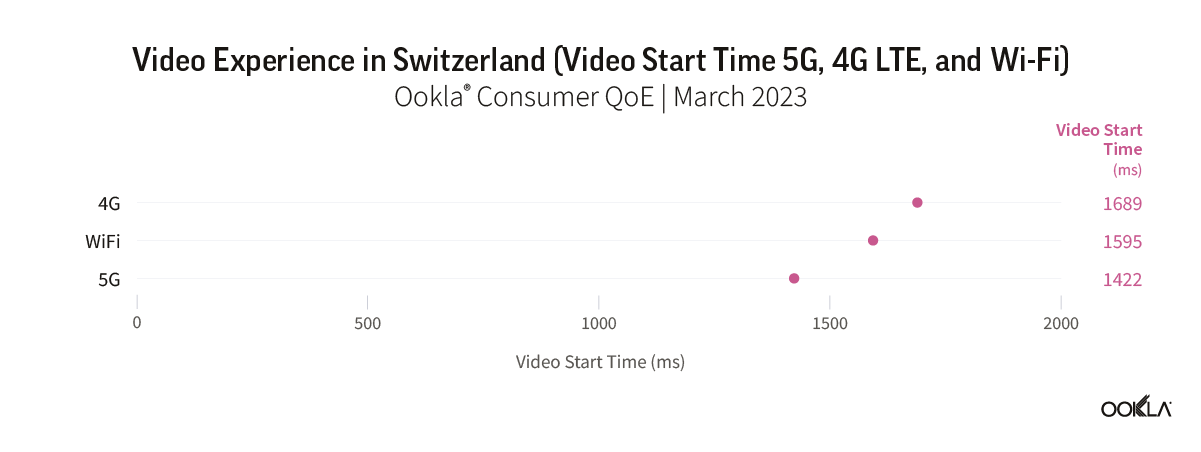
A survey by Moneyland.ch showed that 89% of Swiss people use at least one video streaming service, with Netflix being the most popular, watched by 58% of Swiss viewers in 2022. For those who stream videos, the time it takes for videos to start and/or buffer is a critical factor to consider. Ookla’s Consumer QoE data for March 2023 indicates a nearly 20% decrease in video start time when comparing 4G and 5G networks, with 5G users seeing much quicker video start times than those on 4G. 

Chart of Video Experience in Switzerland (Latency 5G, 4G LTE, and Wi-Fi)

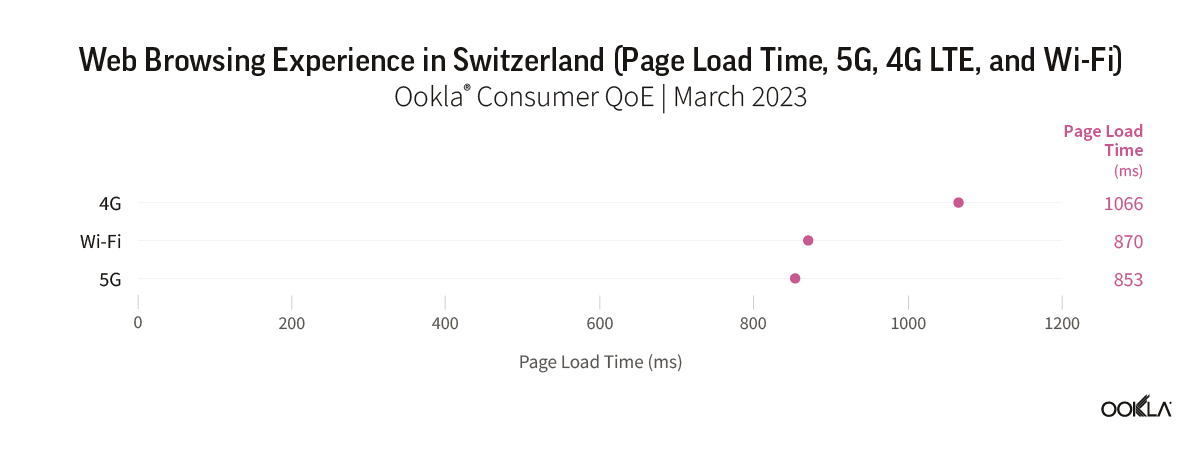
5G delivers comparable browsing results to Wi-Fi, making it a great option for web browsing (and quicker than 4G). 

Chart of Web Browsing Experience in Switzerland (Latency 5G, 4G LTE, and Wi-Fi)

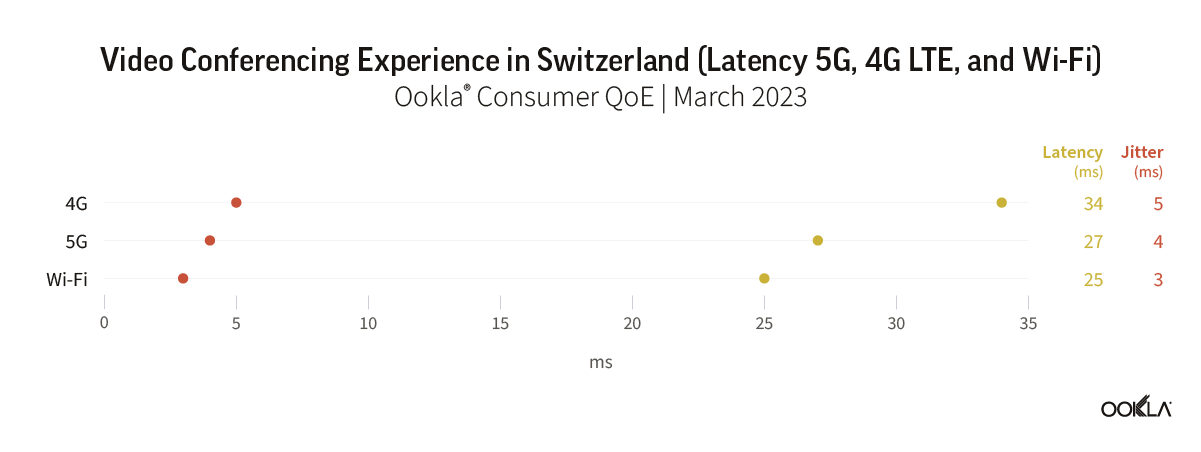
Video conferencing continues to be an integral part of everyday life. According to IGEM Digimonitor 2022 study, 4.0 million people (61% of the population) use a video conferencing tool at least occasionally, with 1.1 million (18%) continuing to video conference daily. Based on Ookla’s Consumer QoE data for March 2023, fixed networks deliver the best video conferencing experience – in terms of both latency and jitter – but 5G wasn’t far behind in either measure. 

Chart of Video Conferencing Experience in Switzerland (Latency 5G, 4G LTE, and Wi-Fi)

5G positively impacts NPS

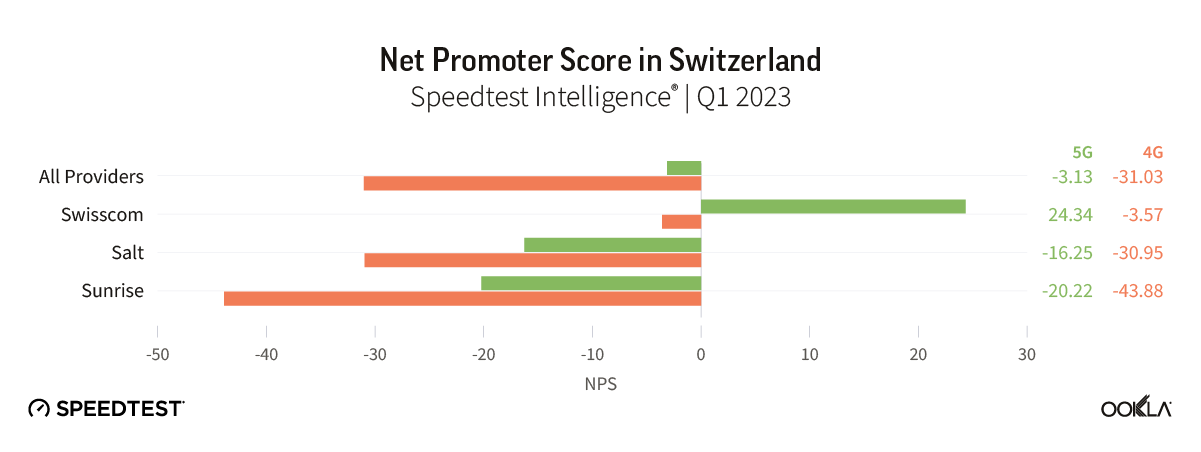
Chart of Net Promoter Score in Switzerland

Net Promoter Score (NPS) from Speedtest Intelligence paints a largely positive picture of current 5G networks in Switzerland. NPS is a key performance indicator of customer experience, categorizing users into Detractors (those that score 0-6), Passives (scores between 7 and 8), and Promoters (score of 9-10), with the NPS representing the percentage of Promoters minus the percent of Detractors, displayed in the range from -100 to 100. 

In our recent article, we found that 5G users, on average, rated their network operator with NPS scores that were universally higher than those for 4G LTE users. The story is similar in Switzerland, where 5G NPS scores were almost ten times higher for 5G than 4G. What’s more, just over half of Swisscom 5G users are promoters (54%) compared to 33% for Salt and 32% for Sunrise. 

We will continue to measure 5G performance in Switzerland. If you have access to 5G in Switzerland, take a Speedtest® on Android or iOS to report how your operator is performing.

If you want to learn more about network performance, subscribe to Ookla Research™ to be the first to read our analyses.

Ookla retains ownership of this article including all of the intellectual property rights, data, content graphs and analysis. This article may not be quoted, reproduced, distributed or published for any commercial purpose without prior consent. Members of the press and others using the findings in this article for non-commercial purposes are welcome to publicly share and link to report information with attribution to Ookla.

| June 13, 2023

Collaboration is Key to Unlock Digital Transformation: A Reflection on M360 Eurasia

Ookla® recently participated in the M360 Eurasia event held in Baku, Azerbaijan, on May 16-17. The conference brought together various players in the telecom industry to discuss important topics such as digital resilience, building stronger customer relationships, and the future of infrastructure, including 5G, IoT, AI, machine learning, fintech, and cybersecurity. The event also emphasized the importance of partnerships, and as such, Ookla shared its perspective on the progress of regional networks and customer experience.

Key takeaways 

  • Digital transformation imperative. Addressing the digital divide, fostering digital resilience, and improving the quality of connectivity are critical priorities in Central Asia’s digital transformation journey.
  • Partnerships are key. Collaboration among stakeholders, including mobile operators, is crucial to overcome challenges and ensure inclusive and reliable digital access for all.
  • AI in customer experience. Leveraging technologies like AI, cloud computing, and biometrics to enhance digital services, improve customer experiences, and promote innovation will be vital to building stronger customer connections. 
  • Early days for 5G. Although 5G is still in its early stages in the region, there is a need for both the government and private sector to collaborate and prioritize the deployment of 5G technology. 

The digital transformation is no longer just an option

As Central Asian countries continue to embrace digital transformation, it’s becoming clear that partnerships are critical to closing the digital divide. Despite network coverage expansion, mobile internet adoption has yet to keep up, resulting in almost 50 million unconnected people in the region, per the latest GSMA Intelligence report. 

Deputy Secretary General of the International Telecommunication Union (ITU) Tomas Lamanauskas highlighted the importance of digital resilience: “The coronavirus pandemic (COVID-19) has changed the way people live, increasing their access to online resources. After the pandemic, the use of computers by people has increased by 60%.” To ensure digital resistance building a robust and flexible digital infrastructure, implementing adequate security measures, and developing a culture of adaptability and innovation are paramount.

During her opening keynote, Azercell CEO Zarina Zeynalova stressed the importance of mobile operators’ role in enabling digital resilience. She also emphasized the need for investing in new security systems and upskilling efforts. Ms. Zeynalova highlighted, “As the providers of mobile connectivity and communication services, we are at the forefront of the complex digital ecosystem and have a unique perspective on opportunities as well as first-hand insight into the challenges of the rapidly evolving landscape.”

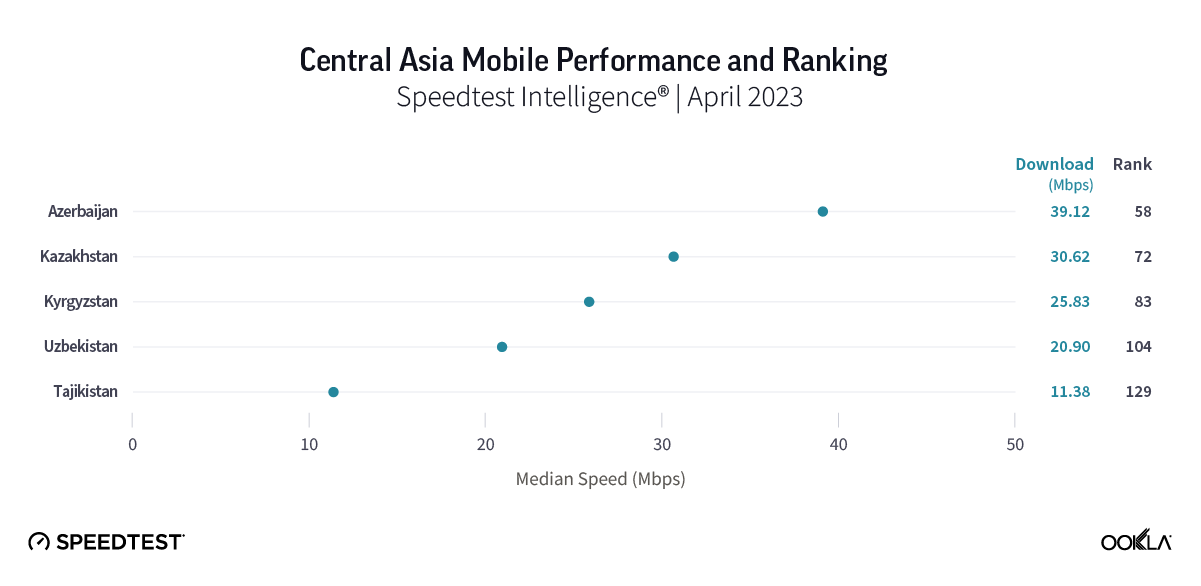
The quality of connectivity also matters. Across Central Asia, where close to half of the population lives in rural areas, it is crucial to make sure that those communities are not left behind when it comes to fast and reliable internet. The latest data from Speedtest Global Index™ shows that there is still room for improvement in the rankings of the “stans.” However, it is encouraging to see that their mobile rankings are on the rise. In Central Asia, where fixed-line broadband and mobile access are limited, access to reliable and high-quality mobile networks is critical; mobile technology is a key factor in digital inclusion and supports economic growth through mobile banking and remote education, among other things. 

Chart of Central Asia Mobile Performance and Ranking

Partnerships are crucial to spurring the digital transformation 

During the panel discussion titled, “Building Stronger Customer Connections: Partnerships in a Mobile-First World,” participants highlighted how digital has become the new normal. One of the speakers, Polina Chernikova, Head of Android Partnerships, The Commonwealth of Independent States (CIS), Google, explained how Google has always been a pioneer in digital innovation by developing platforms such as Android, Play, and Chrome, while providing cloud services to help businesses build better solutions. Additionally, Google supports telco partners in their digital transformation journey by assisting them in getting more smartphones on their networks. One notable example is the development and launch of a Device Locking Solution by Android, which has enabled operators to offer attractive installment plans. 

With the rapid growth and changes in the digital world, many businesses and organizations are adopting cloud-based solutions to enhance their digital projects and streamline their operations. The Chairman of the Board of Directors at Azintelecom, Elkhan Azizov, highlighted the significance of dependable and secure cloud services in supporting digital transformation efforts.

Image of the panel including Sylwia Kechiche at M360

AI will shape the future of customer experience

Leveraging technologies like AI, cloud computing, and biometrics to enhance digital services, improve customer experiences, and promote innovation will be vital to building stronger customer connections. 

During his keynote speech, George Held, the AdTech CEO of VEON, discussed the company’s Digital Operator (DO1440) strategy that aims to reduce customer churn and increase loyalty by offering digital products and bundles. Mr. Held emphasized that “As telcos, we have more direct access to our customers than global tech. We can target customers with what they need when they need it and on the right device.” 

VEON’s strategy is focused on creating locally relevant digital products and services, such as Beeline Kazakhstan’s AI linguistic model called Kaz-RoBERTA-conversational, or BeeBERT for short, which enhances the customer experience and promotes the development of AI-based solutions in the Kazakh language.

Google has been utilizing AI for over seven years to improve its products and make them more helpful to users. With its deep understanding of information and Generative AI capabilities, Google is transforming Search and all its products. Ms. Chernikova emphasized the importance of the developer community to unlock the vast opportunities ahead: “No one company can do this alone. Our developer community will be key to unlocking the enormous opportunities ahead”.

According to Mr. Azizov of Azintelecom, the company’s digital platform SIMA utilizes AI, cloud, and face recognition technologies through partnerships. SIMA has successfully digitalized processes in the country with its biometric-based mobile application for digital signature, which has been downloaded 400,000 times. Additionally, operators can now provide their customers with eSIM online and faster than ever due to the biometrical authentication possible with SIMA.

Still early days for 5G 

Although 5G is still in its early stages in the region, there is a need for both the government and private sector to collaborate and prioritize the deployment of 5G technology. Mobile operators started to deploy and test 5G networks in 2020, although with limited geographic reach across Azerbaijan, Kazakhstan, Kyrgyzstan, Tajikistan, and Uzbekistan. Companies across the region are working towards expanding 5G coverage, making devices more affordable, and optimizing network capabilities to make 5G more accessible and beneficial.

At the end of 2022, Kcell, which operates under two brands, Kcell and Activ, acquired 5G frequencies in the C-band. Aibek Nurkadyr, Strategic Development Director at Kcell, revealed that over 11% of devices using the mass-market Activ brand and 30% across the premium Kcell brand are connected to the 5G network. This shows that Kcell is making progress in expanding its 5G service, but the operator must continue to increase its 5G user base and deliver 5G use cases.

Google is also working to make affordable 5G devices a reality by collaborating with OEMs and SOCs. Additionally, Google is partnering with operators to enable traffic differentiation and improve network utilization through 5G slicing. 

Overall, the event emphasized the importance of digital transformation, partnerships, and AI in shaping the future of the telecom ecosystem. The focus is on improving customer experience, digital resilience, and bridging the digital divide, all of which rely on reliable mobile networks. We will keep a close eye on 5G and network development across Central Asia going forward. In the meantime, if you want to learn more, subscribe to Ookla Research™ to be the first to read our analyses.

Ookla retains ownership of this article including all of the intellectual property rights, data, content graphs and analysis. This article may not be quoted, reproduced, distributed or published for any commercial purpose without prior consent. Members of the press and others using the findings in this article for non-commercial purposes are welcome to publicly share and link to report information with attribution to Ookla.

| January 31, 2022

Ookla Data Hints C-Band Could Change Who’s Going to be Fastest in the U.S.

We recently covered how necessary the addition of C-band spectrum to the 5G strategies of Verizon Wireless and AT&T is for increased performance. We now have data from Speedtest Intelligence® to show exactly how much C-band has already affected 5G performance in the week following launch on January 19 and how that might impact our Ookla Market Report™ rankings next quarter.

U.S. mobile 5G download speeds increased 13% week over week

We saw a week-over-week increase in median 5G download speed of 13% when looking at all operators combined. AT&T and T-Mobile both had slight increases (1%) in median download speed over 5G for all operators when comparing the seven days starting January 12, 2022 to the week of January 19, 2022, with AT&T rising from 68.43 Mbps to 70.46 Mbps and T-Mobile increasing from 181.99 Mbps to 187.11 Mbps. This coincides with AT&T’s very selective rollout of C-band in eight markets and the fact that T-Mobile did not add new spectrum on January 19, though they did launch their 5G carrier aggregation that same day.

Verizon Wireless saw the greatest performance gain of 50% after the C-band rollout, from 76.51 Mbps during the week starting January 19 to 116.29 Mbps during the week of January 19. This massive improvement in speed shows the power of Verizon’s widespread deployment of C-band spectrum and C-band’s ability to deliver fast speeds. We also saw a large increase in testing for customers across the board, but especially Verizon customers who could have seen an ultra wide band icon show up on their phone for the first time after the launch.

This spike in testing is one reason we usually report on at least one quarter of data. However, if the trend in increased speed continues, Verizon Wireless could challenge T-Mobile for fastest download speed in our next Speedtest Global Index Market Analysis.

C-band’s effect on speeds differed across five cities

We also examined week-over-week performance in five of the cities where both Verizon and AT&T deployed C-band: Austin, Texas; Chicago, Illinois; Fort Worth, Texas; Houston, Texas; and Jacksonville, Florida. AT&T saw a 12% increase in median download speed over 5G in Austin, and Verizon Wireless saw statistically significant increases in Fort Worth (21%) and Jacksonville (28%). All other operator speeds over 5G were relatively flat in other listed locations with the exception of Houston where Verizon Wireless showed a dip from a high the prior week.

This could upset the market by the time of our next report

As mentioned above, if Verizon continues to capitalize on their C-band rollout and add additional deployments, we could well see an upset in the U.S. market rankings by the time of our next Speedtest Global Index Market Analysis. There may be additional upsets to come, because while AT&T saw a marginal impact on its initial C-Band launch, their [strategy to install C-band in tandem with recently acquired 3.45-3.55GHz frequency](https://www.fiercewireless.com/5g/att-plans-deploy-345-ghz-c-band-one-climb-tower-strategy) could revolutionize AT&T’s speeds in the second half of the year. Subscribe to Ookla Research™ to get the latest analyses delivered directly to your inbox.

Ookla retains ownership of this article including all of the intellectual property rights, data, content graphs and analysis. This article may not be quoted, reproduced, distributed or published for any commercial purpose without prior consent. Members of the press and others using the findings in this article for non-commercial purposes are welcome to publicly share and link to report information with attribution to Ookla.

| November 23, 2023

Empowering Europe's Digital Ascent: Insights from Ookla's Gigabit Revolution Webinar

Ookla® has recently hosted a webinar on “Accelerating Europe’s Gigabit Revolution: The importance of high-speed internet in the digital era.” We gathered representatives from three European fiber providers, vertically integrated UK Internet Service Provider (ISP) Hyperoptic, Polish open-access fiber network provider, Fiberhost, and Spanish wholesale provider Onvia, to discuss their strategies and challenges related to fiber roll out and adoption. Industry experts from the European Competitive Telecommunications Association (ecta) and two research houses, Assembly Research and Omdia, also joined us. 

European Commission’s Digital Decade 2030 Strategy

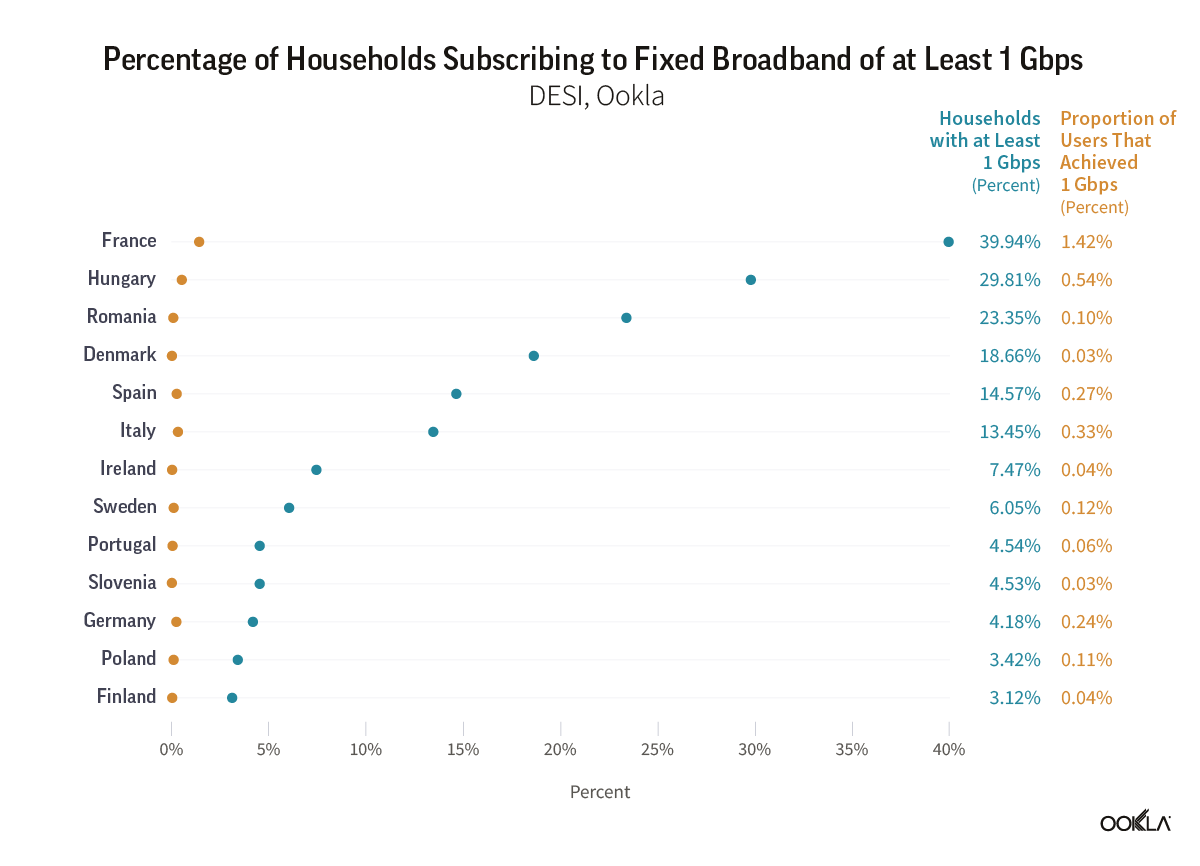
The European Commission’s Digital Decade 2030 strategy, also known as the Digital Compass, is an ambitious roadmap to speed up the digital transformation of Member States by 2030. One of its primary objectives is to enhance digital connectivity, with specific targets such as 100 Mbps services by 2025 and gigabit coverage for all EU households by 2030. We recently published an article to provide a reality check on the progress towards a Gigabit society. Our data suggests a wide gap between advertised and actual speeds for gigabit services, with speeds approaching 100 Mbps commonly seen by users. Despite this gap, our webinar participants were optimistic about achieving the Gigabit Society goal, with 71% supporting that view.

Chart of Percentage of Households Subscribing to Fixed Broadband of at Least 1 Gbps

The EU goal predominantly focuses on the availability aspect. However, it is important to note that having fiber networks available does not automatically equate to actual penetration or adoption rates, although it is a necessary prerequisite. Having physical accessibility to network services is, of course, a vital first step before actual usage, which is influenced by multiple factors such as affordability, awareness, and the perceived need for the service. 

The European fiber network landscape

Stephen Wilson, Senior Principal Analyst from Omdia, provided an analyst’s perspective on how the fiber networks’ competitive landscape is evolving for alternative operators and incumbents. He stated that there has been a substantial increase in Fiber-To-The-Premises (FTTP) coverage, and the investment case for fiber has been spurred by the pandemic. Leading countries, including those in Iberia and Eastern Europe, are pushing coverage to 90% of premises or more, driven by a positive business case. While FTTH (Fiber to the Home) subscriber penetration is generally experiencing steady growth, country-level variations exist, with factors like digital literacy, existing broadband penetration, and competition playing crucial roles in the observed trends. Countries such as Spain and Romania have achieved significant FTTH penetration rates, while others like France have outperformed predictions, emphasizing the diverse dynamics influencing fiber adoption across Europe.

Importance of supportive regulatory framework  

James Robinson, Senior Analyst from Assembly Research, highlighted three measures the European Commission is taking as it seeks to deliver against the Digital Decade’s connectivity targets: the draft Gigabit Recommendation, the proposed Gigabit Infrastructure Act, and a plan for a Digital Networks Act. Although broad industry support exists for the Gigabit Infrastructure Act (GIA), the draft Gigabit Recommendation has proven to be the most controversial. Both measures are still nevertheless expected to be finalized by the end of the year. The Digital Networks Act (DNA) will take longer to materialize, with a white paper not due until H1 2024. Despite its catchy title, the ‘DNA’ is unlikely to represent the urgent concrete action many operators had hoped to see from the Commission following the launch of the exploratory consultation back in February of this year.

Luc Hindryckx, Director General at ecta, expressed doubt about an investment gap that could endanger the 2030 targets. He suggested that some proposed legislation had been developed to support only a few operators rather than to promote competition. Hindryckx stressed the importance of bringing the Gigabit Infrastructure Act to “a good end” and ensuring the reduction of the timing for obtaining permits to deploy networks. He also pointed out that the GIA is complementary to the  European Electronic Communication Code (ECCC), and its key elements include asymmetrical regulation and the Significant Market Power (SMP) regime. Overall, ecta emphasizes the importance of regulatory measures that foster competition, encourage investment, and create a level playing field, ultimately contributing to the successful deployment of gigabit connectivity and the Digital Decade 2030 objectives.

Succeeding in Rural Areas 

Marta Wojciechowska, Chief Executive Officer at Fiberhost, has reported that the company has already met its goal of extending its fiber-optic network to over 1.3 million households by the end of the year. The company primarily focuses on underserved areas, where deployment costs tend to be higher and less predictable. While there are uncertainties regarding demand and fiber service uptake, there are unique benefits, including the low risk of overbuilding. However, the investment process varies significantly between urban and rural areas. In cities, one kilometer of infrastructure can connect one hundred to two hundred households, depending on the city’s size. In rural areas, connectivity extends to just seventeen households per kilometer.

Furthermore, up to 19 formal approvals may be required for infrastructure deployment, which extends the time to connect premises in rural areas to an impractical 24 months. The cost of connecting one household in these secluded “white spots” is over five hundred percent higher than in cities. Overcoming these challenges requires expertise, experience, and a collaborative approach, emphasizing the importance of partnerships with multiple stakeholders. These include local governments and subcontractors to achieve common goals in fiber network expansion.

Strategies for Expansion

Icíar Martínez, Markets and Product Director at Onivia, acknowledged they face similar challenges to Fiberhost but noted that their strategies for expanding the FTTH footprint might differ. Spain boasts close to 90% fiber optic coverage, thanks to private initiatives and government support. Their selective deployment focuses on rural and ultra-rural areas, addressing high customer interest. However, the cherry-picking strategy becomes expensive, impacting profitability, especially in densely competitive areas. Onivia aims to maximize capital returns by identifying key players, adopting XGPON technology for speeds up to 10 Gbps, and strategically balancing deployments in large cities and rural regions to optimize network utilization based on market demands.

On the other hand, Howard Jones, Head of Communications at Hyperoptic, noted that the Hyperoptic approach is distinct, focusing on urban areas with densely populated regions. The key lies in a granular business case approach, evaluating each deployment building by building and street by street. Hyperoptic’s philosophy centers on understanding that the network’s value lies in retaining customers, emphasizing a customer-centric business model. With a customer experience-oriented strategy, the ISP addresses challenges in the UK broadband market, historically marked by lower speeds and inadequate competition. By delivering a high-quality network, reliable service, and fair pricing policies, Jones highlighted that the company aims to set new standards in customer experience, achieving a 40% penetration rate within approximately a year of network deployment. 

Addressing take-up challenges

Marta shared that Fiberhost’s network would not be deployed in white spot areas without EU funds. Fiberhost is the largest beneficiary of EU-funded grants, but this is just the beginning of the investment process. They need to “earn money, and for that, we need to have a good take-up rate.” She added that they must work hard to encourage people to join the fiber network. Their analysis showed that there is a slowdown in activations after ~40 %. While early adopters (47%) are willing to pay a premium for fiber internet, a substantial portion of potential users remain hesitant, contributing to the overall challenge of achieving a high take-up rate. The remaining 53% of households exhibit characteristics of an older demographic (above fifty-five) with limited internet usage, often for undemanding tasks. Their price sensitivity and lower discretionary income present a formidable barrier to higher adoption rates. As a result, Fiberhost adopts a multifaceted strategy, encompassing high-level engagement with Internet Service Providers (ISPs), targeted sales promotions, and educational initiatives. This strategic flexibility recognizes the absence of a one-size-fits-all solution and emphasizes the need for nuanced approaches tailored to the diverse challenges within each territory. 

Iciar echoed this sentiment but also highlighted a need to implement a connectivity plan, not just deploy fiber, but also to digitalize rural areas. Access to a broadband network in rural households is essential, and so is educating people on the benefits of accessing new technologies. Onivia is exploring synergies with other technologies like 5G or satellite to extend broadband connectivity into areas that are difficult to reach. Iciar mentioned that working with local authorities is key to reusing existing infrastructure and avoiding building and disturbing neighborhoods with work.

Demand Aggregation and Competition

Stephen pointed out that the most successful operators are already in the 60-70% take-up rates of premises passed in countries like Norway, which points to demand aggregation being an important factor in getting pre-commitments before you roll out. Howard concluded, “Competition is the key to ensuring that these targets are met because I don’t believe that incumbents alone will do it. They need to be driven, and driven by competition.” He added the introduction of ‘One Touch Switch’ adds another layer of competition into the UK market and presents an opportunity to break the stranglehold of the big retail providers, who still often tend to sell FTTC (Fiber to the Cabinet), by moving a significant number of customers to alternate providers who are more likely to offer FTTP. This initiative is crucial, but what’s more important is the need to retain competition for everyone. 

The journey towards Europe’s gigabit revolution is indeed multifaceted and involves various factors such as regulatory landscapes, diverse deployment strategies, financial dependencies, and the imperative of competition. Achieving the Digital Decade 2030 targets demands not just the availability of physical networks but also a concerted effort to address adoption challenges and ensure that the benefits of enhanced connectivity reach all corners of society. A shared commitment to realizing Europe’s digital potential is crucial, and a regulatory framework that fosters competition emerges as a common thread, underlining its pivotal role in driving investment, innovation, and equality. Moving forward, collaboration, adaptability, and a unified approach are essential to achieving Europe’s digital aspirations. From our side, we will continue to report what we see from Ookla® data in terms of users actually experiencing speeds. 

See the full webinar recording here

Ookla retains ownership of this article including all of the intellectual property rights, data, content graphs and analysis. This article may not be quoted, reproduced, distributed or published for any commercial purpose without prior consent. Members of the press and others using the findings in this article for non-commercial purposes are welcome to publicly share and link to report information with attribution to Ookla.
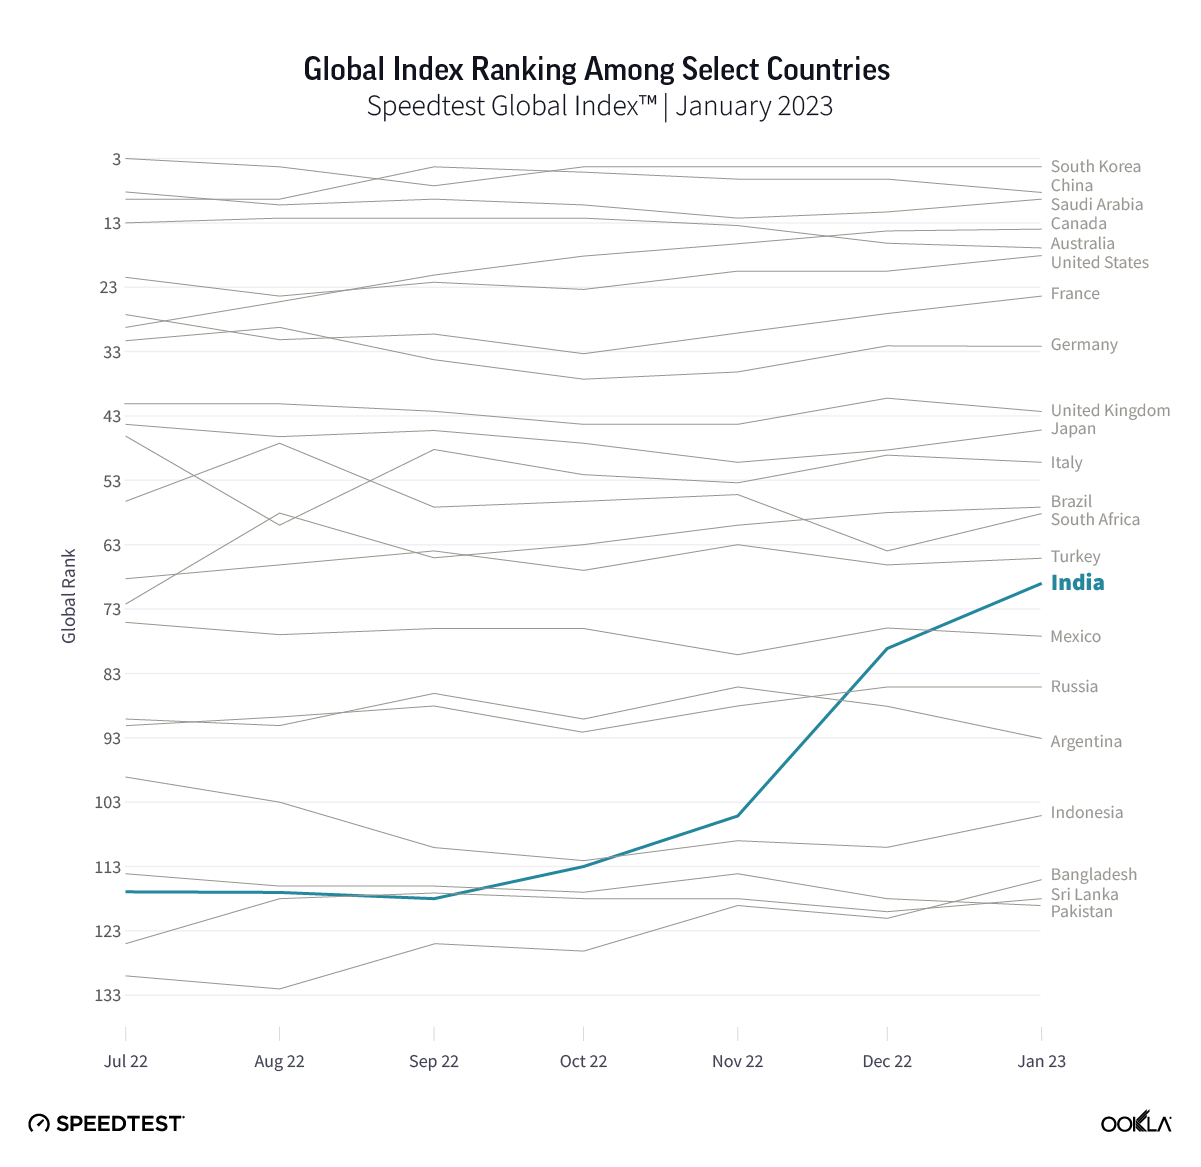
| August 27, 2019

Where to Find the Fastest Airport Wi-Fi in the U.S. and Canada in 2019

We’re back with our annual survey of the fastest airport Wi-Fi in the U.S. and Canada. This year we’re sharing data on twice as many airports, as well as looking at which non-airport-sponsored SSIDs are your fastest choice. Whether you’re taking one last summer vacation or booking business trips for the fall, this guide should help you find the fastest airport internet connections.

Our analysis is based on Speedtest IntelligenceTM data from 51 of the largest airports in the U.S. and Canada during Q1-Q2 2019.

Fastest airport Wi-Fi

We looked first at mean download and upload speeds over the airport’s Wi-Fi SSID to see which airports are prioritizing fast speeds.

Honolulu’s Daniel K. Inouye International Airport makes its debut on the list this year at the very top of the rankings. With a mean download speed of 145.12 Mbps, Honolulu’s Wi-Fi was 37.5% faster than second-place Chicago Midway (which was also new to the list). These two airports unseated Sea-Tac, last year’s winner for fastest airport Wi-Fi. Ranking third, Sea-Tac’s mean download speed over Wi-Fi actually fell 4.4% since our last analysis. Nashville International and Phoenix Sky Harbor rounded out the top five

airport-update-chart1-1

Calgary placed 17th overall but showed the fastest airport Wi-Fi of the five Canadian airports we examined. Montréal–Pierre Elliott Trudeau International Airport had the slowest Wi-Fi among Canadian airports again this year, but their mean download speed jumped 154.4% since our last analysis.

We were excited to see that while we more than doubled the number of airports on the list this year, the number with Wi-Fi download speeds less than 10 Mbps fell. The airport with the slowest Wi-Fi was Louis Armstrong New Orleans International Airport, followed by Salt Lake City International Airport, Houston’s William P. Hobby Airport, Southwest Florida International Airport in Fort Myers, and Norman Y. Mineta San José International Airport.

Both Denver and San Francisco split their Wi-Fi between two separate SSIDs that appear to cater individually to 5 GHz and 2.4 GHz devices. In both of these cases we’ve chosen to list the faster of the two SSIDs. Fort Lauderdale has four different Wi-Fi SSIDs for four different terminals. We aggregated the speeds from those SSIDs to report a mean.

Comparing speeds on other Wi-Fi SSIDs at major airports

Airport-provided Wi-Fi is not always your fastest option. This year we also looked for alternate Wi-Fi SSIDs to see which is fastest at each airport. Access to some of these SSIDs may require memberships or day passes, so you can use the information below to decide whether or not to make that investment.

Fastest Wi-Fi SSIDs at 51 Largest Airports in U.S. and Canada
Speedtest IntelligenceTM | Q1-Q2 2019
Airport Fastest SSID Mean Download (Mbps) % Faster than Airport SSID
Austin–Bergstrom International Airport Boingo Hotspot 80.99 0.2%
Baltimore–Washington International Airport Boingo Hotspot 81.91 1.7%
Calgary International Airport YYC-Free-WiFi 69.22
Charlotte Douglas International Airport CLT Free WiFi 47.68
Chicago Midway International Airport _Free_MDW_Wi-Fi 105.51
Chicago O’Hare International Airport united_club 124.96 93.9%
Cleveland Hopkins International Airport CLE-GUEST 52.88
Dallas Love Field DAL Free WiFi 43.56
Dallas/Fort Worth International Airport TheCenturionLounge 70.29 28.8%
Daniel K. Inouye International Airport HNL Free WiFi 145.12
Denver International Airport – DEN Airport Free WiFi 88.47
Detroit Metropolitan Airport Boingo Hotspot 62.28 0.2%
Edmonton International Airport EIA_FREE_WIFI 51.44
Fort Lauderdale–Hollywood International Airport MedallionNet 41.98 237.5%
George Bush Intercontinental Airport united_club 156.73 1117.8%
Hartsfield–Jackson Atlanta International Airport DeltaSkyClub 111.89 69.8%
Indianapolis International Airport IND PUBLIC WiFi 71.14
John F. Kennedy International Airport TWA 161.66 221.5%
John Wayne Airport JWAFREEWIFI 79.91
Kansas City International Airport KCI_FREE_WiFi 38.28
LaGuardia Airport _Free LGA Wi-Fi 79.40
Logan International Airport Passpoint Secure 58.64 26.8%
Los Angeles International Airport united_club 156.91 122.3%
Louis Armstrong New Orleans International Airport #MSY-Free_Wifi 4.42 337.6%
McCarran International Airport McCarran WiFi 44.56
Miami International Airport Avianca_VIP 55.58 55.4%
Minneapolis–Saint Paul International Airport Boingo Hotspot 82.11 34.8%
Montréal–Pierre Elliott Trudeau International Airport VIP 44.37 172.0%
Nashville International Airport Boingo Hotspot 100.42 3.6%
Newark Liberty International Airport united_club 120.31 133.0%
Norman Y. Mineta San José International Airport XFINITY 26.81 208.2%
Oakland International Airport OAK Free WiFi 90.95
Orlando International Airport skyclub 63.06 47.1%
Philadelphia International Airport American Airlines lounge Wi-Fi 79.37 73.3%
Phoenix Sky Harbor International Airport Free PHX Boingo WiFi 93.47
Portland International Airport flypdx 38.47
Raleigh–Durham International Airport RDU Free WiFi 24.80
Ronald Reagan Washington National Airport FlyReagan 81.72
Sacramento International Airport flysacramento 37.26
Salt Lake City International Airport DeltaSkyClub 18.70 699.1%
San Antonio International Airport SAFreeWiFi 47.83
San Diego International Airport #SANfreewifi 85.30
San Francisco International Airport united_club 151.10 175.3%
Seattle–Tacoma International Airport Alaska Lounge 102.26 3.6%
Southwest Florida International Airport RSWiFly 7.51
St. Louis Lambert International Airport *STL_FREE_WIFI 60.20
Tampa International Airport TPA 19.50
Toronto Pearson International Airport Plaza Premium Lounge 38.52 25.3%
Vancouver International Airport @yvrairport 58.97
Washington Dulles International Airport united_club 185.86 150.2%
William P. Hobby Airport Free Airport WIFI 7.30

The airport’s own SSID was the fastest option for Wi-Fi at 26 airports.

At the other 25 airports, airport lounges (both those affiliated with airlines and other private entities) often topped the pack. We saw that “united_club” was the fastest SSID at six airports and “DeltaSkyClub” at two. “Alaska Lounge,” “American Airlines lounge Wi-Fi,” “Avianca_VIP,” “MedallionNet” and “Plaza Premium Lounge” were each the fastest SSID at one airport.

“Boingo Hotspot” was the fastest SSID at five airports and “Passpoint Secure” (a Boingo service) at one. It’s interesting that at airports where we saw both the “Boingo Hotspot” and “Passpoint Secure” SSIDs, mean download speeds on the “Boingo Hotspot” SSID were routinely faster.

How airline lounges fare for Wi-Fi

We won’t pretend to compare most of the amenities available at various airline lounges, but we do have data on which have the fastest Wi-Fi. We compared mean download speeds over Wi-Fi SSIDs affiliated with airlines and airport lounges to see which memberships you might want to consider.

The United Club has fast Wi-Fi at Dulles, LAX, George Bush Intercontinental, San Francisco, O-Hare and Newark, with mean download speeds well above 100 Mbps. At LAX, the mean download speed of 156.91 Mbps on “united_club” is 263.2% faster than “American Airlines lounge Wi-Fi.” Similarly, “united_club” is 158.9% faster than “American Airlines lounge Wi-Fi” at Chicago O’Hare. United’s more general SSID, “United_Wi-Fi” is slow — 97.3% slower than “united_club” in Houston, and 93.3% slower in Newark.

American Airlines had the fastest lounge Wi-Fi at JFK with a mean download speed of 103.61 Mbps. At Philadelphia International the lounge saw a mean download speed of 79.37 Mbps. It was slower at Miami International Airport, LAX and Chicago O’Hare, however, with mean download speeds in the mid-to-upper 40s. At Phoenix Sky Harbor and Dallas-Fort Worth, though, download speed at the American Airlines Lounge was closer to the mid 20s.

Delta operates three separate SSIDs in Atlanta with “DeltaSkyClub” having the fastest downloads at 111.89 Mbps, “Delta_Guest” at 86.42 Mbps and “DeltaWiFi” at 28.65. In Detroit “DeltaSkyClub” delivered a download speed of 42.12 Mbps and 35.64 Mbps in Minneapolis. Downloads were even slower on this SSID at LaGuardia, Salt Lake City, Sea-Tac, JFK and LAX, with mean speeds that ranged from 15.91 Mbps to 23.20 Mbps.

The Alaska Lounge was the fastest at Sea-Tac with a mean download speed of 102.26 Mbps. The Avianca VIP Lounge was the fastest at Miami International with 55.58 Mbps.

TWA had the fastest Wi-Fi at JFK by far, outpacing other airline-affiliated SSIDs by at least 60 Mbps. Also at JFK, JetBlue’s “Fly-Fi” was slow at 9.83 Mbps but 61.1% faster than “JetBlue Hotspot.”

Wherever your travels may take you, remember the number one rule of Wi-Fi: if the connection is not secured, your data isn’t either. Once you’re safely at your gate (or chilling in the lounge), take a Speedtest so we can bring you an updated version of this list next year

Ookla retains ownership of this article including all of the intellectual property rights, data, content graphs and analysis. This article may not be quoted, reproduced, distributed or published for any commercial purpose without prior consent. Members of the press and others using the findings in this article for non-commercial purposes are welcome to publicly share and link to report information with attribution to Ookla.
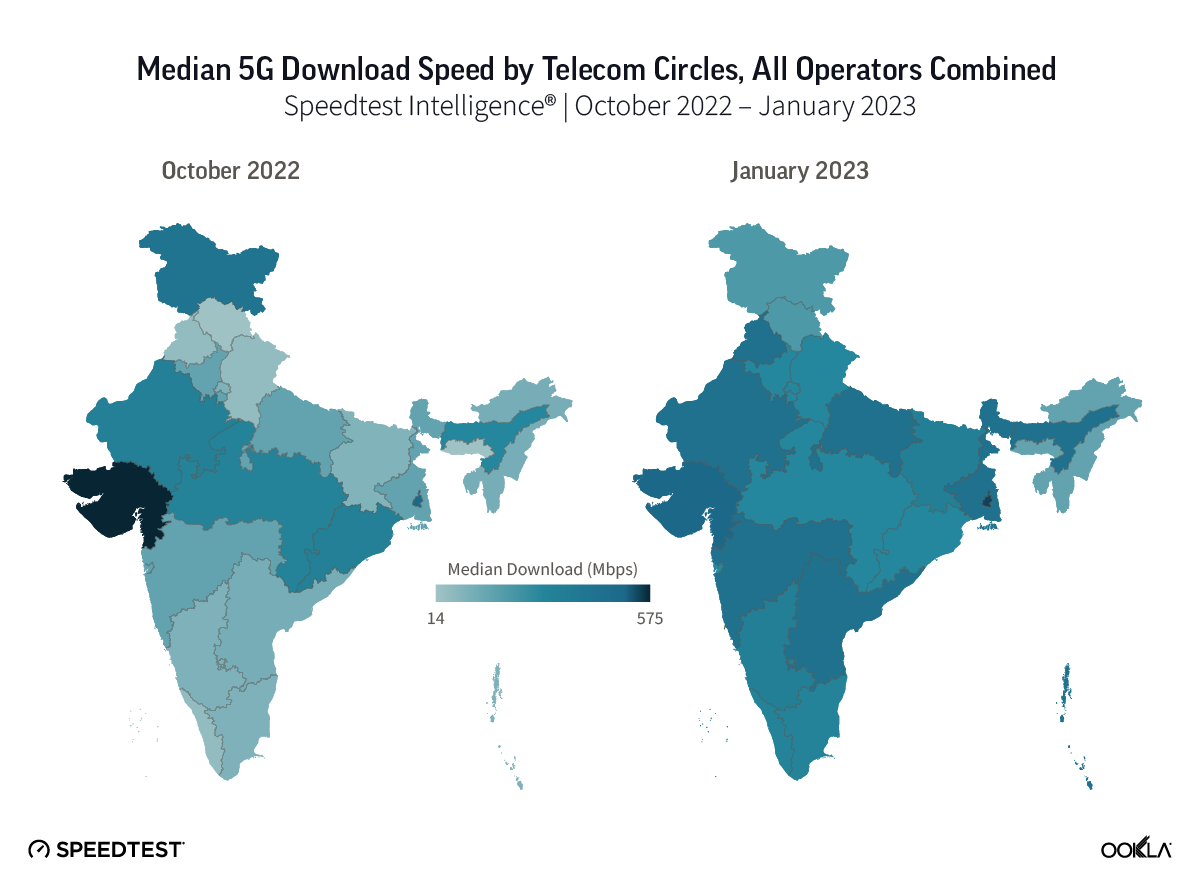
| February 3, 2022

5G Comes of Age: Five Predictions for 2022

2022 will see work start on defining 5G-Advanced (Release 18), while further spectrum will be assigned for 5G use, new networks rolled out (including private 5G) as well as testing and deployment of Open RAN, standalone (SA) 5G, mmWave, and use of the public cloud. All of this investment stems from the fact that 5G has been deemed to be a transformative technology … but how close are we to that reality? In the lead up to Mobile World Congress (MWC), we reflect on what operators and the wider ecosystem will focus on at the event and beyond when it comes to 5G. If you’d like to know more about these trends and more, we are happy to discuss them in person at MWC or virtually.

As 5G scales, global average speeds will fall and disparities widen

5G continued to scale during 2021, with the Ookla® 5G Map™ recording 5G deployments in 116 countries as of December 31, 2021, up from 99 countries on the same date a year ago. 2022 will see further spectrum auctions in key 5G bands, and further launches, extending 5G’s geographic reach to large but lower-ARPU markets in Latin America, Africa, the Indian subcontinent, and developing areas in Asia Pacific. Characterized by higher population density, lower ARPU and lower levels of fiber backhaul penetration, growth in new markets is likely to drive global 5G median speeds downwards. At the same time, 5G will offer significantly faster speeds than current 4G networks provide in these regions, and in many cases, 5G will help relieve the pressure on over-congested networks. It will also lead to lower average prices for 5G smartphones globally as vendors target these new markets.

Over the course of 2022, we’ll witness further deployments of SA 5G and in mid- and high-frequency spectrum, which will see some markets like the United States begin to play catch-up internationally, while extending the lead of others. We already see huge variation in 5G performance between markets — more so than any cellular technology to date — and even between competing in-market operators. Our end of year wrap up piece on 5G, Growing and Slowing: The State of 5G Worldwide in 2021, examined city-level 5G network performance and found that Seoul, South Korea was the fastest 5G market in Q3 2021 with a median download speed of 530.83 Mbps, while Brasilia, Brazil underperformed, recording only 58.81 Mbps. While backhaul infrastructure can be a bottleneck, particularly in more developing markets, we see two key levers by which regulators and operators can help drive performance improvements: spectrum availability in a combination of low, mid, and high bands and the level of network densification. The recent launch of 5G in the C-band by Verizon Wireless in the U.S. is a prime example, with Ookla®  Speedtest Intelligence® data showing an uplift in early speeds, but still leaving it behind market leader T-Mobile. 

Reducing the environmental impact of 5G is top of the agenda

We’ve already seen considerable attention from vendors and operators as they look to optimize network energy use and this will continue to be a key focus point for 2022 and beyond. While 5G itself is more efficient than 4G per unit of traffic (90% according to a joint study by Nokia & Telefonica), the sheer level of traffic it will support is projected to increase total network energy consumption by approximately 160% by 2030 according to ABI Research. With energy costs at record highs globally and the environmental impact of related emissions rising (despite on-going moves to decarbonize energy grids), the need to make 5G networks more energy efficient is only increasing. 

Putting parts of the RAN to sleep when demand is low is one key energy saving method, where operators can use machine learning and AI to predict traffic patterns and power down individual radios in a MIMO deployment — or even put entire cell sites to sleep. Maintaining legacy networks puts additional pressure on operator margins, while also perpetuating inefficiencies in terms of energy use. Planned generational sunsetting for 2G and 3G will see further spectral assets being made available for 5G, while also transitioning legacy connections to the more efficient technology. 2021 has seen the largest number of networks sunset so far — with 33 set to be turned off according to GSMA Intelligence — and this trend will continue in 2022.

Spectrum ownership and deployment models fall under the spotlight  

2022 will start to see the effectiveness of new models of 5G spectrum and network ownership weighed, starting with the Single Wholesale Network (SWN). Governments and regulators worldwide see 5G as a means to accelerate the digital transformation of their industries and foster economic growth. That’s why we see them playing a much more visible role in the 5G era, looking to spur deployment by providing incentives, easing regulatory and planning bottlenecks, and ensuring timely access to key spectrum bands. We’re also seeing new and in some cases recycled spectrum and network ownership models come to the fore, with innovative models of spectrum assignment like the CBRS band in the U.S.  and the allocation of spectrum to verticals (e.g., manufacturing in Germany). 2021 has already seen a number of mobile private networks launched and this trend will continue in 2022. The Government of Malaysia, having allocated spectrum to a special purpose vehicle (the Digital Nasional Berhad ) to deploy a single wholesale 5G network, is now reconsidering its approach to 5G deployment, with a decision due by the end of January. All eyes will be on the outcome of this decision, given the checkered history of SWNs to date, but it could provide an interesting case study for other markets to consider when launching 5G if successful.

Standalone 5G’s improvements to latency and upload performance begin to bear fruit

Speedtest Intelligence data clearly shows that headline 5G download performance trumps upload performance for network operators. While historically demand has been largely asymmetric, the trend to remote working as a result of the pandemic and continued growth in social media use and video calling increases the reliance on network uplink performance. Over time, we’re likely to see network operators begin to place more emphasis on differentiating their performance across both download and upload speeds. However, in the short term, we’ll start to see upload performance enhancements driven by the implementation of carrier aggregation where it allows operators to migrate uplink and control channels to lower-frequency bands, thereby expanding the reach and capacity of 5G networks, as well as the introduction of 256QAM and MIMO for uplink connections. 

However, speed is just one side of the 5G story. Release 16 brings about additional capabilities in terms of latency and density. Starting in 2022, 5G technology will go beyond pockets of high-speed mobile broadband to deliver low latency, high density, industry specific applications that make use of cloud and edge technologies to deliver widely available and immersive 5G consumer capabilities. Even though there are no concrete timelines for 5G network slicing commercial solutions, Google’s  recent Android 12 announcement brought network slicing one step closer to becoming a commercial reality. Google has already been testing networking slicing with Nokia and Ericsson, and Taiwan’s Far EasTone has conducted proof-of-concept trials using Android 12 devices connected to multiple 5G slices utilizing URSP.

5G networks become a platform for innovation 

MWC will showcase the ways enterprises are utilizing 5G technologies to change business models and create new value. 5G has been designed as a platform play from its inception, bringing together cloud and edge technologies into compelling services. Networks are increasingly becoming virtualized, as telcos consider hosting non network-related applications and moving more assets (such as network functions) to the public cloud in order to increase flexibility and reduce costs. Over the course of 2022, we’re likely to see more operators follow in Dish’s footsteps, which in April 2021 contracted AWS to provide RAN and core infrastructure for its cloud-native, open 5G network. To make this happen at scale, partnerships between hyperscalers and the wider ecosystem is a necessity: AWS, Microsoft, and Google, are already recruiting operators to their respective clouds across core as well as edge estates, as exhibited by the large number of partnerships signed over the past year.

5G has also been designed with enterprises’ requirements in mind. As such, 5G’s improvements in terms of lower latency, faster transmission speeds, and increased network capacity (massive IoT) open the door to digital transformation of enterprises, and what’s more important, enable new use cases. 5G SA offers the most benefits, allowing support for a wide range of devices and applications with more demanding bandwidth requirements, including wireless robots and real-time video surveillance, compared to Wi-Fi and 4G. 

That’s the theory but how are things working out in practice? RootMetrics® recently measured the performance of T-Mobile’s 5G SA vs NSA in Las Vegas. T-Mobile’s 5G SA network delivered speeds over twice as fast as its speed on NSA 5G. In the future, 5G SA will also deliver time-sensitive networking for high-precision devices. As operator deployments of 5G SA networks scale, so too will enterprise adoption of advanced 5G features such as edge computing and network slicing. Operators are already looking for ways to innovate and monetize 5G, with Softbank leveraging its 5G Consortium, consisting of vertical players, experts, and 5G partners, “to support advanced healthcare, automated driving and other next-generation societal infrastructure”.  

Ookla will be at MWC Barcelona 2022 later this month. Come visit us at our Stand 2I28 in Hall 2, to talk with us about the future of 5G.

Ookla retains ownership of this article including all of the intellectual property rights, data, content graphs and analysis. This article may not be quoted, reproduced, distributed or published for any commercial purpose without prior consent. Members of the press and others using the findings in this article for non-commercial purposes are welcome to publicly share and link to report information with attribution to Ookla.
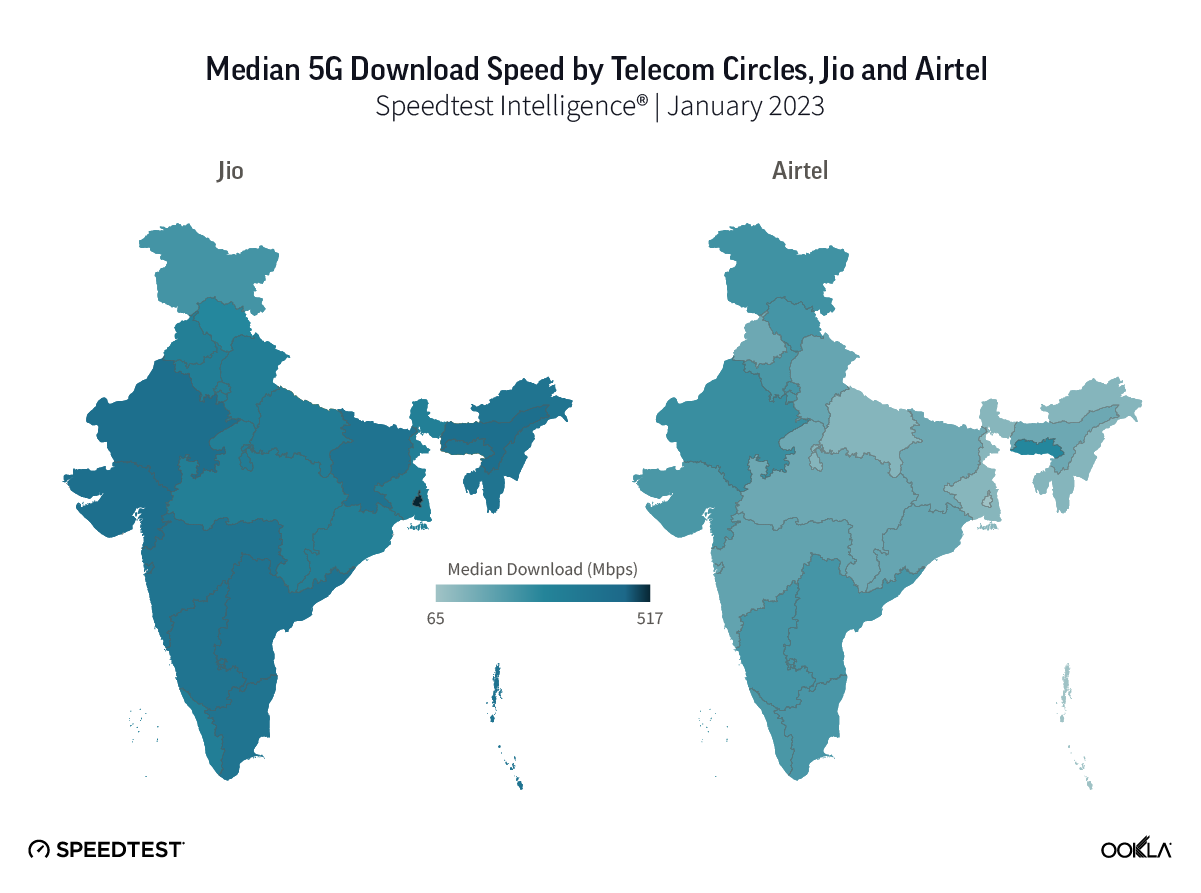
| May 23, 2023

U.S. Airports Have Fastest Free Airport Wi-Fi, Chinese Airports Have Faster Mobile

The summer travel season is about to officially begin across the northern hemisphere and we’re back with fresh data for our series on airport Wi-Fi performance. This year we examined mobile Wi-Fi on free Wi-Fi provided by the individual airports as well as mobile speeds at some of the busiest airports in the world during Q1 2023. While airports in the United States top the list of fastest free airport Wi-Fi, the fastest mobile speeds we saw were in China. Read on for a specific look at internet performance including: download speed, upload speed, and latency.
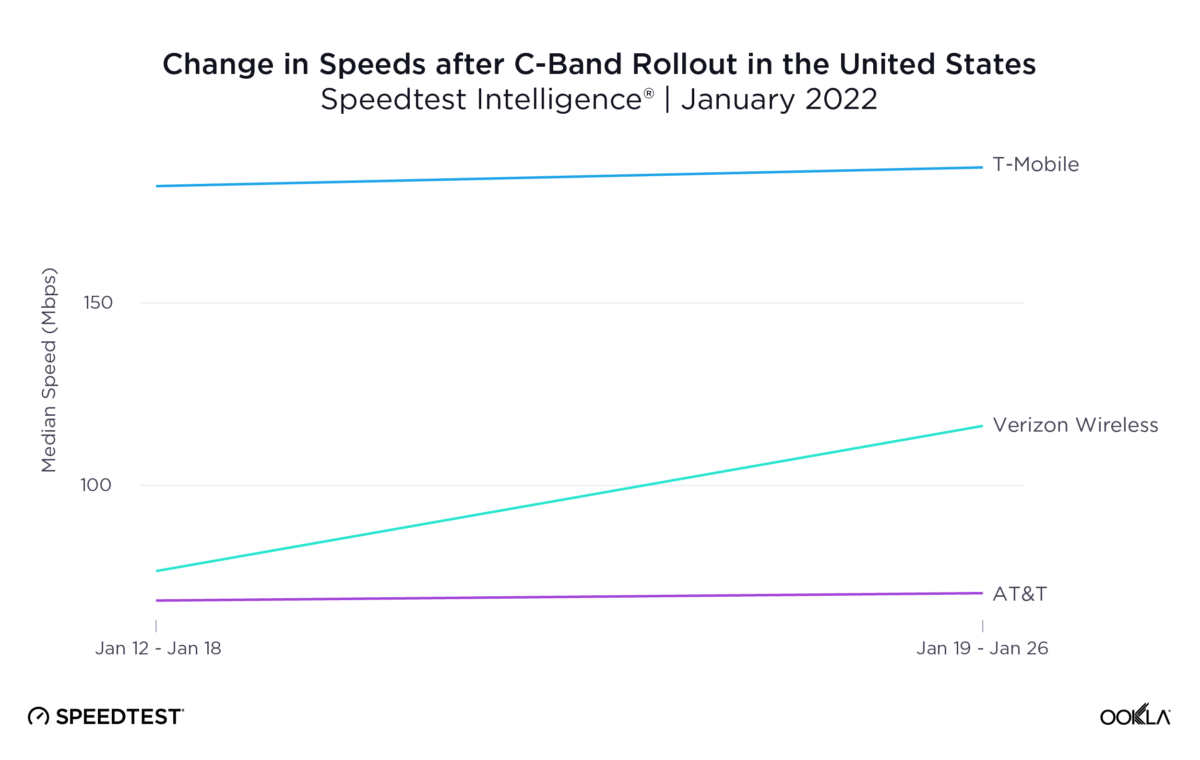
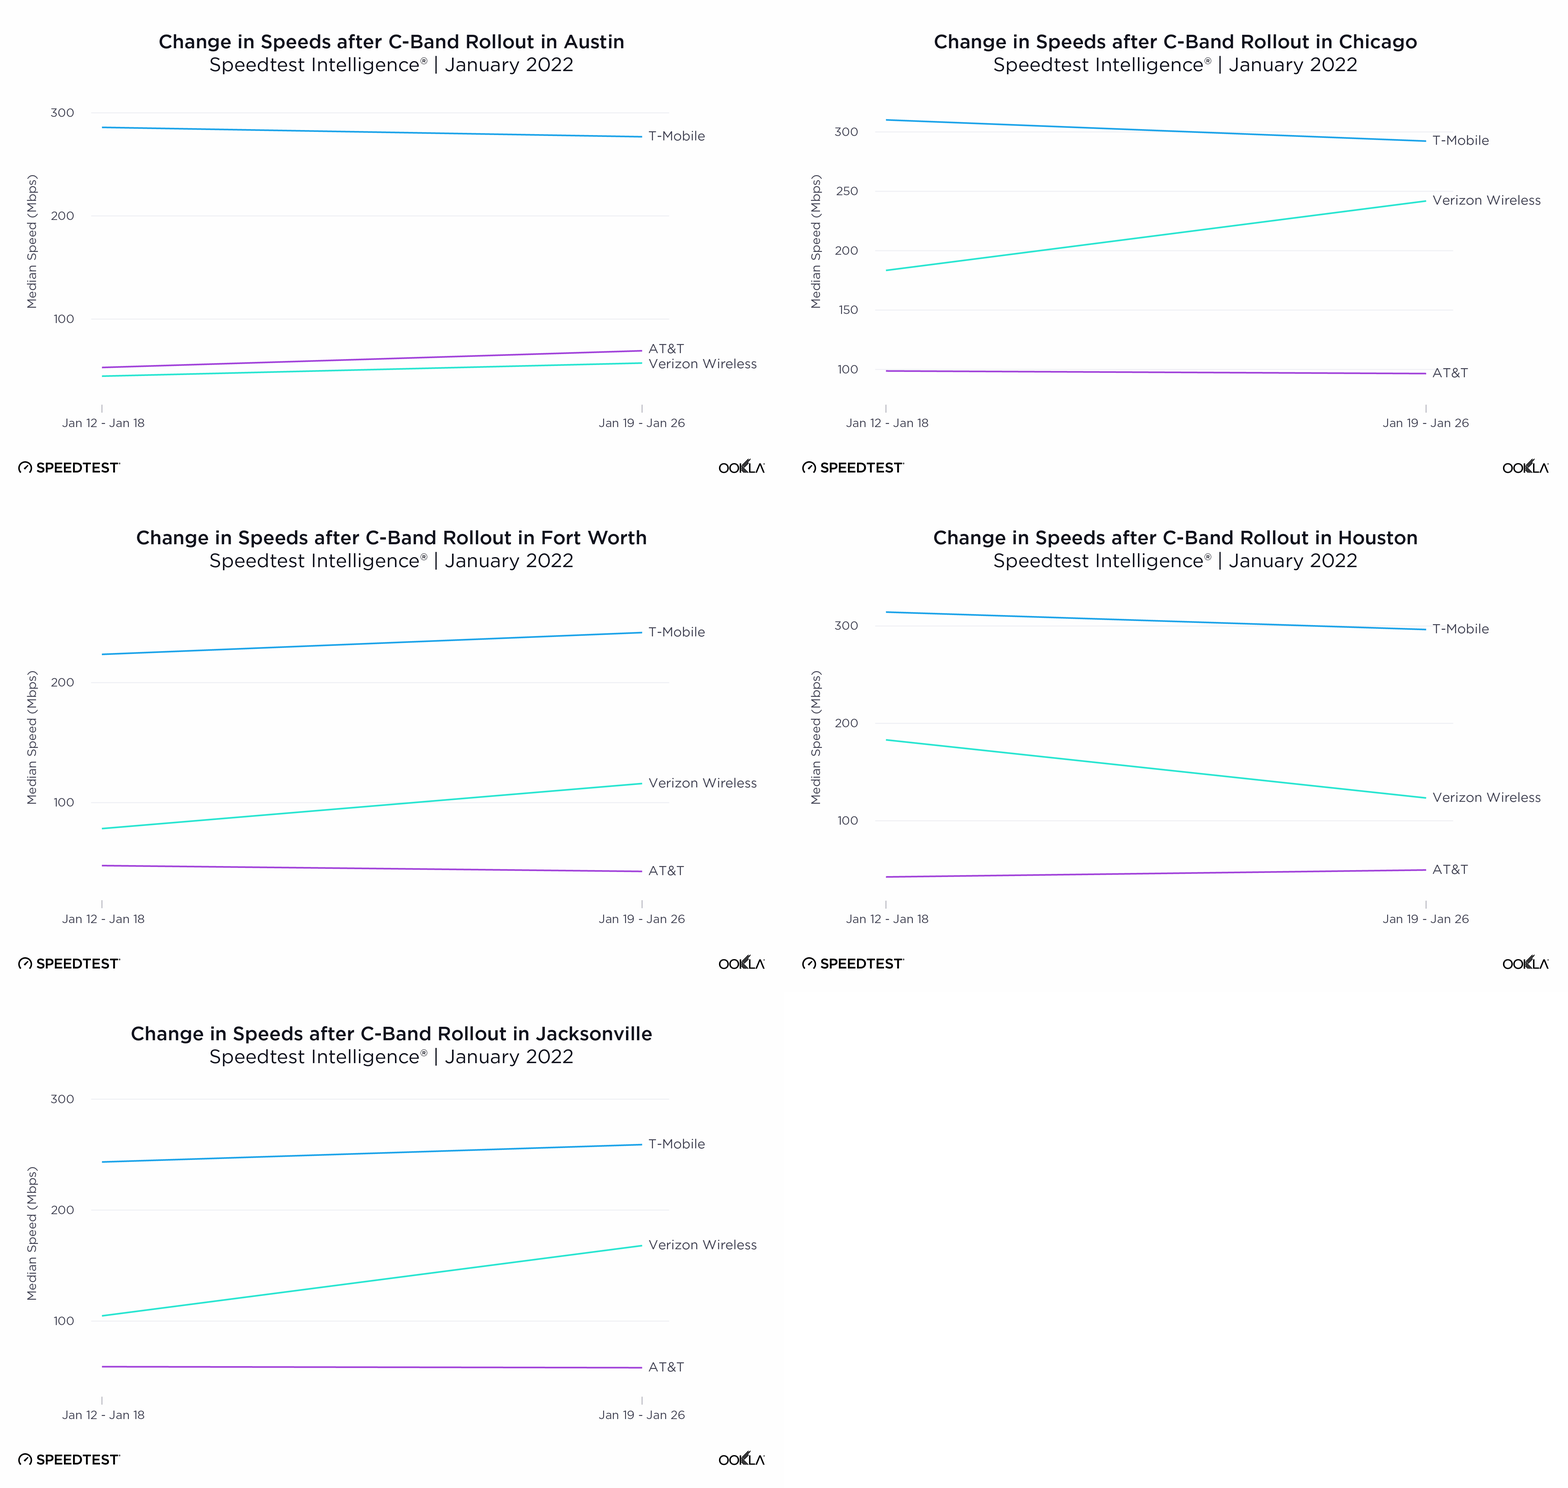
U.S. airports have fastest airport Wi-Fi

Speedtest Intelligence® showed two U.S. airports at the top of the list for free airport Wi-Fi with Fort Lauderdale’s Hollywood International Airport Terminal 3 and San Francisco International Airport showing median download speeds of 157.60 Mbps and 156.66 Mbps, respectively, during Q1 2023. This represented a small drop for SFO since our November analysis but an increase for FLL. Dallas/Fort Worth International Airport (143.42 Mbps), John F. Kennedy International Airport (136.06 Mbps), and Seattle–Tacoma International Airport (136.02 Mbps) rounded out the top five with three additional SSIDs from FLL following closely behind with median download speeds from 122.07 Mbps to 134.62 Mbps.

Chart of Mobile Internet Performance Over Free Wi-Fi at Select Airports

As we’ve seen in most recent analyses, the airports with the fastest Wi-Fi are international hubs that passengers from around the world pass through on their way to all kinds of destinations. If you are connecting through any of these airports, you should have no trouble with internet speeds this fast. In case of video calls, upload speeds are even faster than downloads at almost all of these airports, and SFO had the fastest uploads on the list.

Hartsfield–Jackson Atlanta International Airport and SEA had the lowest median multi-server latency on Wi-Fi of any of the airports surveyed during Q1 2023. This means your device should see very little delay when relaying information across the web.

Shanghai tops Wi-Fi performance at global airports

Shanghai Pudong International Airport was the fastest non-U.S. airport on our list with a fastest median download speed of 118.67 Mbps. Charles de Gaulle Airport in Paris (98.82 Mbps), Amsterdam Airport Schiphol (82.83 Mbps), Dubai International Airport (67.21 Mbps), and Frankfurt Airport (59.10 Mbps) followed for median download speeds at non-U.S. airports. All of these airports have internet speeds that qualify as at least good, which means you should be okay unless you want to try multi-player gaming (which is probably not your first choice on an airport layover anyway). Both Mexican airports on our list showed speeds in the slow range, so log off early and enjoy your vacation if you’re at the airport in Cancún or Mexico City.

Chinese airports have fastest mobile speeds

Get ready to connect to local mobile service or tether your phone to your laptop if you’re traveling through airports in Shanghai and Beijing and have access to 5G. Not only did Shanghai Pudong International Airport, Beijing Capital International Airport, and Beijing Daxing International Airport have the fastest median downloads over mobile on our list at 308.51 Mbps, 304.87 Mbps, and 300.70 Mbps, respectively, during Q1 2023 — the mobile speeds at these airports were dramatically faster than the airport Wi-Fi. Salt Lake City International Airport (282.21 Mbps) and Hangzhou Xiaoshan International Airport (259.86 Mbps) rounded out the top five.

Chart of Mobile Network Performance at Select Airports

While latency on mobile was generally higher than that on Wi-Fi, these same three Chinese airports (PEK, PKX, and PVG) also showed the lowest median multi-server latency on mobile during Q1 2023, indicating that your internet experience at these airports will have the least lag. Airports outside the U.S. performed better for latency overall with the top 16 airports for latency all located outside North America. CUN had the highest latency on mobile.

We were able to include more airports in the mobile analysis because there were more mobile samples to analyze at those airports than there were samples over Wi-Fi.

Airport Wi-Fi or mobile? Connecting on your next trip

Save yourself time by using this checklist to decide whether to try out the Wi-Fi or simply use the local mobile network. We compared internet performance on free airport Wi-Fi with median download speeds over mobile for the 38 airports we have both Wi-Fi and mobile data for during Q1 2023. Twenty-one airports had faster mobile internet than airport Wi-Fi. Twelve airports had faster Wi-Fi than mobile, and four airports showed only a slight distinction between Wi-Fi and mobile so we gave both the green check marks.

Chart Comparing Airport Wi-Fi and Mobile Speeds at Select Airports

Airport Wi-Fi has come a long way since we started this series in 2017. We hope your connections are smooth and if you’re traveling this summer, take a Speedtest® at the airport to see how your experience compares.

Ookla retains ownership of this article including all of the intellectual property rights, data, content graphs and analysis. This article may not be quoted, reproduced, distributed or published for any commercial purpose without prior consent. Members of the press and others using the findings in this article for non-commercial purposes are welcome to publicly share and link to report information with attribution to Ookla.