| October 24, 2023

Government and Regulatory Support is Key to Improving 4G Performance in Africa

In this article, we analyze select African countries that have consistently improved their ranking in Ookla’s Speedtest Global Index™ between June 2020 and June 2023 and discuss the drivers that contributed to this rise. These countries can provide lessons and best practices that other operators and regulators can apply to bridge the 4G performance gap.

Key takeaways

  • Government and policy intervention is critical in supporting the rollout of 4G networks in Africa. Operators need more than ever support amid the challenging macroeconomic, operating conditions, and shrinking consumer disposable income. For example, the government intervened in Nigeria to cancel excise tax to reduce operators’ financial burden, promoted infrastructure sharing in Cote d’Ivoire and Zimbabwe to speed up network deployment, and led the expansion of 4G infrastructure in Libya.
  • Spectrum availability is crucial to improving network performance and coverage to meet growing data demand. For example, public authorities encouraged the efficient spectrum usage by freeing up legacy bands and refarming existing ones in Mauritius, Namibia, and Tanzania, and by adopting technology-neutral spectrum licensing in Zimbabwe.
  • Non-punitive network QoS compliance policies can help drive investments and promote fair competition. Policymakers and regulators in Africa are increasingly adopting alternatives to financial sanctions to encourage operators to meet coverage and QoS obligations. For example, the regulator in Tanzania mandated network investments instead of issuing non-compliance penalties.

Some African countries show a marked improvement in 4G download and upload speeds as well as coverage

Cellular networks are critical to connect individuals and businesses as internet access in Africa is predominantly mobile. In addition, the adoption of digital services, spurred by the COVID-19 pandemic, has rapidly increased the demand for data services. As a result, consumer needs and economic growth will increasingly depend on a fast, reliable mobile network.

We used Ookla’s Speedtest Global Index™ to identify African countries that have consistently improved their mobile speed ranking between June 2020 and June 2023. We then used Speedtest Intelligence® data to compare 4G mobile performance on modern chipsets between Q2 2020 and Q2 2023.

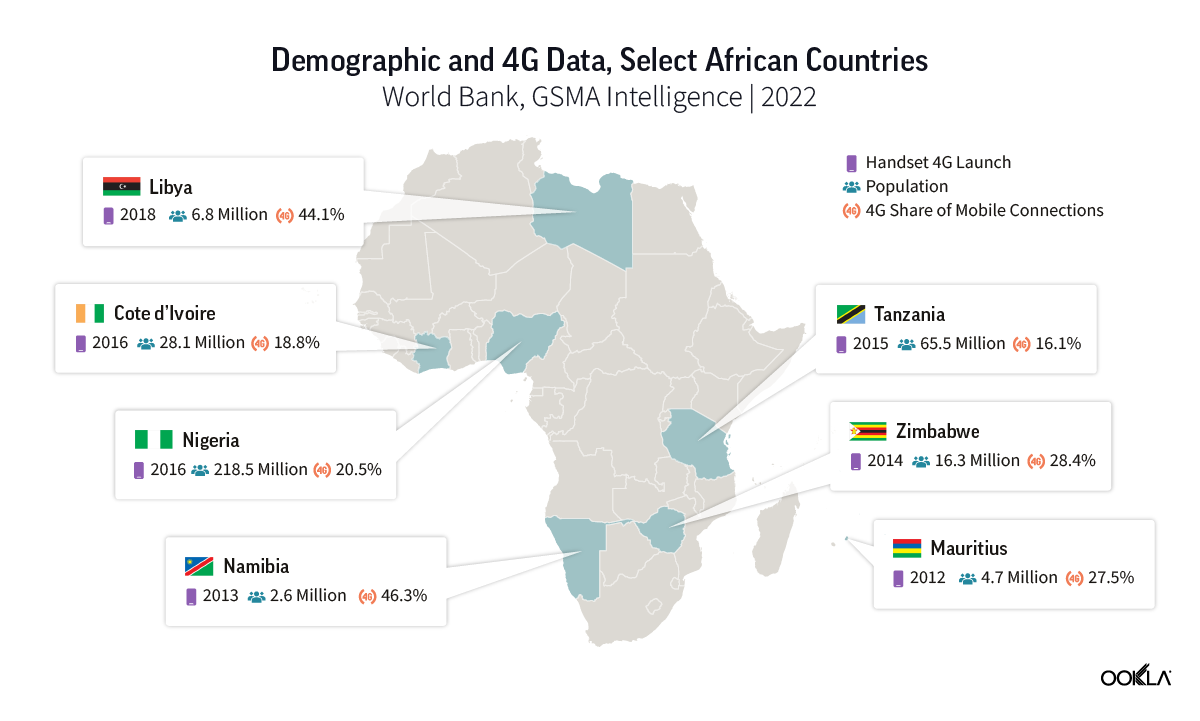
We focused on markets that offer strong growth potential for 4G, so we selected countries whose 4G share of connections was lower than 50% at the end of 2022 (based on data from GSMA Intelligence). The shortlisted countries represent different sub-regions and have different demographical and geographical characteristics, as shown on the map below. 

Map of Demographic and 4G Data in Select African Countries

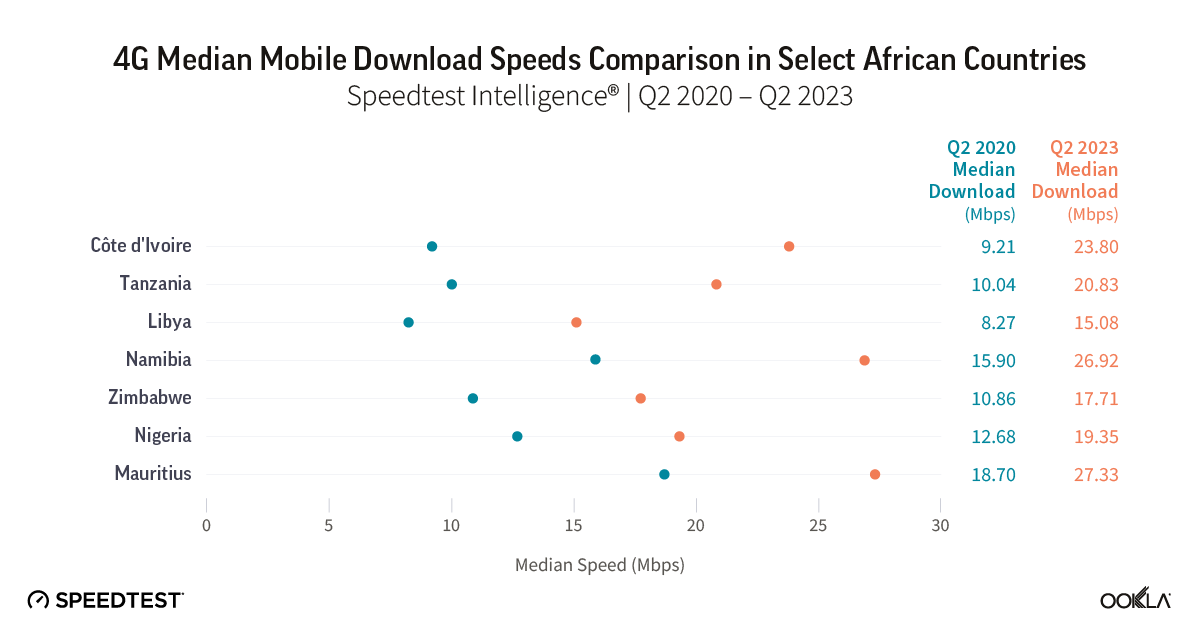
According to Speedtest Intelligence data, Cote d’Ivoire showed impressive improvement in 4G network performance since Q2 2020, reaching a median download speed of 23.8 Mbps in Q2 2023, the third highest speed behind only Mauritius with 27.33 Mbps and Namibia with 26.92 Mbps. Tanzania doubled its 4G download speeds to 20.83 Mbps while Libya, Nigeria, and Zimbabwe had download speeds between 15 Mbps and 20 Mbps in Q2 2023.

Chart of 4G Median Mobile Downloads Speeds Comparison in Select African Countries | Q2 2020 - Q2 2023

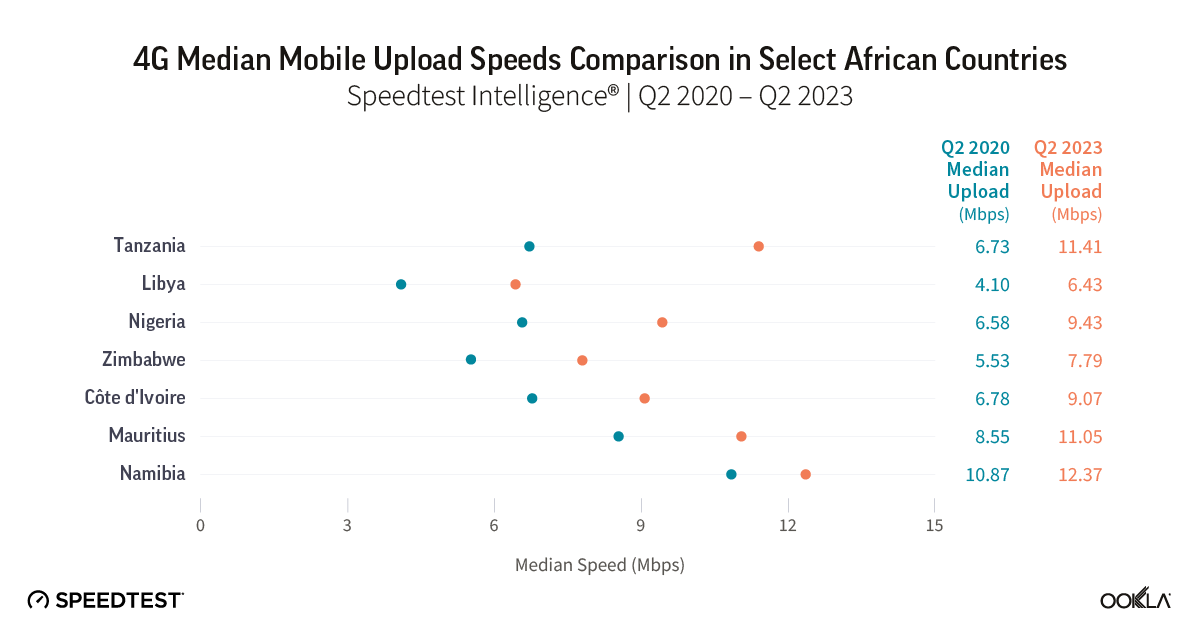
Improvements in upload speeds over the same period and the differences between the countries were less pronounced than download speed results. With a jump of 1.6 times in 4G upload speed between Q2 2020 and Q2 2023, Tanzania moved from fourth to second place, ahead of Cote d’Ivoire and Mauritius and just behind Namibia. Notably, Libya lagged behind other countries in download and upload speeds but improved markedly over three years, despite being the last one to launch 4G in 2018, and arguably, where operators had the most challenging environment. 

Chart of 4G Median Mobile Uploads Speeds Comparison in Select African Countries | Q2 2020 - Q2 2023

In the following sections, we analyze market dynamics in each country, review operators’ 4G investments, and discuss the factors that drove (or inhibited, at times) 4G market development.

Cote d’Ivoire has plenty of room to increase 4G adoption

Mobile penetration of the population in Cote d’Ivoire increased rapidly since 2020 to reach 142.4% in Q1 2023 (according to Autorité de Régulation des Télécommunications (ARTCI)). 

Orange is the largest mobile operator in Côte d’Ivoire in terms of subscribers (45.6% in Q1 2023) and 4G network population coverage (90.6% in December 2022). It launched 4G services in March 2016 over 1800 MHz. It expanded its subscriber base rapidly thanks, in part, to a $312 million investment in network deployment and upgrades in 2019 and 2020. It also set a plan to invest a further USD120 million between 2020 and 2025 to upgrade the fiber-optic backbone of its 4G network. 

MTN captured just over a third of mobile subscribers in March 2023. It launched 4G shortly after Orange, followed by LTE-A in Abidjan in December 2020, the only operator to offer this service to date in the country. In October 2022, it signed a $75 million five-year contract with Canadian infrastructure supplier NuRAN Wireless to expand its network coverage in rural areas. However, we understood that this only concerns 2G and 3G services. MTN’s 4G coverage reached 57.4% of the population at the end of 2022, way behind Orange. 

Moov had been capturing an increasing share of mobile connections until 2018. Since then, its market share has remained mostly stable at around 20%. It launched 4G services in Q3 2016 over 900 MHz. Moov has extensive network coverage in remote areas, which has helped it to grow its subscriber base. Coverage reached just over half of the population at the end of 2022, lagging behind Orange and MTN.

The three operators managed to rapidly expand 4G coverage after launch. According to Speedtest Intelligence®, 4G service availability, which represents the proportion of an operator’s known locations where a device has access to 4G LTE service, already reached 83.5% in 2018 and increased to 94.3% during Q1-Q3 2023. Despite this, 4G share of mobile connections remains low at 18.8% in 2022 (according to GSMA Intelligence). The unaffordability of smartphones, combined with the limited coverage in rural areas and poor network QoS remain obstacles to mobile data adoption.

To address these challenges, Orange and MTN launched financing schemes and introduced affordable handset models. Further, ARTCI initiated discussions with the operators in 2022 on how to implement improvements in their network and was given additional powers to improve service quality levels. ARTCI also awarded the three operators 2×20 MHz in the 2600 MHz band for LTE to improve network data capacity and is looking for infrastructure sharing as an option to speed up 5G deployment, in time for the African Cup, which will take place at the beginning of 2024.

Government support was pivotal in Libya to accelerate 4G rollout amidst challenging conditions

Libya experienced prolonged political unrest and violence since 2011, leading to the destruction of communication networks, equipment theft, and power shortage. The progressive return to stability since 2021 has somewhat enabled the restoration and extension of existing network infrastructure.

Despite these challenges, Libya has one of the highest mobile penetration in Africa (178.5% in June 2023, according to GSMA Intelligence), and it is one of the few North African countries with an MVNO (albeit capturing less than 1% of the market). The market is a duopoly with two subsidies of Libyan Post, Telecommunication and Information Technology Company (LPTIC): Al Madar Aljaded and Libyana. Both operators introduced 4G over 1800 MHz in 2018, initially covering only a few cities.

Libyana took the lead by launching LTE in January 2018 and covering 30 major towns and cities by the end of that year. It subsequently expanded coverage to more than 49 towns and cities by April 2022. 

Almadar Aljaded launched LTE and LTE-A in October 2018 in Greater Tripoli Benghazi and Misrata before expanding nationwide, claiming coverage for more than 80% of the population in 2022. 

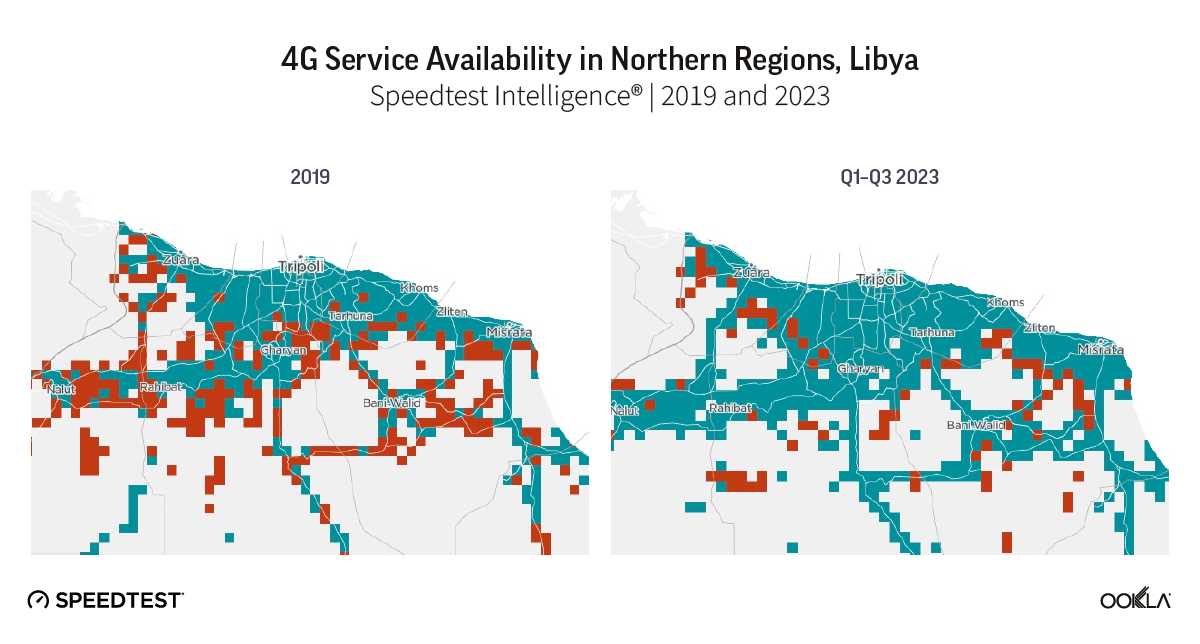
4G deployment gained momentum and the restoration of the telecoms infrastructure resumed thanks to LPTIC’s program launched in 2021 to extend LTE coverage to underserved areas thanks to cooperation agreements with foreign governments and telecoms groups. According to Speedtest Intelligence®, access to 4G service increased from 11.8% in 2019 to 76.8% during Q1-Q3 2023. Northern regions had particularly benefited from network coverage enhancements as shown in the map below where green squares show locations where 4G service is available and red squares where 4G service is unavailable.

This coverage expansion was accompanied by a boost to median download and upload speeds reaching 15.08 Mbps and 6.43 Mbps in Q2 2023, respectively. However, 4G network throughput is low compared to the performance of other countries featured in this article, suggesting that there is room to improve capacity.

Unfortunately, the deadly floods that struck the eastern part of the country in September 2023 are a significant setback. We expect network expansion and upgrade efforts will be delayed as funding will be directed toward relief efforts and the restoration of basic mobile services.

Maps of 4G Service Availability in Northern Regions, Libya | 2019 and 2023

The allocation of additional spectrum in Mauritius helped to improve 4G coverage and speed

Mauritius is an early adopter of 4G with a saturated mobile market (population penetration reached 160.0% in Q3 2023). The market has three active mobile network operators: incumbent operator Cellplus Mobile Communications (under my.t mobile), Emtel, and Mahanagar Telephone Mauritius Limited (MTML) (operating under the CHiLi brand).

Cellplus Mobile launched 4G in 2012 over the 1800 MHz band. It initiated a major network modernization project in 2017, which resulted in a 50% increase in data traffic in 2018 enabling 4G traffic to overtake 3G traffic for the first time. It achieved quasi-nationwide 4G coverage by mid-2019.

The second operator Emtel also launched 4G in 2012 and claimed its 4G network covered the whole island by end-2022. Lastly, MTML (CHiLi), introduced LTE services in 2015 and progressively expanded coverage until it reached 90% of the population by end-2022. This led to a 7% increase in monthly data traffic year-on-year in FY2022/2021.

Operators continued to improve 4G coverage and speed as they prepared to launch 5G. According to Speedtest Intelligence®, access to 4G service increased from 64.40% in 2019 to 96.3% during Q1-Q3 2023. During that period, Mauritius pulled further ahead than the other countries with 27.33 Mbps median 4G download speed in Q2 2023, overtaking Namibia which, until then, had the fastest download speed among the countries analyzed.

These achievements were partly driven by initiatives led by the Information and Communication Technologies Authority (ICTA) which continually encouraged the refarm and release of additional spectrum. For example, the 2100 MHz spectrum (1920‐1980 MHz paired with 2110‐2170 MHz) was reused for LTE and LTE-A services since 2018, after being used exclusively for 3G. ICTA also assigned 2×10 MHz of spectrum in the range 832MHz-862MHz and 791MHz-821MHz for LTE services in 2021, which helped to increase 4G coverage.

Access to additional spectrum and operators’ investment in Namibia helped to boost 4G coverage and performance

Mobile population penetration reached 110.7% in Q3 2023, behind other African markets with similar GDP. Similar to Libya, the market is a duopoly with two mobile operators controlled by a state company, Namibia Post and Telecommunications Holdings (NPTH): MTC, with an 86% market share, and Telecom Namibia (TN Mobile).

Market leader MTC launched a 4G LTE network over 1800 MHz in May 2012, initially for mobile broadband only. MTC then activated LTE-A in April 2016 contributing to boosting download speed, despite limited service availability in selected urban areas. MTC refarmed 2100 MHz for LTE in 2018 and was awarded 2x5MHz lots in the 900 MHz spectrum band in August 2021, but that was deemed insufficient to serve its large subscriber base. It initiated the ‘081EVERY1’ project to build additional base stations and upgrade 4G infrastructure in towns to provide 100% population coverage by the end of 2023. However, we understand that this objective has not been attained as of October 2023 (LTE coverage expanded to more than 68% of the population in 2022).

TN Mobile launched 4G in November 2013 and LTE-A in late 2019, using only 1800 MHz. In July 2022, the operator outlined a plan to invest more than $124 million over five years to modernize its network, starting with its national backbone, core network, and access technologies to boost population coverage and network QoS. Before that, TN Mobile had been deploying or upgrading mobile sites in selected rural and urban areas since 2019 to achieve 100% population 4G coverage by end-2023. However, the cost of competing with the dominating incumbent operator will likely make it difficult to achieve it.

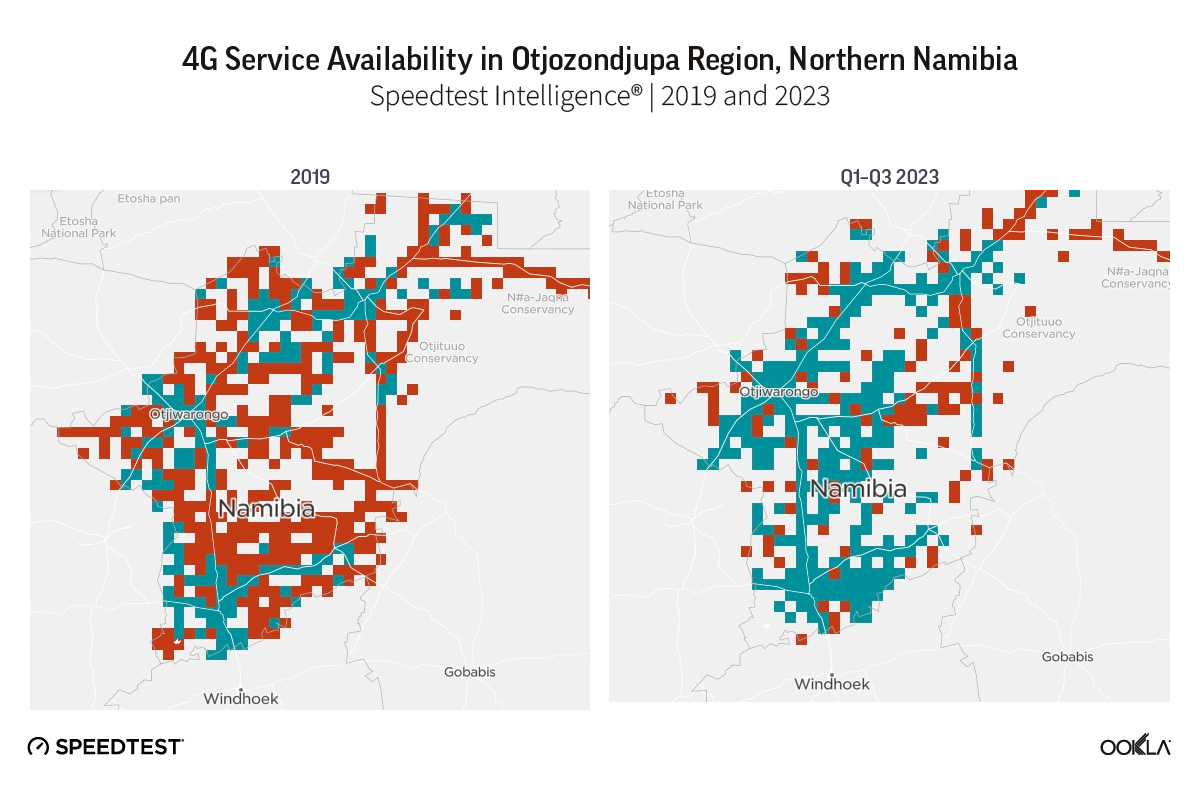
According to Speedtest Intelligence, 4G service availability in Nambia increased from 24.7% in 2019 to 76.6% over January-October 2023, with the Otjozondjupa region showing substantial improvement (see map below). However, according to the Communications Regulatory Authority of Namibia (CRAN), only seven out of fourteen regions were covered by 4G, calling for more private-sector investment to increase 4G footprint. To support these efforts, the CRNA kicked off the auction process for 700 MHz (703-788 MHz) and 800 MHz (790-862 MHz) frequency bands in February 2023. The spectrum was awarded in October 2023 to the two mobile operators and local ISP Loc8 Mobile for 4G and 5G services.

The three licensees should provide 4G and 5G services with at least 20 Mbps download speed and have to extend 4G coverage to at least 80% of the population in six out of the 14 regions. This suggests that operators will need substantial investments in network infrastructure to satisfy these coverage and speed requirements.

Maps of 4G Service Availability in Otjozondjupa Region, Northern Namibia | 2019 and 2023

Access to multiple spectrum bands helped operators in Nigeria to rapidly expand 4G network coverage

Nigeria is the largest market in Africa in terms of mobile connections with over 220 million mobile subscribers. The market peaked in 2020 and then contracted due to the implementation of the SIM registration policy. The market started recovering more in the second half of 2021 as previously-restricted subscribers obtained a new SIM through ID verification. Mobile penetration reached 90.3% in Q3 2023.

The market is highly competitive with three main players: MTN (38.7% share of subscribers in July 2023), Glo (Globacom) (27.82%), and Airtel (27.24%). 4G coverage increased rapidly to reach 80.9% at the end of 2022 though adoption peaked at around 25% before starting to fall as some customers migrate to 5G. 

Glo was the first main operator to introduce 4G services in 2016 over 700 MHz, which it then combined with 1800 MHz spectrum in 2019. It launched LTE-A in 2023 by combining  700 MHz, 1800 MHz, and 2600 MHz (which it acquired recently), and plans to deploy 4,000 LTE-A mobile sites in major towns and cities.

MTN launched 4G the same year using 1800 MHz and 2600 MHz bands. It then launched LTE-A by combining 2600 MHz and 1800 MHz in 2019. MTN then acquired 800 MHz spectrum to improve coverage 4G coverage which reached 83% in 2023. Its CAPEX (excluding right-of-use assets) increased by 18.1% in 2022 to around $470 million to accelerate 4G and 5G network expansion. In September 2023, it acquired an additional 10 MHz of spectrum in the 2600 MHz band to improve the capacity of its LTE network. 

Airtel was the last to launch LTE over 1800 MHz, before incorporating 2600 MHz in 2019 and 900 MHz in 2022, which helped to expand coverage to more than 463 locations in the country.

Maps of 4G Service Availability in Nigeria | 2019 and 2023

Operators faced several technical and operational challenges that impacted the quality of 4G connectivity in Nigeria. This was the result of the network infrastructure not being able to keep up with pent-up demand for mobile device services. Other factors also contributed to the deterioration of network quality including the limited access to continuous power supply, vandalism, and multiple taxes and levies. 

Furthermore, the Nigerian Communications Commission (NCC) and the government took a tough stand against operators for failing to meet QoS obligations or delaying tax payments, resulting in significant fines between 2012 and 2016. 

The NCC started adopting less punitive measures against operators recently and being more actively engaged with them on QoS issues, following the South African model. The government also reversed its decision to impose a 5% excise duty on telecom services in 2023. These measures should help somewhat operators weather the current challenging macroeconomic climate.

The regulator’s efforts helped improve 4G coverage in Tanzania but data services remain unaffordable to most of the population

Tanzania has a crowded mobile market with seven operators and fierce price competition. The introduction of biometric SIM identification slowed market growth in 2020 (the market contracted by 9.5 million) before recovering in 2021. Mobile penetration reached 93.9% in June 2023.

Three operators dominate the market: Vodacom (30% of subscribers in June 2023), Airtel (27%), and third-placed Tigo (27%), which was acquired by a consortium led by Axian Telecom in April 2022.

Vodacom launched 4G commercially in 2016. It uses 700 MHz and 1800 MHz spectrum bands. It reported having deployed 2315 4G sites by the end of 2022 (up from 1814 in September 2021) and that broadband coverage reached 93% of the population.

Airtel launched LTE services over 1800 MHz in the capital Dodoma in November 2019 then expanded to other cities in 2020. It announced the deployment of its ‘Supa 4G’ LTE-A network in 2021 which uses 700 MHz and 2100 MHz in 500 cities and villages. It claims to have rolled out LTE-A in 80% of its mobile sites by April 2022. Airtel was also allocated an additional spectrum in the 1800 MHz band in 2019. 

Tigo launched LTE services in Dar es  Salaam in April 2015 over 800 MHz. It progressively expanded its network to reach 26 regions by February 2022. It launched LTE-A in September 2018 over 800/1800 MHz in a limited number of cities. In May 2022, Axian Telecom announced plans to invest $500 million in infrastructure over the next five years to improve 4G coverage and QoS, especially in rural areas, and to support the country’s digital transformation and bridge the digital divide. 

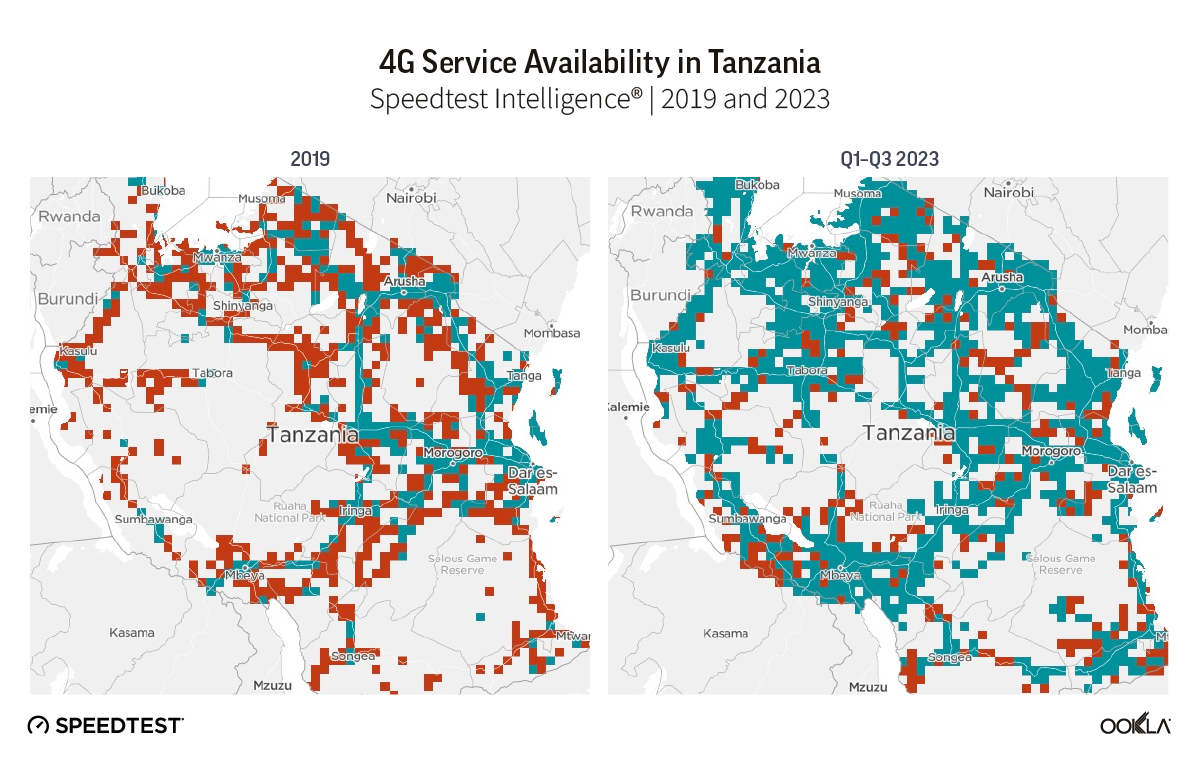
Maps of 4G Service Availability in Tanzania | 2019 and 2023

The Tanzania Communications Regulatory Authority (TCRA) has been less punitive than before. For example, in 2019, it fined the six operators $2.6 million for failing to meet QoS standards. However, in 2021, the TCRA ordered the operators to invest $16.4 million to address network issues rather than issue a new fine

The government also freed up the 700 MHz band and auctioned it off in 2018 to enable operators to provide 4G data services to more communities. Four years later, another auction was completed for 2300 MHz, 2600 MHz, and 3500 MHz bands to be used for 4G and 5G. More recently, the government launched the ‘Digital Tanzania’ project in May 2023 in partnership with mobile operators and with support from the World Bank to reach 80% broadband population penetration by 2025. Operators will use the universal access fund to deploy 758 mobile towers to provide data services to 1407 villages and over 8.5 million potential users. 

While 4G coverage reached 65%, Tanzania has the lowest 4G share of connections among the countries reviewed in this article, at 17.8% in Q2 2023. Furthermore, according to TCRA, only 27% of Tanzanians owned smartphones and mobile internet-enabled devices in 2022. 

This suggests that many consumers still can not afford data-enabled handsets and that data tariffs remain out of reach for most Tanzanians, given low income levels, since most of them live in rural areas and work in the agriculture sector.

The government plays a crucial role in progressing the national broadband connectivity agenda in Zimbabwe

According to the Postal and Telecommunications Regulatory Authority (POTRAZ), mobile penetration reached 91.9% at the end of Q2 2023. Mobile data connectivity is the most common way to access internet services. 3G and 4G services represented more than 98% of data connections in the country, and the main driver for internet penetration.

The market is dominated by Econet which controls 72.3% of subscriptions as of June 2023. It launched 4G over 1800 MHz in August 2013, but adoption was muted because of limited coverage, and expensive tariffs. Fast forward to October 2022, and 4G network reached 39% of the population. Econet has the highest number of LTE base stations in the country, 54.3% of the 1962 stations in June 2023. In September 2023, it announced the deployment of 30 new 4G sites by March 2024 and an upgrade of all existing 2G sites to 4G in the eastern provinces. 

NetOne is a state-owned operator and the second-largest player with a 25.5% market share in June 2023. It launched 4G in November 2014, using 1800 MHz before adding 700 MHz in 2016. It resumed deployment of LTE base stations in rural areas in 2021, which helped it to control more than 44.5% of total 4G towers in the country (867 base stations) and grow its data subscribers.

Telecel has been struggling to maintain its market share over the past few years. It initially opted not to launch LTE along with competitors because it believed that the market was not ready. It eventually introduced LTE in late 2017 but had just 17 LTE base stations according to the regulator by mid-2022.

The government announced its plan to raise internet penetration to above 75.0% by 2025, up from 65.2% in Q2 2023. It announced the national broadband program covering 2023–2030 to reduce the cost of broadband access to 2% of the average monthly income from 10.1%. The government is committed to raising the funds for this plan which includes the deployment of fibre infrastructure for broadband access and backhaul. It also plans to deploy 300 base stations across the country to be shared by the operators to support mobile services in rural areas using the universal services fund.

This is a vital initiative as operators are struggling to finance their network deployment and upgrade their networks due to currency depreciation, and limited access to foreign currency to pay for equipment. Their revenues are also down due to the reduction in consumer spending as a result of inflation and reduced disposable income, which is impacting their ability to finance their infrastructure development plan.

It is clear, from the examples discussed above, that the role of governments and regulatory authorities is crucial to making mobile data services accessible in Africa. Operators need sufficient spectrum, favorable policies and regulations, and the support they need to expand 4G infrastructure. In light of the current macroeconomic and operational challenges hindering the adoption of 4G, such as spectrum availability, coverage requirements, and handset affordability, overcoming these challenges will help with the next phase of 5G development.

Connectivity is crucial to economic development, competitiveness, and innovation in the Middle East and Africa region. Ookla’s crowdsourced insights and data help policymakers make informed decisions on how to use spectrum efficiently and improve network performance and user experience. Ookla also regularly hosts events in the region to help regulators share knowledge and experiences on how to close the digital divide. Regulatory officials from Jordan, Palestine, Iraq, Qatar, Bahrain, and Libya attended the last regulatory summit in June 2023 in Jordan.

Ookla retains ownership of this article including all of the intellectual property rights, data, content graphs and analysis. This article may not be quoted, reproduced, distributed or published for any commercial purpose without prior consent. Members of the press and others using the findings in this article for non-commercial purposes are welcome to publicly share and link to report information with attribution to Ookla.
| September 4, 2019

In-Depth Analysis of Changes in World Internet Performance Using the Speedtest Global Index

A lot has changed in the two years since 2017 when we first began ranking mobile and fixed broadband speeds of countries around the world with the Speedtest Global IndexTM. 5G is being deployed around the world and fiber continues to make gigabit speeds a reality in more and more countries. We’ve been tracking it all and are here to report on how much speeds have increased, which countries are leading internet performance and which are falling behind, and what trends we see across continents.

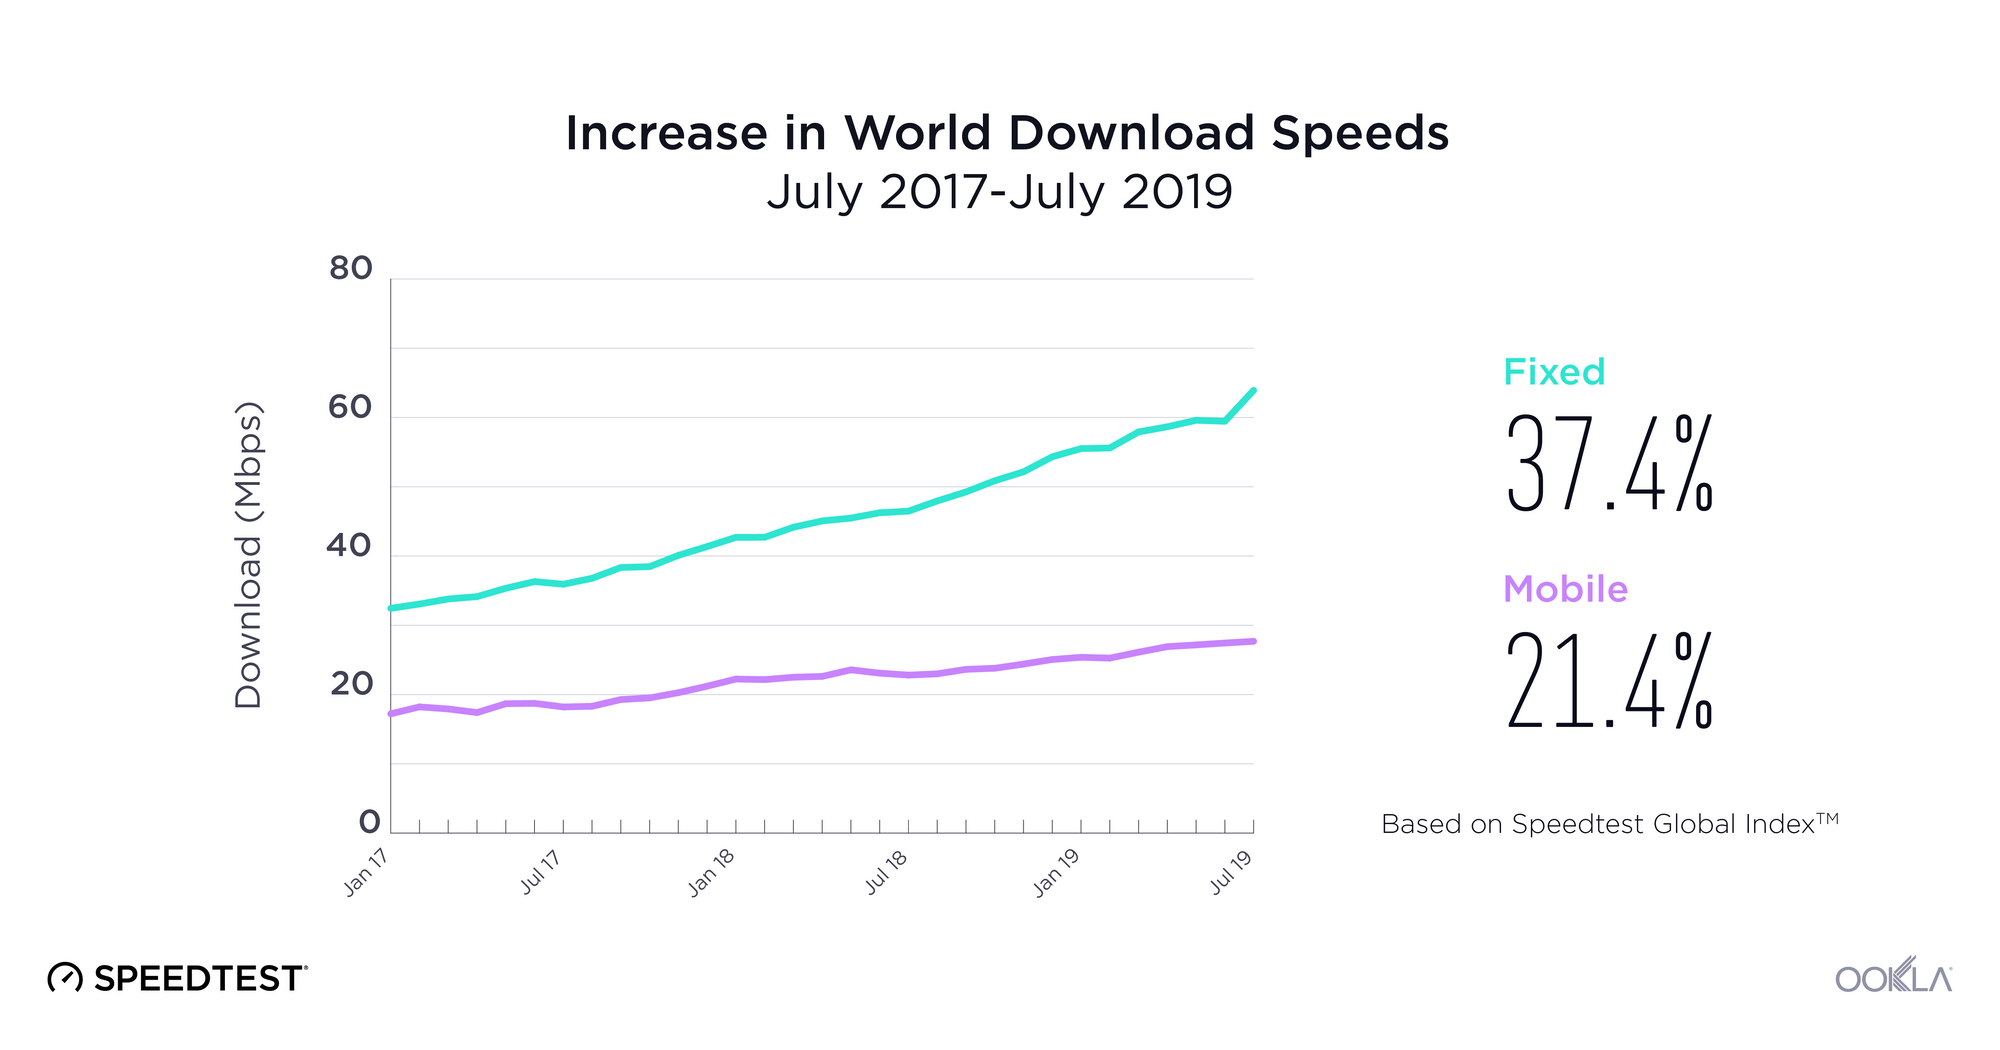
World mobile speed increased 21.4% with fixed broadband up 37.4%

World-Download-Speeds-2019-OG2

Looking just at the last year, the world’s mean download speed over mobile increased 21.4% from 22.81 Mbps in July 2018 to 27.69 Mbps in July 2019. Mean upload speed over mobile increased 18.1% from 9.13 Mbps to 10.78 Mbps. The world average for download speed over fixed broadband increased 37.4% from 46.48 Mbps in July 2018 to 63.85 Mbps in July 2019. Mean upload speed over fixed broadband increased 48.9% from 22.52 Mbps to 33.53 Mbps.

Shake-ups in the country rankings for internet performance

Fastest-Countries-Mobile-2018-2019

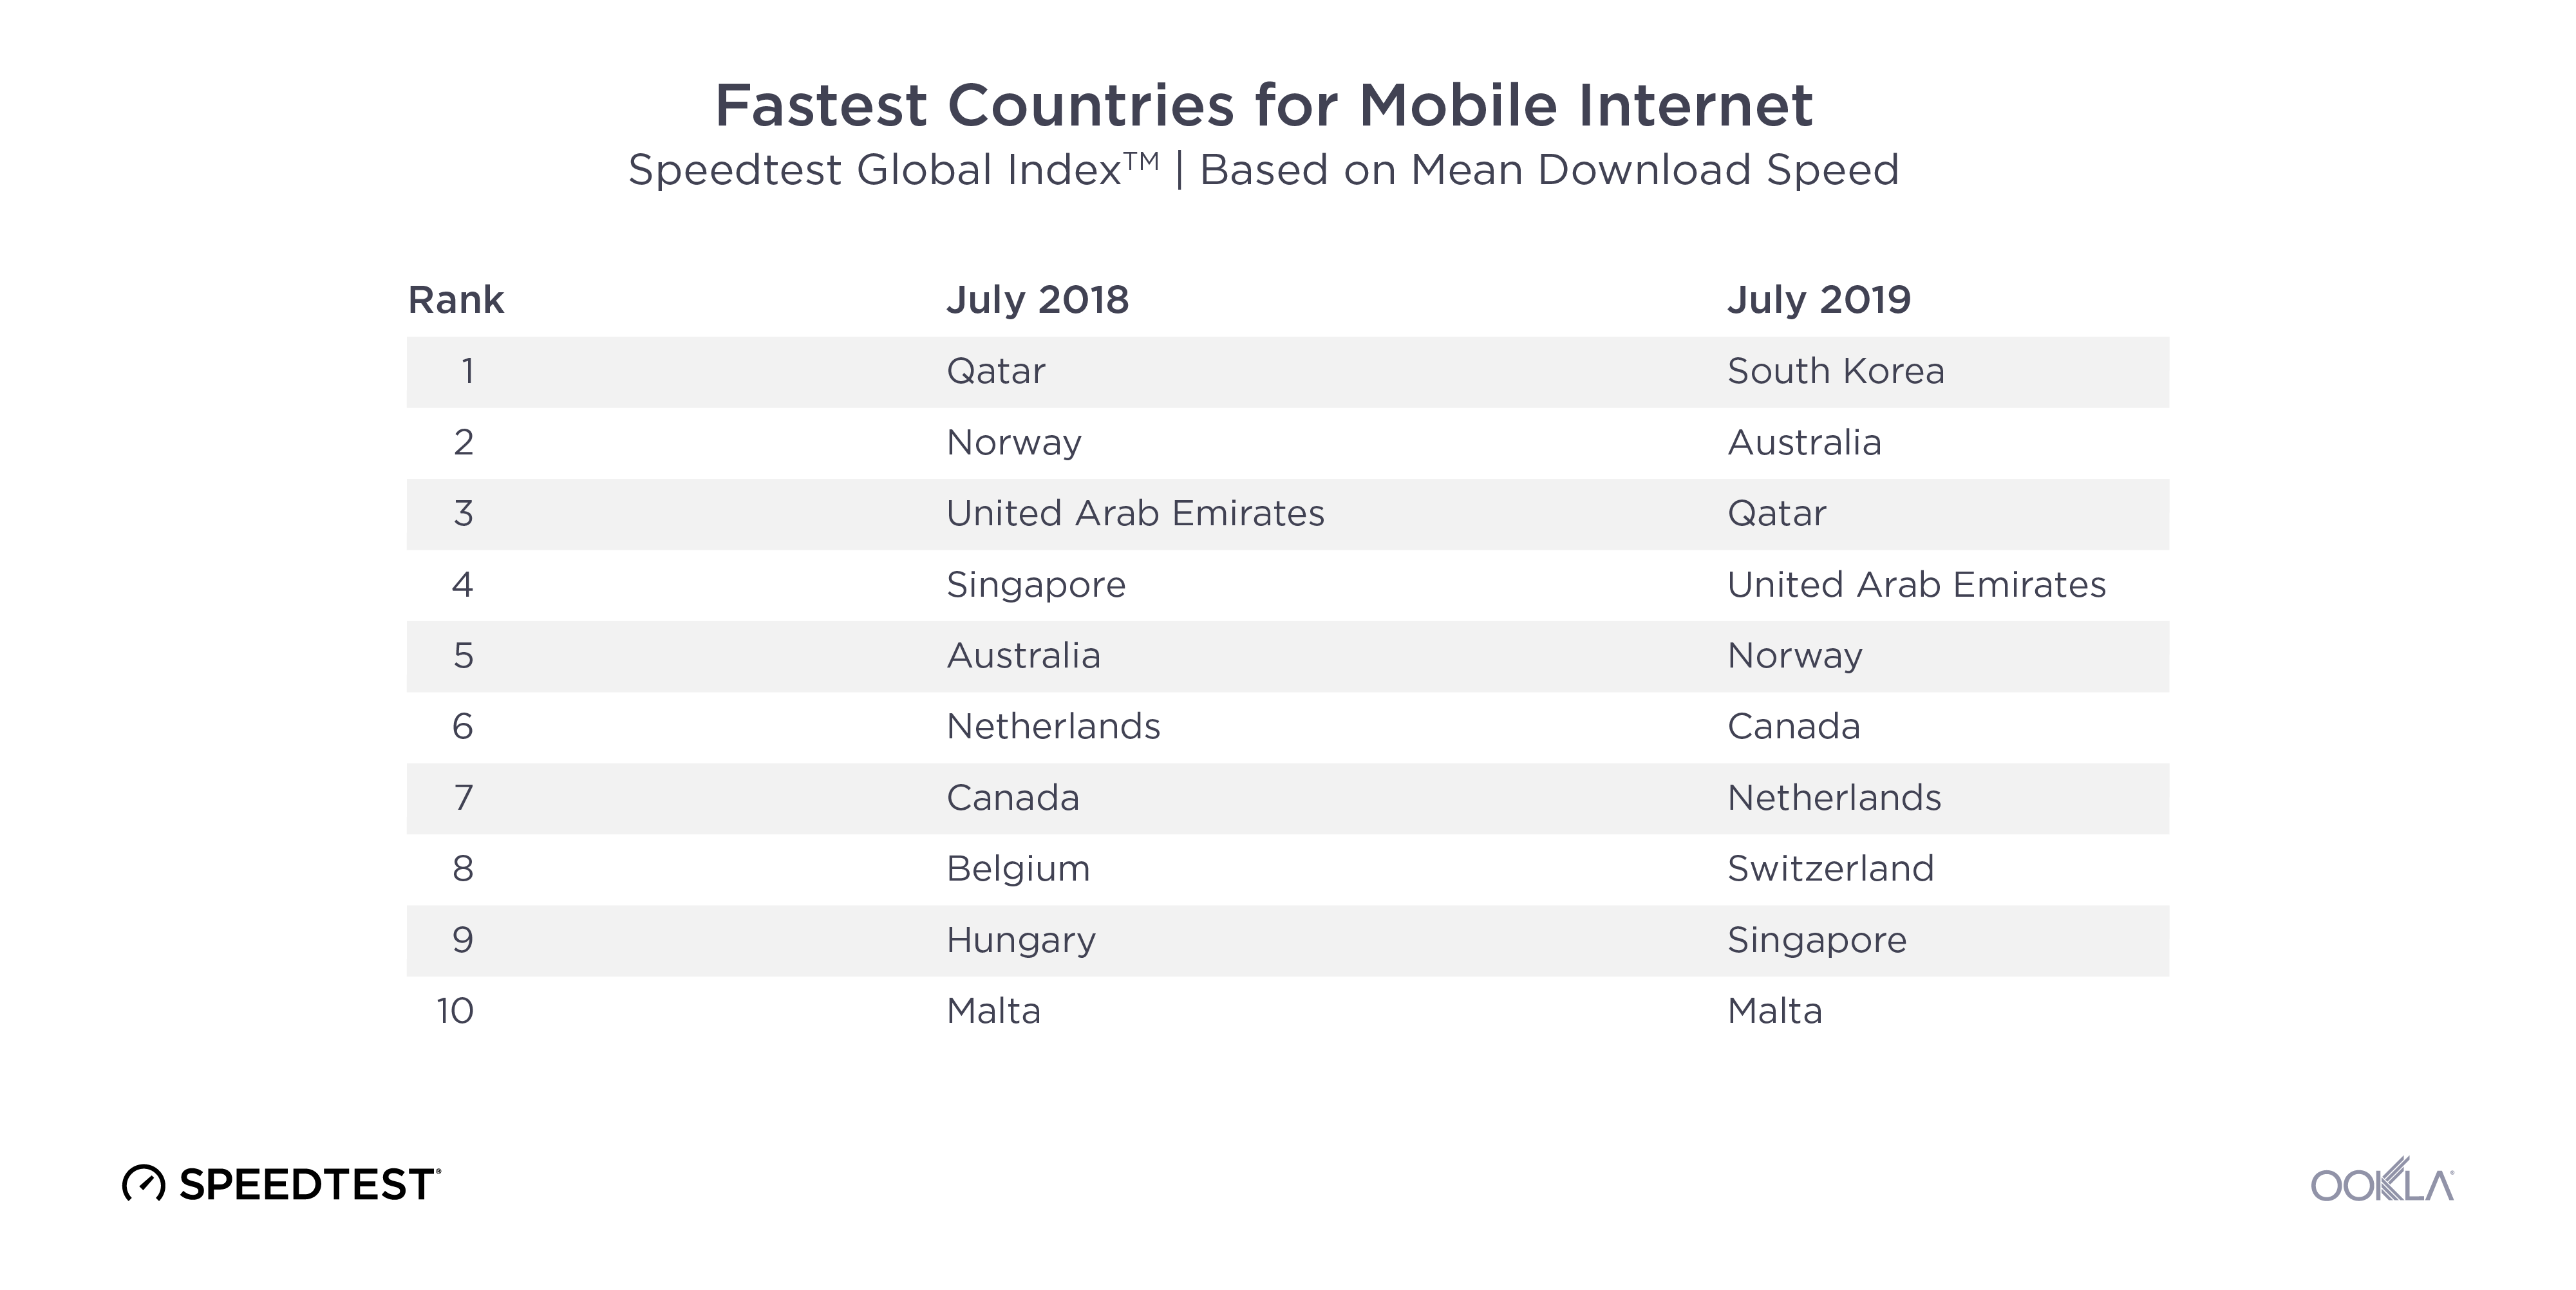
Mobile speeds in the fastest countries have skyrocketed in the past year which has dramatically shifted the rankings. South Korea, which was not even in the top ten a year ago, saw a 165.9% increase in mean download speed over mobile during the past 12 months, in large part due to 5G. Switzerland’s mean download speed increased 23.5%. Canada’s was up 22.2%, Australia 21.2%, the Netherlands 17.3%, UAE 11.1%, Malta 10.3% and Norway 5.8%. Qatar remained in the top ten, although the country’s mean download speed over mobile actually dropped 1.4% from July 2018 to July 2019.

Individual mobile operators can make a huge difference in a country’s speeds. In 2017 we were excited to see Telenor uncap their mobile speeds, which drove Norway to the top of the Speedtest Global Index. A big part of South Korea’s mobile success in the past year is the way KT, LG U+ and SK Telecom banded together to release 5G at the same time. Switzerland has also benefited from 5G and Sunrise leads the country with 262 5G deployments across the country while Swisscomm has 52.

Fastest-Countries-Fixed-2018-2019

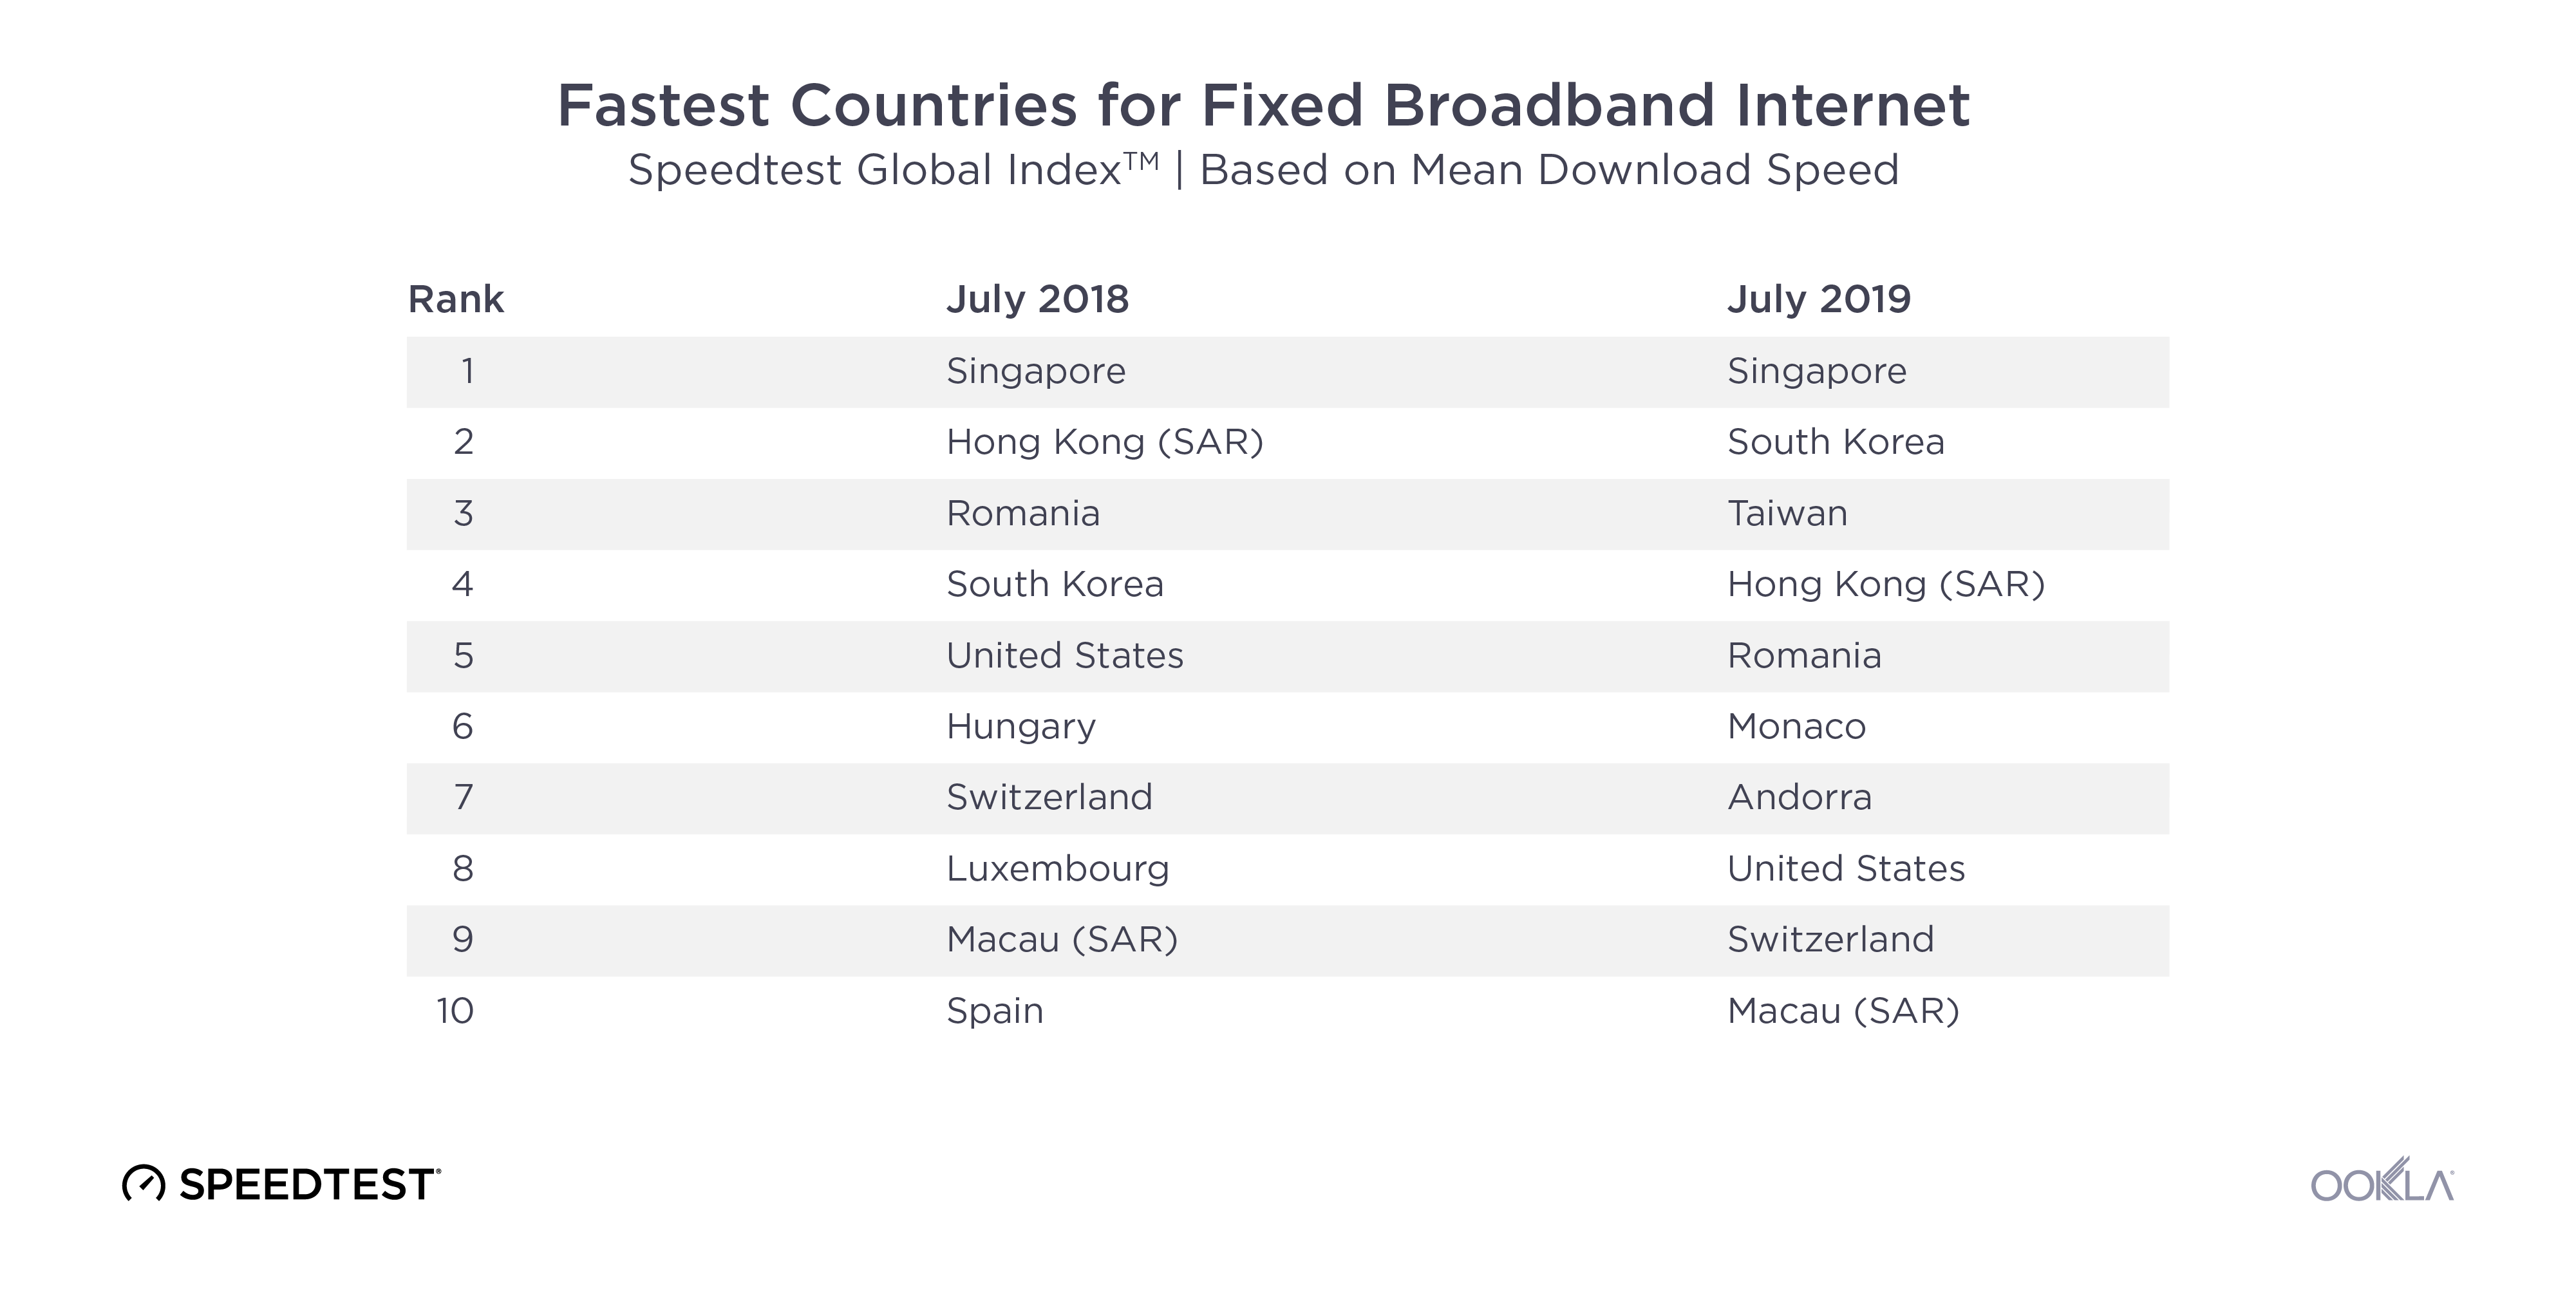
Fixed broadband rankings on the Speedtest Global Index have not changed as dramatically during the past 12 months as those on mobile. Singapore remains the fastest country with an increase in mean download speed over fixed broadband of 5.6%. Taiwan had the largest jump in speeds among the top 10 with a 166.5% improvement in fixed download speed between July 2018 and July 2019. Mean download speed over fixed broadband increased 52.4% in South Korea, 26.4% in Macau, 21.7% in Romania, 21.0% in Switzerland, 19.3% in the United States and 3.5% in Hong Kong.

Monaco and Andorra did not have enough tests to qualify for the Speedtest Global Index one year ago, but massive fixed broadband improvements in both countries inspired us to lower our test count threshold for inclusion and also share these smaller countries’ success stories.

Technologies paving the way: 5G and gigabit

The presence of 5G is not enough to change a market

As discussed above, 5G has the potential to rocket a country to the top of the mobile rankings on the Speedtest Global Index. In practice, we’ve seen 5G speeds that were over 1000% faster than those on LTE.

Mobile-Download-Speeds-by-Country

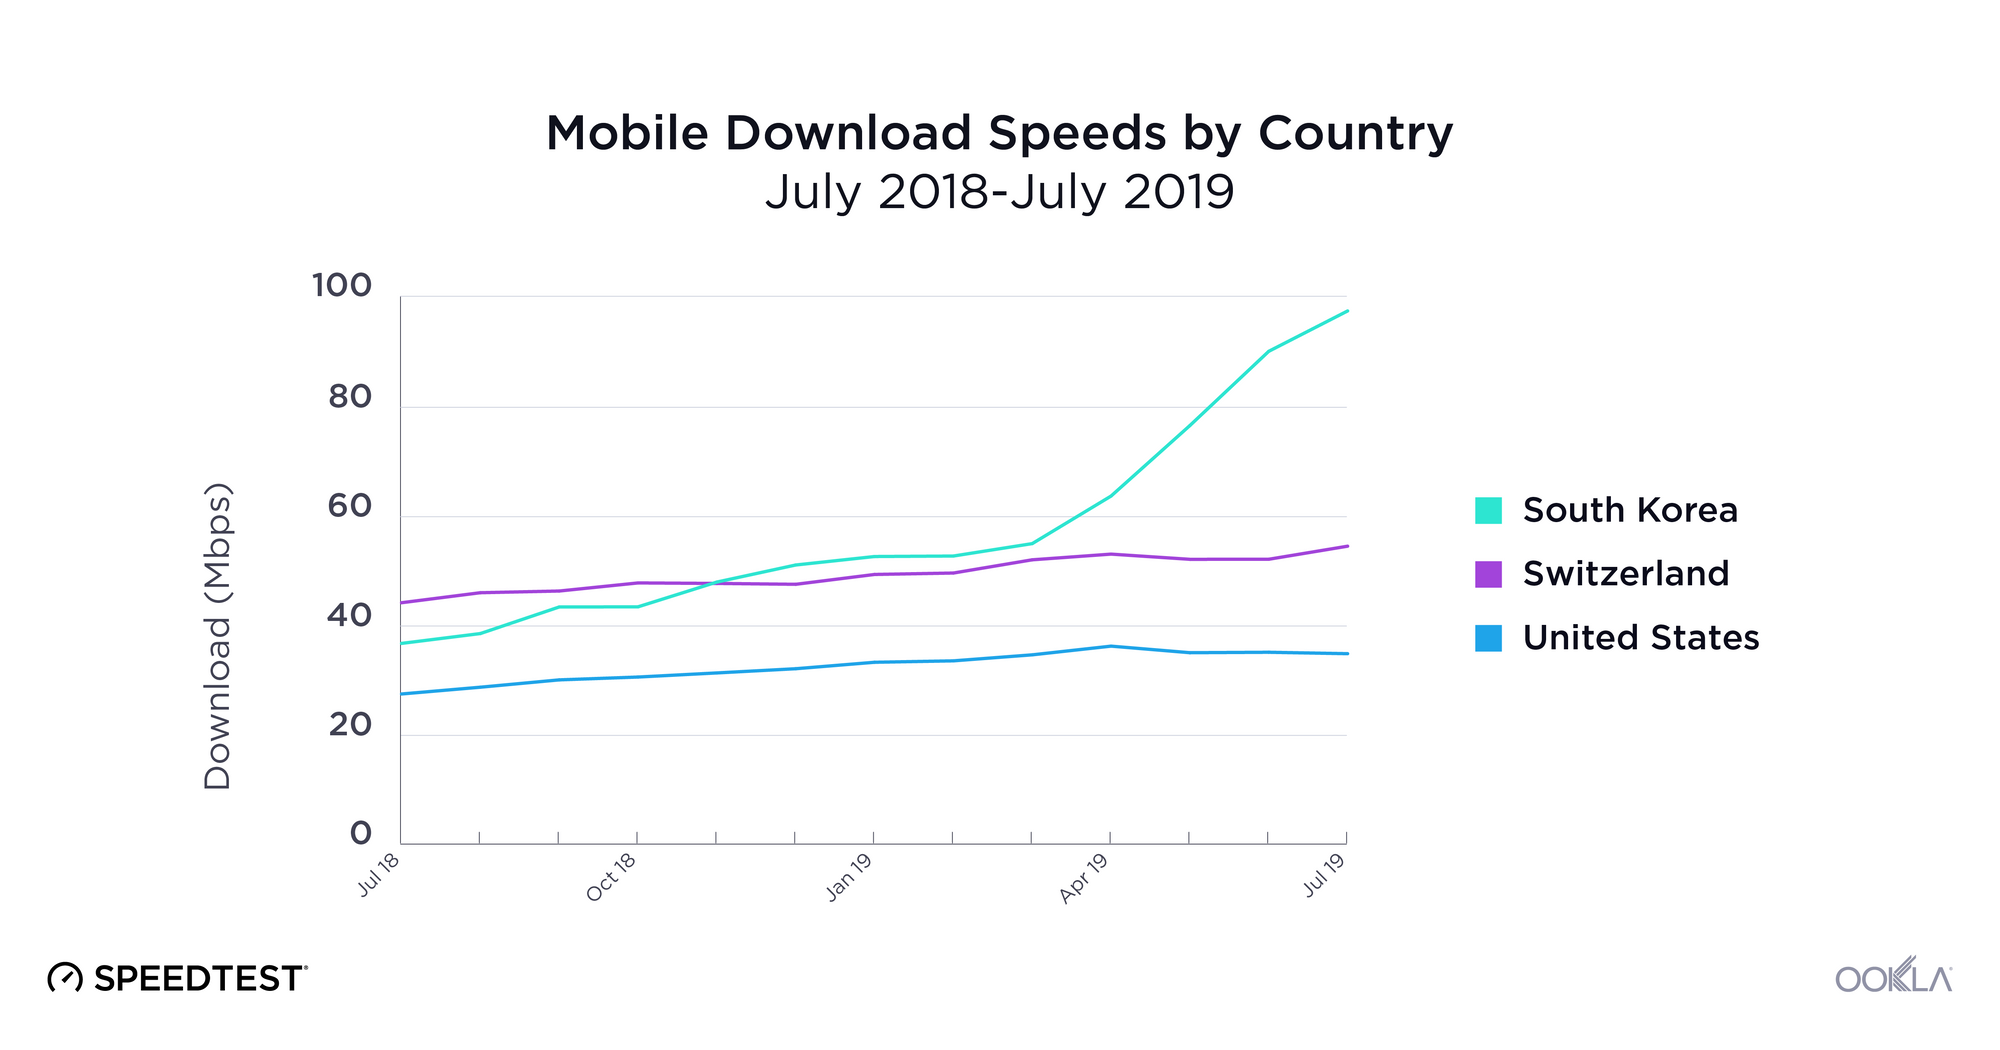
In reality, though, unless 5G is commercially available widely across a country and from all mobile operators (as was the case in South Korea), the change in speeds at the country level is not that significant. Though commercial 5G was launched widely across Switzerland by Sunrise and Swisscom in April 2019, the country’s mean download speed only increased 2.8% in the three months since. The average mobile download speed in the U.S. has actually declined slightly since 5G was initially deployed. This is because 5G is still only available in a very limited number of markets to consumers with 5G-capable devices.

Visit the Ookla 5G Map for the latest on 5G deployments across the globe.

Gigabit is a game-changer, if you can get it

Unlike 5G, fiber connections have been rolling out since 2007, opening up the possibility of gigabit-speed fixed broadband. That said, it’s costly and time-intensive to lay miles and miles of fiber so progress has varied widely across the globe.

Gigabit-Test---Performance_Singapore-1

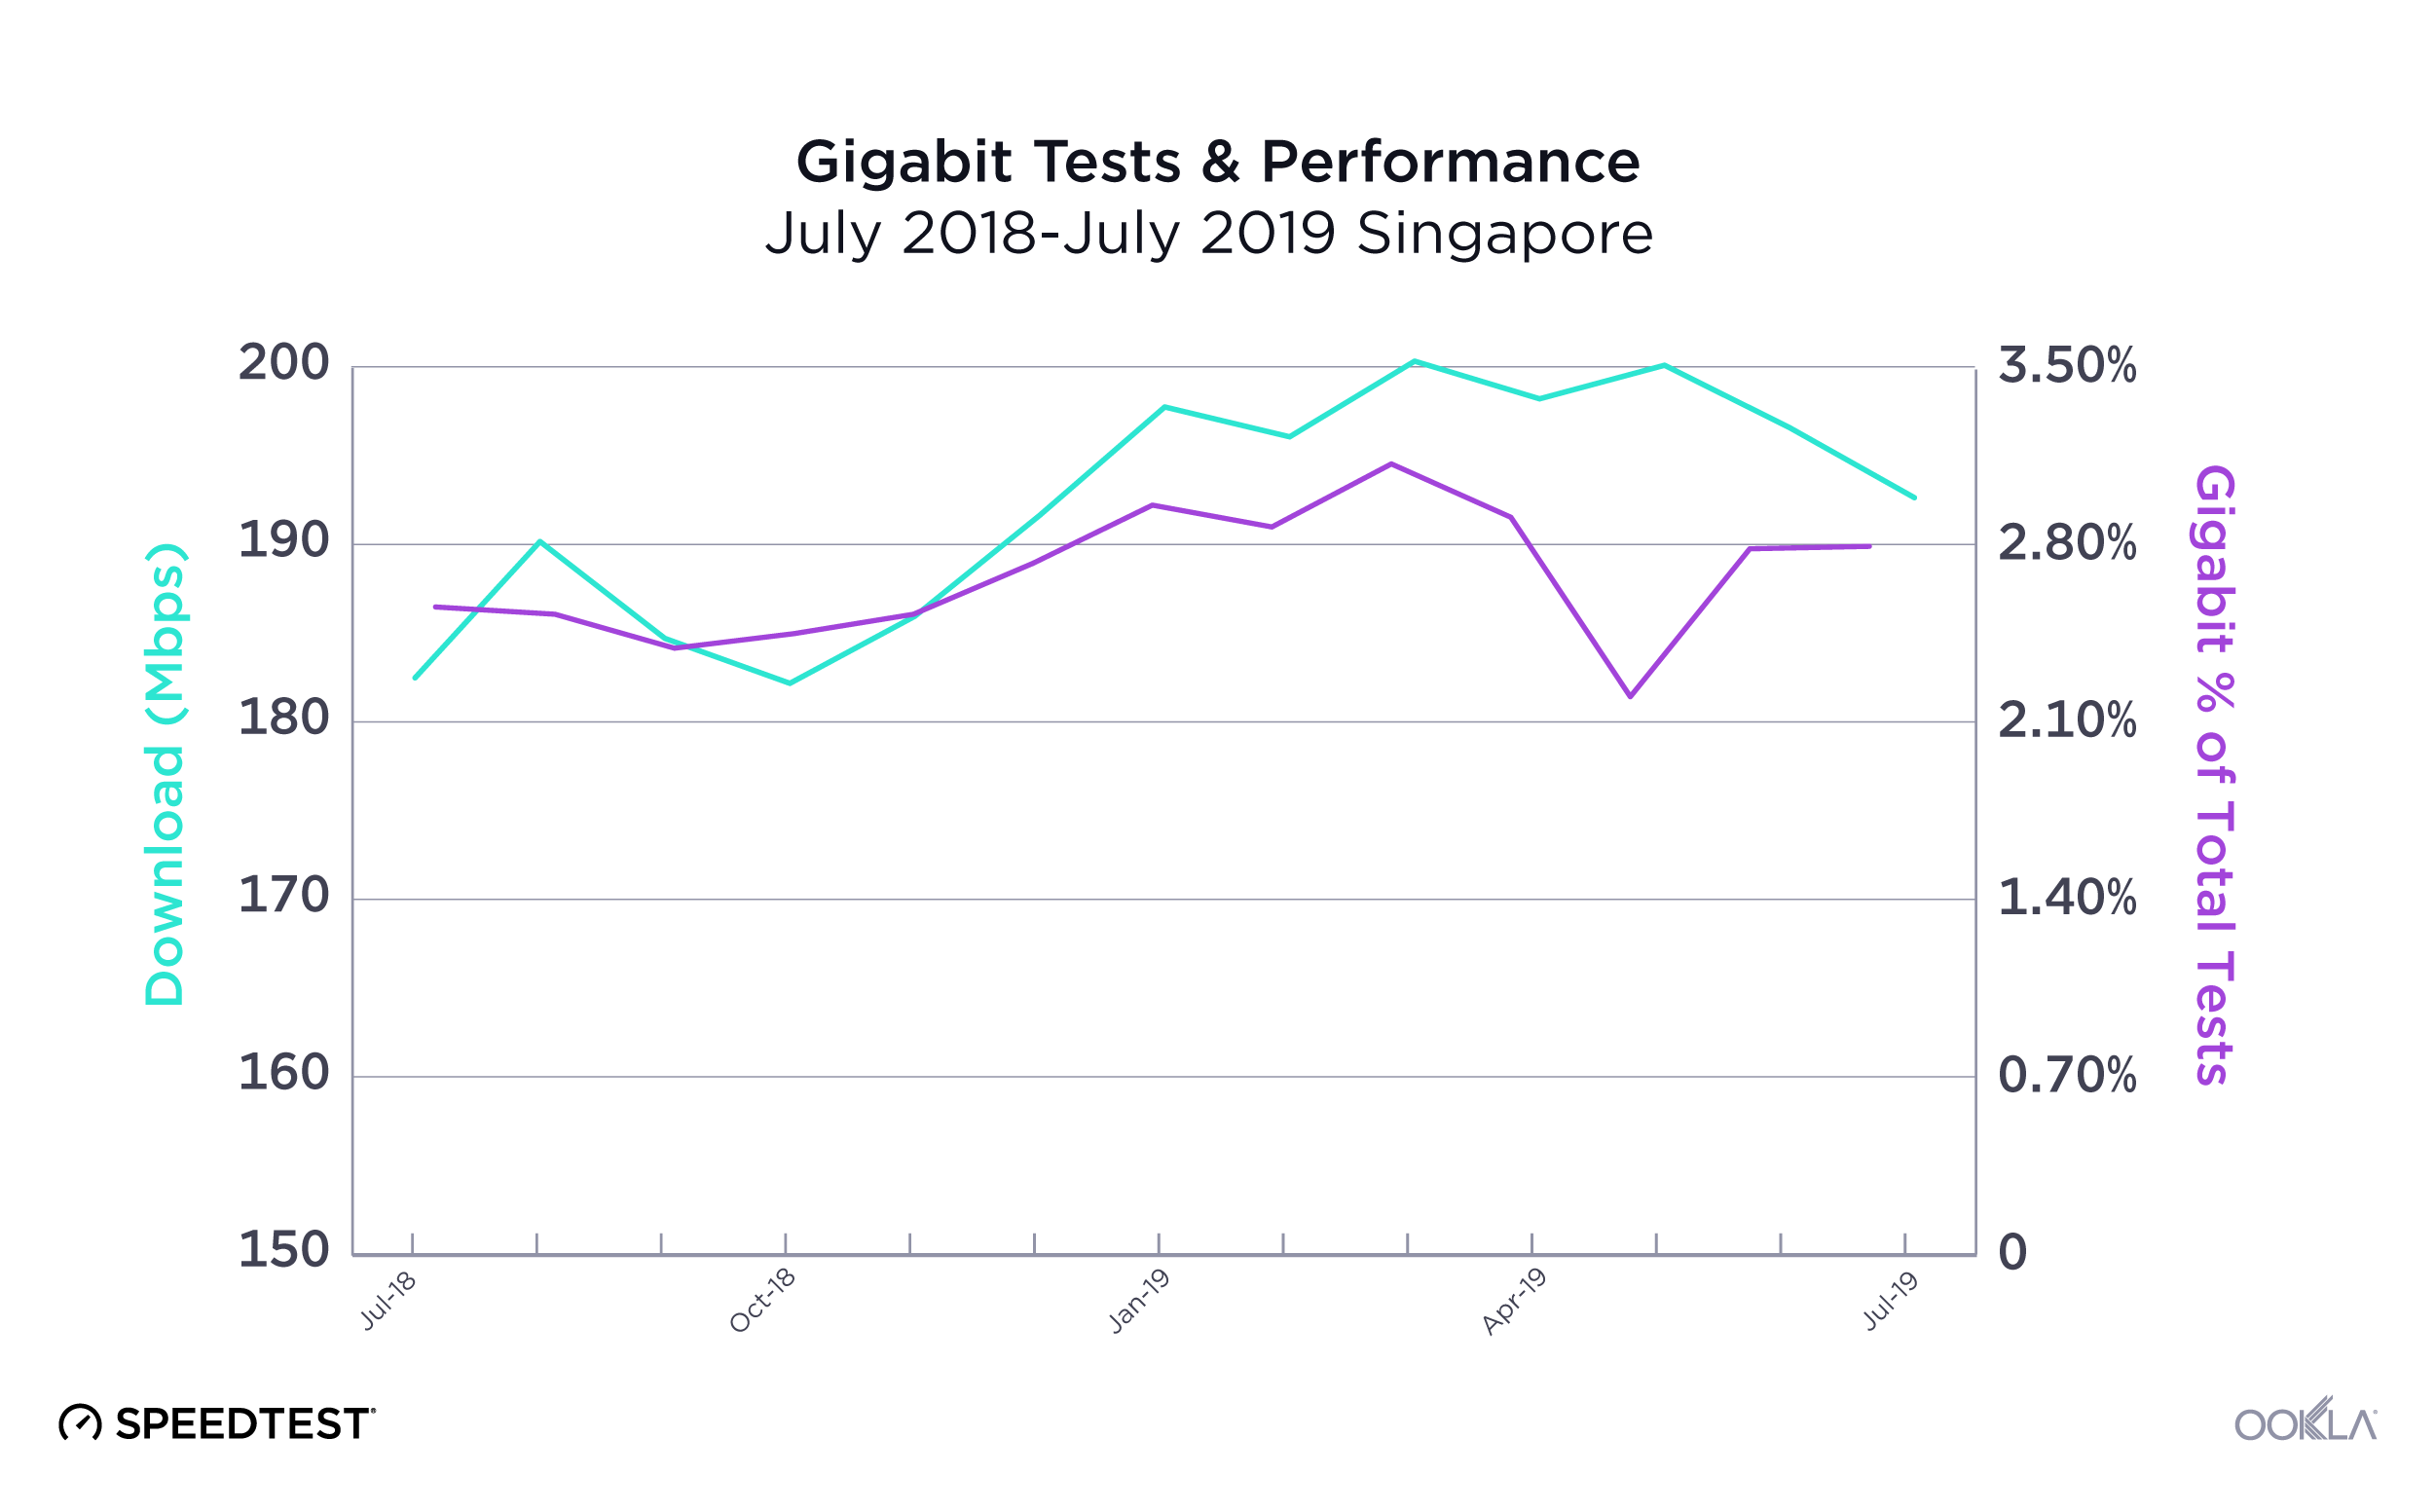
Geographically small countries like Singapore have the advantage when it comes to fiber, because It’s easier and cheaper to lay fiber optic cable across the country’s small footprint. Singaporean internet service providers (ISPs) have used this advantage to go beyond mere gigabit and offer connections as fast as 10 Gbps. This is reflected both in Singapore’s dominance of the fixed rankings on the Speedtest Global Index and in the fact that 2.87% of their total Speedtest results over fixed broadband are gigabit-speed (800 Mbps or higher).

Gigabit-Test---Performance_Brazil-1

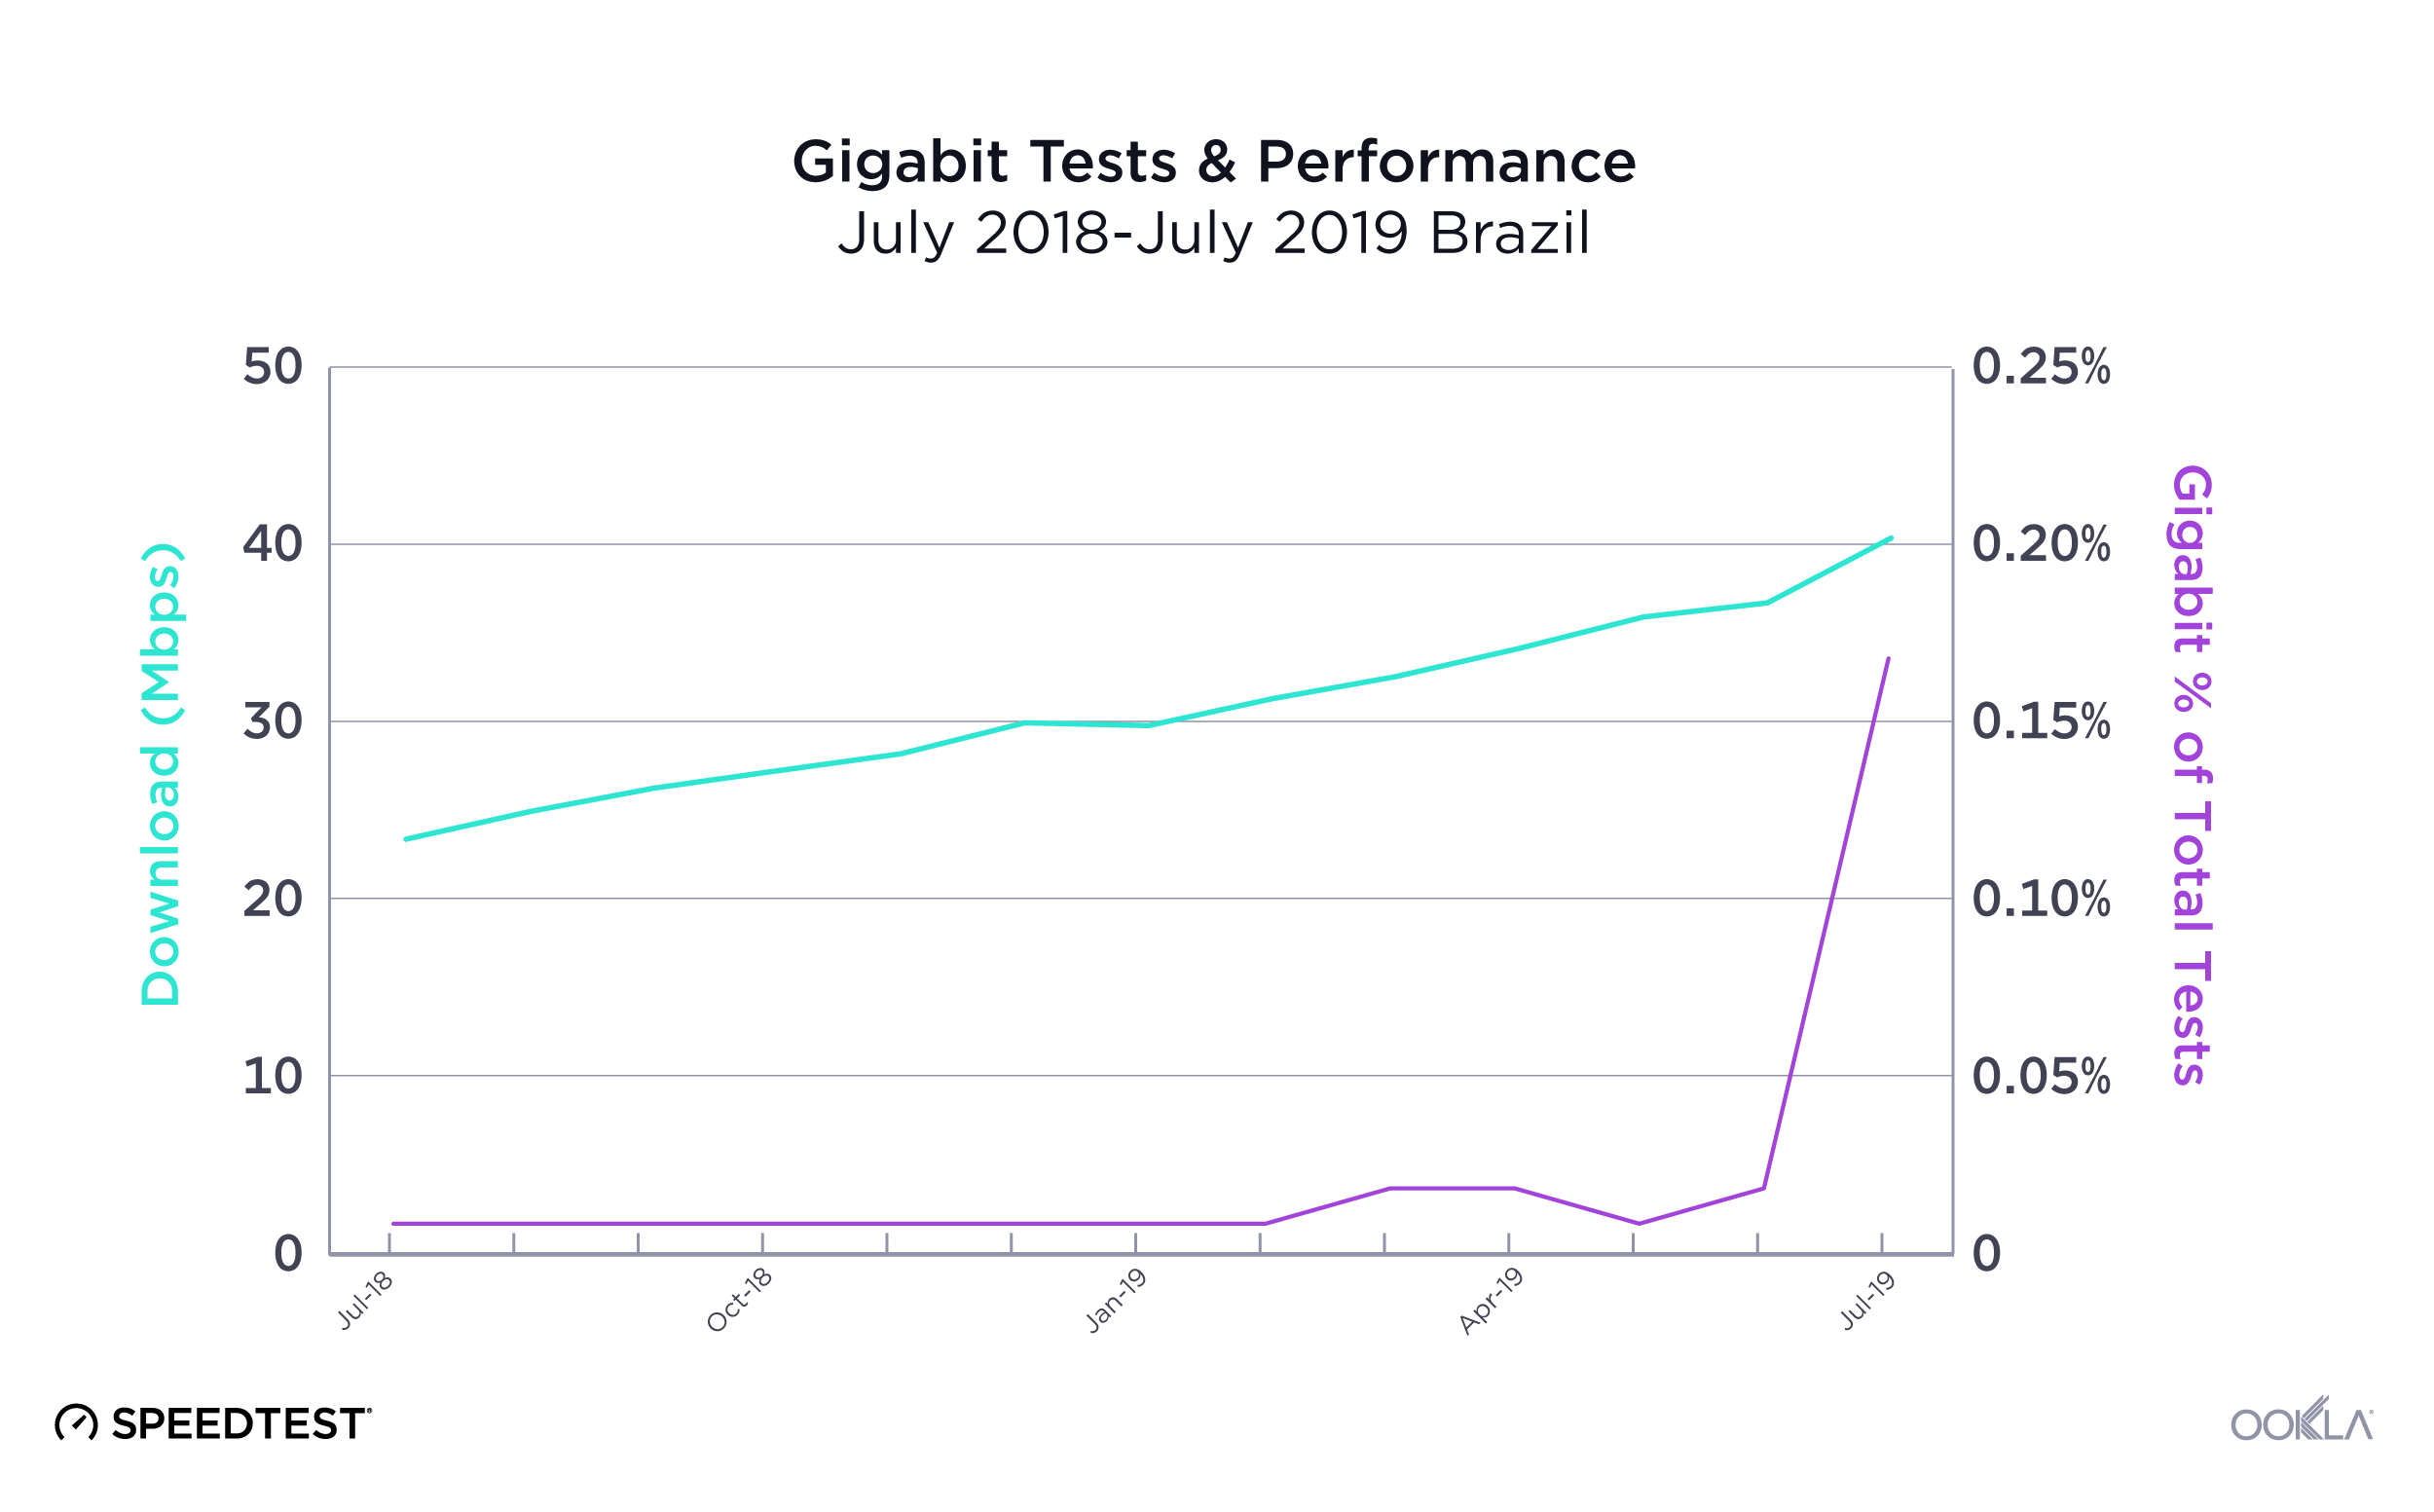
Brazil offers a good contrast for how difficult it can be for gigabit to reach the masses. While the first Brazilian ISP to offer fiber-to-the-premises (FTTP) initially did so in 2007, easy access to gigabit speeds was slow to follow. However, that may be starting to change. Between June and July 2019 we saw a large uptick in gigabit-speed results in Brazil, where the proportion of gigabit speed tests increased from 0.02% of total fixed broadband tests to 0.17%. This corresponded with a large increase in mean download speed at the country level.

Comparing world mobile and fixed broadband at a glance

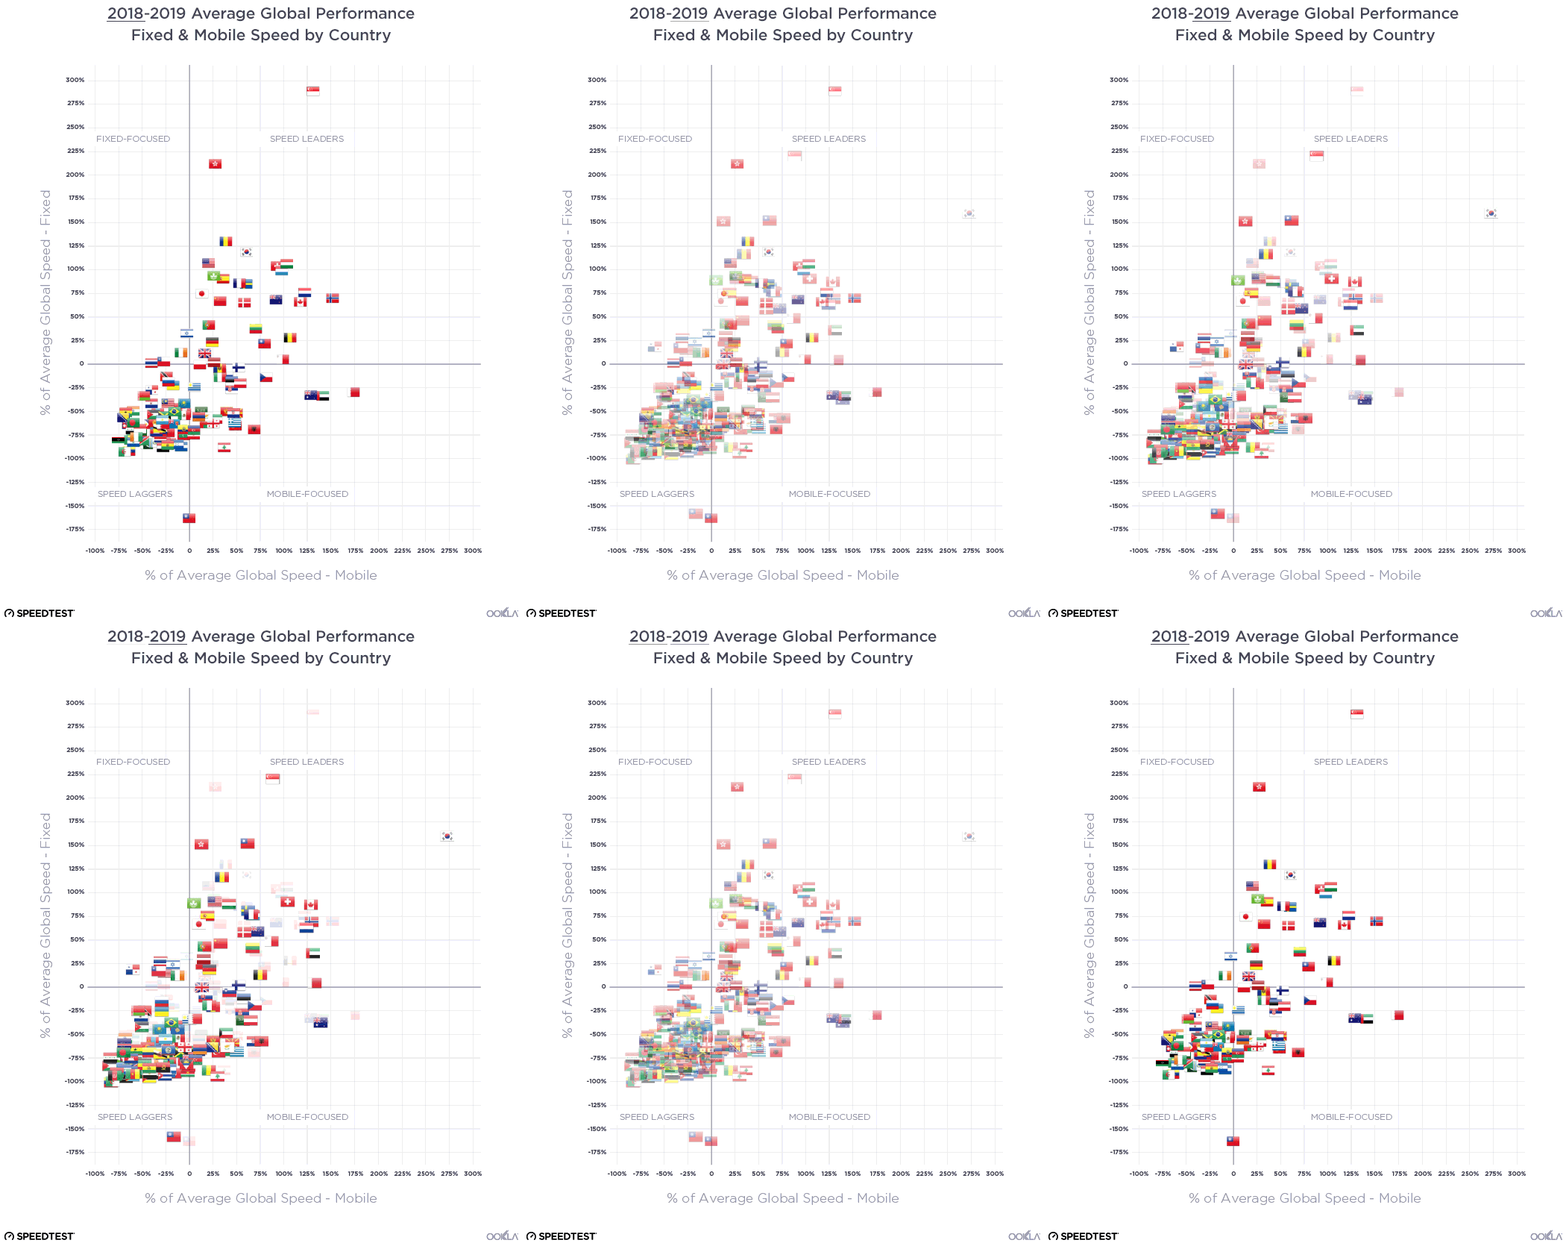
We were curious to see just how different internet performance experiences were around the world, so we plotted average mobile download speed against average download speed on fixed broadband. All of the graphs below use a percentage difference from the global average, a number that changed between 2018 and 2019.

fade-Performance-vs-Global---Quadrant-All

Speed Leaders

There was not much change in the list of countries that showed above-average download speeds on both mobile and fixed broadband between July 2018 and July 2019, the “Speed Leaders.” What did change was that fixed broadband speeds increased significantly enough among the group to bring the whole pack closer to Singapore and Hong Kong. On the mobile axis, South Korea’s major increase in download speed made that country more of an outlier, pushing the boundaries of what great performance can look like.

Fixed-Focused countries

Between July 2018 and July 2019 we saw the number of countries considered to be “Fixed-Focused” (having faster download speeds over fixed broadband than the world average while their average mobile download speeds were slower than average) increase. Ireland was the only country that solidly fit this category in 2018. Thailand and Chile started near the midline for fixed speeds and below-average for mobile speeds in 2018. 2019 found both countries squarely in the Fixed-Focused category. Israel also edged into this category as their mobile download speed fell between July 2018 and 2019.

Mobile-Focused countries

The “Mobile-Focused” category saw the most movement between July 2018 and July 2019 as some countries (the UAE and Qatar) increased their fixed speeds sufficiently to join the Speed Leaders. Meanwhile, Bosnia and Herzegovina’s mobile download speed increased year-over-year to move them into the Mobile-Focused quadrant. Georgia’s mobile download speed decreased enough to move them from Mobile-Focused to Speed Laggers.

It will be interesting to see how many of these Mobile-Focused countries double down on their mobile investments and explore 5G alternatives to fixed broadband.

Speed Laggers

No country wants to be in the position of having slower than average mobile and fixed broadband speeds. We saw 57 countries in this “Speed Laggers” quadrant in July 2018 and 78 in July 2019. This increase is mostly due to our expansion of the number of countries we consider for the Speedtest Global Index based on test count. There were enough countries in this category that we’ve considered them separately by continent below.

Regional views of mobile and fixed broadband performance

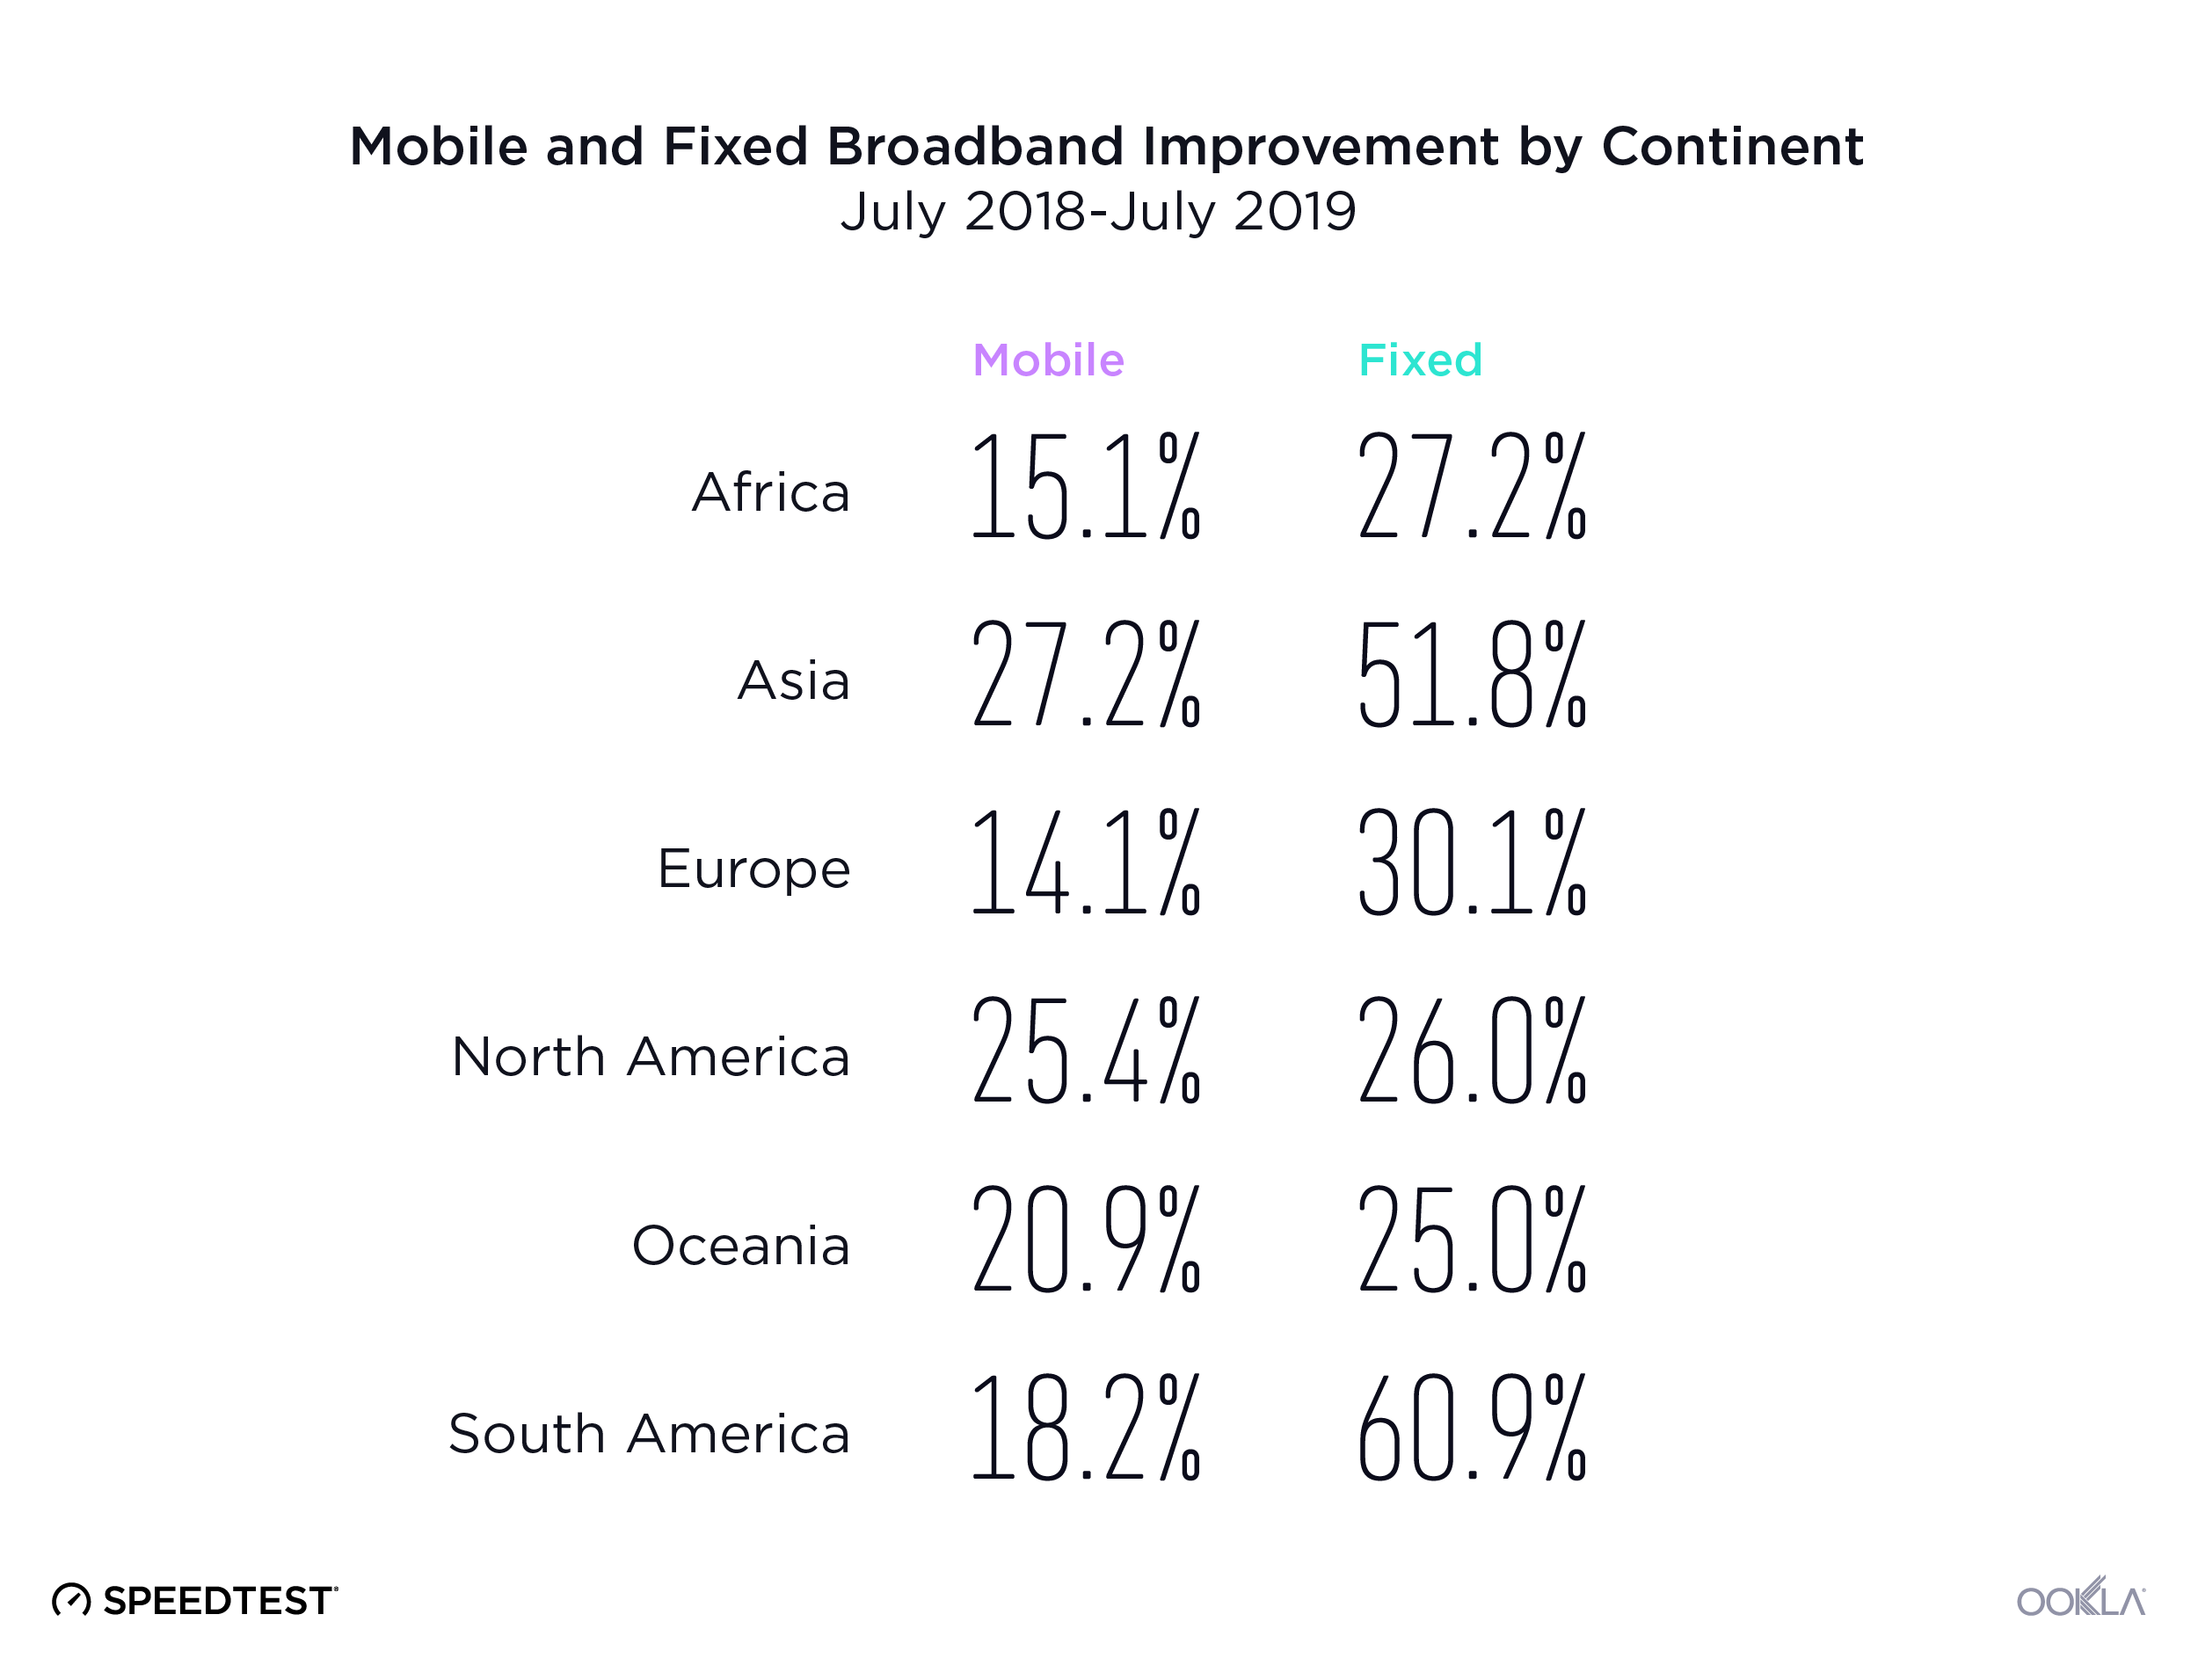
Mobile-and-Fixed-Broadband-Improvement-by-Continent-02

We aggregated Speedtest results by continent to analyze mobile and fixed broadband performance by continent.

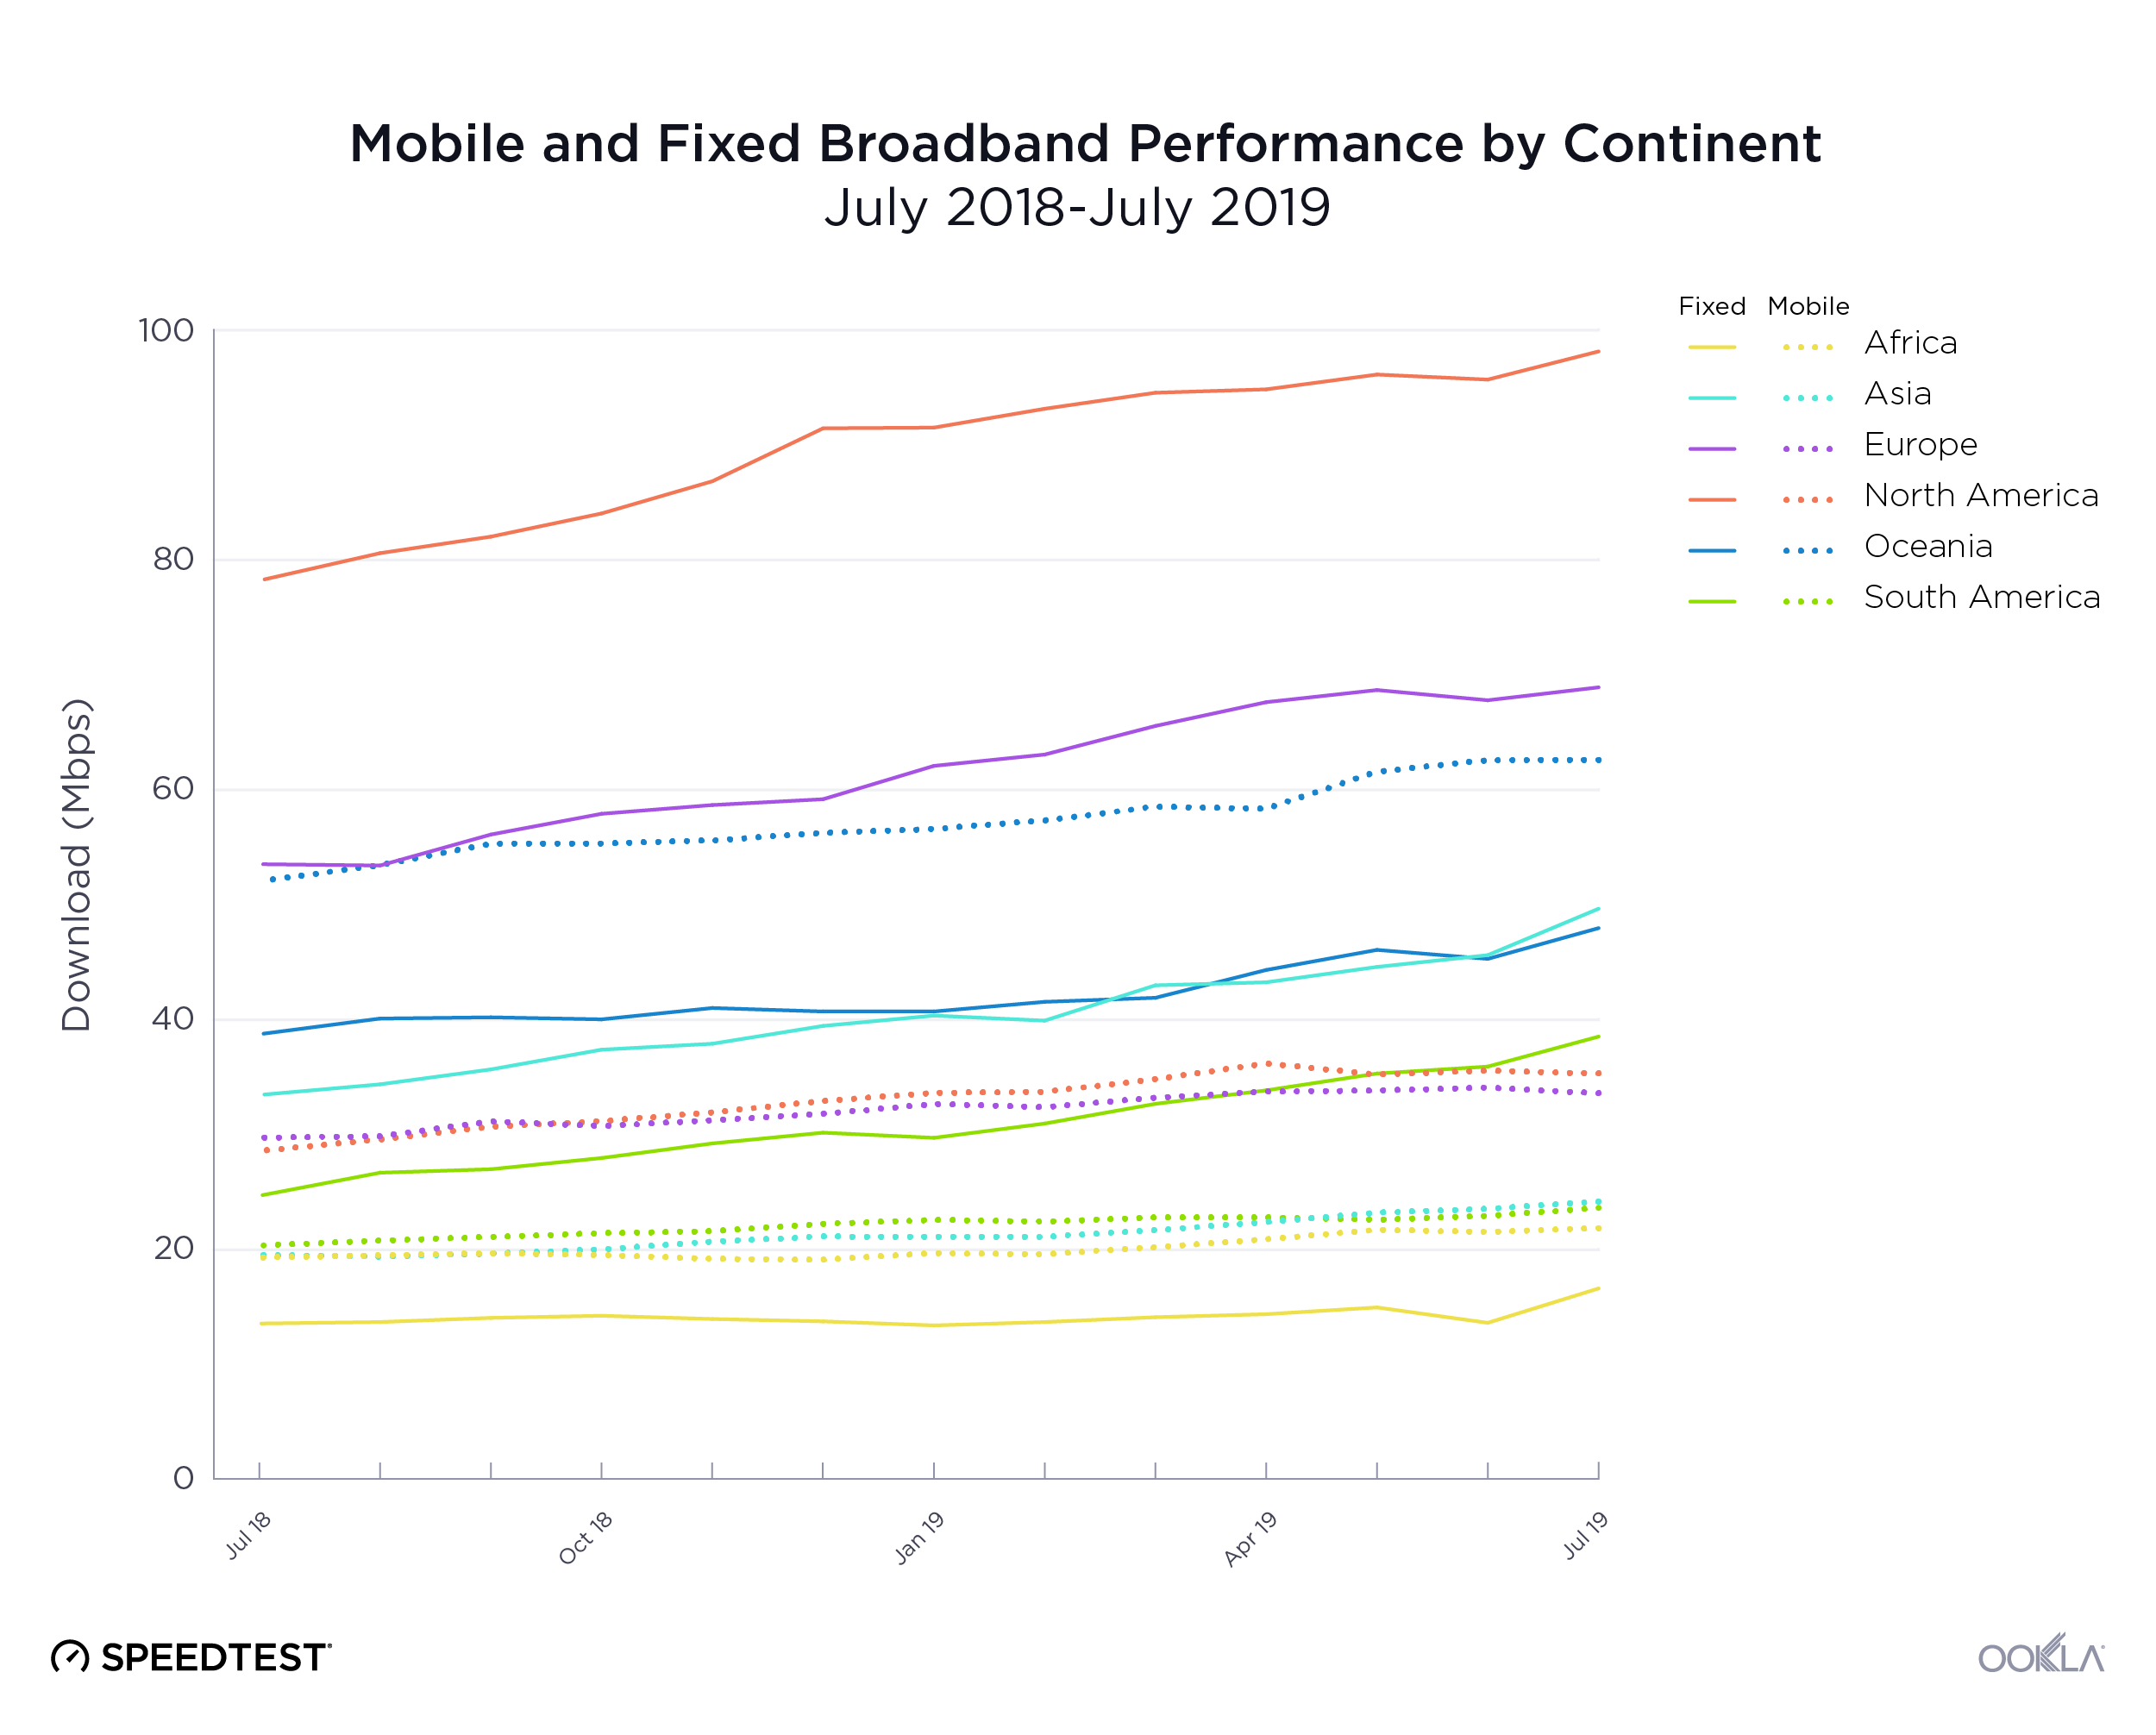
Mobile-and-Fixed-Performance-by-Continent-01

Asia had the highest percentage increase in mobile download speed followed by North America, Oceania, South America, Africa and Europe. Oceania had the fastest mean download speed in July 2019. North America placed second, Europe third, Asia fourth, South America fifth and Africa sixth.

On the fixed broadband side, South America saw the highest percentage increase in download speed. Asia came in second, Europe third, Africa fourth, North America fifth and Oceania sixth. North America had the fastest mean download speed in July 2019. Europe was second, Asia third, and Oceania fourth. As we saw with mobile, South America and Africa again ranked fifth and sixth, respectively.

A zoomed-in view of the speed quadrants separated by continent offers a more detailed view of each country’s role in these rankings.

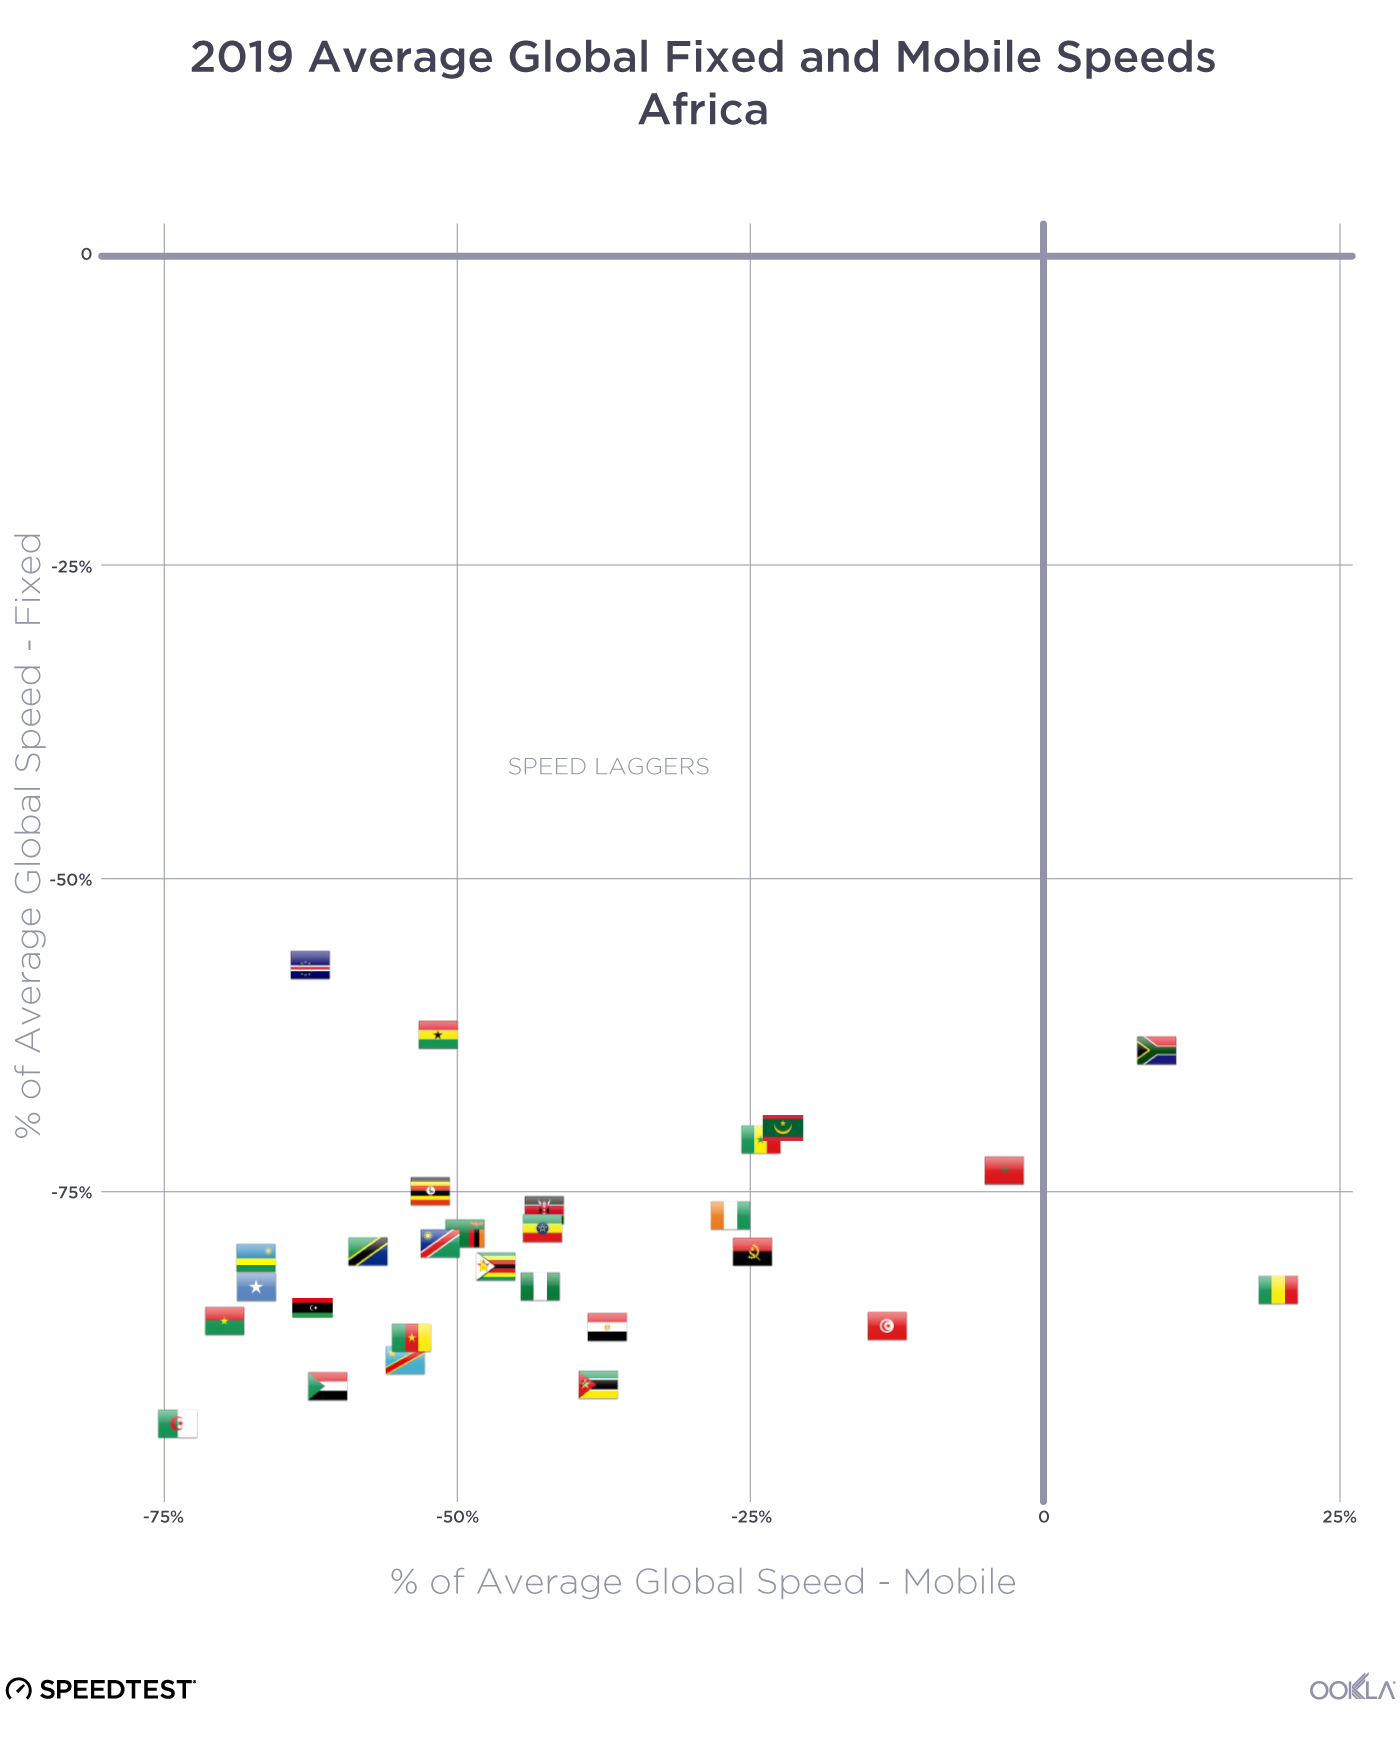
Africa mostly lags in internet speeds

2019-Performance-vs-Global---Africa

In July 2019, all but two African countries in the Speedtest Global Index fell into the Speed Laggers category, having mobile and fixed broadband speeds that were below global averages. The exceptions were South Africa and Guinea, which both had fast enough mobile speeds to place them in the mobile-focused quadrant.

Asian markets show a wide breadth of internet performance

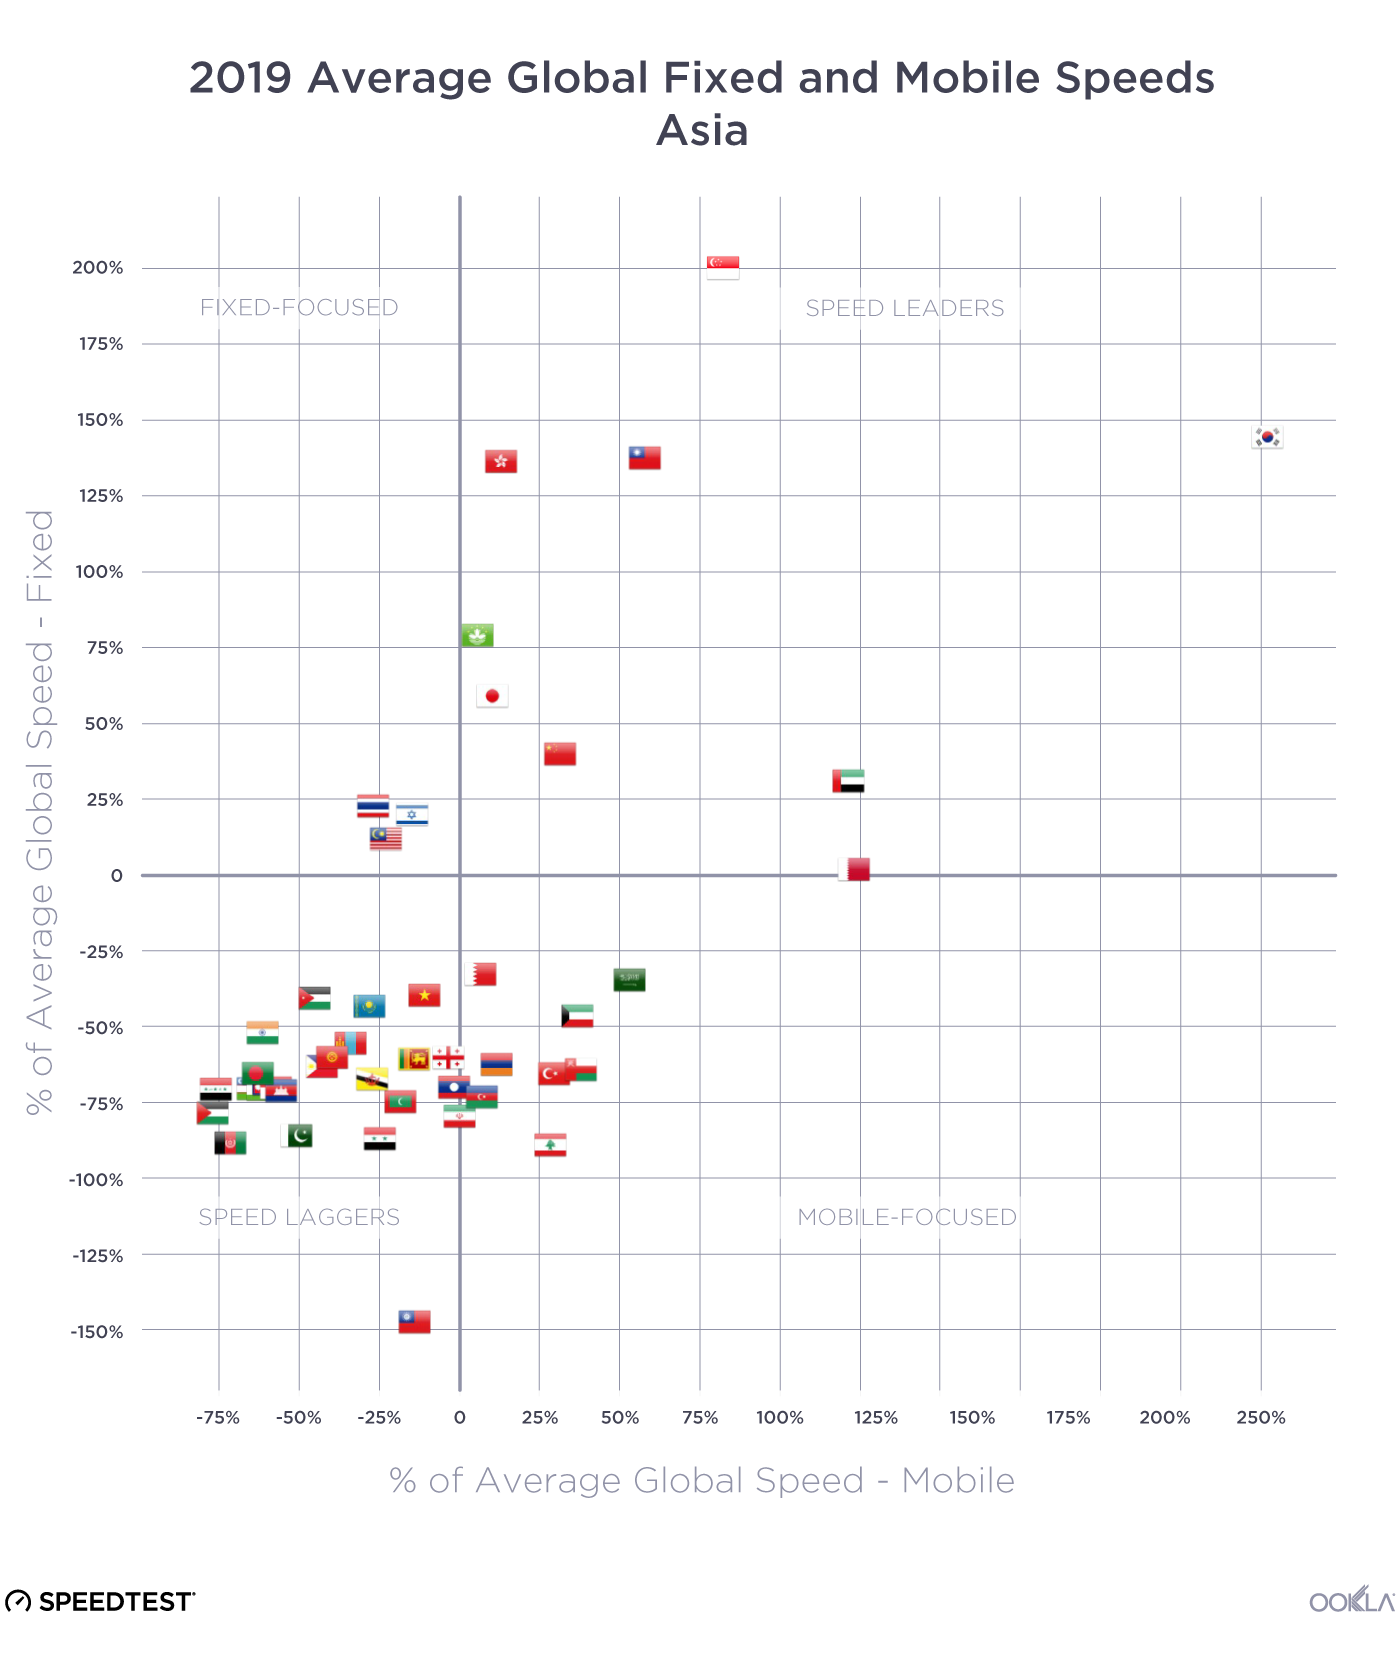
2019-Performance-vs-Global---Asia

Asia was the most diverse continent we examined in terms of internet performance. We saw a plurality of countries in each of the four quadrants in July 2019. Most of the Speed Leaders were in East Asia: China, Hong Kong (SAR), Japan, Macau (SAR), South Korea, and Taiwan. If we include Singapore, another Speed Leader, these are among the wealthiest nations in Asia (using GDP per capita). Two of Asia’s Fixed-Focused countries are in Southeast Asia (Malaysia and Thailand) and one is in the Middle East (Israel).

The Speed Laggers category contained countries from South Asia (including Afghanistan, India and Pakistan), Southeast Asia (Brunei, Cambodia, the Philippines and Vietnam) and the Middle East (Jordan). Mobile-Focused countries in Asia were mostly Middle Eastern, including Kuwait, Lebanon, Oman, Saudi Arabia and Turkey.

European mobile performance is mostly strong, fixed varies

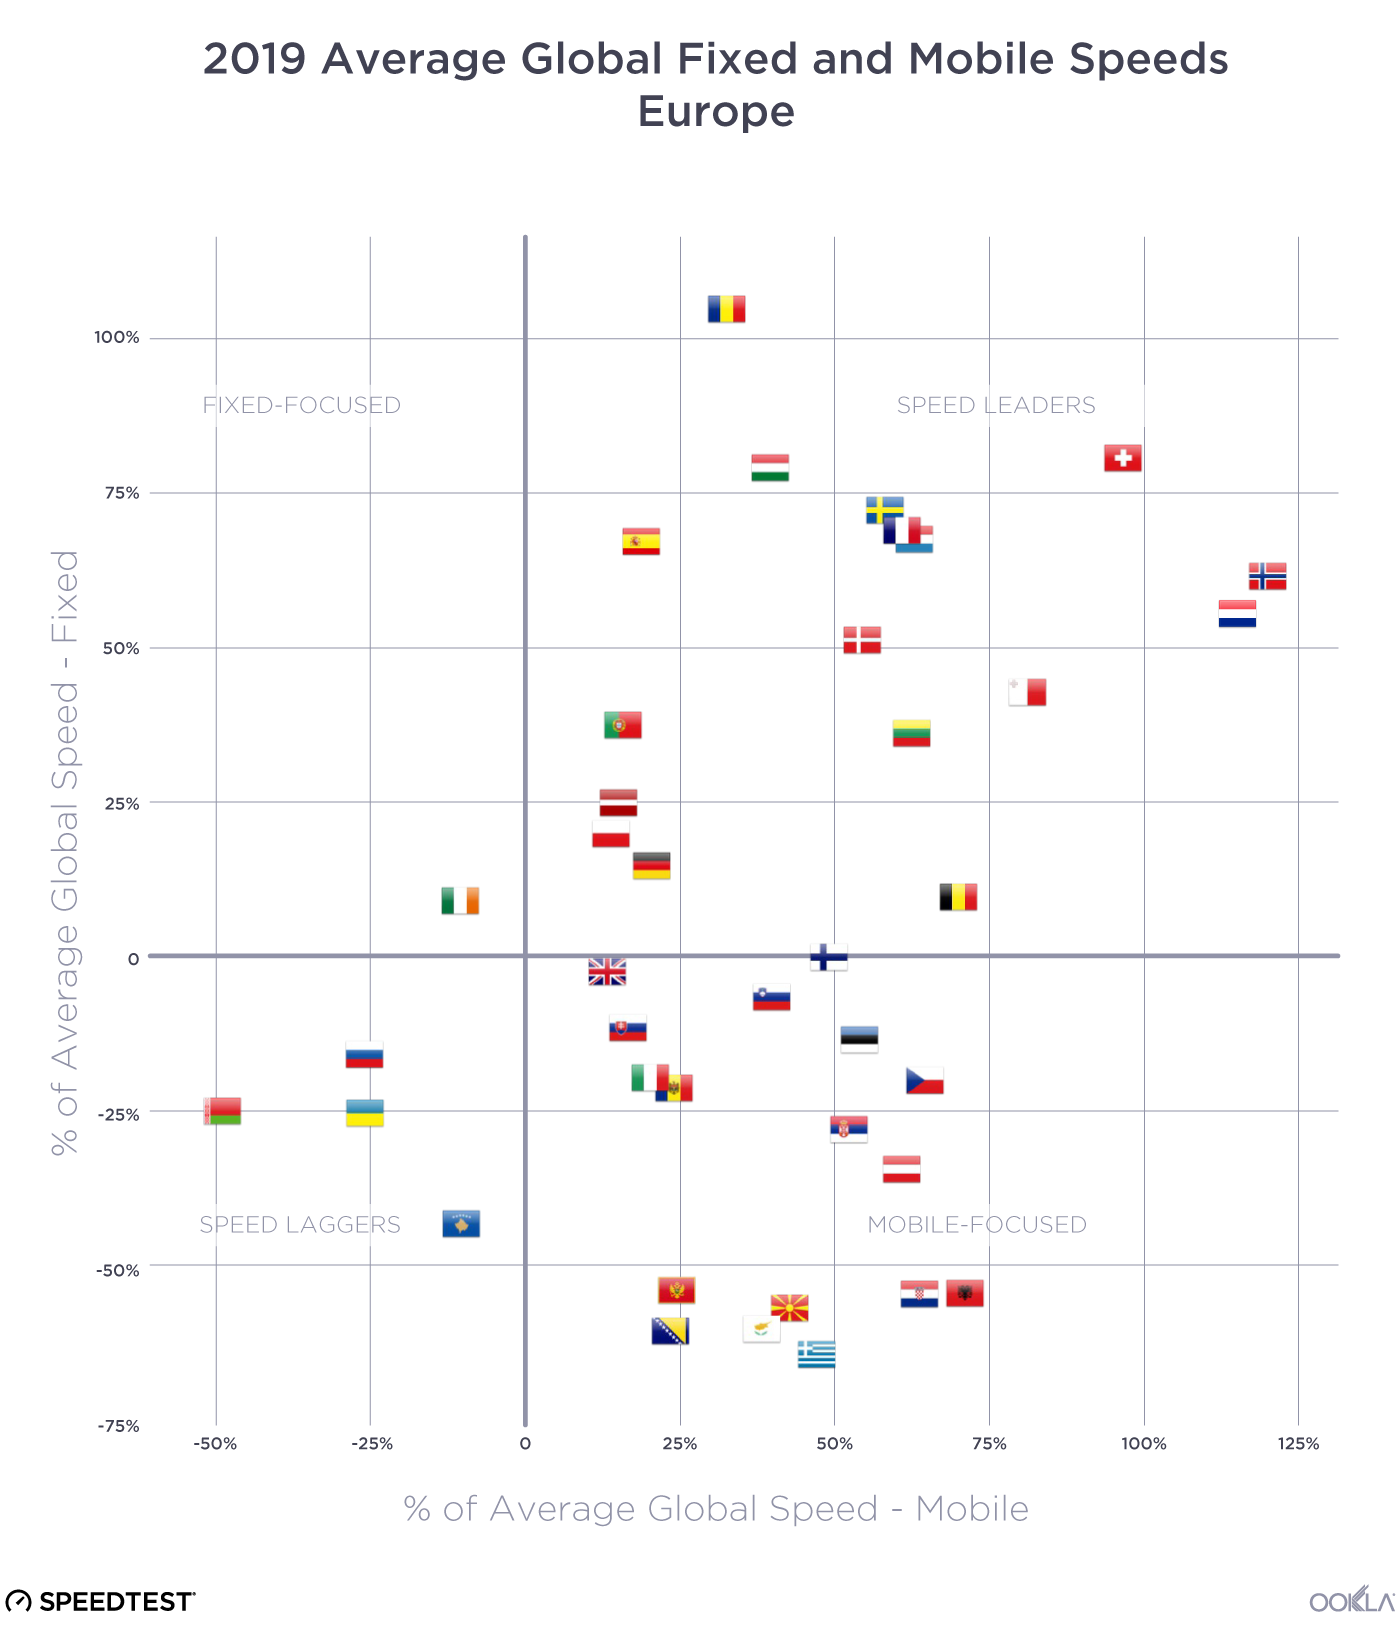
2019-Performance-vs-Global---Europe

With the exception of Ireland, the European countries on the Speedtest Global Index fell into the Speed Leaders, Mobile-Focused, and Speed Laggers categories. All of the Speed Laggers (Belarus, Kazakhstan, Russia and the Ukraine) were from Eastern Europe. Countries from Southeast Europe (including Albania, Bosnia and Herzegovina, Croatia, Greece, Montenegro, Moldova, Serbia and Slovenia) and Central Europe (Austria and the Czech Republic) made up the bulk of the Mobile-Focused category.

Speed Leaders included countries from the Baltics (Estonia, Latvia and Lithuania), the Nordics (Denmark, Norway and Sweden), Central Europe (Poland and Romania), and Western Europe (including Belgium, France, Germany, the Netherlands, and Spain).

North American internet performance is sharply divided

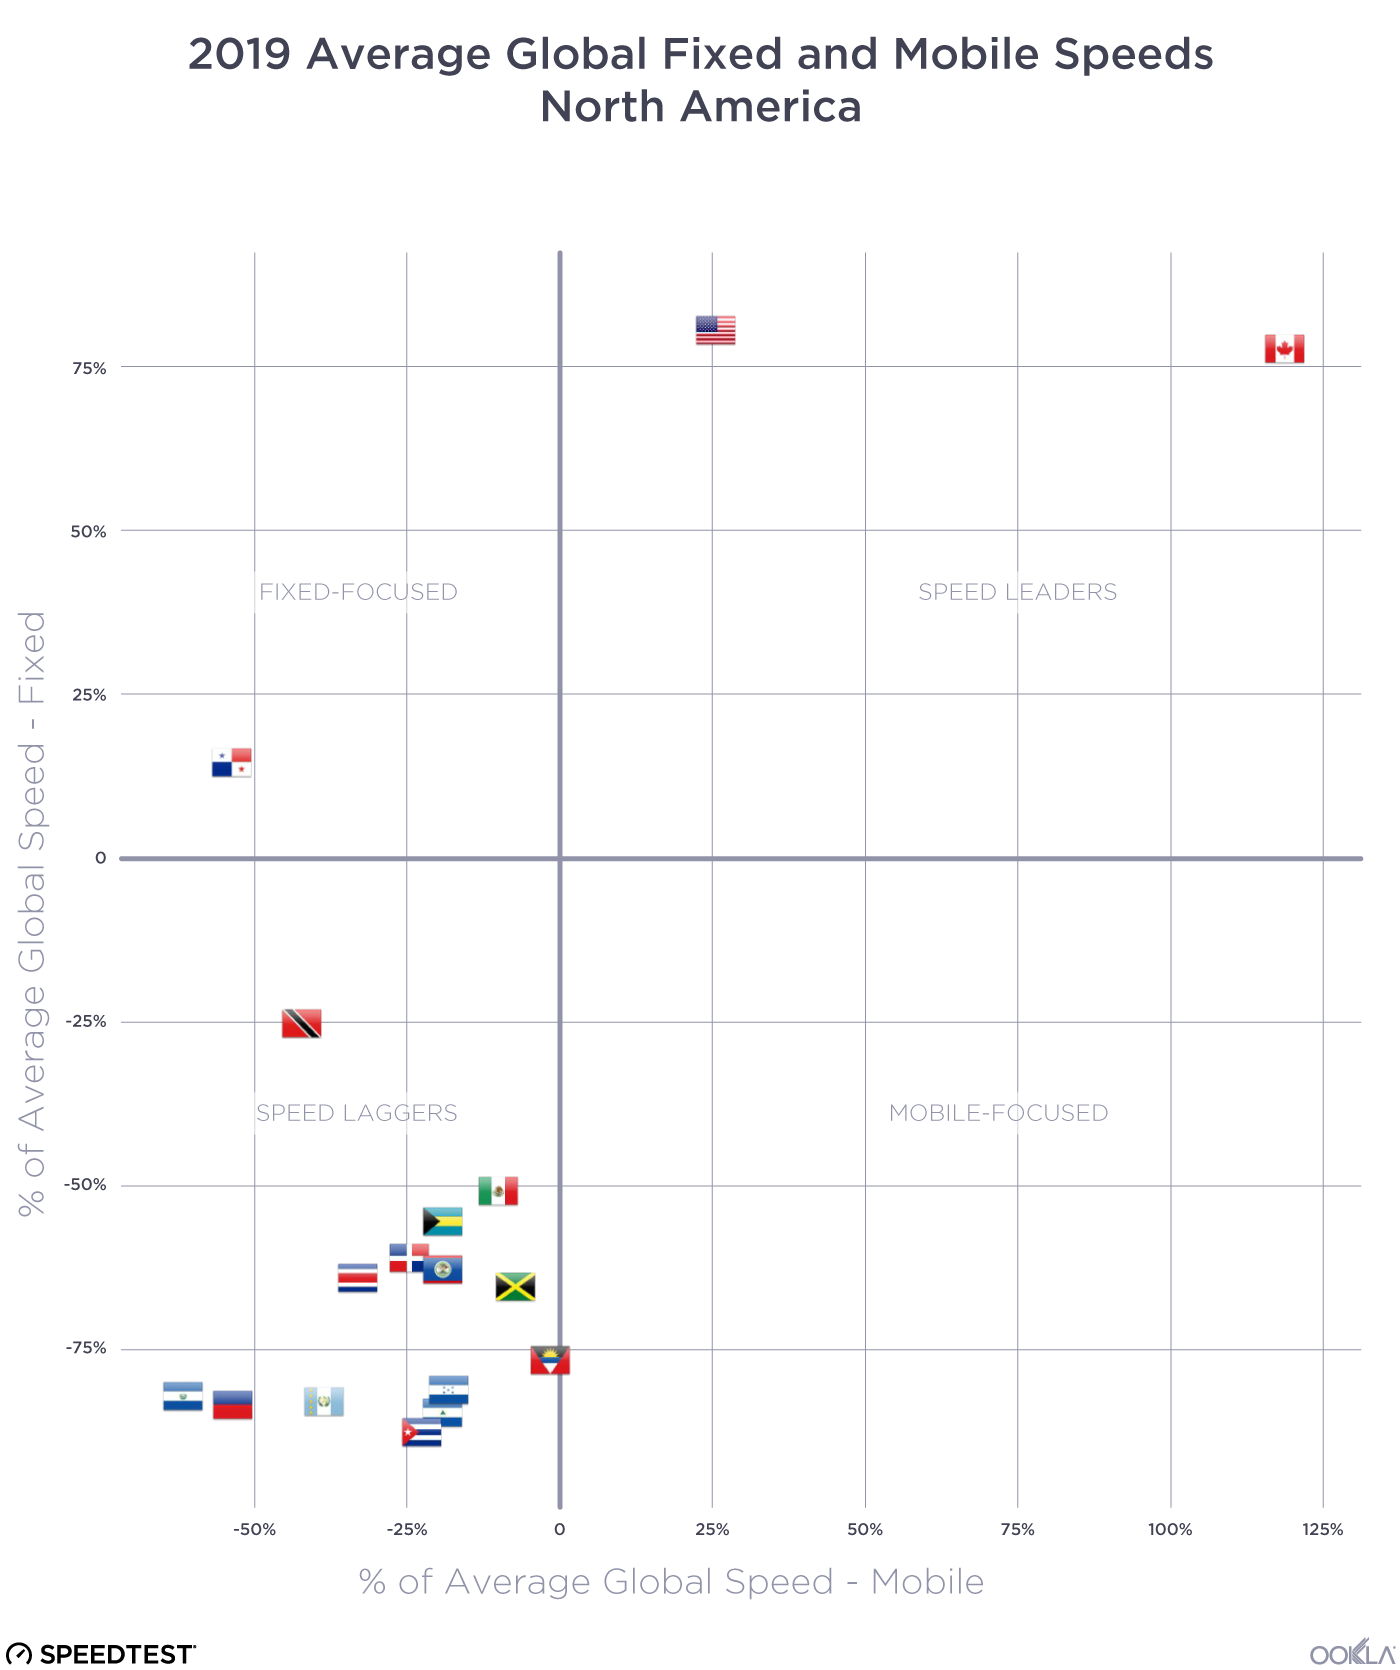
2019-Performance-vs-Global---North-America

Canada and the U.S. are the only two North American countries in the Speed Leaders category. Panama is the only North American country under Fixed-Focused. Mexico and all of the Central American countries fall into the Speed Laggers category. There are no North American countries that are Mobile-Focused.

Each country in Oceania has a very different internet story

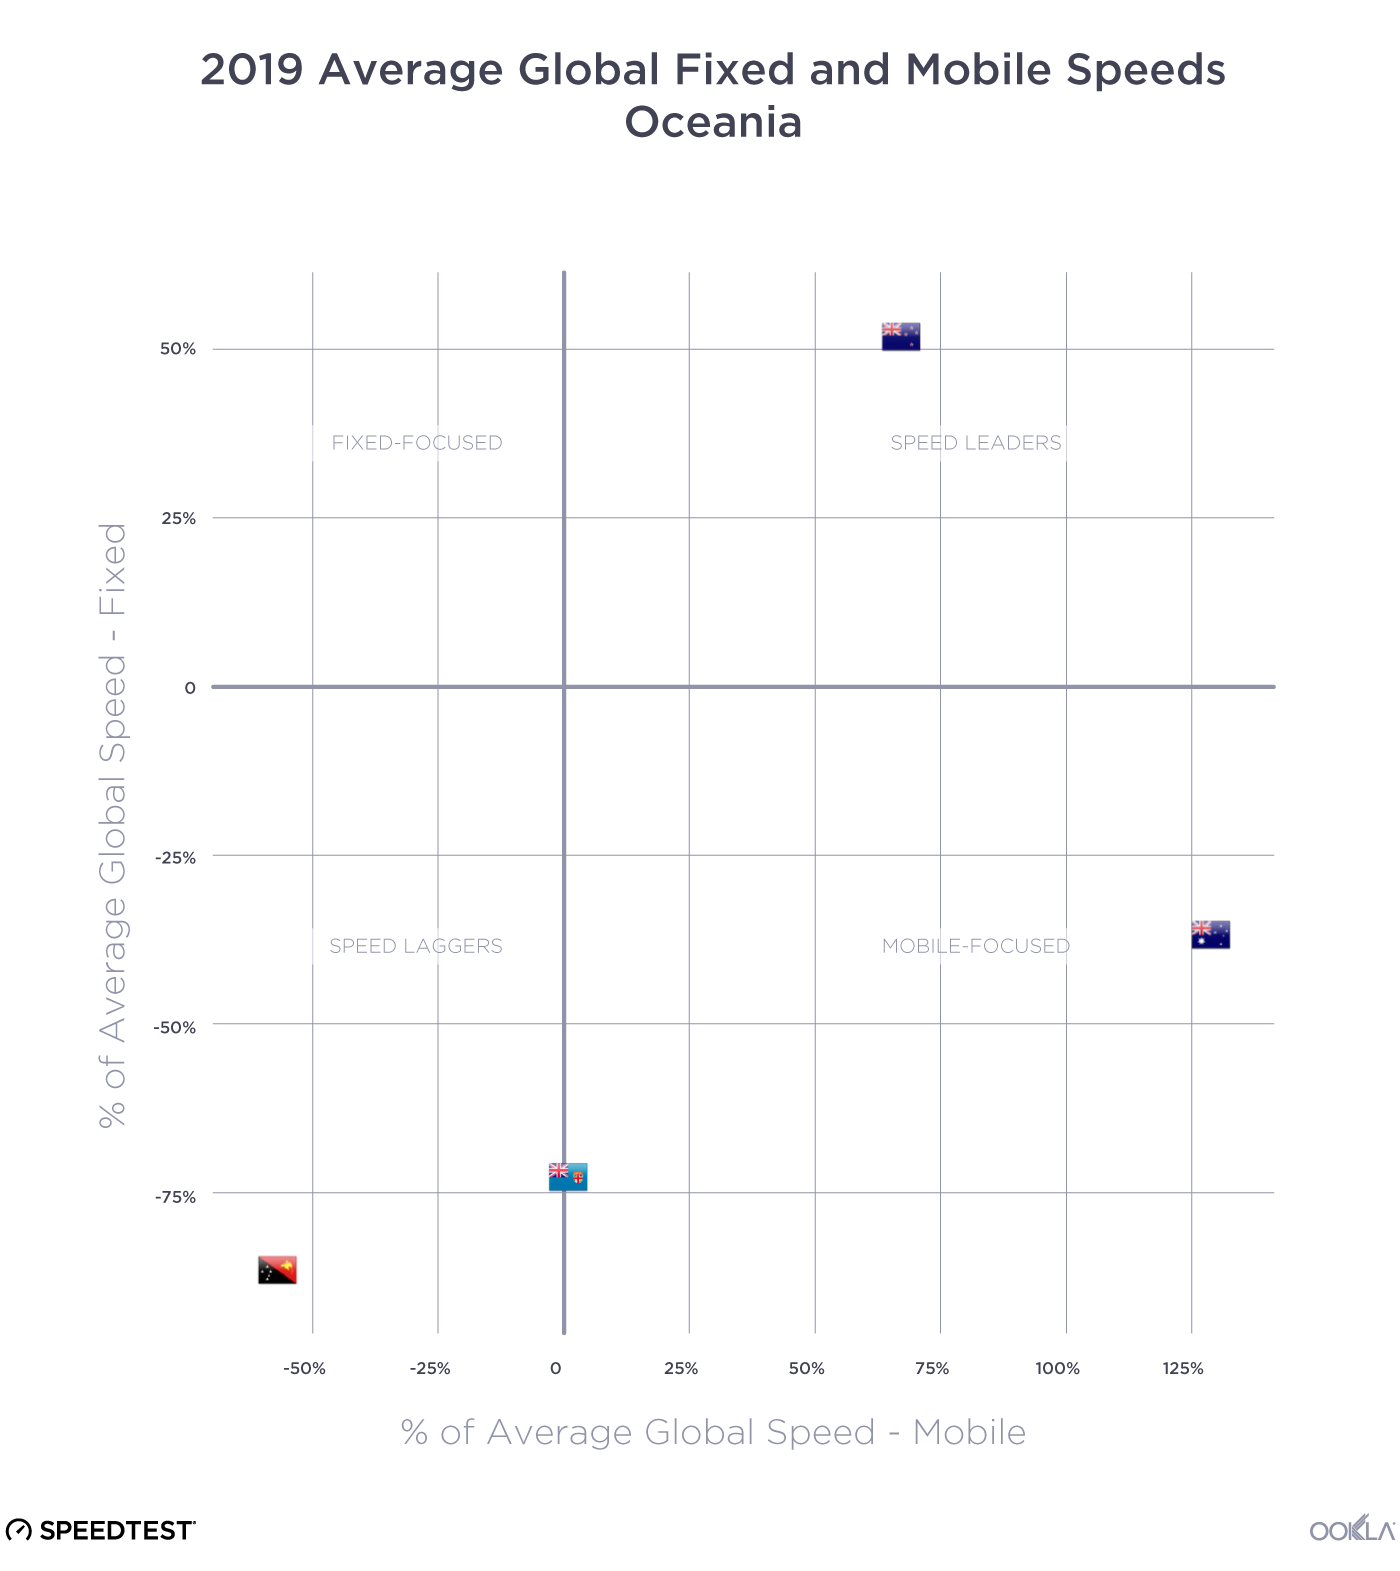
2019-Performance-vs-Global---Ocean

Oceania is represented in three of the four quadrants: Speed Leaders (New Zealand), Mobile-Focused (Australia) and Speed Laggers (Papua New Guinea) with Fiji straddling the divide between Speed Laggers and Mobile-Focused.

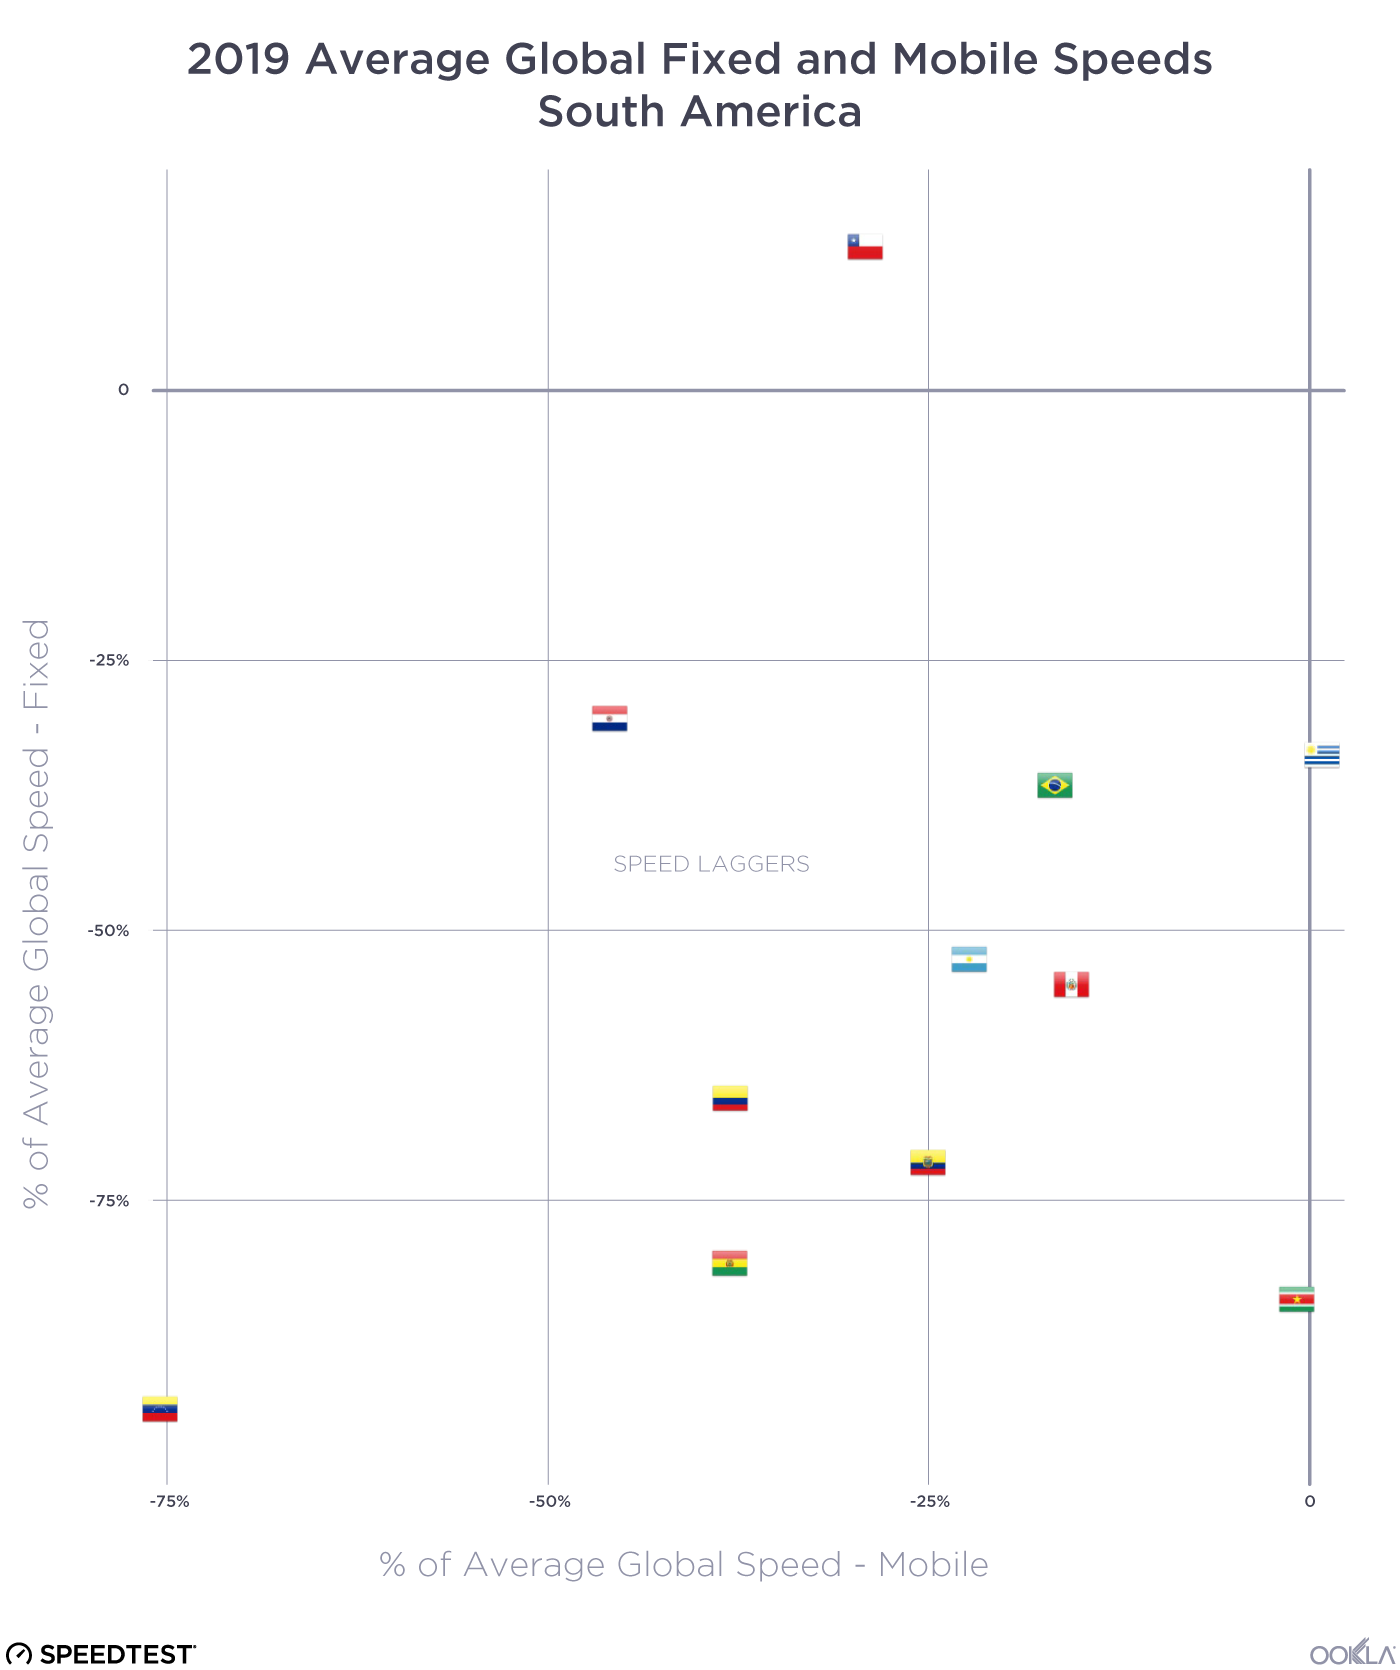
South America mostly lags in mobile and fixed internet speeds

2019-Performance-vs-Global---South-America

Most of the South American countries represented on the Speedtest Global Index are in the Speed Laggers quadrant (Argentina, Bolivia, Brazil, Colombia, Ecuador, Paraguay, Peru, Suriname and Venezuela). Chile is an exception, being part of the Fixed-Focused group, as is Uruguay which sits in Mobile-Focused.

Global internet speeds are improving on average and 5G and gigabit are compounding those advances where available. However, not all countries are benefitting equally. We’ll be interested to see how 5G continues to push mobile speeds in the next year and also whether 5G Wi-Fi becomes a game changer for fixed broadband. Remember to check the Speedtest Global Index on a monthly basis for updated country rankings. And take a Speedtest to make sure your experience is represented in your country’s averages.

Editor’s Note: This article was edited on September 10, 2019 to correct an error in the labeling on the first image. The colors in a later image were updated for consistency.

Ookla retains ownership of this article including all of the intellectual property rights, data, content graphs and analysis. This article may not be quoted, reproduced, distributed or published for any commercial purpose without prior consent. Members of the press and others using the findings in this article for non-commercial purposes are welcome to publicly share and link to report information with attribution to Ookla.
| December 10, 2020

Massive Expansions and Huge Improvements in Speed: The Worldwide Growth of 5G in 2020

The rapid expansion of 5G in countries across the globe was a bright spot in a year that needed one. But just how great is the news? We examined Speedtest Intelligence® data from over 60.5 million Speedtest® results during Q3 2020 to see how much speeds have improved, where download speeds are the fastest at the country and capital level, where 5G deployments have increased and what worldwide 5G coverage looks like now. We also looked at countries where 5G doesn’t yet reach to understand where good news might be on the horizon.

We have only included countries with commercially available 5G on these lists in order to provide a more accurate view of the performance consumers can reasonably expect. While our data shows results for many countries where 5G is not yet commercially available, these tests are likely results from engineers testing their own networks. In addition, we’re only providing analysis for countries with more than 200 samples during Q3 2020. The bars shown in our charts are 95% confidence intervals, which represent the range of values in which the true value is likely to be. Countries marked in tables with an asterisk first launched 5G commercially in 2020.

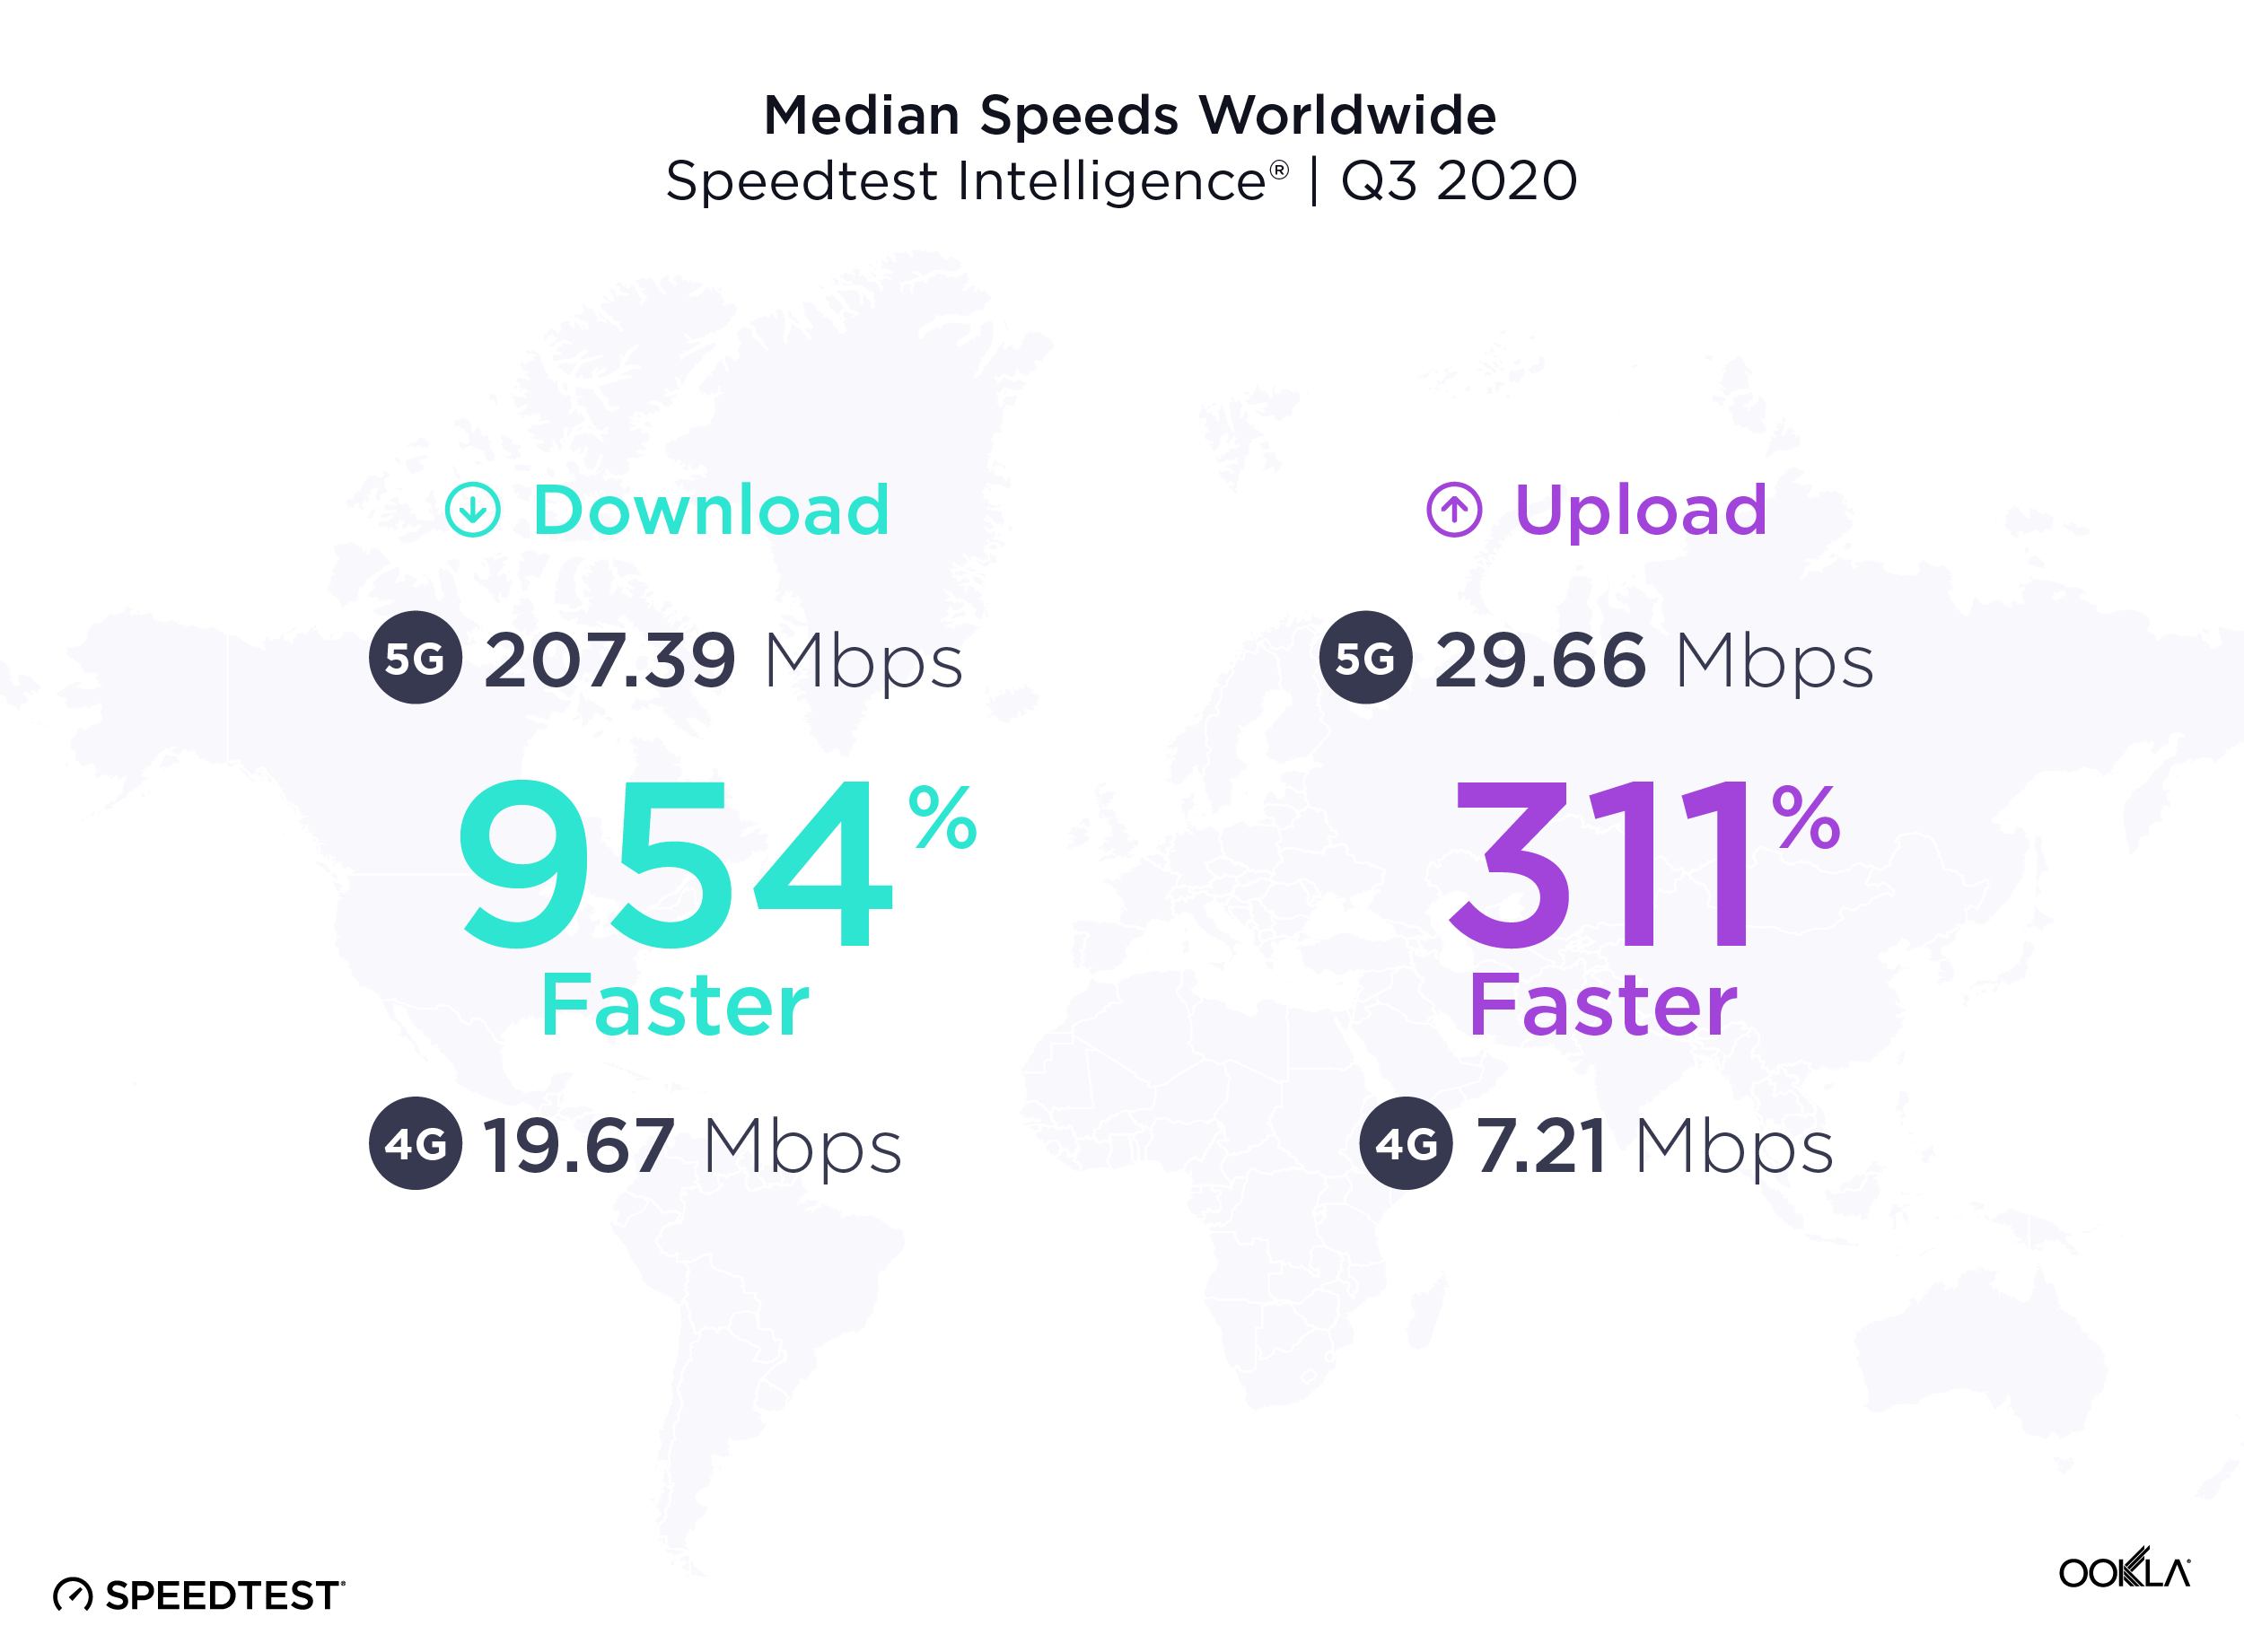
5G downloads were 954% faster than 4G at the global level

The worldwide median download speed over 5G was 954% faster than that over 4G during Q3 2020. Median upload speed over 5G was 311% faster than that over 4G. Consumers are eagerly adopting the new technology and many have wanted to measure the full throughput capacity of their network connection. In Q3 2020 alone, there were 4,324,788 Speedtest results over 5G.
Median-Speeds-Worldwide_1220-1

United Arab Emirates had the fastest 5G

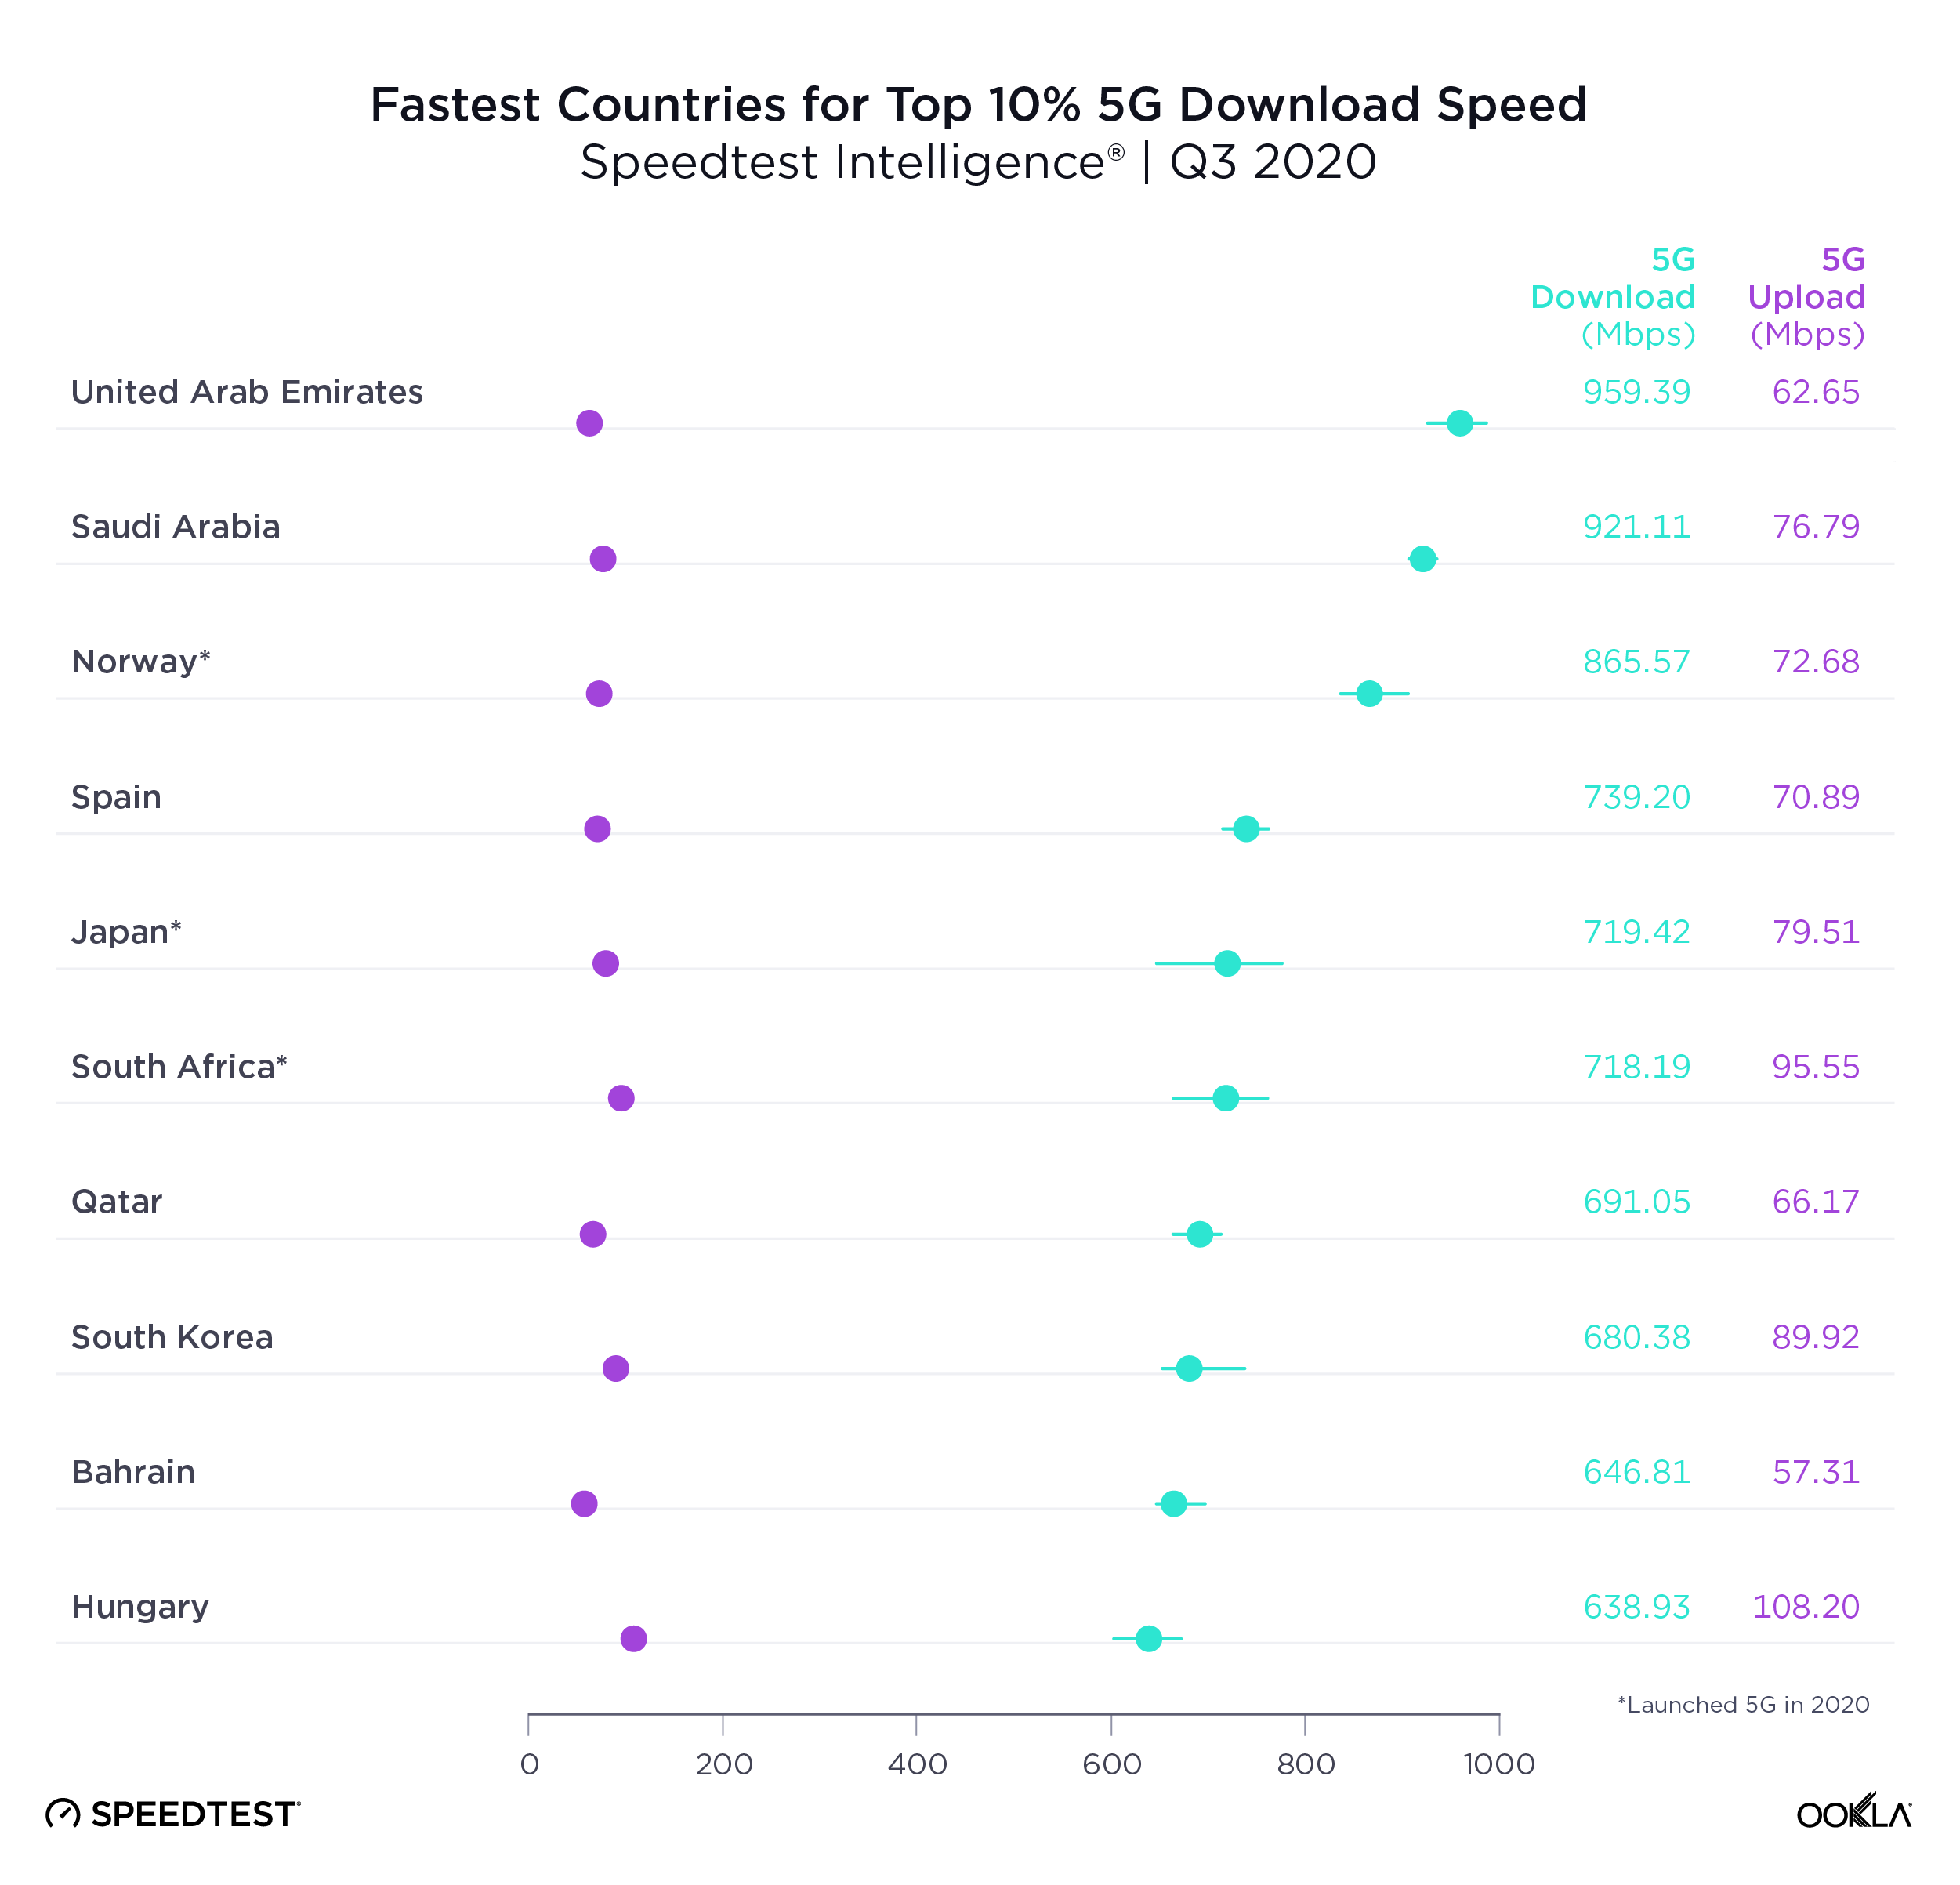
United Arab Emirates topped the list of countries with the fastest top 10% 5G download speed in Q3 2020. Top 10% (or 90th percentile) measures the speeds seen by the fastest 10% of users and is a way to gauge what each country’s networks are capable of. Saudi Arabia was second for top 10% 5G download speed, Norway third, Spain fourth and Japan fifth.
Fastest-Countries-Top-5G-Download-Speed_1220-2

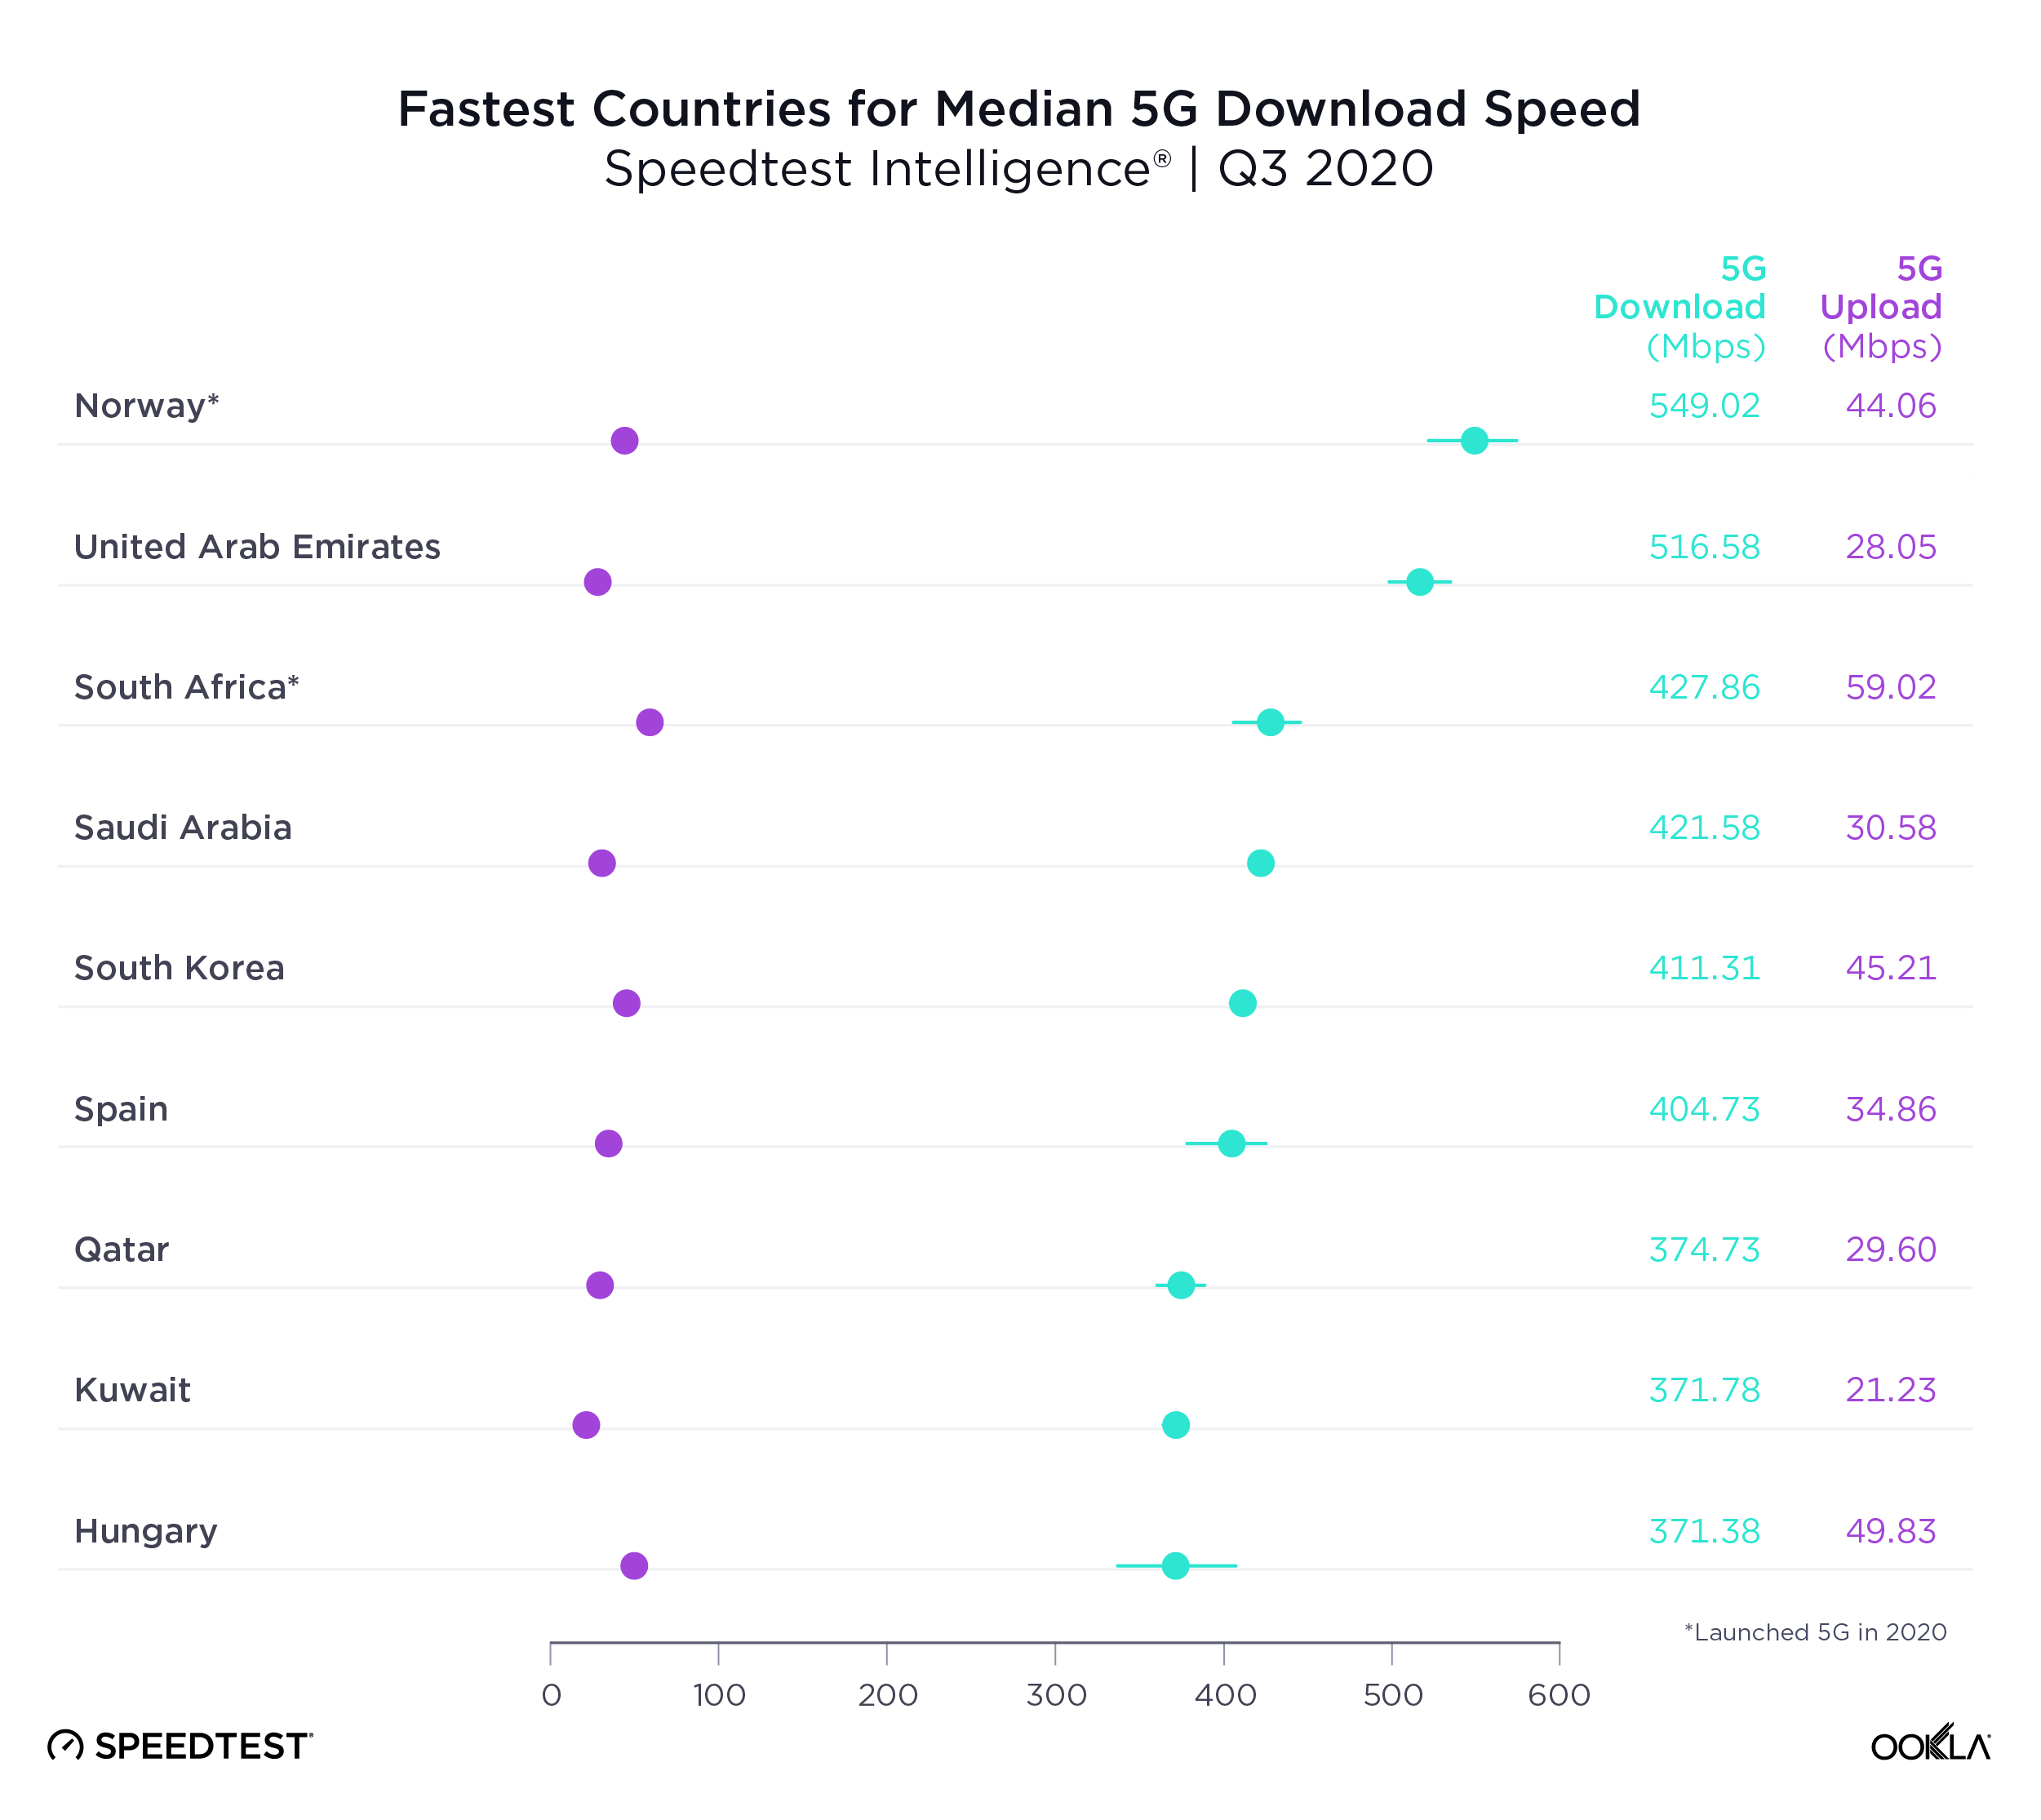
Another way to measure 5G performance is to look at median 5G download speed, which is a better predictor of the kind of performance most 5G customers can expect. Norway was the country with the fastest median download speed over 5G during Q3 2020. U.A.E. was second in this category, South Africa third, Saudi Arabia fourth and Spain fifth.
Fastest-Countries-Median-5G-Download-Speed_1220-2

It’s notable that Japan was on the list of 10 countries with the fastest top 10% 5G download speed but not on the list of 10 countries with the fastest median download speed over 5G. No matter how fast a country’s mobile infrastructure is, many other factors go into median 5G speeds, including device adoption and spectrum allocation.

Abu Dhabi tops list of 5G speeds in world capitals

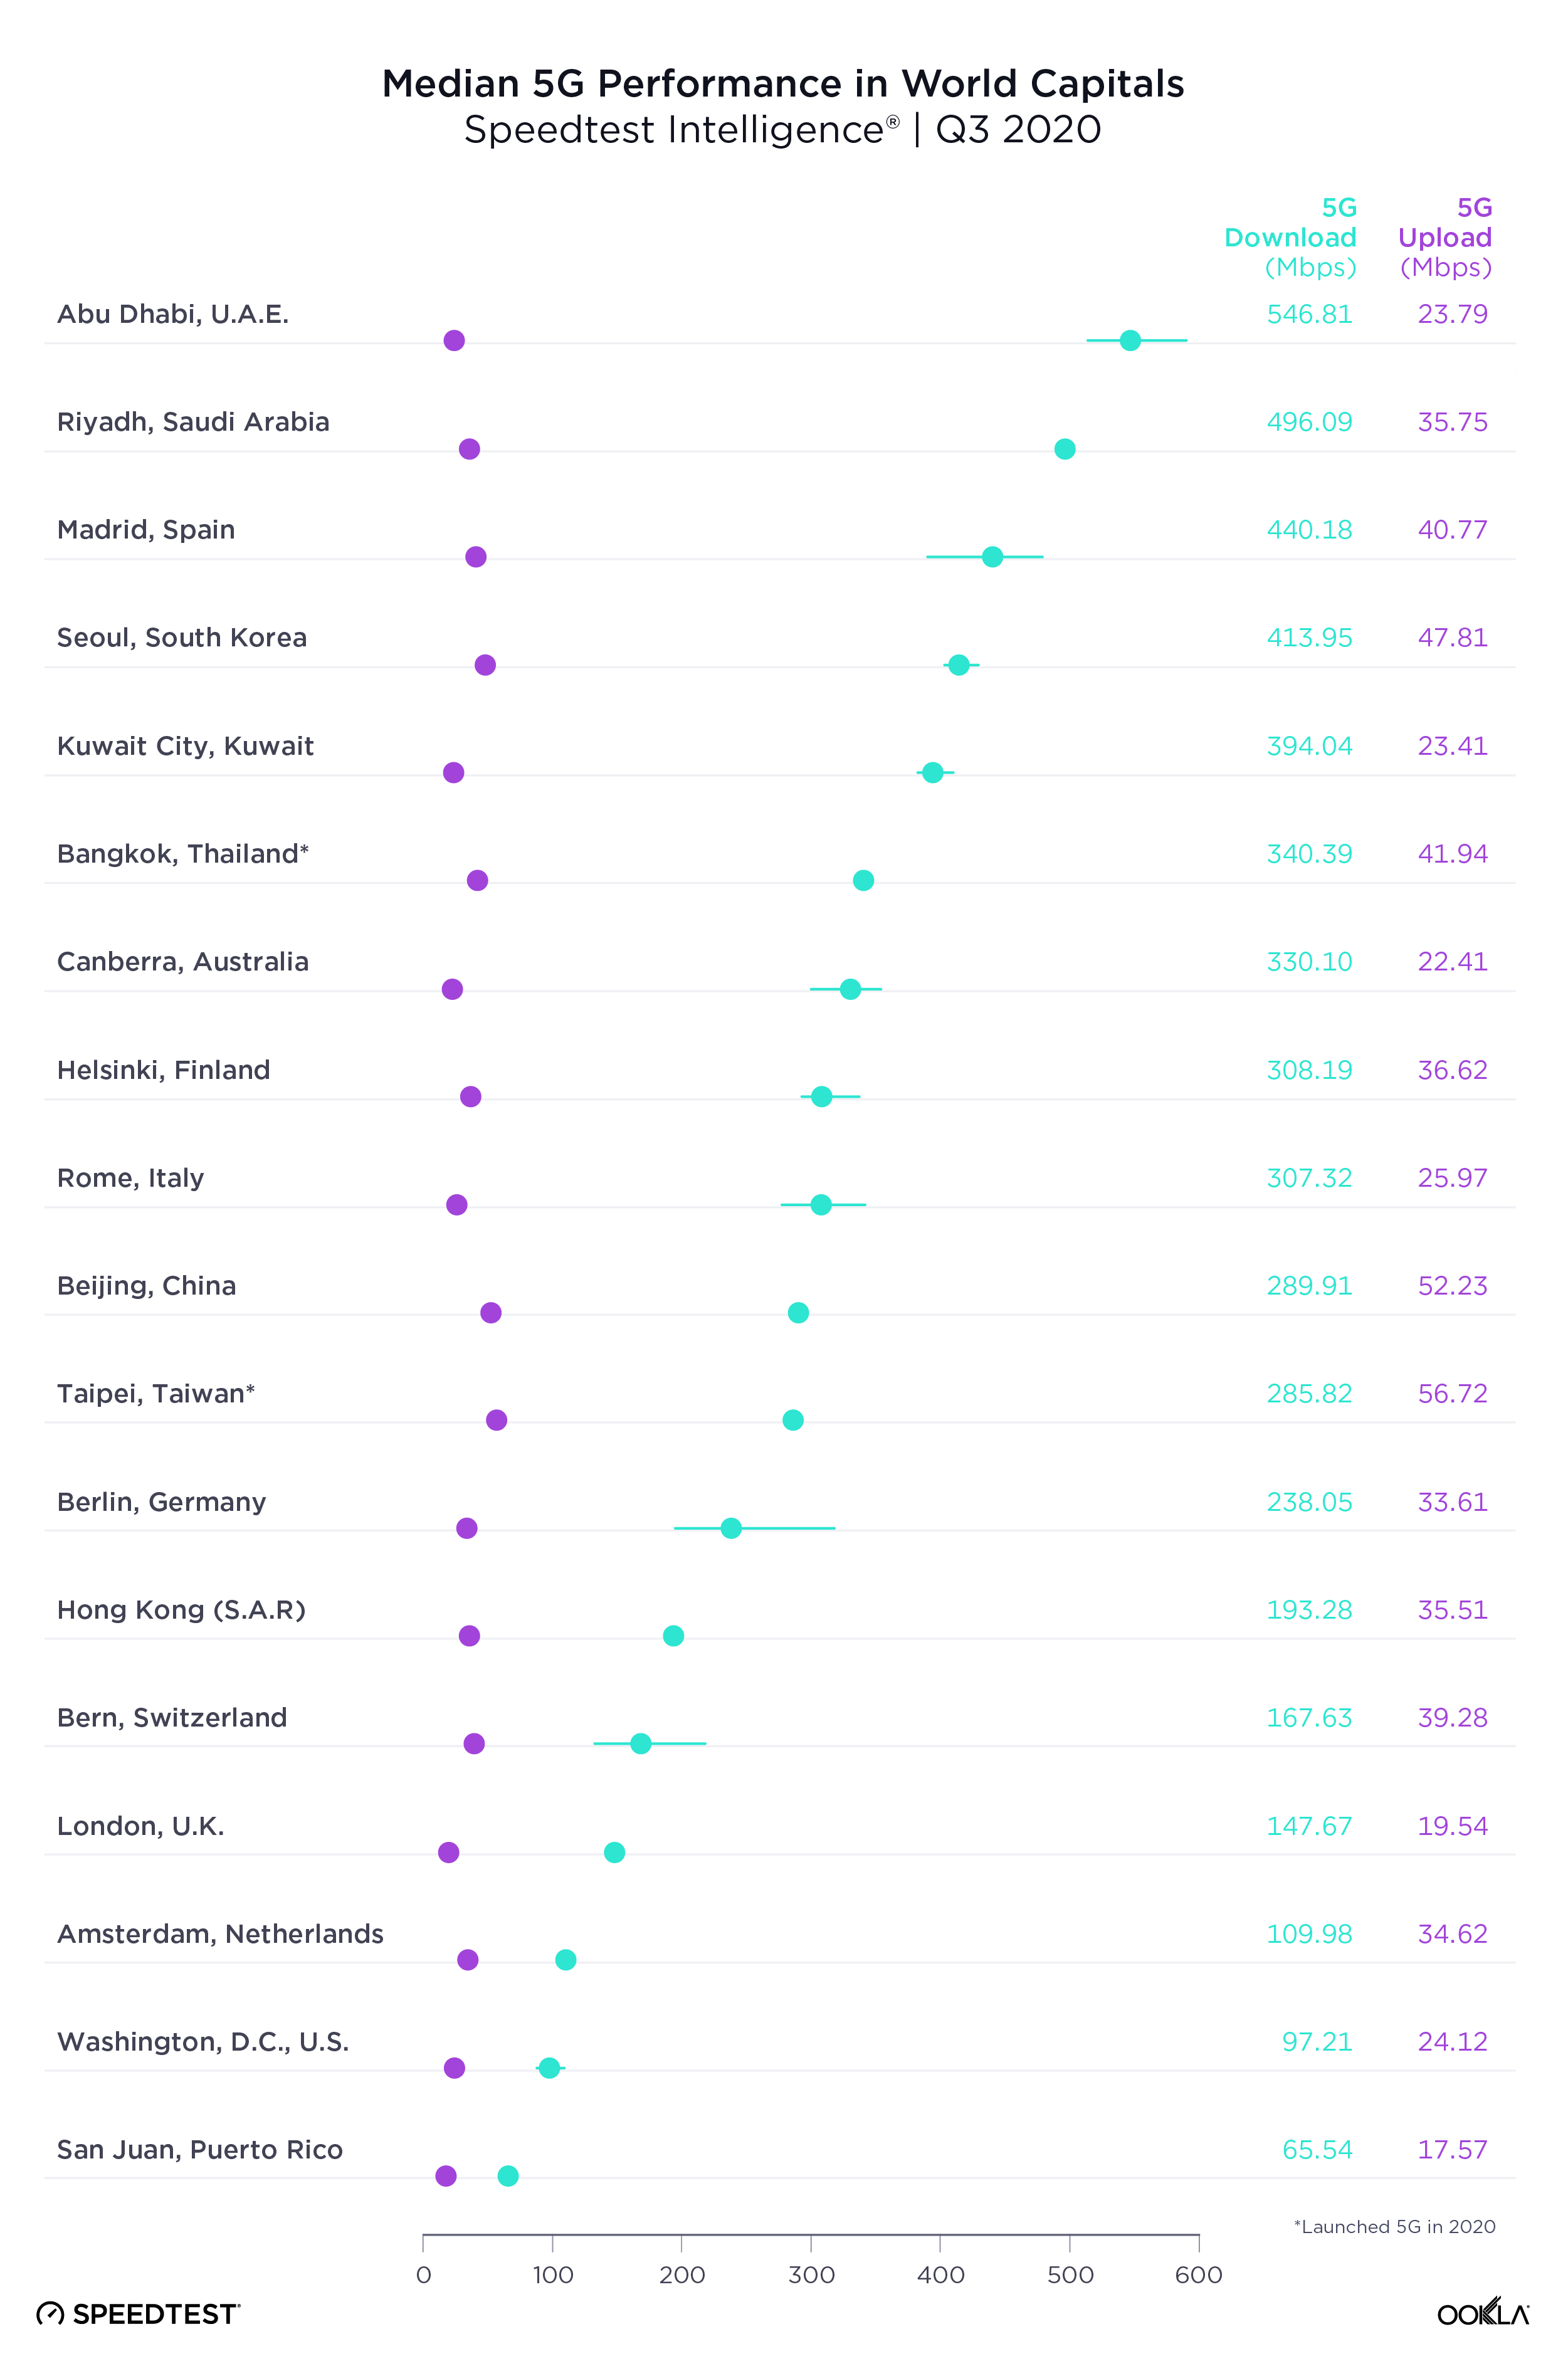
Our examination of 5G performance for 18 world capital cities with 5G during Q3 2020 found that Abu Dhabi had the fastest median download speed over 5G at 546.81 Mbps. Riyadh was second, Madrid third, Seoul fourth and Kuwait City fifth. As we saw at the country level, median upload speed was much lower than download speed.
Median-5G-Performance-Capitals_1220-2

How 5G performance and time spent compare within regions

We looked more closely at 5G performance across several intergovernmental organizations and trade blocs to get a better sense of how countries are performing in comparison to their neighbors and trade partners. We also calculated Time Spent on 5G, the proportion of time that users with 5G-capable devices spent on 5G, for each country.

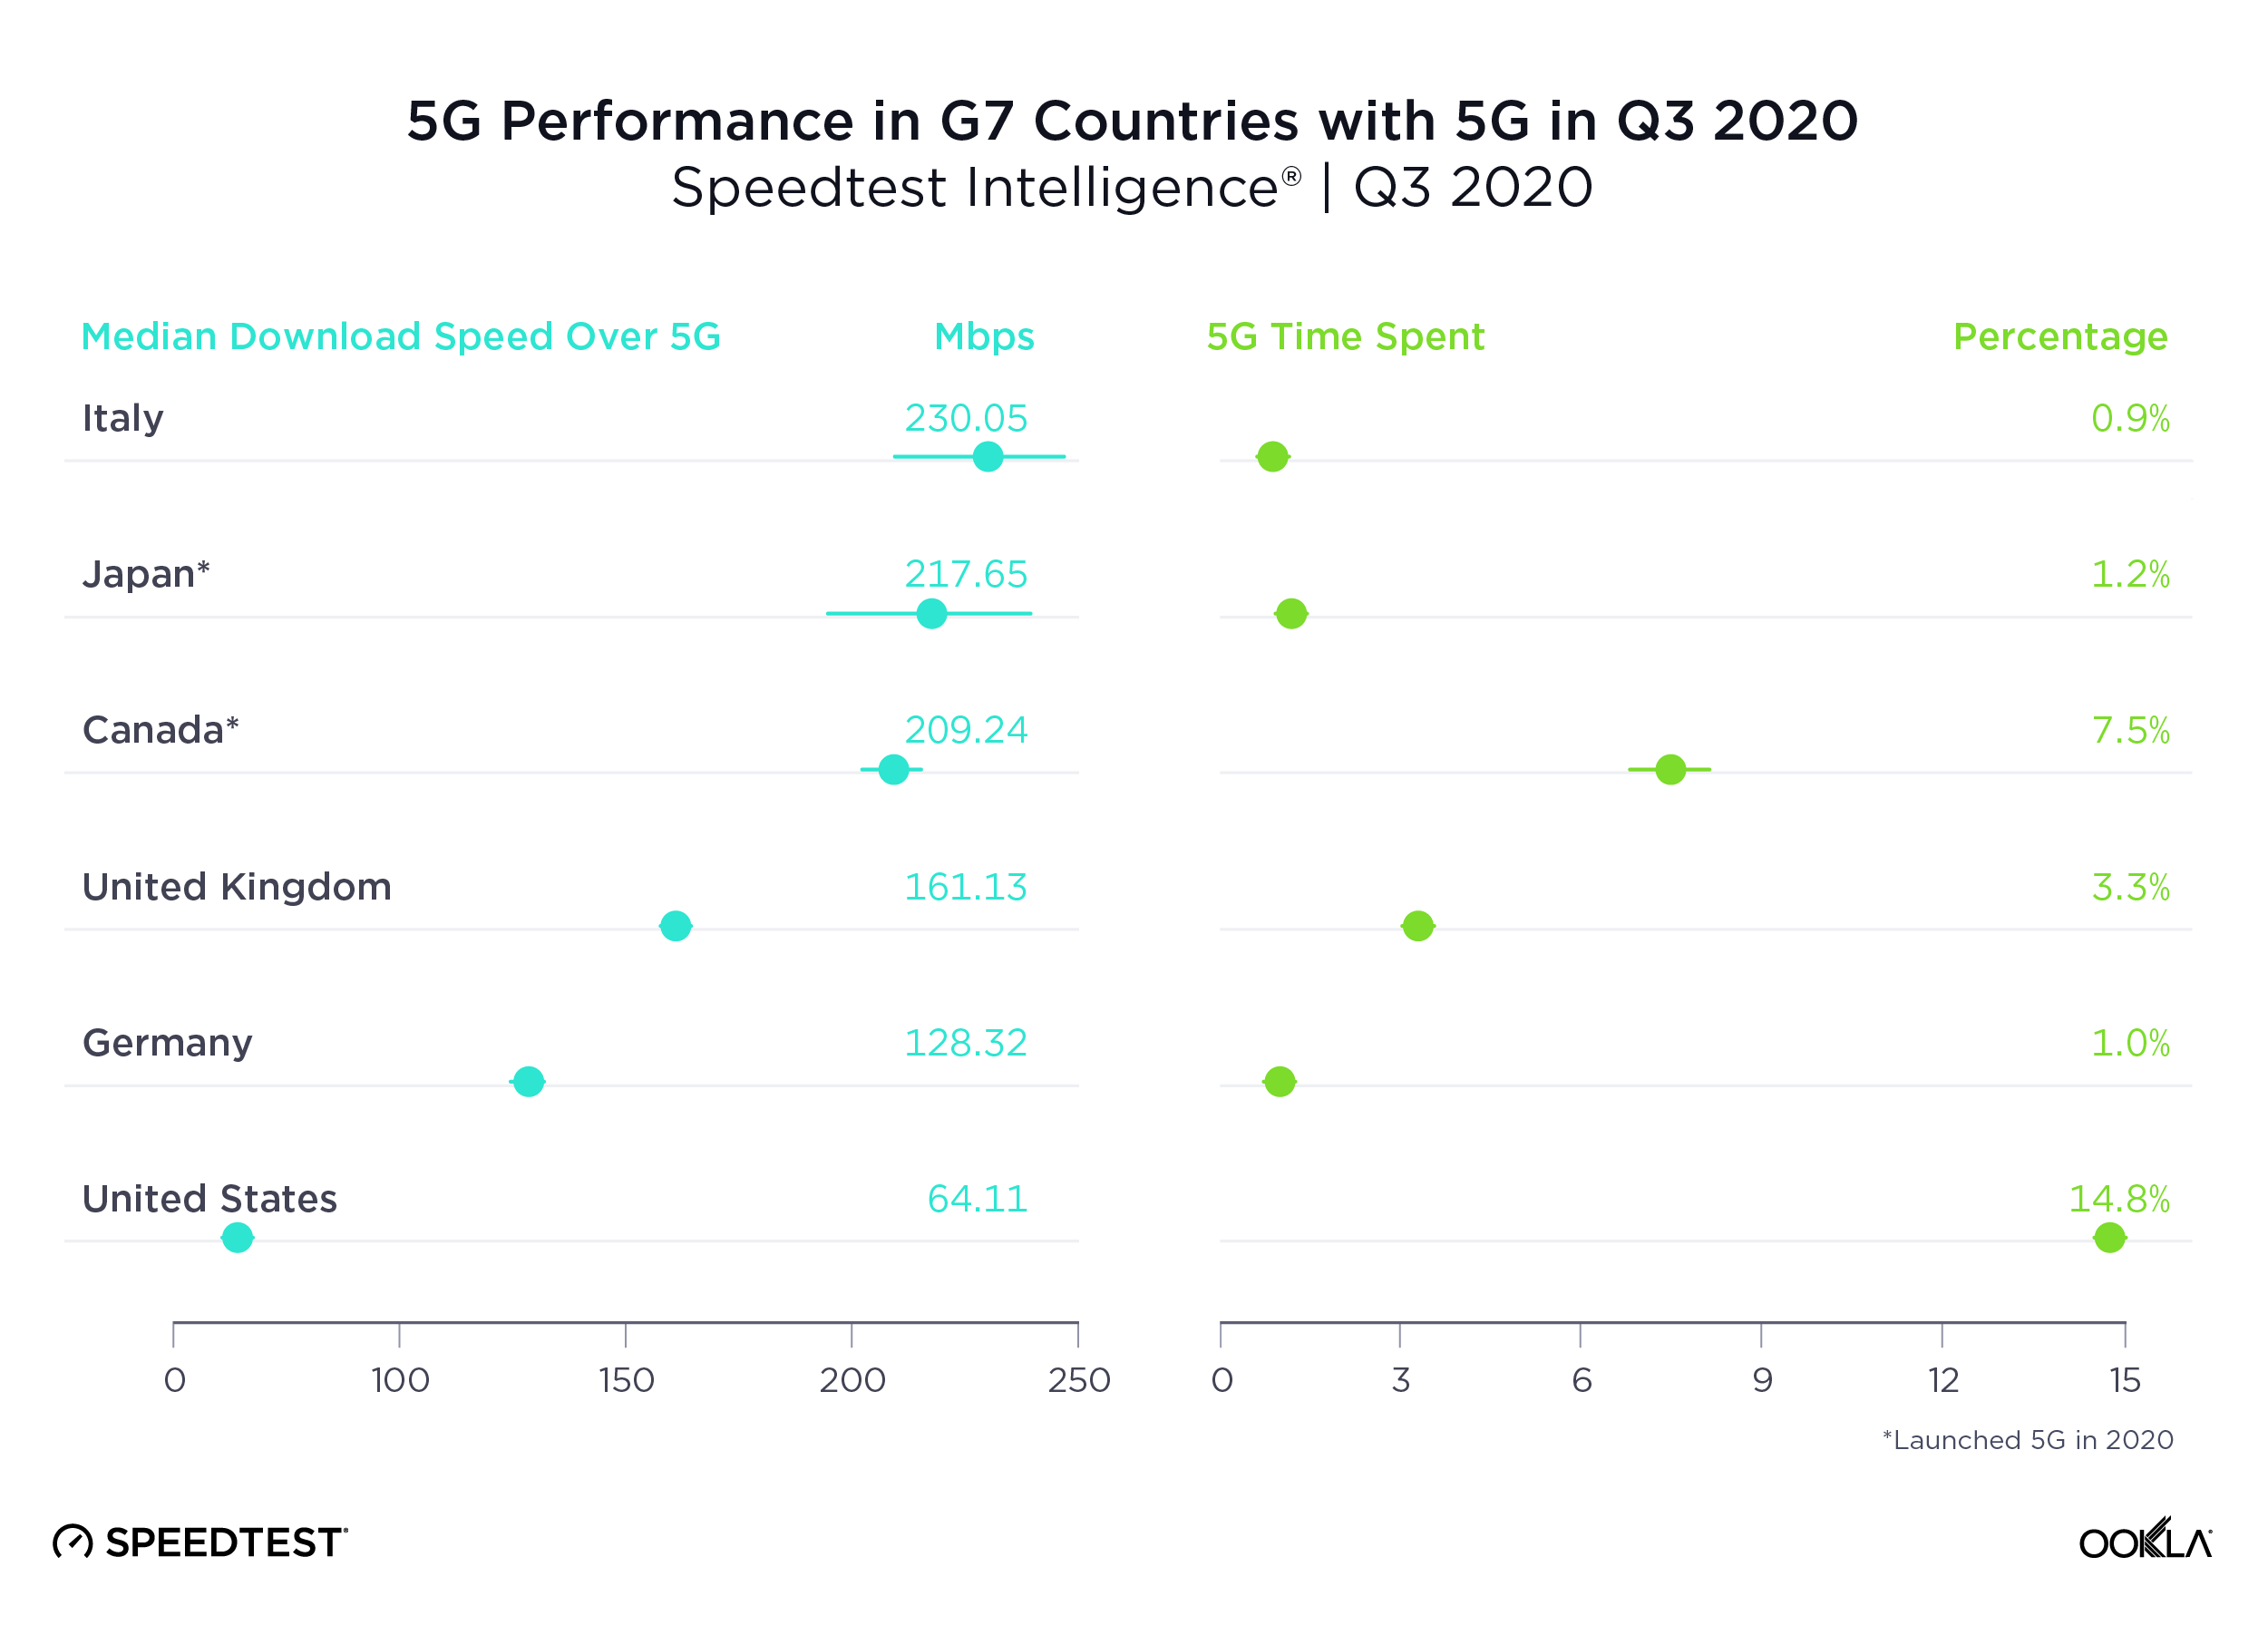
Italy had the fastest 5G among G7 countries, U.S. the slowest

Italy had the fastest median download speed over 5G of all the G7 countries. Japan was second, Canada third, the U.K. fourth and Germany fifth. The U.S. had the highest Time Spent on 5G, followed by Canada. For a deeper analysis of 5G in the U.K., read our previous coverage. Because France launched commercially available 5G only within the last couple of weeks, we have not included it on this table.
5G-Performance-G7-Countries_1220

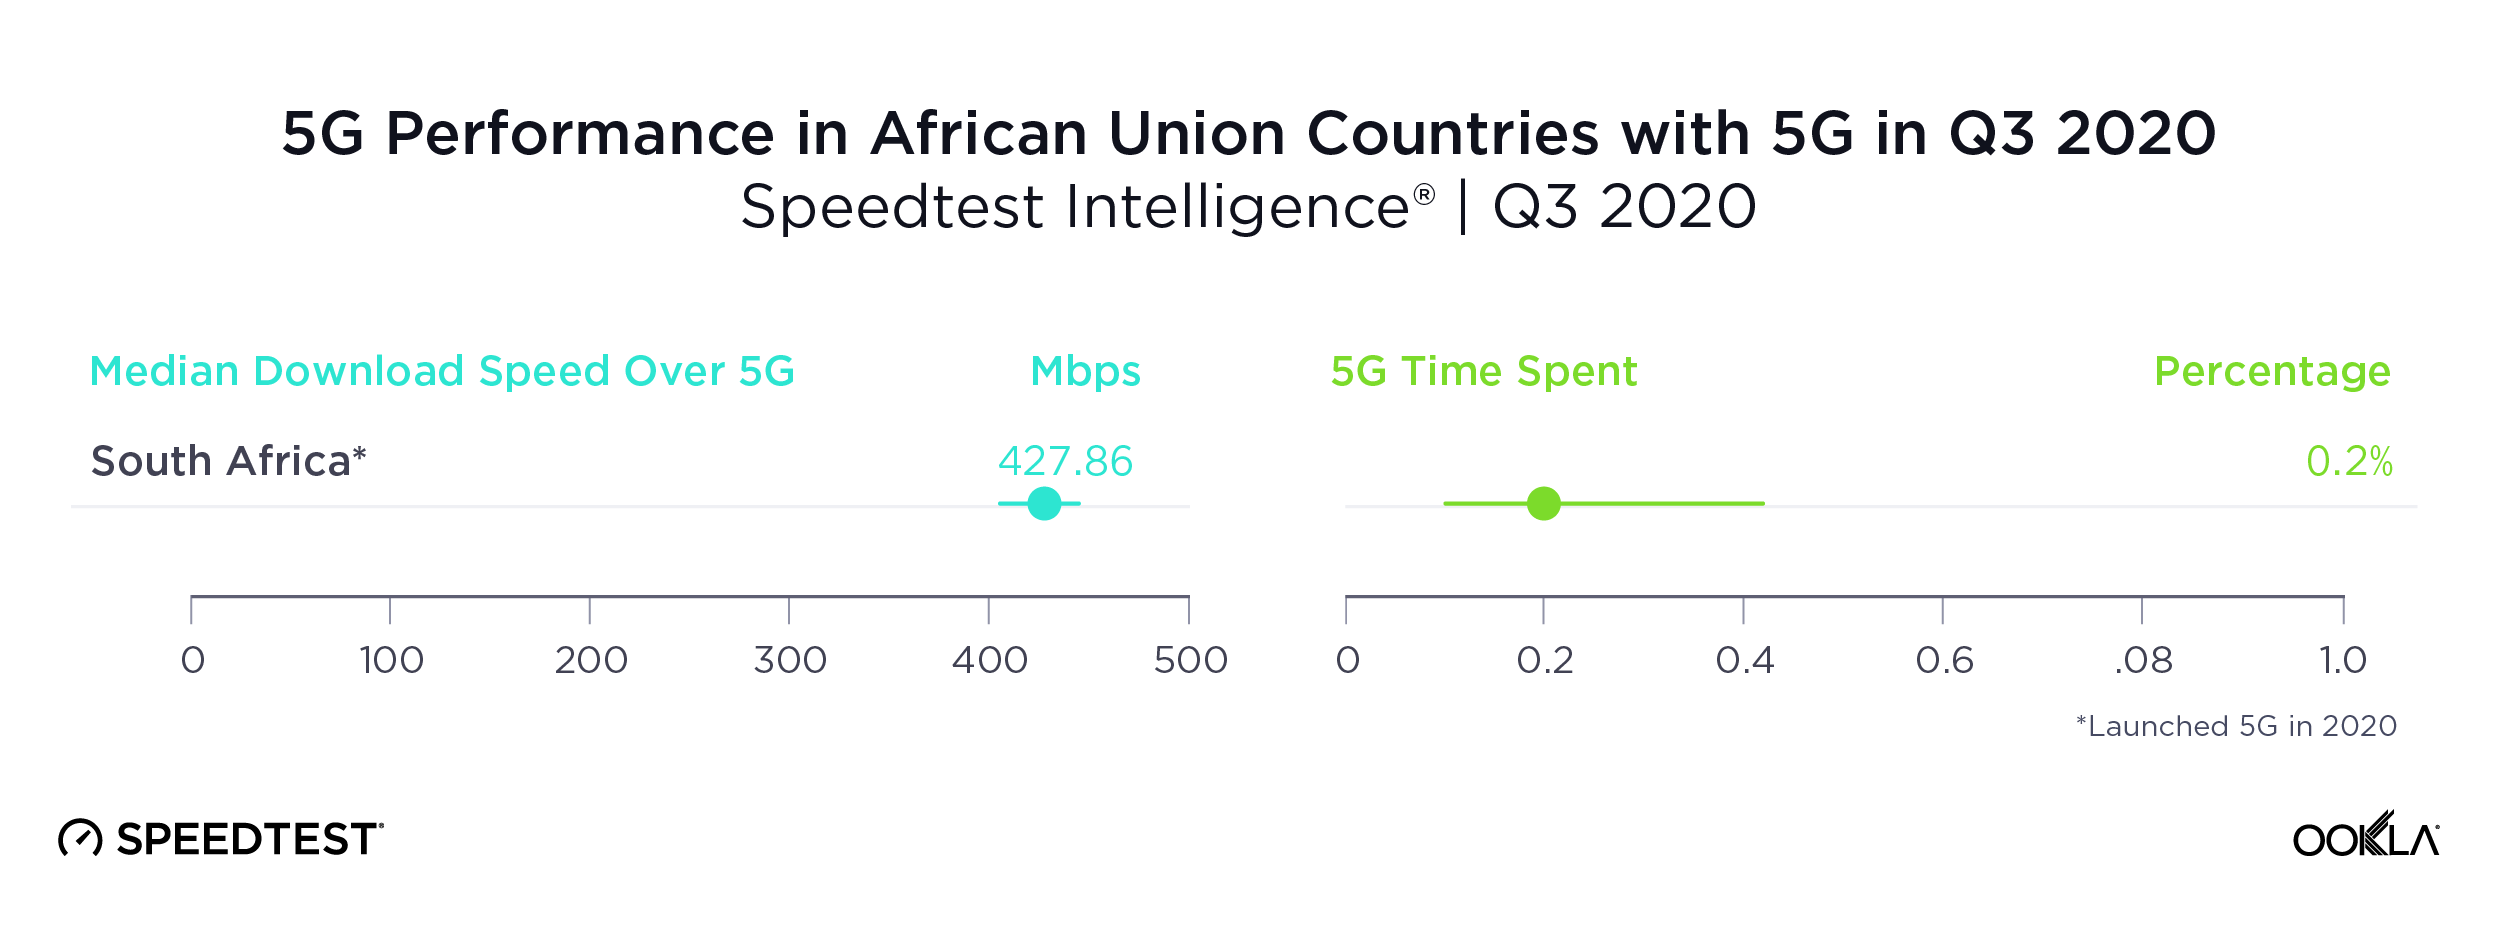
South Africa was the only country in the African Union with sufficient 5G to rate

As we saw above, South Africa’s impressive median download speed over 5G ranked the country third in the world during Q3 2020. South Africa was only one of two countries in the African Union to have commercially available 5G during Q3 2020. The other, Madagascar, did not have sufficient samples to properly analyze. Time Spent on 5G in South Africa was very low, an indication that 5G is not yet widely available there.
5G-Performance-Africa_1220

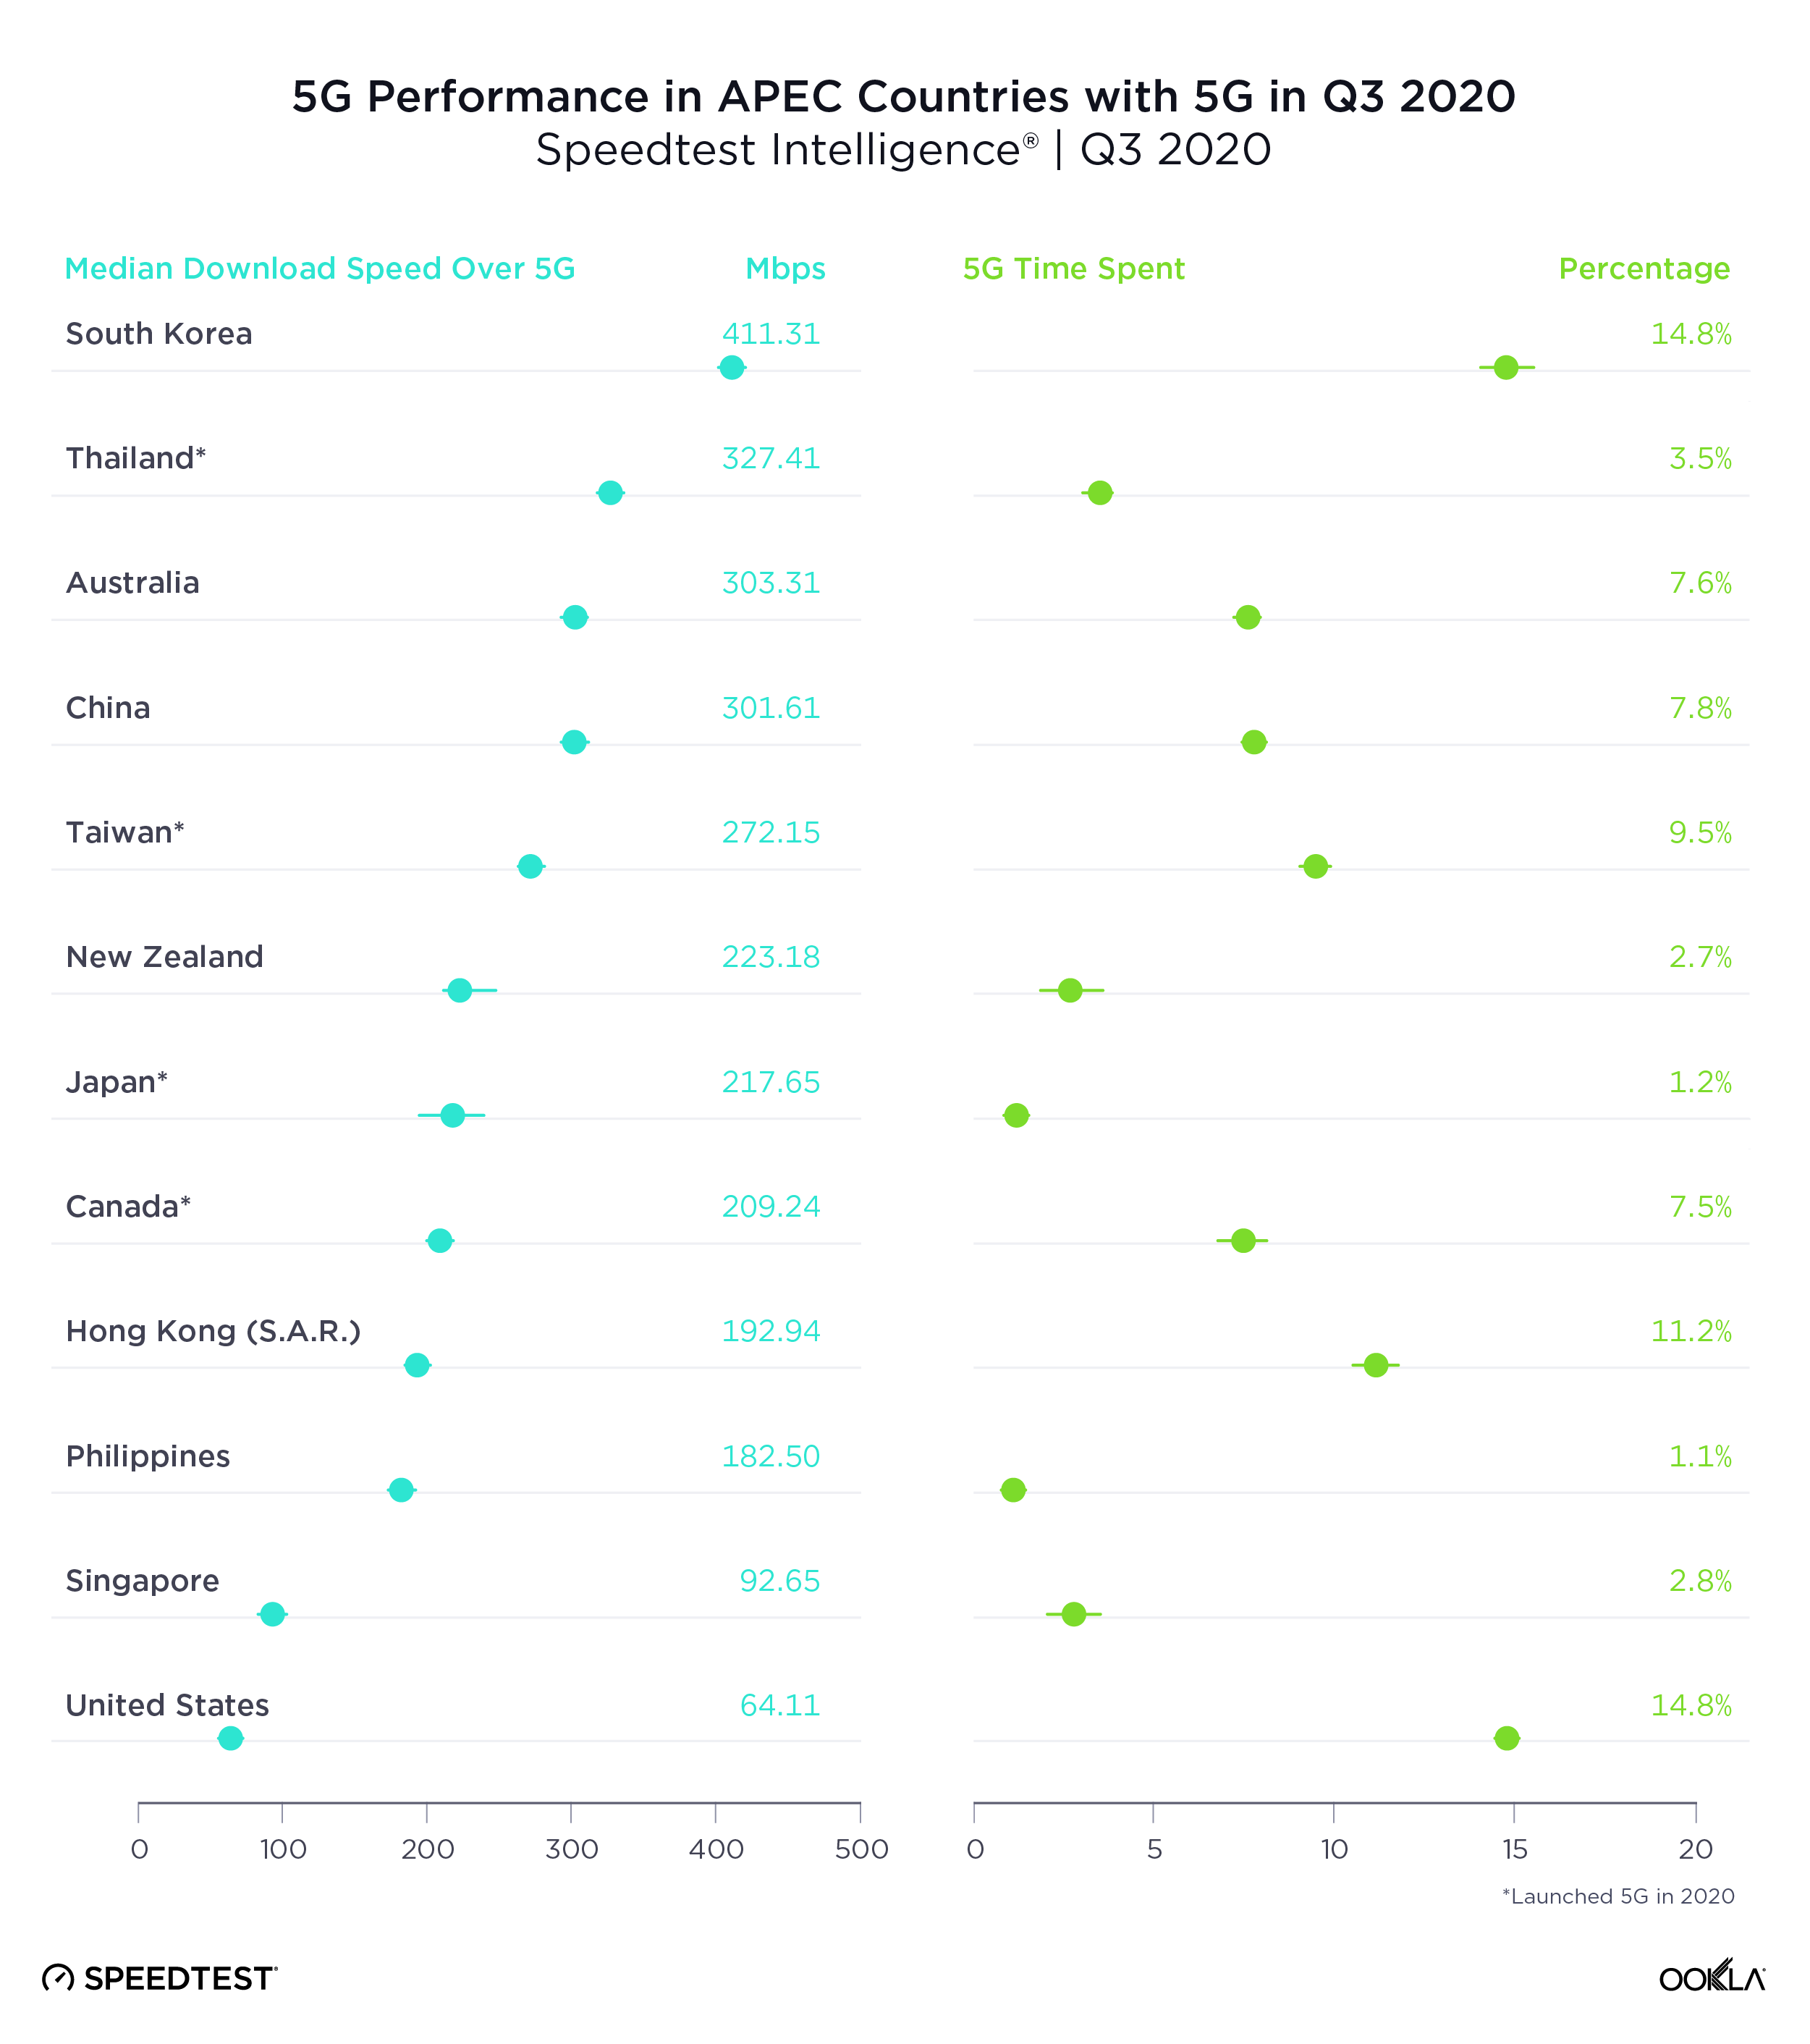
South Korea had the fastest 5G in APEC countries, U.S. the slowest

A median download speed over 5G of 411.11 Mbps put South Korea comfortably at the top of Asia-Pacific Economic Cooperation (APEC) countries with the fastest 5G during Q3 2020. Thailand was second, Australia third, China fourth and Taiwan fifth. 5G speeds represented the largest improvement over 4G in the Philippines where the median download speed over 4G during Q3 2020 (9.36 Mbps) was substantially lower than that of other countries on this list.

South Korea and the U.S. tied for highest Time Spent on 5G among APEC countries during Q3 2020, followed by Hong Kong and Taiwan.
5G-Performance-APEC_1220

Spain had the fastest 5G in the E.U., Poland the slowest

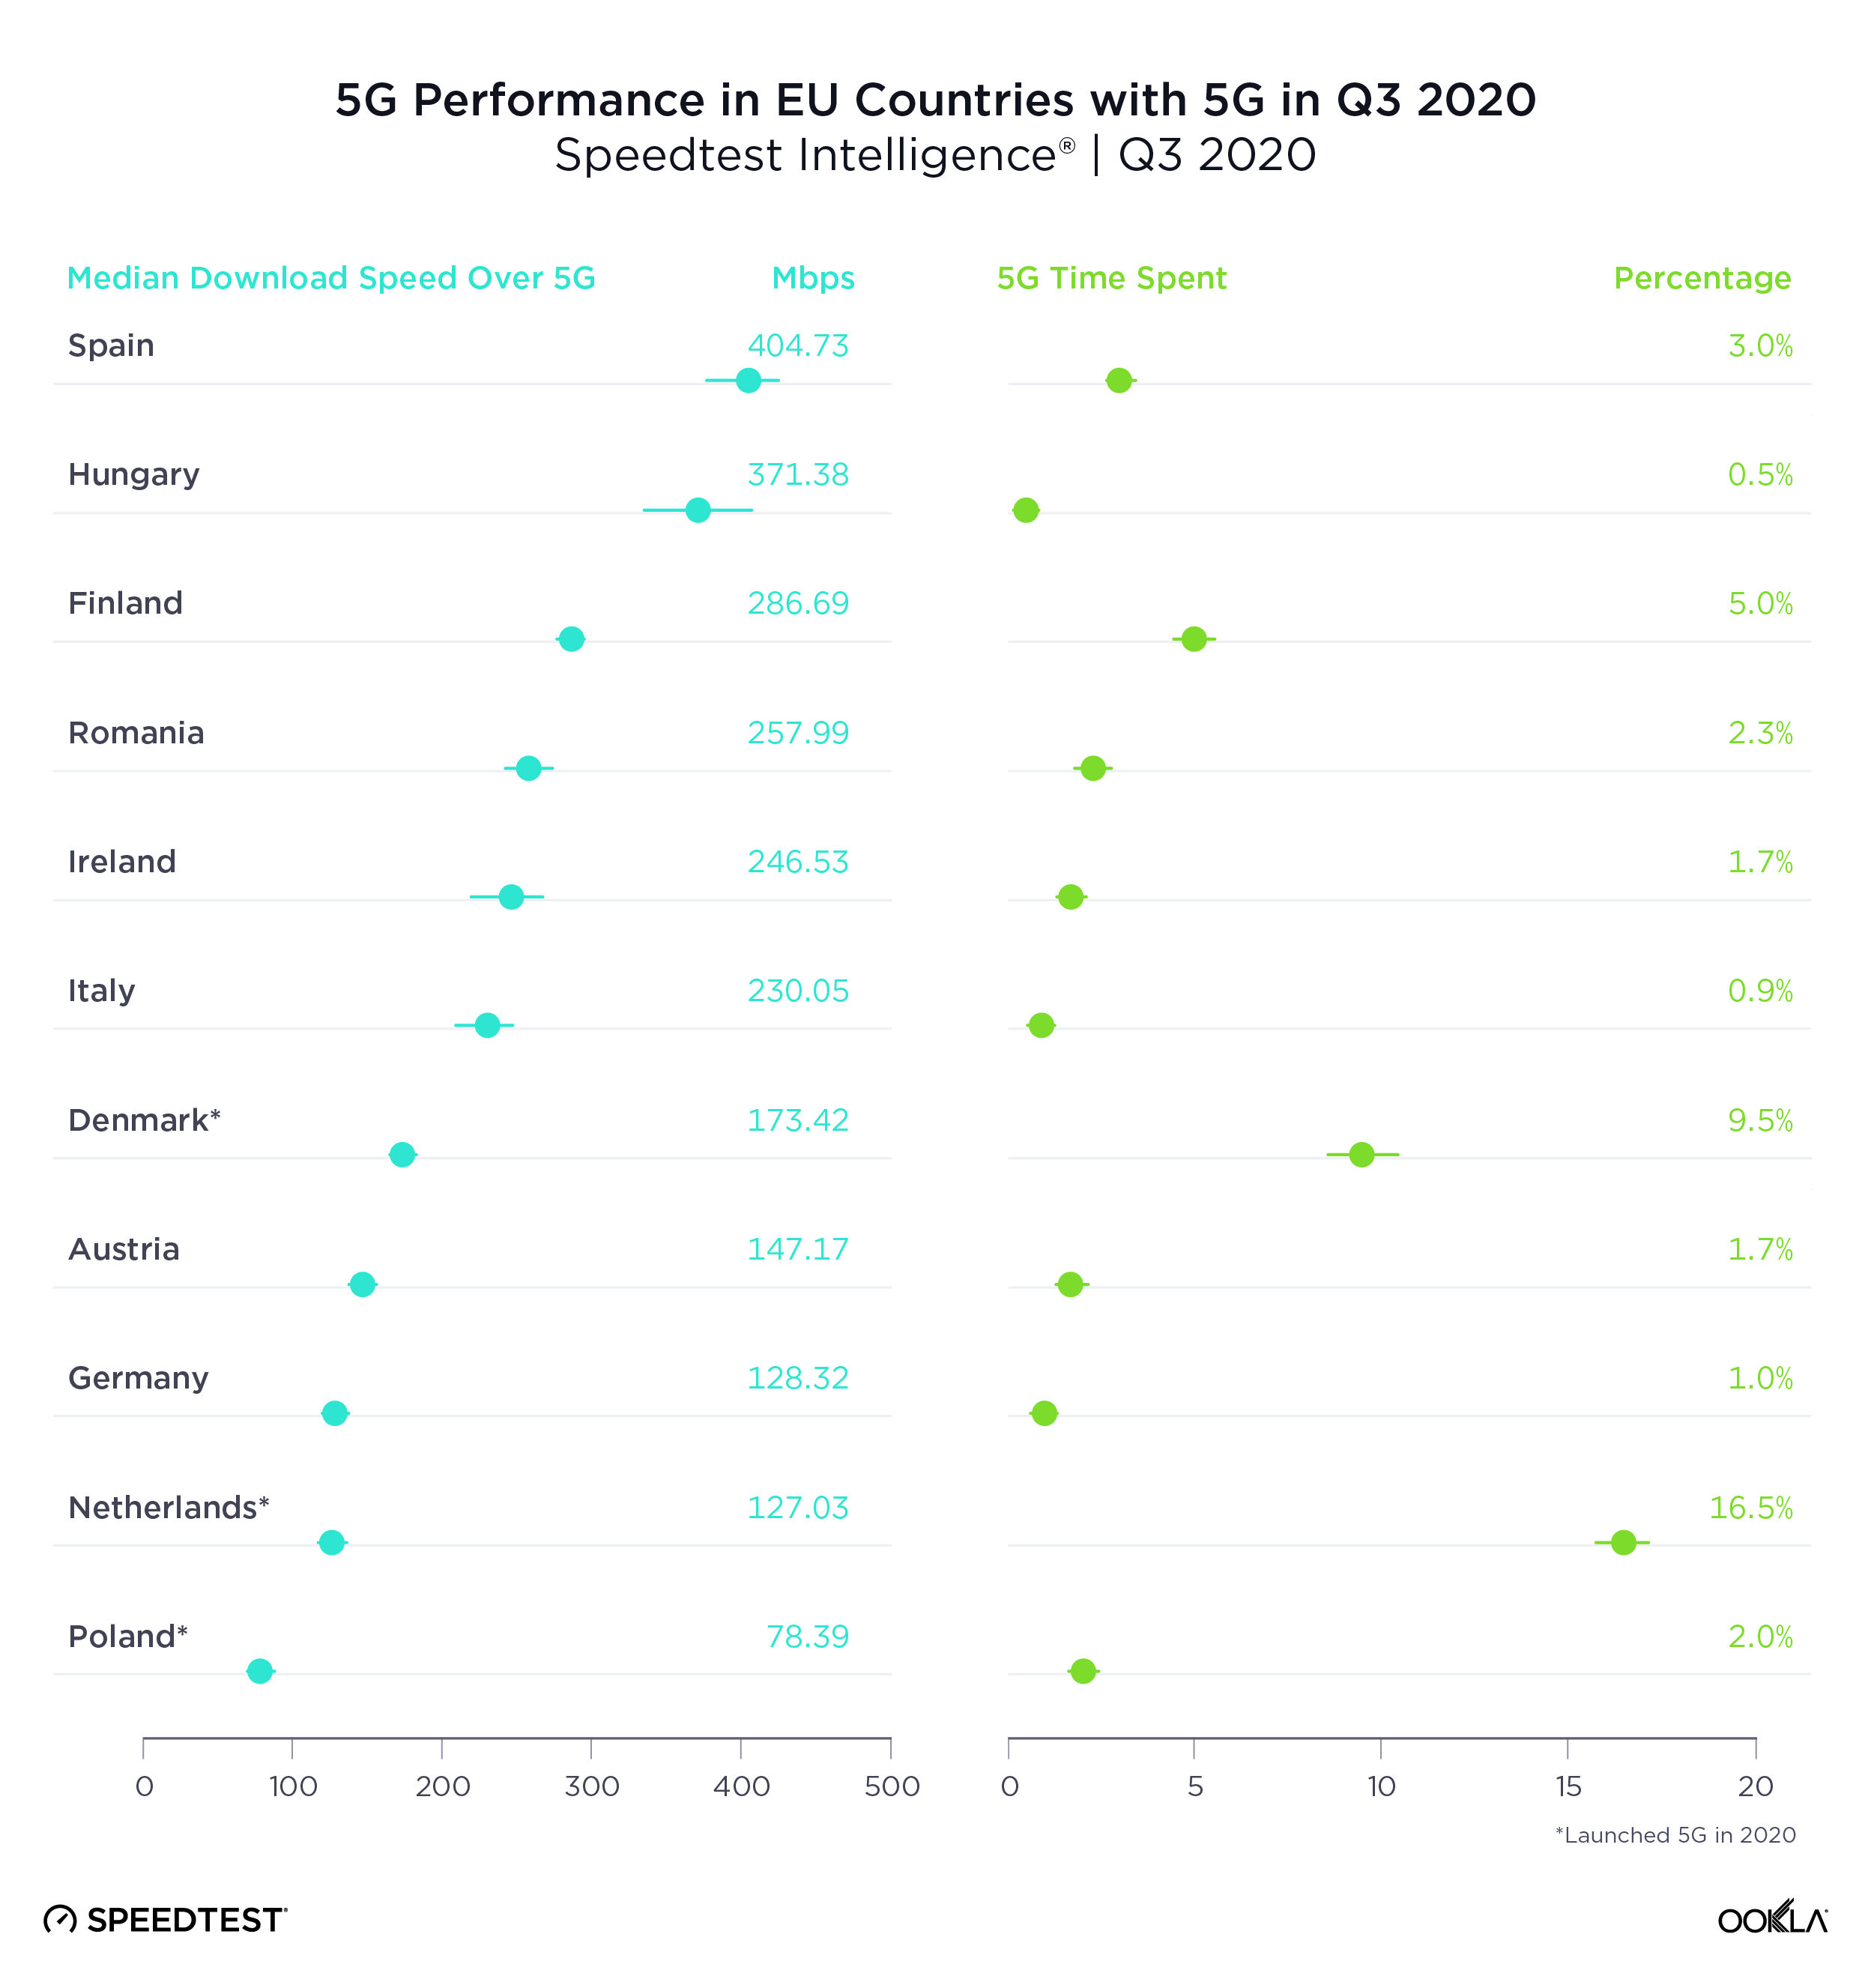
Spain showed the fastest median download speed over 5G among the 11 European Union (E.U.) countries with sufficient 5G samples to rank during Q3 2020. Hungary was second, Finland third, Romania fourth and Ireland fifth. Spain’s median download speed over 5G also represented the largest gain over 4G among all of these countries, partially because Spain had the second slowest median download speed over 4G. France is not included on this list because 5G did not become commercially available in the country until after Q3 2020.

The Netherlands had the highest Time Spent on 5G among E.U. countries during Q3 2020, indicating that customers with 5G phones are able to spend far more time on 5G there than in other E.U. countries. Denmark was second for Time Spent on 5G among EU countries in Q3 2020 and Finland third.
5G-Performance-EU_1220

U.A.E had the fastest 5G in Gulf Cooperation Council Countries

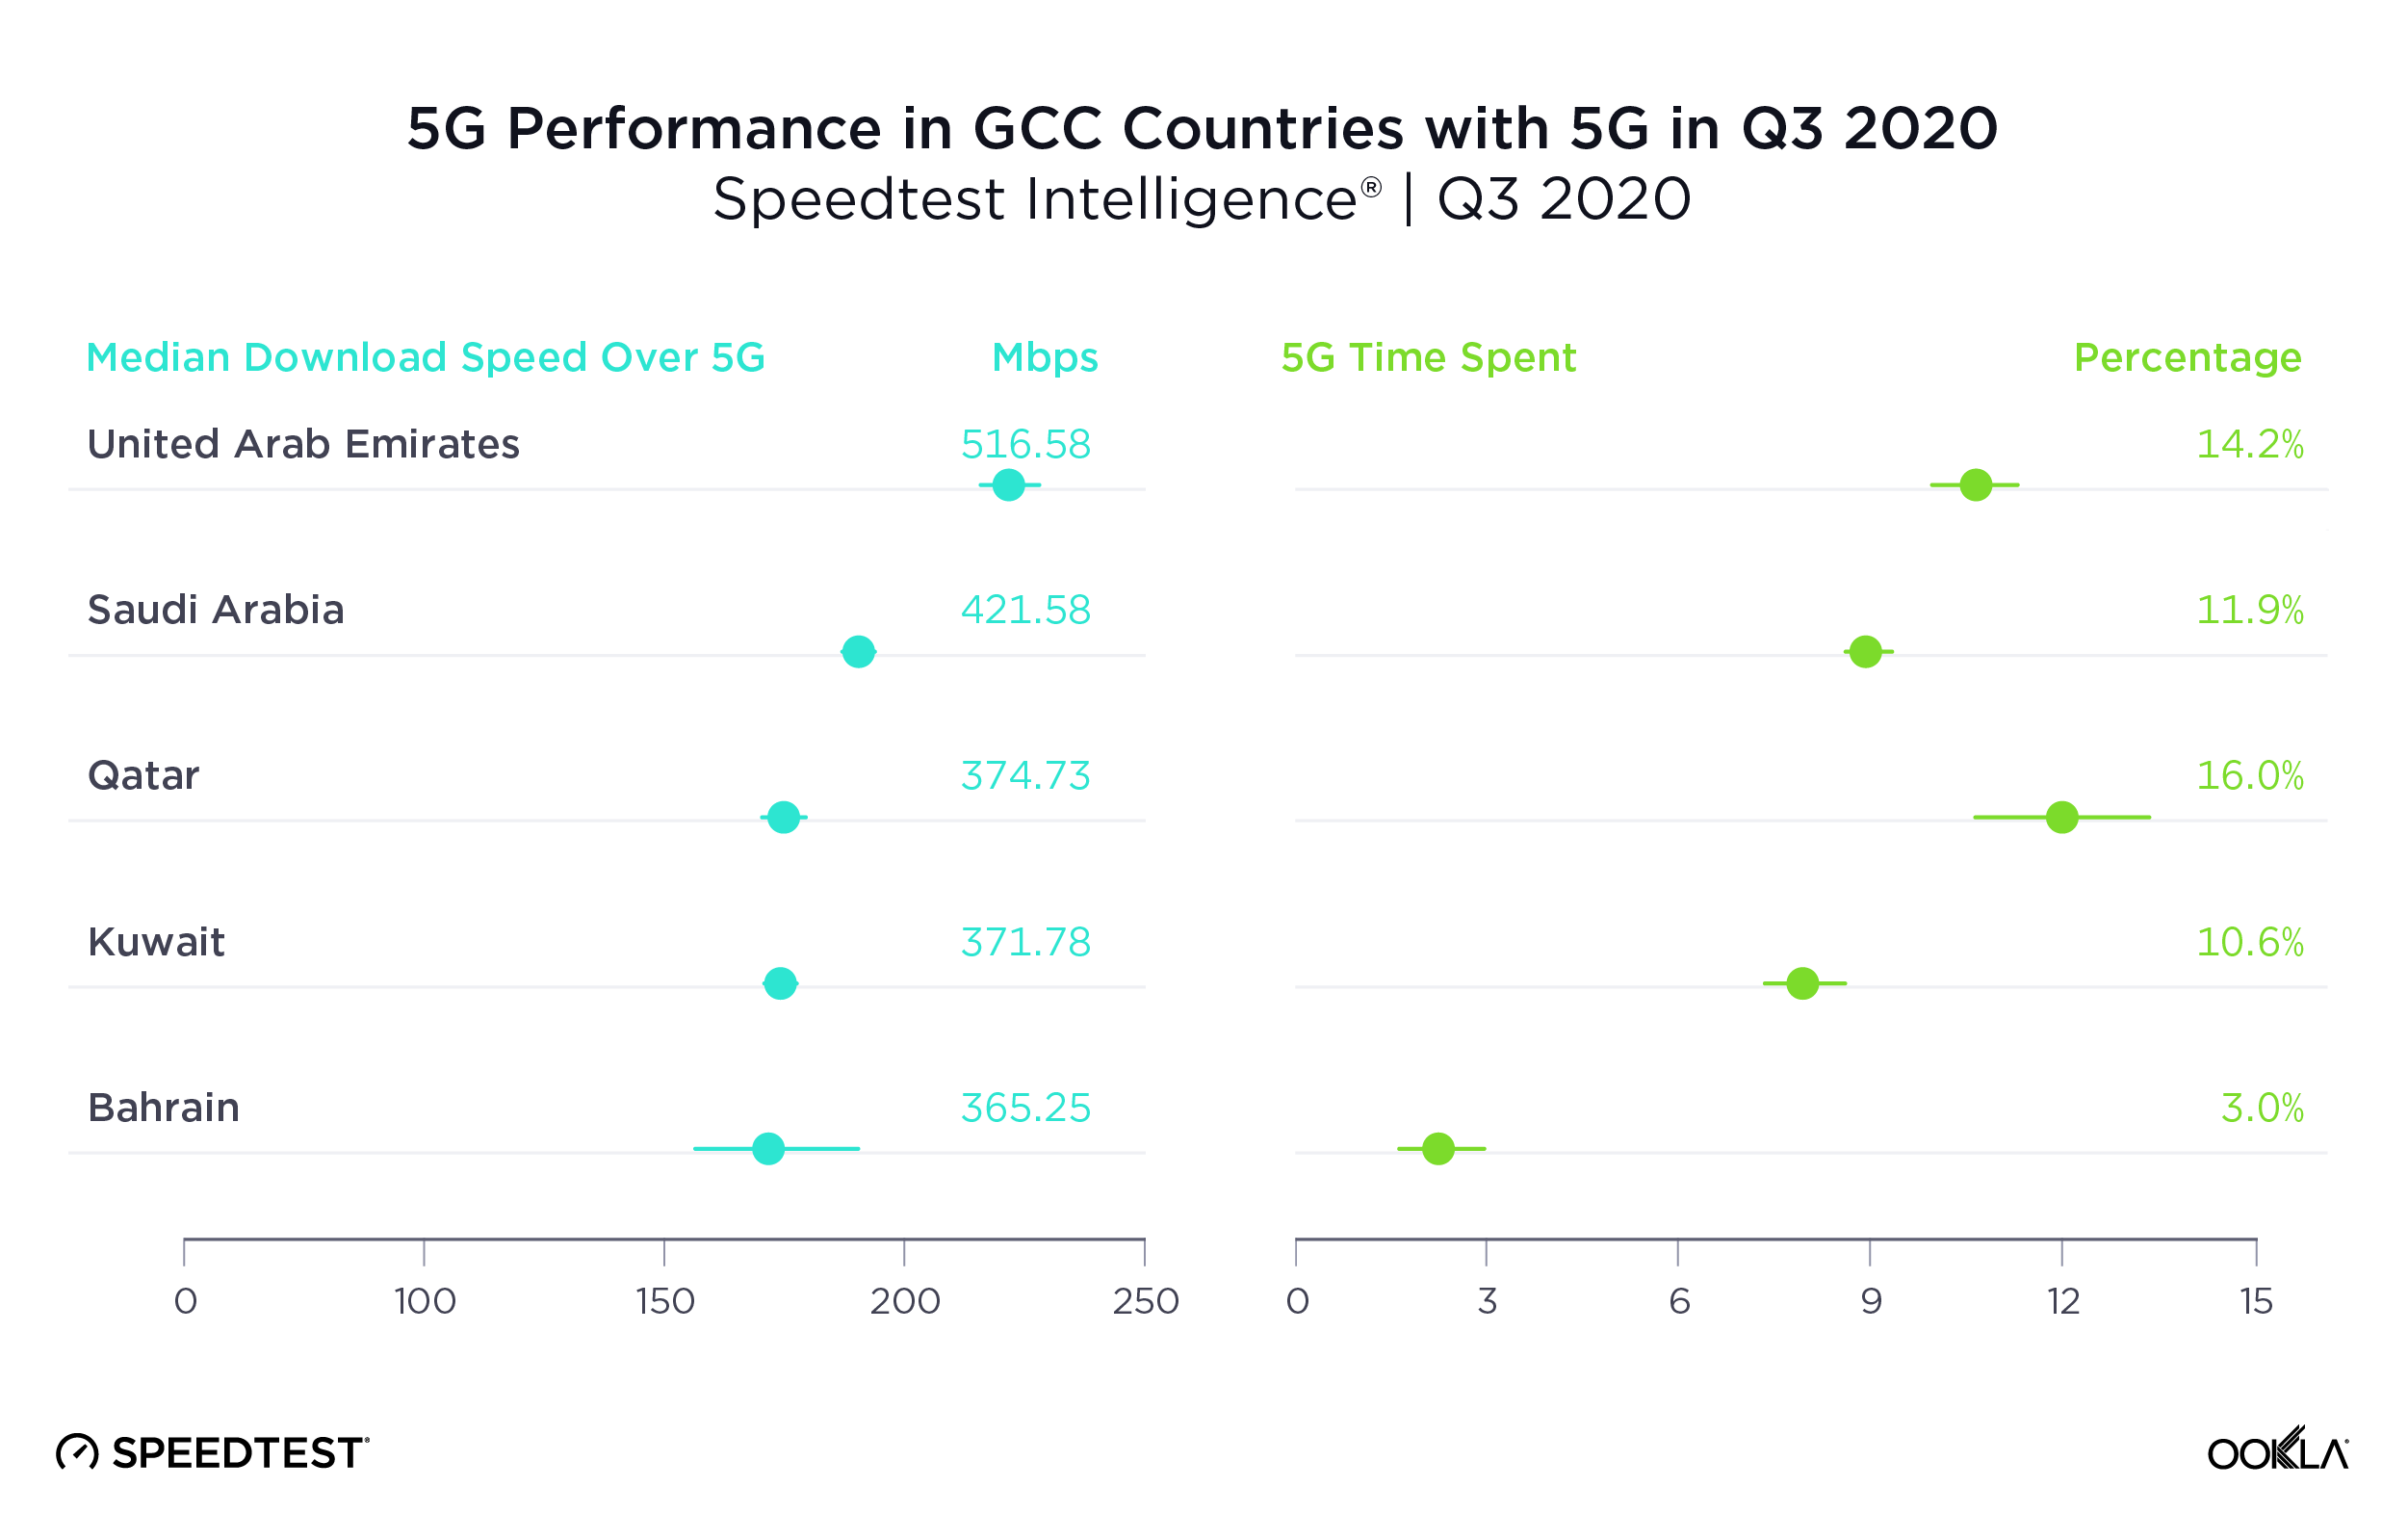
With the second fastest median download speed over 5G in the world, U.A.E. was also the Gulf Cooperation Council (GCC) country with the fastest 5G during Q3 2020. Saudi Arabia was second and Qatar third. While Oman does have commercially available 5G, there were insufficient samples in the country during Q3 2020 to properly analyze performance.

5G represented the largest improvement over 4G in Kuwait and Bahrain, countries that had slower median download speeds over 4G than their neighbors.

Time Spent on 5G was relatively high in all the GCC countries on this list, except Bahrain, when compared to other countries in the world during Q3 2020. Qatar showed the highest Time Spent on 5G among GCC countries in Q3 2020 at 16.0%. U.A.E. was second and Saudi Arabia third.
5G-Performance-GCC_1220

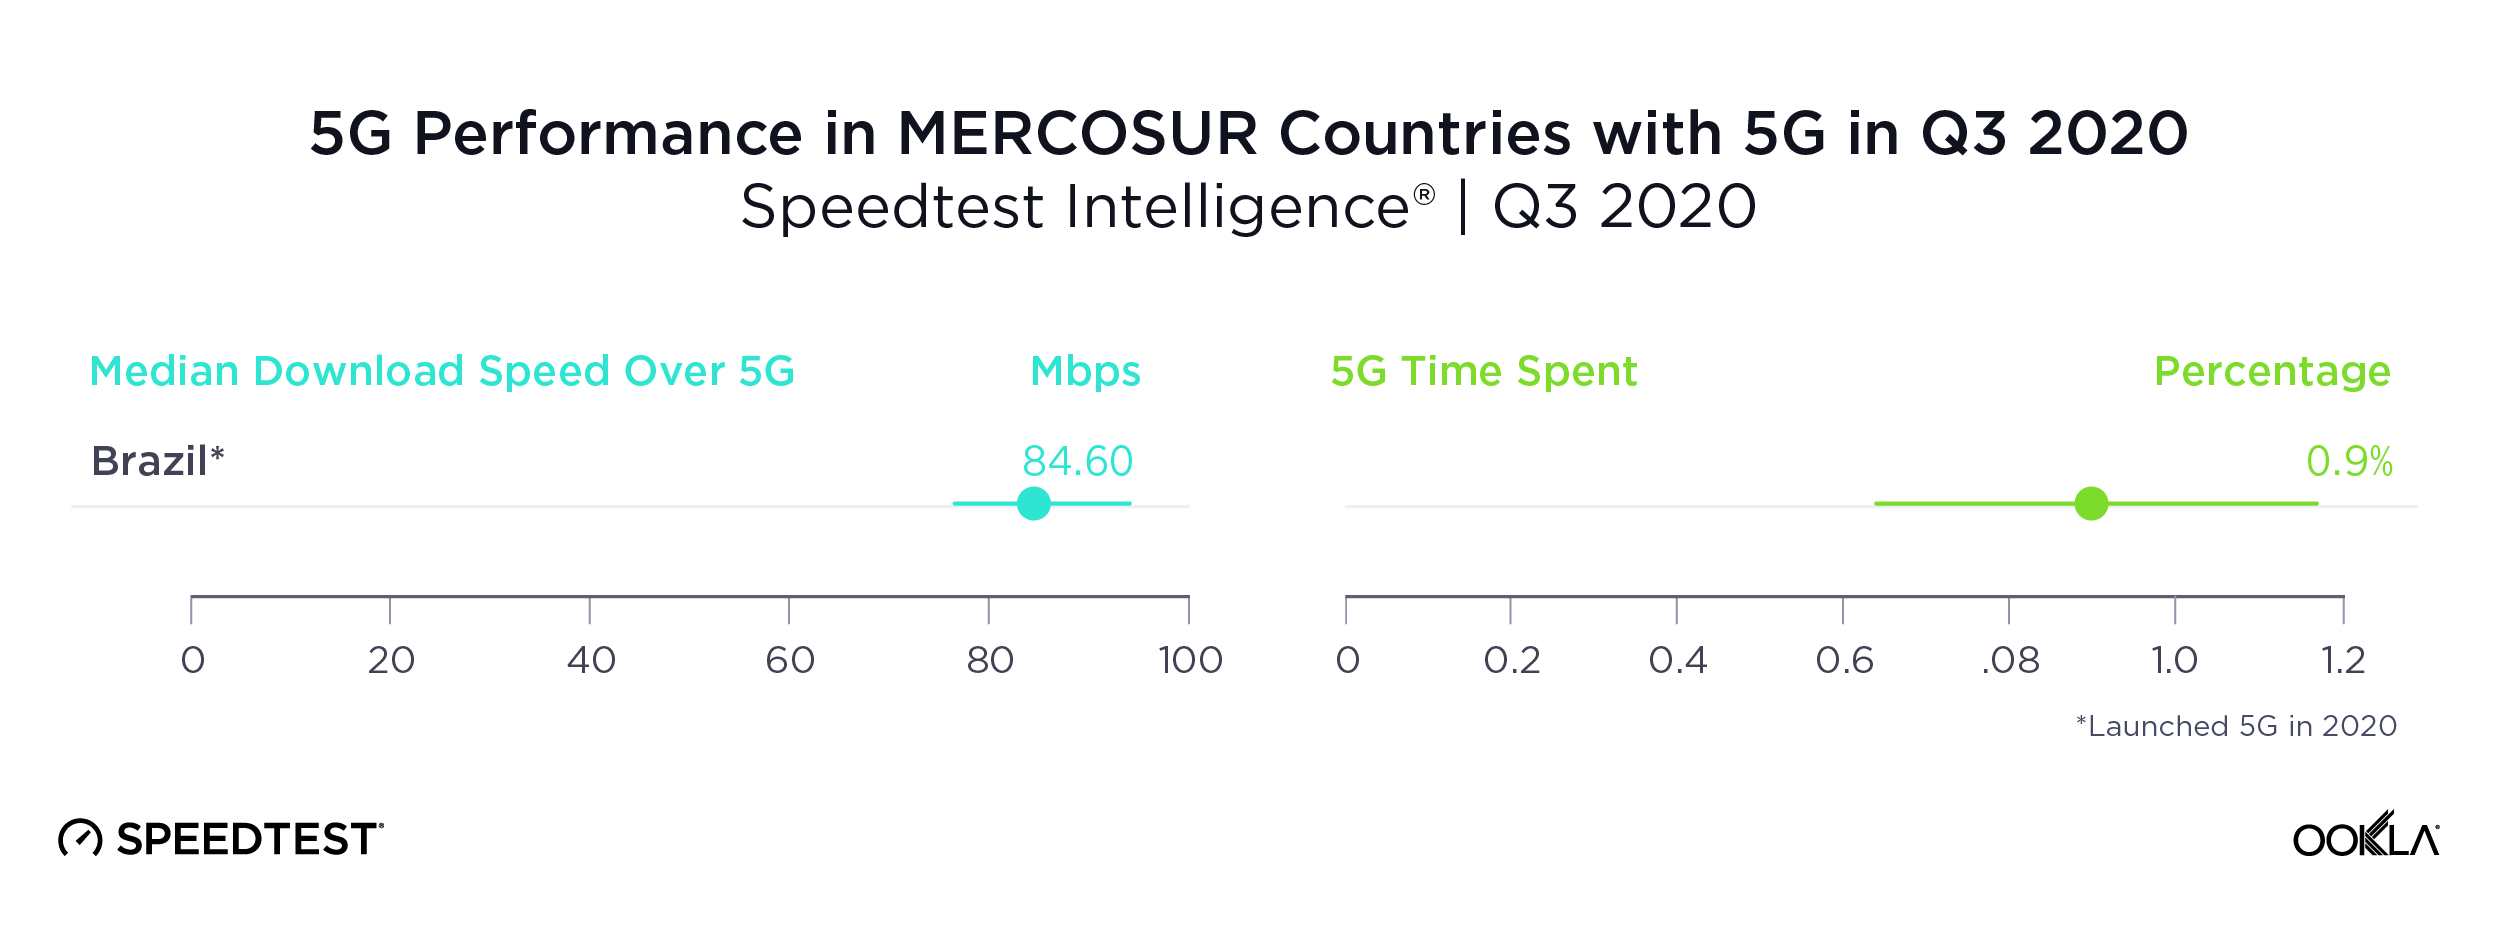
Brazil was the only MERCOSUR country with sufficient 5G to rate

Brazil’s median download speed over 5G of 84.60 Mbps during Q3 2020 may not seem fast for 5G, but it still puts Brazil well ahead of other countries in the Southern Common Market (MERCOSUR), most of which do not yet have 5G at all. We did see 5G results in Colombia, but there were insufficient samples to properly compare.

Time Spent on 5G in Brazil during Q3 2020 was not quite one percent, indicating that customers do not have much access to 5G yet.
5G-Performance-MERCOSUR_1220

The U.S., Europe and Asia see widespread 5G coverage

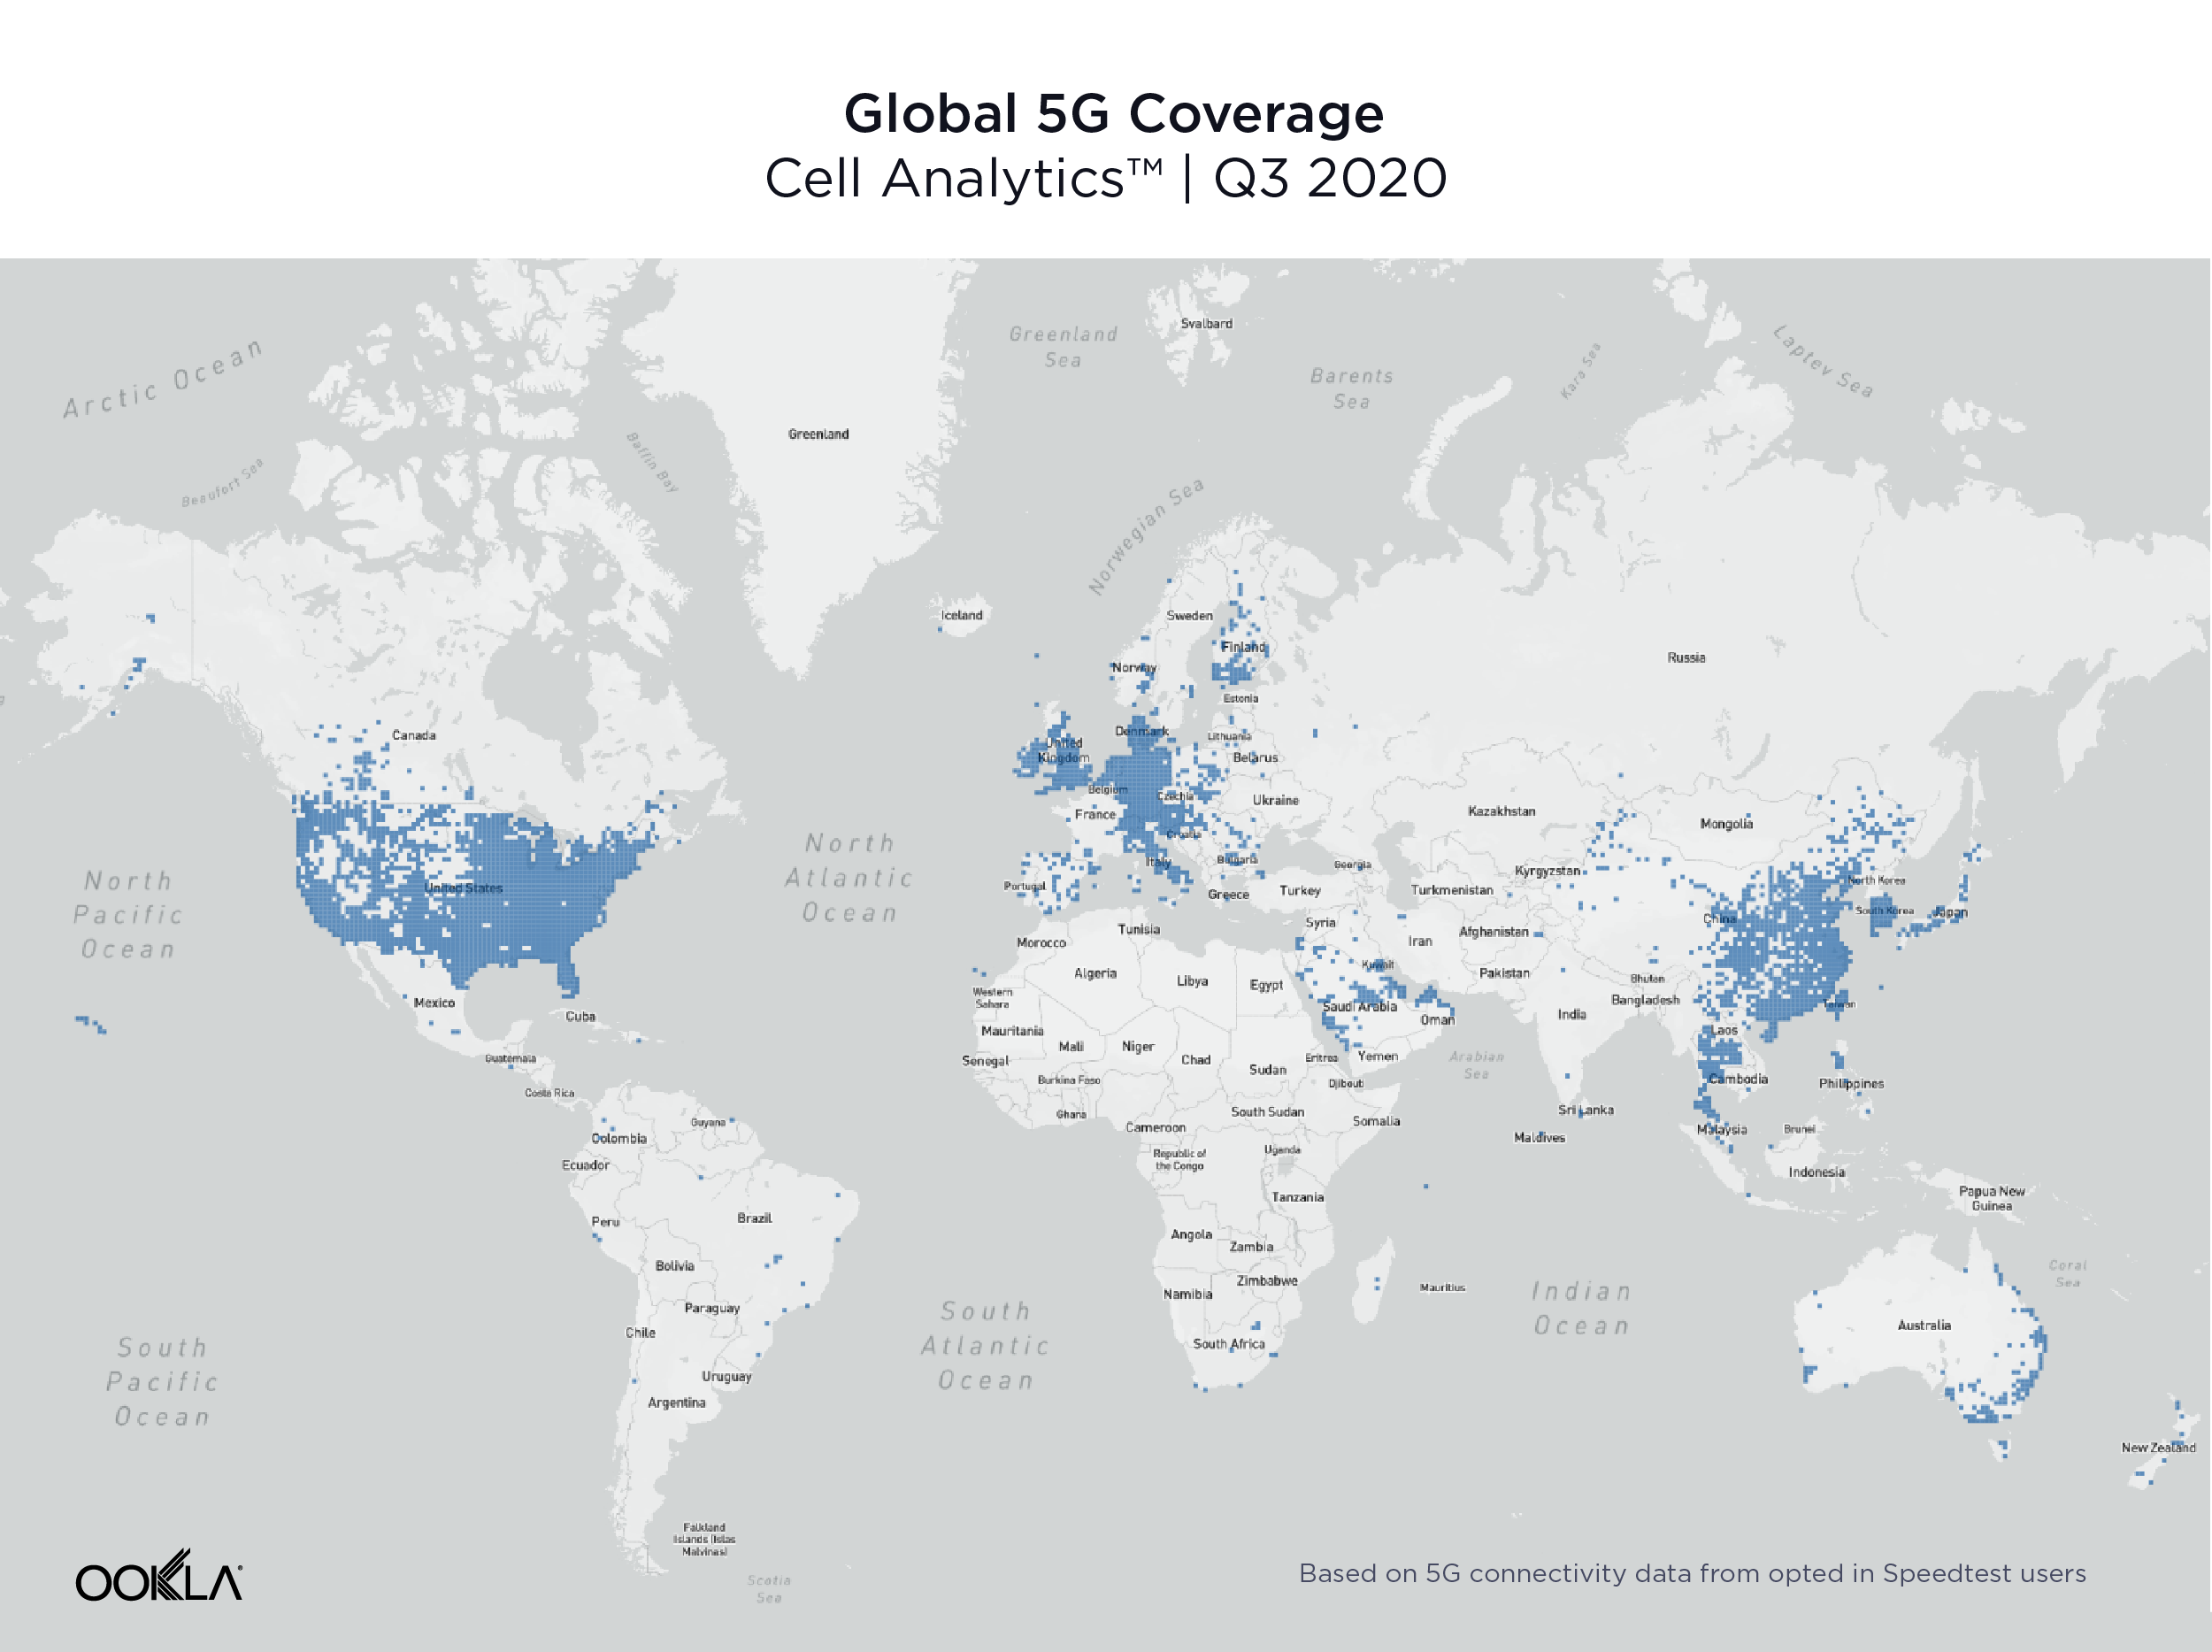
Data from Cell Analytics™ shows a global view of 5G coverage in Q3 2020. This map, based on 5G connectivity data for opted-in Speedtest users, shows that 5G is spreading rapidly across the U.S., Europe, the Arabian Peninsula and Asia. In other regions, 5G is primarily available in larger cities, if at all.
Global-5G-Coverage_1220

99 countries worldwide had 5G, in 14,643 total cities

The number of countries with 5G deployments increased 62.3% between Q3 2019 and Q3 2020, with 99 countries having 5G deployments at the end of Q3 2020, according to the Ookla 5G Map™. There were 14,643 cities worldwide with 5G deployments at the end of Q3 2020, a 1,671% increase over Q3 2019. The total number of deployments worldwide was 17,046. The counts here and throughout this section include commercially available 5G as well as 5G networks with limited availability and those in pre-release.

Countries with the Most 5G Cities
Ookla 5G Map™ | Q3 2020
Country Numbers of Cities with 5G
United States 7,583
Germany 2,312
Austria 1,104
Netherlands* 1,009
Switzerland 554
Thailand* 325
Ireland 214
Puerto Rico 187
United Kingdom 169
Kuwait 97

The U.S. had the most cities with 5G deployments at the end of Q3 2020 with 7,583. Germany was second, Austria third, the Netherlands fourth and Switzerland fifth. A deployment is when a provider has some level of 5G presence in a city. A city can have multiple deployments when more than one provider is present.

Countries with the Largest Growth in Number of Deployments
Ookla 5G Map™ | Q3 2020
Country 5G Deployments as of Q3 2020 % Change Q3 2020 vs Q3 2019
Netherlands* 1,071 50,350%
Thailand* 451 32,401%
United States 7,808 21,566%
Germany 2,417 11,460%
Canada* 93 7,600%
Austria 1,173 4,918%
Ireland 236 4,180%
Poland 81 3,150%
Japan* 75 2,050%
Oman 50 2,000%

The Netherlands showed the largest percentage change in the number of 5G deployments between Q3 2019 and Q3 2020 with a 50,350% jump from two deployments in Q3 2019 to 1,071 in Q3 2020. Thailand saw the second largest percentage increase, the U.S. third, Germany fourth and Canada fifth.

Most early trials and commercial deployments of 5G spectrum allocations around the world have been centered around fallow swaths of the mid-band (3.3 GHz – 4.2 GHz) spectrum. With the recent commercialization of Dynamic Spectrum Sharing (DSS) across all major 5G infrastructure vendors, there is now increasing demand for 5G support on many existing 4G frequencies, ranging from 600 MHz to 2.5 GHz. In unique 5G markets like Japan, there is an additional need for the 4.5 GHz band as well as the millimeter wave (FR2).

In the United States, early deployments leveraged millimeter wave frequency bands in the 28 GHz and the 39 GHz, which delivered impressive speeds in a very constrained footprint. The rapid 5G deployment in the 600 MHz band has added a substantial nationwide 5G footprint — and with that, much wider 5G availability for many more Americans. With the recent merger between T-Mobile and Sprint, the deployment of 2.5 GHz spectrum has been significantly accelerated, which should improve both network efficiency and user experience on T-Mobile’s network. Additionally, next year’s availability of 5G Carrier Aggregation will allow T-Mobile to combine 600 MHz with 2.5 GHz to deliver improved 5G speeds on top of the existing nationwide footprint. In addition, DSS has recently been deployed by AT&T and Verizon, which allows operators to choose from existing low-band spectrum assets (850 MHz) and deliver both LTE and 5G at the same time. This feature alone doesn’t add a significant boost in perceived user experience, but will certainly improve the 5G footprint.

China showed the highest percentage of 5G test samples

Another way to measure 5G adoption is to look at the proportion of samples taken over 5G relative to the total number of samples on all technologies. Speedtest Intelligence is uniquely positioned to measure global growth in 5G because of the worldwide adoption of Speedtest apps. China had the highest percentage of 5G Speedtest results compared to other mobile technology types in Q3 2020 at 18.9%. South Korea was second, Hong Kong third, Puerto Rico fourth and Qatar fifth.

Countries with the Most 5G
Speedtest Intelligence® | Q3 2020
Country 5G Samples as a % of Total
China 18.9%
South Korea 15.8%
Hong Kong (S.A.R.)* 7.9%
Puerto Rico 6.7%
Qatar 5.7%
United States 5.5%
Netherlands* 4.9%
United Arab Emirates 4.6%
Kuwait 4.6%
Australia 4.2%

What 5G will look like in 2021

With recently announced device chipset advancements expected in 2021, including 5G Carrier Aggregation, operators will be able to combine two 5G frequency bands in the sub-6GHz (FR1) range, allowing not only faster speeds, but also greater coverage. More importantly, the ability to combine Frequency Division Duplexing (FDD) and Time Division Duplexing (TDD) FR1 channels will enable operators to leverage low-band frequencies (sub-1GHz) for uplink transmissions (user device to cell site), while combining the low-band with the mid-band (2.5 GHz, 3.5 GHz) on the downlink. This should significantly expand the availability of fast 5G download speeds across larger geographies.

Similarly, DSS — which is a stepping stone to standalone 5G and allows for the simultaneous delivery of 4G and 5G technology on the same spectrum slice — will enable operators to combine already-deployed FDD spectrum with dedicated mid-band spectrum for an enhanced standalone 5G experience. This will unlock the full potential of 5G networks, such as ultra low latency and network slicing, while delivering an improved mobile experience to users.

Where 5G fails to reach

During Q3 2020 Speedtest Intelligence showed 55 countries in the world (with more than 200 samples) where more than 20% of samples were from 2G and 3G connections (combined). These are countries where, in many cases, 5G is still aspirational. As excited as we are about the expansion of 5G, we do not want to see these countries left behind.

Countries That Still Rely Heavily on 2G and 3G Connections
Speedtest Intelligence® | Q3 2020
Country 2G & 3G Samples 4G Samples
Turkmenistan 74.9% 25.1%
Rwanda 52.3% 47.7%
Iraq 49.4% 50.6%
Belarus 46.5% 53.5%
Afghanistan 46.0% 54.0%
Antigua and Barbuda 40.2% 59.8%
Tajikistan 40.2% 59.8%
Suriname 39.7% 60.3%
Haiti 37.7% 62.3%
Syria 37.5% 62.5%
Ghana 36.0% 64.0%
Ethiopia 35.0% 65.0%
Mozambique 34.7% 65.3%
Benin 34.3% 65.7%
Angola 34.1% 65.9%
El Salvador 32.5% 67.5%
Moldova 31.8% 68.2%
Venezuela 30.3% 69.7%
Tanzania 30.0% 70.0%
Papua New Guinea 29.5% 70.5%
Jamaica 29.4% 70.6%
Sudan 29.2% 70.8%
Algeria 29.0% 71.0%
Namibia 28.5% 71.5%
Zimbabwe 28.5% 71.5%
Somalia 28.4% 71.6%
Nicaragua 28.1% 71.9%
Armenia 28.1% 71.9%
Bosnia and Herzegovina 28.1% 71.9%
Uzbekistan 27.8% 72.2%
Cameroon 27.5% 72.5%
Zambia 27.4% 72.6%
Uganda 26.6% 73.4%
Trinidad and Tobago 26.6% 73.4%
Honduras 26.5% 73.5%
Bangladesh 26.3% 73.7%
Burkina Faso 26.0% 74.0%
Ukraine 25.8% 74.2%
Nigeria 25.7% 74.3%
DR Congo 24.6% 75.4%
Costa Rica 24.3% 75.7%
Botswana 24.1% 75.9%
Libya 22.9% 77.1%
Azerbaijan 22.9% 77.1%
Ecuador 22.8% 77.2%
Mali 22.4% 77.6%
Mongolia 21.8% 78.2%
Maldives 21.6% 78.4%
Mauritius 21.3% 78.7%
Tunisia 21.0% 79.0%
Belize 20.7% 79.3%
Laos 20.5% 79.5%
Kenya 20.3% 79.7%
Paraguay 20.1% 79.9%
Côte d’Ivoire 20.0% 80.0%

In markets where 4G layers haven’t been deployed or substantially covered, end users fall back to the circuit-switched network (2G, 3G). These decades-old network technologies should be sufficient for basic voice and texting, social media, and navigation apps, but cannot deliver rich media experiences or video calling. Unfortunately, many countries on this list are places where consumers rely primarily on mobile phones for their internet connectivity.

5G is radically changing the speeds and capabilities of mobile networks around the world. If the current growth rate continues, it won’t be long before most nations have access to 5G. But there are nations and subsets of subscribers who may not see the benefits of 5G for years to come. We will continue reporting on 5G achievements across the globe and watching speeds in general on the Speedtest Global Index™.

Ookla retains ownership of this article including all of the intellectual property rights, data, content graphs and analysis. This article may not be quoted, reproduced, distributed or published for any commercial purpose without prior consent. Members of the press and others using the findings in this article for non-commercial purposes are welcome to publicly share and link to report information with attribution to Ookla.