| February 16, 2023

Spectrum: An Essential Ingredient to Ensure Good 5G Performance

We have recently written about 5G performance at length, ranked the countries, looked at operators’ 5G strategies, and even commented on consumers’ perception of 5G performance. Most recently, we commented on the state of the worldwide 5G in 2022 and the fastest 5G mobile devices. This article will examine the relationship between spectrum and 5G performance.

Key takeaways:

  • Based on Speedtest Intelligence® data, we can see a significant variance between countries in median 5G speed, with four broad clusters of 5G performance emerging: 5G Leaders, High Performers, Improvers, and 5G Outliers. 
  • 5G performance depends heavily on the operator’s 5G spectrum holding.
  • The larger the allocation of the C-band spectrum, the faster the 5G download speed, with the contiguous spectrum enhancing performance further. 
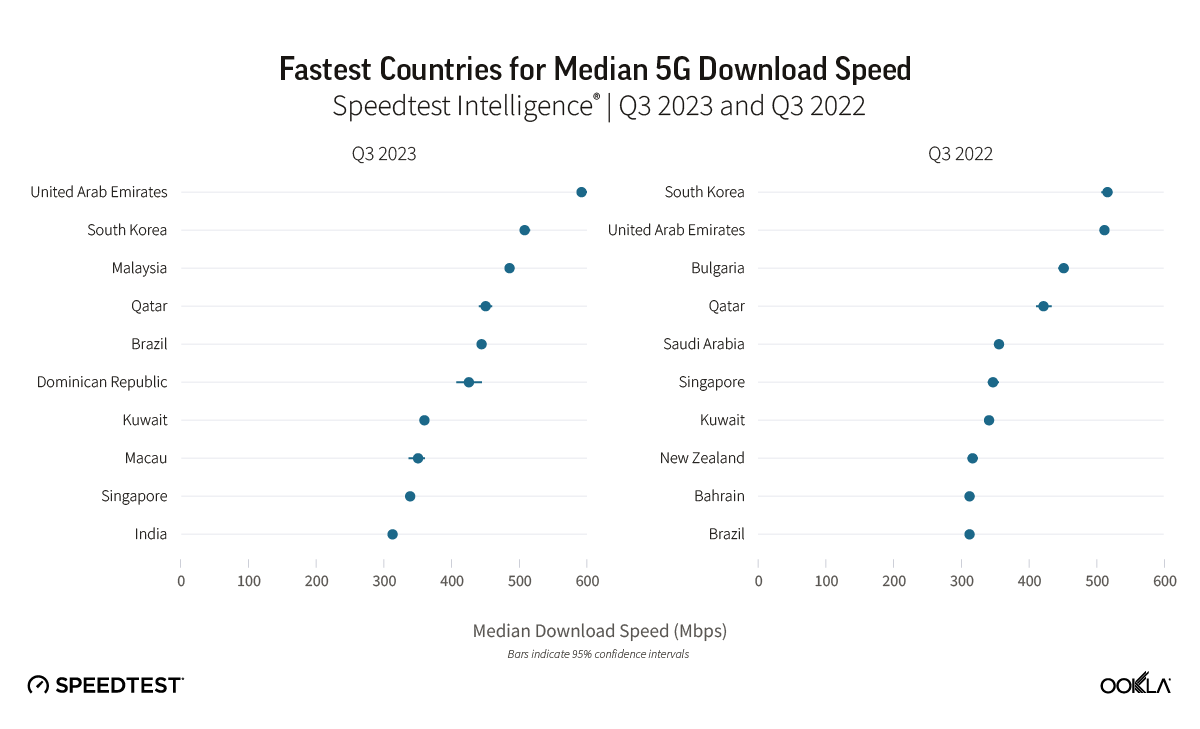
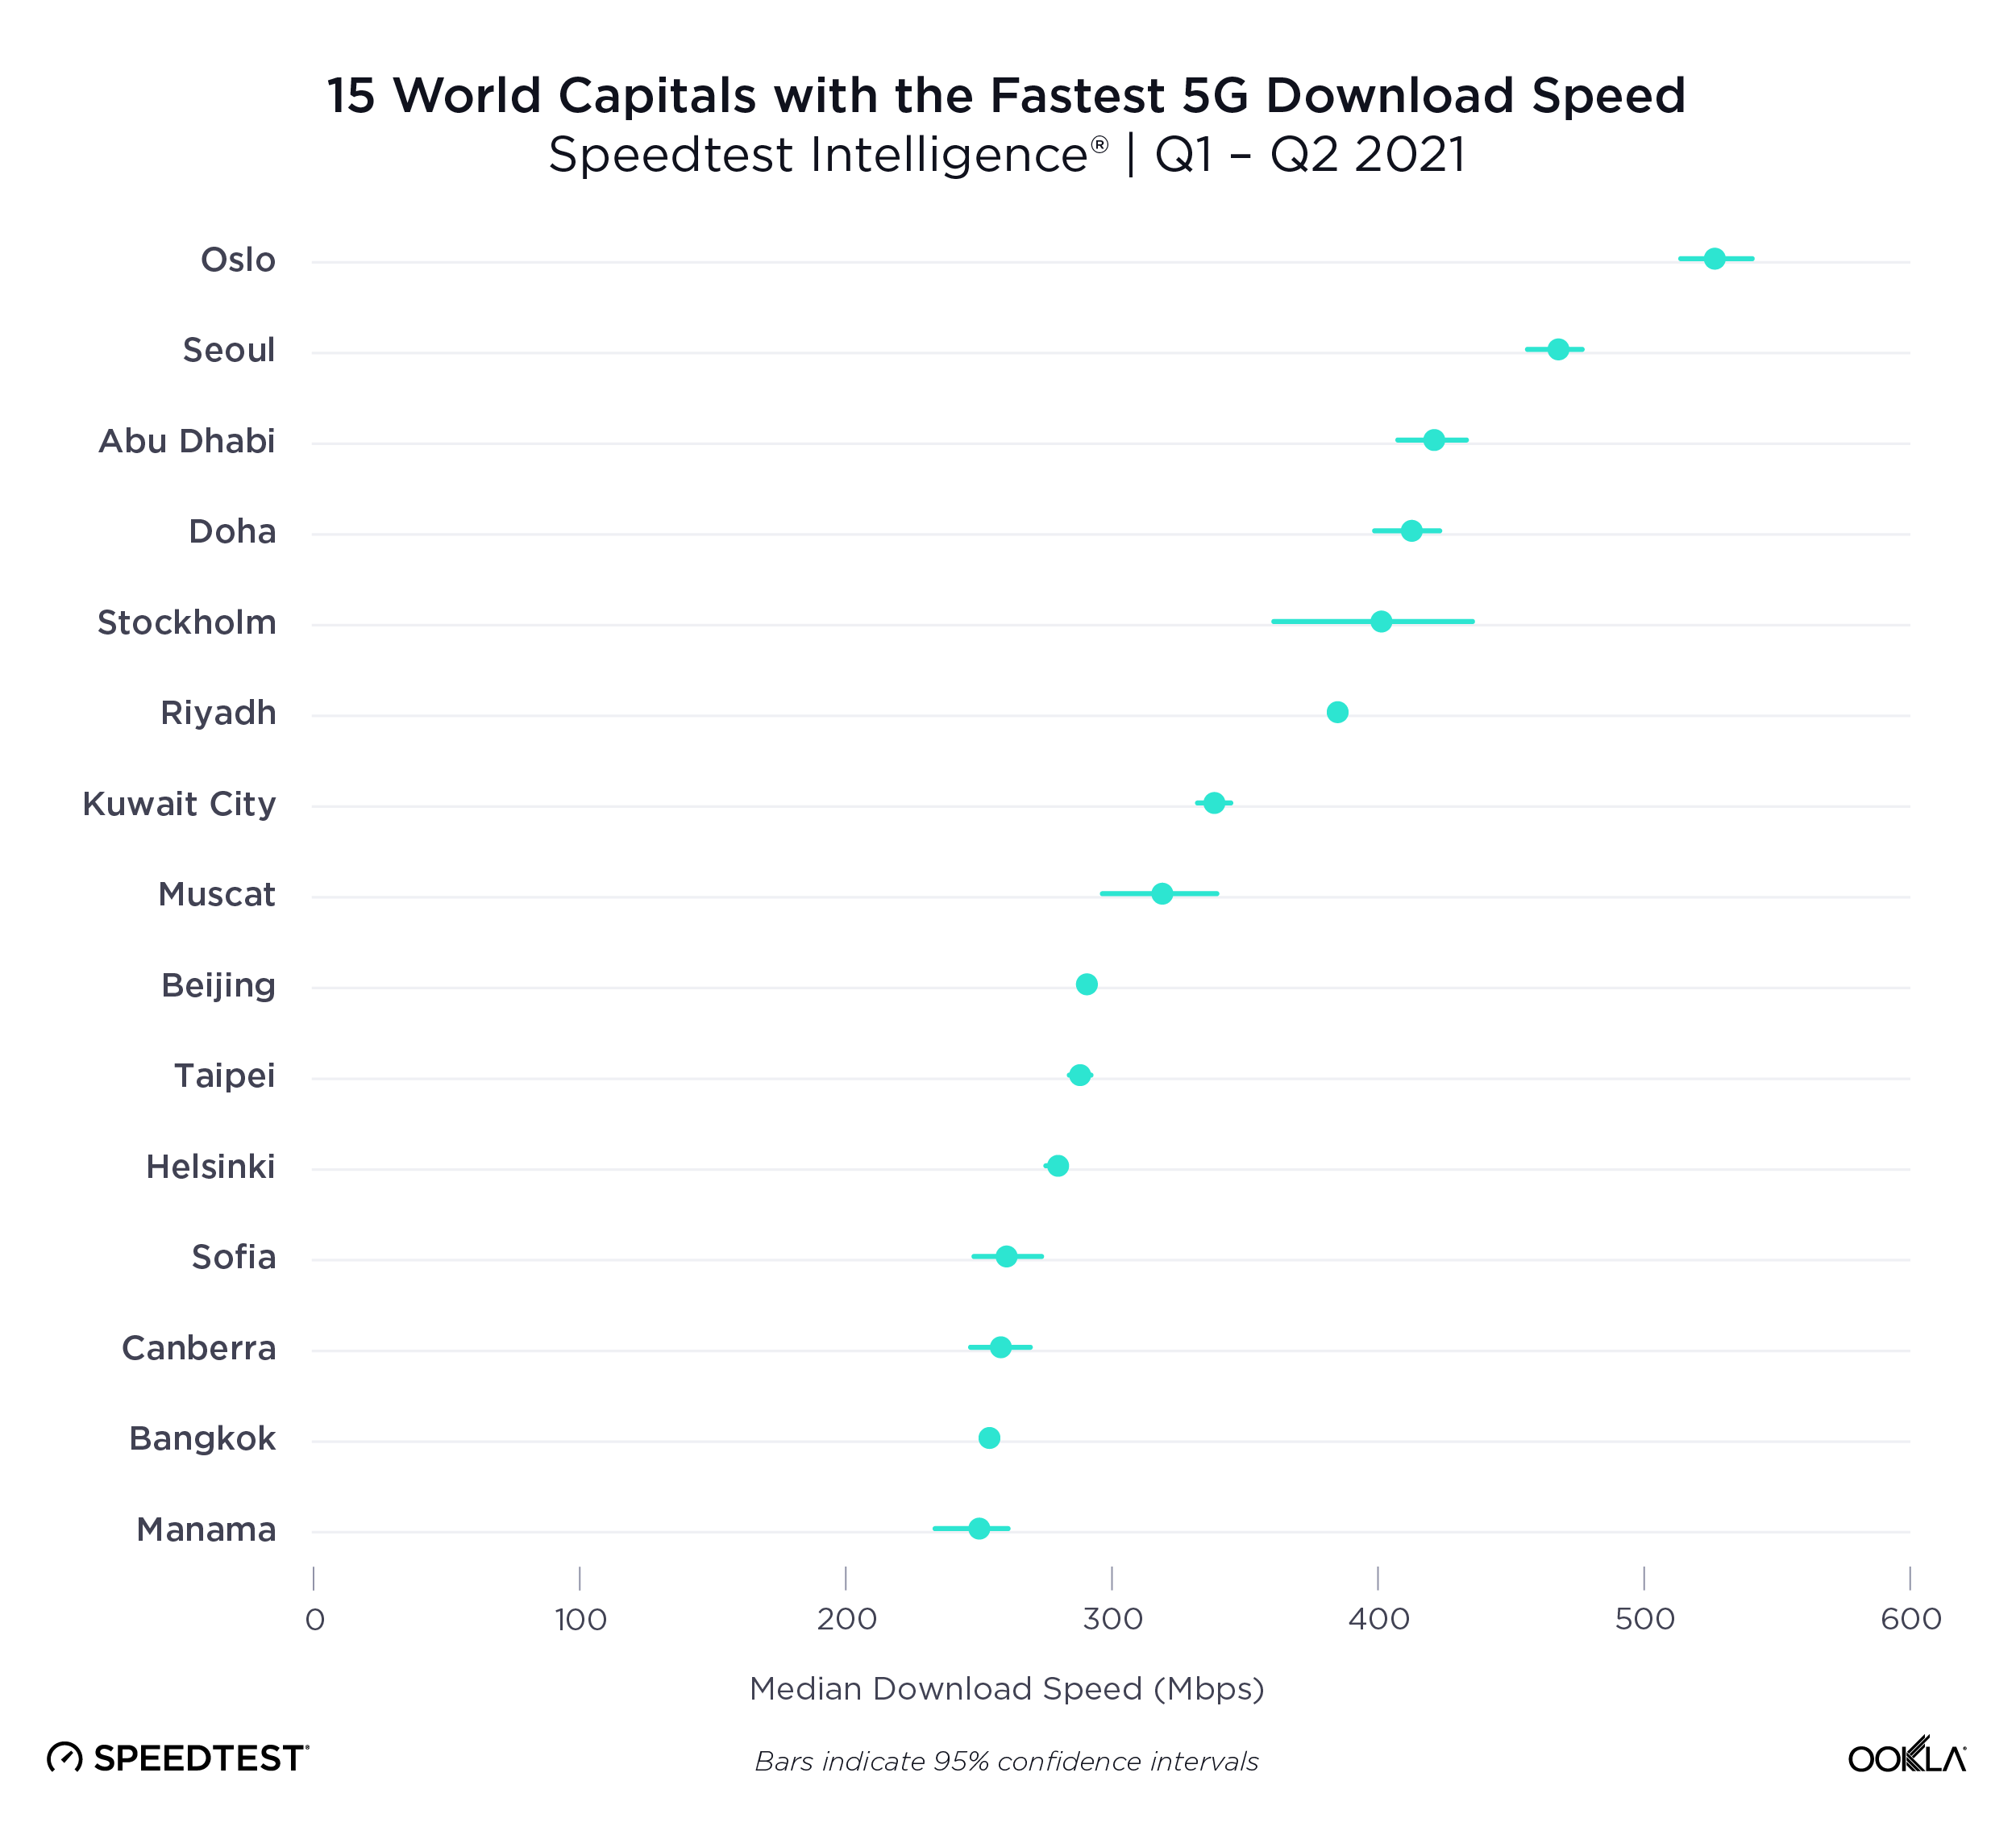
  • Operators with access to 100 MHz of contiguous spectrum, e.g., in the U.A.E. and South Korea, led the 5G global ranking in Q4 2022 with a median download speed of 516.15 Mbps and 511.70 Mbps, respectively.
  • Access to low-band spectrum is just one factor that impacts 5G Availability. 

Four tiers of 5G performance 

Looking at market-level Speedtest Intelligence data, we can see significant variance in median 5G download speeds between the 52 countries we analyzed. We identified four broad clusters of 5G performance as measured by median 5G download speed.

chart of 5g performance clusers basd on median 5g download speed across a sample of countries
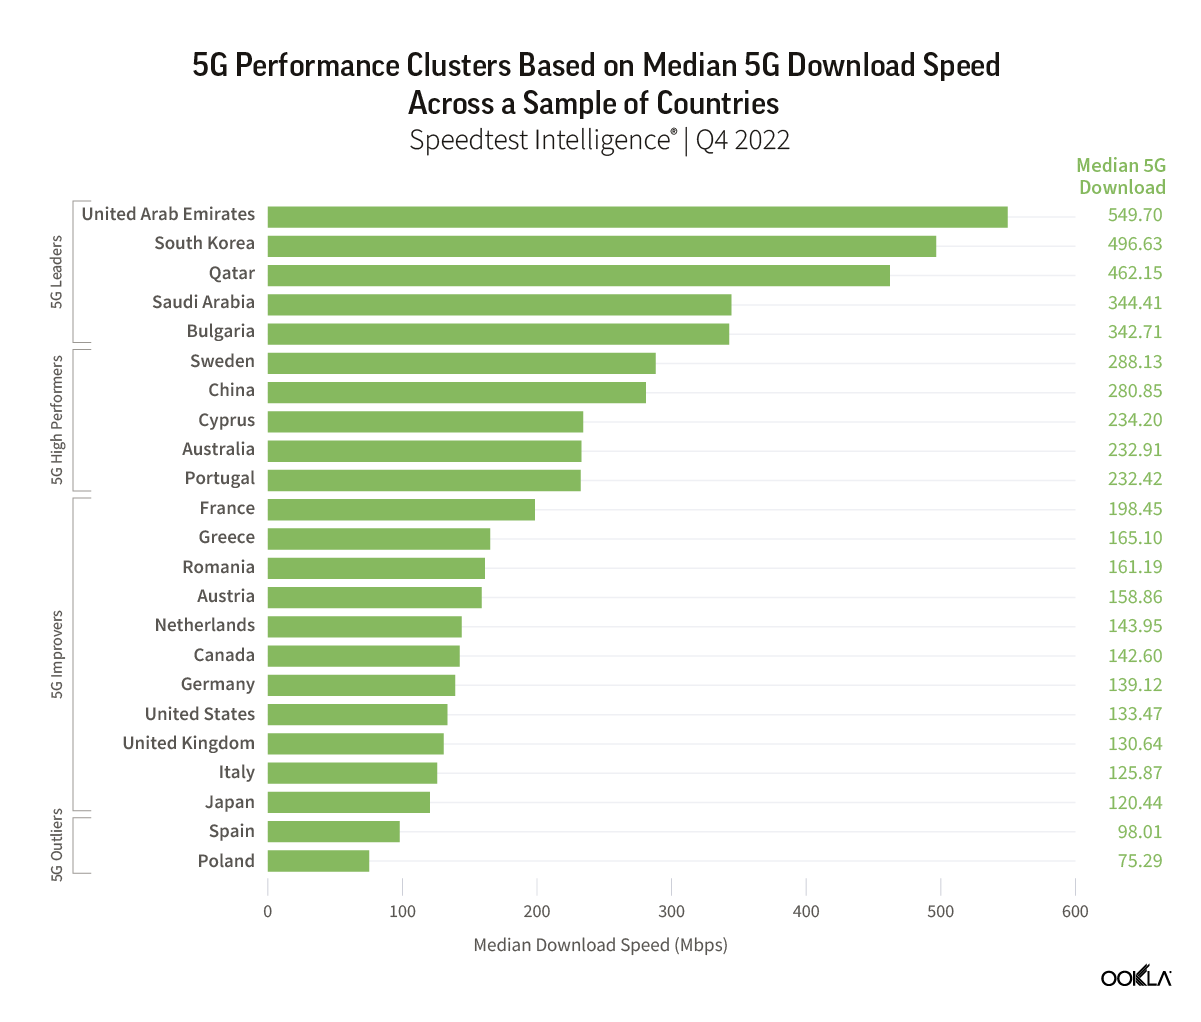
5G Leaders: > 300 Mbps

These markets are the 5G pioneers, being among the first to launch 5G services, and are continually pushing the boundaries of 5G performance with median download speeds typically greater than 300 Mbps. High-performant 5G markets have allocated substantial amounts of spectrum for 5G use, particularly with wide allocations in the coveted C-band, and have assigned and, in some cases, begun limited use of mmWave spectrum. In some cases, we see a trade-off between 5G performance and 5G Availability (the proportion of time users with 5G capable devices spend connected to 5G networks).

5G High Performers: 200 – 300 Mbps

These markets share many of the characteristics of 5G leaders, having made an adequate spectrum allocation for 5G use and fostered competition between operators, which has helped spur network investment. However, they lag behind 5G Leaders based on their level of network densification. They typically use Dynamic Spectrum Sharing (DSS), which allows operators to share spectrum between network generations, but it can weigh on performance. Median 5G download performance in these markets typically ranges from 200 Mbps to 300 Mbps. We don’t generally see as much of a trade-off between performance and 5G Availability in these markets. 

5G Improvers: < 200 Mbps

These markets typically have limited C-band availability or a regulatory environment promoting strong price competition, with operator investment constrained. As a result,  median 5G download speeds are between 100- 200 Mbps in these markets. In some cases — for example, in the U.S. and U.K., we see 5G spectrum allocations (based on spectrum currently in use) giving a significant advantage to one player in the market, which has then sought to capitalize on this through aggressive 5G network deployment. Furthermore, with the exception of the U.S., which had a 5G Availability of 56.0% in Q4 2022, 5G Improvers all have 5G Availability in the low double digits, ranging from 13.5% in Japan to 19.2% in Germany. 

5G Outliers

Only in a few markets did 5G performance drop below 100 Mbps. Polish performance can be explained by the lack of a dedicated 5G spectrum; Polkomtel trading under the Plus brand, utilizing 50 MHz of spectrum in the 2.6 GHz band, and all other operators deploying 5G using DSS in the 2.1 GHz spectrum band. Spain, on the other hand, has assigned spectrum across all three bands, with C-band blocks ranging from 80MHz (MasMovil) to 110 MHz (Orange), and most recently, awarded mmWave too. However, operators focus on meeting coverage obligations that rely heavily on the 700 MHz band. For example, Movistar’s 5G network reached a total of 1,719 municipalities at the end of 2022, equivalent to 83% of the population. 

Fast 5G and good 5G Availability don’t always go hand in hand  

chart of medan 5g and availability in select markets

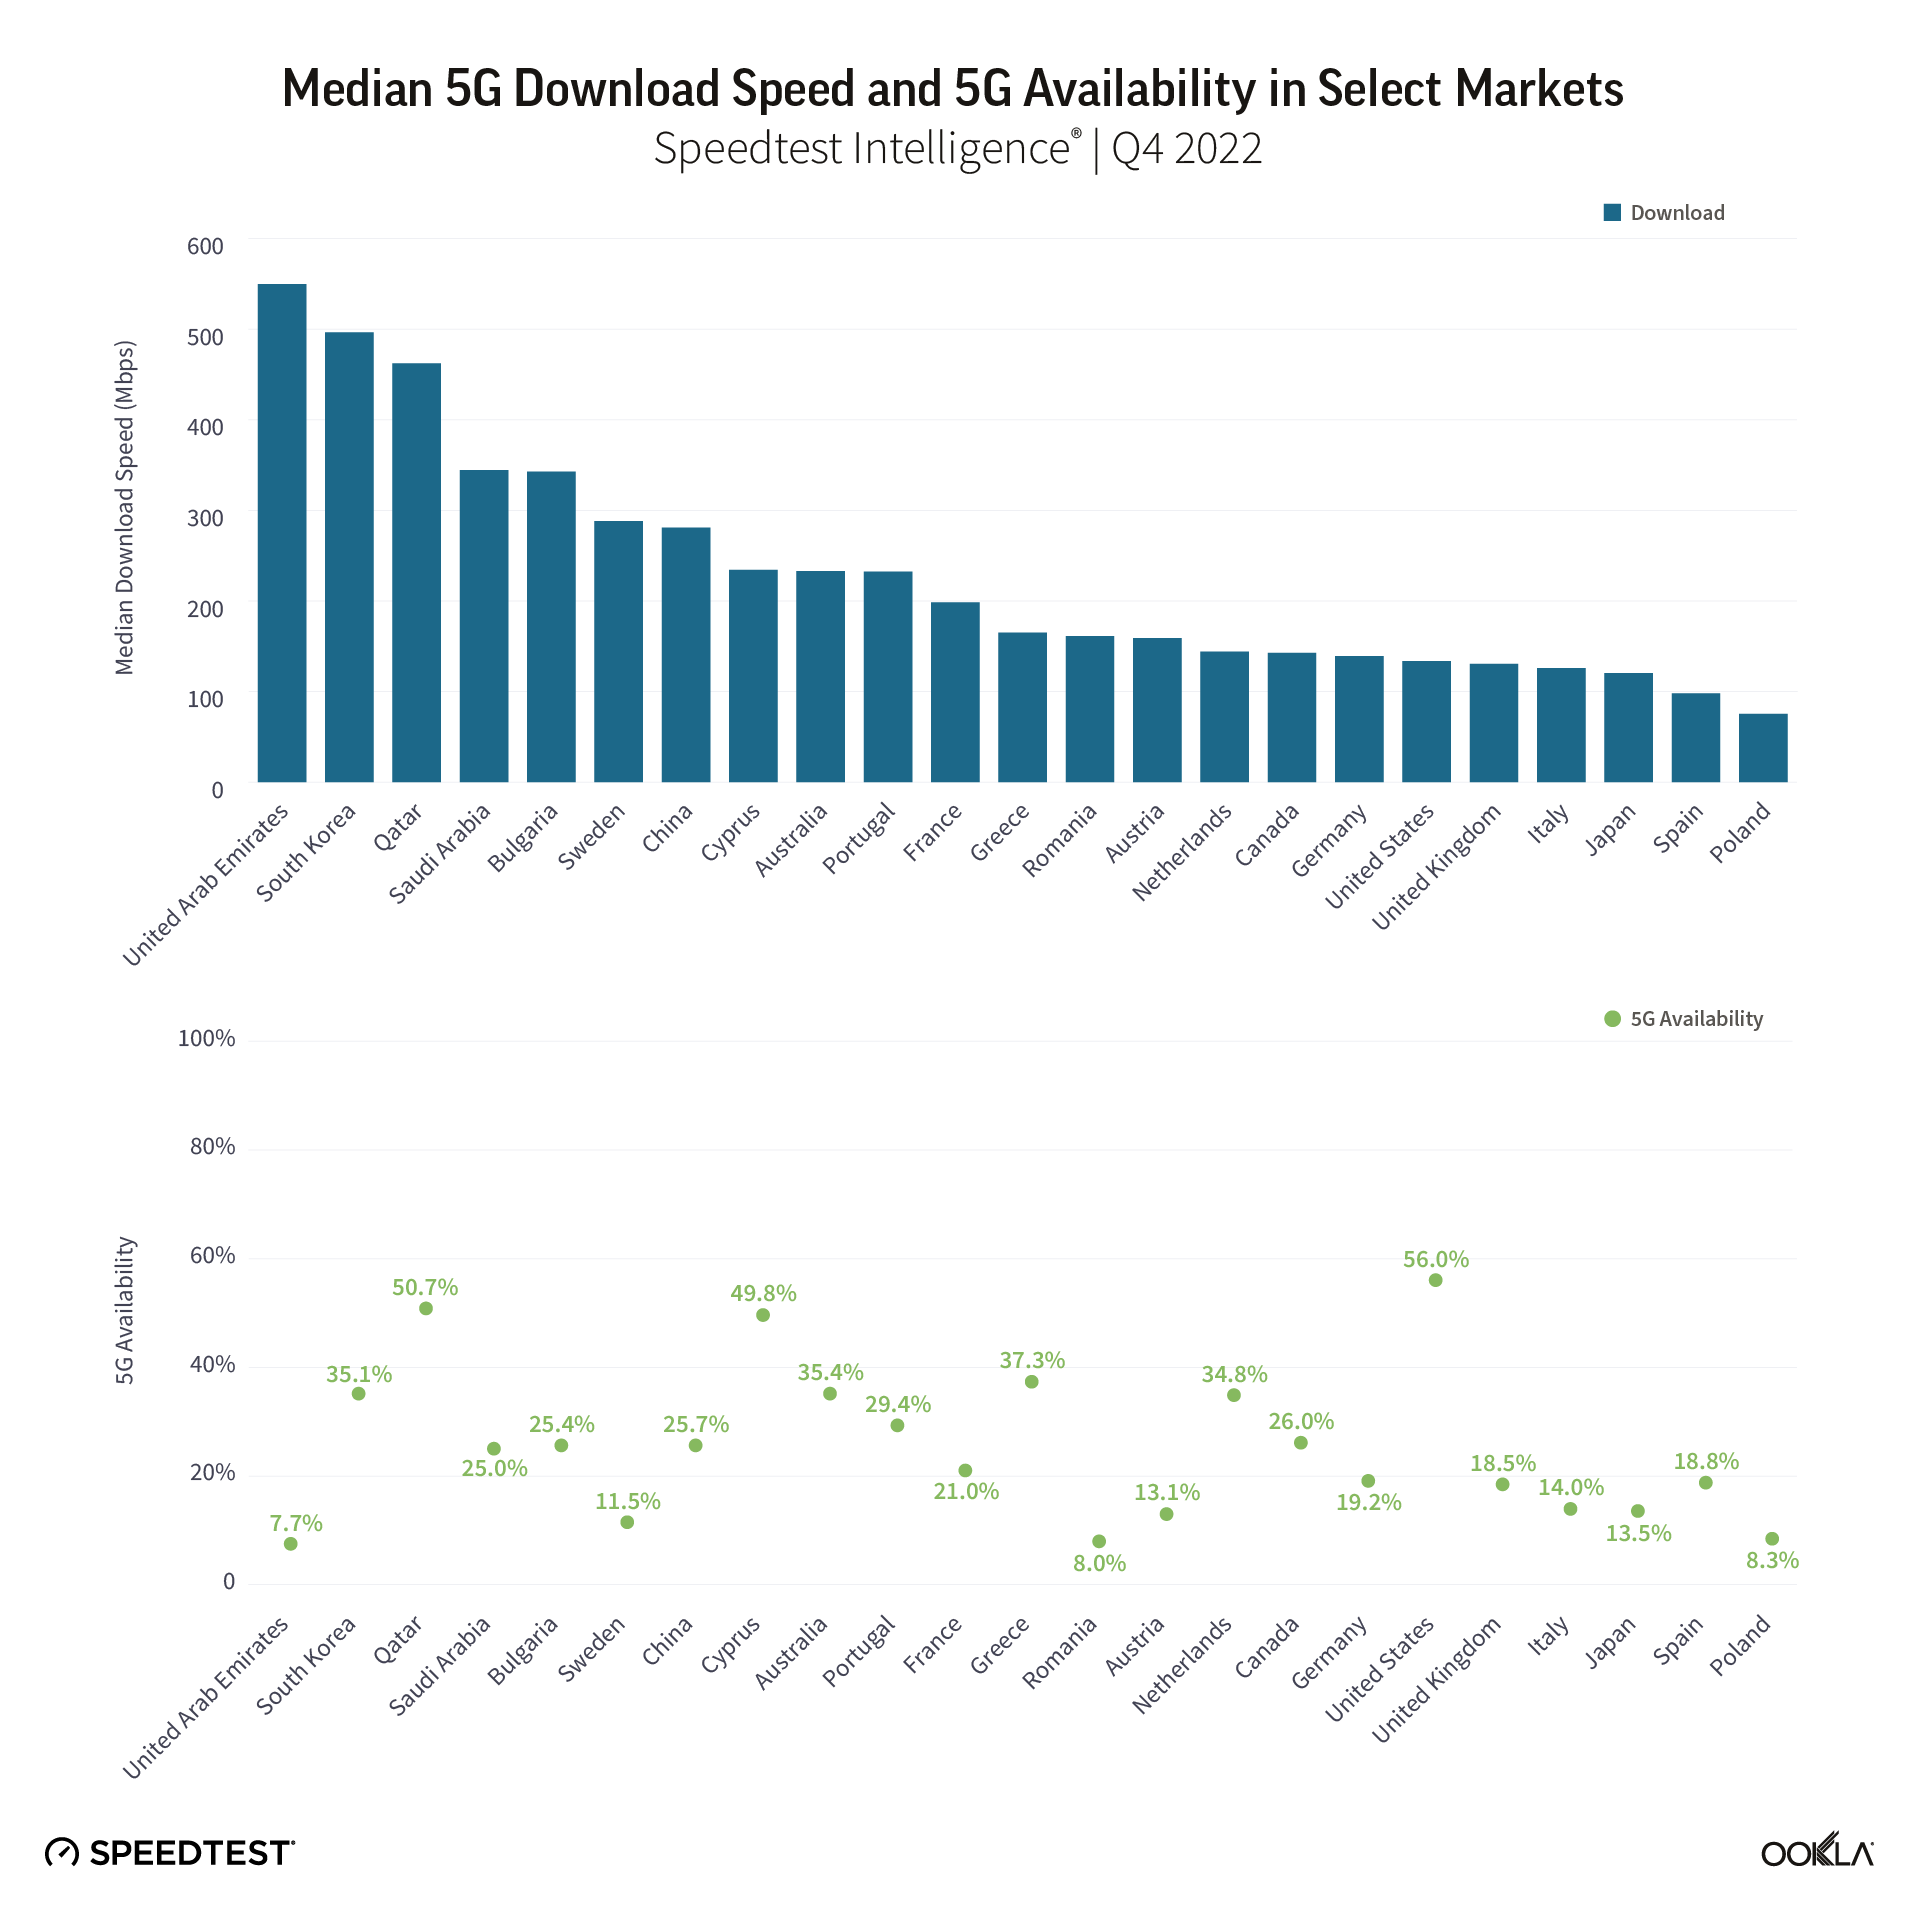
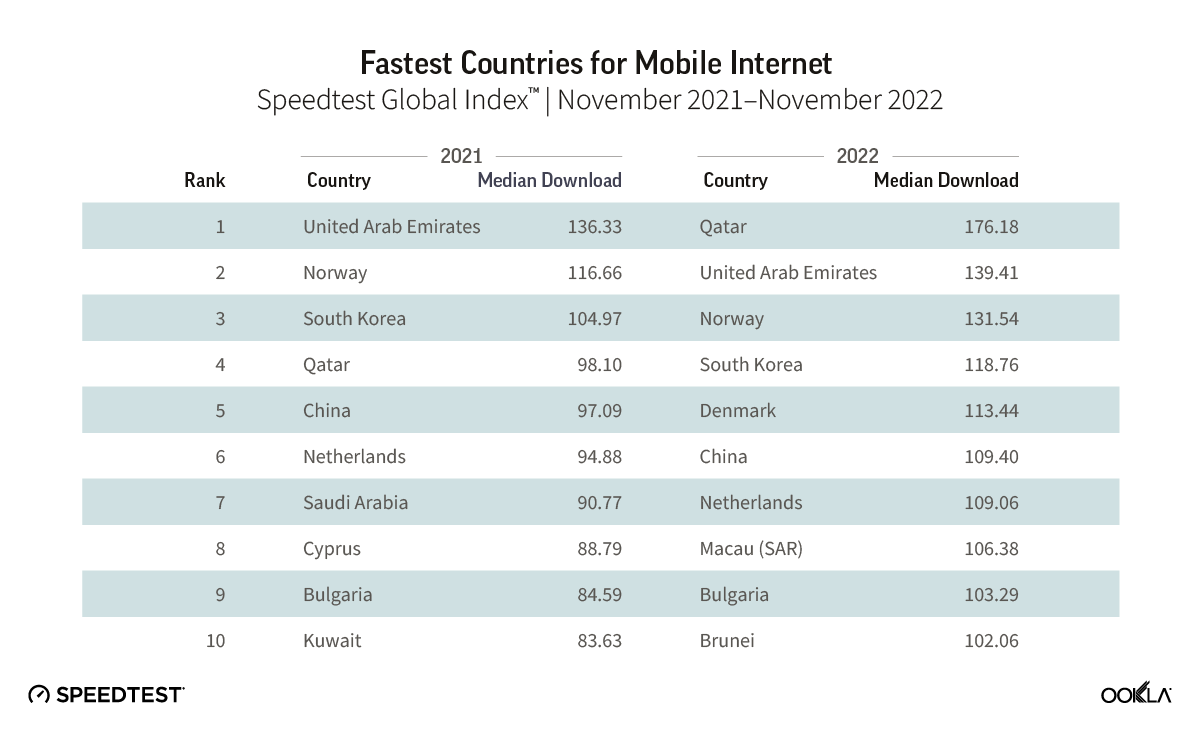
Using Speedtest Intelligence data, we examined a relationship between the country’s 5G median download speed and 5G Availability. And for the most part, there isn’t one. Fast networks don’t immediately come with high 5G Availability. For example, the U.A.E. and South Korea have topped our ranking in terms of the fastest median download speed over 5G at 549.70 Mbps and 496.63 Mbps, respectively, during Q4 2022. Yet, when it comes to 5G Availability, the U.S. came first in the ranking at 56.0% in Q4 2022, South Korea’s 5G Availability stood at 35.1%, while the U.A.E recorded a 5G Availability of 7.7% in Q4 2022. 

All eyes on spectrum

The key to understanding 5G is understanding operators’ 5G spectrum holding. There are two key considerations to keep in mind when discussing the spectrum for 5G: speed performance and geographical coverage. Regulators assign 5G spectrum across three spectrum ranges: low, mid (lower mid-band and upper/C-band), and high (mmWave).

Low-band (sub-1GHz) spectrum can travel farther, cover a greater geographical region, and provide deeper penetration within buildings, given its good propagation characteristics. But, the low band spectrum cannot deliver “true” 5G speeds, peaking at 100 Mbps median download speed. Another challenge is that these frequency bands are in high demand and in low supply, and in some countries, still used for analog television. 

Mid-band spectrum (1-6 GHz spectrum) is the so-called “sweet spot” for 5G, especially the upper mid-band (C-band), which offers the best of both worlds in terms of coverage and capacity.

Existing networks such as 2G, 3G, and 4G already use the lower mid-band. This spectrum band has been the 4G data traffic capacity layer, often used in Frequency Division Duplex (FDD) mode. FDD is a technique that uses separate frequency bands at the transmitter and receiver sides. For example, the U.S. and China used the 2.6 GHz spectrum band in Time Division Duplex (TDD) mode to drive their 5G deployment. Most counties will use TDD for 5G network rollout. This means that the 5G base station and end-user device use the same channel to transmit simultaneously, potentially creating interference issues while allowing more flexibility. Furthermore, this spectrum band will grow in importance as legacy networks are retired and spectrum refarmed.

The upper mid-band, especially 3.3 GHz to 3.8 GHz (otherwise known as C-band), offers a good combination of propagation and capacity. 3GPP standards currently support a 100 MHz wide channel and a maximum bandwidth of 400 MHz in carrier aggregation mode.

The high band, also called the millimeter wave (mmWave), spectrum can deliver super-fast speeds (thinking gigabits) but has limited range. Recently we published an article looking at the mmWave performance and recent developments.

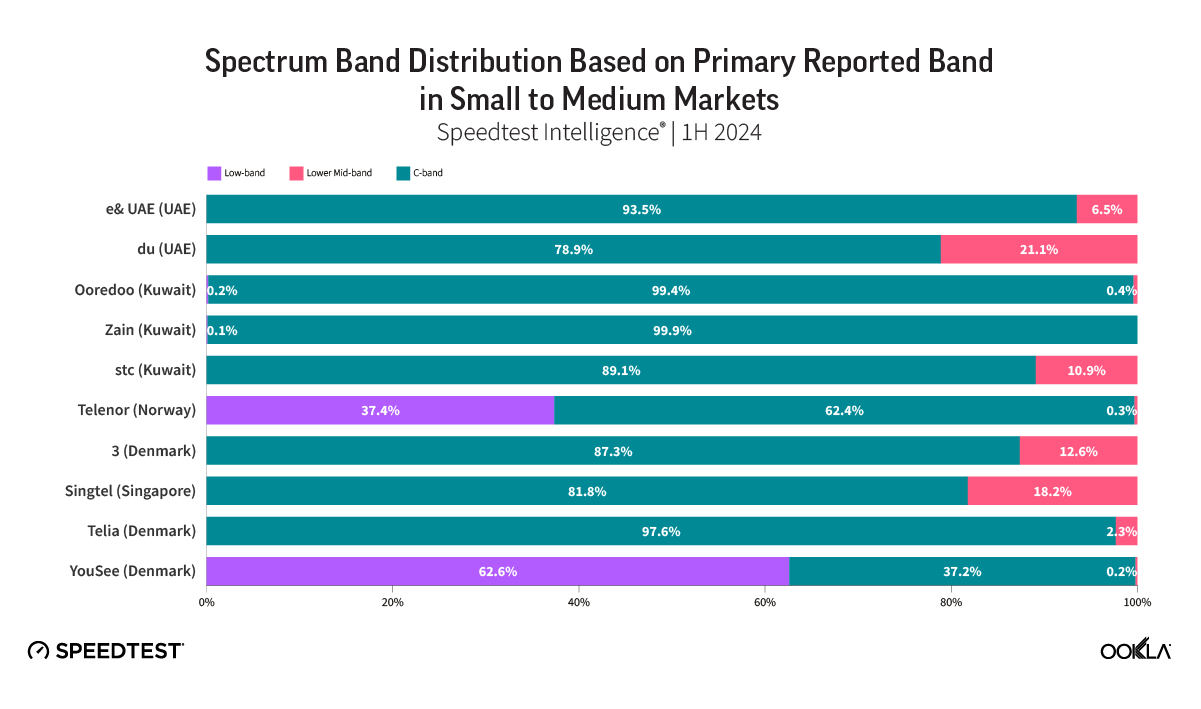
Using Speedtest Intelligence background data, we can gain insights into which spectrum bands operators use for 5G. 

chart of spectrum band distribution

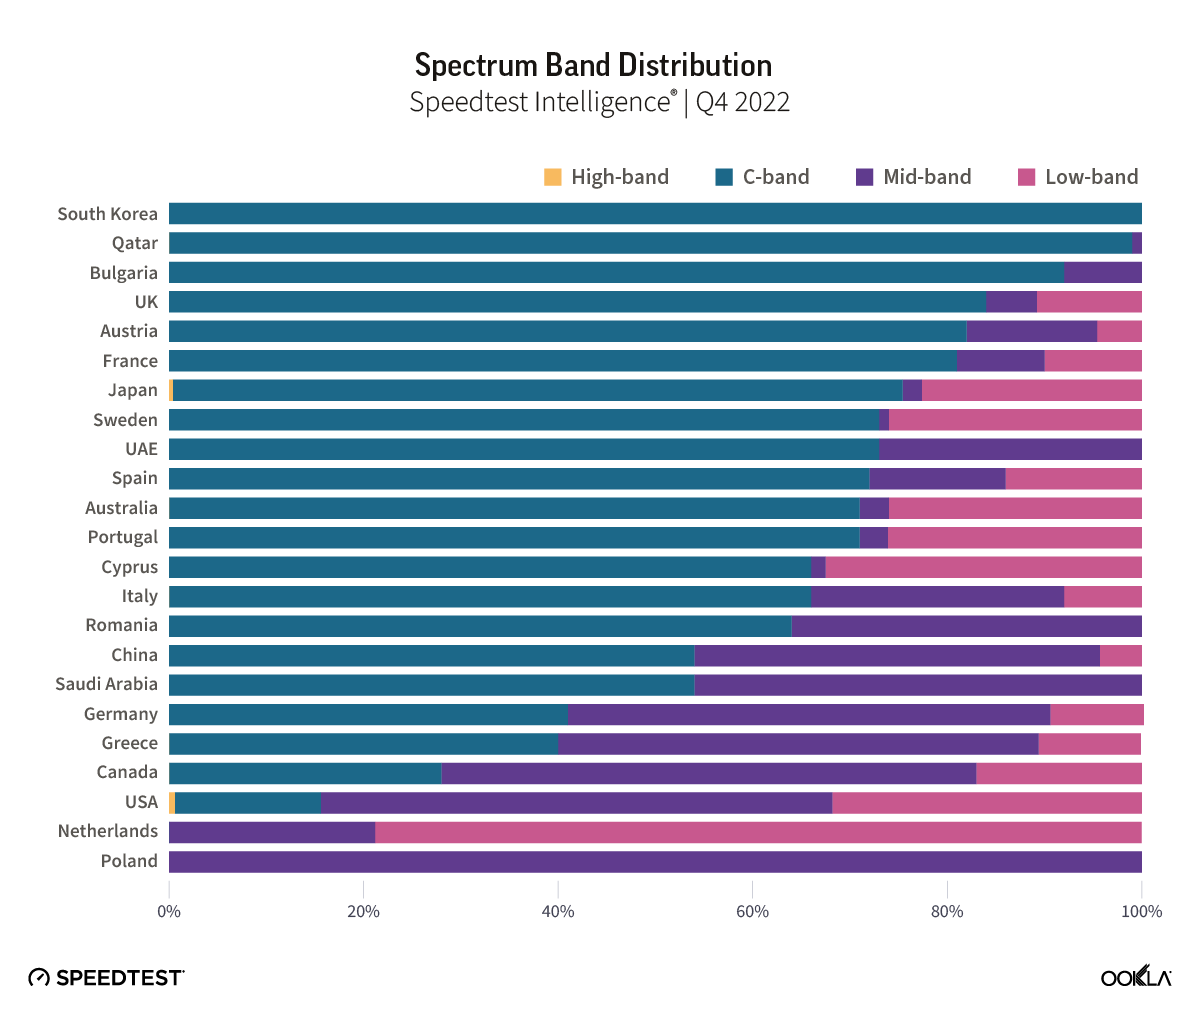
  • High band (mmWave) accounted for less than 1% of the scans in four countries: Japan, U.S., Qatar, and Australia.
  • Most countries used the mid-band spectrum.
    • C-band spectrum is used by all countries that have allocated it (21 out of 23 countries), with a notable exception of the Netherlands and Poland, which will finally auction the 3.5 GHz spectrum, set to take place in the summer of 2023. 
    • All countries we have analyzed, bar South Korea, use lower mid-band partially due to operators switching off their legacy networks (2G/3G) and refarming their existing spectrum holdings to support 5G networks rollout.
  • Low band was used by 78% of analyzed countries (18 out of 23) across our sample. 

Addressing spectral challenges via DSS and CA comes at a cost

The ITU minimum technical requirements to meet 5G performance requirements identify at least 100 MHz channel per operator and up to 1 GHz per operator in mmWave bands. This, however, is only sometimes the case. We can see imbalances in terms of operators’ performance within a country, which can be partially explained by having larger spectral resources. For example, Three UK benefited from having the largest, dedicated 5G spectrum — 140 MHz of frequency across several 5G spectrum bands, including a 100 MHz block of continuous spectrum in the 3.3-3.8 GHz band, which positions it well in terms of median download speeds compared to other U.K. operators.

In the absence of a dedicated 5G spectrum or to supplement the existing spectrum, operators can use two technologies to aid their 5G deployment: Dynamic Spectrum Sharing (DSS) and Carrier Aggregation (CA). DSS enables operators to allocate spectrum flexibly across low-, mid-, and high-bands and switch between LTE and 5G New Radio depending on network demand. However, there is a downside to that in terms of 5G performance. For example, in Poland, apart from Plus, all other operators deployed 5G using DSS in the 2.1 GHz spectrum band, which can partially explain why they have lower speeds.

Conversely, CA enables operators to use two or more bands together, integrating them as one big block to deploy 5G. This allows for the aggregation of non-contiguous spectrum blocks, but it impacts performance by introducing latency and signaling overhead. 

Access to low-band spectrum has a positive impact on 5G Availability, but it is not the only factor at play

chart of 5g availability and the use of low-band spectrum

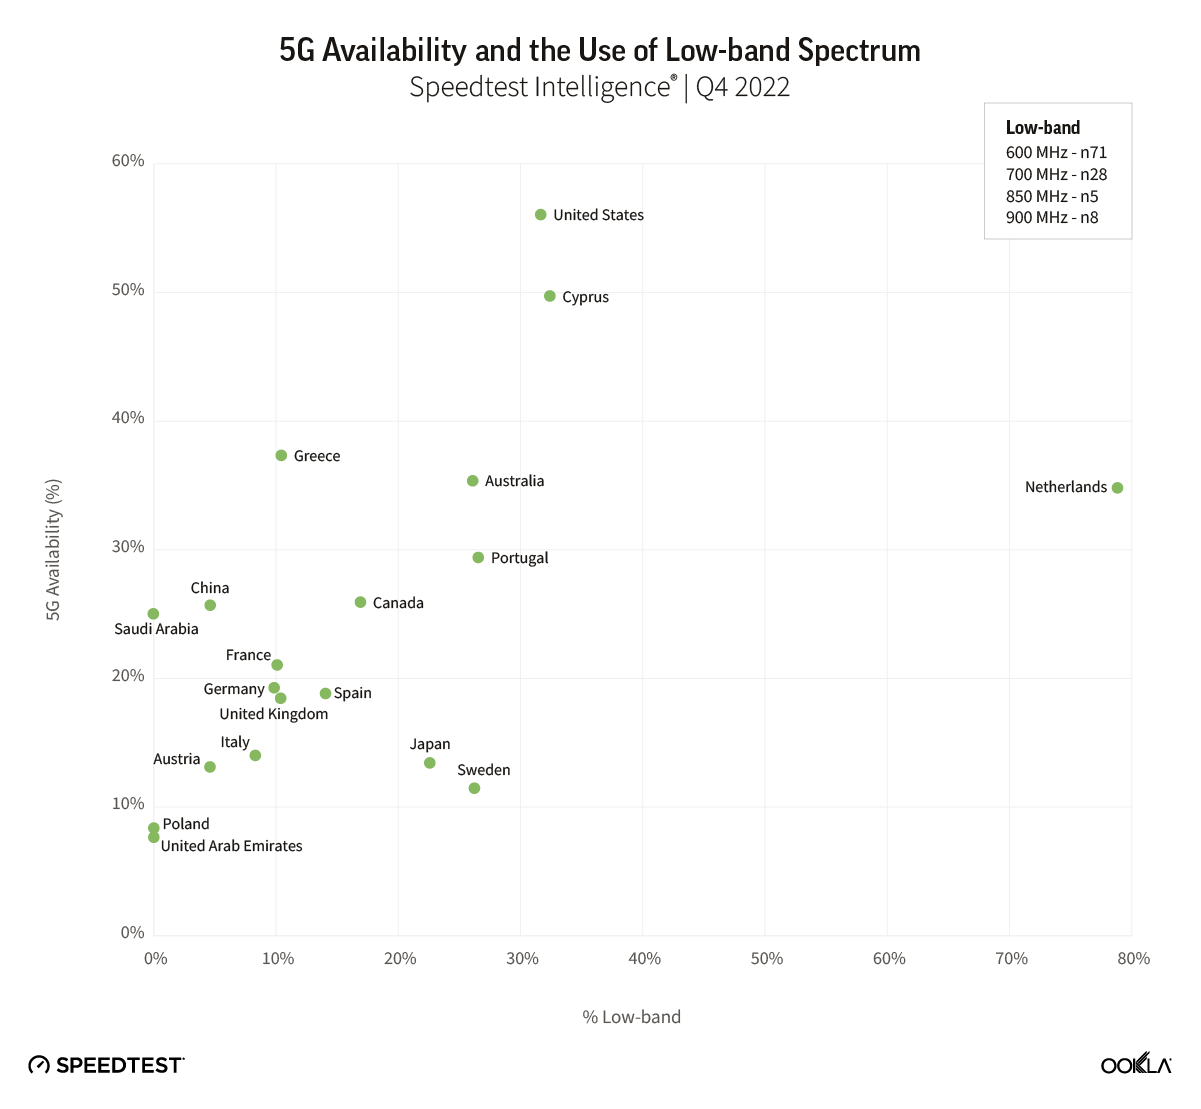
Ookla® data indicates that 5G coverage, which is often enabled by having access to a dedicated low-band spectrum (600 – 900 MHz), is just one part of the puzzle when it comes to 5G Availability. Low-band (700 MHz) spectrum, initially used for LTE, is now allocated to 5G because it allows extended coverage. According to the GSA, the 700 MHz spectrum band is particularly precious. GSA’s data shows that spectrum at 700 MHz has generated an average of $0.309/MHz/pop in assignments and auctions since 2015, significantly above the average price for C-band. For example, India’s highly anticipated 5G spectrum auction garnered $0.380MH/pop for 700 MHz compared to $0.031/MHz/pop for C-band. 

Qatar, Saudi Arabia, South Korea, and the U.A.E. don’t have any 5G devices using low-band spectrum simply because there has been no spectrum assigned in this band to 5G services. During the initial 5G auction in 2016, South Korea’s 700 MHz spectrum remained unsold. 

Other essential aspects driving 5G Availability are the affordability and availability of 5G-capable smartphones, 5G tariffs, and end-user demand. Case in point, despite the lack of low-band spectrum, South Korea reached a 5G Availability of 35.1% in Q4 2022, driven by customer adoption and 5G network densification. According to the Ministry of Science and ICT, in November 2022, there were 27.5 million 5G subscriptions in South Korea, equivalent to 36% of all mobile subscriptions. According to its Communication Agency, there are 215,000 5G base stations, which translates into 319 people per 5G base station, nearly seven times more than the EU and 13 times more than the U.S.

A country’s geography impacts 5G coverage too. For example, in addition to having access to low band spectrum, the Netherlands benefits from being flatter and more densely populated, resulting in a greater ability to expand 5G coverage. 

Another factor at play is the spectrum license conditions that stipulate coverage requirements, for instance, as part of the 700MHz licenses in the Netherlands, there is a minimum speed of 8 Mbps in 98% of the cases in each municipality of the country in 2022.

While the relationship between low-band spectrum and 5G Availability is not a direct one, we wanted to investigate whether there is a link between the median 5G download speed and the C-band spectrum. 

Larger the share of the C-Band spectrum, the faster the 5G download speed

chart of 5g download speed and the use of c-band spectrum

Our analysis found that access to C-band spectrum typically translates into a faster median 5G download speed. Unsurprisingly, operators are keen to deploy 5G services using C-band spectrum. According to GSA, since the end of 2015, 54 countries have auctioned, assigned, or renewed licenses for C-band spectrum. 

All eyes on 5G Leaders

Countries where operators solely rely on the mid-band spectrum for 5G, and where 5G services have been available for more than 13 quarters have achieved over 300 Mbps median download speed in Q4 2022. Bulgaria is an exception, having launched services just over two years ago. We can also conclude that operators’ overall spectrum holding and whether they have access to a contiguous spectrum matters, too. Contiguous spectrum helps achieve faster speeds, lower latency, and improved spectral efficiency. 

U.A.E.: Emirati operators – Etisalat and Du –  use two carrier spectrum in the 3.5 GHz and 2.5 GHz frequency range, each carrier at 100 MHz, to establish a 5G network. This results in speeds exceeding 500 Mbps. The U.A.E. had a median 5G download speed of 511.70 Mbps in Q4 2022. 

South Korea: KT and SKT bought a 100 MHz channel each in 2018. In July 2022, LG+ secured an additional 20 MHz C-band spectrum, bringing its total spectrum holding to 100 MHz. Alongside the 5G spectrum auction, the government outlined the rollout milestones for the operators’ 3.5 GHz rollout: 22,500 base stations by the end of 2021, 45,000 by the end of 2023, and 150,000 at completion. Thanks to that, South Korea has the most base stations per population. South Korea is one of the early adopters of 5G, having commercialized 5G in 2019 and over a third of all mobile subscriptions on 5G. One of the reasons behind South Korea’s fast-paced 5G adoption is the support from the government, which adopted the 2021 action plan for the “Digital New Deal” to support 5G development and a wider digital transformation. 

Qatar: Qatar, clocking a median 5G download speed of 462.15 Mbps and 5G Availability of 50.7% in Q4 2022, delivers the best of the worlds — good speeds and 5G Availability. In November 2022, Qatar’s Communications Regulatory Authority (CRA) amended the mobile licenses held by Vodafone Qatar and Ooredoo Qatar in early 2019, authorizing each operator to utilize 100 MHz of C-band spectrum and committing them to roll out commercial 5G networks before the end of 2020 in all densely populated areas. Operators’ heavy investment into their network to achieve near-universal service coverage and incentives to migrate users to 5G networks has paid off. We have closely monitored 5G performance during the recent World Cup. Not only did Qatari 5G networks manage to withstand the additional network load that World Cap brought, but it has also improved in performance, with the median 5G download performance hitting 472.13 Mbps in November 2022. 

Saudi Arabia: Operators in the KSA have access to more than 1000 MHz of licensed spectrum for IMT use in the low- and mid-band ranges. Saudi regulator – CST (Communication, Space and Technology Commission) – championed data-driven, evidence-based policy decisions to enable a 5G rollout by conducting analysis of spectrum usage, the performance of various bands, and existing network infrastructure to see where investments had been made within certain bands (e.g., extra capacity in specific bands in urban areas and coverage of rural areas using adequate bands). If you would like to find out more, read this case study

Bulgaria: In April 2021, Vivacom Bulgaria won 100 MHz in the 3.7-3.8 GHz band for BGN4.6 million (€2.35 million). Vivacom utilizes DSS, combining frequencies in 1.8, 2.1, and 3.6 GHz bands for 5G. A1 Bulgaria, on the other hand, uses a dedicated 100 MHz band.

We will continue to monitor 5G performance across the world and investigate the factors that impact 5G performance. If you want to learn more about 5G performance, head to Ookla ResearchTM and subscribe to our newsletter to stay up to date with our latest analyses. 

Ookla retains ownership of this article including all of the intellectual property rights, data, content graphs and analysis. This article may not be quoted, reproduced, distributed or published for any commercial purpose without prior consent. Members of the press and others using the findings in this article for non-commercial purposes are welcome to publicly share and link to report information with attribution to Ookla.

| December 19, 2023

The State of Worldwide Connectivity in 2023

To gain insight into the current performance of networks, we analyzed Speedtest® data in Q3 2023. Our analysis compares changes in 5G performance to the previous year, identifies the top 10 countries with the best performance, and discusses customer satisfaction with 5G. We also ranked countries based on the performance of their fixed networks and investigated the connectivity gap across the world.

5G | Fixed | Connectivity for All

Key takeaways 

  • Global 5G download speed improved. The median global 5G download speed experienced a substantial 20% increase in Q3 2023, reaching 203.04 Mbps, compared to 168.27 Mbps in Q3 2022. This improvement aligns with a significant rise in global 5G subscriptions, indicating positive progress in user adoption of 5G and the performance of 5G networks. 
  • Top 5G performers have shifted. The top 10 countries for 5G performance witnessed notable changes, with the United Arab Emirates claiming the top spot, surpassing South Korea. Malaysia, India, and the Dominican Republic also made significant strides, showcasing a dynamic shift in the global 5G landscape.
  • Speedtest user ratings indicate room for 5G improvement. Despite advancements in 5G technology, there has been a decline in the Net Promoter Score (NPS) among 5G users. Factors contributing to this dissatisfaction could include unmet expectations and discrepancies between actual 5G speeds and advertised speeds.
  • Fixed Networks Advancements. On a global scale, fixed networks demonstrated significant performance improvement, with a 19% increase in median download speed (83.95 Mbps) and a 28% increase in upload speed (38.32 Mbps) in Q3 2023 compared to the previous year. This highlights the ongoing transition to more advanced broadband technologies, particularly Fiber-to-the-Home (FTTH).
  • The imperative of closing the connectivity gaps. Despite improvements in global connectivity, there are still areas that fall outside of network coverage. Speedtest® data highlights disparities in internet performance between fixed and mobile networks across different regions, emphasizing the importance of addressing connectivity challenges worldwide.

5G Networks

Global 5G download speed improvements

Illustration of 5G Median Performance Worldwide

The median global 5G download speed has experienced a noteworthy surge, registering a 20% increase and reaching 203.04 Mbps in Q3 2023, compared to 168.27 Mbps in Q3 2022, according to Speedtest Intelligence® data. This improvement coincides with a substantial rise in global 5G connections, reaching 1.4 billion according to GSMA Intelligence, representing a 65% year-on-year increase from 872 million a year ago. 

In terms of upload speed and latency, only a very modest improvement of 1% occurred. Median 5G upload speeds reached 18.93 Mbps in Q3 2023, compared to 18.71 Mbps in the same period last year; multi-server latency, a critical metric for network responsiveness, improved from 45 ms in Q3 2022 to 44 ms in Q3 2023. 

Speedtest users experiencing the top 10% of 5G download speeds globally have seen a 9% increase, rising from 525.54 Mbps in Q3 2022 to 573.12 Mbps in Q3 2023. However, speeds have not yet reached Gigabit levels, primarly because of network economics. 5G was originally designed to deliver peak data rates of up to 20 Gbps based on IMT-2020 requirements, but we are still a ways off before gigabit speeds become the new normal. For instance, symmetrical download, upload speeds, and ultra-low latency haven’t been realized, partially because the vast majority of 5G networks are not ‘true 5G’ as they have been deployed in Non-Standalone (NSA) mode, meaning they rely on a 4G LTE network core. According to GSA, over 40 operators have launched 5G standalone (SA) in public networks, but the rollout is not yet complete. Nevertheless, the industry is actively exploring the prospect of 5G Advanced, which promises symmetrical upload and download speeds and ultra-low latency, signaling a proactive stance ahead of the eventual transition to 6G.

Malaysia joined South Korea and the U.A.E at 5G speeds podium

Chart of Fastest Countries for Median 5G Download Speed

During Q3 2023, the United Arab Emirates and South Korea stood out as leaders in 5G performance, boasting the fastest median 5G download speeds globally at 592.01 Mbps and 507.59 Mbps, respectively. Our top 10 list also includes Malaysia, Qatar, Brazil, the Dominican Republic, Kuwait, Macau, Singapore, and India. The shift in the top 10 rankings reveals dynamic changes, with Malaysia, the Dominican Republic, and India making significant strides, while Bulgaria, Saudi Arabia, New Zealand, and Bahrain dropped out of the rankings.

The U.A.E showcased a 14% increase in its median 5G download speed, reaching 592.01 Mbps in Q3 2023, up from 511.68 Mbps in Q3 2022, allowing the U.A.E to take the top spot from South Korea. Key factors contributing to the U.A.E.’s 5G leadership include fierce market competition driven by Etisalat and du, resulting in extensive 5G coverage and widespread access to 5G services. Additionally, the allocation of a 100 MHz of contiguous spectrum, as discussed in our 5G spectrum article, has played a pivotal role in achieving faster speeds, lower latency, and improved spectral efficiency.

The regional shift in 5G performance leadership is noteworthy. In 2022, half of the top 10 countries were from the Middle East, while in 2023, the same proportion hailed from the Asia Pacific region. Our analysis suggests that early adopters in the Asia Pacific region have outperformed major European markets in 5G performance, due to factors such as early spectrum availability and supportive government policies.

Malaysia’s remarkable achievement in reaching the third spot globally for 5G download speed, with a reported speed of 485.24 Mbps in Q3 2023, is particularly noteworthy. Despite launching its nationwide 5G network less than two years ago, Malaysia’s unconventional deployment strategy has proven effective. India has also made a significant leap, with its median 5G download speed of 312.26 Mbps allowing India to reach the top 10 worldwide. The country’s climb of 72 places on the Speedtest Global Index™ between September 2022 and August 2023 is primarily credited to the launch of 5G. Following a 5G spectrum auction in India, operators have successfully addressed network congestion issues by offloading 4G traffic onto 5G networks.

In Brazil, 5G download speed increased 1.4 times, jumping from 312.09 Mbps in Q3 2022 to 443.93 Mbps in Q3 2023. Before Brazil’s 5G spectrum auction, operators had offered 5G using DSS since July 2020. While DSS can provide broad 5G coverage, its speeds are often similar to those on 4G LTE networks. In November of 2021, however, Brazil’s multi-band 5G spectrum auction closed, which not only generated BRL47.2 billion ($8.5 billion) in total commitments, but it also allowed operators to deliver much faster speeds on dedicated 5G spectrum compared to DSS. National operators – Telefonica Brasil (Vivo), Claro Brazil, and TIM Brazil – ended up with 40 MHz or 50 MHz in the 2.3 GHz spectrum band and 100 MHz each in the 3.5 GHz band. The subsequent simultaneous activation of 5G networks in July 2022 marked a transformative moment with the continuous expansion of 5G services to 623 municipalities by December 2023. An upcoming spectrum auction expects to improve Brazil’s 5G standing even further.

The Dominican Republic’s entry into the top 10 fastest 5G countries was marked by its official launch of 5G services in December 2021, making it the first Caribbean nation and the third in Latin America to adopt a 5G network.

Disparity Between 5G Performance and Consumer Perception

The Net Promoter Score (NPS) is a tool that gauges customer loyalty and satisfaction. At the end of Speetest, users may be asked to answer “How likely is it that you would recommend [provider] to a friend or colleague?” on a scale from 0-10. Net Promoter Scores are applied to both users and providers. Users are categorized into Detractors (score 0-6), Passives (score 7-8), and Promoters (score 9-10). NPS is the percent of Promoters minus the percent of Detractors and is displayed in the range from -100 to 100. Providers are ranked in descending order of NPS. NPS categorizes users into Detractors (those that score 0-6), Passives (scores between 7 and 8), and Promoters (scores of 9-10). NPS represents the percentage of Promoters minus the percent of Detractors displayed in the range from -100 to 100. 

In our article discussing whether 5G was meeting customer expectations, we found that 5G users typically rate their network operator with NPS scores universally higher than those for 4G LTE users. In Q3 2023, that trend continued, as 5G  users that were on 5G network when answering the NPS question still scored higher than those on 4G across all markets analyzed. It isn’t surprising given that at a global level, 5G had a 637% better median download speed than 4G and a 130% better median upload speed. 

Chart of NPS Score, 5G Compared to 4G

While 5G NPS still outpaces scores on 4G, our data shows that 5G NPS has been decreasing annually. This could point to the fact that excitement about 5G as a new technology is waning as users become used to faster speeds, or as customers await new use cases that can take advantage of the faster speeds that 5G can provide. After all, we are still waiting for that killer app for 5G, the way the video and streaming were for 4G. 

While it is difficult to fully explain the reasons behind the 5G NPS decrease without further research, we can clearly see that network performance isn’t the only factor at play influencing NPS declines. Others can include customer care, pricing, and other services. For example, in South Korea, one of the first countries to launch 5G with one of the world’s fastest speeds, consumers scored 5G networks -41.47 in Q3 2023 compared to -20.51 in Q3 2022. 

In March 2021, South Korean consumers launched a class action suit against operators because they felt they were being misled by the promises of 5G in the country. Recently, South Korea’s antitrust regulator fined three 5G operators a total of 33.6 billion won ($25.06 million) for making exaggerated claims about the level of performance their networks could achieve. South Korean operators claimed consumers could experience theoretical 5G speeds, which are not practically achievable in a “real world” environment, as factors such as spectrum usage, network densification, user location, and device capability significantly affect actual performance. Our data shows that the top 10% of 5G users in South Korea experienced speeds of 1.004 Gbps in Q3 2023, which, although impressive, are far lower than the advertised 20 Gbps speeds. 

Chart of 5G NPS Score Change Year on Year

Fixed Networks

Fiber driving fixed performance gains 

Illustration of Fixed Median Performance Worldwide

On a global scale, fixed networks have demonstrated significant advancements, achieving a median download speed of 83.95 Mbps and an upload speed of 38.32 Mbps in Q3 2023, per Speedtest Intelligence data. This signifies a substantial 19% improvement in download speed and an impressive 28% enhancement in upload speed compared to those in 2022. This also indicates that more fixed connections have migrated to fiber networks.

According to the World Broadband Association (WBBA) report titled “Next Generation Broadband Roadmap 2023 to 2030” Fiber-to-the-Home (FTTH) is identified as the natural progression from copper-based xDSL broadband networks. The shift towards FTTH varies across different countries and regions, but the industry is committed to embracing more advanced and efficient broadband technologies. 

Oftentimes, despite improvement in underlying broadband technology, Wi-Fi is the bottleneck that reduces customer experience. Our research has shown that Wi-Fi performance can lag behind ethernet in markets where advanced cable and fiber connections are replacing legacy broadband technology (such as DSL or coax cable). Wi-Fi speeds typically range from 30-40% of ethernet, indicating a need to accelerate the adoption of more advanced Wi-Fi technologies and optimize the home network environment.

The UAE, Singapore, and Hong Kong are in the lead for fixed

Chart of Fastest Countries for Fixed Broadband Download Speed

The United Arab Emirates (UAE) and Singapore led the way in fixed network performance.

The UAE achieved a median download speed of 247.63 Mbps in Q3 2023, representing a notable 1.83 times increase compared to the previous year. Most customers in the UAE have access to fiber networks, and additional measures have been implemented by operators in the region to enhance internet speeds, such as increasing the minimum download speed from 250 Mbps to 500 Mbps and offering price discounts to incentivize users to upgrade to higher-tier plans. 

Singapore also leads on the 2023 Fiber Development Index (FDI), with maximum scores in seven of the nine metrics. Singapore, along with Qatar and South Korea, has achieved 100% FTHH coverage. One of the reasons for this success, besides having a smaller area, is that Singapore’s regulator mandates building owners and real estate developers to provide adequate space, facilities, and accessibility for network operators to pre-install fiber networks.

Hong Kong also demonstrated significant progress, with a 37% increase in median download speed and a 40% increase in upload speed. To track broadband adoption, the Office of the Communications Authority (OFCA) in Hong Kong monitors broadband adoption by advertised speed and technology mix; as of August 2023, 66% of residential clients already subscribed to the Internet with a download speed equal to or greater than 1 Gbps.

Chile has seen a 14% improvement in median download speed and a 29% improvement in upload speed on the back of a greater fiber adoption. Chile has been the top-performing fixed broadband market across Latin America, consistently outperforming other regional markets but over the last three years, it has also closed the performance gap with other leading markets globally. Chile’s strong fixed broadband performance — an anomaly in the region — is primarily due to strong competition among Chilean ISPs. Chile has seven ISPs with over 5% market share, all heavily focused on migrating customers to fiber. 

Thailand is a newcomer to the ranking as FTTH continues to grow strongly. FTTH constitutes an impressive 95% of fixed broadband users in Thailand, equivalent to around 58.96% of household penetration. Operators have been actively rolling out fiber in adherence to the Digital Thailand National Policy.

In the United States, there has been a 26% improvement in median download speed and a 7% improvement in upload speed. In this very competitive market, with a range of access technologies vying for customers, a combination of migration to fiber, 5G fixed-wireless access (FWA), and faster cable connections is helping drive higher performance levels. In line with the demand for faster network performance in the market, the FCC recently announced that it is seeking input on a planned increase to its definition of broadband/high-speed internet to 100 Mbps download and 20 Mbps upload, up from the current 25 Mbps download and 3 Mbps upload standard.

As discussed in our recent article, several European countries are making substantial progress in offering high-speed broadband. Across Europe, Denmark had the fastest median download speed for fixed broadband (196.43 Mbps), followed by Spain (176.08 Mbps) and France (170.51 Mbps). Denmark experienced a 25% improvement in median download speed and a 16% improvement in upload speed. Spain also showed significant improvement, with a 32% increase in median download speed and a 29% increase in upload speed. France exhibited even stronger progress, with a 53% increase in median download speed and a 41% increase in upload speed. The speed gains we’ve seen in Spain and France are correlated with an increase in fiber adoption; for example, Spain boasts nearly 90% fiber optic coverage, thanks to private initiatives and government support, while France expects a full-fiber rollout by 2025.

Connectivity for All

The imperative of closing the connectivity gap

Massive investments are being made to bridge the connectivity gap as recognition of connectivity as a fundamental human right is growing. According to a WBBA Whitepaper, a high level of broadband penetration is critical to the country’s socioeconomic development. However, it’s not only about being connected to the network per se; the quality of that broadband connection is equally crucial. Unlike other utility services like gas and electricity, where quality is generally stable, with broadband, the quality of the network experience is crucial to ensure users can benefit fully from multiple applications.

To assess the digital divide, we mapped mobile and fixed internet performance using data from the Open Data Initiative, which Ookla provides as part of Ookla for Good

Determining where a digital divide exists is a complex issue that involves identifying where network infrastructure is located, where people need connectivity, and how affordable it is. Although it can be challenging to dig into a specific location, it is evident that there are varying levels of Internet performance worldwide. A quick glance at our data shows that fixed broadband customers are more likely to experience faster networks (measured as an average download speed of 100 Mbps and above) than mobile across the Americas and Europe. The opposite is true for mobile networks across Africa and APAC, where mobile networks are often the primary means of connectivity. Compared to urban areas, rural communities are often ill-equipped for broadband access. Due to a lack of bandwidth (and therefore slower speeds), people in these areas need help doing many things on the internet, such as streaming videos. The US regulator FCC defines broadband in the United States as access to  25 Mbps download and 3 Mbps upload speeds. Areas without those speeds are classified as broadband “digital deserts,” even if those areas have internet access. Although broadband definitions can vary considerably from country to country, we can see in the next section that many areas fall outside any standards of connectivity globally.

Despite the world becoming increasingly connected, many rural and remote areas still struggle to access the internet. For example, large swathes of South America and Africa fall outside terrestrial network coverage. As discussed in our recent article, cellular networks are critical to connecting individuals and businesses as internet access in Africa is predominantly mobile. Before we can start discussing 5G, connecting communities with the internet in general is a priority. Affordable 4G smartphones and targeted financing for under-served demographics are key for bridging the digital divide and reducing poverty, as a World Bank study found that 4G coverage can help cut poverty by up to 4.3%. 

5G technology can potentially replace fixed internet access in situations where the cost of fiber deployments is high and rolling out traditional fixed broadband networks isn’t commercially viable. However, in countries like Indonesia, satellite technology may be a more effective solution for connecting remote areas. While 5G Fixed Wireless Access (FWA) and satellite technology can complement each other, the adoption of satellite technology is currently limited by factors such as coverage, device affordability, and service cost. As revealed in our recent article, Starlink outperforms GEO satellites and is a suitable replacement for fixed networks in rural areas. While it may not match the leading cable or fiber providers in terms of median speeds or multi-server latency, satellite internet provides a viable alternative in places where cable and fiber access networks are unavailable. This is mainly due to a more consistent distribution of download performance across Speedtest samples, unlike FWA and DSL-based services, where performance is impacted by the distance from the cell site or exchange/DSLAM.

Fixed and mobile network operators across the globe widely use Speedtest data to enhance Internet quality, improve accessibility, and inform network expansion. The United States Federal Communications Commission and the Malaysian Communications and Multimedia Commission rely on Speedtest data to ensure accountability of telecommunications entities and allocate funds for rural and urban connectivity development. Ookla also licenses data to NGOs and educational institutions to help bridge the digital divide between areas with and without modern Internet access. Our mapping data is used to track results and determine whether broadband infrastructure can handle growth as more people connect devices and technologies demand more bandwidth. We are also actively involved in discussing best practices for ensuring digital transformation and connectivity for all in the APAC region, Central Asia, and Europe. If you are interested in working with us, please reach out. 

Keep track of how well your country is performing on Ookla’s Speedtest Global Index and get advice on how to plan and optimize your network.

Ookla retains ownership of this article including all of the intellectual property rights, data, content graphs and analysis. This article may not be quoted, reproduced, distributed or published for any commercial purpose without prior consent. Members of the press and others using the findings in this article for non-commercial purposes are welcome to publicly share and link to report information with attribution to Ookla.

| December 22, 2024

Ringing in the New Year - How do 5G Networks Cope Under Stress?

5G Networks Support NYE Festivities Across Major Cities

Major events present a unique challenge for mobile networks, particularly sporting events where users congregate in concentrated numbers, and where sharing of video to social media, and to friends and family is a key use case. Ringing in the New Year is another case in point – for many years network operators published statistics on the number of voice calls made, messages sent, and the amount of data traffic their networks handled. While the rise of over-the-top (OTT) communications platforms such as WhatsApp have put a damper on these press releases, there remains a sizeable impact on operators’ networks. For example, Belgian operator Proximus noted a 95% increase in mobile data traffic on New Year’s Eve in 2023 compared to 2022. The trend isn’t uniform across markets, with Australia’s Telstra consistently seeing lower data usage on New Year’s Eve, with its customers using 30% less data than average, according to a news source. What is clear is that the New Year presents network operators with the challenge of serving sufficient bandwidth to customers attending major New Year celebrations, allowing them to share the moment, but also to support the mass wishing of “Happy New Year” across a variety of channels.

We reviewed Speedtest Intelligence data for New Year’s Eve 2023/24, to analyse how 5G networks coped with the surge in demand and change in traffic patterns at New Year, across a selection of major cities featuring some of the largest New Year celebrations around the globe. We focused in on median performance alongside the 10th percentile, in order to evaluate the spread of performance from the median user to those experiencing more challenging network conditions which would impact their experience at New Year.

Worst 10% of Speedtest samples reveal network challenges

We zeroed in on 5G upload performance first. Network operators universally allocate more spectral capacity to the downlink, as most mobile use cases lean more heavily on downloading data to the end-user device. However, the usage profile at the New Year is different, with video sharing, video streaming and calling, as well as uploading content to social media, more prevalent. These are all activities that are supported by uplink from the device.

Our data shows a significant gap between upload performance for the median user, and those in the lower 10th percentile – those experiencing the worst 10% of performance samples. Half the cities in our analysis recorded 10th percentile upload performance of less than 1 Mbps, with speeds ranging from 0.30 Mbps in Berlin, to 6.09 Mbps in Dubai. These sub-par speeds make it nearly impossible to upload photos or videos.

User Experience – Assessing the Worst 10% of Performance Samples on New Year's Eve
Speedtest data, New Year's Eve 23/24, 8pm – 1am

It was a similar picture for New Year revellers based on download speeds and latency. Despite more capacity being allocated to the downlink, performance for the lowest 10% of samples tumbled significantly compared to the median experience, with cities in APAC (Bangkok, Hong Kong, Sydney and Tokyo) in particular suffering, recording 10th percentile 5G download speeds of less than 10 Mbps. Latency was more of a mixed story across cities. At one end of the scale, Tokyo recorded a variance in latency between the median and 90th percentile (the worst 10% of latency samples) of just 19 ms, while Sydney saw a much wider gap of almost 200 ms. At 200 ms of latency users are likely to experience frustratingly slow loading times, unresponsive applications, and poor video quality.

Our data also showed the degree to which New Year usage pulled down 5G performance for the worst 10% of samples. New York, and cities in Europe saw less of an impact at New Year’s Eve compared to their global counterparts. Berlin, London, New York and Paris saw 5G download speeds for 10th percentile drop by between 1.13 Mbps and 6.88 Mbps. In contrast, Bangkok, Hong Kong and Sydney saw performance drop by between 15.13 Mbps and 21.44 Mbps. Dubai and Rio de Janeiro recorded the largest variance, however with faster 5G speeds they still outpaced the remaining markets by a significant margin. Upload performance for the worst 10% of samples followed a similar trend to download, however latency performance was more varied. Berlin, Dubai, New York, Rio de Janeiro and Tokyo saw very little difference between New Year Eve latency performance and the Q4 2023 average. However, Paris, Hong Kong and London saw an increase in latency for the worst 10% off samples of between 22 ms and 36 ms, while Bangkok and Sydney fared worst, with an increase of 61 ms and 171 ms respectively.

Impact of New Year's Eve Traffic on Users With the Worst 10% of Samples
Speedtest data, Q4 2023 vs New Year's Eve 23/24, 8pm – 1am

Addressing network pain points

Addressing network pain points for users affected by poor performance in dense urban areas is a challenging task. For major events like the recent Paris Olympics, which we reported on earlier this year, network operators will typically deploy temporary network assets such as cells on wheels (CoWs) to add extra network capacity, which can then be removed once the event concludes. Network operators can also look to build private networks, to provide dedicated capacity to support the operations of the event, including routing traffic for broadcasting purposes. However, city authorities also have an important role to play here, as highlighted in our recent whitepaper with Dublin City Council and the City Telecoms Association. Having a holistic view of network performance and its evolution across a city, as well as international benchmarks, provides city authorities with the data and insights to engage more constructively with network operators and regulators, and help introduce more effective policies to deliver meaningful change for end-users. We’ll continue to benchmark and report on city and state performance, based on Speedtest Intelligence data. For more information, please contact us.

Ookla retains ownership of this article including all of the intellectual property rights, data, content graphs and analysis. This article may not be quoted, reproduced, distributed or published for any commercial purpose without prior consent. Members of the press and others using the findings in this article for non-commercial purposes are welcome to publicly share and link to report information with attribution to Ookla.

| December 13, 2024

Performance Benchmarking of Mobile Operators in Small to Mid-Sized Markets

As mobile connectivity demand grows, particularly in urban areas, network performance has become a crucial indicator of a country’s development, competitiveness, and quality of life. This report focuses on the performance of mobile networks in small to mid-sized markets, which strike a balance between fostering competition and allowing operators to concentrate on urban connectivity. Based on the selected criteria, the top-performing operators identified in this analysis come from nine countries: Bulgaria, Denmark, Finland, Hungary, Kuwait, Norway, Singapore, Switzerland, and the U.A.E.

Key Takeaways

  • Operators from the U.A.E. and Kuwait dominate the top five positions. Speedtest Intelligence® 1H 2024 data showed that U.A.E.’s e& led with a median download speed of 351.73 Mbps, followed by du at 264.41 Mbps. Kuwait’s Ooredoo (234.45 Mbps), Zain (218.06 Mbps), and stc (190.42 Mbps) rounded out the top five.
  • Early 5G adoption has been a key factor in driving improved network performance, with operators like e& (U.A.E.), du (U.A.E.), Ooredoo (Kuwait), and Zain (Kuwait) achieving globally competitive median download speeds since launching 5G in 2019. Speedtest Intelligence data highlights consistent growth in 5G Availability and 5G Service metrics over the past two years. For instance, Ooredoo (Kuwait) increased 5G Availability from 67.0% to 73.7% and 5G Service from 78.3% to 83.9%, while Telenor Norway improved 5G Availability from 40.4% to 55.9%, and YouSee (Denmark) reached 84.0%, showcasing the significant impact of 5G expansion on network performance.
  • The top-performing operators predominantly came from a select group of highly urbanized and economically developed countries. Only nine countries accounted for the top 20 mobile operators in small to mid-size markets. Notably, all operators in the top ten were from countries with urbanization rates exceeding 87%, highlighting the correlation between high urban density and network performance.

Understanding mobile performance in advanced small to mid-size markets

Mobile network performance is shaped by multiple factors, each impacting speed, reliability, and user experience. Spectrum availability, infrastructure density, and advanced technologies like 5G are essential for meeting user demand effectively. Additionally, geographic, economic, and regulatory factors influence the level of investment and an operator’s ability to deploy and optimize services. Large markets spanning vast regions pose unique logistical and technical challenges for operators trying to serve both densely populated cities and remote rural areas. In contrast, operators in smaller markets, such as city-states, focus on compact urban areas, requiring a more targeted and agile approach to network deployment.

For the purpose of this analysis, we defined small-to-mid sized markets as having populations between 4 million and 10 million.  The majority of the population is concentrated in high-density areas, allowing for a clearer examination of urban network strategies without the intricate infrastructure needs of large rural areas. There are 35 markets globally that fit this criteria, and of these, more than 65% occupy land areas smaller than 200,000 km². Using Speedtest Intelligence data, we examined the mobile performance in these markets during the first half of 2024, highlighting the top 20 ranked mobile providers based on median download speed.

Operators from the U.A.E. and Kuwait dominate the top ten rankings

Using Speedtest Intelligence® data collected in the first half of 2024, we ranked the top ten mobile operators in small to mid-size markets based on all mobile technologies combined. Operators from the United Arab Emirates and Kuwait dominate the top five positions, with a few operators from Denmark, Norway, and Singapore also making it into the top ten list. Notably, all operators in the top ten were from highly urbanized countries, with an urbanization rate exceeding 87%. These markets were also economically developed, having an average GDP per capita of just under USD 60,000.

Top 10 Ranked Operators Performance, Small to Medium Markets
Source: Speedtest Intelligence® | 1H 2024

U.A.E.’s e& (U.A.E) leads by a significant margin, achieving a median download speed of 351.73 Mbps for all technologies combined. This lead is indicative of the e&’s strong investment in telecommunication infrastructure and advanced network capabilities. Following e& is du, which has a median download speed of 264.41 Mbps. Both e& and du reported similar median upload speeds, with 26.58 Mbps and 26.25 Mbps respectively. The results underscore the U.A.E.’s robust telecommunications landscape, driven by strong competition among the leading operators.

Kuwait’s Ooredoo and Zain rank third and fourth with median download speeds of 234.45 Mbps and 218.06 Mbps, respectively. Another Kuwaiti operator, stc, completes the top five with a speed of 190.42 Mbps. The presence of three Kuwaiti operators in the top five highlights the country’s substantial progress in mobile network development, driven by a concentrated urban population and high levels of mobile broadband penetration. 

The dominance of operators from the Middle East, particularly the U.A.E. and Kuwait, in overall network performance highlights the significant investments and advancements in 5G infrastructure within the region. Our previous report examined how the U.A.E. was the fastest 5G market globally in 1H 2024, with a median download speed of 660.08 Mbps, with e& UAE leading both domestically and globally at 749.63 Mbps. In Kuwait, Zain topped 5G median download speed in the market with a speed of 411.06 Mbps, surpassing Ooredoo at 379.04 Mbps during the same period. These achievements underscore the region’s strategic focus on enhancing connectivity and setting benchmarks for global 5G performance. 

Northern Europe also has strong representation in the top ten, with Telenor (Norway) achieving 174.34 Mbps and three Danish operators (3, Telia, and YouSee) rounding out the list, all offering speeds above 148 Mbps. Singtel of Singapore is positioned in eighth place at 159.22 Mbps, indicative of Singapore’s efficient, urban-focused mobile deployment.

European operators were the most prominent beyond the top ten

11-20 Ranked Operators Performance, Small to Medium Markets
Source: Speedtest Intelligence® | 1H 2024

The next tier of mobile operators, ranked 11 to 20 by median download speed, offers a broader view of competitive performance across smaller European and Asian markets. Leading this group is A1 of Bulgaria, with a median download speed of 140.56 Mbps, placing it just below the top 10. Close behind Telenor (Denmark) and Telia (Norway), at 135.83 Mbps and 134.53 Mbps, respectively, highlight Northern Europe’s strong network performance capabilities, where dense urban populations and advanced network deployment have created solid foundations for high-speed connectivity.

Finnish operators make up a substantial part of this ranking, with DNA at 120.72 Mbps, Telia at 103.51 Mbps, and Elisa at 93.50 Mbps. The inclusion of the three Finnish operators in the list is notable, given the complex mix of population distribution and challenging coverage requirements of the market, which make consistently high speeds difficult across various geographies.

Other European operators, such as Swisscom in Switzerland, which had a speed of 117.29 Mbps, and Yettel in Hungary, with 94.58 Mbps, demonstrated that smaller, urbanized markets could still maintain competitive internet speeds. Singapore’s StarHub, with a speed of 100.46 Mbps, ranked 18th, highlighting the country’s strong mobile infrastructure.

Proactive 5G strategies contributing to overall performance gains among top operators

The majority of the operators in the top 20 list were early adopters of 5G technology, with most launching 5G services as early as 2019 or 2020. This early adoption has proven to be a factor in enhancing their overall network performance, allowing them to deliver faster speeds, greater reliability, and a better overall user experience compared to markets that lagged in 5G rollout.

Timeline of 5G Launch Among Top Operators in Small to Medium Markets

Operators such as e& (U.A.E.), du (U.A.E.), Ooredoo (Kuwait), and Zain (Kuwait) launched 5G services in 2019 and have consistently achieved higher median download speeds compared to other operators globally. In May 2019, etisalat by e& became the first operator in the Middle East and North Africa (MENA) region to introduce 5G Non-Standalone (NSA) technology to subscribers. The U.A.E. and Kuwait have regularly ranked as the fastest operators in Ookla’s Speedtest Global Index, alongside other early 5G adopters like Qatar and South Korea.

Government support and operator investments have played a crucial role in driving 5G success in these markets. In the U.A.E., the telecom regulator TDRA waived fees for 5G frequencies above 3 GHz for five years, giving operators access to extensive spectrum resources in the 2500-2600 MHz and 3300-3800 MHz ranges. Similarly, Kuwait’s CITRA allocated additional spectrum in the 2.3 GHz and 2.6 GHz bands, enabling operators to enhance their 5G networks and prepare for the rollout of 5G-Advanced technology.

European operators, including Telenor (Norway), 3 (Denmark), and A1 (Bulgaria), as well as Singtel and StarHub in Singapore, have also leveraged early 5G implementation to enhance service quality. GSMA’s 5G Connectivity Index highlights that markets with proactive 5G strategies tend to outperform in network performance metrics. 

Leading operators demonstrate ongoing 5G adoption and coverage expansion

The overall performance gains are closely linked to the increased adoption of 5G services and the expansion of 5G coverage in key markets. As more users spend a larger share of their time on 5G networks, reliance on older technologies like 4G has steadily declined. This transition has contributed to faster speeds, lower latency, and overall improvements in mobile network performance for users across these top-performing operators.

5G Availability (%) Quarterly Trend
Source: Speedtest Intelligence® | Q1 2023 – Q3 2024

5G Service (%) Quarterly Trend
Source: Speedtest Intelligence® | Q1 2023 – Q3 2024

Top operators have continued to expand their 5G networks across their respective markets. Over the past 24 months, quarterly data has shown a consistent upward trend in both 5G Availability—the percentage of time users with 5G-capable devices spend connected to 5G—and 5G Service, which measures the percentage of geographical areas with reported 5G coverage. This dual growth demonstrates the operators’ commitment to improving both user experience and network reach.

e& (U.A.E.) and du (U.A.E.) have shown steady increases in 5G Availability. e& rose from 13.9% in Q2 2023 to 25.6% in Q3 2024, while du increased from 16.5% to 20.9% over the same period. 5G Service also improved, with e& expanding from 41.5% in Q2 2023 to 52.9% in Q3 2024, and du growing from 56.4% to 67.2%. 

Kuwaiti operators Ooredoo, Zain, and stc consistently maintained high levels of 5G Availability. Ooredoo increased from 67.0% in Q2 2023 to 73.7% in Q3 2024, while 5G Service also saw growth, with Ooredoo rising from 78.3% to 83.9% and Zain expanding from 81.1% to 90.6% during the same period. 

European operators also showed notable progress. Telenor Norway achieved significant growth in 5G Availability, rising from 40.4% to 55.9%. Denmark’s YouSee maintained one of the highest levels, increasing from 72.8% to 84.0%. In Finland, DNA and Telia demonstrated consistent improvements, with DNA rising from 52.6% to 71.6% and Telia making steady advancements as well. These trends reflect the continued expansion of 5G in both urban and outskirts, supporting increased 5G connectivity  across these markets.

Majority of the top operators’ 5G networks are utilizing C-band spectrum

Spectrum availability plays an important part in network performance, impacting speed and coverage. In urbanized small to mid-size markets, operators must strategically manage and, where possible, the ability to access adequate spectrum resources is crucial for reducing network congestion and maintaining a consistent, high-quality experience for users.

We analyzed the distribution of Speedtest data samples based on the primary reported 5G spectrum bands used by the top ten performing operators to gain insights into the spectrum bands utilized by operators. It’s important to note that operators will employ differing strategies to optimize spectrum utilization and the user experience. Consumer-initiated tests will attempt to saturate a network connection, and operators will tend to serve this capacity demand through the spectrum bands with the highest capacity and, where required, supplement this capacity through carrier aggregation. This gives a better indication of the maximum throughput and state of the network, in contrast with background idle-state testing, which will often camp on lower frequency bands and, more specifically, on 4G-LTE.

The results show that upper mid-band spectrum, or  C-Band (3.3-4.2 GHz), is the most widely utilized spectrum band among these operators, playing a critical role in balancing performance, availability, and coverage. The C-band offers an optimal balance between speed and coverage, making it suitable for urban and broader coverage areas.

Operators like e& (U.A.E.) and du (U.A.E.) rely heavily on the C-band, with 93.5% and 78.9% of test samples reported in this range, respectively. Similarly, operators in Kuwait, including Ooredoo, Zain, and stc, show a near-exclusive reliance on the C-band (ranging from 89.1% to 99.9%), enabling them to deliver widespread 5G availability and improved median download speeds.

In Nordic markets, operators like Telenor Norway and YouSee Denmark demonstrate more diverse spectrum strategies. Telenor Norway combines significant use of the C-band (62.4%) with a notable portion of low-band spectrum (37.4%), which enhances coverage in rural and less densely populated areas. This mixed approach allows these operators to ensure nationwide 5G rollout while maintaining urban performance. 

Top performing operators came from a few highly urbanized countries.

Our data shows that operators from only nine countries made up the top 20 mobile operators with the best median download speed within small to mid-size markets. Denmark had the highest representation, contributing four operators to the top 20 list. Kuwait and Finland follow closely, each with three operators ranked among the best. Other countries with top-performing operators include the U.A.E., Singapore, Norway, Bulgaria, Switzerland, and Hungary, each featuring one or two operators.

Top 20 Operators Countries
Source: Speedtest Intelligence® | 1H 2024, World Population Review | 2023

These markets share several common characteristics that likely contribute to their high mobile network performance. Most are highly urbanized and economically developed, which facilitates the deployment of advanced telecommunications infrastructure.  Additionally, these countries often have high levels of investment in digital connectivity, enabling operators to maintain robust, high-speed networks. Many of these markets, such as Singapore, Switzerland, and Norway, are relatively compact, allowing operators to concentrate network resources and deliver consistent performance across their territories.

In contrast, markets with lower urbanization levels, such as Austria (59.5% urbanization) and Ireland (64.5% urbanization), despite sharing similar characteristics with the high-performing markets—such as strong economies and investments in telecommunications infrastructure—reported lower median download speeds of 79.46 Mbps and 38.20 Mbps, respectively. This highlights the need for tailored strategies in less urbanized markets to enhance coverage and optimize performance.

Ookla will continue to monitor overall mobile performance and 5G deployments globally and benchmark countries and operators. For more information about Speedtest Intelligence data and insights, please get in touch.

Ookla retains ownership of this article including all of the intellectual property rights, data, content graphs and analysis. This article may not be quoted, reproduced, distributed or published for any commercial purpose without prior consent. Members of the press and others using the findings in this article for non-commercial purposes are welcome to publicly share and link to report information with attribution to Ookla.

| June 17, 2024

Your Guide to Airport Wi-Fi and Mobile Performance at 50+ Global Airports in 2024

Airports around the world have been packed with travelers this year, which puts extra stress on the Wi-Fi. With summer travel already well in swing in the northern hemisphere, we’re back with fresh data for our series on airport Wi-Fi performance to help you plan for connectivity at all your connections. You’ll find information about Wi-Fi on free networks provided by the individual airports as well as mobile speeds at some of the busiest airports in the world during Q1 2024. Read on for a look at internet performance at over 50 of the world’s busiest airports with data on download speed, upload speed, and latency.

Key takeaways

  • The seven fastest airports for downloads over Wi-Fi were in the United States: San Francisco International Airport, Newark Liberty International Airport, John F. Kennedy International Airport, Phoenix Sky Harbor International Airport, Seattle–Tacoma International Airport, Dallas Fort Worth International Airport, and Harry Reid International Airport.
  • Six U.S. airports had the fastest uploads over Wi-Fi: San Francisco International Airport, Phoenix Sky Harbor International Airport, Newark Liberty International Airport, Seattle–Tacoma International Airport, Dallas Fort Worth International Airport, and John F. Kennedy International Airport.
  • The fastest mobile download speeds on our list were at Hamad International Airport in Doha, Qatar, Shanghai Hongqiao International Airport in China, and Phoenix Sky Harbor International Airport in the U.S.
  • Eight of the 10 airports with the fastest mobile upload speeds were in China.

9 airports have 100+ Mbps Wi-Fi download speeds

Speedtest Intelligence® showed seven of the nine airports with median Wi-Fi download speeds over 100 Mbps were in the U.S.:

  • San Francisco International Airport (173.55 Mbps),
  • Newark Liberty International Airport (166.51 Mbps),
  • John F. Kennedy International Airport (151.59 Mbps),
  • Phoenix Sky Harbor International Airport (151.28 Mbps),
  • Seattle–Tacoma International Airport (137.31 Mbps),
  • Dallas Fort Worth International Airport (119.92 Mbps), and
  • Harry Reid International Airport (107.84 Mbps).

Charles de Gaulle Airport in Paris, France and China’s Hangzhou Xiaoshan International Airport rounded out the list with median download speeds of 107.13 Mbps and 101.01 Mbps, respectively. Hartsfield–Jackson Atlanta International Airport and Sea–Tac had the lowest median multi-server latency on Wi-Fi of any of the airports surveyed during Q1 2024.

Hover on the pins on the map below to see full details for download and upload speeds as well as latency at all the airports analyzed.

Fixed Broadband Internet Speeds Over Free Wi-Fi at Global Airports
Speedtest Intelligence® | Q1 2024
A map showing fixed broadband speeds in selected global airports.

At Ookla®, we’re dedicated to making sure the networks you depend on are always at their best. With Ekahau®, our Wi-Fi solution, we know firsthand just how challenging it can be to optimize Wi-Fi at airports, especially when you have up to 900 people waiting at each boarding gate during the busiest travel times. While the speeds achieved by these top airports are impressive, we saw two smaller U.S. airports with median Wi-Fi download speeds over 200 Mbps during our U.S.-only analysis of airport Wi-Fi in the fall.

Six airports on our list use multiple SSIDs for their Wi-Fi networks for different terminals or to take advantage of the coverage advantages of 2.4 GHz and the speed advantages of 5 GHz frequencies. We have included data for all the SSIDs with sufficient samples in the map and reported in the text on the best result when using multiple SSIDs results in dramatically different speeds.

Eighteen airports on our list had median Wi-Fi download speeds of less than 25 Mbps. Mexico City International Airport in Mexico had the lowest median Wi-Fi download speed at 5.11 Mbps, followed by:

  • Tan Son Nhat International Airport in Vietnam (7.07 Mbps),
  • Beijing Capital International Airport in China (9.45 Mbps),
  • Cairo International Airport in Egypt (10.62 Mbps), and
  • Tokyo Haneda Airport in Japan (11.37 Mbps).

You may struggle with everything from video chatting to streaming at any airport with a download speed below 25 Mbps. Latency is also a factor in performance so if your airport is one of the three with a median Wi-Fi latency over 60 ms, a mobile hotspot may be a better option for a stable connection.

Wi-Fi 6 has arrived

Our analysis shows at least 15 airports on our list were using the new Wi-Fi 6 standard in their Wi-Fi setup. Wi-Fi 6 uses Multi-User Multiple Input, Multiple Output (MU-MIMO) and Orthogonal Frequency Division Multiple Access (OFDMA) to increase performance and throughput, especially when serving multiple devices. This offers a real advantage at a large public location like an airport. In order to get maximum benefit from Wi-Fi 6, consumers would need to be using Wi-Fi 6-compatible devices. Speedtest data shows a fairly even split between airports that saw faster download speeds on Wi-Fi 6 and airports where Wi-Fi 6 results were comparable to those on other earlier Wi-Fi generations.

As you know, international travel can be complicated. Even if the airport offers free Wi-Fi, you may encounter other barriers to access. For example, a local number is required in Cairo to receive the access code to connect to the airport Wi-Fi. And while we’d love to include other large airports like Nigeria’s Murtala Muhammed International Airport in future Wi-Fi analyses, they currently do not offer free Wi-Fi so we have included mobile data below.

11 airports show mobile speeds over 200 Mbps

Speedtest® data shows mobile speeds massively outpaced Wi-Fi, with 14 airports showing faster median downloads over mobile than the fastest airport for Wi-Fi. Hamad International Airport in Qatar had the fastest median download speed over mobile on our list at 442.49 Mbps during Q1 2024, followed by:

  • Shanghai Hongqiao International Airport (341.19 Mbps),
  • Phoenix Sky Harbor International Airport (295.94 Mbps),
  • Shanghai Pudong International Airport (264.71 Mbps),
  • Chongqing Jiangbei International Airport (258.42 Mbps), and
  • Istanbul Airport (255.51 Mbps).

Mobile Network Speeds at Global Airports
Speedtest Intelligence® | Q1 2024

Fastest mobile speeds at airports in Africa and South America

Jomo Kenyatta International Airport in Kenya had the fastest mobile download speeds of the four African airports we analyzed at 88.12 Mbps during Q1 2024. São Paulo/Guarulhos International Airport in Brazil was the faster of the two Latin American airports analyzed with a median download speed of 55.44 Mbps.

Airports with slow mobile speeds

Mobile can’t fix everything, because six airports came in with a median mobile download speed below 25 Mbps. Mexico City International Airport was again at the bottom with 8.75 Mbps, followed by:

  • Josep Tarradellas Barcelona–El Prat Airport (15.21 Mbps),
  • Orlando International Airport (15.84 Mbps),
  • Adolfo Suárez Madrid–Barajas Airport (20.37 Mbps),
  • Chhatrapati Shivaji Maharaj International Airport (20.96 Mbps), and
  • Indira Gandhi International Airport (21.80 Mbps).

Latency on mobile was generally higher than that on Wi-Fi with 46 airports showing a Wi-Fi latency lower than the lowest latency on mobile, 27.51 ms at China’s Shanghai Hongqiao International Airport. As noted above, latency is an important factor in performance, so it might be worth investigating the airport Wi-Fi by running a Speedtest if your mobile performance seems to lag.

Airport Wi-Fi or mobile? Connecting on your next trip

We created a quick guide to help you decide whether to try out the Wi-Fi or simply use the local mobile network if you have access. Use it to compare free airport Wi-Fi performance against mobile performance for the 52 airports we have both Wi-Fi and mobile data for during Q1 2024. Twenty-six airports had faster mobile internet than airport Wi-Fi. Eight airports had faster Wi-Fi than mobile, and seven airports showed only a slight distinction between Wi-Fi and mobile or download speeds over 100 Mbps on both, so we gave both the green check marks. We were able to include more airports in the mobile analysis because there were more mobile samples to analyze at those airports than there were samples over Wi-Fi.

Chart of Comparing Airport Wi-Fi and Mobile Speeds at World Airports

The averages reported here are based on real-world data, so your experience may differ, especially on a busy travel day. Take a Speedtest® at the airport to see how your performance compares. Cheers to safe travels and rapid connections wherever you’re flying.

Ookla retains ownership of this article including all of the intellectual property rights, data, content graphs and analysis. This article may not be quoted, reproduced, distributed or published for any commercial purpose without prior consent. Members of the press and others using the findings in this article for non-commercial purposes are welcome to publicly share and link to report information with attribution to Ookla.

| July 27, 2021

Oslo Tops the List of World Capitals with the Fastest 5G in Q1-Q2 2021

Mobile operators are rapidly expanding 5G deployments across the globe, with 16,410 new 5G deployments across 109 countries added to the Ookla 5G Map in June 2021 alone. Huge investments in 5G are being made to increase performance, especially in major cities. We used Speedtest Intelligence® to see which world capitals have the best 5G speeds and availability, based on locations with commercially available 5G during Q1-Q2 2021.

Oslo, Norway was the fastest world capital for 5G during Q1-Q2 2021

ookla_fastest_5g_download_speed_world_capitals_0721

The race for fastest 5G performance among world capitals was extremely competitive during Q1-Q2 2021. Oslo, Norway had the fastest 5G of any world capital, clocking in with a median download speed of 526.74 Mbps. Seoul, South Korea had the second fastest median download speed over 5G at 467.84 Mbps; Abu Dhabi, United Arab Emirates was third (421.26 Mbps); Doha, Qatar fourth (413.40 Mbps) and Stockholm, Sweden fifth (401.30 Mbps). Riyadh, Saudi Arabia (384.66 Mbps); Kuwait City, Kuwait (338.97 Mbps), Muscat, Oman (318.95 Mbps); Beijing, China (291.19 Mbps); and Taipei, Taiwan (287.86 Mbps); rounded out the top 10. Helsinki, Finland showed a median 5G download speed of 279.59 Mbps; Sofia, Bulgaria 260.55 Mbps; Canberra, Australia 258.39 Mbps; Bangkok, Thailand 253.73 Mbps; Manama, Bahrain 249.71; Dublin, Ireland 223.01; Luxembourg City, Luxembourg 209.98 Mbps; Paris, France 208.48 Mbps and Bucharest, Romania 203.44 Mbps.

We saw median 5G download speeds between 150 Mbps and 200 Mbps in the following world capitals during Q1-Q2 2021: Ottawa, Canada (196.11 Mbps); Hanoi, Vietnam (195.99 Mbps); Bratislava, Slovakia (188.23 Mbps); Madrid, Spain (183.37 Mbps); Bern, Switzerland (175.69 Mbps); Rome, Italy (171.79 Mbps); London, United Kingdom (167.50 Mbps); Tokyo, Japan (167.02 Mbps); Athens, Greece (164.95 Mbps); Copenhagen, Denmark (162.75 Mbps); Ljubljana, Slovenia (158.50 Mbps); Hong Kong (153.78) and Washington, D.C., United States (151.80 Mbps).

Cape Town, South Africa was the slowest world capital for 5G in Q1-Q2 2021

ookla_slowest_5g_download_speed_world_capitals_0721

Speedtest Intelligence shows Capetown, South Africa had the slowest median download speed over 5G during Q1-Q2 2021 at 53.33 Mbps. Other world capitals with slower median 5G download speeds included: Brasilia, Brazil (62.18 Mbps); San Juan, Puerto Rico (72.59 Mbps); Warsaw, Poland (80.18 Mbps); Singapore (111.20 Mbps); Manila, Philippines (112.23 Mbps); Prague, Czechia (116.30 Mbps); Budapest, Hungary (137.54 Mbps); Amsterdam, Netherlands (139.75 Mbps); Zagreb, Croatia (140.92 Mbps); Vienna, Austria (144.93 Mbps); Jerusalem, Israel (145.17 Mbps); and Berlin, Germany (148.16 Mbps).

Capitals not mentioned on either of these lists did not have sufficient 5G samples during Q1-Q2 2021 to be included in this report.

The fastest 5G speeds are yet to come

5G is rapidly improving across the world and we’re eager to see how countries, cities and operators continue to perform during Q3 2021 and beyond. If you want to see how your 5G network performs against these benchmarks, please download the Android or iOS app, and take a Speedtest®. Learn more about 5G provider performance in select cities here, and visit the Ookla 5G MapTM to see which providers are offering 5G in your area.

Editor’s note: This article was updated on July 28 to reorganize the content for clarity.

Ookla retains ownership of this article including all of the intellectual property rights, data, content graphs and analysis. This article may not be quoted, reproduced, distributed or published for any commercial purpose without prior consent. Members of the press and others using the findings in this article for non-commercial purposes are welcome to publicly share and link to report information with attribution to Ookla.

| December 21, 2021

Oman’s Mobile Performance Is Blazing Ahead and 5G Will Boost Speeds


pdf_download_button_ar-1

Middle Eastern countries — particularly within the oil-rich Gulf — have been investing heavily in expanding and upgrading their mobile networks over the past few years. That’s been paying off for consumers across the region, with United Arab Emirate (U.A.E.) operator Etisalat being awarded with the World’s fastest mobile network operator in 2020 and Gulf nations holding four of the top 10 spots on the Speedtest Global Index during September 2021. With Oman rising in the mobile rankings and Muscat placing in the top 10 world capitals for fastest 5G during Q1-Q2 2021, Oman’s rise as a potential mobile powerhouse merits further investigation.

This article examines the state of Oman’s mobile performance during Q3 2021, including which provider had the fastest mobile performance, Oman’s 5G evolution, a governorate-level mobile analysis and snapshot of provider performance in Muscat using Ookla® Cell Analytics.

Oman is behind its regional partners for mobile performance during Q3 2021, but speeds are rapidly accelerating

ookla_download-comparison_oman_1021_en

Speedtest Intelligence® revealed the U.A.E. had the fastest median mobile download speed among Oman’s regional trading partners at 109.92 Mbps during Q3 2021. Oman was a hair faster than Bahrain at 46.85 Mbps. Jordan and Iraq had the slowest median download speeds on this list at 18.82 Mbps and 33.74 Mbps, respectively.

Ooredoo overtook Omantel as Oman’s fastest mobile operator

ookla_mobile_performance_oman_1121_en

Competition between Oman’s top providers, Ooredoo and Omantel, has been fierce over the past year. However, Ooredoo pulled ahead of Omantel during Q3 2021, achieving a median mobile download speed of 48.22 Mbps to Omantel’s 44.56 Mbps. Ooredoo also had the fastest median mobile upload speed during Q3 2021 at 13.74 Mbps to Omantel’s 12.00 Mbps.

Ooredoo outpaced Omantel for fastest 5G download speed

ookla_5G_performance_oman_1121_en

Ooredoo also achieved the fastest 5G in Oman during Q3 2021, achieving a median 5G download speed of 346.37 Mbps to Omantel’s 228.25 Mbps. The fastest median 5G upload speed during Q3 2021 was much closer with Ooredoo achieving a median upload speed of 27.37 Mbps to Omantel’s 24.78 Mbps.

Ooredoo beat Omantel for 4G Availability, Omantel pulled ahead for 5G Availability

ookla_4G-5G-availability_oman_1121_en

Competition for the highest 4G and 5G Availability — with 4G Availability representing the proportion of users who spend most of their time on 4G or greater networks and 5G Availability representing the proportion of users who spend most of their time on 5G networks — was also close in Oman during Q3 2021. Ooredoo had the highest 4G Availability at 84.3% to Omantel’s 78.4%. For 5G Availability there was no statistical winner, but Omantel achieved 8.1% and Ooredoo achieved 7.4% during Q3 2021.

Muscat had the fastest mobile download speed among Oman’s governorates

ookla_mobile-performance_oman_map_1121_en

We used data from Speedtest Intelligence to examine Oman’s 11 governorates and found Muscat Governorate had the fastest median mobile download speed at 66.96 Mbps during Q3 2021. Al Buraymi Governorate was next on this list at 47.22 Mbps, followed by Al Batinah North Governorate (46.74 Mbps), Al Batinah South Governorate (44.68 Mbps) and Ad Dakhiliyah ‍Governorate (42.49 Mbps). Ash Sharqiyah North Governorate, Dhofar Governorate and Ad Dhahirah Governorate and Ash Sharqiyah South Governorate achieved between 34.00 Mbps and 39.00 Mbps. Al Wusta Governorate had the slowest median download speed at 33.21 Mbps. Musandam Governorate lacked sufficient data for inclusion.

Four governorates achieved the 4G Availability above 80% during Q3 2021

ookla_4g-availability_oman_map_1121_en

Speedtest Intelligence found that there was no statistical winner for highest 4G Availability in Oman during Q3 2021, but Muscat Governorate (84.4%), Al Batinah North Governorate (83.5%), Al Batinah South Governorate (83.0%) and Dhofar Governorate (82.8%) all achieved 4G Availability above 80%. All the rest of Oman’s governorates had 4G Availability between 72.0-80.0% except Al Wusta Governorate, which had the lowest 4G Availability in Oman at 57.9% during Q3 2021.

Signal strength is competitive in Muscat

We identified several key locations in Muscat to highlight using Cell Analytics data from Q2-Q3 2021. Each of these maps shows the strongest 4G reference signal received power (RSRP) in a given area, which can help mobile operators locate areas where they can improve their networks. Cell Analytics can identify the strongest RSRP by mobile network provider for a given area if there is a statistically-significant winner and color codes that plot bin to the provider’s color. Provider-level maps show the performance of individual providers for a given area, with pink and red showing a strong signal and blue indicating a weak signal.

Al Mawaleh South and Al Mouj Muscat

Located west and northwest of the Muscat International Airport, Al Mawaleh South and Al Mouj Muscat are high-traffic areas frequented by many Omani residents. The image below shows the strongest 4G LTE RSRP signal strength by provider with the dark blue representing Omantel and purple representing Ooredoo. As evidenced by the bands of solid colors, Omantel and Ooredoo have a strong presence by the major throughways in this area, while competition throughout the neighborhood is tight, particularly around the City Centre Muscat mall just west of the airport.

cell-analytics_best-rsrp_al-mawaleh-south_1021_en

The maps below show areas where each top provider has high and low signal strength data. Omantel had areas of high signal strength (pink and red), particularly on the major throughways and crowded shopping areas. Omantel also had a strong presence near the Al Mouj Marina, as well as key locations at the Seeb Stadium and City Centre Muscat mall. Ooredoo had deployments in similar locations with a strong signal near 18th November St., just north of the airport.

cell-analytics_rsrp_al-mawaleh-south_1021_en

Ruwi and Al Wadi Al Kabir

Located in central Muscat, Ruwi and Al Wadi Al Kabir Industrial Estate represent the commercial heart of Muscat. As the images that follow show, it’s clear mobile operators have recognized how valuable this valley is to Omanis. Ooredoo had a strong presence in this area during Q2-Q3 2021, particularly through the central throughways, downtown core and central Al Wadi Al Kabir Industrial Estate. Omantel had strong signal strengths along most of Bait Al Falaj St. as well as south of this map.

cell-analytics_best-rsrp_al-wadi-al-kabir_1021_en

It comes as no surprise then that Ooredoo showed very strong 4G LTE signal strength near the central and southwest areas of this map during Q2-Q3 2021, as well as a few pockets of strong RSRP throughout. Interestingly, there were a few weaker areas between Ruwi St. and 41 Way near the center of the map. Omantel had strong signal strength near the north of this map, the southern half and central core, though there were a few areas of weaker signal strength (green and blue) in the west and center.

cell-analytics_rsrp_al-wadi-al-kabir_1021_en

Al Ghubrah South, Al Ghubrah Ash Shamaliyah, Al Azaiba North, Al Azaiba South and Al Khuwayr South

Home to the busy downtown Muscat area as well as the Sultan Qaboos Grand Mosque, national Omani soccer stadium and beautiful beaches, this central Muscat area contains major local and international points of interest. The map below shows the provider with the strongest RSRP signal strength for a given area during Q2-Q3 2021. We saw a seemingly even competition between Ooredoo and Omantel, with each provider showing stronger RSRP signal strength in bands near the major highway and major sightseeing activities.

cell-analytics_best-rsrp_al-ghubrah_1021_en

However, when we look at each individual mobile operators’ 4G LTE RSRP, we see the area on Sultan Qaboos St. that includes Oman Avenues Mall, LuLu Hypermarket-Bousher, Muscat Grand Mall, Sharaf DG Muscat Mall and IKEA Muscat was fiercely competitive. Ooredoo had strong signal strength near the north of this area while Omantel had strong signal strength near in the middle of this area, fading slightly within the shopping mall areas. Omantel also had strong signal strength along most of Qaboos St. and lower signal strength within many of the neighborhoods beyond that core roadway. In that last respect, Ooredoo seemed to be doing a little better with more red showing in some of the neighborhood areas where Omantel fell short.

cell-analytics_rsrp_al-ghubrah_1021_en

Oman’s future mobile experience is faster, competitive 5G

Like many of its peers in the Gulf Cooperation Council (GCC), Oman has set in place a strategic vision for its economic development as it looks to diversify its economy away from a reliance on oil. Its e.Oman 2030 strategy highlights the realization of a high-speed, high density network infrastructure as a key enabling factor in achieving its goals of increased digital literacy and skills, the development and adoption of e-government services, and the digital transformation of Omani industries.

In October 2019, Oman’s Telecommunications Regulatory Authority (TRA) outlined its 5G roadmap in support of this objective. The regulator has granted Omantel and Ooredoo rights to a 100 MHz block of spectrum each in the C-band for 5G services, while reserving an additional 100 MHz block for a new entrant. The regulator also waived annual frequency fees for a year to encourage investment, while the operators undertook deploying 4,400 5G base stations over the following five years. According to the RTA, a total of 1,300 5G sites had been deployed in the market as of June 2021, equating to 5G coverage of 40% of the population. With 5G Availability in the market below 10%, it’s clear that operators need to do more to encourage 5G adoption.

Oman Future Telecommunications (OFT), operating under the Vodafone Oman brand, plans to launch commercial services in late 2021. OFT signed a strategic partnership with Vodafone in 2019 and was granted a license in 2021 to become Oman’s third network operator. OFT recently signed a managed services agreement with Ericsson to build and operate a greenfield 4G and 5G core and radio access network and already has agreements in place with Oman Tower Company and Oman Broadband to accelerate its network build. Increased competition in the market, particularly when 5G adoption is still in its early stages, will bring renewed focus on network speed as a differentiator. This is backed up by Vodafone Oman’s aggressive network rollout with Ericsson. Vodafone‘s experience in India — where the early 4G era and entrance of Reliance Jio saw price wars that led to both network operator consolidation and the amassing of large debt burdens by operators in the market — is likely to dissuade Vodafone from pursuing an aggressive pricing strategy in Oman.

Internet speeds in Oman are blazing forward and we’ll be watching closely to see how they change. Click here to learn more about Speedtest Intelligence and Cell Analytics.

Ookla retains ownership of this article including all of the intellectual property rights, data, content graphs and analysis. This article may not be quoted, reproduced, distributed or published for any commercial purpose without prior consent. Members of the press and others using the findings in this article for non-commercial purposes are welcome to publicly share and link to report information with attribution to Ookla.

| January 4, 2023

The Speedtest Global Index Shows These Countries Sped Forward for Internet Experience in 2022

Internet connectivity continues to speed ahead for people around the world, especially as countries prioritize and improve mobile and fixed broadband networks. That’s nowhere more apparent than on the Speedtest Global Index™, which tracks countries’ internet speeds and the overall global median internet speeds. Last year, we took a look at the state of the internet speeds over the years, and today we’re back to see how most of 2022 fared from November 2021 to November 2022, and what countries made our top 10 fastest mobile and fixed broadband lists.

Mobile download speed jumped nearly 17% over the last year globally, fixed broadband up at least 28%

Chart of increase in world download speeds from November 2021 through 2022

The improvement of global median download speeds has been somewhat asymmetrical over the past year on the Speedtest Global Index. Fixed broadband speeds made greater strides over the past year than mobile download speeds, with fixed broadband speeds becoming at least 28% faster and mobile becoming nearly 17% faster from November 2021 to November 2022. Gains in upload speed were even more pronounced with mobile becoming at least 9% faster and fixed broadband becoming at least 30% faster. Latency, which is becoming an increasingly important metric, decreased on mobile over the course of the year from 29 ms in 2021 to 28 ms in 2022, while fixed broadband latency remained the same at 10 ms.

Top 10 rankings remain relatively constant over the past year, U.A.E. joins fixed broadband list and Denmark, Macau (SAR), and Brunei race ahead for mobile during 2022

Chile raced ahead on fixed broadband

List of fastest countries for fixed braodband internet from November 2021 through 2022

The competition for the fastest fixed broadband was neck-and-neck on the Speedtest Global Index during 2022, with Chile (216.23 Mbps) taking top honors and China (214.23 Mbps) and Singapore (214.23 Mbps) a hair behind. Over the course of the year, the top 10 countries for fastest fixed broadband remained relatively the same while each country jostled up and down the list for fixed broadband superiority. Only Spain was replaced from the top 10 with the U.A.E. taking its place. Notably, China jumped four places from sixth to second, improving its median download speed from 146.62 Mbps in 2021 to 214.58 Mbps in 2022. Romania’s tenth place finish in 2022 would have earned fourth place in 2021, showing how fast these countries are all prioritizing improved fixed broadband speeds.

Qatar soars to first for fastest mobile country

List of fastest countries for mobile internet from November 2021 through 2022

Ahead of hosting the FIFA World Cup 2022®, Qatar rocketed to first place on the Speedtest Global Index with a median download speed of 176.18 Mbps in November 2022 from 98.10 Mbps in November 2022. Next on the list was the U.A.E. at 139.41 Mbps, which had the fastest median download speed in November 2021. Notably, all 10 countries on our November 2022 list had median mobile download speeds greater than 100 Mbps. New to our 2022 list Denmark (113.44 Mbps), Macau (SAR) (106.38 Mbps), and Brunei (102.36 Mbps) replaced Saudi Arabia, Cyprus, and Kuwait from our 2021 list.

Most of the top 10 countries perform well for fixed and mobile

Chart of 2022 perfromance against global median for leading countries

Out of the 17 countries appearing on either the fastest fixed broadband or mobile Speedtest Global Index top 10s during November 2021 — with China, Denmark, and the U.A.E. appearing on both lists — all but Monaco met the statistical threshold to be included to look at overall fixed and mobile performance. Looking at the remaining 16 countries, most every country on both lists performed relatively well against the global median for both fixed and mobile, which appear as gray lines in the image above. Three countries underperformed a global median: Brunei and Bulgaria for fixed, and Chile for mobile. Thailand performed at about roughly the global median for mobile, as did Romania.

We’re excited to see how global speeds and rankings change over the next year as individual countries and their providers choose to invest and expand different technologies, particularly in 5G and fiber. Be sure to track your country’s and check in on our monthly updates on the Speedtest Global Index. If you want more in-depth analyses and updates, subscribe to Ookla Research™.

Ookla retains ownership of this article including all of the intellectual property rights, data, content graphs and analysis. This article may not be quoted, reproduced, distributed or published for any commercial purpose without prior consent. Members of the press and others using the findings in this article for non-commercial purposes are welcome to publicly share and link to report information with attribution to Ookla.

| April 17, 2023

47 New Ookla Market Reports Available for Q1 2023

Ookla® Market Reports™ identify key data about internet performance in countries across the world. This quarter we’ve provided updated analyses for 47 markets using Speedtest Intelligence® and summarized a few top takeaways below. Click through to the market report to see more details and charts about the countries you’re interested in, including the fastest fixed broadband providers and mobile operators, who had the most consistent service, and 5G and device performance in select countries during Q1 2023. Jump forward to a continent using these links:

Africa | Americas | Asia | Europe | Oceania

Africa

  • Cameroon: Speedtest Intelligence reveals that MTN had the fastest median mobile download speed in Cameroon at 14.46 Mbps during Q1 2023. blue had the lowest median mobile multi-server latency at 184 ms.
  • Ethiopia: Safaricom had the fastest median mobile download speed at 32.81 Mbps during Q1 2023. Ethio Telecom had the lowest median mobile multi-server latency at 55 ms.
  • Tanzania: There were no winners over fastest fixed broadband and mobile in Tanzania during Q1 2023. Dar es Salaam had the fastest median mobile download speed among Tanzania’s most populous cities at 28.73 Mbps during Q1 2023.

Americas

  • Argentina: Personal had the fastest median download speed over mobile (32.62 Mbps) and Movistar was fastest for fixed broadband (94.26 Mbps). Movistar had the lowest median multi-server latency over fixed broadband at 12 ms.
  • Belize: NEXGEN had the fastest median download over fixed broadband in Belize at 47.35 Mbps. Digi had the fastest median mobile download speed at 18.39 Mbps.
  • Canada: Bell was the fastest mobile operator in Canada with a median download speed of 111.11 Mbps at Q1 2023. Bell also had the fastest median 5G download speed at 183.29 Mbps. Bell pure fibre was fastest for fixed broadband (281.94 Mbps). 
  • Colombia: Movistar was fastest for fixed broadband with a median download speed of 151.74 Mbps. ETB had the lowest median multi-server latency over fixed broadband at 8 ms.
  • Dominican Republic: Claro had the fastest median download speed among mobile operators at 32.01 Mbps. Viva had the lowest mobile multi-server latency at 43 ms. SpaceX’s Starlink was fastest for fixed broadband at 45.65 Mbps. 
  • Ecuador: The fastest mobile operator was CNT with a median download speed of 30.82 Mbps. Netlife was fastest for fixed broadband (71.82 Mbps). Fibramax had the lowest multi-server latency over fixed broadband at 9 ms. 
  • El Salvador: Claro had the fastest median download speed over mobile in El Salvador at 39.09 Mbps.
  • Guatemala: Claro was the fastest mobile operator in Guatemala with a median download speed of 33.13 Mbps. Claro also had the highest Consistency with 84.5% of results showing at least a 5 Mbps minimum download speed and 1 Mbps minimum upload speed.
  • Guyana: ENet was the fastest fixed broadband provider (60.27 Mbps), while Digicel was the fastest mobile operator (35.60 Mbps). ENet also had the lowest median multi-server latency over fixed broadband at 120 ms.
  • Haiti: Digicel was the fastest mobile operator in Haiti with a median mobile download speed of 11.12 Mbps. SpaceX Starlink had the fastest fixed broadband internet at 46.76 Mbps. Natcom had the lowest median mobile multi-server latency at 62 ms. 
  • Jamaica: Flow was the fastest fixed broadband provider in Jamaica with a median download speed of 50.50 Mbps. Flow also had the lowest median multi-server latency at 36 ms.
  • Mexico: Telcel had the fastest median download speed over mobile at 45.54 Mbps. Totalplay was fastest for fixed broadband (78.94 Mbps) and had the lowest median multi-server latency at 26 ms.
  • Peru: Claro was the fastest mobile operator with a median download speed of 22.39 Mbps. Apple devices had the fastest median download speed among top device manufacturers at 29.68 Mbps.
  • Suriname: Telesur had the fastest median download speed over mobile at 51.18 Mbps. There was no winner over fixed broadband, but Digicel+ had the lowest median multi-server latency at 57 ms.
  • Trinidad and Tobago: Digicel had the fastest median download speed over mobile at 37.56 Mbps. Digicel+ had the fastest median fixed broadband download speed at 94.27 Mbps and the lowest median multi-server latency at 7 ms.
  • United States: T-Mobile was the fastest mobile operator with a median download speed of 165.22 Mbps. T-Mobile also had the fastest median 5G download speed at 220.70 Mbps. Spectrum edged out XFINITY as the fastest fixed broadband provider with a median download speed of 234.80 Mbps. Verizon had the lowest median multi-server latency on fixed broadband at 15 ms.

Asia

  • Afghanistan: The fastest mobile operator in Afghanistan was Afghan Wireless (5.92 Mbps), which also had the lowest median multi-server latency at 84 ms.
  • Bangladesh: Banglalink was the fastest mobile operator in Bangladesh with a median download speed of 21.94 Mbps. DOT Internet was fastest over fixed broadband at 89.50 Mbps and had the lowest median multi-server latency at 5 ms.
  • Bhutan: There was no fastest mobile operator in Bhutan during Q1 2023, but BT had the lowest median multi-server latency at 66 ms.
  • Brunei: There was no statistical winner on mobile during Q1 2023, but Apple devices had the fastest median download speed at 113.48 Mbps.
  • Cambodia: SINET had the fastest median download speed over fixed broadband (42.00 Mbps). Cellcard was fastest over mobile at 32.05 Mbps.
  • China: China Mobile was the fastest mobile operator with a median download speed of 138.95 Mbps. China Mobile also had the fastest median mobile 5G download speed at 291.24 Mbps. China Unicom was fastest for fixed broadband at 221.07 Mbps.
  • Georgia: MagtiCom had the fastest median fixed broadband speed in Georgia at 27.65 Mbps during Q1 2023. MagtiCom also had the lowest median multi-server latency at 11 ms. Geocell was fastest over mobile at 40.81 Mbps.
  • Indonesia: Telkomsel was the fastest Indonesian mobile operator with a median download speed of 24.48 Mbps. Telkomsel also had the lowest median mobile multi-server latency at 45 ms.
  • Japan: NTT DoCoMo was the fastest mobile operator with a median download speed of 48.86 Mbps during Q1 2023. So-net had the fastest fixed broadband speed at 282.13 Mbps, as well as the lowest median multi-server latency at 9 ms.
  • Malaysia: TIME was the fastest fixed broadband provider in Malaysia (107.56 Mbps) and had the lowest multi-server latency at 9 ms.
  • Pakistan: Transworld had the fastest median fixed broadband download speed in Pakistan at 16.23 Mbps. Jazz was fastest over mobile at 21.93 Mbps. Zong had the lowest median mobile multi-server latency at 46 ms.
  • Philippines: Smart delivered the fastest mobile download speed in the Philippines (33.39 Mbps). 
  • Singapore: Singtel had the fastest median download speed over mobile at 119.66 Mbps. StarHub had the lowest median mobile multi-server latency at 26 ms. SingTel had the fastest fixed broadband speed (263.13 Mbps). 
  • South Korea: KT delivered the fastest median download speed over fixed broadband in South Korea at 145.28 Mbps. SK Telecom had the fastest mobile speed at 194.41 Mbps.
  • Sri Lanka: SLT-Mobitel delivered the fastest mobile and fixed broadband speeds in Sri Lanka at 20.62 Mbps and 44.76 Mbps, respectively. Dialog had the lowest median mobile multi-server latency at 36 ms.
  • United Arab Emirates: Etisalat had the fastest median fixed download speed (255.01 Mbps) and median mobile download speed (184.58 Mbps) in the UAE during Q1 2023. Etisalat also had the fastest median 5G download speed at 672.04 Mbps and lowest median multi-server latency at 35 ms.

Europe

  • Albania: ONE overtook Vodafone as the fastest mobile operator in Albania with a median download speed of 48.44 Mbps during Q1 2023. ONE also had the lowest median mobile multi-server latency at 34 ms. Digicom was fastest for fixed broadband (87.71 Mbps).
  • Belgium: Telenet had the fastest median download speed over fixed broadband at 135.65 Mbps, while Telenet/BASE had the fastest median download speed over mobile at 69.48 Mbps.
  • Denmark: YouSee was the fastest mobile operator in Denmark with a median download speed of 137.28 Mbps. Hiper was fastest for fixed broadband at 258.41 Mbps.
  • Estonia: The fastest mobile operator in Estonia was Telia with a median download speed of 91.34 Mbps. Telia had the lowest median multi-server latency on mobile at 30 ms. Elisa was fastest over fixed broadband at 92.20 Mbps. 
  • Finland: DNA had the fastest median download speed over mobile at 101.59 Mbps. Lounea was fastest for fixed broadband at 107.84 Mbps and had the lowest median multi-server latency at 11 ms.
  • Germany: Telekom was the fastest mobile operator in Germany with a median download speed of 96.61 Mbps. Deutsche Glasfaser overtook Vodafone as the fastest fixed broadband provider at 183.20 Mbps. Deutsche Glasfaser also had the lowest median multi-server latency at 14 ms.
  • Latvia: While there was no fastest mobile operator in Latvia during Q1 2023, Balticom was fastest for fixed broadband with a median download speed of 238.41 Mbps. Balticom also had the lowest median fixed broadband multi-server latency at 4 ms.
  • Lithuania: The mobile operator with the fastest median download speed was Telia at 109.53 Mbps. Cgates was fastest for fixed broadband at 151.33 Mbps.
  • Poland: UPC was the fastest provider for fixed broadband with a median download speed of 214.34 Mbps. There was no statistical winner over mobile during Q1 2023.
  • Switzerland: Salt blazed ahead for the fastest fixed broadband with a median download speed of 367.36 Mbps. Salt also had the lowest median multi-server latency over fixed broadband at 8 ms.
  • Turkey: Turkcell was the fastest mobile operator in Turkey with a median download speed of 51.76 Mbps. Türk Telekom had the lowest median mobile multi-server latency at 38 ms. TurkNet was fastest for fixed broadband at 58.85 Mbps. 

Oceania

  • New Zealand: MyRepublic had the fastest median download speed over fixed broadband in New Zealand at 287.90 Mbps. There were no statistical winners among top mobile operators.

The Speedtest Global Index is your resource to understand how internet connectivity compares around the world and how it’s changing. Check back next month for updated data on country and city rankings, and look for updated Ookla Market Reports with Q2 2023 data in July.

Editor’s note: This article was updated on April 18 to exclude data from Vietnam while we continue to investigate anomalies in the market.

Ookla retains ownership of this article including all of the intellectual property rights, data, content graphs and analysis. This article may not be quoted, reproduced, distributed or published for any commercial purpose without prior consent. Members of the press and others using the findings in this article for non-commercial purposes are welcome to publicly share and link to report information with attribution to Ookla.

| September 21, 2023

Mobile gaming in the Gulf region: 5G improves the experience, but latency remains an issue

In this article, we look at the performance of mobile networks in the six countries of the Gulf Cooperation Council (GCC) during the first half of 2023 for their ability to support gaming services. To this end, we introduce Ookla’s Game Score™ to quantify the gaming experience and analyze four network metrics that typically impact mobile gaming: download speed, upload speed, latency, and jitter.

Key takeaways

  • The Gulf region offers strong growth potential for mobile gaming. The region benefits from a large youth demographic, a growing casual gaming base, widespread smartphone adoption, and high-speed internet access. Operators and governments are also helping to increase public engagement in gaming.
  • The U.A.E., Bahrain, and Qatar had the highest Game Scores in the Middle East (83.49, 83.24, and 82.81, respectively, on a 100-point scale). These countries have superior mobile network performance that helps to deliver a good gaming experience. Their Game Scores were also higher for 5G compared to 4G, highlighting the importance of network upgrades and migrating customers to 5G.
  • Relatively high latency in some markets can make some games glitchy. Most casual gamers should be able to enjoy a smooth experience over 5G thanks to fast download and upload speeds, but some latency-sensitive games (like multiplayer shooters) may have noticeable lags. Mobile operators can explore different approaches (such as deploying edge computing infrastructure) to improve game responsiveness and prepare their networks for more data-intensive games.

Ookla’s Game Score™ helps quantify the gaming experience

Game Score™ compares the performance of operators’ networks in terms of their ability to offer the best gaming experiences to consumers. The score is composed of different components, each measuring a different aspect of a consumer’s gaming experience based on multiple network key performance indicators. Game Score™ is based on Ookla’s consumer-initiated Speedtest Intelligence® results for download and upload speeds, as well as Consumer QoE’s™ latency and jitter measurements taken on real-world game servers. 

Each component is evaluated and scored on a scale of 0-100 for each eligible operator. Finally, scored components are combined in a weighted average to produce a Game Score for each operator. For this article, we aggregated the scores of eligible operators to obtain a country-level Game Score. More details about our Game Score methodology can be downloaded from this link.

The Gulf region offers strong growth potential for mobile gaming

According to BCG, the Middle East region has the highest gaming penetration: more than 60% of the population are game enthusiasts. The audience for live-streaming games is expected to exceed 200 million in 2025, making the Middle East one of the fastest-growing regions for gaming.

The GCC region, in particular, has strong growth potential in terms of active gamers and e-sports participants thanks to its large youth demographic, sizable disposable income, access to high-speed connectivity, and the ongoing development of gaming infrastructure (such as hosting local gaming servers and setting up gaming arenas and e-sports facilities). The market will expand as gaming becomes more mainstream and more female users and older demographics engage in gaming.

5G is also helping to increase mobile gaming adoption as it enables smoother gameplay than 4G. According to the GSMA, around half of surveyed 5G users (or those intending to upgrade to 5G) in eight developed markets game frequently compared to around 30% among non-5G users. More operators are also bundling gaming services into their 5G plans, making mobile gaming more mainstream. Operators consider gaming as a growth area and a means to increase customer engagement and differentiate their connectivity propositions (see table below).

Local governments have also implemented strategies to develop a local gaming ecosystem to diversify their economies. For example, Saudi Arabia has a national gaming and e-sports strategy while the U.A.E. aims to encourage global gaming producers to establish a local presence.

Recent gaming-related propositions and initiatives

Bahrain Batelco introduced a mobile gaming portal in 2022
stc offers stc play app and organizes e-sports tournaments. It partnered with gaming infrastructure provider Subspace in 2019 to improve the multi-player experience in the region
Zain offers a mobile game pass with a dedicated data allowance for popular games
Kuwait Zain has a dedicated e-sports division that hosts tournaments. It partnered with PLAYHERA to establish a gaming and e-sports platform in 2022
Ooredoo offers gamer-dedicated 5G and fiber plans with reduced latency. It also organizes e-sports competitions
stc offers a 5G plan add-on that promises to reduce latency, jitter, and packet loss
Oman Omantel launched ‘GeForce NOW’ cloud gaming service in partnership with NVIDIA. It also offers an add-on to get 100 Mbps extra speed on fiber and a dedicated mobile add-on for game data traffic
Ooredoo organizes local e-sports tournaments
Qatar Ooredoo launched the first e-sports tournament in Qatar, part of its e-sports brand, Ooredoo Nation – Gamers’ Land, in 2021. In 2023, it launched Ooredoo Nation League as a hub for Qatari gamers
Vodafone commercialized the Vive Cosmos headset with a subscription to VIVEPORT Infinity, a repository of VR games, apps, and videos
Saudi Arabia stc launched ‘stc play’ e-sports and game distribution platform and rolled out the Blacknut cloud gaming platform. It also offers a mobile data add-on tailored for gamers
Mobily launched an e-sports platform for gamers powered by D11 Gaming. It also offers Game Mode, an add-on for unlimited use of PUBG Mobile and League of Legends: Wild Rift games
Zain launched ‘GeForce NOW’ cloud gaming service. It also offers a fiber package dedicated to gaming that includes a low-latency router, up to 500 Mbps for download and 200 Mbps for upload speeds
U.A.E. Etisalat by e& launched ‘Arena Play’ mobile add-ons to enable customers to play without incurring data charges. It also introduced ‘Arena eLife’ fixed broadband add-on to access many games online from home
du launched Games Instant Play as part of its ‘My World’ mobile portal

Bahrain, Qatar, and the U.A.E. had the highest Game Scores in the Middle East

The U.A.E., Bahrain, and Qatar had the highest Game Scores during the first half of 2023 in the Middle East. That means that users in these countries get the best mobile gaming experience in the region. The U.A.E. is home to the fastest 5G operator globally in Q2 2023, according to Ookla Speedtest Intelligence™ data. The U.A.E. comes first with a Game Score of 83.49 on a 100-point scale (considering all mobile technologies). The U.A.E.  was closely followed by Bahrain with a score of 83.24 and Qatar with a score of 82.81. These results reflect the superior mobile network performance in these three markets which helps to deliver a good gaming experience. Kuwait, Saudi Arabia, and Oman were further down the Game Score ranking, achieving scores of 80.41, 78.74, and 75.40, respectively. 

Chart of Overall Game Score™, per Country

Game Scores were consistently higher for 5G than 4G users in all Gulf countries. The gaming experience benefits from the larger bandwidth and lower latency offered by 5G, contributing to smoother and more responsive gameplay. Game Scores on 4G lagged those on 5G by a range from 5.37% in Oman to 8.26% in Saudi Arabia. Gulf operators have the potential to improve the gaming experience by continuing to improve their 5G infrastructure, migrating more customers to 5G, and establishing local gaming servers.

Chart of Game Score™ for 4G and 5G, per Country

In the following sections, we break down the Game Score into its components to understand how being on a 4G or 5G network can affect the everyday gaming experiences of Gulf-based mobile users.

Gaming download and upload speeds are markedly higher on 5G than on 4G, making mobile gaming more enjoyable

Download speed is essential in creating a smooth gaming experience without interruptions or degradations in streaming quality. High download speeds are also important for downloading digitally distributed games and updates. Download speed requirements for online mobile gaming vary depending on the game type (for example, cloud gaming needs higher bandwidth than a game played on a smartphone), gamer profile (for example, competitive gamers will need higher bandwidth than casual players) and use cases (for example, downloading game updates compared to playing preload games). 

For the purpose of this analysis, we assume that 25 Mbps is the minimum download speed to enjoy a good gaming experience for casual gamers (who represent the majority of gamers). According to Ookla’s data, all Gulf markets comfortably exceed that requirement on 4G and surpass it significantly on 5G. Kuwait had the lowest download speed over 4G in the first half of 2023 at 35.12 Mbps. In contrast, Oman had the lowest 5G download speed at 176.79 Mbps. 

U.A.E. offers the fastest median download speeds for both 4G and 5G at 69.17 Mbps and 566.10 Mbps, respectively, ahead of Qatar and Bahrain which rounded out the top 3 in the region. 5G offers significantly better performance than 4G in all markets. The median 5G speed across Gulf countries was 6.8X faster than the median 4G speed (345.53 Mbps vs. 43.9 Mbps).

Chart of Median Download over 4G and 5G, per Country

Upload speed also plays an essential role in creating a smooth gaming experience without interruptions or quality degradation, particularly in multiplayer games. We use 3 Mbps as a reference point based on the recommended minimum upload speed for a good gaming experience for casual gamers.

Ookla’s data shows that Gulf markets are crushing it when it comes to exceeding upload requirements for both 4G and 5G. The lowest median upload speed recorded on 4G was in Saudi Arabia at 10.87 Mbps; For 5G, it was in Oman at 17.28 Mbps. Median upload speeds on 5G were 1.27X faster than those on a 4G network in the region. The gap between 4G and 5G upload speeds is larger in Bahrain, Saudi Arabia, and the U.A.E., which means that gamers in these countries could see the most significant improvement in gameplay and streaming quality when switching from 4G to 5G. In absolute terms, Qatar, Bahrain, and the U.A.E. offer the fastest upload speeds, reaching a maximum of 38.48 Mbps for the latter.

Chart of Median Upload over 4G and 5G, per Country

Relatively high latency in some markets can make some multiplayer games glitchy on 5G

Game Latency is a measure of latency to popular gaming server locations. Latency affects how quickly a gamer’s response is reflected in gameplay and is of particular interest to those who prefer games where reaction time is crucial. Low latency can provide smooth and lag-free gaming. For this analysis, we consider a sub-100 ms latency to be good for many games and most casual gamers.

Ookla’s data shows that most countries, except Oman, recorded latency below 100 ms on 5G. Bahrain had the lowest latency on 5G at 72.01 ms, and Oman had the highest latency at 115.46 ms. Saudi Arabia and Kuwait also had a relatively high 5G latency at 93.2 ms and 90.31 ms, respectively, which means that some multiplayer shooters, racing, fighting, and multiplayer online battle arena (MOBA) games might have a noticeable lag. Operators have room to improve the conditions for multiplayer games, especially for competitive gamers. 

Users saw more modest differences in latency between 4G and 5G than for download and upload speeds. That means that multiplayer gamers can still get decent gameplay on either network technology and may not perceive an improvement in response time when switching to 5G. However, enhancements in 5G infrastructure will widen 5G’s advantage over 4G and provide a stronger incentive for gamers to migrate over time.

Chart of Gaming Latency over 4G and 5G, per Country

The variation in latency to popular gaming servers, known as Game Jitter, can also cause laggy gameplay or distorted audio if it is too high. For smoother gameplay, latency should be consistently low. A jitter below 30 ms is considered good for casual mobile gamers.

Results show that the Gulf region has low jitter, especially on 5G. Jitter ranged from 8.26 ms in Bahrain to 13.43 ms in Oman during Q1-Q2 2023. Jitter on 4G was slightly higher than 5G in all countries except in Oman where it was surprisingly lower at 11.55 ms – both Ooredoo and Omantel recorded lower jitter on their 4G network than on 5G during the first half of 2023. 

Chart of Gaming Jitter over 4G and 5G, per Country

The localization of gaming servers, the rollout of 5G Standalone (SA), and edge computing can push mobile gaming performance to new heights

Mobile operators can explore different approaches to improve connectivity consistency, speeds, and latency compared to current 5G in order to support more data-intensive games, enhance the multi-player gaming experience on smartphones, and cater to competitive gamers. 

  • Shorten the distance between the users and the game servers. According to data published by the Saudi’s telecoms regulator, users can save, on average, 60 ms in latency when playing popular games with servers located in the GCC compared to servers in Europe. We expect more Gulf-based operators will host game servers in their data centers as more publishers strive to offer the best experience to local gamers.
  • Deploy 5G Standalone (SA) to increase bandwidth and speed and enable ultra-low latency. Most of the 5G networks deployed in the Gulf region use the Non-Standalone (NSA) model, where the radio antennas (part of the radio access network) are based on 5G but the core uses a 4G infrastructure. As of July 2023, the GSA reported that seven operators in the Gulf region were evaluating 5G SA, while six have either deployed or launched the service. The migration to 5G SA is expected to reduce latency to sub-5 ms, which should help the multiplayer and cloud gaming experience.
  • Deploy edge computing infrastructure to make gaming experiences more immersive. Edge computing enables new use cases with stringent bandwidth, latency, and availability requirements. Some local operators, such as Etisalat by e& and stc, have partnered with vendors and hyperscalers to develop edge computing capabilities to target enterprise customers. Operators should explore how to exploit these resources to support their own gaming and entertainment initiatives and support those of their partners.

The GCC region has a vibrant and untapped gaming market poised for tremendous growth. This potential hinges on the robustness of the telecoms infrastructure. Gulf operators’ investments in 5G infrastructure helped them climb Ookla’s Game Score leaderboard and demonstrated their commitment to putting their countries on the gaming map. Operators can continue to improve the gaming experience and further minimize latency by deploying local gaming servers, edge computing infrastructure, and 5G SA to make games more responsive and smooth. These improvements will put the region in an even better position to lead game development and foster the local gaming ecosystem.

Ookla retains ownership of this article including all of the intellectual property rights, data, content graphs and analysis. This article may not be quoted, reproduced, distributed or published for any commercial purpose without prior consent. Members of the press and others using the findings in this article for non-commercial purposes are welcome to publicly share and link to report information with attribution to Ookla.