United States: Starlink fastest, speeds decreasing
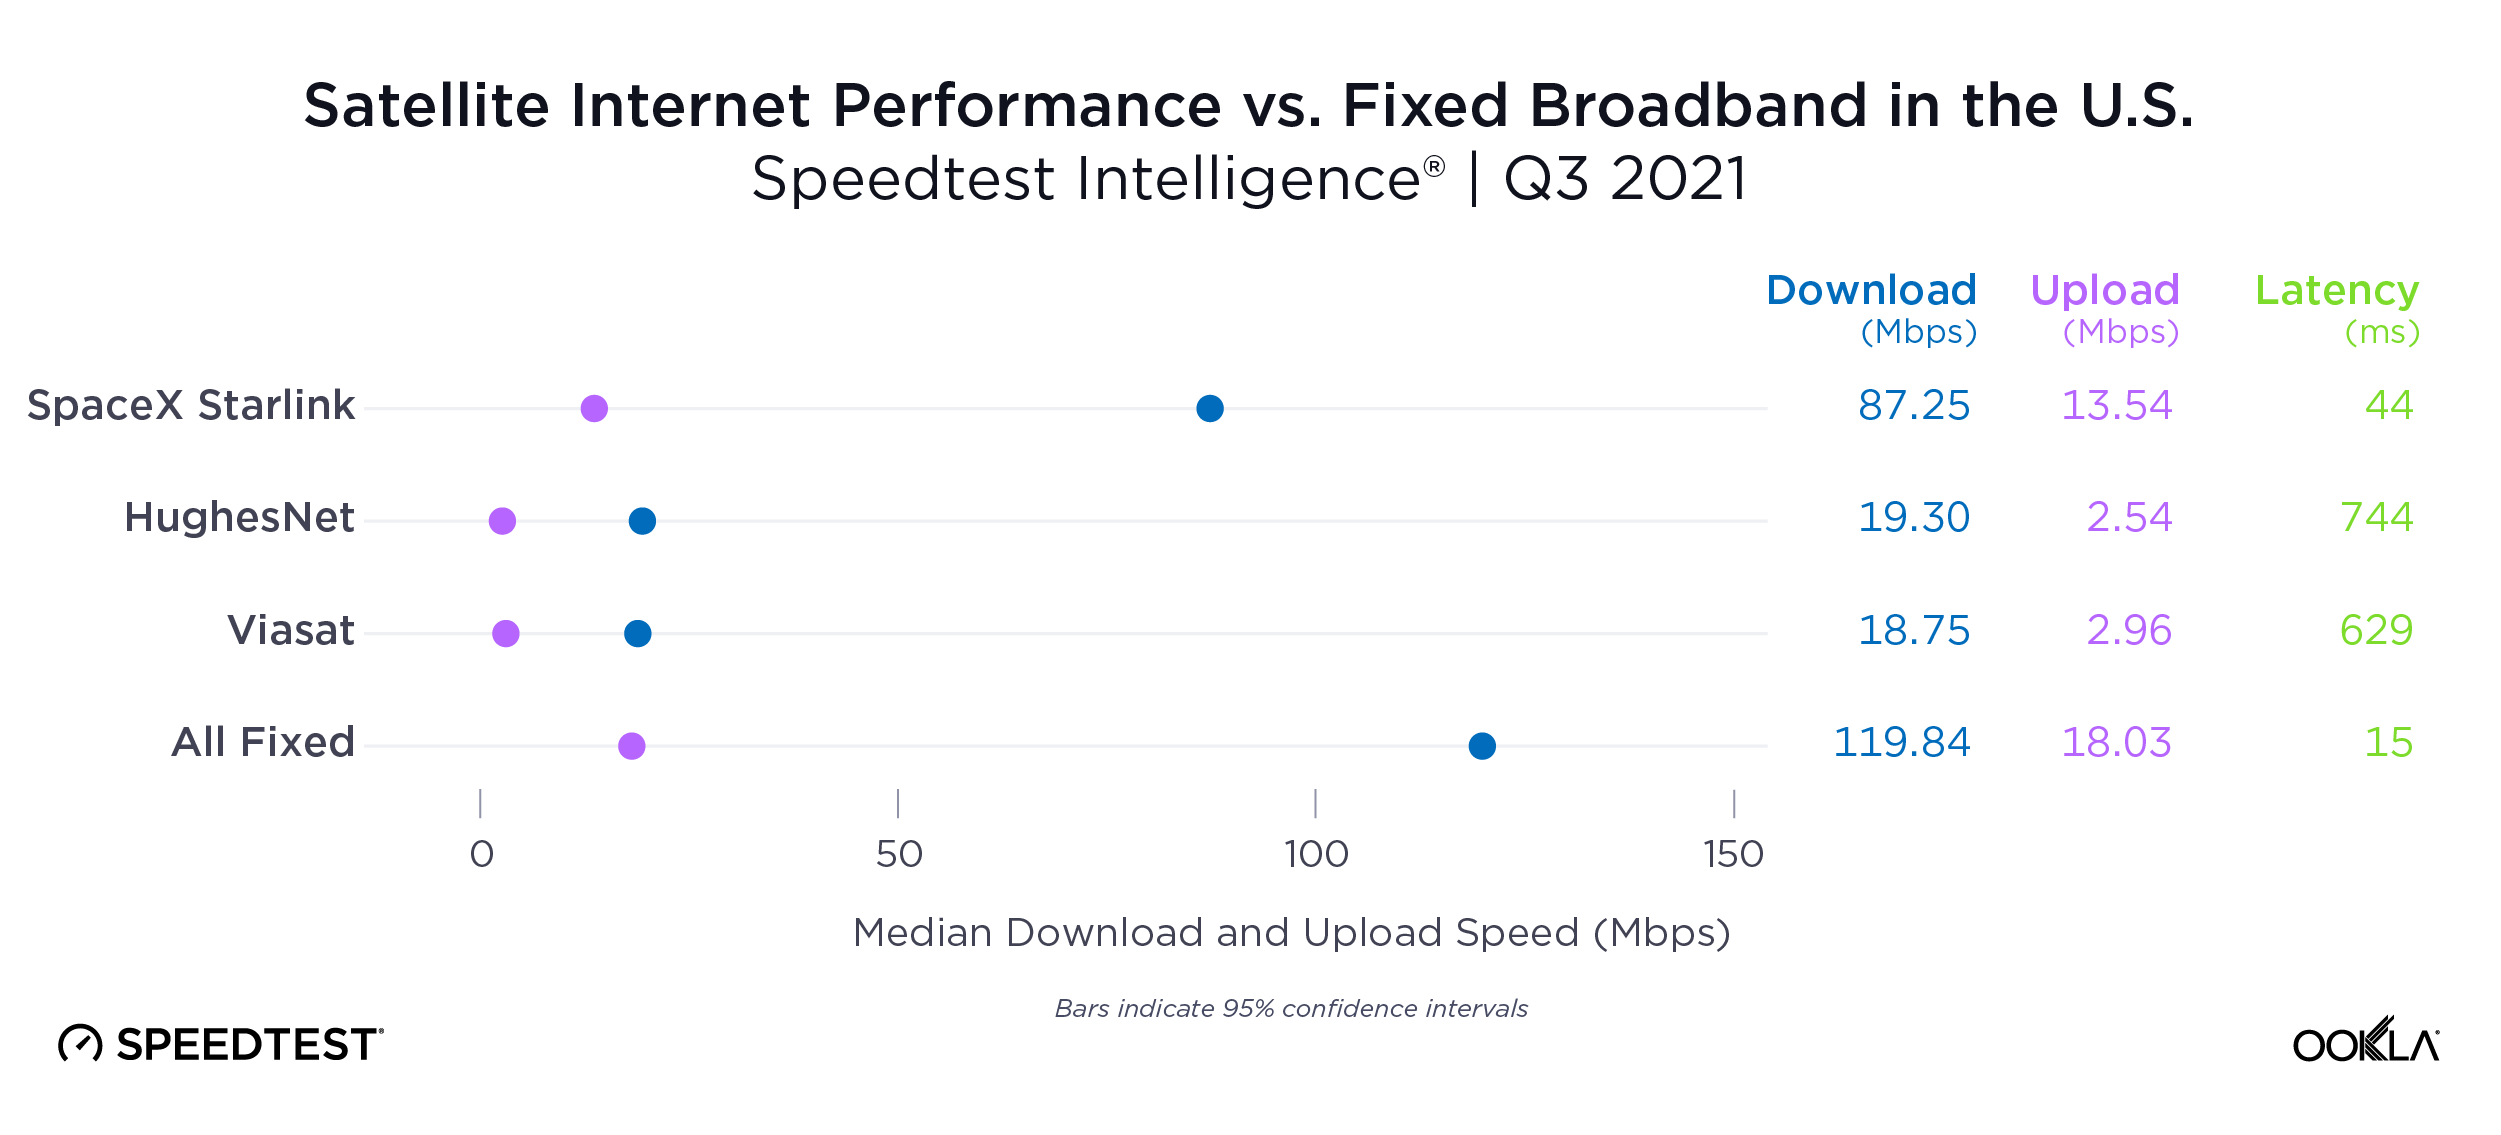
Consumers in the U.S. looking to use satellite service to connect to the internet will find that performance was mostly flat when comparing Q3 2021 to Q2 2021. Starlink’s median download speed decreased from 97.23 Mbps during Q2 2021 to 87.25 Mbps in Q3 2021, which could be a function of adding more customers. HughesNet followed distantly at 19.30 Mbps (comparable to the 19.73 Mbps we saw in Q2 2021) and Viasat third at 18.75 Mbps (18.13 Mbps in Q2 2021). For comparison, the median download speed for all fixed broadband providers in the U.S. during Q3 2021 was 119.84 Mbps (115.22 Mbps in Q2 2021).
Starlink’s median upload speed of 13.54 Mbps (down from 13.89 Mbps in Q2 2021) was much closer to that on all fixed broadband (18.03 Mbps in Q3 2021 and 17.18 Mbps in Q2 2021). Viasat and HughesNet followed at 2.96 Mbps (3.38 Mbps in Q2 2021) and 2.54 Mbps (2.43 Mbps in Q2 2021), respectively.
As we saw last quarter, Starlink, which uses low earth orbit (LEO) satellites, was the only satellite internet provider with a median latency anywhere near that seen on fixed broadband in Q3 2021 (44 ms and 15 ms, respectively). Viasat and HughesNet, which both utilize higher “geosynchronous” orbits, had median latencies of 629 ms and 744 ms, respectively.
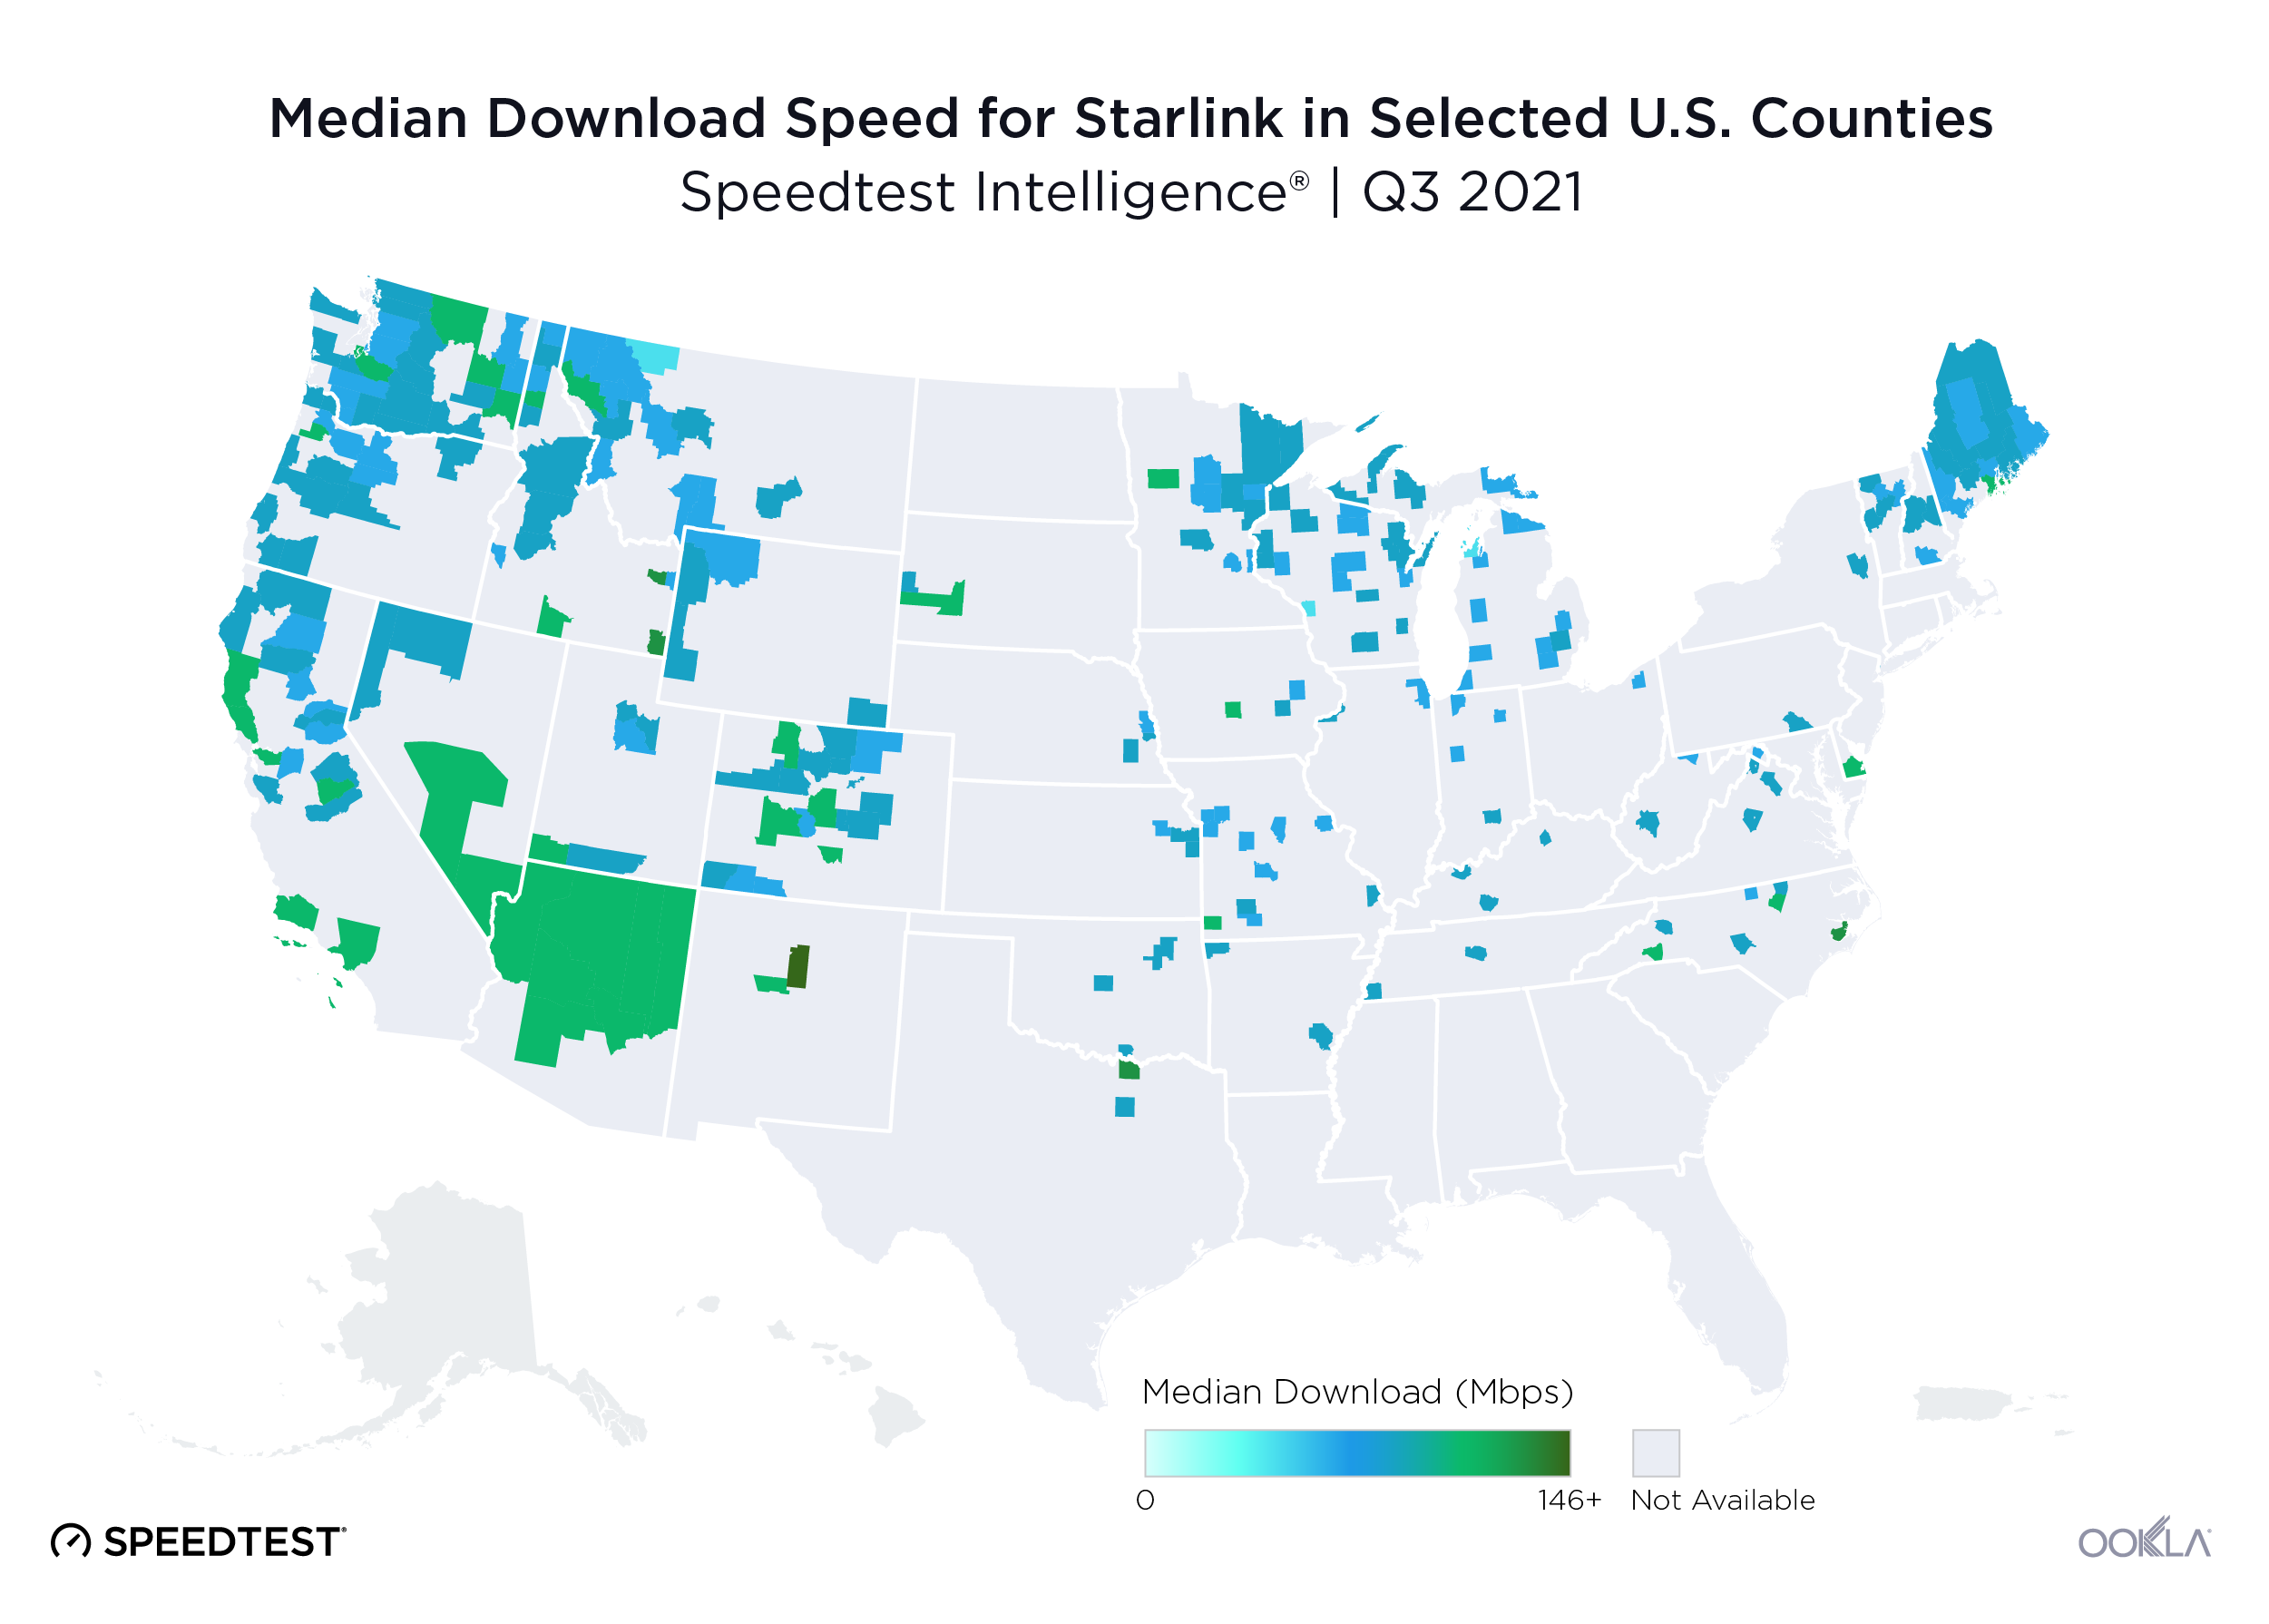
Starlink performance varies at the county level
We saw sufficient samples during Q3 2021 to analyze Starlink performance in 304 counties in the U.S. While there was about a 100 Mbps range in performance between the county with the fastest median download speed (Santa Fe County, New Mexico at 146.58 Mbps) and the county with the slowest median download speed (Drummond Township, Michigan at 46.63 Mbps), even the lower-end speeds are well above the FCC’s Baseline performance tier of at least a 25 Mbps download speed.
Satellite internet performance elsewhere in the world
We examined satellite internet performance in countries with an established market share to see how well their speeds compare to local fixed broadband. We’re excited to add analysis on satellite performance in Australia and Belgium this quarter.
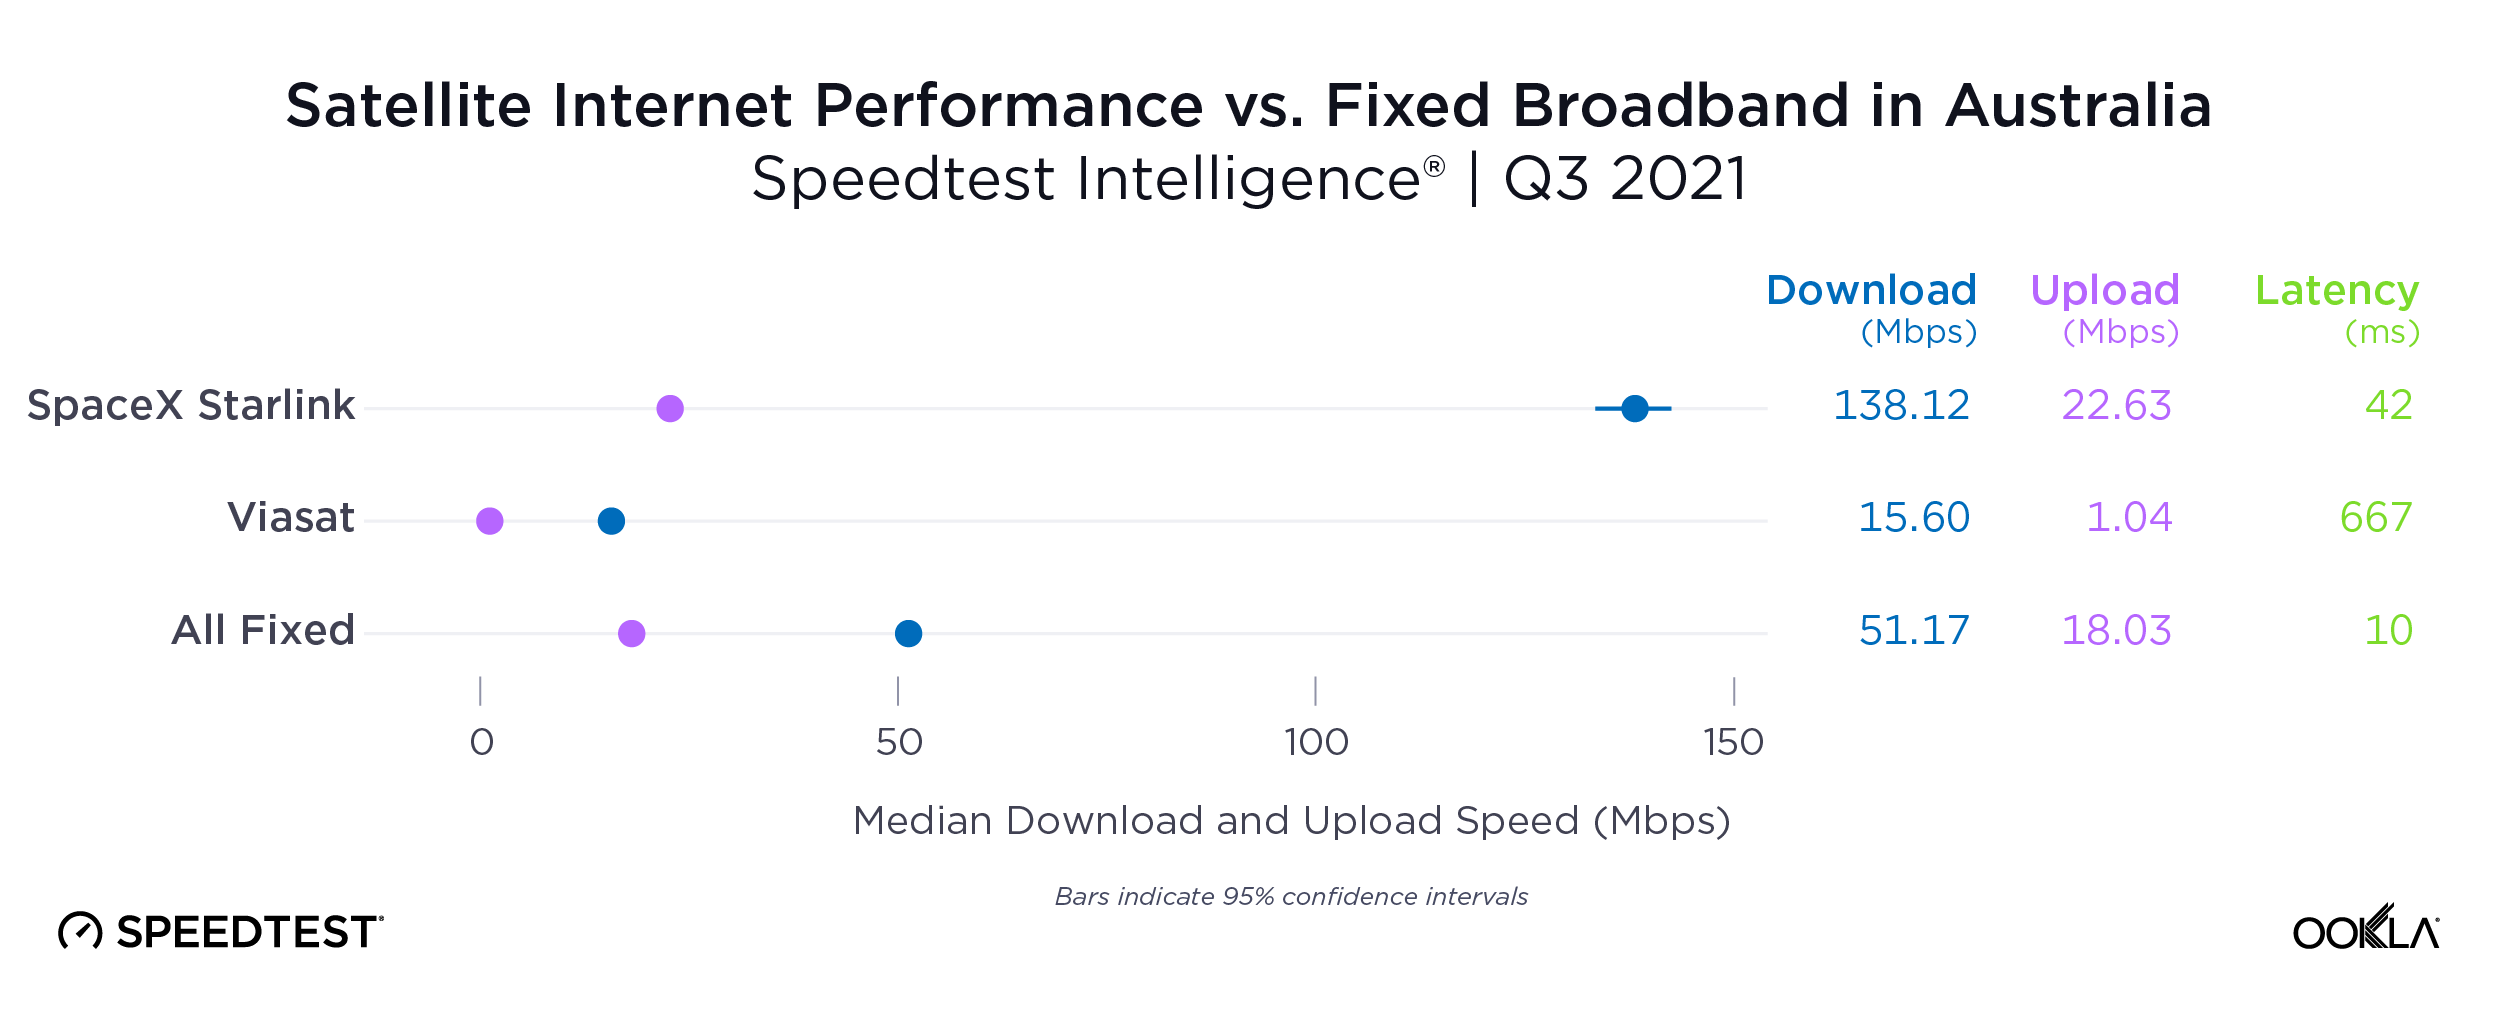
Australia: Starlink outperformed Viasat and fixed broadband average
Starlink radically outperformed Viasat in Australia during Q3 2021 with a median download speed of 138.12 Mbps to Viasat’s 15.60 Mbps. Starlink also outpaced Viasat for median upload speed at 22.63 Mbps and 1.04 Mbps, respectively. Compared to the median download speed over all fixed broadband of 51.17 Mbps, Starlink could be an attractive alternative to traditional fixed broadband on all levels except latency where Starlink showed 42 ms vs. 10 ms for all fixed broadband combined.
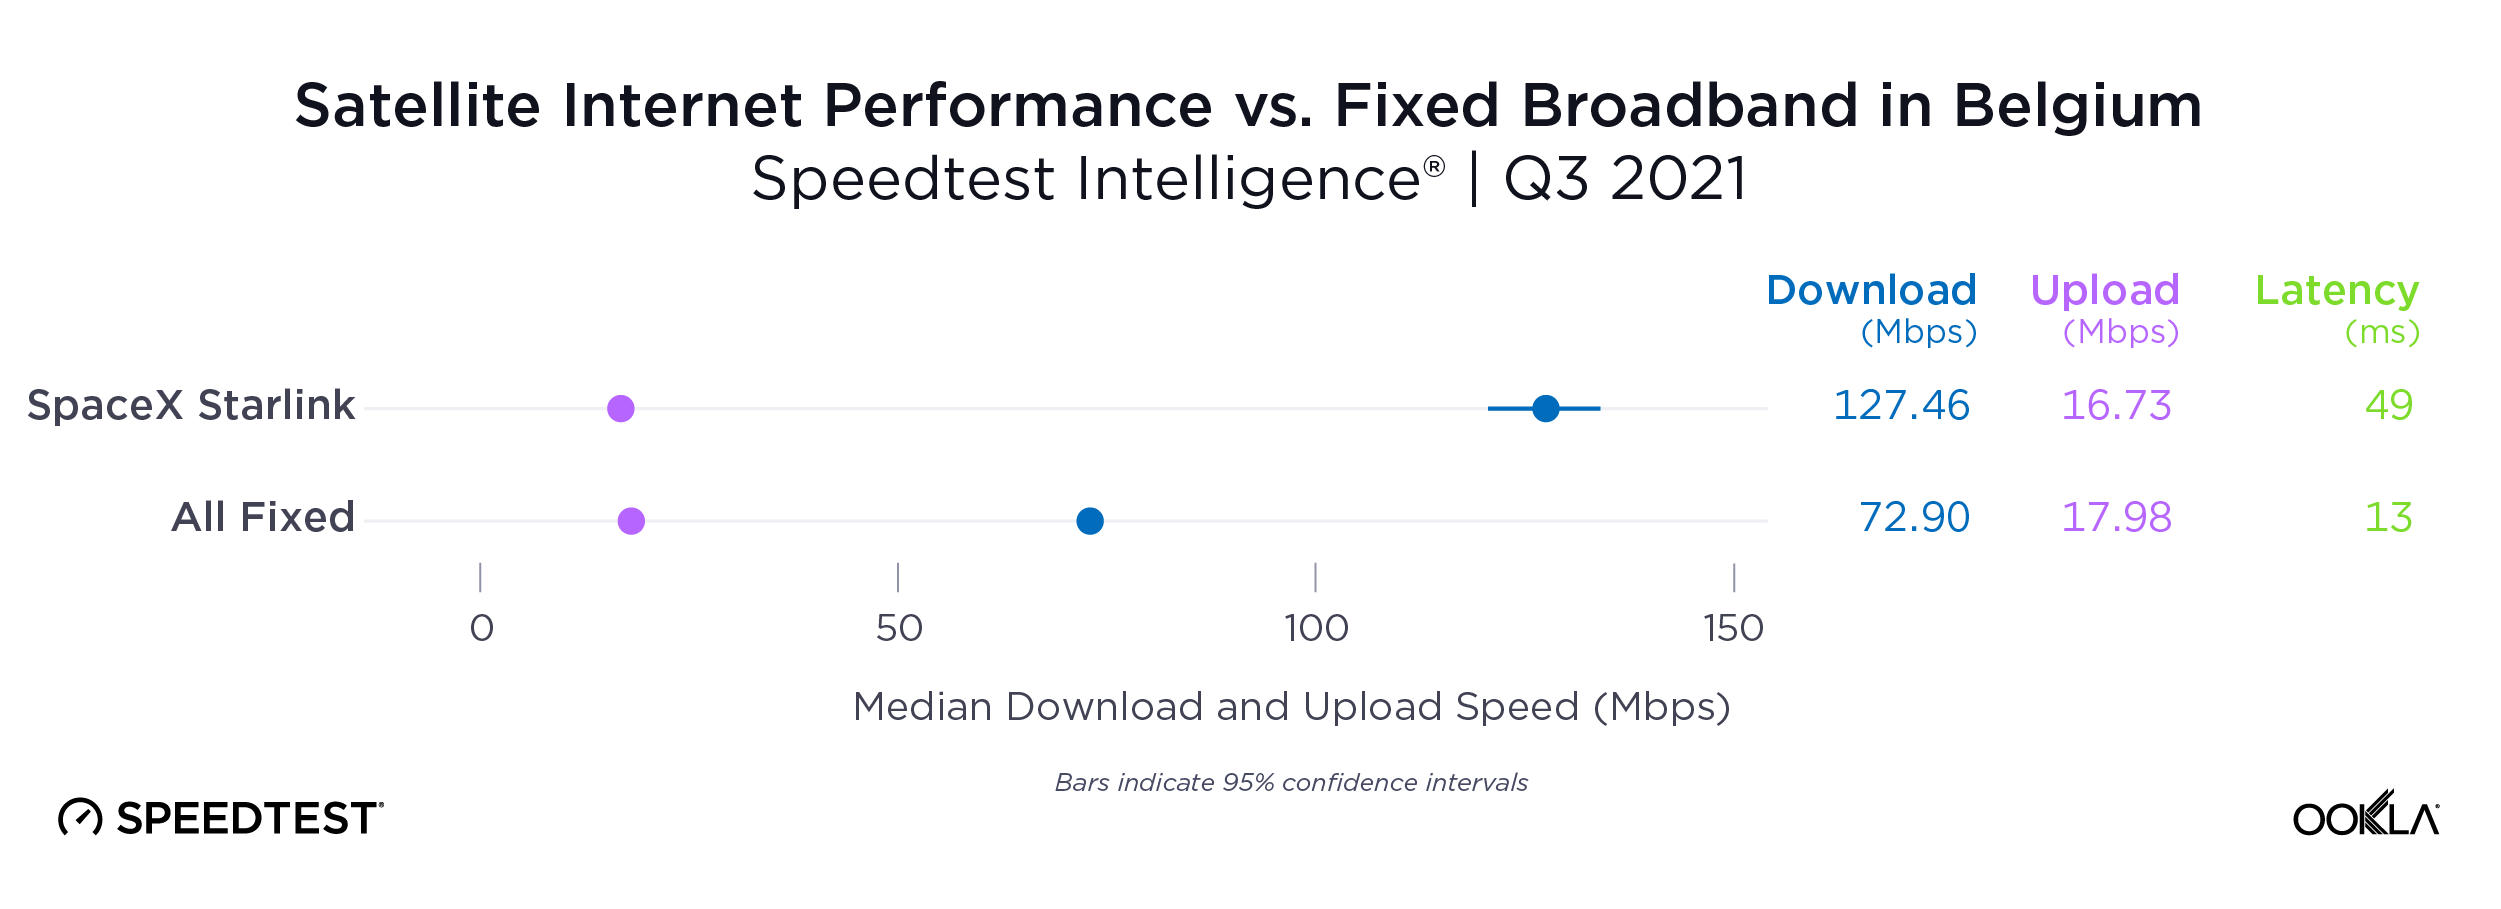
Belgium: Starlink dramatically faster than fixed broadband
Starlink’s median download speed of 127.46 Mbps during Q3 2021 was dramatically faster than the country’s median download for all fixed broadband of 72.90 Mbps. At 16.73 Mbps, Starlink’s median upload speed was only slightly slower than the overall median of 17.98 Mbps. However, Starlink’s 49 ms latency was higher than the country’s average of 13 ms. Starlink was the only satellite internet provider with adequate samples to analyze in Belgium during Q3 2021.
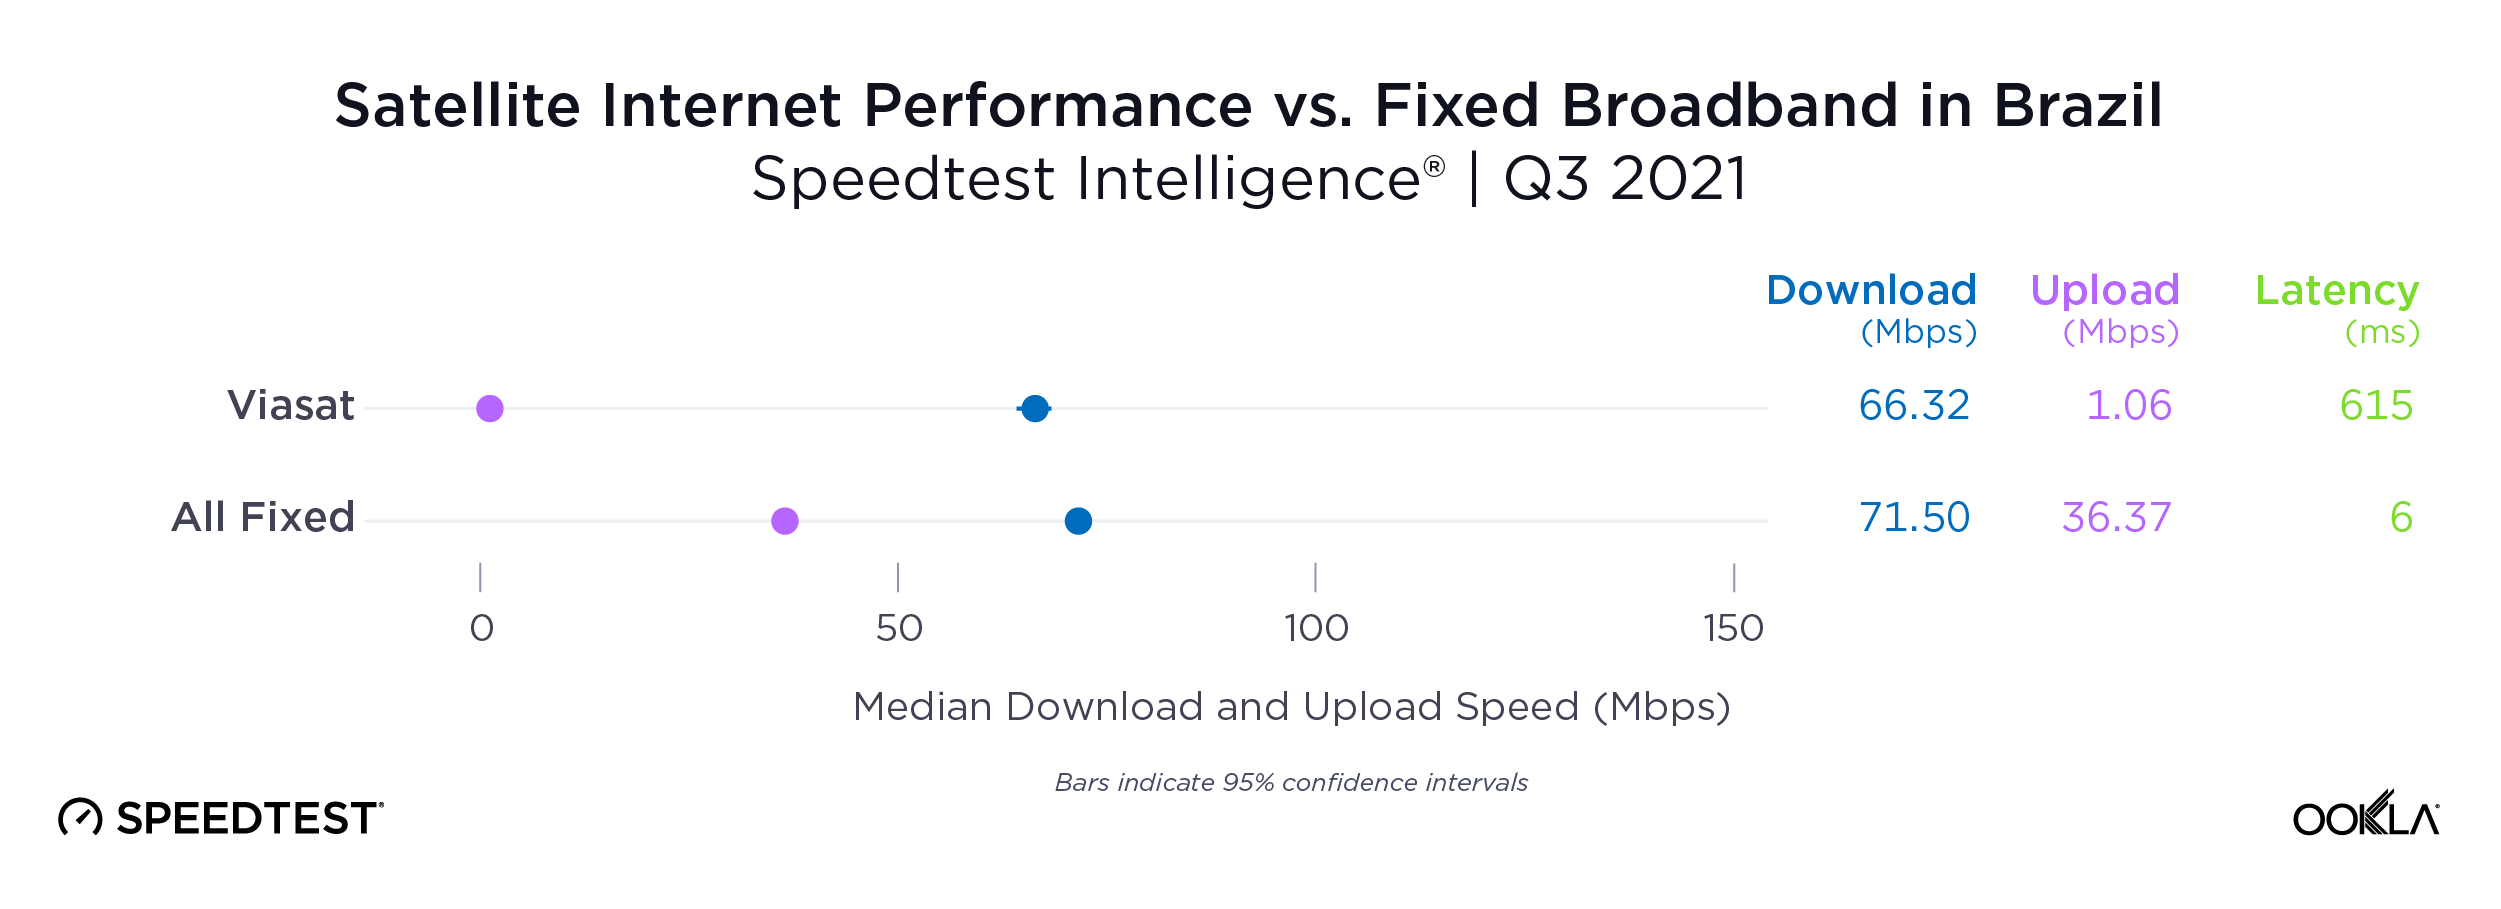
Brazil: Viasat close to national average
Viasat’s median download speed in Brazil improved to 66.32 Mbps during Q3 2021 (up from 60.30 Mbps in Q2 2021. This was close to the national median for fixed broadband of 71.50 Mbps. Viasat’s median upload speed (1.06 Mbps) was much slower, however, than that on fixed broadband (36.37 Mbps), and Viasat’s latency was much higher (615 ms vs 6 ms).
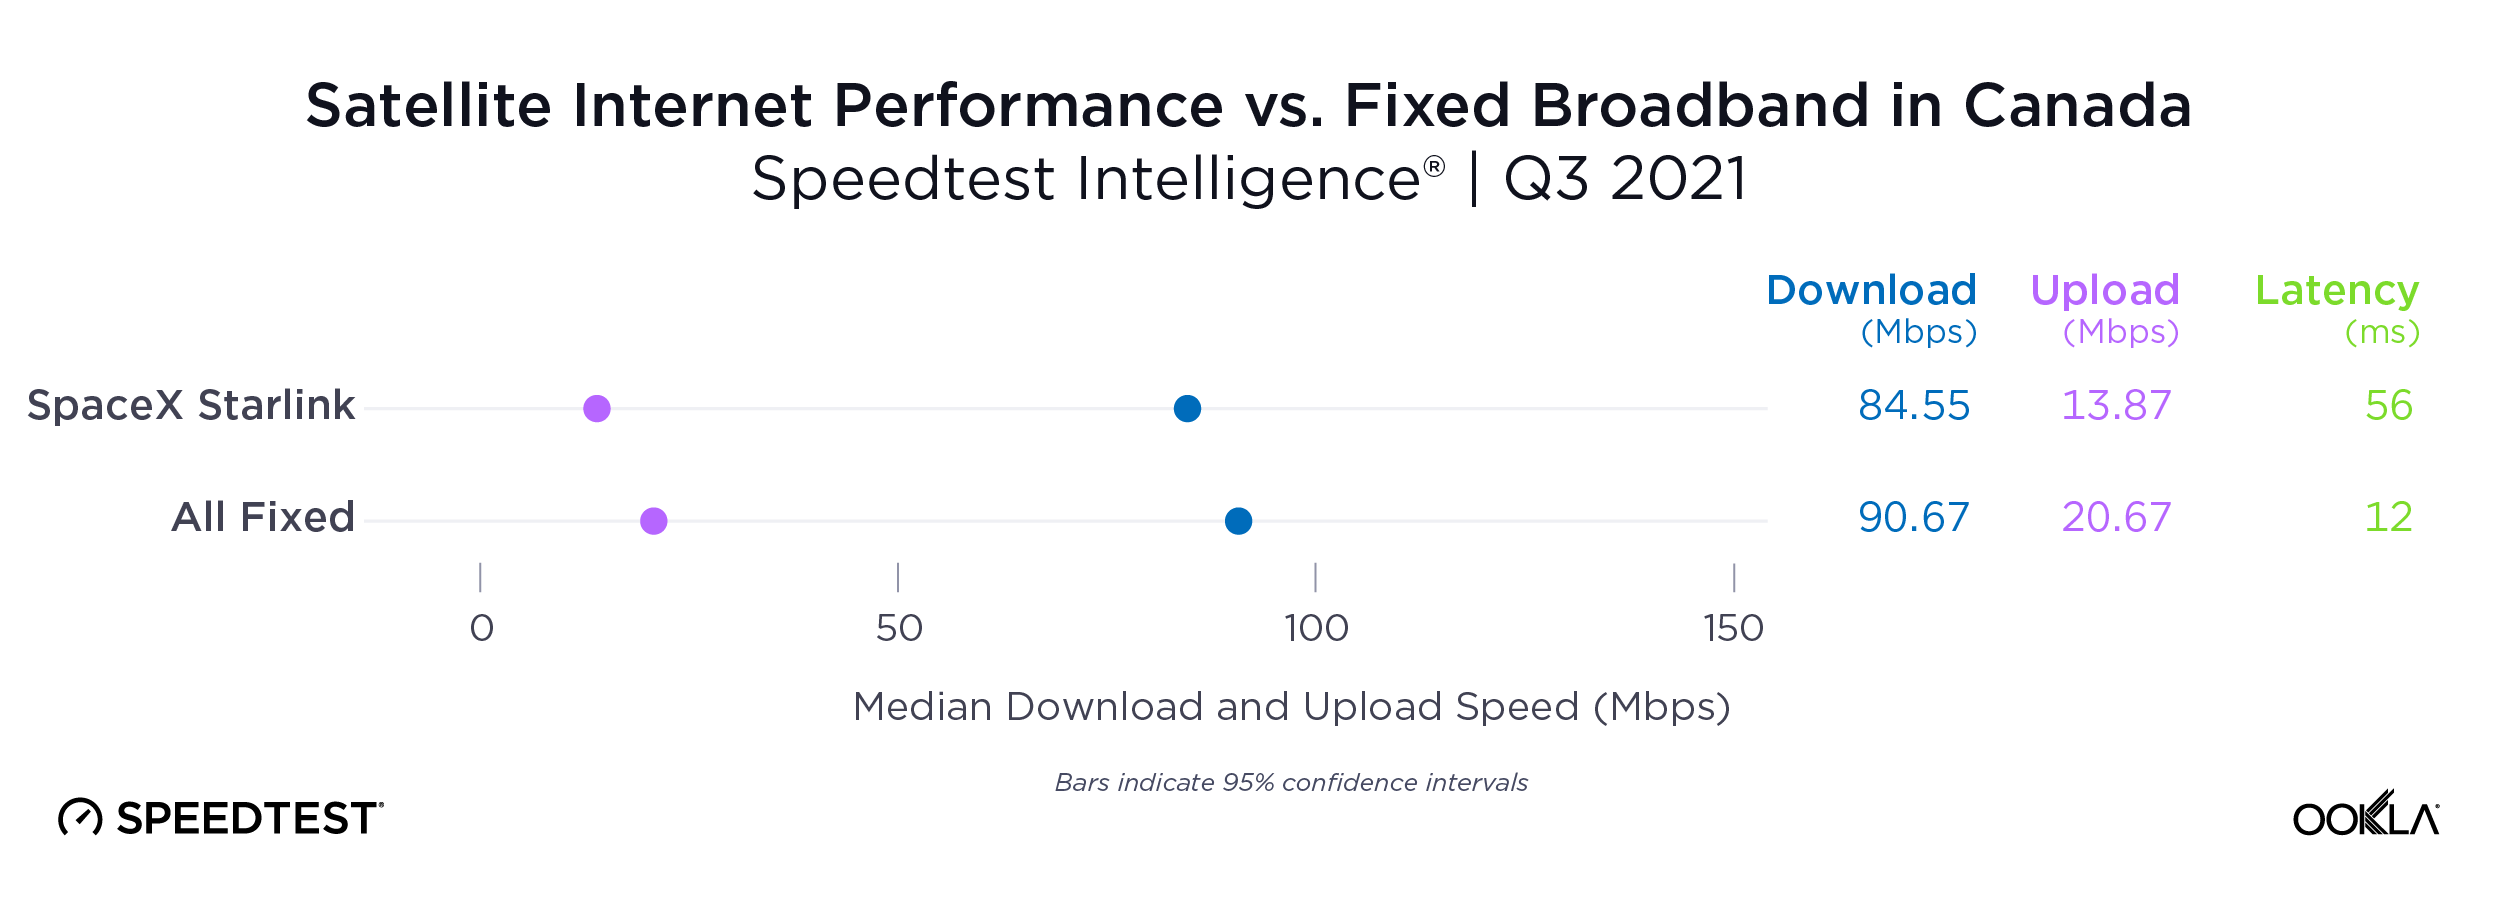
Canada: Starlink performance relatively flat
Our previous article showed that Starlink’s median download speed exceeded that of fixed broadband in Canada during Q2 2021 (86.92 Mbps vs. 84.24 Mbps). In Q3 2021, Starlink’s median download speed decreased slightly to 84.55 Mbps while that over all fixed broadband increased to 90.67 Mbps. This is in line with what we expect to see on new technologies as additional users are added to a system. Starlink’s median upload speed was slower than fixed broadband (13.87 Mbps vs. 20.67 Mbps). Latency on Starlink was much higher (56 ms vs. 12 ms). Starlink is still a viable alternative to fixed broadband in Canada, especially for consumers without access to other options.
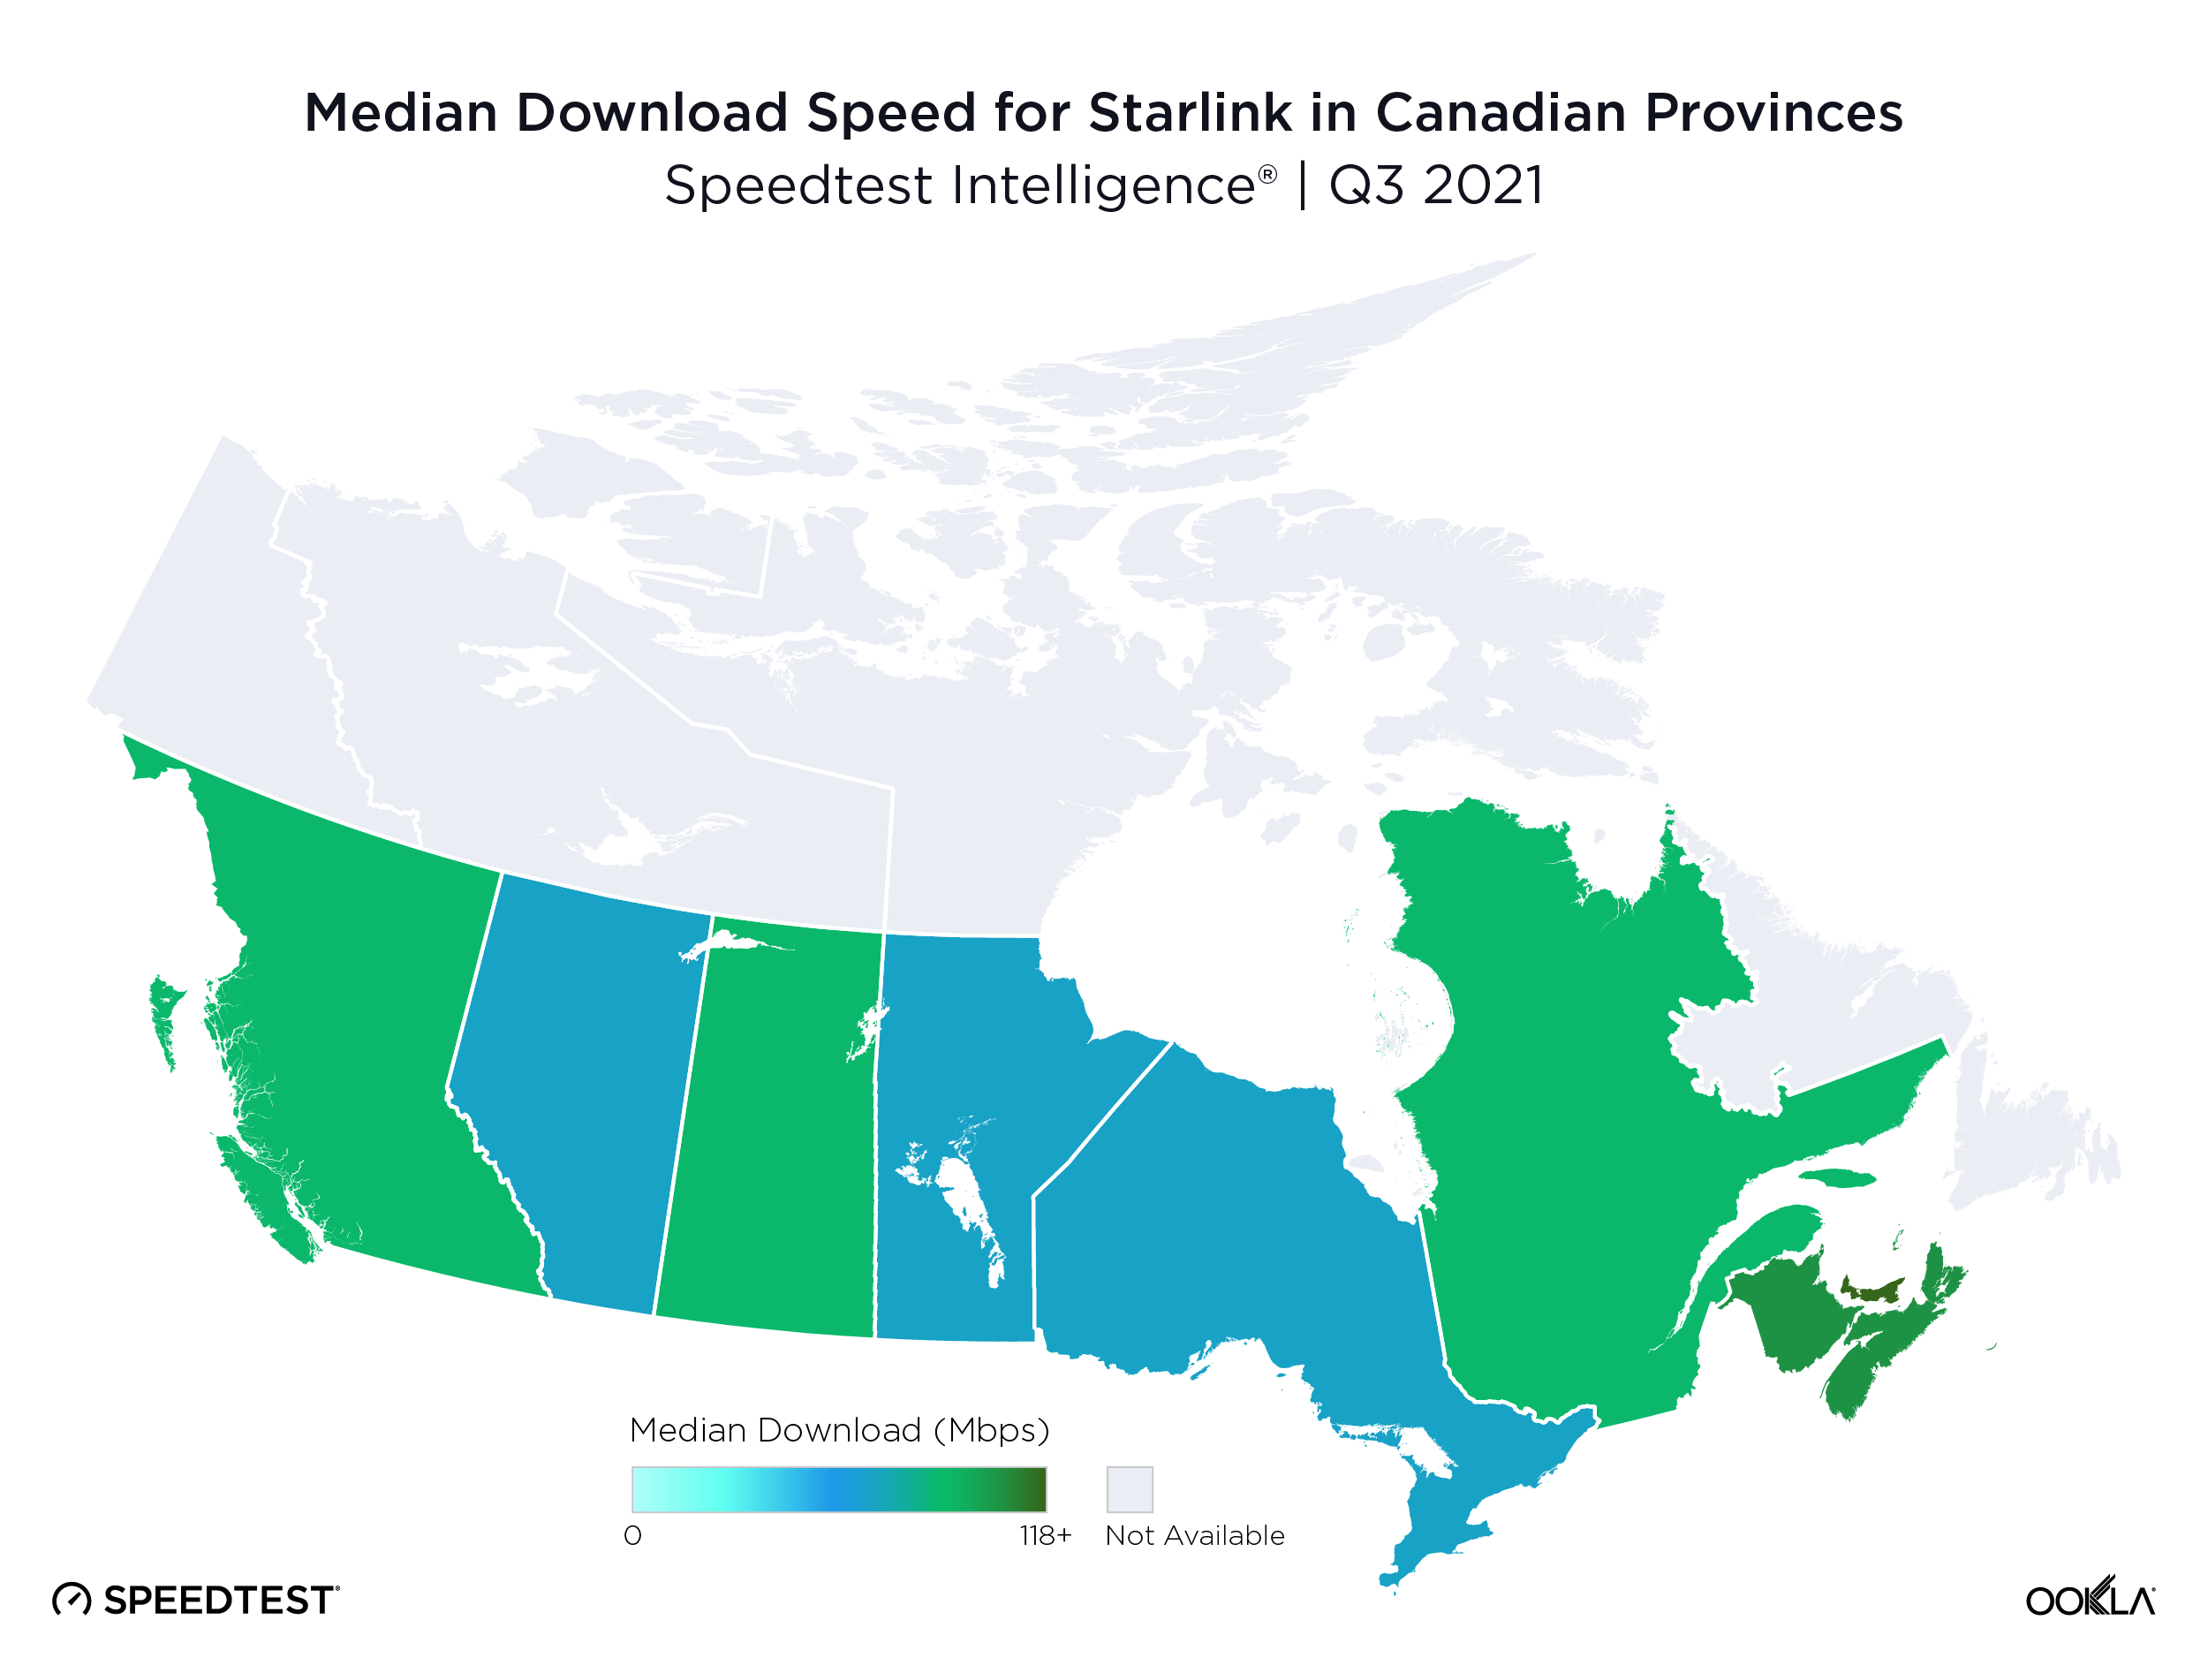
Starlink faster than overall fixed broadband in 5 provinces
Starlink showed enough samples to analyze performance in nine out of 10 provinces in Canada during Q3 2021. Starlink’s Q3 2021 median download speed was faster than the median for all fixed broadband in five provinces: Manitoba (81.04 Mbps vs. 65.91 Mbps), Nova Scotia (109.60 Mbps vs. 99.82 Mbps), Prince Edward Island (118.02 Mbps vs. 46.86 Mbps), Quebec (92.59 Mbps vs. 72.07 Mbps) and Saskatchewan (97.67 Mbps vs. 57.59 Mbps). Download speeds were comparable between Starlink and overall fixed broadband in New Brunswick (104.56 Mbps vs. 104.28 Mbps), and overall fixed broadband was faster than Starlink in Alberta (92.65 Mbps vs. 82.48 Mbps), British Columbia (111.36 Mbps vs. 87.34 Mbps) and Ontario (86.26 Mbps vs. 79.54 Mbps).
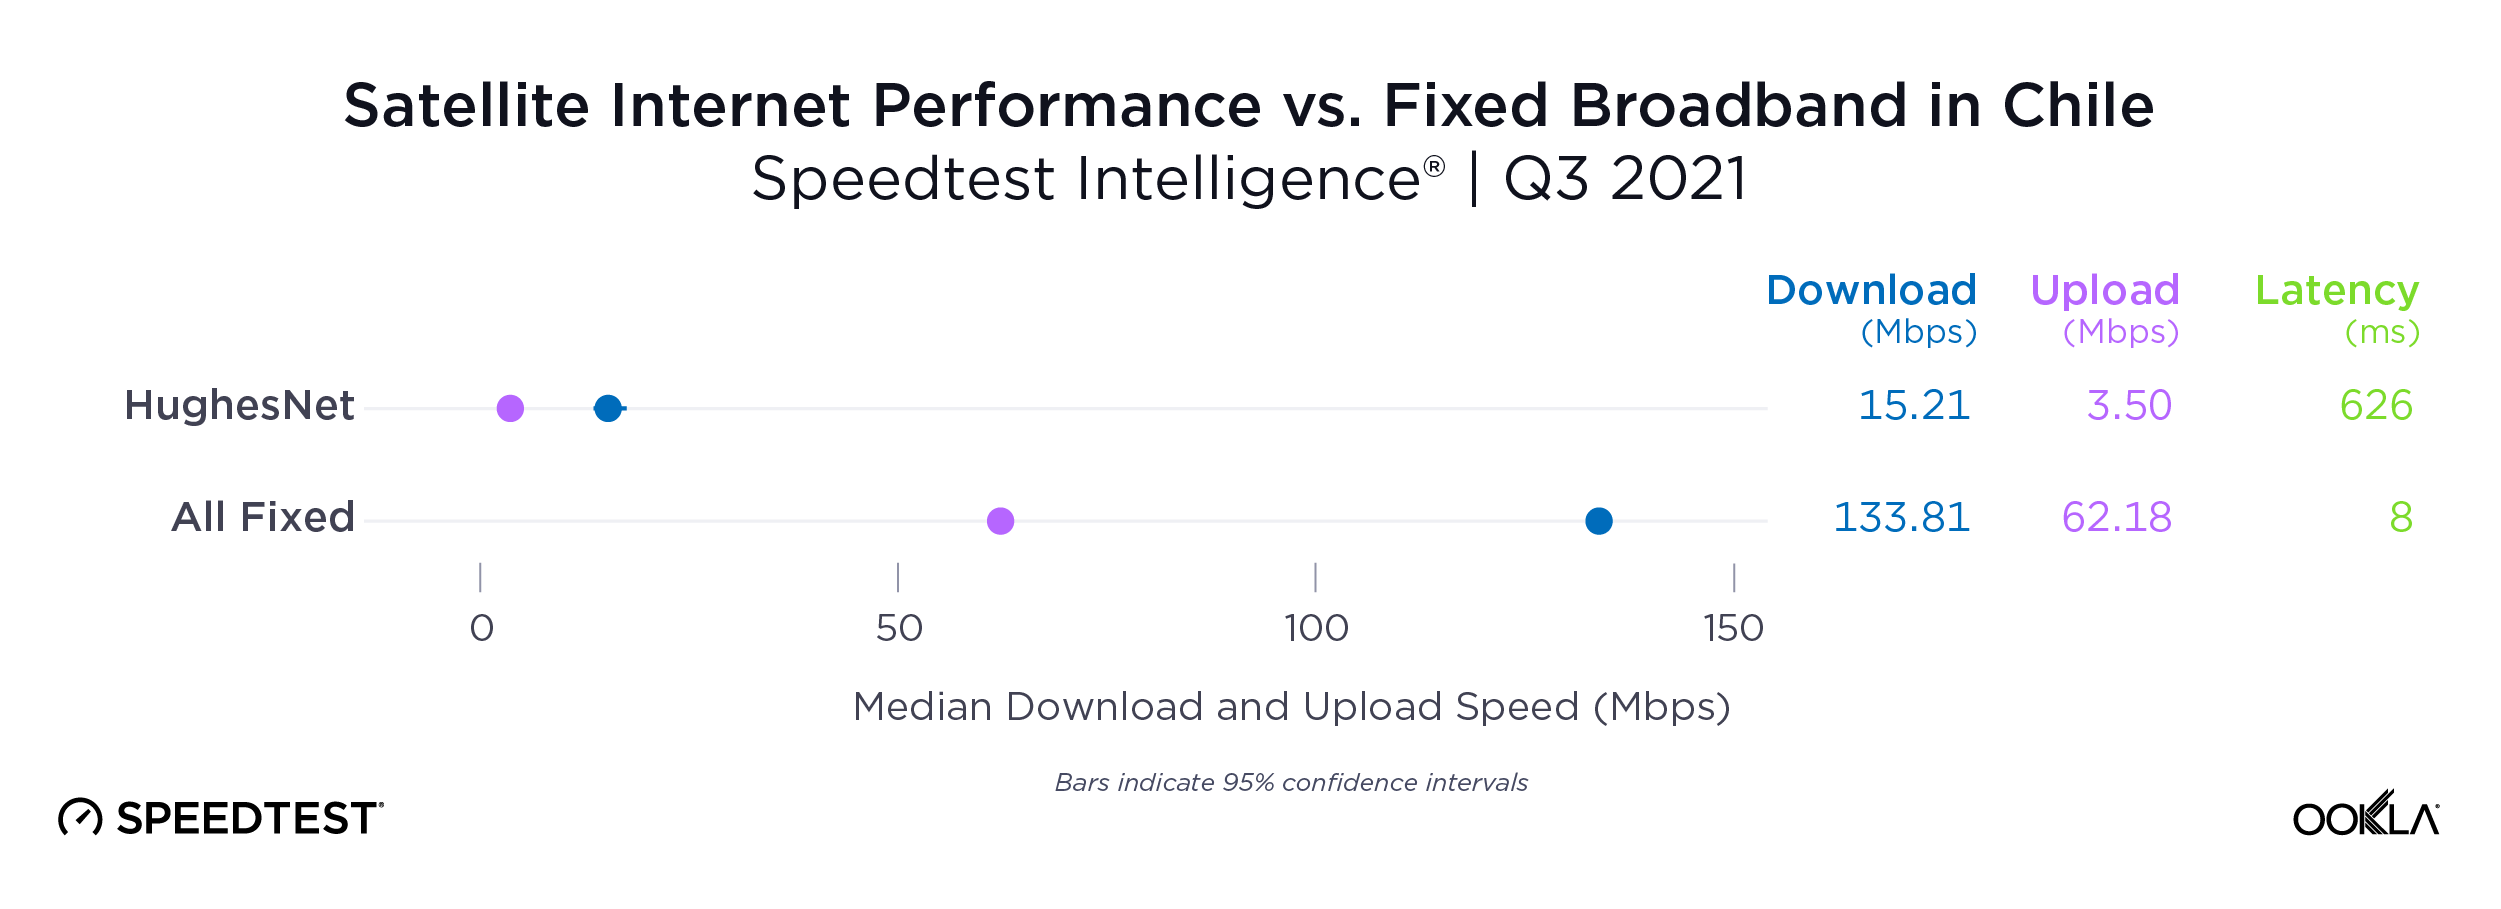
Chile: HughesNet slower than fixed broadband average
HughesNet was hard pressed to compete with Chile’s fixed broadband, which ranked fourth in the world during October 2021. HughesNet showed a 15.21 Mbps median download speed compared during Q3 2021 with the country’s fixed broadband average of 133.81 Mbps during the same period. Median upload speeds also showed a wide gap (3.50 Mbps for HughesNet to 62.18 Mbps on fixed broadband), and HughesNet’s latency was very high (626 ms vs. 8 ms).
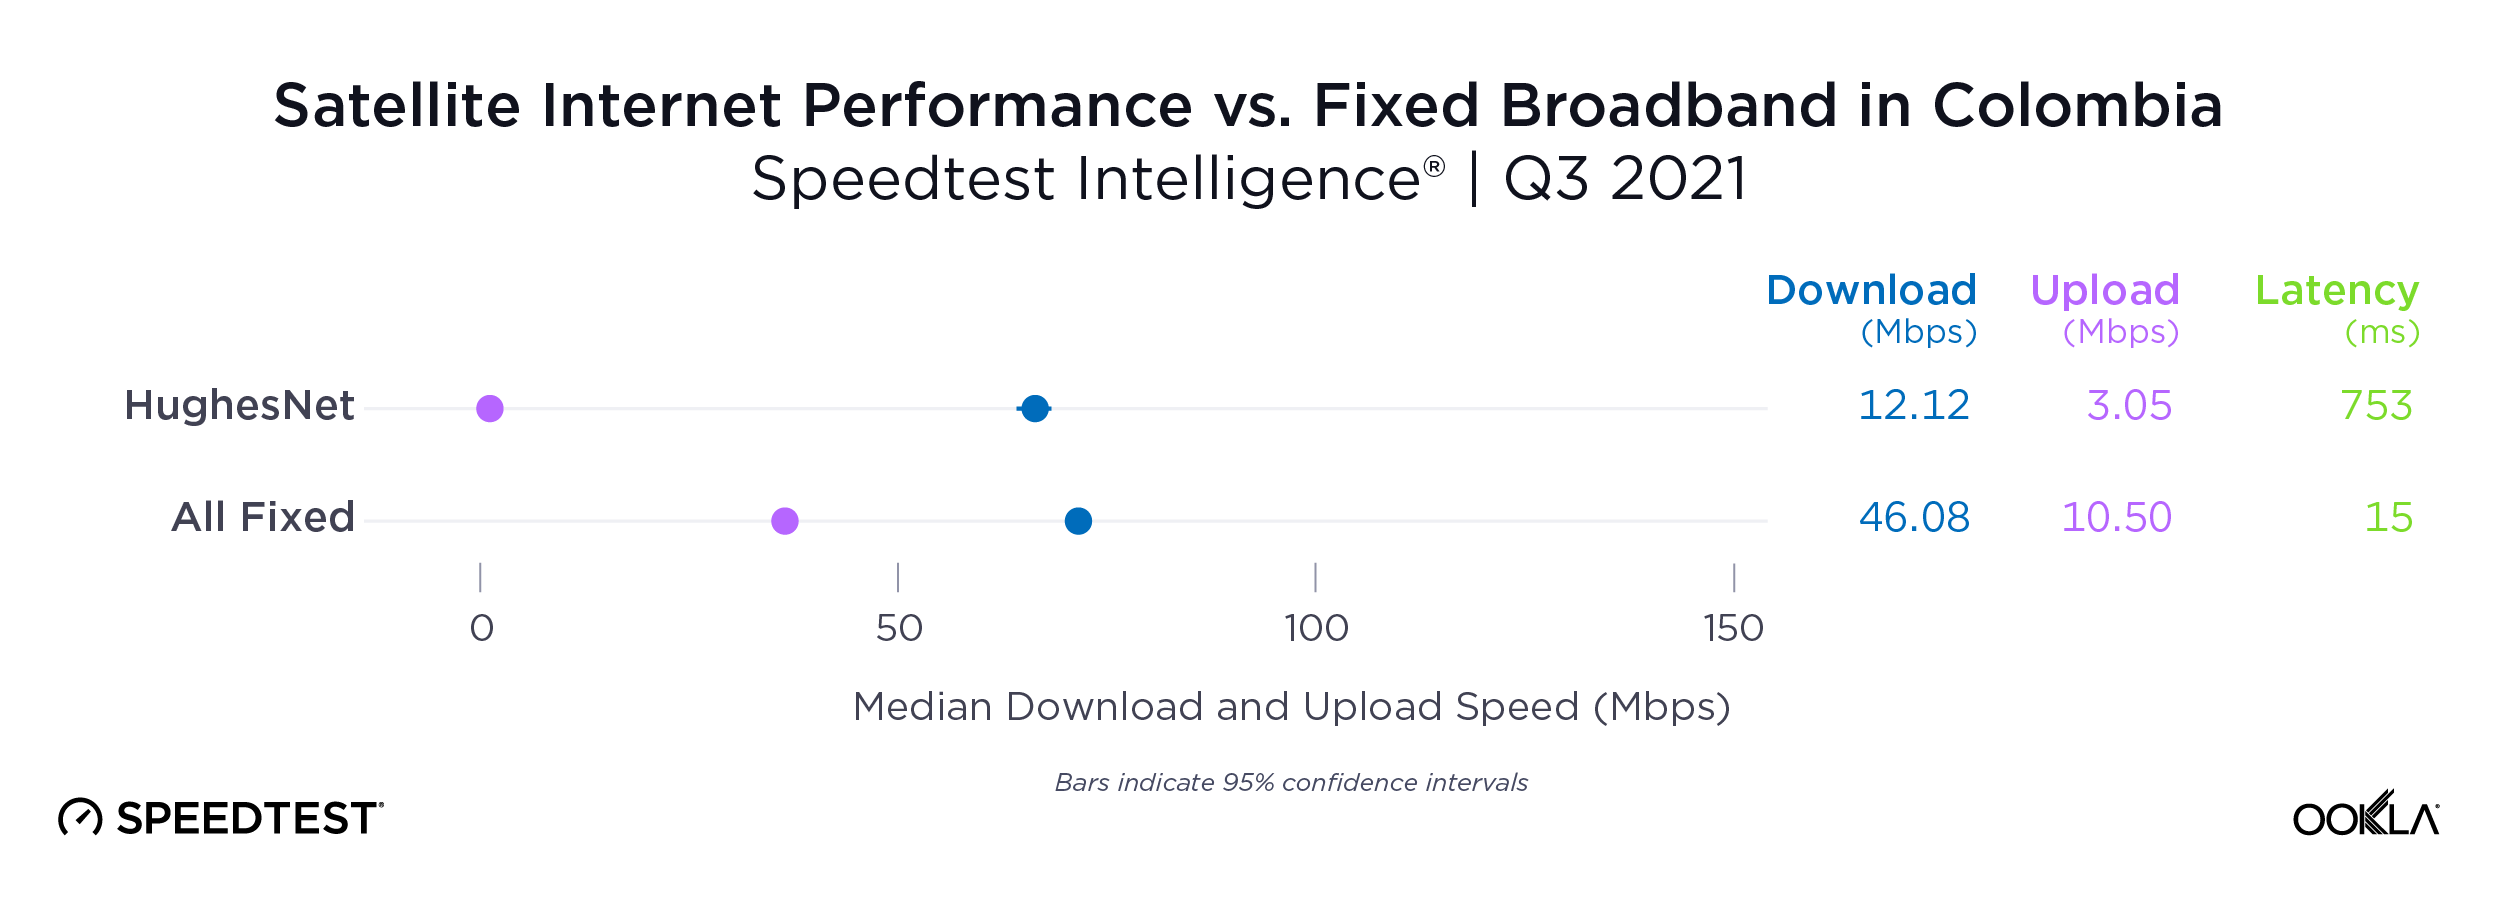
Colombia: HughesNet slow but improving
HughesNet’s median download speed increased in Q3 2021 to 12.12 Mbps (up from 9.28 Mbps during Q2 2021), compared with Colombia’s 46.08 Mbps for fixed broadband overall (35.90 Mbps in Q2 2021). Median upload speed was also slower using the satellite internet provider (3.05 Mbps) than fixed broadband (10.50 Mbps), and latency was much higher on satellite (753 ms vs. 15 ms).
France: Starlink speeds decreasing, remains faster than fixed broadband average
Starlink users in France saw a median download speed of 102.15 Mbps in Q3 2021 (down from 139.39 Mbps in Q2 2021, likely due to increased usage). Starlink’s download speed easily beat the country-wide median for fixed broadband of 75.47 Mbps (up from 70.81 Mbps in Q2 2021). Starlink’s upload speed during Q3 2021 was slower than the fixed broadband median (19.84 Mbps vs. 56.66 Mbps), and Starlink’s latency was higher (54 ms vs. 13 ms).
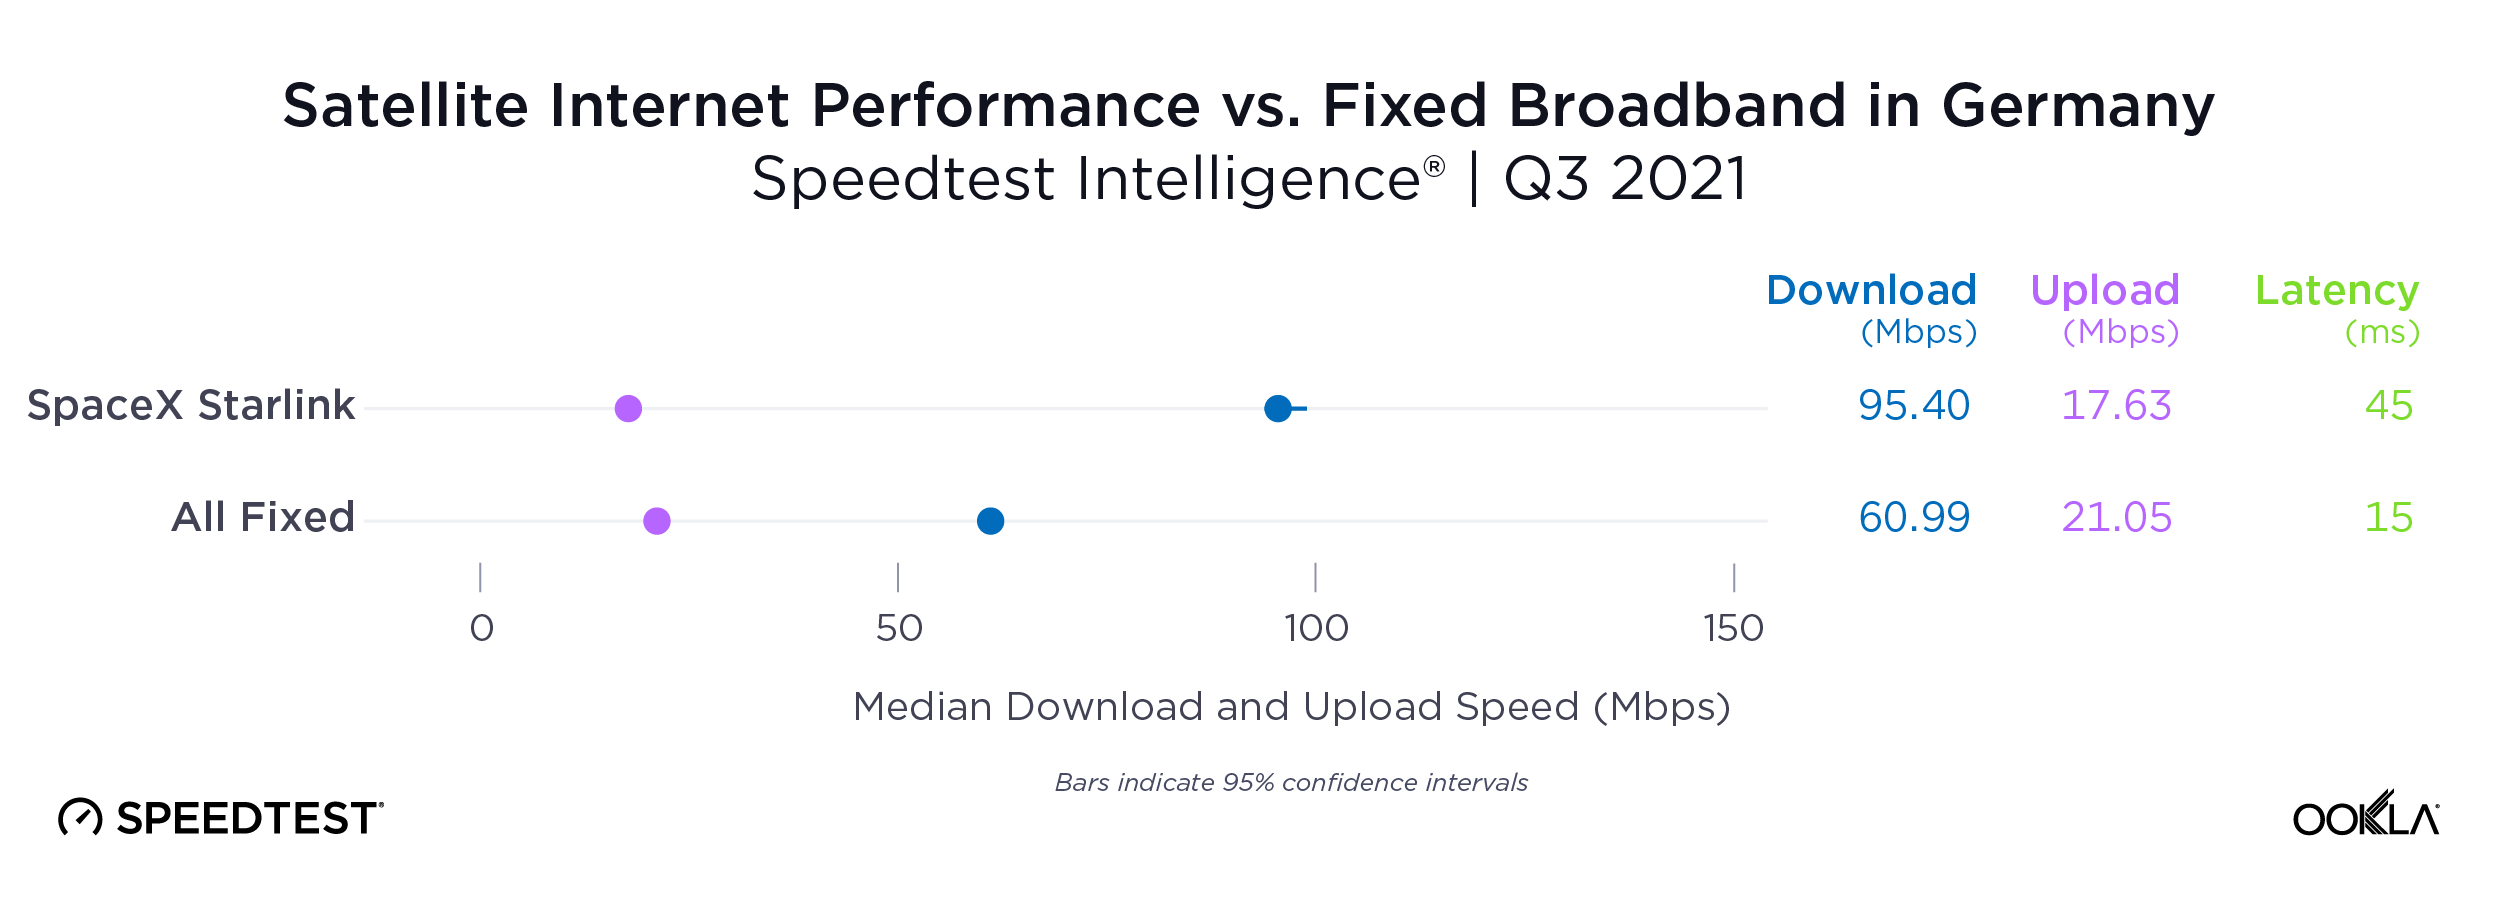
Germany: Starlink faster than country average for fixed broadband
Starlink’s median download speed in Germany of 95.40 Mbps was much faster than the country median of 60.99 Mbps during Q3 2021. Starlink was slightly slower for upload speed than overall fixed broadband (17.63 Mbps vs. 21.05 Mbps) and Starlink showed a higher latency (45 ms vs. 15 ms).
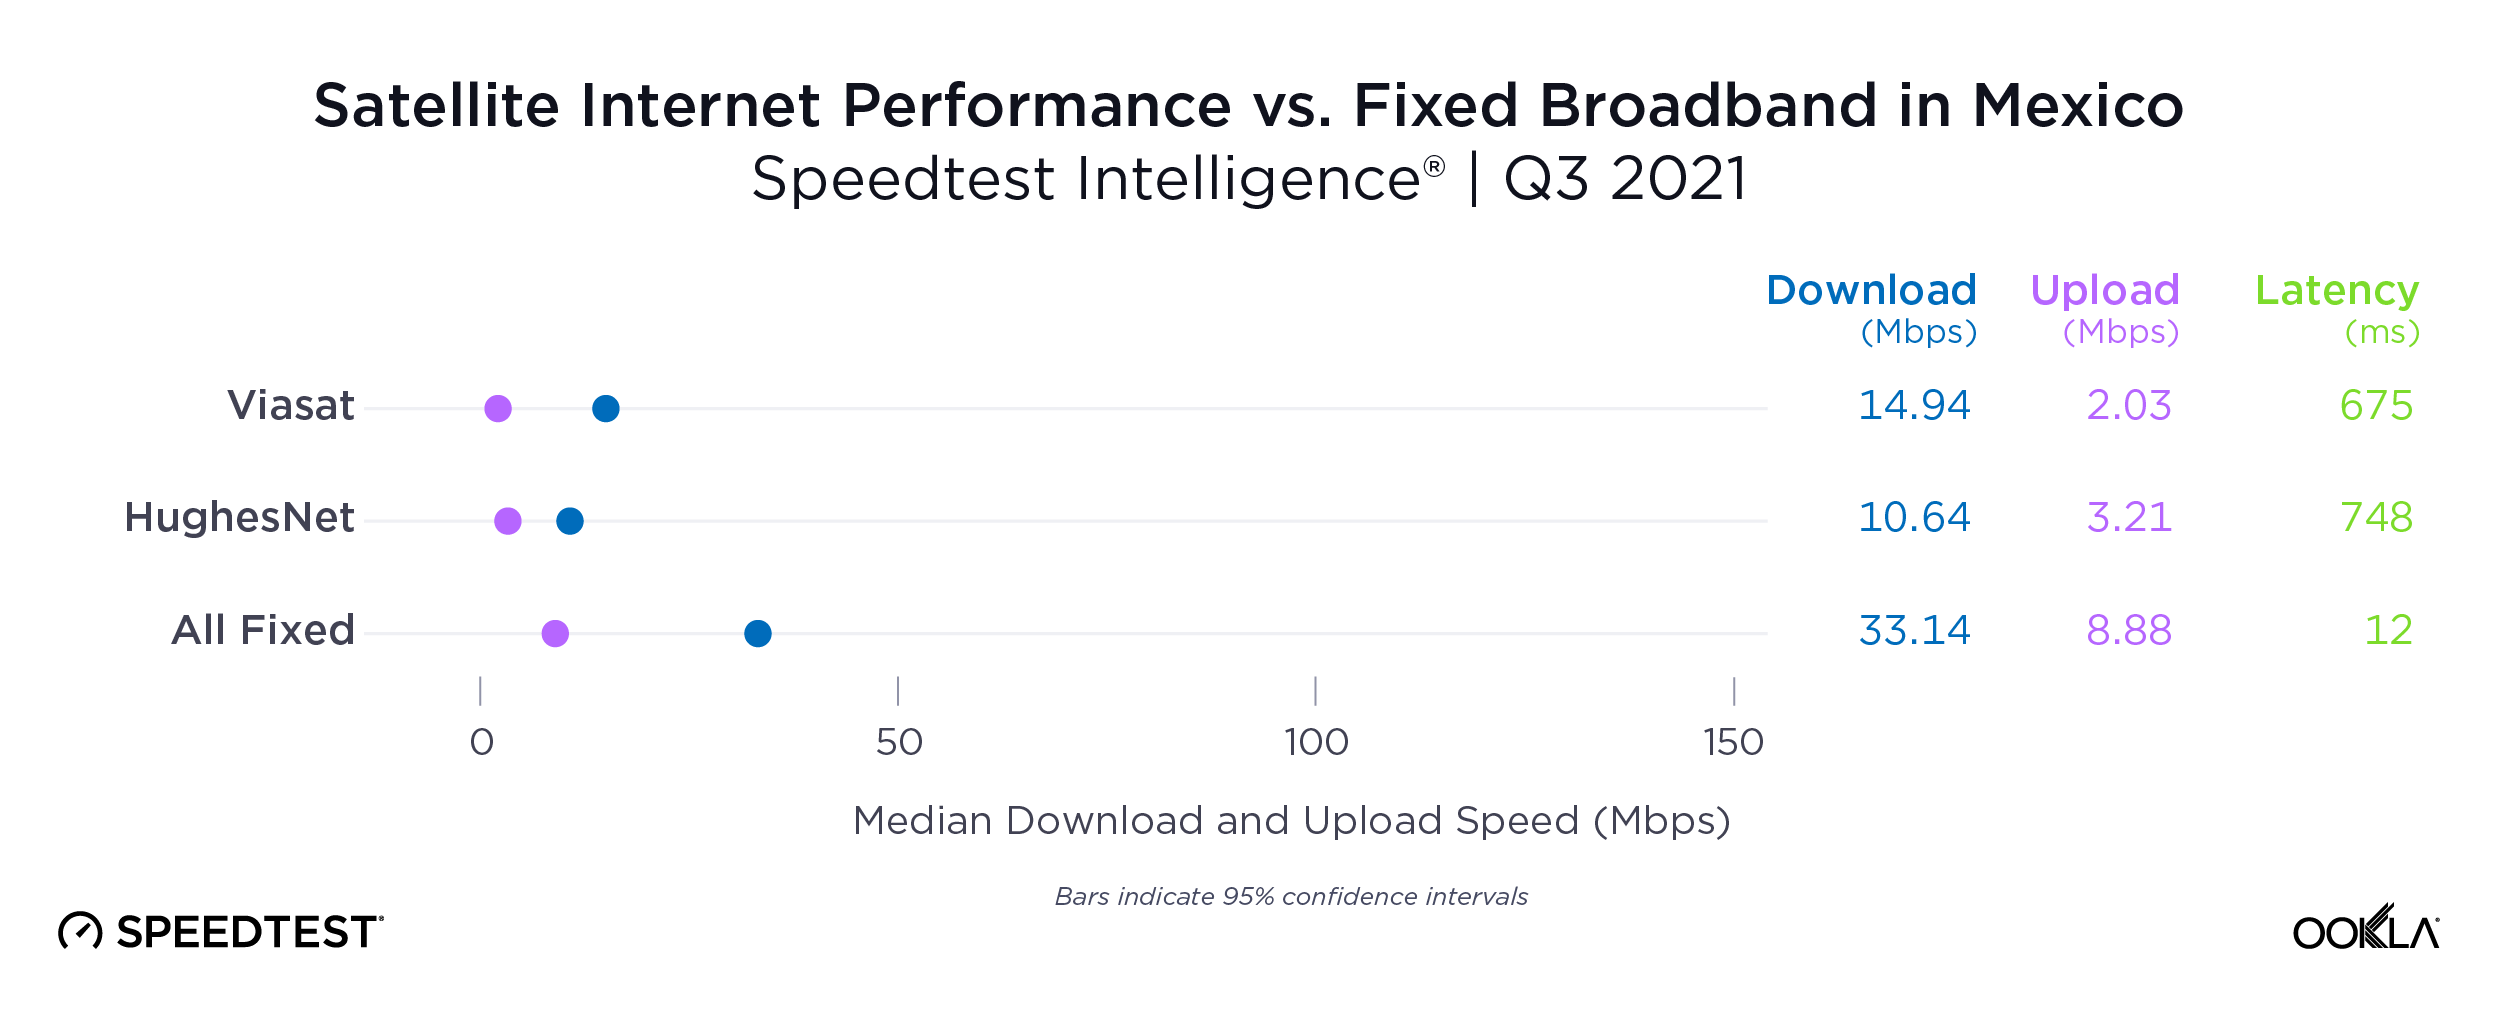
Mexico: Viasat faster than HughesNet for downloads
Viasat, with a median download speed of 14.94 Mbps during Q3 2021 (up from 13.95 Mbps in Q2 2021), was faster than HughesNet (10.64 Mbps in Q3 2021, down from 11.92 Mbps in Q2 2021) but slower than the country’s median for fixed broadband (33.14 Mbps in Q3 2021, 29.99 Mbps in Q2 2021). HughesNet was slightly faster than Viasat for upload speed during Q3 2021 (3.21 Mbps vs. 2.03 Mbps). While Viasat’s latency was high (675 ms vs 12 ms for fixed broadband), it was lower than HughesNet’s (748 ms).
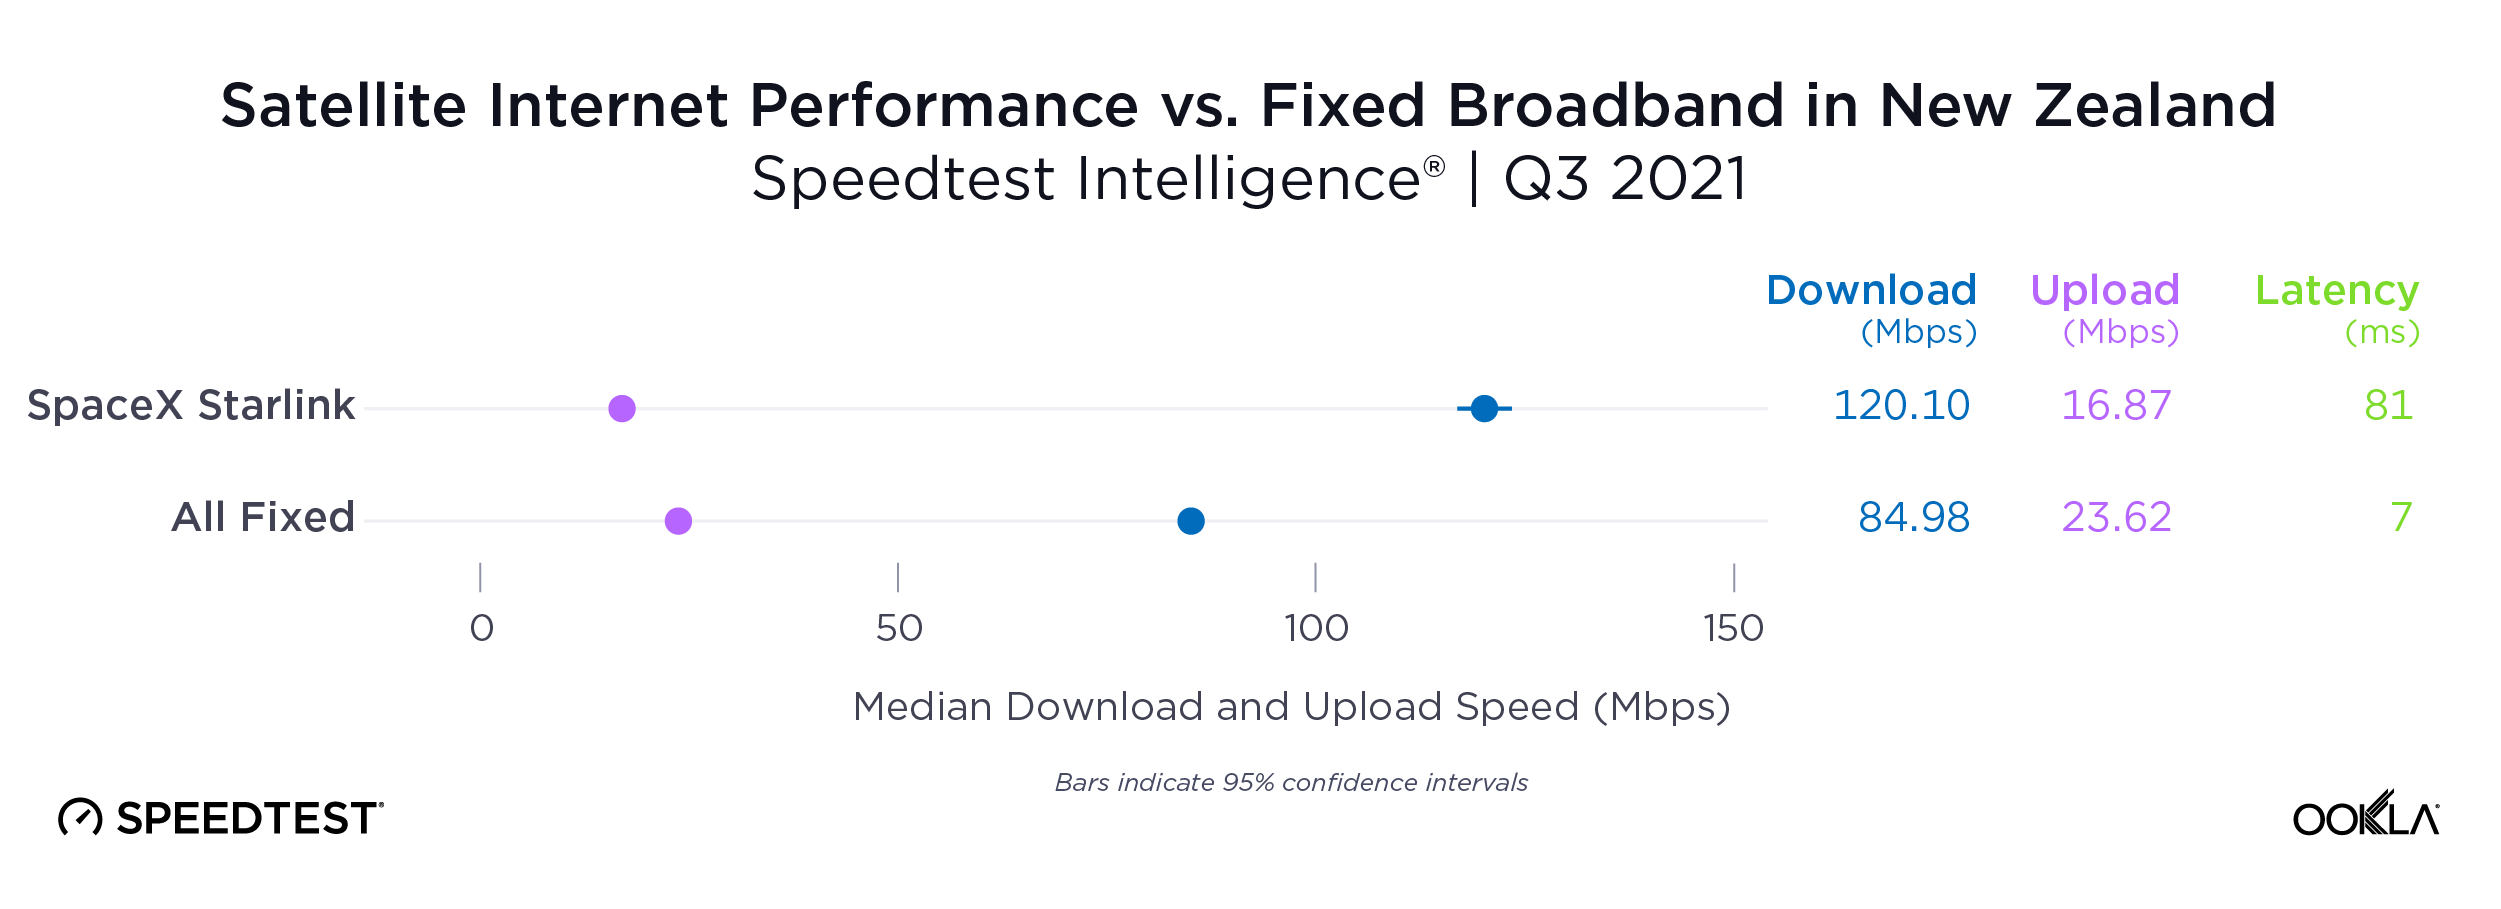
New Zealand: Starlink slowed slightly, remained faster than fixed broadband average
Starlink’s Q3 2021 median download speed (120.10 Mbps, down from 127.02 Mbps in Q2 2021, likely due to increased usage) was much faster than New Zealand’s median fixed broadband download speed (84.98 in Q3 2021 up from 78.85 Mbps in Q2 2021). Starlink was slower than New Zealand’s overall fixed broadband for Q3 2021 upload speed (16.87 Mbps vs. 23.62 Mbps). While Starlink’s median latency improved from 101 ms in Q2 2021 to 81 ms in Q3 2021, it was still slower than New Zealand’s median for all fixed broadband of 7 ms during Q3 2021.
United Kingdom: Starlink nearly twice as fast as fixed broadband average
Starlink showed a much faster median download speed in the U.K. during Q3 2021 (111.66 Mbps, up from 108.30 Mbps in Q2 2021) than the country’s median for fixed broadband (53.16 Mbps in Q3 2021, up from 50.14 Mbps in Q2 2021). Starlink’s upload speed was comparable to the median for all fixed broadband in the U.K. (16.02 Mbps vs. 15.77 Mbps), and the latency was pretty good, given the distance traveled (37 ms vs. 15 ms).
We look forward to updating this data again next quarter with new locations as satellite internet continues to become a more viable option for many. If you’re using satellite internet, take a Speedtest to help us provide an accurate picture of real-world performance.
Ookla retains ownership of this article including all of the intellectual property rights, data, content graphs and analysis. This article may not be quoted, reproduced, distributed or published for any commercial purpose without prior consent. Members of the press and others using the findings in this article for non-commercial purposes are welcome to publicly share and link to report information with attribution to Ookla.
Ookla® has exciting, fresh data from Q3 2022 for SpaceX’s Starlink, HughesNet, and Viasat in North and South America, as well as new Starlink markets we haven’t yet featured in our ongoing series on satellite internet. With accelerating competition on the horizon for 2023, we’ve been eager to see how Starlink continues to perform, especially as building new fiber connections continues to be costly around the world.
This analysis includes results from five additional countries, two new providers, and expanded data for Starlink, HughesNet, and Viasat. We also examine how Starlink’s internet performance has changed over the past year in Canada, Chile, and the United States.
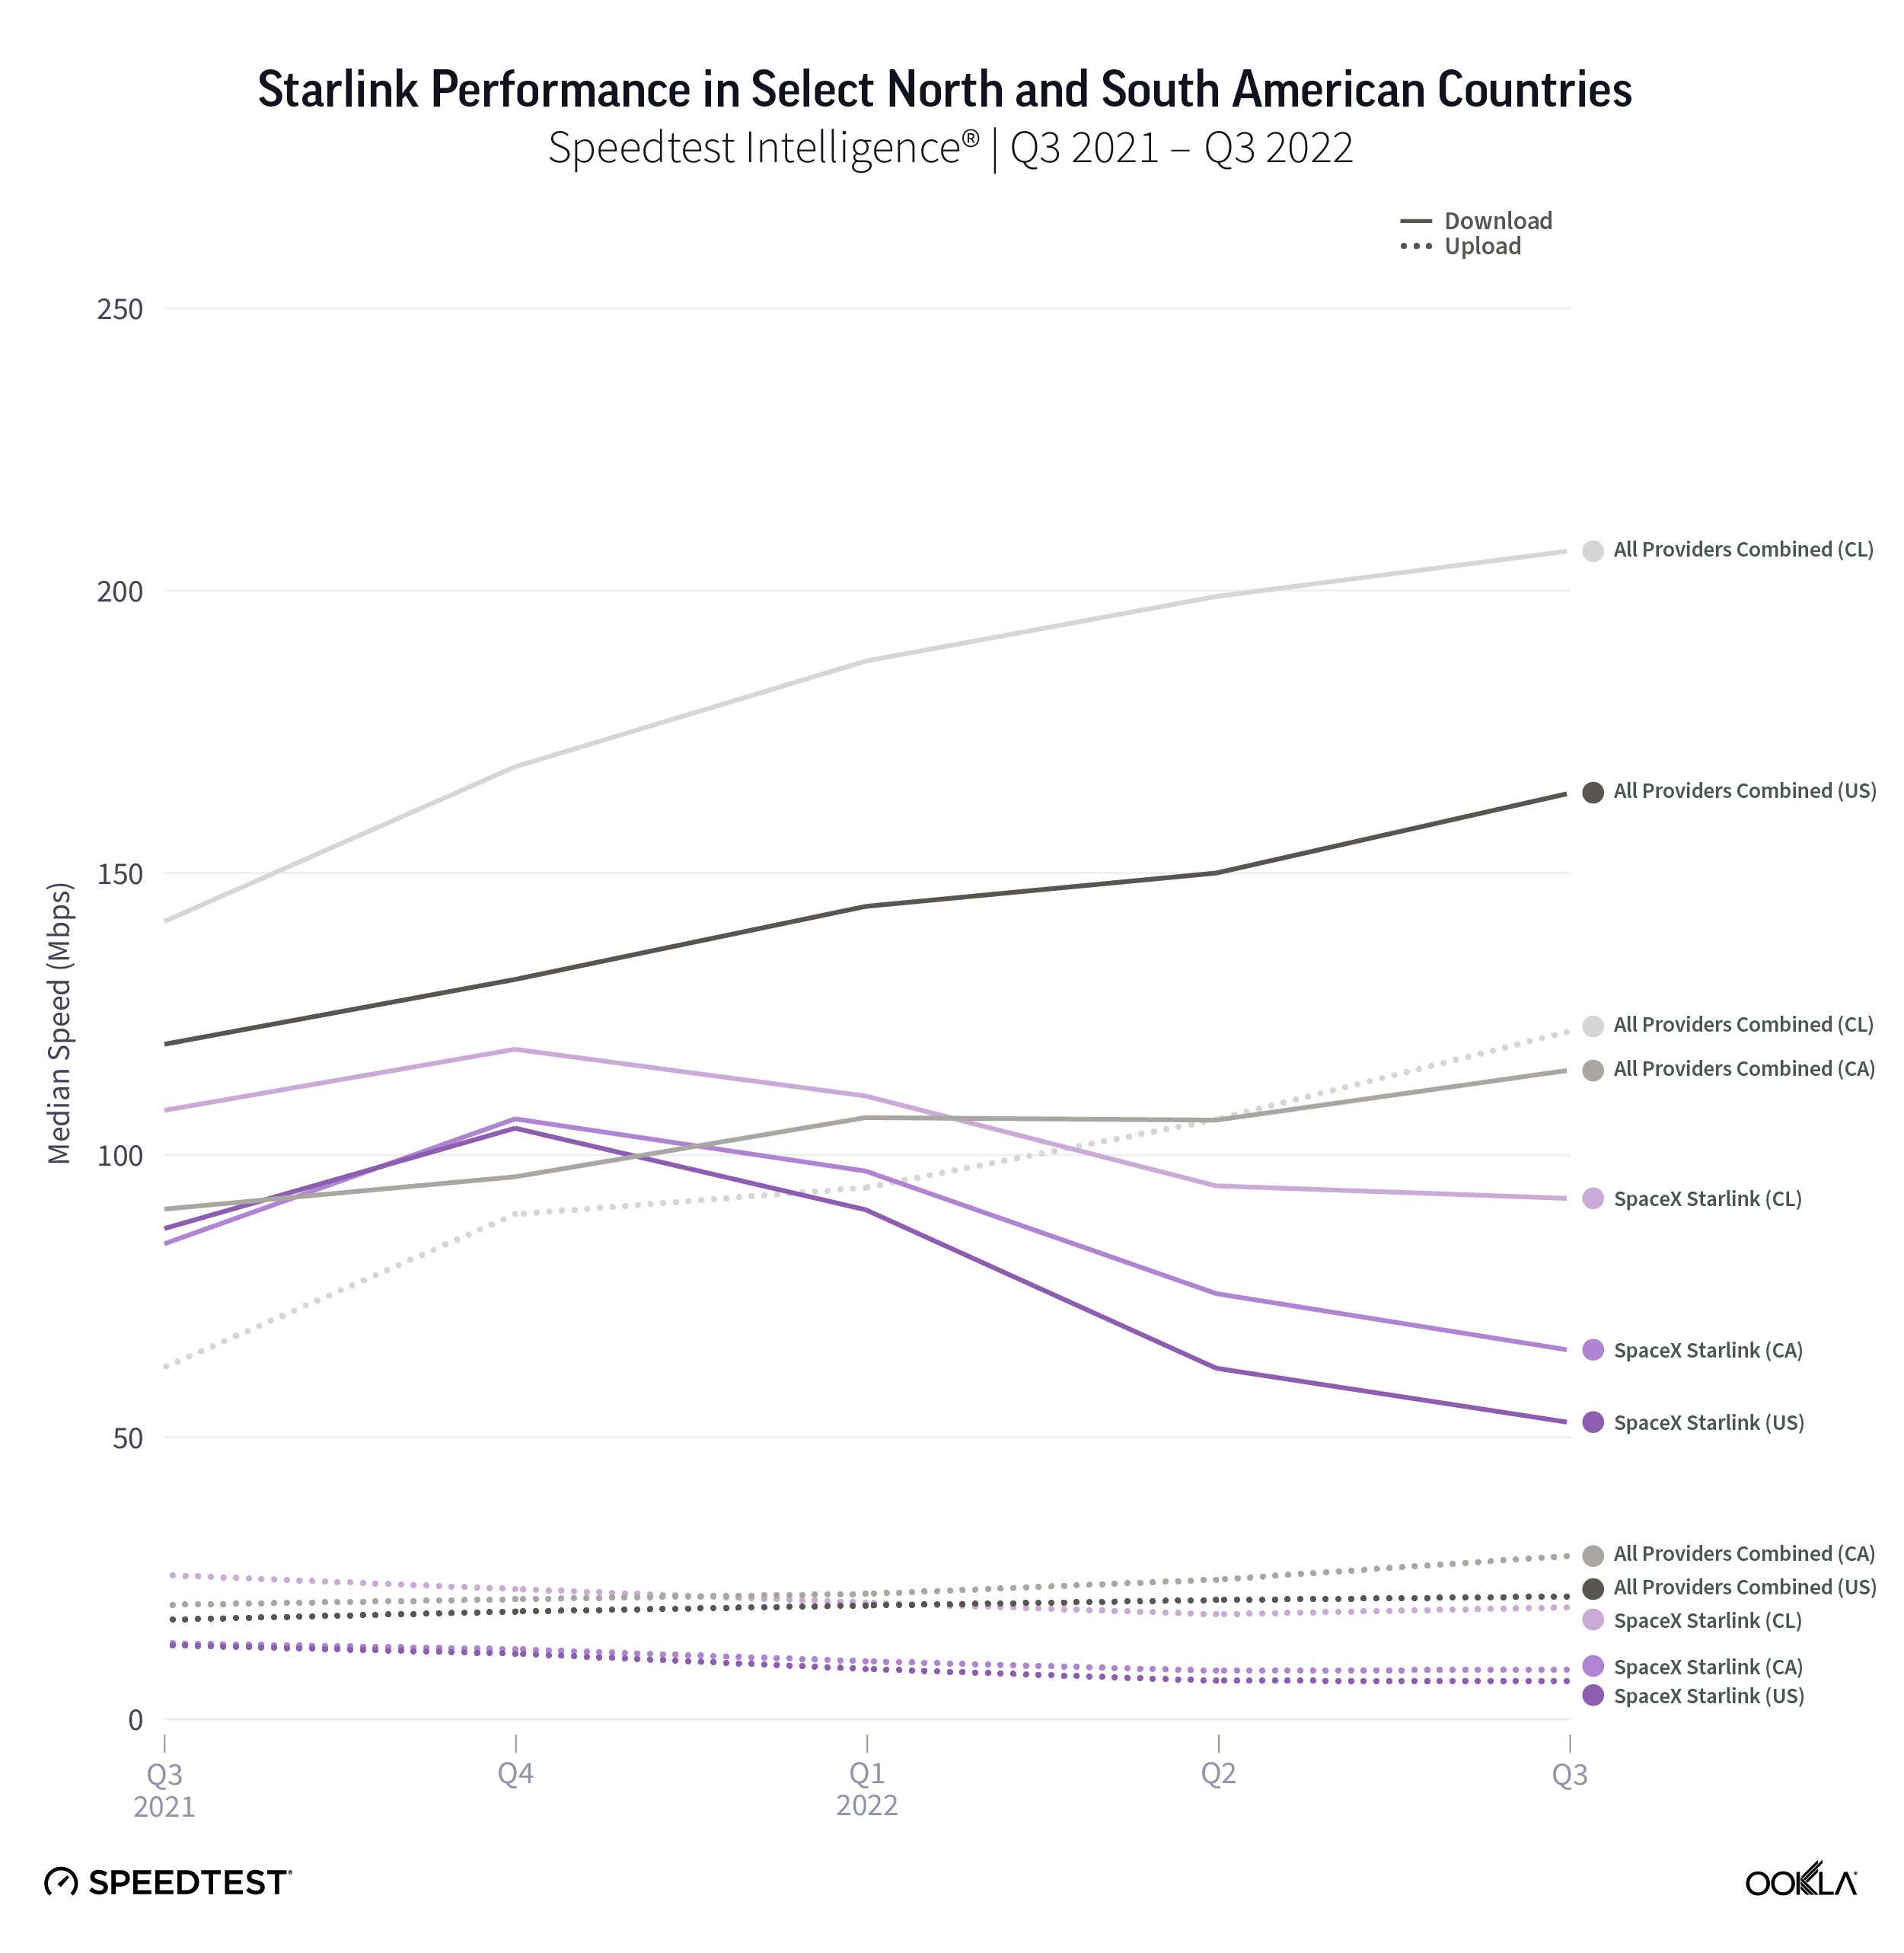
Starlink performance dipped once again during Q3 2022 (though only slightly)
Perhaps a victim of their own success, Starlink download speeds dropped once again in Canada (at least 14%) and the U.S. (at least 17%) from Q2 to Q3 2022, while speeds remained roughly the same in Chile quarter over quarter. During the same period, fixed broadband performance raced ahead, improving at least 8% to 115.18 Mbps in Canada, at least 4% to 207.04 Mbps in Chile, and at least 8% to 164.13 Mbps in the U.S.
Over the past year, as we’ve seen more users flock to sign up for Starlink (reaching 400,000 users worldwide during Q2 2022), speeds have started to decrease. Without a doubt, Starlink often can be a life-changing service for consumers where connectivity is inadequate or nonexistent. Even as speeds slow, they still provide more than enough connectivity to do almost everything consumers normally need to do, including streaming 4K video and video messaging. The biggest thing you might have issues with is if you’re trying to play multiplayer online games — even being a low-earth orbit (LEO) satellite, latency still lags far behind low-latency fixed broadband connections.
Starlink upload speeds remained roughly unchanged in all three countries we surveyed during Q3 2022, improving marginally in Canada and Chile, and essentially staying the same in the U.S.
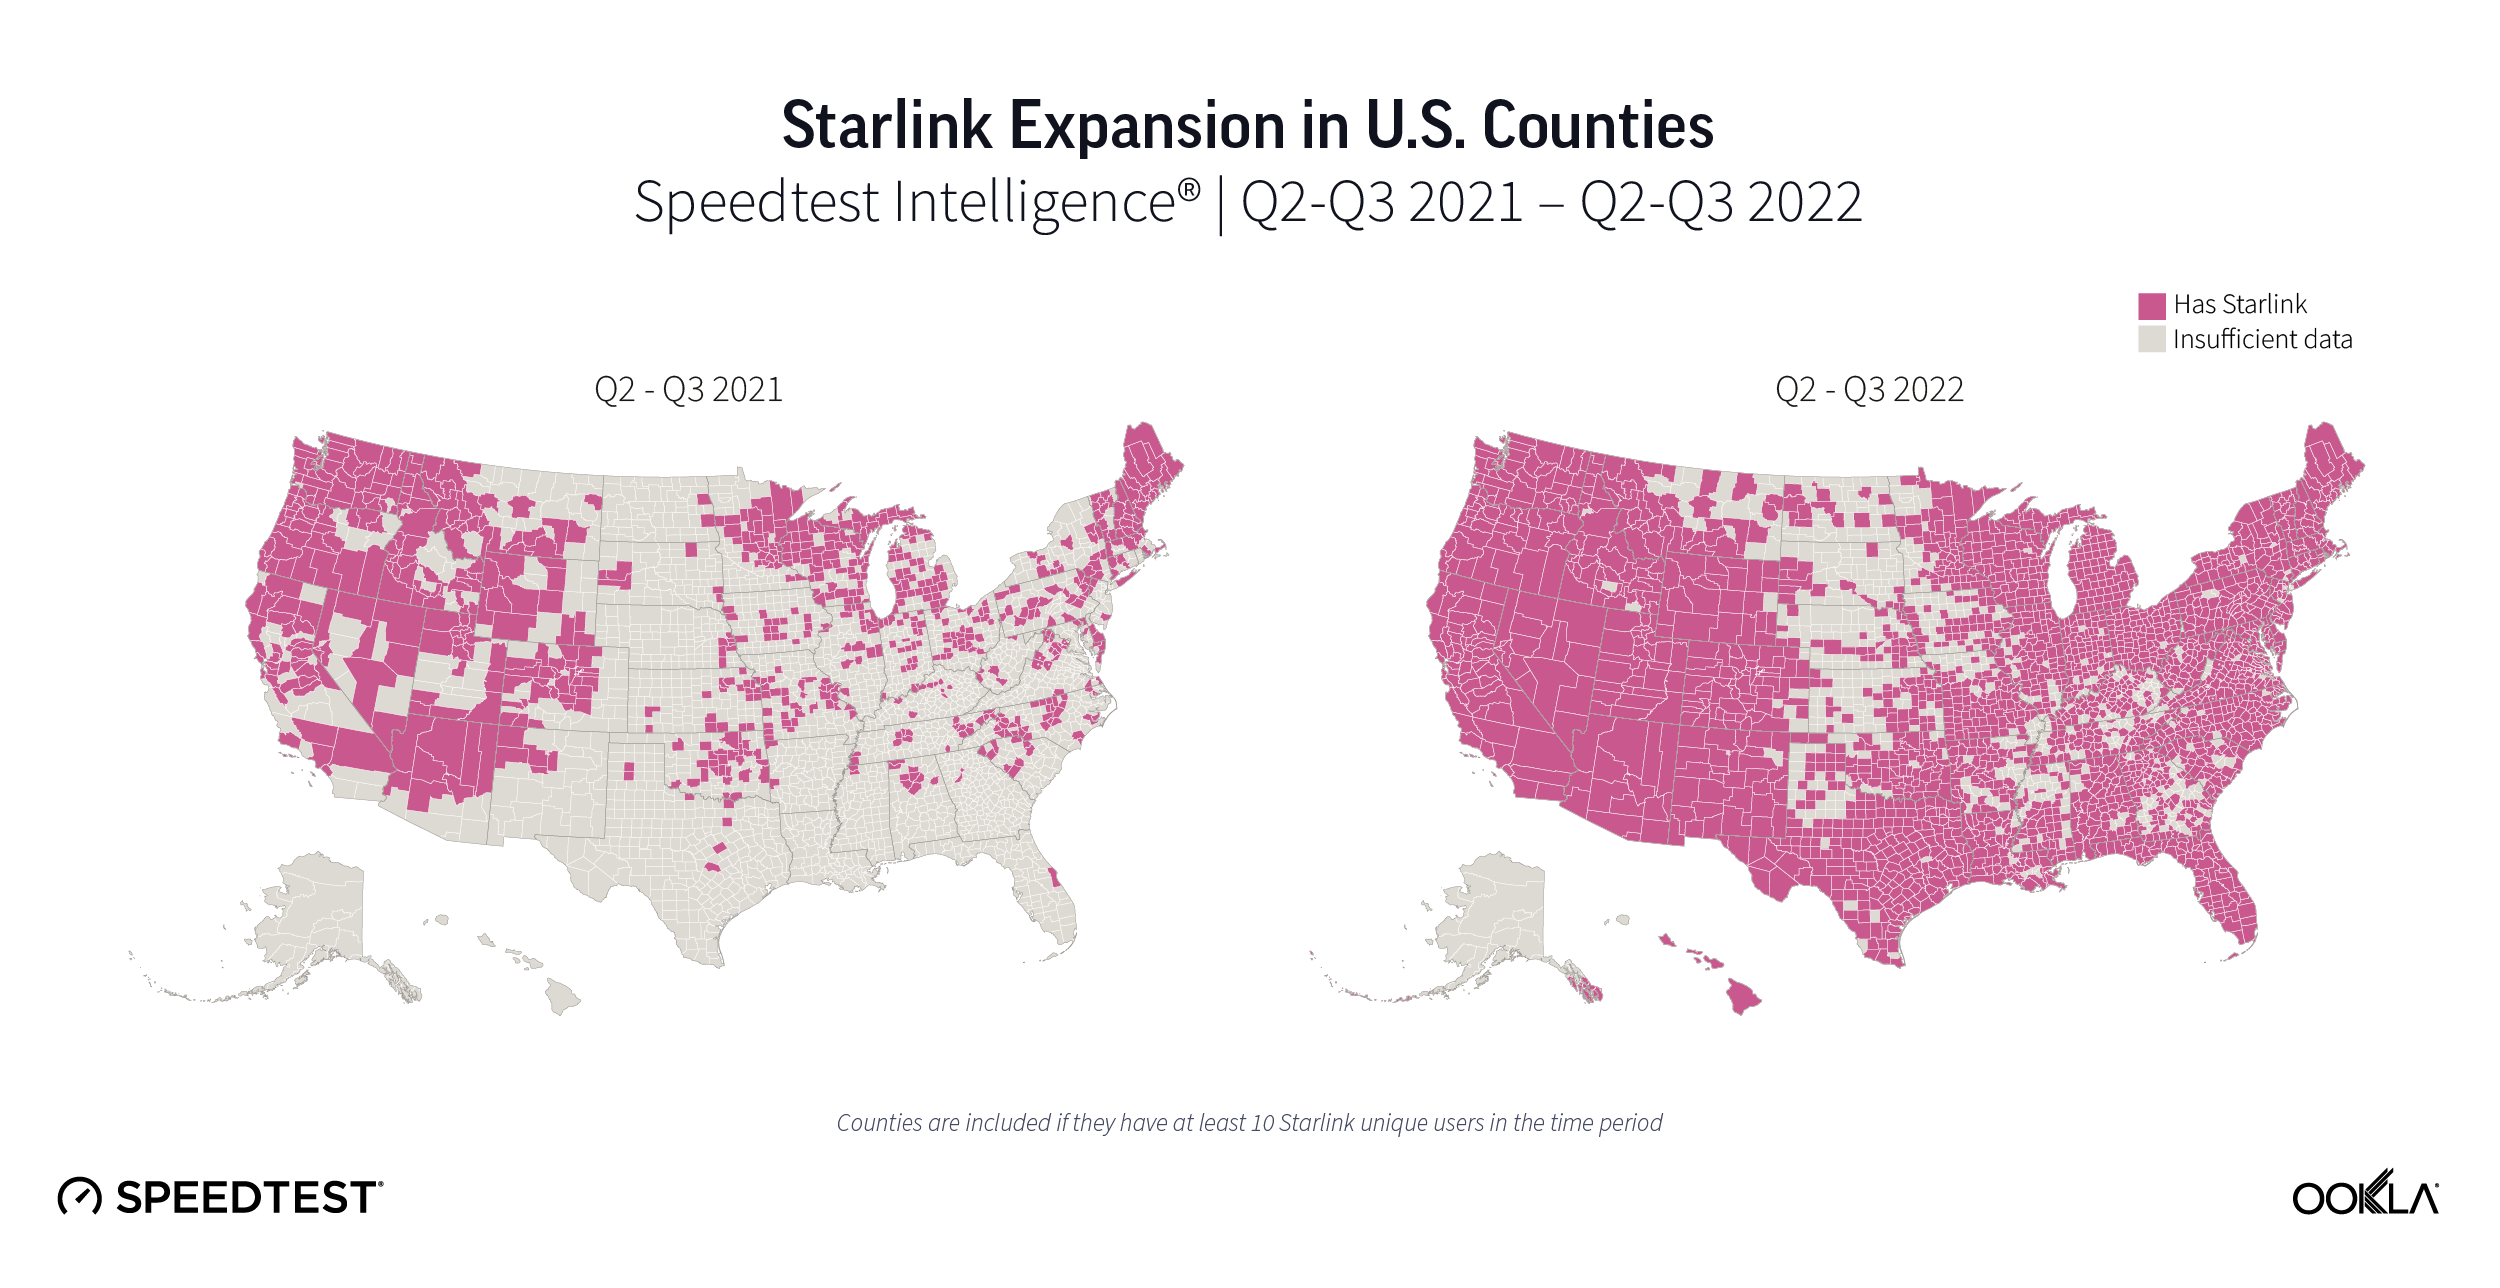
Starlink remains a boon for rural U.S. consumers who can afford it
Over the past year, Starlink has proliferated across the U.S., going from having at least 10 unique users in 776 U.S. counties, or roughly 25% of all counties during Q2-Q3 2021 to 2,399 counties in Q2-Q3 2022, or roughly 75% of counties. That marks about a 200% increase year over year, indicating consumer confidence in the provider.
Looking at only “nonmetro” counties as defined by the U.S. Office of Management and Budget, 336 counties showed at least 10 Starlink users in Q2-Q3 2021. That was about 17% of all nonmetro counties. In Q2-Q3 2022, that rose to 1359 counties, or about 69% of nonmetro counties, marking about a 300% increase year over year.
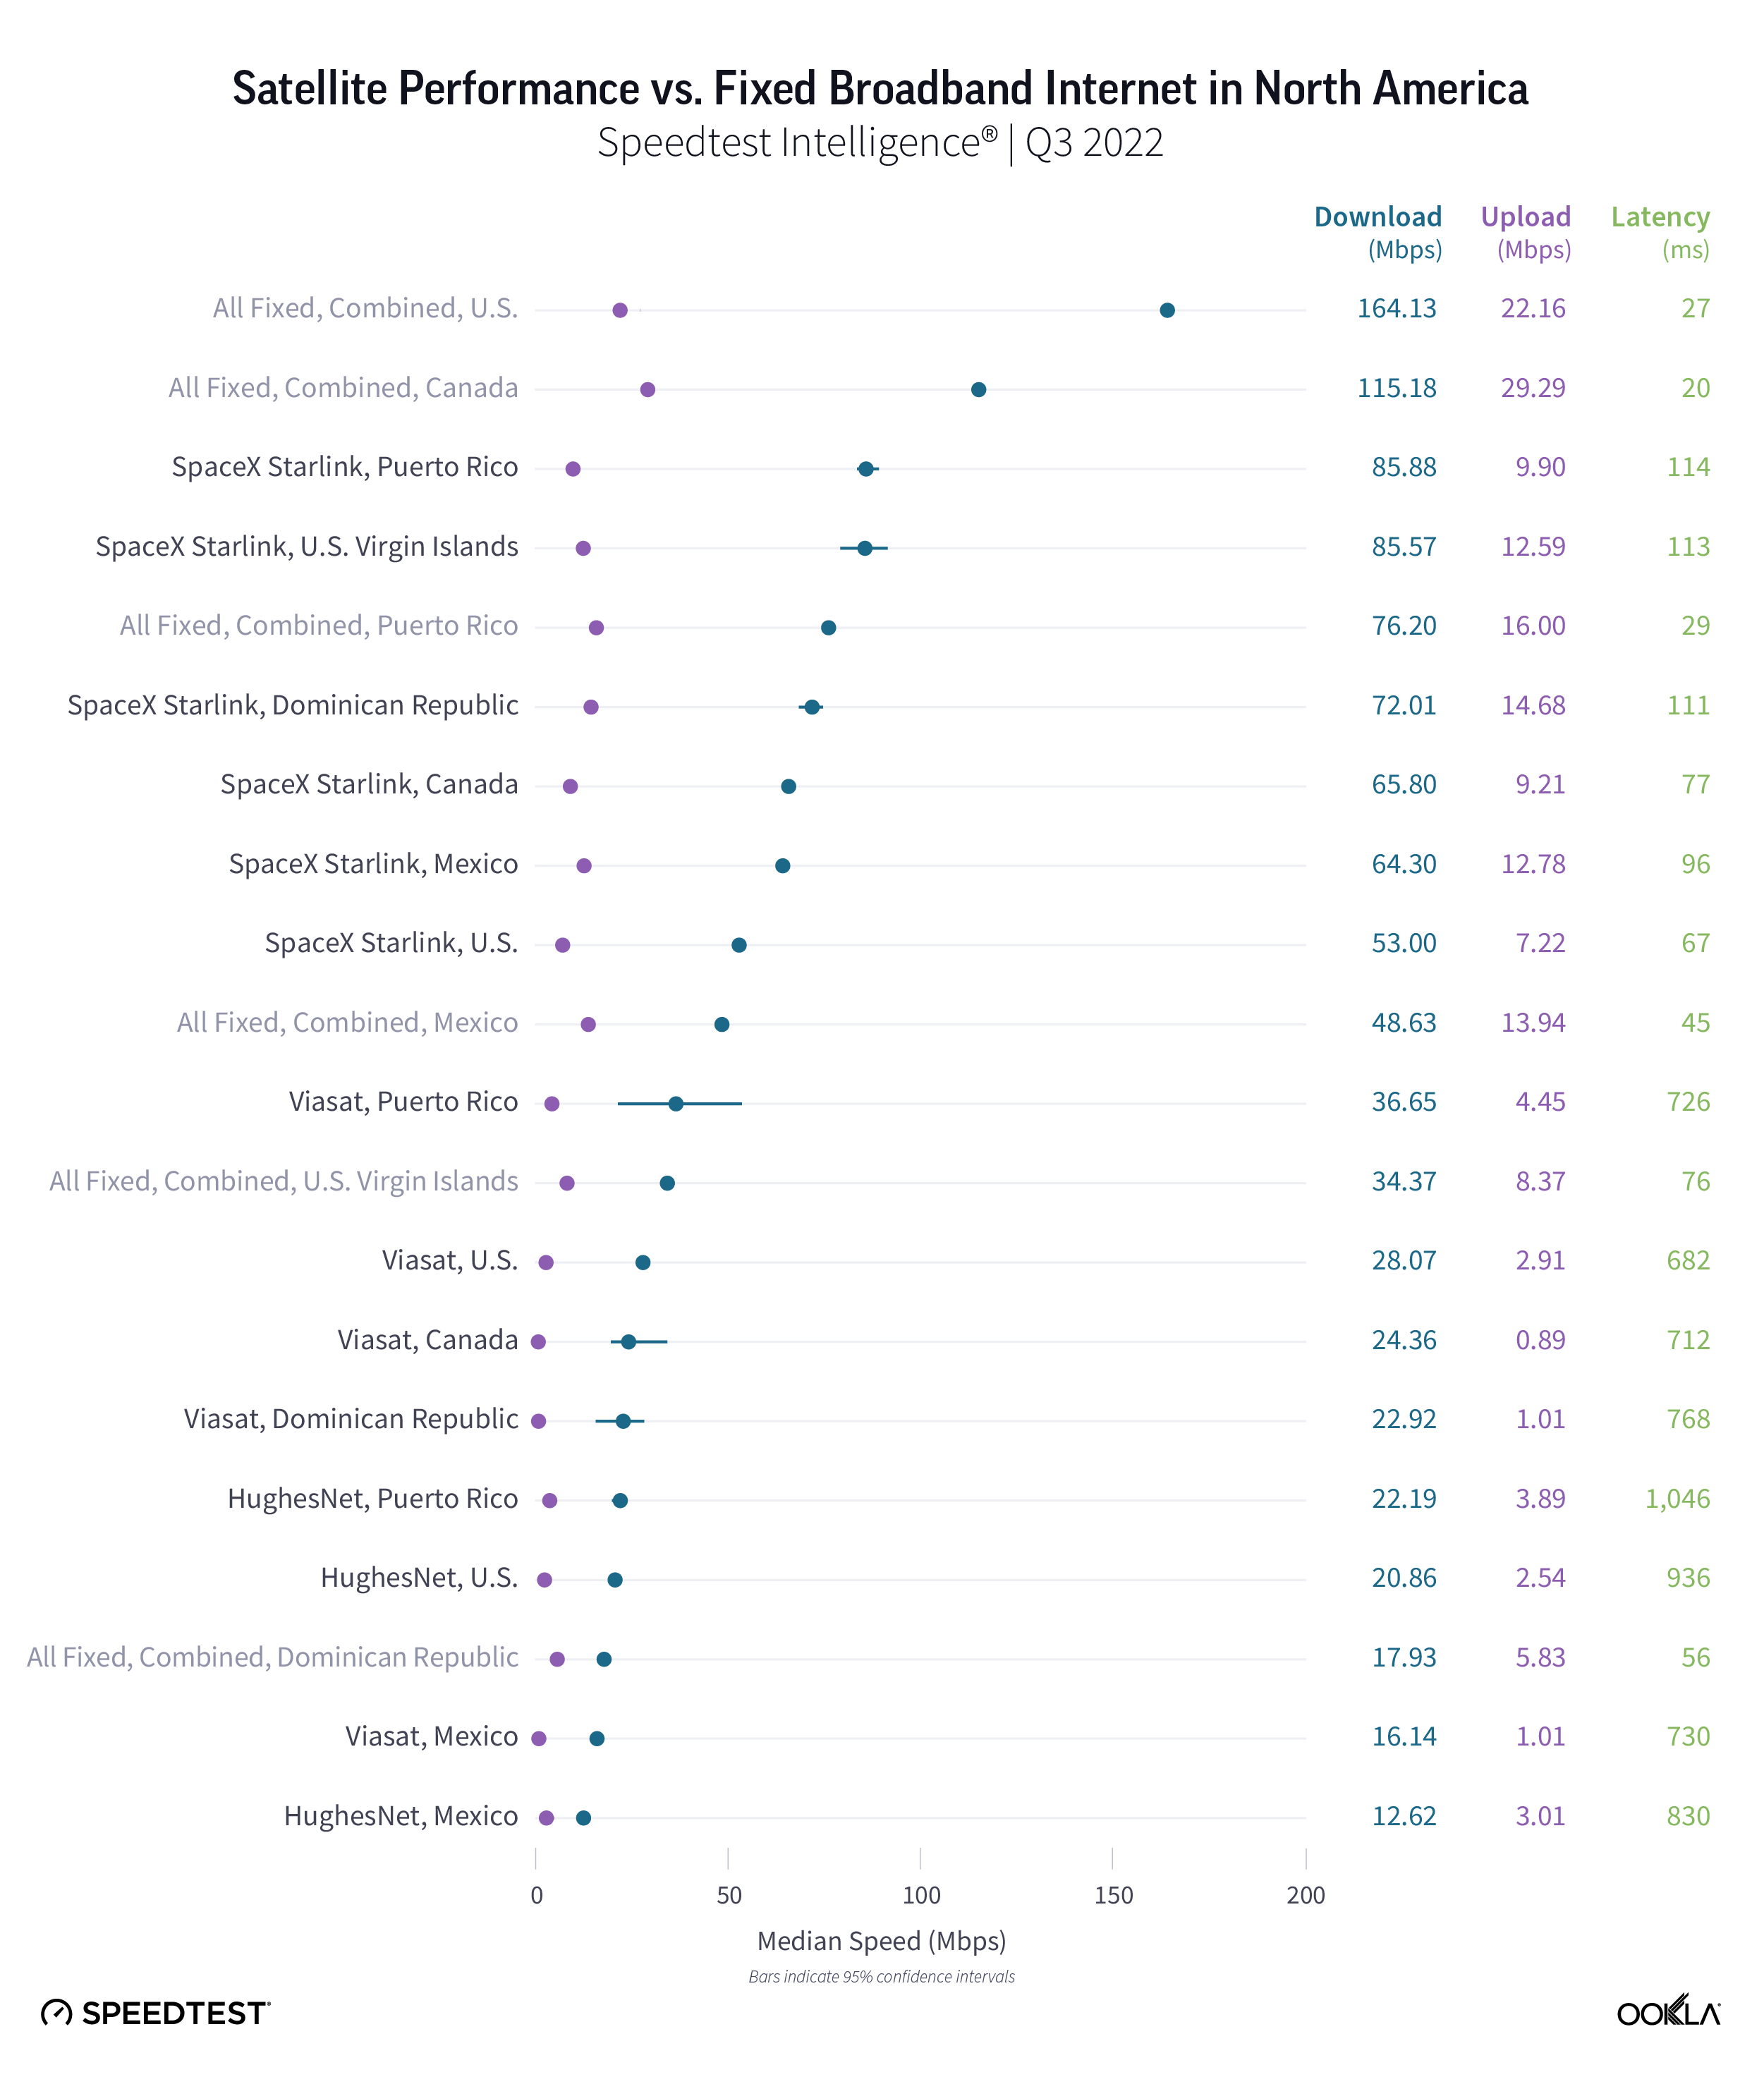
Starlink in Puerto Rico and the U.S. Virgin Islands had the fastest satellite internet in North America
Speedtest Intelligence® reveals that Starlink in Puerto Rico and the U.S. Virgin Islands had the fastest median download speed among satellite providers in North America at 85.88 Mbps and 85.57 Mbps during Q3 2022. Starlink in the Dominican Republic (72.01 Mbps), Canada (65.80 Mbps), Mexico (64.30 Mbps), and the U.S. (53.00 Mbps) followed. Starlink had faster median download speeds than all fixed broadband providers combined in all of these countries except Canada and the U.S., and Viasat outperformed fixed broadband in the Dominican Republic (22.92 Mbps).
Viasat and HughesNet recorded their fastest median download speeds in Puerto Rico at 36.65 Mbps and 22.19 Mbps, respectively. Almost every satellite provider on our list reached speeds fast enough to stream high-quality video at around 20 Mbps, though latency still was much higher than fixed broadband internet.
For upload speeds, Starlink outperformed fixed broadband providers combined in the Dominican Republic (14.68 Mbps to 5.83 Mbps) and the U.S. Virgin Islands (12.59 Mbps to 8.37 Mbps). Fixed broadband providers in Canada had the fastest upload on our list at 29.29 Mbps.
Multi-server latency showed satellite internet’s limits, with the huge distances between satellite and receivers adding up to long lags — and every satellite provider with higher latencies than fixed broadband providers. However, the Dominican Republic and U.S. Virgin Islands still had higher fixed broadband multi-server latencies at 55.45 ms and 76.15 ms, respectively. Starlink in the U.S. had the lowest multi-server latency at 67.16 ms, followed by Canada (77.32 ms), and Mexico (96.42 ms), which were the only satellite options that had a multi-server latency under 100 ms.
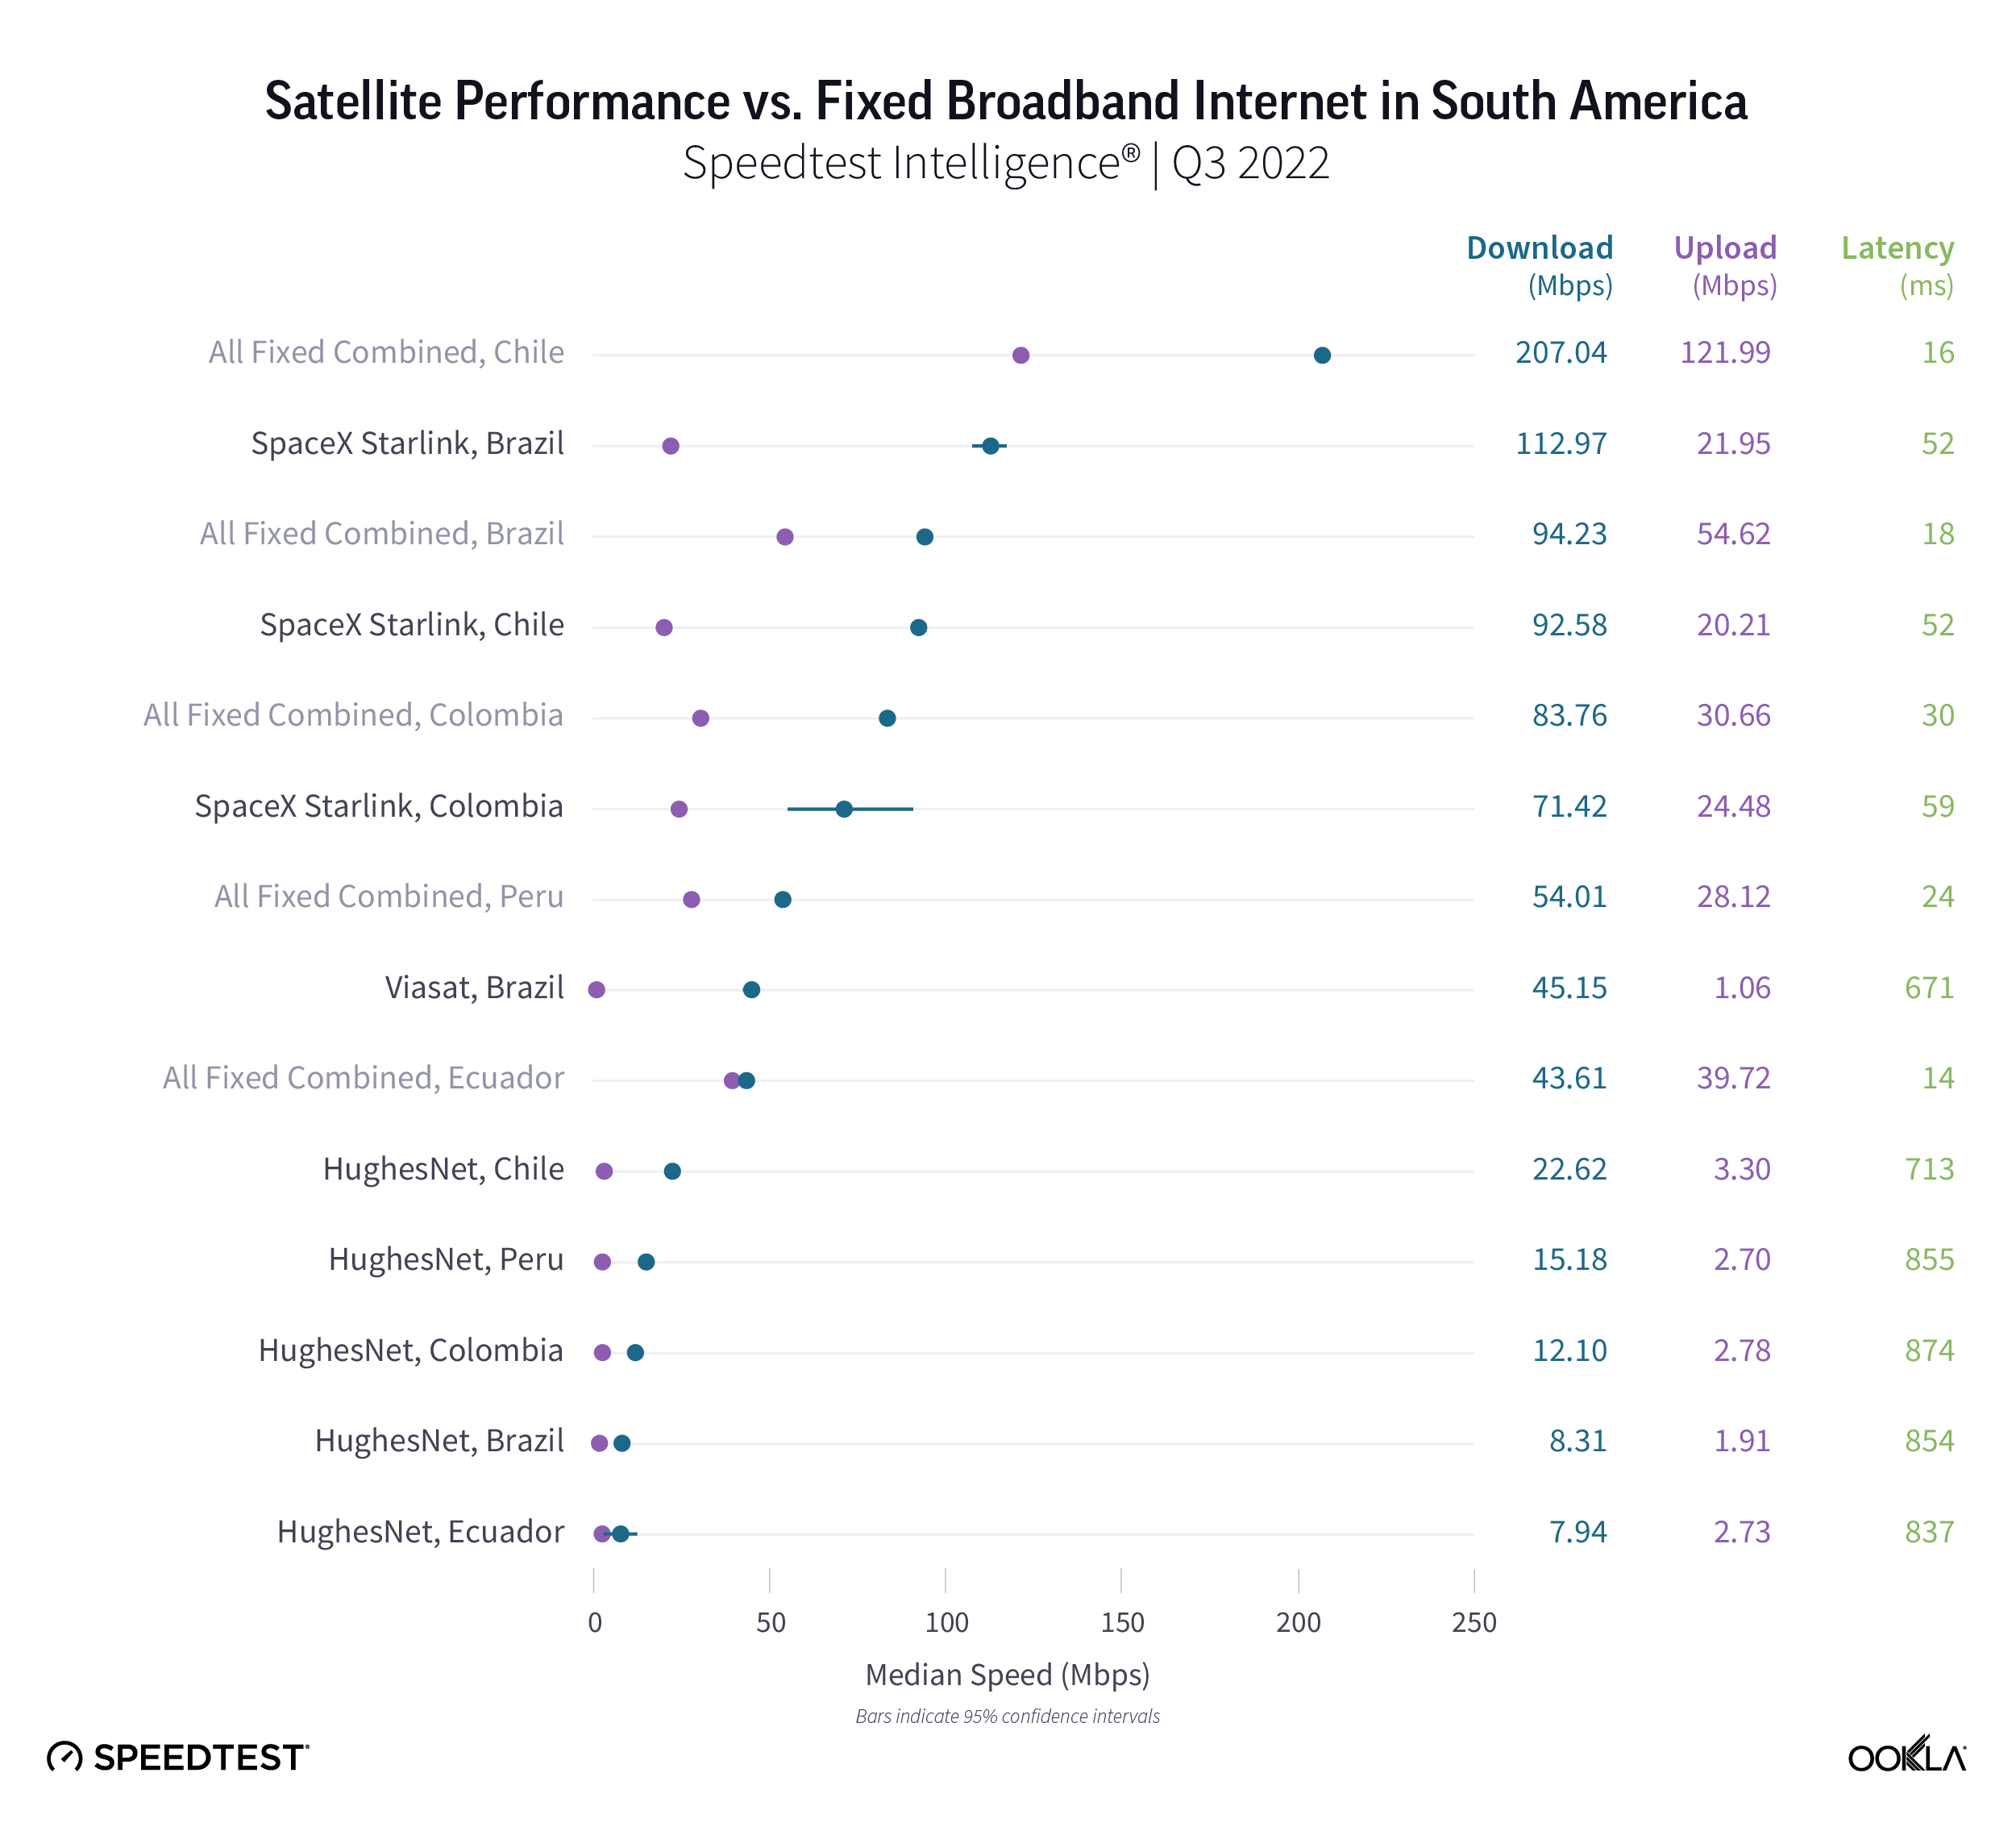
Starlink in Brazil was the fastest satellite provider in South America
Brazilian satellite consumers weren’t lacking for fast internet options during Q3 2022, with Starlink blazing ahead among satellite providers in South America at 112.97 Mbps. Even Viasat notched a respectable median download speed of 45.15 Mbps. Starlink in Brazil was also the only satellite provider to outperform its country’s fixed broadband speeds, with ultrafast fixed broadband in Chile pulling ahead of Starlink 207.04 Mbps to 92.58 Mbps. Colombia was statistically too close to call in Q3 2022 with Starlink at 71.42 Mbps and fixed broadband at 83.76 Mbps. HughesNet trailed far behind with its fastest speed in Chile at 22.62 Mbps during Q3 2022.
For upload speeds, fixed broadband providers in every country we surveyed were faster than their satellite counterparts during Q3 2022. Starlink in Colombia had the fastest upload speed among satellite providers at 24.48 Mbps.
Speedtest Intelligence reveals multi-server latency told a similar story, with every country’s fixed broadband providers having a lower multi-server latency than their satellite counterparts. However, Starlink in Brazil and Chile had the lowest satellite multi-server latencies at 52.21 ms and 52.32 ms, respectively, during Q3 2022. Viasat and HughesNet lowest latencies were far behind with Viasat in Brazil at 670.63 ms and HughesNet in Chile at 713.04 ms.
New Q3 2022 Starlink countries have mixed results
Speedtest Intelligence data shows Starlink data in six new countries during Q3 2022, including Colombia, the Dominican Republic, Estonia, Moldova, Norway, and the U.S. Virgin Islands. Starlink in Estonia (93.48 Mbps), the U.S. Virgin Islands (85.57 Mbps), and the Dominican Republic (72.01 Mbps) were much faster options than fixed broadband providers in their respective countries during Q3 2022. Starlink in Norway (113.86 Mbps) and Colombia (71.42 Mbps) were statistically in the same range as fixed broadband providers in their respective countries during the same time period. Starlink in Moldova (53.11 Mbps) was much slower than all fixed broadband providers combined (105.65 Mbps), though for rural folks with fewer options, still provides a speedy connection.
In all six countries, Starlink underperformed all fixed broadband providers combined for upload speed during Q3 2022, lagging behind from 12.59 Mbps to 24.48 Mbps, while median fixed broadband upload speeds ranged from 30.66 Mbps to 93.80 Mbps.
Multi-server latency was generally much higher than fixed broadband, with Starlink in Colombia showing the lowest multi-server latency at 58.65 ms, followed by Norway (73.00 ms), Estonia (85.37 ms), Moldova (105.26 ms), the Dominican Republic (110.62 ms), and the U.S. Virgin Islands (113.12 ms).
The great space race is on
There is no doubt a new space race for connectivity is being waged across the world. Competitors are pouring hundreds of millions and even billions into unlocking the celestial connectivity dilemma. Here are some major updates about what’s next for various different satellite competitors:
Eutelsat’s proposed merger with OneWeb, which seems to be making progress forward, has the potential to disrupt satellite connectivity and give consumers more internet options across the globe.
Starlink is entering into the RV and private jet markets.
The European Commission is still looking into creating their own LEO network.
With the competition for satellite connectivity heating up and Starlink facing potentially more competition in the coming months, we’ll be keeping our eyes to the sky to see how connectivity is performing. We’ll continue our series next quarter with Q3-Q4 2022 data from Europe and Oceania and any new countries where Starlink launches, and be back with North and South America data in Q2 2023. In the meantime, be sure to download the Speedtest app for Windows and Mac computers or for iOS or Android for devices and see how your satellite internet stacks up to our findings.
Ookla retains ownership of this article including all of the intellectual property rights, data, content graphs and analysis. This article may not be quoted, reproduced, distributed or published for any commercial purpose without prior consent. Members of the press and others using the findings in this article for non-commercial purposes are welcome to publicly share and link to report information with attribution to Ookla.
Ookla® has covered SpaceX’s Starlink satellite internet for over a year now with our ongoing series on satellite internet performance. We’ve seen Starlink launch in new locations across the world, and while some speeds have shown signs of slowing down from their initial launches, the newly announced T-Mobile partnership with Starlink could extend the benefit of satellite connections to the mobile market.
Today, we have fresh data on satellite performance during Q2 2022 in Europe, Oceania, North America, and South America. This analysis includes results from eight additional countries, two new providers, and expanded data for Starlink, HughesNet, and Viasat. We also examine how Starlink’s internet performance has changed over the past year in Canada, France, Germany, New Zealand, the United Kingdom, and the United States.
Starlink speeds decreased in every country we surveyed over the past year as more users sign up for service
Speedtest Intelligence® reveals that median download speeds for Starlink fell across Canada, France, Germany, New Zealand, the U.K, and the U.S., dropping between 9% and 54% from Q2 2021 to Q2 2022 as more users signed up for the service. However, Starlink still reached a median download speed of at least 60 Mbps in North America during Q2 2022, which is more than enough for at least one connected device to do most everything on the internet including streaming video, downloading games, and chatting on video with friends and family.
Upload speeds also slowed on Starlink, with speeds decreasing across all of the countries we’ve tracked over the past year. Latency fared a little better with latency remaining relatively flat (though high when compared to fixed broadband) in most countries. New Zealand was the outlier, with latency dropping 23 ms. For most users, we still suspect these dips are still worthwhile for areas that have no service, slow service, or few affordable options for fast internet.
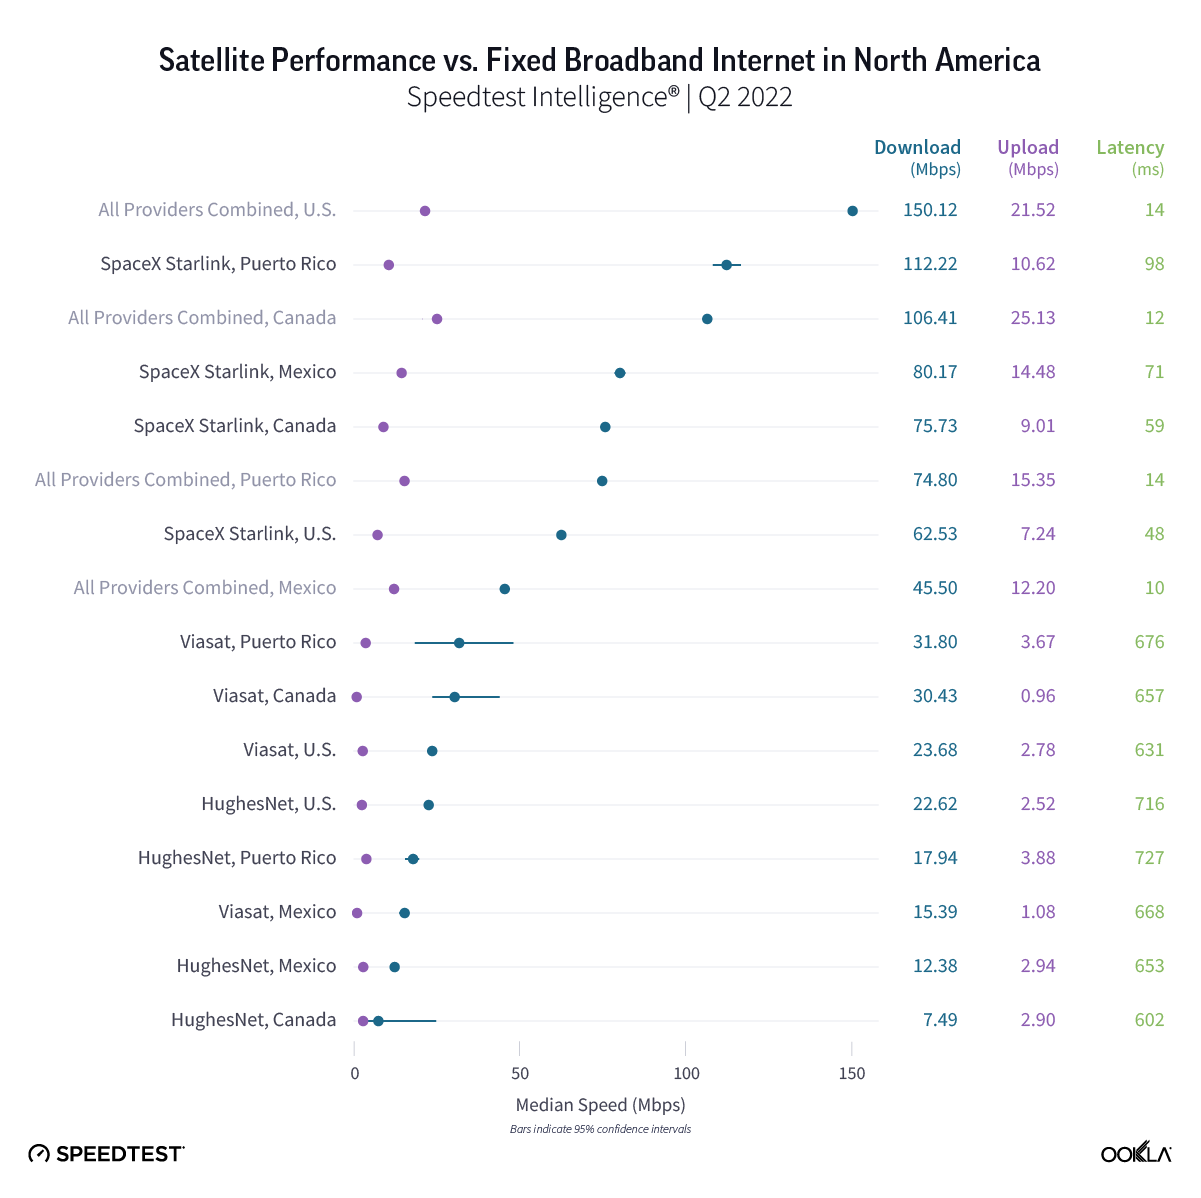
Starlink in Puerto Rico was the fastest satellite provider in North America
Starlink in Puerto Rico had the fastest satellite internet in North America during Q2 2022 with a median download speed of 112.22 Mbps, followed by Starlink in Mexico (80.17 Mbps), Canada (75.73 Mbps), and the U.S. (62.53 Mbps). Starlink in Puerto Rico and Mexico was faster than their countries’ fixed broadband providers combined (74.80 Mbps and 45.50 Mbps, respectively), while fixed broadband in the U.S. (150.12 Mbps) and Canada (106.41 Mbps) was faster than each country’s satellite providers.
In every country except Mexico, fixed broadband upload speeds were faster than satellite speeds. Starlink in Mexico edged out fixed broadband providers 14.48 Mbps to 12.20 Mbps. Latency was higher for every satellite provider compared to fixed broadband. Starlink in the U.S. had the lowest median latency among satellite providers at 48 ms.
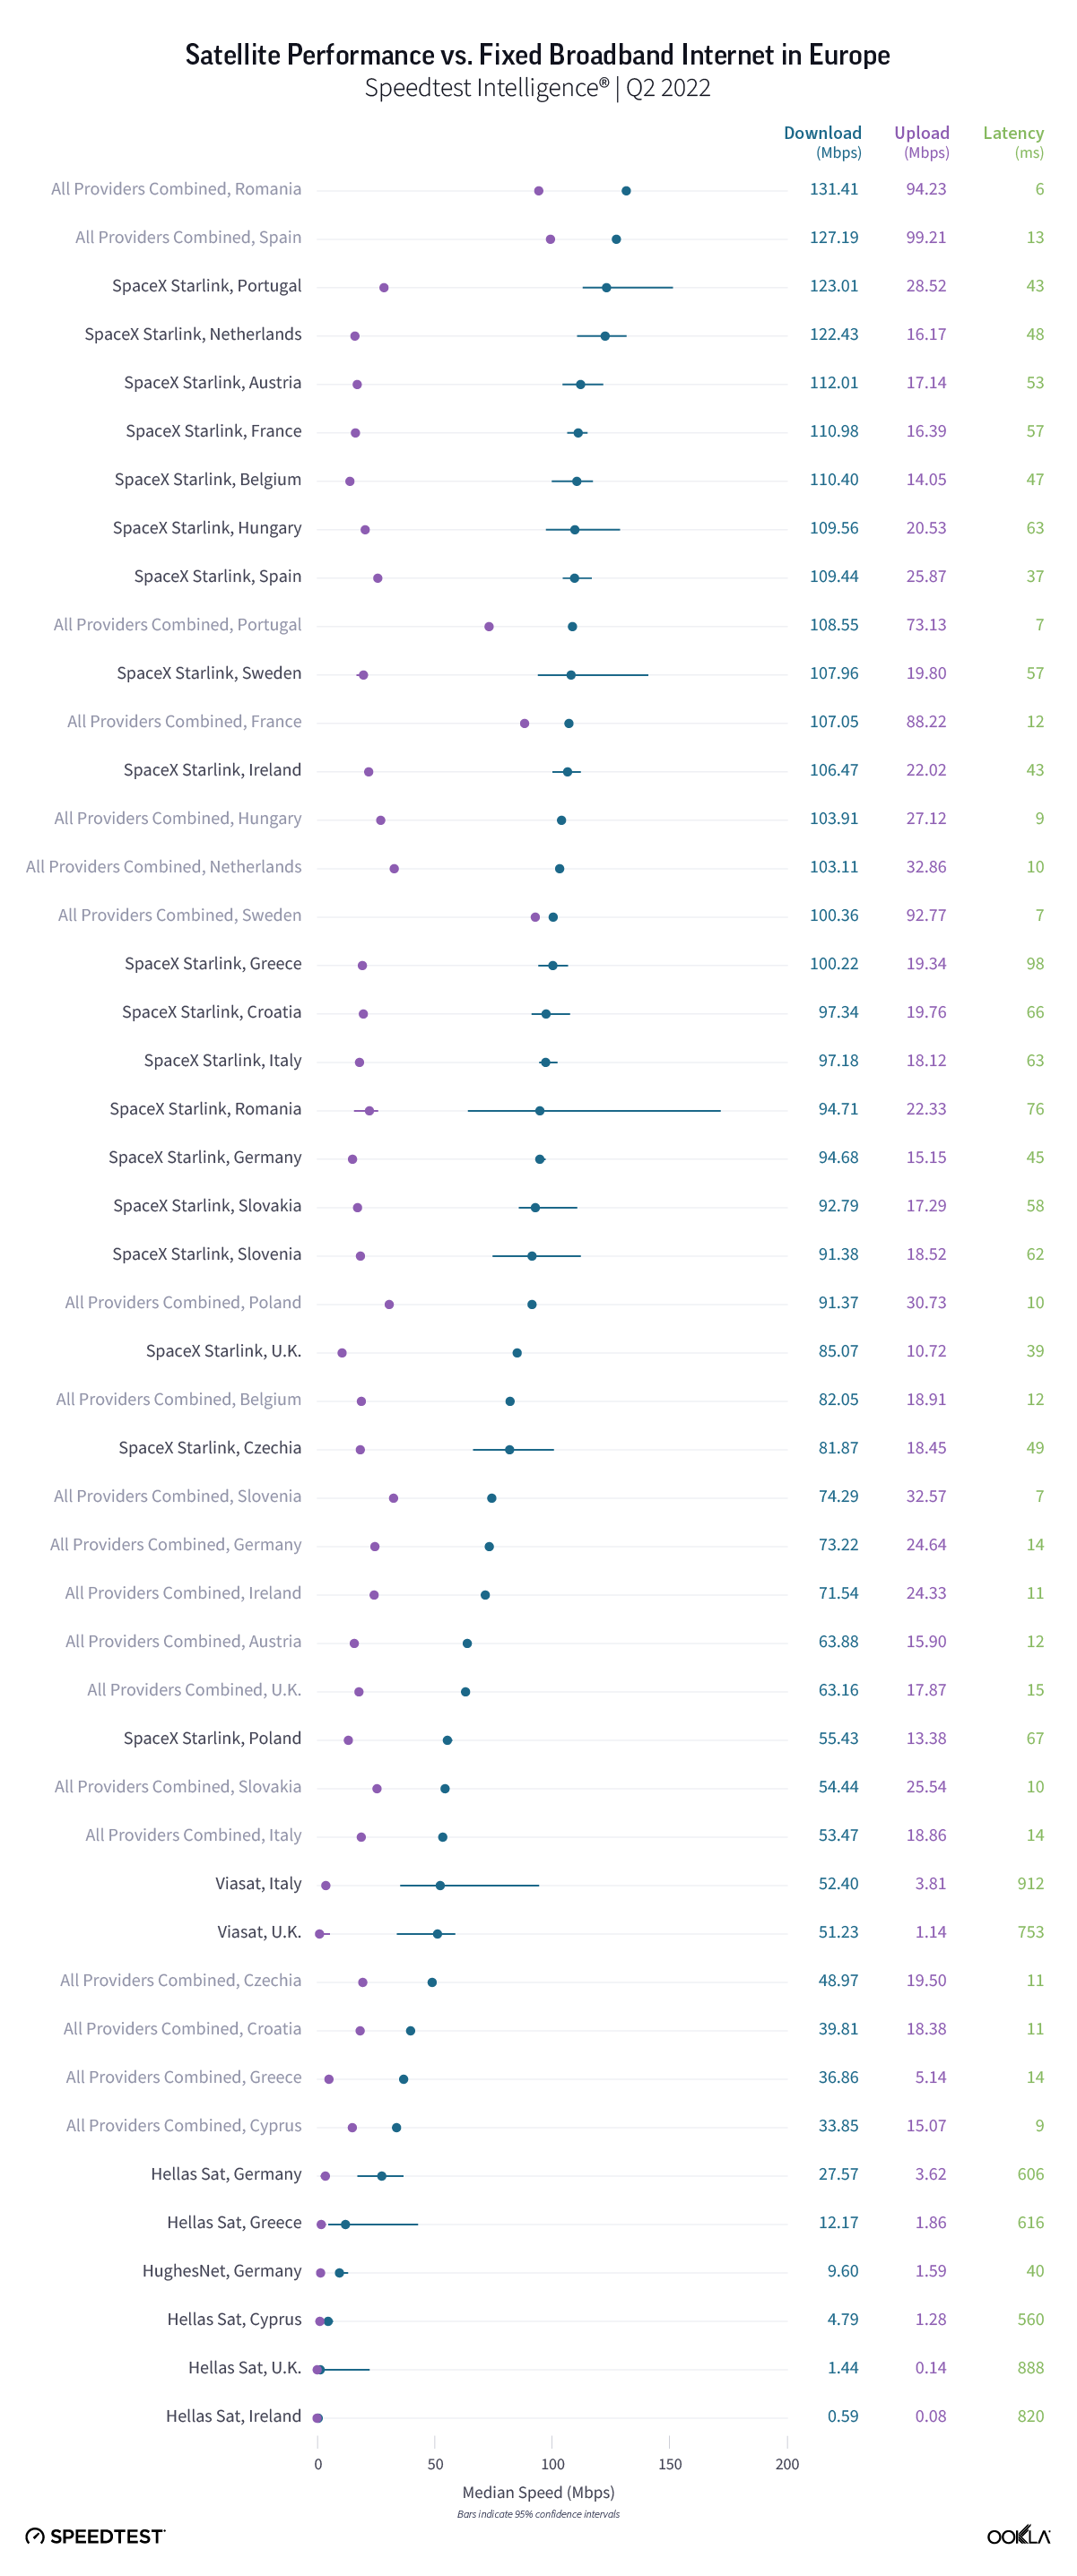
Starlink outperformed fixed broadband average in 16 European countries
Speedtest Intelligence shows Starlink was fast in Europe during Q2 2022, outperforming fixed broadband median download speed in 16 countries and reached download speeds over 100 Mbps in 10 countries. In contrast, fixed broadband only achieved median download speeds over 100 Mbps in six countries: Romania, Spain, Portugal, France, Hungary, and the Netherlands during Q2 2022. Starlink was fastest for median download speed in Portugal at 123.01 Mbps, the Netherlands (122.43 Mbps), Austria (112.01 Mbps), France (110.98 Mbps), and Belgium (110.40 Mbps). Romania and Spain were the only countries to have fixed broadband beat Starlink for fastest median download speed, achieving 131.41 Mbps and 127.19 Mbps, respectively.
For upload, Starlink in Greece and Austria was the only satellite provider to achieve faster upload speeds than all fixed broadband providers combined at 19.34 Mbps to 5.14 Mbps, and to 17.14 Mbps to 15.90 Mbps, respectively. Fixed broadband providers in Spain (99.21 Mbps), Romania (94.23 Mbps), Sweden (92.77 Mbps), France (88.22 Mbps), Lithuania (83.54 Mbps), and Portugal (73.13 Mbps) all recorded median upload speeds greater than 70 Mbps, with the closest satellite provider being Starlink in Portugal at 28.52 Mbps.
All satellite providers fell far behind fixed broadband providers in the whole of Europe for latency during Q2 2022. Starlink in Spain and the United Kingdom recorded the lowest satellite latencies at 37 ms and 39 ms, respectively — still a far cry from the closest fixed broadband latency, which was 14 ms in Germany, Greece, and Italy.
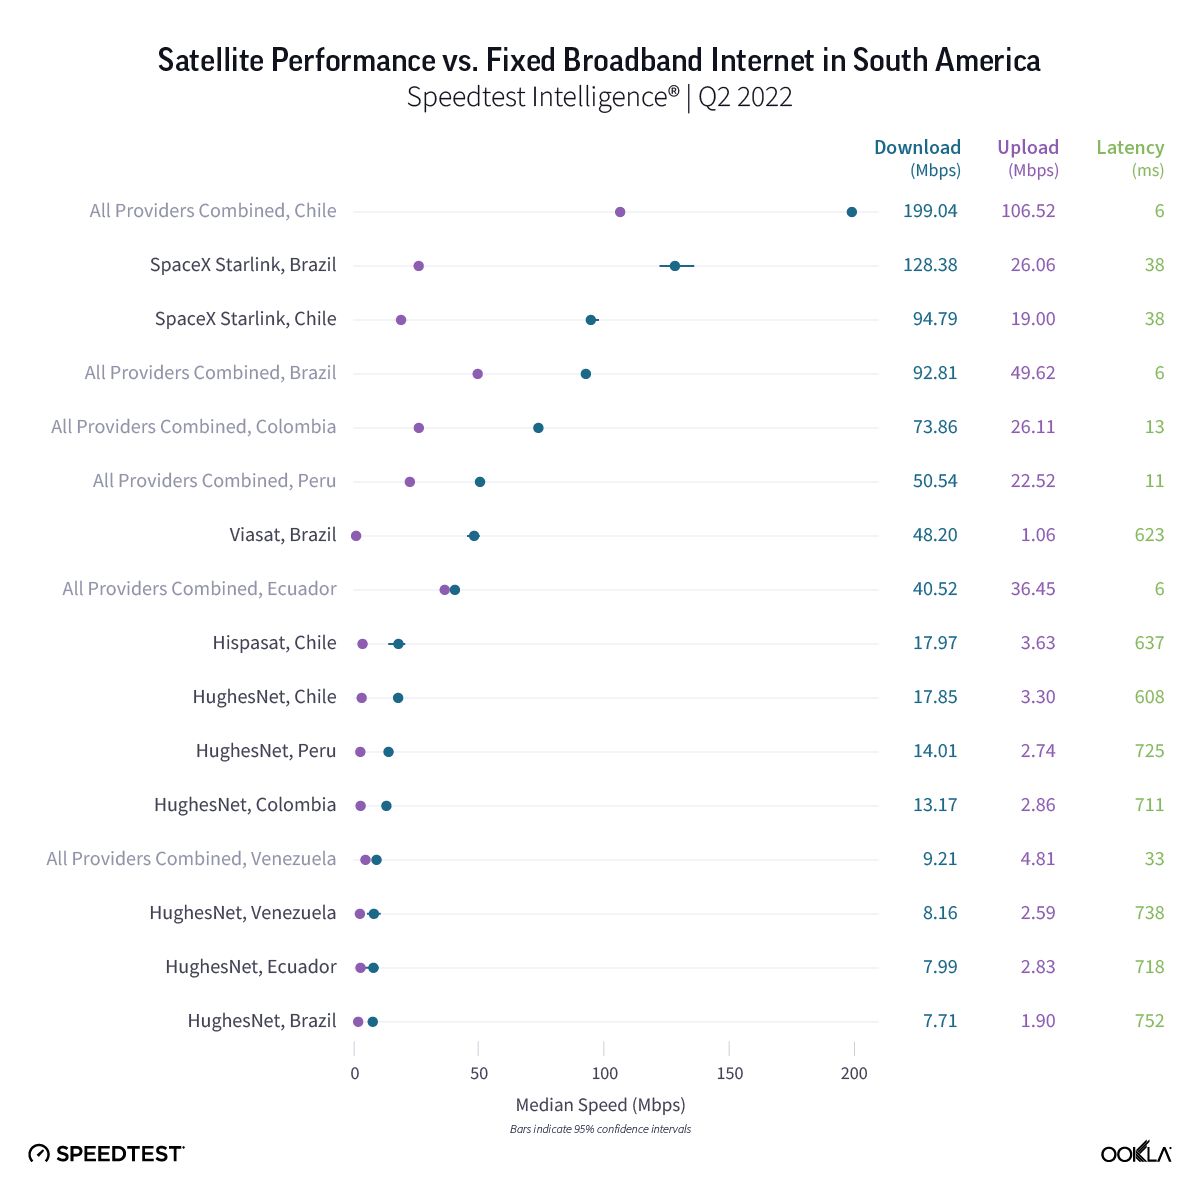
Starlink in Brazil was the fastest satellite provider in South America
Our analysis of Speedtest Intelligence data found Starlink in Brazil was the fastest satellite provider in South America with a median download speed of 128.38 Mbps during Q2 2022, followed by Starlink in Chile at 94.79 Mbps. Chilean fixed broadband internet was still much faster for those who could get access to it. The Speedtest Global Index™ found Chile had the second fastest fixed broadband internet in the world with a median download speed of 211.43 Mbps during August 2022. Starlink in Brazil was the only satellite provider to be faster than its country’s fixed broadband providers combined.
Like last quarter, South American fixed broadband providers surpassed satellite providers in each respective upload speeds during Q2 2022. All satellite providers had a higher median latency than fixed broadband, though Starlink in Brazil and Chile had latencies of 38 ms.
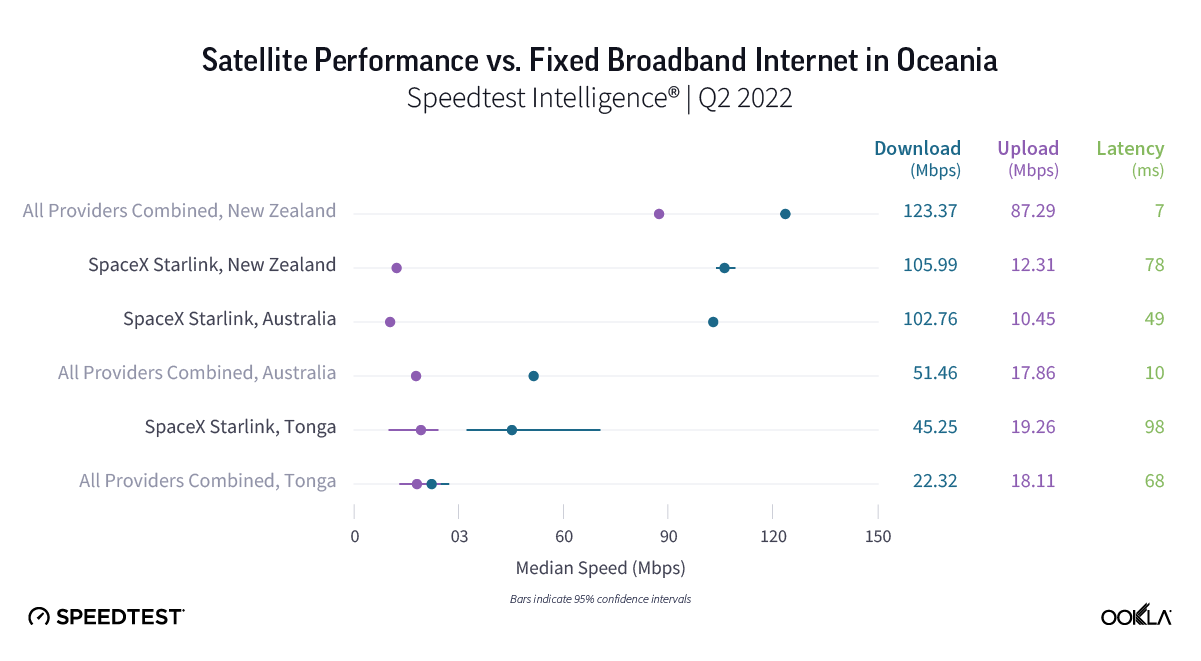
Starlink in New Zealand was the fastest satellite provider in Oceania
Starlink’s fastest median download speed in Oceania was in New Zealand at 105.99 Mbps, though this still fell short of fixed broadband providers in the country. Starlink in Australia was faster than fixed broadband providers by a wide margin at 102.76 Mbps to 51.46 Mbps during Q2 2022. Starlink outperformed fixed broadband providers in new-to-our-list Tonga 45.25 Mbps to 22.32 Mbps.
New Zealand’s fixed broadband dominated for the fastest median upload speed in Oceania at 87.29 Mbps during Q2 2022, while Australia’s fixed broadband fell far behind with an upload speed of 17.86 Mbps. Both speeds were still faster than Starlink’s median upload speeds in New Zealand and Australia (12.31 Mbps and 10.45 Mbps, respectively). Tonga didn’t have a statistical winner for fastest upload speed, but Starlink reached 19.26 Mbps and fixed broadband 18.11 Mbps. Fixed broadband also had a lower median latency than Starlink during Q1 2022, which clocked in at 49 ms in Australia, 78 ms in New Zealand, and 98 ms in Tonga.
Biggest questions lie ahead, but competition will be good for consumers
Satellite connectivity is coming to mobile, with Starlink’s new partnership with T-Mobile and new mobile devices becoming satellite enabled. This will cause ripples across North America, which is a net positive for consumers who live in areas with low mobile and fixed broadband connectivity. Connecting with the world won’t be a question of how anymore, it will be a question of how good your experience is. That’s hopefully a win-win for consumers, especially as more providers vie for the fastest and best satellite experience — a true global space race.
Ookla retains ownership of this article including all of the intellectual property rights, data, content graphs and analysis. This article may not be quoted, reproduced, distributed or published for any commercial purpose without prior consent. Members of the press and others using the findings in this article for non-commercial purposes are welcome to publicly share and link to report information with attribution to Ookla.
It’s been a year since we first examined SpaceX’s Starlink satellite internet, which launched its public beta in November 2020. Today we’re updating our ongoing series on satellite internet performance with data from Q1 2022 in Europe, Oceania, North America, and South America, including results from 10 additional countries. We’re also examining how Starlink’s internet performance has changed over the past year in the United States and Canada.
Starlink speeds increased nearly 58% in Canada and 38% in the U.S. over the past year
Speedtest Intelligence® reveals that median download speeds for Starlink dramatically increased from Q1 2021 to Q1 2022 in the U.S. and Canada, as did speeds for all fixed broadband providers combined. In the U.S., Starlink median download speeds improved roughly 38% from 65.72 Mbps in Q1 2021 to 90.55 Mbps in Q1 2022. In Canada, Starlink’s download speed leapt ahead nearly 58% from 61.84 Mbps to 97.40 Mbps during the same time period.
However, Speedtest Intelligence also showed that upload speeds for Starlink decreased at least 33% in the U.S. (16.29 Mbps in Q1 2021 to 9.33 Mbps in Q1 2022) and at least 36% in Canada (16.69 Mbps to 10.70 Mbps) during the same time period. Median latency on Starlink marginally increased from 40 ms to 43 ms in the U.S. and from 51 ms to 55 ms in Canada during the past year. For many Starlink users, we suspect these changes are negligible.
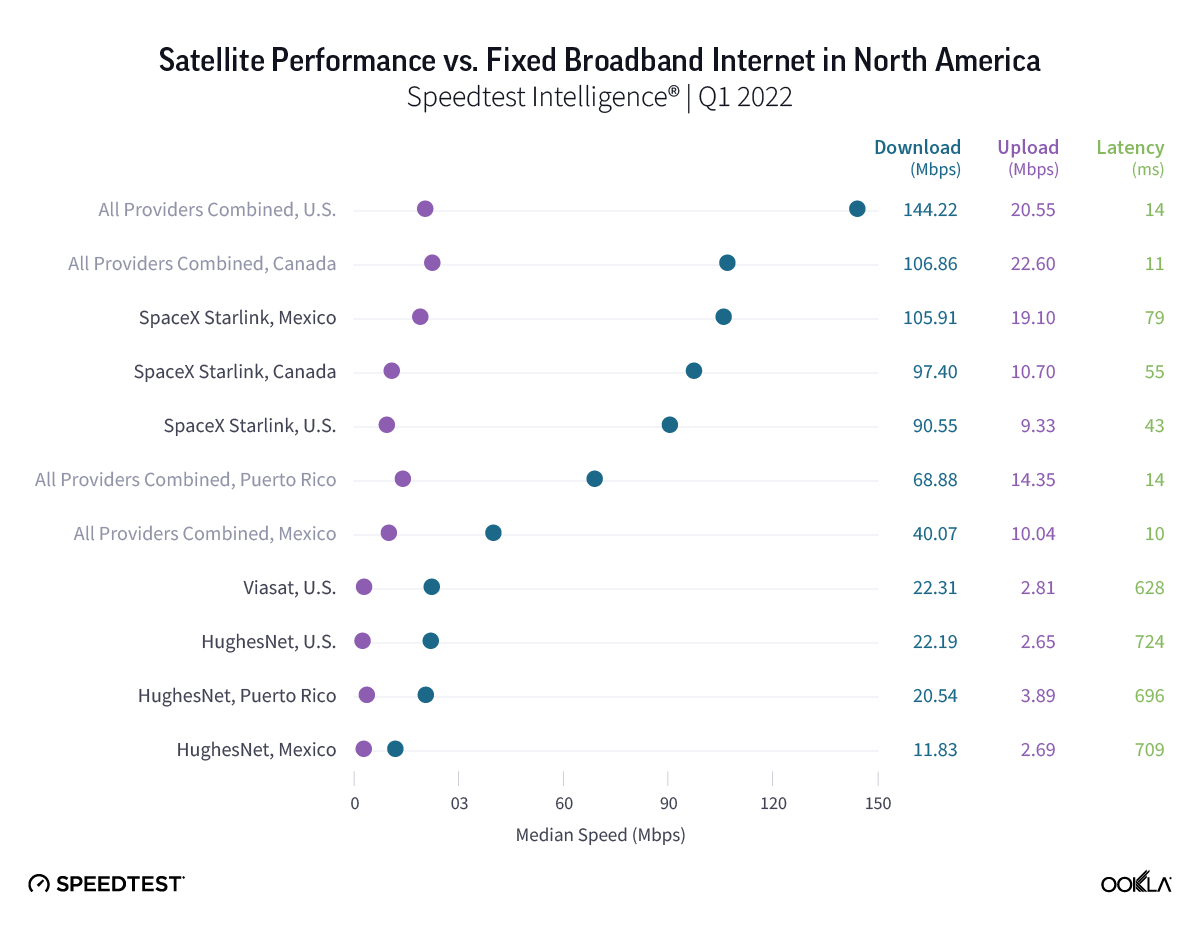
Starlink in Mexico was the fastest satellite provider in North America
Starlink in Mexico had the fastest satellite internet in North America during Q1 2022 with a median download speed of 105.91 Mbps, followed by Starlink in Canada (97.40 Mbps) and the U.S. (90.55 Mbps). Mexico’s fixed broadband download speed (40.07 Mbps) was much slower than Starlink, while Starlink download speeds were slower than fixed broadband for all providers combined in the U.S. (144.22 Mbps) and Canada (106.86 Mbps). Puerto Rico, new to our list, showed HughesNet had the fastest satellite internet on the island territory at 20.54 Mbps, though fixed broadband was much faster at 68.88 Mbps.
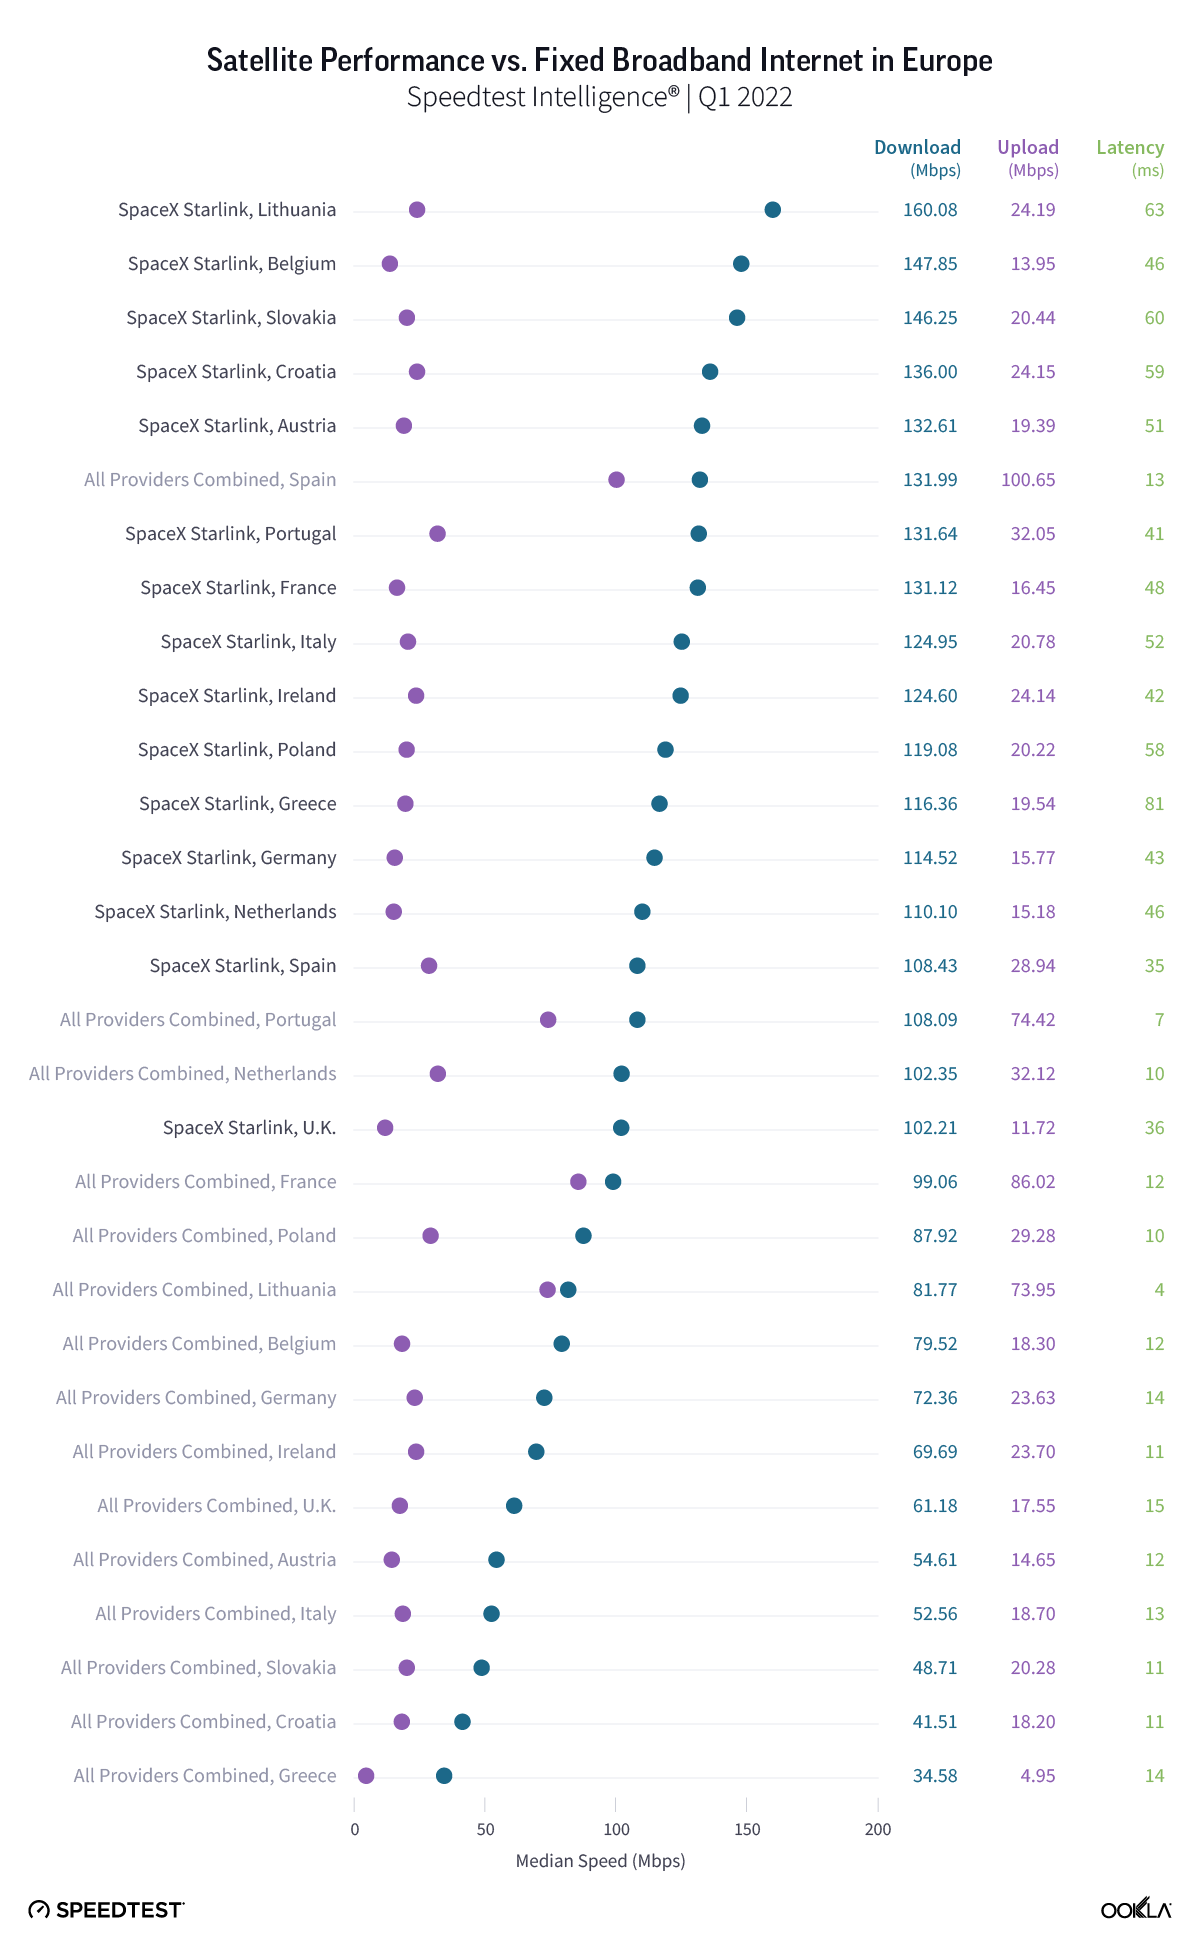
Starlink in Lithuania was the fastest satellite provider in Europe
Speedtest Intelligence showed that Starlink blazed ahead in Europe during Q1 2022, with Starlink achieving a 100+ Mbps median download speed in every country where it was commercially available. In contrast, fixed broadband only achieved median download speeds over 100 Mbps in Spain, Portugal, and the Netherlands during Q1 2022. Starlink was fastest for download speed in Lithuania at 160.08 Mbps, followed by Belgium (147.85 Mbps), Slovakia (146.25 Mbps), Croatia (136.00 Mbps), and Austria (132.61 Mbps). Spain was the only country to have its fixed broadband beat Starlink for fastest median download speed, achieving 131.99 Mbps to Starlink’s 108.43 Mbps within the country.
For upload, fixed broadband providers in Spain (100.65 Mbps), France (86.02 Mbps), Portugal (74.42 Mbps), and Lithuania (73.95 Mbps) all recorded median speeds greater than 70 Mbps, while the closest satellite provider, Starlink in Portugal, trailed at 32.05 Mbps.
All satellite providers fell far behind fixed broadband providers in the whole of Europe for latency during Q1 2022, with Starlink in Spain and the United Kingdom recording the highest satellite latencies at 35 ms and 36 ms, respectively — a far cry from the lowest fixed broadband latency, which was 15 ms in the U.K.
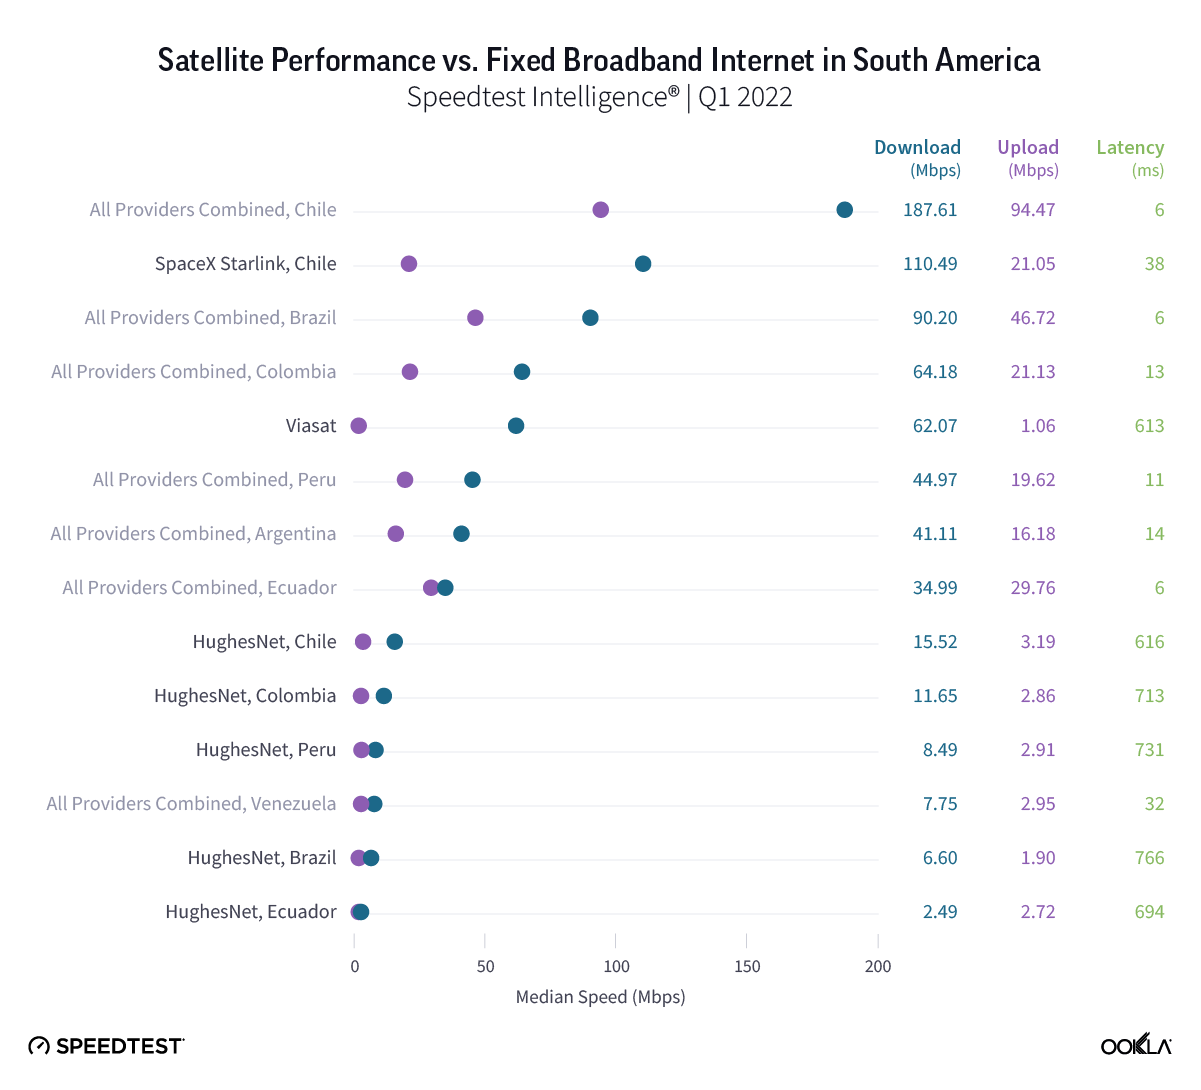
Starlink in Chile was the fastest satellite provider in South America
Our analysis of Speedtest Intelligence data found Starlink in Chile was the fastest satellite provider in South America with a median download speed of 110.49 Mbps during Q1 2022. Although Chilean fixed broadband internet was much faster for those who could get access to it. In fact, during May 2022, the Speedtest Global Index™ found Chile had the second fastest fixed broadband internet in the world with a median download speed of 206.97 Mbps, just a hair shy of Singapore’s first place speed of 209.21 Mbps.
No South American satellite provider surpassed its country’s fixed broadband download or upload speeds during Q1 2022. Viasat in Brazil had a noteworthy median download speed of 62.07 Mbps, though still fell short of the country’s fixed broadband speed of 90.20 Mbps. All satellite providers had a higher median latency than fixed broadband, though Starlink in Chile had a latency of 38 ms.
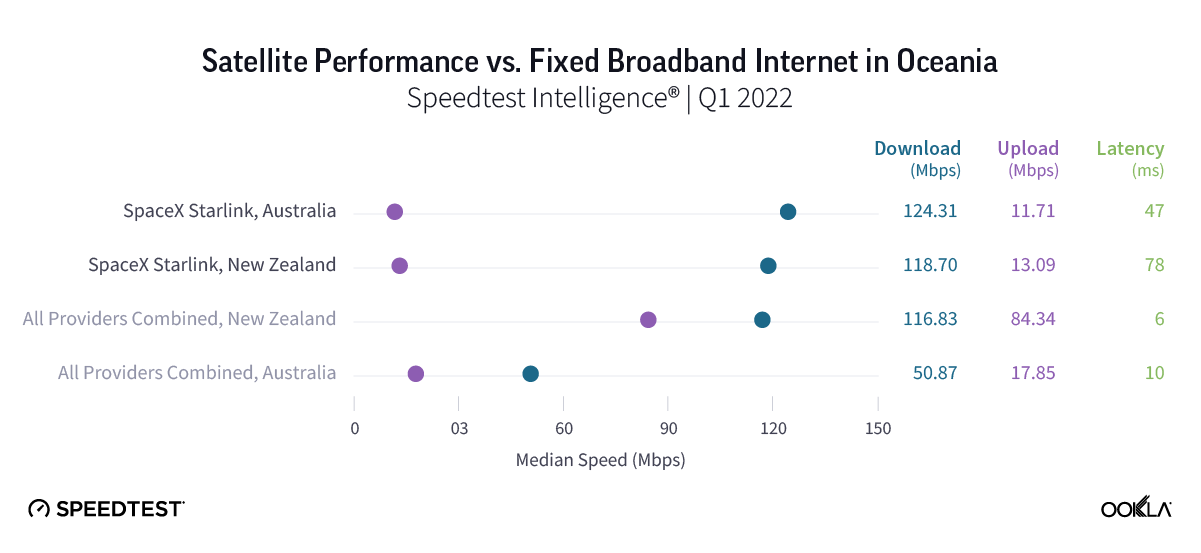
Starlink in Australia was the fastest satellite provider in Oceania
Starlink raced ahead in Oceania, recording faster median download speeds than fixed broadband in both Australia and New Zealand. In Australia, Starlink had a median download speed of 124.31 Mbps, much faster than Australian fixed broadband at 50.87 Mbps for download during Q1 2022. The comparison in New Zealand was much closer with Starlink’s median download speed at 118.70 Mbps and fixed broadband at 116.83 Mbps during Q1 2022.
New Zealand’s fixed broadband dominated for the fastest median upload speed in Oceania at 84.34 Mbps during Q1 2022, while Australia’s fixed broadband fell far behind with an upload speed at 17.85 Mbps. Both speeds were still faster than Starlink’s median upload speeds in New Zealand and Australia (13.09 Mbps and 11.71 Mbps, respectively). Fixed broadband also had a faster median latency than Starlink during Q1 2022, which clocked in at 47 ms in Australia and 78 ms in New Zealand.
Consumers are flocking to Starlink, but competitors are close behind
As we’ve continued to see over the past year, Starlink’s low-earth orbit satellites (LEOs) provide a life-changing service for consumers in rural areas that might not otherwise have access to high-speed internet. However, more companies are looking to compete with Starlink and launch their own LEO constellations, including Amazon’s Project Kuiper, which recently received FCC permission to test their own satellite service and is slated to launch later this year, and Viasat which is set to merge with Inmarsat and launch new constellations by 2023.
We’ll continue to monitor the skies in our ongoing satellite series, but if you’re using satellite internet, take a Speedtest® to help us provide an accurate and more complete picture of real-world performance.
Editor’s note: This article was amended on June 28 to clarify percentage increases in the U.S. and Canada and to update the percent change for upload for Canada.
Ookla retains ownership of this article including all of the intellectual property rights, data, content graphs and analysis. This article may not be quoted, reproduced, distributed or published for any commercial purpose without prior consent. Members of the press and others using the findings in this article for non-commercial purposes are welcome to publicly share and link to report information with attribution to Ookla.
More than 80% of Canadians have access to fixed broadband networks, but for rural Canadians that figure drops to just 60%. Yet, this gap between who has broadband access and who doesn’t is closing in rural areas at a rate nearly three times faster than in urban areas. Canada is narrowing its rural broadband divide thanks to a clearly articulated and well-funded connectivity strategy to ensure high-speed internet access for all.
Using Speedtest Intelligence® data, this report identifies Canada’s Provinces and Territories that are delivering the minimum standard for fixed broadband speeds, as established by the Canadian Radio-television and Telecommunications Commission (CRTC). Based on data from the 1H 2024 (and compared to 1H 2023), it also analyzes performance in other geographic splits, including Urban-vs-Rural and the Remoteness Index.
Key Takeaways
As many as 2 million more Canadians enjoyed broadband speeds in the first half of 2024 compared to the first half of 2023.
Rural Canadian Speedtest users saw a 23% increase in those with broadband speeds in 1H 2024over 1H 2023.
Satellite internet service plays a key role in closing the broadband divide for Canada’s vast geography. In the U.S., regulators were ambivalent about allowing satellite internet to qualify for government broadband funding (this attitude has recently begun to change in favor). Canada knew many years ago that satellite internet was critical.
Broadband in the Spotlight
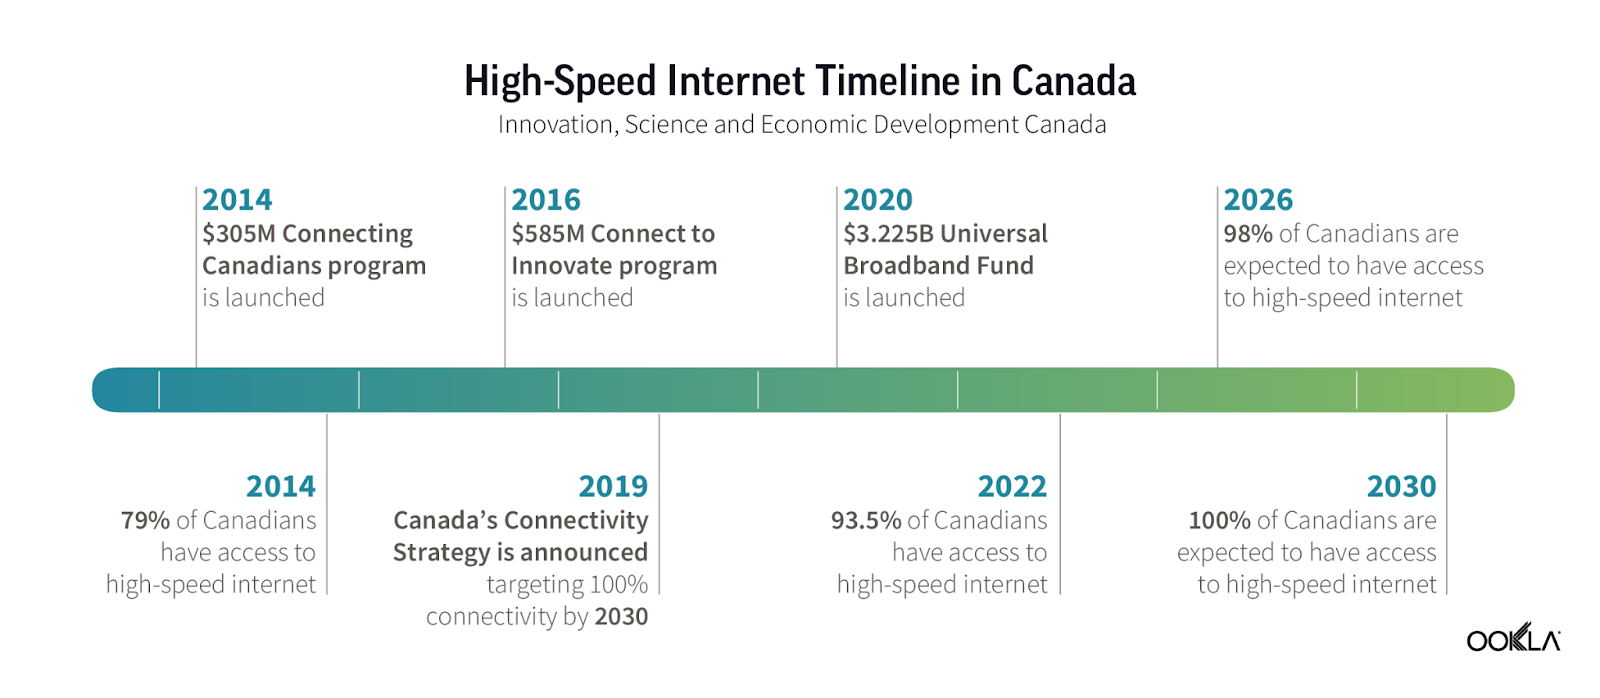
While the COVID-19 pandemic shined a light on the digital divide, the government of Canada has long been investing in broadband deployments to close the gap. In 2014 it established the Connecting Canadians program (CCP), allocating C$305M to improve connectivity for 300,000 underserved households.
The Connect to Innovate (CTI) program was launched in December 2016 with C$500M (and C$85M added to CTI in 2019) to expand high-speed Internet in communities underserved by the private sector. The CTI aimed to improve access for over 380,000 homes.
Deepening its investments in 2020, perhaps in response to COVID-19 lockdowns, the Canadian government launched the C$3.225B Universal Broadband Fund (UBF).
UBF
Universal Broadband Fund (2020)
$3.225B
CTI
Connect To Innovate (2016)
$585M
CCP
Connecting Canadians Program (2014)
$305M
With over C$4B from these programs alone, the CRTC has a goal of connecting 98% of Canadians to high-speed internet (broadband) delivering at least 50 Mbps download (DL) and 10 Mbps upload (UL) speeds (50/10 Mbps) by 2026, and 100% by 2030.
Conquer Divide
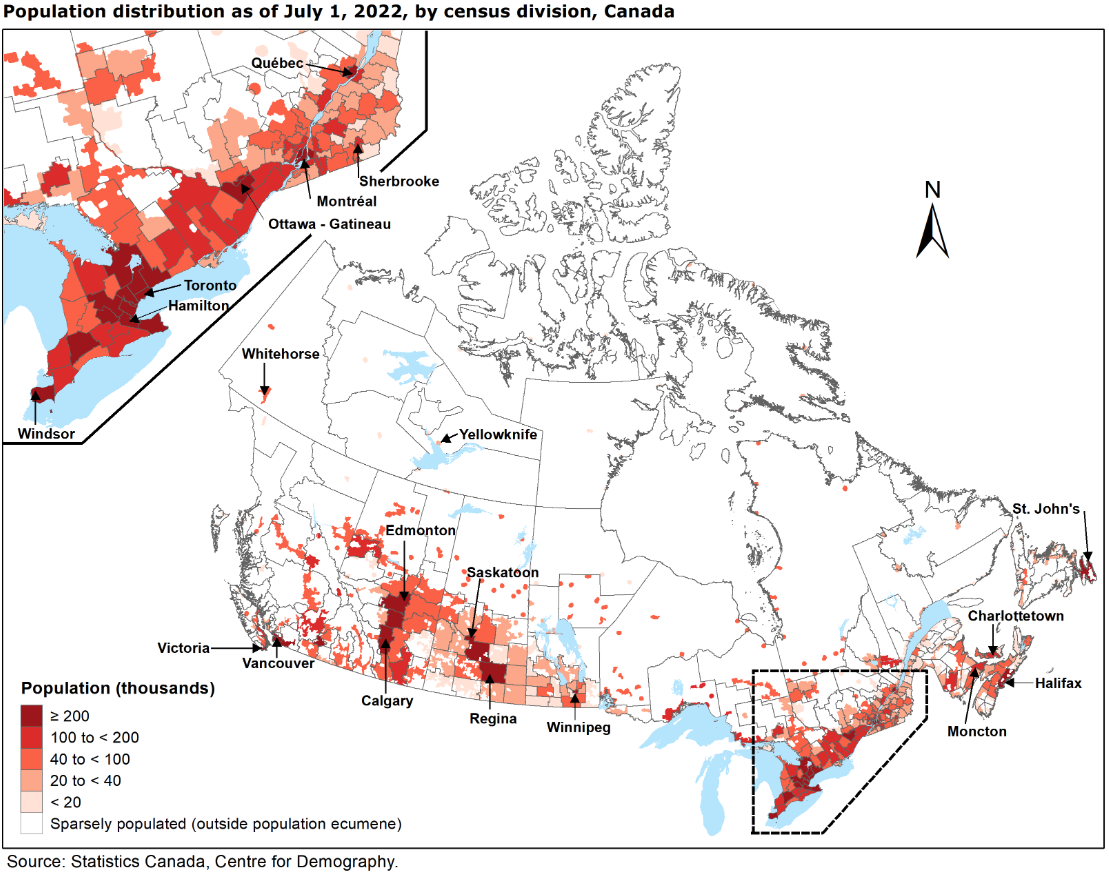
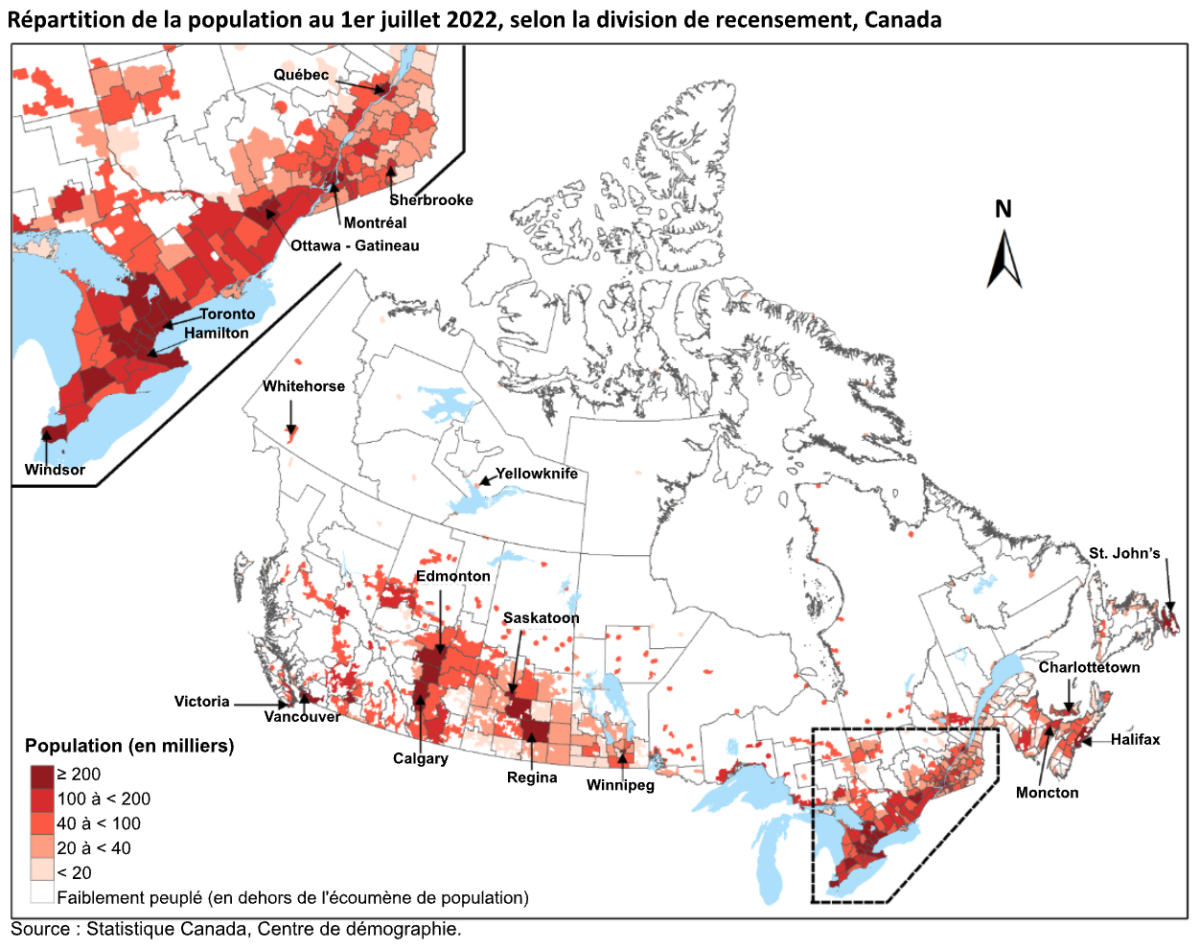
Canada’s population of 41 million is concentrated in a handful of large, urban metropolitan areas near the U.S. border. However, despite the country’s large land mass, it is highly urbanized. Approximately two-thirds, or 27 million, of Canadians live within 100 kilometers of the U.S. border —about the distance from the border to Winnipeg —yet this is only 4% of Canada’s land mass.
Imagine a line across lower Canada, 100 km north of Canada’s southern border – crossing Winnipeg in the middle of the population distribution map. In the area below the line and above the border with the U.S., 82.2% of Speedtest users are getting the CRTC’s minimum standard for fixed broadband speeds (50/10 Mbps). For Speedtest users north of the 100 km line, 76.3% met (or exceeded) the standard. Just a 5.9 percentage points gap.
However, the 100 km line is rather blunt and unsophisticated (and imaginary). Instead let’s look at the Urban-vs-Rural division as well as a more-granular designation based on the Remoteness Index.
Compared with the 100 km line’s gap, the Urban-vs-Rural digital divide aligns more closely with expectations of a larger disparity between these geographic areas. Specifically, 83.8% of Urban users meet the 50/10 Mbps standard, compared to 60.0% of Rural users resulting in a 23.8 percentage point gap.
The good news is the gap has closed from the prior year with Rural users seeing a 23% improvement compared to 5% for Urban users. To emphasize this further, in the first half of 2023 fewer than 50% of Rural users were able to get broadband speeds of 50/10 Mbps. This indicates that efforts to address this gap (i.e., UBF) were targeting the right places.
Continuing across the table, median download and upload speeds are roughly three times faster among urban than rural Speedtest users (DL 251.62 Mbps vs 90.76 Mbps and UL 64.82 Mbps vs 18.88 Mbps, respectively). Comparing the rural median speeds to the 50/10 Mbps threshold shows that half of Speedtest users in rural Canada enjoy download speeds that are 40.76 Mbps (i.e., 90.76 minus 50) and upload speeds that are 8.88 Mbps (i.e., 18.88 minus 10) faster than the target. (This is not to say that an individual Speedtest user experiences both upload and download speeds over the threshold, which is required for the target.)
The difference in Urban and Rural latency literally demonstrates the difference in physical distances (which not only means farther, but also more hops or switching; even buffering time based on the capacity of the data transport) .
The Remoteness Index presents a similar picture in finer geographic slices. (As one would expect, since the underlying data is the same.) Not surprisingly, the percentage of Speedtest users that meet the 50/10 Mbps threshold decreases as their location moves from least remote to most remote. Here too, speed and latency degrade at each step of remoteness, correlating with those meeting the 50/10 Mbps threshold percentages.
The percentage change from the prior year tells a similar story of greater improvement in the more remote geographies, but with some nuance. While we might expect Most Remote to demonstrate even more improvement and be greater than More Remote, deployment challenges and associated costs to deliver telecommunications infrastructure in the most remote geographies can be exponentially prohibitive. Thus, this extreme lack of population density coupled with difficult topography explain why government programs like CTI are needed, and why other solutions like satellite are viable.
The Provinces and The Territories
In the above analysis, broadband speeds were assessed using an imaginary 100 km demarcation, illustrating the concentration of population along Canada’s southern border. Before examining broadband performance and the digital divide among Canada’s provinces and territories, here are additional facts about Canada’s relative sparseness of people in its vast geography.
Landmass: The combined land area of the territories (Yukon, Northwest, Nunavut) is larger than the land area of India, the world’s 7th largest (and most populous) country
Population: The population of the territories is equivalent to the total number of births across Canada every four months.
The territories hold just 0.3% of Canada’s population on 39% of its land. Canada is often compared to the U.S., but Australia is a better comparison, with both Canada and Australia ranking among the least densely populated countries in the world.
Now let’s examine the 50/10 Mbps threshold in the provinces and territories.
Province / Territory
% Meeting 50/10 Mbps 1H 2024
Change from 1H 2023
Urban-Rural Gap 1H 2024, %pts
Newfoundland and Labrador
81.7
6%
22.5
British Columbia
79.8
4%
21.9
New Brunswick
78.1
2%
14.0
Nova Scotia
77.8
9%
8.2
Québec
76.5
8%
9.8
Ontario
76.0
8%
33.9
Alberta
75.7
5%
30.0
Manitoba
71.7
11%
20.8
Prince Edward Island
71.2
14%
18.5
Saskatchewan
64.7
17%
33.0
Northwest Territories
57.3
8%
-7.1
Yukon Territory
53.2
14%
6.7
Nunavut
36.2
94%
Not meaningful
In this table, by geography, percentage of Speedtest users achieving the CRTC broadband speed targets in 1H 2024, compared with the same period in prior year, and the digital divide.
Following the logic of the Remoteness Index, the territories have the fewest Speedtest users meeting the 50/10 Mbps threshold. The percentage changes in the territories from 2023 do not follow the same pattern seen in the Urban-vs-Rural chart and Remoteness Index because these geographies are a mix of these geographic definitions (as it is in the provinces). Similarly, the Urban-vs-Rural gap result is confounded by sparse population. In Nunavut, more than half of the population is defined as rural.
On the top of the table, Newfoundland and Labrador, New Brunswick, and Nova Scotia may be unexpected leaders in meeting the 50/10 Mbps threshold. New Brunswick and Nova Scotia have relatively higher population density among the provinces and territories which (economically) encourages the deployment of telecommunications infrastructure. This appears to play out in the Urban-vs-Rural gap as well, ranking among the lowest gaps in the provinces.
The exceptional performance of Newfoundland and Labrador (81.7% meeting 50/10 Mbps) can partly be attributed to the vast majority of its population residing on the island of Newfoundland, and half of them, in turn, residing on the Avalon peninsula (see the population distribution map above and St. John’s in the east). This concentration of population underscores the fundamental reality of economics in telecommunications deployment. And in the opposite direction, the Urban-vs-Rural gap (22.5%pts) also makes this same point for the need for the funding programs like UBF to address the digital divide.
Breaking Down the Digital Divide
Percentage of Urban and Rural Speedtest users in each Province/Territory with broadband speeds of at least 50/10 Mbps, 1H 2024, Nunavut: Urban n too small; Rural 43.6%
Look, Up in the Sky
As addressed in the discussion about Most Remote, because of Canada’s topographical challenges, fiber and electricity are cost prohibitive in many deployment cases. In 2019, Canada added C$85M to its CTI program because it recognized that it needed support for low-Earth orbit (LEO) satellites to reach its connectivity goals (50/10 Mbps connectivity to 95% of Canadians by 2026, and the hardest-to-reach Canadians by 2030).
Briefly looking across Canada for Speedtest users of satellite internet services during the first half of 2024, over half saw download speeds of 72.90 Mbps or greater, and upload speeds of 12.47 or greater. Moreover, in the territory of Nunavut the speeds were basically identical (75.16 Mbps and 12.50 Mbps, respectively), which makes sense since Nunavut is equally Urban or Rural (or More Remote or Less Remote) to an orbiting satellite a few hundred miles overhead. Clearly LEO is a viable solution technically and economically.
Whether fiber or satellite, broadband connectivity means nothing without power. The cost of electricity in the north can be ten times more expensive than in southern cities. In some cases, diesel fuel burned for both heat and electricity is flown, shipped by sea, or by tanker over frozen lakes and rivers in the winter. As with broadband, the Canadian government has a plan to invest in Rural and Northern Communities to make available affordable and clean energy.
Another barrier to fully-connected communities that affects Urban as well as the Most Remote is digital literacy (though the latter faces compounding factors). Here again the Canadian government is addressing the issue with initiatives such as its Digital Literacy Exchange Program.
No matter the geographic lens – Urban-vs-Rural, Remoteness Index, or Provinces and Territories – the goal is to get to 100% in 2030. But even 100% broadband connectivity from a purely technical perspective, would not be 100% in spirit without other programs and initiatives like these. Communication is achieved when the signal is received, not just sent.
Recently, Ookla also looked at the broadband and digital divide in the U.S. – How the 50 U.S. States Stack up in Broadband Speed Performance: 1H 2024 | Ookla®. We look forward to providing more updates on the U.S. and Canada’s progress to provide high-speed internet connectivity for all. For more information about Speedtest Intelligence data and insights, please get in touch.
Le Rétrécissement de la Fracture Numérique au Canada
Plus de 80 % des Canadiens ont accès à des réseaux fixes à large bande, mais pour les Canadiens des régions rurales, ce chiffre tombe à seulement 60 %. Pourtant, cet écart entre ceux qui ont accès à la large bande et ceux qui n’en ont pas se rétrécit dans les régions rurales à un rythme près de trois fois plus rapide que dans les zones urbaines. Le Canada réduit la fracture numérique dans les régions rurales grâce à une stratégie de connectivité clairement articulée et bien financée pour assurer l’accès à l’Internet haute vitesse pour tous.
À l’aide des données de Speedtest Intelligence®, le présent rapport identifie les provinces et les territoires du Canada qui fournissent la norme minimale pour les vitesses à large bande fixes, telle qu’établie par le Conseil de la Radiodiffusion et des Télécommunications Canadiennes (CRTC). Sur la base des données du 1er semestre 2024 (et par rapport au 1er semestre 2023), il analyse également les performances dans d’autres catégories géographiques, y compris les catégories urbaine et rurale ainsi que l’indice d’éloignement (Remoteness Index).
Principaux points à retenir
Pas moins de 2 millions de Canadiens supplémentaires ont bénéficié de l’accès à Internet haute vitesse au premier semestre 2024 par rapport au premier semestre 2023.
Les utilisateurs ruraux canadiens de Speedtest ont vu une augmentation de 23 % de ceux qui ont accès à Internet haute vitesse au cours du premier semestre 2024par rapport au premier semestre 2023.
Le service Internet par satellite constitue un levier essentiel pour réduire la fracture numérique et améliorer l’accès à la large bande sur l’immense territoire canadien. Aux États-Unis, les organismes de réglementation étaient ambivalents quant à autoriser le financement par le gouvernement de l’Internet par satellite (cette attitude a récemment commencé à changer). Le Canada savait il y a de nombreuses années que l’Internet par satellite était essentiel.
La large bande sous les feux de la rampe
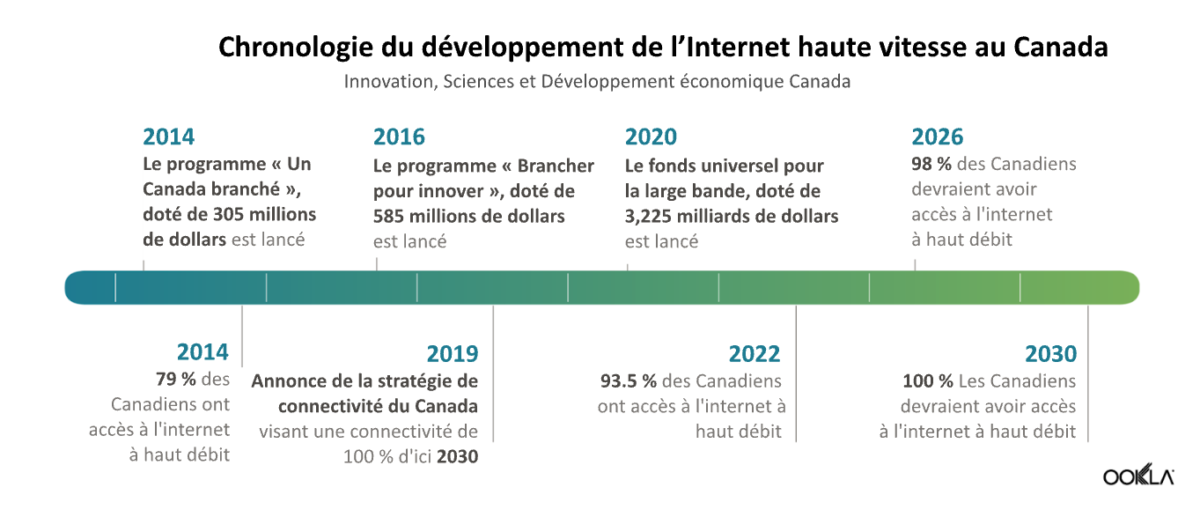
Alors que la pandémie de COVID-19 a mise en lumière la fracture numérique, le gouvernement du Canada investit depuis longtemps dans le déploiement de la large bande pour réduire cet écart. En 2014, il a mis sur pied le programme Un Canada branché, allouant 305 millions de dollars canadiens pour améliorer la connectivité de 300 000 ménages mal desservis.
Le programme Brancher pour innover a été lancé en décembre 2016 avec 500 millions de dollars canadiens (85 millions de dollars canadiens supplémentaires alloués en 2019) pour étendre l’accès a l’Internet à haut débit dans les communautés mal desservies par le secteur privé. Ce programme visait à améliorer l’accès à plus de 380 000 foyers.
Renforçant ses investissements en 2020, peut-être en réponse aux confinement lié au COVID-19, le gouvernement canadien a lancé le Fonds universel pour la large bande, doté de 3,225 milliards de dollars canadiens.
UBF
Fonds universel pour la large bande (2020)
3,225 milliards de dollars
CTI
Brancher pour innover (2016)
585 M$
CCP
Programme « Un Canada branché » (2014)
305 M$
Avec plus de 4 milliards de dollars canadiens provenant de ces programmes uniquement, le CRTC a pour objectif de connecter 98 % des Canadiens à l’Internet haute vitesse (large bande) offrant des vitesses d’au moins 50 Mbps en téléchargement (DL) et 10 Mbps en téléversement (UL) (50/10 Mbps) d’ici 2026, et 100 % d’ici 2030.
Vaincre la fracture
La population de 41 millions d’habitants du Canada est concentrée dans une poignée de métropoles près de la frontière américaine. Malgré l’immensité du pays, le Canada est fortement urbanisé. Environ les deux tiers, soit 27 millions, des Canadiens vivent à moins de 100 kilomètres de la frontière américaine, soit environ la distance entre la frontière et Winnipeg; mais cette zone ne représente que 4 % de la superficie du Canada.
Imaginez une ligne traversant le Canada, à 100 km au nord de sa frontière méridionale, et traversant Winnipeg au milieu de la carte de répartition de la population. Dans la zone située sous la ligne de démarcation et au-dessus de la frontière avec les États-Unis, 82,2 % des utilisateurs de Speedtest obtiennent la norme minimale du CRTC pour les vitesses des services à large bande fixe (50/10 Mbps). Pour les utilisateurs du Speedtest au nord de la ligne des 100 km, 76,3 % respectent (ou dépassent) la norme. Soit un écart de seulement 5,9 points.
Cependant, la ligne des 100 km reste une mesure assez simpliste, peu sophistiquée et, de surcroît, imaginaire. Examinons plutôt la division entre les zones urbaines et rurales, ainsi qu’une classification plus détaillée basée sur l’indice d’éloignement.
Comparée à celle définie par la ligne des 100 km, la fracture numérique entre les zones urbaines et rurales correspond davantage aux attentes, reflétant une disparité plus marquée entre ces zones géographiques. Plus précisément, 83,8 % des utilisateurs urbains respectent la norme de 50/10 Mbps, comparativement à 60,0 % des utilisateurs ruraux, ce qui donne un écart de 23,8 points.
La bonne nouvelle est que l’écart s’est réduit par rapport à l’année précédente, les utilisateurs ruraux ayant constaté une amélioration de 23 %, contre 5 % pour les utilisateurs urbains. Pour souligner davantage ce point, au cours du premier semestre de 2023, moins de 50 % des utilisateurs ruraux ont pu obtenir des vitesses à large bande de 50/10 Mbps. Cela indique que les efforts déployés pour combler cette lacune (c’est-à-dire le Fonds universel pour la large bande) ont été utilisés à bonne fin.
Si l’on poursuit la lecture du tableau, les vitesses médianes de téléchargement et de téléversement sont environ trois fois plus élevées chez les utilisateurs urbains que chez les utilisateurs ruraux de Speedtest (DL 251,62 Mbps contre 90,76 Mbps et UL 64,82 Mbps contre 18,88 Mbps, respectivement). La comparaison des vitesses médianes en milieu rural avec le seuil de 50/10 Mbps montre que la moitié des utilisateurs de Speedtest dans les régions rurales du Canada bénéficient de vitesses de téléchargement de 40,76 Mbps (c.-à-d. 90,76 moins 50) et de vitesses de téléversement de 8,88 Mbps (c.-à-d. 18,88 moins 10) plus rapides que l’objectif fixé. (Cela ne signifie pas pour autant qu’un utilisateur individuel de Speedtest bénéficie à la fois de vitesses de téléchargement et de téléversement dépassant le seuil requis, ce qui est nécessaire pour atteindre l’objectif.)
La différence entre les temps de latence en milieu urbain et en milieu rural illustre littéralement la différence entre les distances physiques (ce qui signifie non seulement des distances plus grandes, mais aussi un plus grand nombre de sauts de traffic).
L’indice d’éloignement présente une image similaire dans des tranches géographiques plus fines. (Comme on pouvait s’y attendre, puisque les données sous-jacentes sont les mêmes.) Il n’est pas surprenant de constater que le pourcentage d’utilisateurs Speedtest qui atteignent le seuil de 50/10 Mbps diminue au fur et à mesure que cette indice augmente. Ici aussi, la vitesse et la latence se dégradent avec l’augmentation de l’indice, en corrélation avec le pourcentage d’utilisateurs atteignant de seuil de 50/10 Mbps.
La variation (en pourcentage) par rapport à l’année précédente offre des similarités, avec une amélioration dans les zones géographiques les plus éloignées, mais avec tout en apportant une certaine nuance. On pourrait s’attendre à ce que les régions les plus éloignées s’améliorent, mais les difficultés de déploiement et les coûts associés à la mise en place d’une infrastructure de télécommunications dans les zones géographiques les plus reculées peuvent être exponentiellement prohibitifs. Ainsi, ce manque extrême de densité de population, associé à une topographie difficile, explique pourquoi des programmes gouvernementaux sont nécessaires et pourquoi d’autres solutions comme l’accès par satellite sont viables.
Les provinces et les territoires
Dans l’analyse ci-dessus, les vitesses à large bande ont été évaluées à l’aide d’une démarcation imaginaire de 100 km, illustrant la concentration de la population le long de la frontière sud du Canada. Avant d’examiner les performances de la large bande et la fracture numérique parmi les provinces et territoires du Canada, voici quelques faits supplémentaires concernant la relative faiblesse de la densité de population dans l’immensité géographique du pays.
Masse continentale : La superficie terrestre combinée des territoires (Yukon, Nord-Ouest, Nunavut) est plus grande que la superficie de l’Inde, le 7e pays le plus grand (et le plus peuplé) du monde
Population : La population des territoires équivaut au nombre total de naissances au Canada tous les quatre mois.
Les territoires ne représentent que 0,3 % de la population du Canada mais 39 % de son territoire. Le Canada est souvent comparé aux États-Unis, mais l’Australie est une meilleure comparaison; le Canada et l’Australie se classant parmi les pays les moins densément peuplés du monde.
Examinons maintenant le seuil de 50/10 Mbps dans les provinces et les territoires.
Province / Territoire
% Atteignant l’objectif 50/10 Mbps 1H 2024
Changement par rapport à 1H 2023
Écart entre les zones urbaines et rurales 1H 2024, %pts
Terre-Neuve-et-Labrador
81,7
6 %
22,5
Colombie-Britannique
79,8
4 %
21,9
Nouveau-Brunswick
78,1
2 %
14,0
Nouvelle-Écosse
77,8
9 %
8,2
Québec
76,5
8 %
9,8
Ontario
76,0
8 %
33,9
Alberta
75,7
5 %
30,0
Manitoba
71,7
11 %
20,8
Île-du-Prince-Édouard
71,2
14 %
18,5
Saskatchewan
64,7
17 %
33,0
Territoires du Nord-Ouest
57,3
8 %
-7,1
Territoire du Yukon
53,2
14 %
6,7
Nunavut
36,2
94 %
Pas significatif
Pourcentage d’utilisateurs de Speedtest atteignant les objectifs de vitesse de large bande du CRTC au premier semestre 2024 par région par rapport à la même période de l’année précédente.
Suivant la logique de l’indice d’éloignement, les territoires ont le moins d’utilisateurs Speedtest répondant au seuil de 50/10 Mbps. Les variations en pourcentage dans les territoires à partir de 2023 ne suivent pas la même tendance que celle observée dans le graphique urbain/rural et l’indice d’éloignement, car ces géographies sont un mélange de ces définitions géographiques (comme c’est le cas dans les provinces). De même, le résultat de l’écart entre les zones urbaines et les zones rurales est faussé par la faible densité de population. Au Nunavut, plus de la moitié de la population est définie comme rurale.
En haut du tableau, Terre-Neuve-et-Labrador, le Nouveau-Brunswick et la Nouvelle-Écosse pourraient être des chefs de file inattendus dans la réalisation du seuil de 50/10 Mbps. Le Nouveau-Brunswick et la Nouvelle-Écosse ont une densité de population relativement plus élevée parmi les provinces et les territoires, ce qui encourage (économiquement) le déploiement de l’infrastructure de télécommunications. Cela semble également se jouer dans l’écart entre les régions urbaines et rurales, qui se classe parmi les écarts les plus faibles dans les provinces.
La performance exceptionnelle de Terre-Neuve-et-Labrador (81,7 % atteignant 50/10 Mbps) peut en partie être attribuée au fait que la grande majorité de sa population réside sur l’île du Terre Neuve, dont la moitié vit sur la péninsule d’Avalon (voir la carte de répartition de la population ci-dessus et la ville de St. John’s à l’est). Cette concentration de population souligne la réalité fondamentale de l’économie dans le déploiement des télécommunications. Et dans la direction opposée, l’écart entre les zones urbaines et rurales (22,5 % de points) souligne également la nécessité de programmes de financement pour combler la fracture numérique.
Briser la fracture numérique
Pourcentage d’utilisateurs de Speedtest fixe en milieu urbain et rural dans chaque province et territoire ayant accès à des vitesses à large bande de 50/10 Mbps, 1H 2024, Nunavut: Urbain n trop petit; Rural 43.6%
Regardez vers les étoiles
Comme mentionné précédemment, en raison des défis topographiques du Canada, la fibre et l’électricité peuvent avoir des coûts de déploiement prohibitifs dans de nombreux cas. En 2019, le Canada a ajouté 85 millions de dollars canadiens à son programme Brancher pour innover (CTI), car il a reconnu qu’il avait besoin de satellites en orbite basse (LEO) pour atteindre ses objectifs en matière de connectivité (connectivité de 50/10 Mbps pour 95 % des Canadiens d’ici 2026, et pour les Canadiens les plus difficiles à atteindre d’ici 2030).
En examinant brièvement les utilisateurs de Speedtest des services Internet par satellite à travers le Canada durant la première moitié de 2024, plus de la moitié ont enregistré des vitesses de téléchargement de 72,90 Mbps ou supérieures, ainsi que des vitesses de téléversement de 12,47 Mbps ou supérieures. De plus, dans le territoire du Nunavut, les vitesses étaient pratiquement identiques (75,16 Mbps et 12,50 Mbps, respectivement), ce qui est logique, puisque le Nunavut est à la fois urbain et rural (ou plus éloigné et moins éloigné) pour un satellite en orbite à quelques centaines de kilomètres au-dessus. Il est clair que le LEO est une solution viable techniquement et économiquement.
Qu’il s’agisse de fibre ou de satellite, la connectivité à large bande ne signifie rien sans électricité. Le coût de l’électricité dans le nord peut être dix fois plus élevé que dans les villes du sud. Dans certains cas, le carburant diesel utilisé pour le chauffage et l’électricité est transporté par avion, par bateau ou par camion-citerne sur des lacs et des rivières gelés en hiver. Comme pour la large bande, le gouvernement canadien a un plan pour investir dans les collectivités rurales et nordiques afin de rendre disponible une énergie propre et abordable.
Un autre obstacle à des communautés pleinement connectées, qui touche tant les zones urbaines que les régions les plus éloignées, est la maîtrise des outils numériques (bien que ces dernières fassent face à des facteurs aggravants). Là encore, le gouvernement canadien s’attaque au problème avec des initiatives comme son Programme d’échange en matière de littératie numérique.
Peu importe la perspective géographique – urbain par rapport à rural, indice d’éloignement ou provinces et territoires – l’objectif est d’atteindre 100 % en 2030. Mais même une connectivité à large bande à 100 %, d’un point de vue purement technique, ne serait pas à 100 % dans l’esprit sans d’autres programmes et initiatives comme ceux-ci. La communication est réalisée lorsque le signal est reçu, pas seulement envoyé.
Récemment, Ookla a également examiné la fracture numérique et l’accès à la large bande aux États-Unis. – Comment les 50 États américains se positionnent en matière de vitesse de la large bande : 1H 2024 | Ookla®. Nous sommes impatients de fournir d’autres mises à jour sur les progrès réalisés par les États-Unis et le Canada pour fournir une connectivité Internet haute vitesse pour tous. Pour plus d’informations sur les données et les analyses de Speedtest Intelligence, veuillez prendre contact.
Ookla retains ownership of this article including all of the intellectual property rights, data, content graphs and analysis. This article may not be quoted, reproduced, distributed or published for any commercial purpose without prior consent. Members of the press and others using the findings in this article for non-commercial purposes are welcome to publicly share and link to report information with attribution to Ookla.
There’s nothing quite like picking up your phone for a little “me” time only to open up that first web page… and wait for it to load. Maybe the images aren’t there yet or the content jumps around while the ads load — it’s the worst. 5G is meant to help, so we dug into Speedtest® quality of experience data to see if this newer technology is living up to its promise. Read on for an analysis of page load speed (how many milliseconds it takes for a page to load) on three popular services in nine major countries around the world during Q1 2024.
Click the country below to go directly to that section or read on for the full article:
Page speed relies on low latency for the best internet experience
Page load speed is a critical measure of your web browsing experience. It measures how long it takes for a page to load, fully displaying the content on that page. This is directly impacted by latency, which is how quickly your device gets a response after you’ve sent out a request. A typical request on the internet requires two to five round trip communications between various entities over different latency sensitive protocols.
5G lived up to the latency promise, showing a faster page load speed than 4G on all services in all countries we surveyed. However, the improvement was not the same in all places, with Canada topping the list of fastest page load speed over 5G on all the services we surveyed while South Africa had the slowest 5G page load speed on Google and YouTube of countries reviewed here. Read on for details.
5G loads 20-30% faster than 4G in Brazil
Speedtest data shows that 5G delivered a much lower page load speed than 4G on all three services in Brazil during Q1 2024. Google loaded 20% faster on 5G than 4G, YouTube was 25% faster, and Facebook was 30% faster on 5G.
Canada’s 5G page load speed among the fastest on all 3 services
As mentioned, Canada’s 5G page load speed was the fastest or among the fastest for all countries analyzed in this article, with Canada having the fastest page load speed on Facebook, Google, and YouTube. Our analysis demonstrated that 5G delivered a decently faster page load speed than 4G on all three services in Canada during Q1 2024. YouTube loaded 16% faster on 5G than 4G, Google was 18% faster, and Facebook was 23% faster on 5G.
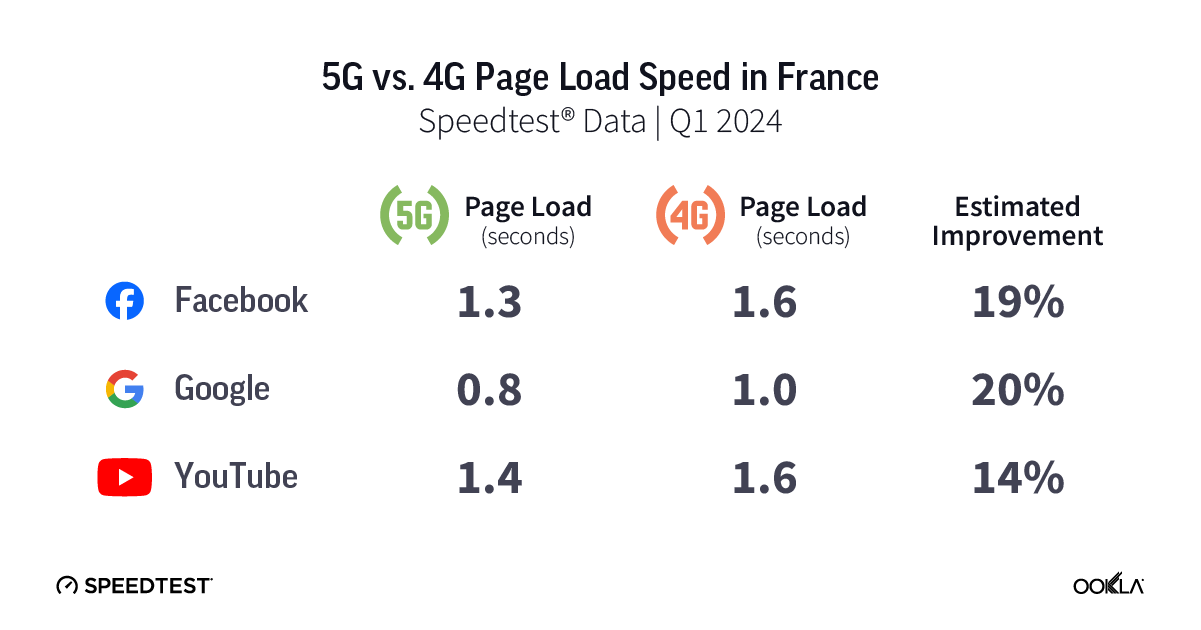
French 5G loads 14-20% faster than 4G
Speedtest data shows 5G page load speed on all three services was decently faster than on 4G in France during Q1 2024. YouTube loaded 14% faster on 5G than 4G, Facebook was 19%, and Google was 20% faster on 5G.
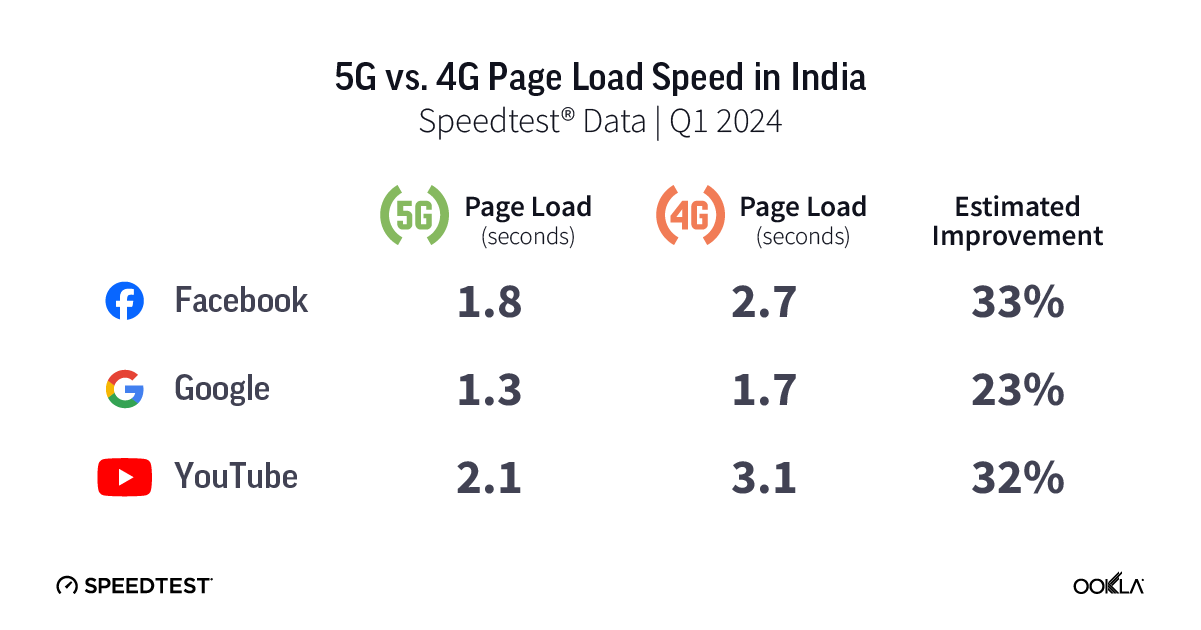
5G loads 23-33% faster than 4G in India
Analysis of Speedtest data shows the page load speed on all three services was much lower on 5G than 4G in India during Q1 2024. Google loaded 23% faster on 5G than 4G, YouTube was 32% faster, and Facebook was 33% faster on 5G. India and Mexico had the slowest page load speeds for Facebook over 5G of any of the countries we looked at.
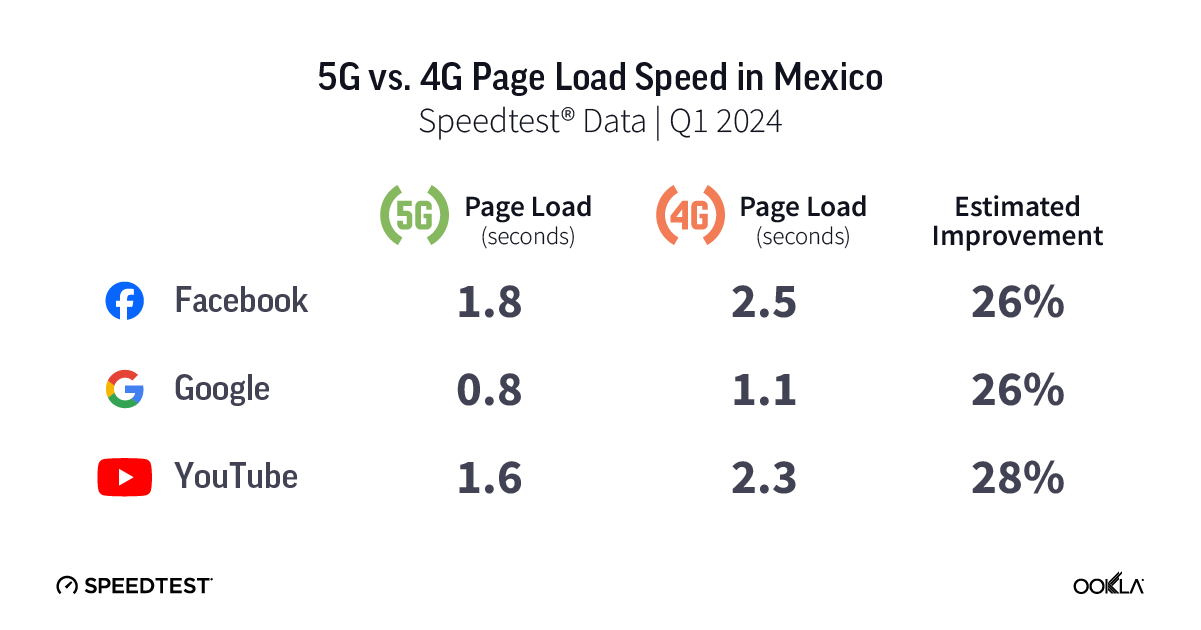
Mexican 5G loads 26-28% faster than 4G
Speedtest data shows 5G delivered a much lower page load speed than 4G on all three services in Mexico during Q1 2024. Google and Facebook loaded 26% faster on 5G than 4G and YouTube was 28% faster on 5G. Mexico and India had the slowest 5G page load speeds for Facebook among the countries examined.
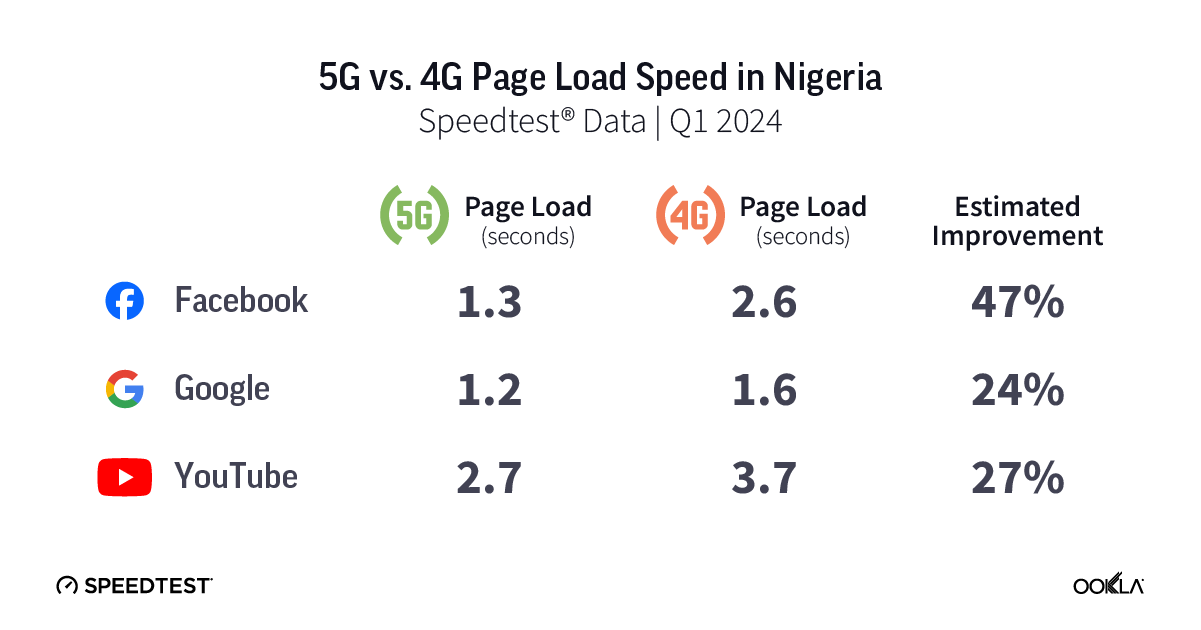
5G loads up to 47% faster than 4G in Nigeria
Our analysis revealed 5G delivered a much lower page load speed than 4G on all three services in Nigeria during Q1 2024. Google loaded 24% faster on 5G than 4G, YouTube was 27% faster, and Facebook was a whopping 47% faster on 5G.
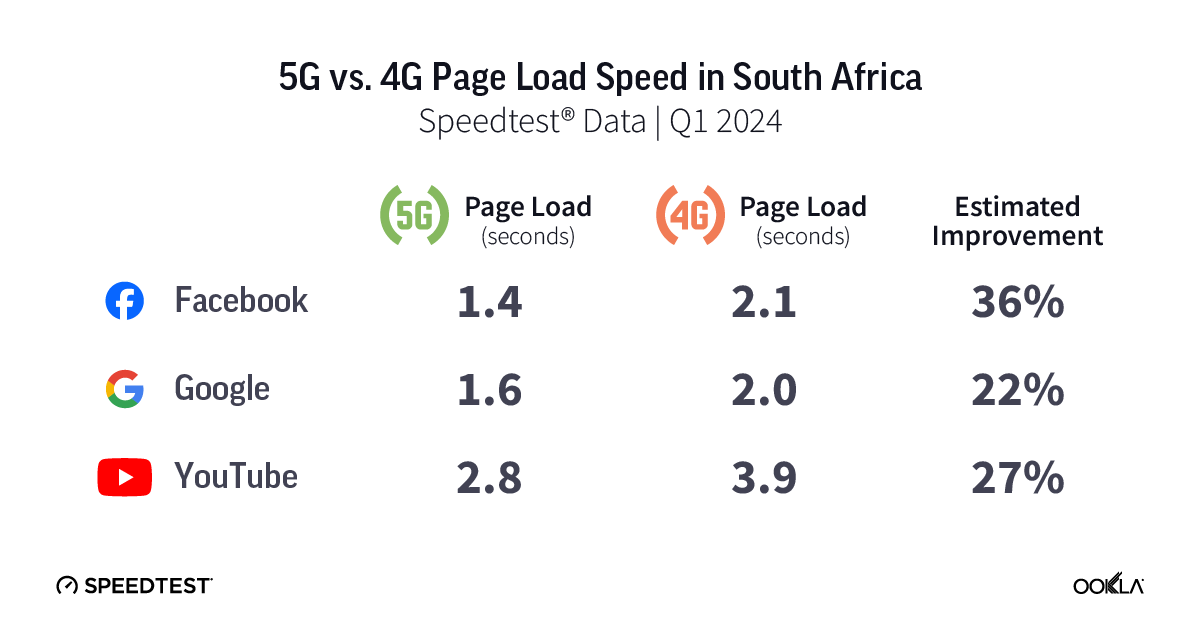
South Africans see 22-36% faster 5G page load over 4G, but slow Google and YouTube
Speedtest data shows 5G delivered a much lower page load speed than 4G on all three services in South Africa during Q1 2024. Google loaded 22% faster on 5G than 4G, YouTube was 27% faster, and Facebook was 36% faster on 5G. South Africa had the slowest 5G page load speed for both Google and YouTube of any of the countries analyzed.
5G loads 11-15% faster than 4G in Spain
5G page load speed in Spain was somewhat faster than 4G on all three services during Q1 2024. YouTube loaded 11% faster on 5G than 4G, Google was 14% faster than 4G, and Facebook was 15% faster on 5G.
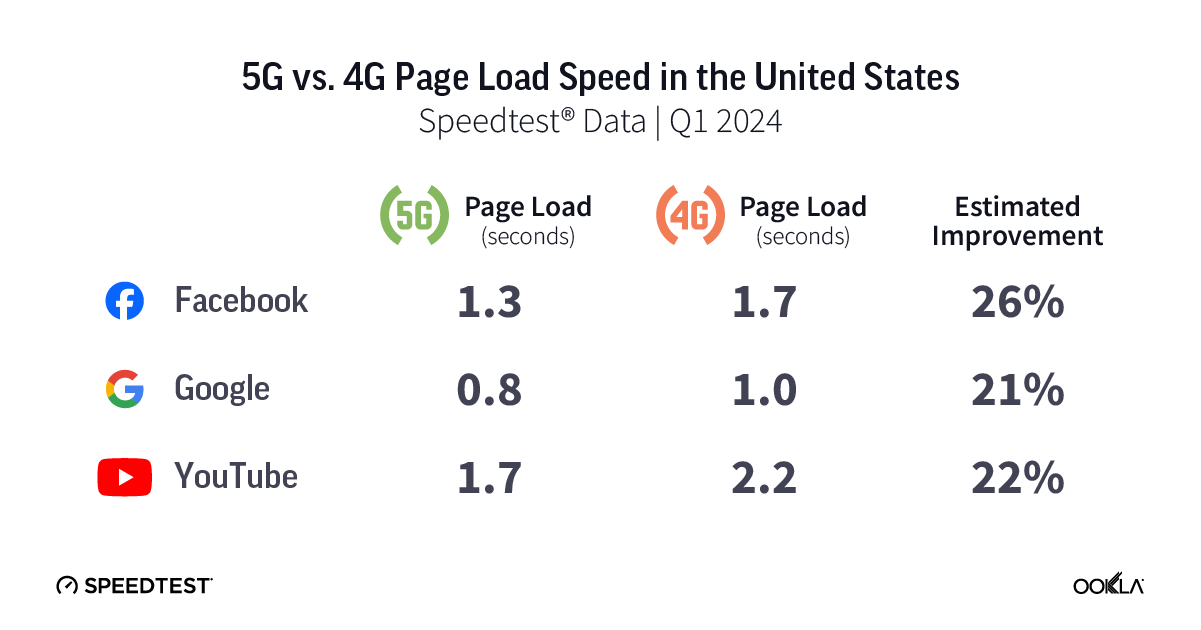
U.S. 5G loads 21-26% faster than 4G
Speedtest data from the U.S. shows 5G delivered a much lower page load speed than 4G on all three services during Q1 2024. Google loaded 21% faster on 5G than 4G, YouTube was 22% faster, and Facebook was 26% faster on 5G.
Your time is valuable. Our data shows that you can get some of that important time back if you have access to 5G and can afford to upgrade. To learn more about your network experience, download the Speedtest app for Android or iOS. Remember, too, that there’s a Downdetector® tab in the Speedtest apps to help you troubleshoot pages that aren’t loading at all.
Ookla retains ownership of this article including all of the intellectual property rights, data, content graphs and analysis. This article may not be quoted, reproduced, distributed or published for any commercial purpose without prior consent. Members of the press and others using the findings in this article for non-commercial purposes are welcome to publicly share and link to report information with attribution to Ookla.
Airports around the world have been packed with travelers this year, which puts extra stress on the Wi-Fi. With summer travel already well in swing in the northern hemisphere, we’re back with fresh data for our seriesonairport Wi-Fiperformance to help you plan for connectivity at all your connections. You’ll find information about Wi-Fi on free networks provided by the individual airports as well as mobile speeds at some of the busiest airports in the world during Q1 2024. Read on for a look at internet performance at over 50 of the world’s busiest airports with data on download speed, upload speed, and latency.
Key takeaways
The seven fastest airports for downloads over Wi-Fi were in the United States: San Francisco International Airport, Newark Liberty International Airport, John F. Kennedy International Airport, Phoenix Sky Harbor International Airport, Seattle–Tacoma International Airport, Dallas Fort Worth International Airport, and Harry Reid International Airport.
Six U.S. airports had the fastest uploads over Wi-Fi: San Francisco International Airport, Phoenix Sky Harbor International Airport, Newark Liberty International Airport, Seattle–Tacoma International Airport, Dallas Fort Worth International Airport, and John F. Kennedy International Airport.
The fastest mobile download speeds on our list were at Hamad International Airport in Doha, Qatar, Shanghai Hongqiao International Airport in China, and Phoenix Sky Harbor International Airport in the U.S.
Eight of the 10 airports with the fastest mobile upload speeds were in China.
9 airports have 100+ Mbps Wi-Fi download speeds
Speedtest Intelligence® showed seven of the nine airports with median Wi-Fi download speeds over 100 Mbps were in the U.S.:
San Francisco International Airport (173.55 Mbps),
Newark Liberty International Airport (166.51 Mbps),
John F. Kennedy International Airport (151.59 Mbps),
Phoenix Sky Harbor International Airport (151.28 Mbps),
Seattle–Tacoma International Airport (137.31 Mbps),
Dallas Fort Worth International Airport (119.92 Mbps), and
Harry Reid International Airport (107.84 Mbps).
Charles de Gaulle Airport in Paris, France and China’s Hangzhou Xiaoshan International Airport rounded out the list with median download speeds of 107.13 Mbps and 101.01 Mbps, respectively. Hartsfield–Jackson Atlanta International Airport and Sea–Tac had the lowest median multi-server latency on Wi-Fi of any of the airports surveyed during Q1 2024.
Hover on the pins on the map below to see full details for download and upload speeds as well as latency at all the airports analyzed.
Fixed Broadband Internet Speeds Over Free Wi-Fi at Global Airports
Speedtest Intelligence® | Q1 2024
A map showing fixed broadband speeds in selected global airports.
At Ookla®, we’re dedicated to making sure the networks you depend on are always at their best. With Ekahau®, our Wi-Fi solution, we know firsthand just how challenging it can be to optimize Wi-Fi at airports, especially when you have up to 900 people waiting at each boarding gate during the busiest travel times. While the speeds achieved by these top airports are impressive, we saw two smaller U.S. airports with median Wi-Fi download speeds over 200 Mbps during our U.S.-only analysis of airport Wi-Fi in the fall.
Six airports on our list use multiple SSIDs for their Wi-Fi networks for different terminals or to take advantage of the coverage advantages of 2.4 GHz and the speed advantages of 5 GHz frequencies. We have included data for all the SSIDs with sufficient samples in the map and reported in the text on the best result when using multiple SSIDs results in dramatically different speeds.
Eighteen airports on our list had median Wi-Fi download speeds of less than 25 Mbps. Mexico City International Airport in Mexico had the lowest median Wi-Fi download speed at 5.11 Mbps, followed by:
Tan Son Nhat International Airport in Vietnam (7.07 Mbps),
Beijing Capital International Airport in China (9.45 Mbps),
Cairo International Airport in Egypt (10.62 Mbps), and
Tokyo Haneda Airport in Japan (11.37 Mbps).
You may struggle with everything from video chatting to streaming at any airport with a download speed below 25 Mbps. Latency is also a factor in performance so if your airport is one of the three with a median Wi-Fi latency over 60 ms, a mobile hotspot may be a better option for a stable connection.
Wi-Fi 6 has arrived
Our analysis shows at least 15 airports on our list were using the new Wi-Fi 6 standard in their Wi-Fi setup. Wi-Fi 6 uses Multi-User Multiple Input, Multiple Output (MU-MIMO) and Orthogonal Frequency Division Multiple Access (OFDMA) to increase performance and throughput, especially when serving multiple devices. This offers a real advantage at a large public location like an airport. In order to get maximum benefit from Wi-Fi 6, consumers would need to be using Wi-Fi 6-compatible devices. Speedtest data shows a fairly even split between airports that saw faster download speeds on Wi-Fi 6 and airports where Wi-Fi 6 results were comparable to those on other earlier Wi-Fi generations.
As you know, international travel can be complicated. Even if the airport offers free Wi-Fi, you may encounter other barriers to access. For example, a local number is required in Cairo to receive the access code to connect to the airport Wi-Fi. And while we’d love to include other large airports like Nigeria’s Murtala Muhammed International Airport in future Wi-Fi analyses, they currently do not offer free Wi-Fi so we have included mobile data below.
11 airports show mobile speeds over 200 Mbps
Speedtest® data shows mobile speeds massively outpaced Wi-Fi, with 14 airports showing faster median downloads over mobile than the fastest airport for Wi-Fi. Hamad International Airport in Qatar had the fastest median download speed over mobile on our list at 442.49 Mbps during Q1 2024, followed by:
Shanghai Hongqiao International Airport (341.19 Mbps),
Phoenix Sky Harbor International Airport (295.94 Mbps),
Shanghai Pudong International Airport (264.71 Mbps),
Chongqing Jiangbei International Airport (258.42 Mbps), and
Istanbul Airport (255.51 Mbps).
Mobile Network Speeds at Global Airports
Speedtest Intelligence® | Q1 2024
Fastest mobile speeds at airports in Africa and South America
Jomo Kenyatta International Airport in Kenya had the fastest mobile download speeds of the four African airports we analyzed at 88.12 Mbps during Q1 2024. São Paulo/Guarulhos International Airport in Brazil was the faster of the two Latin American airports analyzed with a median download speed of 55.44 Mbps.
Airports with slow mobile speeds
Mobile can’t fix everything, because six airports came in with a median mobile download speed below 25 Mbps. Mexico City International Airport was again at the bottom with 8.75 Mbps, followed by:
Chhatrapati Shivaji Maharaj International Airport (20.96 Mbps), and
Indira Gandhi International Airport (21.80 Mbps).
Latency on mobile was generally higher than that on Wi-Fi with 46 airports showing a Wi-Fi latency lower than the lowest latency on mobile, 27.51 ms at China’s Shanghai Hongqiao International Airport. As noted above, latency is an important factor in performance, so it might be worth investigating the airport Wi-Fi by running a Speedtest if your mobile performance seems to lag.
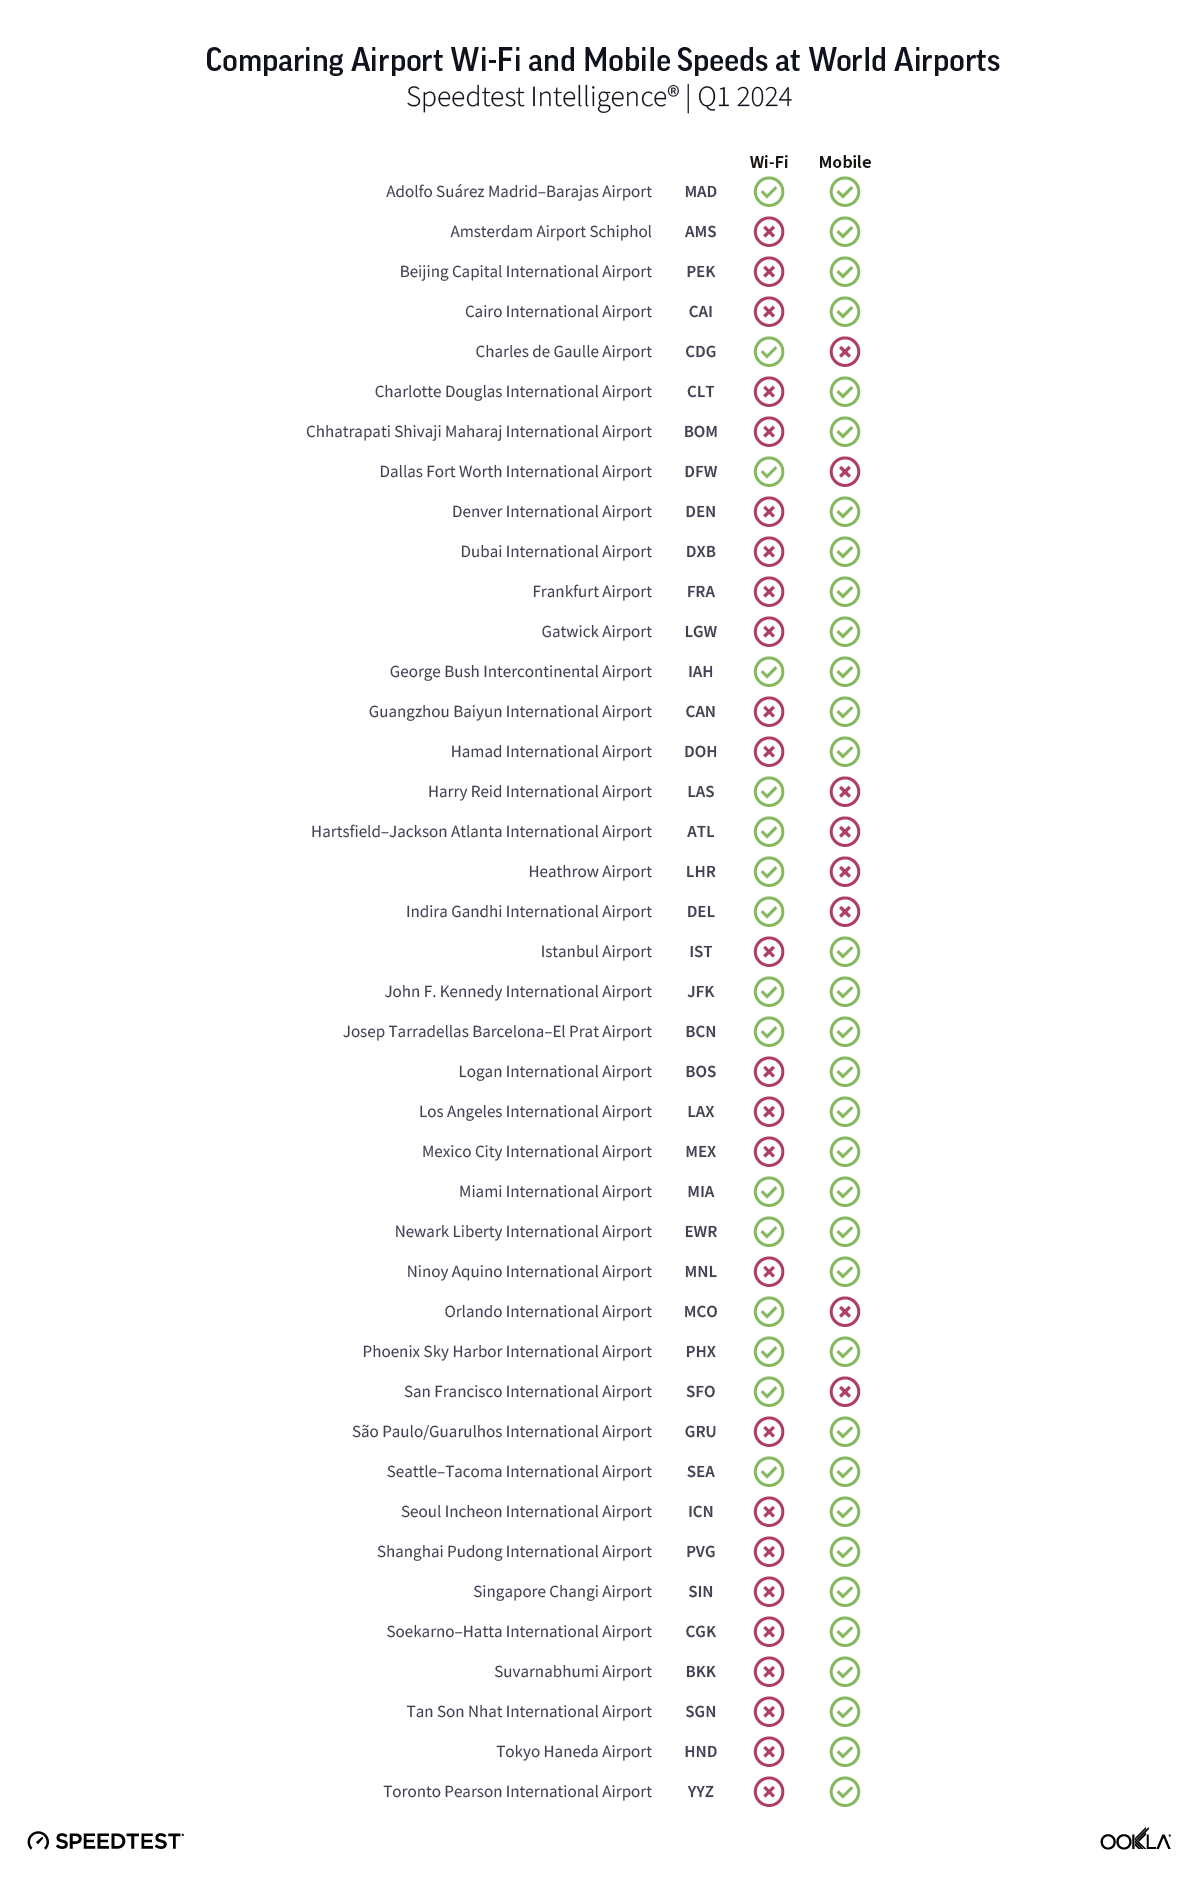
Airport Wi-Fi or mobile? Connecting on your next trip
We created a quick guide to help you decide whether to try out the Wi-Fi or simply use the local mobile network if you have access. Use it to compare free airport Wi-Fi performance against mobile performance for the 52 airports we have both Wi-Fi and mobile data for during Q1 2024. Twenty-six airports had faster mobile internet than airport Wi-Fi. Eight airports had faster Wi-Fi than mobile, and seven airports showed only a slight distinction between Wi-Fi and mobile or download speeds over 100 Mbps on both, so we gave both the green check marks. We were able to include more airports in the mobile analysis because there were more mobile samples to analyze at those airports than there were samples over Wi-Fi.
The averages reported here are based on real-world data, so your experience may differ, especially on a busy travel day. Take a Speedtest® at the airport to see how your performance compares. Cheers to safe travels and rapid connections wherever you’re flying.
Ookla retains ownership of this article including all of the intellectual property rights, data, content graphs and analysis. This article may not be quoted, reproduced, distributed or published for any commercial purpose without prior consent. Members of the press and others using the findings in this article for non-commercial purposes are welcome to publicly share and link to report information with attribution to Ookla.
Ookla® Market Reports™ identify key data about internet performance in countries across the world. This quarter we’ve provided updated analyses for 52 markets using Speedtest Intelligence® and summarized the top takeaways below. Click through to the market report to see more details and charts about the countries you’re interested in, including the fastest fixed broadband providers and mobile operators, who had the most consistent service, as well as 5G and device performance in select countries during Q4 2023. Jump forward to a continent using these links:
Côte d’Ivoire: Orange recorded the fastest median mobile and fixed download speeds during Q4 2023, at 30.13 Mbps and 65.90 Mbps, respectively. Moov Africa recorded the lowest mobile median multi-server latency at 83 ms, while CANALBOX recorded the lowest latency over fixed broadband at 70 ms. Of Côte d’Ivoire most populous cities, Abidjan had the fastest median fixed download speed of 58.88 Mbps.
Mozambique: Tmcel recorded the fastest mobile median download speed of 27.80 Mbps in Q4 2023, and also the highest mobile Consistency at 91.6%. Of Mozambique’s most populous cities, Maputo had the fastest median mobile and fixed download speeds at 26.33 Mbps and 14.65 Mbps, respectively. SpaceX’s Starlink recorded the fastest fixed broadband median download speed in Q4 2023 at 36.13 Mbps, along with the highest Consistency at 49.7%. Meanwhile, TVCABO recorded the lowest latency over fixed broadband at 16 ms.
Senegal: There was no winner of fastest median mobile performance in Senegal during Q4 2023, with Free and Orange both tied. Orange led the market for median fixed broadband download performance, with 21.46 Mbps in Q4 2023. Orange also had the lowest latency at 90 ms and highest Consistency of 45.4%. Of Senegal’s most populous cities, Dakar had the fastest median fixed download speed of 27.11 Mbps.
Argentina: Personal had the fastest median download speed over mobile at 36.59 Mbps, while also registering the lowest latency of 39 ms during Q4 2023. In the fixed broadband market, there was no statistically fastest network, with Movistar and Telecentro delivering median download speeds of 106.41 Mbps and 105.98 Mbps, respectively. Movistar recorded the lowest latency of 9 ms. Among Argentina’s most populous cities, Mendoza recorded the fastest mobile median download speed of 37.75 Mbps, while Buenos Aires recorded the fastest fixed download speed of 109.79 Mbps.
Belize: Digi had the fastest median mobile download and upload speeds of 17.50 Mbps and 9.28 Mbps, respectively during Q4 2023. Digi also recorded the highest Consistency of 80.3%, while smart! recorded the lowest median latency of 56 ms. There was no statistically fastest fixed network in the market based on download speed, however NEXGEN recorded the fastest median upload speed at 47.47 Mbps.
Canada: Bell was the fastest mobile operator in Canada with a median download speed of 121.33 Mbps in Q4 2023. Bell also had the fastest median 5G download speed at 194.23 Mbps. Rogers had the fastest median mobile upload speed of 15.10 Mbps, and the highest Consistency of 88.2%. Bell pure fibre was fastest for fixed broadband, recording a median download speed of 307.77 Mbps and a median upload speed of 264.97 Mbps. Bell pure fibre also recorded the highest Video Score, of 87.90. Of Canada’s most populous cities, St. John’s recorded the fastest median mobile download speed at 171.76 Mbps, while Fredericton recorded the fastest median fixed broadband download speed of 247.89 Mbps.
Colombia: Movistar was fastest for fixed broadband with a median download speed of 210.46 Mbps in Q4 2023. ETB had the lowest latency over fixed broadband at 7 ms. Of Colombia’s most populous cities, Cartagena recorded the fastest median fixed download speed of 146.74 Mbps.
Costa Rica: Claro had the fastest median download speed among mobile operators at 40.56 Mbps during Q4 2023. Liberty recorded the fastest median upload speed at 10.73 Mbps, the lowest mobile latency at 33 ms, and the highest Consistency at 78.6%. Metrocom was fastest for fixed broadband download and upload performance, at 225.94 Mbps and 179.66 Mbps, respectively. Metrocom also recorded the lowest latency, at 6 ms.
Dominican Republic: Claro had the fastest median download and upload speeds among mobile operators at 34.27 Mbps and 9.84 Mbps, respectively. Claro also recorded the highest Consistency, at 77.0%. Viva had the lowest mobile latency at 43 ms. SpaceX’s Starlink was fastest for fixed broadband download performance at 48.08 Mbps, while Claro recorded the fastest median upload speed at 25.38 Mbps, and the lowest latency at 41 ms. Altice recorded the highest fixed broadband Consistency, at 66.6%.
Ecuador: CNT recorded the fastest median mobile download speed during Q4 2023, at 26.22 Mbps, while Movistar recorded the lowest mobile multi-server latency at 41 ms. Netlife was fastest for fixed broadband, with a median download speed of 91.56 Mbps. Netlife also recorded the lowest latency over fixed broadband at 8 ms. Xtrim recorded the highest fixed broadband Consistency at 84.8%. Of Ecuador’s most populous cities, Santo Domingo recorded the fastest median mobile download speed of 31.58 Mbps, while Guayaquil recorded the fastest median fixed download speed of 88.59 Mbps.
El Salvador: Claro had the fastest median download speed among mobile operators in El Salvador, at 40.97 Mbps, along with the highest Consistency of 90.4%. Movistar registered the fastest median mobile upload speed of 13.35 Mbps and lowest latency at 73 ms. Cable Color recorded the fastest median fixed download speed at 55.57 Mbps, the top median upload speed at 57.04 Mbps, and the lowest median latency of 51 ms. Of El Salvador’s most populous cities, Santa Tecla showed the fastest median mobile and fixed download speeds during Q4 2023 at 39.27 Mbps and 54.98 Mbps respectively.
Guatemala: Claro was the fastest mobile operator in Guatemala during Q4 2023 with a median download speed of 41.63 Mbps and a median upload speed of 19.61 Mbps. Claro also had the highest Consistency at 87.9%, while also leading the market for 5G performance, with a median 5G download speed of 388.34 Mbps. Tigo recorded the lowest median mobile latency at 79 ms. SpaceX’s Starlink was fastest for median fixed download performance at 54.32 Mbps, while Cable Color was fastest for fixed upload performance at 33.45 Mbps. Cable Color also had the lowest median latency on fixed broadband at 27 ms. Claro recorded the highest fixed broadband Consistency at 73.1%. Of Guatemala’s most populous cities, Escuintla showed the fastest median mobile download speed during Q4 2023 at 44.16 Mbps, while Villa Nueva recorded the fastest median fixed download speed, at 60.83 Mbps.
Guyana: There was no winner of fastest median mobile performance in Guyana during Q4 2023, with ENet and Digicel posting median download speeds of 24.64 Mbps and 23.53 Mbps, respectively. ENet recorded the fastest median mobile upload speed at 18.49 Mbps and offered the lowest median latency at 143 ms. In the fixed broadband market, ENet recorded the fastest median download and upload speeds, of 70.20 Mbps and 52.25 Mbps, respectively, while also recording the lowest median latency of 130 ms. GTT recorded the highest fixed broadband Consistency during Q4 2023, at 69.2%.
Haiti: Digicel was the fastest mobile operator in Haiti with a median mobile download speed of 14.26 Mbps, a median upload speed of 10.52 Mbps, and Consistency of 67.2%. Natcom recorded the lowest mobile latency, of 62 ms. SpaceX Starlink had the fastest median fixed download speed at 41.73 Mbps. Natcom had the fastest median fixed upload speed at 31.89 Mbps, the lowest median fixed latency at 47 ms, and the highest fixed broadband Consistency of 64.0%.
Honduras: Claro recorded the fastest median mobile download and upload speeds during Q4 2023, of 53.06 Mbps and 16.22 Mbps, respectively, while also recording the highest Consistency at 87.2%. Tigo recorded the lowest median mobile latency at 93 ms. Claro had the fastest median fixed download speed at 47.26 Mbps during Q4 2023, and the highest fixed broadband Consistency at 80.2%. TEVISAT recorded the fastest median upload speed, of 22.36 Mbps, and the lowest median fixed latency at 20 ms. Of Honduras’ most populous cities, El Progreso recorded the fastest median mobile download speed during Q4 2023, of 41.69 Mbps, while Tegucigalpa showed the fastest median fixed download speed at 41.97 Mbps.
Jamaica:There was no winner of fastest median mobile download performance in Jamaica during Q4 2023, with Flow and Digicel tied. Digicel recorded the fastest median upload speed of 8.37 Mbps and highest Consistency of 81.9%. Flow had the lowest mobile median latency at 38 ms. SpaceX Starlink had the fastest median download speed over fixed broadband at 84.10 Mbps, and the highest fixed broadband Consistency at 77.8%. Digicel+ recorded the fastest median upload speed of 46.14 Mbps, while Flow recorded the lowest median fixed latency at 25 ms.
Mexico: Telcel had the fastest median download and upload speeds over mobile at 52.06 Mbps and 13.50 Mbps, respectively, and the operator also delivered the fastest median 5G download speed at 233.82 Mbps. Telcel also had the lowest mobile median latency at 62 ms and highest Consistency at 87.2%. Totalplay was fastest for fixed broadband with a median download speed of 88.87 Mbps and a median upload speed of 30.50 Mbps. Totalplay also had the lowest median fixed broadband latency at 28 ms and the highest Consistency at 84.0%. Among Mexico’s most populous cities, Monterrey recorded the fastest median mobile download speed of 38.36 Mbps, while Guadalajara recorded the fastest median fixed broadband speed of 80.32 Mbps.
Panama: MasMovil was the fastest mobile operator with median download and upload speeds of 27.24 Mbps and 15.18 Mbps, respectively, as well as the highest Consistency of 79.3%. Digicel recorded the lowest median mobile latency, at 34 ms. There was no winner of the fastest median fixed download performance, with both Tigo and MasMovil tied. MasMovil recorded the fastest median upload speed of 33.38 Mbps and the lowest median latency at 16ms. Among Panama’s most populous cities, David recorded the fastest median mobile download speed of 21.57 Mbps, while La Chorrera recorded the fastest median fixed broadband speed of 156.71 Mbps.
Peru: Claro was the fastest mobile operator in Peru with a median download speed of 23.30 Mbps during Q4 2023, and also had the highest mobile Consistency in the market with 80.6%.
Trinidad and Tobago: Digicel had the fastest median download speed over mobile at 33.29 Mbps and the highest Video Score in the market at 74.86. bmobile recorded the fastest median mobile upload speed of 12.17 Mbps, and the lowest median latency at 32 ms. Digicel+ had the fastest median fixed broadband download and upload speeds at 118.53 Mbps and 107.24 Mbps, respectively. Digicel+ also had the lowest median latency at 7 ms.
United States: T-Mobile was the fastest mobile operator with median download and upload speeds of 188.96 Mbps and 12.19 Mbps, respectively. T-Mobile also recorded the highest mobile Consistency at 87.3%, and the lowest median mobile latency of 50 ms. T-Mobile also led the market with the fastest median 5G download speed at 238.87 Mbps, as well as the lowest 5G latency of 48 ms. T-Mobile secured the highest Video Score across all technologies with 78.21, and for 5G, with a Video Score of 81.54. Cox led the market as the fastest fixed broadband provider with a median download speed of 261.27 Mbps, while AT&T Internet recorded the fastest median fixed upload speed of 195.64 Mbps, and Verizon had the lowest median latency over fixed broadband at 15 ms.
Uruguay: Antel was the fastest mobile operator in Uruguay during Q4 2023 with a median download speed of 117.79 Mbps, and recorded the lowest median latency of 44 ms.
Venezuela: Digitel was the fastest mobile operator with a median download speed of 14.37 Mbps and a median upload speed of 6.97 Mbps during Q4 2023. Digitel also recorded the highest Consistency in the market, with 68.0%, and the lowest median latency of 97 ms. Airtek Solutions had the fastest median fixed download and upload speeds of 94.76 Mbps and 94.89 Mbps, respectively. Airtek Solutions also recorded the highest fixed broadband Consistency of 86.0%, and the lowest median latency at 7 ms. Among Venezuela’s most populous cities, Maracaibo recorded the fastest median mobile and fixed download speeds of 17.17 Mbps and 82.35 Mbps, respectively.
Afghanistan: The fastest mobile operator in Afghanistan was Afghan Wireless with a median download speed of 6.68 Mbps in Q4 2023. The operator also had the lowest median latency at 77 ms and the highest Consistency of 51.0%.
Bangladesh: Banglalink was the fastest mobile operator in Bangladesh with a median download speed of 26.74 Mbps in Q4 2023. Banglalink also recorded the highest Consistency of 89.0% and the lowest median latency of 33 ms. DOT Internet was the fastest fixed broadband provider with a median download speed of 91.35 Mbps, while also recording the highest Consistency at 87.5% and the lowest median latency at 5 ms.
Bhutan: There was no statistical winner for fastest mobile download performance during Q4 2023 in Bhutan, with TashiCell and BT both tied with speeds of 31.52 Mbps and 28.15 Mbps, respectively. TashiCell recorded the lowest median mobile latency of 52 ms.
Brunei: There was no statistical winner for fastest mobile download performance during Q4 2023 in Brunei, with DST and Imagine both tied with speeds of 97.34 Mbps and 91.53 Mbps, respectively.
Cambodia: Cellcard recorded the fastest median mobile download speed at 33.74 Mbps during Q4 2023, while Metfone recorded the highest Consistency at 80.8% and the lowest median latency at 38 ms. MekongNet was the fastest fixed broadband provider, with a median fixed download speed of 48.29 Mbps. MekongNet also recorded the highest Consistency at 71.1%. OpenNet recorded the lowest median latency over fixed broadband, at 7ms.
China: China Broadnet was the fastest mobile operator in China during Q4 2023, with a median download speed of 248.77 Mbps, and median 5G download speed of 305.61 Mbps. China Mobile recorded the lowest median mobile latency, at 42 ms. There was no statistical winner for fastest fixed download performance, with China Unicom and China Mobile both tied with speeds of 246.93 Mbps and 245.59 Mbps, respectively. China Mobile recorded the highest fixed broadband Consistency, of 93.4%, while China Telecom recorded the lowest median fixed broadband latency at 22 ms. Among China’s most populous cities, Beijing recorded the fastest median mobile download speed of 232.41 Mbps, while Tianjin recorded the fastest median fixed download speed of 326.07 Mbps.
Georgia:Geocell recorded the fastest mobile download performance during Q4 2023 in Georgia, at 50.52 Mbps, and the lowest mobile latency at 37 ms. MagtiCom had the fastest median fixed download speed at 27.81 Mbps and the highest Consistency of 66.5%. Among Georgia’s most populous cities, Tbilisi recorded the fastest median mobile download speed of 36.17 Mbps, while Rustavi recorded the fastest median fixed download speed of 27.38 Mbps.
Hong Kong (SAR): China Mobile Hong Kong was the fastest mobile operator in Hong Kong (SAR) during Q4 2023, with a median download speed across all technologies of 98.94 Mbps, and a median download speed over 5G of 177.96 Mbps. csl recorded the fastest median mobile upload speed, at 16.89 Mbps.
Indonesia: Telkomsel was the fastest Indonesian mobile operator with a median download speed of 31.14 Mbps. Telkomsel also had the lowest median mobile latency at 45 ms.
Japan: Rakuten Mobile recorded the fastest mobile download and upload speeds during Q4 2023 in Japan, at 51.16 Mbps and 20.21 Mbps, respectively. Rakuten Mobile also recorded the highest Consistency in the market at 90.6%, while SoftBank recorded the lowest median latency at 43 ms. So-net had the fastest fixed download and upload speeds, at 296.29 Mbps and 219.53 Mbps, respectively, as well as the lowest median latency over fixed broadband at 9 ms. SpaceX Starlink recorded the highest fixed broadband Consistency in the market at 96.4%.
Kazakhstan: Tele2 recorded the highest mobile Consistency in Kazakhstan during Q4 2023 with 85.3% and the lowest median mobile latency at 39 ms.
Malaysia: TM was the fastest fixed broadband provider in Malaysia with a median download speed of 112.00 Mbps in Q4 2023. TIME recorded the lowest fixed broadband latency at 9 ms.
Pakistan: Jazz delivered the fastest median mobile download speed in Pakistan at 21.38 Mbps in Q4 2023. Zong recorded the highest mobile Consistency, at 83.2%, and the lowest median mobile latency of 45 ms. Transworld recorded the fastest median fixed broadband download speed at 22.08 Mbps and the highest Consistency at 46.1%, while Connect Communications recorded the lowest median fixed broadband latency at 12 ms.
Philippines: Smart delivered the fastest median mobile download speed in the Philippines at 37.64 Mbps in Q4 2023.
South Korea: SK Telecom recorded the fastest median mobile download speed at 192.67 Mbps, while also recording the highest Consistency in the market at 89.1%. LG U+ had the lowest median mobile latency in the market at 76 ms. In South Korea’s fixed broadband market, LG U+ delivered the fastest median download speed at 146.20 Mbps, and the lowest median latency of 57 ms.
Sri Lanka:There was no statistical winner for fastest mobile download performance during Q4 2023 in Sri Lanka, with Dialog and SLT-Mobitel both tied with speeds of 23.98 Mbps and 23.89 Mbps, respectively. Dialog delivered the lowest median mobile latency of 36 ms. SLT-Mobitel recorded the fastest fixed download speed of 37.46 Mbps, as well as the highest fixed broadband Consistency of 57.9% and the lowest fixed broadband latency at 13 ms.
Vietnam: Viettel was the fastest fixed provider in Vietnam during Q4 2023, with a median download speed of 107.40 Mbps. Viettel also recorded the highest fixed broadband Consistency at 94.8% and the lowest median fixed broadband latency of 4 ms.
Albania: Vodafone recorded the fastest median mobile download speed in Albania during Q4 2023, of 53.36 Mbps. One Albania recorded the highest mobile Consistency of 86.1%. Digicom was the fastest fixed broadband provider with a median download speed of 94.74 Mbps. Abissnet recorded the lowest fixed broadband latency, at 7 ms. Among Albania’s most populous cities, Vlorë recorded the fastest median mobile download speed of 75.34 Mbps, while Shkodër recorded the fastest median fixed download speed of 69.91 Mbps.
Belgium: Proximus recorded the fastest median mobile download speed in Belgium during Q4 2023, at 89.67 Mbps. Proximus also recorded the highest mobile Consistency in the market at 89.8%. There was no statistical winner for fastest fixed download performance, with Telenet and VOO both tied with speeds of 158.08 Mbps and 156.00 Mbps, respectively. VOO recorded the highest Consistency at 89.8%. Among Belgium’s most populous cities, Ghent recorded the fastest median mobile and fixed download speeds, of 168.89 Mbps and 90.14 Mbps, respectively.
Denmark: Telia was the fastest mobile operator in Denmark during Q4 2023, with a median download speed of 163.41 Mbps. Hiper was fastest for fixed broadband, with a median download speed of 277.56 Mbps.
Estonia: The fastest mobile operator in Estonia was Telia with a median download speed of 92.39 Mbps in Q4 2023. Elisa recorded the highest mobile Consistency of 91.9%. Elisa was the fastest fixed broadband provider, with a median download speed of 100.13 Mbps. Elisa also recorded the highest fixed broadband Consistency, of 86.3%. Infonet recorded the lowest median fixed broadband latency of 5 ms.
Finland: DNA had the fastest median mobile download speed at 113.57 Mbps in Q4 2023, and the highest Consistency of 95.4%. DNA also recorded the fastest median 5G download performance, at 247.54 Mbps. Telia recorded the lowest median mobile latency of 31 ms. Lounea was fastest for fixed broadband with a median download speed of 171.31 Mbps. Lounea also recorded the highest fixed broadband Consistency in the market at 91.5%, as well as the lowest median fixed broadband latency at 13 ms.
Germany: Telekom was the fastest mobile operator in Germany during Q4 2023, with a median download speed of 90.26 Mbps, as well as the top median download speed over 5G at 179.25 Mbps. Telekom also recorded the highest mobile Consistency in the market at 92.1% and the lowest median mobile latency of 38 ms. Deutsche Glasfaser recorded the fastest fixed broadband performance, with a median download speed at 201.43 Mbps. Deutsche Glasfaser also recorded the highest fixed broadband Consistency in the market at 90.5% and the lowest latency of 14 ms.
Latvia:There was no statistical winner for fastest mobile download performance in Latvia during Q4 2023, with BITĖ and LMT both tied with speeds of 81.56 Mbps and 81.11 Mbps, respectively.BITĖ recorded the highest mobile Consistency in the market of 91.3%, while LMT recorded the lowest mobile latency at 27 ms. Balticom was fastest for fixed broadband with a median download speed of 275.19 Mbps, while also leading with the highest fixed broadband Consistency of 93.7%, and the lowest median latency at 4 ms. Among Latvia’s most populous cities, Olaine recorded the fastest median mobile download speed, of 170.18 Mbps, while Salaspils recorded the fastest median fixed broadband download speed of 94.64 Mbps.
Lithuania: Telia was the fastest mobile operator in Lithuania during Q4 2023, with a median download speed of 116.58 Mbps in Q4 2023. Telia also recorded the highest Consistency in the market at 94.7%, and the lowest median mobile latency at 32 ms. Cgates was fastest for fixed broadband with a median download speed of 177.14 Mbps. Cgates also recorded the highest Consistency over fixed broadband in the market at 90.9%, while Penki recorded the lowest fixed broadband latency, at 4ms. Among Lithuania’s most populous cities, Panevėžys recorded the fastest median mobile download speed, of 106.34 Mbps, while Klaipėda recorded the fastest median fixed broadband download speed of 138.34 Mbps.
Poland: T-Mobile was the fastest mobile operator in Poland during Q4 2023, with a median download speed of 49.10 Mbps. T-Mobile also recorded the highest Consistency in the market at 88.4%. Plus recorded the fastest 5G performance in the market, with a median 5G download speed of 133.34 Mbps. Plus also recorded the lowest median mobile latency, at 43 ms. UPC was the fastest provider for fixed broadband with a median download speed of 232.36 Mbps, while Netia recorded the lowest fixed broadband latency, at 16 ms. Among Poland’s most populous cities, Łódź recorded the fastest median mobile download speed of 46.53 Mbps, while Wrocław recorded the fastest median fixed download speed of 172.86 Mbps.
Turkey: Turkcell was the fastest mobile operator in Turkey with a median download speed of 56.73 Mbps in Q4 2023, and Turkcell also recorded the highest Consistency of 91.3%. Türk Telekom had the lowest median mobile latency at 39 ms. TurkNet was fastest for fixed broadband, with a median download speed of 66.57 Mbps. TurkNet also recorded the lowest median fixed latency at 13 ms, and the highest Consistency at 81.5%. Among Turkey’s most populous cities, Istanbul recorded the fastest median download speeds across mobile and fixed, at 38.50 Mbps and 47.81 Mbps, respectively.
New Zealand: There was no statistical winner for fastest mobile download performance during Q4 2023 in New Zealand, with One NZ and Spark both tied with speeds of 73.52 Mbps and 70.23 Mbps, respectively. 2degrees led the market with the highest Consistency of 91.0% and the lowest median mobile multi-server latency at 40 ms.
The Speedtest Global Index is your resource to understand how internet connectivity compares around the world and how it’s changing. Check back next month for updated data on country and city rankings, and look for updated Ookla Market Reports with 1H 2024 data in July.
Ookla retains ownership of this article including all of the intellectual property rights, data, content graphs and analysis. This article may not be quoted, reproduced, distributed or published for any commercial purpose without prior consent. Members of the press and others using the findings in this article for non-commercial purposes are welcome to publicly share and link to report information with attribution to Ookla.
Thailand has climbed two spots on fixed broadband to reach first place for the first time.
On mobile, Qatar climbed two spots to land in first place for mobile. While the country has ranked among the top five for the past year, this is the first time the country has reached the top spot.
Hungary has been steadily climbing the fixed broadband chart and currently ranks seventh.
Kuwait has reached sixth place, its highest mobile ranking to date, most likely due to an expanding 5G market.
AT&T had the fastest Speed ScoreTM in the U.S. on mobile in Q4 2020. Washington, DC showed the fastest median mobile download speed while Gilbert, AZ was the fastest city for fixed broadband.
Bell showed the fastest median download speed on 5G during Q4 2020. The city of Edmonton had the fastest mean download speed over fixed broadband and mobile.
China Telecom showed the fastest Speed Score on fixed broadband. China Telecom was also fastest on mobile 5G and had the highest 4G Availability on mobile. China Mobile showed the fastest Speed Score on mobile.
Lyon showed the fastest mean download speed over fixed broadband while Nice was fastest on mobile. Orange had the fastest Speed Score on mobile overall and on 5G. Free was the fastest provider for fixed broadband.
Telkomsel was the fastest mobile operator in Indonesia during Q3-Q4 2020 while Biznet was the fastest ISP. IM3 Ooredoo had the highest 4G Availability among mobile operators.
New Global Index Market Analyses are also available for:
Find out how Apple’s iPhone 12 series performed in select cities around the world in Q4 2020.
Ookla retains ownership of this article including all of the intellectual property rights, data, content graphs and analysis. This article may not be quoted, reproduced, distributed or published for any commercial purpose without prior consent. Members of the press and others using the findings in this article for non-commercial purposes are welcome to publicly share and link to report information with attribution to Ookla.
There was not a lot of movement in the top 10 for mobile. Canada (11th) was replaced by Bulgaria (10th).
For fixed broadband, Cyprus rose 10 ranks to 16th — their highest standing in the last 13 months.
Spain and Hungary both rose three spots on fixed broadband, to sixth and seventh, respectively. Both countries have shown steady improvement in fixed download speed over the last 13 months.
For the first time in 13 months, Switzerland fell out of the top 10 for fixed broadband (to 11th).
The upcoming Ookla® webinar will share how you can accurately position your 5G network using claims backed by the industry’s most trusted source for network data — while also building more trust with consumers.
Ookla retains ownership of this article including all of the intellectual property rights, data, content graphs and analysis. This article may not be quoted, reproduced, distributed or published for any commercial purpose without prior consent. Members of the press and others using the findings in this article for non-commercial purposes are welcome to publicly share and link to report information with attribution to Ookla.