| November 5, 2020

Unable to Connect — The Most Significant Online Service Outages in Q3 2020

“Is it down?” frustrated users asked themselves during the multiple online service outages in Q3 2020. The fourth installment of our online service outage tracking series used Downdetector® data from Q3 2020 and focused on the following online service categories: cloud services, collaboration platforms, financial services, gaming, internet service providers and social media.

Cloud services

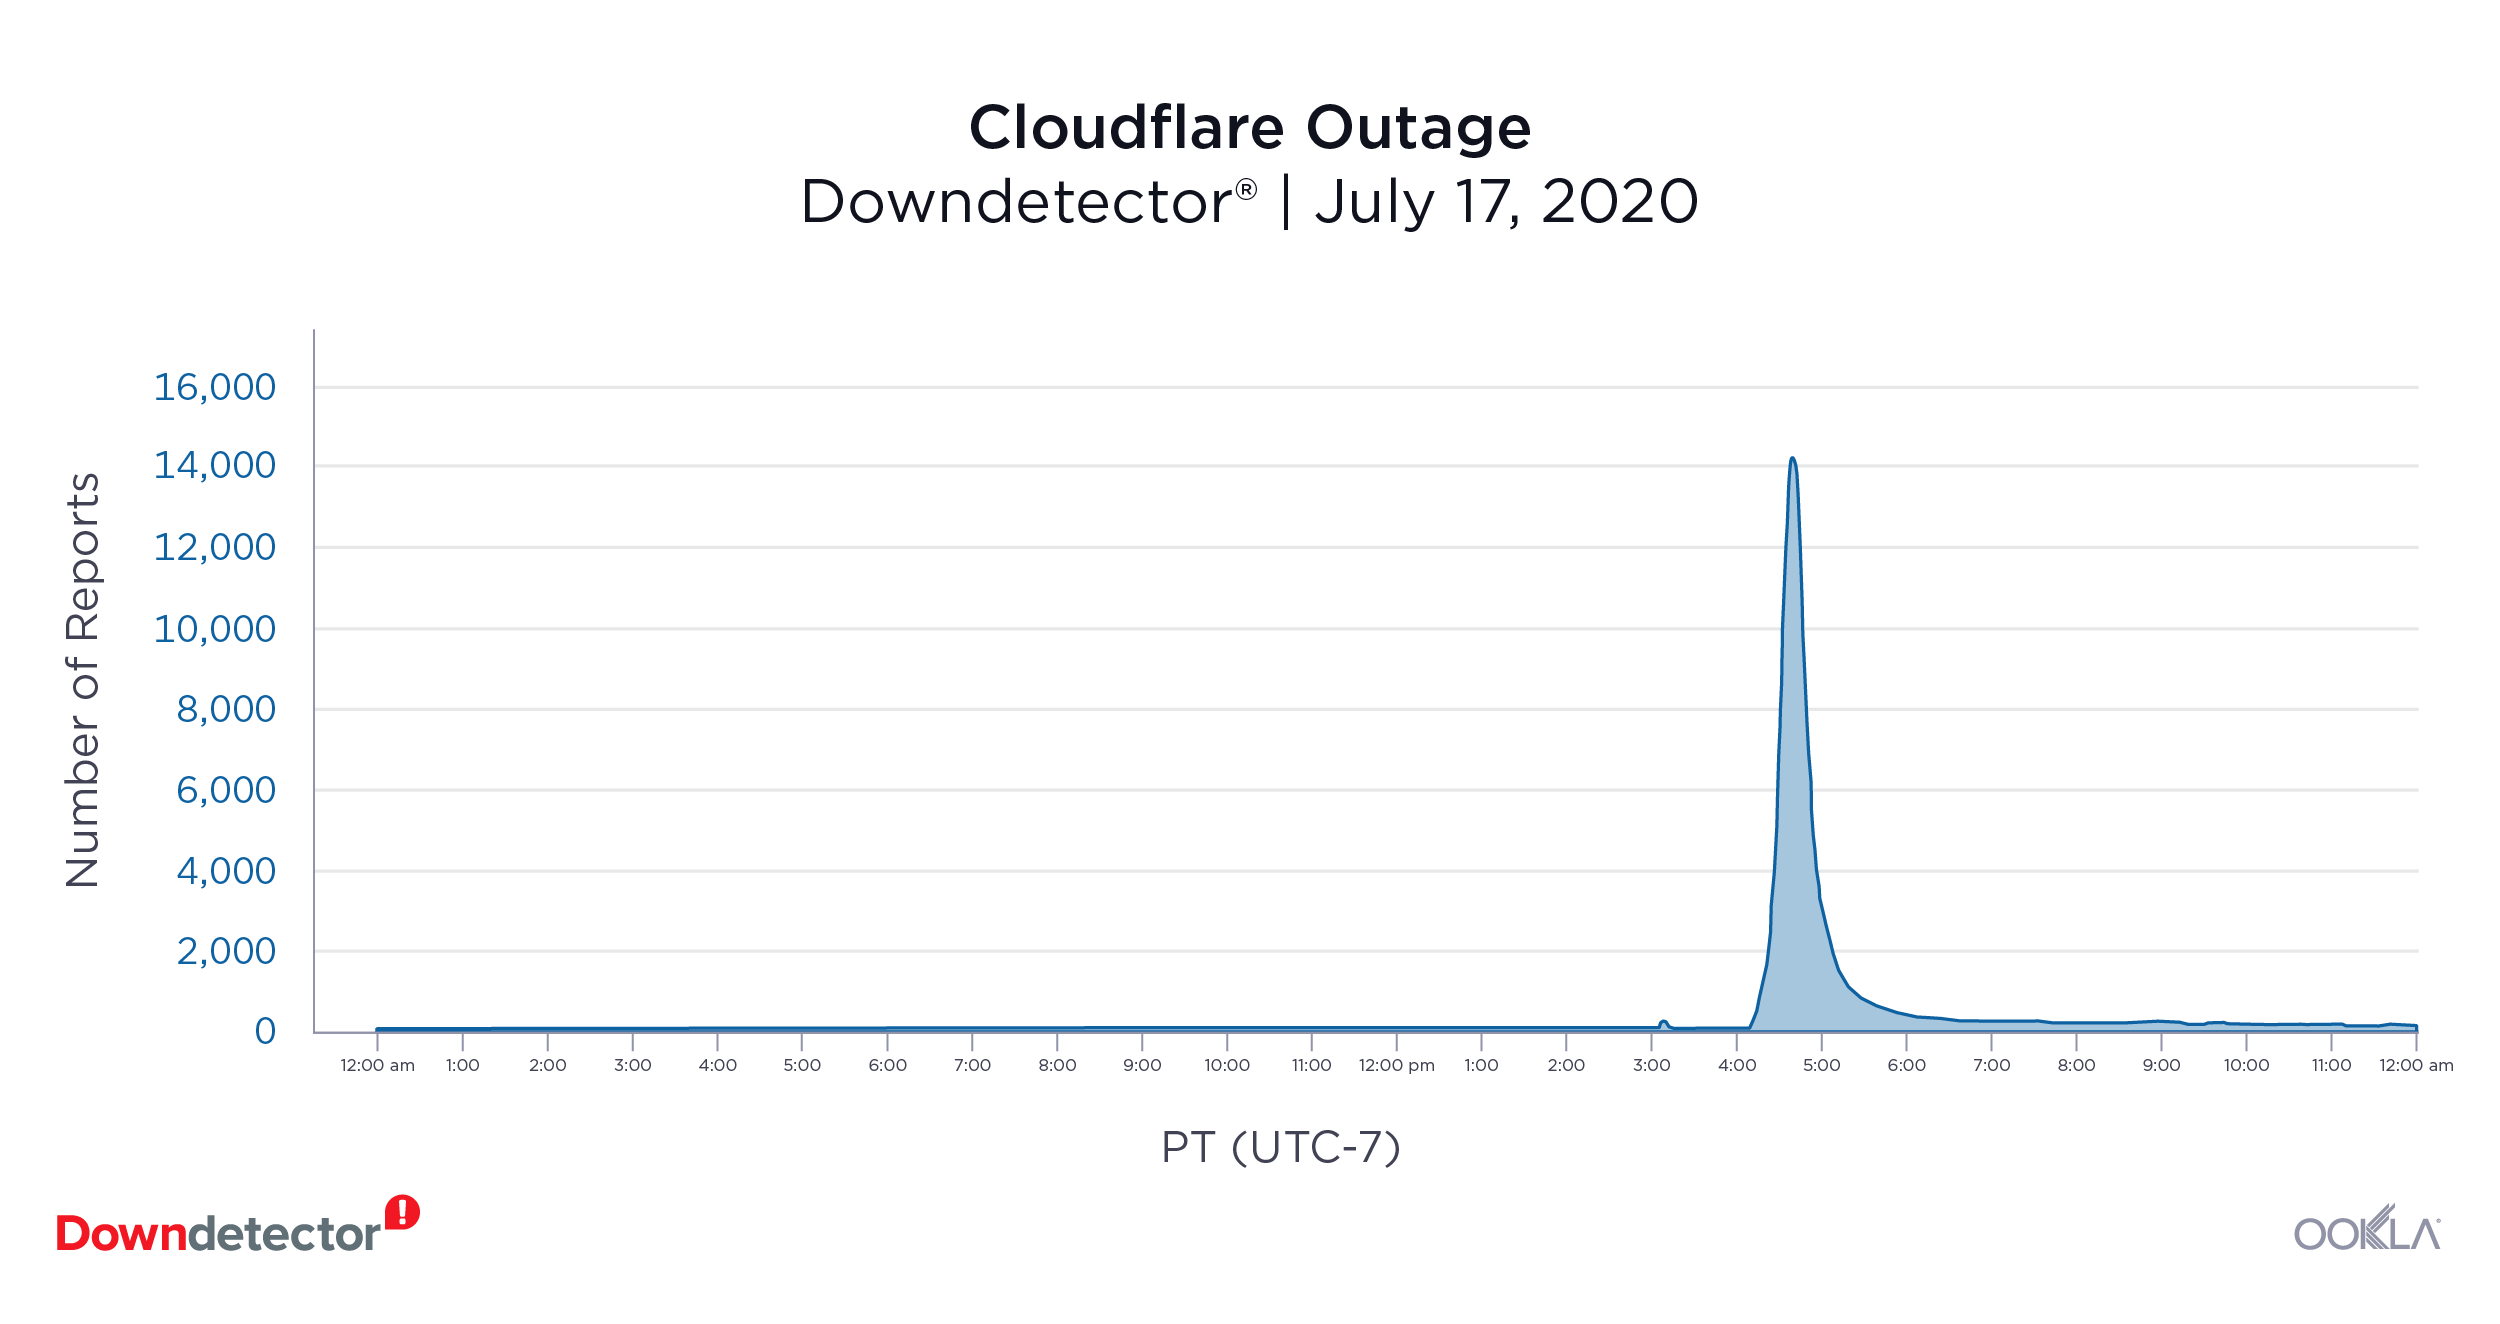
Cloudflare (July 17, 2020): 14,198 reports at peak

Downdetector_Cloudflare_Outage_1020

On July 17, a major disruption in Cloudflare’s service broke the internet, taking multiple online services down with it. Users rushed to Downdetector to log issues with multiple services that rely on Cloudflare for content delivery, including 4chan, DoorDash and Zendesk. At the peak of the outage, there were 14,198 reports of issues with the service in the U.S.

Azure (September 28, 2020): 2,846 reports at peak

Azure, Microsoft’s cloud service, was affected by September 28’s Microsoft-wide outage (see next category). Users from Germany, India, Japan and the U.S. stated they had issues with the cloud service. That day, there were 2,846 reports of issues at the peak of the outage in the U.S.

Collaboration platforms

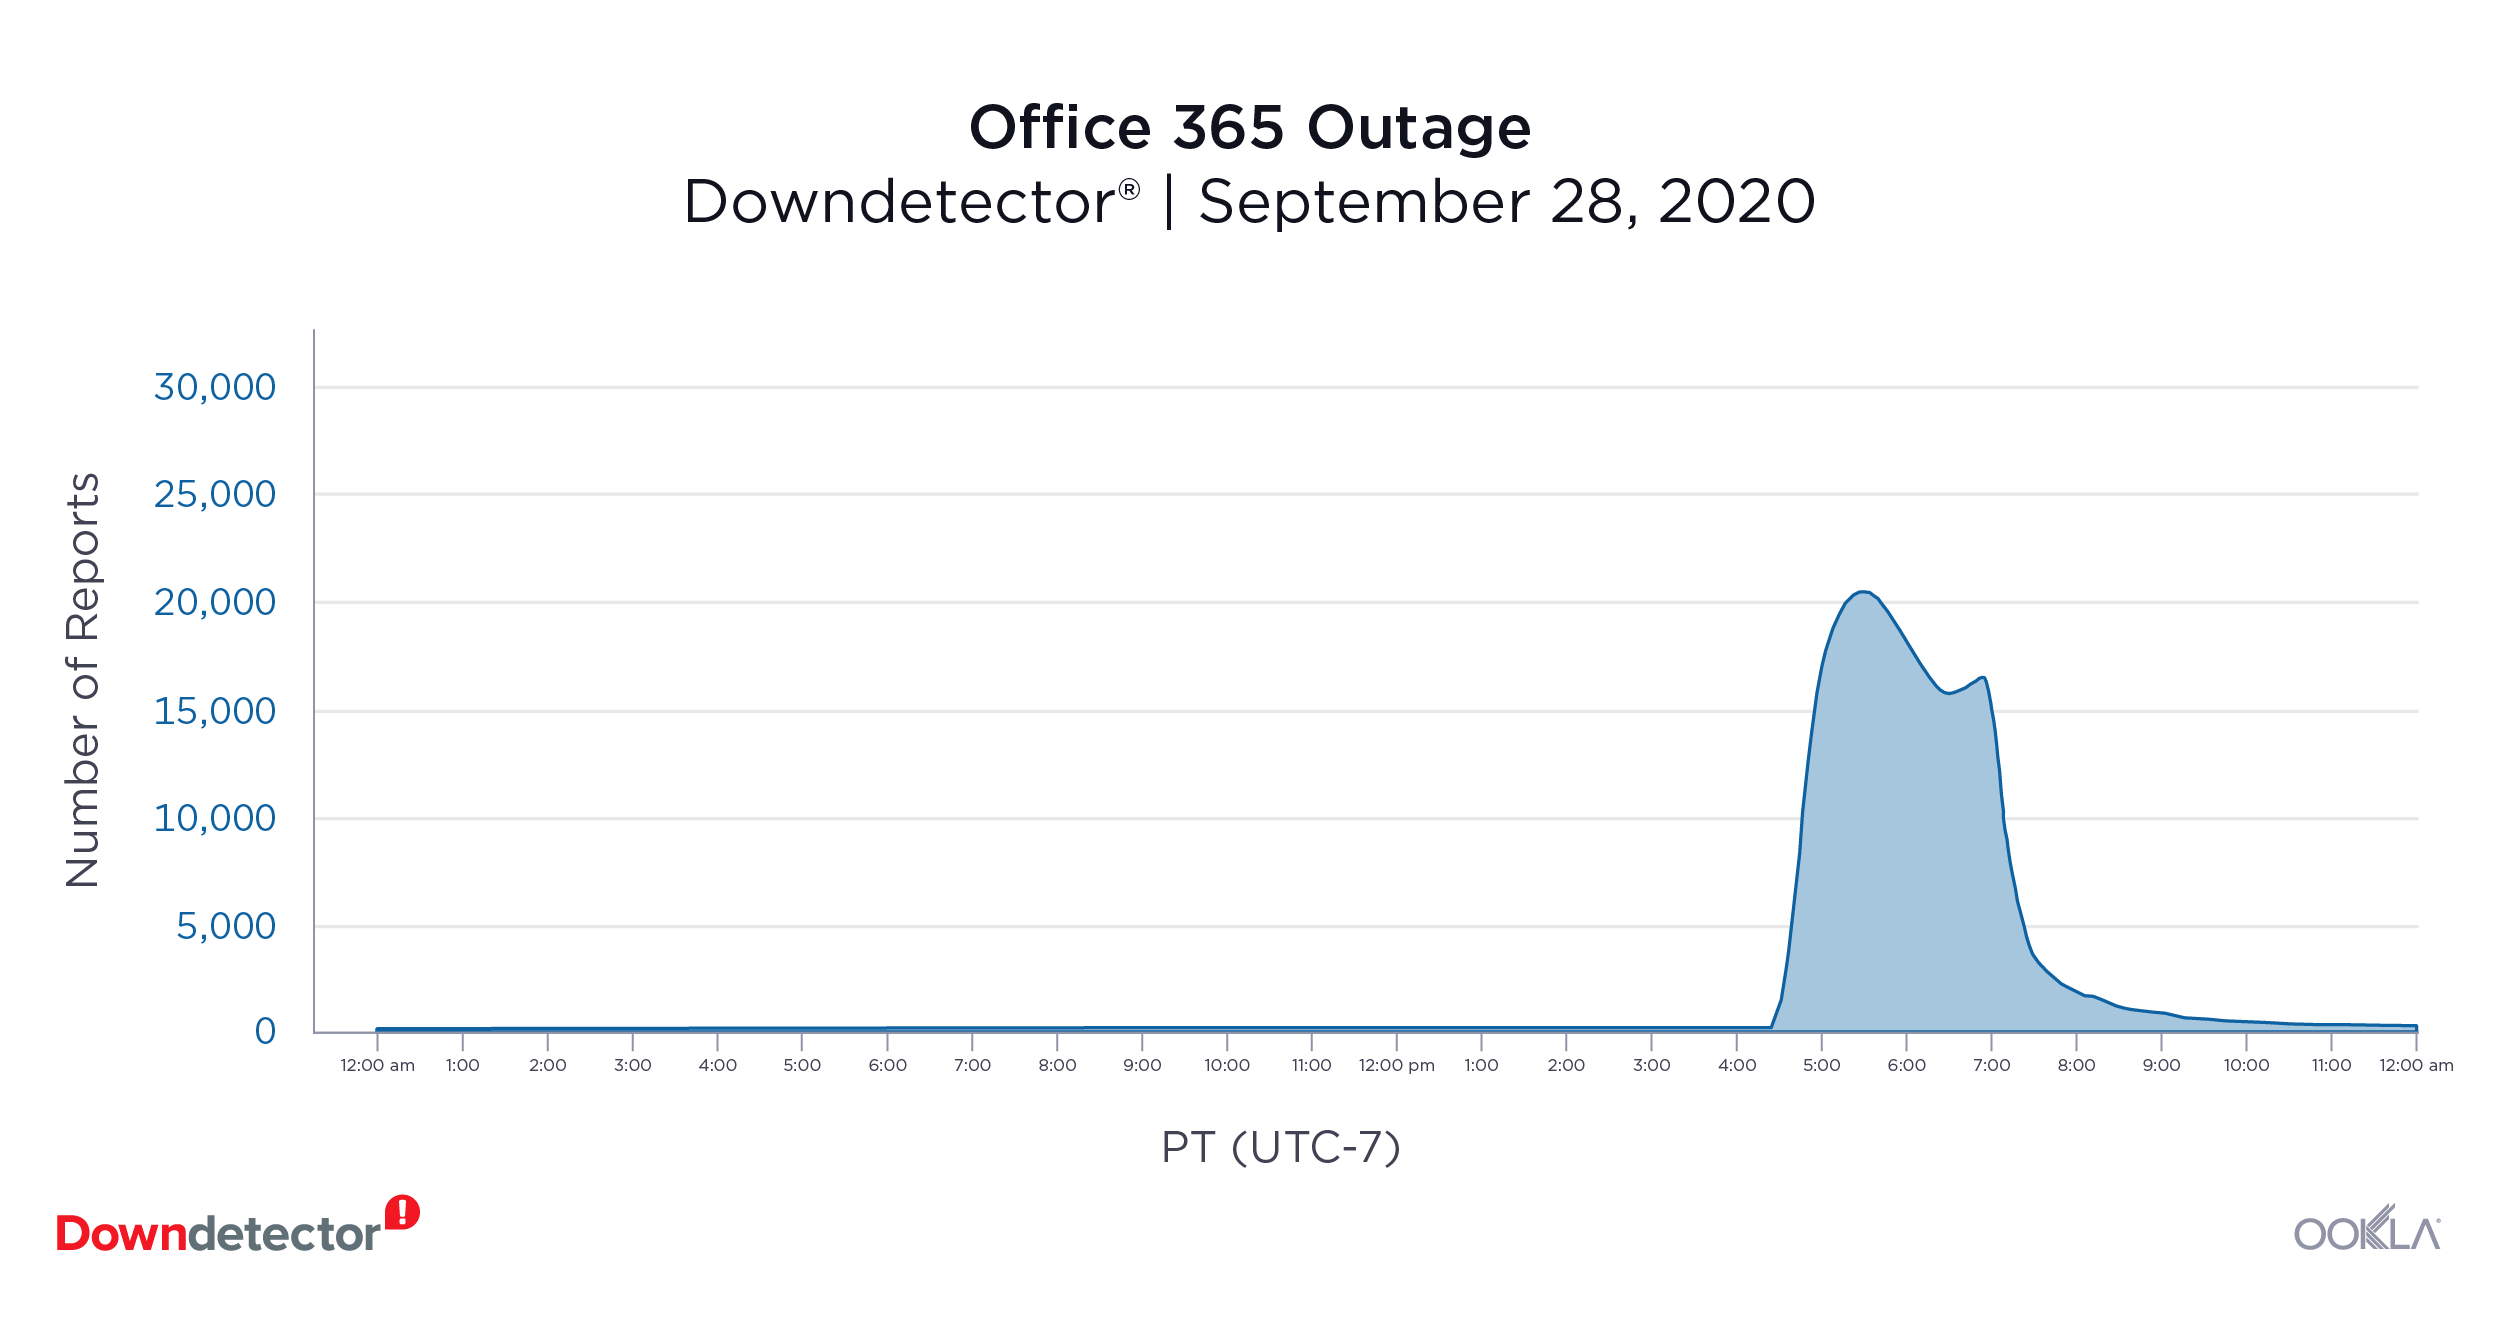
Office 365 (September 28,2020): 20,437 reports at peak

Downdetector_Office365_Outage_1020

Microsoft’s suite of online collaboration services including Outlook, Sharepoint, OneDrive and Skype went down on September 28 (along with Azure, see above). Logs of issues with the services started coming into Downdetector at 3 p.m Pacific. Most users stated being unable to log in or connect to the server. At the peak, there were 20,437 reported issues in the U.S. Users from Japan and India also logged problems with the service that day.

Zoom (August 24, 2020): 17,874 reports at peak

On August 24, users were upset to find that they were unable to connect with their coworkers, friends and family through Zoom. Most users stated problems with logging in and joining a conference. There were 17,874 reports of issues in the U.S. at the peak of the outage. Users in the U.K. and Canada also had issues with the video conferencing service that day.

Google Drive (September 24, 2020): 14,715 reports at peak

Users in the U.S., Philippines and Indonesia were unable to collaborate on projects, upload files or access their documents stored in Google Drive on September 24. At the peak of the outage in the U.S., there were 14,715 reported issues. Users of Google products YouTube and Gmail also logged issues in Brazil, Germany, India, Japan, Mexico and the U.K.

Slack (September 29, 2020): 1,396 reports at peak

Slack received 1,396 logs of issues at the peak of the outage reports on September 29. Users in the U.S. had problems with sending messages, videos and images to their peers — and some were unable to connect to the platform at all.

Financial services

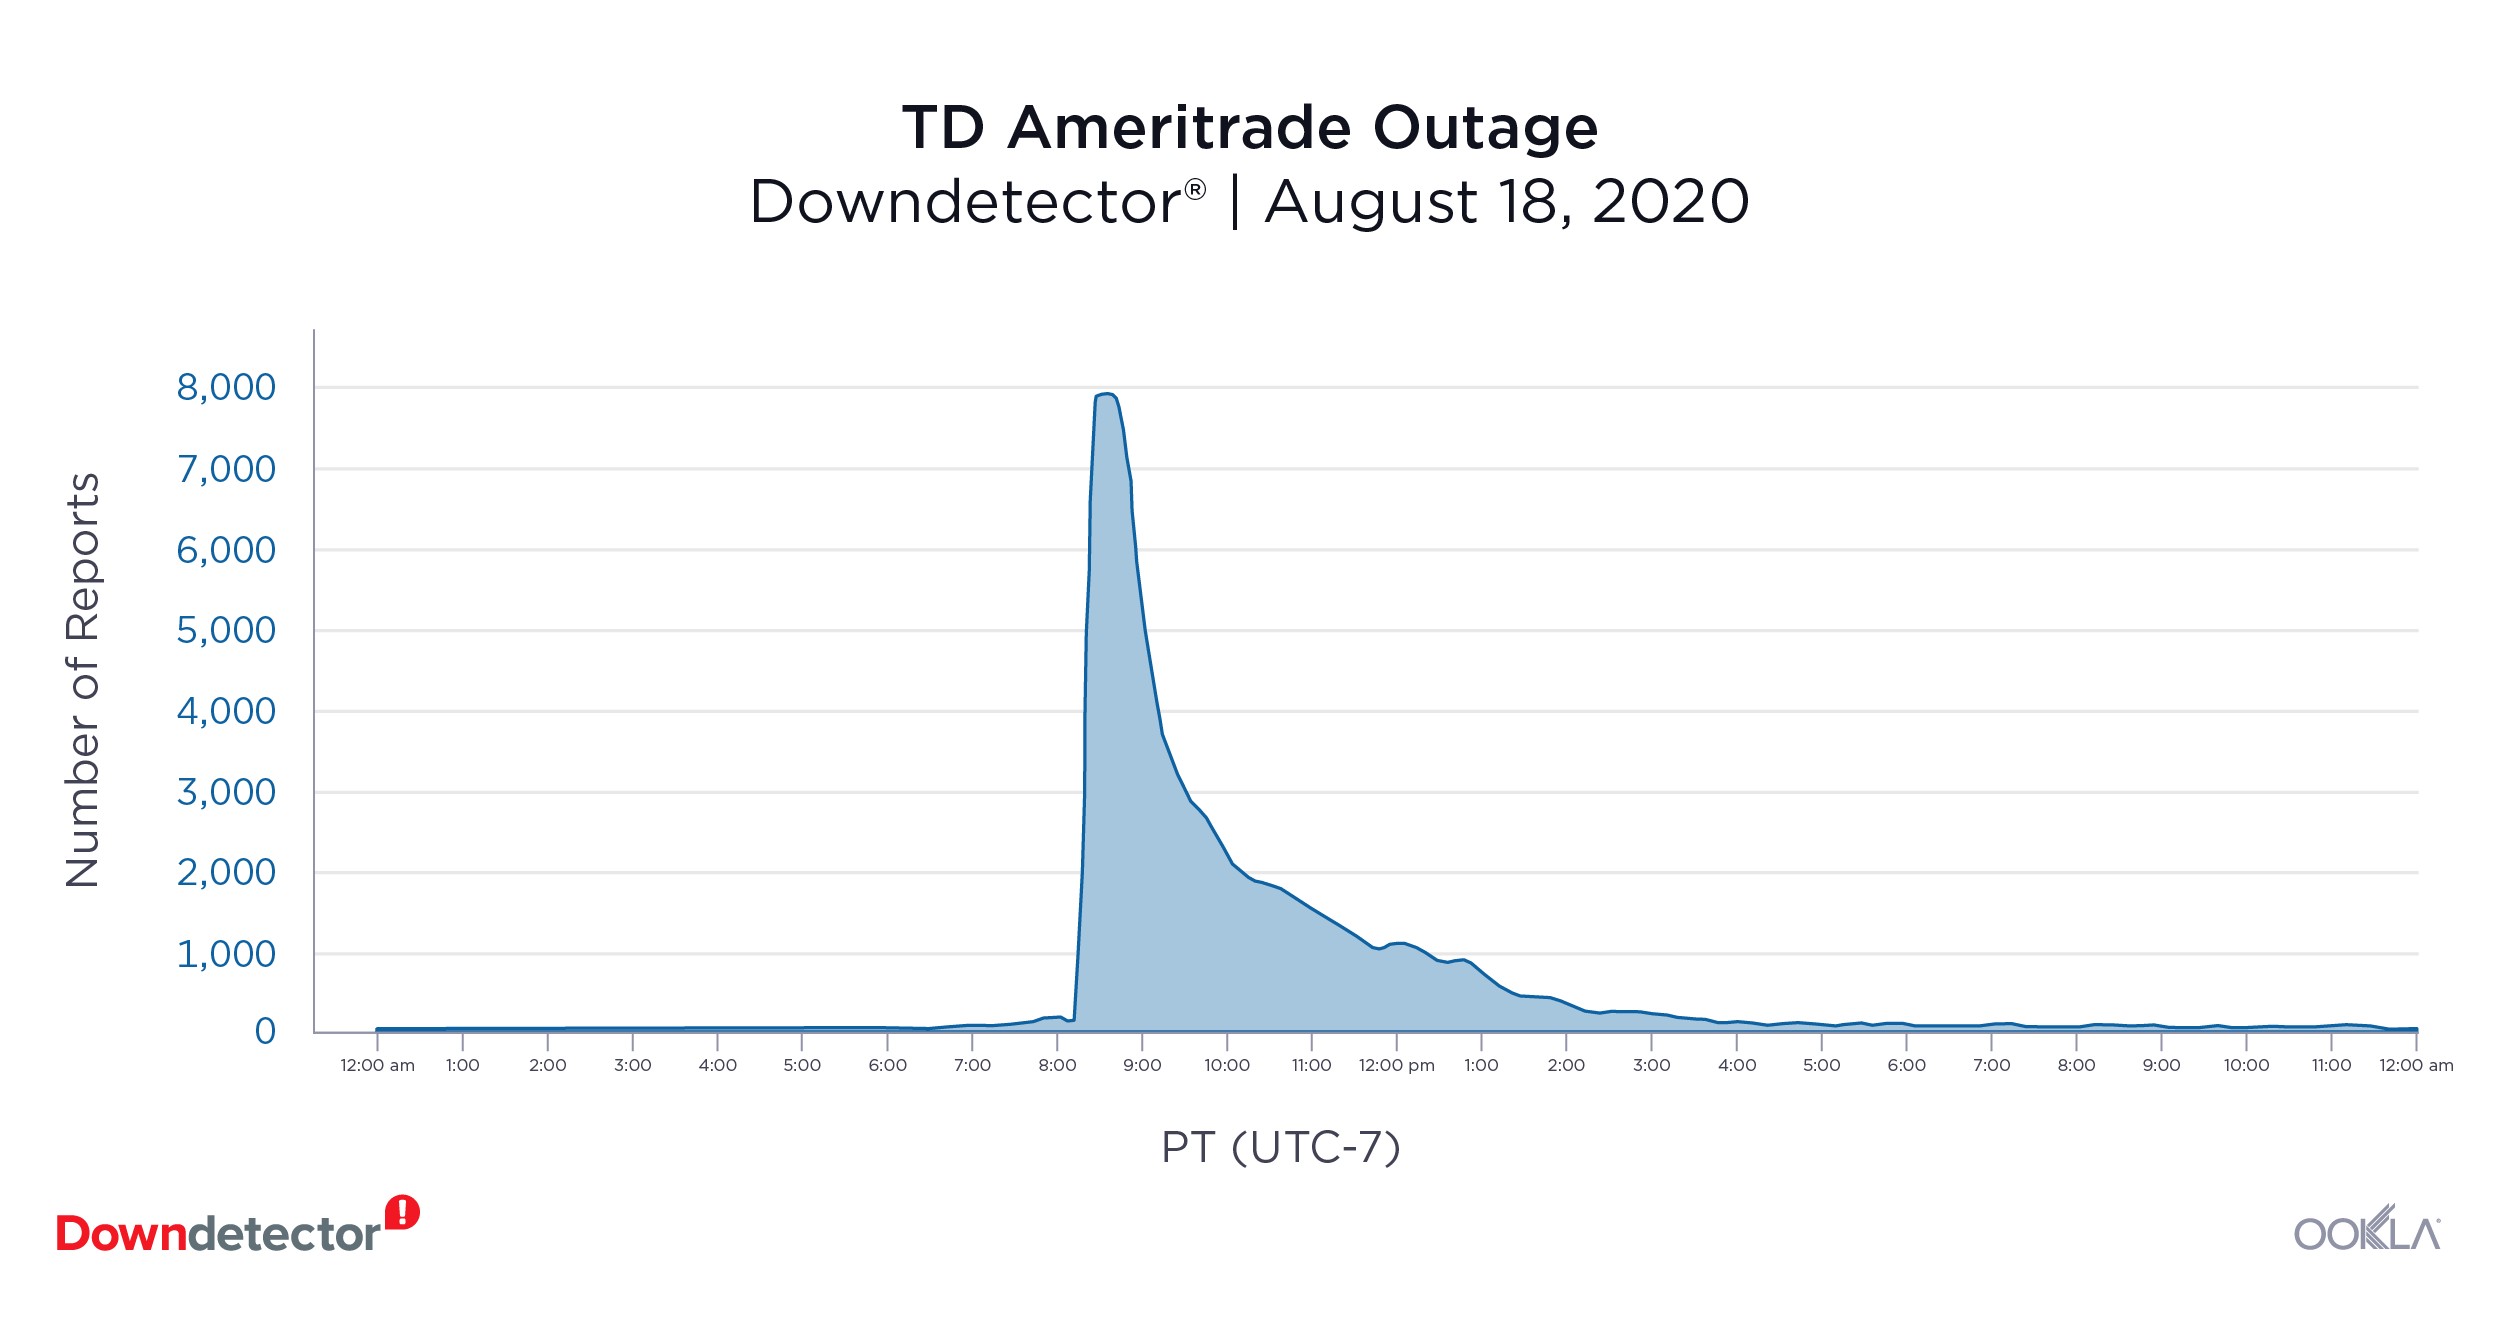
TD Ameritrade (August 18, 2020): 7,814 reports at peak

Downdetector_TD-Ameritrade_Outage_1020

The online stock investment tool reportedly went down on August 18. Users were unable to log into their account or buy and sell stocks. At the peak of the outage, there were 7,814 reports of issues in the U.S. There were two other notable outages that month — August 17 with 5,816 reports at peak and August 31 with 6,893 reports at peak.

Gaming

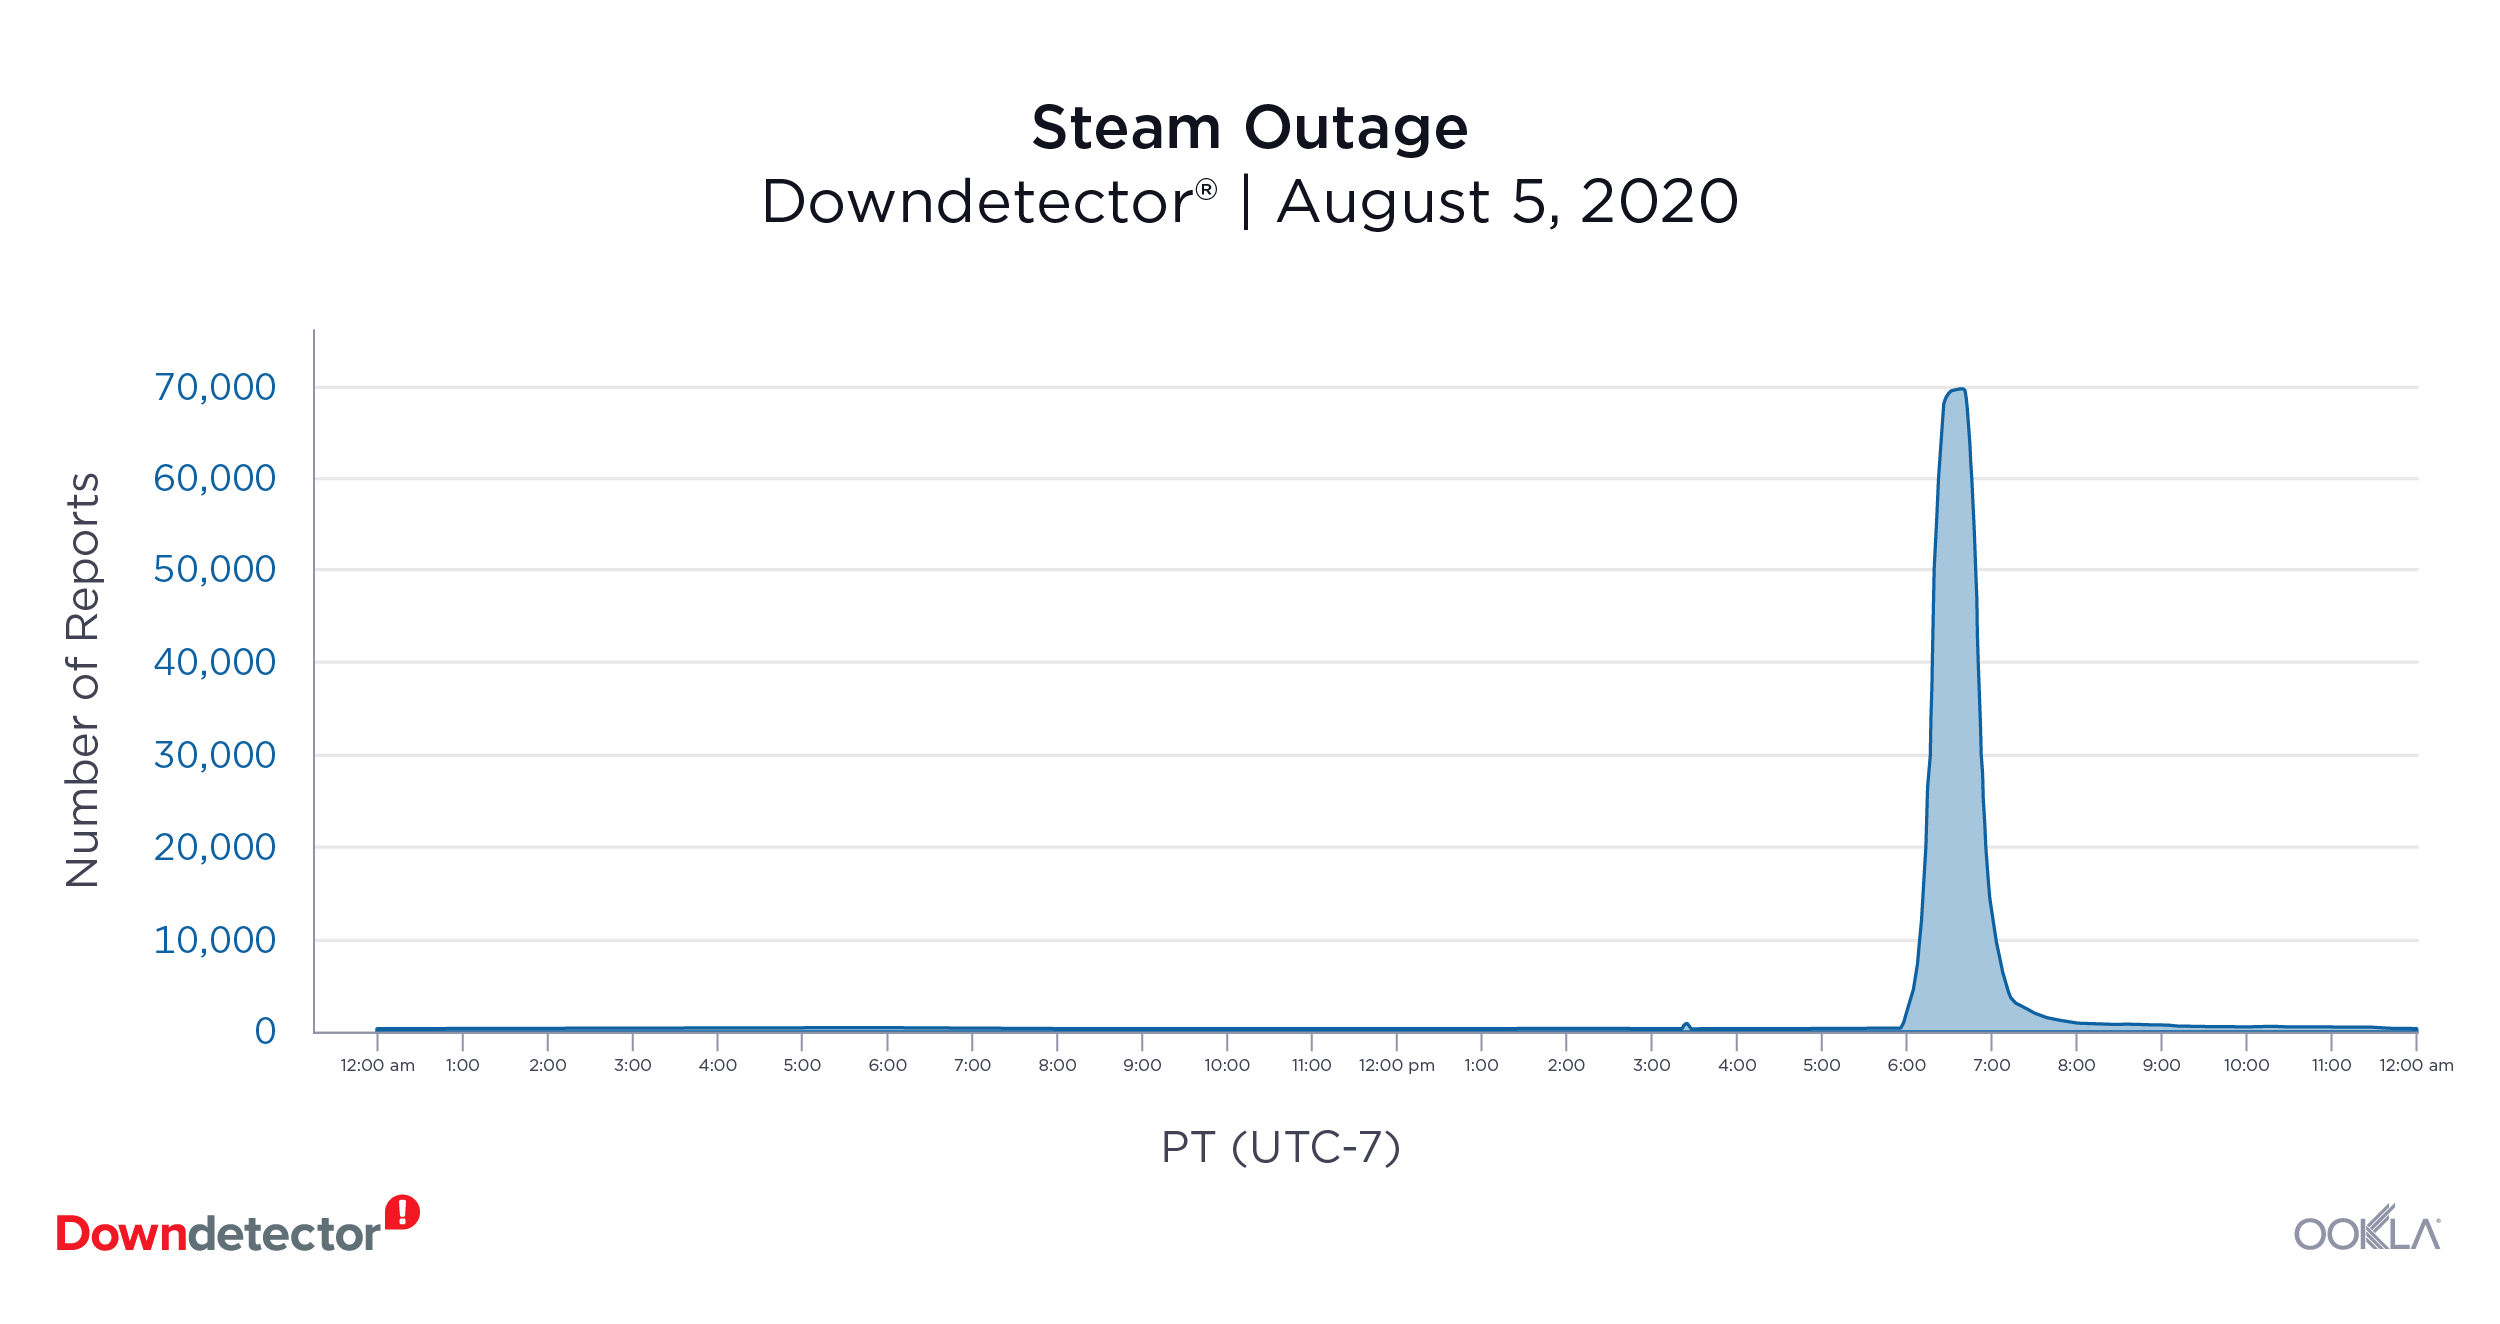
Steam (August 5, 2020): 69,255 reports at peak

Downdetector_Steam_Outage_1020

Users from Brazil, Germany, Japan, the U.K and the U.S. submitted issues with Steam on August 5. Most users stated problems when trying to log into the platform and play with other users. At the peak of the outage in the U.S, there were 69,255 reports of issues with the gaming platform.

Fall Guys (September 2, 2020): 2,890 reports at peak

The Fall Guys status page on Downdetector showed there were problems with the popular online game on September 2. Users in Brazil, the U.K. and the U.S. were struggling to play the game online. That day, 97% of reports stated problems with the server connection.

Internet service providers

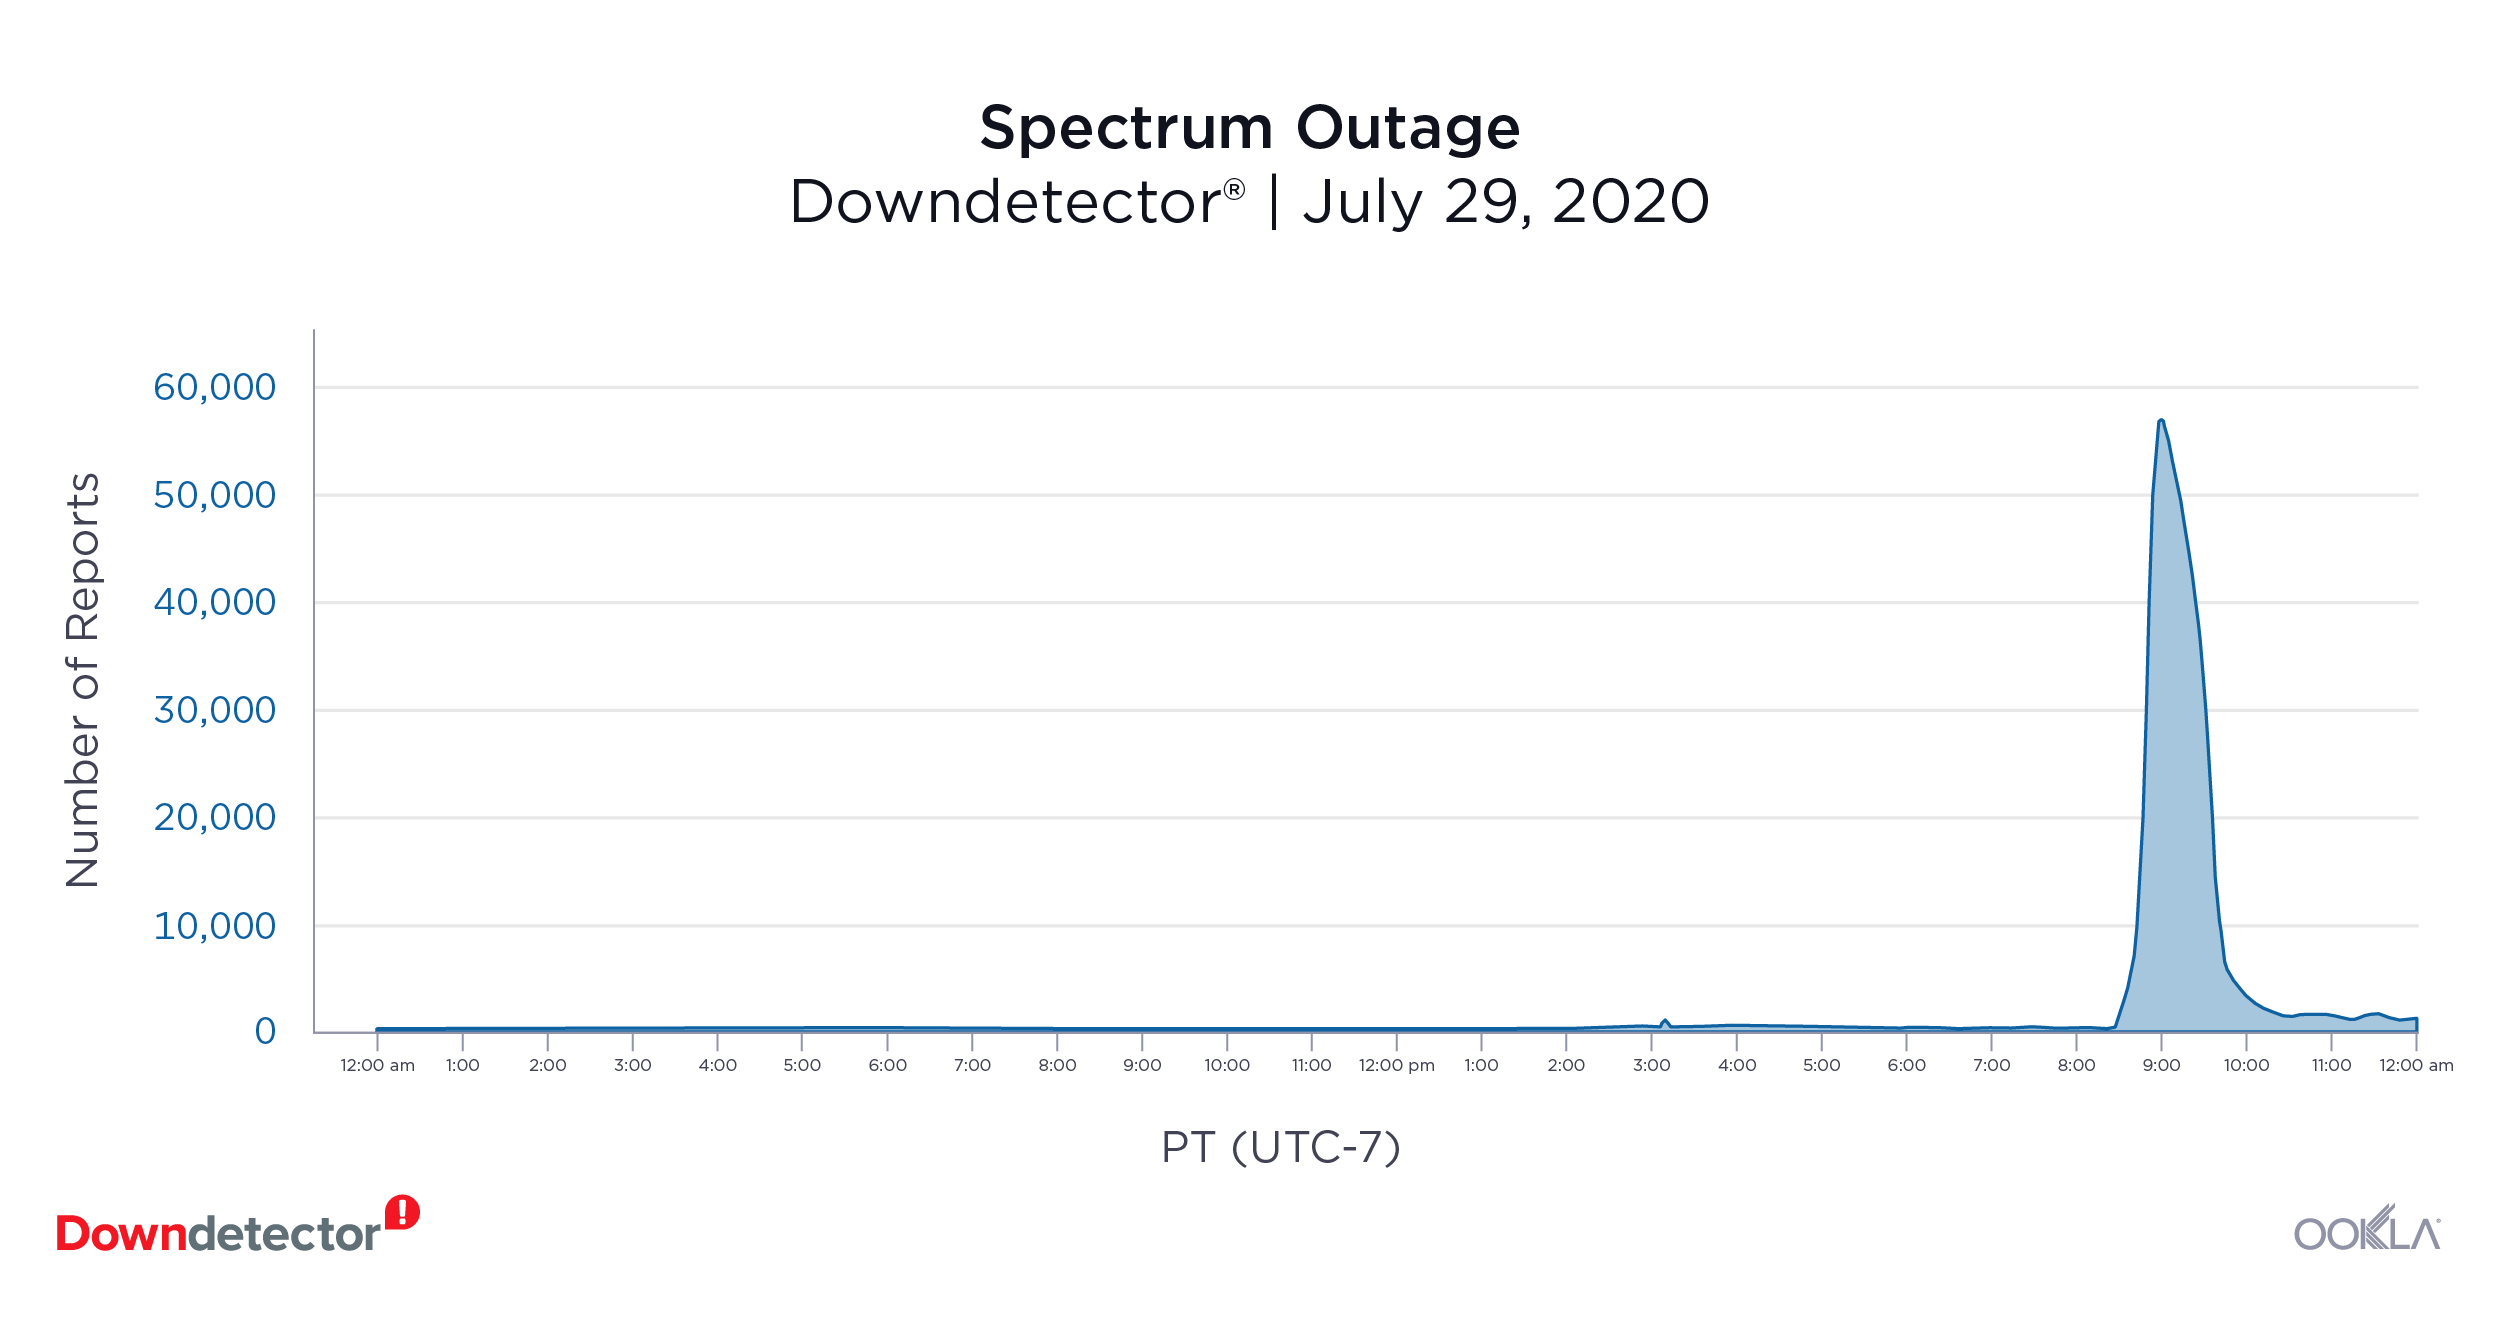
Spectrum (July 29, 2020): 56,318 reports at peak

Downdetector_Spectrum_Outage_1020

Spectrum users from the both coasts of the United States flooded Downdetector with logs of issues with the service when they started experiencing problems with their internet connections. Complaints with the service started surging at around 5 p.m. Pacific and lasted for about an hour. At the peak of the outage there were 56,318 reports of issues.

CenturyLink (August 30, 2020): 11,543 reports at peak

CenturyLink customers on the East Coast of the U.S. had problems with their internet service on August 30 starting around 2 a.m. Pacific and ending around 8 a.m. Pacific. There were 11,543 reports of issues at the peak of the outage.

Social Media

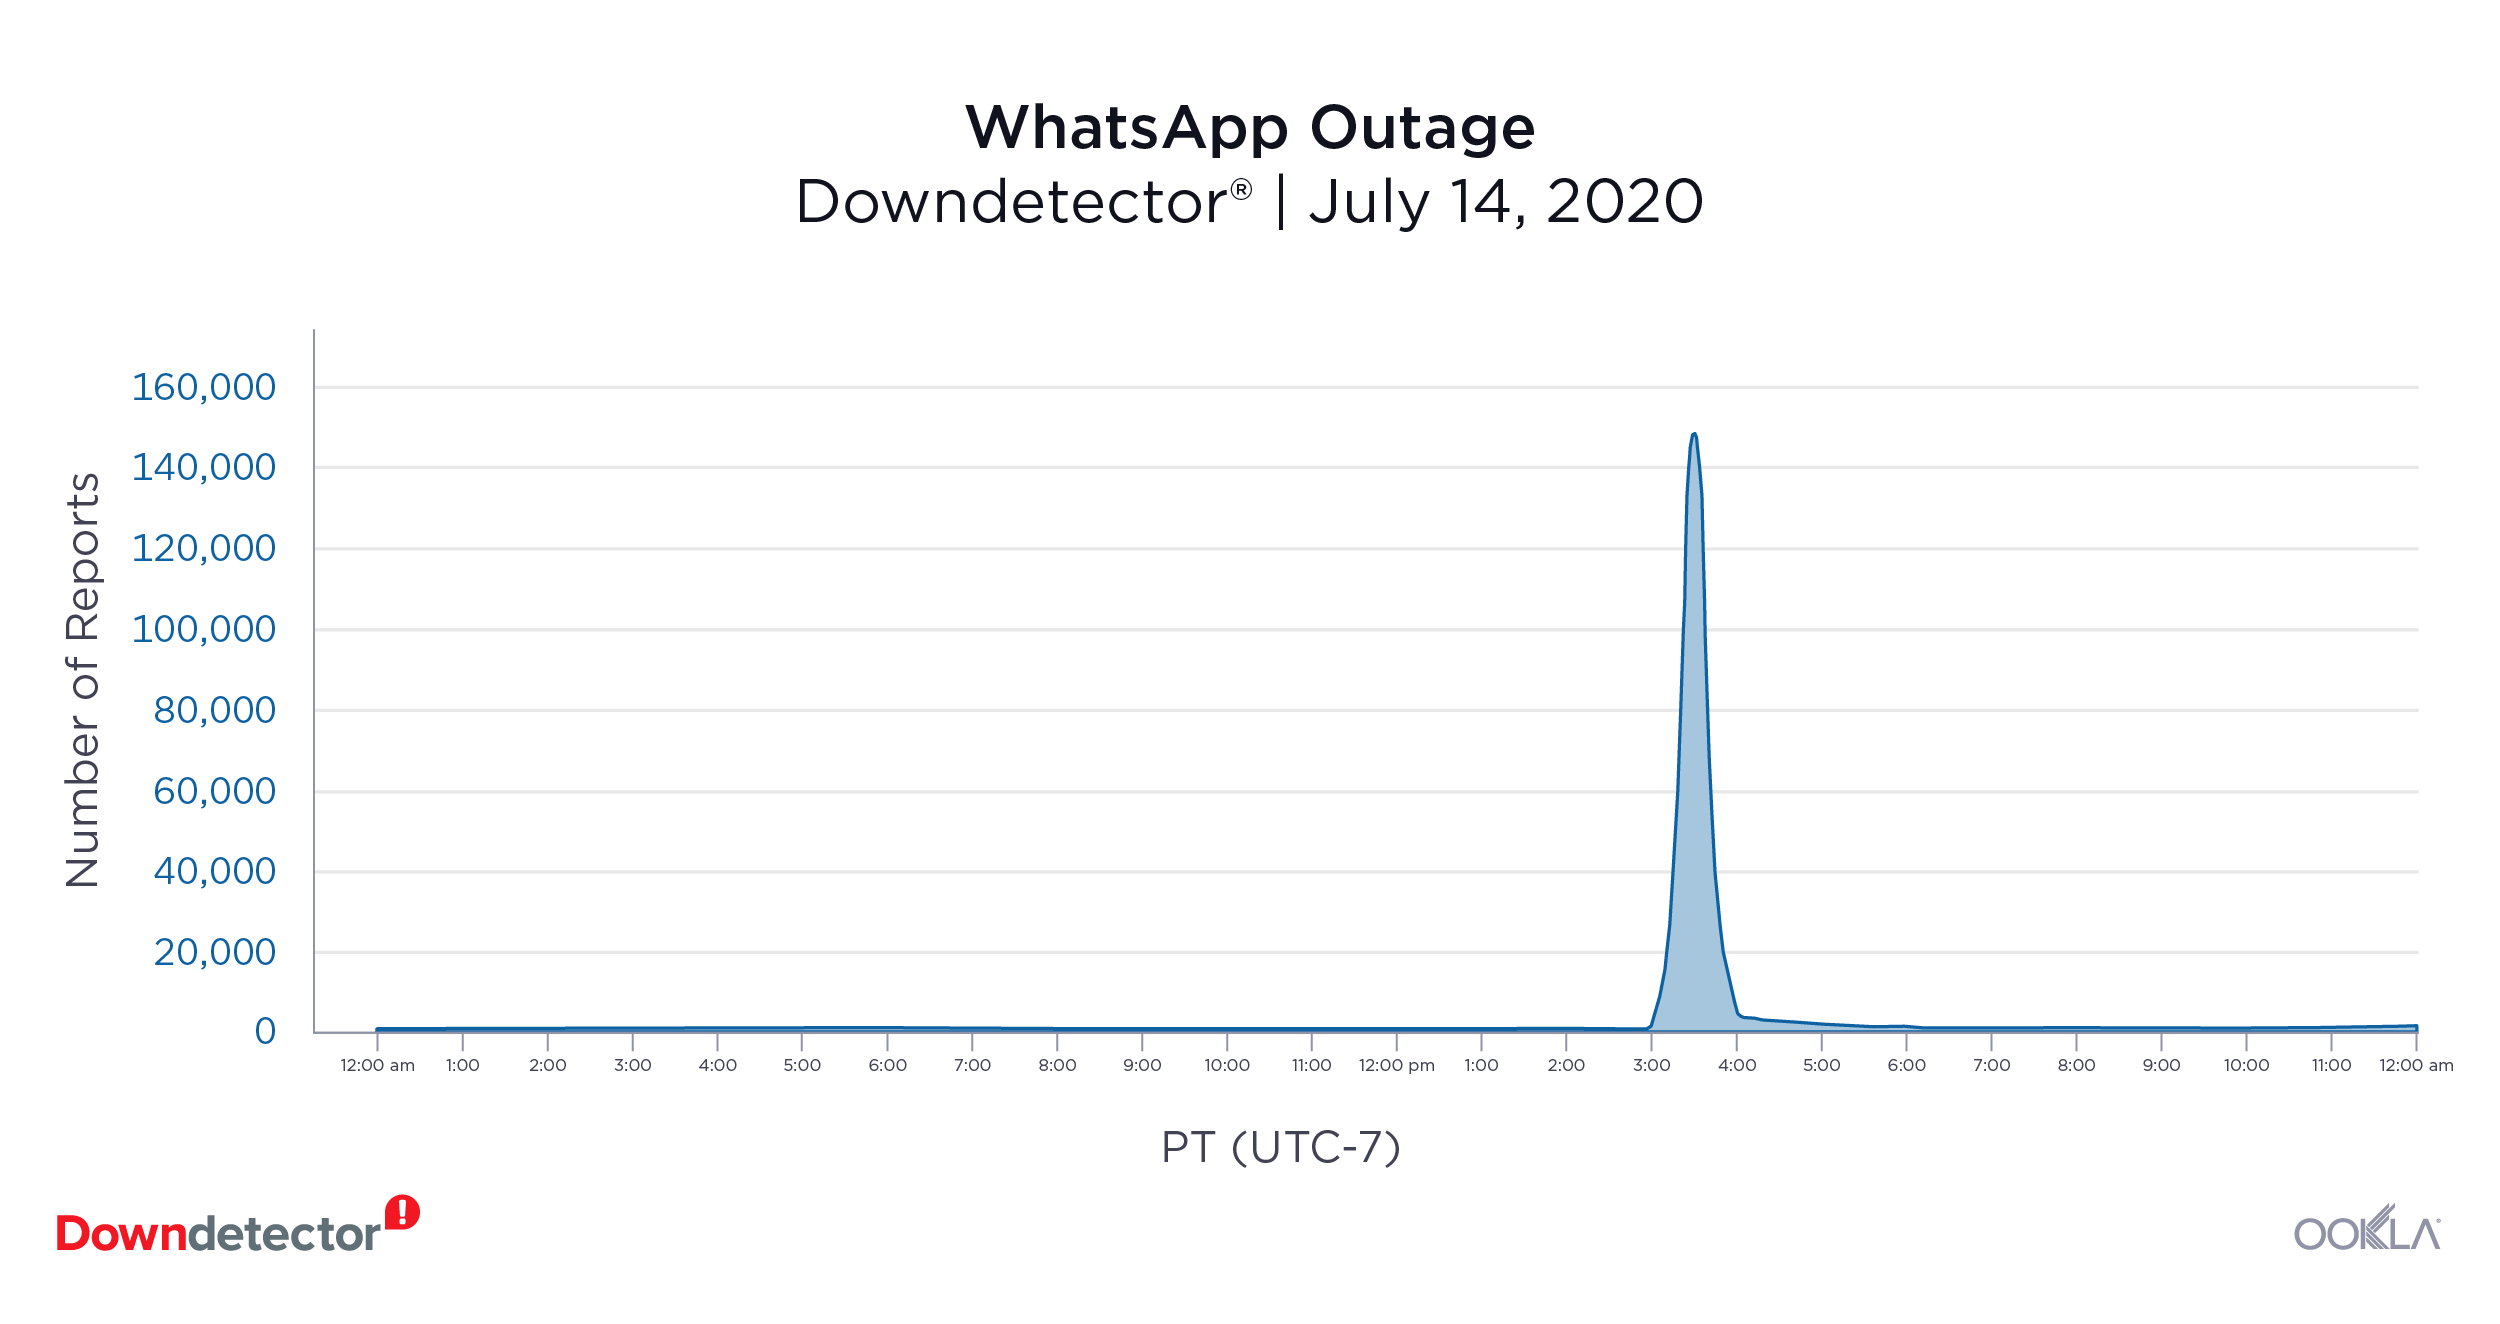
WhatsApp (July 14, 2020): 148,573 reports at peak

Downdetector_WhatsApp_Outage_1020-1

A multi-country outage affected WhatsApp on July 14. Users from all over the world stated problems with sending and receiving messages on the Facebook-owned app. The country with the most issues submitted was Germany with 148,573 reports of issues at the peak of the outage. Users in Brazil, India, the Netherlands, Mexico, Spain and the U.K. were also affected by the outage.

Facebook (September 17, 2020): 30,918 reports at peak

Facebook users from multiple countries experienced problems with the social media platform on September 17. More than half of the logs were labeled as “total blackout” — users were unable to access the platform or any of its features. There were 30,918 reports of issues at the peak of the outage in the U.S. Users in Italy, Poland and the U.K. also had problems with Facebook that day.

Want to know when an online service is down? Keep up with outages by visiting Downdetector.

Ookla retains ownership of this article including all of the intellectual property rights, data, content graphs and analysis. This article may not be quoted, reproduced, distributed or published for any commercial purpose without prior consent. Members of the press and others using the findings in this article for non-commercial purposes are welcome to publicly share and link to report information with attribution to Ookla.

| February 17, 2021

ICYMI: Ookla Data and Research from January 2021


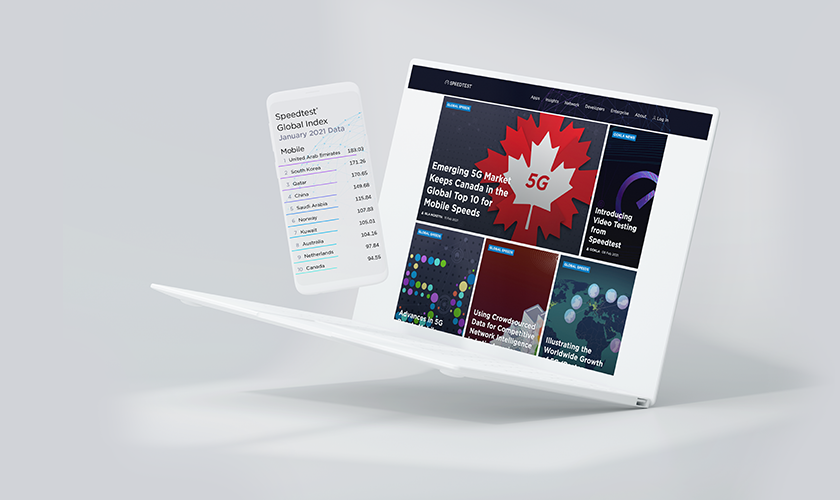
Highlights from the Speedtest Global IndexTM

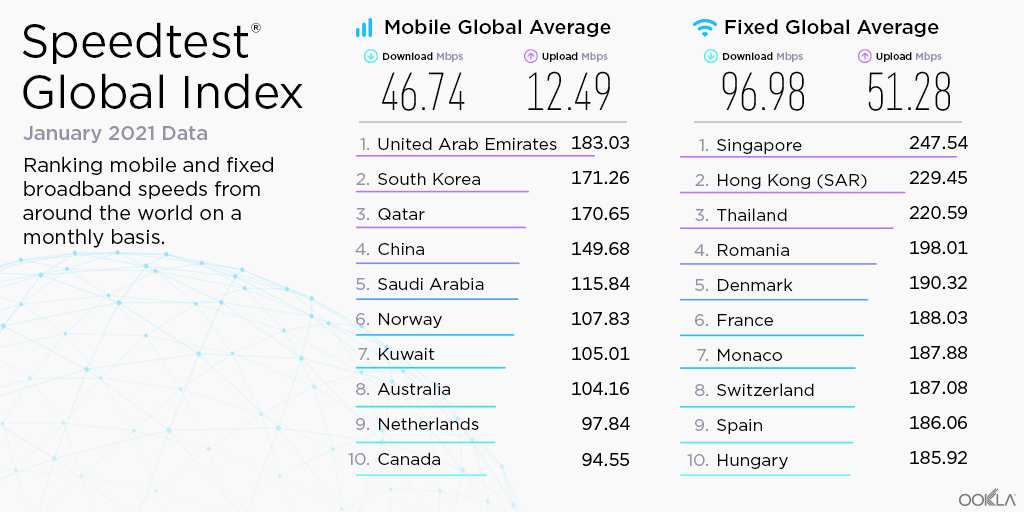
Global-Index-Tweet-Image-January-2021-2
These are the top stories from January 2021:

  • Spain climbed five ranks and reached ninth place on fixed broadband. This is the first time the country has reached the top ten.
  • On mobile, the United Arab Emirates is in first place for the fifth time in 13 months.
  • Greece climbed to 29th place, most likely due to an expanding 5G market.
  • Denmark reached fifth place for fixed broadband for the first time in the last year.

Articles worth a second look

Introducing Video Testing from Speedtest

Video streaming is a crucial part of the internet experience. Now you can directly measure your video’s quality using Speedtest for iOS.

Emerging 5G Market Keeps Canada in the Global Top 10 for Mobile Speeds

Canada’s 5G market may be less than a year old, but its expansion has provided provinces and cities across the country with speeds that far exceed those over 4G.

Advances in 5G Boosts Mobile Speeds in Taiwan

This comprehensive report on Taiwan’s mobile speeds shows the impact 5G has had on the market — and how speeds vary by operator and across the country.

Illustrating the Worldwide Growth of 5G (Poster Download)

This poster illustrates the impact of 5G on network performance worldwide using data from Speedtest Intelligence®. Download the free poster to see the full picture of the industry’s achievements.

New Year, Great Data: The Best Ookla Open Data Projects We’ve Seen So Far

Read more about the most exciting open data projects from Ookla For GoodTM that really show what this data can do.

“There’s a Problem With Your Connection” — The Most Significant Outages of Q4 2020

Did you experience an online service outage during Q4 2020? Find out what online service outages made headlines during the last three months of 2020.
Upcoming webinars

Upcoming webinars

Using Crowdsourced Data for Competitive Network Intelligence in Latin America

In the upcoming Ookla® webinar, offered in both Portuguese and Spanish, we share how mobile operators in Latin America can monitor and benchmark their competitors’ performance and also prioritize network optimization in the areas most important to their customers.

pr-cta1
Wednesday, February 24 at 11 a.m. BRT

es-cta1
Thursday, February 25 at 9 a.m. CST (10 a.m. EST/PET/COT)

Ookla retains ownership of this article including all of the intellectual property rights, data, content graphs and analysis. This article may not be quoted, reproduced, distributed or published for any commercial purpose without prior consent. Members of the press and others using the findings in this article for non-commercial purposes are welcome to publicly share and link to report information with attribution to Ookla.

| November 23, 2023

Empowering Europe's Digital Ascent: Insights from Ookla's Gigabit Revolution Webinar

Ookla® has recently hosted a webinar on “Accelerating Europe’s Gigabit Revolution: The importance of high-speed internet in the digital era.” We gathered representatives from three European fiber providers, vertically integrated UK Internet Service Provider (ISP) Hyperoptic, Polish open-access fiber network provider, Fiberhost, and Spanish wholesale provider Onvia, to discuss their strategies and challenges related to fiber roll out and adoption. Industry experts from the European Competitive Telecommunications Association (ecta) and two research houses, Assembly Research and Omdia, also joined us. 

European Commission’s Digital Decade 2030 Strategy

The European Commission’s Digital Decade 2030 strategy, also known as the Digital Compass, is an ambitious roadmap to speed up the digital transformation of Member States by 2030. One of its primary objectives is to enhance digital connectivity, with specific targets such as 100 Mbps services by 2025 and gigabit coverage for all EU households by 2030. We recently published an article to provide a reality check on the progress towards a Gigabit society. Our data suggests a wide gap between advertised and actual speeds for gigabit services, with speeds approaching 100 Mbps commonly seen by users. Despite this gap, our webinar participants were optimistic about achieving the Gigabit Society goal, with 71% supporting that view.

Chart of Percentage of Households Subscribing to Fixed Broadband of at Least 1 Gbps

The EU goal predominantly focuses on the availability aspect. However, it is important to note that having fiber networks available does not automatically equate to actual penetration or adoption rates, although it is a necessary prerequisite. Having physical accessibility to network services is, of course, a vital first step before actual usage, which is influenced by multiple factors such as affordability, awareness, and the perceived need for the service. 

The European fiber network landscape

Stephen Wilson, Senior Principal Analyst from Omdia, provided an analyst’s perspective on how the fiber networks’ competitive landscape is evolving for alternative operators and incumbents. He stated that there has been a substantial increase in Fiber-To-The-Premises (FTTP) coverage, and the investment case for fiber has been spurred by the pandemic. Leading countries, including those in Iberia and Eastern Europe, are pushing coverage to 90% of premises or more, driven by a positive business case. While FTTH (Fiber to the Home) subscriber penetration is generally experiencing steady growth, country-level variations exist, with factors like digital literacy, existing broadband penetration, and competition playing crucial roles in the observed trends. Countries such as Spain and Romania have achieved significant FTTH penetration rates, while others like France have outperformed predictions, emphasizing the diverse dynamics influencing fiber adoption across Europe.

Importance of supportive regulatory framework  

James Robinson, Senior Analyst from Assembly Research, highlighted three measures the European Commission is taking as it seeks to deliver against the Digital Decade’s connectivity targets: the draft Gigabit Recommendation, the proposed Gigabit Infrastructure Act, and a plan for a Digital Networks Act. Although broad industry support exists for the Gigabit Infrastructure Act (GIA), the draft Gigabit Recommendation has proven to be the most controversial. Both measures are still nevertheless expected to be finalized by the end of the year. The Digital Networks Act (DNA) will take longer to materialize, with a white paper not due until H1 2024. Despite its catchy title, the ‘DNA’ is unlikely to represent the urgent concrete action many operators had hoped to see from the Commission following the launch of the exploratory consultation back in February of this year.

Luc Hindryckx, Director General at ecta, expressed doubt about an investment gap that could endanger the 2030 targets. He suggested that some proposed legislation had been developed to support only a few operators rather than to promote competition. Hindryckx stressed the importance of bringing the Gigabit Infrastructure Act to “a good end” and ensuring the reduction of the timing for obtaining permits to deploy networks. He also pointed out that the GIA is complementary to the  European Electronic Communication Code (ECCC), and its key elements include asymmetrical regulation and the Significant Market Power (SMP) regime. Overall, ecta emphasizes the importance of regulatory measures that foster competition, encourage investment, and create a level playing field, ultimately contributing to the successful deployment of gigabit connectivity and the Digital Decade 2030 objectives.

Succeeding in Rural Areas 

Marta Wojciechowska, Chief Executive Officer at Fiberhost, has reported that the company has already met its goal of extending its fiber-optic network to over 1.3 million households by the end of the year. The company primarily focuses on underserved areas, where deployment costs tend to be higher and less predictable. While there are uncertainties regarding demand and fiber service uptake, there are unique benefits, including the low risk of overbuilding. However, the investment process varies significantly between urban and rural areas. In cities, one kilometer of infrastructure can connect one hundred to two hundred households, depending on the city’s size. In rural areas, connectivity extends to just seventeen households per kilometer.

Furthermore, up to 19 formal approvals may be required for infrastructure deployment, which extends the time to connect premises in rural areas to an impractical 24 months. The cost of connecting one household in these secluded “white spots” is over five hundred percent higher than in cities. Overcoming these challenges requires expertise, experience, and a collaborative approach, emphasizing the importance of partnerships with multiple stakeholders. These include local governments and subcontractors to achieve common goals in fiber network expansion.

Strategies for Expansion

Icíar Martínez, Markets and Product Director at Onivia, acknowledged they face similar challenges to Fiberhost but noted that their strategies for expanding the FTTH footprint might differ. Spain boasts close to 90% fiber optic coverage, thanks to private initiatives and government support. Their selective deployment focuses on rural and ultra-rural areas, addressing high customer interest. However, the cherry-picking strategy becomes expensive, impacting profitability, especially in densely competitive areas. Onivia aims to maximize capital returns by identifying key players, adopting XGPON technology for speeds up to 10 Gbps, and strategically balancing deployments in large cities and rural regions to optimize network utilization based on market demands.

On the other hand, Howard Jones, Head of Communications at Hyperoptic, noted that the Hyperoptic approach is distinct, focusing on urban areas with densely populated regions. The key lies in a granular business case approach, evaluating each deployment building by building and street by street. Hyperoptic’s philosophy centers on understanding that the network’s value lies in retaining customers, emphasizing a customer-centric business model. With a customer experience-oriented strategy, the ISP addresses challenges in the UK broadband market, historically marked by lower speeds and inadequate competition. By delivering a high-quality network, reliable service, and fair pricing policies, Jones highlighted that the company aims to set new standards in customer experience, achieving a 40% penetration rate within approximately a year of network deployment. 

Addressing take-up challenges

Marta shared that Fiberhost’s network would not be deployed in white spot areas without EU funds. Fiberhost is the largest beneficiary of EU-funded grants, but this is just the beginning of the investment process. They need to “earn money, and for that, we need to have a good take-up rate.” She added that they must work hard to encourage people to join the fiber network. Their analysis showed that there is a slowdown in activations after ~40 %. While early adopters (47%) are willing to pay a premium for fiber internet, a substantial portion of potential users remain hesitant, contributing to the overall challenge of achieving a high take-up rate. The remaining 53% of households exhibit characteristics of an older demographic (above fifty-five) with limited internet usage, often for undemanding tasks. Their price sensitivity and lower discretionary income present a formidable barrier to higher adoption rates. As a result, Fiberhost adopts a multifaceted strategy, encompassing high-level engagement with Internet Service Providers (ISPs), targeted sales promotions, and educational initiatives. This strategic flexibility recognizes the absence of a one-size-fits-all solution and emphasizes the need for nuanced approaches tailored to the diverse challenges within each territory. 

Iciar echoed this sentiment but also highlighted a need to implement a connectivity plan, not just deploy fiber, but also to digitalize rural areas. Access to a broadband network in rural households is essential, and so is educating people on the benefits of accessing new technologies. Onivia is exploring synergies with other technologies like 5G or satellite to extend broadband connectivity into areas that are difficult to reach. Iciar mentioned that working with local authorities is key to reusing existing infrastructure and avoiding building and disturbing neighborhoods with work.

Demand Aggregation and Competition

Stephen pointed out that the most successful operators are already in the 60-70% take-up rates of premises passed in countries like Norway, which points to demand aggregation being an important factor in getting pre-commitments before you roll out. Howard concluded, “Competition is the key to ensuring that these targets are met because I don’t believe that incumbents alone will do it. They need to be driven, and driven by competition.” He added the introduction of ‘One Touch Switch’ adds another layer of competition into the UK market and presents an opportunity to break the stranglehold of the big retail providers, who still often tend to sell FTTC (Fiber to the Cabinet), by moving a significant number of customers to alternate providers who are more likely to offer FTTP. This initiative is crucial, but what’s more important is the need to retain competition for everyone. 

The journey towards Europe’s gigabit revolution is indeed multifaceted and involves various factors such as regulatory landscapes, diverse deployment strategies, financial dependencies, and the imperative of competition. Achieving the Digital Decade 2030 targets demands not just the availability of physical networks but also a concerted effort to address adoption challenges and ensure that the benefits of enhanced connectivity reach all corners of society. A shared commitment to realizing Europe’s digital potential is crucial, and a regulatory framework that fosters competition emerges as a common thread, underlining its pivotal role in driving investment, innovation, and equality. Moving forward, collaboration, adaptability, and a unified approach are essential to achieving Europe’s digital aspirations. From our side, we will continue to report what we see from Ookla® data in terms of users actually experiencing speeds. 

See the full webinar recording here

Ookla retains ownership of this article including all of the intellectual property rights, data, content graphs and analysis. This article may not be quoted, reproduced, distributed or published for any commercial purpose without prior consent. Members of the press and others using the findings in this article for non-commercial purposes are welcome to publicly share and link to report information with attribution to Ookla.

| May 23, 2023

U.S. Airports Have Fastest Free Airport Wi-Fi, Chinese Airports Have Faster Mobile

The summer travel season is about to officially begin across the northern hemisphere and we’re back with fresh data for our series on airport Wi-Fi performance. This year we examined mobile Wi-Fi on free Wi-Fi provided by the individual airports as well as mobile speeds at some of the busiest airports in the world during Q1 2023. While airports in the United States top the list of fastest free airport Wi-Fi, the fastest mobile speeds we saw were in China. Read on for a specific look at internet performance including: download speed, upload speed, and latency.

U.S. airports have fastest airport Wi-Fi

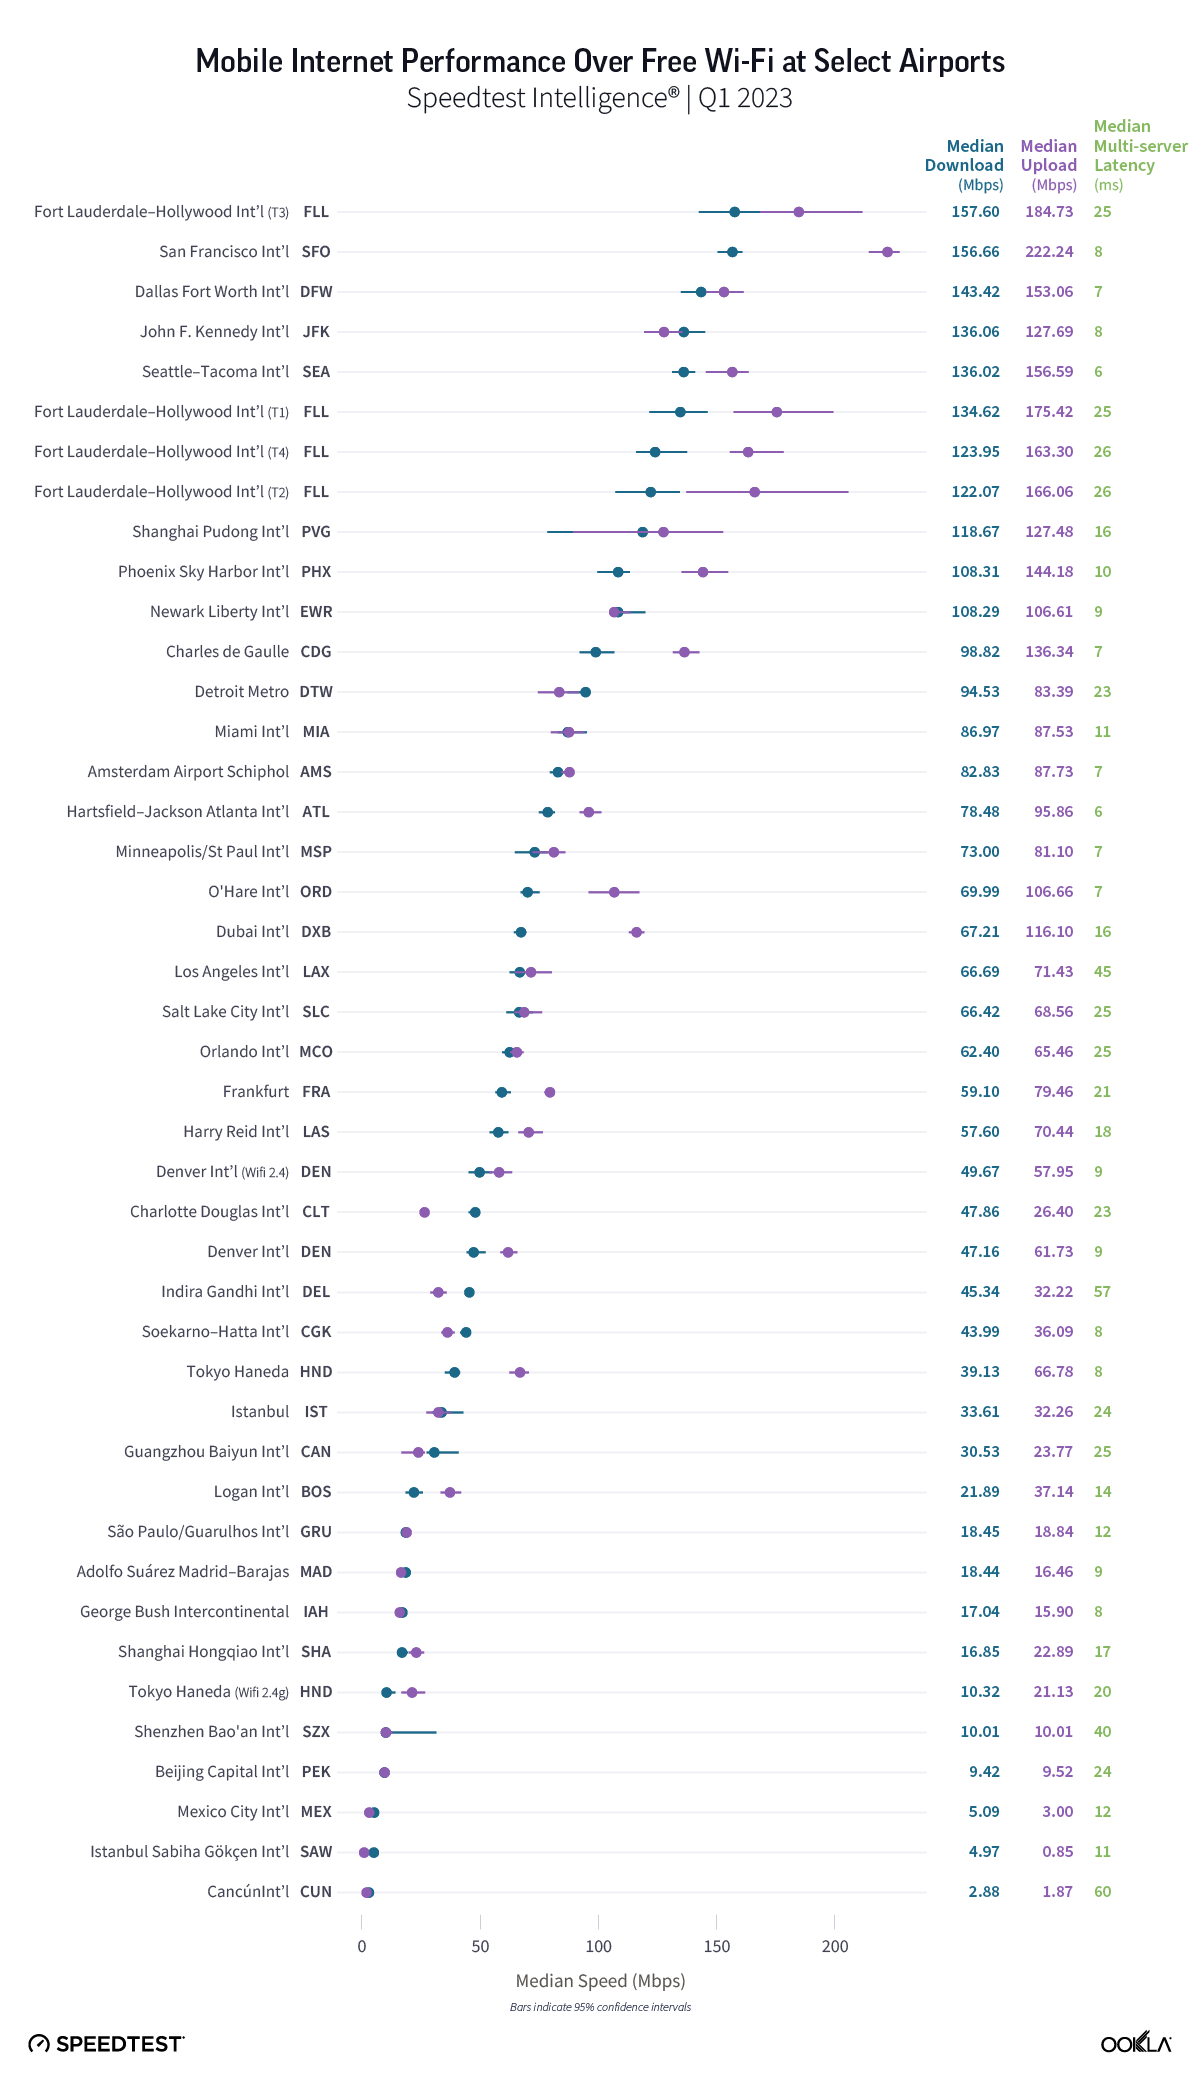
Speedtest Intelligence® showed two U.S. airports at the top of the list for free airport Wi-Fi with Fort Lauderdale’s Hollywood International Airport Terminal 3 and San Francisco International Airport showing median download speeds of 157.60 Mbps and 156.66 Mbps, respectively, during Q1 2023. This represented a small drop for SFO since our November analysis but an increase for FLL. Dallas/Fort Worth International Airport (143.42 Mbps), John F. Kennedy International Airport (136.06 Mbps), and Seattle–Tacoma International Airport (136.02 Mbps) rounded out the top five with three additional SSIDs from FLL following closely behind with median download speeds from 122.07 Mbps to 134.62 Mbps.

Chart of Mobile Internet Performance Over Free Wi-Fi at Select Airports

As we’ve seen in most recent analyses, the airports with the fastest Wi-Fi are international hubs that passengers from around the world pass through on their way to all kinds of destinations. If you are connecting through any of these airports, you should have no trouble with internet speeds this fast. In case of video calls, upload speeds are even faster than downloads at almost all of these airports, and SFO had the fastest uploads on the list.

Hartsfield–Jackson Atlanta International Airport and SEA had the lowest median multi-server latency on Wi-Fi of any of the airports surveyed during Q1 2023. This means your device should see very little delay when relaying information across the web.

Shanghai tops Wi-Fi performance at global airports

Shanghai Pudong International Airport was the fastest non-U.S. airport on our list with a fastest median download speed of 118.67 Mbps. Charles de Gaulle Airport in Paris (98.82 Mbps), Amsterdam Airport Schiphol (82.83 Mbps), Dubai International Airport (67.21 Mbps), and Frankfurt Airport (59.10 Mbps) followed for median download speeds at non-U.S. airports. All of these airports have internet speeds that qualify as at least good, which means you should be okay unless you want to try multi-player gaming (which is probably not your first choice on an airport layover anyway). Both Mexican airports on our list showed speeds in the slow range, so log off early and enjoy your vacation if you’re at the airport in Cancún or Mexico City.

Chinese airports have fastest mobile speeds

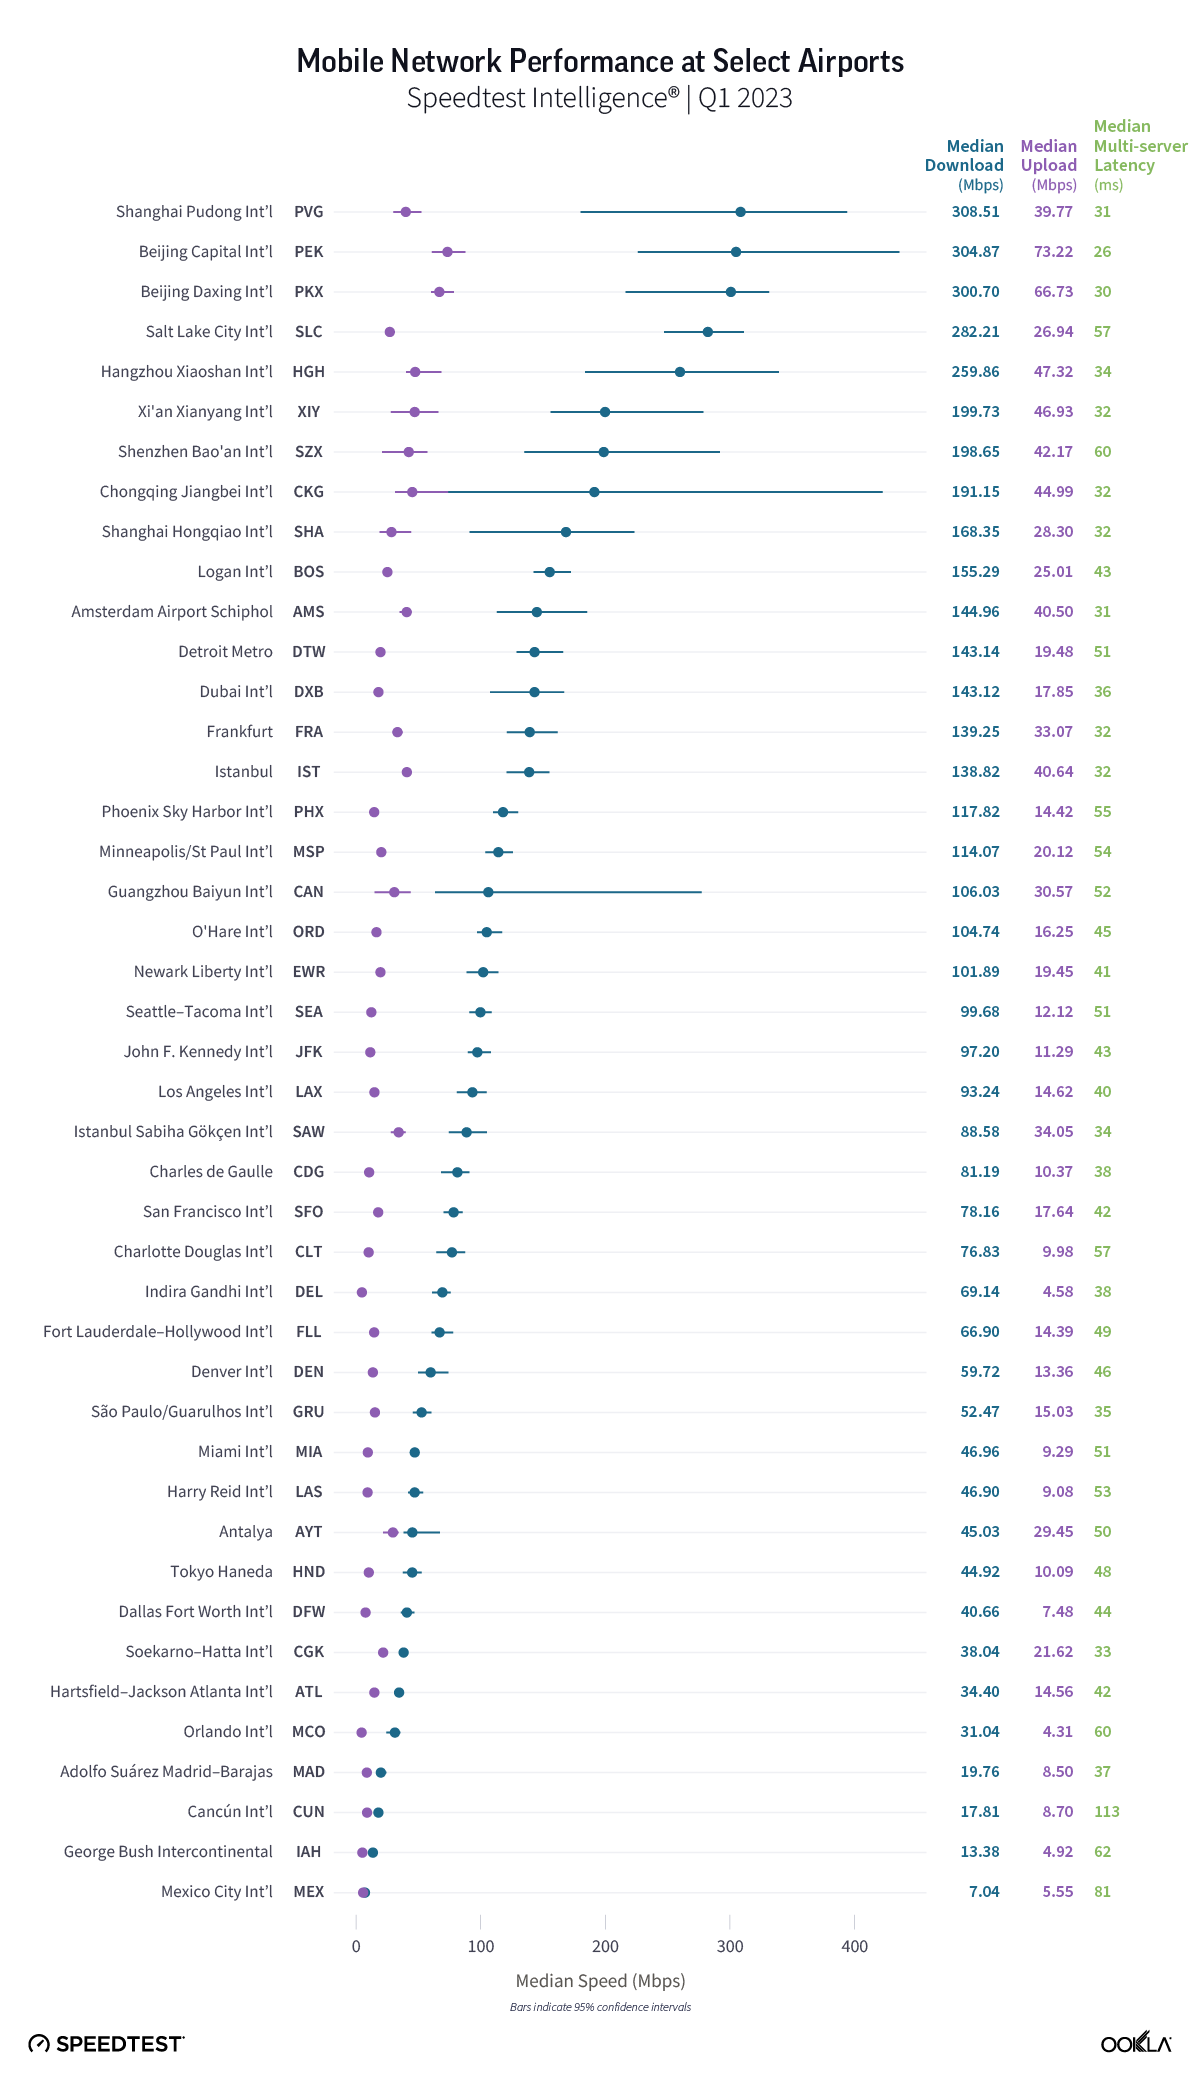
Get ready to connect to local mobile service or tether your phone to your laptop if you’re traveling through airports in Shanghai and Beijing and have access to 5G. Not only did Shanghai Pudong International Airport, Beijing Capital International Airport, and Beijing Daxing International Airport have the fastest median downloads over mobile on our list at 308.51 Mbps, 304.87 Mbps, and 300.70 Mbps, respectively, during Q1 2023 — the mobile speeds at these airports were dramatically faster than the airport Wi-Fi. Salt Lake City International Airport (282.21 Mbps) and Hangzhou Xiaoshan International Airport (259.86 Mbps) rounded out the top five.

Chart of Mobile Network Performance at Select Airports

While latency on mobile was generally higher than that on Wi-Fi, these same three Chinese airports (PEK, PKX, and PVG) also showed the lowest median multi-server latency on mobile during Q1 2023, indicating that your internet experience at these airports will have the least lag. Airports outside the U.S. performed better for latency overall with the top 16 airports for latency all located outside North America. CUN had the highest latency on mobile.

We were able to include more airports in the mobile analysis because there were more mobile samples to analyze at those airports than there were samples over Wi-Fi.

Airport Wi-Fi or mobile? Connecting on your next trip

Save yourself time by using this checklist to decide whether to try out the Wi-Fi or simply use the local mobile network. We compared internet performance on free airport Wi-Fi with median download speeds over mobile for the 38 airports we have both Wi-Fi and mobile data for during Q1 2023. Twenty-one airports had faster mobile internet than airport Wi-Fi. Twelve airports had faster Wi-Fi than mobile, and four airports showed only a slight distinction between Wi-Fi and mobile so we gave both the green check marks.

Chart Comparing Airport Wi-Fi and Mobile Speeds at Select Airports

Airport Wi-Fi has come a long way since we started this series in 2017. We hope your connections are smooth and if you’re traveling this summer, take a Speedtest® at the airport to see how your experience compares.

Ookla retains ownership of this article including all of the intellectual property rights, data, content graphs and analysis. This article may not be quoted, reproduced, distributed or published for any commercial purpose without prior consent. Members of the press and others using the findings in this article for non-commercial purposes are welcome to publicly share and link to report information with attribution to Ookla.

| May 18, 2022

Four U.S. Airports Top Our List of Fastest Free Airport Wi-Fi

The COVID-19 pandemic upended a lot of travel plans and put our series on airport Wi-Fi on hold. We’re excited to get back in the swing of things in time for the summer travel season, and we have fresh data for you on Wi-Fi speeds at some of the busiest airports in the world during Q1 2022. Our analysis focuses on Wi-Fi over mobile connections on free Wi-Fi provided by the individual airports and Wi-Fi at selected airport lounges. The good news is that every airport surveyed met the recommended speed for streaming on mobile. However, there was a large divide between the fastest airports on the list and the slowest.

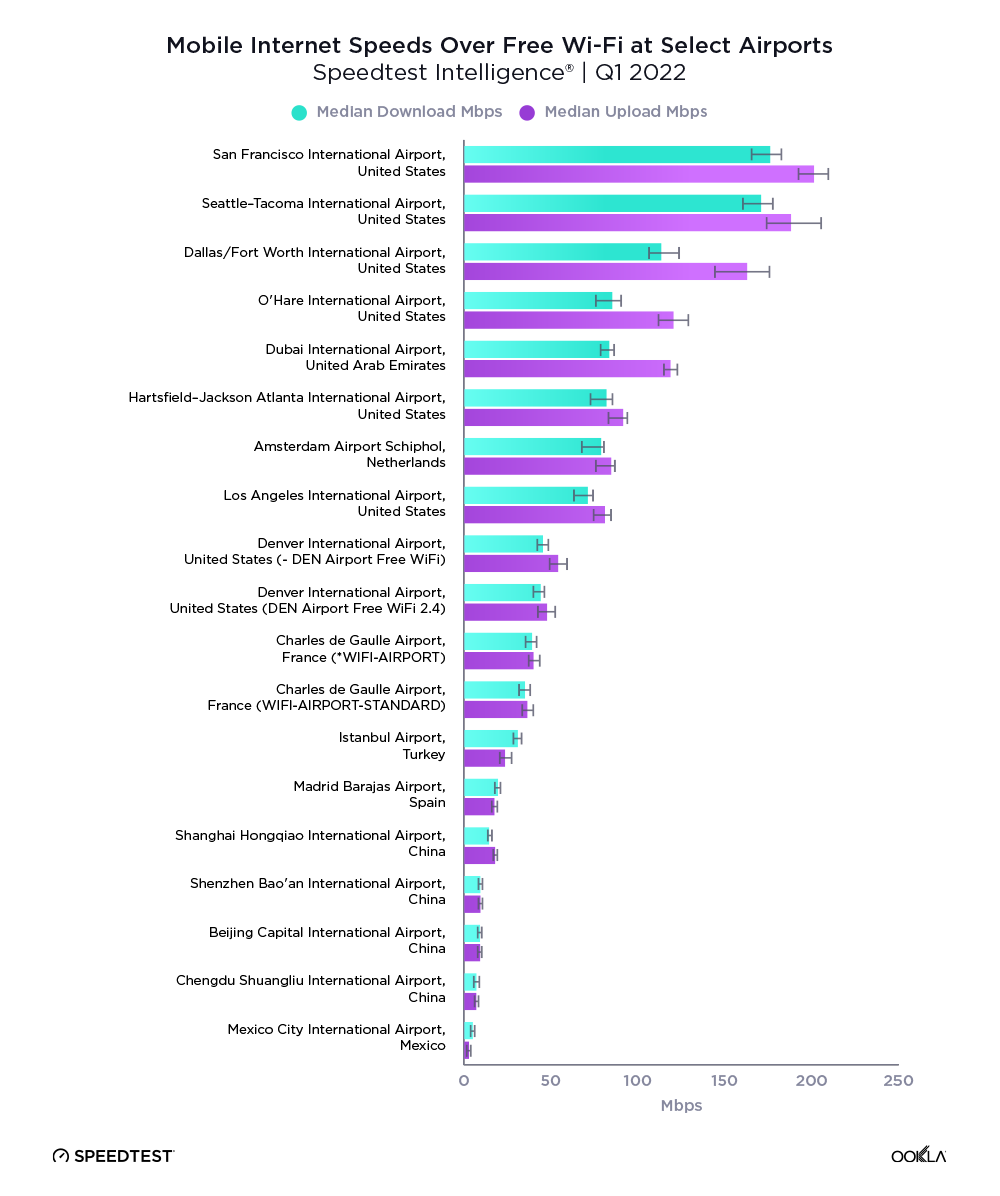
Mobile Internet Speeds Over Free Wi-Fi at Select Airports

Speedtest Intelligence® showed four airports in the United States at the top of the list for free airport Wi-Fi. San Francisco International Airport showed a median download speed of 176.25 Mbps during Q1 2022, Seattle-Tacoma International Airport 171.01 Mbps, Dallas/Fort Worth International Airport 113.64 Mbps, and Chicago O’Hare International Airport 85.49 Mbps. Dubai International Airport, Hartsfield–Jackson Atlanta International Airport, Amsterdam Airport Schiphol, and Los Angeles International Airport followed. All of these airports are international hubs that passengers from around the world pass through on their way to all kinds of destinations. Flyers waiting for connecting planes at these airports should have no trouble with internet speeds. In case of video calls, upload speeds are even faster than downloads at all of these airports, and San Francisco and SeaTac had the fastest uploads on the list. There is a wide gap in median speeds between the free airport Wi-Fi at Los Angeles International Airport and the rest of the airports on our list.

Denver International has their Wi-Fi split between two SSIDs that serve different spectrum bands, both of which showed median download speeds between 44 and 46 Mbps. Connecting to the 5 GHz “- DEN Airport Free WiFi” will get you a faster median upload speed than “DEN Airport Free WiFi 2.4.” Charles de Gaulle also has two different SSIDs for their free airport Wi-Fi though travelers can select either, “*WIFI-AIRPORT” had slightly faster median speeds than “WIFI-AIRPORT-STANDARD.”

Turkey’s Istanbul Airport was next on the list with a median download speed of 31.08 Mbps and a median upload speed of 23.80 Mbps. Spain’s Madrid Barajas Airport was the top of the bottom of our list with a median download speed of 19.76 Mbps over free airport Wi-Fi.

Four of the bottom five airports on our list were in China. Shanghai Hongqiao International Airport was faster than the other Chinese airports on the list with a median download speed of 14.69 Mbps. Shenzhen Bao’an International Airport and Beijing Capital International Airport were next on our list and showed nearly identical median download and upload speeds over free airport Wi-Fi. Chengdu Shuangliu International Airport showed slightly slower download and upload speeds than both. Mexico City International Airport in Mexico had the slowest median download and upload speeds over free airport Wi-Fi of any airport on this list.

Wi-Fi in airport lounges is often faster than free airport Wi-Fi

Free Wi-Fi is very nice to have for catching up on your life back home or reliving the glory of your vacation pics as you upload them to your social media accounts, but if you’re looking for the fastest Wi-Fi in an airport, you may want to look into other options. In many cases we found that airport lounges had faster Wi-Fi, like the United Club in Chicago and San Francisco which boasted median download speeds of 246.17 Mbps and 244.37 Mbps, respectively, during Q1 2022. The fastest club Wi-Fi download speed at LAX was at the Alaska Lounge (238.59 Mbps).

Outside the U.S., Wi-Fi speeds at airport lounges ranged dramatically. The following lounges all showed faster median download speeds than the free Wi-Fi at their respective airports during Q1 2022: the Plaza Premium Lounge in Dubai (148.96 Mbps), the Grand Lounge Elite in Mexico City (125.12 Mbps), Privium at Amsterdam’s Schiphol (121.05 Mbps), the Emirates Lounge at Paris’ Charles de Gaulle (93.31 Mbps), and the Sala VIP Puerta de Alcalá in Madrid (50.28 Mbps).

This stronger performance at airport lounges should be expected because it’s much easier to configure Wi-Fi over a small area like a single airport lounge than it is to serve an entire airport with multiple terminals. Patrons of airport lounges are also paying for the privilege, whether by the day or the year, so their expectations are higher. We did not always find this to be the case, however, so take a Speedtest® if you feel like you are not getting what you are paying for.

We were glad to see that travelers at all these airports have fast enough Wi-Fi to stream video on mobile and that there are other options available for those who need faster internet. Airports have had a lot to focus on in the last couple of years and Wi-Fi was not at the top of the list. We hope that will change as passenger volumes return to normal. If you’re traveling this summer, take a Speedtest at the airport to see how your experience compares.

Ookla retains ownership of this article including all of the intellectual property rights, data, content graphs and analysis. This article may not be quoted, reproduced, distributed or published for any commercial purpose without prior consent. Members of the press and others using the findings in this article for non-commercial purposes are welcome to publicly share and link to report information with attribution to Ookla.

| November 15, 2023

Your Black Friday/Cyber Monday Guide to iPhone 15 and Samsung Galaxy Z Fold5 and Flip5 Performance

To upgrade or not to upgrade, with Black Friday and Cyber Monday deals on the latest iPhone and Samsung devices on the horizon you may be asking yourself just that question. We analyzed data from Speedtest Intelligence® in 13 major markets to see how well the Apple iPhone 15 devices and the Samsung Galaxy Z Fold5 and Flip5 models are performing in comparison to last year’s models over 5G to help you make an informed decision. For details on performance by Samsung Galaxy S23 models, read our analysis from earlier this year. We’re especially interested in seeing if technical improvements on iPhone 15 models including support for WiFi 6E drive better performance.

Data for iPhone models is provided for the period from September 22-October 20, 2023, while data for the Samsung models is for the period from August 11-October 20, 2023. Keep in mind that device data differs across markets due to a variety of factors, including: 5G investments by governments and mobile operators, different 5G spectrum allocations, and mobile 5G plans. As many of these devices are very new, the sample counts in some countries are still low so the statistical ranges of expected performance are wider for the newer devices than the older models.

Half of models surveyed worth the upgrade in Australia

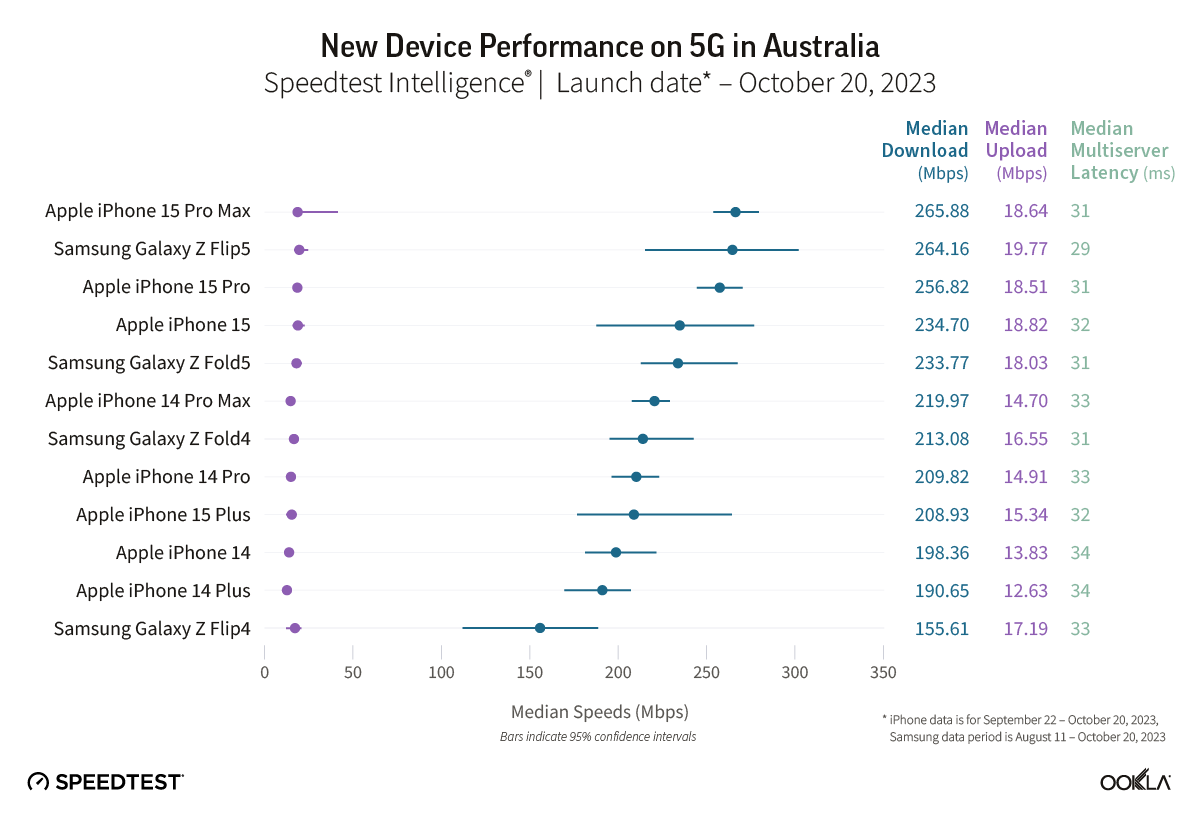
Chart of New Device Performance on 5G in Australia

In Australia, two out of four iPhone 15 models showed median 5G download speeds that were significantly faster than their iPhone 14 equivalents during the September 22-October 20, 2023 period. Speedtest Intelligence reveals the iPhone 15 Pro and the iPhone 15 Pro Max both had a 14% better download speed than their prior year counterparts. There was no statistical winner for the iPhone standard model or the iPhone Plus in Australia during this period.

The Galaxy Z Flip5 had a 30% better download speed than the Galaxy Z Flip4 during the August 11-October 20, 2023 period in Australia, while there was no statistical winner for the Galaxy Z Fold.

Recommendation: Depending on your model of choice, only half the devices surveyed merit an upgrade based on performance alone in Australia.

iPhones mostly worth the upgrade in Brazil

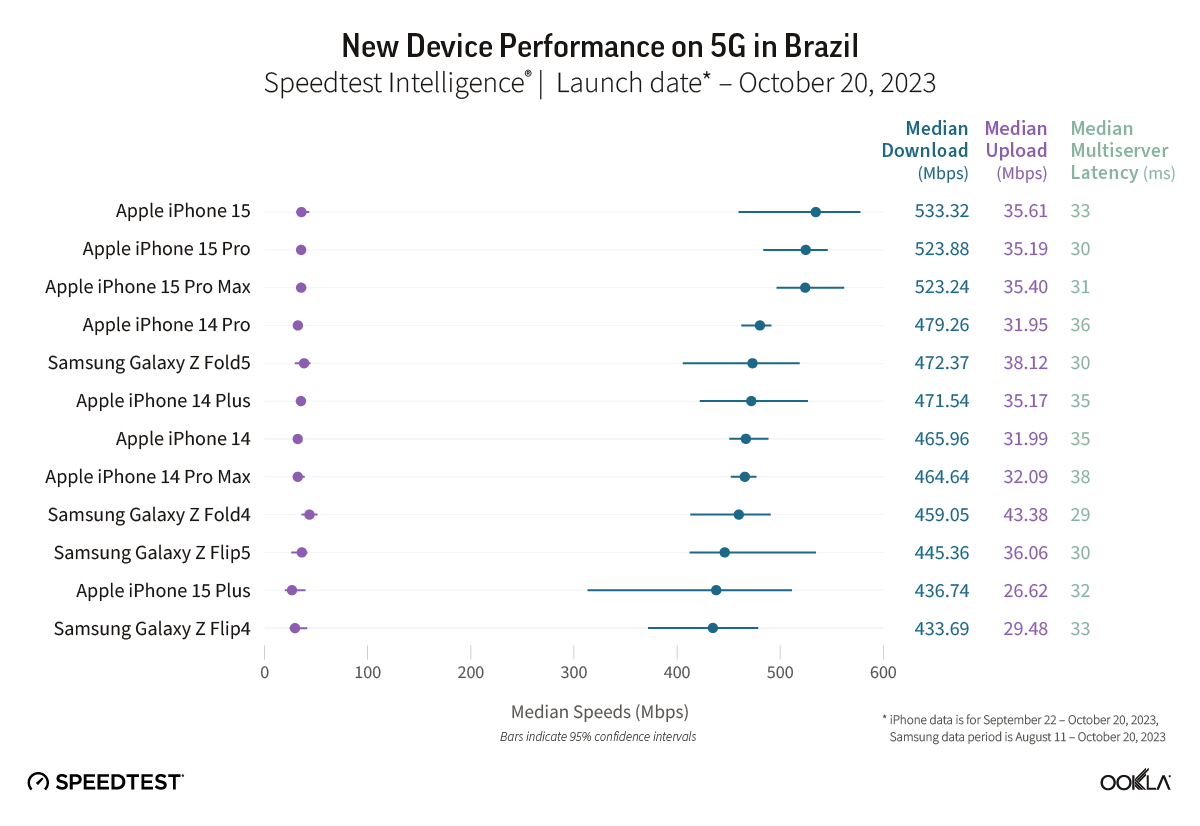
Chart of New Device Performance on 5G in Brazil

Three out of four iPhone 15 models in Brazil showed median 5G download speeds that were significantly faster than their iPhone 14 equivalents during the September 22-October 20, 2023 period. Speedtest Intelligence showed the iPhone 15 had a better download speed than the iPhone 14, with the iPhone 15 Pro Max having a 8% better download speed than the iPhone 14 Pro Max, and the iPhone 15 Pro showing a 1% better download speed than the iPhone 14 Pro. There was no statistical winner for the iPhone Plus in Brazil during this period.

There was no statistical winner for 5G median download speed during the August 11-October 20, 2023 period for the Galaxy Z Flip or the Galaxy Z Fold in Brazil.

Recommendation: iPhone users in Brazil should consider an upgrade based on performance, while Samsung Galaxy fans only need to upgrade if they are looking for feature improvements.

All iPhones show improvement over prior models in Canada

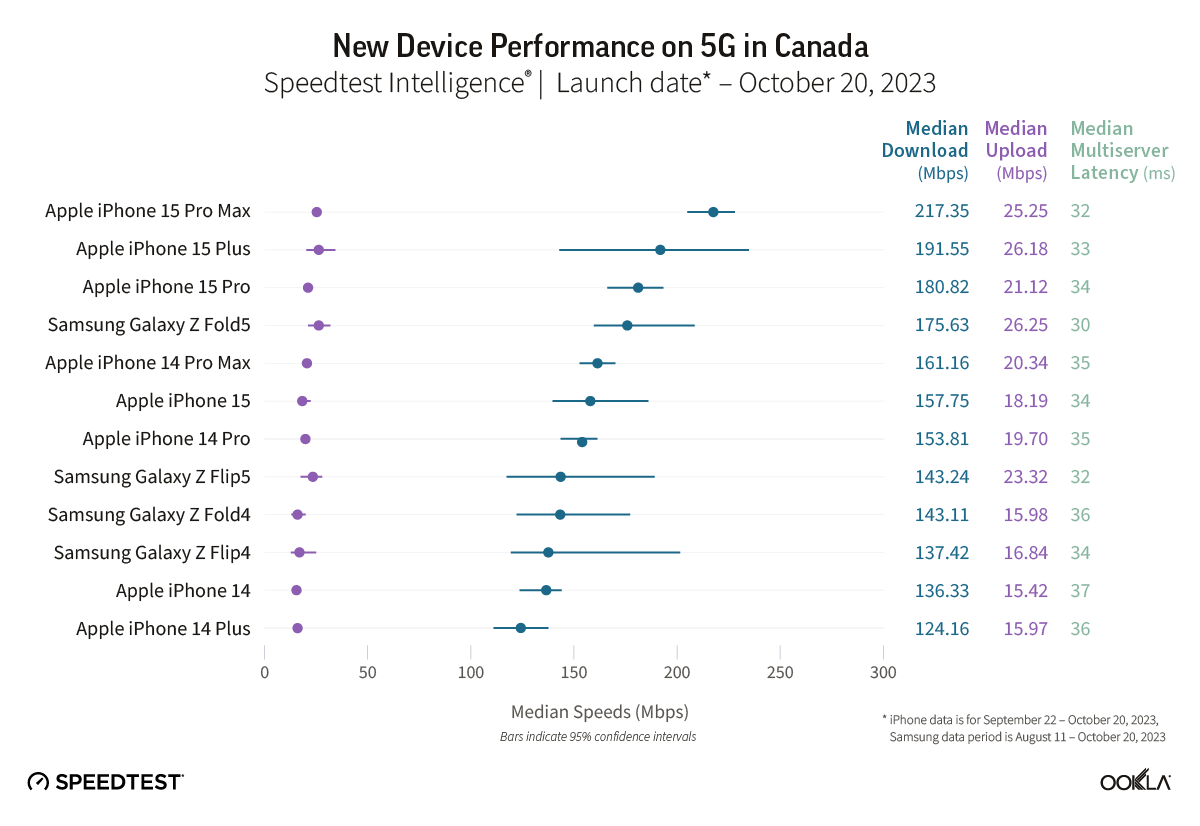
Chart of New Device Performance on 5G in Canada

All four iPhone 15 models in Canada showed median 5G download speeds that were significantly faster than their iPhone 14 equivalents during the September 22-October 20, 2023 period. Data from Speedtest Intelligence demonstrated the iPhone 15 had a better download speed than the iPhone 14, with the iPhone 15 Pro Max having a 26% better download speed than the iPhone 14 Pro Max, the iPhone 15 Pro Plus showed a 12% better download speed than the iPhone 14 Pro Plus, and the iPhone 15 Pro had an 8% better download speed than the iPhone 14 Pro.

The Galaxy Z Fold5 had a better download speed than the Galaxy Z Fold4 during the August 11-October 20, 2023 period in Canada, while there was no statistical winner for the Galaxy Z Flip.

Recommendation: iPhone users in Canada should consider an upgrade based on performance, while Samsung Galaxy fans should make a decision based on which model they’re considering.

Three iPhone models show decent improvement over prior versions in France

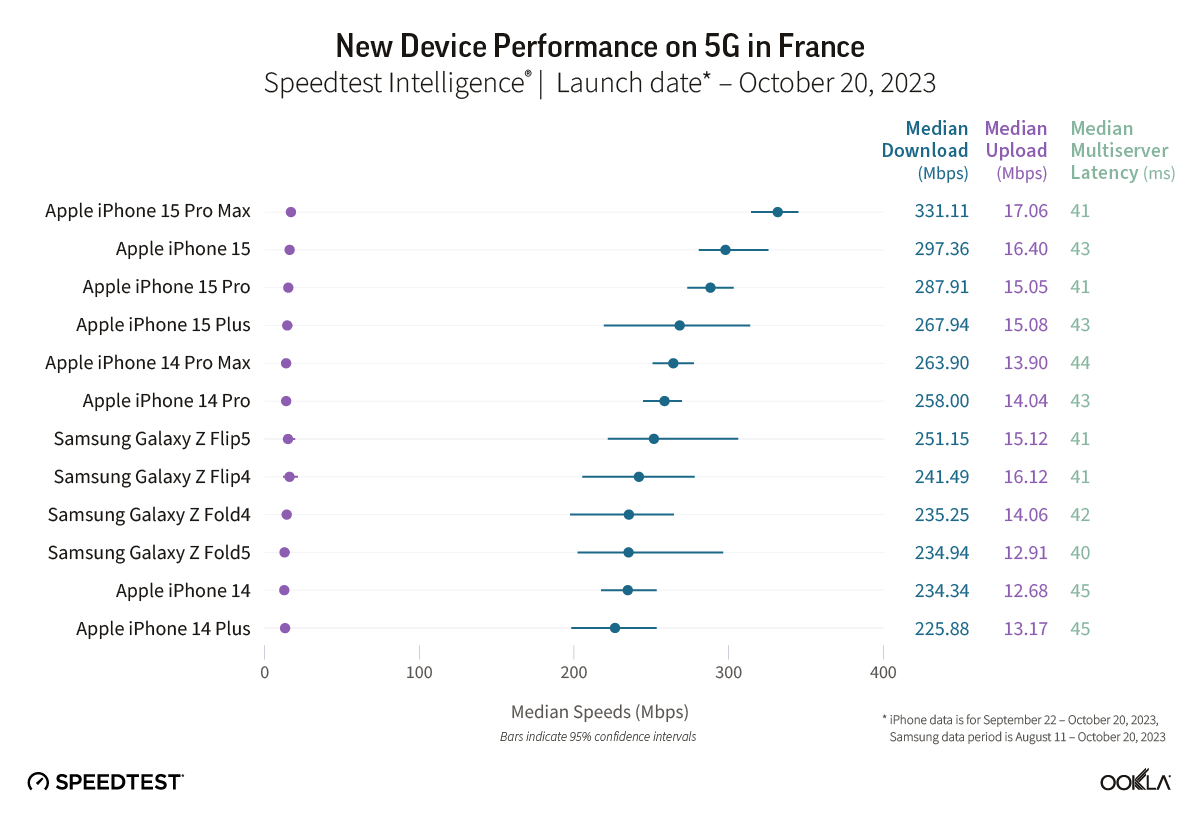
Chart of New Device Performance on 5G in France

Three out of four iPhone 15 models in France showed median 5G download speeds that were significantly faster than their iPhone 14 equivalents during the September 22-October 20, 2023 period. Speedtest Intelligence reveals the iPhone 15 and the iPhone 15 Pro Max both had 18% better download speeds than their respective prior year models. The iPhone 15 Pro had a 5% better download speed than the iPhone 14 Pro. There was no statistical winner for the iPhone Plus in France during this period.

There was no statistical winner for 5G median download speed during the August 11-October 20, 2023 period for the Galaxy Z Flip or the Galaxy Z Fold in France.

Recommendation: iPhone users in France should consider an upgrade based on performance, and Samsung Galaxy users only need to upgrade if they are looking for feature improvements.

Galaxy Z Fold5 shows some improvements in Germany

Chart of New Device Performance on 5G in Germany

Two out of four iPhone 15 models showed median 5G download speeds that were significantly faster than their iPhone 14 equivalents in Germany during the September 22-October 20, 2023 period. Speedtest Intelligence reveals slight improvements with the iPhone 15 Pro Max having a 6% better download speed than the iPhone 14 Pro Max and the iPhone 15 Pro having a 2% better download speed than the iPhone 14 Pro. There was no statistical winner for the iPhone standard model or the iPhone Plus in Germany during this period.

The Galaxy Z Fold5 had a 13% better download speed than the Galaxy Z Fold4 during the August 11-October 20, 2023 period in Germany, while there was no statistical winner for the Galaxy Z Flip.

Recommendation: Apple users won’t see major performance improvements from the new models, but the Galaxy Z Fold5 is worth the upgrade on performance alone.

India sees better performance on three iPhone models

Chart of New Device Performance on 5G in India

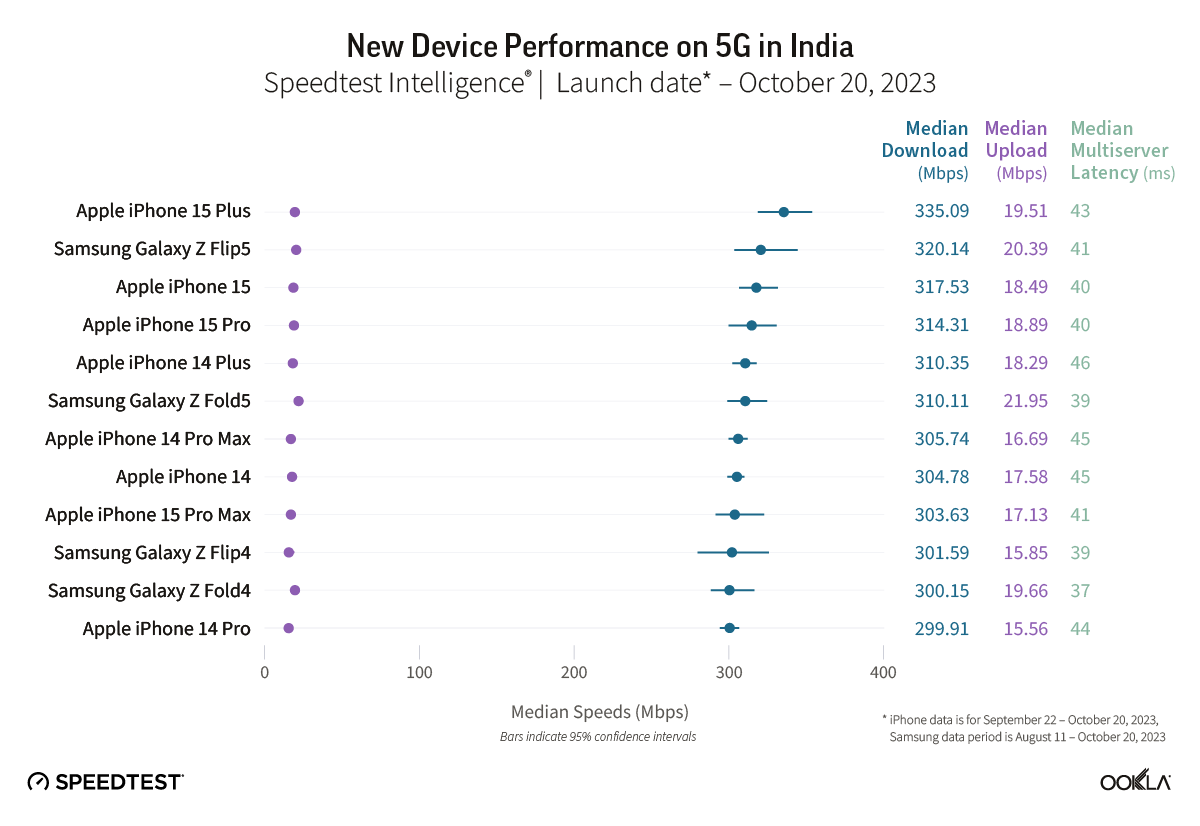
Three out of four iPhone 15 models in India showed median 5G download speeds that were significantly faster than their iPhone 14 equivalents during the September 22-October 20, 2023 period. Speedtest Intelligence showed the iPhone 15, iPhone 15 Pro, and the iPhone 15 Plus had better speeds than their respective prior models. There was no statistical winner for the iPhone Pro Max in India during this period.

There was no statistical winner for 5G median download speed during the August 11-October 20, 2023 period for the Galaxy Z Flip or the Galaxy Z Fold in India.

Recommendation: Indian iPhone users should consider an upgrade based on performance, and Samsung Galaxy users only need to upgrade if they are looking for feature improvements.

No significant performance gains on new devices in the Philippines

Chart of New Device Performance on 5G in the Philippines

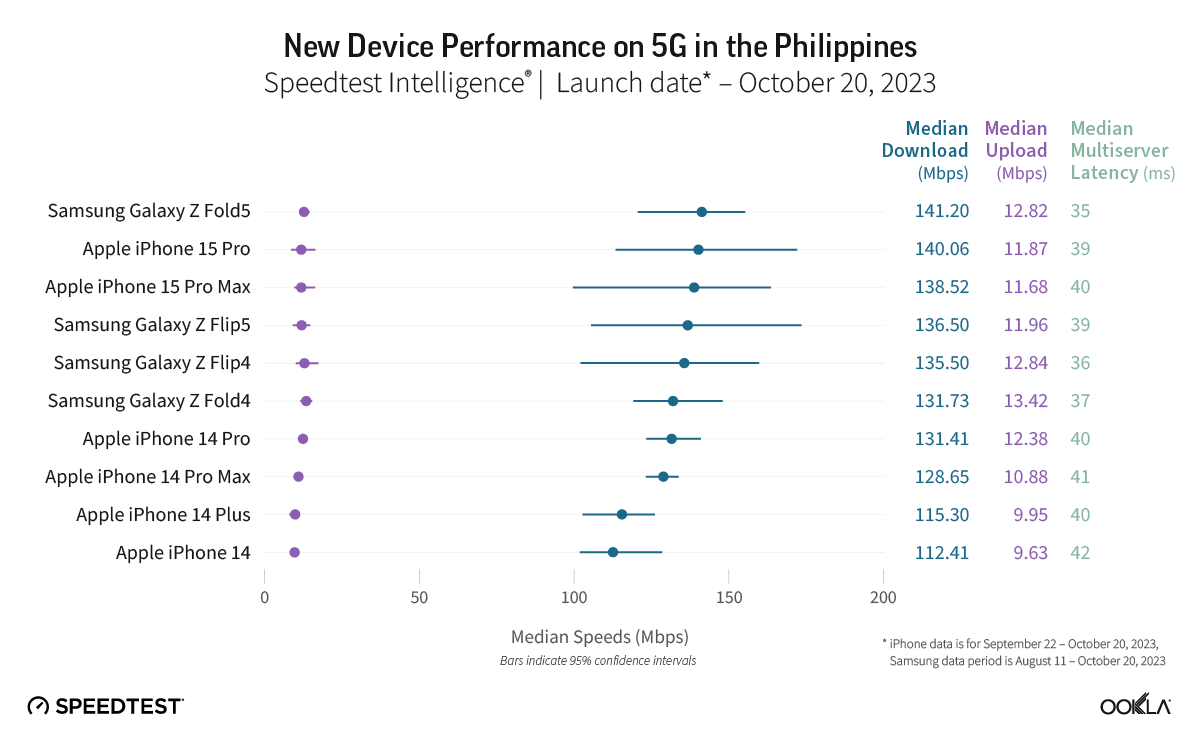
Neither the iPhone 15 Pro nor the iPhone 15 Pro Max had a statistically better median download speed over 5G than their prior year models during the September 22-October 20, 2023 period in the Philippines. There were not enough samples to properly assess the performance of the other two iPhone models.

Likewise, there was no statistical winner for 5G median download speed during the August 11-October 20, 2023 period for the Galaxy Z Flip or the Galaxy Z Fold in the Philippines.

Recommendation: Filipino consumers looking to upgrade their phones to the latest models will have to look for reasons beyond performance.

Galaxy Z Fold5 sees performance improvement in South Korea

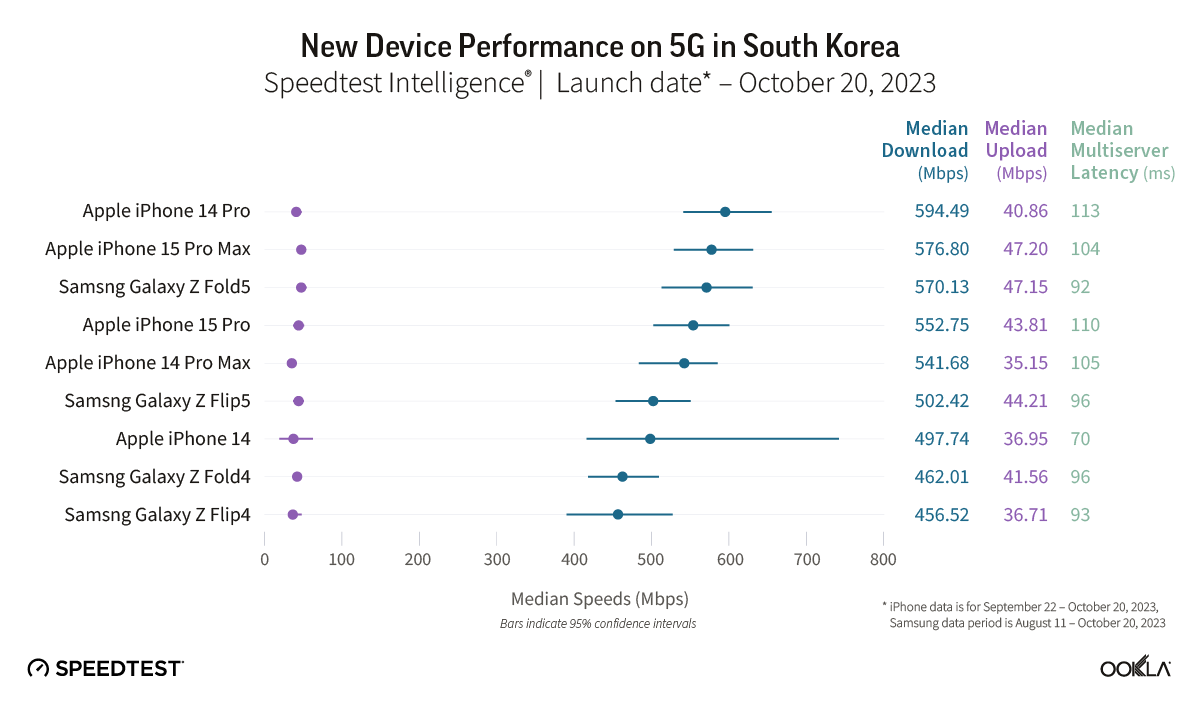
Chart of New Device Performance on 5G in South Korea

Mobile speeds in South Korea are already fast with a top 10 performance on the Speedtest Global Index™ as of September 2023. New phones may not push performance boosts, though, as Speedtest Intelligence data did not show significant increases in median download speed over 5G for the iPhone 15 Pro or the iPhone 15 Pro Max in South Korea during the September 22-October 20, 2023 period. However, the iPhone 15 Pro Max had a 16% better upload speed than the iPhone 14 Pro Max. There were not enough samples to properly assess the performance of the other two iPhone models.

On the other hand, the Galaxy Z Fold5 had a 10% better download speed than the Galaxy Z Fold4 during the August 11-October 20, 2023 period in South Korea, while there was no statistical winner for the Galaxy Z Flip.

Recommendation: If South Korean consumers are looking for better performance, upgrading from the Galaxy Z Fold4 to the Galaxy Z Fold5 is worth looking into.

Spain sees major increases in iPhone speed

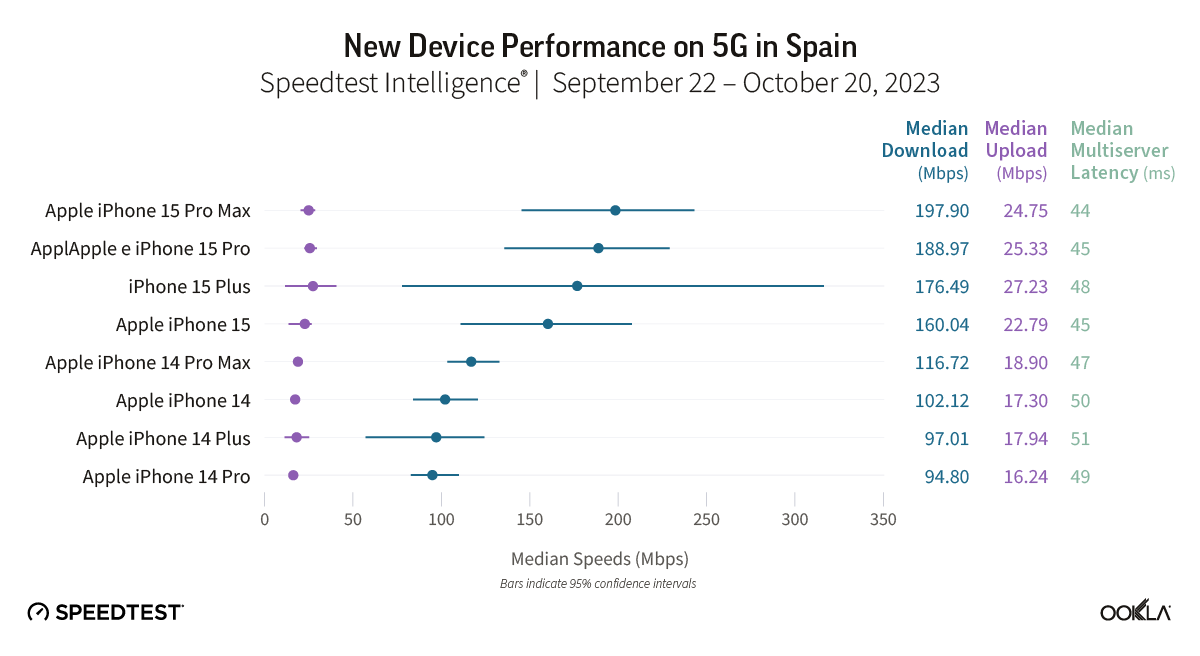
Chart of New Device Performance on 5G in Spain

Three iPhone 15 models in Spain showed median 5G download speeds that were significantly faster than their iPhone 14 equivalents during the September 22-October 20, 2023 period, and the improvements in performance were mostly greater than we saw in other countries, with the exception of the United States. Speedtest Intelligence reveals the iPhone 15 Pro had a 40% better download speed than the iPhone 14 Pro, the iPhone 15 Pro Max had a 36% better download speed than the iPhone 14 Pro Max, and the iPhone 15 had an 11% better download speed than the iPhone 14. There were not enough samples to properly assess the performance of the iPhone Plus.

There were not enough samples to evaluate the Galaxy Z Flip or the Galaxy Z Fold during the August 11-October 20, 2023 period in Spain.

Recommendation: Spanish iPhone fans should definitely upgrade their devices while Samsung users can hold off for now.

Unbeatable performance in U.A.E. makes upgrades unnecessary

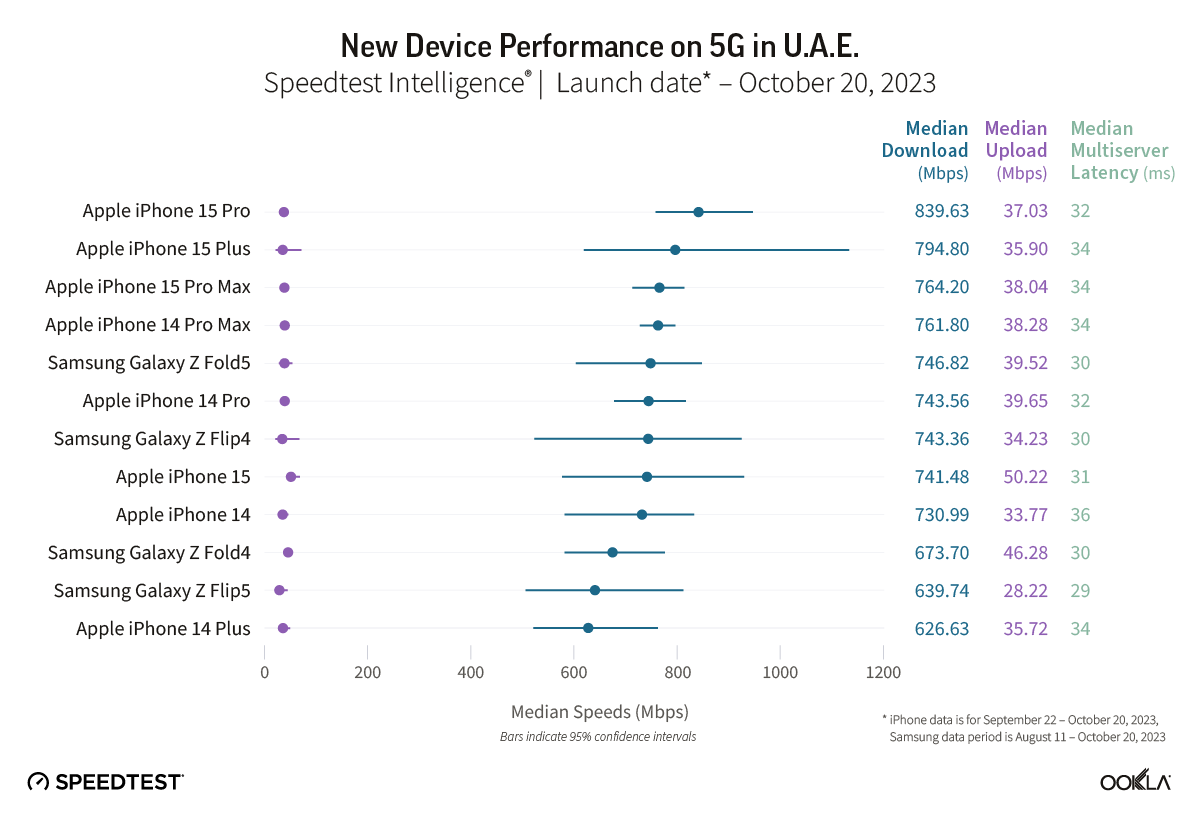
Chart of New Device Performance on 5G in U.A.E.

While Speedtest Intelligence data did not show significant increases in median download speed over 5G for the iPhone 15 Pro or the iPhone 15 Pro Max during the September 22-October 20, 2023 period, performance likely isn’t a concern in the United Arab Emirates, whose blisteringly fast download speeds topped the Speedtest Global Index™ in September 2023. There were not enough samples to properly assess the performance of the other two iPhone models.

Similarly, there was no statistical winner for 5G median download speed during the August 11-October 20, 2023 period for the Galaxy Z Fold in the U.A.E., and there were not enough samples to evaluate the Galaxy Z Flip.

Recommendation: Consumers in the U.A.E. should upgrade if they are looking for the new features on the new phone models, but upgrades for performance are unnecessary.

iPhone upgrades are the way to go in the U.K.

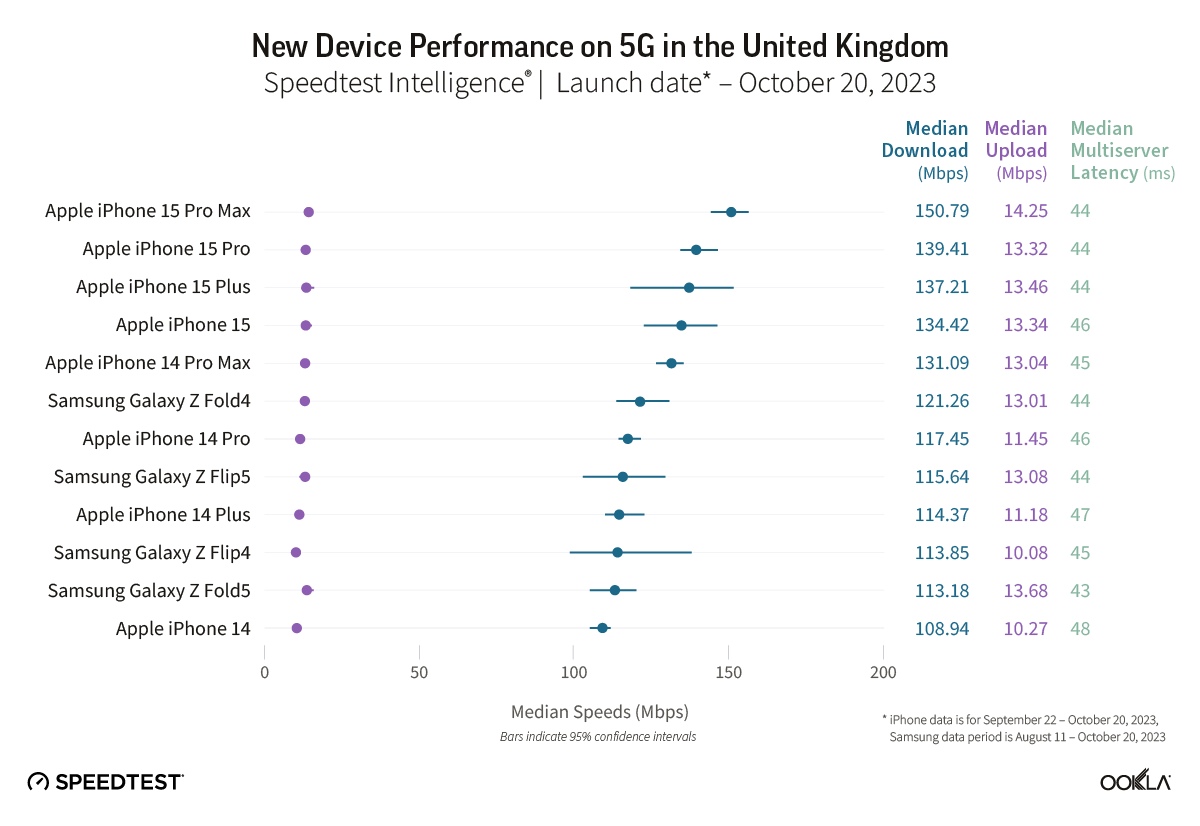
Chart of New Device Performance on 5G in the United Kingdom

All four iPhone 15 models in the United Kingdom showed median 5G download speeds that were significantly faster than their iPhone 14 equivalents during the September 22-October 20, 2023 period. Speedtest Intelligence reveals the iPhone 15 had a 16% better download speed than the iPhone 14, the iPhone 15 Pro had a 14% better download speed than the iPhone 14 Pro, iPhone 15 Pro Max had a 10% better download speed than the iPhone 14 Pro Max, and iPhone 15 Plus has a 4% better download speed than the iPhone 14 Plus. 

There was no statistical winner for 5G median download speed during the August 11-October 20, 2023 period for the Galaxy Z Flip or the Galaxy Z Fold in the U.K.

Recommendation: iPhone users in the U.K. should see performance improvements that make upgrading to the latest models worthwhile. Samsung Galaxy users only need to upgrade if they are looking for new features.

U.S. consumers see some of the highest improvements when upgrading to new iPhone models

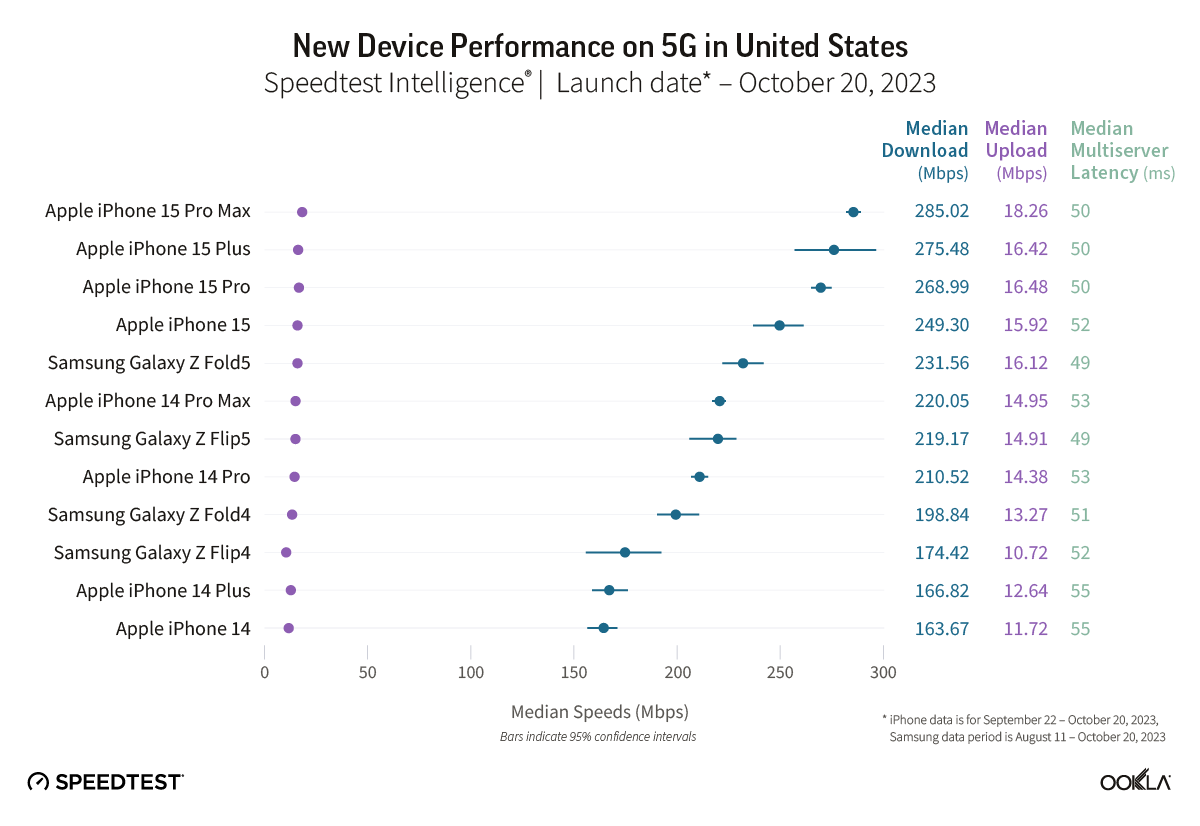
Chart of New Device Performance on 5G in United States

Not only did all four iPhone 15 models in the United States show median 5G download speeds that were significantly faster than their iPhone 14 equivalents during the September 22-October 20, 2023 period, the improvements in performance were greater than we saw in most other countries, with the exception of Spain. Speedtest Intelligence showed the iPhone 15 Plus had a 54% better download speed than the iPhone 14 Plus, the iPhone 15 had a 45% better download speed than the iPhone 14, iPhone 15 Pro Max had a 27% better download speed than the iPhone 14 Pro Max, and iPhone 15 Pro has a 25% better download speed than the iPhone 14 Pro. 

Samsung users also saw increased median download speeds over 5G when using the newer models during the August 11-October 20, 2023 period in the U.S. The Galaxy Z Flip5 had a 15% better download speed than the Galaxy Z Flip4, and the Galaxy Z Fold5 had a 10% better download speed than the Galaxy Z Fold4.

Recommendation: Upgrades for all this holiday season!

No performance boost on iPhone 15 Pro Max in Vietnam

Chart of New Device Performance on 5G in Vietnam

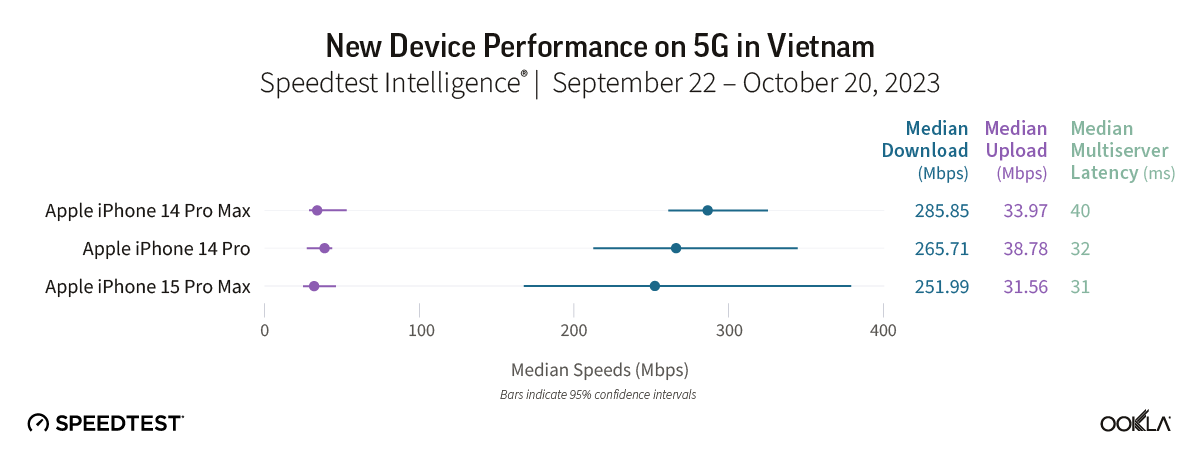
The iPhone 15 Pro Max did not have a statistically better median download speed over 5G than the iPhone 14 Pro Max during the September 22-October 20, 2023 period in Vietnam. There were not enough samples to properly assess the performance of the other three iPhone models. Likewise, there were not enough samples to evaluate the Galaxy Z Flip or the Galaxy Z Fold.

Recommendation: Vietnamese consumers don’t need to upgrade to newer models on performance alone.

Ookla will continue evaluating device performance

We’re excited by the number of countries where mobile device performance increased with the new models and even more excited by the countries where performance is so fast that consumers can look to new modes of connectivity. Even if your country didn’t see the speed boosts you were hoping for, don’t hold back on upgrading if you want to treat yourself or a loved one based on any other number of reasons. Remember to download the iOS or Android Speedtest® app on any new devices to make sure your mobile operator is delivering the speeds you expect.

Ookla retains ownership of this article including all of the intellectual property rights, data, content graphs and analysis. This article may not be quoted, reproduced, distributed or published for any commercial purpose without prior consent. Members of the press and others using the findings in this article for non-commercial purposes are welcome to publicly share and link to report information with attribution to Ookla.

| October 23, 2023

A Reality Check on the Progress toward a Gigabit Society

The European Commission has set forth an ambitious goal of achieving a Digital Decade 2030 strategy, also known as the Digital Compass. The aim is to expedite the digital transformation of Member States by 2030. One of the primary objectives of this strategy is to improve digital connectivity, which will be measured through specific targets such as 100 Mbps services by 2025 and gigabit coverage to all EU households by 2030. In this article, we will discuss the progress made so far, the disparities in user experience, and the challenges that need to be addressed to achieve Europe’s connectivity goals.

Key messages 

  • Digital Decade Ambition: The ambitious goals of the EU’s Digital Decade strategy are indeed lofty. Broadband services might promise speeds in excess of 1 Gbps, but the reality is that users rarely experience that level of speed. However, while the gap between advertised speeds and actual speeds for gigabit services is wide, speeds approaching 100 Mbps are far more common. 
  • Median Download Speeds and Infrastructure Development: Several European countries are making substantial progress in offering high-speed broadband. Denmark, Spain, France, and Romania have notably fast median download speeds, primarily due to their fiber-to-the-home (FTTH) infrastructure investments. The type of broadband technology used in those countries (and others) significantly influences the gap between download and upload speeds, with fiber-based networks showing more balanced speeds.
  • AltNets Drive Fiber Adoption: Alternative network providers (AltNets) play a vital role in accelerating fiber adoption and addressing challenges mainstream ISPs face. Their role varies across countries and regions.
  • Take-up rates remain a challenge: With the completion of fiber rollout in several countries, the focus has now shifted towards promoting fiber subscriptions. However, there are challenges that persist, such as consumer reluctance and the need for incentives. A survey conducted in rural France revealed that 42% of the respondents found their current internet sufficient, while 37% said that they would be encouraged to upgrade if offered incentives.

You can also register for our November 8 webinar, where a panel of industry experts will discuss how Europe can accelerate the expansion of gigabit-capable infrastructure. Register now

On the road to 100 Mbps

Chart of Percentage of Households Subscribing to Fixed Broadband of at Least 1 Mbps and Proportion of Users that Achieved 100 Mbps

The European Commission aims to ensure that all European households, businesses, and public institutions should have access to “high internet speeds” of at least 100 Mbps by year-end 2025. The EU is showing progress in terms of achieving that target. According to Broadband Coverage in Europe 2022, 86.6% of EU households were within 100 Mbps + coverage, meaning they had access to broadband services capable of providing at least 100 Mbps download speeds. 

While having networks available does not automatically equate to real penetration or adoption rates, it is an important prerequisite. Physical accessibility to network services is a vital first step before actual usage, which is influenced by factors such as affordability, awareness, and the perceived need for the service.

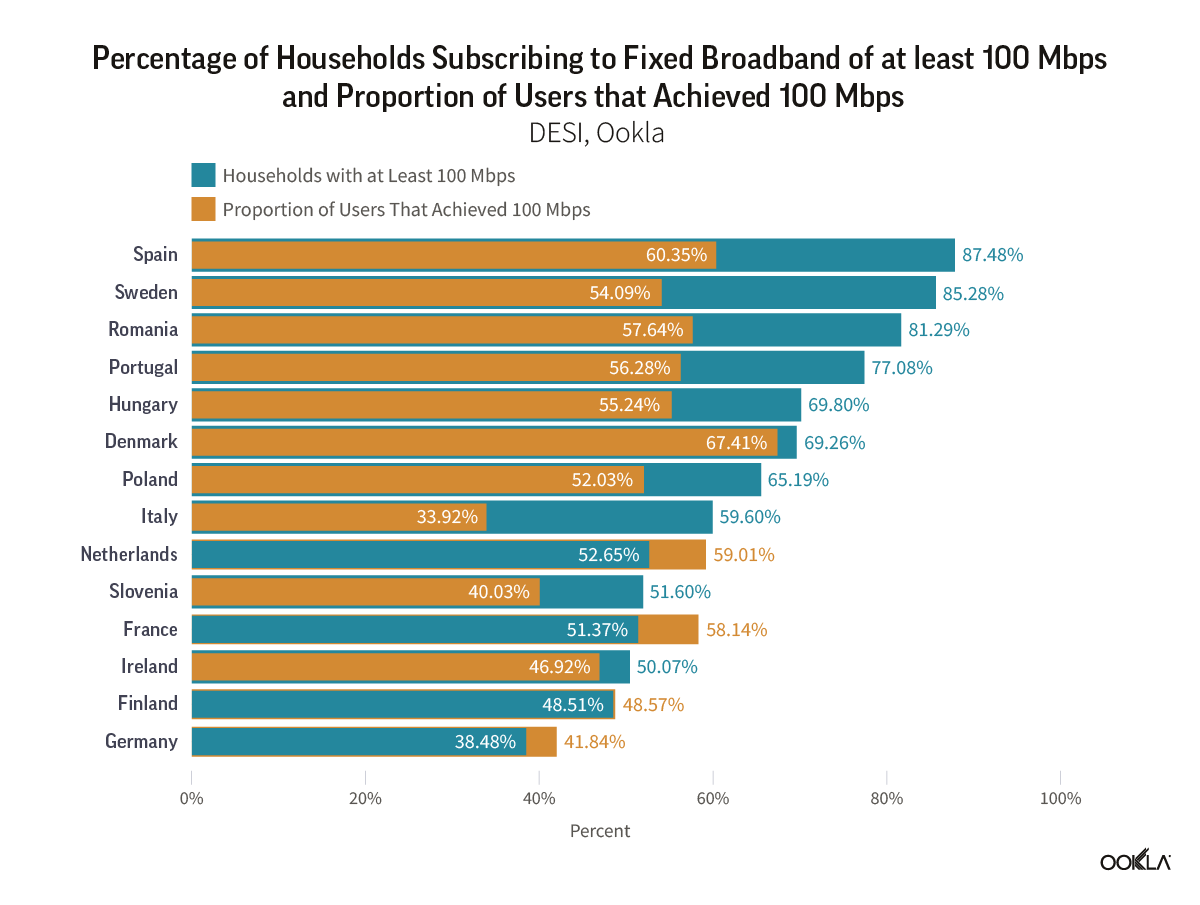
According to the Digital Economy and Society Index DESI 2023 dashboard for the Digital Decade, 55.08% of EU households had already subscribed to fixed broadband services with internet speeds of at least 100 Mbps. While this rate of subscribers is significant and an indicator of the EC’s ongoing progress, the region is still far from achieving its goal of universal, 100 Mbps coverage by 2025. Some countries like Spain, Sweden, and Romania, where over 80% of households subscribe to broadband exceeding 100 Mbps, have already made significant progress in terms of fiber coverage. 

However, in those countries, there is a significant gap between what households subscribe to and what we see from Ookla® data in terms of users actually experiencing speeds above 100 Mbps. Netherlands, France, and Germany are the outliers where we see more users having “high internet speeds” compared to the speeds advertised in their broadband subscription package. This is particularly interesting because Germany still heavily relies on VDSL for high-speed access technologies. Still, there is a significant amount of work to be done before countries can deliver on their strategies to achieve the 100 Mbps target.
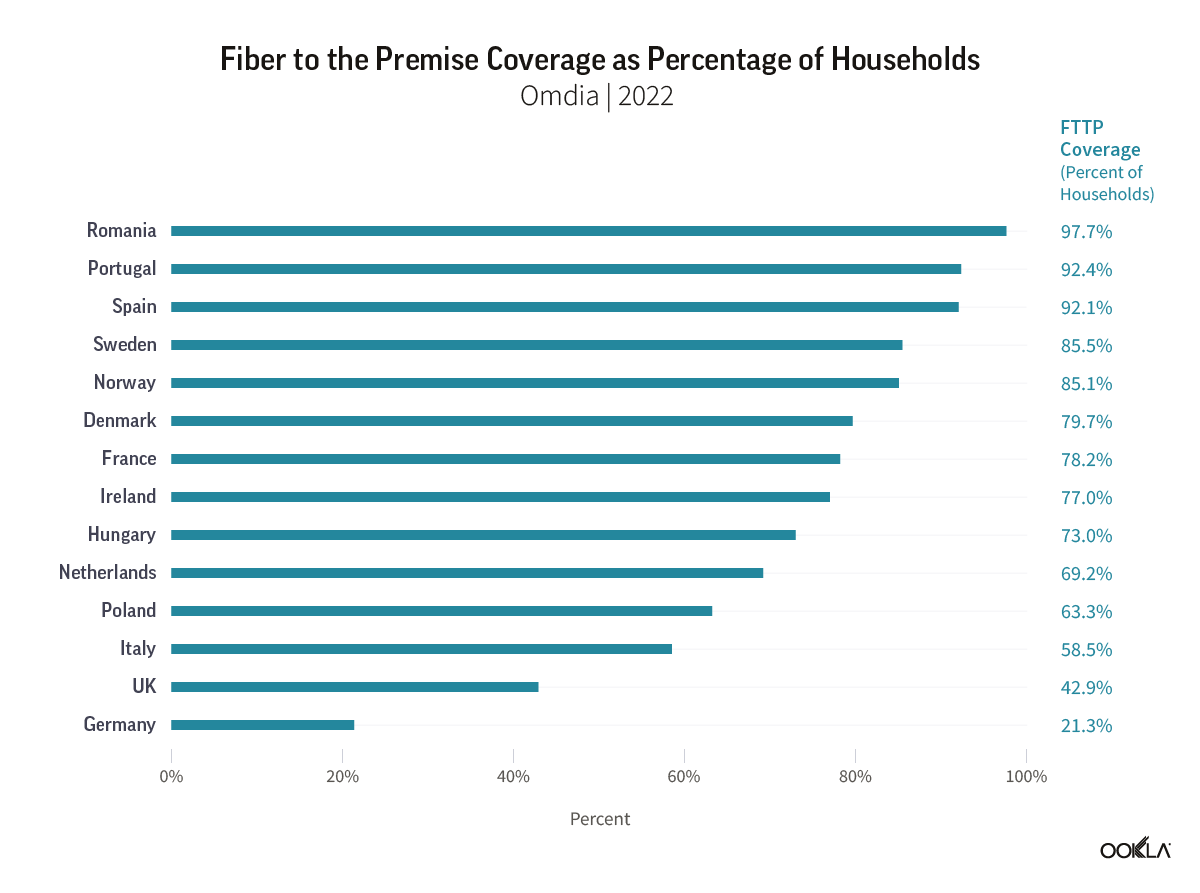
Chart of Fibre to the Premise Coverage as Percentage of Households

The EC’s goal of gigabit connectivity is certainly one of the driving forces behind the rollout of fiber networks in the region. So far, progress is mixed across the region in terms of fiber network rollouts and adoption. As we have discussed, regulatory incentives propel the move to fiber. For example, Romania has one of the highest Fiber to the Home/ Building (FTTP/B) penetration rates across the region — nearly 97.7% of households — which is partially driven by government-backed fixed infrastructure projects such as RoNet, and the special attention given to rural and disadvantaged areas. Portugal, which already scored high on fiber coverage, plans to launch an international public tender by the end of 2023 for a project to cover all underserved areas with fiber-optic networks to boost fiber penetration further.

The reality of gigabit speeds 

The European Commission’s Digital Decade 2030 strategy seeks to extend gigabit (1 Gbps) connectivity to every European Union household by 2030. To track the progress of these objectives, the DESI plays a crucial role in tracking EC’s progress. Only 56% of households in the EU have access to the necessary fiber networks for gigabit connectivity, and the take-up rate (proportion of households that subscribe to fiber) is even lower. According to the DESI 2023 dashboard for the Digital Decade, 13.76% of households in the European Union have subscribed to fixed broadband with at least 1 Gbps as of 2022. Nevertheless, there is a significant disparity in these percentages across different EU nations. For instance, only five countries surpassed the EU value – France leading with 39.94%, Hungary second at 29.81%, followed by Romania at 23.35%, Denmark at 18.66%, and Spain at 14.57%.
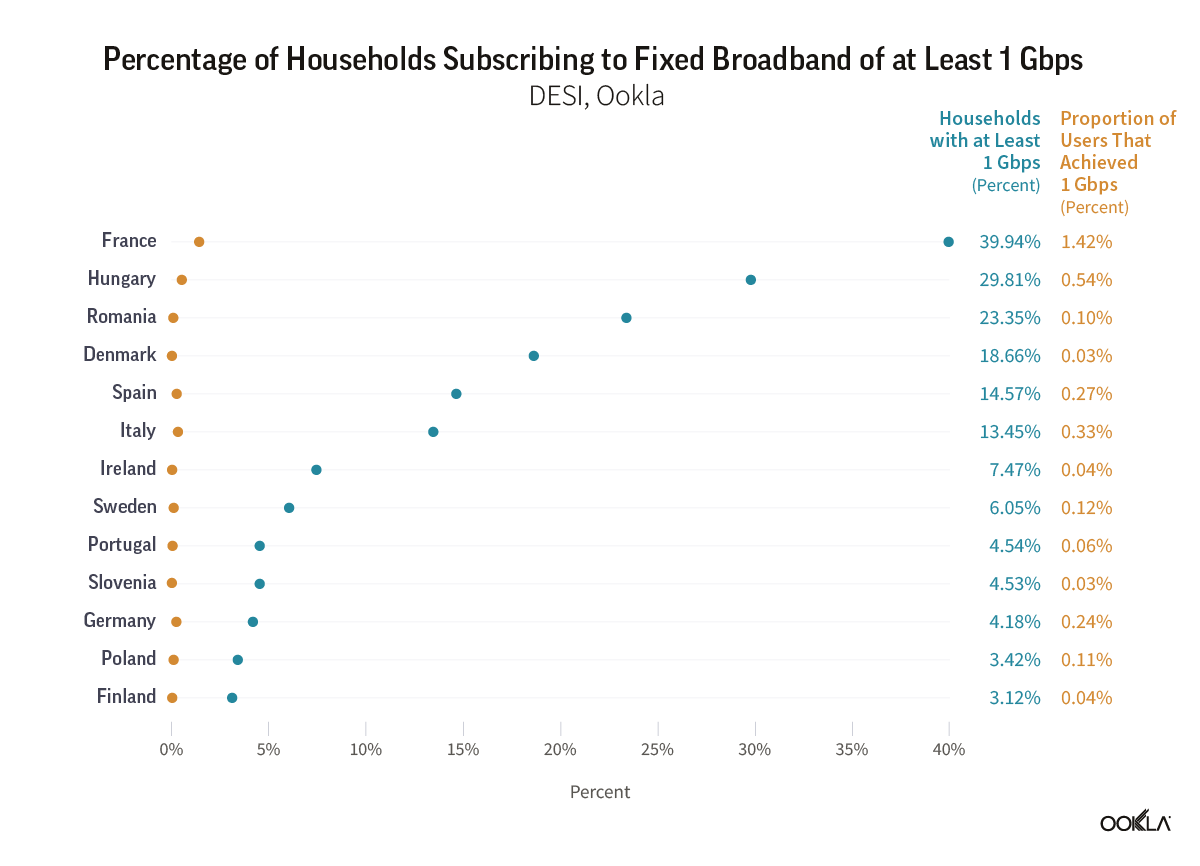
Chart of Percentage of Households Subscribing to Fixed Broadband of at Least 1 Gbps

Looking at this data one might believe that many European households have access to Gigabit internet speeds. However, the reality is different as not all of them genuinely experience such high speeds. In fact, the proportion of Speedtest® users registering median download speeds of at least 1 Gbps in many countries is quite low. For example, France only had 1.42%, Hungary at 0.54%, Romania at 0.1%, Denmark at 0.03%, and Spain at 0.27%. 

The significant gap between expectations and reality underscores the importance of not only rolling out gigabit-capable networks but also stimulating demand for those services. Service providers also need to pay attention to home networking equipment. Our research has shown that in markets where legacy broadband technology (such as DSL or coax cable) is being replaced by advanced cable and fiber connections, Wi-Fi performance can lag behind ethernet. Wi-Fi speeds typically range from 30-40% of ethernet, indicating a need to accelerate the adoption of more advanced Wi-Fi technologies and optimize the home network environment.

Median download and upload disparities

Median speeds are a standard metric for measuring performance, but there’s more to the story for the end-user experience. Access technology, be it DSL, cable, or fiber, as well as customer premises equipment and end-user devices, significantly influence the user experience. In our recent article, we highlighted how the persistent use of legacy and underperforming Wi-Fi standards in home networks can hamper efforts to provide the best network experience to customers despite progress in terms of fiber rollout and adoption.
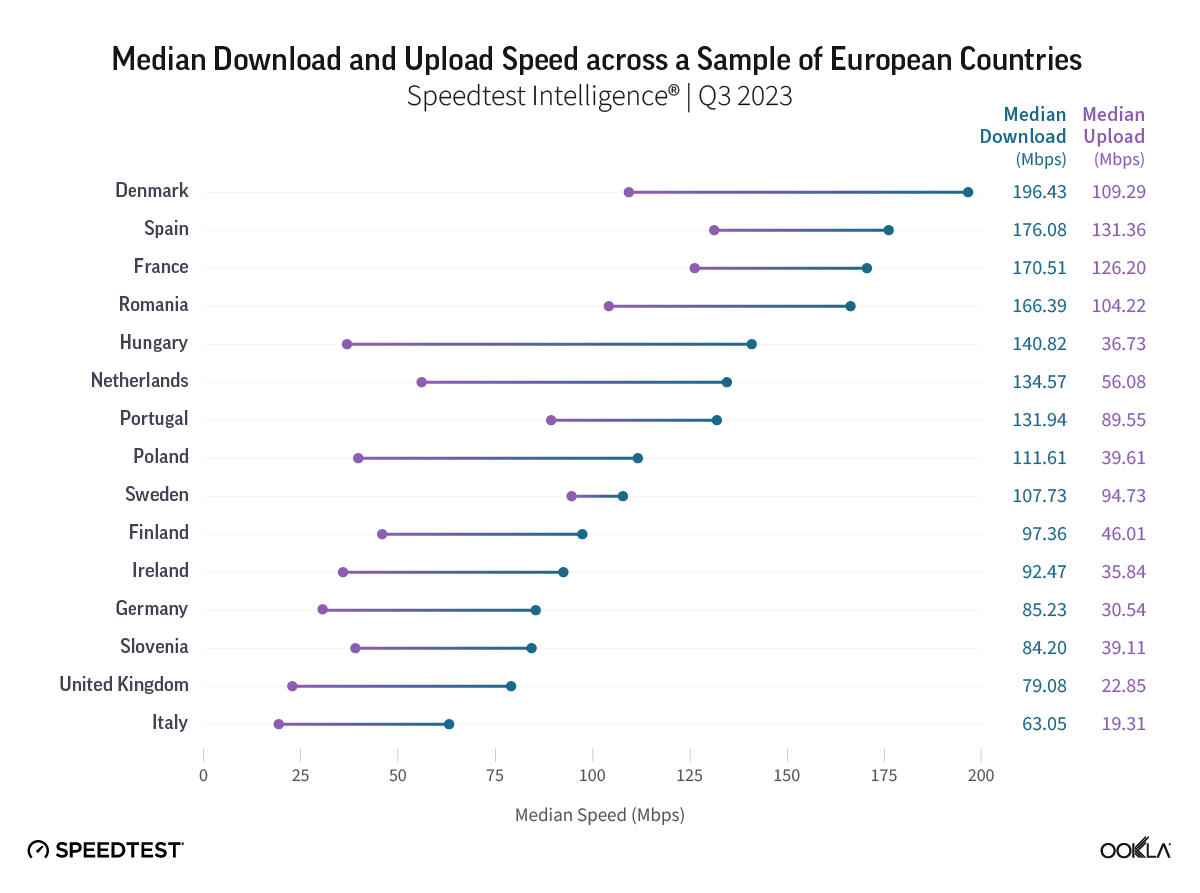
Median Download and Upload Speed across a Sample of European Countries

According to Speedtest Intelligence® in Q3 2023, across Europe, Denmark had the fastest median download speed for fixed broadband (196.43 Mbps), followed by Spain (176.08 Mbps), France (170.51 Mbps), and Romania (166.39 Mbps). Notably, several of those countries have a substantial gap between median download and upload speeds. The type of broadband technology implemented can heavily influence the divergence between download and upload performance. Nations still reliant on DSL and cable often exhibit lower median upload speeds and a wider gap between upload and download speeds. On one hand, the UK and Germany lag behind other countries in broadband infrastructure upgrades due to their reliance on copper-based technologies and cable networks and are at the tail end of the ranking. 

On the other hand, Sweden, with a 63% Fiber-to-the-Home (FTTH) penetration rate in 2022, has the narrowest gap between download and upload speeds. Forward-thinking broadband infrastructure and significant municipal involvement have positioned Sweden to reach the EC’s goals in the coming years. France, Spain, Denmark, Romania, and Portugal are also making significant progress toward achieving full-fiber coverage, with France expecting a full-fiber rollout by 2025. As fiber broadband adoption increases, the gap between download and upload speeds will narrow, mainly because fiber subscriptions are typically offered with symmetrical speeds, where users would experience the same level of speed for both download and upload usage. 

However, even when we look at “the best-connected” Speedtest users (those seeing speeds in the top 10th percentile of our results), there’s a wide range of performance. Download speeds ranged between 417.23 Mbps and 844.04 Mbps, while the range for upload speeds was even wider, with median upload speeds ranging from 57.11 Mbps to 599.39 Mbps. 

When looking at speeds at the 10th percentile, only four countries topped 700 Mbps. France led with a top speed of 844.08 Mbps, followed by Hungary at 765.85 Mbps, Denmark at 734.91 Mbps, and Romania at 704.04 Mbps. Notably, three of these countries (Romania, France, and Denmark) also lead in the top 10% of upload speeds, with all three exceeding 500 Mbps. 

While for most countries included in this analysis, top speeds are at least a few hundred Mbps apart, there are a few exceptions. Spain shined bright, with the top 10% of its download and upload speeds closely matched at 611.17 Mbps and 609.17 Mbps, respectively. 
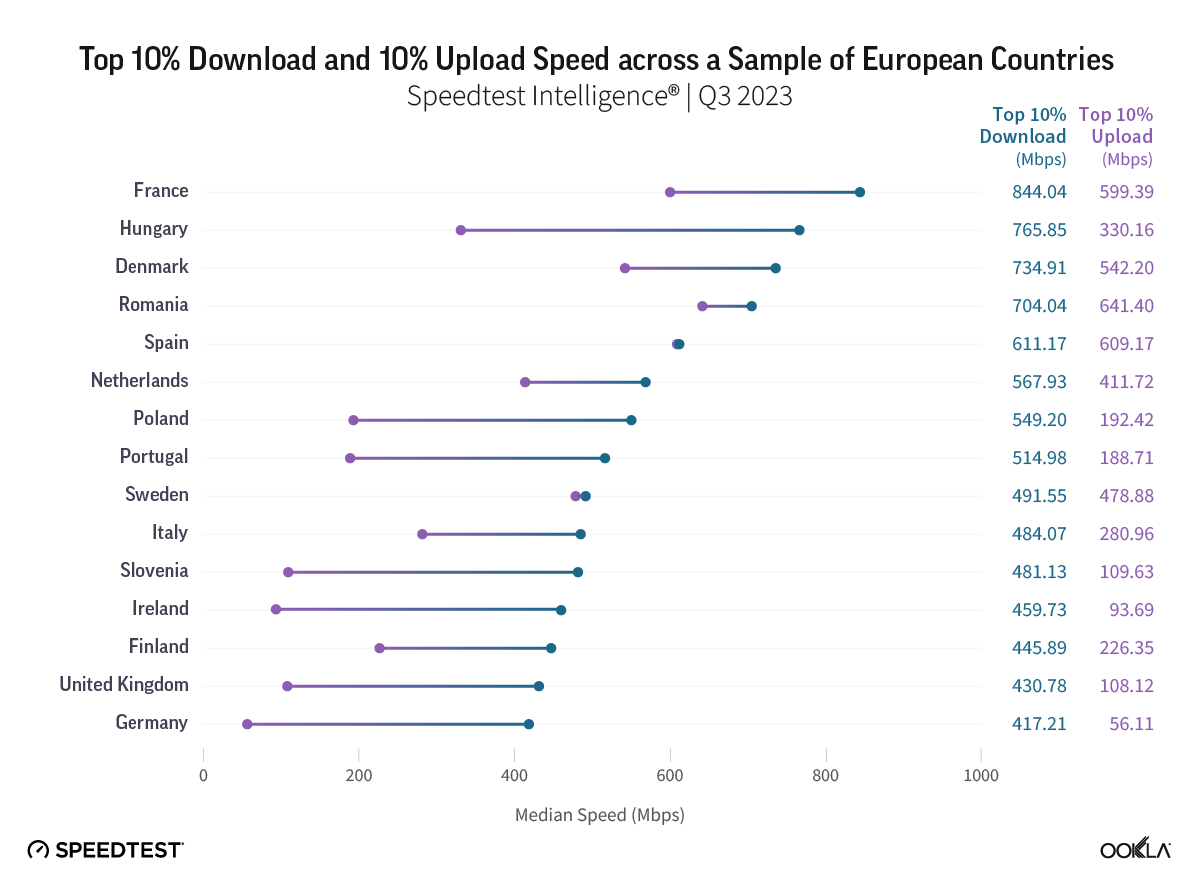
Chart of Top 10% Download and Upload Speed across a Sample of European Countries

Beyond median speeds

To delve deeper into the performance and reliability of internet services across different countries, it can be helpful to look at the expected speed range, i.e., the range of speeds that the majority of users experience. This middle 50% of speeds are captured by the interquartile range, with the lower value of the range, or lower quartile, indicating the bottom 25% of speeds and the upper value of the range, or upper quartile, indicating the top 25% of speeds. Examining Speedtest Intelligence data from Q3 2023, the lower quartile download speed across European countries ranged from 28.15 Mbps to 81.48 Mbps (in other words,, 25% of downloads were below that speed), while upper quartile speeds clocked in between 166.16 Mbps and 441.38 Mbps (i.e., 25% of downloads were above this speed). 
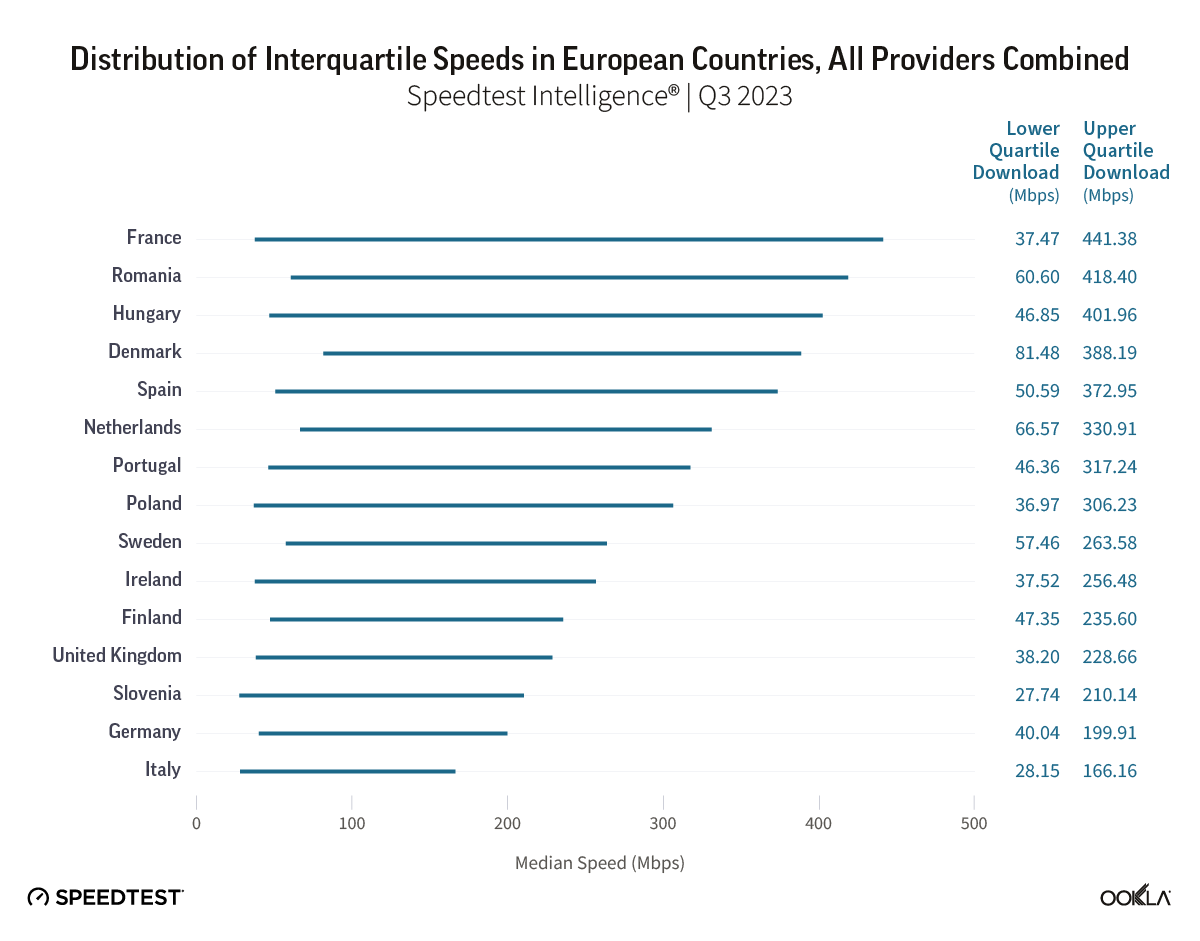
Chart of Distribution of Interquartile Speeds in European Countries, All Providers Combined

Role of AltNets

According to the FTTH Council Europe, alternative operators (AltNets) are playing a significant role in the adoption of fiber in the EU39 region. The EU39 region comprises the EU27, the UK, Iceland, Israel, North Macedonia, Norway, Serbia, Switzerland, Turkey, and 4 CIS other countries. In 2021, around 56% of FTTH/B initiatives were led by AltNets, which marks a shift from 2011 when alternative ISPs had a 71% share, and incumbents accounted for only 21% of initiatives. 

Chart of Number of Active Internet Service Providers (ISPs) and FTTH Share of All Connections

We looked at data from Omdia to determine whether there is a correlation between the number of active ISPs and the speed of the transition to fiber networks measured by FTTH share of all connections. The relationship is not straightforward and varies significantly depending on each country’s competitive landscape and government initiatives. 

Across a number of countries fiber accounts for the majority of subscriptions – Spain comes on top with 81.8%, followed by Romania (81.7%), Sweden (77.5%), and Portugal (62.4%). Spain is a good example of a market that has been migrating to fiber away from copper ahead of the incumbent Telefonica turning off its legacy fixed network in 2024. Furthermore, Spain’s National Commission for Markets and Competition (CNMC) has simplified its ‘MARCo offer’, making it easier for alternative operators to access Telefonica’s infrastructure to launch their own fiber optic services. 

It is worth noting that countries like the UK and Poland, which have many ISPs, are also leading the way in AltNet-driven fiber initiatives. In our previous article looking at the impact of AltNets in the UK, we concluded that AltNets played an important role. In fact, AltNets provided the top speeds in London, Glasgow, Liverpool, and Manchester, as well as across a number of counties. Public funding has helped facilitate the emergence of fiber ISPs in rural areas where fiber deployment is not commercially viable. Other AltNets like Hyperoptic are already well established, deploying and operating an FTTP network in high-density areas, which connects existing and new multi-dwelling buildings.

Take-up rates come with challenges

As fiber rollout nears completion in some countries, the focus shifts to selling fiber subscriptions to households that are within fiber network coverage. Sweden leads with an 80.1% consumer take-up rate (proportion of households that subscribed to and are actively using fiber-optic broadband services), but Spain, Norway, and France also boast high rates above 70%. 
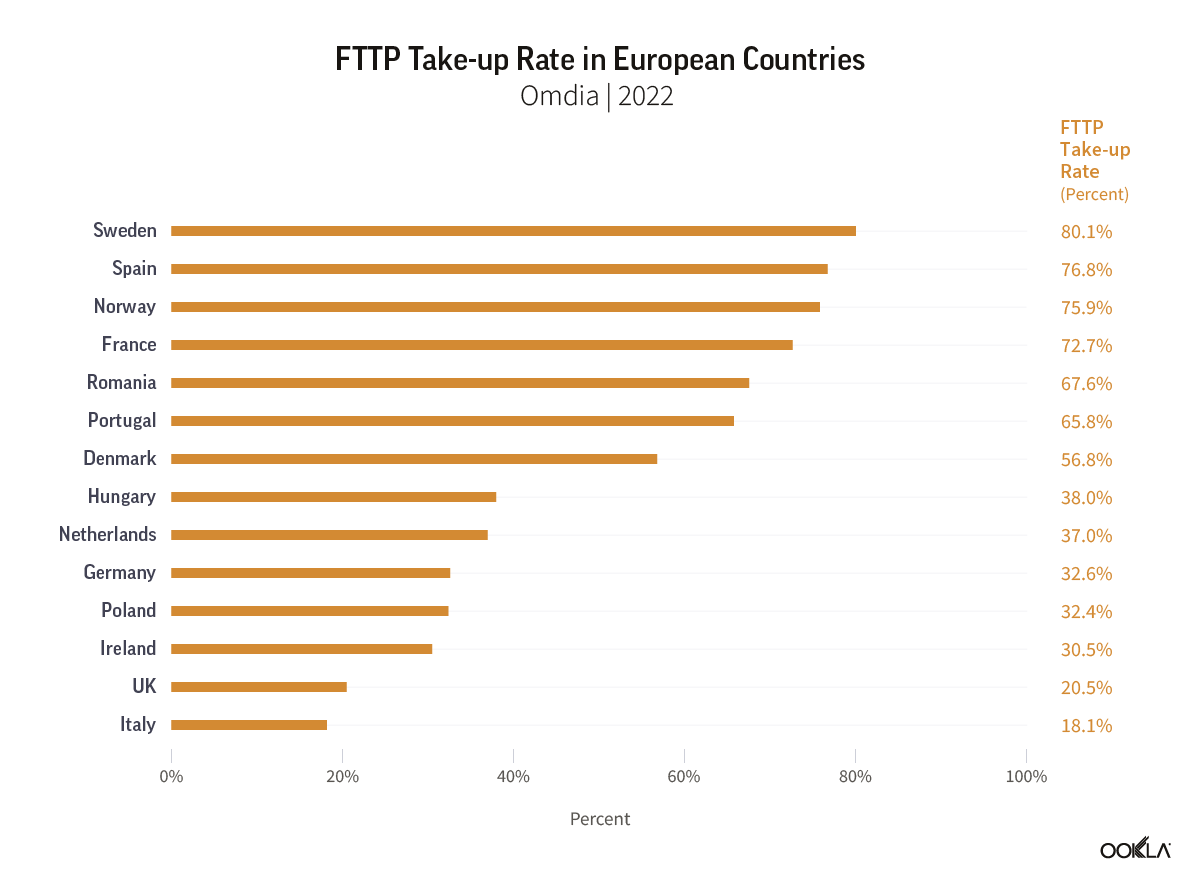
Chart of FTTP Take-up Rate in European Countries

Sweden was the country that pioneered the open access model for fiber networks to drive competition and contributed to the country’s high fiber broadband penetration rates. Fiberhost, a Polish open-access network provider, is a significant beneficiary of EU funds, with 99% of funding for building the country’s fiber network in white spot areas (areas with limited or no access to high-speed internet).

There also has been notable progress in the wholesale networks market in Europe, some of which look to connect remote and rural areas. The Italian wholesale operator, Open Fiber, is partially funded by the country’s National Recovery and Resilience Plan (PNRR), with the goal of connecting the grey areas (where no other operator has plans to develop an NGA network) to gigabit speeds. 

However, challenges persist in convincing consumers to switch to full fiber, even in countries with high take-up rates. For instance, a joint venture by Orange conducted a survey in rural areas of France to understand why households with FTTH access hadn’t upgraded to fiber services. The study revealed that 42% found their current internet sufficient, while 37% said incentives would encourage them to upgrade. Incentives and other initiatives are being implemented to migrate customers onto fiber networks in many countries in the region and across the world. 

Future Initiatives and Investments

Fiber offers superior internet speeds, lower latency, enhanced security, and environmental sustainability – a noteworthy upgrade from copper networks and also a path forward for some cable operators (instead of DOCSIS 4.0). AltNets are making strides in driving fiber deployment across Europe, pushing toward the EC’s ambitious goals of achieving a gigabit society.

Despite progress, obstacles remain in convincing consumers to fully transition to fiber services. Comprehending consumer behavior, promoting fiber benefits, and inspiring initiatives will all play significant roles in this endeavor. Likewise, continued investments must be made to keep Europe on track to attain its connectivity targets

For more insightful updates on Europe’s fiber connectivity status, look forward to the Network X event in October 2023. It’ll offer a live pulse on the latest developments in fiber connectivity. We will continue to follow European countries’ progress toward Gigabit society and monitor its impact on fixed broadband speeds. If you’d like to learn more about internet speeds and speed performance in other markets around the world, visit the Speedtest Global Index™.

You can also register for our upcoming webinar, “Accelerating Europe’s Gigabit Revolution” on Wednesday, November 8 at 9 a.m. CET (GMT+1). A panel of industry experts will come together to discuss how Gigabit Society fits into Europe’s digital transformation strategy and propose strategies to ensure digital access for all. A recording will be provided for registrants who can’t join the live presentation. Register now

Ookla retains ownership of this article including all of the intellectual property rights, data, content graphs and analysis. This article may not be quoted, reproduced, distributed or published for any commercial purpose without prior consent. Members of the press and others using the findings in this article for non-commercial purposes are welcome to publicly share and link to report information with attribution to Ookla.

| February 22, 2017

How’s the Mobile Performance at Mobile World Congress?

You might expect the world’s largest gathering of professionals in the mobile industry to have amazing mobile speeds. Then again, maybe not, since large gatherings can sap the bandwidth right out of a network. We took a look at the speeds at last year’s event to see what you might expect if you’re attending Mobile World Congress (MWC) 2017.

Recapping 2016 performance

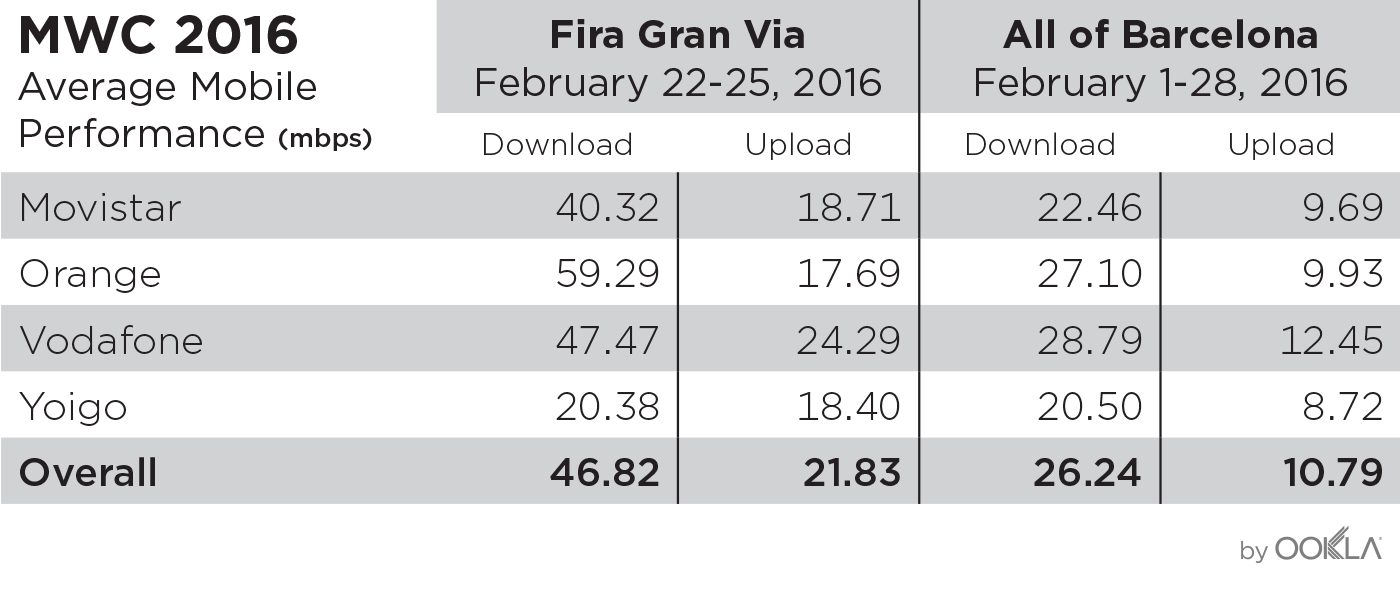
We isolated MWC 2016 speeds by geofencing Barcelona’s Fira Gran Via, where the conference was held, and analyzing a sample of Speedtest data from February 22–25, 2016, the dates of last year’s MWC. We then compared that data to the results from the entire city of Barcelona during the month of February 2016.

You can see that all carriers except Yoigo significantly exceeded average speeds for Barcelona at MWC 2016. So the mobile performance at MWC 2016 almost universally rocked.

The average download speed over Wi-Fi, on the other hand, was a paltry 14.62 Mbps.

We’re watching 2017 data

Of course the MWC crowd will put connectivity at Fira Gran Via to the test during the conference. Carriers will likely bring portable cell sites to offer fast coverage to the masses of mobile-savvy attendees. But we won’t know the actual speeds until the event begins and the Speedtest data starts rolling in.

  • Will the speeds be as fast as last year?
  • Will Orange come out on top for download speed again this year?
  • Will Vodafone offer the fastest uploads?

To find out, watch this space for daily Speedtest data and analysis during the conference, or follow us on Twitter.

As always, you can contribute to our data by taking a Speedtest at the event. And be sure to share your Speedtest results from #MWC17 with #CrowdSpeed on Twitter.

February 27, 2017

The first official day of MWC is just wrapping up and here’s what we saw for speeds at the event during the hours of 6am-7pm UTC:

  • Orange lives up to the first day excitement by knocking mobile download speed out of the park so far.
  • Vodafone and Yoigo are also significantly faster for downloads than they were last year.
  • Movistar is the only carrier whose download speed decreased compared to last year’s conference.
  • Upload speeds are mixed with Movistar and Orange posting strong increases while Vodafone and Yoigo’s download speeds decreased.

We’ll see how that all changes tomorrow…

February 28, 2017

Day two of MWC 2017 has wrapped up. Amidst all the device unveilings and amazing predictions for the future, we have news on whose mobile speeds are rocking the conference.

And the winner is… Orange!

  • For the second day in a row Orange has the fastest download speed. Though slower than yesterday, their download speed is still enviable.
  • Movistar’s downloads are significantly faster than yesterday and have almost caught up to Vodafone’s.
  • Vodafone’s download speed decreased slightly from yesterday, but is still fast enough to live-stream those keynotes.
  • Upload speeds are slower overall than yesterday, but in most cases you should have the performance you need for a video call back home.
  • Sadly, Yoigo’s download and upload speeds are already showing conference fatigue. Let’s hope they rally for tomorrow.

See you back here tomorrow for a recap of day three.

March 1, 2017

The mobile performance numbers are in for day three of MWC and we saw a huge shakeup overnight:

  • Vodafone has pulled way ahead of previous leader Orange for download speed since yesterday with a speed almost as fast as Orange’s day one showing.
  • Movistar has jumped into second place for downloads with now third place Orange ever so slightly behind.
  • Yoigo more than doubled their download speed from yesterday, but they’re still less than half as fast as Movistar and Orange.
  • Upload speeds are looking better than ever across the board with the three fastest carriers all coming in at better than 30 Mbps. Even Yoigo had their fastest day yet for uploads.

Tomorrow’s your last chance to help us gather data, so don’t forget to download those apps for Android or iOS and take a Speedtest. We’ll have day four results as well as averages from the conference as a whole at the end of the day tomorrow.
March 2, 2017

The final day of MWC 2017 saw the most dramatic shift in speeds of the whole conference:

  • Vodafone downloads came in at a lightning-quick 123.05 Mbps. Their uploads were also the fastest we’ve seen from any carrier during the conference.
  • Movistar’s download and upload speeds dipped way down from their prior strength.
  • Orange brought the stability with a download speed that was relatively close to yesterday’s performance, though their upload speed dipped a bit.
  • Meanwhile, there were no Yoigo tests at all.

MWC 2017 mobile performance as a whole

But what you really want to know is which carrier had the fastest speeds for the duration of the conference. The averages are in and…

  • Orange takes first place with a very impressive 97.36 Mbps average download over the four days.
  • Vodafone is a strong second for downloads and Movistar’s third place speed is still quite respectable.
  • If you’ve been watching these updates, it’s no surprise that Yoigo had the slowest speeds overall. That was also true last year, though their year-over-year improvement is solid.
  • Strangely, the upload speeds of the top three fastest carriers were nearly indistinguishable. That 25 Mbps or so is good news for anyone who’s sending masses of conference pics (or snapshots of Sagrada Familia, we won’t tell) back home.

That’s it for our Barcelona coverage this year. We hope your MWC experience was as amazing as some of these speeds. We’re going to go catch up on some sleep and we’ll be back with more analysis soon.

Ookla retains ownership of this article including all of the intellectual property rights, data, content graphs and analysis. This article may not be quoted, reproduced, distributed or published for any commercial purpose without prior consent. Members of the press and others using the findings in this article for non-commercial purposes are welcome to publicly share and link to report information with attribution to Ookla.

| June 28, 2017

Seeking Out the Fastest Free Wi-Fi at European Airports

If Europe is on your travel itinerary this summer, you probably want to know which airports offer free Wi-Fi and whether the service is fast enough for you to handle all of life’s last minute details before jetting across the continent. We took a look at Speedtest data from March through May 2017 from twelve of Europe’s busiest airports to help you find out.

Fastest airport Wi-Fi

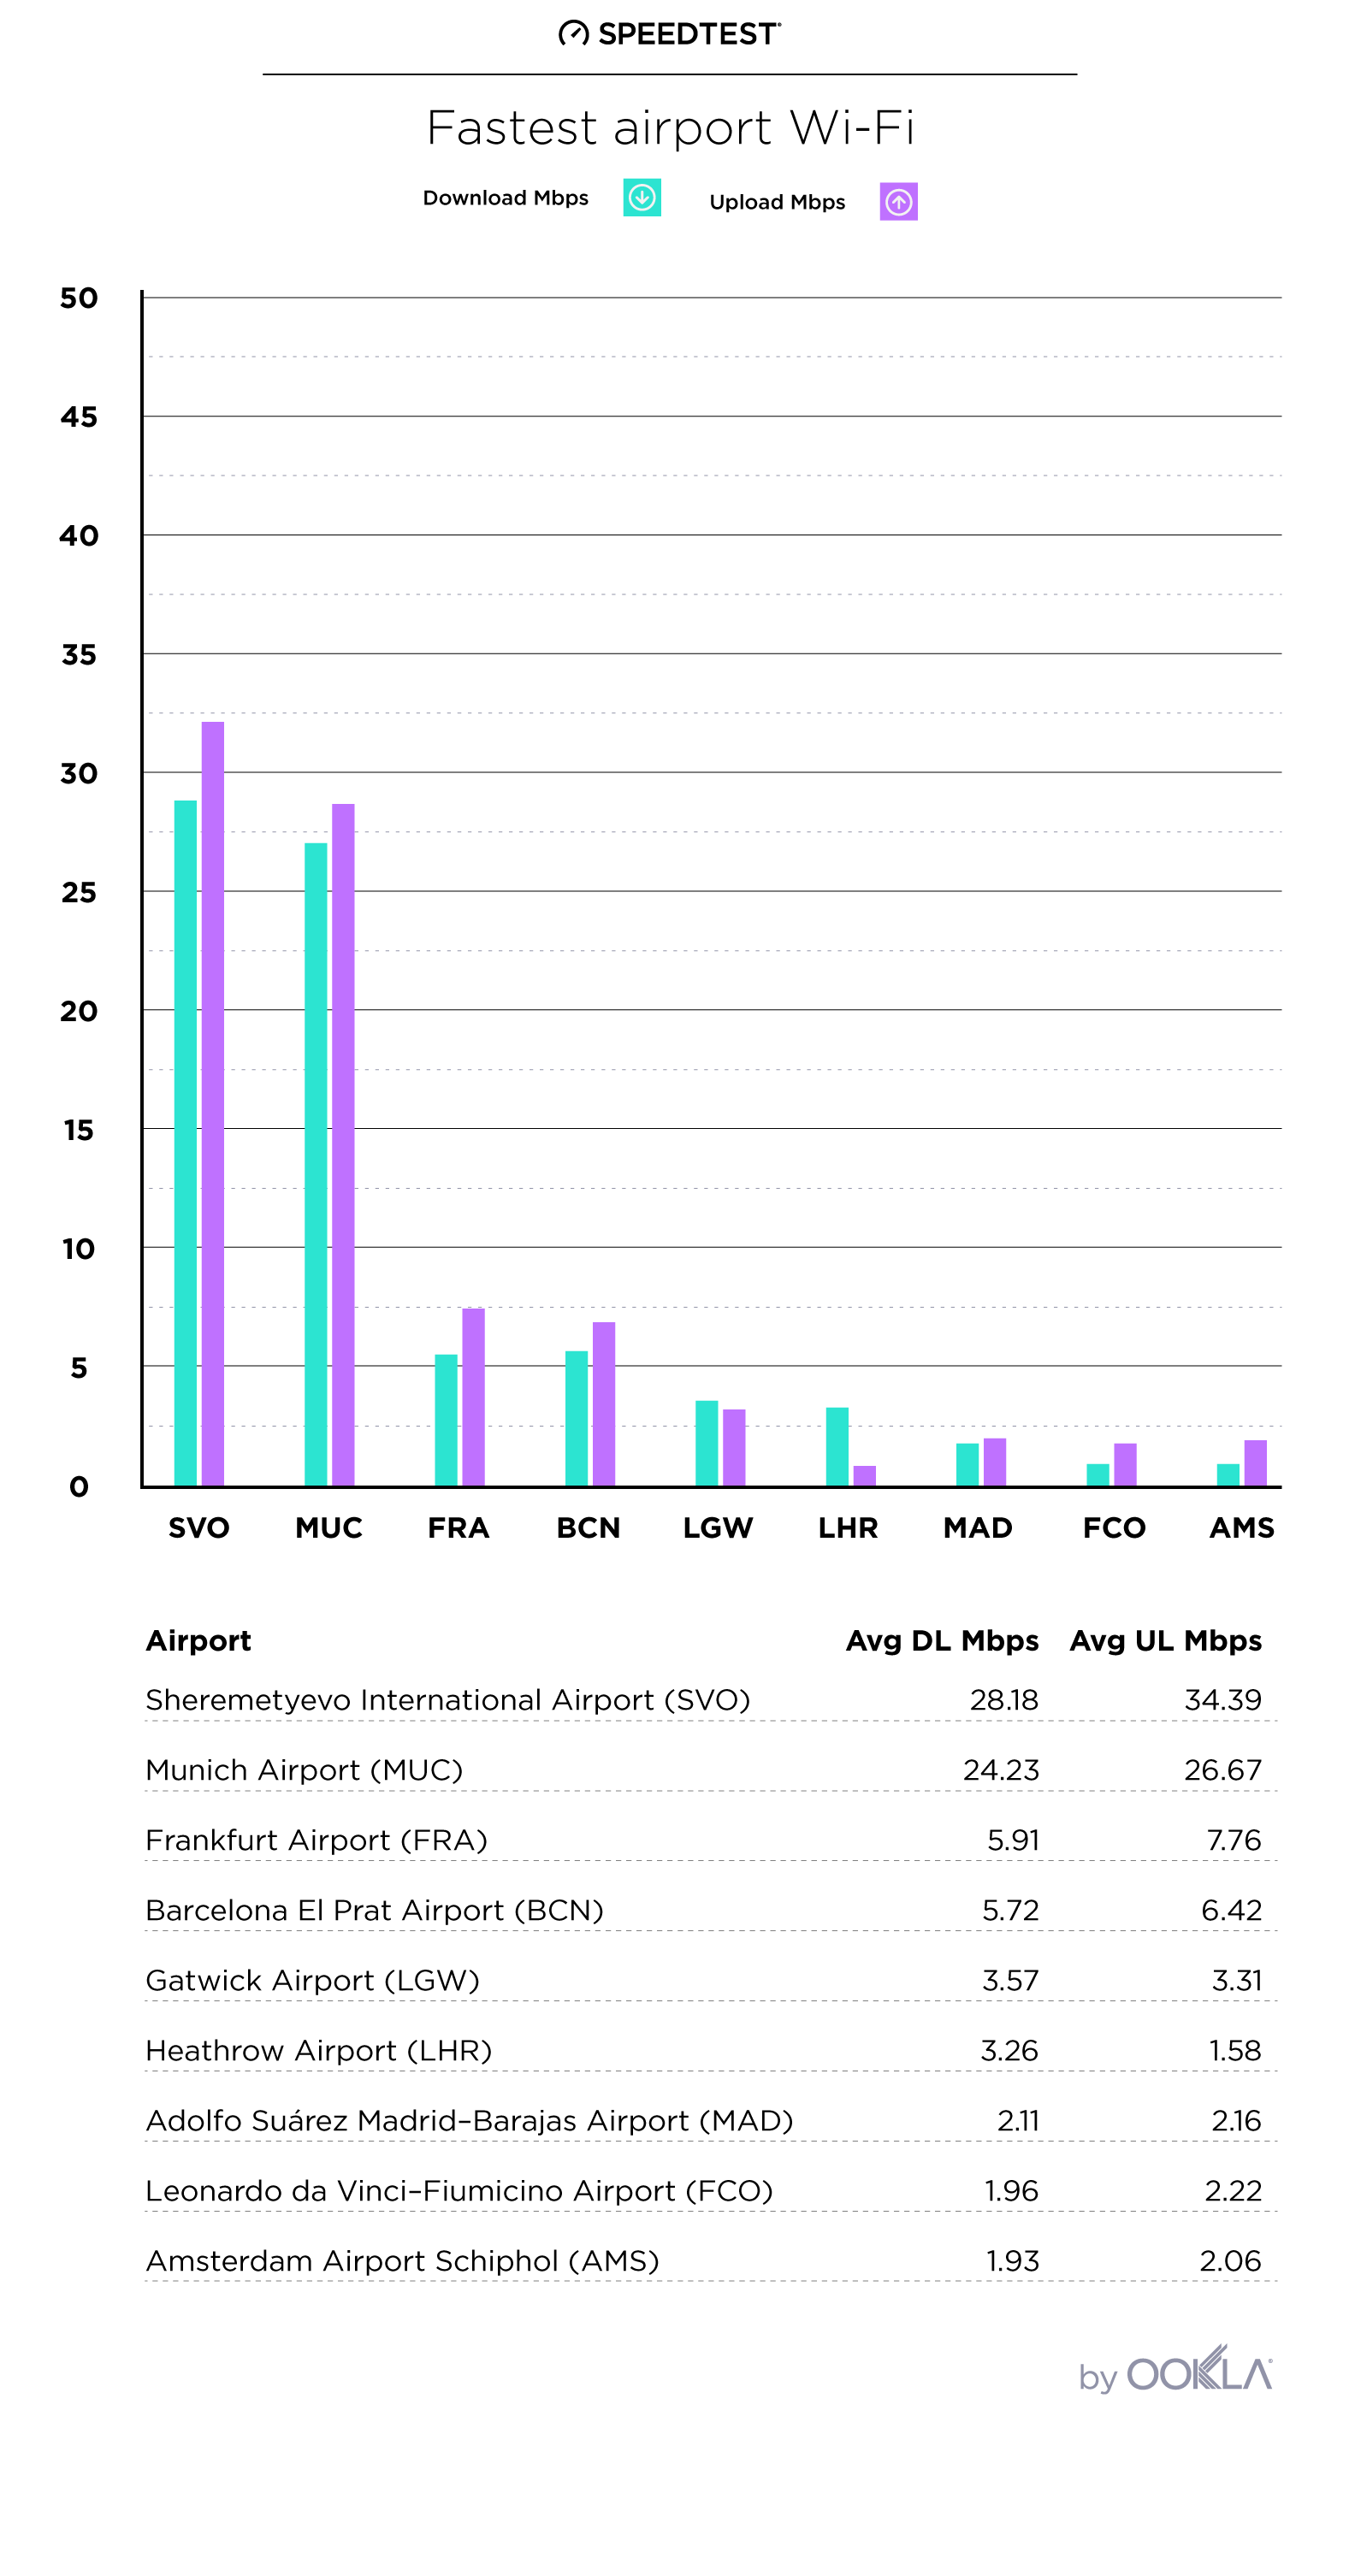
It’s a good thing many airports in Europe offer paid Wi-Fi options if you want better speeds, because speeds on the free Wi-Fi everywhere besides Moscow and Munich are slow.

Moscow’s Sheremetyevo International Airport has the fastest free Wi-Fi in Europe, about equal to the mobile Wi-Fi country average in Russia of 27.96 Mbps, although you’ll need a Russian phone number to access the airport Wi-Fi.

Germany’s second busiest airport, Munich, comes in a close second. Both airports have even faster upload speeds than download, so you can spend your layover safely stowing those vacation pics in the cloud. Munich’s Wi-Fi is 36% slower than Germany’s average download speed over mobile Wi-Fi of 37.94 Mbps.

The rest of the airports offer speeds that are much slower than the average mobile Wi-Fi speeds in their respective countries: Spain (42.72 Mbps), the UK (41.98 Mbps), Italy (21.02 Mbps), and the Netherlands (57.07 Mbps).

For comparison, Hong Kong’s International Airport offers free Wi-Fi with an average speed of 8.93 Mbps while the three largest airports in mainland China offer service ranging from 2.40 to 3.72 Mbps. Those are the slowest airports in Asia, read about the fastest.

Oddly, we saw no Speedtest results in Istanbul’s Atatürk Airport or at either of Paris’ two airports on the published free airport Wi-FI SSIDs during the time we surveyed. At both Orly and Charles de Gaulle, though, we did see networks called “*WIFI-AIRPORT”. If those are indeed the free airport Wi-Fi networks, Charles de Gaulle would rank 7th in Europe at 2.33 Mbps and Orly would rank 8th at 2.32 Mbps.

You can help us get accurate speed data for those airports by taking a Speedtest using the airport’s free Wi-Fi.

Fastest airport cell

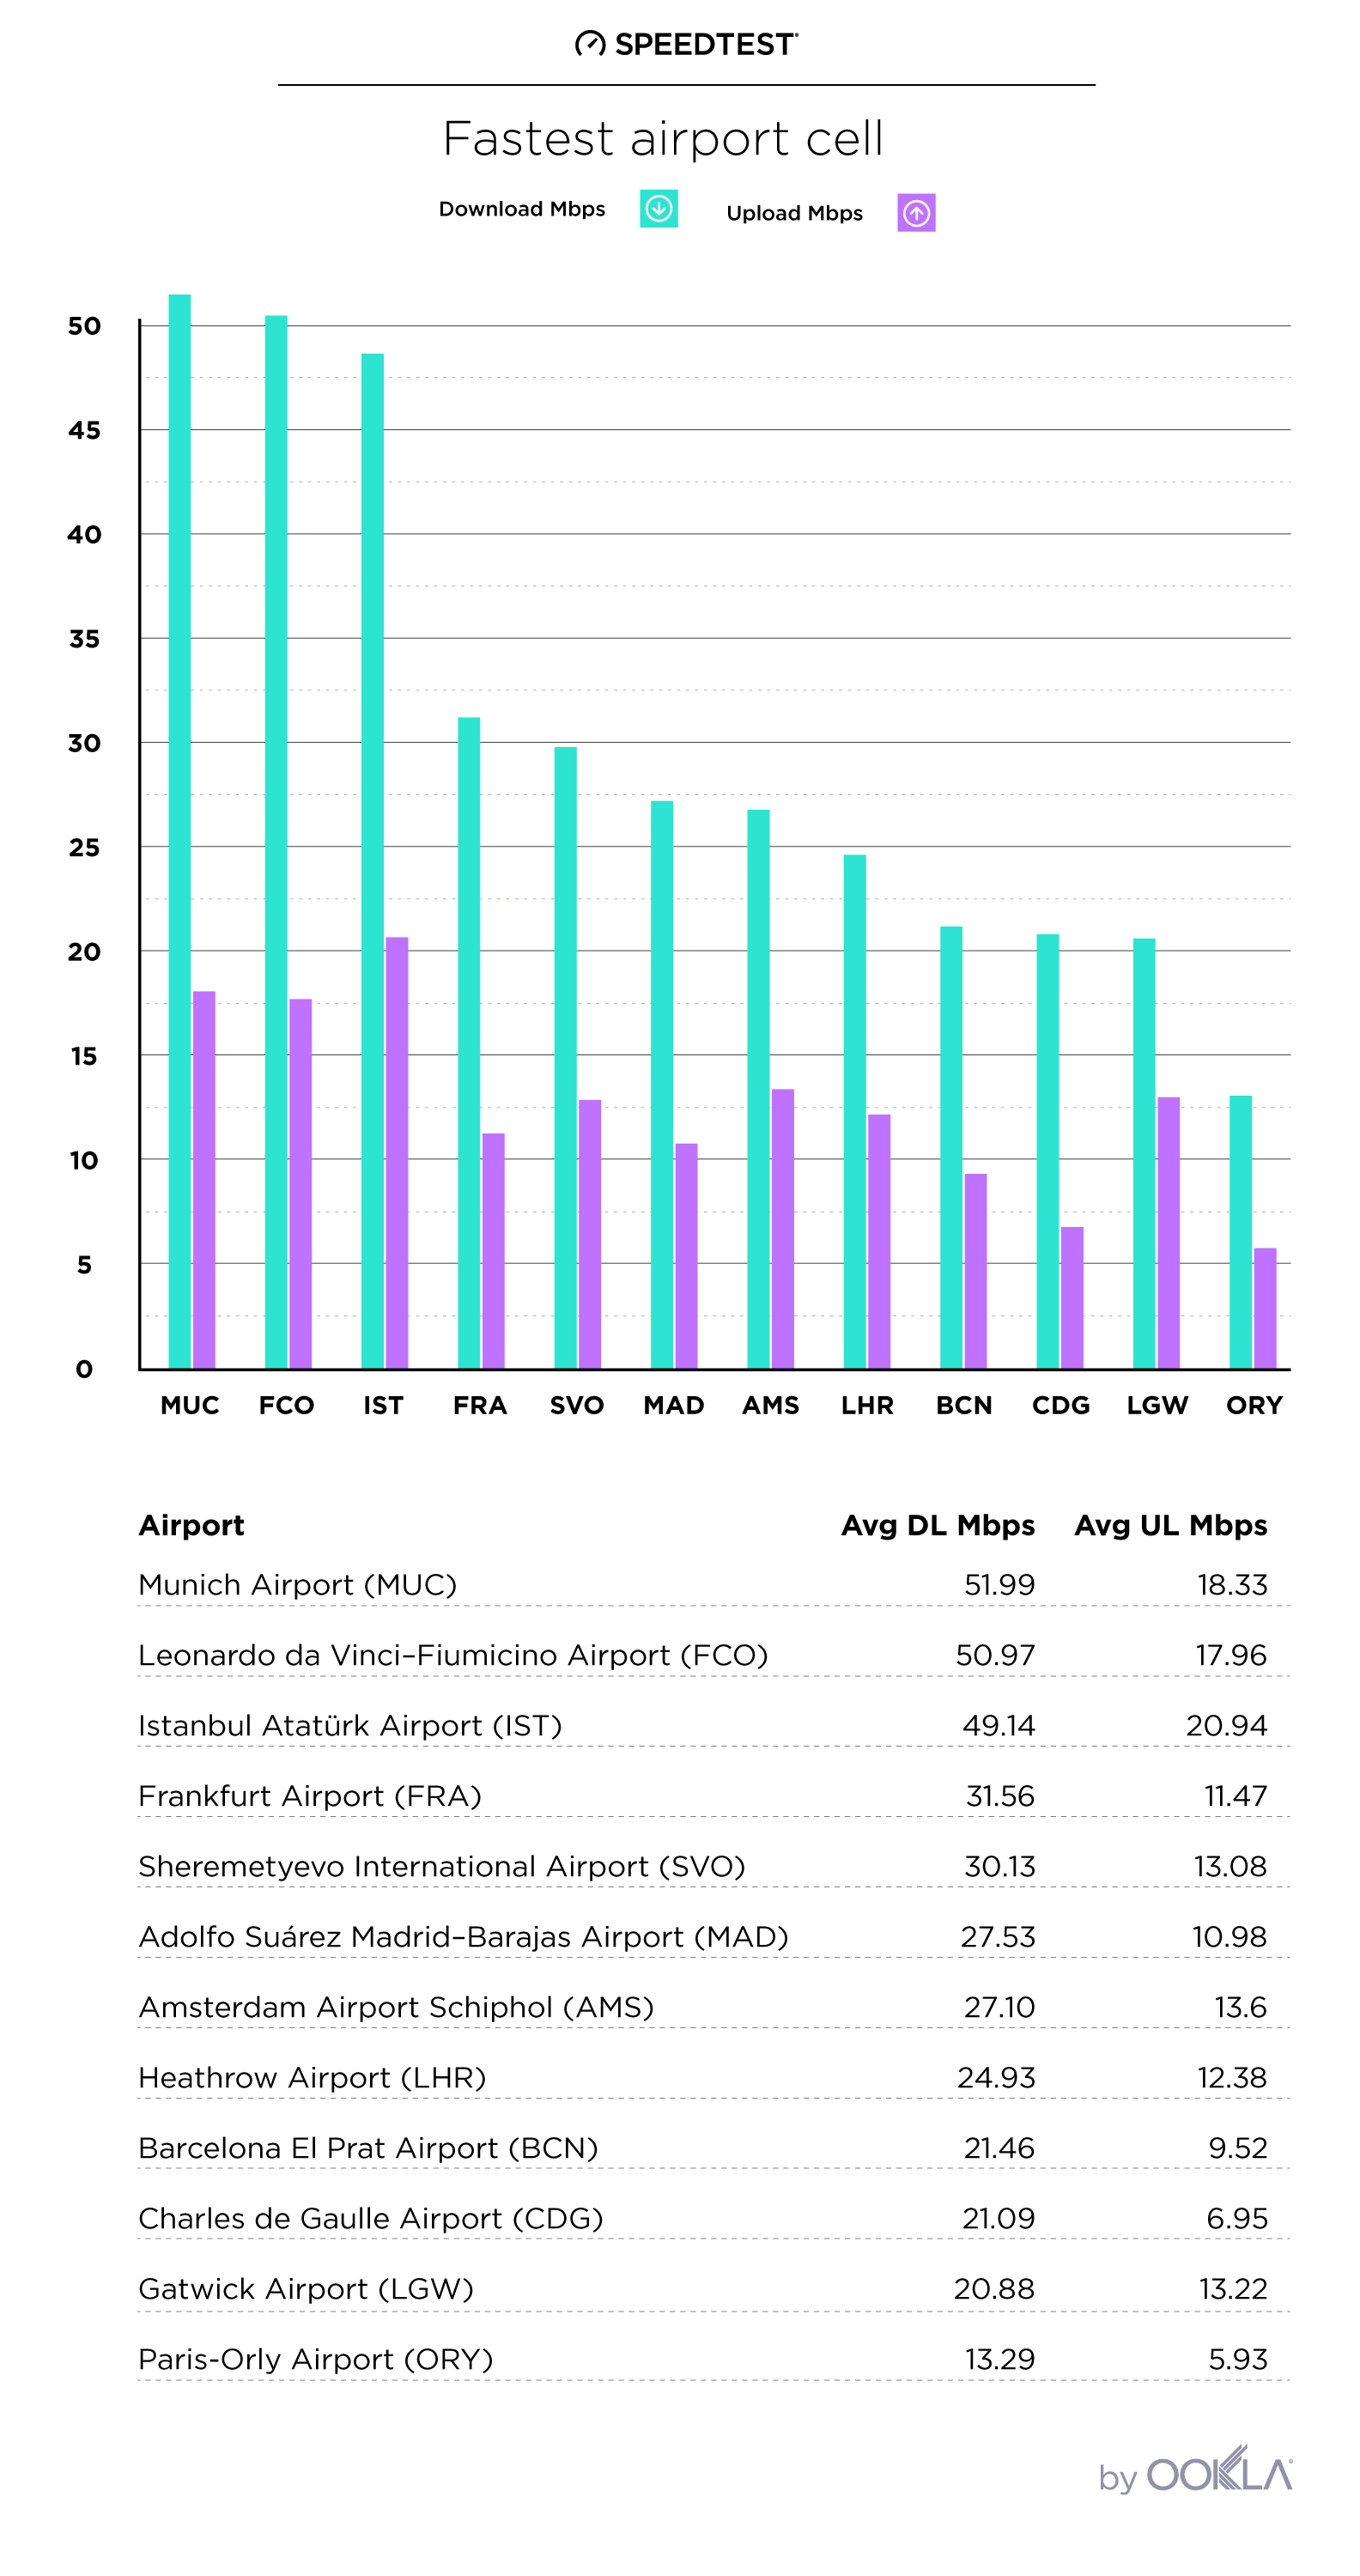
In cases where you can’t connect to Wi-Fi, you’ll be delighted to find that cellular service in these airports is much, much faster than the Wi-Fi.

Munich Airport has the fastest average download speed on cellular with Rome’s Fiumicino Airport and Istanbul’s Atatürk Airport ranking a very close second and third, respectively. And Istanbul has the fastest average upload speed on cell networks.

In many cases, cellular service at these airports is faster than average speeds in the country as a whole. The airports in Munich, Istanbul, and Moscow are all more than twice as fast as that in their respective countries of Germany (23.05 Mbps), Turkey (29.45 Mbps) and Russia (14.92 Mbps). Cell downloads at Rome’s Fiumincino Airport are 56% faster than Italy’s average of 32.52 Mbps over the same period.

The Spanish and British airports we surveyed offer download speeds that are loosely comparable to the averages in their respective countries: Spain’s average is 28.32 Mbps and the UK’s is 25.92 Mbps. Download speed at Paris’s two airports is harder to summarize with the speed at Charles de Gaulle 27% slower than the country average of 29.08 Mbps while Orly’s downloads coming in 54% slower than the country. And Amsterdam’s Schiphol download speed is only half as fast as that in the Netherlands overall (47.38 Mbps).

If you want to know more, read our full country reports on Germany, Turkey and the United Kingdom.

Wi-Fi or cell?

Given those painful Wi-Fi speeds, this is kind of a no-brainer, but we thought you might want to see just how slow the Wi-Fi is at various airports compared to the cellular service.

We omitted data about the Istanbul and Paris airports from these graphs because we can’t verify the Wi-Fi SSIDs, but you get the point: when in doubt in Europe, use cellular service rather than free airport Wi-Fi.

Regional trends

You might be surprised how similar and how different Wi-Fi and cellular service can be at two different airports in the same country or even the same city.

Heathrow vs. Gatwick

The free Wi-Fi at Heathrow and Gatwick is similarly bad but you’ll get faster downloads at Heathrow and slightly faster uploads at Gatwick.

Charles de Gaulle vs. Orly

Wi-Fi downloads at Charles de Gaulle and Orly on the *WIFI-AIRPORT are almost exactly as awfully slow as each other. But on cellular, Charles de Gaulle has significantly faster download and upload speeds.

Barcelona Airport vs. Madrid-Barajas

Barcelona Airport’s slow 5.72 Mbps download speed over Wi-Fi is more than twice as fast as the 2.11 Mbps at Madrid–Barajas Airport. When it comes to cellular, however, Madrid’s downloads are 28% faster and their uploads are 15% faster than those in Barcelona.

Frankfurt Airport vs. Munich Airport

Munich Airport’s Wi-Fi download speed is more than three times faster than Frankfurt’s and Munich’s upload speed is nearly two and a half times faster. Munich also shows an average download speed over cellular that is 67% faster than Frankfurt’s while Munich’s uploads are 59% faster.

If your experience of internet performance at European airports is different than what’s reported here, take a Speedtest on Android or iOS so we can see what you’re experiencing. We’ll be watching for big changes and reporting on them here.

Up next in our fastest airports in the world series, we’ll be looking at internet speeds at the busiest airports in Africa.

Ookla retains ownership of this article including all of the intellectual property rights, data, content graphs and analysis. This article may not be quoted, reproduced, distributed or published for any commercial purpose without prior consent. Members of the press and others using the findings in this article for non-commercial purposes are welcome to publicly share and link to report information with attribution to Ookla.

| January 24, 2018

GOOOOAL: Which World Cup Finalist Scored the Fastest Internet in their Capital City?

Whether you call it soccer or football, everyone calls the World Cup fun. We couldn’t wait for the actual match-ups in June, so we decided to pit the qualifying countries against one another to see who has the fastest internet speeds in their capital cities. The results might surprise you.

Get ready to watch Russia best Brazil and Portugal defeat Iran; meanwhile, Argentina and Nigeria and Belgium and England are preparing for penalty shoot-outs.

Using data from Speedtest Intelligence for Q3-Q4 2017, we’ve calculated which capital cities of World Cup-qualifying countries have the fastest mobile and fixed broadband speeds. We also took a peek at the fastest carriers and internet service providers (ISPs) in each capital using Speed Score, a comprehensive metric that combines measures of internet performance at all levels.

Mobile winners

Iceland’s sixth place ranking for mobile download speed in the Speedtest Global IndexTM virtually assured that Reykjavík would come out at the top of the list of fastest World Cup contenders. Canberra represents Australia well with a second place finish for mobile download speeds among World Cup capitals. And Brussels, Belgium barely surpasses Bern, Switzerland for a third place finish.

Mobile Internet Speeds
Capitals of World Cup Qualifying Countries | Q3 – Q4 2017
Country Capital City Average Download (Mbps) Average Upload (Mbps)
Iceland Reykjavík 55.49 21.53
Australia Canberra 44.24 12.60
Belgium Brussels 42.52 16.74
Switzerland Bern 42.02 17.52
South Korea Seoul 41.85 14.15
Denmark Copenhagen 41.78 18.29
Croatia Zagreb 41.16 16.40
Sweden Stockholm 40.12 12.63
Spain Madrid 38.30 14.02
Portugal Lisbon 30.60 11.39
Serbia Belgrade 30.33 12.49
France Paris 29.03 9.26
Poland Warsaw 26.94 9.84
Germany Berlin 25.83 9.51
England London 25.09 11.49
Russia Moscow 21.89 8.49
Japan Tokyo 19.89 7.10
Uruguay Montevideo 19.82 11.49
Mexico Mexico City 19.11 11.51
Peru Lima 18.33 12.90
Tunisia Tunis 18.27 8.07
Brazil Brasília 18.00 8.64
Morocco Rabat 17.32 9.76
Colombia Bogotá 16.87 9.50
Nigeria Abuja 16.17 6.76
Iran Tehran 15.05 7.04
Argentina Buenos Aires 13.77 7.70
Egypt Cairo 13.15 6.33
Panama Panama City 12.89 8.45
Saudi Arabia Riyadh 12.28 8.88
Senegal Dakar 8.85 3.81
Costa Rica San José 5.97 3.33

Looking at the group draw, Group A fares the worst with 16th place Moscow, Russia being the capital city with the fastest mobile downloads in the group. In Group B, Spain comes out on top. Australia wins Group C, Iceland takes Group D, Switzerland leads Group E and South Korea has the fastest mobile download speed in Group F. Belgium finishes first in Group G and Poland prevails in Group H, despite a 13th place finish overall.

From a regional perspective, European capitals top the rankings with all 14 European World Cup capitals sitting in the top half of the list. Latin American, Middle Eastern and African cities fare worst. Asia’s two contenders are split with Seoul boasting the fifth fastest mobile download speed among World Cup capitals and Tokyo, Japan coming in 17th.

The fastest World Cup capital in Latin America (Montevideo, Uruguay) shows a 64.3% slower mobile download speed than Reykjavík. First place among African World Cup capitals, Rabat, Morocco is 68.8% slower than Reykjavík for mobile downloads. And Tehran, Iran, the fastest World Cup capital in the Middle East, is 72.9% slower than Reykjavík.

Fastest carriers

We also looked into which carriers were fastest in each of the 32 World Cup capital cities.

With Speed Scores ranging from 8.89 in Dakar, Senegal to 46.57 in Brussels, mobile carrier Orange was fastest in four cities and tied for fastest in one. Vodafone was fastest in both Lisbon, Portugal and Madrid, Spain with comparable Speed Scores in the two locations. The rest of the cities show the diversity of fastest carriers that you might expect from a worldwide competition.

Fastest Carriers Speeds
Capitals of World Cup Qualifying Countries | Q3 – Q4 2017
Country Capital City Fastest Carrier Speed Score
Argentina Buenos Aires Personal 16.15
Australia Canberra Telstra 50.21
Belgium Brussels Orange 46.57
Brazil Brasília Claro 24.72
Colombia Bogotá Avantel 20.93
Costa Rica San José ICE 8.30
Croatia Zagreb Hrvatski Telekom 49.35
Denmark Copenhagen TDC / Telia 45.34 / 45.09
Egypt Cairo Orange 16.50
England London EE 36.83
France Paris Orange 33.15
Germany Berlin Telekom 53.54
Iceland Reykjavík Nova 64.61
Iran Tehran MTN IranCell 15.89
Japan Tokyo SoftBank 27.26
Mexico Mexico City AT&T 20.26
Morocco Rabat inwi 20.51
Nigeria Abuja MTN 29.23
Panama Panama City Cable & Wireless Panama / Movistar 14.85 / 14.80
Peru Lima Entel Peru 20.73
Poland Warsaw T-Mobile 36.07
Portugal Lisbon Vodafone 42.44
Russia Moscow MegaFon 37.06
Saudi Arabia Riyadh Zain 13.20
Senegal Dakar Orange 8.89
Serbia Belgrade Vip mobile 45.56
South Korea Seoul LG U+ 50.03
Spain Madrid Vodafone 40.17
Sweden Stockholm Telia 54.49
Switzerland Bern Sunrise / Swisscom 42.14 / 41.91
Tunisia Tunis Ooredoo / Orange 19.90 / 19.89
Uruguay Montevideo Antel 20.35

Fixed broadband winners

Given that Iceland ranks second in the world for fixed broadband download speed on the Speedtest Global Index and has the world’s highest gigabit user penetration (GUP), we’re not surprised to see Reykjavík shut out the competition by coming out on top of World Cup contenders for fixed broadband speed, too. Seoul, South Korea comes in second for fixed broadband download speed among World Cup capitals and Paris, France takes third.

Fixed Broadband Internet Speeds
Capitals of World Cup Qualifying Countries | Q3 – Q4 2017
Country Capital City Average Download (Mbps) Average Upload (Mbps)
Iceland Reykjavík 142.89 154.28
South Korea Seoul 130.75 131.96
France Paris 112.58 55.86
Sweden Stockholm 98.77 66.68
Spain Madrid 86.59 73.43
Japan Tokyo 75.88 70.46
Denmark Copenhagen 72.74 52.13
Switzerland Bern 68.82 54.44
Poland Warsaw 62.57 16.19
Portugal Lisbon 55.80 30.97
England London 52.53 16.12
Germany Berlin 46.84 9.52
Russia Moscow 45.25 42.96
Belgium Brussels 43.25 9.63
Panama Panama City 29.11 5.93
Australia Canberra 28.85 12.46
Serbia Belgrade 26.45 5.59
Croatia Zagreb 26.20 11.40
Mexico Mexico City 24.11 10.14
Uruguay Montevideo 23.02 5.82
Argentina Buenos Aires 22.03 4.26
Brazil Brasília 21.57 5.29
Saudi Arabia Riyadh 20.93 9.05
Peru Lima 18.15 3.51
Colombia Bogotá 13.43 6.48
Morocco Rabat 11.83 2.51
Iran Tehran 9.33 4.18
Costa Rica San José 8.79 4.29
Nigeria Abuja 8.07 5.27
Tunisia Tunis 7.82 4.49
Senegal Dakar 7.42 3.11
Egypt Cairo 5.61 1.92

Group A again suffers on the fixed side with leader Russia coming in 13th based on Moscow’s fixed broadband download speed. Spain’s still the front-runner of Group B. France takes Group C, Iceland wins Group D, Switzerland tops Group E, South Korea reigns over Group F, England heads up Group G and Japan starts Group H based on average download speeds over fixed broadband in their respective capitals.

European capitals again fare well, with 12 of the 14 placing in the top half of fastest World Cup capitals for fixed broadband download speed. Belgrade, Serbia and Zagreb, Croatia rank 17th and 18th, respectively. Tokyo ranks much better for fixed broadband download speed than for mobile, which puts both Asian World Cup capitals in the top six.

With the exception of Panama City, Panama, which ranks 15th, all Latin American World Cup capitals are in the bottom half of the list for download speed over fixed broadband. As are all Middle Eastern and African capital cities.

Panama City’s fixed broadband download speed is 79.6% slower than Reykjavík’s. Riyadh, Saudia Arabia boasts the title of fastest World Cup capital in the Middle East, but is still 85.4% slower for fixed broadband downloads than Reykjavík. The fastest World Cup capital in Africa — Rabat, Morocco — is 91.7% slower than Reykjavík.

Fastest providers

Comparing Speed Scores for fixed broadband across World Cup capitals, Vodafone had wins in Berlin, Germany and Lisbon and Orange took Paris and tied for first in Madrid. The rest of the fastest ISPs vary by location as listed below:

Fastest ISPs Speeds
Capitals of World Cup Qualifying Countries | Q3 – Q4 2017
Country Capital City Fastest ISP Speed Score
Argentina Buenos Aires Cablevisión Fibertel 21.72
Australia Canberra iiNet 33.23
Belgium Brussels Telenet 66.95
Brazil Brasília NET Virtua 27.30
Colombia Bogotá ETB 19.17
Costa Rica San José Cabletica 8.28
Croatia Zagreb vip 30.23
Denmark Copenhagen Fiberby 103.26
Egypt Cairo TE Data 4.84
England London Hyperoptic 117.40
France Paris Orange 107.20
Germany Berlin Vodafone 55.46
Iceland Reykjavík Nova 278.06
Iran Tehran Mobin Net 11.74
Japan Tokyo So-net 118.05
Mexico Mexico City Axtel 45.83
Morocco Rabat Maroc Telecom 9.25
Nigeria Abuja MTN 10.73
Panama Panama City Cable Onda 25.08
Peru Lima Movistar 16.64
Poland Warsaw UPC 82.72
Portugal Lisbon Vodafone 61.80
Russia Moscow MGTS 62.00
Saudi Arabia Riyadh STC 16.46
Senegal Dakar Tigo 6.42
Serbia Belgrade SBB 34.60
South Korea Seoul KT 162.45
Spain Madrid Masmovil / Orange 101.52 / 101.34
Sweden Stockholm Ownit 158.78
Switzerland Bern Fiber7 241.93
Tunisia Tunis TOPNET 7.61
Uruguay Montevideo Antel 22.01

Did your team not come out as expected? Or are you defending a tight match? Take a Speedtest on Android, iOS or on the web and we’ll check back in on scores closer to the main event.

Ookla retains ownership of this article including all of the intellectual property rights, data, content graphs and analysis. This article may not be quoted, reproduced, distributed or published for any commercial purpose without prior consent. Members of the press and others using the findings in this article for non-commercial purposes are welcome to publicly share and link to report information with attribution to Ookla.