| December 22, 2024

Ringing in the New Year - How do 5G Networks Cope Under Stress?

5G Networks Support NYE Festivities Across Major Cities

Major events present a unique challenge for mobile networks, particularly sporting events where users congregate in concentrated numbers, and where sharing of video to social media, and to friends and family is a key use case. Ringing in the New Year is another case in point – for many years network operators published statistics on the number of voice calls made, messages sent, and the amount of data traffic their networks handled. While the rise of over-the-top (OTT) communications platforms such as WhatsApp have put a damper on these press releases, there remains a sizeable impact on operators’ networks. For example, Belgian operator Proximus noted a 95% increase in mobile data traffic on New Year’s Eve in 2023 compared to 2022. The trend isn’t uniform across markets, with Australia’s Telstra consistently seeing lower data usage on New Year’s Eve, with its customers using 30% less data than average, according to a news source. What is clear is that the New Year presents network operators with the challenge of serving sufficient bandwidth to customers attending major New Year celebrations, allowing them to share the moment, but also to support the mass wishing of “Happy New Year” across a variety of channels.

We reviewed Speedtest Intelligence data for New Year’s Eve 2023/24, to analyse how 5G networks coped with the surge in demand and change in traffic patterns at New Year, across a selection of major cities featuring some of the largest New Year celebrations around the globe. We focused in on median performance alongside the 10th percentile, in order to evaluate the spread of performance from the median user to those experiencing more challenging network conditions which would impact their experience at New Year.

Worst 10% of Speedtest samples reveal network challenges

We zeroed in on 5G upload performance first. Network operators universally allocate more spectral capacity to the downlink, as most mobile use cases lean more heavily on downloading data to the end-user device. However, the usage profile at the New Year is different, with video sharing, video streaming and calling, as well as uploading content to social media, more prevalent. These are all activities that are supported by uplink from the device.

Our data shows a significant gap between upload performance for the median user, and those in the lower 10th percentile – those experiencing the worst 10% of performance samples. Half the cities in our analysis recorded 10th percentile upload performance of less than 1 Mbps, with speeds ranging from 0.30 Mbps in Berlin, to 6.09 Mbps in Dubai. These sub-par speeds make it nearly impossible to upload photos or videos.

User Experience – Assessing the Worst 10% of Performance Samples on New Year's Eve
Speedtest data, New Year's Eve 23/24, 8pm – 1am

It was a similar picture for New Year revellers based on download speeds and latency. Despite more capacity being allocated to the downlink, performance for the lowest 10% of samples tumbled significantly compared to the median experience, with cities in APAC (Bangkok, Hong Kong, Sydney and Tokyo) in particular suffering, recording 10th percentile 5G download speeds of less than 10 Mbps. Latency was more of a mixed story across cities. At one end of the scale, Tokyo recorded a variance in latency between the median and 90th percentile (the worst 10% of latency samples) of just 19 ms, while Sydney saw a much wider gap of almost 200 ms. At 200 ms of latency users are likely to experience frustratingly slow loading times, unresponsive applications, and poor video quality.

Our data also showed the degree to which New Year usage pulled down 5G performance for the worst 10% of samples. New York, and cities in Europe saw less of an impact at New Year’s Eve compared to their global counterparts. Berlin, London, New York and Paris saw 5G download speeds for 10th percentile drop by between 1.13 Mbps and 6.88 Mbps. In contrast, Bangkok, Hong Kong and Sydney saw performance drop by between 15.13 Mbps and 21.44 Mbps. Dubai and Rio de Janeiro recorded the largest variance, however with faster 5G speeds they still outpaced the remaining markets by a significant margin. Upload performance for the worst 10% of samples followed a similar trend to download, however latency performance was more varied. Berlin, Dubai, New York, Rio de Janeiro and Tokyo saw very little difference between New Year Eve latency performance and the Q4 2023 average. However, Paris, Hong Kong and London saw an increase in latency for the worst 10% off samples of between 22 ms and 36 ms, while Bangkok and Sydney fared worst, with an increase of 61 ms and 171 ms respectively.

Impact of New Year's Eve Traffic on Users With the Worst 10% of Samples
Speedtest data, Q4 2023 vs New Year's Eve 23/24, 8pm – 1am

Addressing network pain points

Addressing network pain points for users affected by poor performance in dense urban areas is a challenging task. For major events like the recent Paris Olympics, which we reported on earlier this year, network operators will typically deploy temporary network assets such as cells on wheels (CoWs) to add extra network capacity, which can then be removed once the event concludes. Network operators can also look to build private networks, to provide dedicated capacity to support the operations of the event, including routing traffic for broadcasting purposes. However, city authorities also have an important role to play here, as highlighted in our recent whitepaper with Dublin City Council and the City Telecoms Association. Having a holistic view of network performance and its evolution across a city, as well as international benchmarks, provides city authorities with the data and insights to engage more constructively with network operators and regulators, and help introduce more effective policies to deliver meaningful change for end-users. We’ll continue to benchmark and report on city and state performance, based on Speedtest Intelligence data. For more information, please contact us.

Ookla retains ownership of this article including all of the intellectual property rights, data, content graphs and analysis. This article may not be quoted, reproduced, distributed or published for any commercial purpose without prior consent. Members of the press and others using the findings in this article for non-commercial purposes are welcome to publicly share and link to report information with attribution to Ookla.

| August 28, 2024

Paris - Do Major Sporting Events Leave a Network Legacy?

With the 2024 Summer Olympics in Paris having concluded on Sunday 11th August, and the handover to Los Angeles 2028 complete, we look back at how mobile networks performed during the Games, and examine the legacy of other major sporting events. Our data shows a strong increase in upload performance across both 4G and 5G networks in Paris in time for the event. However data from past events shows that this is a common trend, and that not all major sporting events leave a network legacy, with many deployments focussed on adding temporary capacity which is then removed post-event. The African Cup of Nations in Cote D’Ivoire, which took place in January and February 2024, is one exception, with 4G-LTE performance in the capital city of Abidjan increasing in time for the event and being sustained for the six month period afterwards. With so much infrastructure investment targeted at these events, often in congested areas of large cities, operators and organizers should do more to ensure they leave a lasting impact on the network user experience.

Driving network improvements to ensure sufficient capacity for major events

Major sporting events place considerable strain on public mobile networks, necessitating careful planning to anticipate demand. In the case of the Paris Olympics, organizers deployed additional cell sites and backhaul (both permanent and temporary), and added fiber. They also deployed a dedicated private wireless 5G network. Orange, the official connectivity partner of the Paris Olympics, opened up its 5G network to existing 4G consumer and business customers across France, from June to September. In addition to allowing existing 4G users to try 5G, this also freed up capacity on Orange’s 4G network, allowing it to better support 4G roaming users. The mobile operator also implemented an innovative push-to-talk (PTT) service over 4G to allow those organizing the Games to communicate more securely and effectively. For many large events like this, the host city or nation will embark upon significant upgrades to transport links and communication networks, and organizing committees such as the IOC and FIFA are increasingly keen that the events leave a legacy for residents and future visitors.

Network performance, based on consumer-initiated Speedtest samples, showed an increase in median 5G download performance in Paris during the weeks leading up to the opening ceremony on 26th July, as well as sustained performance across the duration of the event. What’s more interesting is the trend in median 5G upload speeds, which ramped up in early July to reach a weekly high of 27.07 Mbps in the week of the opening ceremony, but declined thereafter, down to 23.30 Mbps during the final week. Since the games concluded, 5G performance has picked up again, as the crowds who attended have subsided and the demand on the network abates.

Paris, Summer Olympics 2024 – Weekly Performance Before & During the Games
Speedtest Intelligence® | May – August 2024


This stronger proportional uplift in upload performance over download highlights the desire of network operators to adequately serve the anticipated spike in demand from users to upload and stream video content. Despite this, upload performance over 5G remained approximately 1/10th that of download performance, while Orange’s private wireless 5G network, geared to serve the upload of high-definition content from the Games to the International Broadcasting Centre, was configured to have 80% of its throughput dedicated to the uplink. 4G performance followed a similar pattern, showing stable median download speeds and a ramping up of upload performance.

Assessing the network legacy of past events

While we wait to evaluate the network legacy of these Games for Parisians, we examined previous sporting events, to assess whether the network infrastructure deployed had a more permanent or transitory impact on users. We looked at network performance six months prior to, during, and six months following the events.

5G Performance – Select Major Sporting Events
Speedtest Intelligence® | 2020-2024

5G uplink performance is clearly prioritized for these major events, which makes sense given the increased demand from visitors to upload and stream live content. With the exception of Tokyo, the other three major events saw a statistically significant improvement in median 5G upload speeds. The World Cup in Qatar led the way with a 34.8% improvement, followed closely by Paris with a 29.5% increase. That said, the improvements appear only temporary, with median upload speeds falling in the six months after each event. The uplift is more muted for median 5G download performance, with an increase recorded for both the Winter Olympics in Beijing and the FIFA World Cup in Qatar, while differences in 5G download speeds at the Summer Olympics in Paris and in Tokyo were too close to call. 

4G-LTE Performance – Select Major Sporting Events
Speedtest Intelligence® | 2016 – 2024

4G performance leading up to these major events paints a similar picture to 5G, with more of a focus on improvements to uplink capacity, however there is evidence of more sustained performance post-event. While there was no statistically significant increase in 4G download performance in time for the Summer Olympics in Paris, upload performance ramped up by 9.7%. We also recorded increased upload performance for the Summer Olympics in Rio de Janeiro, the Winter Olympics in Beijing, and for the African Cup of Nations in Cote D’Ivoire. The latter two of these recorded increases in both 4G download and upload performance in time for the events, and in Abidjan this performance uplift was sustained for the six months following the event.

We’ll continue to examine network performance at major events globally. We’re keen to see how the network build advances for LA28, especially given the big focus on major transport initiatives, including “Twenty-Eight by ’28”, which is really placing infrastructure development at the heart of the games.

Ookla retains ownership of this article including all of the intellectual property rights, data, content graphs and analysis. This article may not be quoted, reproduced, distributed or published for any commercial purpose without prior consent. Members of the press and others using the findings in this article for non-commercial purposes are welcome to publicly share and link to report information with attribution to Ookla.

| July 23, 2024

Is Parisian Mobile Coverage Ready for the Gold?

All eyes are on Paris this month for the 2024 Olympic Games. Hundreds of thousands of people will converge to watch the events or compete, and every single one will want to share their experience with friends, loved ones, and the internet at large. Which can only happen if they can find mobile coverage. So we analyzed Speedtest® data from Q2 2024 to help you find the best connection near the various Olympic venues in Paris.

Paris is 5G-ready overall

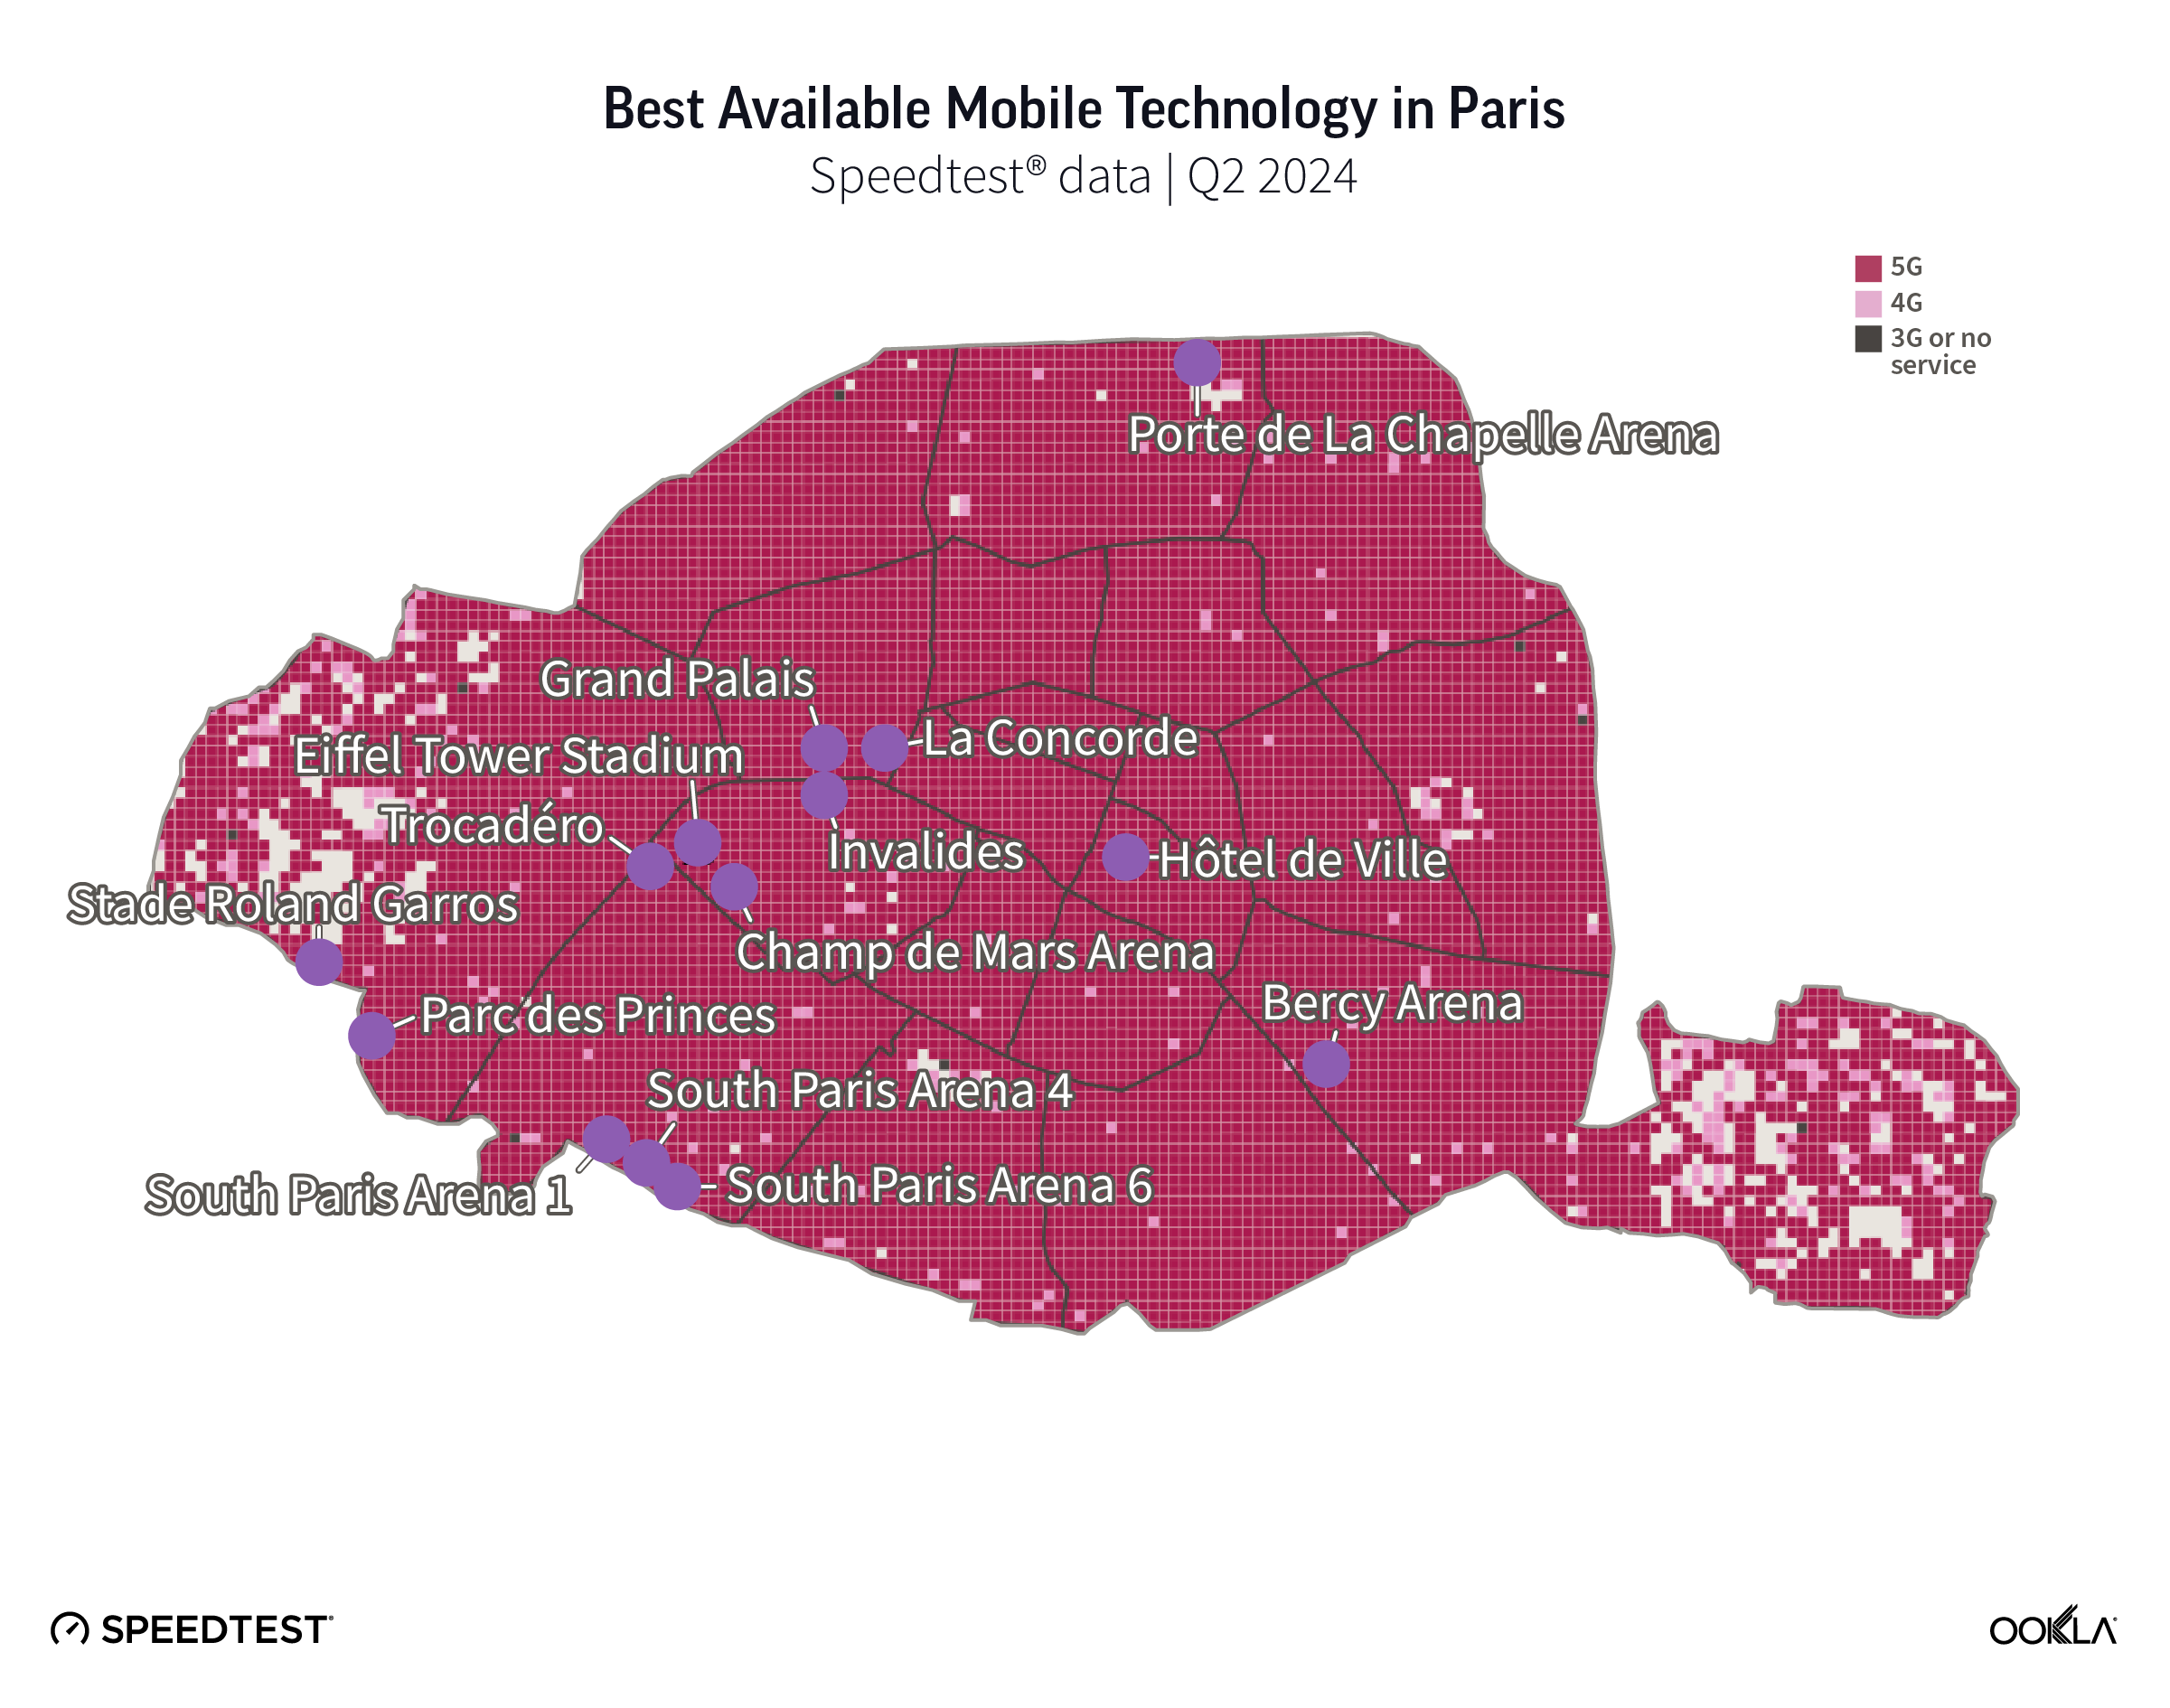
Map Best Available Mobile Technology in Paris

Our analysis of Speedtest data across Paris shows that 5G is available in almost every corner of the city. Coverage is not quite as complete in or near the cemeteries of Montparnasse or Pere Lachaise or in the parks of Bois de Boulogne or Bois de Vincennes, but for the most part you’ll have a hard time finding an area where you cannot connect at all. 5G offers better performance for mobile customers than 4G LTE, providing higher speeds and lower latency. To learn more about 5G, visit our 5G FAQ.

Each of the sections below will give you a good idea of what cellular connection type is most common in the area. For a view of the most common connection types for each mobile carrier, download the Speedtest app for Android or iOS and check the map tab. Pull up the drawer to select a carrier and whether you want to see the best connection type available or the most common. Remember that if you’re roaming, you may not get the performance you’re used to at home.

4th Arrondissement: Hôtel de Ville

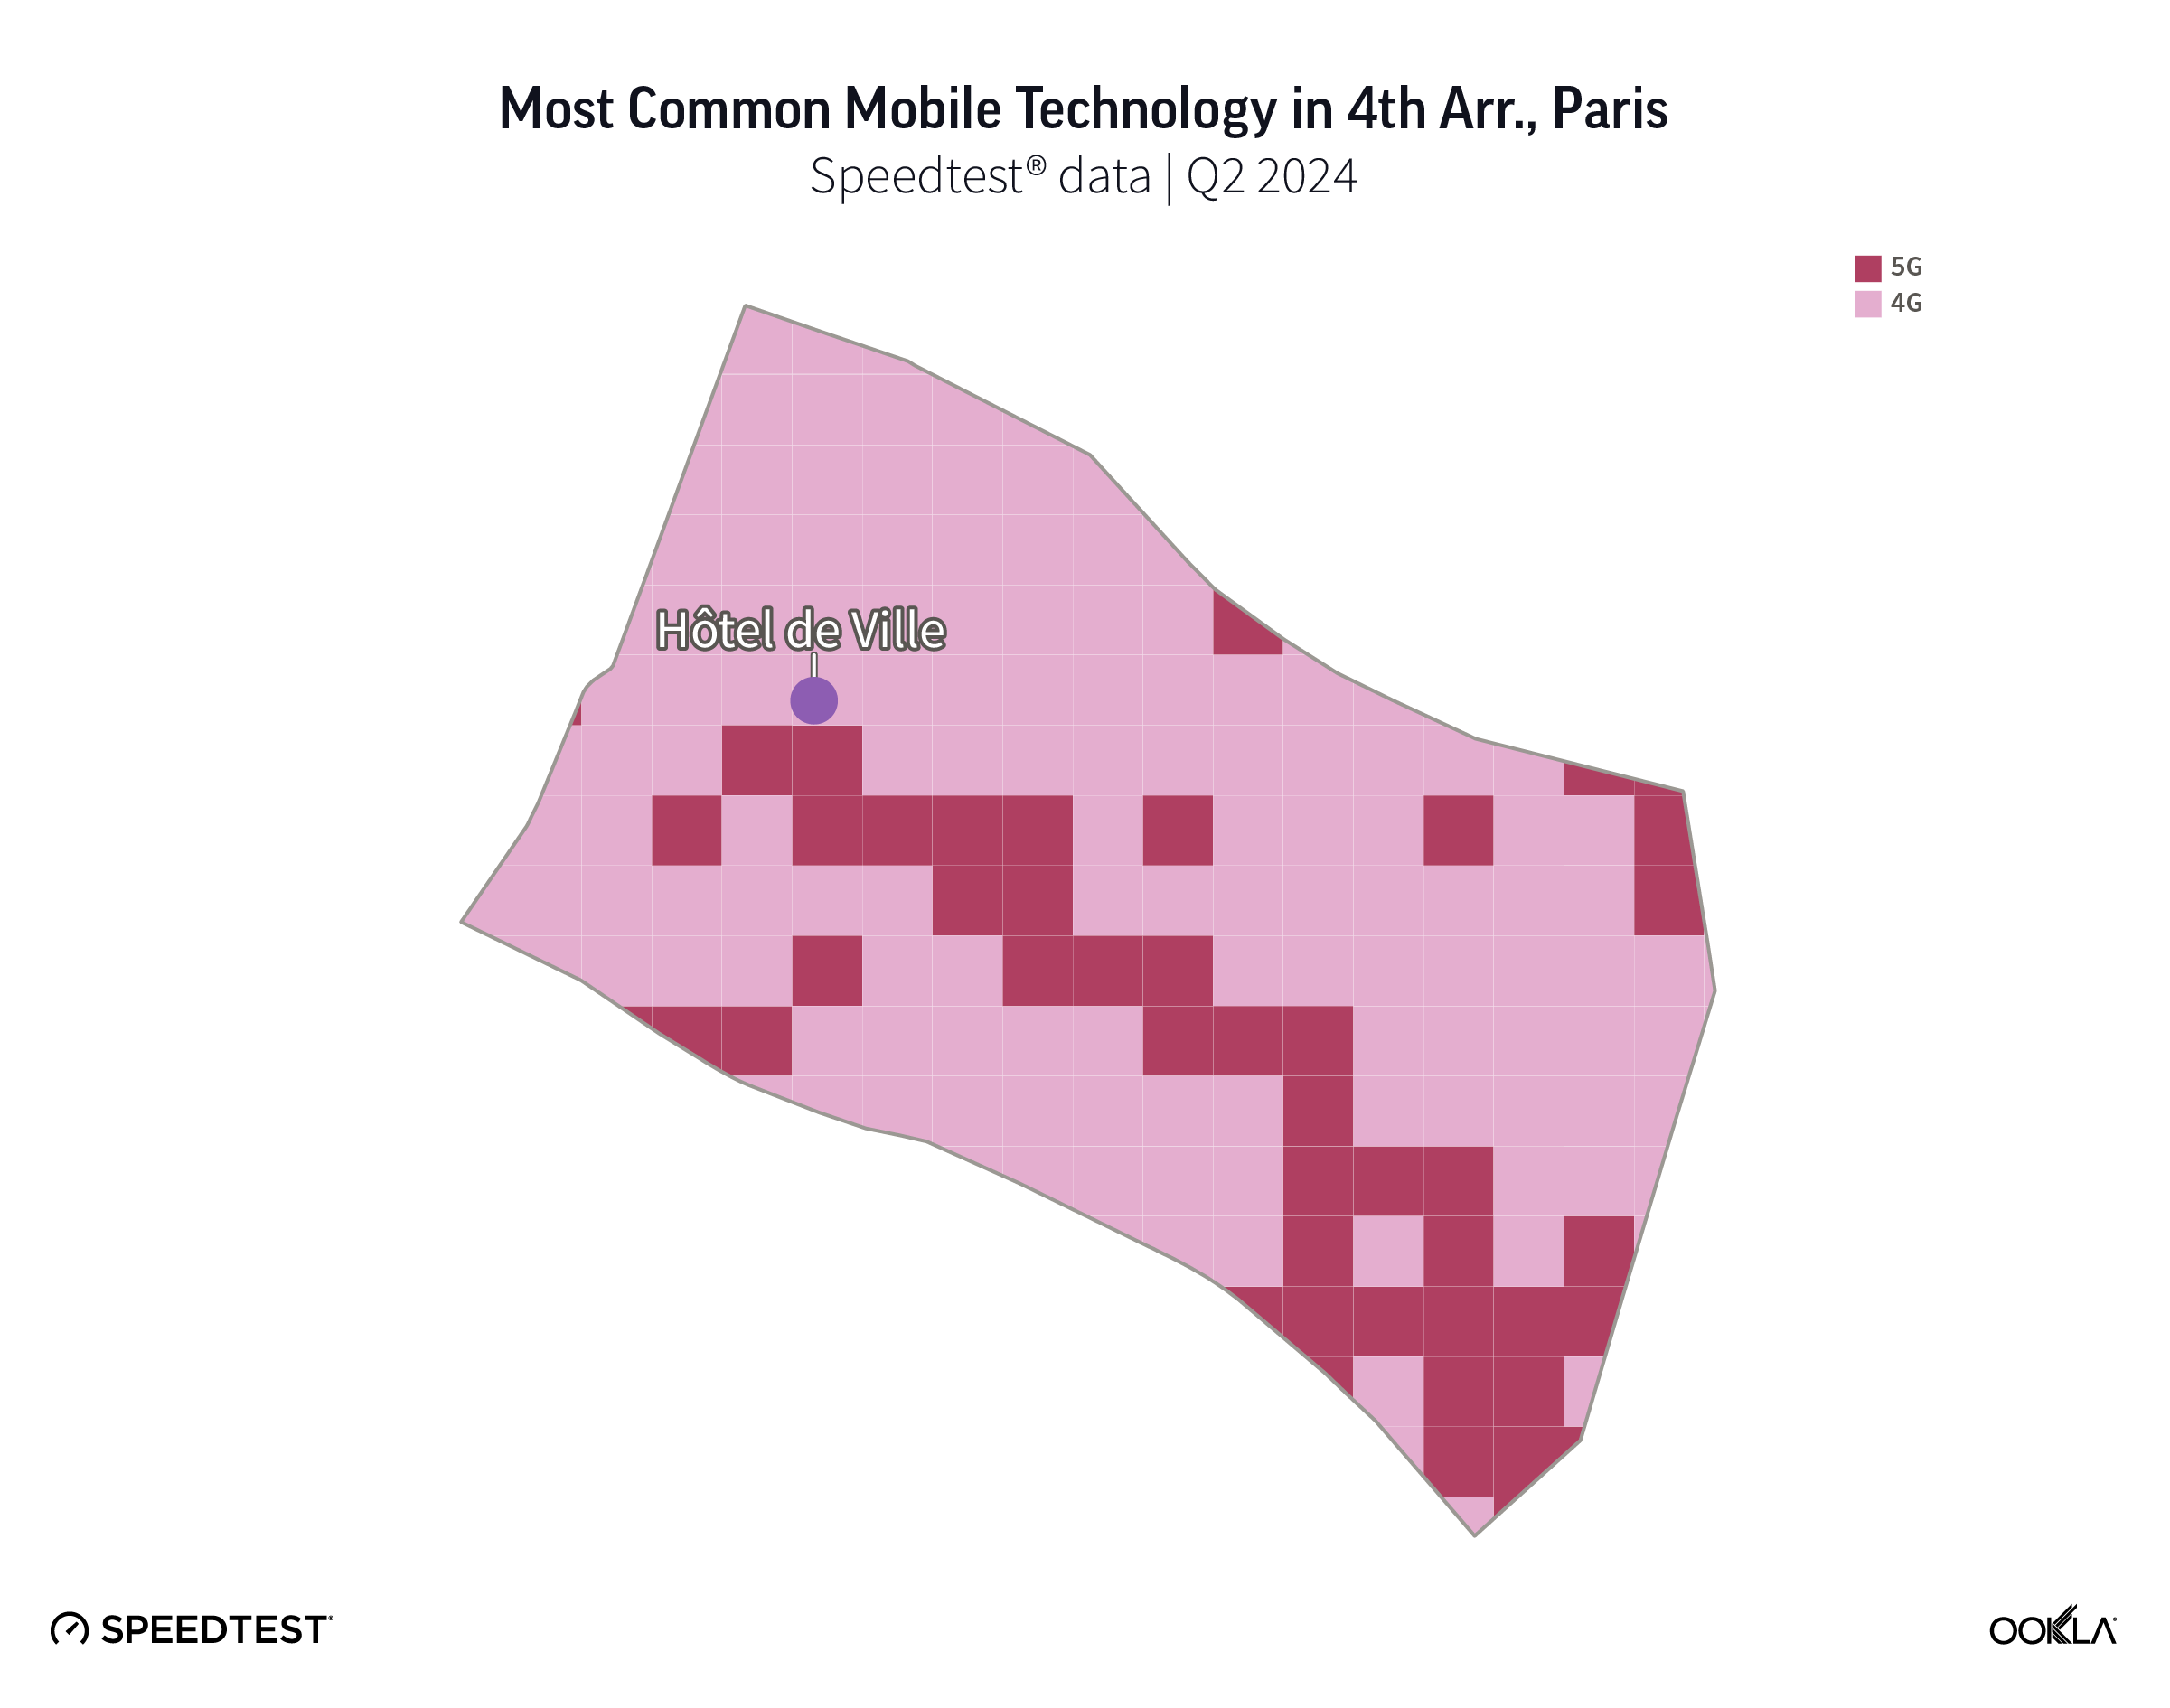
Map of Most Common Mobile Technology in 4th Arrondissement in Paris

The Olympic marathon begins at Paris’s iconic city hall. You should be in luck for 5G coverage both at the start of the race and anywhere you wander along Rue de Rivoli and into the Arsenal section of the Marais. In northern parts of the Marais, 4G is more common, though you may still be able to connect to 5G.

7th Arrondissement: Eiffel Tower Stadium, Champ de Mars Arena, Invalides

Map of Most Common Mobile Technology in 7th Arrondissement in Paris

You’ll probably visit the Eiffel Tower and nearby Champ de Mars, even if you aren’t a fan of beach volleyball, judo, or wrestling. The good news is that 5G is the most common mobile technology near both those venues. The bad news is that there are a few small areas running up the middle of the 7th arrondissement where you’ll be on 3G or you could have no service at all. If this happens, keep walking east because you’ll pass through those areas quickly and find 5G again close to Les Invalides and leading up to Pont Alexandre III.

8th Arrondissement: Grand Palais, La Concorde, Pont Alexandre III

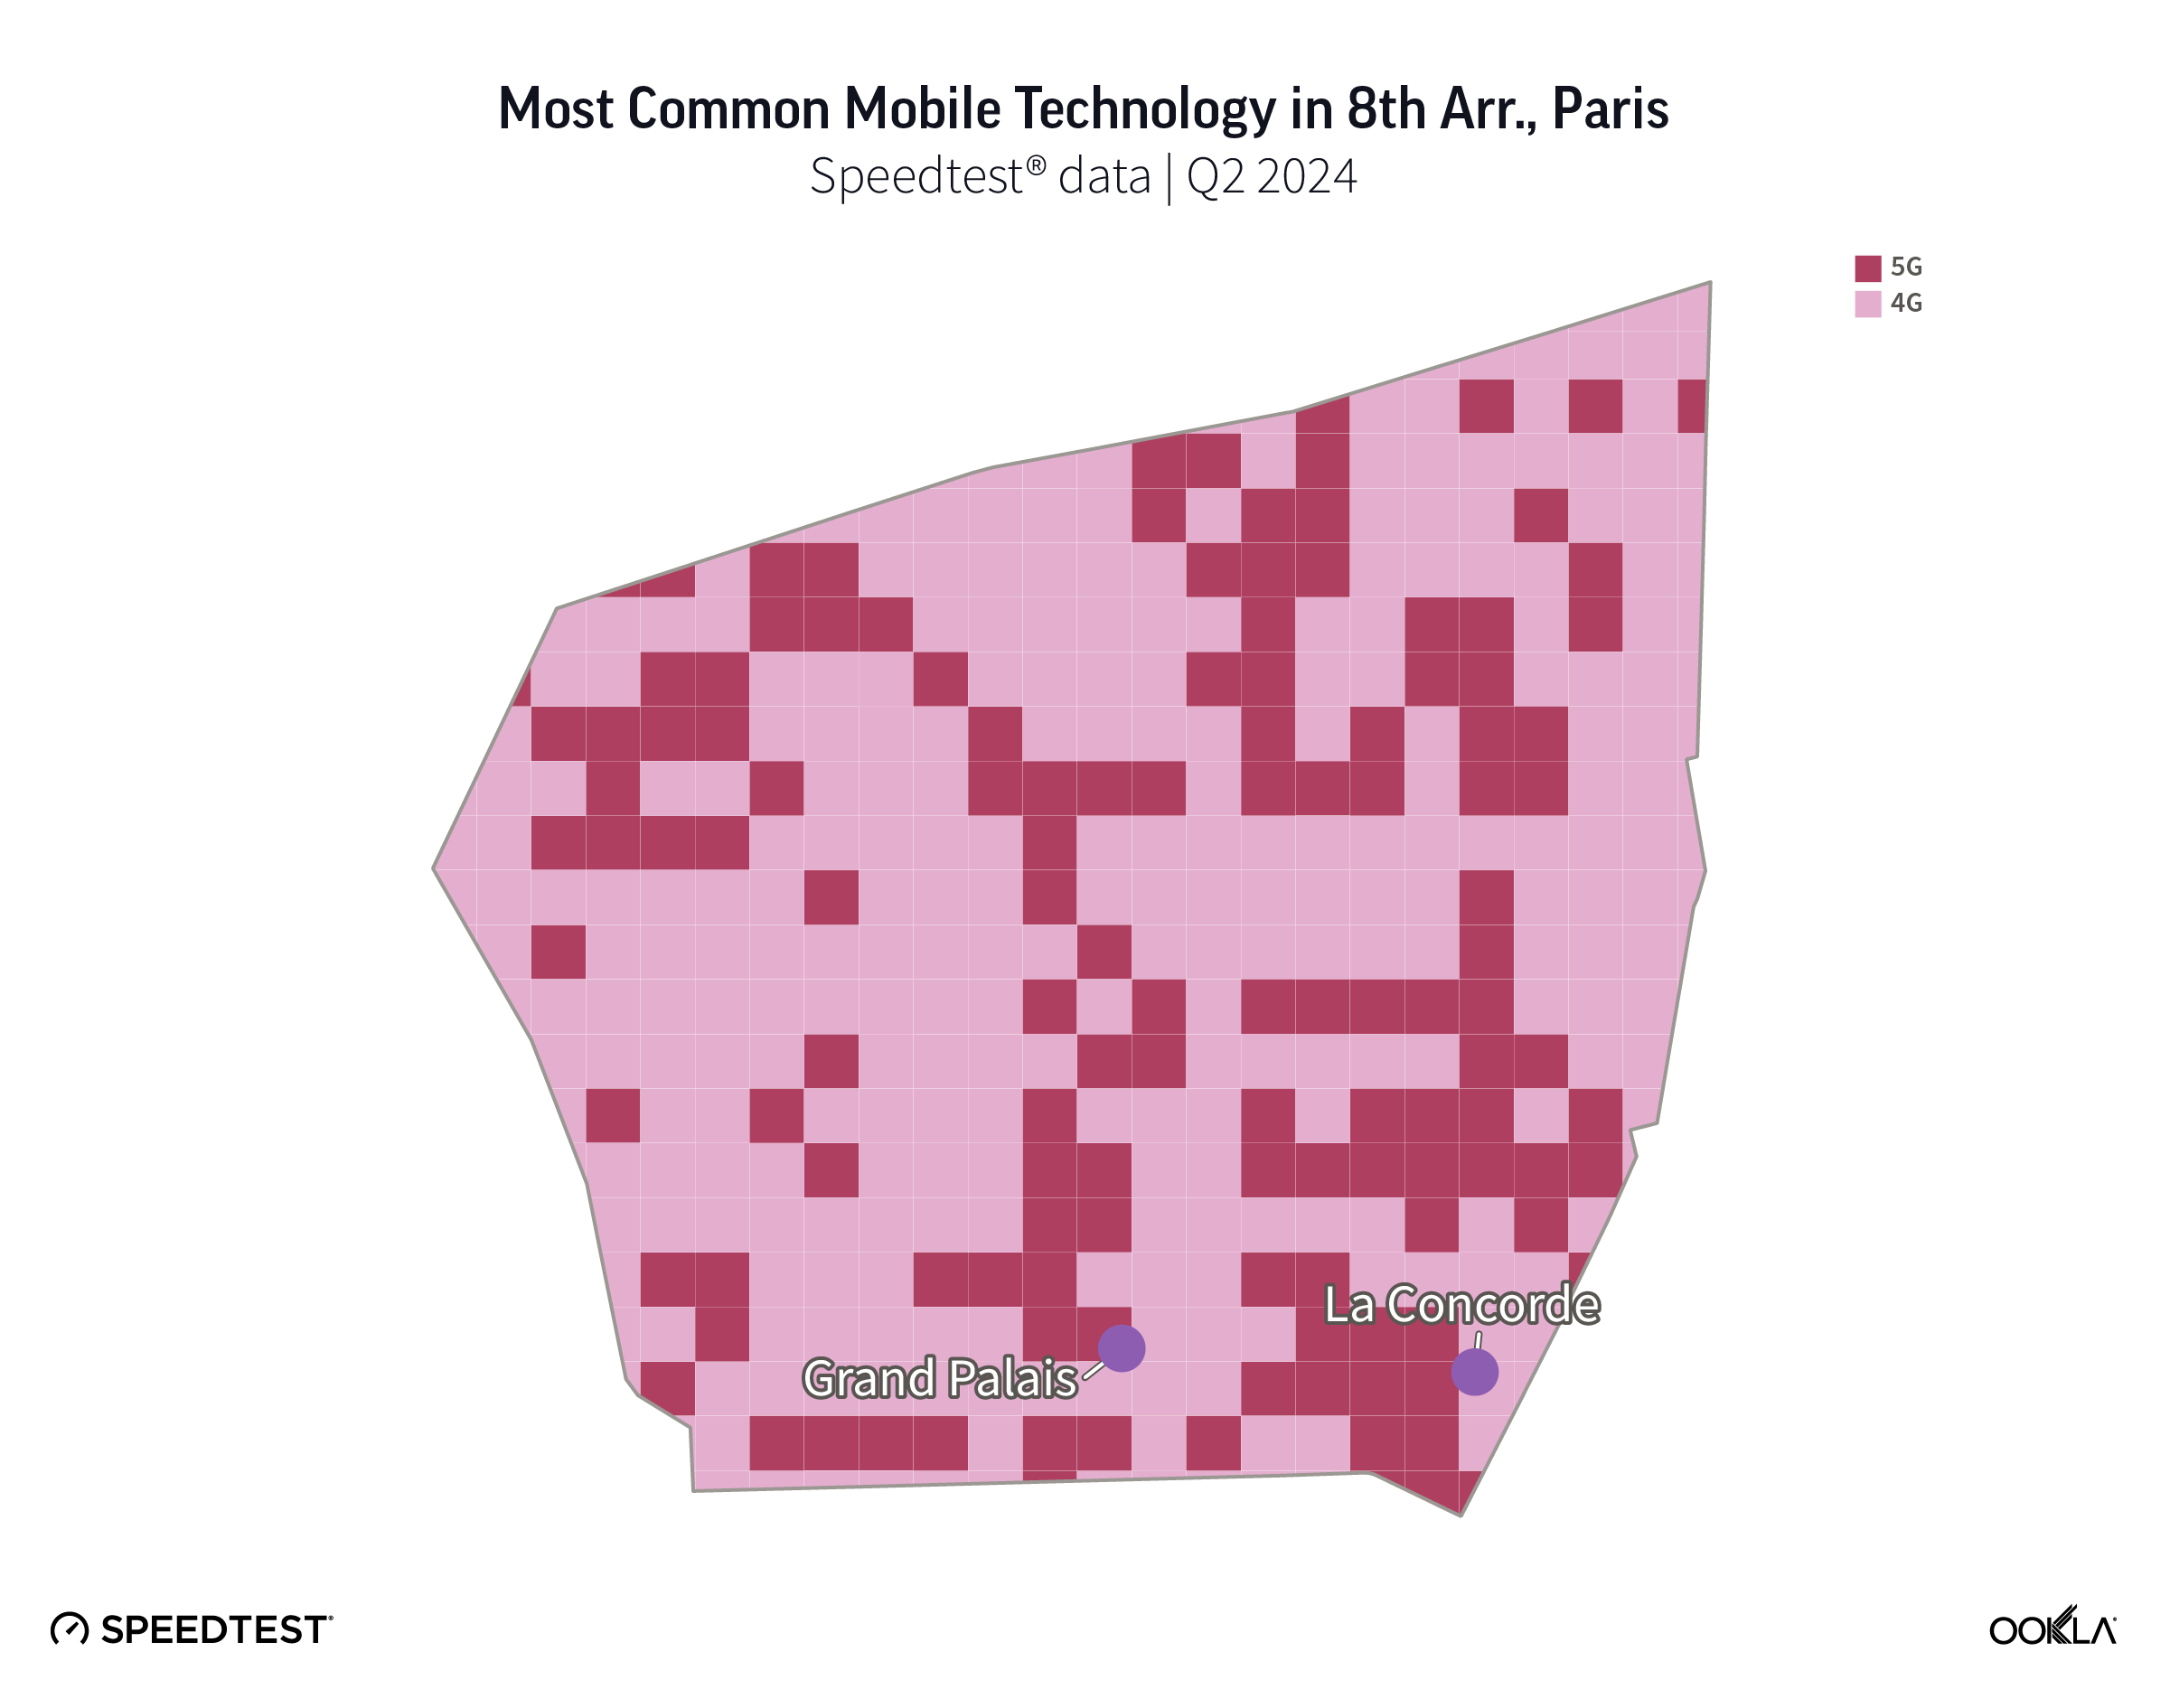
Map of Most Common Mobile Technology in 8th Arrondissement in Paris

The 8th arrondissement is home to venues featuring some of the newest Olympic sports, including breakdancing and skateboarding; it’s also teeming with 5G coverage and shows no dead zones. So whether you’re into fencing, taekwondo, cycling, or swimming, you’ll have access to 5G near all the major venues in this district.

12th Arrondissement: Bercy Arena

Map of Most Common Mobile Technology in 12th Arrondissement in Paris

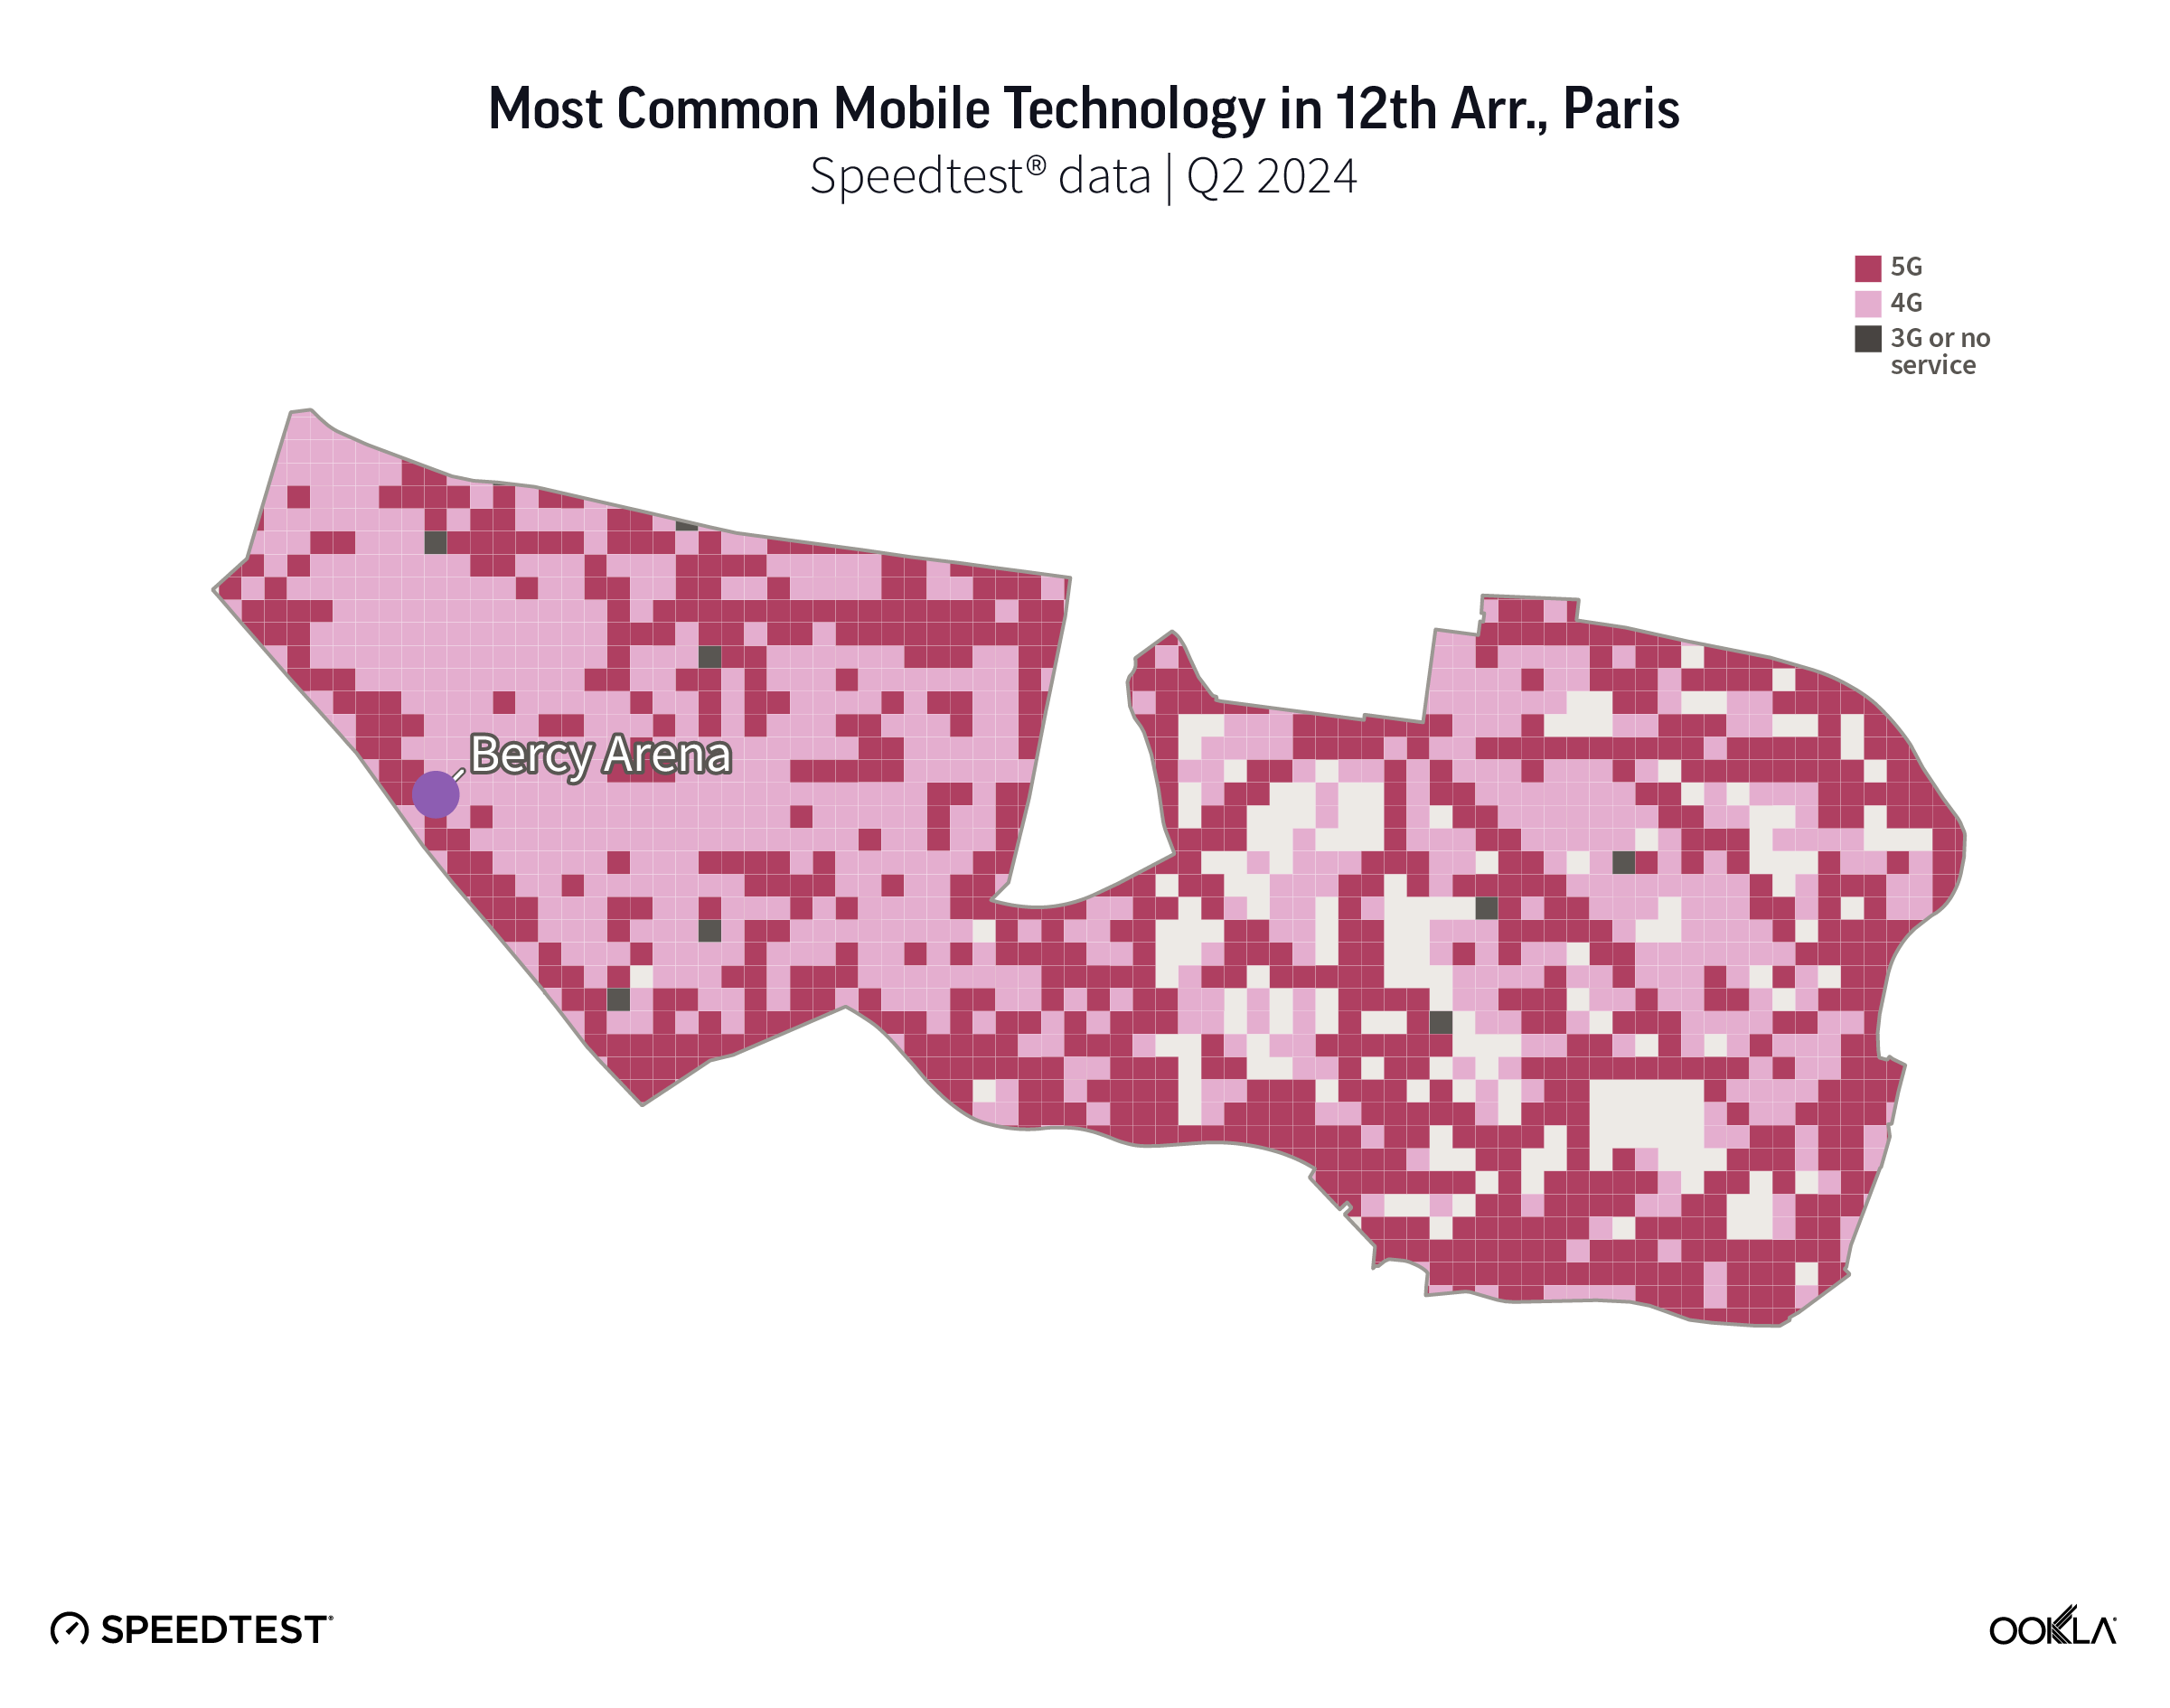
Sharing all the gymnastics highlights should be easy at Bercy Arena in the 12th arrondissement with 5G solidly covering the southwest side of the venue up and down the Seine on Quai de Bercy. LTE is more common along the northeast side of the venue and deeper into the middle of the district. There are a few anomalous spots of 3G or no service dotted throughout the 12th arr., including near the Musée des Arts Forains, Place de la Nation, and in the Bois de Vincennes.

15th Arrondissement: South Paris Arenas

Map of Most Common Mobile Technology in 15th Arrondissement in Paris

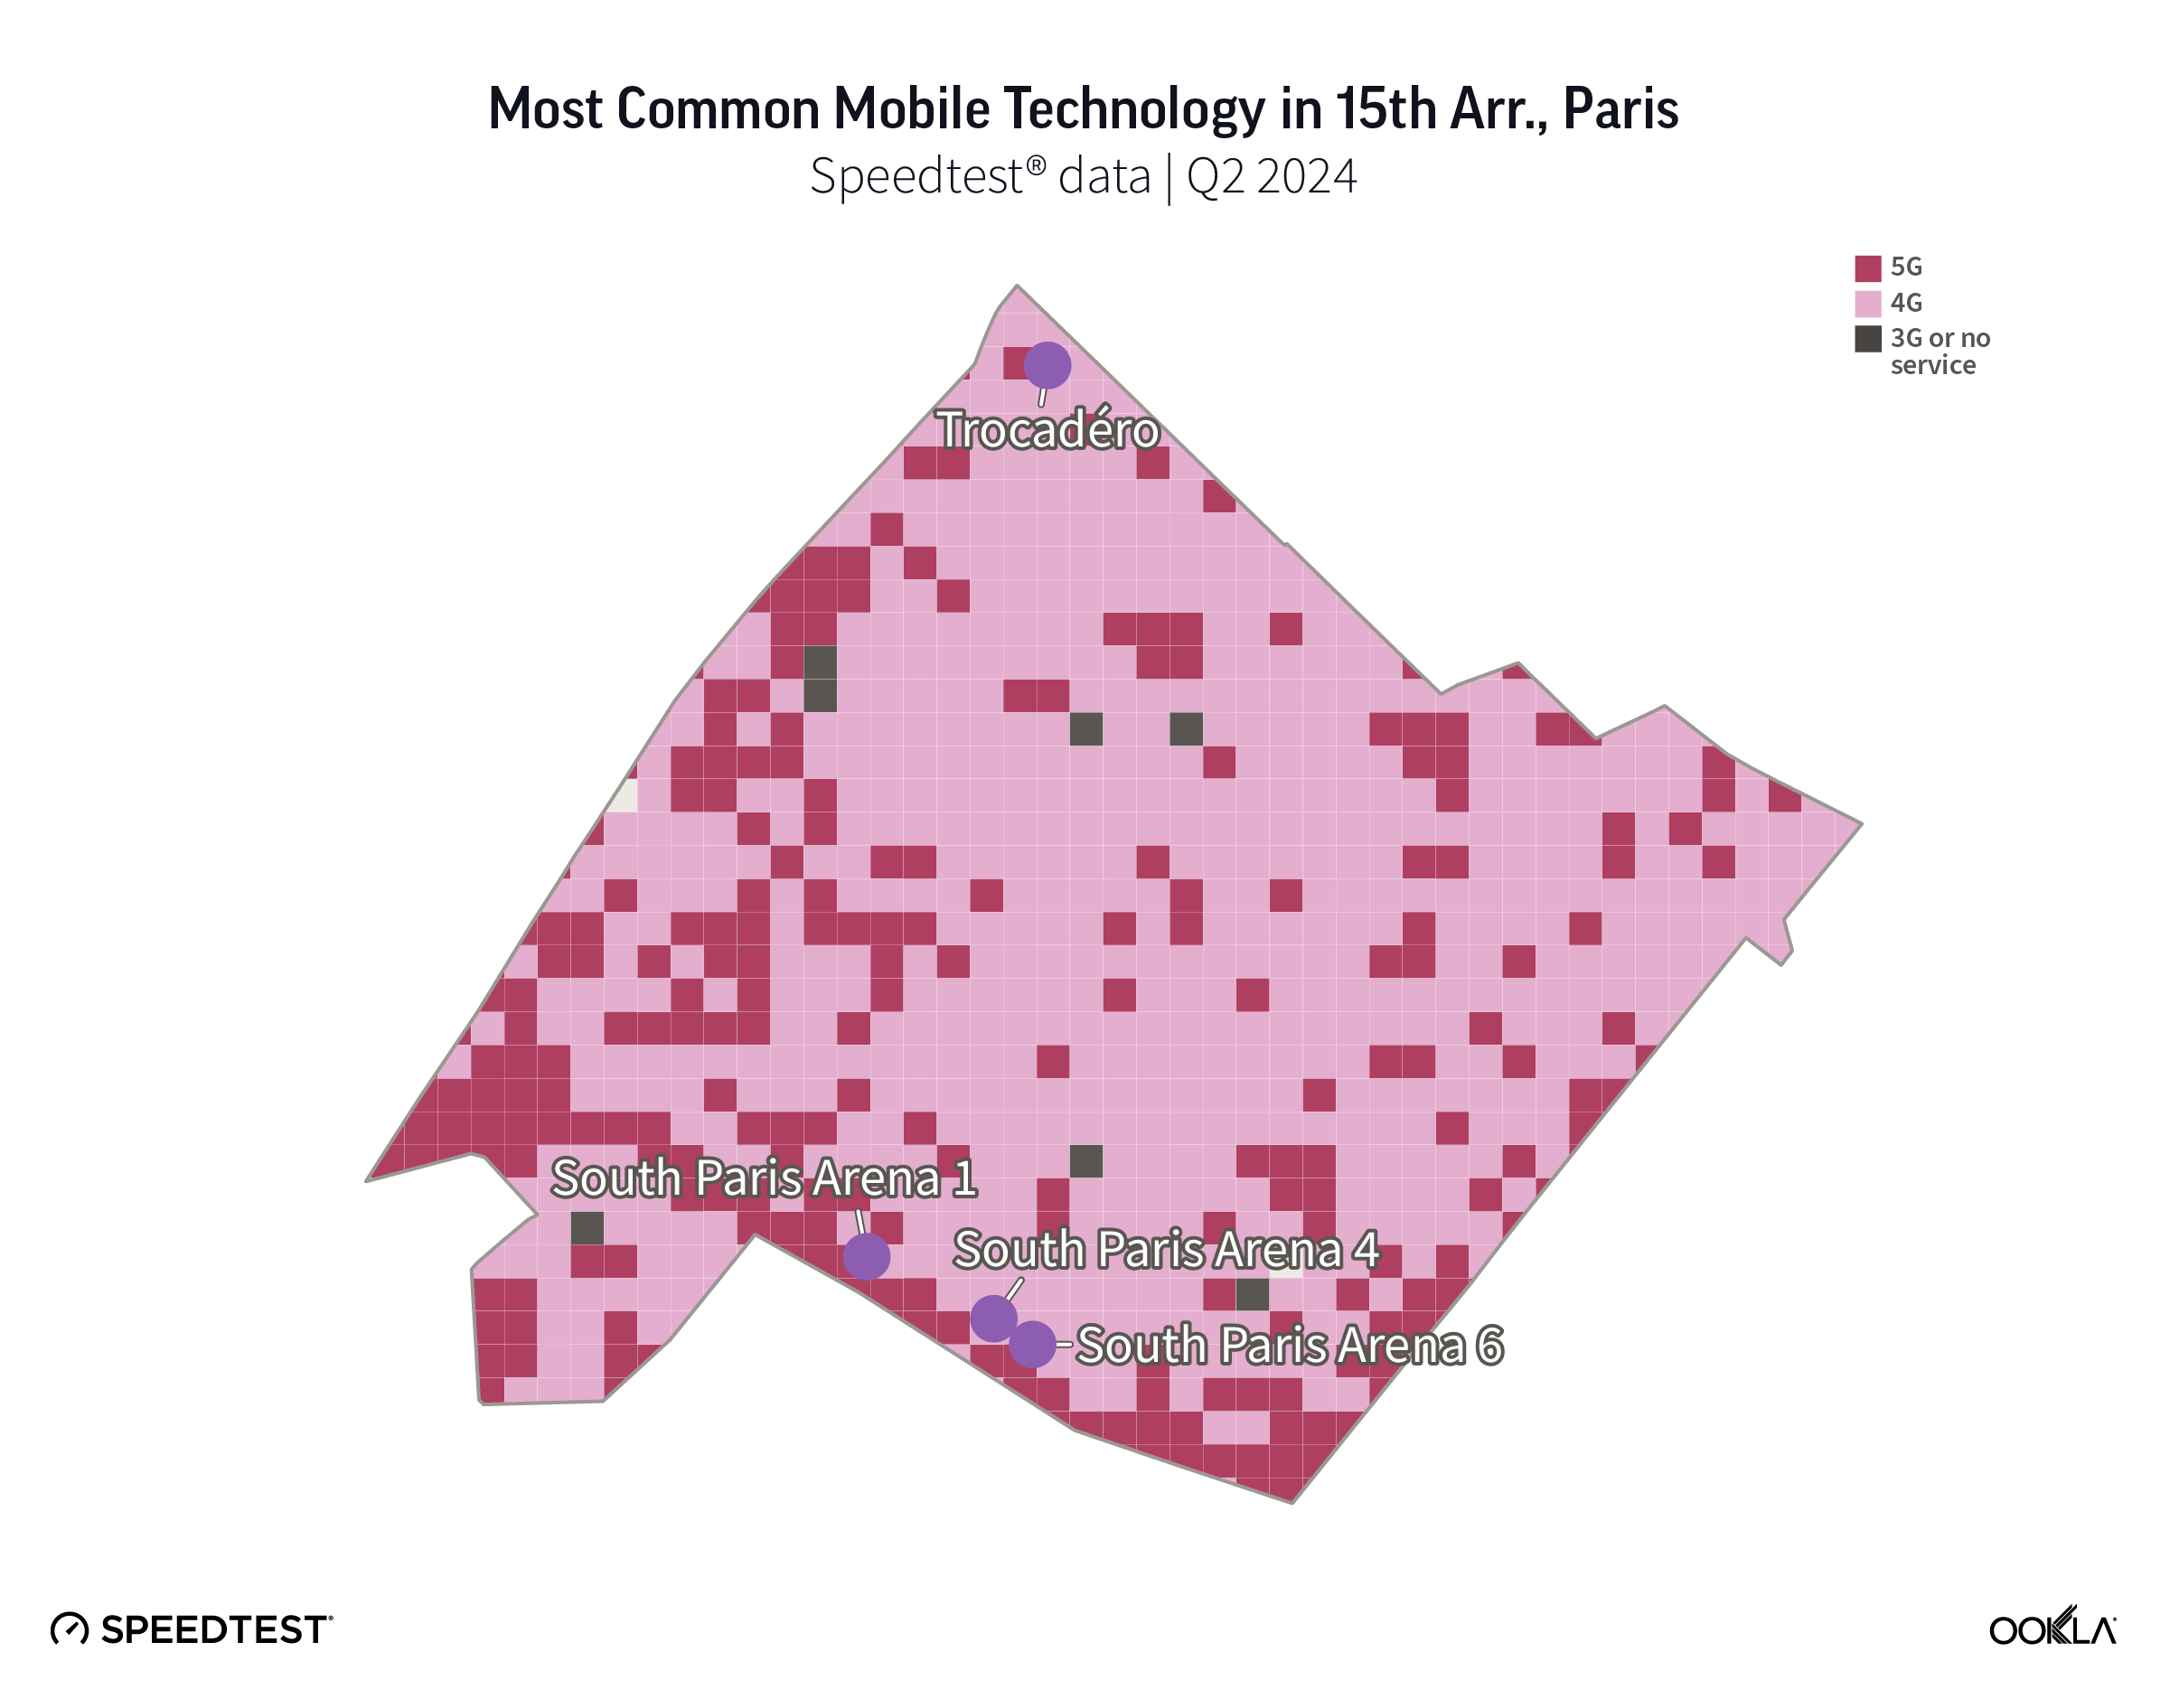
5G is most commonly found along the southwest edge of the 15th arrondissement, including near the South Paris Arena. If you’re walking south from the Eiffel Tower and the 7th arrondissement for the handball, table tennis, volleyball, or weightlifting events at South Paris Arenas, you’ll likely be bumping back and forth between 4G and 5G. There are also a few small areas of 3G or no service scattered throughout the district, so if you’re having trouble connecting, walk a few hundred meters and try again because you’ll be back on LTE.

16th Arrondissement: Trocadéro, Parc des Princes, Stade Roland-Garros

Map of Most Common Mobile Technology in 16th Arrondissement in Paris

If you’re watching football, cycling, boxing, or tennis at any of the three Olympic venues in the 16th arrondissement, you’ll likely have 5G. However, you may quickly find yourself on 4G LTE if you’re wandering the district at large. As we saw in other districts, the edge of the Seine is a reliable place to find 5G should you need a faster connection.

18th Arrondissement: Porte de la Chapelle Arena

Map of Most Common Mobile Technology in 18th Arrondissement in Paris

Fans of badminton and rhythmic gymnastics will find the area around Porte de la Chapelle Arena in the 18th arrondissement to be well covered with 5G. In general, the northern part of this district has more 5G coverage, but there are a few areas of 3G or no service scattered throughout the southern half of the 18th arr.

To see what mobile coverage you can expect at Olympic venues outside of Paris or for a personalized view of mobile coverage by operator, download the free Speedtest app for Android or iOS and check the map tab. Be aware that massive crowds can weigh heavily on a network, so if you are having trouble connecting, check Downdetector® to see if there’s an outage or if a particular service is down.

Ookla retains ownership of this article including all of the intellectual property rights, data, content graphs and analysis. This article may not be quoted, reproduced, distributed or published for any commercial purpose without prior consent. Members of the press and others using the findings in this article for non-commercial purposes are welcome to publicly share and link to report information with attribution to Ookla.

| June 24, 2024

How Much Faster is 5G Anyway? An Analysis of Page Load Speed

There’s nothing quite like picking up your phone for a little “me” time only to open up that first web page… and wait for it to load. Maybe the images aren’t there yet or the content jumps around while the ads load — it’s the worst. 5G is meant to help, so we dug into Speedtest® quality of experience data to see if this newer technology is living up to its promise. Read on for an analysis of page load speed (how many milliseconds it takes for a page to load) on three popular services in nine major countries around the world during Q1 2024.

Click the country below to go directly to that section or read on for the full article:

Brazil | Canada | France | India 

Mexico | Nigeria 

South Africa | Spain | United States

Page speed relies on low latency for the best internet experience

Page load speed is a critical measure of your web browsing experience. It measures how long it takes for a page to load, fully displaying the content on that page. This is directly impacted by latency, which is how quickly your device gets a response after you’ve sent out a request. A typical request on the internet requires two to five round trip communications between various entities over different latency sensitive protocols.

One of the promises of 5G is lower latency, which should lead to a faster (lower) page load speed on any page. The Speedtest Global IndexTM reported the global average for mobile latency as 27 milliseconds (0.027 seconds) with fixed broadband at 9 ms (0.009 s) in May 2024. As seen in the video below, it can take 7x longer to load a full webpage when latency is high, and “40% of users will abandon a site if it takes more than 3 seconds to load,” according to one source. Read more about the importance of latency to quality of experience.

5G lived up to the latency promise, showing a faster page load speed than 4G on all services in all countries we surveyed. However, the improvement was not the same in all places, with Canada topping the list of fastest page load speed over 5G on all the services we surveyed while South Africa had the slowest 5G page load speed on Google and YouTube of countries reviewed here. Read on for details.

5G loads 20-30% faster than 4G in Brazil

Chart of 5G vs. 4G Page Load Speed in Brazil

Speedtest data shows that 5G delivered a much lower page load speed than 4G on all three services in Brazil during Q1 2024. Google loaded 20% faster on 5G than 4G, YouTube was 25% faster, and Facebook was 30% faster on 5G.

Canada’s 5G page load speed among the fastest on all 3 services

Chart of 5G vs. 4G Page Load Speed in Canada

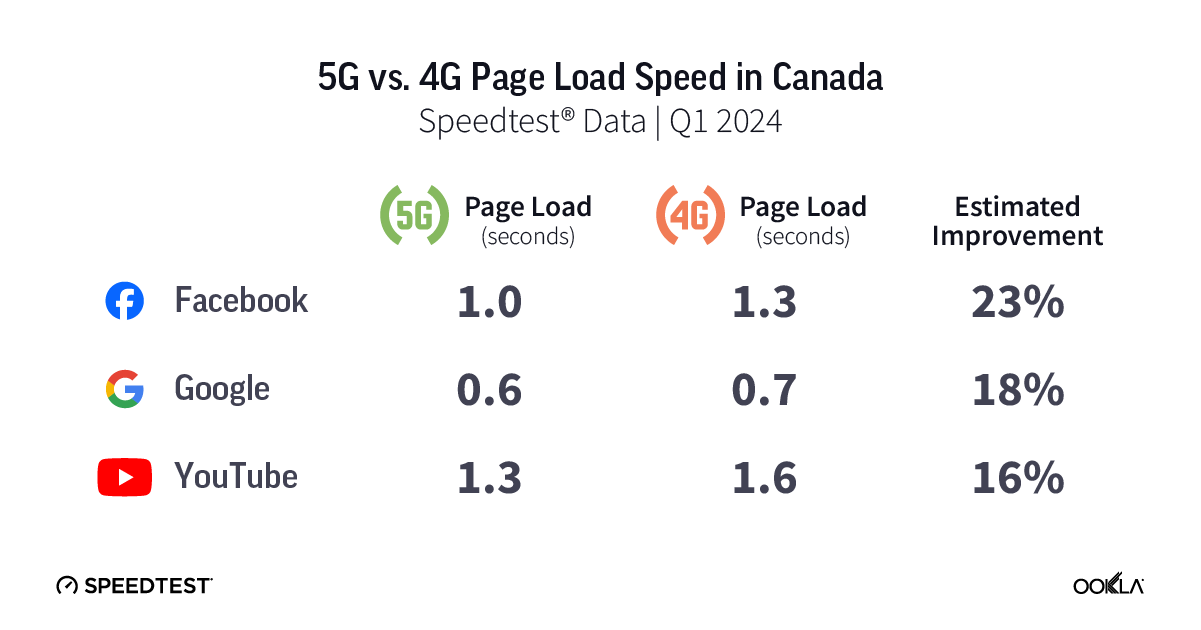
As mentioned, Canada’s 5G page load speed was the fastest or among the fastest for all countries analyzed in this article, with Canada having the fastest page load speed on Facebook, Google, and YouTube. Our analysis demonstrated that 5G delivered a decently faster page load speed than 4G on all three services in Canada during Q1 2024. YouTube loaded 16% faster on 5G than 4G, Google was 18% faster, and Facebook was 23% faster on 5G.

French 5G loads 14-20% faster than 4G

Chart of 5G vs. 4G Page Load Speed in France

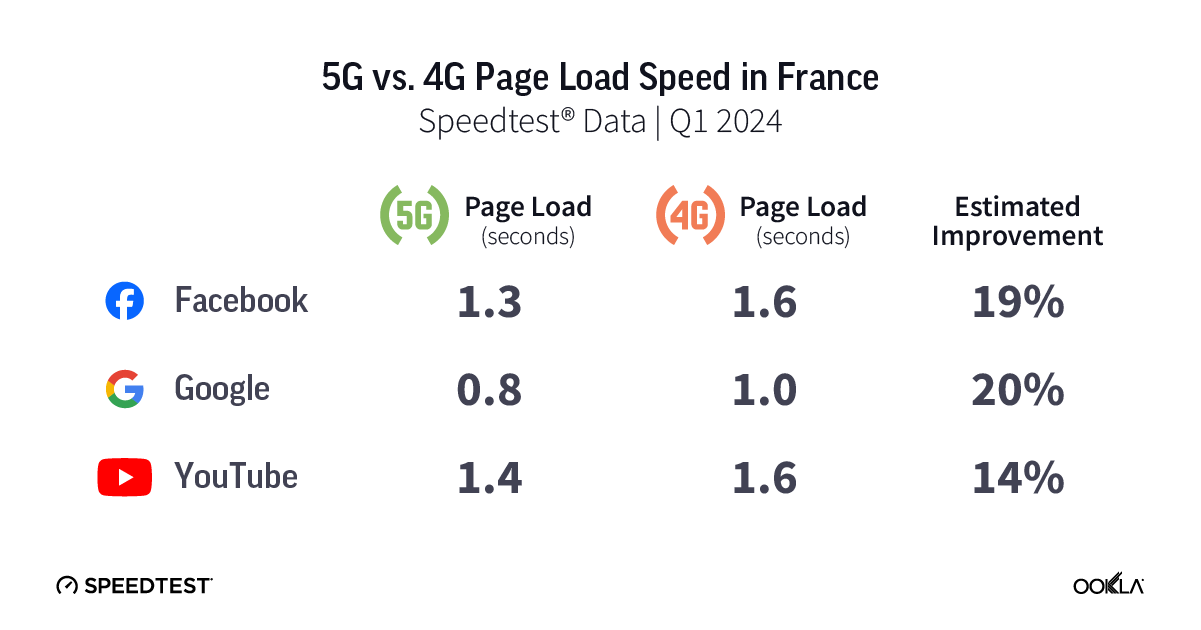
Speedtest data shows 5G page load speed on all three services was decently faster than on 4G in France during Q1 2024. YouTube loaded 14% faster on 5G than 4G, Facebook was 19%, and Google was 20% faster on 5G.

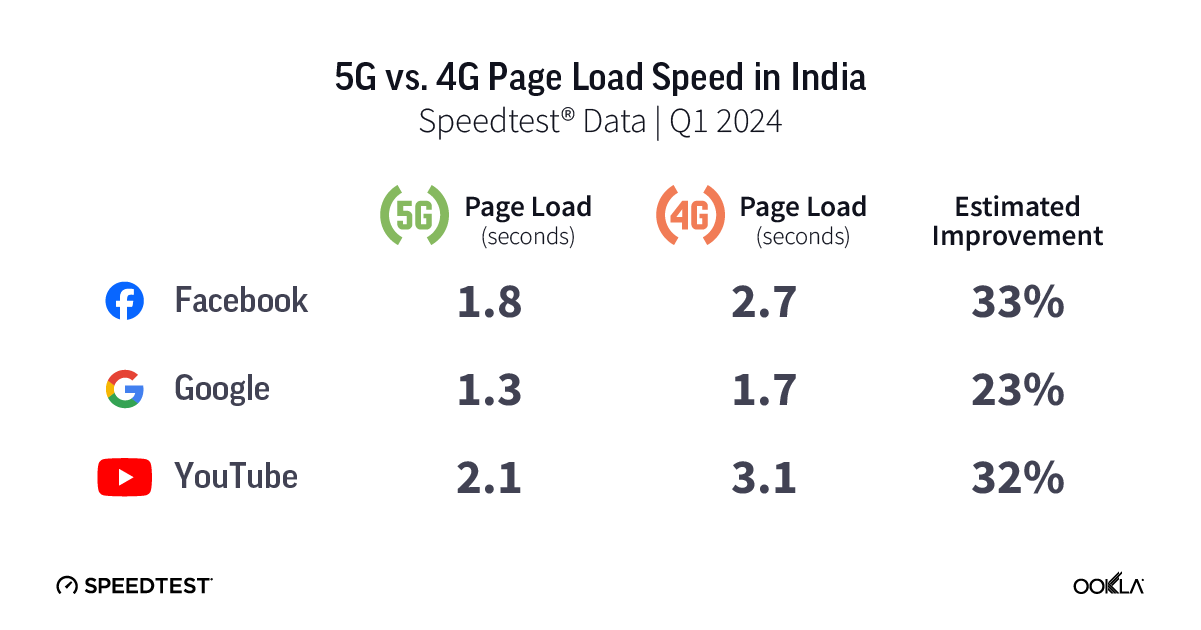
5G loads 23-33% faster than 4G in India

Chart of 5G vs. 4G Page Load Speed in India

Analysis of Speedtest data shows the page load speed on all three services was much lower on 5G than 4G in India during Q1 2024. Google loaded 23% faster on 5G than 4G, YouTube was 32% faster, and Facebook was 33% faster on 5G. India and Mexico had the slowest page load speeds for Facebook over 5G of any of the countries we looked at.

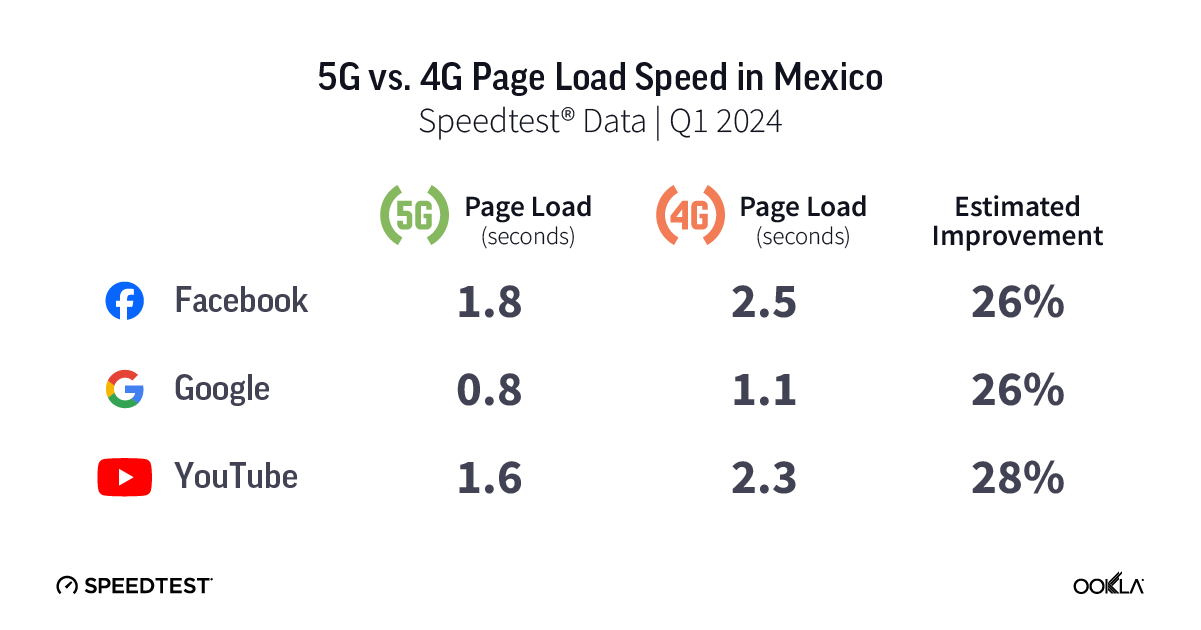
Mexican 5G loads 26-28% faster than 4G

Chart of 5G vs. 4G Page Load Speed in Mexico

Speedtest data shows 5G delivered a much lower page load speed than 4G on all three services in Mexico during Q1 2024. Google and Facebook loaded 26% faster on 5G than 4G and YouTube was 28% faster on 5G. Mexico and India had the slowest 5G page load speeds for Facebook among the countries examined.

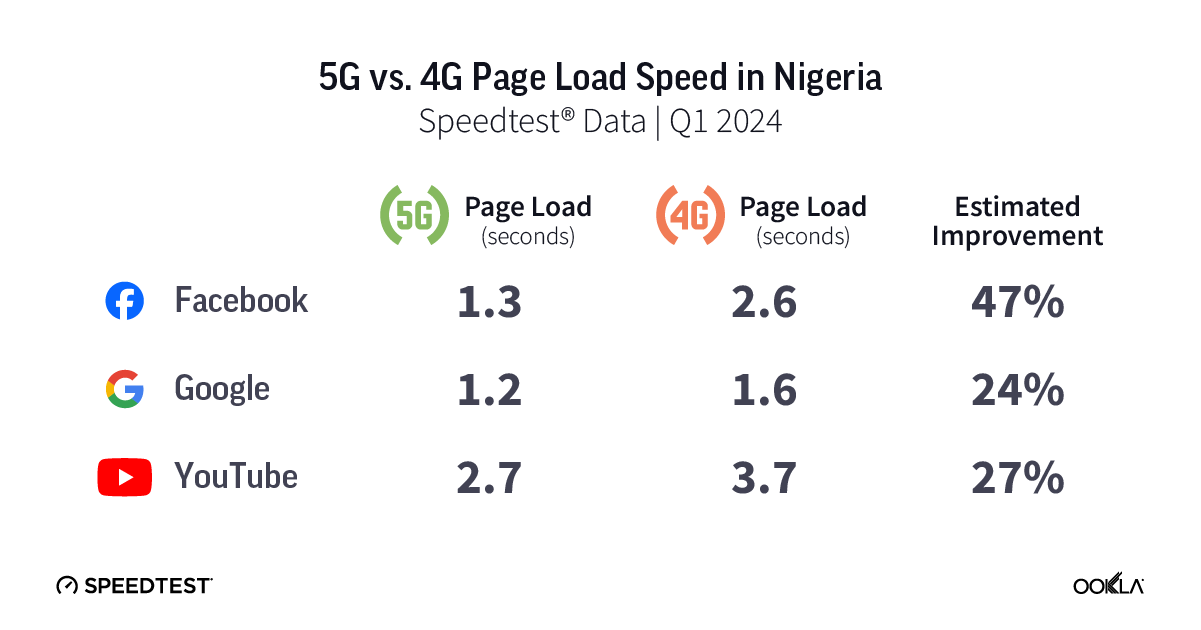
5G loads up to 47% faster than 4G in Nigeria

Chart of 5G vs. 4G Page Load Speed in Nigeria

Our analysis revealed 5G delivered a much lower page load speed than 4G on all three services in Nigeria during Q1 2024. Google loaded 24% faster on 5G than 4G, YouTube was 27% faster, and Facebook was a whopping 47% faster on 5G.

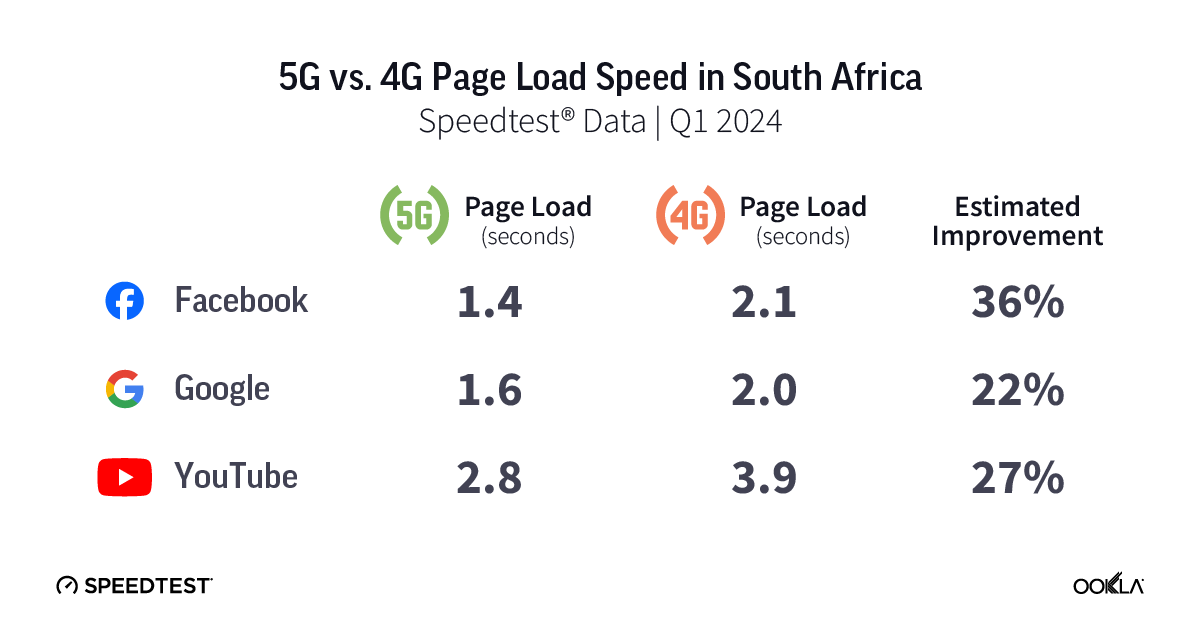
South Africans see 22-36% faster 5G page load over 4G, but slow Google and YouTube

Chart of 5G vs. 4G Page Load Speed in South Africa

Speedtest data shows 5G delivered a much lower page load speed than 4G on all three services in South Africa during Q1 2024. Google loaded 22% faster on 5G than 4G, YouTube was 27% faster, and Facebook was 36% faster on 5G. South Africa had the slowest 5G page load speed for both Google and YouTube of any of the countries analyzed.

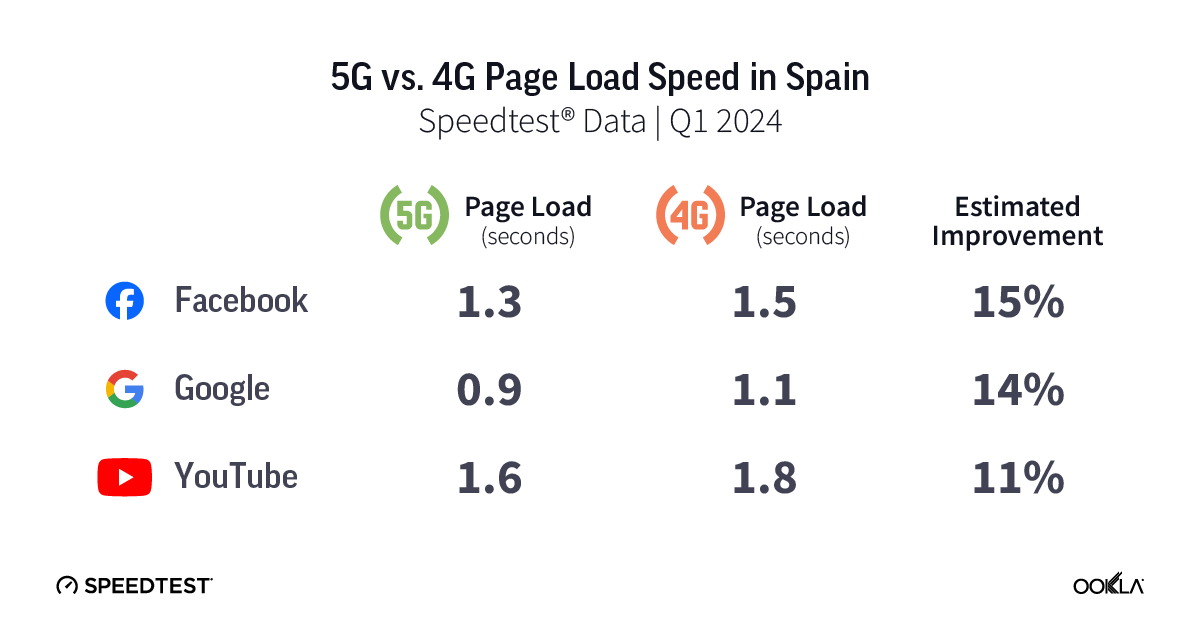
5G loads 11-15% faster than 4G in Spain

Chart of 5G vs. 4G Page Load Speed in Spain

5G page load speed in Spain was somewhat faster than 4G on all three services during Q1 2024. YouTube loaded 11% faster on 5G than 4G, Google was 14% faster than 4G, and Facebook was 15% faster on 5G.

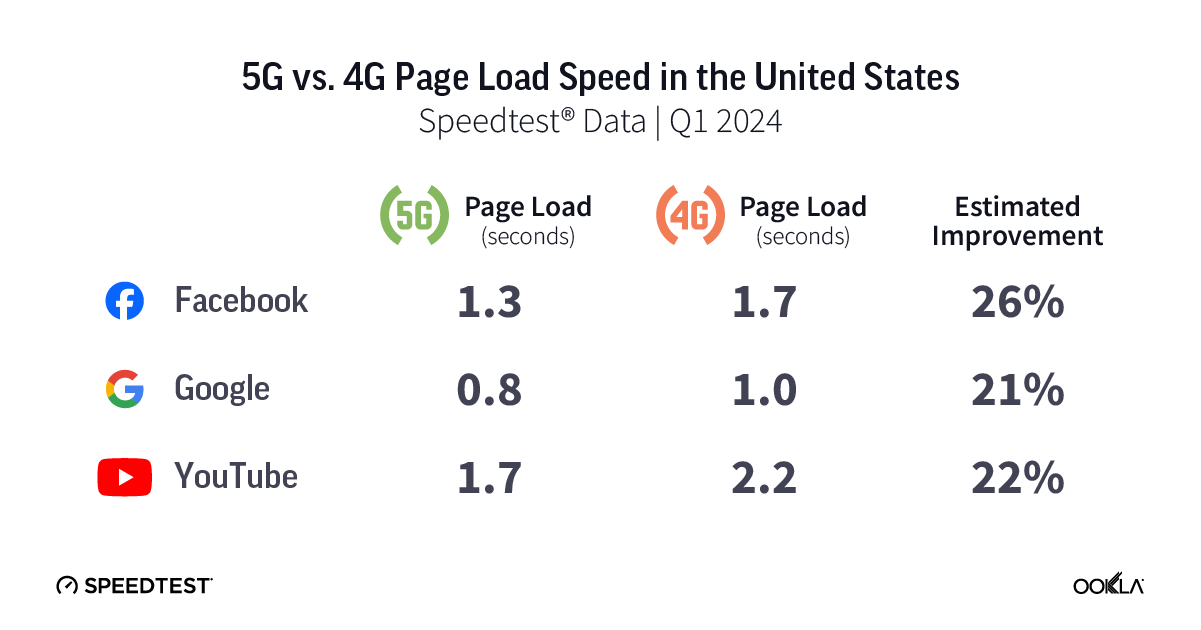
U.S. 5G loads 21-26% faster than 4G

Chart of 5G vs. 4G Page Load Speed in United States

Speedtest data from the U.S. shows 5G delivered a much lower page load speed than 4G on all three services during Q1 2024. Google loaded 21% faster on 5G than 4G, YouTube was 22% faster, and Facebook was 26% faster on 5G.

Your time is valuable. Our data shows that you can get some of that important time back if you have access to 5G and can afford to upgrade. To learn more about your network experience, download the Speedtest app for Android or iOS. Remember, too, that there’s a Downdetector® tab in the Speedtest apps to help you troubleshoot pages that aren’t loading at all.

Ookla retains ownership of this article including all of the intellectual property rights, data, content graphs and analysis. This article may not be quoted, reproduced, distributed or published for any commercial purpose without prior consent. Members of the press and others using the findings in this article for non-commercial purposes are welcome to publicly share and link to report information with attribution to Ookla.

| June 17, 2024

Your Guide to Airport Wi-Fi and Mobile Performance at 50+ Global Airports in 2024

Airports around the world have been packed with travelers this year, which puts extra stress on the Wi-Fi. With summer travel already well in swing in the northern hemisphere, we’re back with fresh data for our series on airport Wi-Fi performance to help you plan for connectivity at all your connections. You’ll find information about Wi-Fi on free networks provided by the individual airports as well as mobile speeds at some of the busiest airports in the world during Q1 2024. Read on for a look at internet performance at over 50 of the world’s busiest airports with data on download speed, upload speed, and latency.

Key takeaways

  • The seven fastest airports for downloads over Wi-Fi were in the United States: San Francisco International Airport, Newark Liberty International Airport, John F. Kennedy International Airport, Phoenix Sky Harbor International Airport, Seattle–Tacoma International Airport, Dallas Fort Worth International Airport, and Harry Reid International Airport.
  • Six U.S. airports had the fastest uploads over Wi-Fi: San Francisco International Airport, Phoenix Sky Harbor International Airport, Newark Liberty International Airport, Seattle–Tacoma International Airport, Dallas Fort Worth International Airport, and John F. Kennedy International Airport.
  • The fastest mobile download speeds on our list were at Hamad International Airport in Doha, Qatar, Shanghai Hongqiao International Airport in China, and Phoenix Sky Harbor International Airport in the U.S.
  • Eight of the 10 airports with the fastest mobile upload speeds were in China.

9 airports have 100+ Mbps Wi-Fi download speeds

Speedtest Intelligence® showed seven of the nine airports with median Wi-Fi download speeds over 100 Mbps were in the U.S.:

  • San Francisco International Airport (173.55 Mbps),
  • Newark Liberty International Airport (166.51 Mbps),
  • John F. Kennedy International Airport (151.59 Mbps),
  • Phoenix Sky Harbor International Airport (151.28 Mbps),
  • Seattle–Tacoma International Airport (137.31 Mbps),
  • Dallas Fort Worth International Airport (119.92 Mbps), and
  • Harry Reid International Airport (107.84 Mbps).

Charles de Gaulle Airport in Paris, France and China’s Hangzhou Xiaoshan International Airport rounded out the list with median download speeds of 107.13 Mbps and 101.01 Mbps, respectively. Hartsfield–Jackson Atlanta International Airport and Sea–Tac had the lowest median multi-server latency on Wi-Fi of any of the airports surveyed during Q1 2024.

Hover on the pins on the map below to see full details for download and upload speeds as well as latency at all the airports analyzed.

Fixed Broadband Internet Speeds Over Free Wi-Fi at Global Airports
Speedtest Intelligence® | Q1 2024
A map showing fixed broadband speeds in selected global airports.

At Ookla®, we’re dedicated to making sure the networks you depend on are always at their best. With Ekahau®, our Wi-Fi solution, we know firsthand just how challenging it can be to optimize Wi-Fi at airports, especially when you have up to 900 people waiting at each boarding gate during the busiest travel times. While the speeds achieved by these top airports are impressive, we saw two smaller U.S. airports with median Wi-Fi download speeds over 200 Mbps during our U.S.-only analysis of airport Wi-Fi in the fall.

Six airports on our list use multiple SSIDs for their Wi-Fi networks for different terminals or to take advantage of the coverage advantages of 2.4 GHz and the speed advantages of 5 GHz frequencies. We have included data for all the SSIDs with sufficient samples in the map and reported in the text on the best result when using multiple SSIDs results in dramatically different speeds.

Eighteen airports on our list had median Wi-Fi download speeds of less than 25 Mbps. Mexico City International Airport in Mexico had the lowest median Wi-Fi download speed at 5.11 Mbps, followed by:

  • Tan Son Nhat International Airport in Vietnam (7.07 Mbps),
  • Beijing Capital International Airport in China (9.45 Mbps),
  • Cairo International Airport in Egypt (10.62 Mbps), and
  • Tokyo Haneda Airport in Japan (11.37 Mbps).

You may struggle with everything from video chatting to streaming at any airport with a download speed below 25 Mbps. Latency is also a factor in performance so if your airport is one of the three with a median Wi-Fi latency over 60 ms, a mobile hotspot may be a better option for a stable connection.

Wi-Fi 6 has arrived

Our analysis shows at least 15 airports on our list were using the new Wi-Fi 6 standard in their Wi-Fi setup. Wi-Fi 6 uses Multi-User Multiple Input, Multiple Output (MU-MIMO) and Orthogonal Frequency Division Multiple Access (OFDMA) to increase performance and throughput, especially when serving multiple devices. This offers a real advantage at a large public location like an airport. In order to get maximum benefit from Wi-Fi 6, consumers would need to be using Wi-Fi 6-compatible devices. Speedtest data shows a fairly even split between airports that saw faster download speeds on Wi-Fi 6 and airports where Wi-Fi 6 results were comparable to those on other earlier Wi-Fi generations.

As you know, international travel can be complicated. Even if the airport offers free Wi-Fi, you may encounter other barriers to access. For example, a local number is required in Cairo to receive the access code to connect to the airport Wi-Fi. And while we’d love to include other large airports like Nigeria’s Murtala Muhammed International Airport in future Wi-Fi analyses, they currently do not offer free Wi-Fi so we have included mobile data below.

11 airports show mobile speeds over 200 Mbps

Speedtest® data shows mobile speeds massively outpaced Wi-Fi, with 14 airports showing faster median downloads over mobile than the fastest airport for Wi-Fi. Hamad International Airport in Qatar had the fastest median download speed over mobile on our list at 442.49 Mbps during Q1 2024, followed by:

  • Shanghai Hongqiao International Airport (341.19 Mbps),
  • Phoenix Sky Harbor International Airport (295.94 Mbps),
  • Shanghai Pudong International Airport (264.71 Mbps),
  • Chongqing Jiangbei International Airport (258.42 Mbps), and
  • Istanbul Airport (255.51 Mbps).

Mobile Network Speeds at Global Airports
Speedtest Intelligence® | Q1 2024

Fastest mobile speeds at airports in Africa and South America

Jomo Kenyatta International Airport in Kenya had the fastest mobile download speeds of the four African airports we analyzed at 88.12 Mbps during Q1 2024. São Paulo/Guarulhos International Airport in Brazil was the faster of the two Latin American airports analyzed with a median download speed of 55.44 Mbps.

Airports with slow mobile speeds

Mobile can’t fix everything, because six airports came in with a median mobile download speed below 25 Mbps. Mexico City International Airport was again at the bottom with 8.75 Mbps, followed by:

  • Josep Tarradellas Barcelona–El Prat Airport (15.21 Mbps),
  • Orlando International Airport (15.84 Mbps),
  • Adolfo Suárez Madrid–Barajas Airport (20.37 Mbps),
  • Chhatrapati Shivaji Maharaj International Airport (20.96 Mbps), and
  • Indira Gandhi International Airport (21.80 Mbps).

Latency on mobile was generally higher than that on Wi-Fi with 46 airports showing a Wi-Fi latency lower than the lowest latency on mobile, 27.51 ms at China’s Shanghai Hongqiao International Airport. As noted above, latency is an important factor in performance, so it might be worth investigating the airport Wi-Fi by running a Speedtest if your mobile performance seems to lag.

Airport Wi-Fi or mobile? Connecting on your next trip

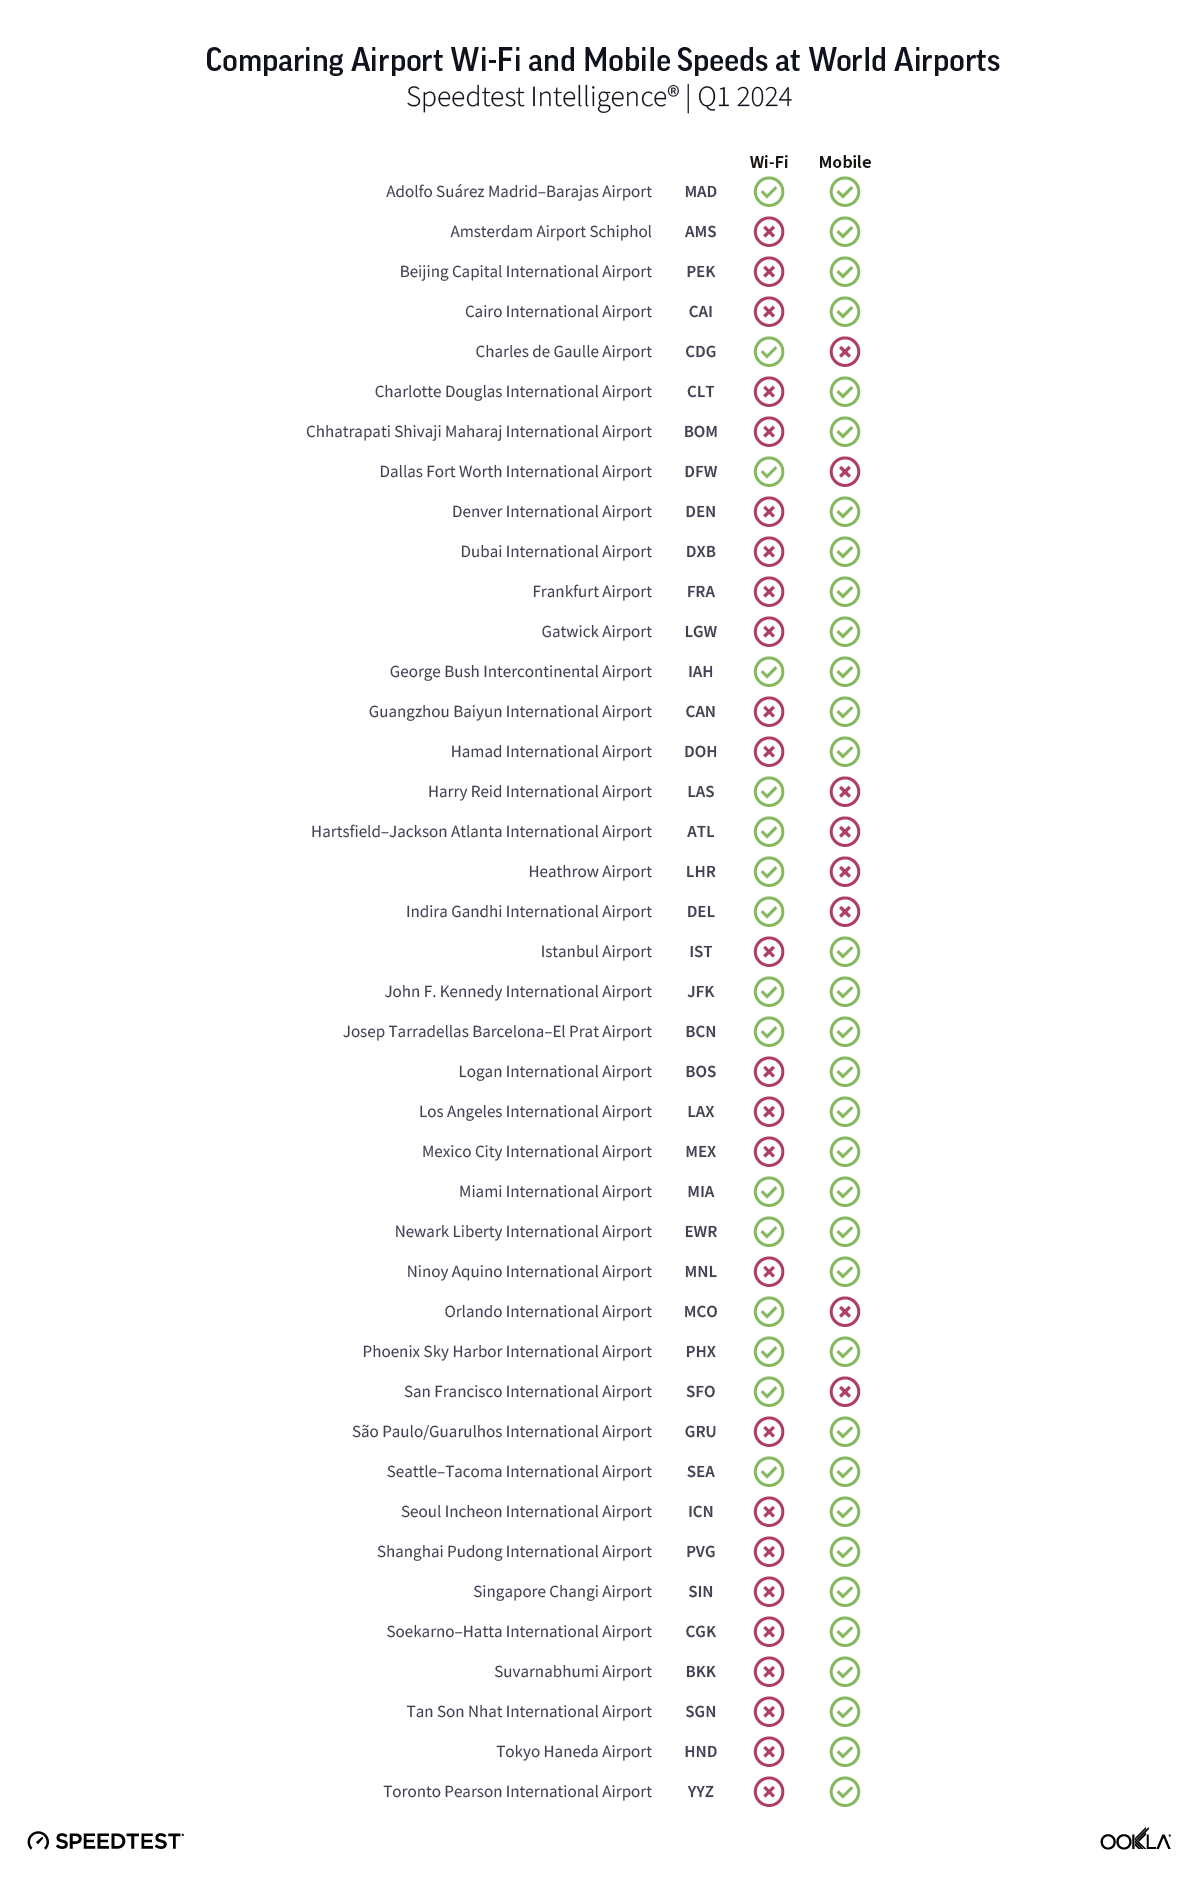
We created a quick guide to help you decide whether to try out the Wi-Fi or simply use the local mobile network if you have access. Use it to compare free airport Wi-Fi performance against mobile performance for the 52 airports we have both Wi-Fi and mobile data for during Q1 2024. Twenty-six airports had faster mobile internet than airport Wi-Fi. Eight airports had faster Wi-Fi than mobile, and seven airports showed only a slight distinction between Wi-Fi and mobile or download speeds over 100 Mbps on both, so we gave both the green check marks. We were able to include more airports in the mobile analysis because there were more mobile samples to analyze at those airports than there were samples over Wi-Fi.

Chart of Comparing Airport Wi-Fi and Mobile Speeds at World Airports

The averages reported here are based on real-world data, so your experience may differ, especially on a busy travel day. Take a Speedtest® at the airport to see how your performance compares. Cheers to safe travels and rapid connections wherever you’re flying.

Ookla retains ownership of this article including all of the intellectual property rights, data, content graphs and analysis. This article may not be quoted, reproduced, distributed or published for any commercial purpose without prior consent. Members of the press and others using the findings in this article for non-commercial purposes are welcome to publicly share and link to report information with attribution to Ookla.

| February 12, 2020

How Roaming Affects Mobile Speeds in Europe

Last year, we conducted an expansive analysis of mobile roaming in the European Union. We’re updating our data to see which countries have the best roaming speeds and how roaming affects time spent on Wi-Fi. This analysis is based on Speedtest data from Android devices in Europe during Q3-Q4 2019. Despite Brexit, we’ve included data from the United Kingdom to keep parity year-over-year, as the roaming agreement remains in place for 2020 and this data involves travel within a specific set of countries.

Roaming in Europe typically means slower download speeds

Mobile roaming speeds are affected by the deals struck between individual mobile operators on a country-by-country basis. This means roaming speeds can depend on the plan a subscriber has selected in their home country and on what is offered in the country of destination.

Out of the 28 countries we examined, residents of 22 countries experienced slower speeds when roaming elsewhere in Europe than they do in their home countries. Travelers from the Netherlands experience the most significant loss in speed, with a roaming download speed that is 54.7% slower than at home. However, users in Slovakia barely notice a change in download speed with a roaming download speed only 2.6% slower than the mean download speed in Slovakia during this period.

Roaming vs. Local Mobile Download Speeds in Europe
Speedtest® Data | Q3-Q4 2019
Country Local Speeds (Mbps) Roaming Speed Upload (Mbps) % Change
Austria 46.30 35.93 -22.4%
Belgium 50.95 33.38 -34.5%
Bulgaria 55.32 30.95 -44.1%
Croatia 52.40 43.73 -16.6%
Cyprus 43.50 21.04 -51.6%
Czech Republic 47.00 36.37 -22.6%
Denmark 48.38 32.28 -33.3%
Estonia 42.61 43.90 3.0%
Finland 43.38 41.46 -4.4%
France 44.34 34.00 -23.3%
Germany 34.07 30.48 -10.5%
Greece 39.90 45.03 12.9%
Hungary 45.53 29.55 -35.1%
Ireland 26.73 32.05 19.9%
Italy 33.64 40.98 21.8%
Latvia 33.20 38.54 16.1%
Lithuania 46.72 39.73 -15.0%
Luxembourg 52.55 34.61 -34.1%
Malta 48.88 32.30 -33.9%
Netherlands 62.52 28.31 -54.7%
Poland 33.07 25.57 -22.7%
Portugal 34.49 36.34 5.4%
Romania 37.84 33.69 -11.0%
Slovakia 34.74 33.83 -2.6%
Slovenia 39.34 32.67 -16.9%
Spain 34.28 27.56 -19.6%
Sweden 48.52 36.55 -24.7%
United Kingdom 36.36 34.96 -3.8%

Upload speeds locally are also mostly faster than those experienced while roaming. Cyprus, Denmark, and the Netherlands all had relatively high mean upload speeds locally, but they also had the largest loss in roaming upload speeds ranging from 31.3% to 36.7% slower upload speeds on mobile roaming.

Residents of some European countries do benefit from faster speeds when roaming on mobile. Users from Estonia, Portugal, Greece, Latvia, Ireland, and Italy all experienced faster download speeds when roaming elsewhere in Europe than they did in their home countries during Q3-Q4 2019. Italian and Irish travelers gained the most when roaming with download speeds that were 21.8% and 19.9% faster than their local speeds, respectively.

A total of 12 countries had higher mean upload speeds while roaming than they experienced locally during this period. France, Latvia, and Ireland benefitted the most with an increase in upload speeds that ranged from 26.5% to 21.4% while roaming.

Latency increases dramatically while roaming in Europe

Unlike mean download and upload speeds, latency is almost always dramatically different while roaming. This is because roaming signals are routed through a user’s home network, making latency a significant issue for Europeans when traveling.

Local vs. Roaming Latency in Europe
Speedtest® Data | Q3-Q4 2019
Country Local Latency (ms) Roaming Latency (ms) % Change
Austria 26 84 220.4%
Belgium 27 83 205.7%
Bulgaria 27 127 368.3%
Croatia 33 89 166.0%
Cyprus 23 213 825.5%
Czech Republic 26 74 187.6%
Denmark 26 100 287.9%
Estonia 25 76 201.5%
Finland 27 97 254.6%
France 41 82 98.8%
Germany 38 87 128.1%
Greece 29 129 349.8%
Hungary 25 93 272.6%
Ireland 35 100 185.0%
Italy 50 91 81.2%
Latvia 26 95 268.2%
Lithuania 27 107 302.2%
Luxembourg 23 83 262.6%
Malta 19 136 611.6%
Netherlands 28 87 208.3%
Poland 35 109 209.2%
Portugal 30 109 258.8%
Romania 30 113 275.3%
Slovakia 31 76 105.5%
Slovenia 24 74 208.2%
Spain 45 107 137.4%
Sweden 29 118 304.3%
United Kingdom 38 103 173.1%

In their home country, residents of Malta (19 ms), Luxembourg (22 ms) and Cyprus (23 ms) enjoyed the lowest latencies in Europe. Residents of France, Spain and Italy experienced the highest latencies in their home countries at 41 ms, 45 ms and 50 ms, respectively.

European residents experienced an increase of at least 81.2% in their latency when visiting other countries within Europe. Residents from Cyprus, Malta and Bulgaria experience the biggest increase in latency when visiting other countries in Europe, ranging from Cyprus’ 825.5% to Bulgaria’s 368.3%. The countries that experienced the smallest increase in latency were Italy (81.2%), France (98.8%) and Germany (128.1%).

Locals spend more time on Wi-Fi than visitors in Europe

While there are no roaming changes within the E.U., users often opt to connect to Wi-Fi to avoid additional data overages at home and abroad. The following table compares the percentage of time spent on Wi-Fi by a resident of a country with that of a visitor to the same country during Q3-Q4 2019.

Percentage of Time Spent on Wi-Fi in Europe
Speedtest® Data | Q3-Q4 2019
Country Local Customers Visitors % Change
Austria 75.5% 40.5% -46.3%
Belgium 77.9% 35.8% -54.1%
Bulgaria 74.0% 60.3% -18.5%
Croatia 74.3% 53.8% -27.5%
Cyprus 79.3% 70.2% -11.5%
Czech Republic 80.1% 46.6% -41.8%
Denmark 78.7% 60.3% -23.4%
Estonia 70.3% 51.9% -26.2%
Finland 63.0% 60.3% -4.4%
France 69.3% 48.7% -29.7%
Germany 80.0% 47.1% -41.1%
Greece 79.3% 64.3% -19.0%
Hungary 76.8% 47.8% -37.8%
Ireland 75.6% 58.9% -22.0%
Italy 70.9% 55.1% -22.2%
Latvia 68.8% 49.2% -28.4%
Lithuania 73.8% 52.2% -29.2%
Luxembourg 72.4% 30.8% -57.4%
Malta 79.4% 65.9% -17.1%
Netherlands 81.8% 49.1% -40.1%
Poland 70.2% 58.2% -17.1%
Portugal 76.5% 61.9% -19.0%
Romania 69.6% 64.1% -7.9%
Slovakia 76.2% 40.1% -47.4%
Slovenia 70.7% 24.7% -65.2%
Spain 78.3% 62.8% -19.7%
Sweden 81.8% 53.8% -34.3%
United Kingdom 79.3% 60.9% -23.1%

As we saw last year, Finnish residents spent the least amount of time on Wi-Fi at 63.0%. Latvia showed the second lowest time spent on Wi-Fi (68.8%), followed by France (69.3%). Residents from the Netherlands, Sweden and the Czech Republic spent the most time on Wi-Fi at 81.8%, 81.8%, and 80.1%, respectively.

Visitors to Cyprus, Malta and Greece spent the most amount of time on Wi-Fi during this period. Time spent on Wi-Fi by visitors ranged from 64.3% in Greece to 70.2% in Cyprus. Visitors to Slovenia, Luxembourg and Belgium as a destination country spent the least amount of time on Wi-Fi at 25.7%, 30.8% and 35.8%, respectively.

Are you interested in more data on roaming performance? Read more here!

Ookla retains ownership of this article including all of the intellectual property rights, data, content graphs and analysis. This article may not be quoted, reproduced, distributed or published for any commercial purpose without prior consent. Members of the press and others using the findings in this article for non-commercial purposes are welcome to publicly share and link to report information with attribution to Ookla.

| March 2, 2020

Mobile and Fixed Broadband Speeds and 4G Availability in Spain

Versión en español

We investigated Spain’s fixed broadband and mobile network performance, 4G Availability, how Spain’s speeds and coverage compare with neighboring European countries and the performance and 4G Availability of top providers in Spain’s ten largest cities during Q3-Q4 2019. In addition to ranking Spain’s providers by top speeds and coverage, we also analyzed the effects of mobile plans with speed caps on Speedtest® results and ranked the providers on consistency of their network performance.

Spain and France were the fastest on our list for fixed broadband

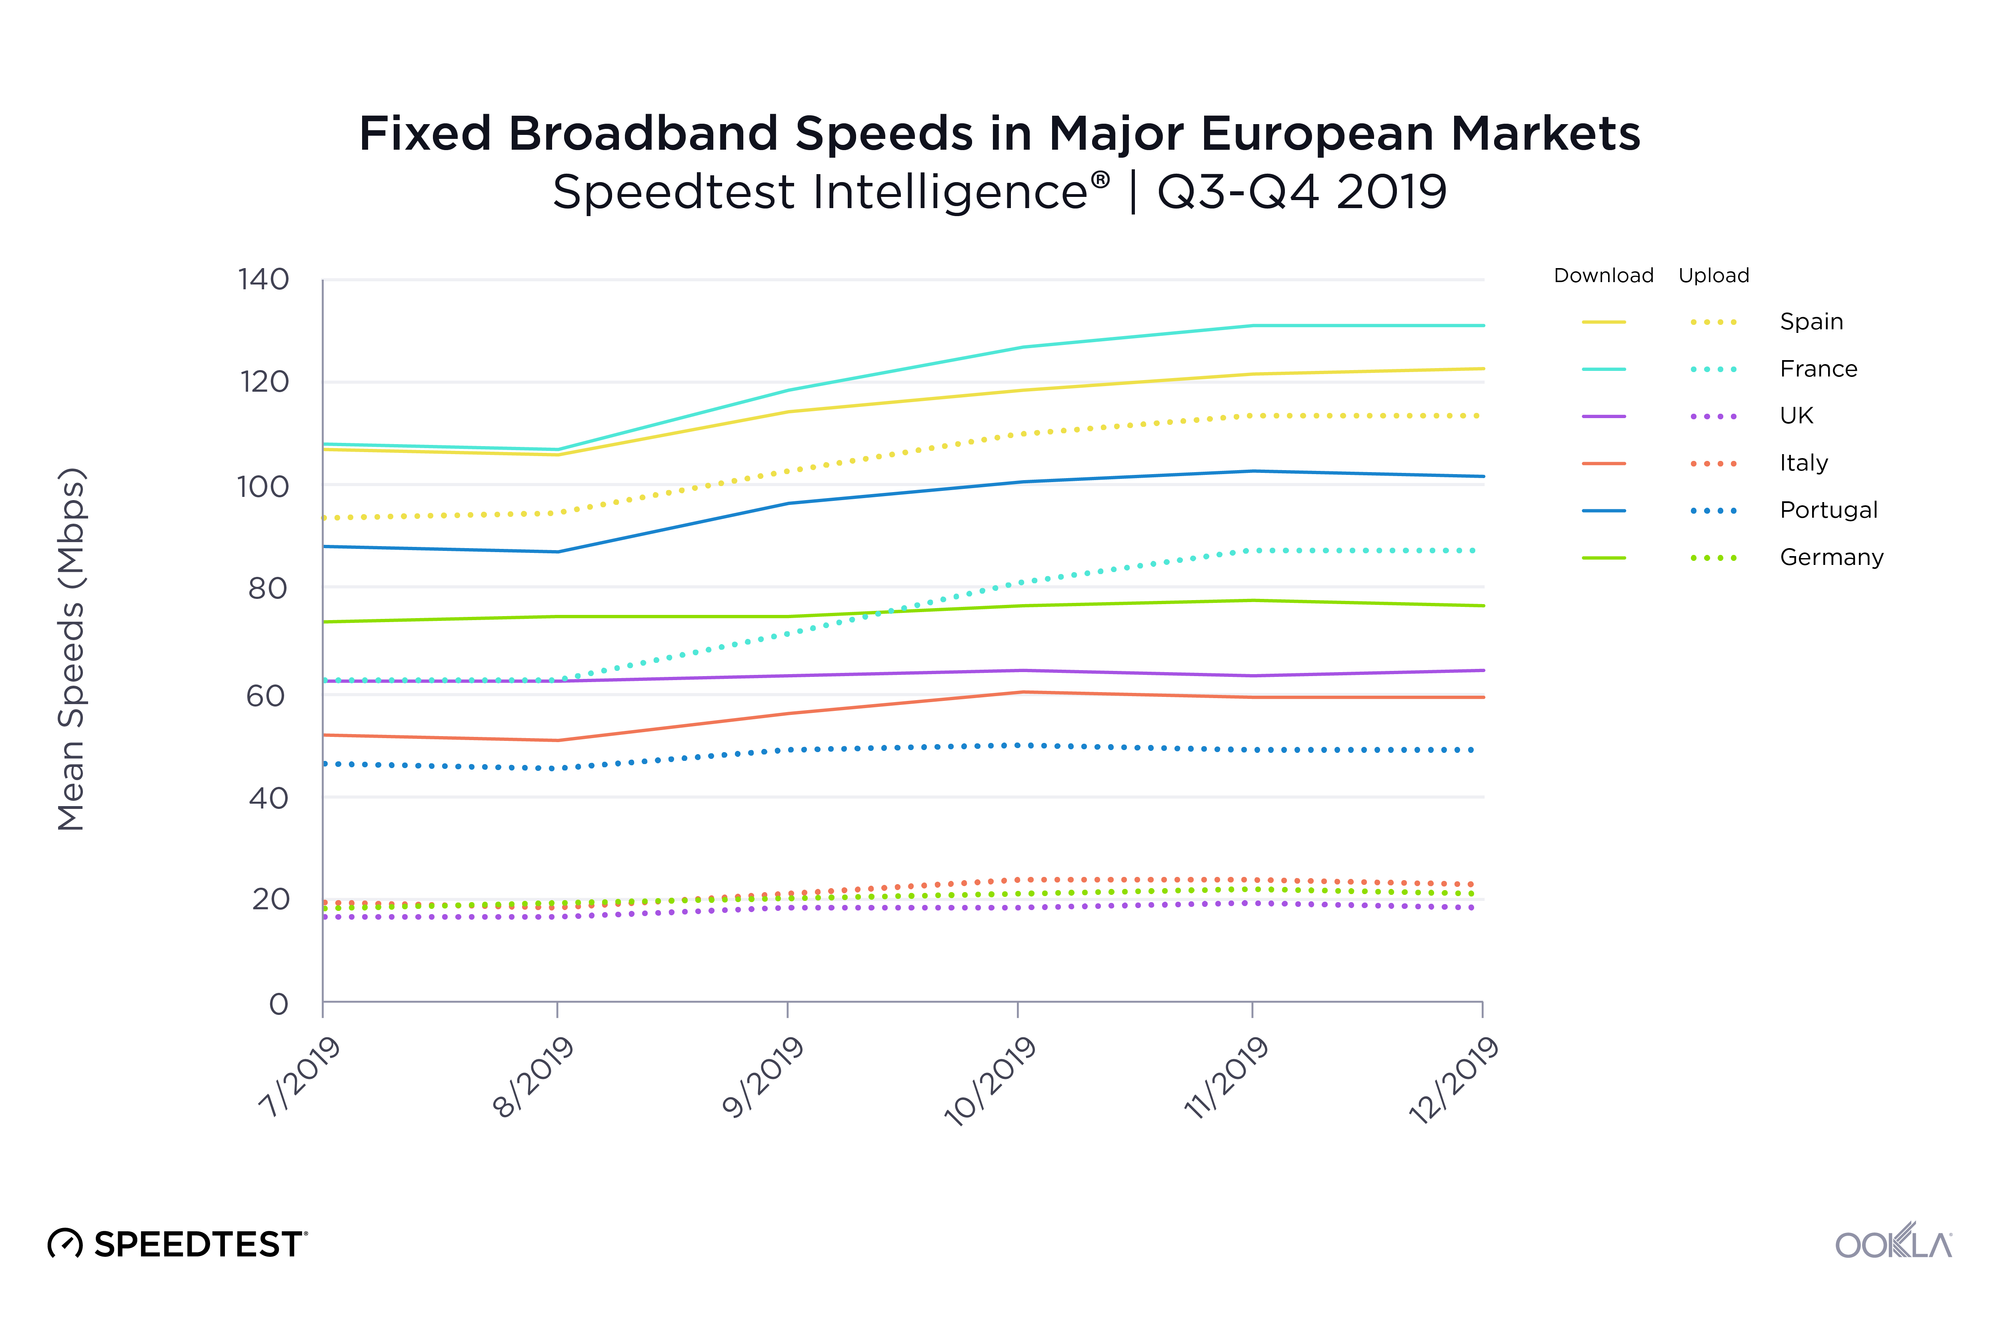
We compared Spain’s fixed broadband performance at the country level to several other western European countries during Q3-Q4 2019. Spain was well positioned for mean download speed on fixed broadband at 113.72 Mbps, second only to France’s 119.37 Mbps. Spain had the fastest mean upload speed on this list at 103.72 Mbps. Italy had the slowest mean download speed on this list at 56.72 Mbps while the United Kingdom had the slowest mean upload speed at 18.28 Mbps.
fixed-broadband-speeds-eng-1

France showed the highest increase in mean download speed during Q3-Q4 2019 at 21.5%, followed by Portugal and Italy at 15.4% and Spain at 14.5%. Speeds remained relatively flat for this period for Italy, the U.K. and Germany.

An examination of latency over fixed broadband during Q3-Q4 2019 revealed a very different performance order. Portugal had the lowest latency during this period at 16 ms. Germany and the U.K. were tied for second at 23 ms. Spain was third (25 ms), Italy fourth (30 ms) and France fifth (32 ms).
Spain ranks fourth for mobile download speed

mobile-speeds-eng-1

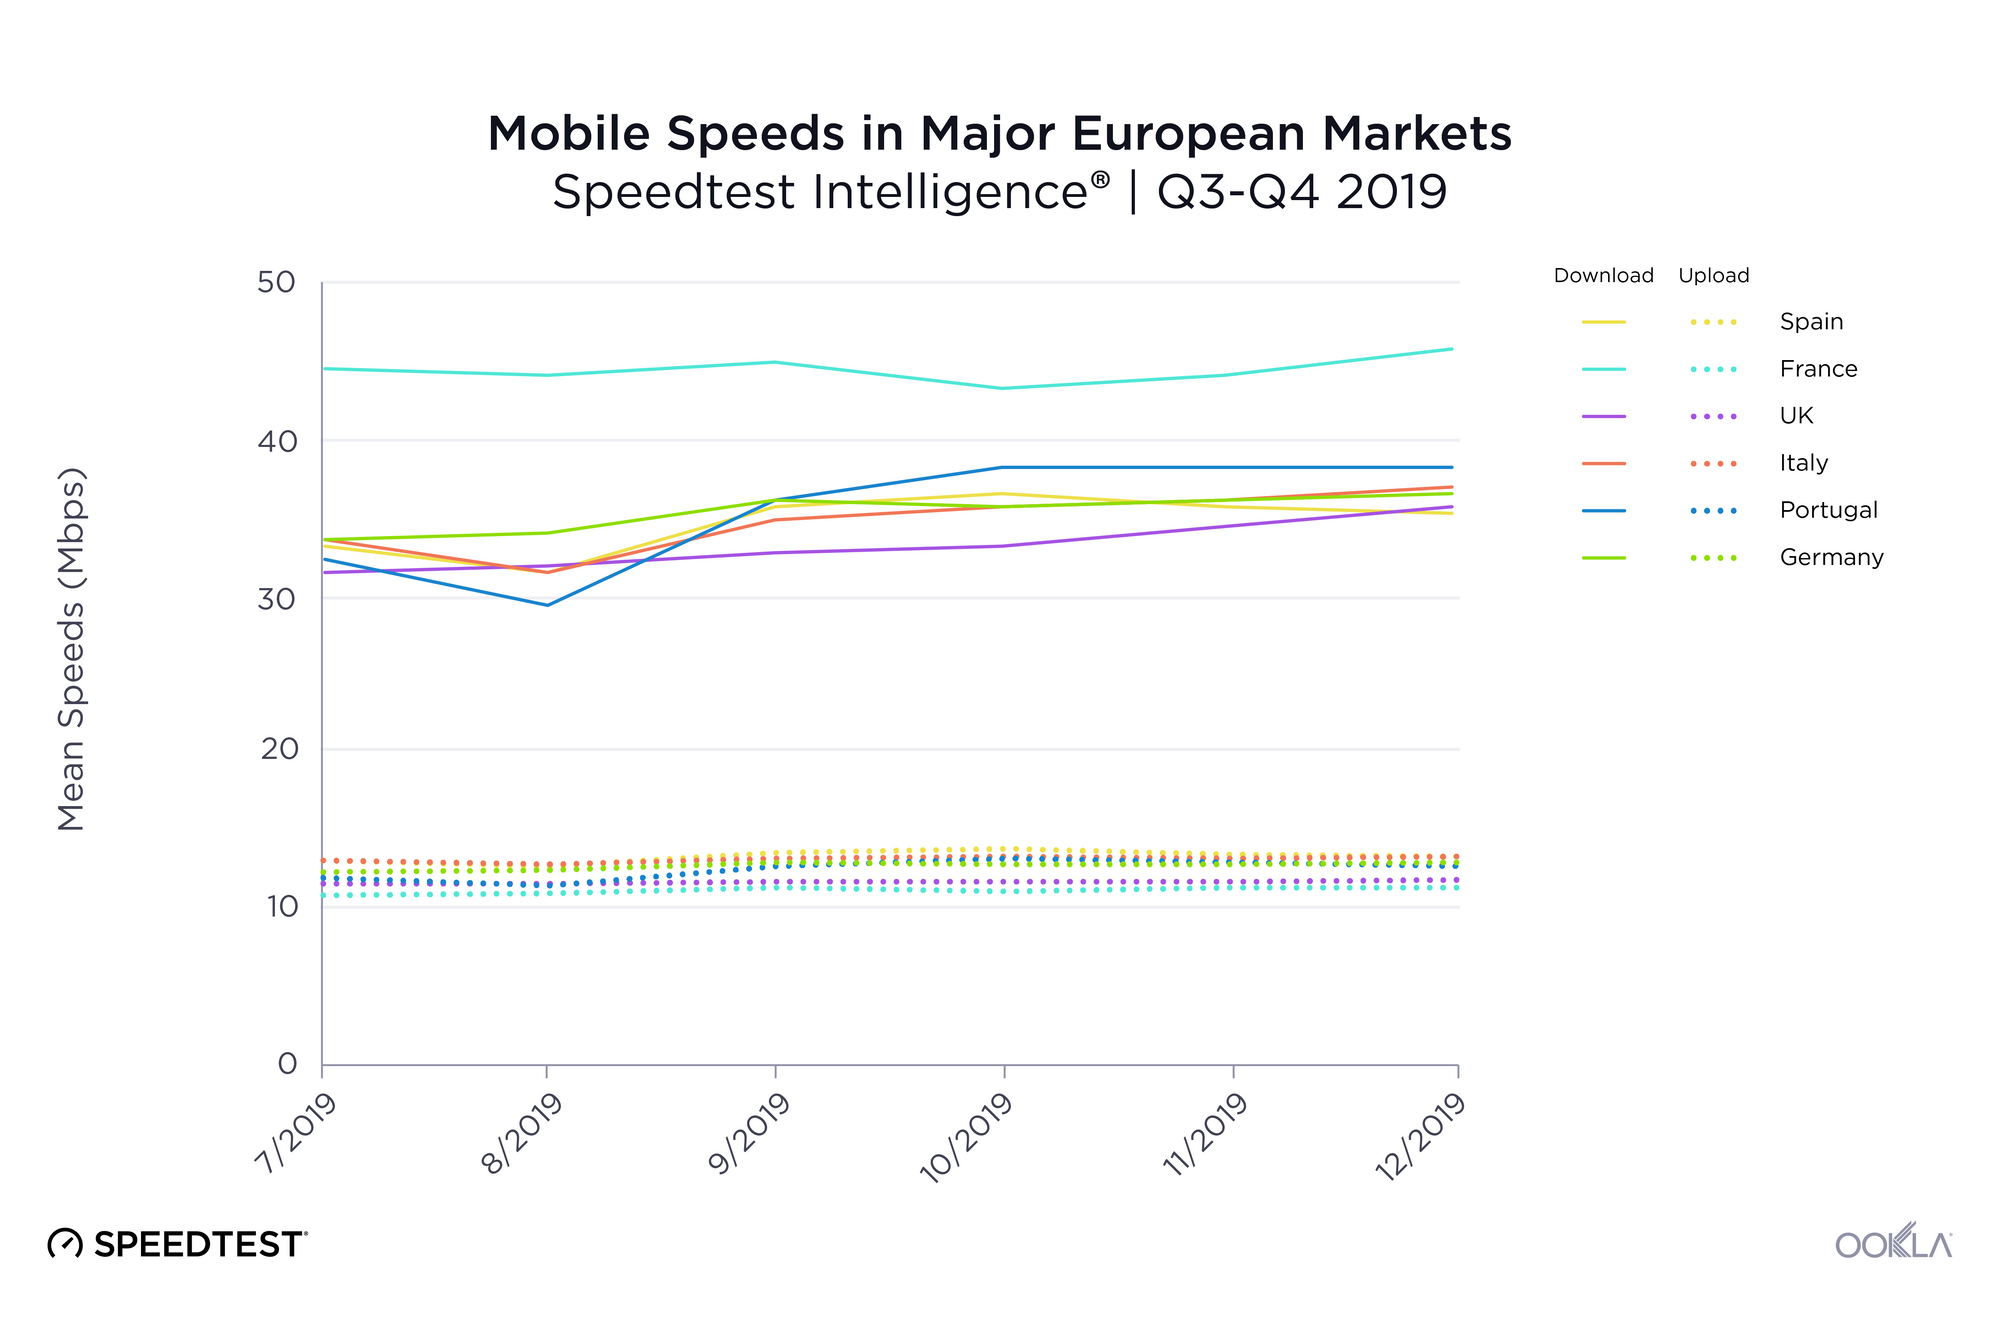
Spain did not rank as well for mean download speed over mobile as they did on fixed broadband, coming in fourth with 33.97 Mbps during Q3-Q4 2019. This was 22.8% slower than first-place France. However, Spain showed the fastest mean upload speeds on mobile at 13.12 Mbps during Q3-Q4 2019.

Portugal saw the largest increase in mobile download speed during Q3-Q4 2019 at 18.4%. Spain’s mean download speed over mobile increased only 6.7% during this period. France showed the smallest increase in mobile download speed at 2.8%.

As we saw on fixed broadband, Portugal had the lowest mobile latency at 32 ms. Germany was second at 41 ms, France third at 43 ms, the U.K. fourth at 44 ms, Spain fifth at 47 ms and Italy last at 52 ms.

United Kingdom and Spain lead in 4G Availability

We used data from Speedtest coverage scans on Android to compare 4G Availability in each market during Q3-Q4 2019. While the U.K. showed the highest 4G Availability at 88.8%, Spain tied for a very close second, with 4G available in 87.7% of tested locations. Germany had the lowest 4G Availability at 72.1% during this period.

4G Availability in Major European Markets
Speedtest Intelligence® | Q3-Q4 2019
Country 4G Availability
United Kingdom 88.8%
Spain 87.7%
France 87.7%
Italy 86.7%
Portugal 85.0%
Germany 72.1%

Looking specifically at Spain’s top mobile providers, Orange had the highest 4G Availability at 88.1%. Movistar was second, Yoigo third, and Vodafone fourth.

4G Availability by Provider in Spain
Speedtest Intelligence® | Q3-Q4 2019
Provider 4G Availability
Orange 88.1%
Movistar 87.7%
Yoigo 87.4%
Vodafone 86.1%

Spain’s 5G deployments are expanding

5G-Deployments-in-Spain-0220-1
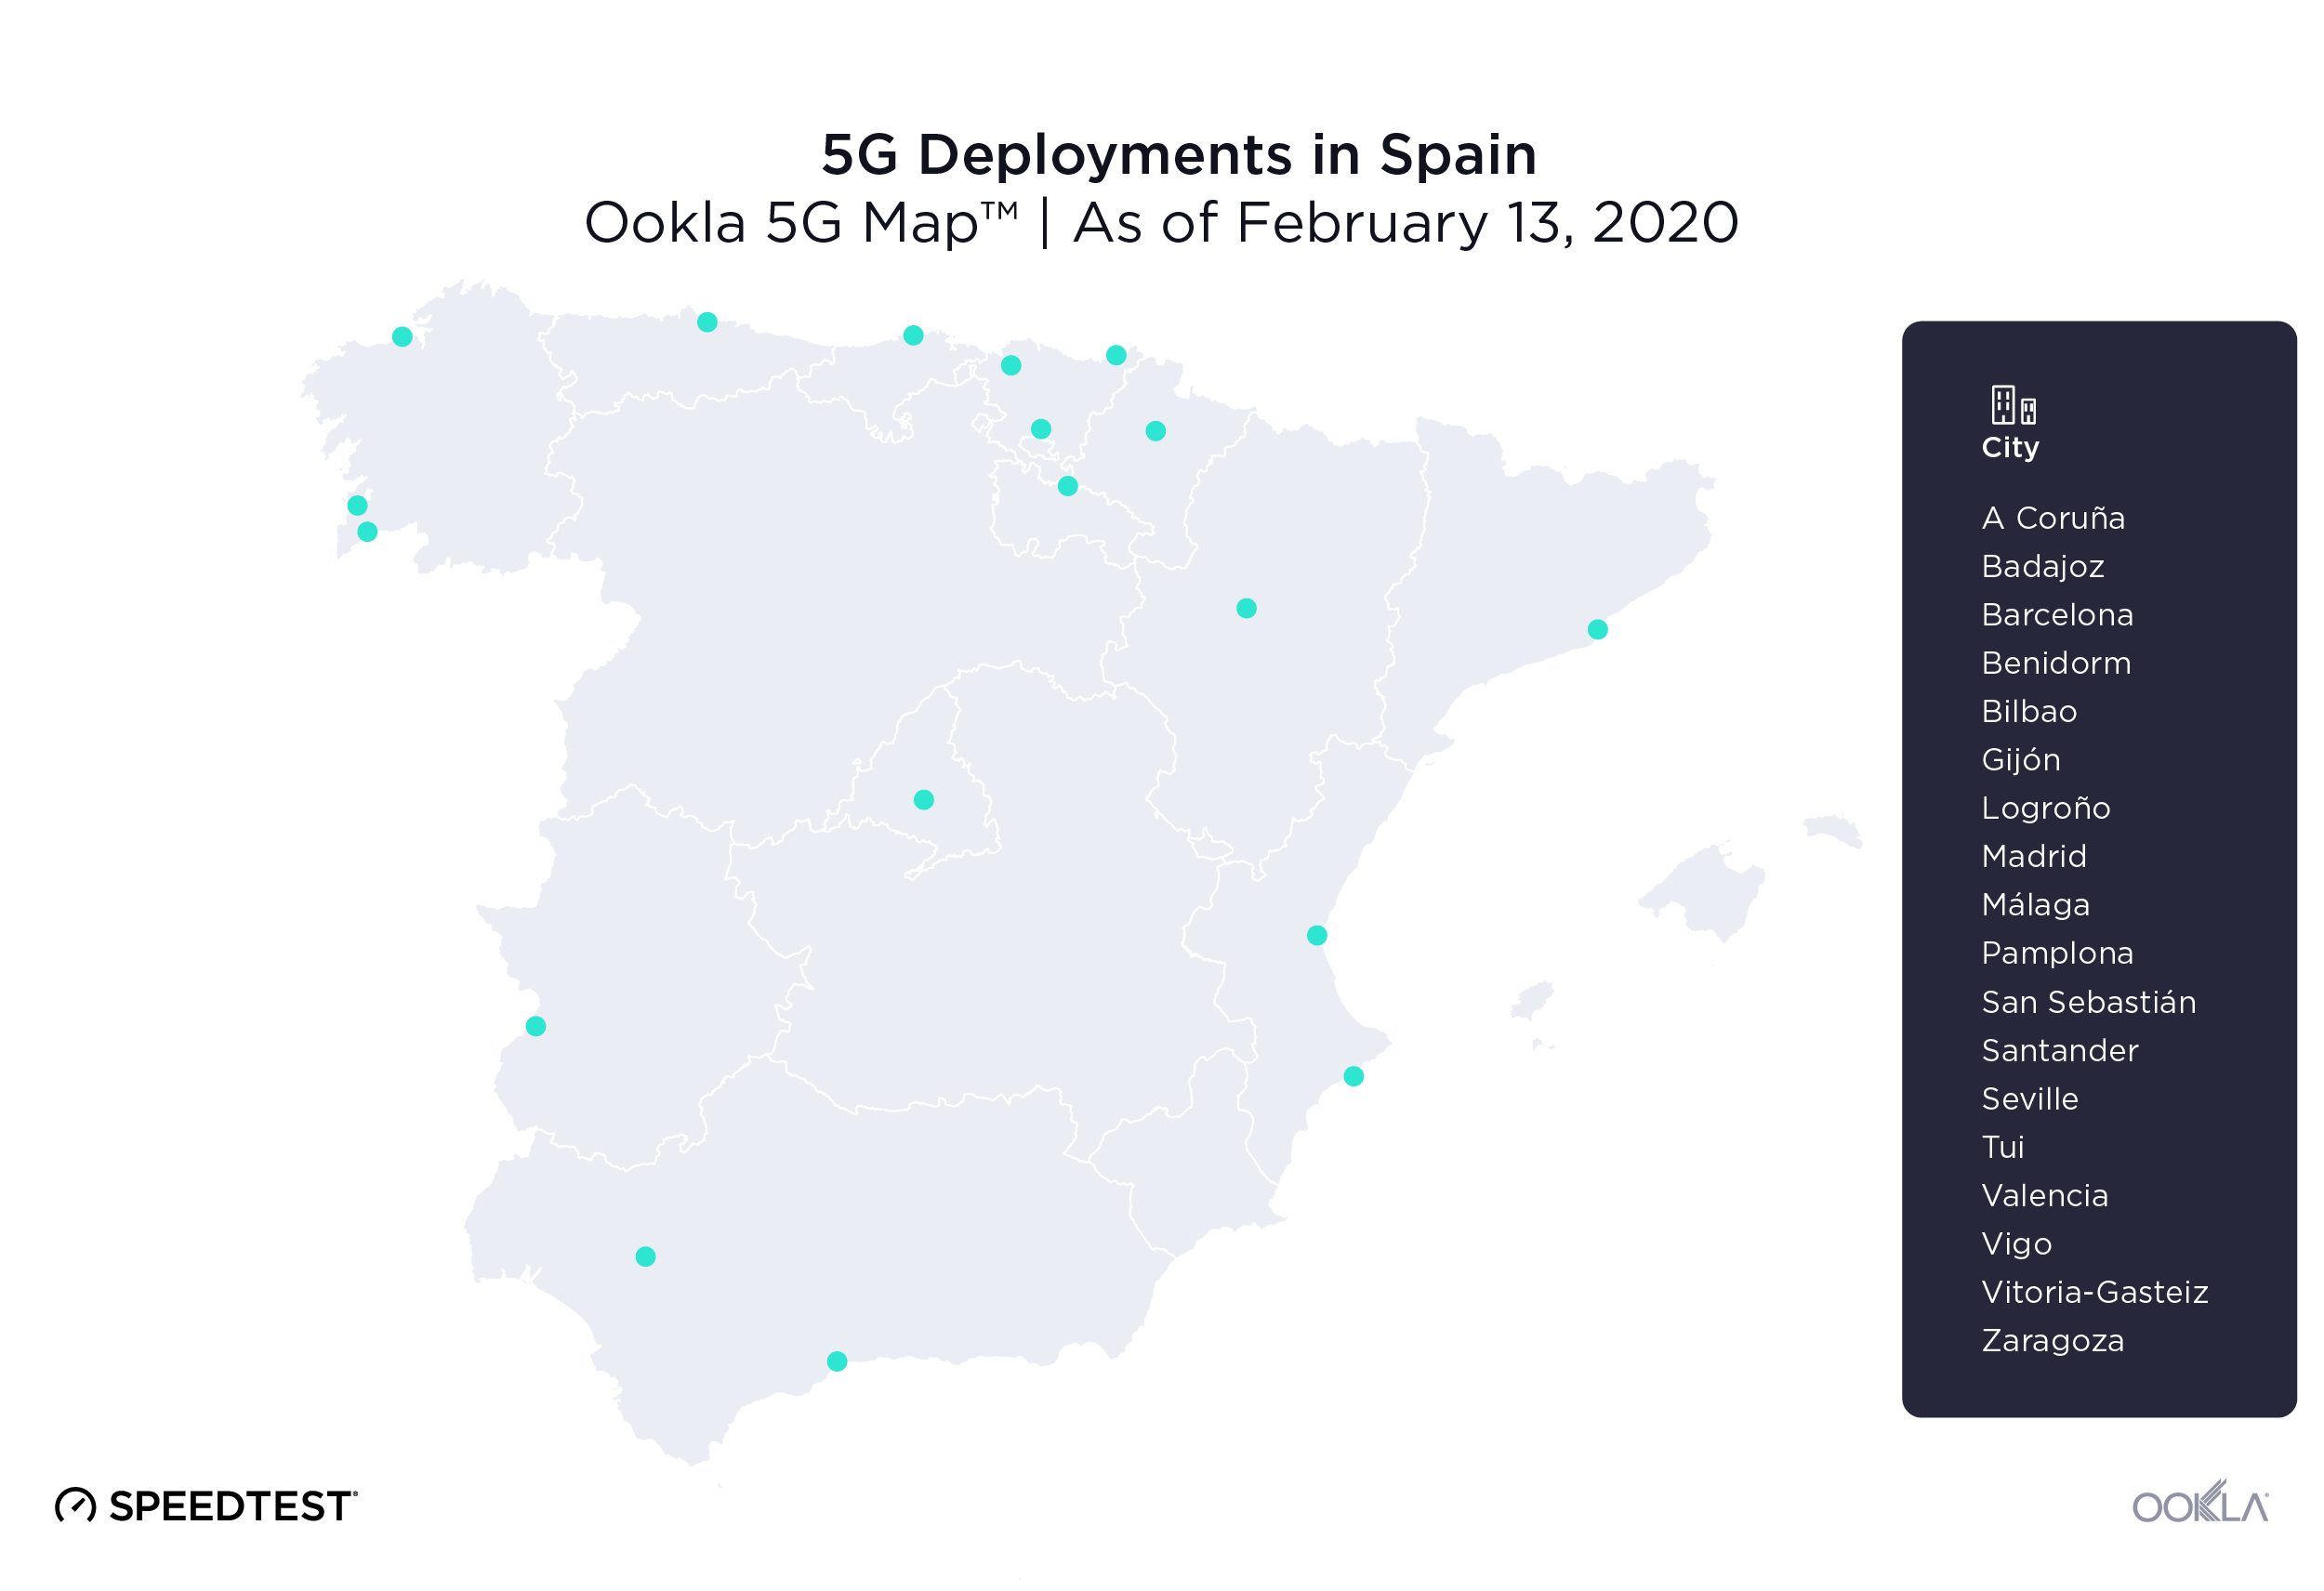
The excitement for 5G is evident in Spain. Vodafone had commercially available 5G deployments in a total of 18 Spanish cities as of February 13, 2020, including Barcelona, Madrid, Valencia, Málaga and Bilbao. Speedtest data reveals the mean download speed on 5G for Spain in Q3-Q4 2019 was 350.68 Mbps — an order of magnitude faster than the national average for mobile download speed — and the mean upload speed over 5G was 31.82 Mbps. Mean latency over 5G in Spain was 27 ms during Q3-Q4 2019.

MÁSMÓVIL was Spain’s fastest fixed broadband provider

Using Speed Score, a metric that combines measures of download and upload speed, to compare top ISPs in Spain during Q3-Q4 2019, we found that MÁSMÓVIL led with a score of 133.75 on fixed broadband. Orange was in second place with 115.25, followed by Vodafone (105.07) and Movistar (103.01).

Fixed Broadband Performance by Provider in Spain
Speedtest Intelligence® | Q3-Q4 2019
Provider Speed ScoreTM
MÁSMÓVIL 133.75
Orange 115.25
Vodafone 105.07
Movistar 103.01

Movistar was Spain’s fastest mobile operator

Movistar had the highest Speed Score among Spain’s mobile operators during Q3-Q4 2019 at 37.76. Orange was second at 33.02, Vodafone third at 26.34 and Yoigo fourth at 22.43. As we will discuss below, overall speed performance can be impacted by the speed caps and tariff plans that are in place in Spain.

Mobile Performance by Operator in Spain
Speedtest Intelligence® | Q3-Q4 2019
Provider Speed ScoreTM
Movistar 37.76
Orange 33.02
Vodafone 26.34
Yoigo 22.43

Speed capping affects overall performance

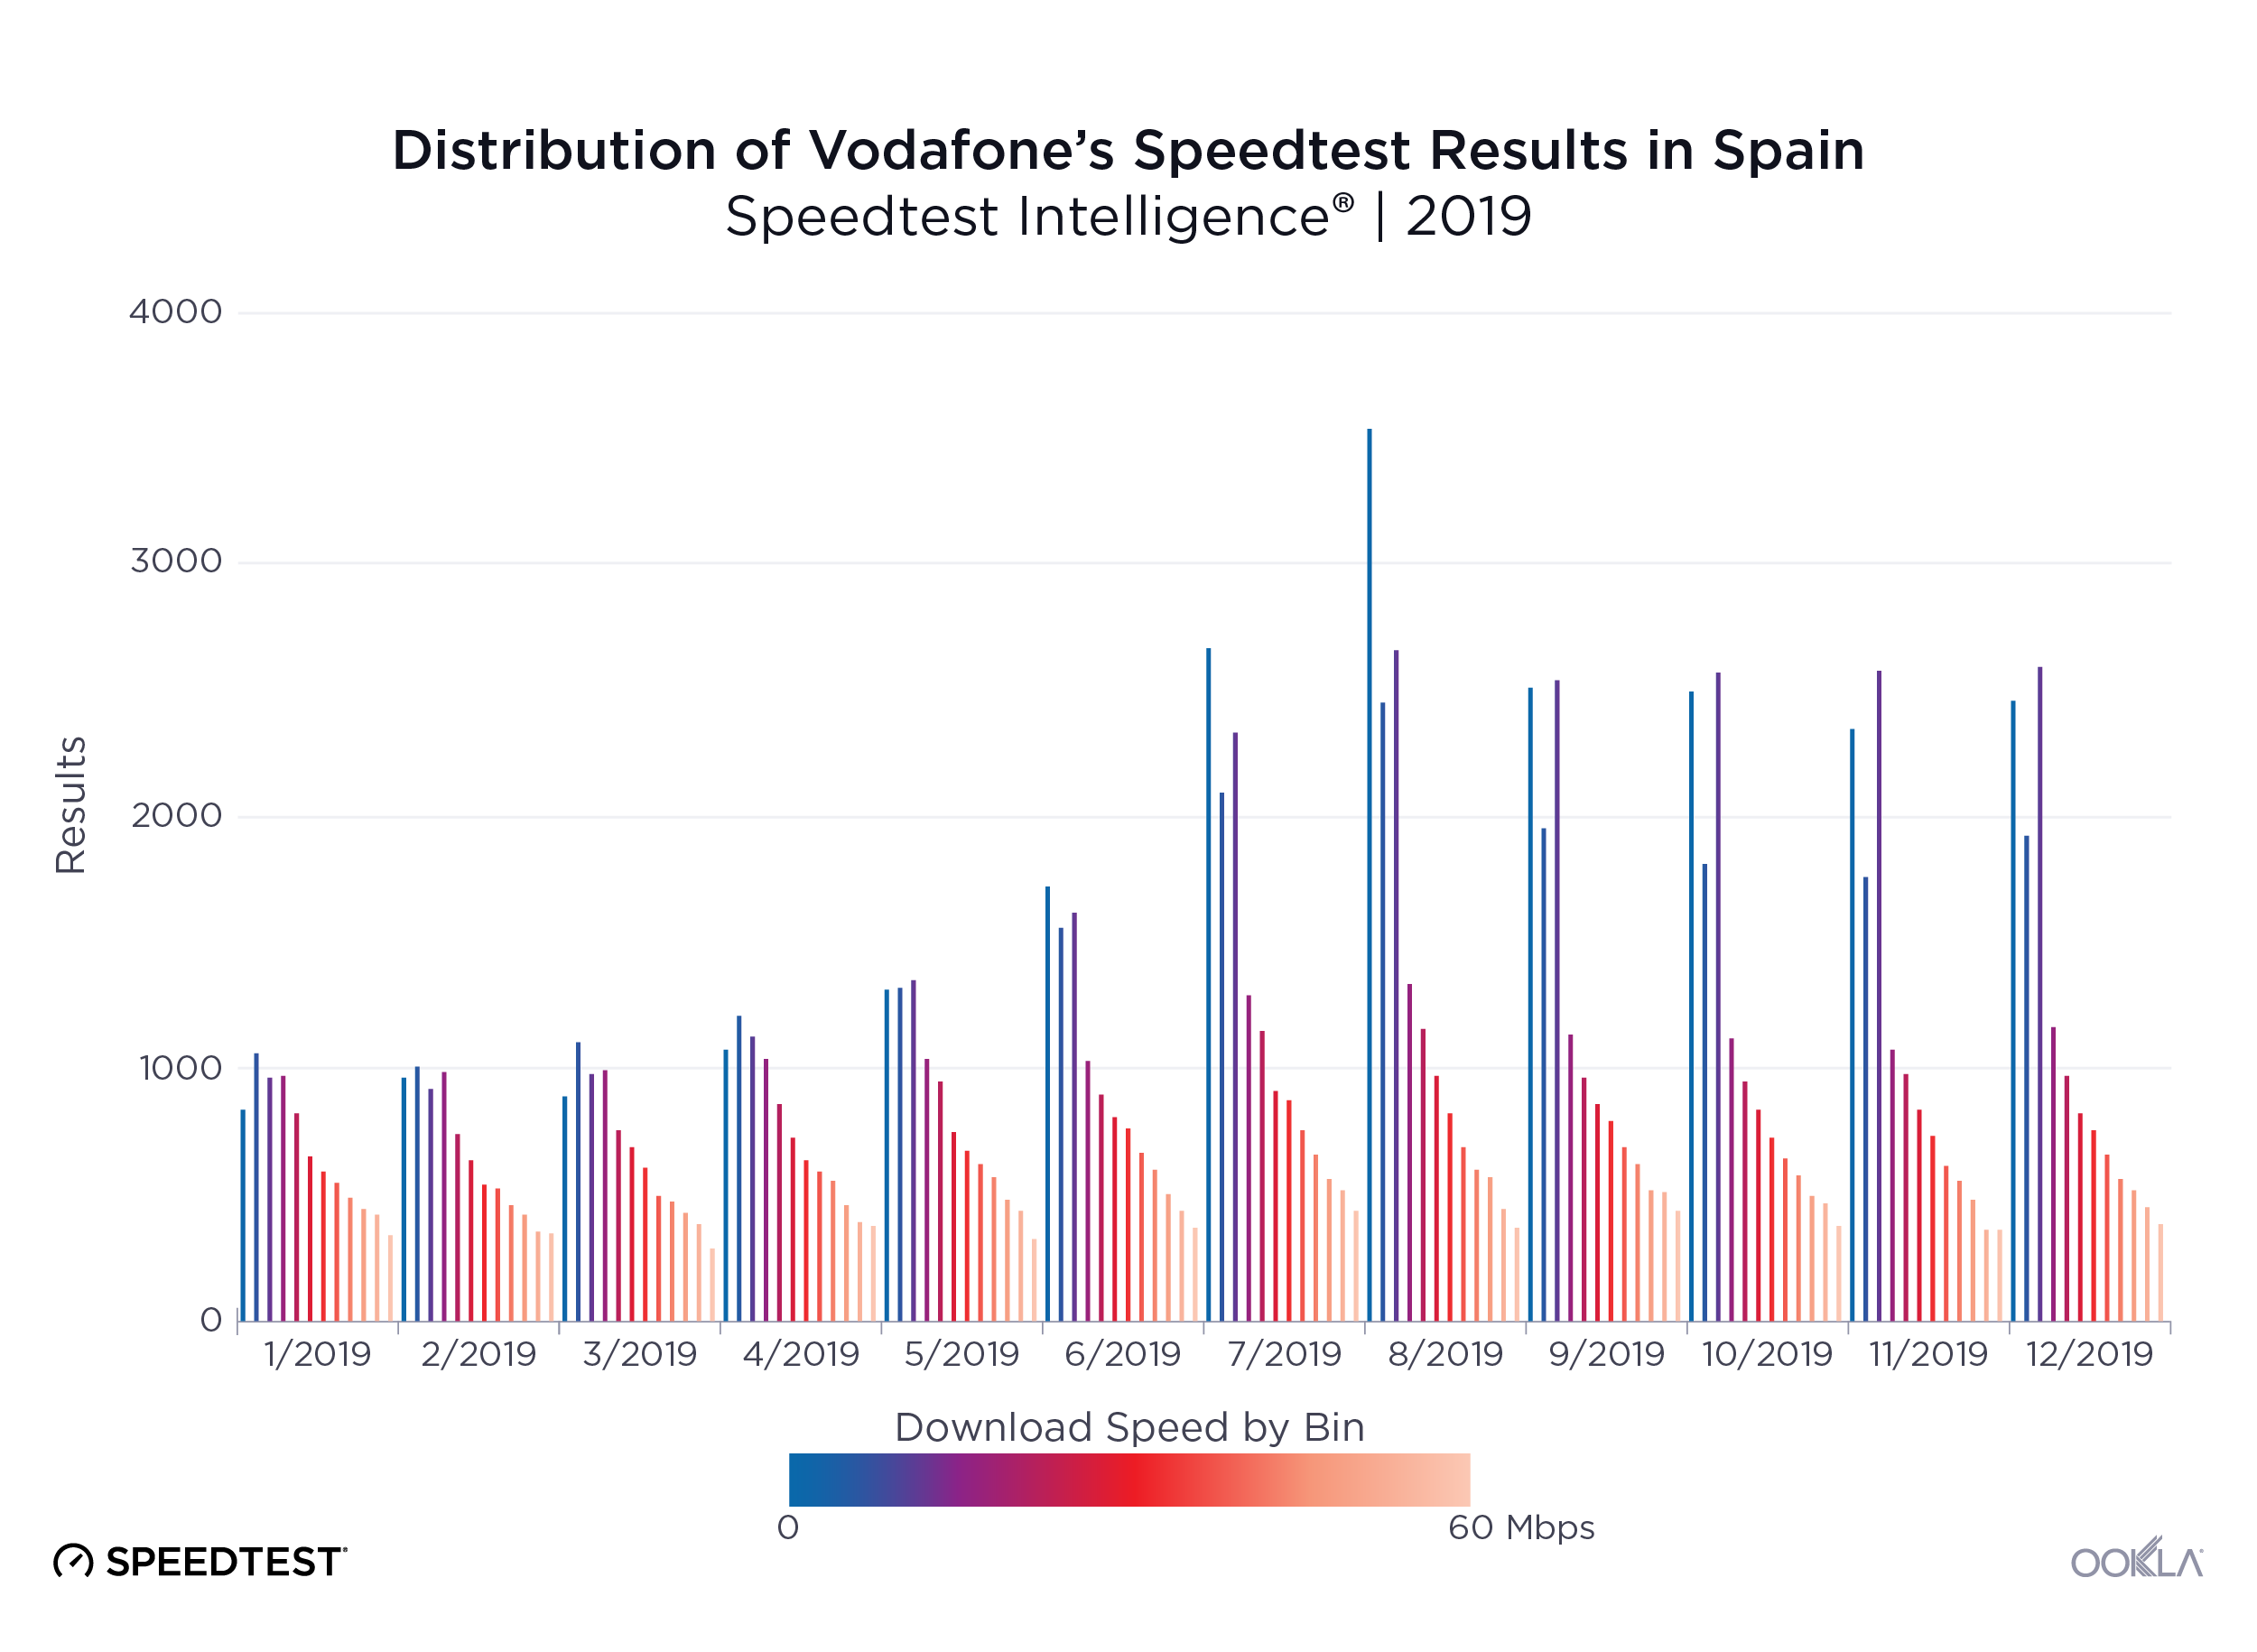
Speed capping, a limit of service imposed onto an internet connection by an operator, allows operators to also offer plans that focus on affordability rather than maximum performance.
Ookla_Distribution-Speedtest-Results_Vodafone_Spain_0220-3_en
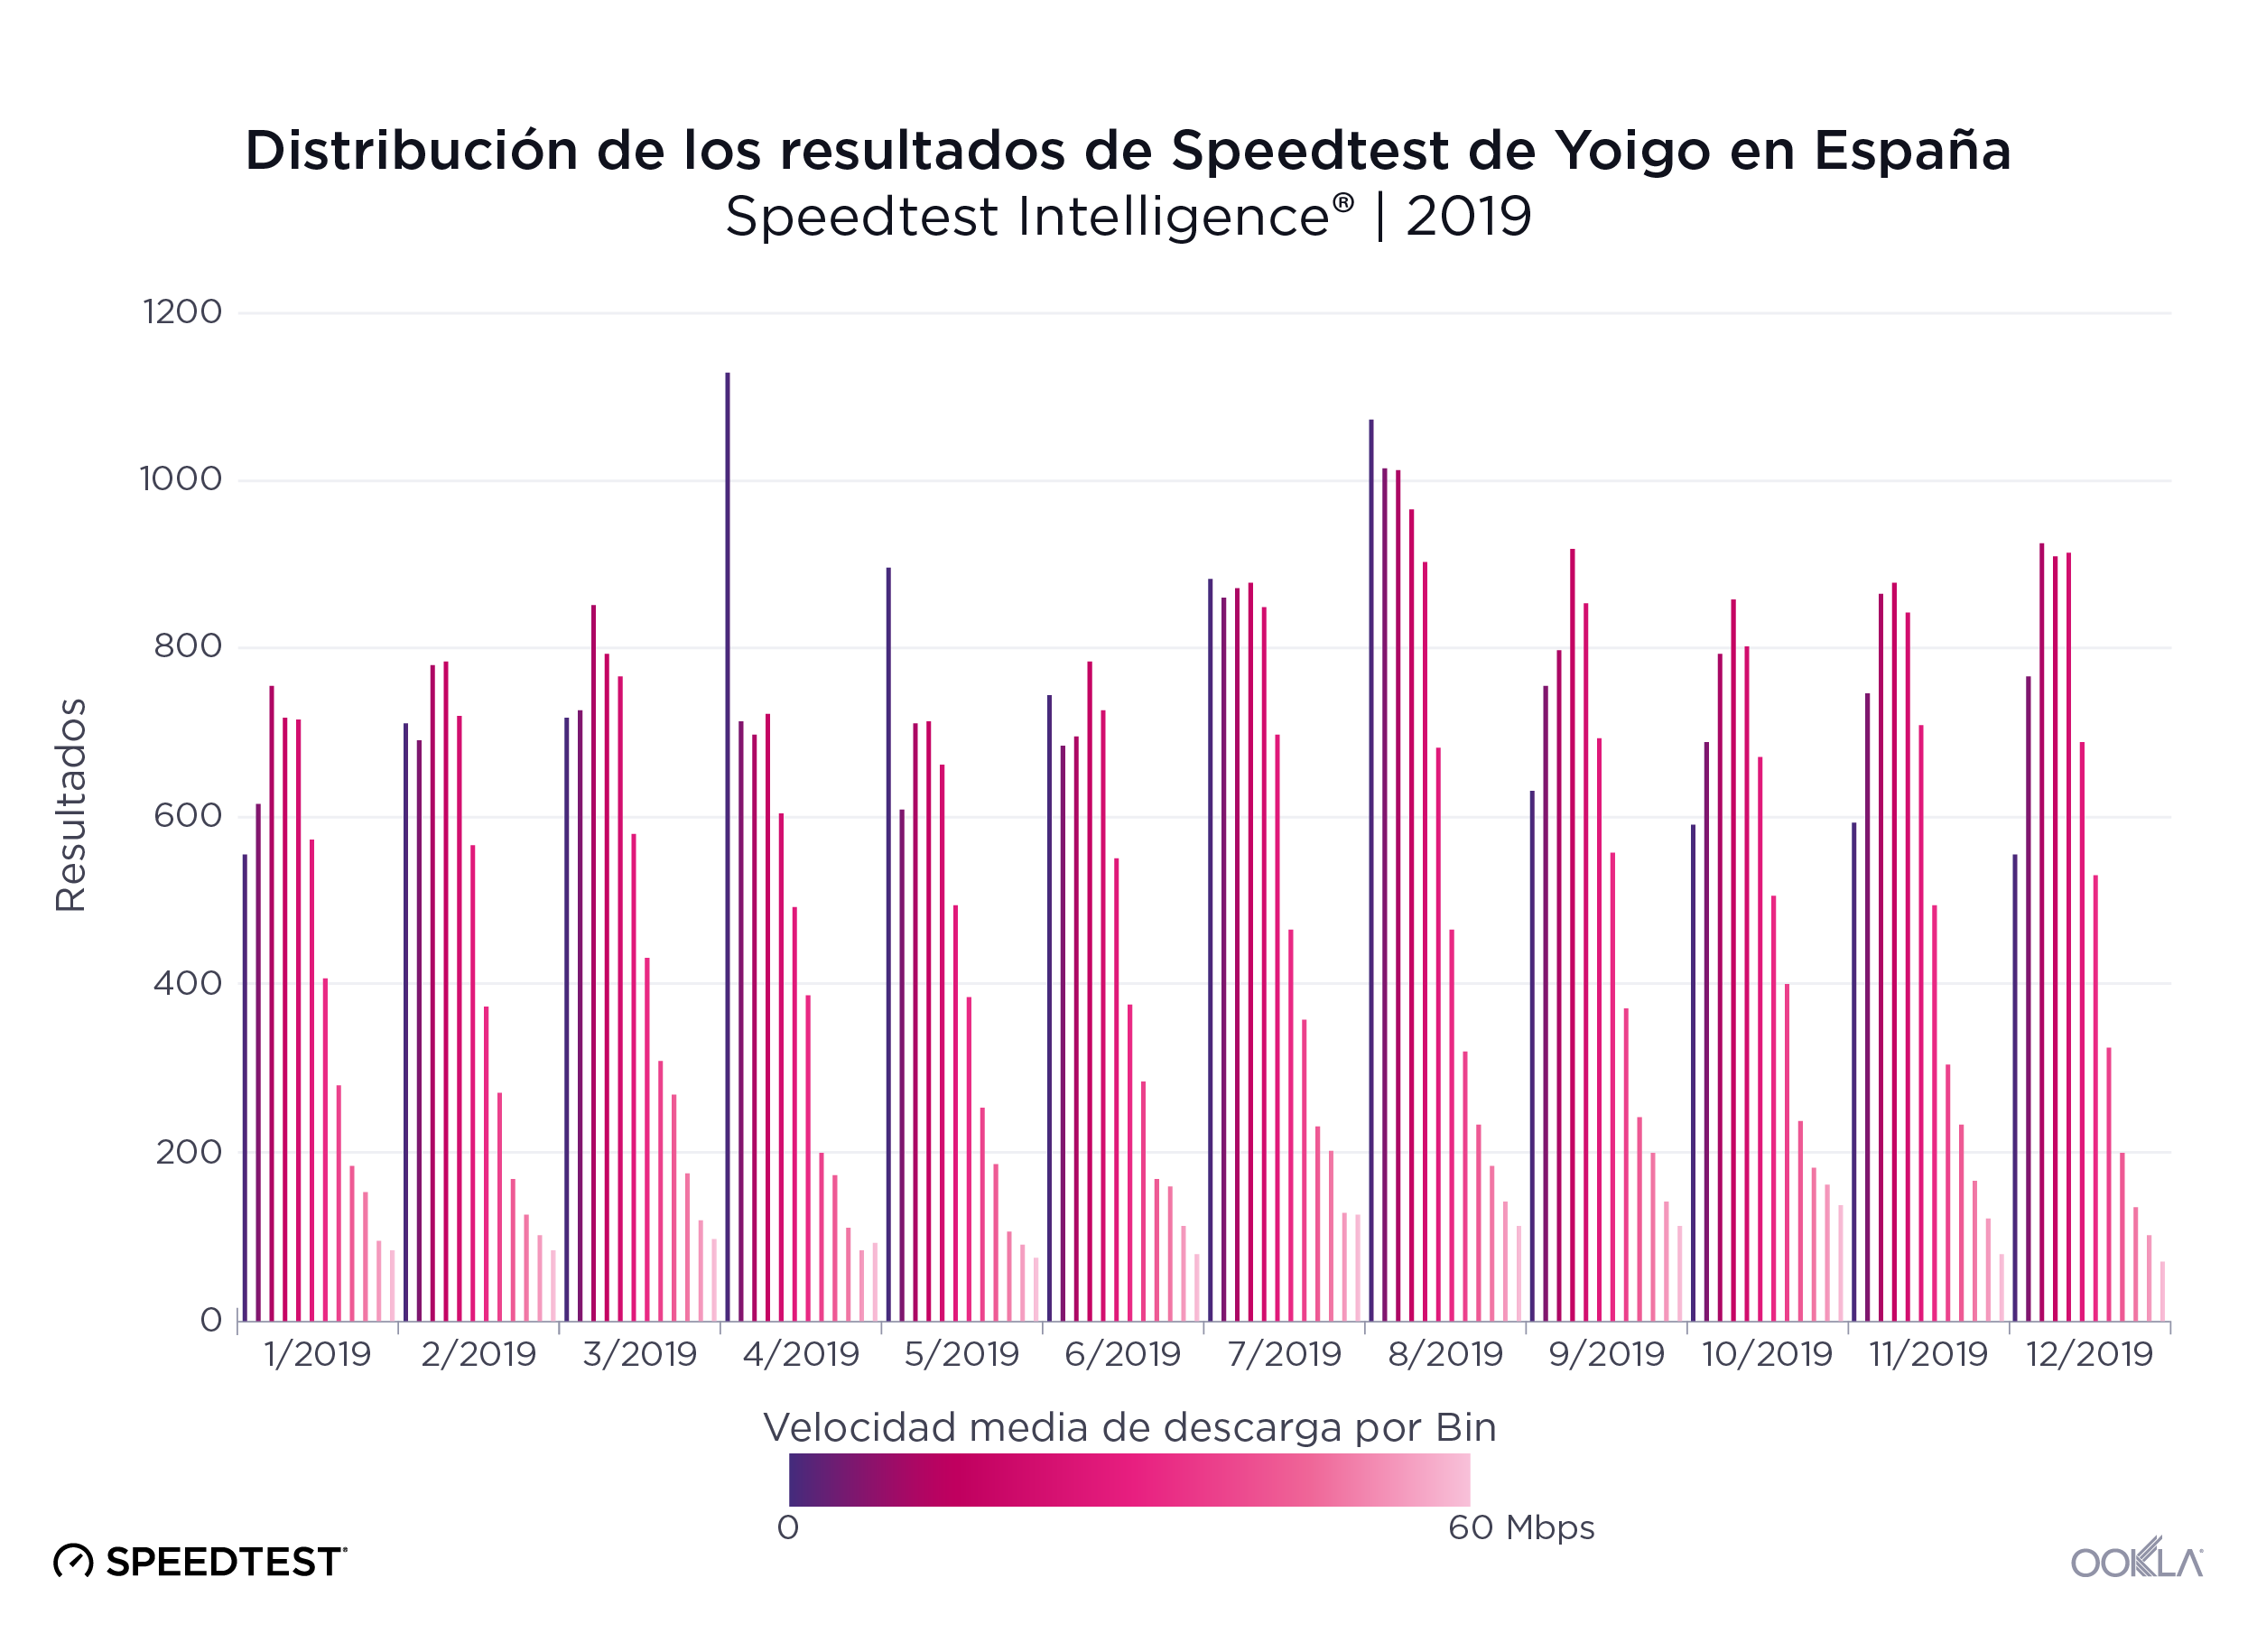
The chart above shows how Vodafone’s introduction of subscription plans that use speed capping affected the distribution of download speeds. While those plans (with caps at 2 Mbps and 10 Mbps, respectively) were available starting in April, we don’t see the true effect on average speeds until May and June when the 0-5 Mbps and 10-15 Mbps buckets start to spike. We’ve only showed bins up to 60 Mbps to make this and the following graphs more legible.

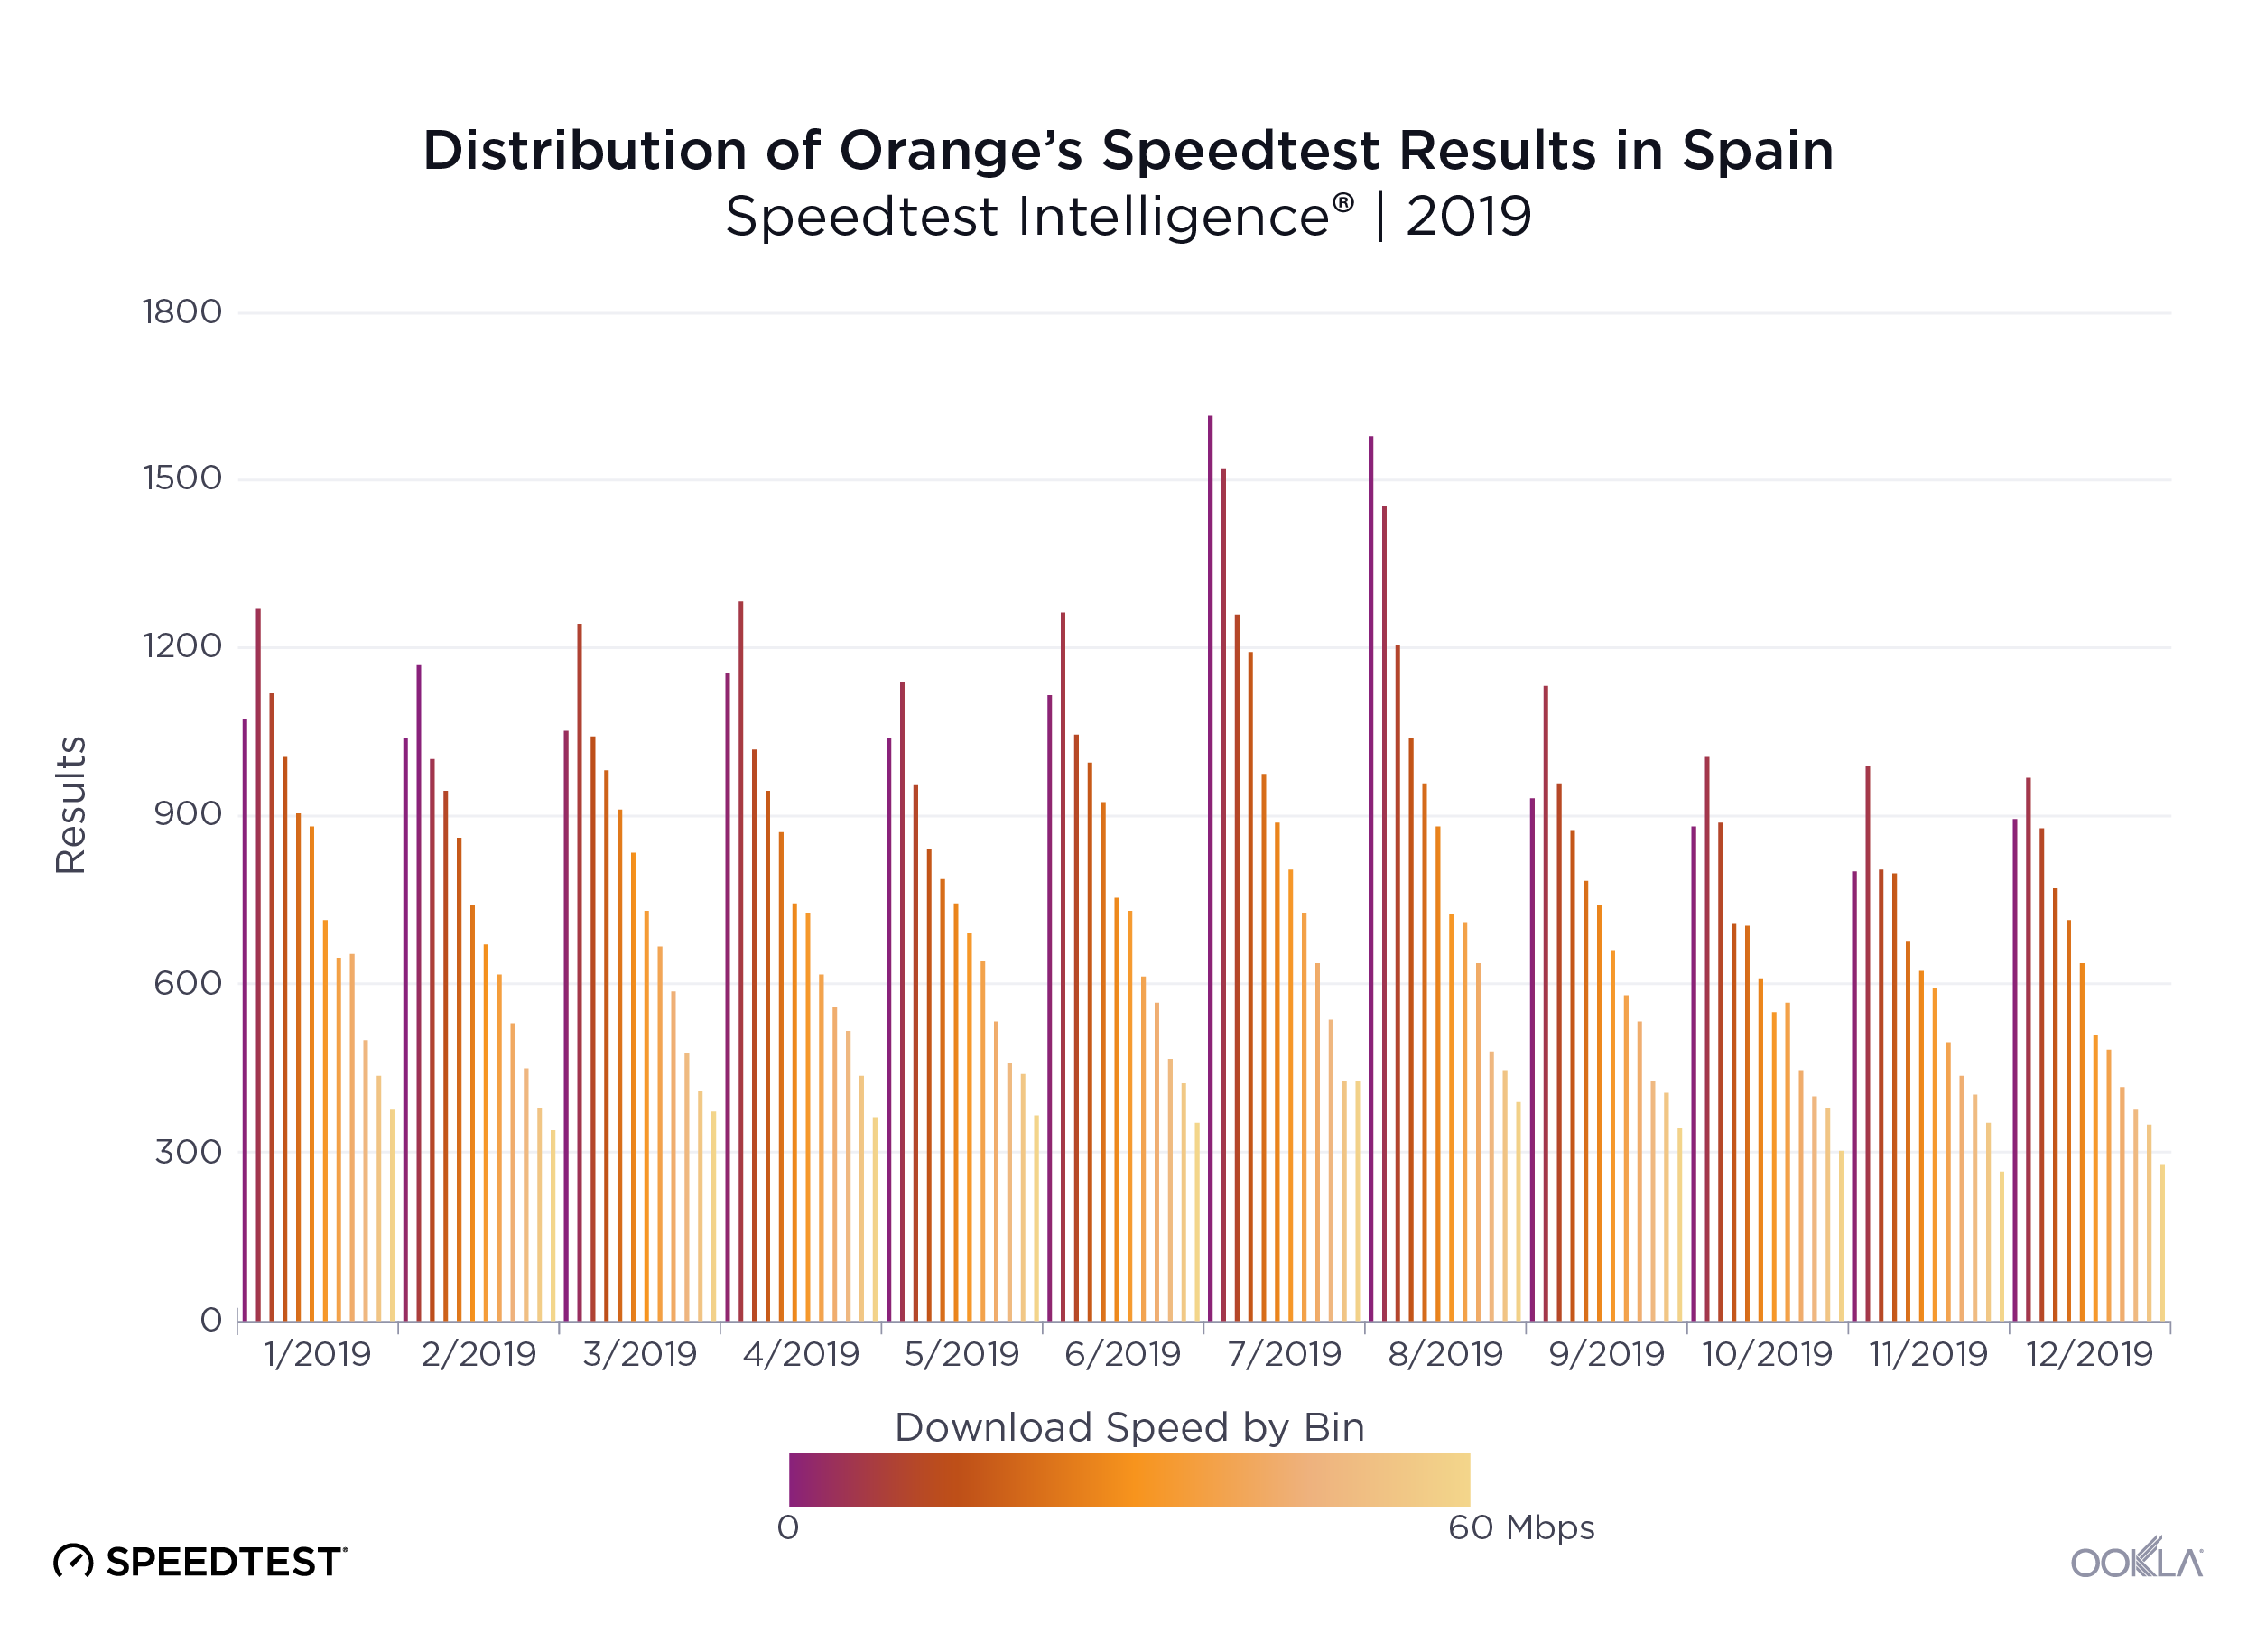
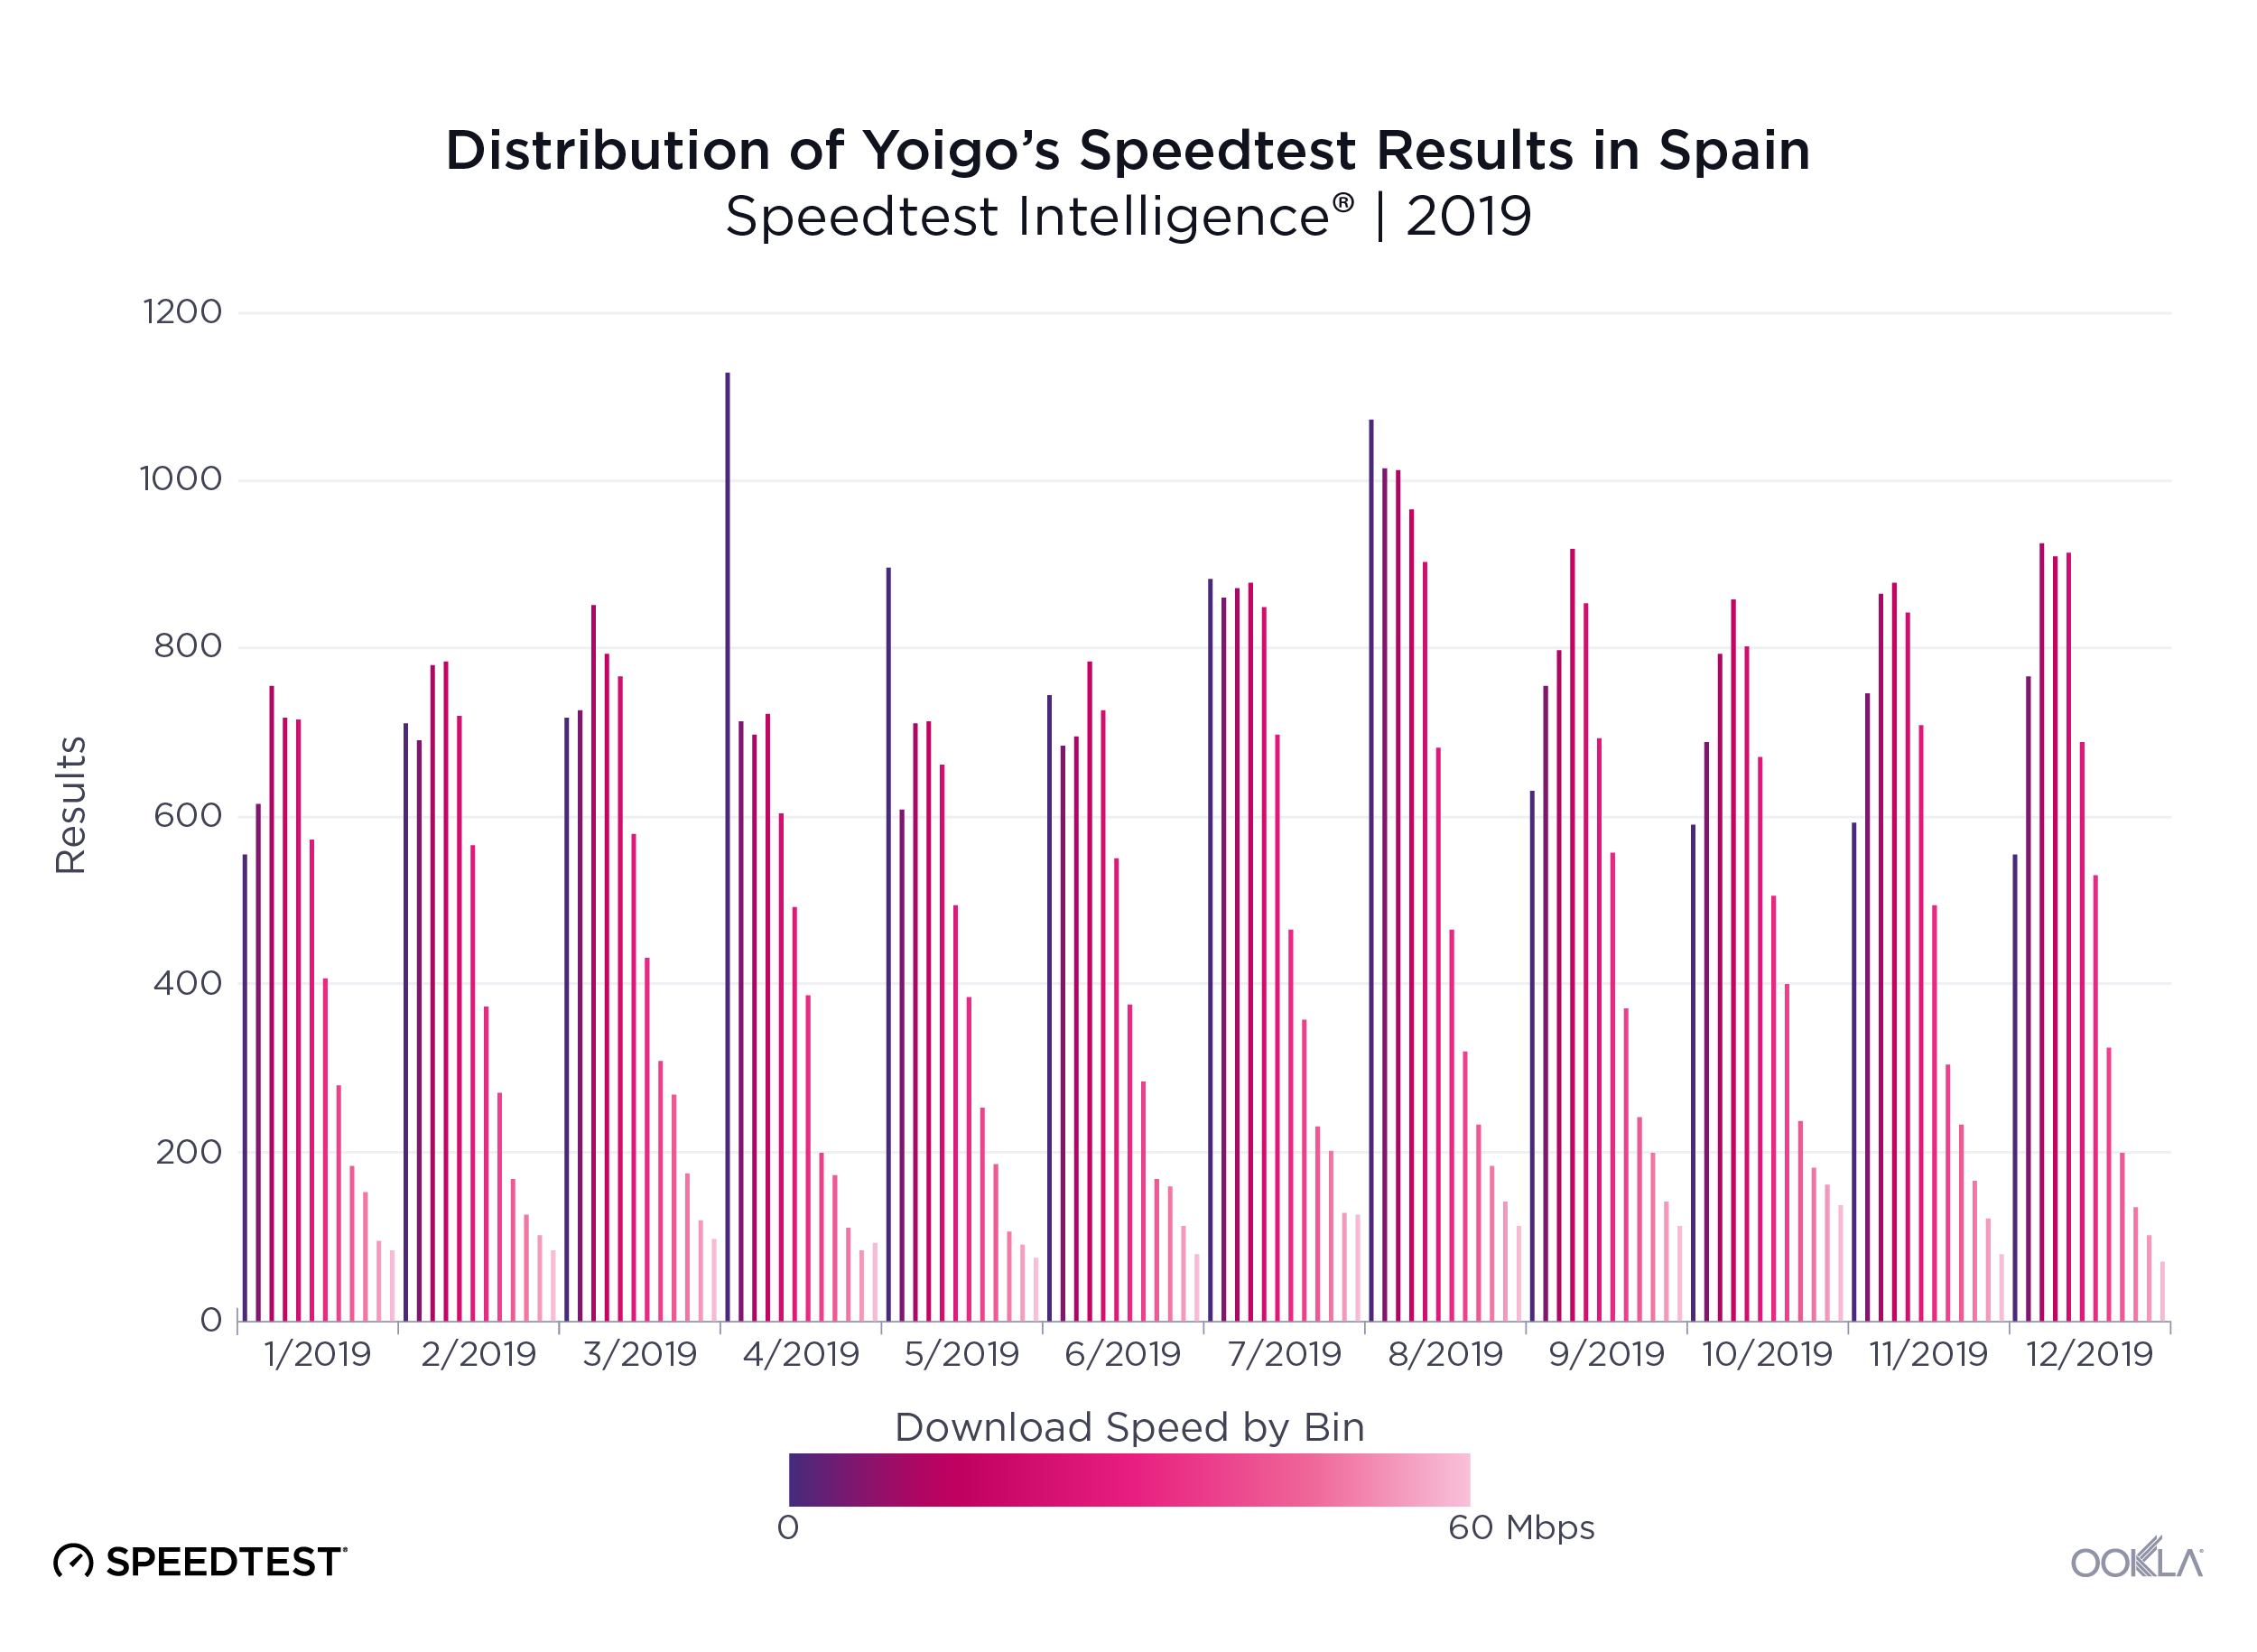
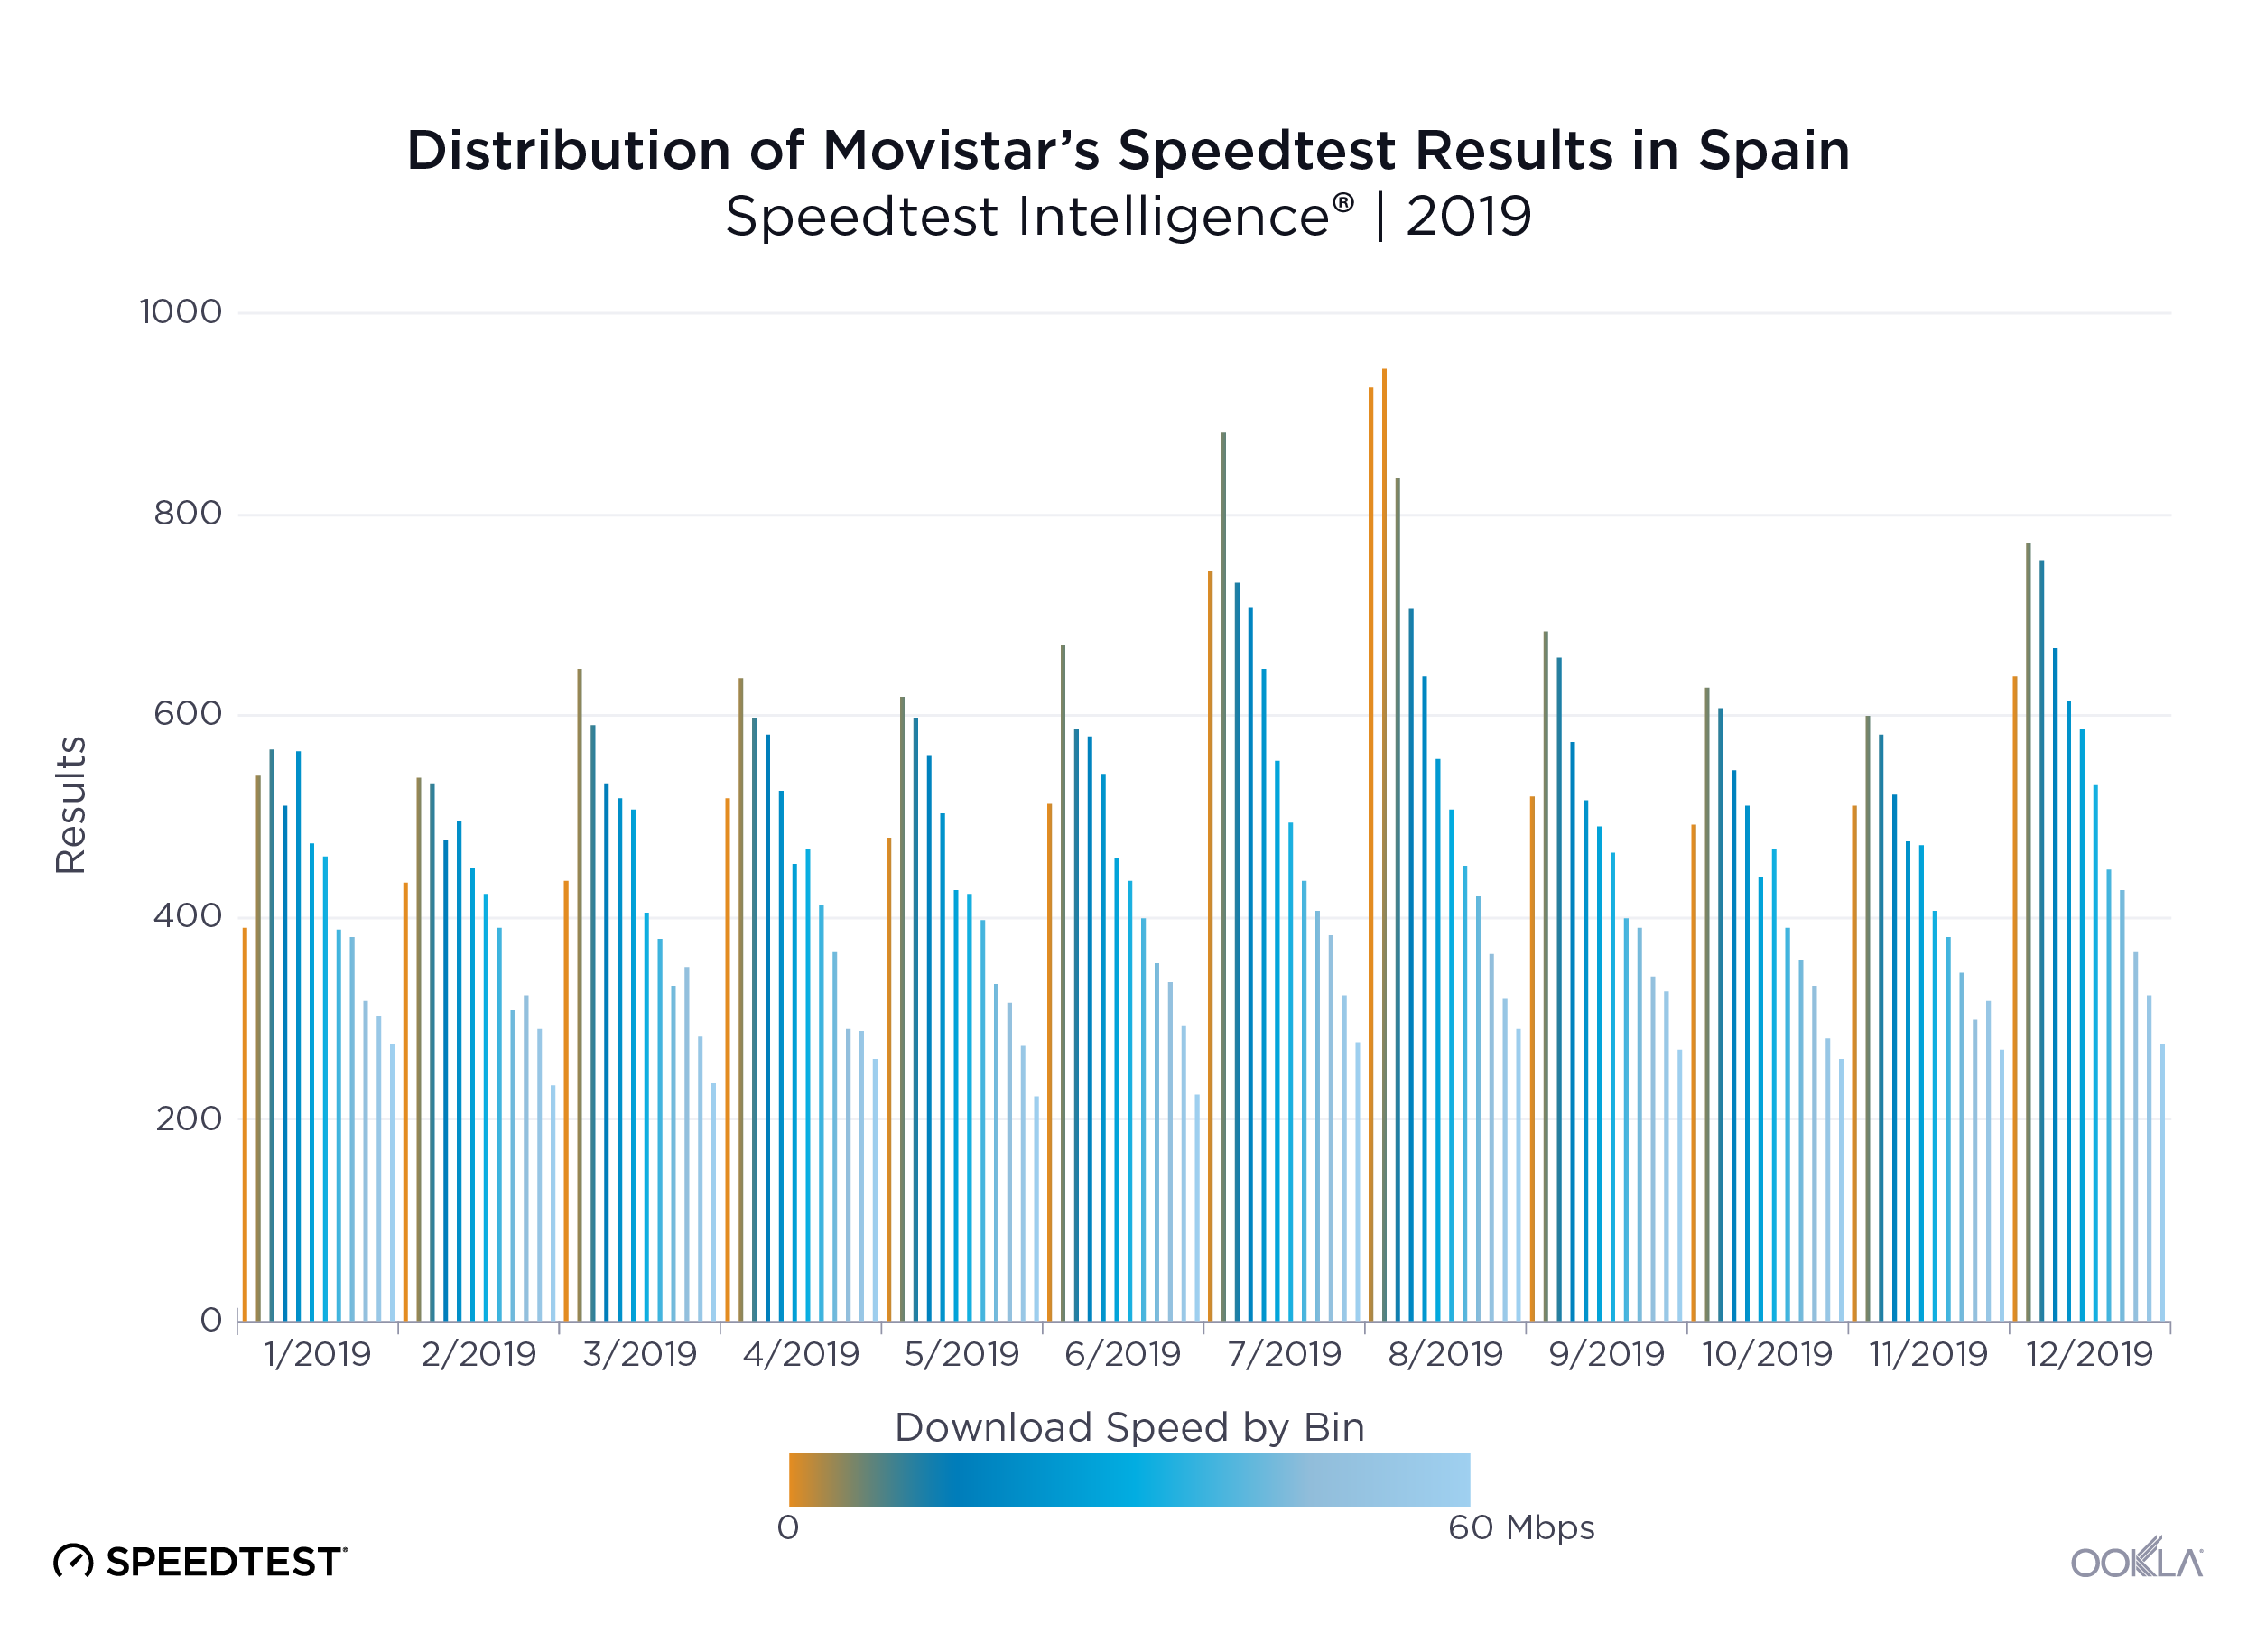
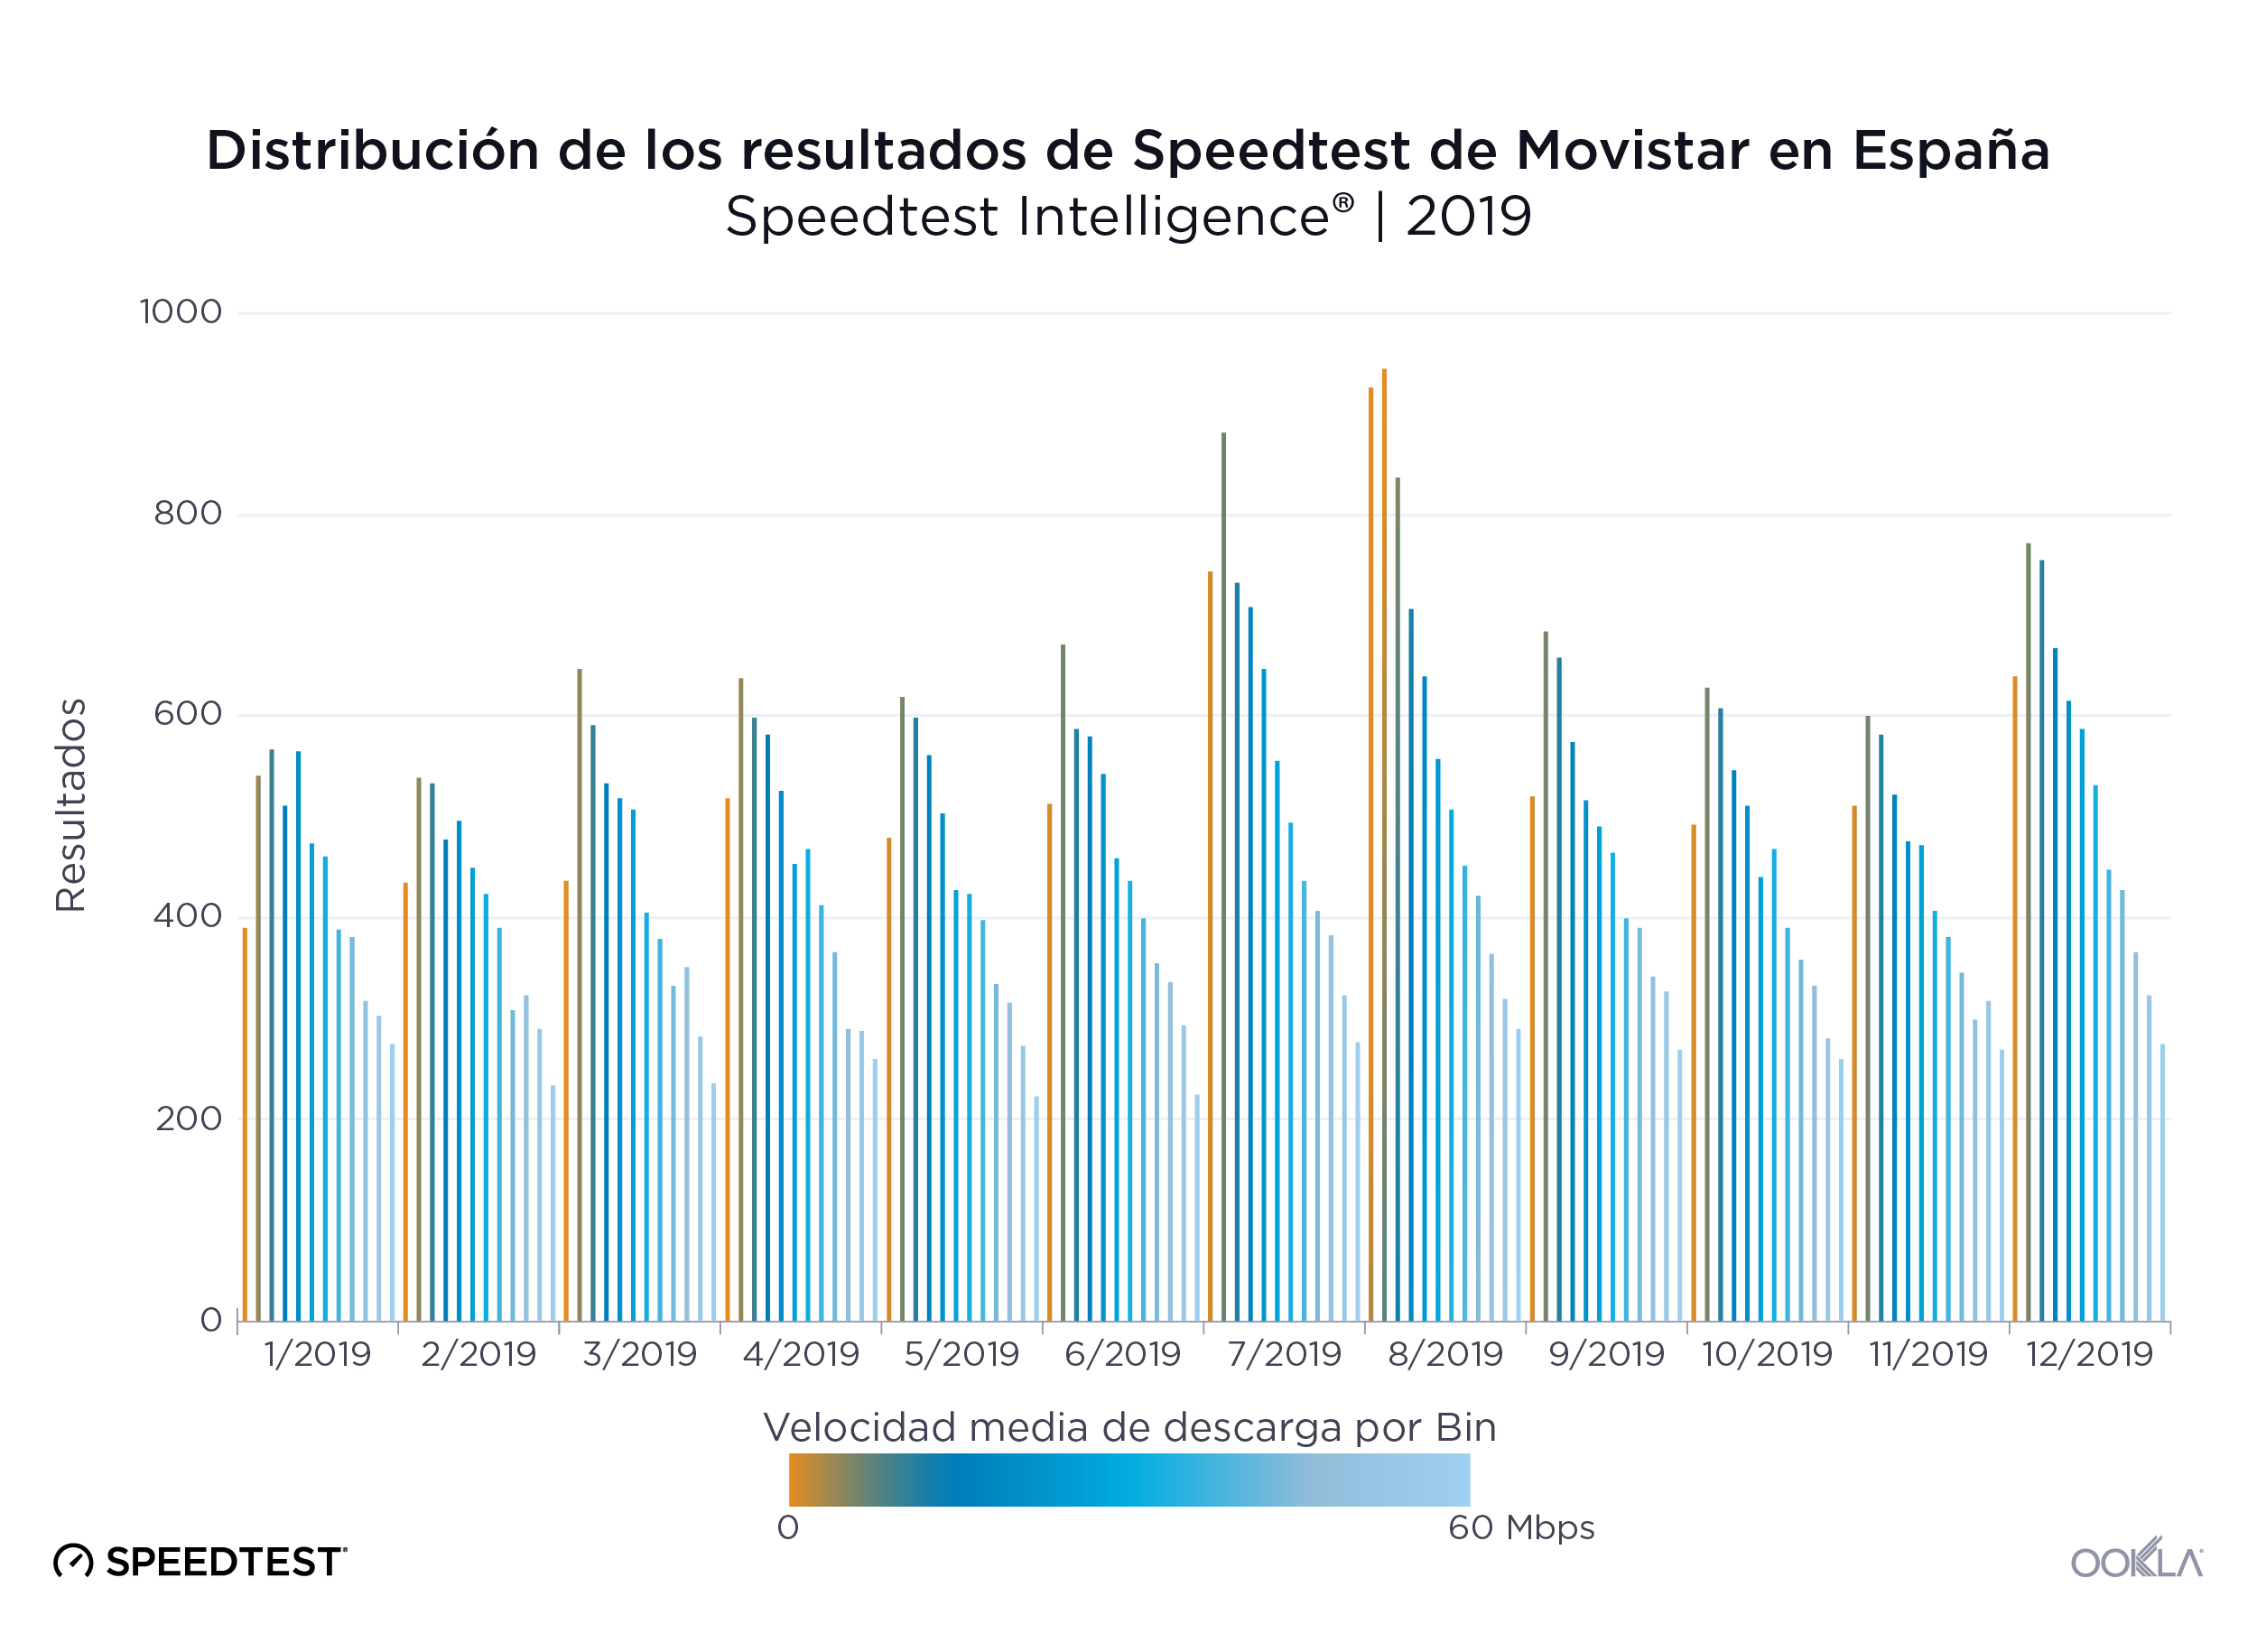
In contrast, we see more even distributions of download speeds among all other mobile operators in Spain.
Ookla_Distribution-Speedtest-Results_Movistar_Spain_0220-3_en
Ookla_Distribution-Speedtest-Results_Orange_Spain_0220-3_en
Ookla_Distribution-Speedtest-Results_Yoigo_Spain_0220-3_en

MÁSMÓVIL and Movistar (mobile) offer the most consistent speeds

Speed is important, but if those speeds are inconsistent, it becomes difficult for users to reliably use their devices to stream HD video, browse the web or use online gaming. We used Speedtest data to calculate each top provider’s APS (Acceptable Performance Score) in Spain during Q3-Q4 2019.

APS for fixed broadband measures the percentage of samples that equal or exceed a download speed of 25 Mbps and also equal or exceed an upload speed of 3 Mbps. MÁSMÓVIL provided the most consistent experience in Spain on fixed broadband in Q3-Q4 2019 with an APS of 81.6%. Movistar was in last place with an APS of 61.9%.

Speed Consistency by Provider on Fixed Broadband
Speedtest Intelligence® | Q3-Q4 2019
Provider APS
MÁSMÓVIL 81.6%
Orange 75.1%
Vodafone 73.5%
Movistar 61.9%

APS on mobile measures the percentage of samples that equal or exceed a download speed of 5 Mbps and also equal or exceed an upload speed of 1 Mbps. Movistar took the top spot for consistency on mobile broadband with an APS of 88.9%. Vodafone had the lowest consistency score with an APS of 79.8%.

Speed Consistency by Operator on Mobile
Speedtest Intelligence® | Q3-Q4 2019
Provider APS
Movistar 88.9%
Orange 84.3%
Yoigo 82.6%
Vodafone 79.8%

Madrid led fixed and mobile broadband speeds
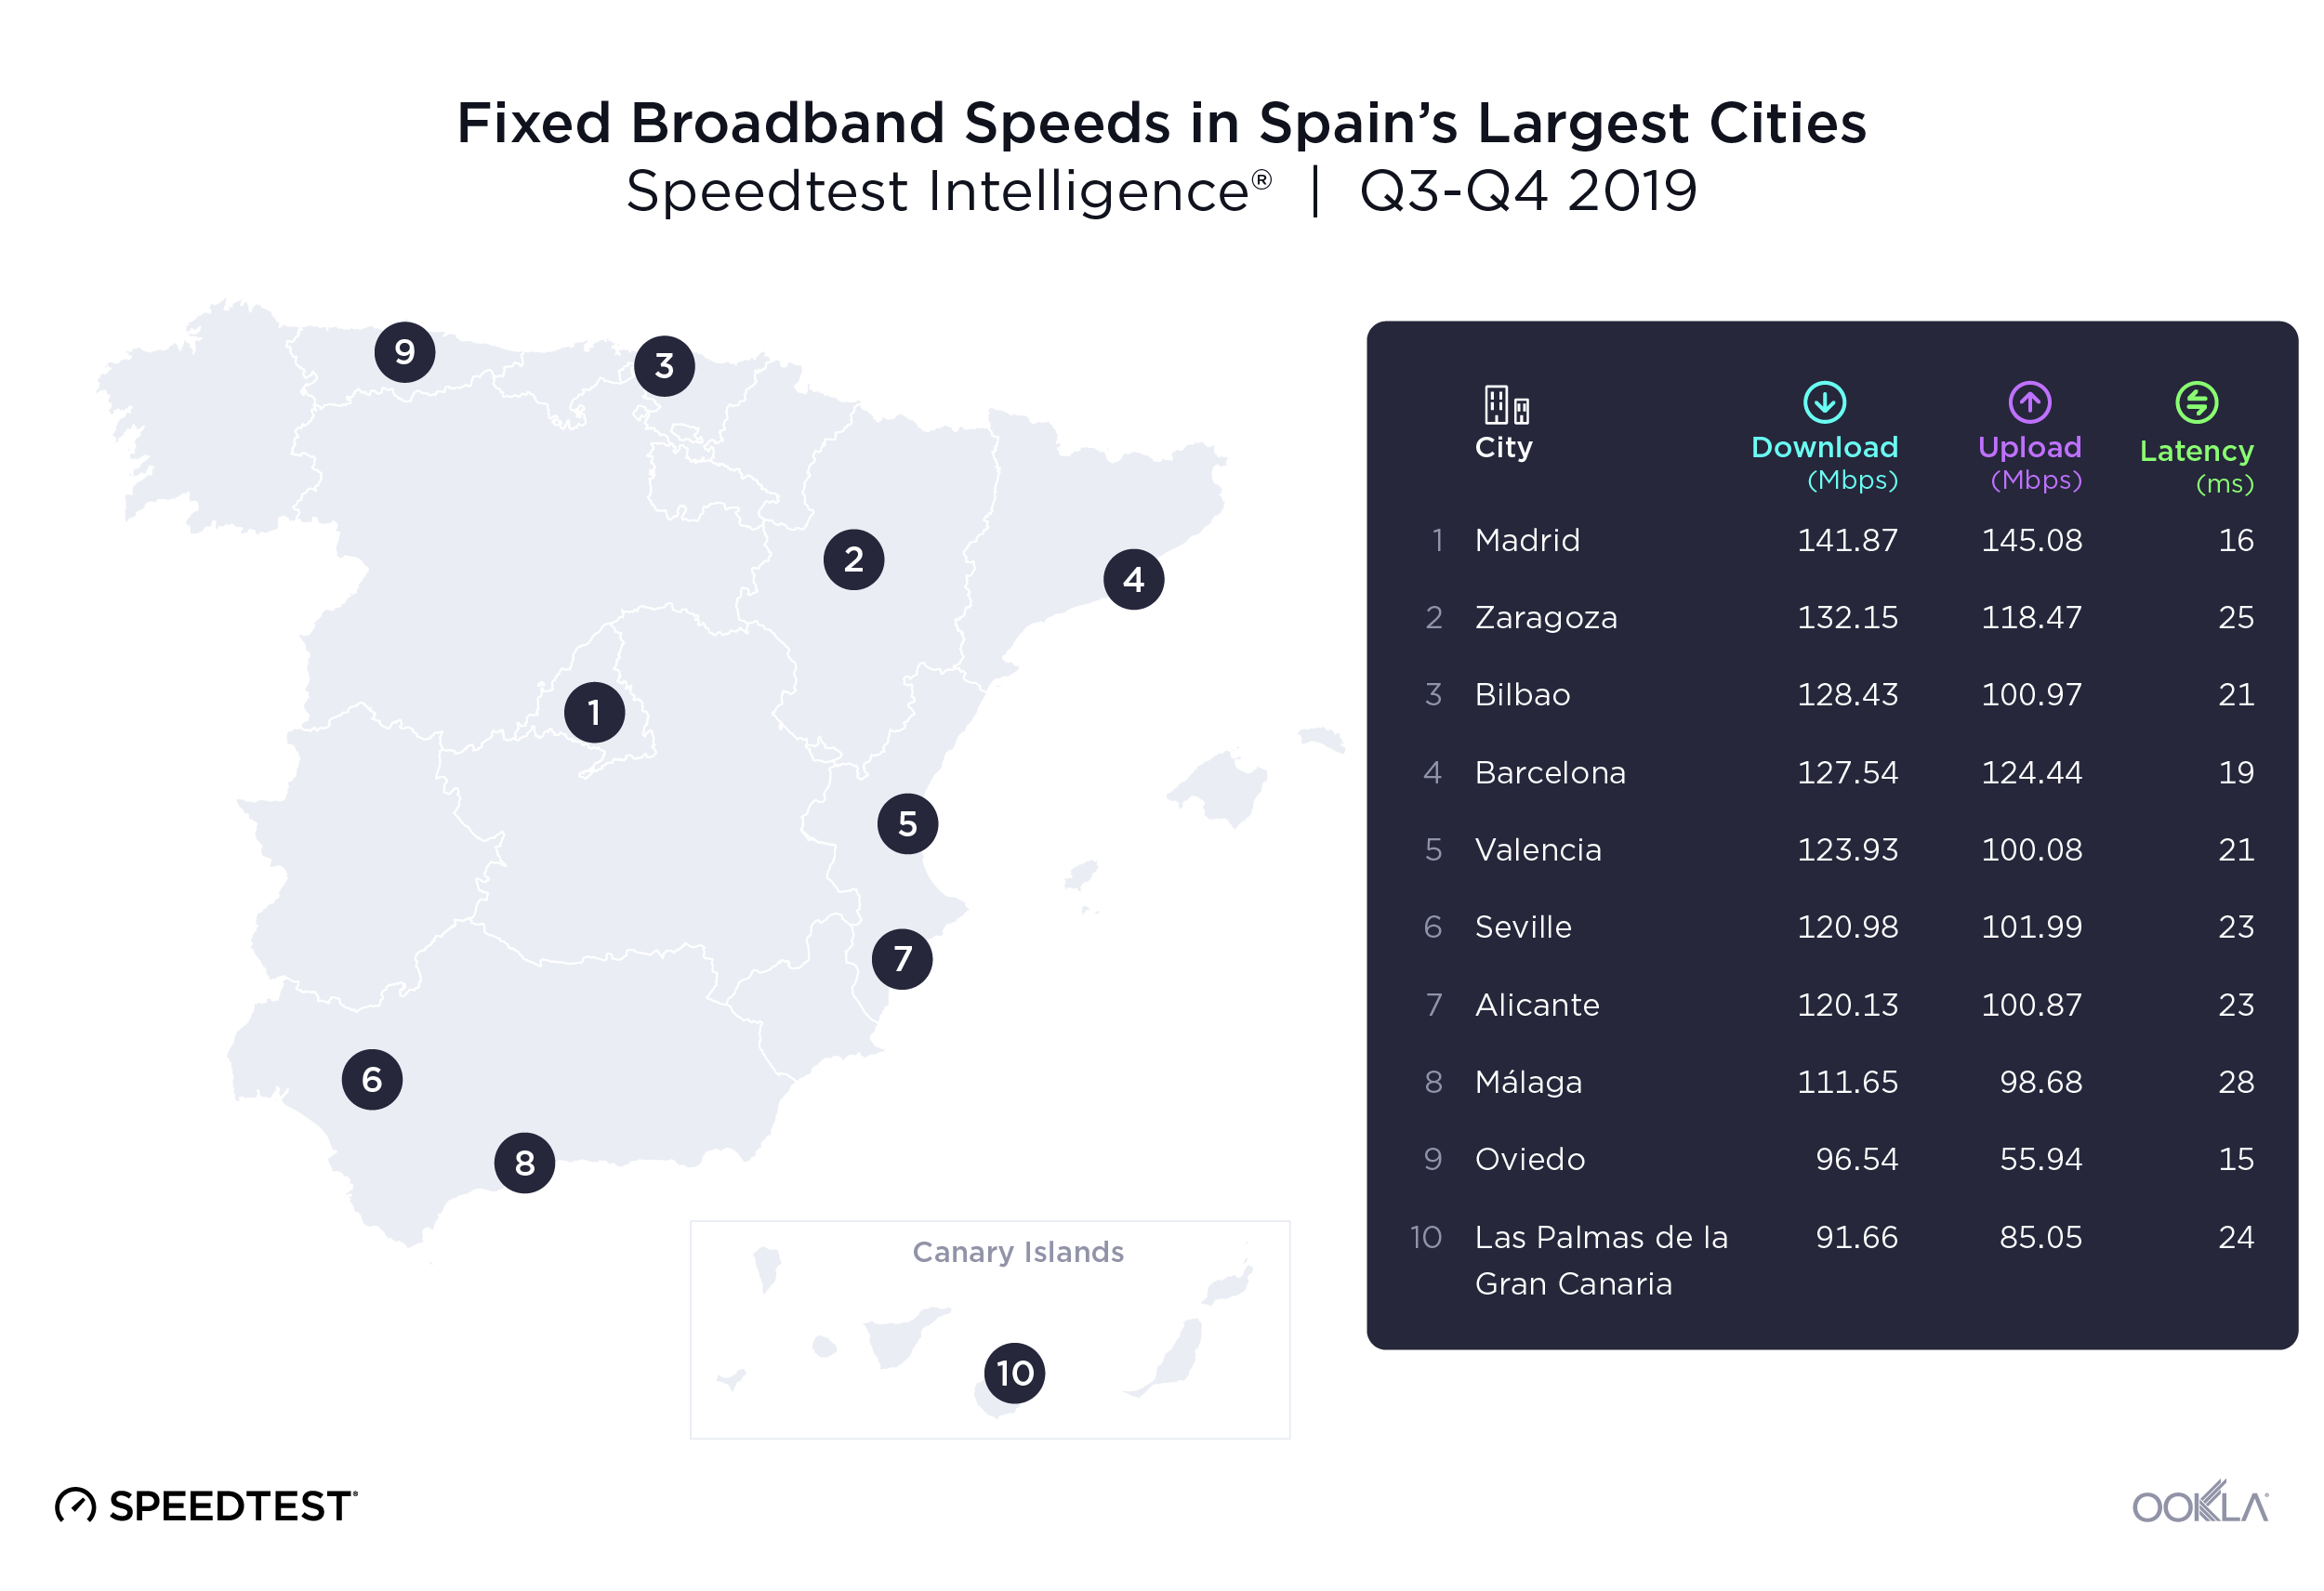
Ookla_Fixed-Broadband-Speeds_Spain_0220-1
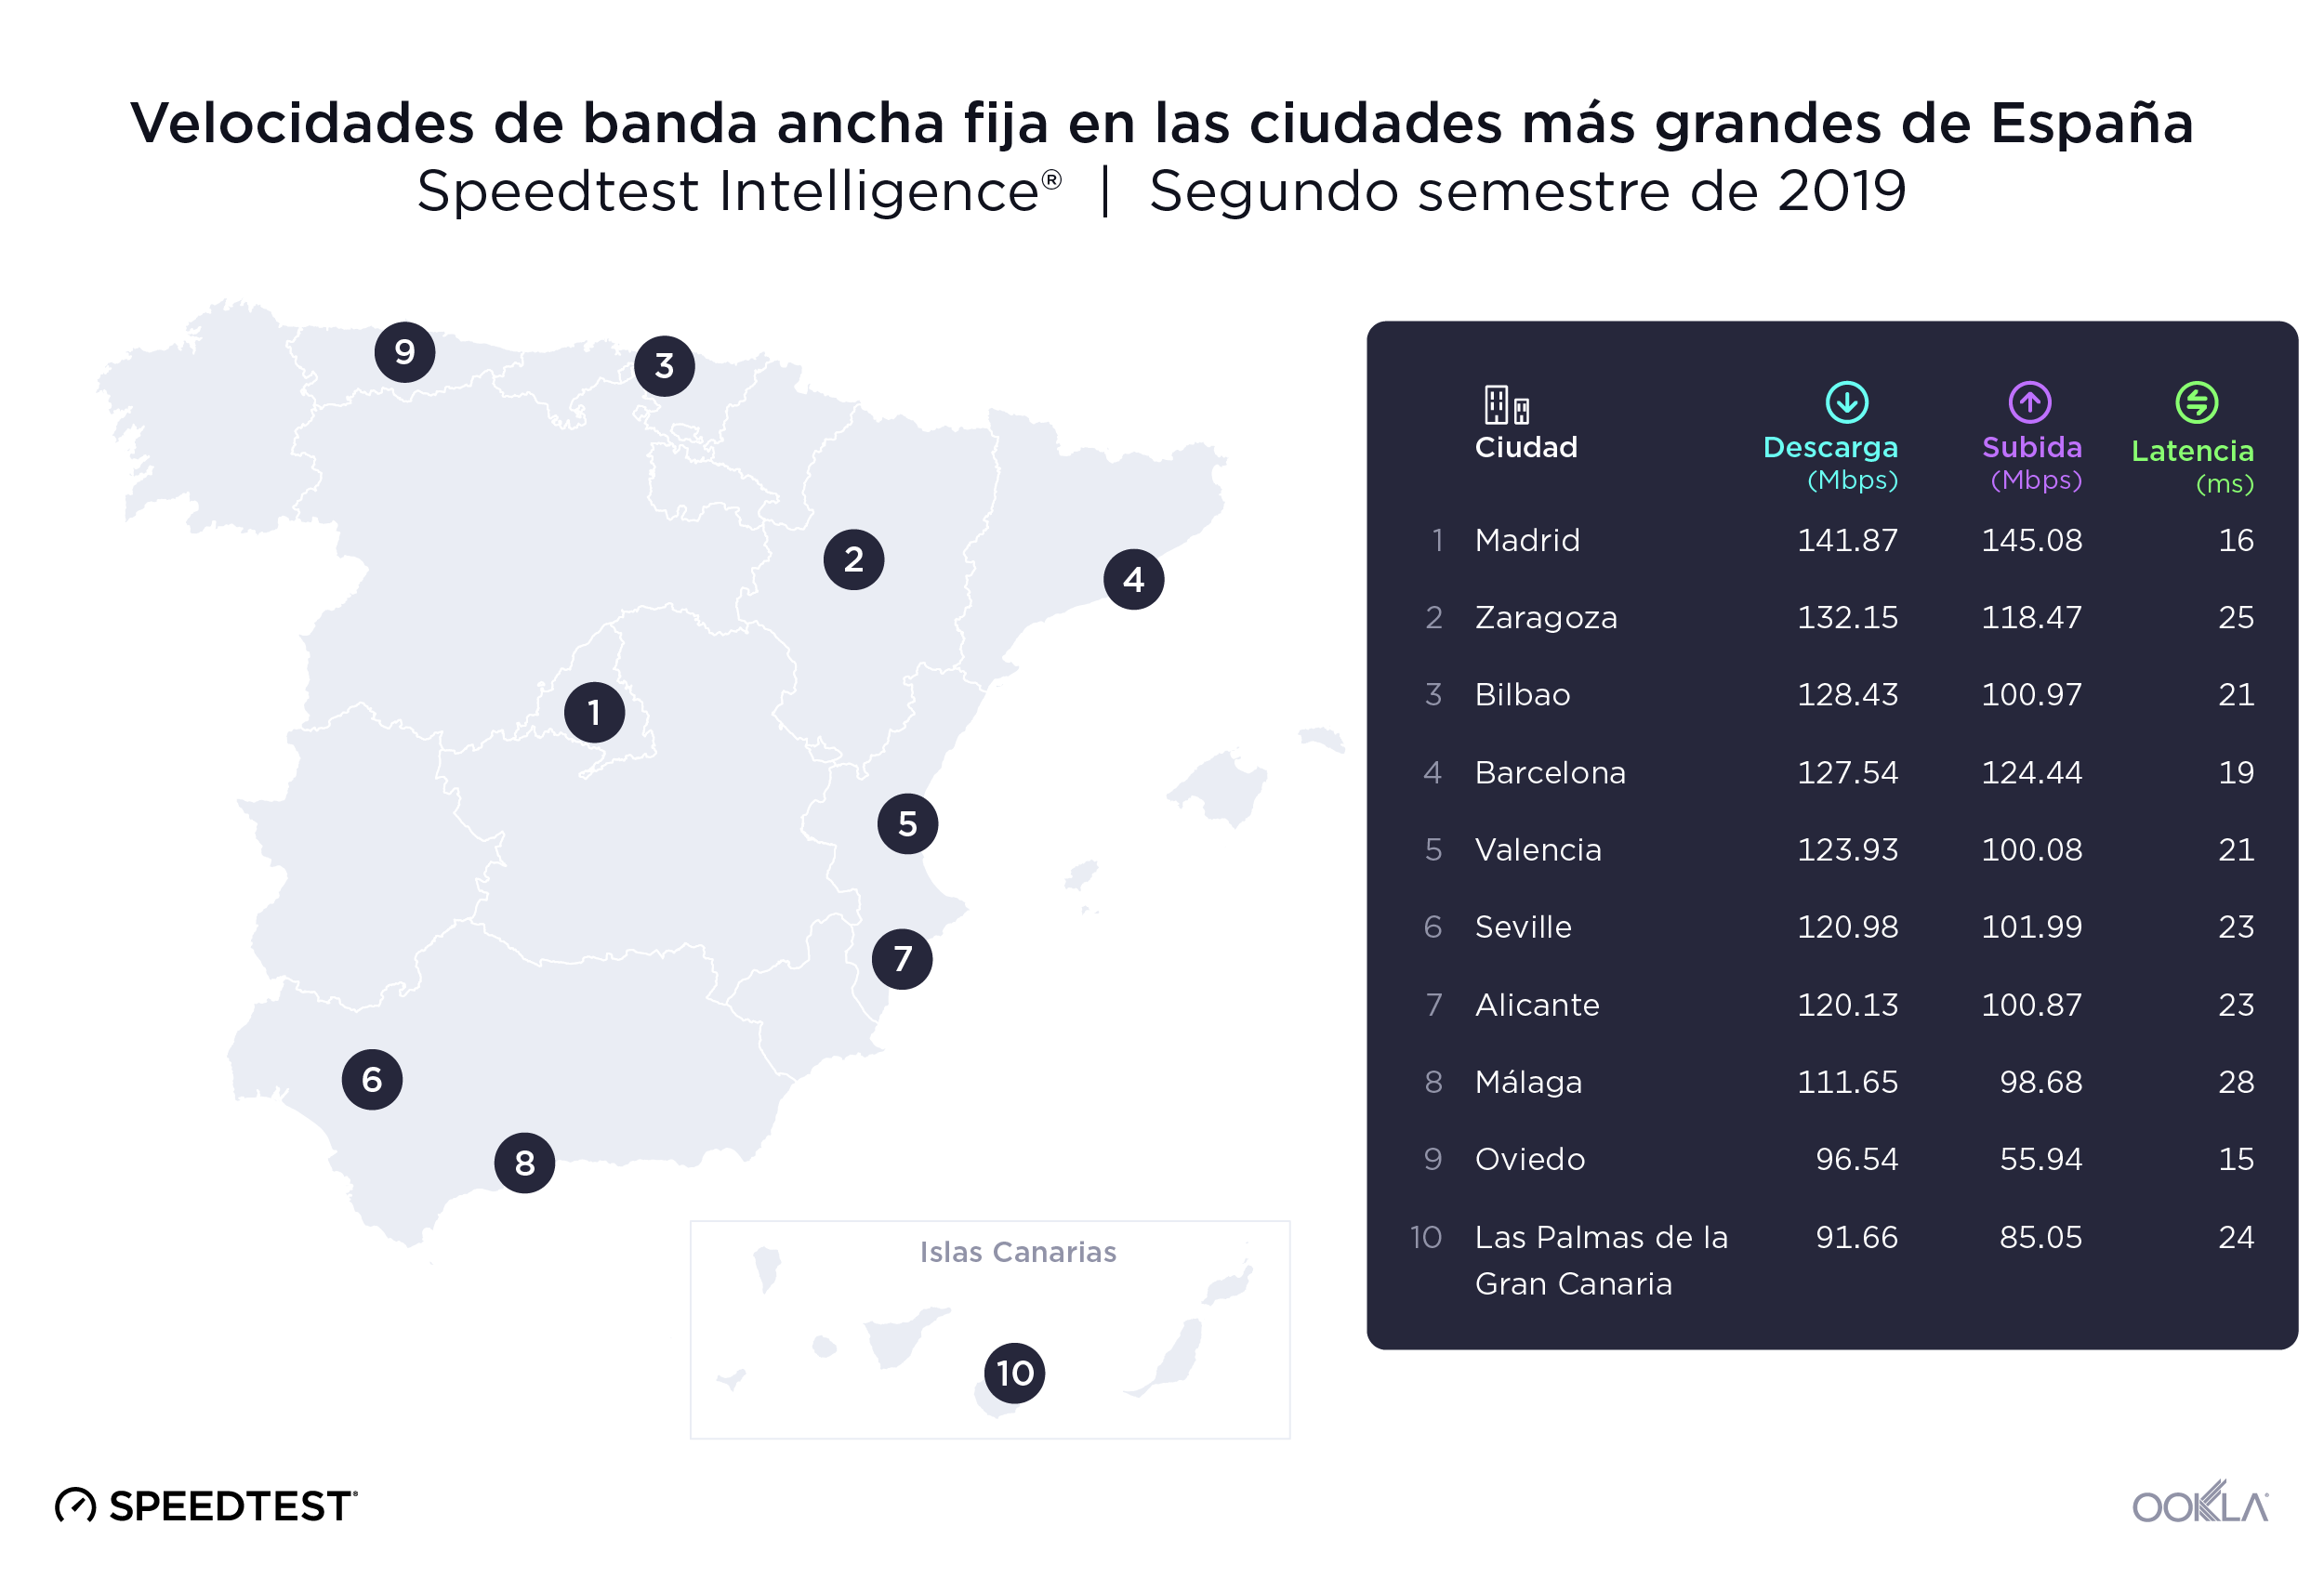
We used Speedtest data from 2,183,336 user-initiated tests to investigate internet speeds in Spain’s ten most populous cities during Q3-Q4 2019. Madrid had the fastest mean download speeds on both fixed broadband and mobile.

Mean download speeds on fixed broadband ranged from 141.87 Mbps in Madrid to 91.66 Mbps in Las Palmas de la Gran Canaria, a 35.4% difference. Madrid also had the fastest mean upload speed over fixed broadband at 145.08 Mbps. Oviedo took the last place in upload speeds on fixed broadband with a 61.4% slower upload speed than Madrid.

Oviedo had the lowest latency over fixed broadband of the cities on our list during Q3-Q4 2019 at 15 ms. Málaga had the highest latency at 28 ms.
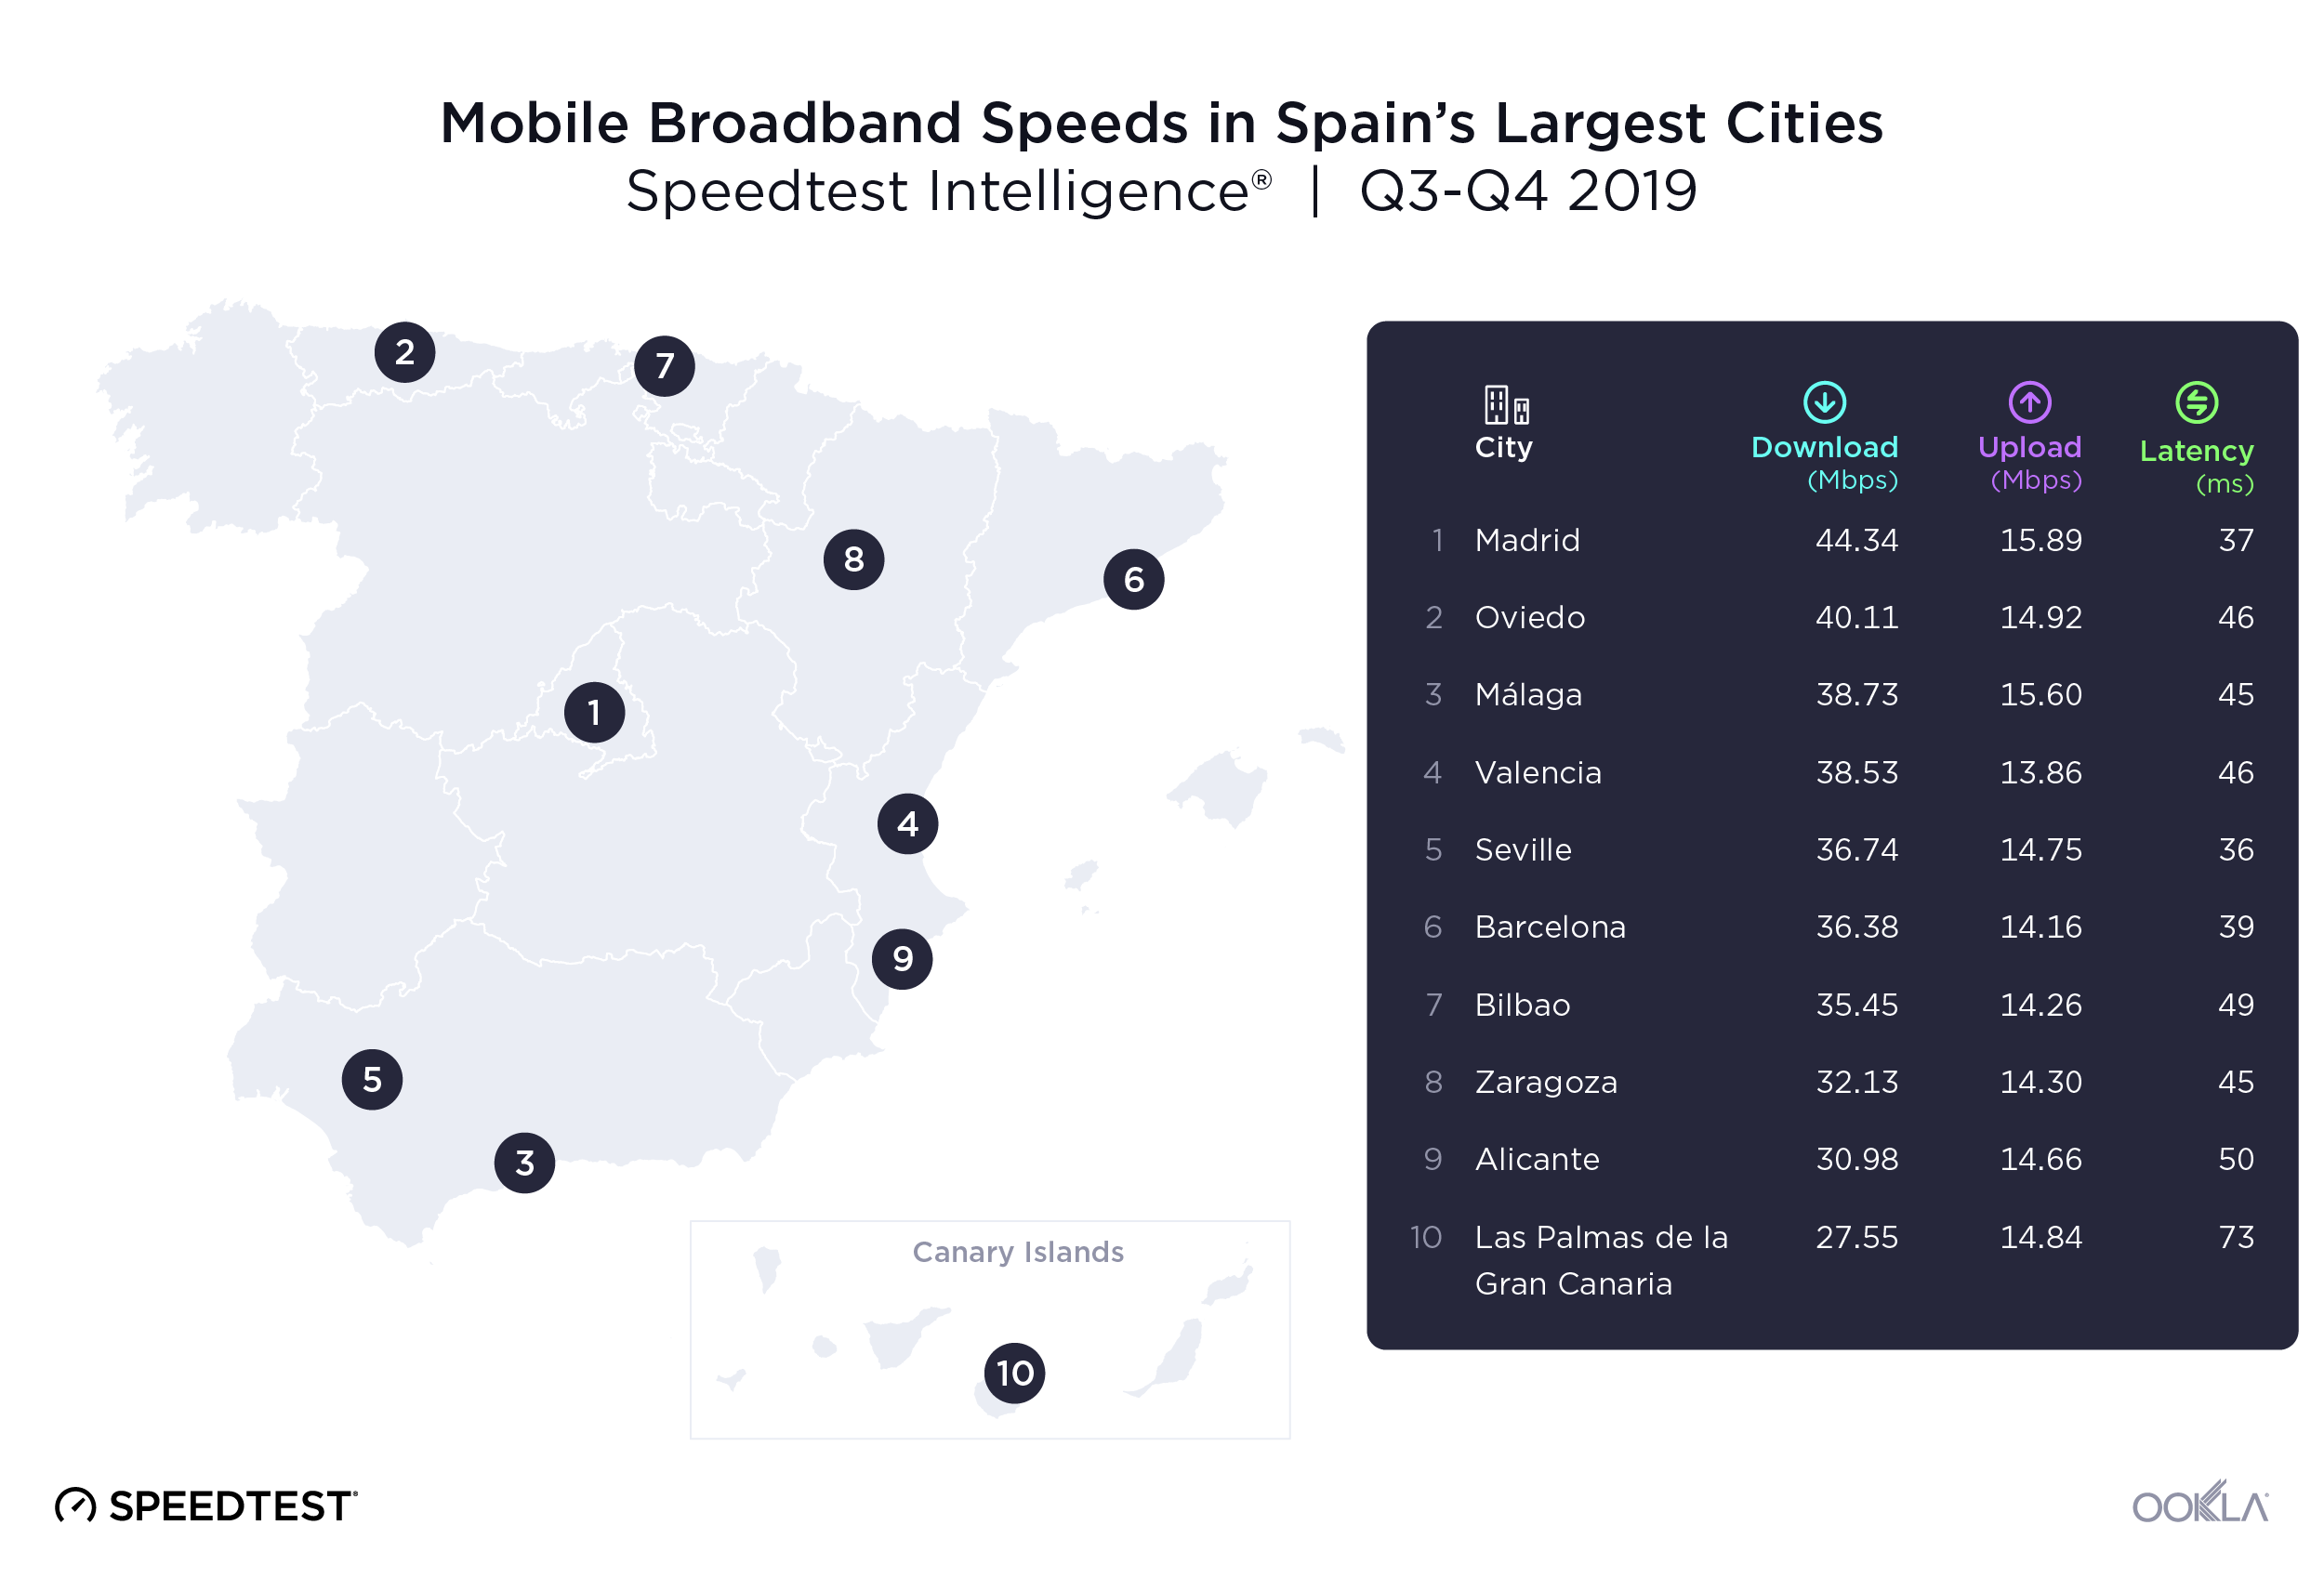
Ookla_Mobile-Broadband-Speeds_Spain_0220-1
The gap between fastest and slowest speeds between Spanish cities on mobile broadband was similar to what we saw fixed broadband during Q3-Q4 2019. Madrid once again led in performance on mobile broadband with a mean download speed of 44.35 Mbps and a mean upload speed of 15.89 Mbps. Las Palmas was in last place on download speeds with a 37.9% slower mean download speed than Madrid. Valencia had the slowest mean upload speed over mobile at 13.86 Mbps. Seville had the lowest latency over mobile at 36 ms during Q3-Q4 2019 and Las Palmas had the highest mobile latency at 73 ms.

Zaragoza led 4G Availability in Spain’s most populous cities

4G Availability in Spain’s Largest Cities
Speedtest Intelligence® | Q3-Q4 2019
City 4G Availability
Zaragoza 97.2%
Valencia 97.1%
Seville 96.8%
Málaga 96.7%
Oviedo 95.4%
Madrid 95.1%
Las Palmas de la Gran Canaria 95.0%
Alicante 94.6%
Bilbao 94.3%
Barcelona 87.7%

4G Availability was higher in Spain’s largest cities than the country’s average, with Zaragoza having the highest 4G Availability at 97.2% of tested locations. Barcelona had the lowest 4G Availability on our list at 87.7%.

MÁSMÓVIL was fastest fixed broadband provider in 6 cities

Looking specifically at Speed Score in individual Spanish cities during Q3-Q4 2019, we found MÁSMÓVIL was the fastest provider in six cities: Málaga, Seville, Zaragoza, Madrid, Valencia and Alicante. Adamo, the fastest fixed provider in Barcelona, had the highest Speed Score on the list at 185.29. Vodafone was the fastest provider in Bilbao and Oviedo.

Fixed Broadband Performance by Operator in Spain’s Largest Cities
Speedtest Intelligence® | Q3-Q4 2019
City Provider Speed ScoreTM
Barcelona Adamo 185.29
Málaga MÁSMÓVIL 156.24
Seville MÁSMÓVIL 148.78
Madrid MÁSMÓVIL 145.83
Bilbao Vodafone 144.65
Zaragoza MÁSMÓVIL 144.40
Oviedo Vodafone 143.85
Valencia MÁSMÓVIL 143.99
Alicante MÁSMÓVIL 143.72
Las Palmas Orange 114.46

Looking at the fastest Spanish providers on mobile broadband for each city during Q3-Q4 2019, Movistar dominated the list with the fastest Speed Score in 7 cities. Movistar also had the highest Speed Score overall at 52.04 in Seville. Vodafone was the fastest mobile provider in Madrid (35.67). Orange was the fastest provider in Barcelona (35.37) and Oviedo (45.10).

Mobile Performance by Operator in Spain’s Largest Cities
Speedtest Intelligence® | Q3-Q4 2019
City Provider Speed ScoreTM
Seville Movistar 52.04
Valencia Movistar 50.80
Alicante Movistar 50.36
Málaga Movistar 48.97
Bilbao Movistar 48.86
Oviedo Orange 45.10
Zaragoza Movistar 40.79
Madrid Vodafone 35.67
Las Palmas Movistar 35.37
Barcelona Vodafone 31.37

We look forward to following these markets and investigating the changing landscape of internet performance and mobile coverage in Europe. Want to learn more about fixed and mobile speeds in different markets? Click here to read more Ookla Research.

Editor’s note: This article was updated on March 4, 2020 to correct an editing error that incorrectly reported the figures for mobile APS.

Velocidades de banda ancha fija y móvil, y disponibilidad de 4G en España

Hemos investigado el rendimiento de la banda ancha fija y móvil, así como la disponibilidad de 4G en España. También hemos comparado las velocidades y la cobertura españolas con las de los países europeos vecinos, así como el rendimiento y la disponibilidad de 4G de los principales proveedores de las diez ciudades más grandes de España en el segundo semestre de 2019. Además de clasificar a los proveedores españoles por su velocidad y cobertura máximas, también hemos analizado los efectos de los planes móviles con limitaciones de velocidad basándonos en los resultados de Speedtest® y hemos clasificado a los proveedores según la constancia del rendimiento de sus redes.

España y Francia fueron los países más rápidos de nuestra lista de banda ancha fija

Hemos comparado el rendimiento de la banda ancha fija de España a nivel de país con varios otros países de la Europa occidental en el segundo semestre de 2019. España obtuvo una buena posición en cuanto a velocidad de descarga media en banda ancha fija, con 113,72 Mbps, en segundo lugar solo después de los 119,37 Mbps de Francia. España registró la velocidad de subida media más alta de esta lista: 103,72 Mbps. Italia obtuvo la velocidad de descarga media más baja de esta lista, 56,72 Mbps, mientras que el Reino Unido registró la velocidad de subida media más baja, 18,28 Mbps.
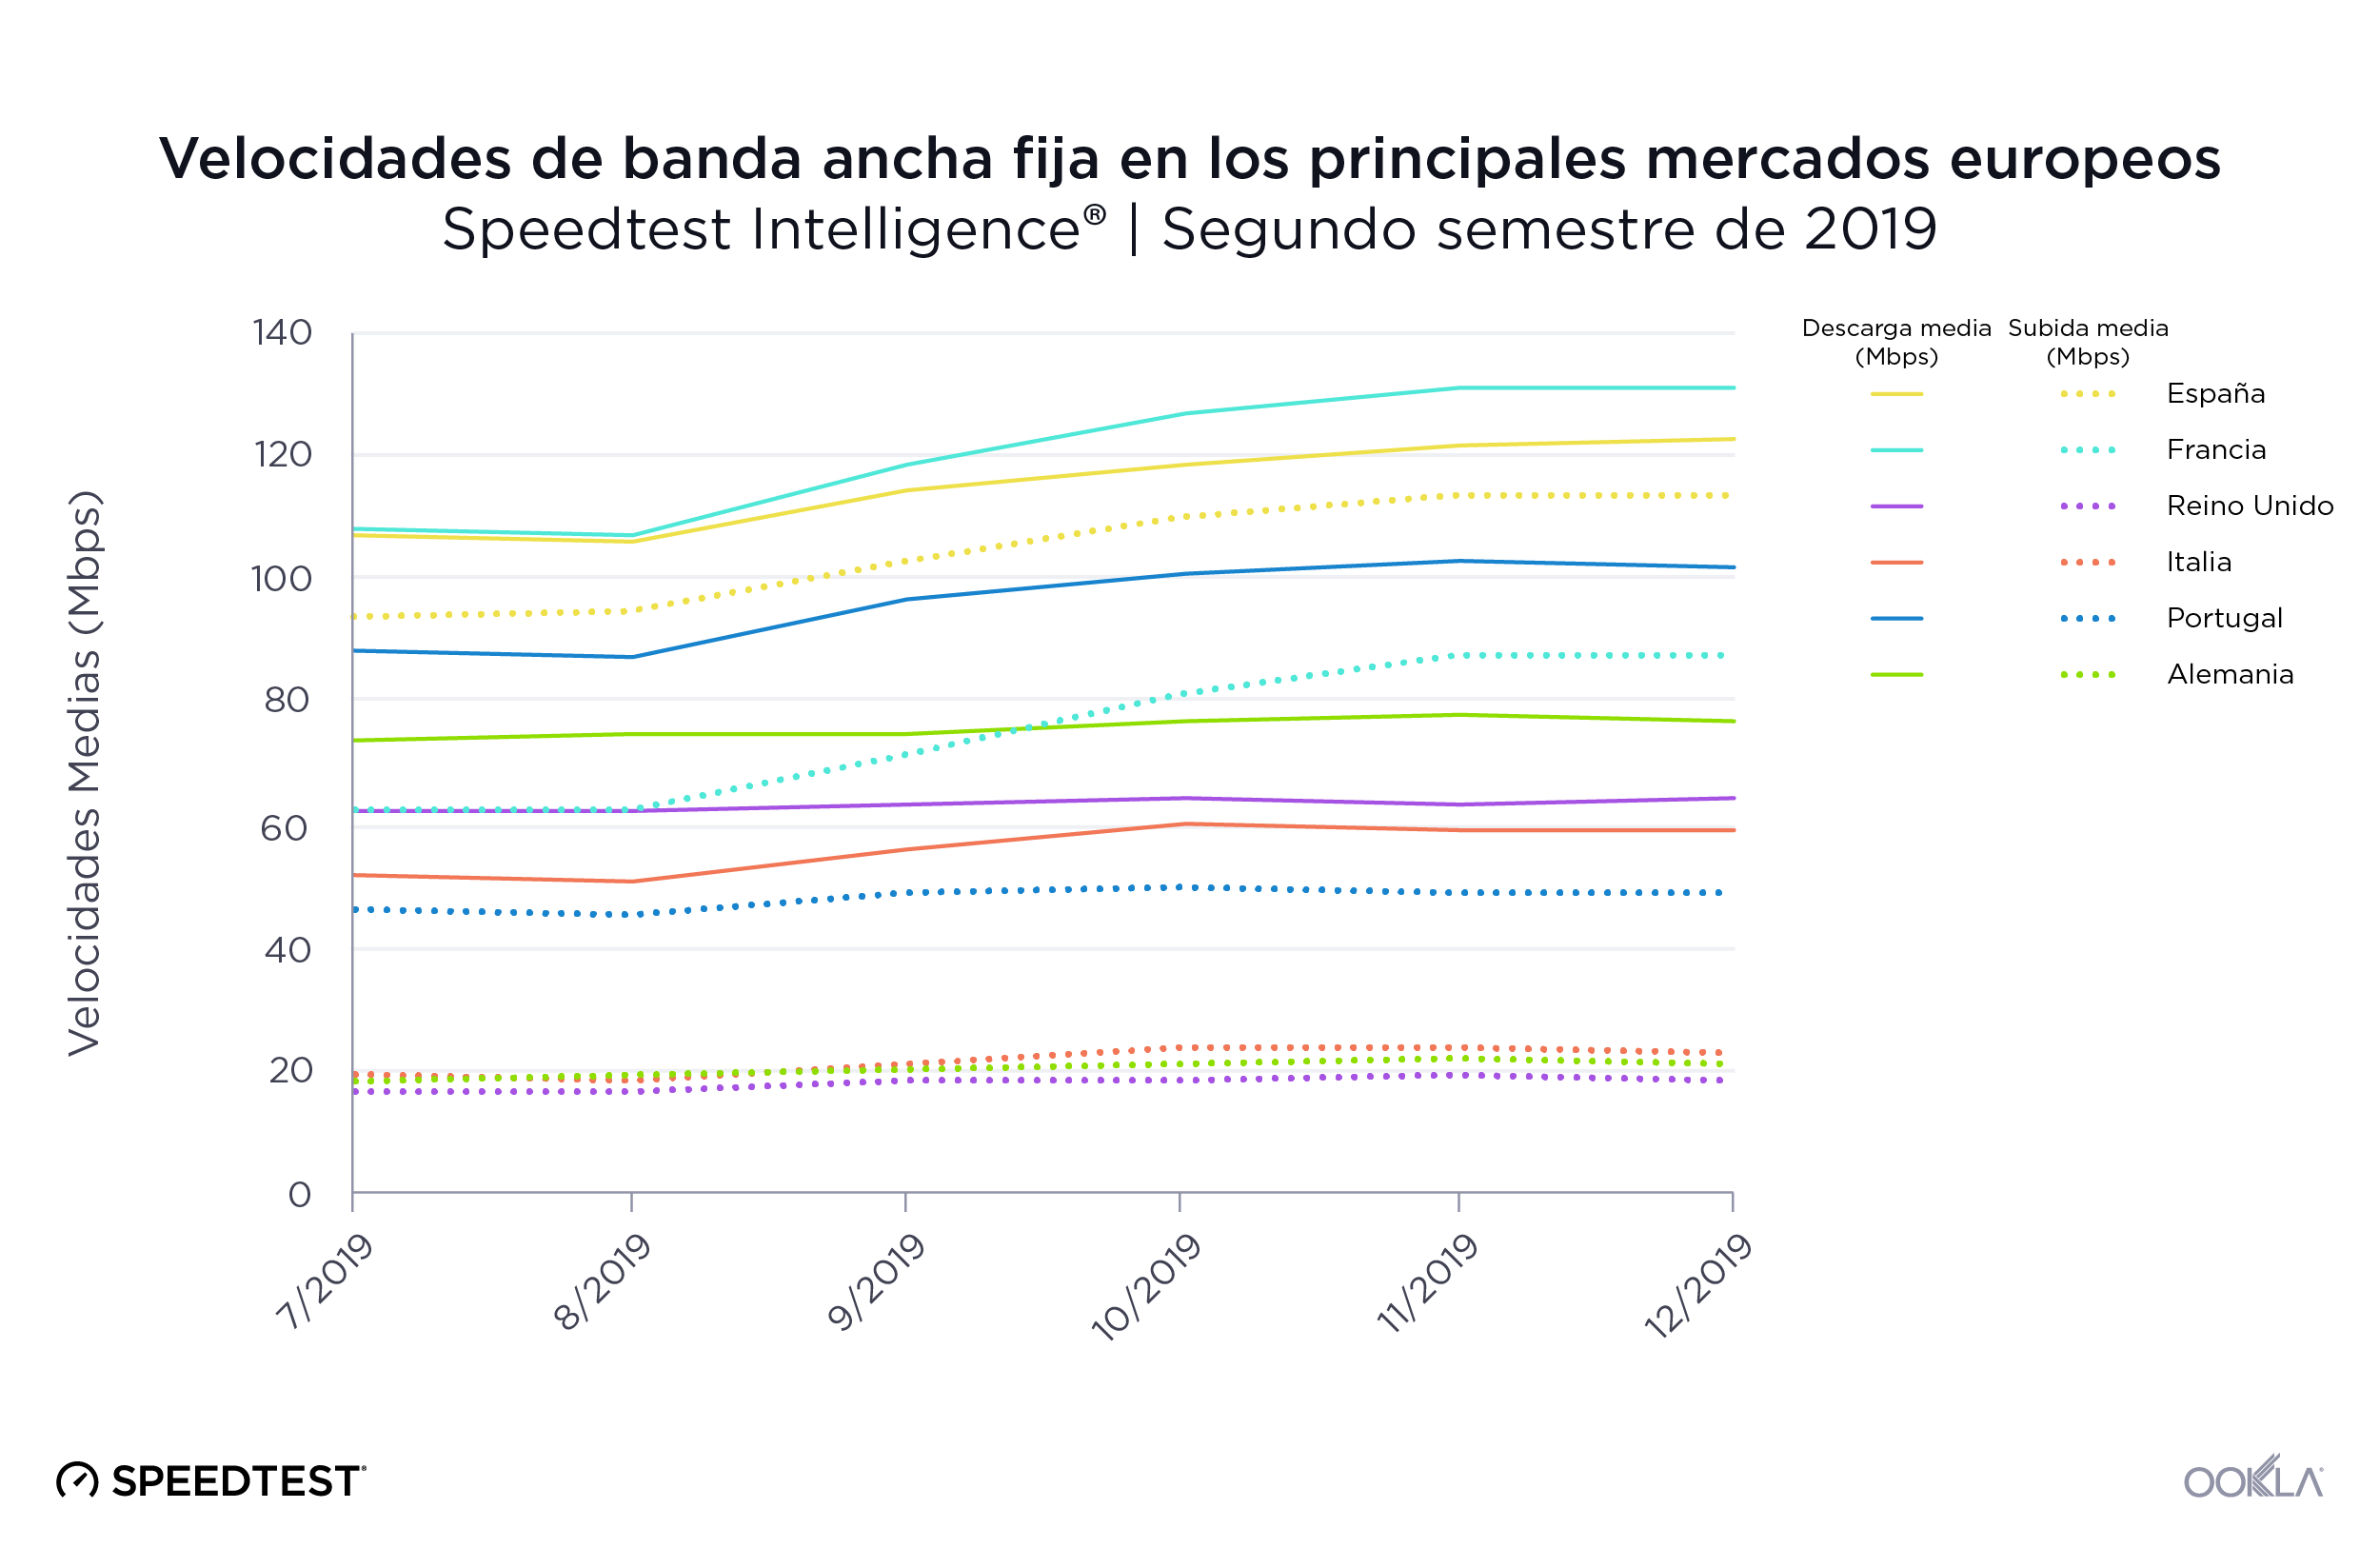
fixed-broadband-speeds-sp-2

Francia registró el mayor aumento en la velocidad de descarga media del segundo semestre de 2019, con el 21,5 %, seguida de Portugal y Italia, con el 15,4 %, y España, con el 14,5 %. Las velocidades se mantuvieron relativamente invariables durante este periodo en Italia, Reino Unido y Alemania.

Un análisis de la latencia en banda ancha fija en el segundo semestre de 2019 reveló una clasificación por rendimiento muy distinta. Portugal se anotó la latencia más baja de este periodo: 16 ms. Alemania y Reino Unido empataron en el segundo puesto con 23 ms. España resultó tercera (25 ms), Italia cuarta (30 ms) y Francia quinta (32 ms).

España, cuarto país en velocidad de descarga en Internet móvil
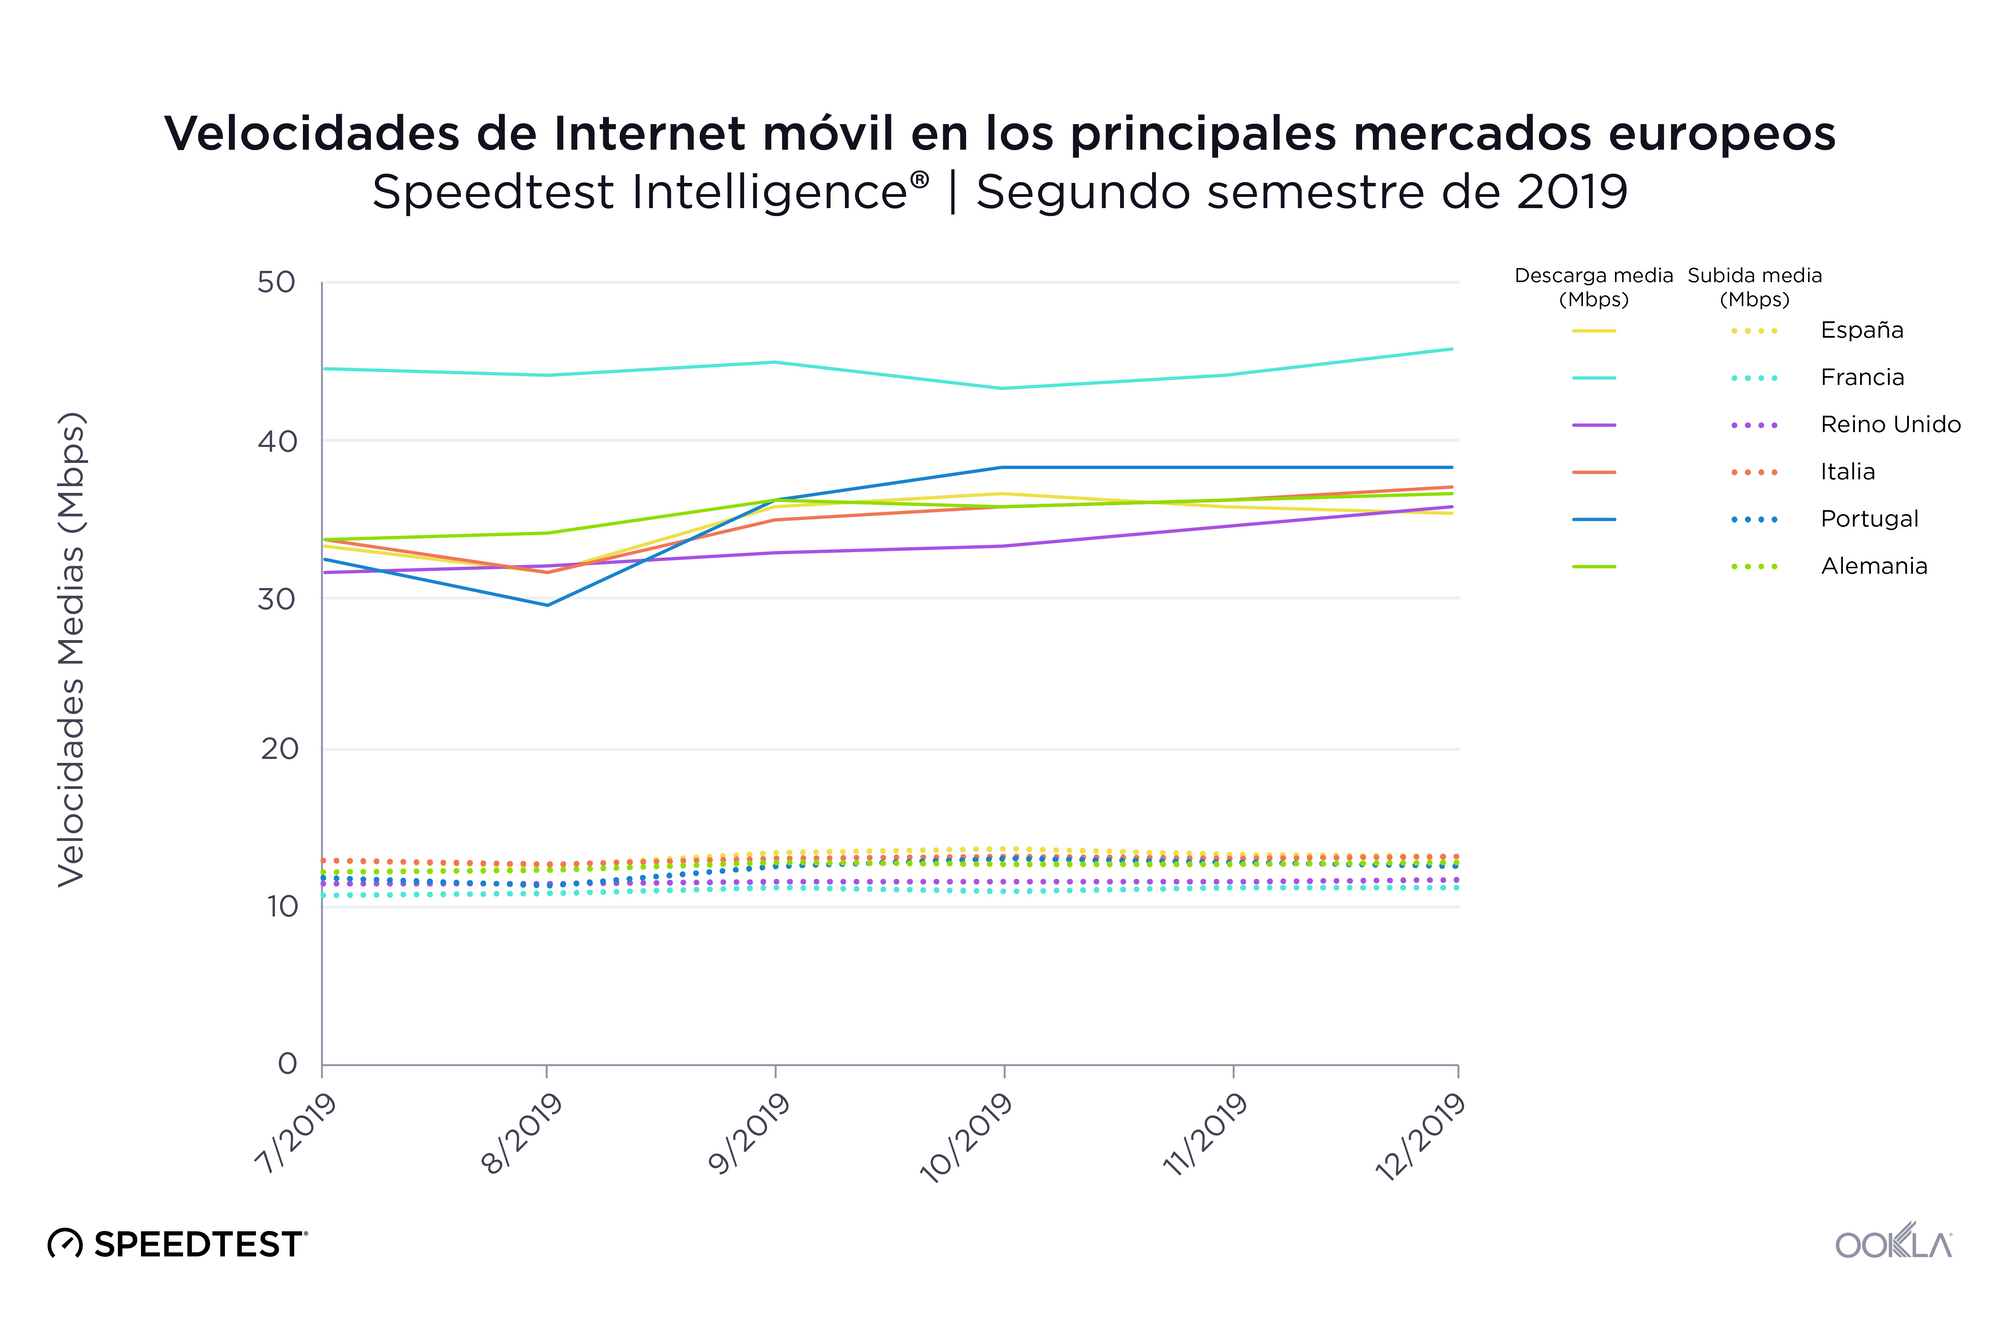
mobile-speeds-sp-3

La clasificación de España en velocidad de descarga media por móvil no fue tan buena como la de banda ancha fija, quedándose con un cuarto puesto con 33,97 Mbps en el segundo semestre de 2019. Esto supuso una velocidad un 22,8 % más lenta que la del primer país clasificado, Francia. Sin embargo, España registró las velocidades de subida medias más altas en Internet móvil, con 13,12 Mbps en el segundo semestre de 2019.

Portugal experimentó el mayor aumento en velocidad de descarga de Internet móvil en el segundo semestre de 2019, el 18,4 %. La velocidad de descarga media de España en Internet móvil aumentó solo un 6,7 % en este periodo. Francia registró el menor aumento de velocidad de descarga de Internet móvil, un 2,8 %.

Como vimos en la banda ancha fija, la latencia móvil más baja fue la de Portugal, con 32 ms. Alemania fue segunda con 41 ms, Francia tercera con 43 ms, Reino Unido cuarto con 44 ms, España quinta con 47 ms e Italia última con 52 ms.

Reino Unido y España, líderes en disponibilidad de 4G

Utilizamos datos de exploraciones de cobertura de Speedtest en Android para comparar la disponibilidad de 4G en cada mercado en el segundo semestre de 2019. Mientras que el Reino Unido mostró la mayor disponibilidad de 4G con el 88,8 %, España y Francia ocuparon el segundo lugar, con 4G disponible en el 87,7 % de las ubicaciones probadas. Durante ese período, Alemania tuvo la menor disponibilidad de 4G con un 72,1 %.

Disponibilidad de 4G en los principales mercados europeos
Speedtest Intelligence® | Segundo semestre de 2019
País Disponibilidad de 4G
Reino Unido 88,8 %
España 87,7 %
Francia 87,7 %
Italia 86,7 %
Portugal 85,0 %
Alemania 72,1 %

Si nos fijamos específicamente en los principales proveedores móviles de España, Orange ofreció la mayor disponibilidad de 4G con un 88,1 %. Movistar fue segundo, Yoigo tercero, y Vodafone cuarto.

Disponibilidad de 4G por proveedor en España
Speedtest Intelligence® | Segundo semestre de 2019
Proveedor Disponibilidad de 4G
Orange 88,1 %
Movistar 87,7 %
Yoigo 87,4 %
Vodafone 86,1 %

Los despliegues de 5G en España se están expandiendo
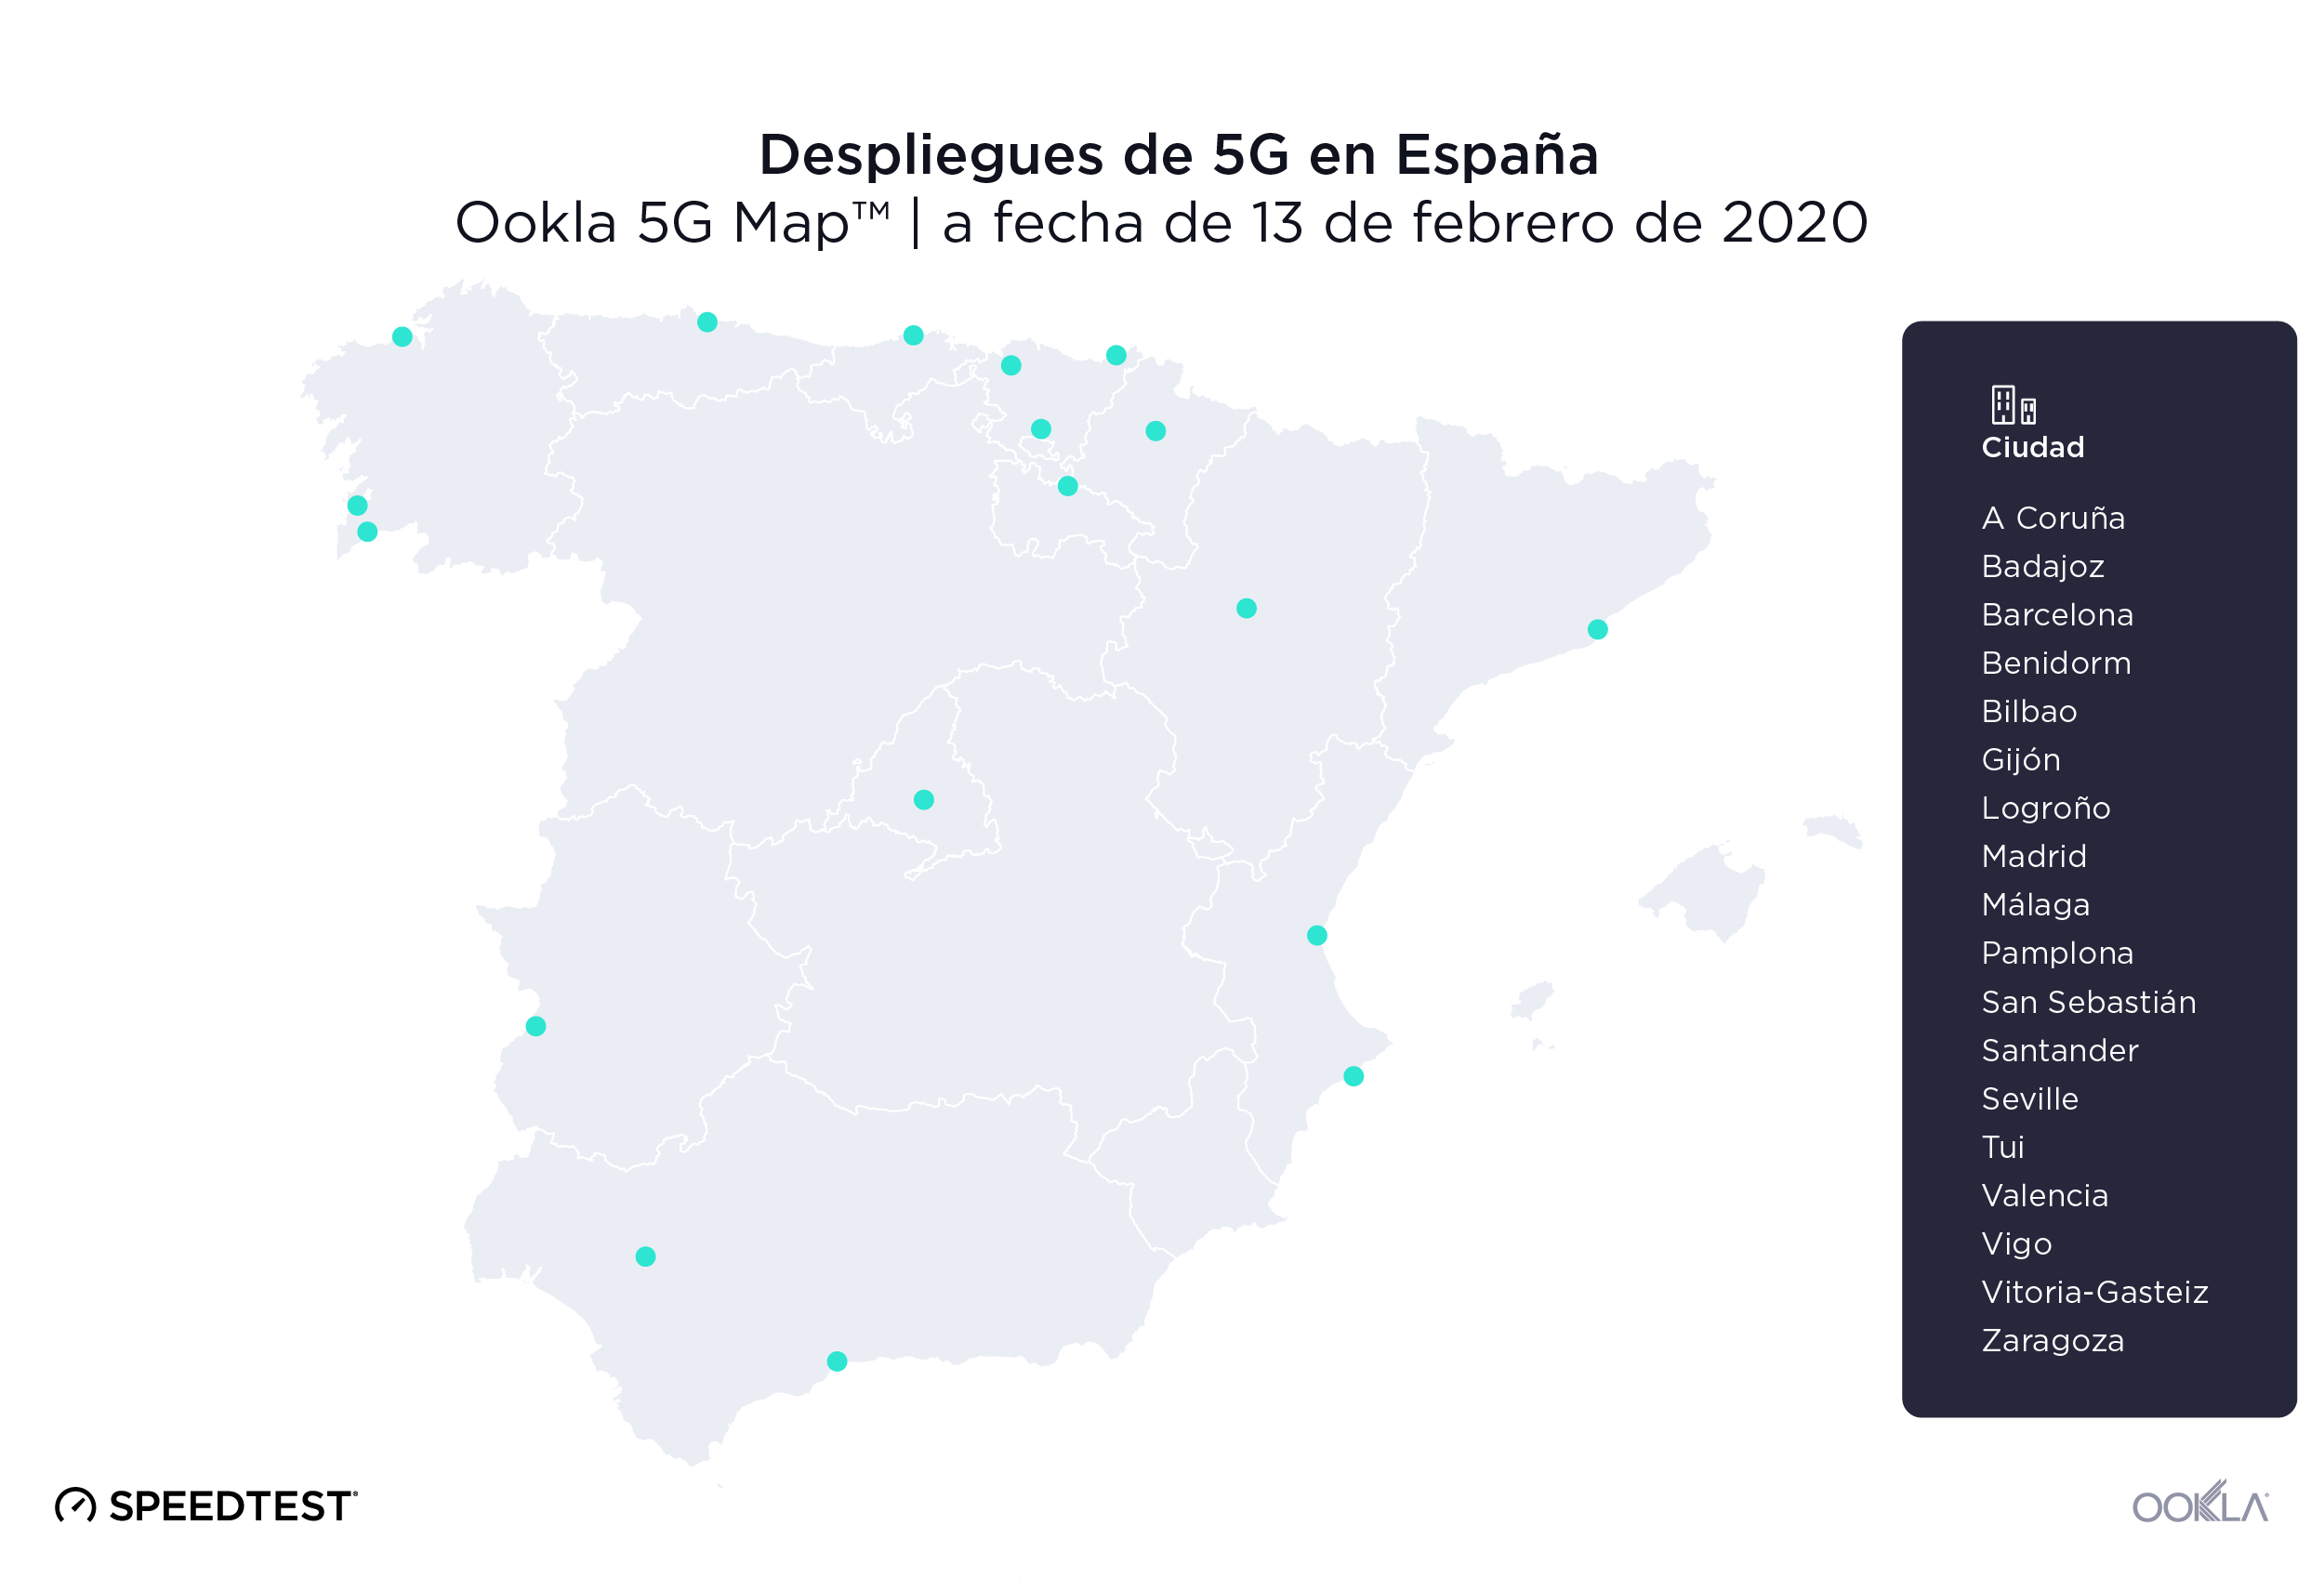
5G-Deployments-in-Spain-0220_es
El entusiasmo por el 5G es evidente en España. Vodafone desplegó 5G comercialmente disponible en un total de 18 ciudades españolas a fecha del 13 de febrero de 2020, incluidas Barcelona, Madrid, Valencia, Málaga y Bilbao. Los datos de Speedtest revelan que en España la velocidad media de descarga en 5G en el segundo semestre de 2019 fue de 350,68 Mbps (velocidad superior a la media nacional para Internet móvil) y la velocidad de subida media por 5G fue de 31,82 Mbps. La latencia media por 5G en España fue de 27 ms en el segundo semestre de 2019.

MÁSMÓVIL fue el proveedor de banda ancha fija más rápido de España

Al utilizar Speed Score™, sistema que combina mediciones de velocidades de descarga y de subida, para comparar los principales proveedores de servicios de Internet de España en el segundo semestre de 2019, descubrimos que MÁSMÓVIL obtuvo los mejores resultados, con una puntuación de 133,75 en banda ancha fija. Orange ocupó el segundo lugar con 115,25, seguido de Vodafone (105,07) y Movistar (103,01).

Rendimiento de la banda ancha fija en España por proveedor
Speedtest Intelligence® | Segundo semestre de 2019
Proveedor Speed ScoreTM
MÁSMÓVIL 133,75
Orange 115,25
Vodafone 105,07
Movistar 103,01

Movistar fue el operador móvil más rápido de España

Movistar obtuvo la máxima puntuación de velocidad de entre los operadores móviles de España en el segundo semestre de 2019, con 37,76. Orange fue segundo con 33,02, Vodafone la tercera con 26,34 y Yoigo cuarta con 22,43. Como veremos más adelante, el rendimiento general de la velocidad puede verse afectado por los límites de velocidad y los planes de tarifas vigentes en España.

Rendimiento de Internet móvil en España por operador
Speedtest Intelligence® | Segundo semestre de 2019
Proveedor Speed ScoreTM
Movistar 37,76
Orange 33,02
Vodafone 26,34
Yoigo 22,43

La limitación de velocidad afecta al rendimiento general

La limitación de la velocidad, una restricción de servicio impuesta a una conexión de Internet por los operadores, permite a estos ofrecer también planes que se centren en la asequibilidad más que en el rendimiento máximo.
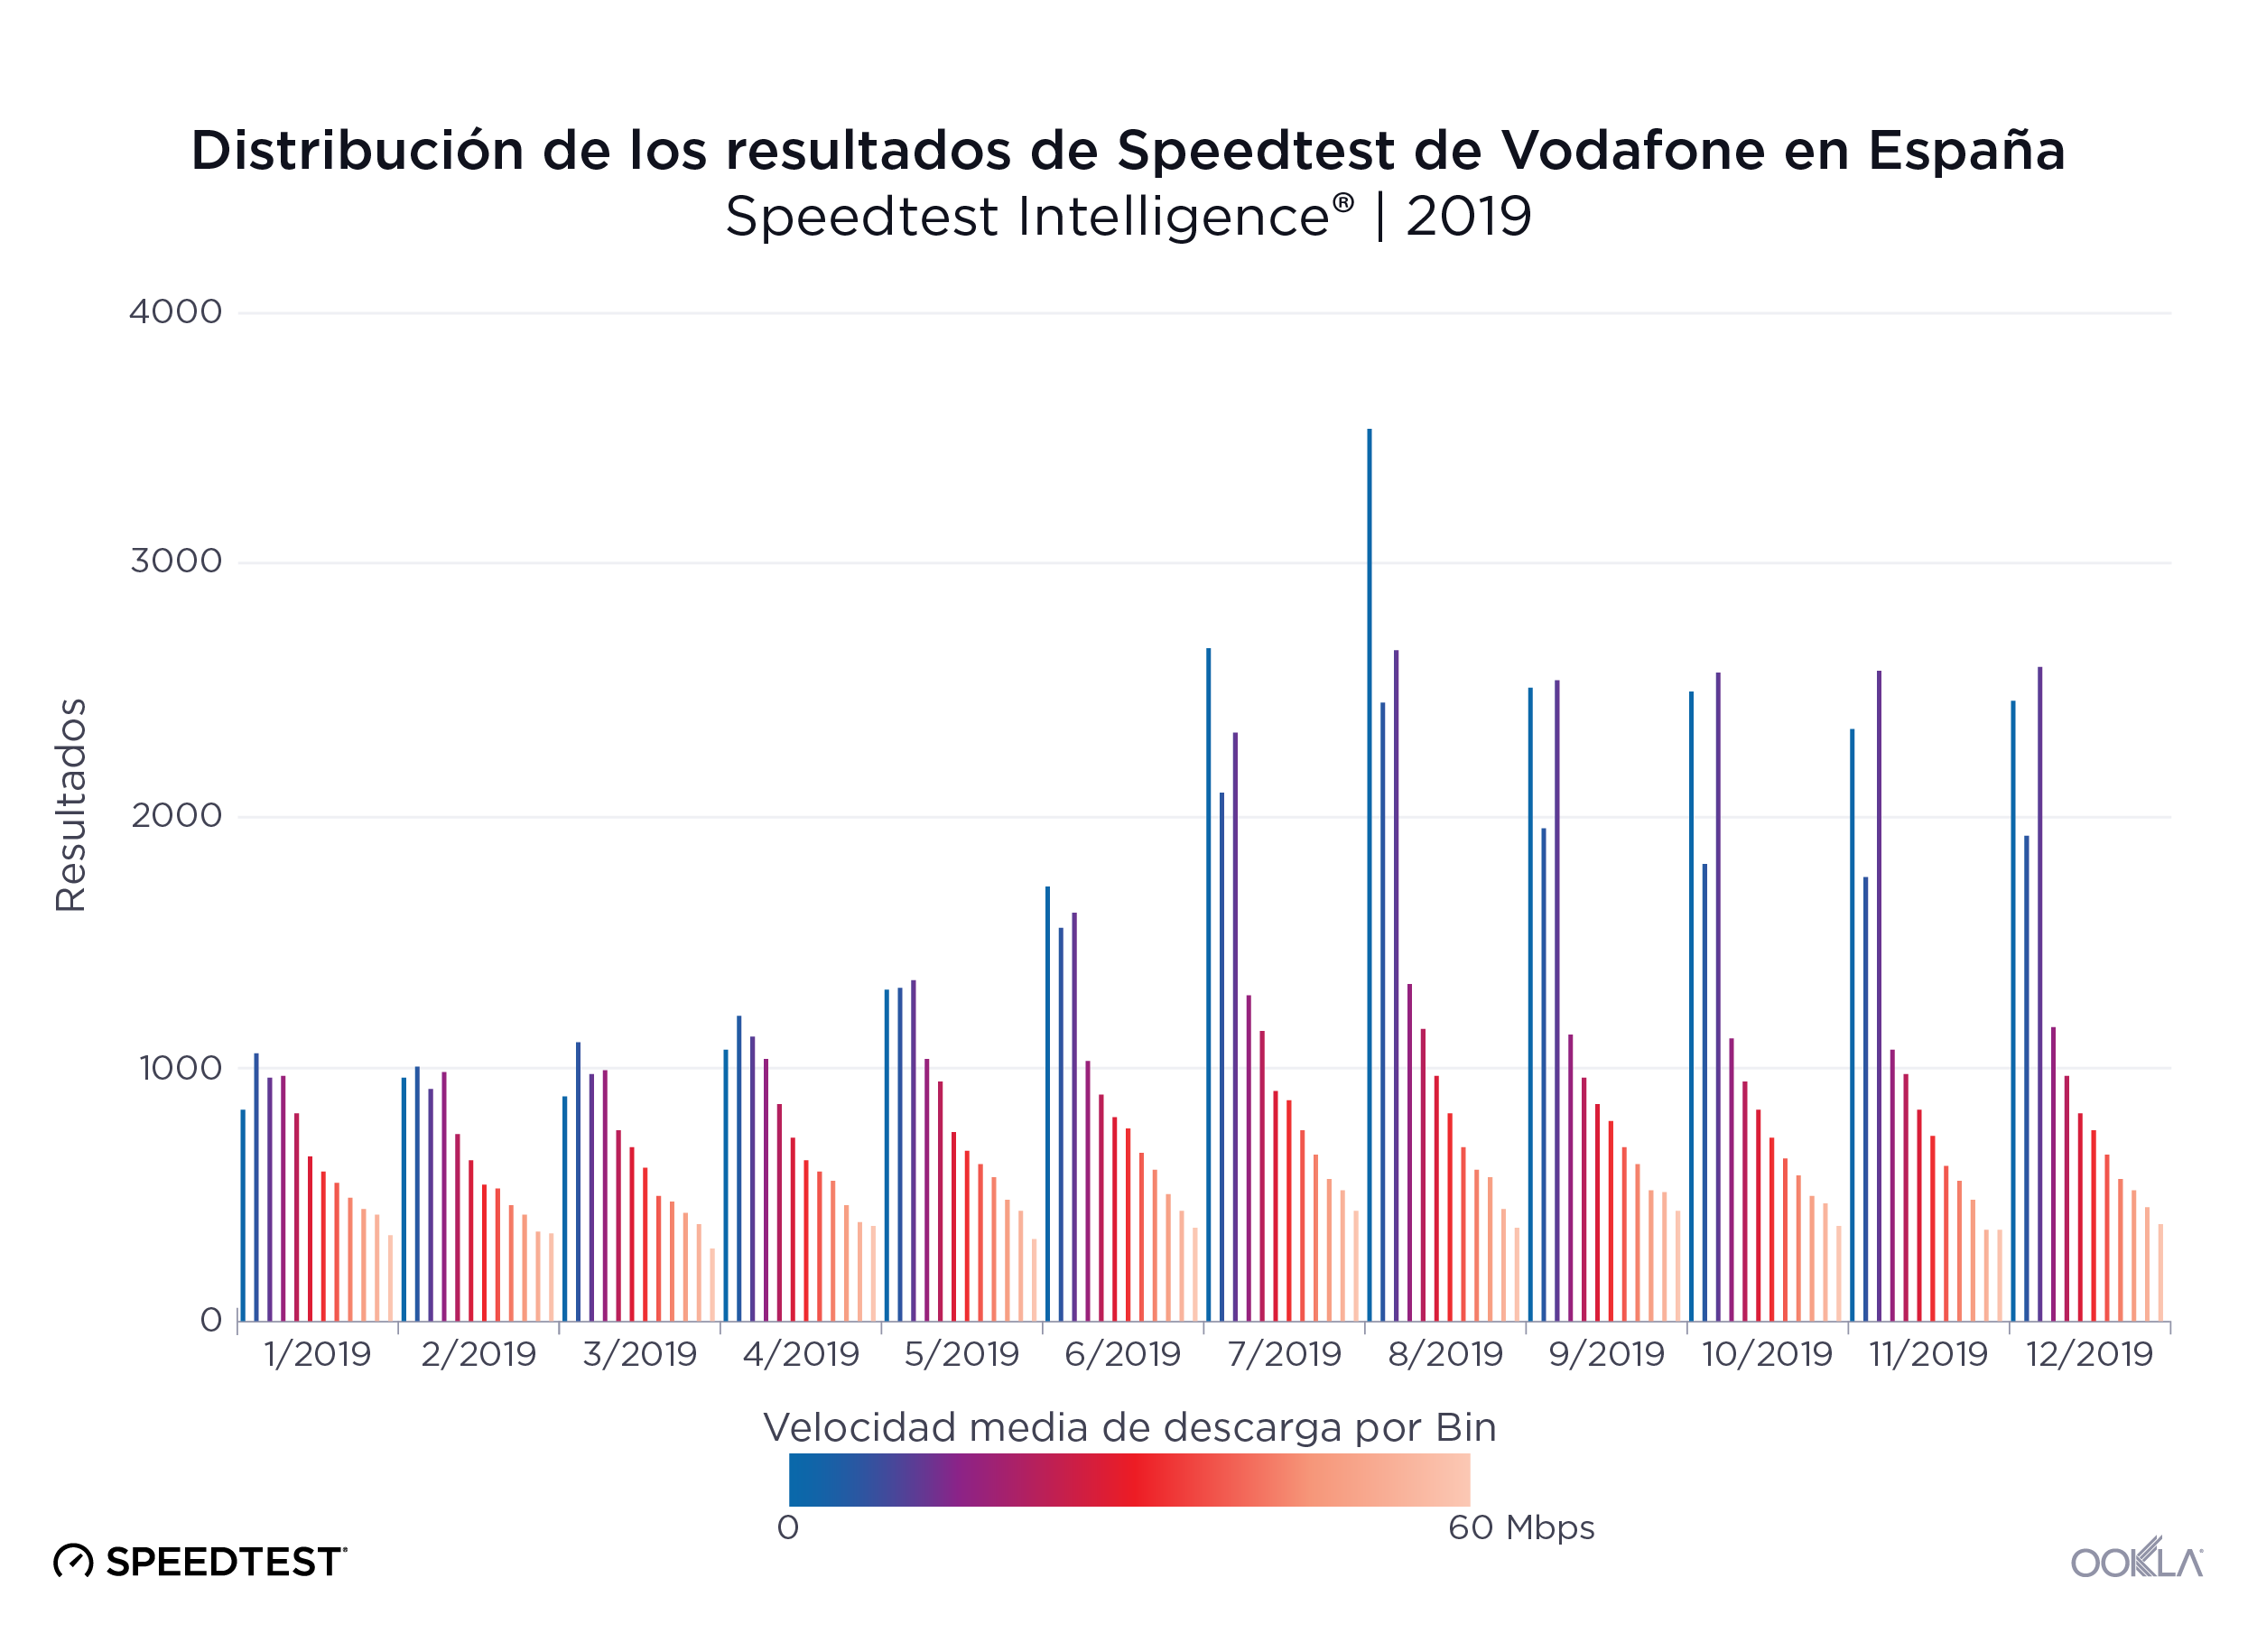
Ookla_Distribution-Speedtest-Results_Vodafone_Spain_0220-3_es
En el gráfico anterior se muestra cómo los planes de suscripción con limitación de velocidad introducidos por Vodafone afectaron a la distribución de las velocidades de descarga. Aunque esos planes (con limitaciones de 2 Mbps y 10 Mbps, respectivamente) estaban disponibles desde abril, no vemos un efecto verdadero en las velocidades medias hasta mayo y junio cuando las medidas de 0-5 Mbps y 10-15 Mbps empiezan a sobresalir.

En cambio, en el resto de operadores móviles de España vemos distribuciones más uniformes de las velocidades de descarga.
Ookla_Distribution-Speedtest-Results_Movistar_Spain_0220-3_es
Ookla_Distribution-Speedtest-Results_Orange_Spain_0220-3_es
Ookla_Distribution-Speedtest-Results_Yoigo_Spain_0220-3_es

MÁSMÓVIL y Movistar (móvil) ofrecen las velocidades más constantes

La velocidad es importante, pero si no es constante, resulta difícil que los usuarios utilicen sus dispositivos con fiabilidad para transmitir vídeo de alta definición, navegar por la web o jugar en línea. Utilizamos los datos de Speedtest para calcular la PRA (puntuación de rendimiento aceptable) de cada uno de los principales proveedores de España durante el segundo semestre de 2019.

La PRA de banda ancha fija mide el porcentaje de muestras que igualan o superan una velocidad de descarga de 25 Mbps y que también igualan o superan una velocidad de subida de 3 Mbps. MÁSMÓVIL proporcionó el mayor nivel de constancia de España en banda ancha fija en el segundo semestre de 2019 con una PRA de 81,6 %. Movistar quedó en último lugar con una PRA del 61,9 %.

Constancia de velocidad por proveedor en banda ancha fija
Speedtest Intelligence® | Segundo semestre de 2019
Proveedor PRA
MÁSMÓVIL 81,6 %
Orange 75,1 %
Vodafone 73,5 %
Movistar 61,9 %

La PRA de Internet móvil mide el porcentaje de muestras que igualan o superan una velocidad de descarga de 5 Mbps y que también igualan o superan una velocidad de subida de 1 Mbps. Movistar ocupó el primer lugar en constancia de banda ancha móvil con una PRA del 88,9 %, Vodafone obtuvo la puntuación más baja en constancia con una PRA del 79,8 %.

Constancia de velocidad por operador en Internet móvil
Speedtest Intelligence® | Segundo semestre de 2019
Proveedor PRA
Movistar 88,9 %
Orange 84,3 %
Yoigo 82,6 %
Vodafone 79,8 %

Madrid lideró las velocidades de banda ancha fija y móvil
Ookla_Fixed-Broadband-Speeds_Spain_0220_es-2
Para estudiar las velocidades de Internet de las diez ciudades más pobladas de España en el segundo semestre de 2019 utilizamos los datos de Speedtest de 2.183.336 pruebas realizadas por los usuarios. Madrid registró las velocidades medias de descarga más altas tanto en banda ancha fija como en Internet móvil.

Las velocidades medias de descarga por banda ancha fija oscilaron entre los 141,87 Mbps de Madrid y los 91,66 Mbps de Las Palmas de la Gran Canaria, una diferencia del 35,4 %. Madrid registró también la velocidad de subida media más alta por banda ancha fija, con 145,08 Mbps. Oviedo ocupó el último lugar en velocidad de subida por banda ancha fija con un 61,4 % menos de velocidad de subida que Madrid.

Oviedo tuvo la menor latencia en banda ancha fija de las ciudades de nuestra lista durante el segundo semestre de 2019, con 15 ms. Málaga registró la latencia más alta, con 28 ms.
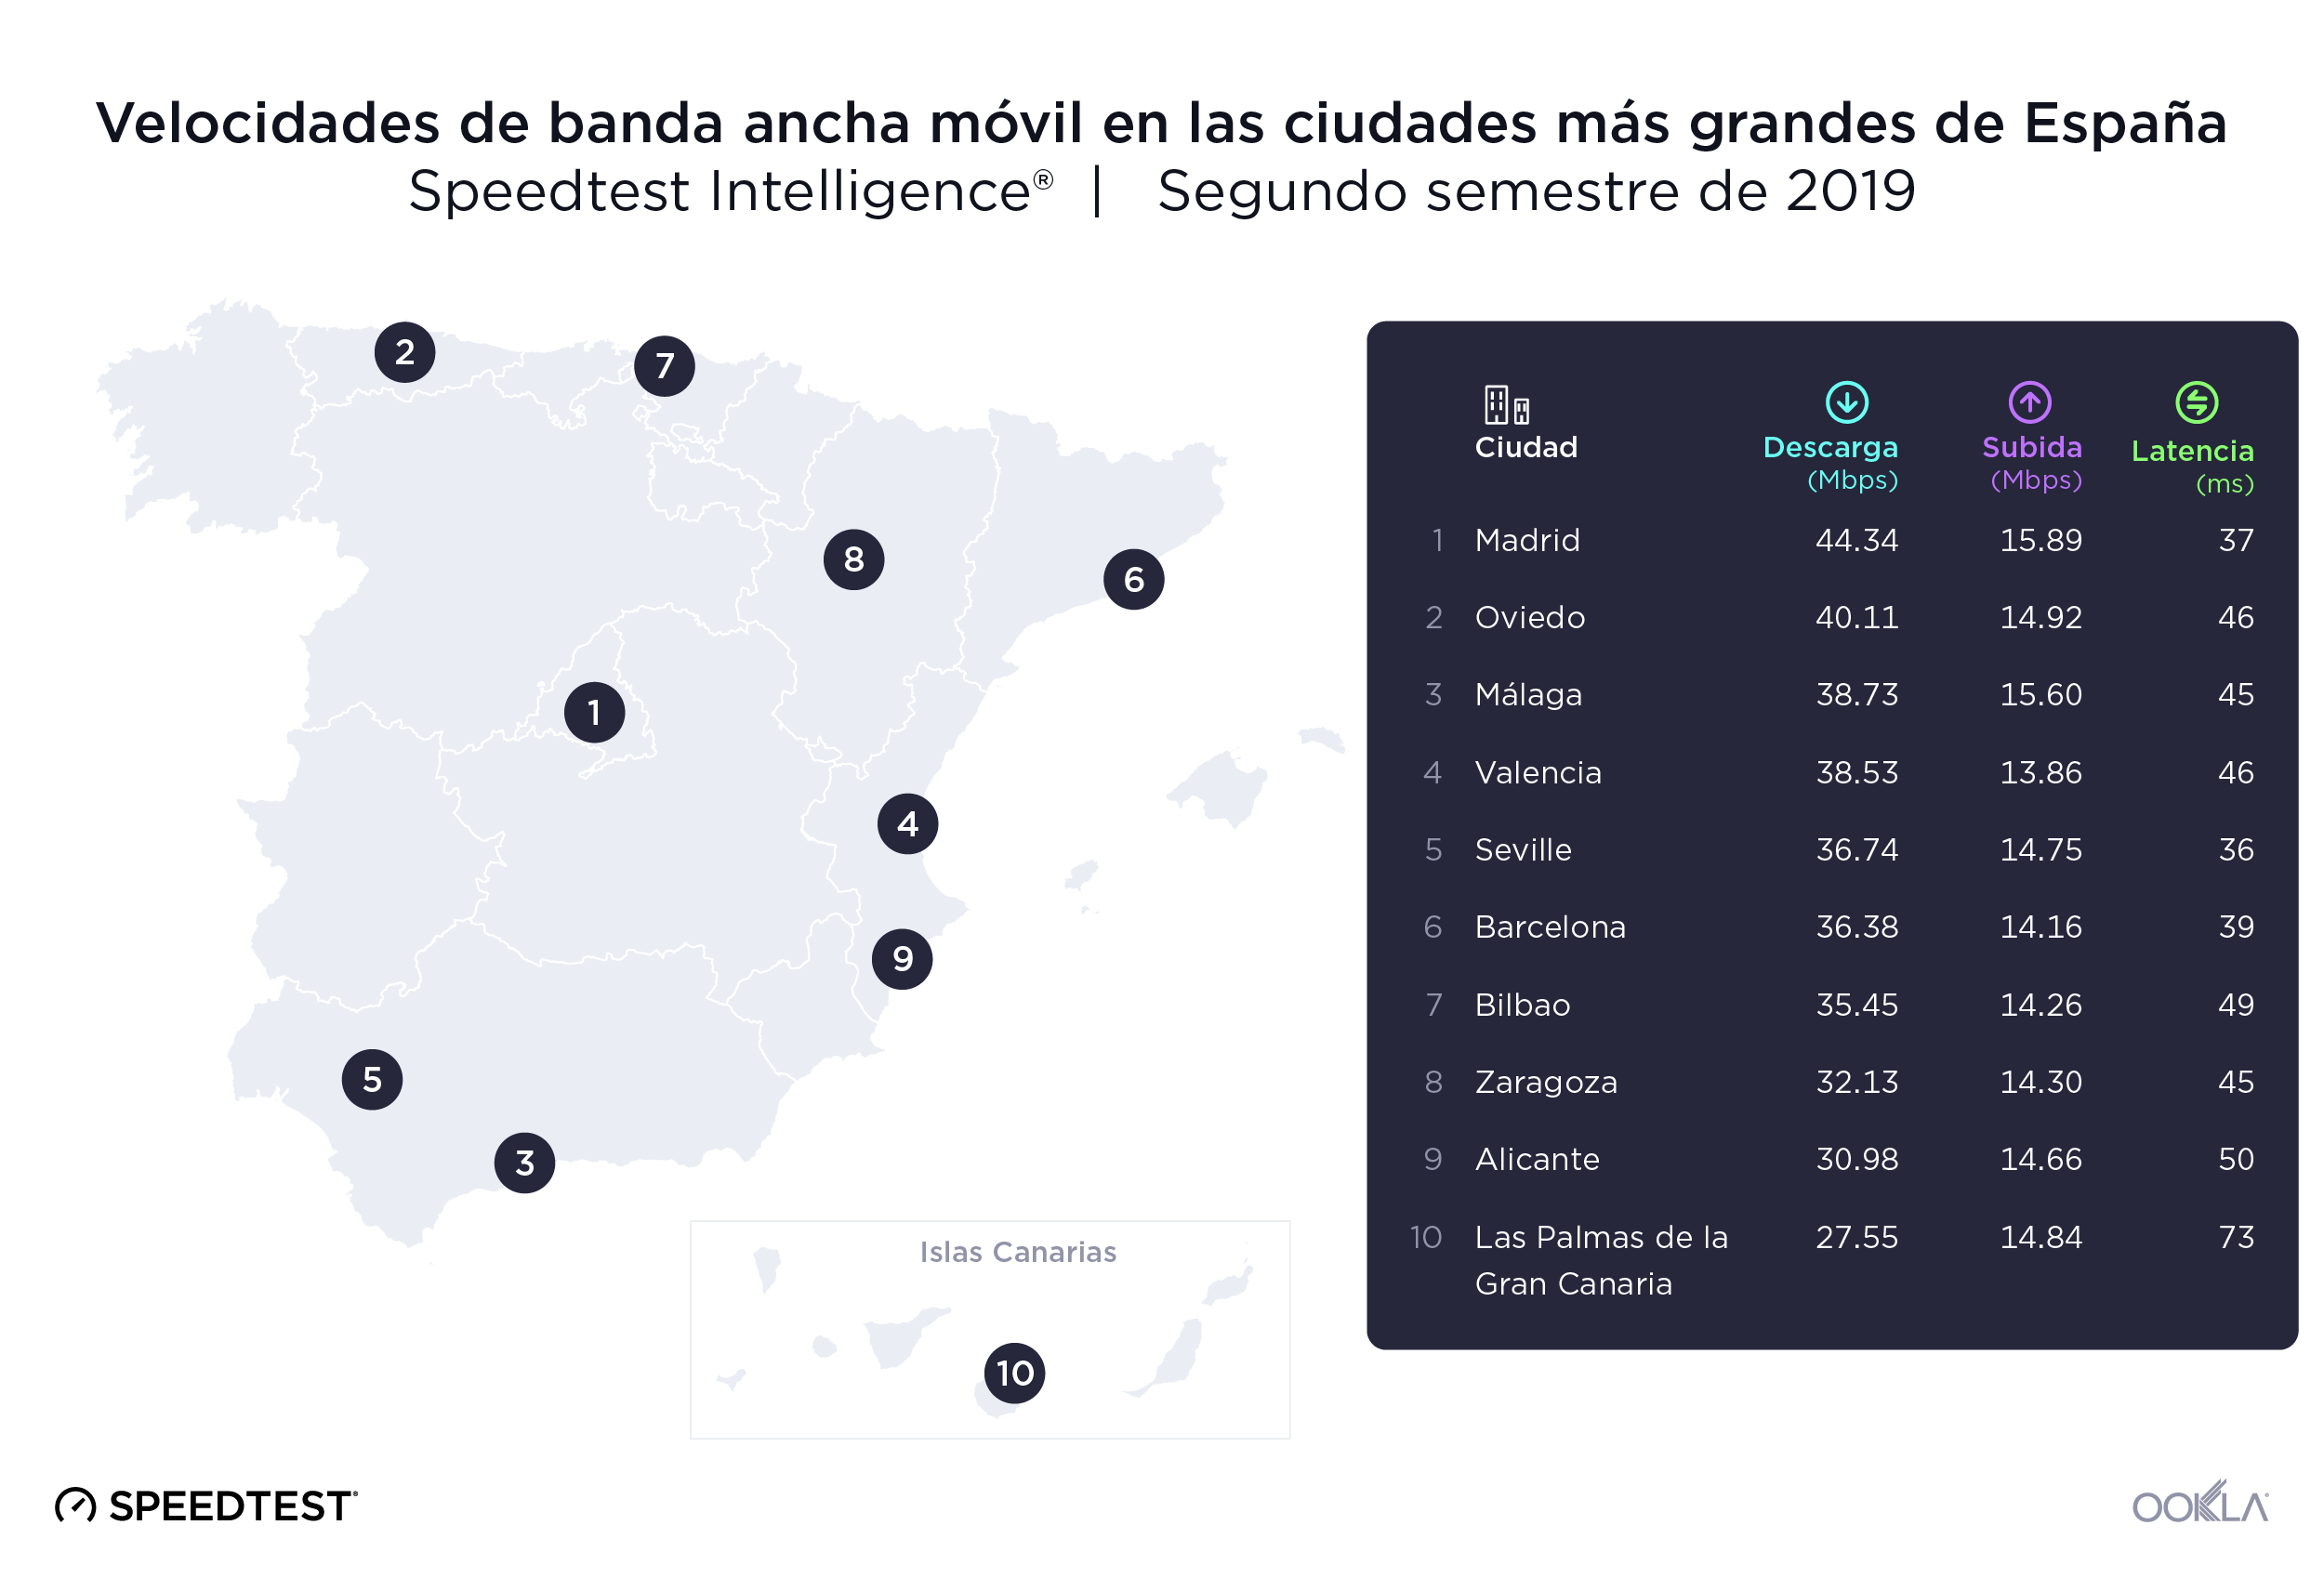
Ookla_Mobile-Broadband-Speeds_Spain_0220_es-1
La brecha entre las velocidades más rápidas y más lentas de las ciudades españolas por banda ancha móvil fue similar a la que apreciamos en la banda ancha fija en el segundo semestre de 2019. Madrid volvió a liderar el rendimiento de la banda ancha móvil con una velocidad media de descarga de 44,35 Mbps y una velocidad media de subida de 15,89 Mbps. Las Palmas quedó en último lugar en velocidades de descarga con un 37,9 % menos de velocidad media de descarga que Madrid. Valencia registró la velocidad de subida media más baja por Internet móvil: 13,86 Mbps. Sevilla obtuvo la menor latencia por Internet móvil con 36 ms en el segundo semestre de 2019 y Las Palmas registró la mayor latencia por Internet móvil con 73 ms.

Zaragoza lideró la disponibilidad de 4G en las ciudades españolas más pobladas

Disponibilidad de 4G en las ciudades más grandes de España
Speedtest Intelligence® | Segundo semestre de 2019
Ciudad Disponibilidad de 4G
Zaragoza 97,2 %
Valencia 97,1 %
Sevilla 96,8 %
Málaga 96,7 %
Oviedo 95,4 %
Madrid 95,1 %
Las Palmas de la Gran Canaria 95,0 %
Alicante 94,6 %
Bilbao 94,3 %
Barcelona 87,7 %

La disponibilidad de 4G en las ciudades más grandes de España superó el promedio del país, siendo Zaragoza la de mayor disponibilidad de 4G con el 97,2 % de las ubicaciones analizadas. Barcelona tuvo la menor disponibilidad de 4G de nuestra lista, con el 87,7 %.

MÁSMÓVIL fue el proveedor de banda ancha fija más rápido de 6 ciudades

Si nos fijamos específicamente en la puntuación de velocidad en cada una de las ciudades españolas en el segundo semestre de 2019, vemos que MÁSMÓVIL fue el proveedor más rápido en seis ciudades: Málaga, Sevilla, Zaragoza, Madrid, Valencia y Alicante. Adamo, el proveedor fijo más rápido de Barcelona, consiguió la puntuación de velocidad más alta de la lista con 185,29. Vodafone fue el proveedor más rápido en Bilbao y Oviedo.

Rendimiento de la banda ancha fija por operador en las ciudades más grandes de España
Speedtest Intelligence® | Segundo semestre de 2019
Ciudad Proveedor Speed ScoreTM
Barcelona Adamo 185,29
Málaga MÁSMÓVIL 156,24
Sevilla MÁSMÓVIL 148,78
Madrid MÁSMÓVIL 145,83
Bilbao Vodafone 144,65
Zaragoza MÁSMÓVIL 144,40
Valencia MÁSMÓVIL 143,99
Oviedo Vodafone 143,85
Alicante MÁSMÓVIL 143,72
Las Palmas Orange 114,46

Si nos fijamos en los proveedores españoles más rápidos en banda ancha móvil de cada ciudad en el segundo semestre de 2019, Movistar dominó la lista con la puntuación de velocidad más alta en 7 ciudades. Movistar consiguió también la puntuación de velocidad máxima, con 52,04 en Sevilla. Vodafone fue el proveedor de Internet móvil más rápido en Madrid (35,67). Orange fue el proveedor más rápido de Barcelona (35,37) y Oviedo (45,10).

Rendimiento de Internet móvil por operador en las ciudades más grandes de España
Speedtest Intelligence® | Segundo semestre de 2019
Ciudad Proveedor Speed ScoreTM
Sevilla Movistar 52,04
Valencia Movistar 50,80
Alicante Movistar 50,36
Málaga Movistar 48,97
Bilbao Movistar 48,86
Oviedo Orange 45,10
Zaragoza Movistar 40,79
Madrid Vodafone 35,67
Barcelona Orange 35,37
Las Palmas Movistar 31,37

Nos encantará seguir la evolución de estos mercados y estudiar el cambiante panorama del rendimiento de Internet y de la cobertura móvil en Europa. Si desea obtener más información sobre las velocidades fijas y móviles en diferentes mercados, haga clic aquí para leer más información de Ookla.

Nota del editor: Este artículo fue actualizado el 4 de marzo del 2020 que para corregir un error de edición que reportaba cifras incorrectas del PRA móvil.

Ookla retains ownership of this article including all of the intellectual property rights, data, content graphs and analysis. This article may not be quoted, reproduced, distributed or published for any commercial purpose without prior consent. Members of the press and others using the findings in this article for non-commercial purposes are welcome to publicly share and link to report information with attribution to Ookla.

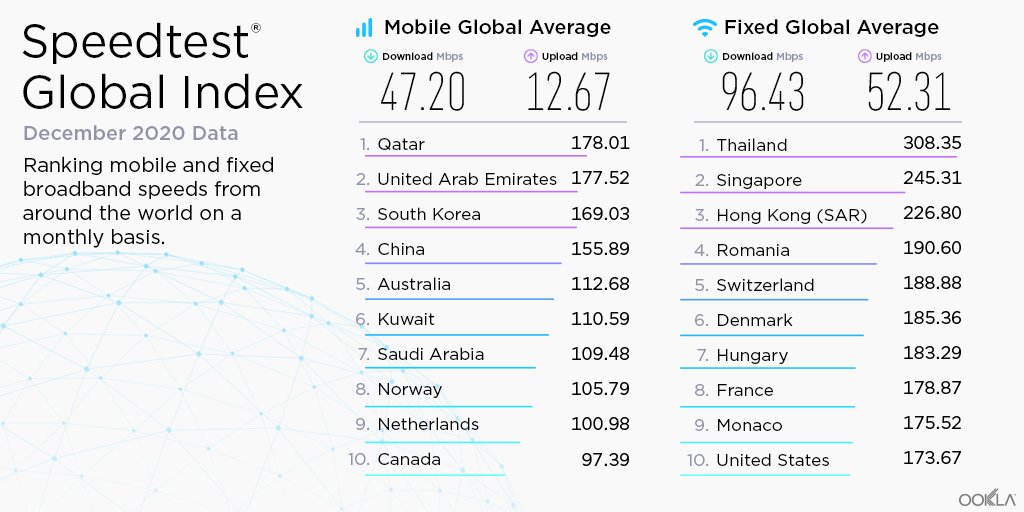
| January 20, 2021

ICYMI: Ookla Data and Research from December 2020


Highlights from the Speedtest Global IndexTM

Global-Index-Tweet-Image-Dec-2020

These are the top stories from December 2020:

  • Thailand has climbed two spots on fixed broadband to reach first place for the first time.
  • On mobile, Qatar climbed two spots to land in first place for mobile. While the country has ranked among the top five for the past year, this is the first time the country has reached the top spot.
  • Hungary has been steadily climbing the fixed broadband chart and currently ranks seventh.
  • Kuwait has reached sixth place, its highest mobile ranking to date, most likely due to an expanding 5G market.

New Global Index Market Analyses

United States

AT&T had the fastest Speed ScoreTM in the U.S. on mobile in Q4 2020. Washington, DC showed the fastest median mobile download speed while Gilbert, AZ was the fastest city for fixed broadband.

Canada

Bell showed the fastest median download speed on 5G during Q4 2020. The city of Edmonton had the fastest mean download speed over fixed broadband and mobile.

China

China Telecom showed the fastest Speed Score on fixed broadband. China Telecom was also fastest on mobile 5G and had the highest 4G Availability on mobile. China Mobile showed the fastest Speed Score on mobile.

France

Lyon showed the fastest mean download speed over fixed broadband while Nice was fastest on mobile. Orange had the fastest Speed Score on mobile overall and on 5G. Free was the fastest provider for fixed broadband.

Indonesia

Telkomsel was the fastest mobile operator in Indonesia during Q3-Q4 2020 while Biznet was the fastest ISP. IM3 Ooredoo had the highest 4G Availability among mobile operators.

New Global Index Market Analyses are also available for:

Articles worth a second look

2020 Recap: How the Internet Held Up During a Global Pandemic


This comprehensive report reveals how speeds over fixed broadband held up in 2020 using data from Speedtest Intelligence®.

Apple has 5G! But How Fast is the iPhone 12?


Find out how Apple’s iPhone 12 series performed in select cities around the world in Q4 2020.

Ookla retains ownership of this article including all of the intellectual property rights, data, content graphs and analysis. This article may not be quoted, reproduced, distributed or published for any commercial purpose without prior consent. Members of the press and others using the findings in this article for non-commercial purposes are welcome to publicly share and link to report information with attribution to Ookla.

| January 27, 2021

There's a Problem With Your Connection — The Most Significant Outages of Q4 2020


“We’re experiencing problems” was a common phrase faced by users who encountered outages during Q4 2020. We are continuing our series tracking outages in online services using Downdetector® data from Q4 2020. Once more we have focused on seven categories: cloud services, email service providers, financial services, gaming, internet service providers, social media and streaming services.

Cloud services

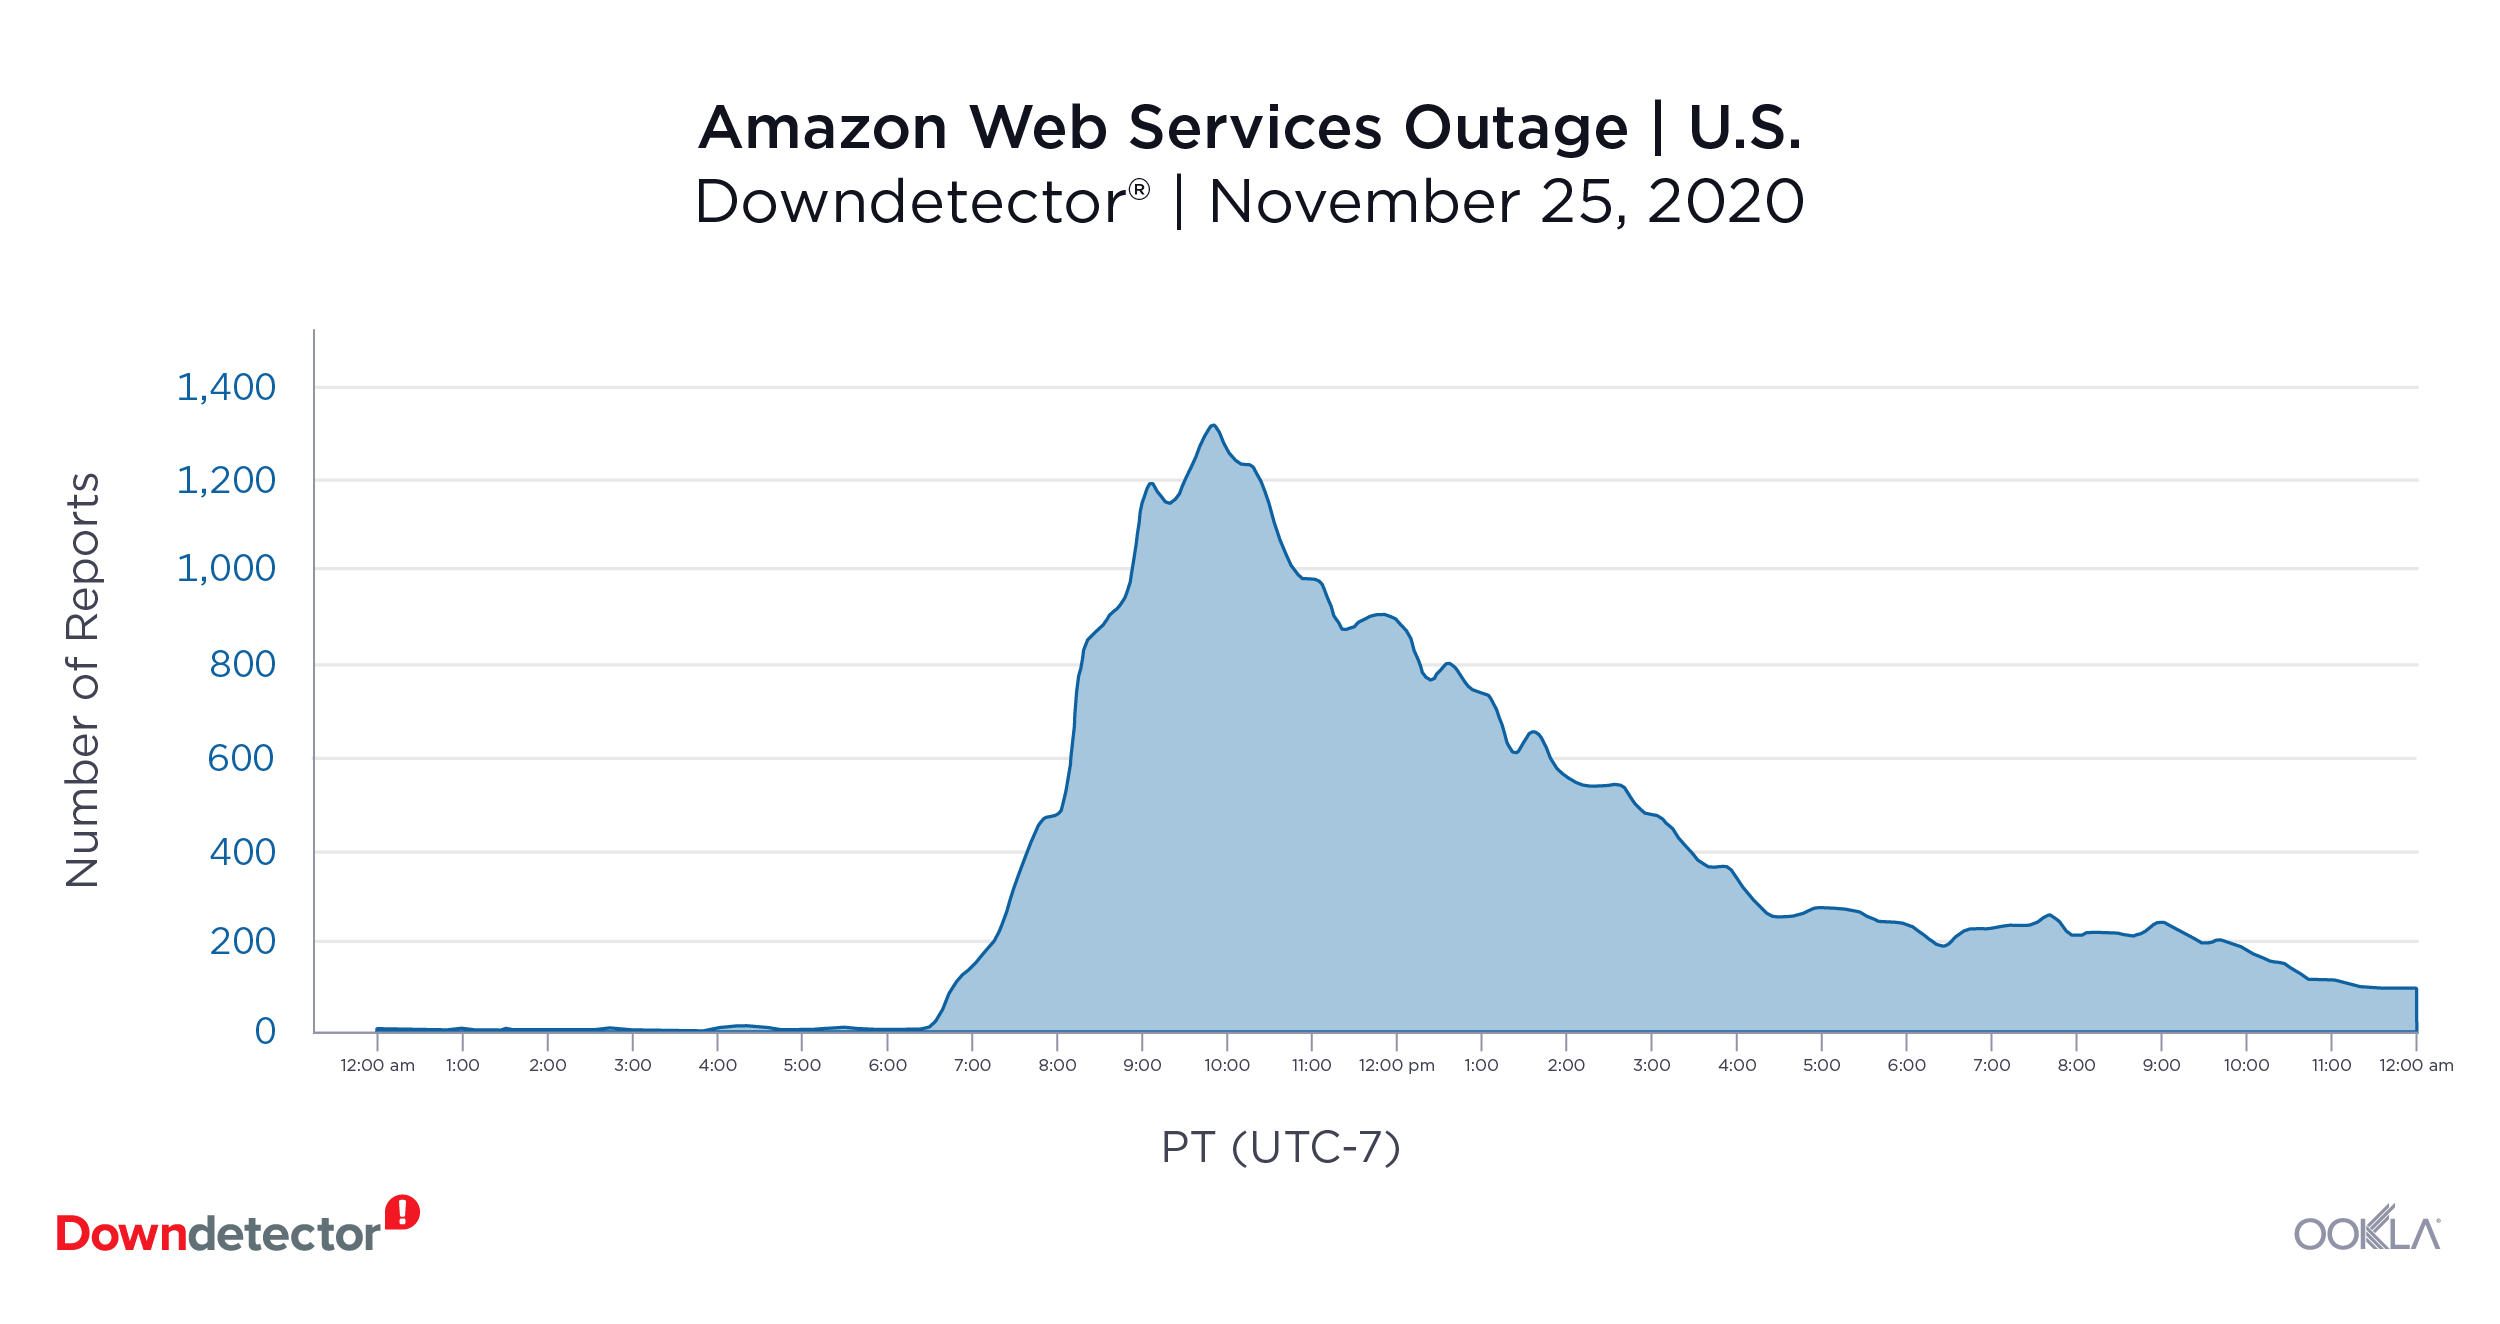
Downdetector_AWS_Outage_0121-1

Amazon Web Services (November 25, 2020): 1,313 reports at peak

Users of Amazon’s cloud service noticed a disruption in their service on November 25. Most users stated they were having problems with the AWS Console. The outage affected users in India, Japan, the Netherlands and the U.S. At the peak of outage reports at 8:45 a.m. Pacific, there were 1,313 logged issues in the U.S.

Email service providers

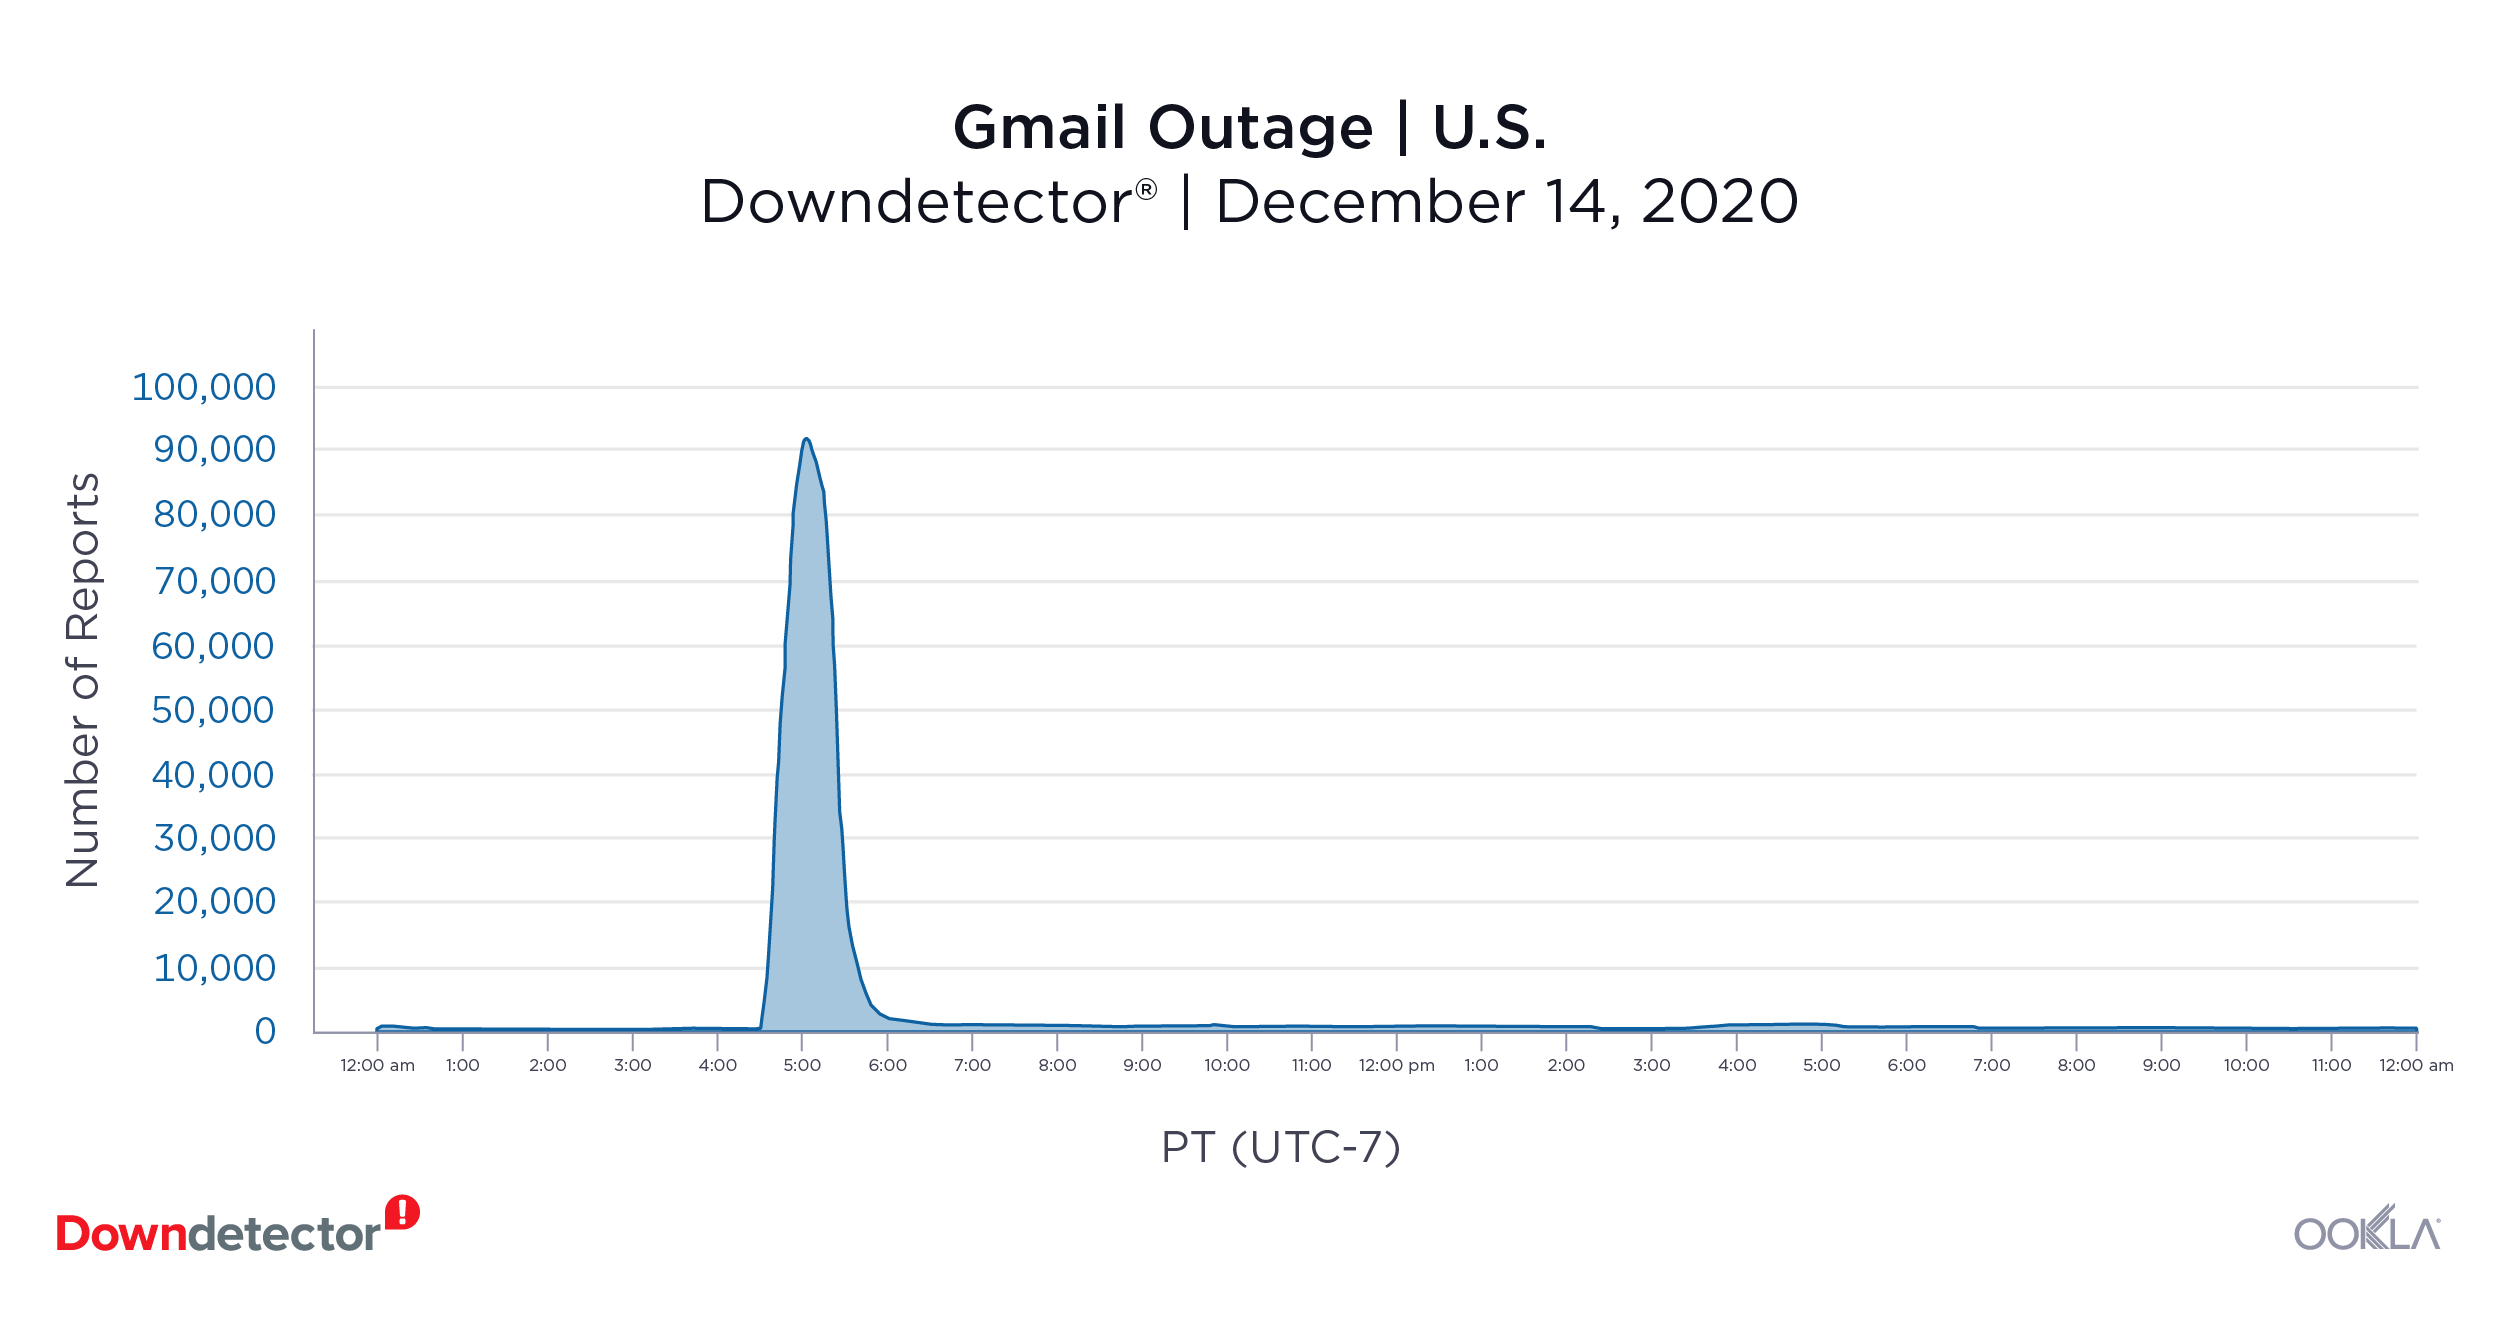
Downdetector_Gmail_Outage_0121

Gmail (December 14, 2020): 90,409 reports at peak

On December 14, users were unable to access their Gmail accounts for over an hour. That day, there were over 90,000 logged issues with the email service provider in the U.S. Users were unable to log into their accounts, send or receive emails. The outage also affected users in Finland, Germany, India, Japan, Poland, the Philippines and Spain.

Financial services

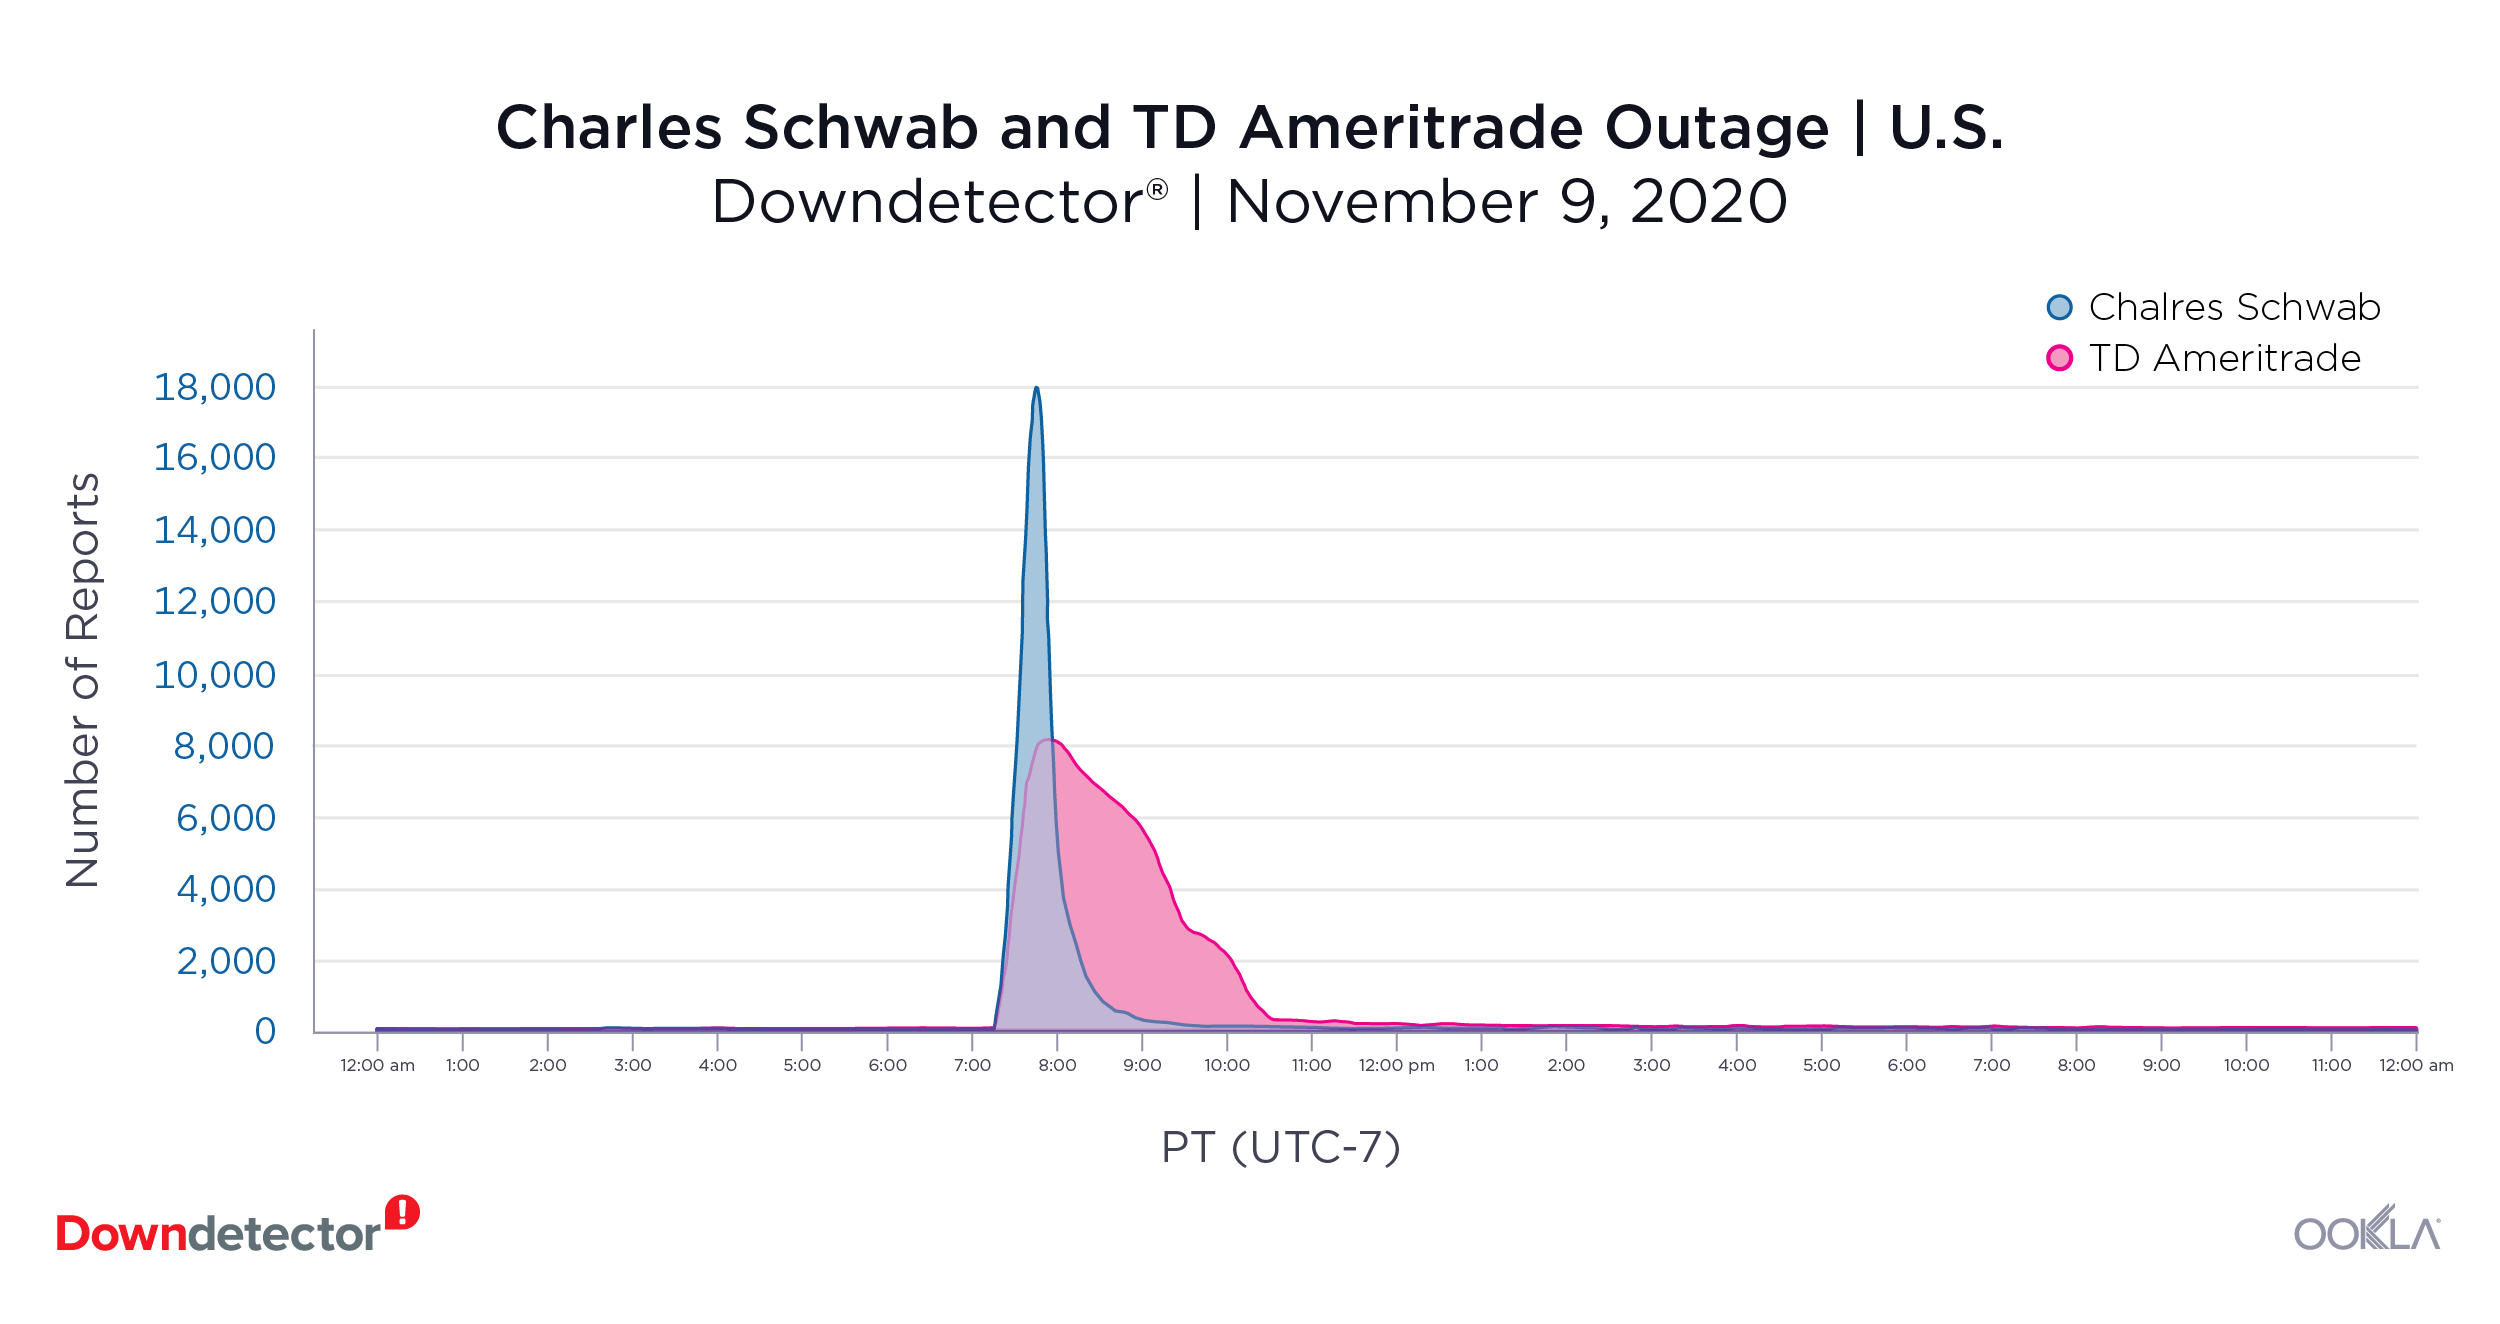
Downdetector_Schwab_Ameritrade_Outage_0121-2

Charles Schwab (November 9, 2020): 17,906 reports at peak

Charles Schwab users experienced problems when trying to log into their accounts on November 9, most likely caused by a surge in activity after news about the Pfizer COVID-19 vaccine were published. The outage lasted for a little over an hour, and there were 17,906 reported issues at the peak of the outage at 6:45 a.m. Pacific. Most error logs came from Chicago, Dallas, and New York City.

TD Ameritrade (November 9, 2020): 8,014 reports at peak

This electronic trading platform also had an outage early in the morning of November 9. Users from Chicago, Dallas, Houston and Brooklyn logged issues on Downdetector and were unable to access their account. At the peak of outage reports at 7:00 a.m. Pacific, there were 8,014 issues logged in the U.S.

Merrill Lynch (November 24, 2020): 2,850 reports at peak

While Merrill Lynch was not immune to reported problems on November 9, the financial service experienced a larger outage on November 24. Users in the U.S. logged 2,850 issues at the peak of the outage at 7:15 a.m. Pacific that day.

Gaming

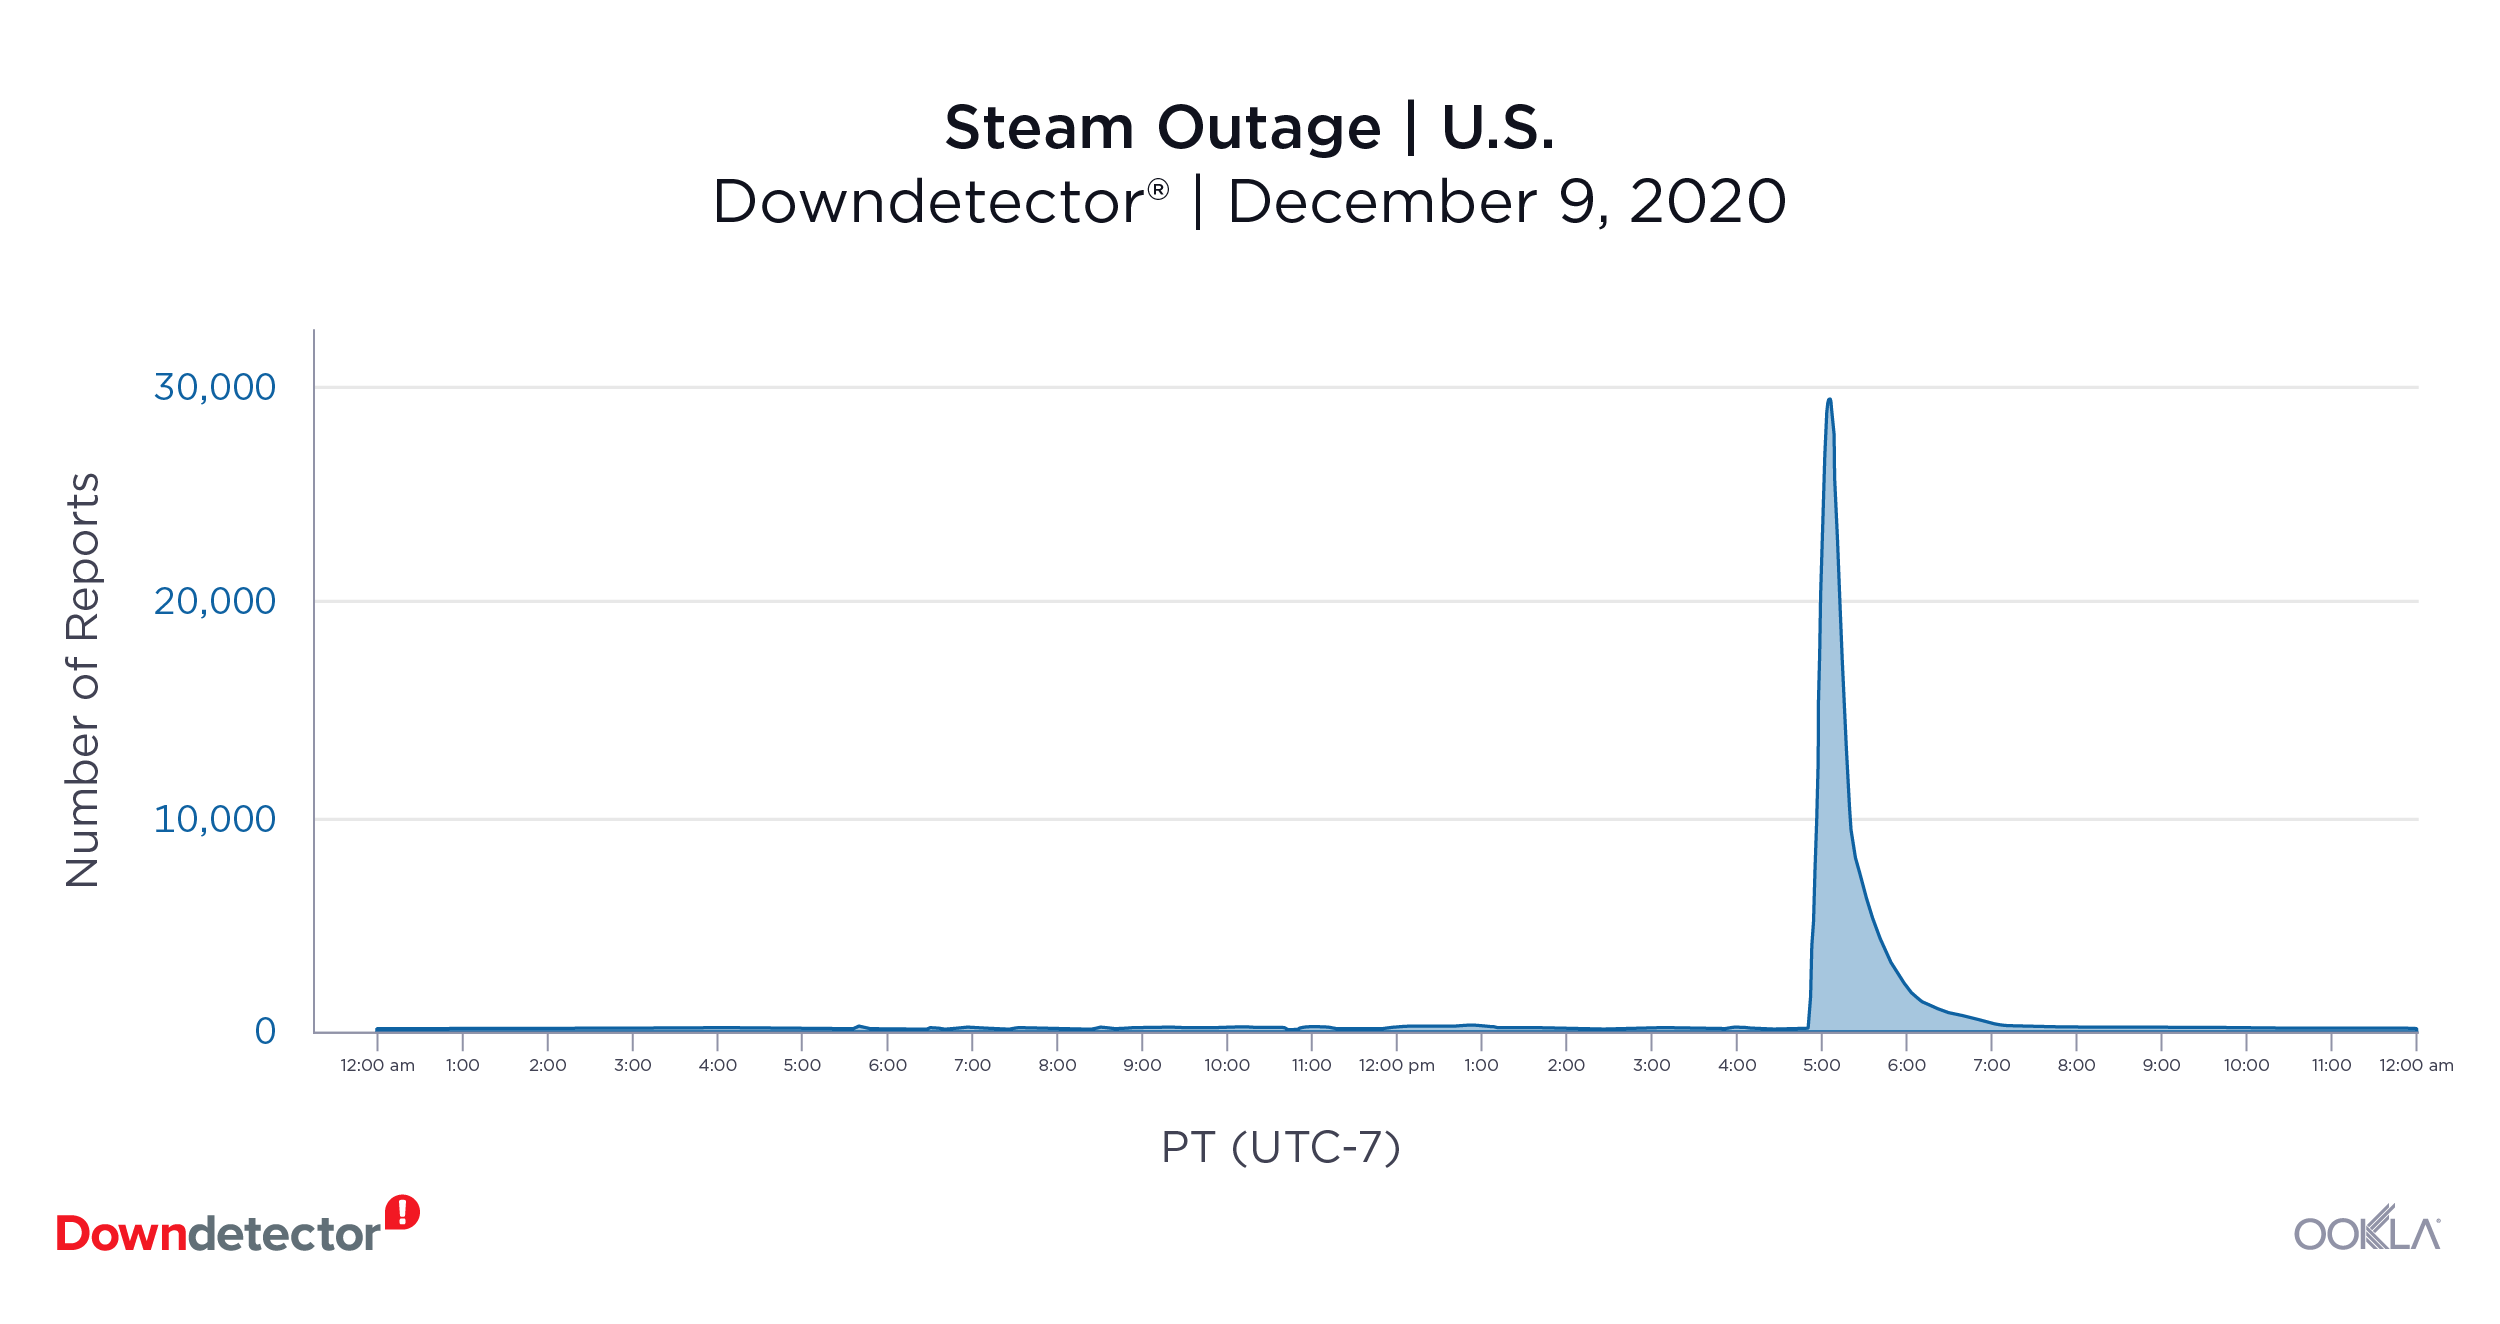
Downdetector_Steam_Outage_0121

Steam (December 9, 2020): 29,212 reports at peak

The release of the popular game Cyberpunk 77, which created a large volume of traffic on Steam, was the likely cause of Steam’s outage on December 9. Users anxious to download the newly released game became frustrated when the platform was suddenly unavailable. In the U.S. alone, there were 29,212 reported issues on Downdetector.

Internet service providers

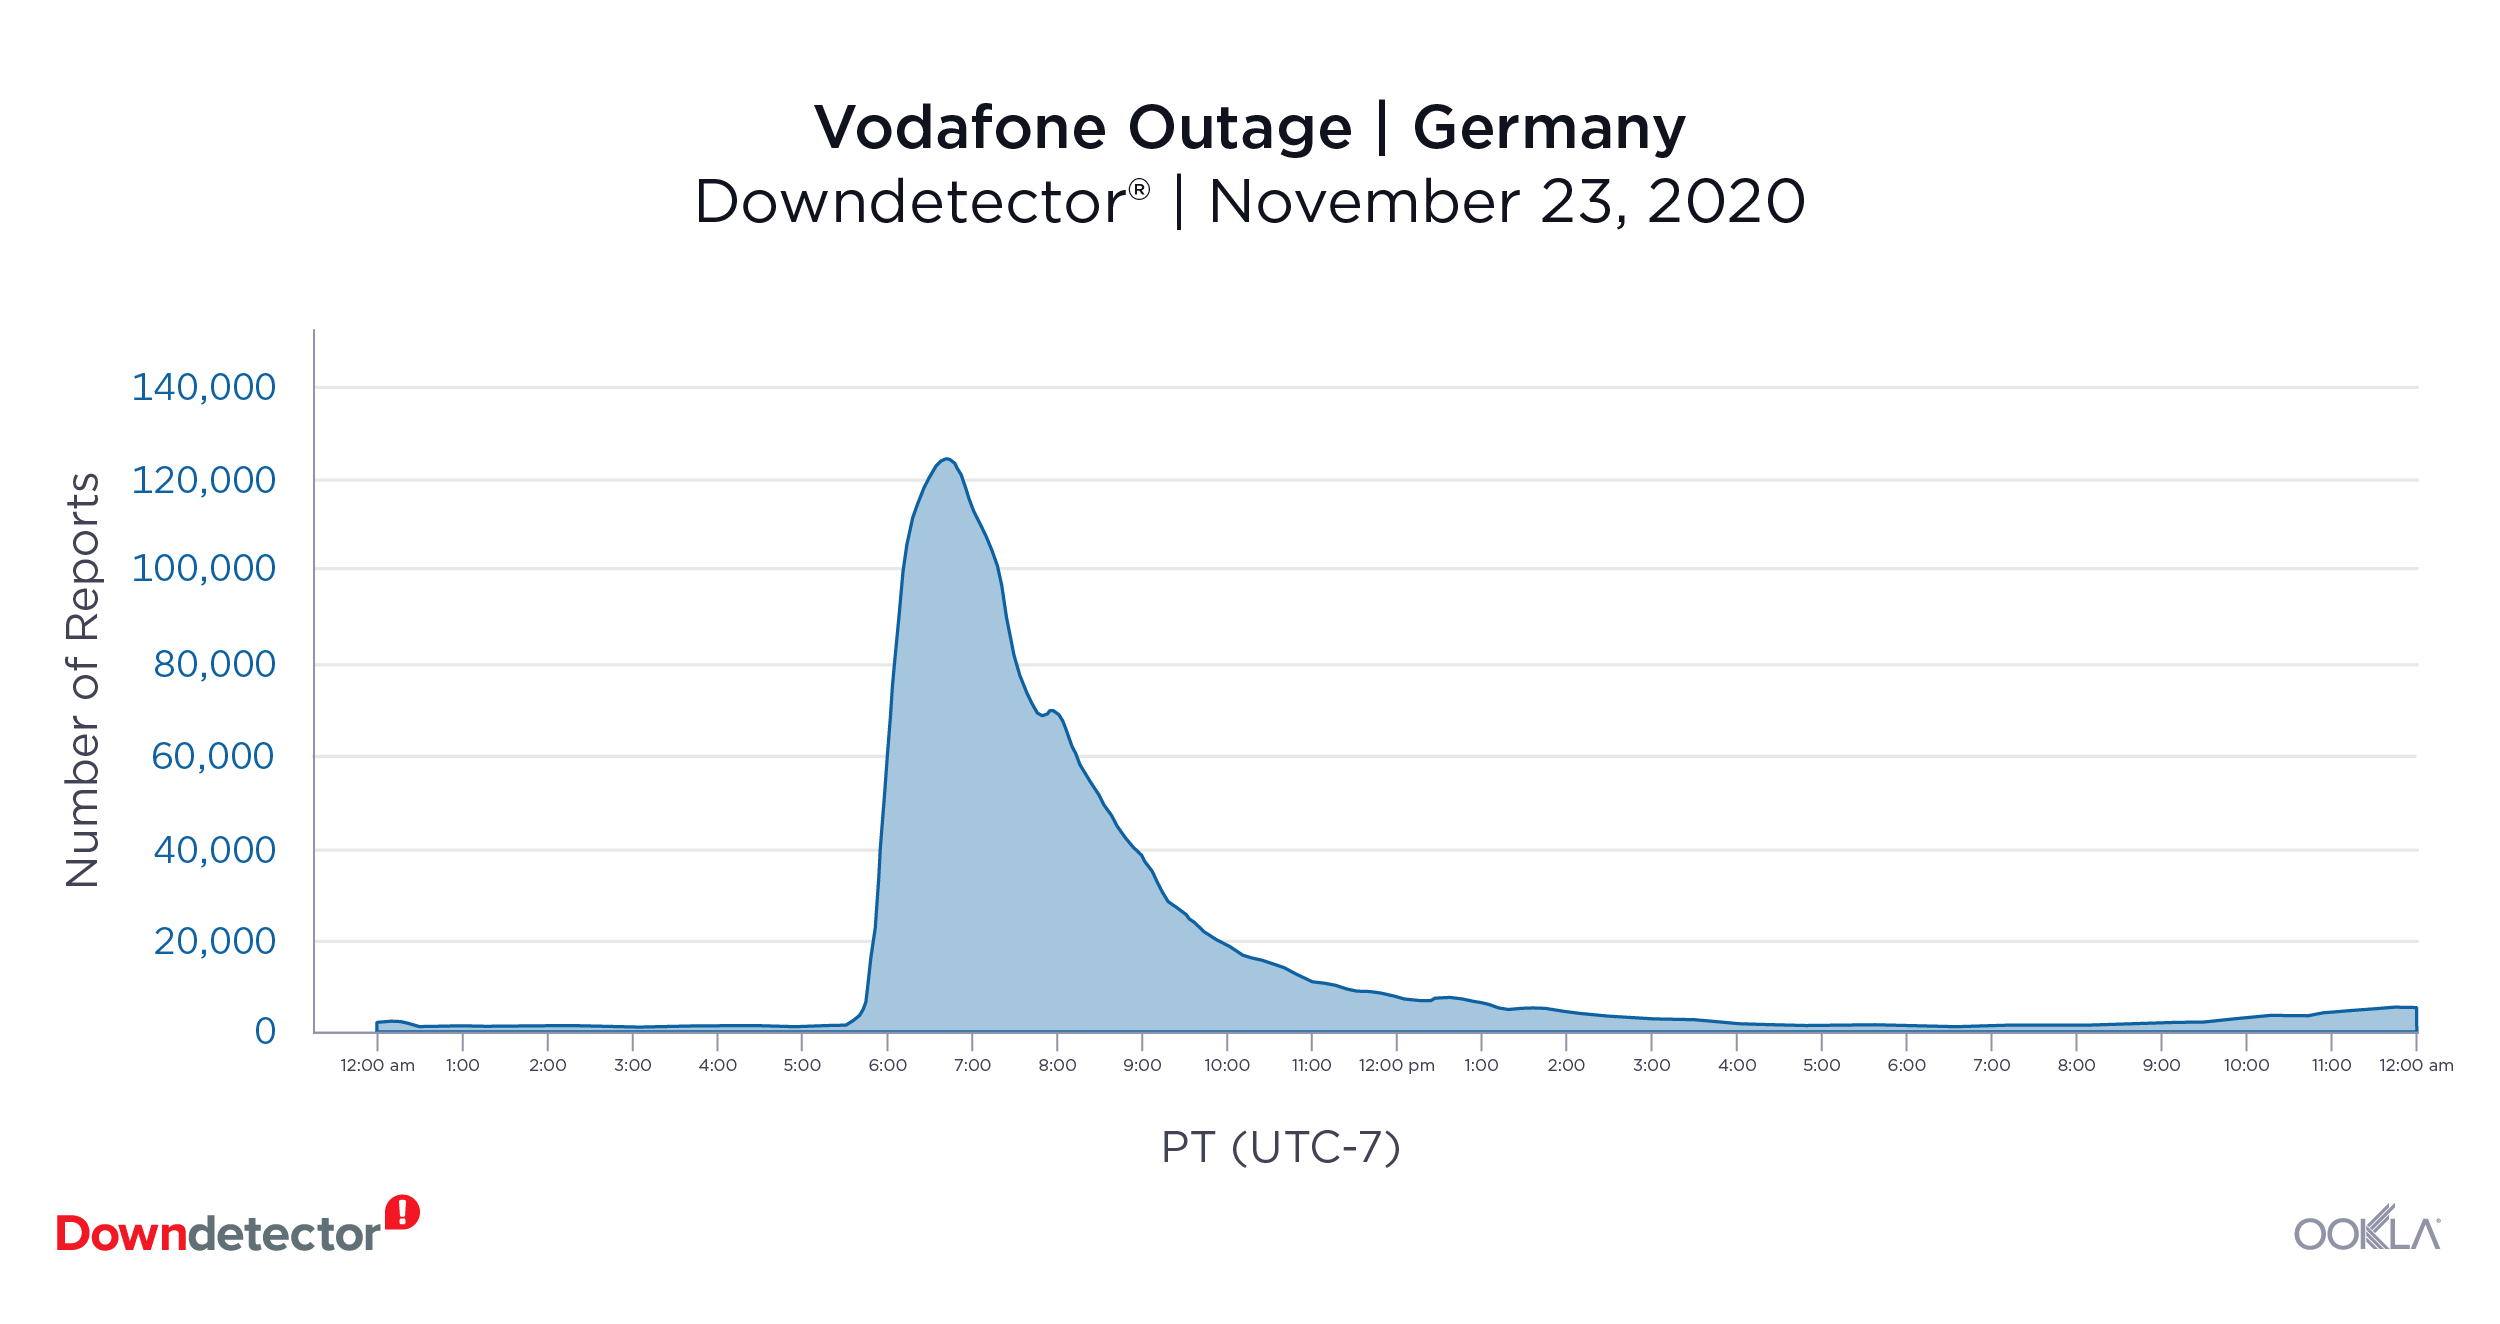
Downdetector_Vodafone_Outage_0121

Vodafone Germany (November 23, 2020): 122,627 reports at peak

Vodafone Germany’s mobile service experienced a disruption on November 23. Users from all over Germany (including Berlin, Hamburg and Munich) logged problems with their mobile service that day. At the peak of outage reports, there were 122,627 logged issues.

AT&T (December 25, 2020): 10,617 reports at peak

On Christmas Day, AT&T users in the U.S. reported problems with their mobile and internet services due to an explosion near an AT&T telecommunications hub. Downdetector logged 10,617 issues from users located in cities including Chattanooga, Lexington and Nashville.

Bouygues Telecom (December 2, 2020): 1,984 reports at peak

French users of Bouygues Telecom (primarily in Paris), noticed a disruption in their mobile service on December 2. Customers were unable to make or receive calls or use their mobile internet service for about four hours. At the peak of outage reports, there were 1,984 logged issues.

Social media

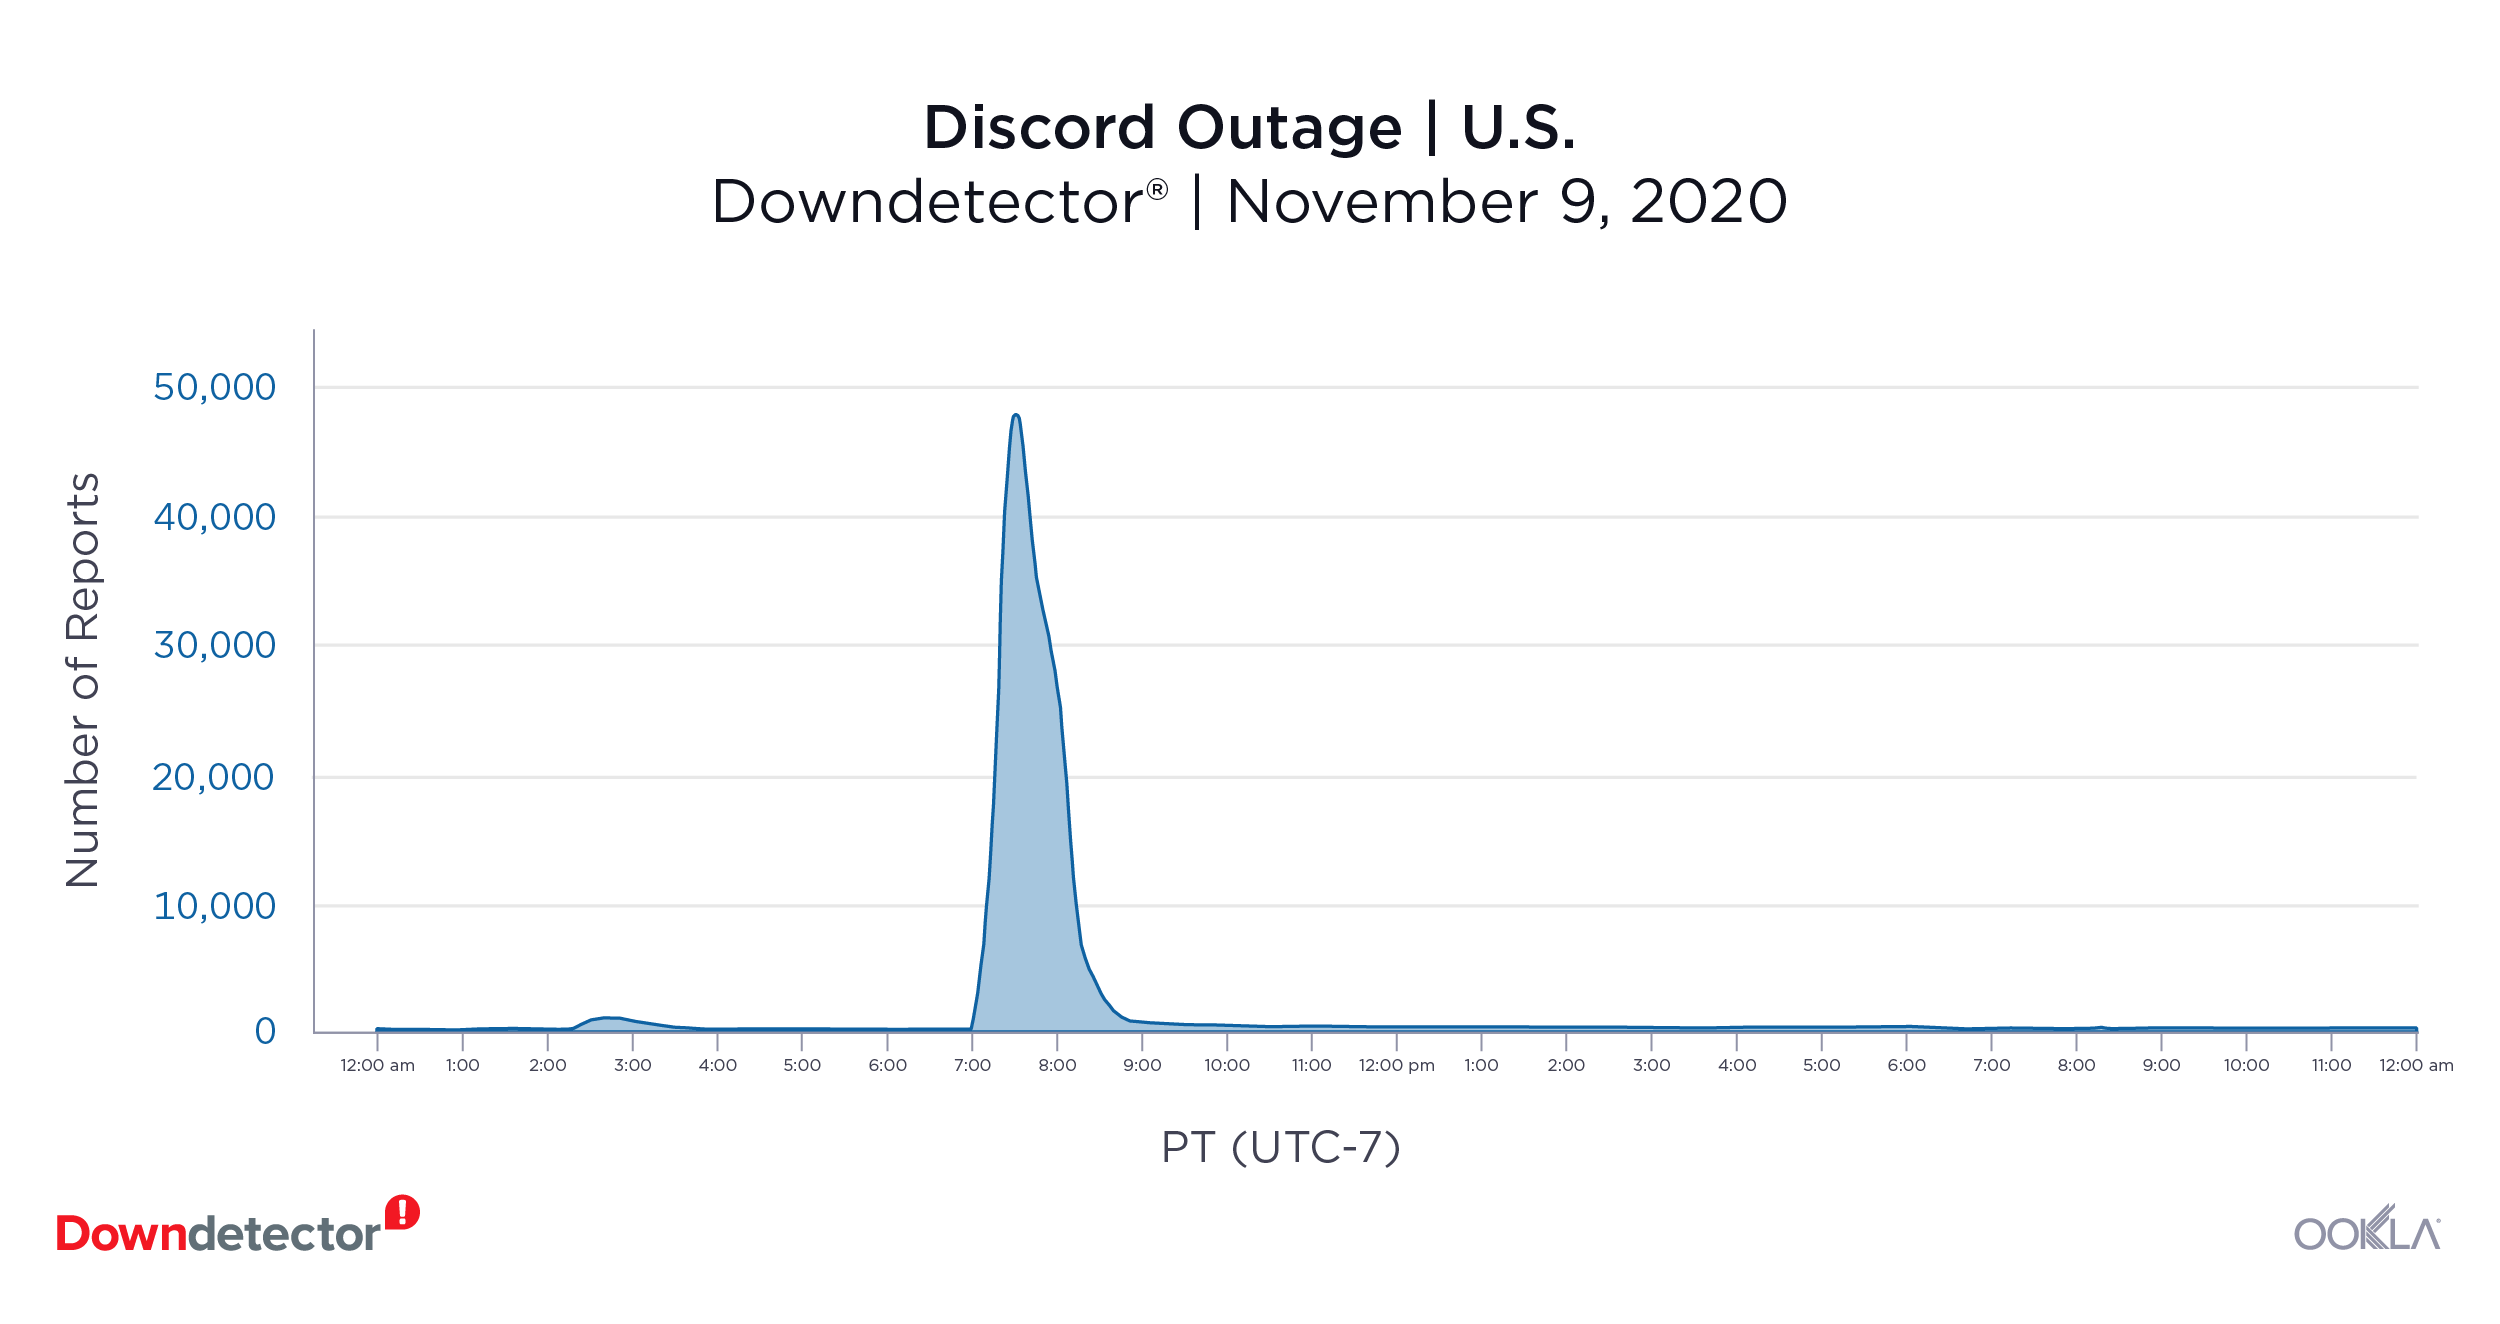
Downdetector_Discord_Outage_0121-1

Discord (November 9, 2020): 47,017 reports at peak

The instant messaging platform encountered a problem on November 9. Users in Italy, Germany, the U.K. and the U.S. recorded problems with the server connection. That day, there were almost 50,000 reports of issues on Discord in the U.S.

Telegram (December 16, 2020): 35,836 reports at peak

Telegram users in Russia reported issues with the messaging app on December 16. The outage lasted less than an hour, but Downdetector still received over 35,000 logs from users that day. The app also experienced a smaller outage on October 3 with 20,801 logged issues from users.

VKontakte (October 5, 2020): 6,427 reports at peak

VKontakte, also known as VK, had a disruption in service on October 5. Users of the Russian social media platform rushed to Downdetector to log outage reports when they were unable to log into their accounts. That day, there were 6,427 logs of issues at the peak of the outage reports.

Streaming services

Downdetector_YouTube_Outage_0121

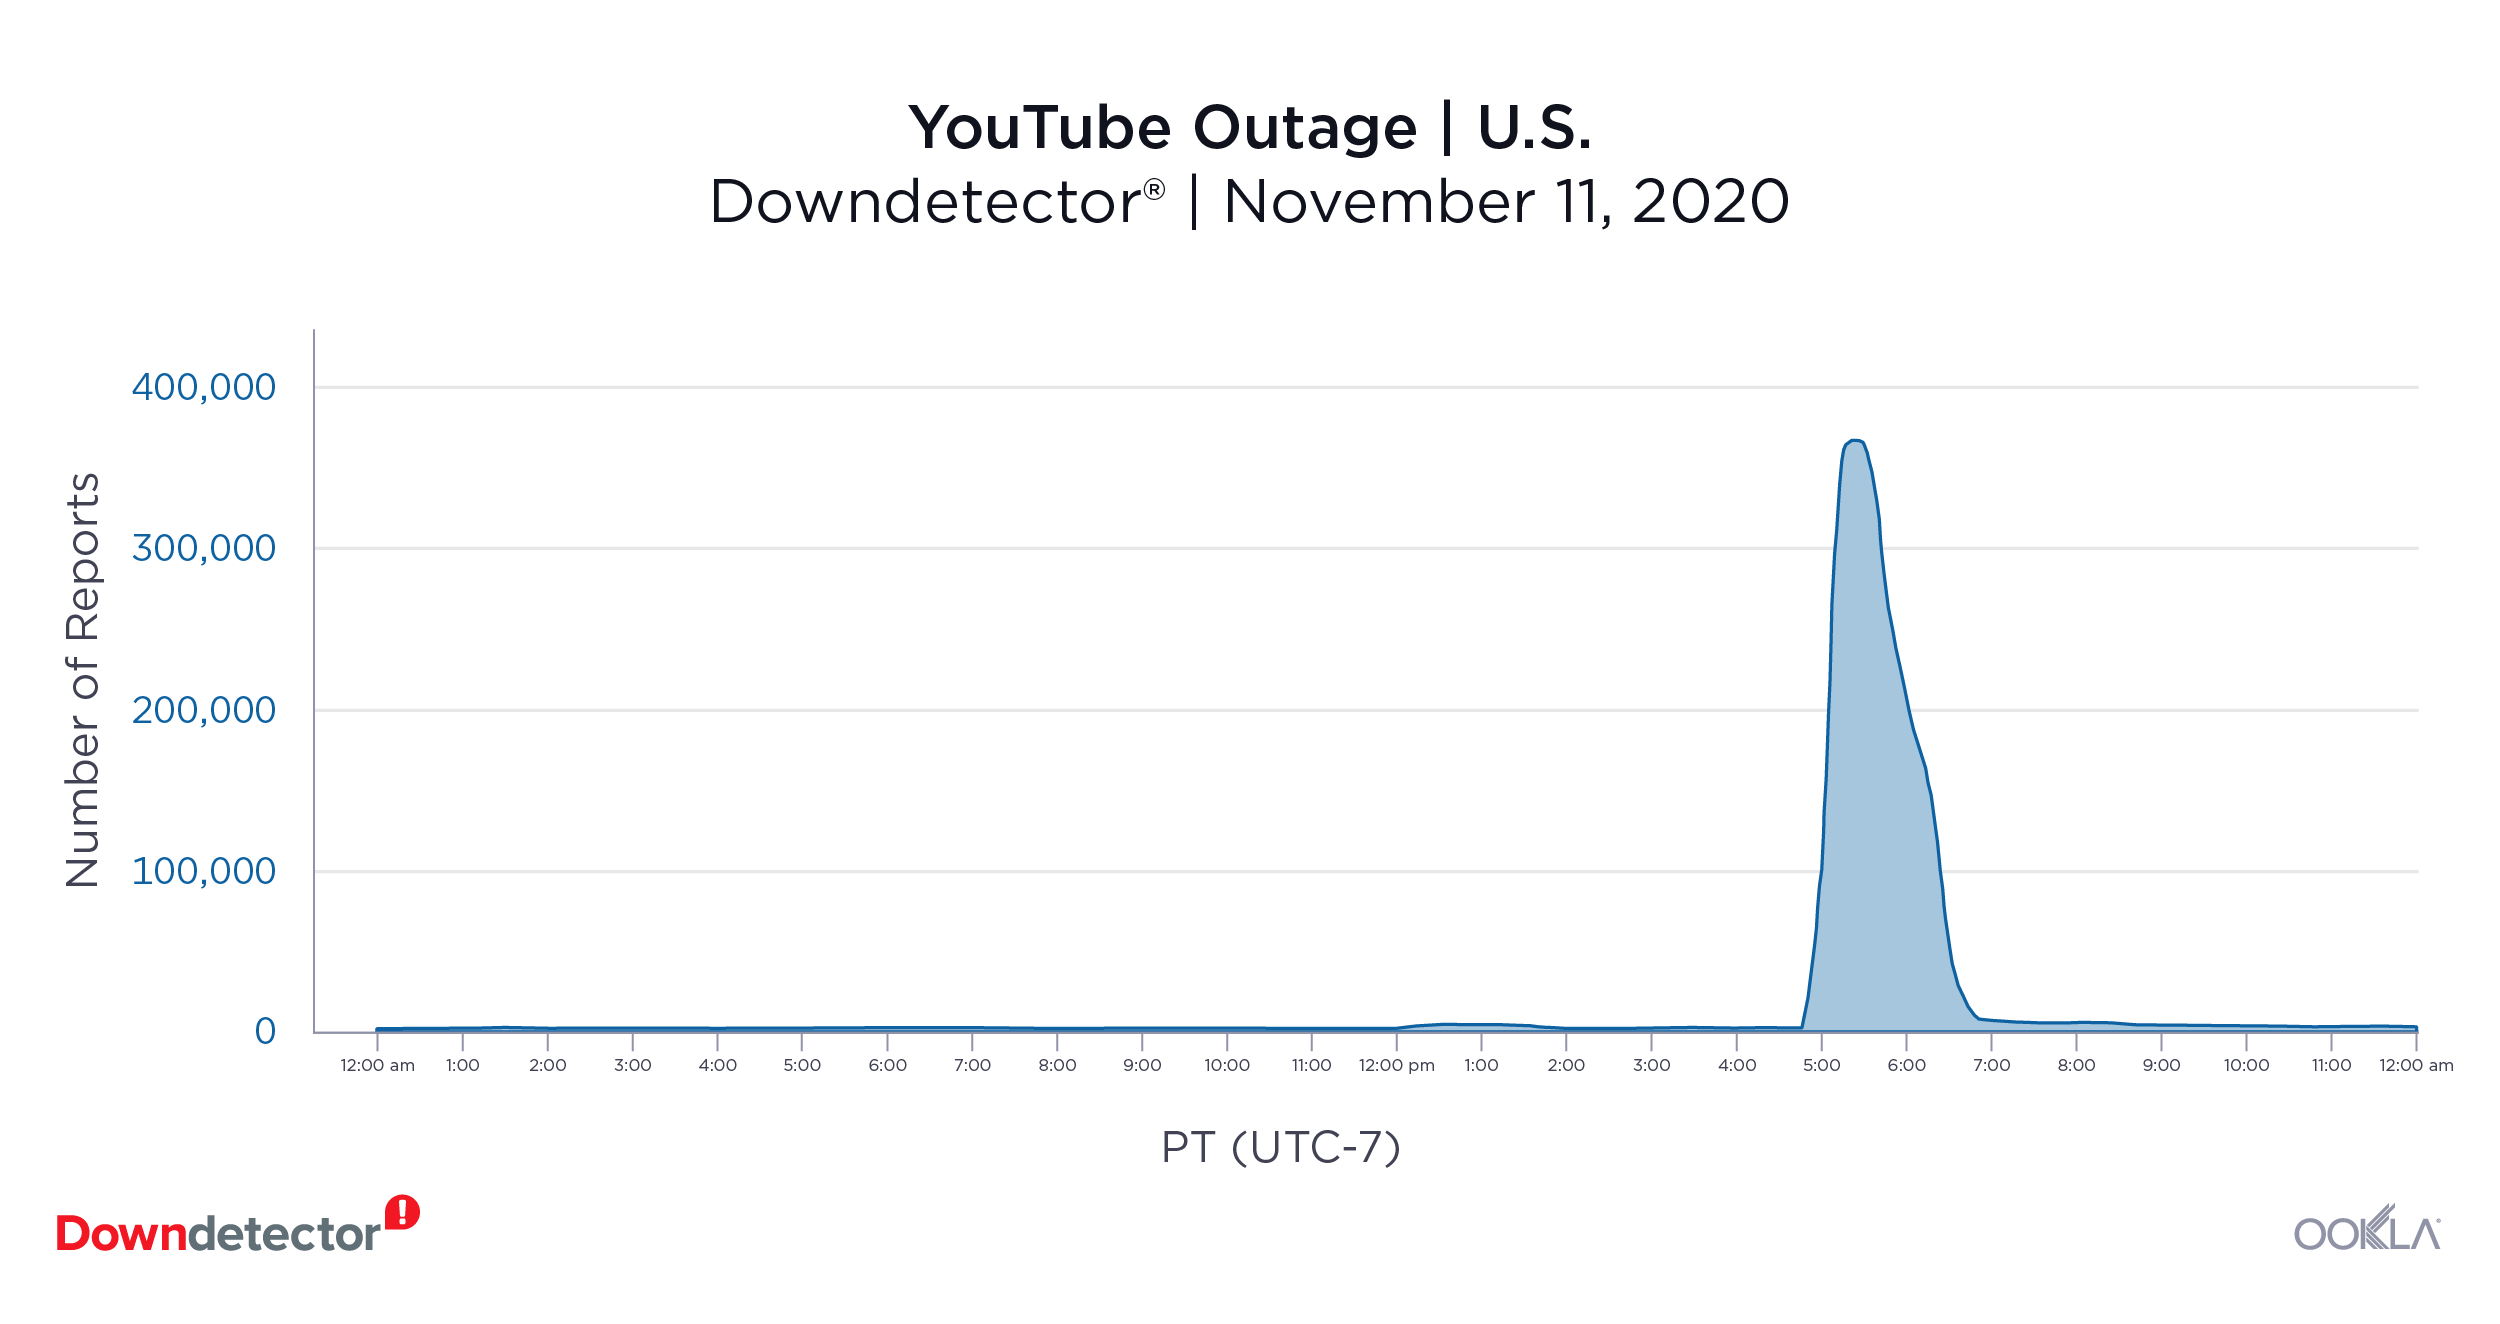
YouTube (November 11, 2020): 357,876 reports at the peak

The Google-owned video streaming service had trouble loading content for their users on November 11. Logs of issues with the service were recorded in Australia, France, Japan, Italy, the U.K and the U.S. Over 300,000 logs were recorded in the U.S. at the peak of the outage reports at 3:30 p.m. Pacific.

Spotify (November 27, 2020): 16,802 reports at the peak

On November 27, users of the popular music streaming service logged issues with the platform. Users in Germany, the U.K. and the U.S. were unable to stream their favorite songs or podcasts. Downdetector recorded 16,802 logs of issues in the U.S. at the peak of the outage reports.

Want to know when an online service is down? Keep up with outages by visiting Downdetector.

Ookla retains ownership of this article including all of the intellectual property rights, data, content graphs and analysis. This article may not be quoted, reproduced, distributed or published for any commercial purpose without prior consent. Members of the press and others using the findings in this article for non-commercial purposes are welcome to publicly share and link to report information with attribution to Ookla.

| June 16, 2021

How COVID-19 Affected Roaming for Mobile Speeds in Europe

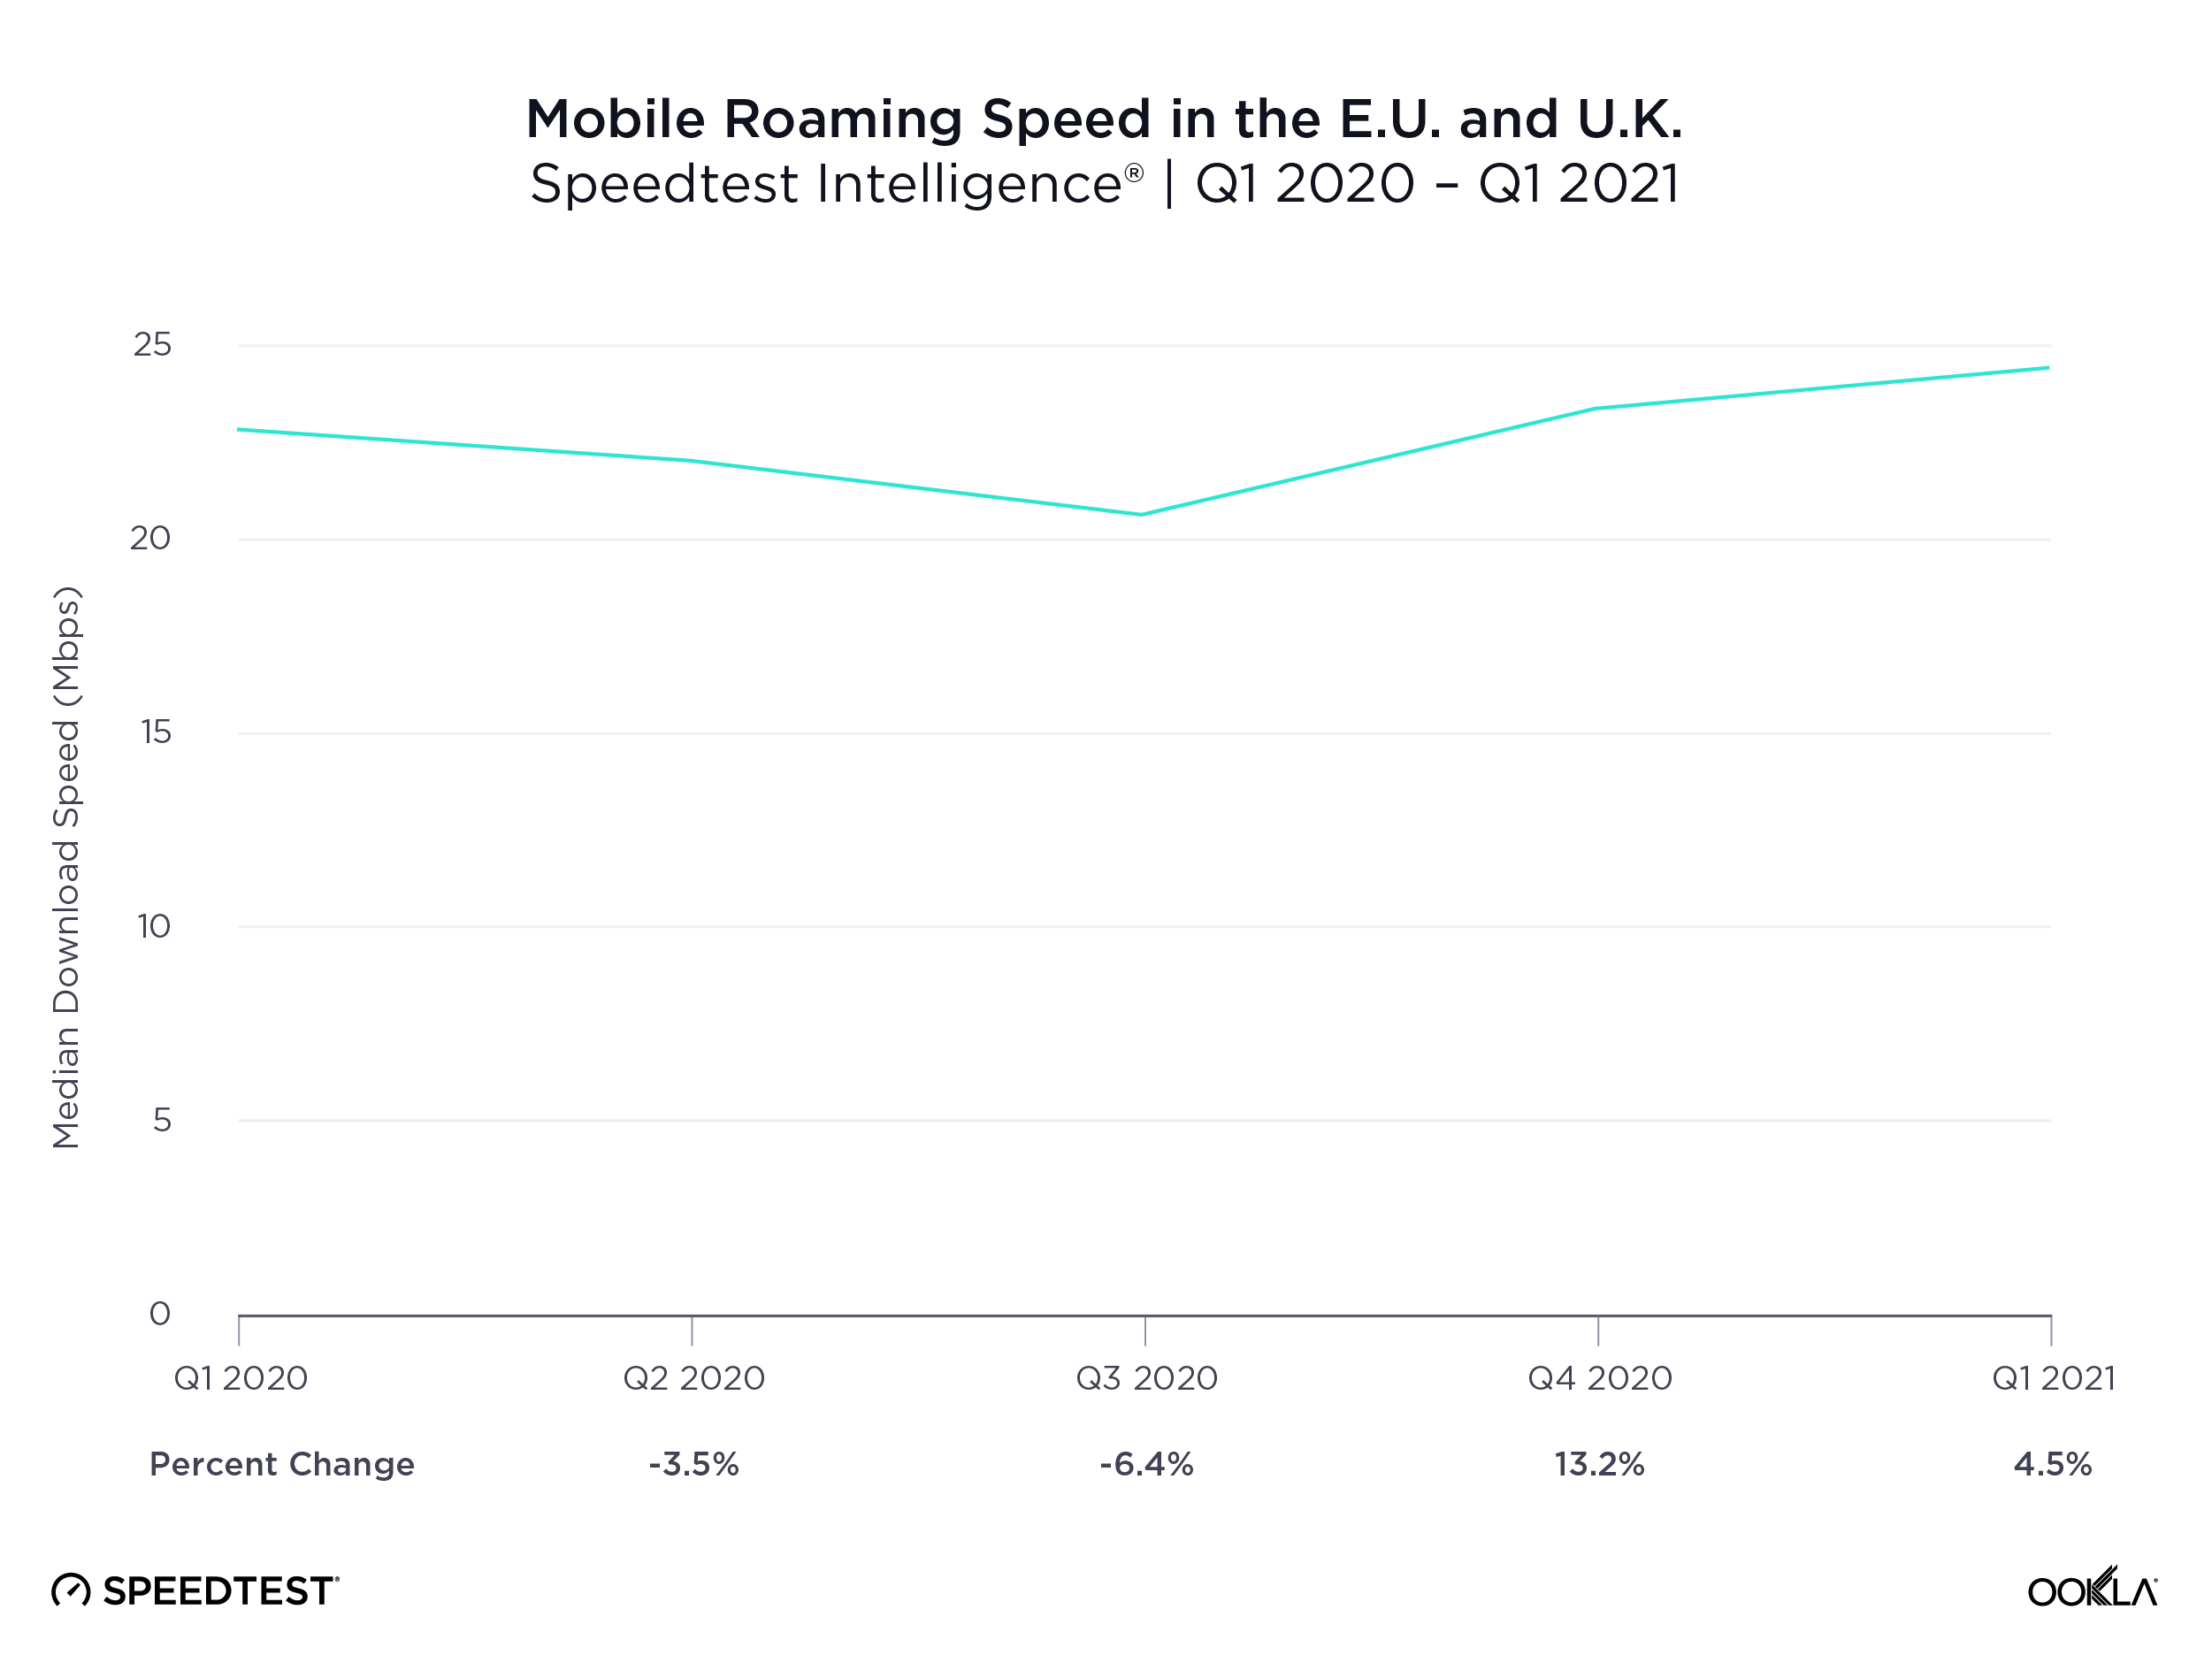
Roaming might seem like an unusual topic in a time when inter-country travel has been largely prohibited, but we wanted to build on our previous analysis to see how roaming performance and behaviors evolved over the past year. This analysis examines Speedtest data from Android devices in the European Union (E.U.) and the United Kingdom (U.K.) from Q1 2020 through Q1 2021. We’ve included the U.K. to maintain continuity with pre-Brexit reports.

Roaming speeds were slower in most European countries in Q1 2021

Speedtest Intelligence® again showed that consumers who are roaming outside their home countries often experience slower speeds. During Q1 2021, 19 out of the 26 European countries with statistically viable roaming sample sizes experienced slower median roaming download speeds than median local download speeds. Cyprus and Malta had too few roaming samples to be included in this year’s analysis for Q1 2021.

For the seven countries that saw increased speeds, Latvians experienced the largest increase in median download speed when roaming elsewhere in Europe at 23.4%, which was followed closely by Estonia (22.8%) and Ireland (19.5%). Greece, Romania and Slovenia saw increases of more than 5%. The U.K. saw about the same speeds roaming and locally with an increase of only 0.5% when roaming. Hungary also saw comparable roaming download speeds to local speeds with a decrease of only 0.5% when roaming.

Median Local vs. Roaming Download Speeds in Europe
Speedtest Intelligence® | Q1 2021
Country Local Download (Mbps) Roaming Download (Mbps) % Change
Austria 36.19 26.13 -27.8%
Belgium 43.90 27.52 -37.3%
Bulgaria 61.76 29.74 -51.8%
Croatia 48.23 31.3 -35.1%
Czechia 31.35 19.74 -37.0%
Denmark 50.11 22.18 -55.7%
Estonia 34.34 42.16 22.8%
Finland 43.02 31.68 -26.4%
France 34.68 29.62 -14.6%
Germany 27.56 20.14 -26.9%
Greece 32.38 35.51 9.7%
Hungary 28.66 28.51 -0.5%
Ireland 14.99 17.91 19.5%
Italy 25.24 21.66 -14.2%
Latvia 22.69 28.00 23.4%
Lithuania 33.66 30.80 -8.5%
Luxembourg 40.65 26.31 -35.3%
Netherlands 77.52 26.48 -65.8%
Poland 26.51 23.13 -12.7%
Portugal 26.16 23.74 -9.3%
Romania 25.12 26.80 6.7%
Slovakia 23.79 20.94 -12.0%
Slovenia 27.63 29.58 7.1%
Spain 23.78 18.21 -23.4%
Sweden 38.26 23.16 -39.5%
United Kingdom 27.96 28.09 0.5%

Every other country on our list saw decreases in median download speeds of 8.5% or more while roaming, with customers from the Netherlands experiencing the largest drop (65.8%) from a local speed of 77.52 Mbps to 26.48 Mbps while roaming. Customers from Denmark and Bulgaria experienced roaming speeds less than half of what they’re accustomed to at home with decreases of 55.7% and 51.8%, respectively.

Roaming decreased during the pandemic while speeds increased

The COVID-19 pandemic has upended countless lives with multiple lockdowns throughout 2020 and 2021 and severe limits to movement across borders. Data from Speedtest Intelligence reflects this decrease in roaming with roaming samples markedly down when comparing Q1 2021 to Q1 2020. We saw the most roaming samples during Q3 2020 and Q1 2020, which corresponds to increased lockdowns and movement restrictions in Q2 and Q4 2020 in response to the first and second waves of the pandemic.

Roaming speeds for all European countries combined increased 6.9% between Q1 2020 and Q1 2021, though the increase was not linear. Median download speed while roaming decreased from 22.89 Mbps in Q1 2020 to 22.09 in Q2 2020 and slipped down to 20.68 Mbps in Q3 2020. Roaming speeds began to increase in Q4 2020 with the median download speed rising to 23.42 Mbps, and Q1 2021 saw a further increase to 24.47 Mbps.

ookla_roaming_quarter_change_eu_0621-1

Estonia saw the biggest year-over-year increase in median roaming download speed, Slovakia and Italy saw the largest decrease

Median European Roaming Download Speeds
Speedtest Intelligence® | Q1 2020 – Q1 2021
Country Q1 2020 Download (Mbps) Q1 2021 Download (Mbps) % Change
Europe (All Countries Combined) 22.89 24.47 6.9%
Austria 24.39 26.13 7.1%
Belgium 23.78 27.52 15.7%
Bulgaria 22.81 29.74 30.4%
Croatia 29.28 31.30 6.9%
Czechia 20.23 19.74 -2.4%
Denmark 21.38 22.18 3.7%
Estonia 27.82 42.16 51.5%
Finland 32.18 31.68 -1.6%
France 24.57 29.62 20.6%
Germany 20.74 20.14 -2.9%
Greece 41.07 35.51 -13.5%
Hungary 25.10 28.51 13.6%
Ireland 22.08 17.91 -18.9%
Italy 26.98 21.66 -19.7%
Latvia 26.38 28.00 6.1%
Lithuania 22.60 30.80 36.3%
Luxembourg 18.82 26.31 39.8%
Netherlands 18.39 26.48 44.0%
Poland 17.01 23.13 36.0%
Portugal 23.78 23.74 -0.2%
Romania 23.64 26.80 13.4%
Slovakia 26.16 20.94 -20.0%
Slovenia 25.30 29.58 16.9%
Spain 15.05 18.21 21.0%
Sweden 21.36 23.16 8.4%
United Kingdom 29.48 28.09 -4.7%

2020 also posed many challenges for telecom operators around the world as customers shifted use patterns. Despite these challenges, many Europeans saw increases in median roaming speeds year-over-year. In fact, customers in 17 out of the 26 countries analyzed saw faster download speeds while roaming elsewhere in Europe when comparing Q1 2020 to Q1 2021. Estonians saw the largest increase at 51.5% (from 27.82 Mbps to 42.16 Mbps), the Netherlands was next with a 44.0% jump (from 18.39 Mbps to 26.48 Mbps) and Luxembourg saw a 39.8% increase in download speed (from 18.82 Mbps to 26.31 Mbps).

Countries whose customers experienced year-over-year decreases in median downloads speed while roaming include Slovakia (20.0% decrease), Italy (19.7%), Ireland (18.9%), Greece (13.5%), the U.K. (4.7%), Germany (2.9%), Czechia (2.4%), Finland (1.6%) and Portugal (0.2%).

While the year-over-year change is an interesting baseline metric, it’s also important to note only Denmark, Germany, Poland and Spain had consistently slower median roaming download speeds than the European average during every quarter from Q1 2020 to Q1 2021. Every other country had at least one quarter where speeds were faster than the European average.

Outbound roaming speeds varied drastically from country to country from Q1 2020 to Q1 2021

Roaming speeds are heavily dependent on agreements between individual operators, which means they can vary dramatically by country and by operator. We looked closely at outbound roaming for individual countries to see how different countries’ networks performed during COVID-19 lockdowns.

Customers from the Netherlands roaming in France saw the fastest median roaming download speed in all of Europe during Q1 2021 at 70.46 Mbps. Customers from Germany roaming in Portugal experienced the slowest median roaming download speed during Q3 2020 at 0.42 Mbps.

Here were some of the fastest roaming speeds from select countries to other countries within Europe between Q1 2020 and Q1 2021:

  • Netherlands to France (70.46 Mbps in Q1 2021)
  • Bulgaria to the U.K. (58.21 Mbps in Q4 2020)
  • Netherlands to Poland (55.77 Mbps in Q1 2021)
  • Denmark to Sweden (40.46 Mbps in Q4 2020)
  • Finland to Estonia (48.41 Mbps in Q1 2020)

Here were some of the slowest roaming speeds between Q1 2020 and Q1 2021:

  • Germany to Portugal (0.42 Mbps in Q3 2020)
  • Czechia to France (4.98 Mbps in Q3 2020)
  • France to Portugal (5.54 Mbps in Q3 2020)
  • Hungary to France (5.95 Mbps in Q3 2020)
  • Poland to Belgium (7.59 Mbps in Q1 2020)

We’ll continue to watch roaming speeds over the next year to see how roaming changes as more countries reopen and travel picks up again. If you’re interested in learning more about roaming speeds for your business or country, please click here.

Ookla retains ownership of this article including all of the intellectual property rights, data, content graphs and analysis. This article may not be quoted, reproduced, distributed or published for any commercial purpose without prior consent. Members of the press and others using the findings in this article for non-commercial purposes are welcome to publicly share and link to report information with attribution to Ookla.