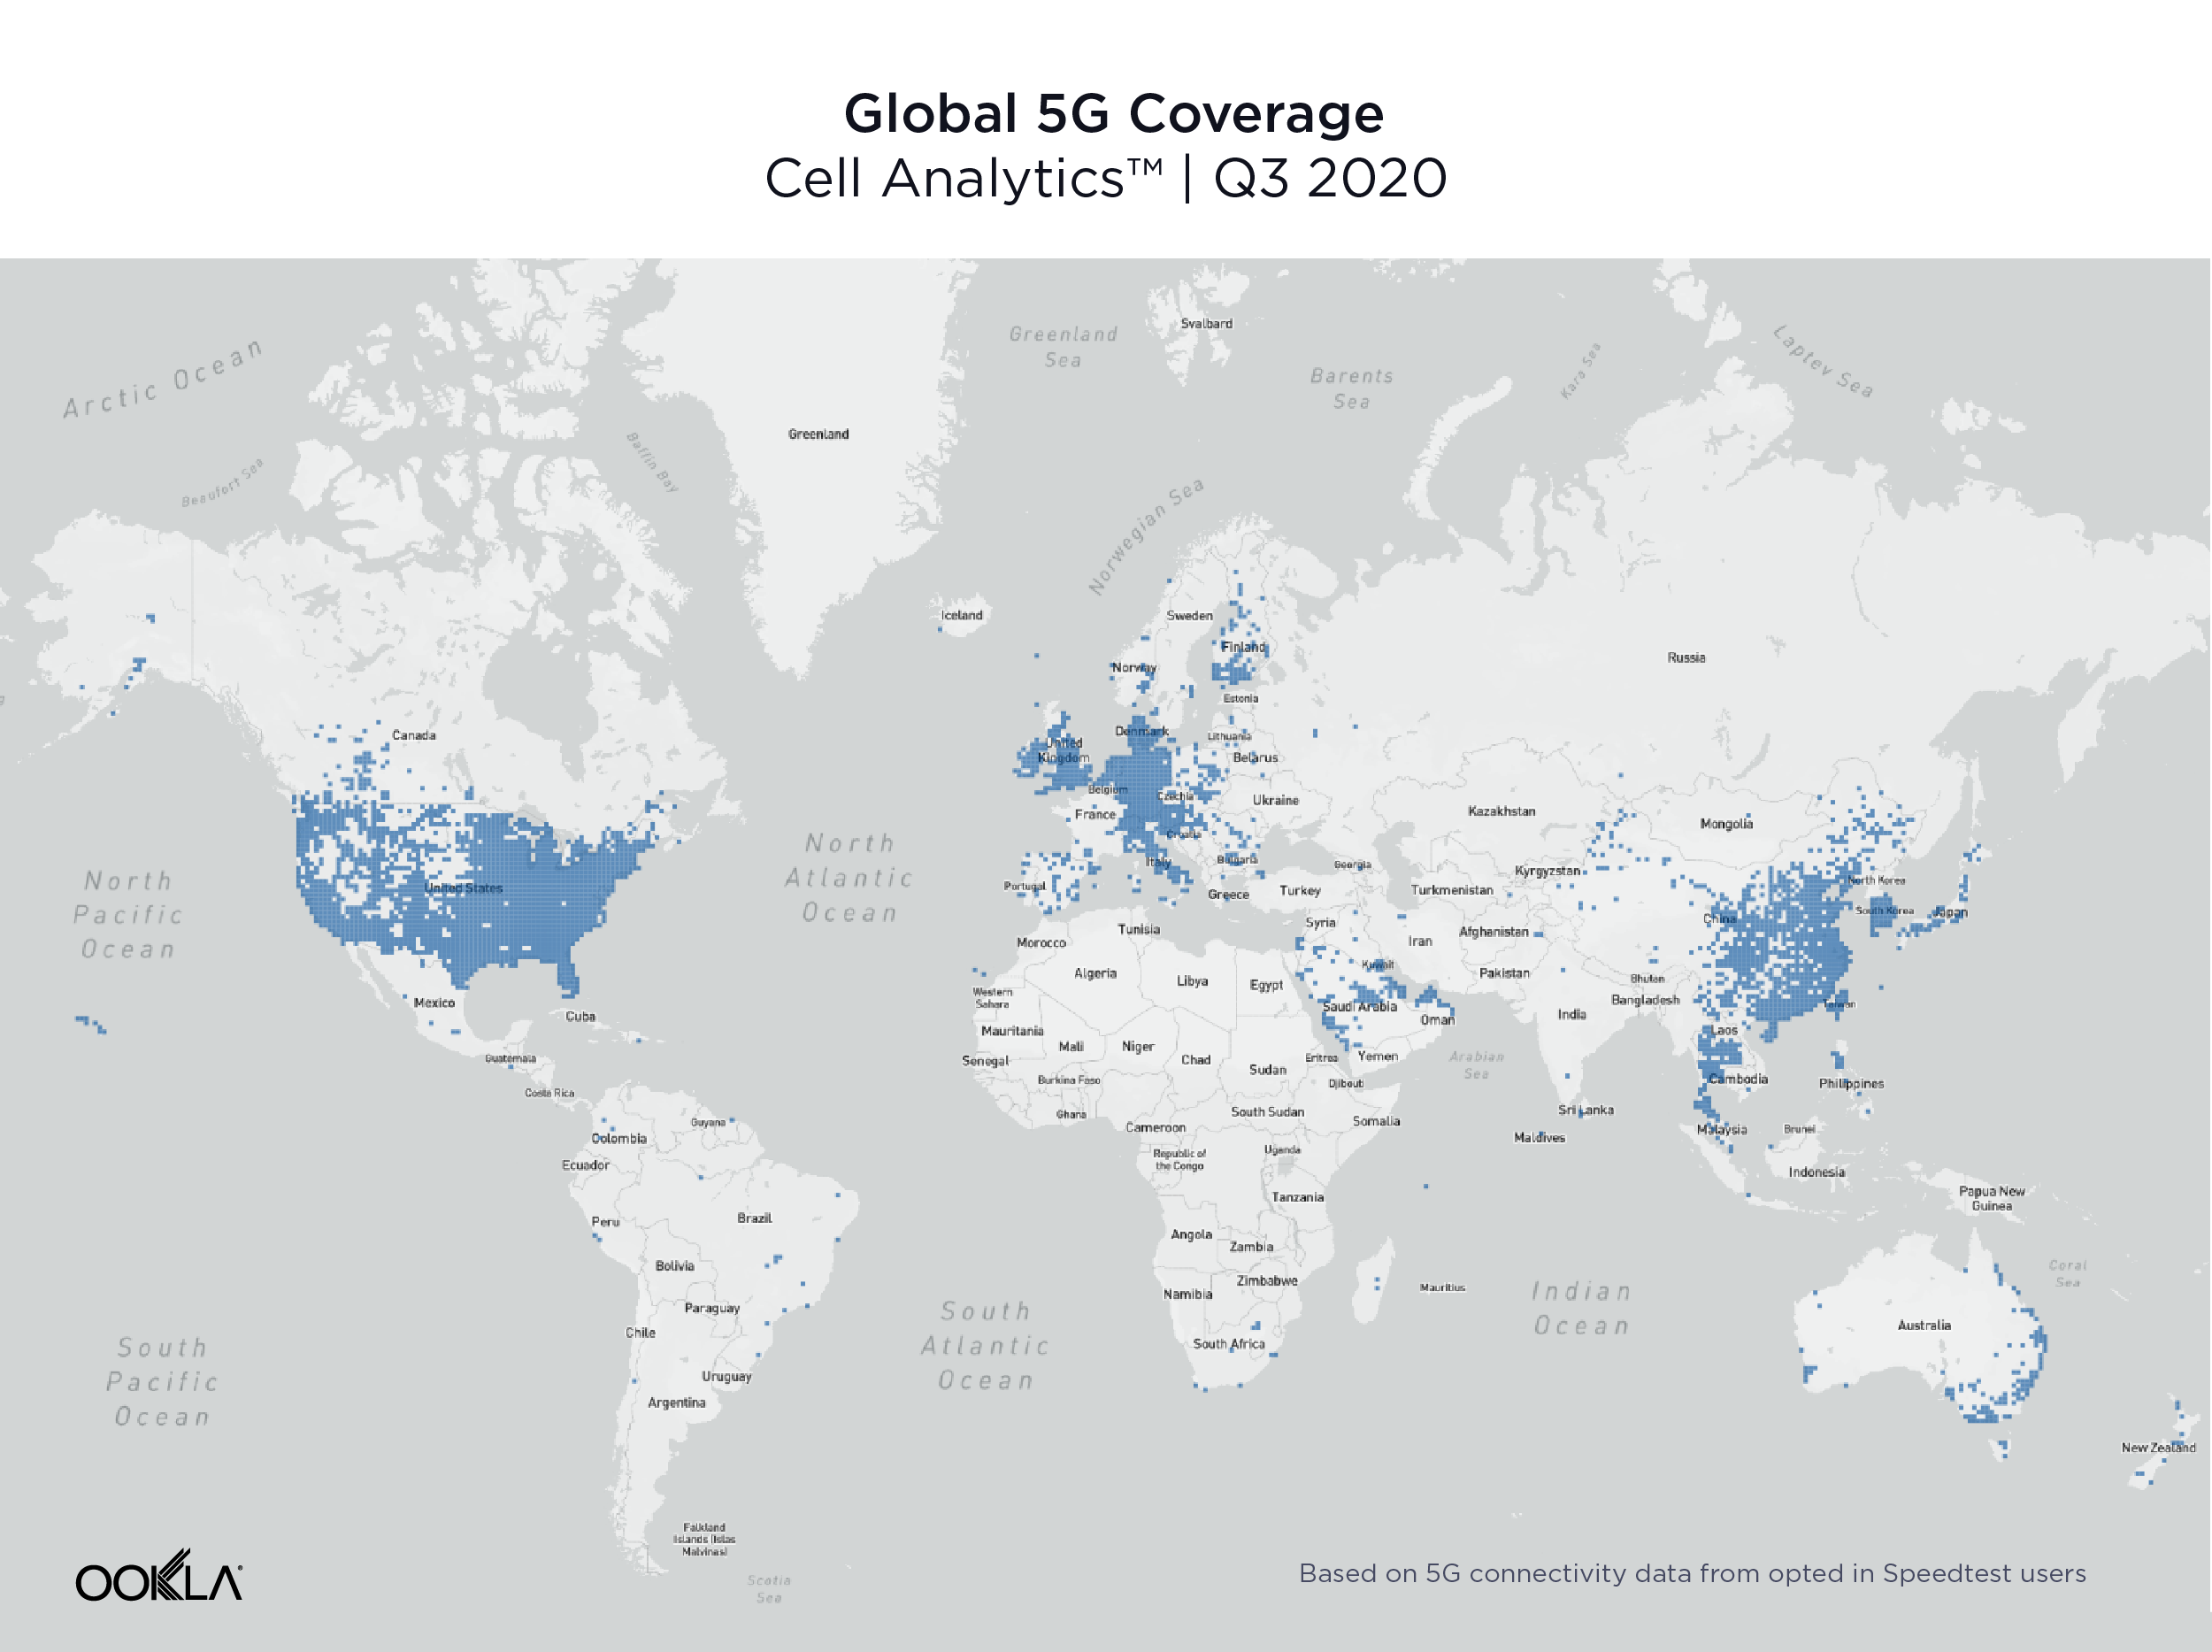

The holidays are nearly here and with them the desire to treat yourself or a loved one to an upgraded phone, just because. The first question you’re likely to ask yourself as you browse new models is “To 5G or not to 5G?” Once you check the Ookla 5G Map™ to see if your operator has deployed 5G in your area, you’ll probably want to know if the 5G speeds are worth the extra cost. We’ve analyzed Speedtest Intelligence® data from the most popular Android and iPhone devices around the world during Q3 2021 to help you see if it’s worth the upgrade. Click a country from the list to jump down to the related analysis.
Australia
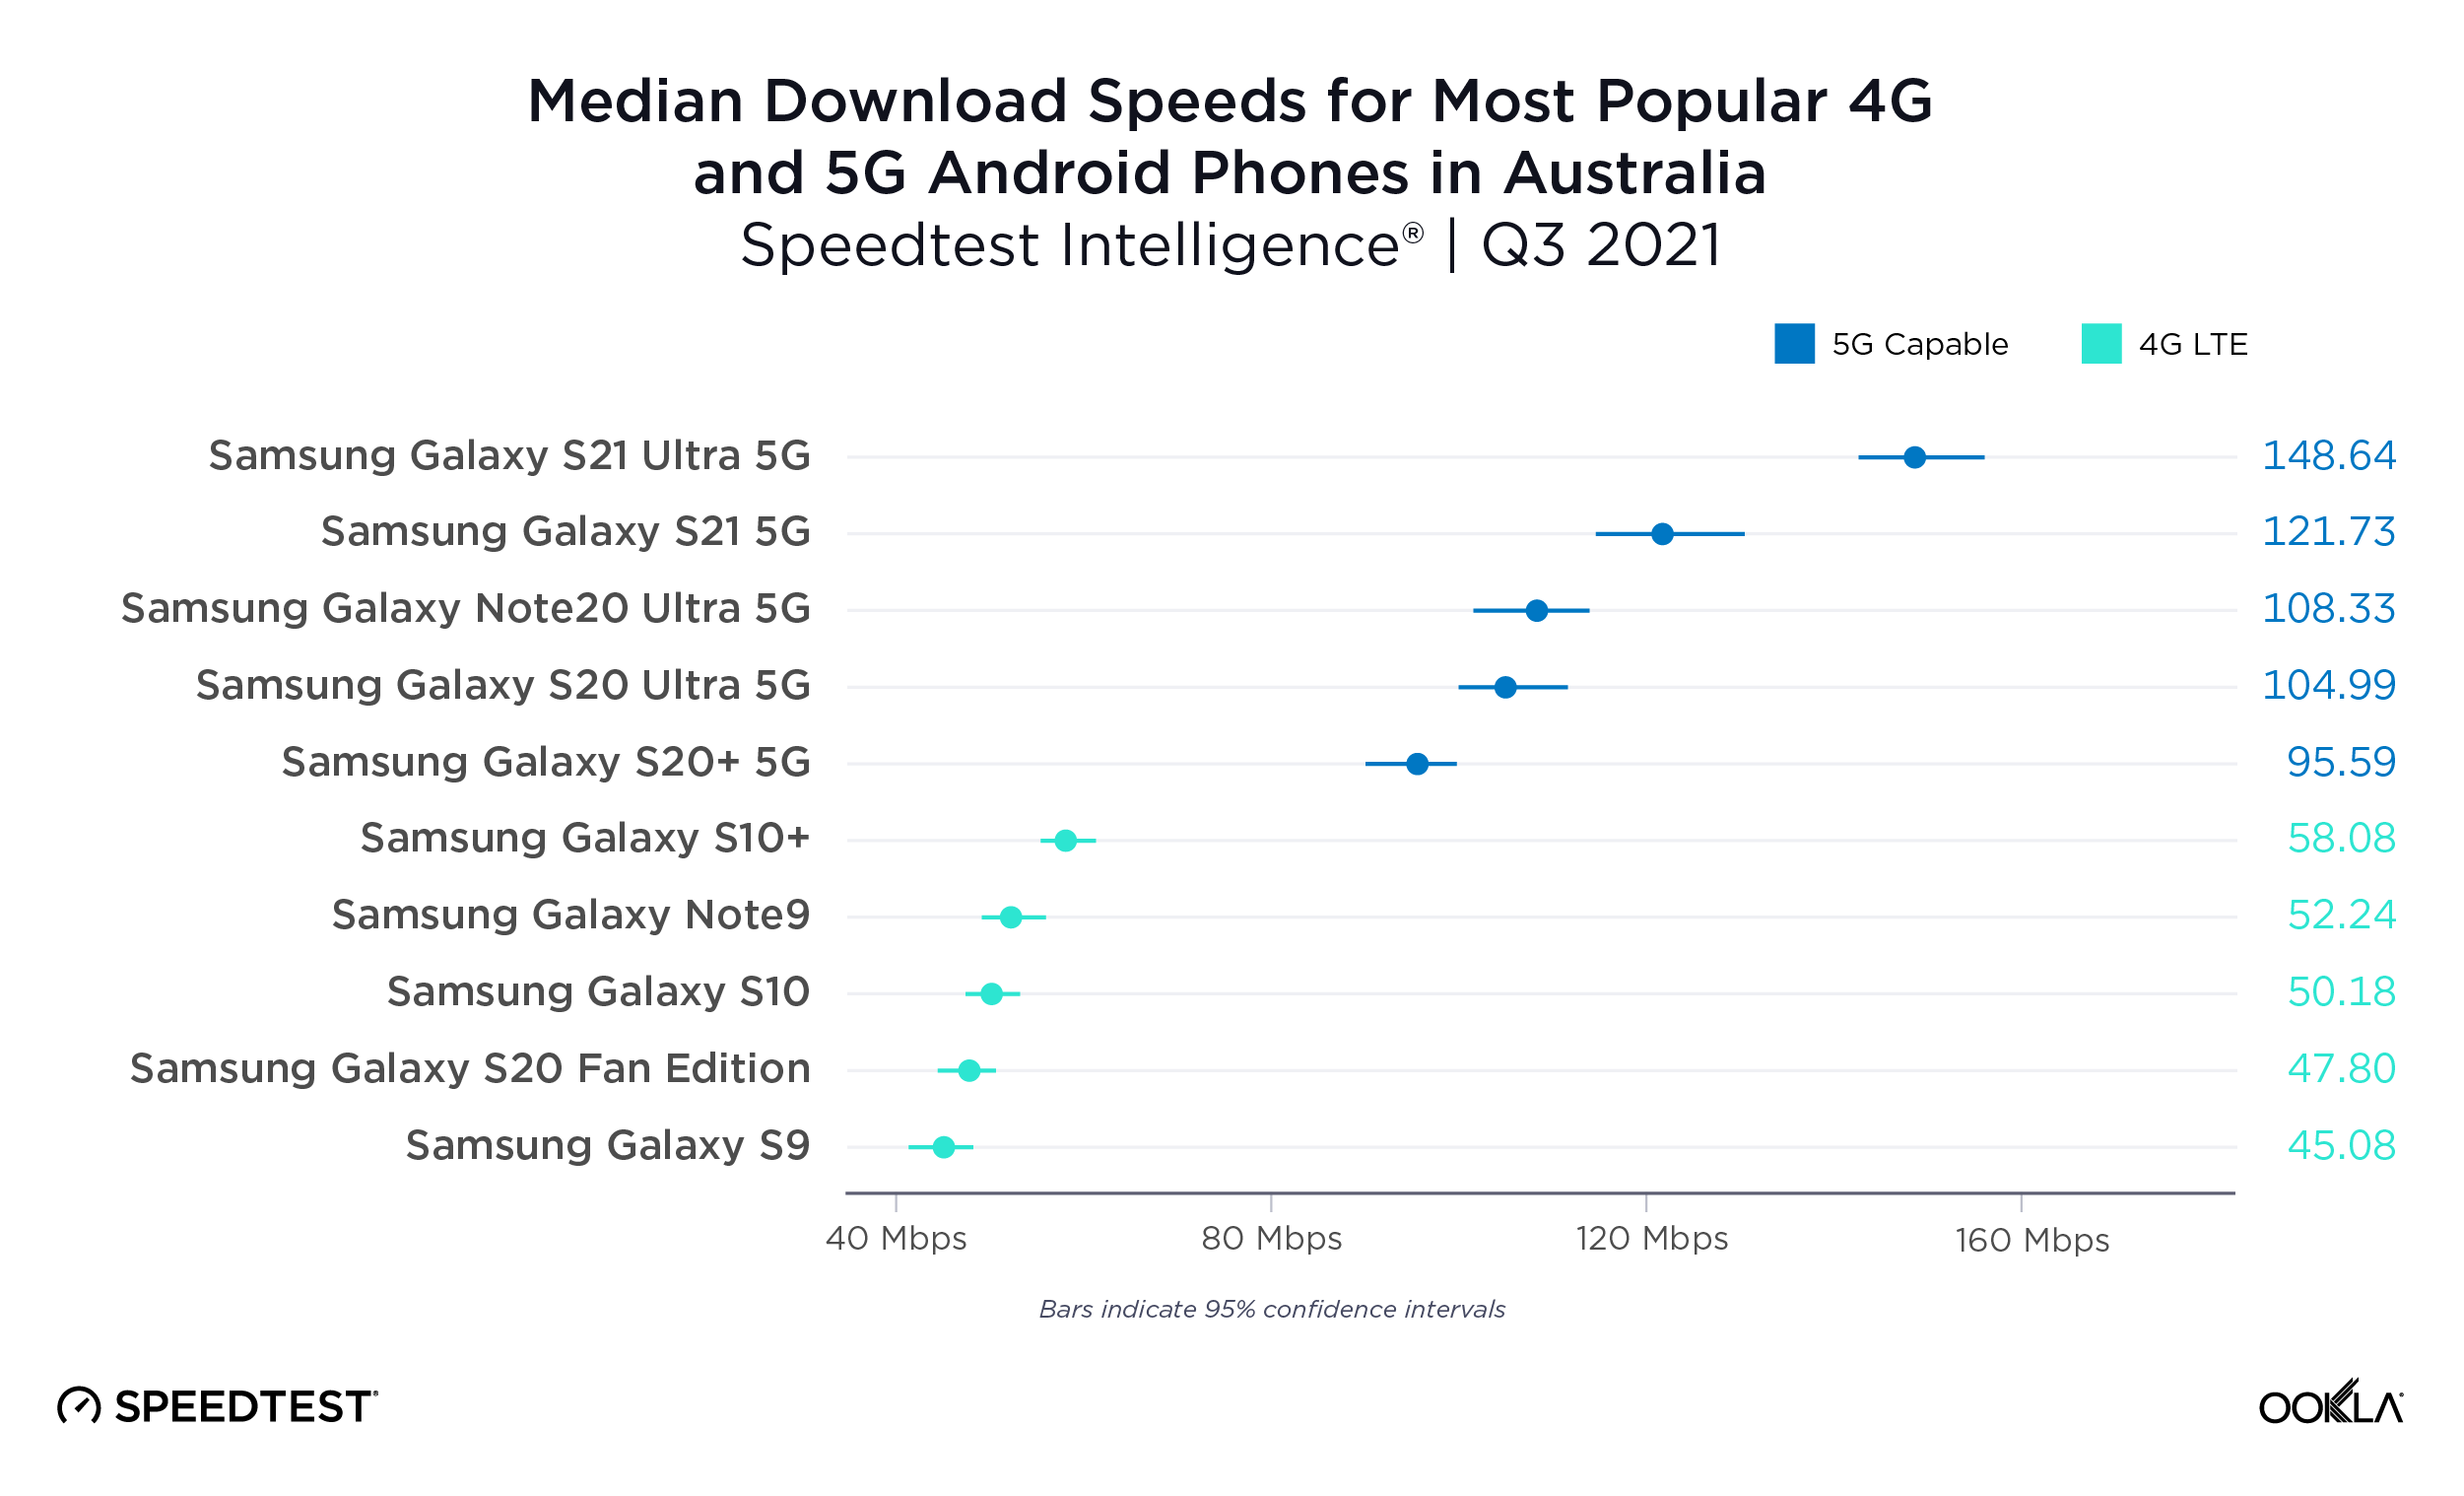
5G Samsung devices more than twice as fast as most popular 4G devices in Australia
Although only a year separates the release of the Samsung Galaxy S10 series and the S20 series devices, the latter were definitely faster in Australia during Q3 2021. Even the slowest 5G-capable device on this list, the Galaxy S20+ 5G was much faster than the fastest 4G phone, the Galaxy S10+.
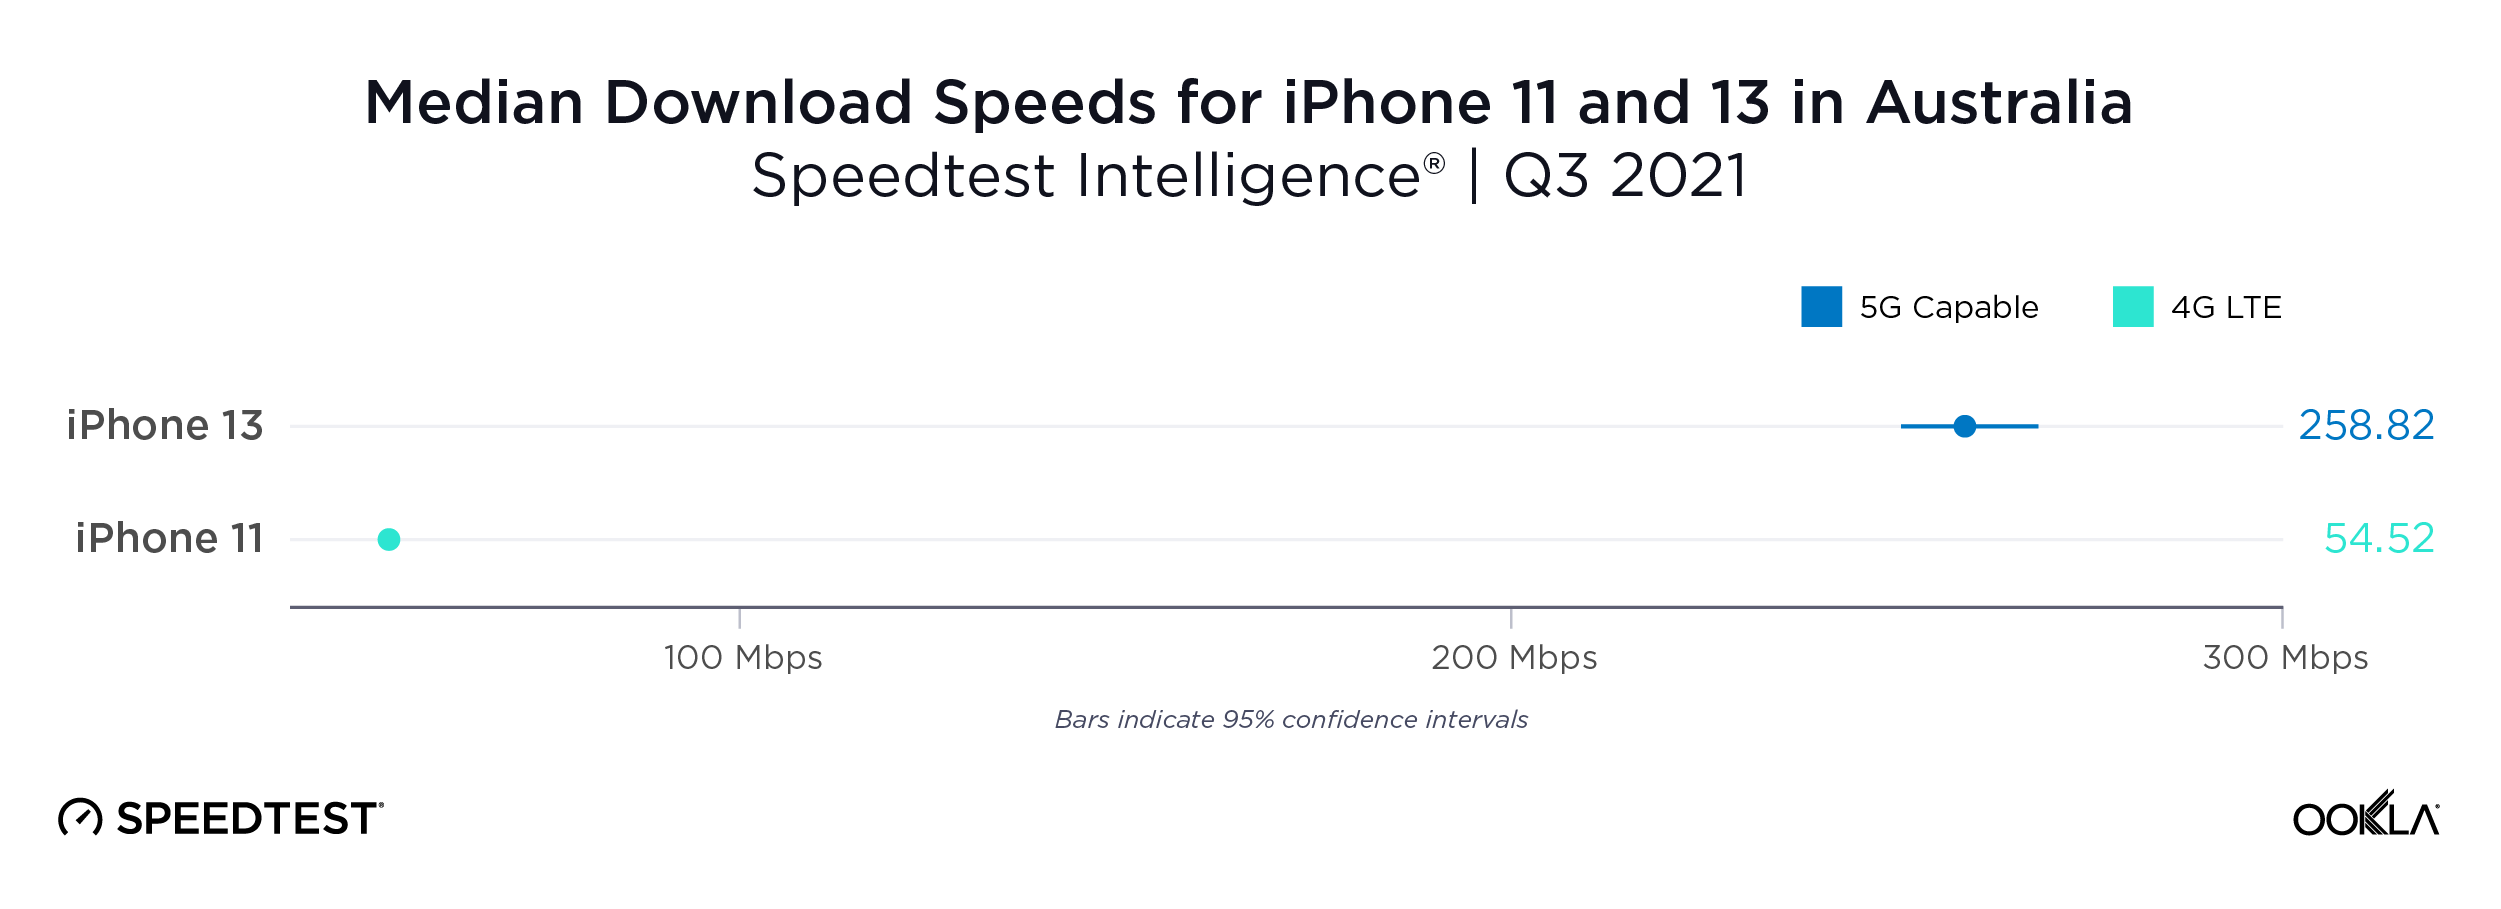
iPhone 13 wallops iPhone 11 for speed in Australia
Australians who recently upgraded their iPhone 11 for an iPhone 13 would have seen a more than 4X increase in median download speed during Q3 2021. If speed is your number one concern, this upgrade is necessary.
Bahrain
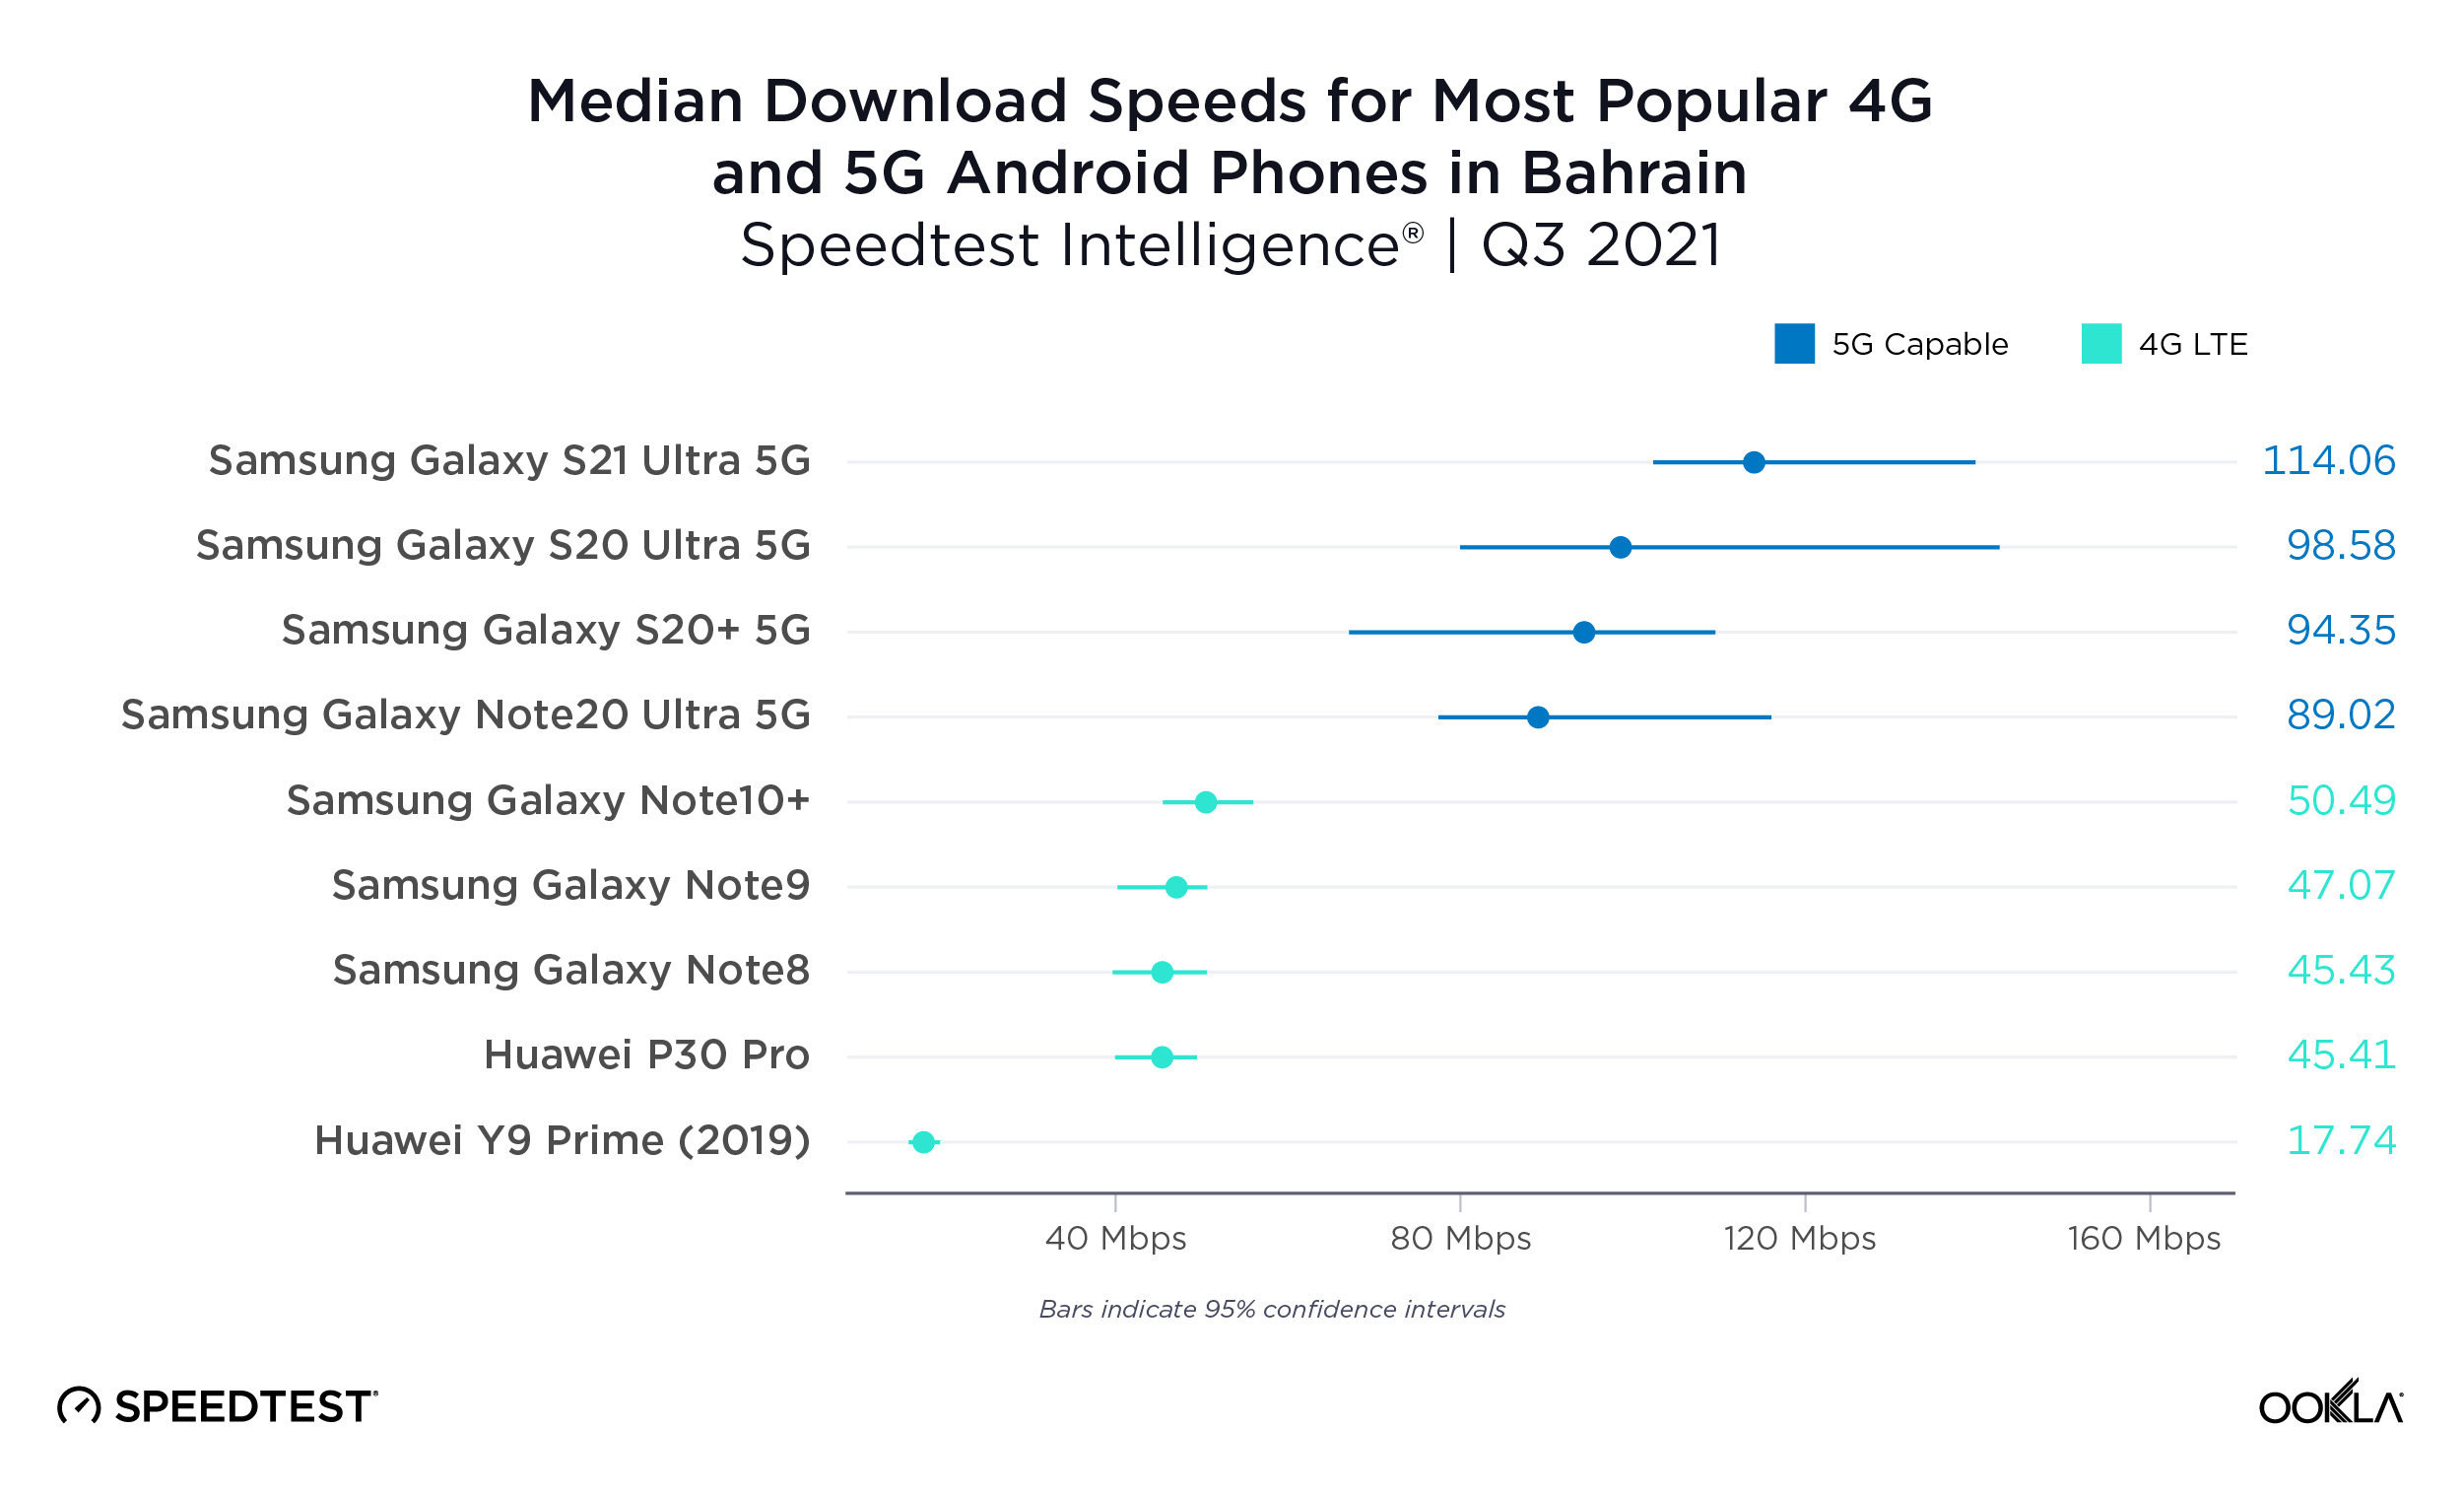
5G Samsung variants live up to the hype in Bahrain
Fewer 5G-capable phones made our list in Bahrain during Q3 2021 due to sample counts, but those that did roundly outperformed the most popular 4G devices. The median download speed of 5G-capable devices on this list was more than two times faster than the median for 4G devices on this list.
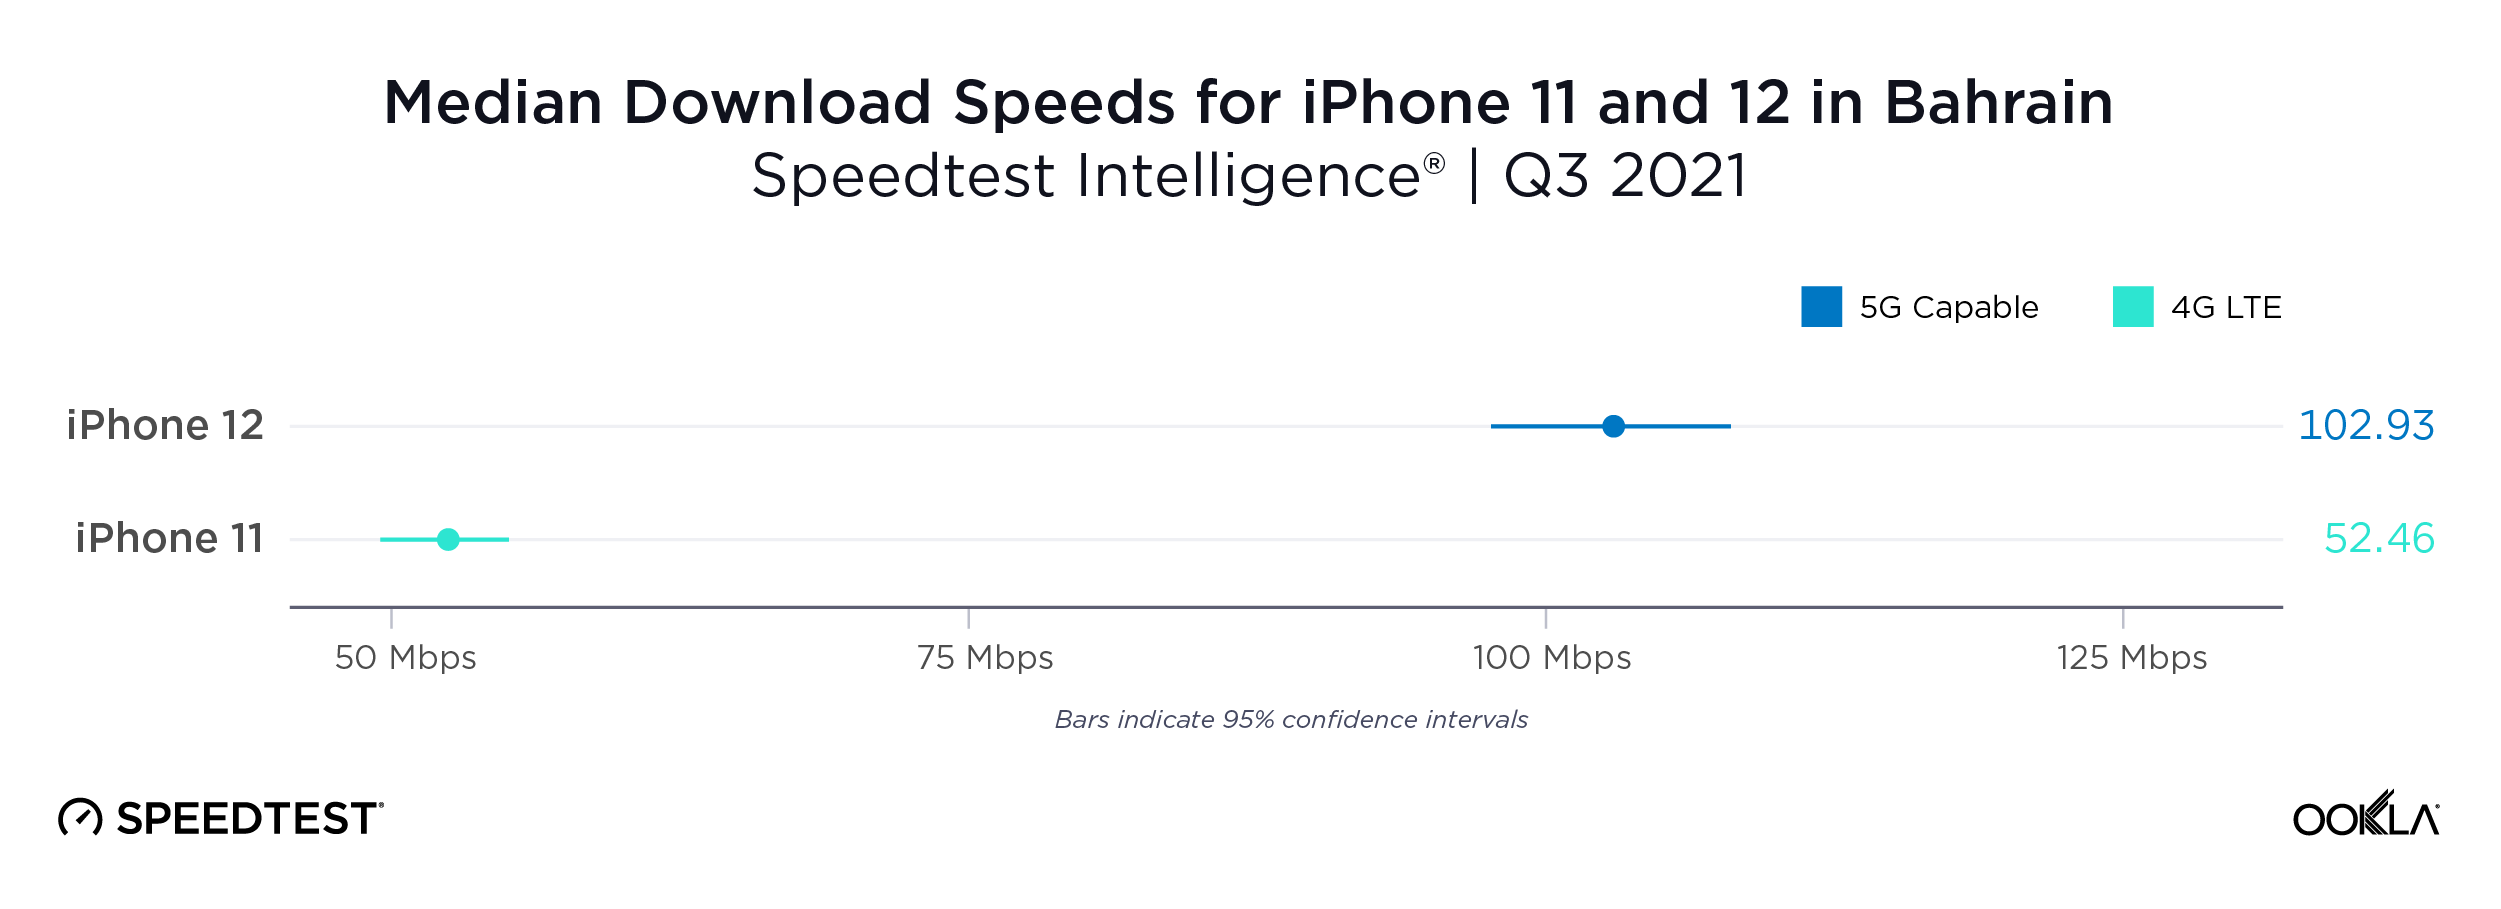
iPhone 12 85% faster than iPhone 11 in Bahrain
There weren’t sufficient samples to analyze performance of the brand new iPhone 13 in Bahrain during Q3 2021, but median download speed on the iPhone 12 was 85.0% faster than that on the iPhone 11.
Canada
Not all 5G Android devices offer a massive improvement in Canada
Q3 2021 data from Canada shows that 5G isn’t the only way to get a fast connection. While the fastest 5G-capable device among the top five most popular (the Samsung Galaxy S21 Ultra 5G) offered very fast median download speeds, two 4G devices (the Note10+ and the S10+) were nearly as fast as the slowest 5G-capable device on this list (the S20 Fan Edition 5G). To upgrade or not is definitely a question here of which device you are upgrading from and which you plan to upgrade to.

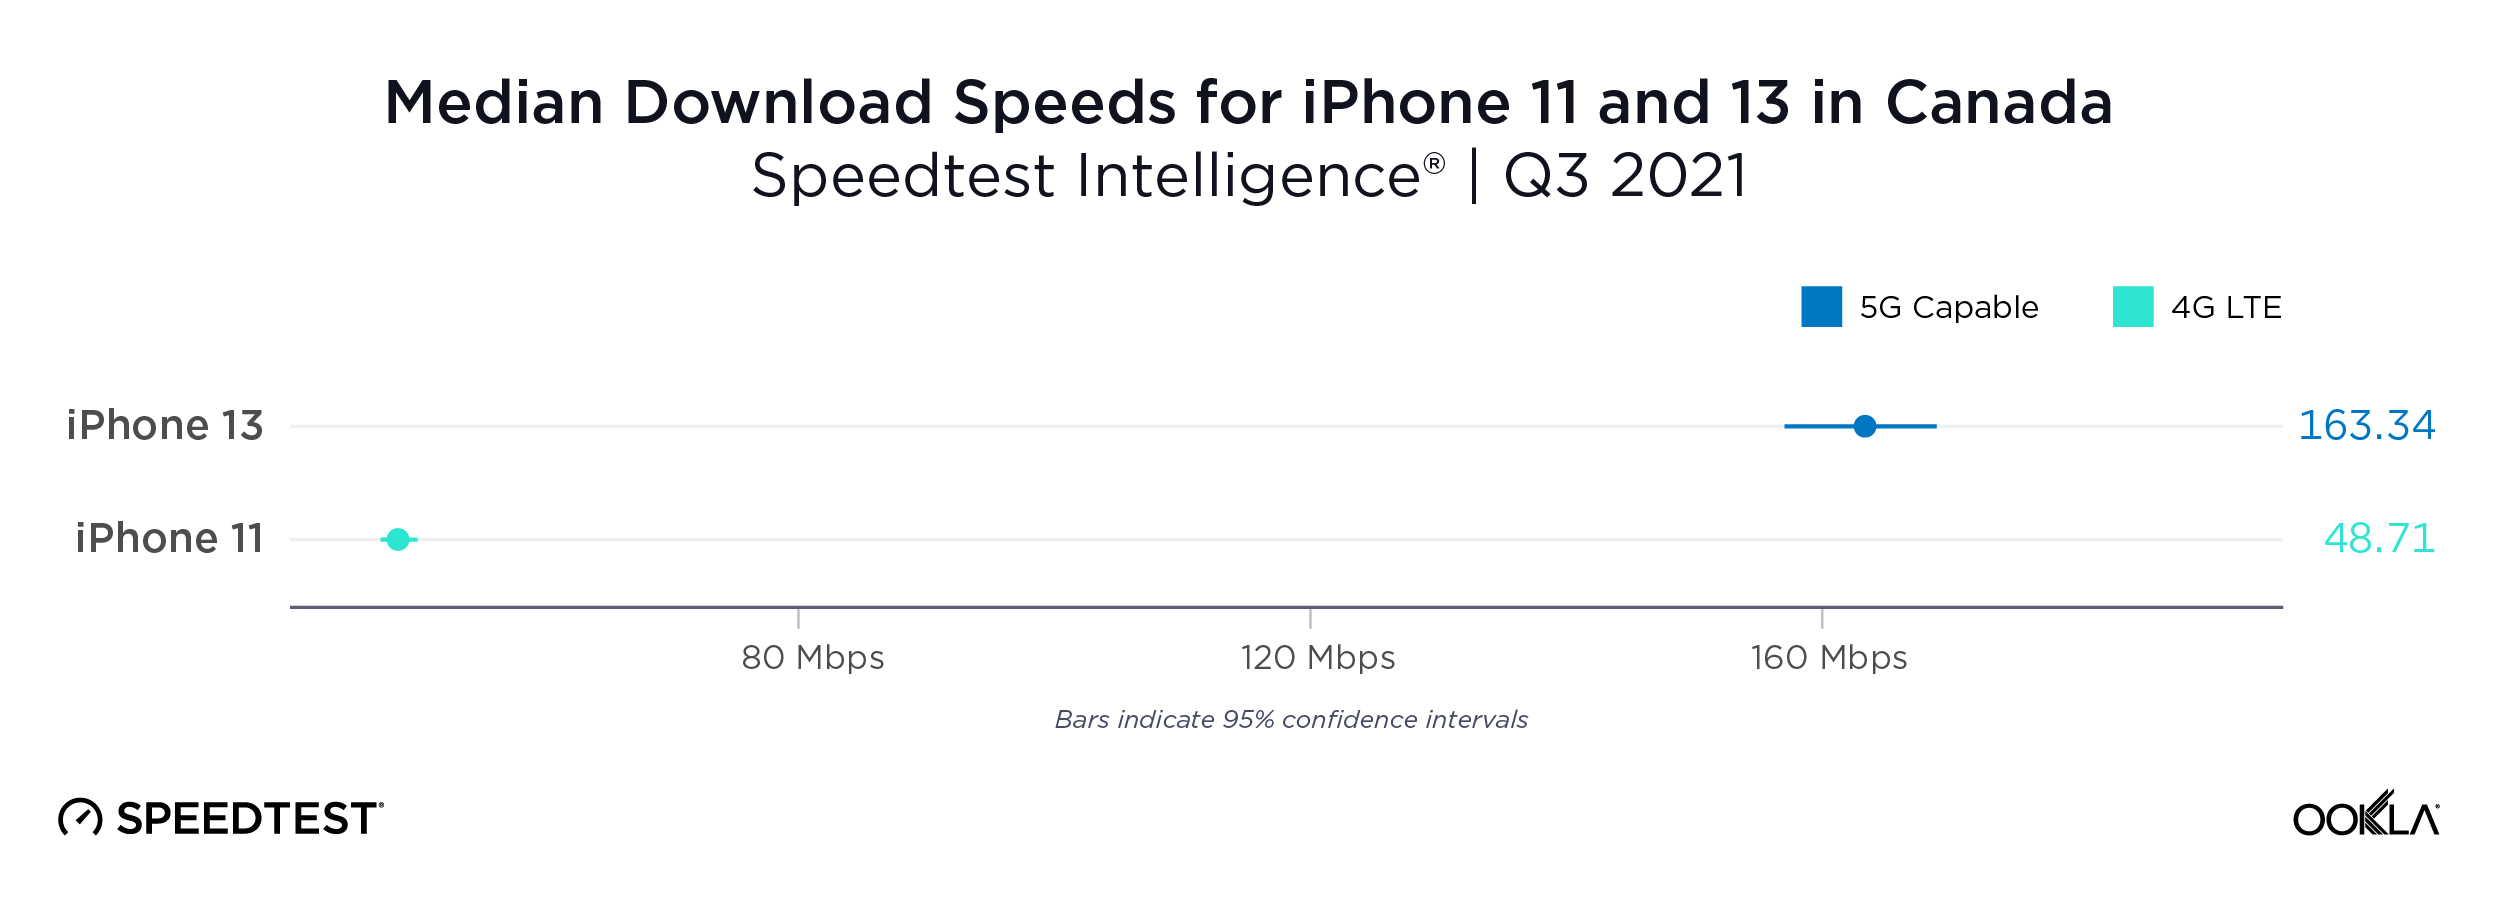
iPhone 13 more than three times as fast as the iPhone 11 in Canada
Canadians looking for fast mobile performance on Apple devices will enjoy an upgrade to the iPhone 13 whose median download speed in Q3 2021 was more than three times as fast as that on the iPhone 11.
China
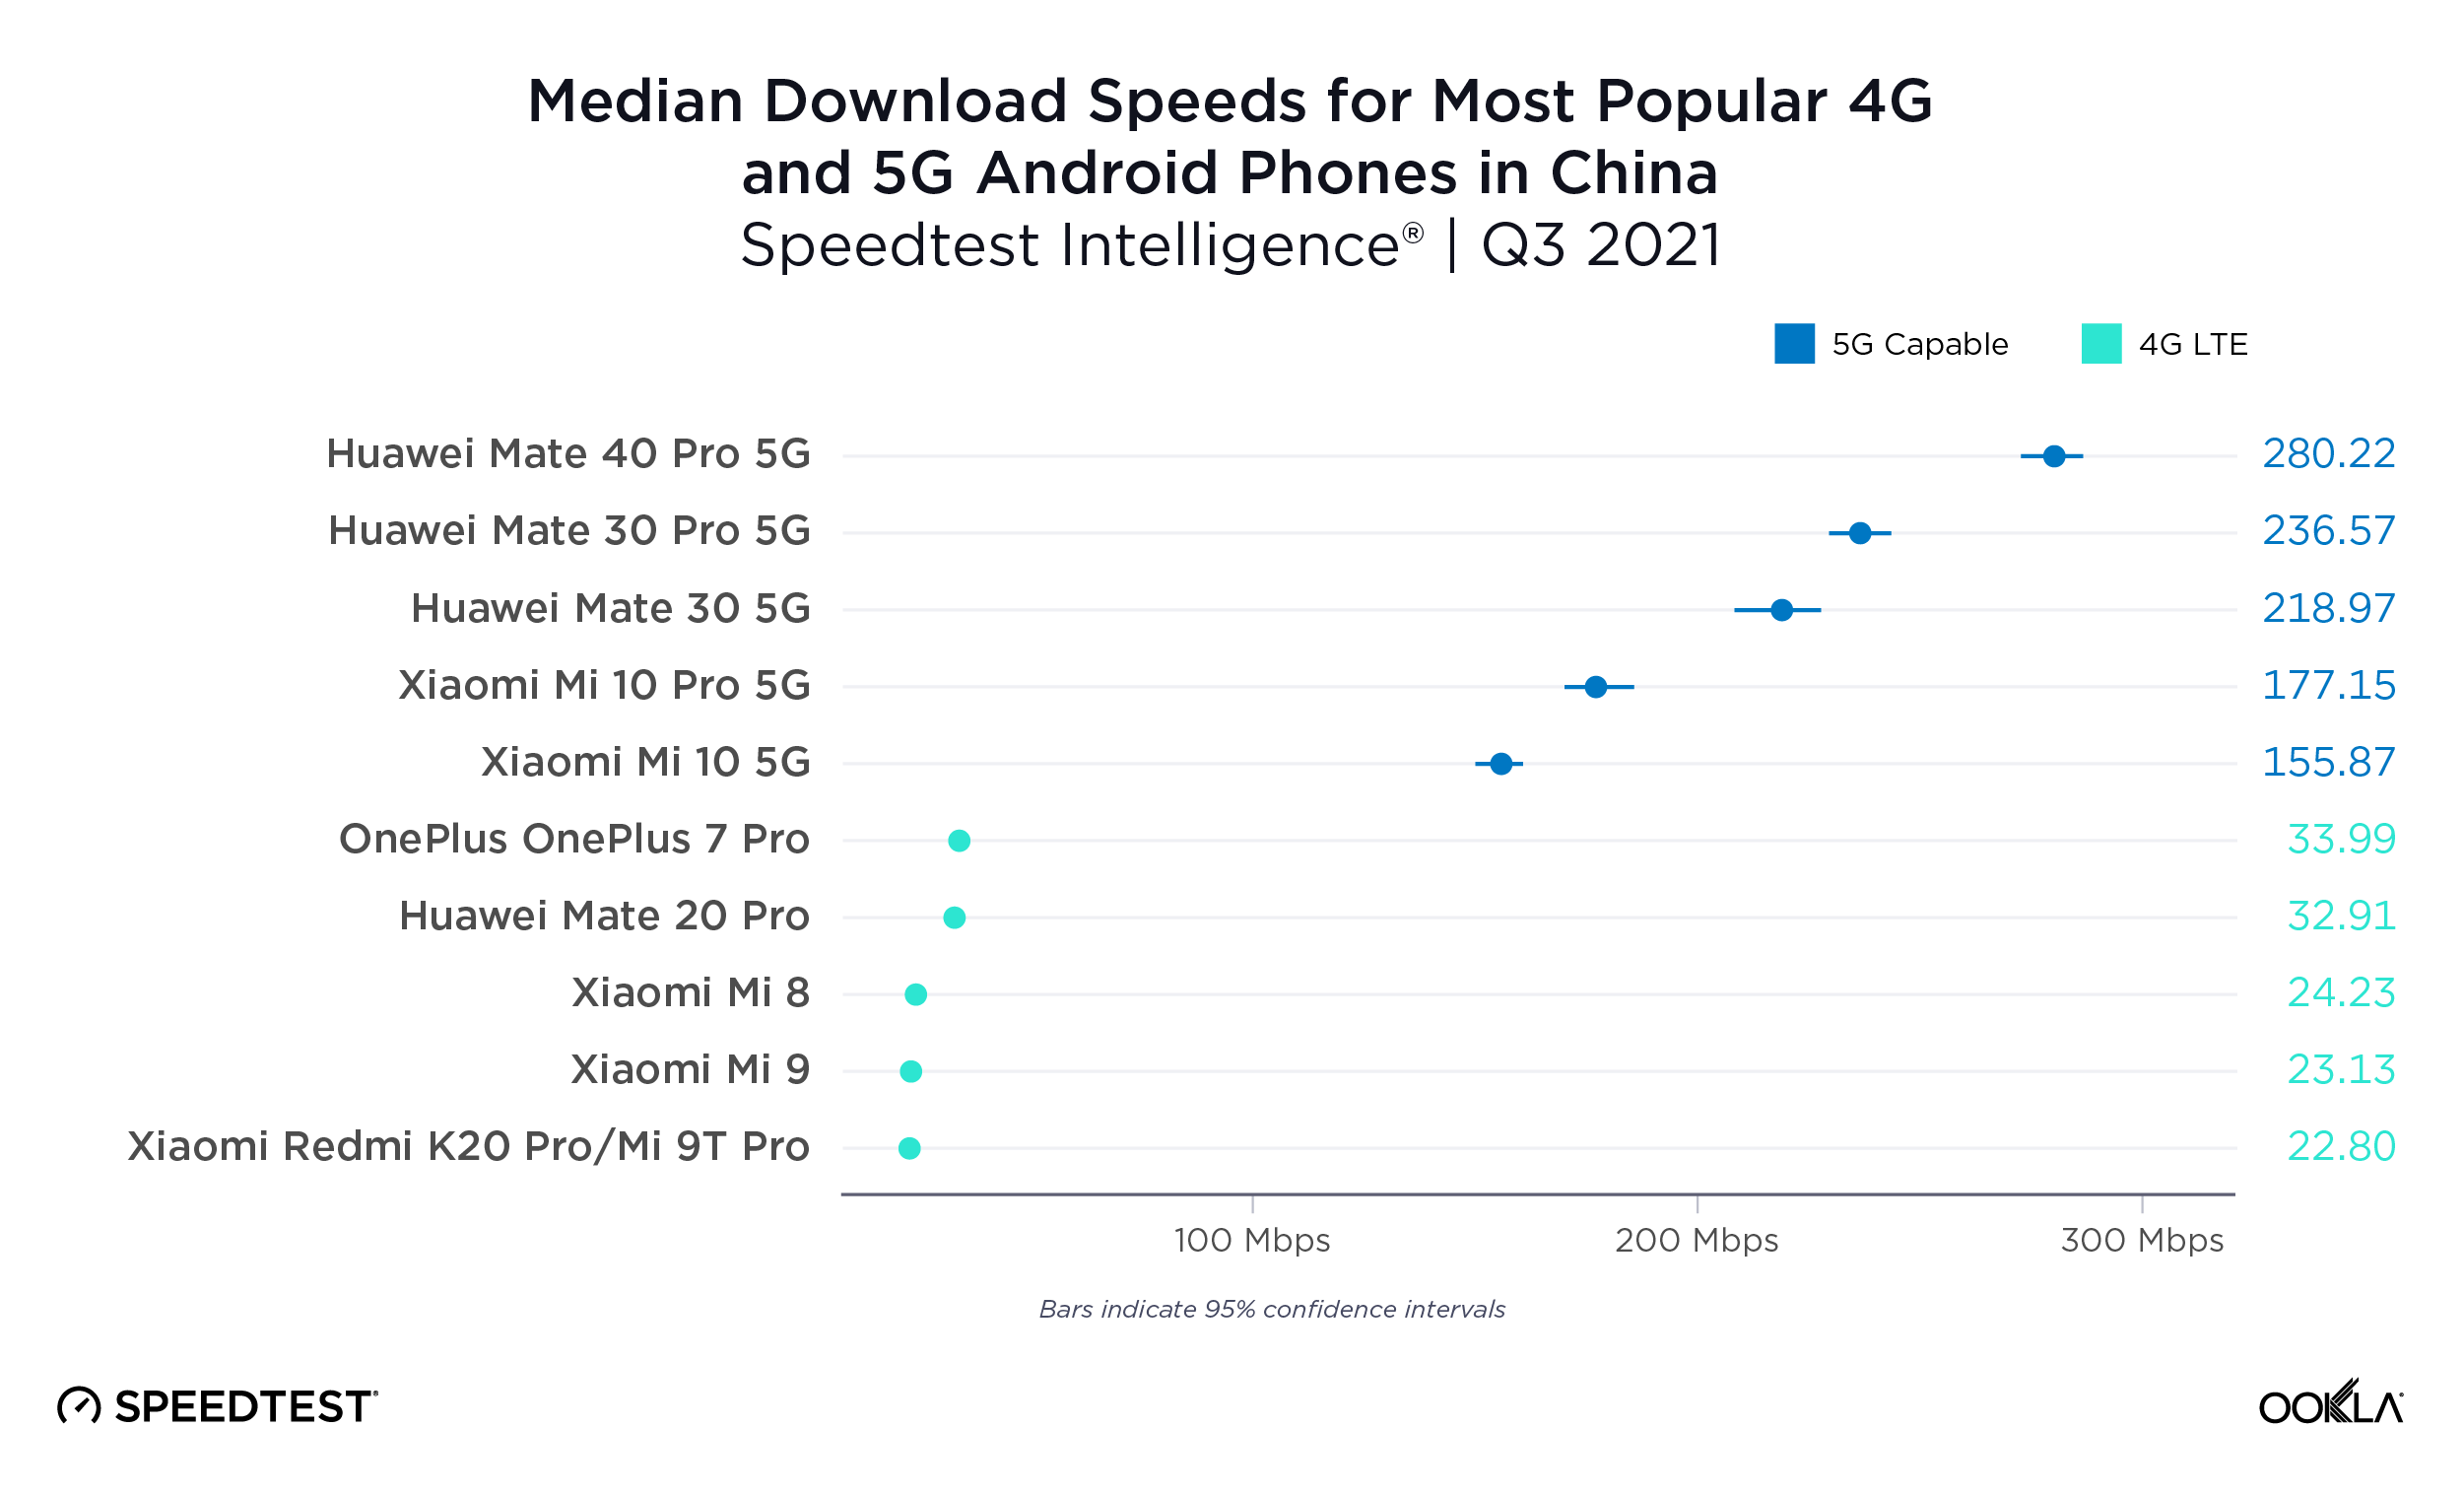
5G offers major advantages on Android in China
There is no question as to whether consumers with one of the five most popular 4G Android devices would see faster speeds with one of the five most popular 5G Android devices. The 4G devices on this list saw median download speeds in the 22.00 to 34.00 Mbps range during Q3 2021 while the 5G-capable devices showed median download speeds between 155.87 Mbps (Xiaomi Mi 10 5G) and 280.22 Mbps (Huawei Mate 40 Pro 5G).
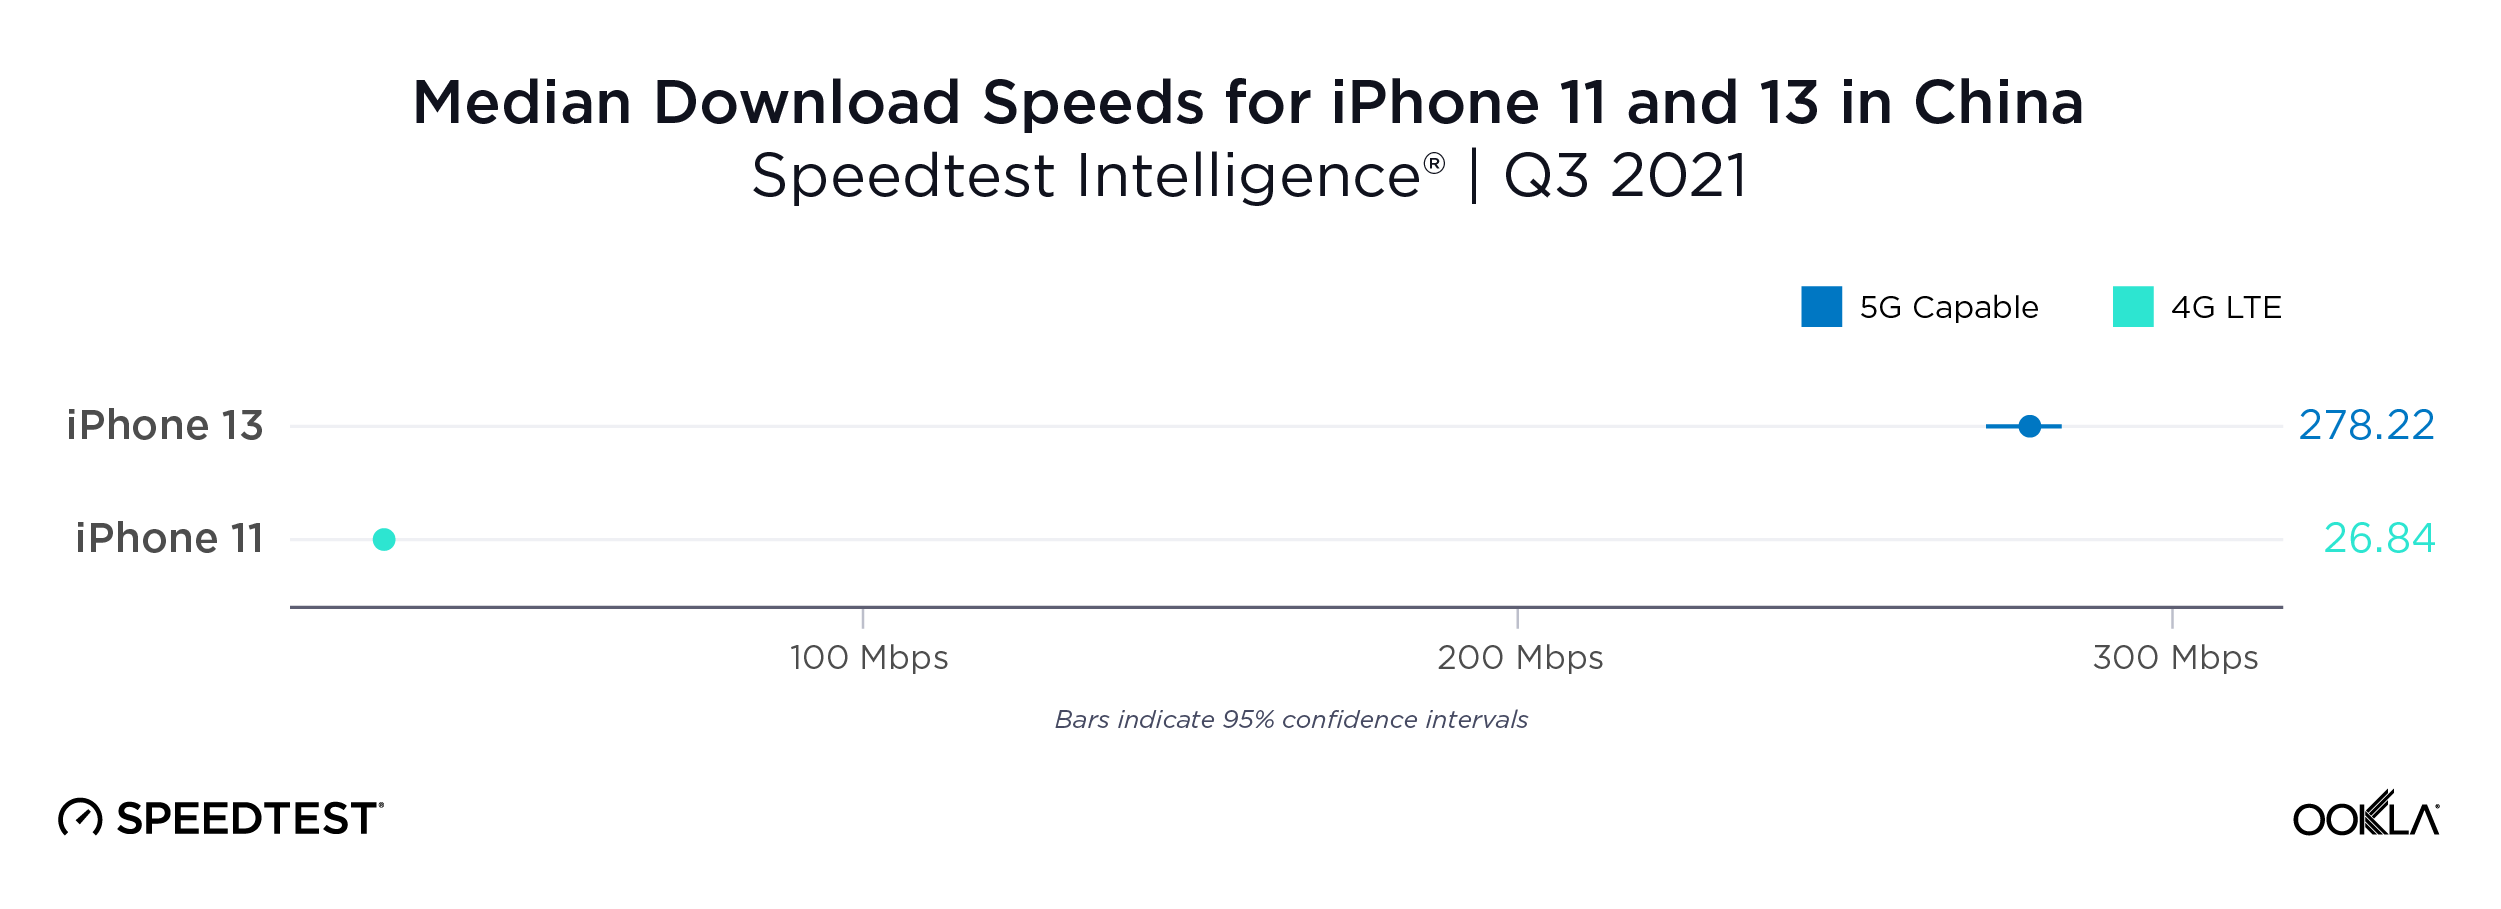
iPhone 13 more than ten times faster than iPhone 11 in China
China was home to the largest performance increase when comparing the iPhone 11 to the iPhone 13. Median download speed on the iPhone 13 was more than ten times faster during Q3 2021 than on the iPhone 11. Some of this difference may reflect market conditions where users in more rural areas have older phones and poorer infrastructure, but it’s still an impressive difference.
France
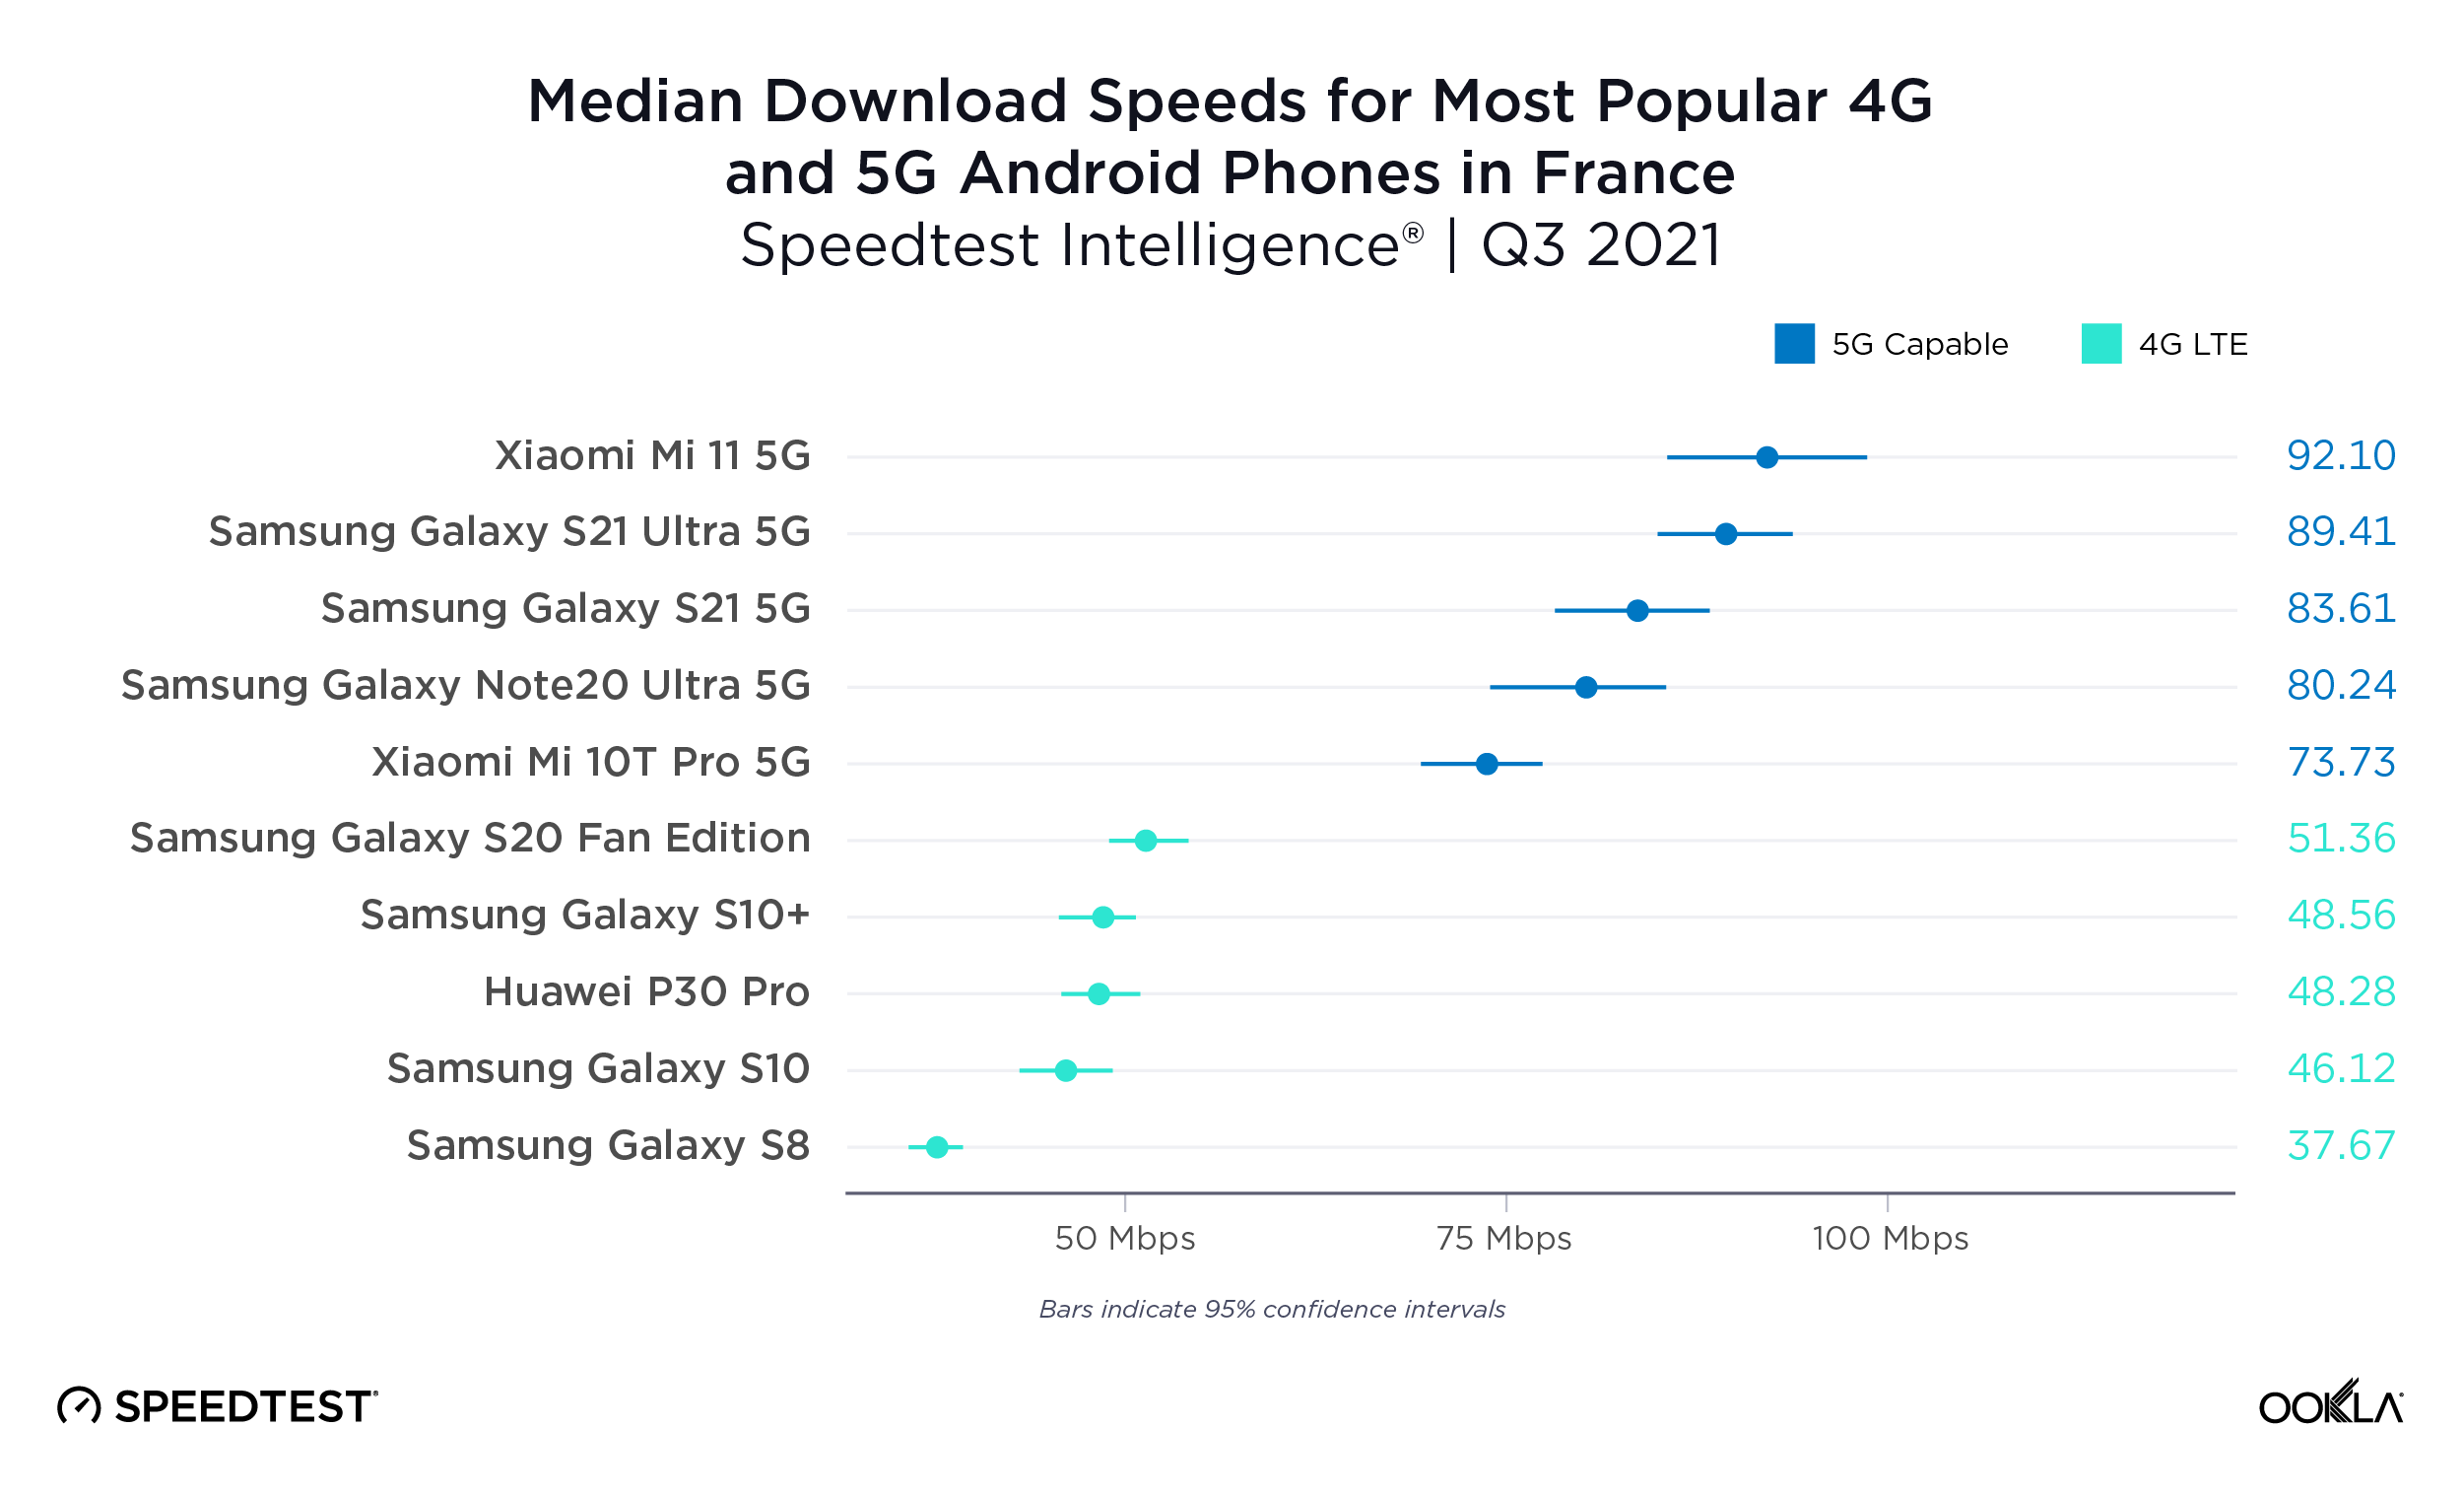
French 5G offers a decent speed boost on Android
The most popular 4G devices in France showed median download speeds between 37.67 Mbps (Samsung Galaxy S8) and 51.36 Mbps (S20 Fan Edition) during Q3 2021. These were easily topped by the 5G-capable devices which showed median download speeds of 73.73 Mbps (Xiaomi Mi 10T Pro 5G) to 92.10 Mbps (Xiaomi Mi 11 5G).
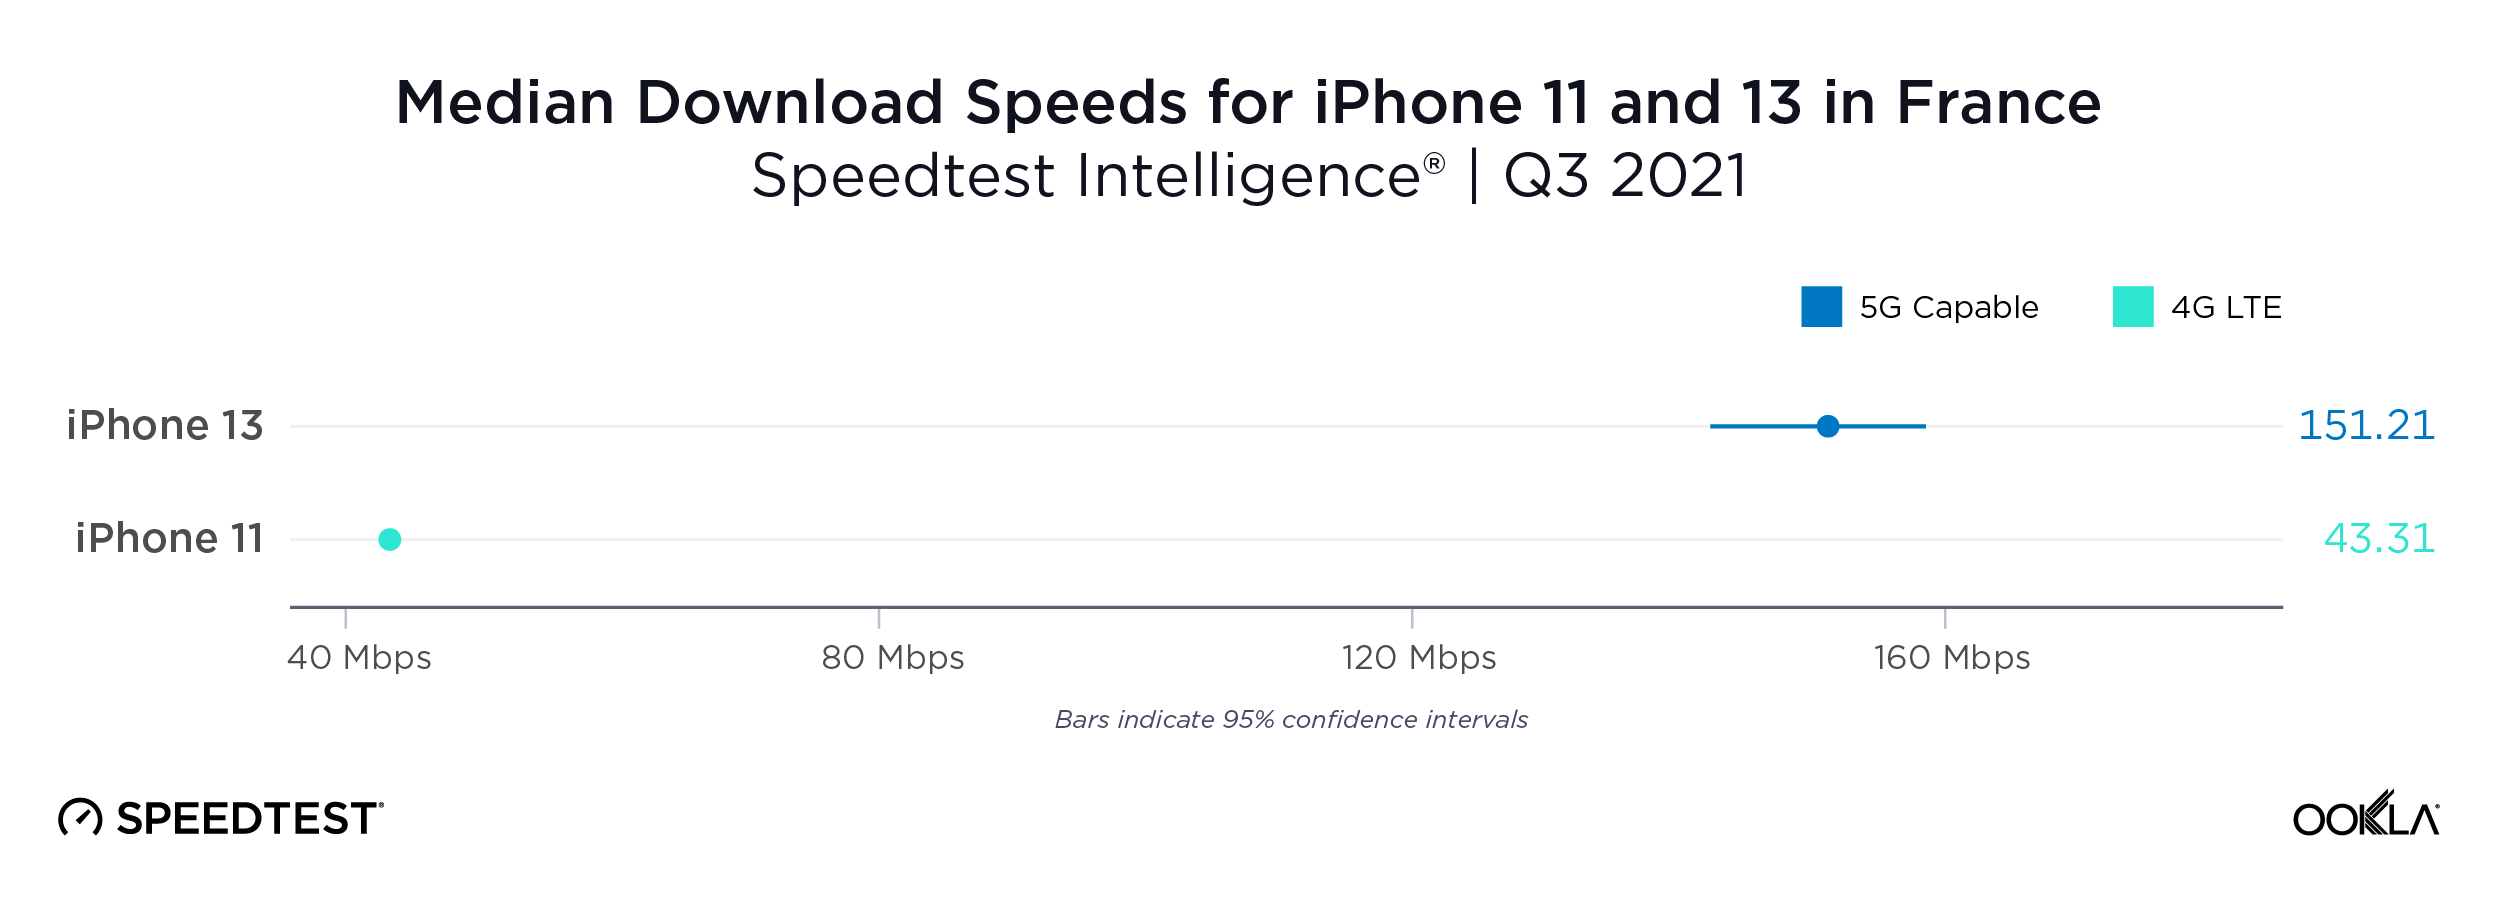
iPhone 13 more than three times faster than iPhone 11 in France
French consumers who upgraded from the iPhone 11 to the iPhone 13 during Q3 2021 would have tripled their median download speed potential on the 5G-capable iPhone 13.
Japan
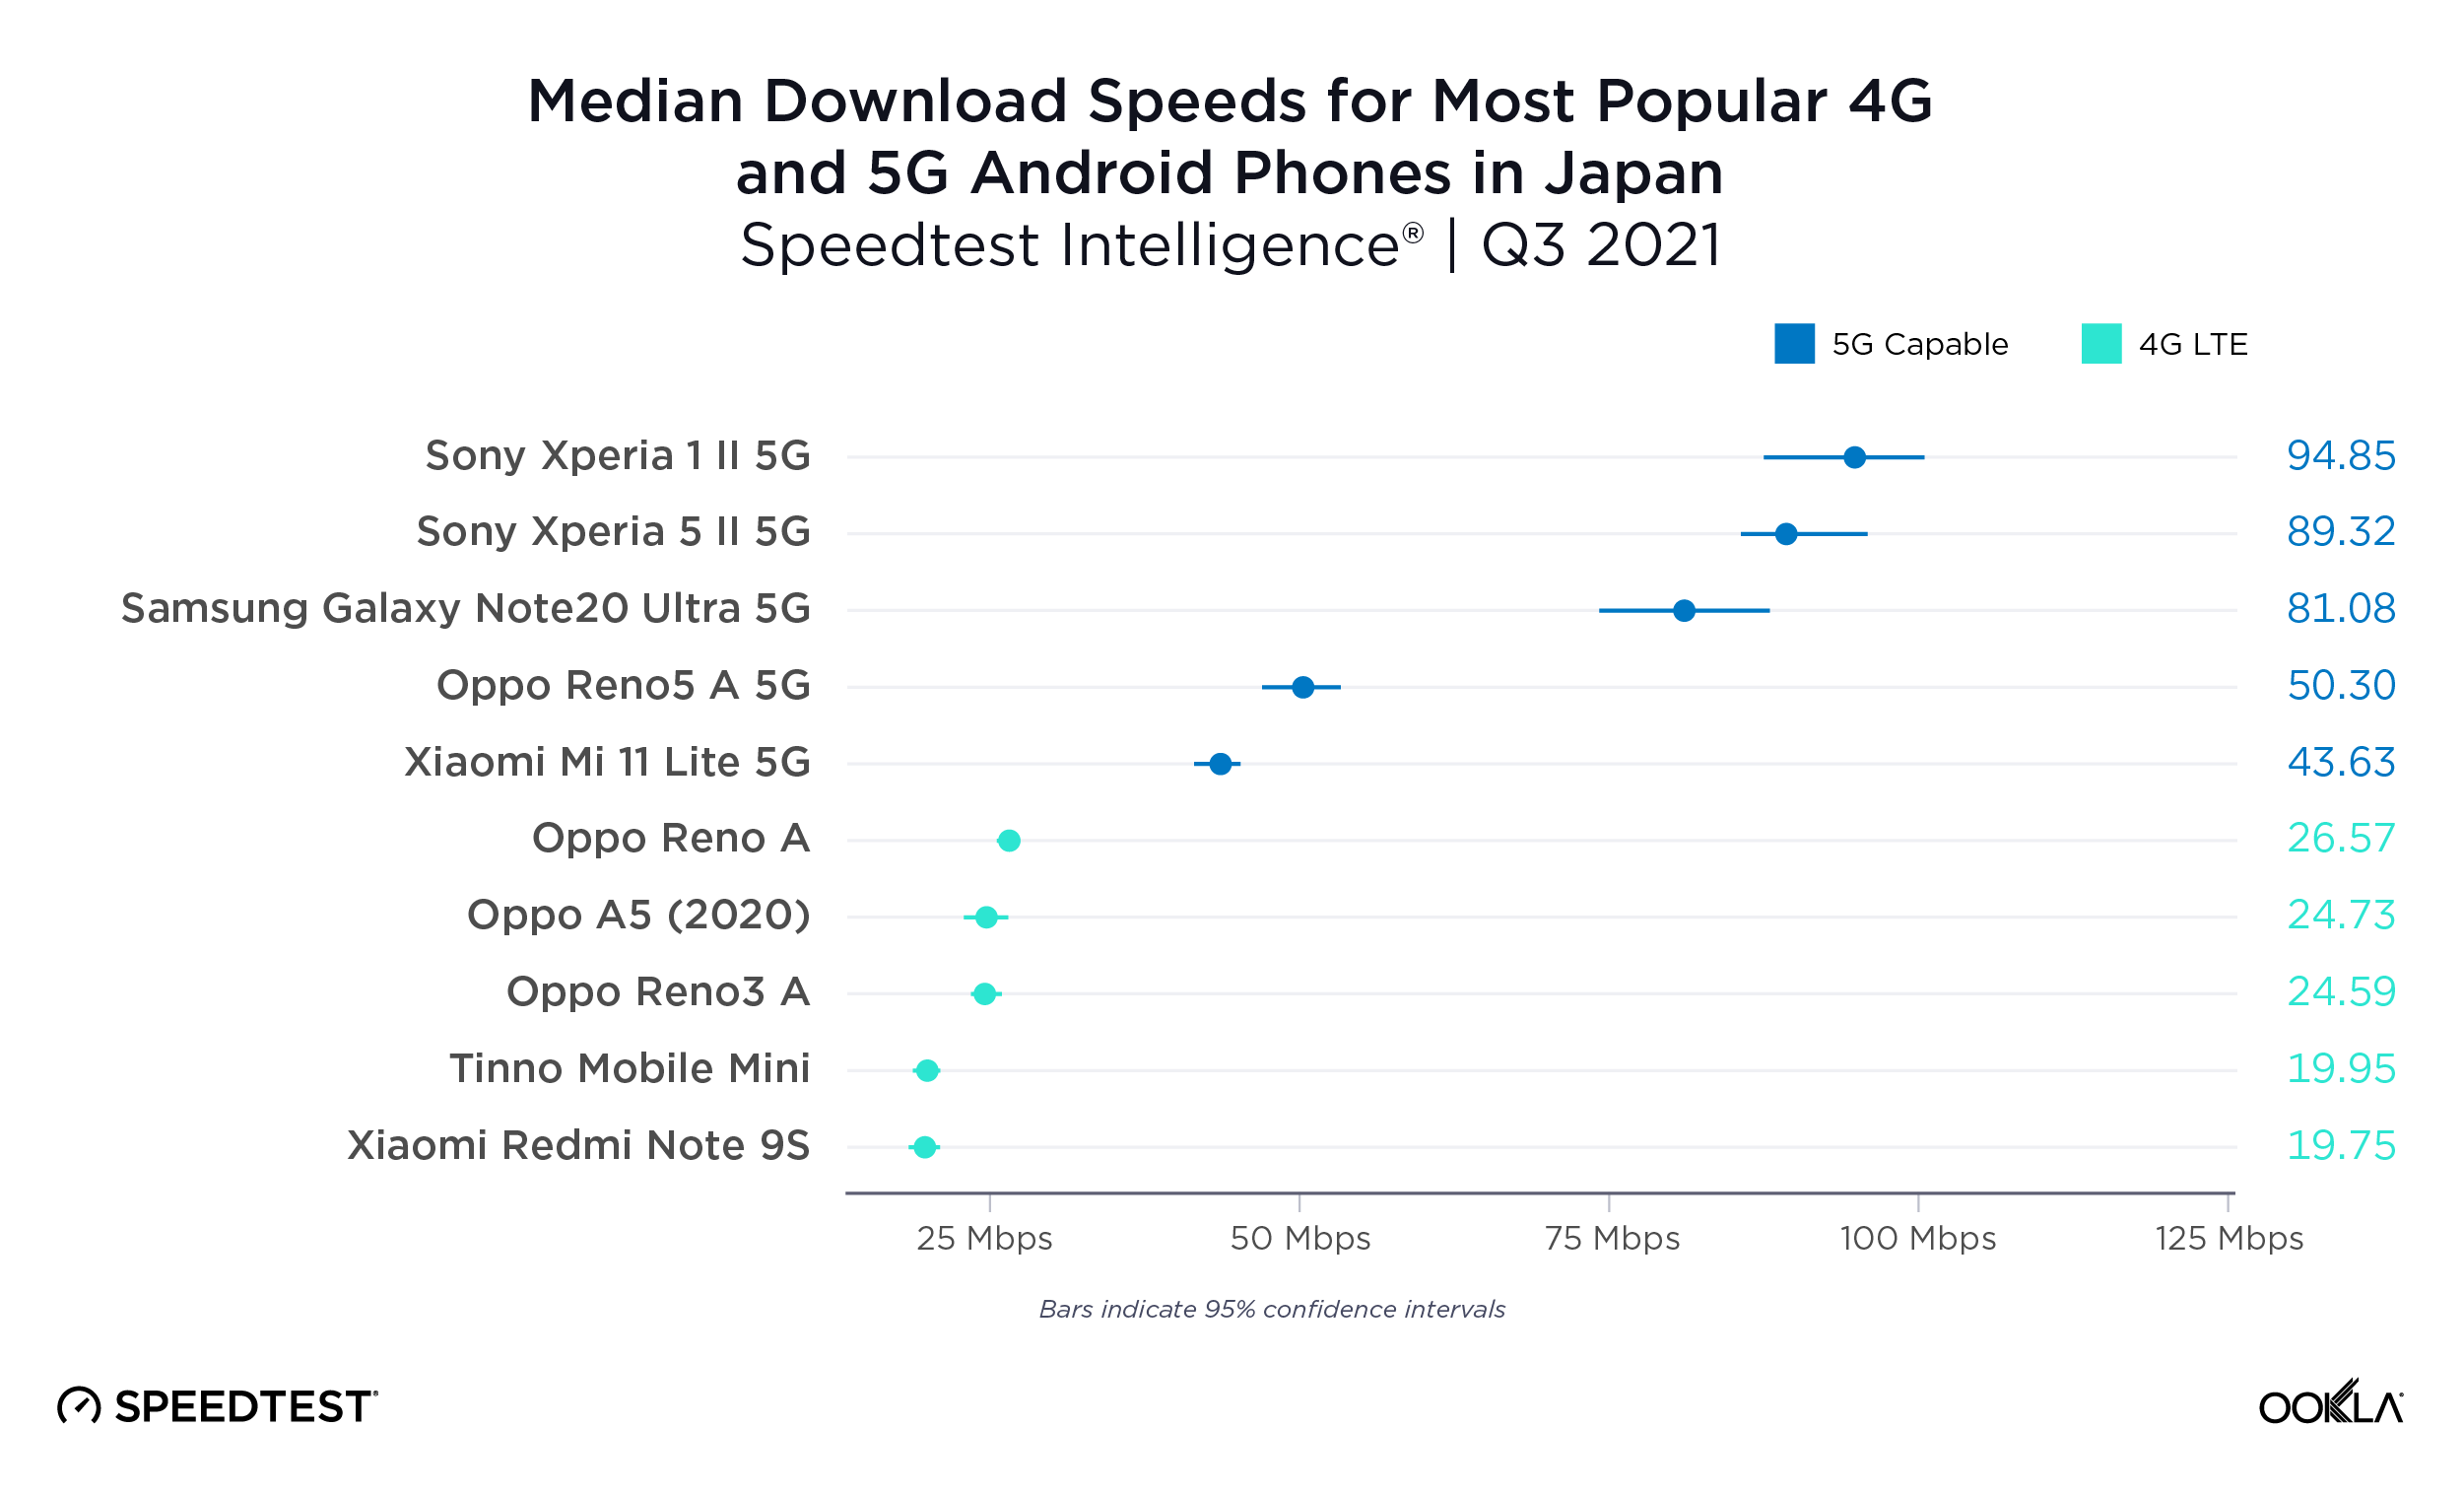
Android 5G devices are faster in Japan, but not always fast
The most popular 4G devices in Japan during Q3 2021 were much slower than the most popular 5G-capable devices. Speedtest Intelligence showed median download speeds on 4G devices ranging from 19.75 Mbps (Xiaomi Redmi Note 9S) to 26.57 Mbps (Oppo Reno A). Even the slowest 5G-capable device on this list, the Xiaomi Mi 11 Lite 5G at 43.63 Mbps, was 56% faster than the fastest 4G devices. However, the fastest 5G-capable device on this list, the Sony Xperia 1 II 5G, was twice as fast as that at 94.85 Mbps.
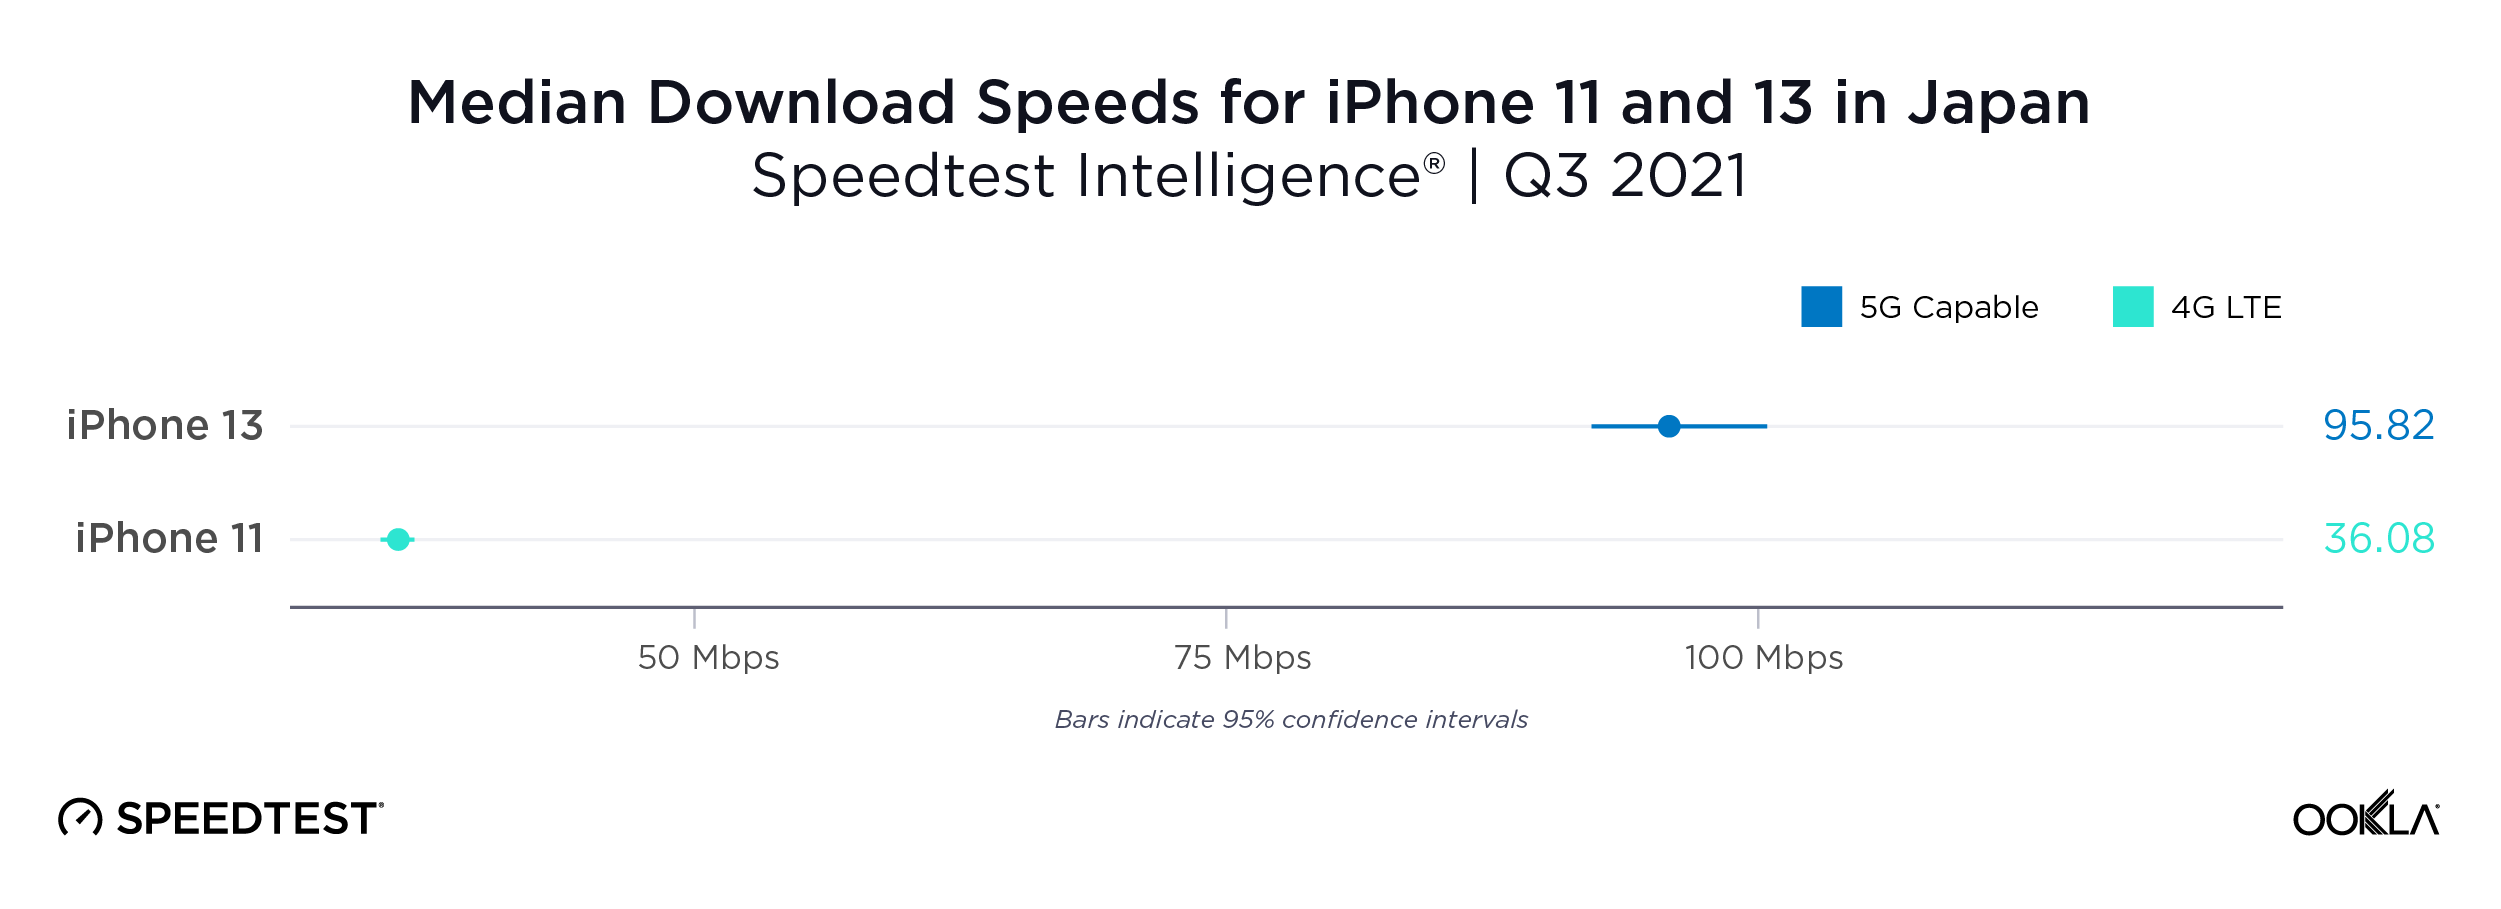
iPhone 13 more than twice as fast as iPhone 11 in Japan
In Japan, the median download speed of the iPhone 13 was more than twice as fast as that over the iPhone 11 during Q3 2021. This was one of the smallest differences in performance between the iPhone 11 and 13 that we saw in our analysis.
Saudi Arabia
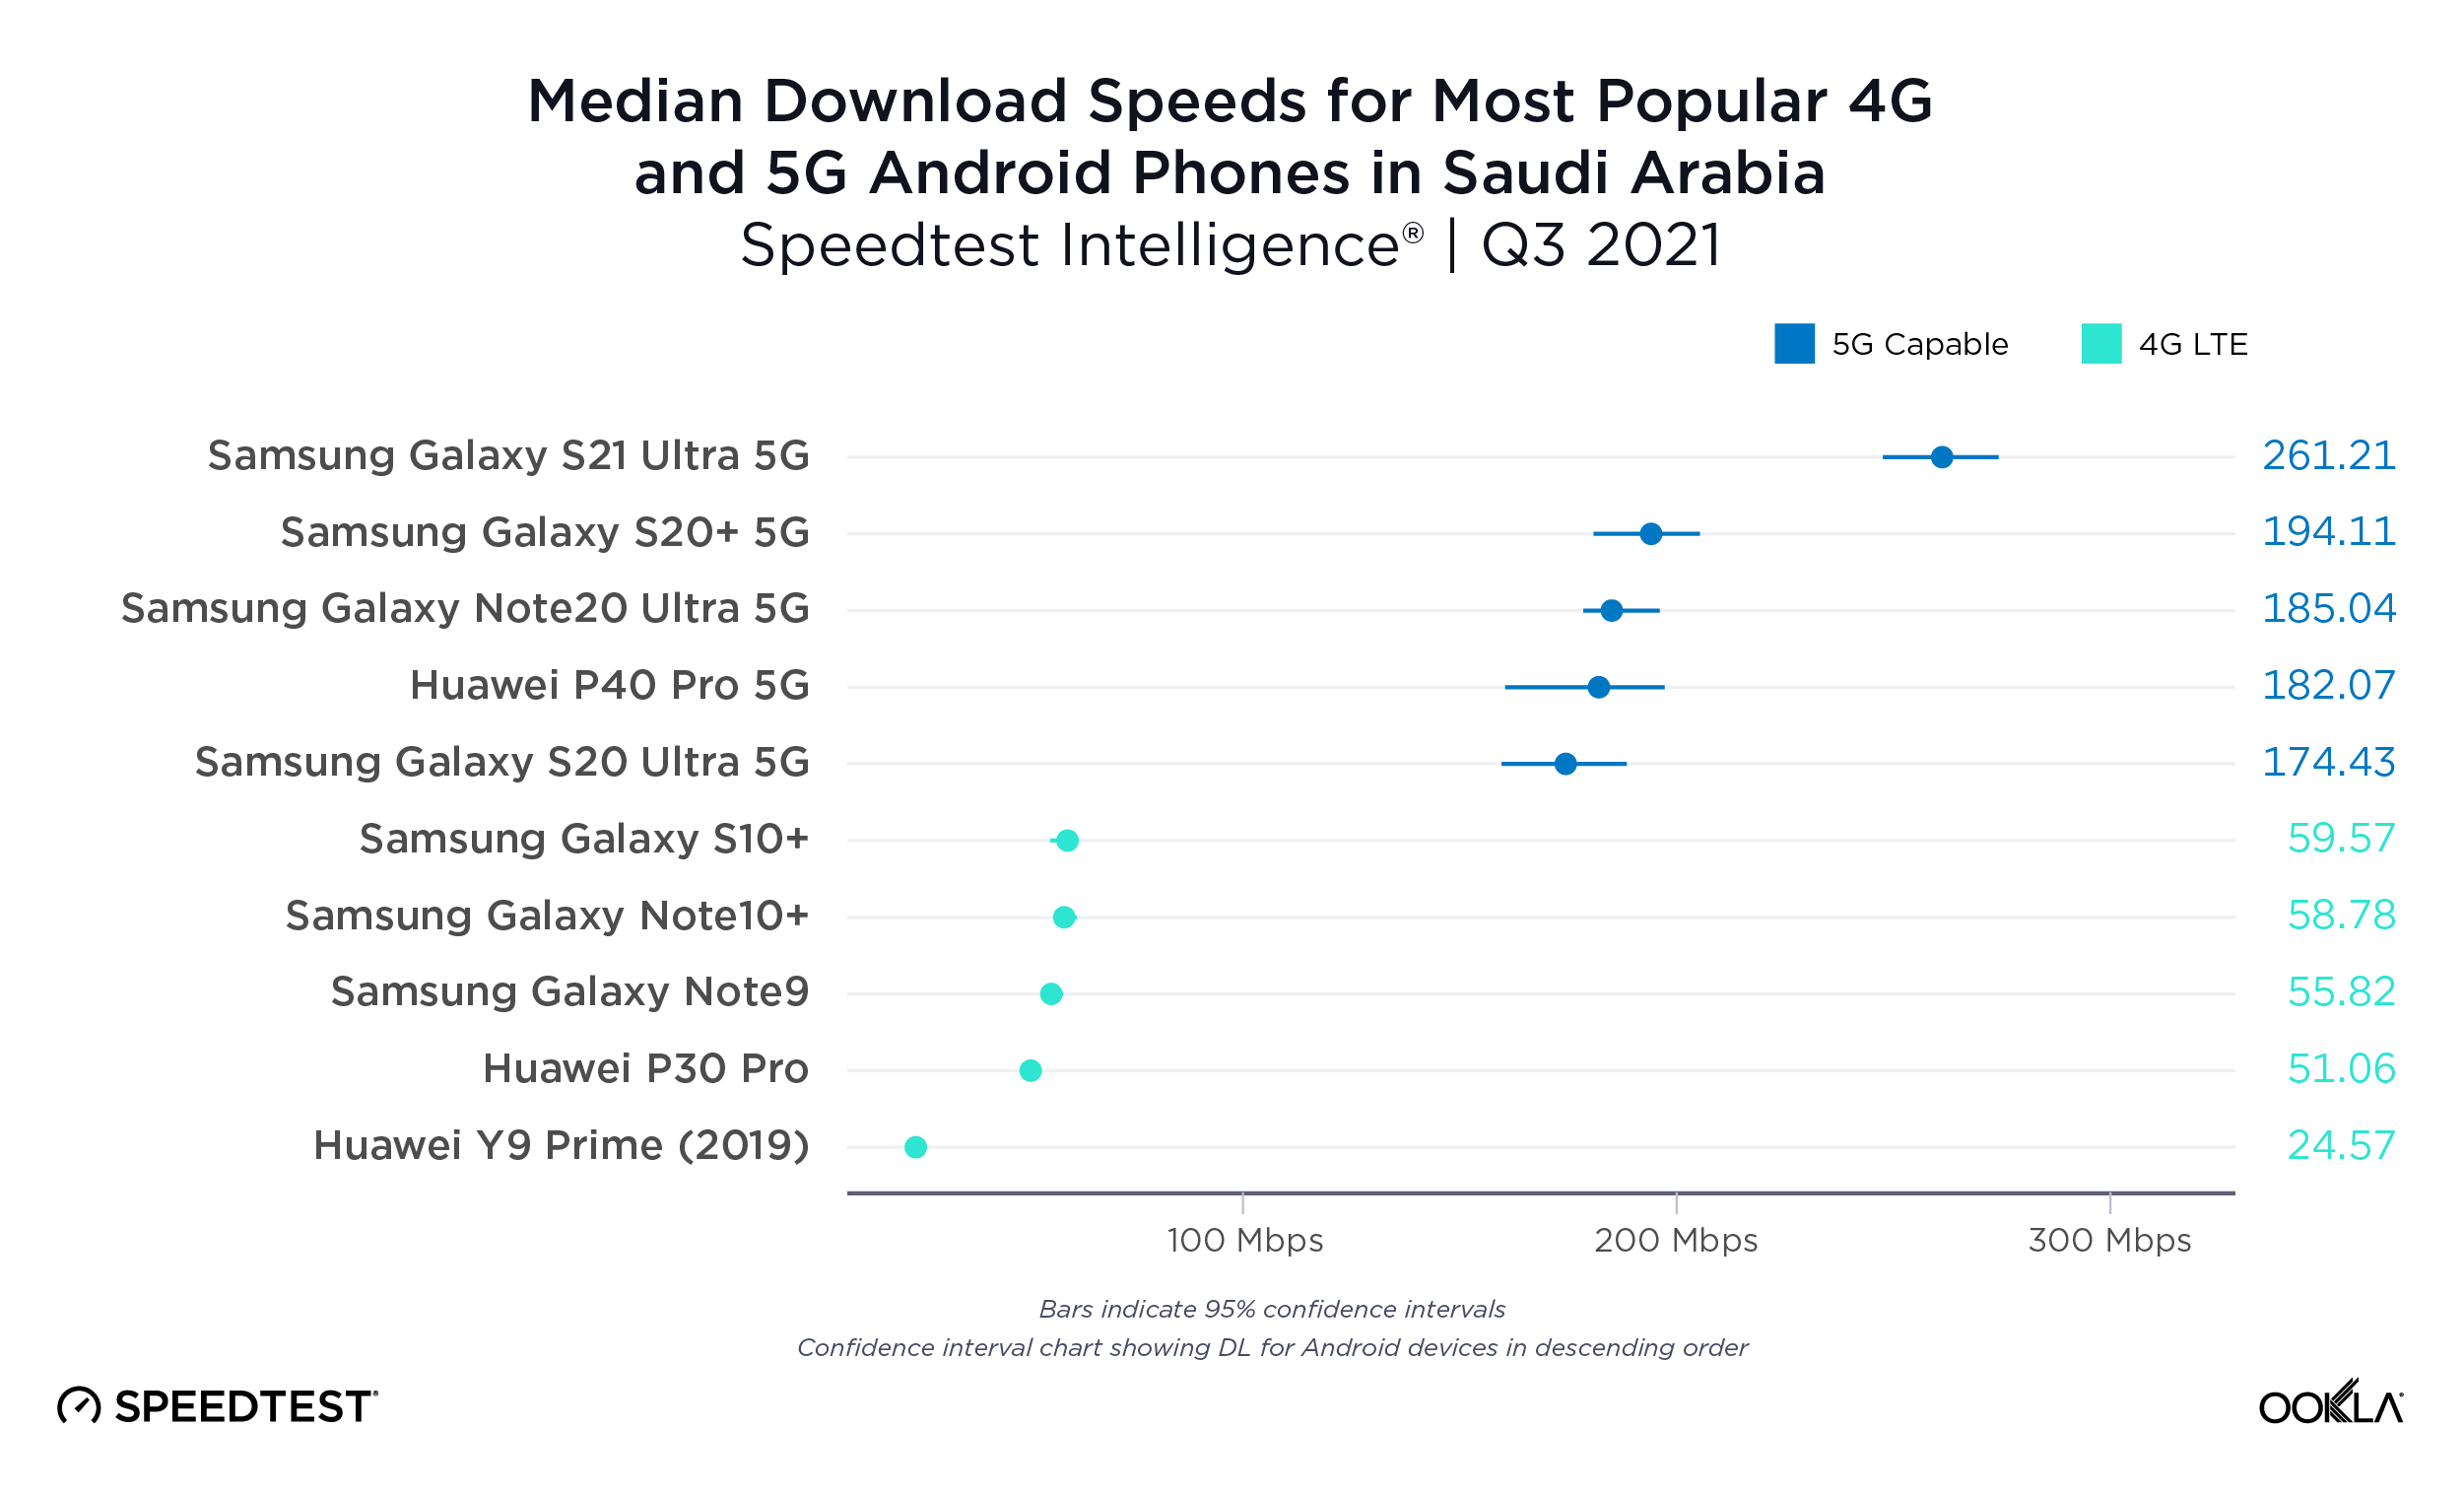
5G Android devices are much faster than 4G in Saudi Arabia
Median download speeds on the most popular 5G-capable devices were fast in Saudi Arabia compared to most other markets. 5G-capable speeds ranged from 174.43 Mbps for the Samsung Galaxy S20 Ultra 5G to 261.21 Mbps for the S21 Ultra 5G. 5G is definitely worth the upgrade in Saudi Arabia.
iPhone 13 was more than five times faster than the iPhone 11 in Saudi Arabia
Not only did Saudi Arabia show the second fastest median download speed over iPhone 13 during Q3 2021, the iPhone 13 was also more than five times faster than the iPhone 11.

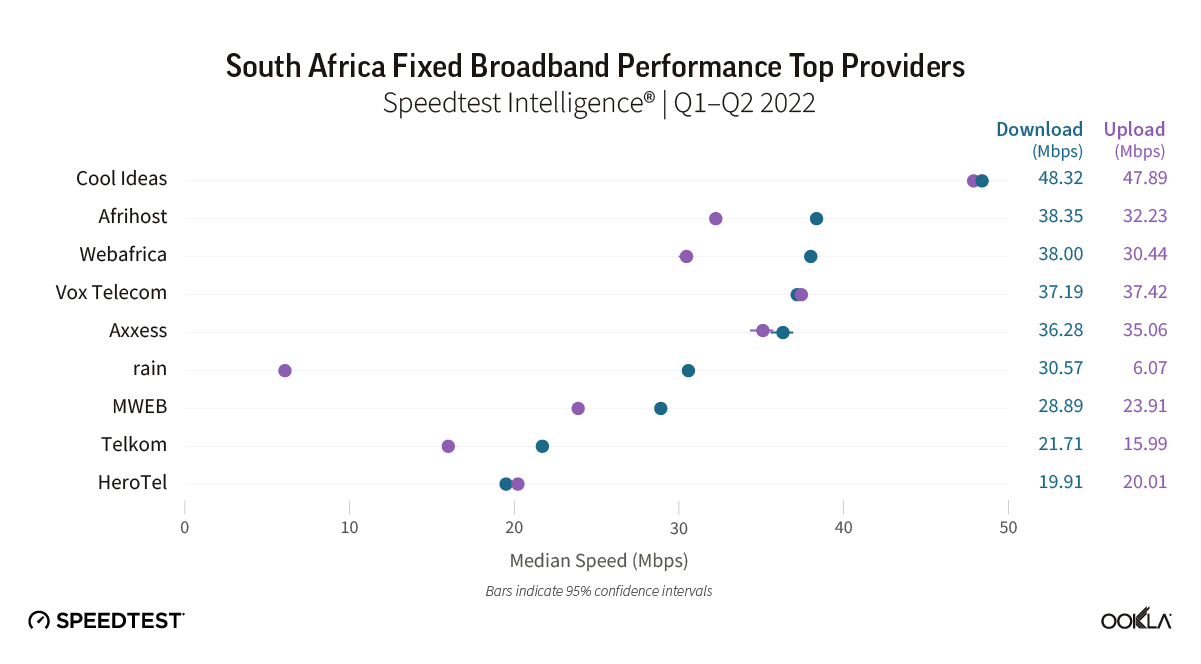
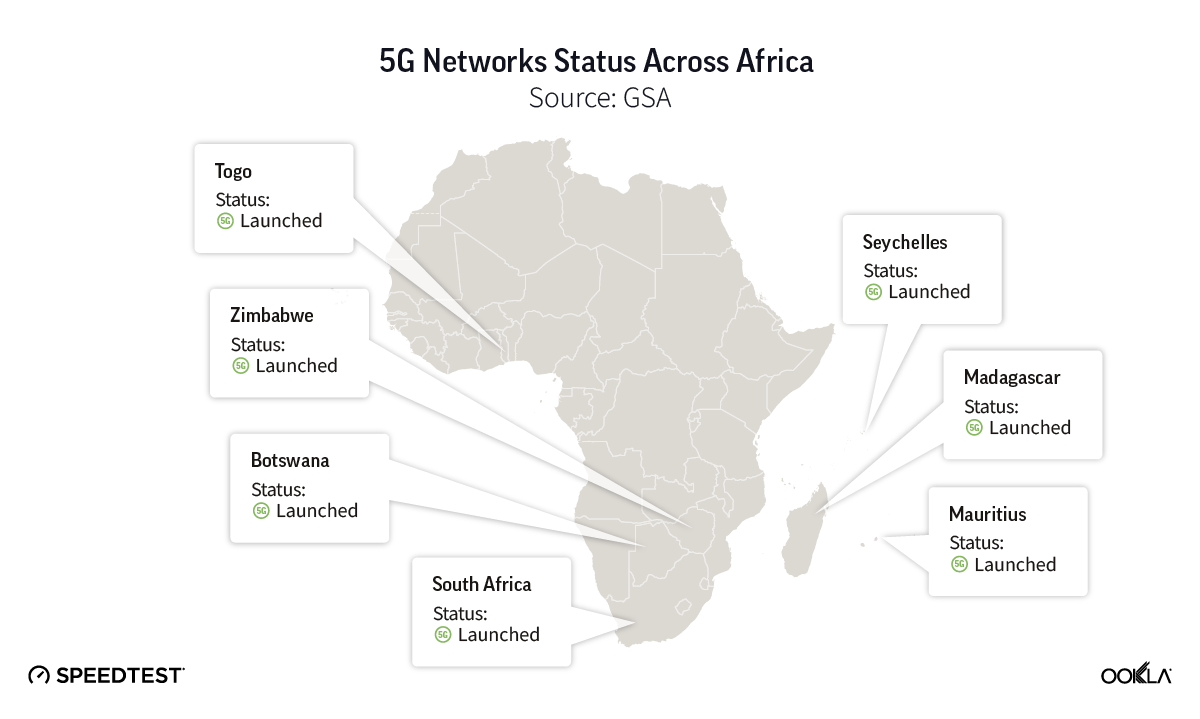
South Africa
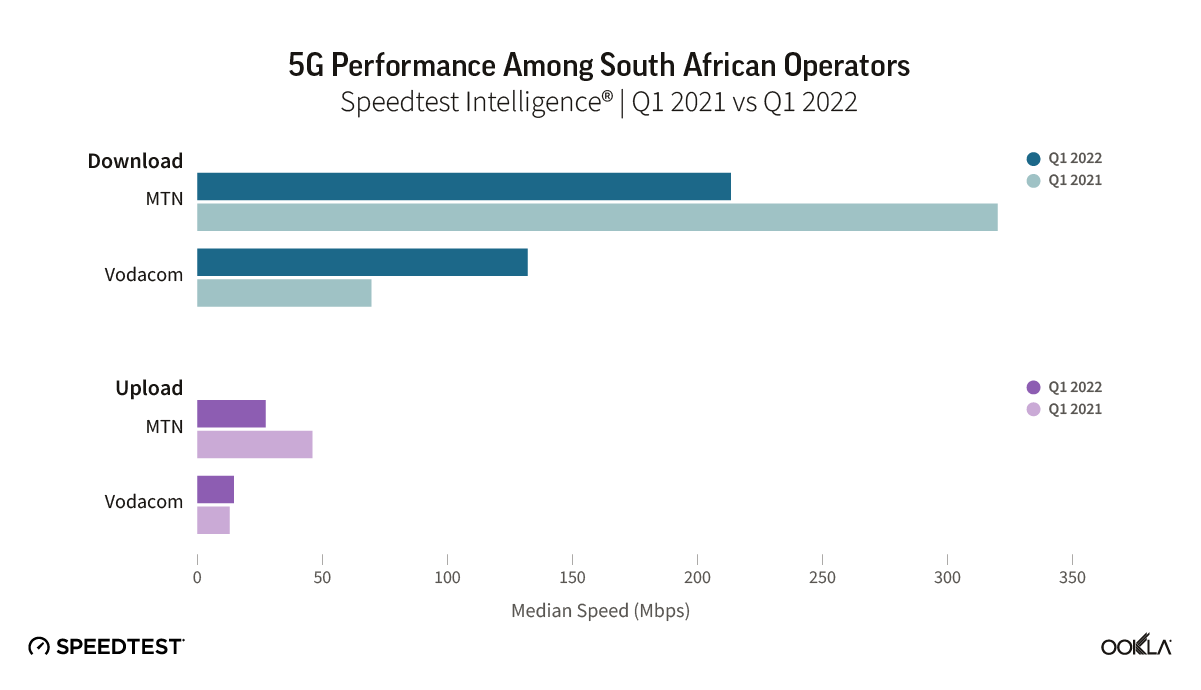
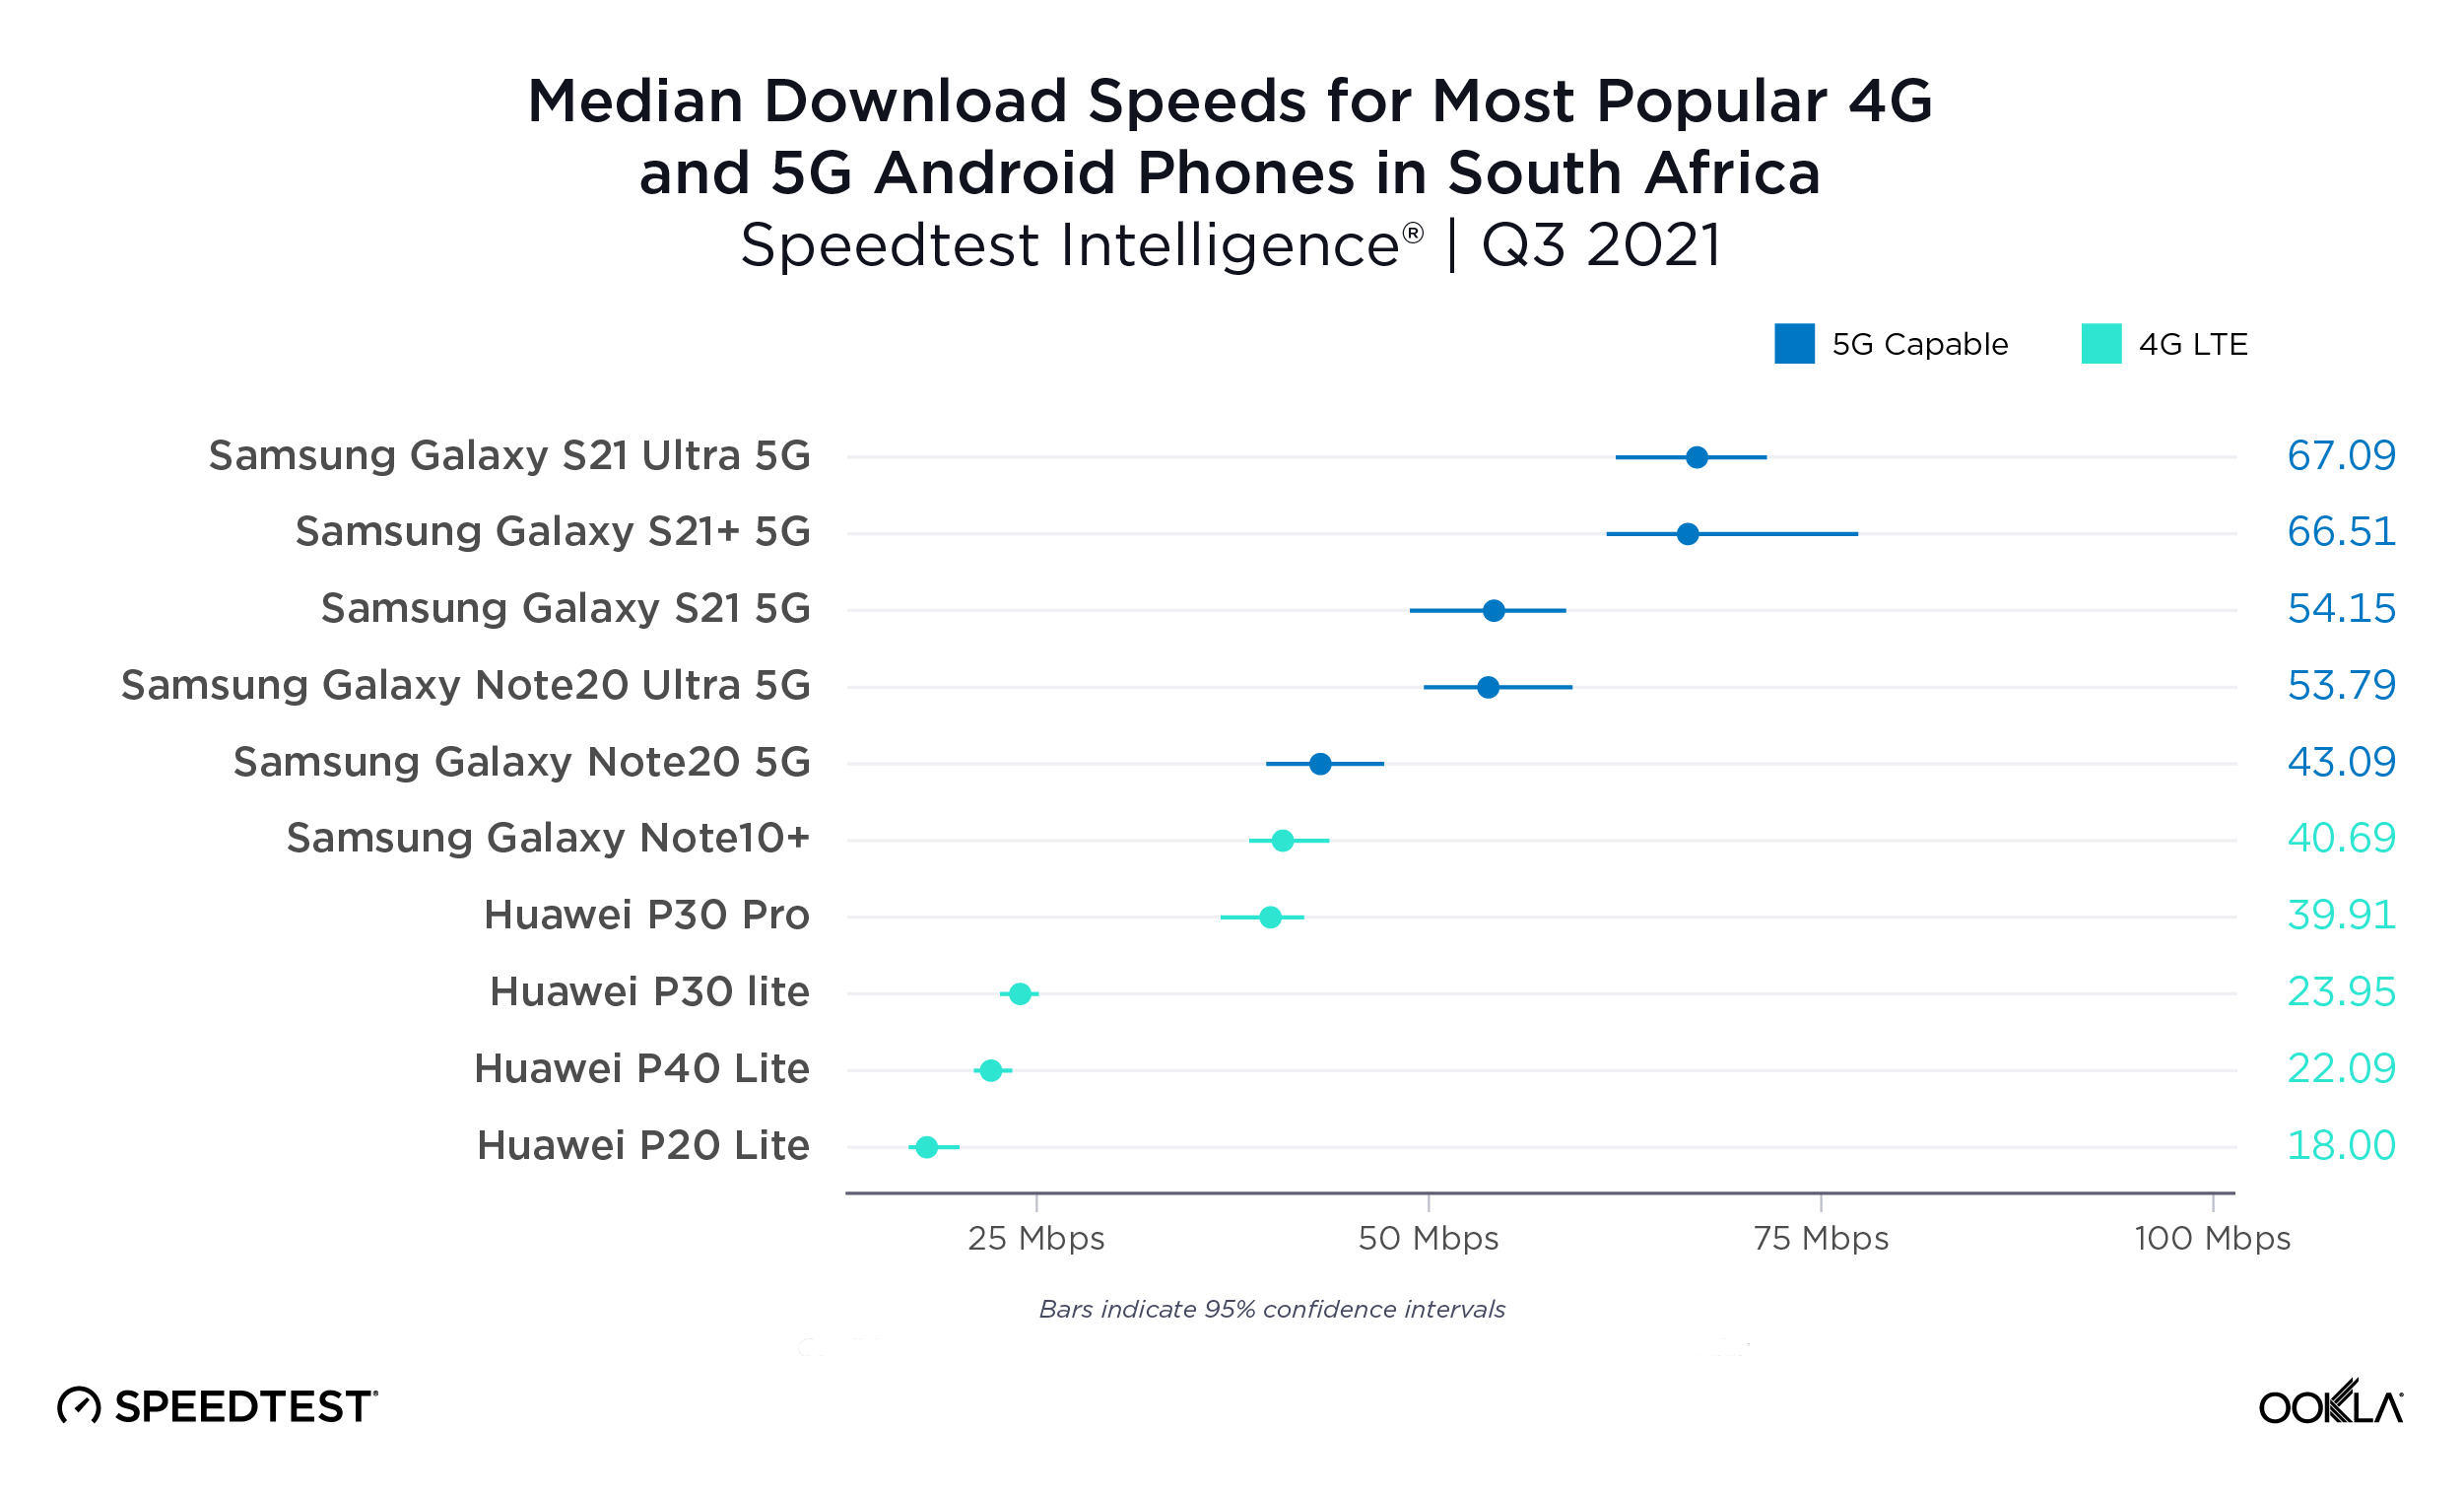
5G shows a small improvement over 4G on Android in South Africa
The most popular 4G devices in South Africa showed a wide range of median download speeds during Q3 2021, from 18.00 Mbps (Huawei P20 Lite) to 40.69 Mbps (Samsung Galaxy Note10+). South Africa’s median download speeds on the most popular 5G devices were among the lowest we saw, from 43.09 Mbps on the Samsung Galaxy Note20 5G to 67.09 Mbps on the S21 Ultra 5G.
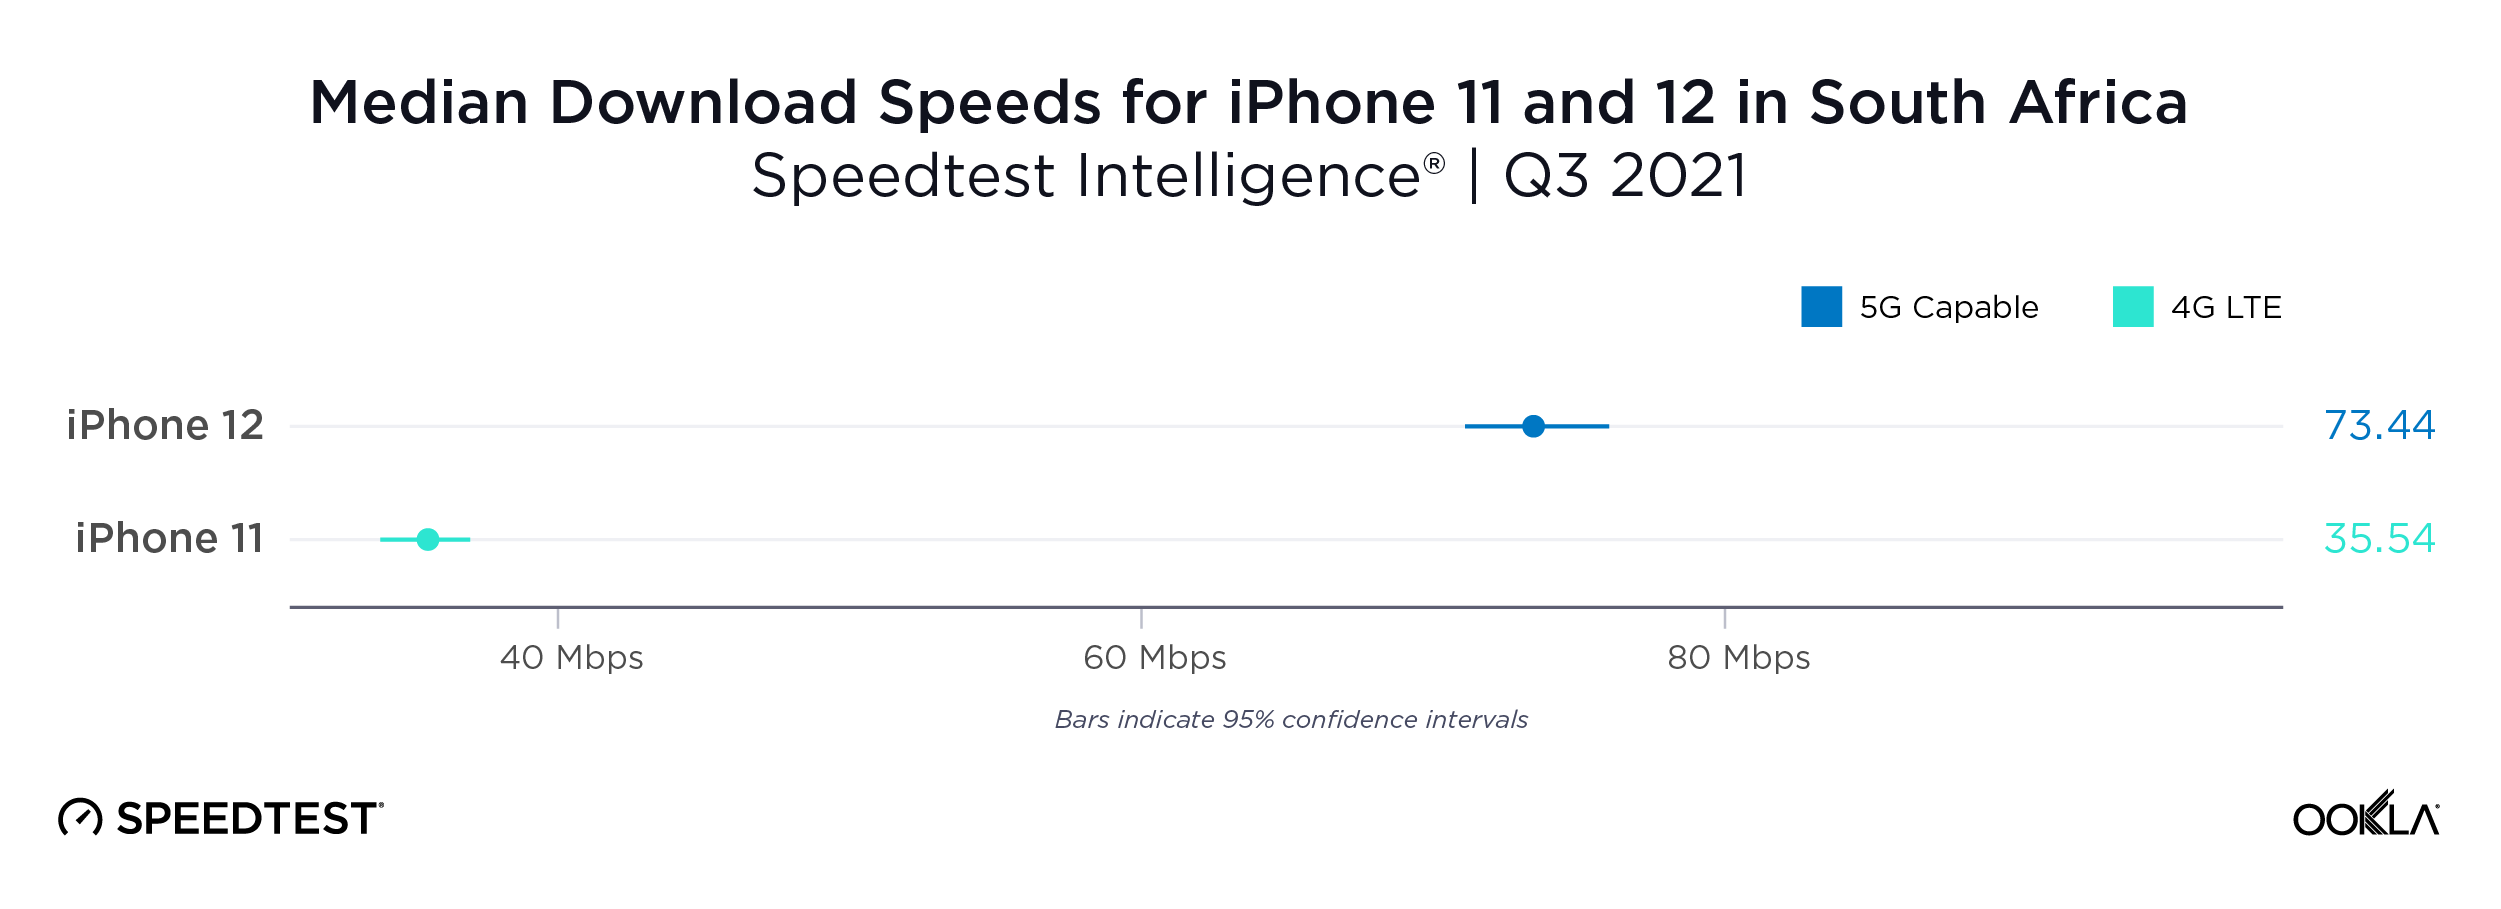
iPhone 12 was almost twice as fast as the iPhone 11 in South Africa
There weren’t sufficient samples in South Africa to analyze the iPhone 13, so we compared the iPhone 12 to the iPhone 11. The median download speed on the iPhone 12 was almost twice as fast as that on the iPhone 11 during Q3 2021.
South Korea
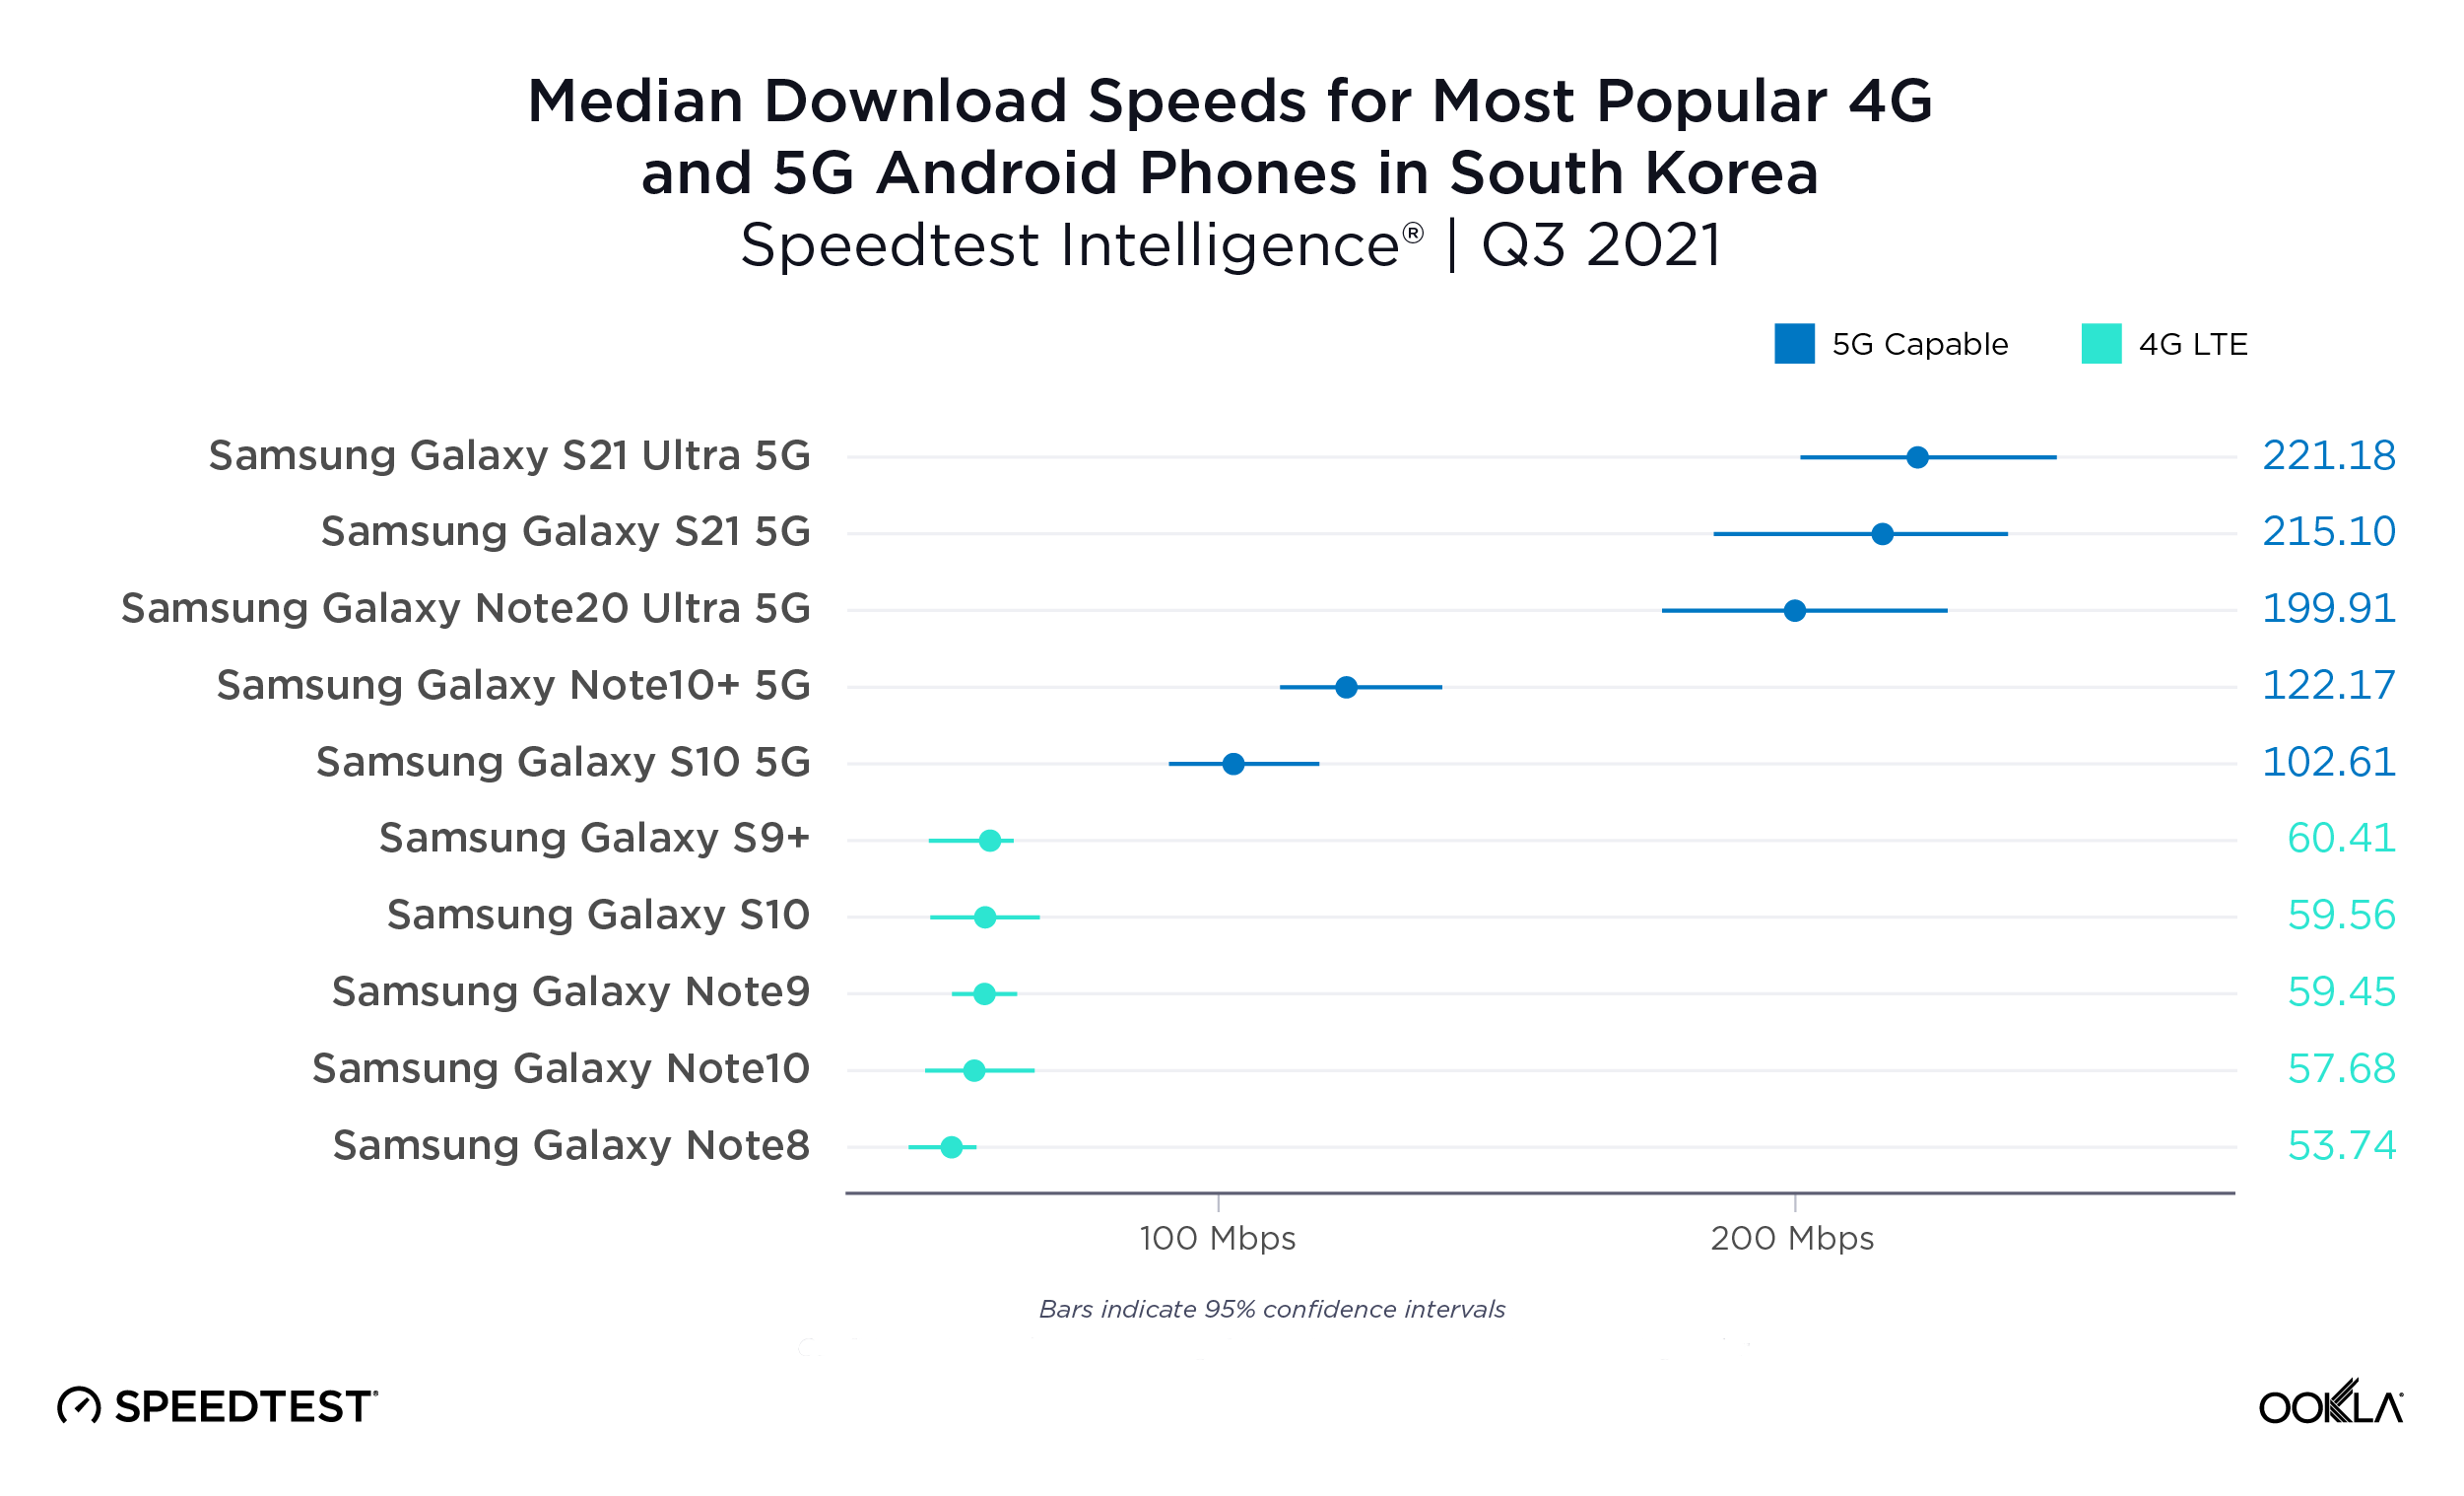
4G Android devices in South Korea are fast, 5G even faster
The median download speeds we saw on the most popular 4G devices in South Korea during Q3 2021 rivaled the 5G speeds in South Africa with speeds ranging from 53.74 Mbps on the Samsung Galaxy Note8 to 60.41 Mbps on the S9+. However, median performance on 5G-capable devices was even faster. There was a wide variety in speeds among the most popular 5G-capable with the S10 5G showing a median download speed of 102.61 Mbps and the S21 Ultra 5G coming in at 221.18 Mbps. 5G is worth the upgrade in South Korea and consumers have a variety of high-performing devices to choose from.
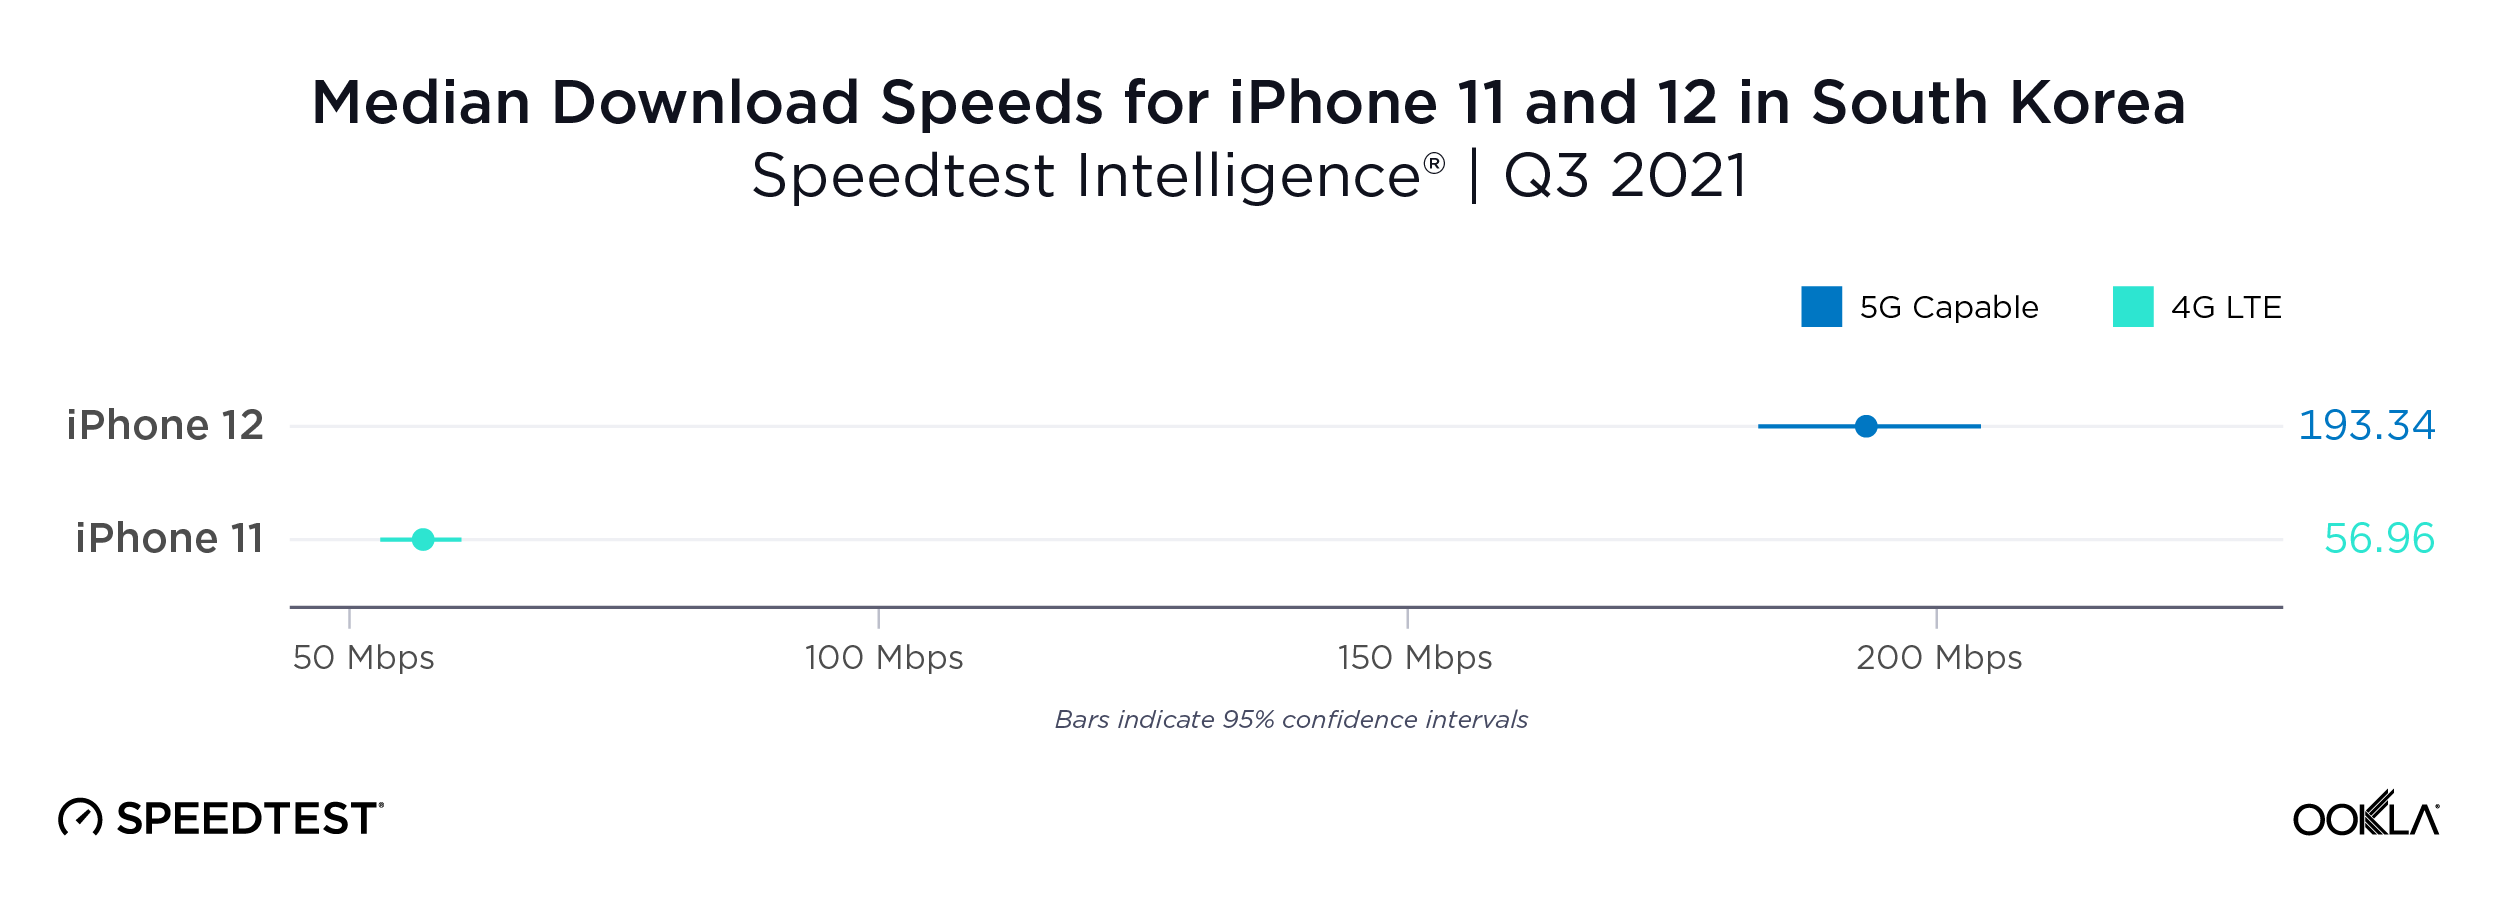
iPhone 12 more than three times faster than iPhone 11 in South Korea
South Korea did not have enough samples from the new iPhone 13, so we compared the iPhone 12 to the iPhone 11. Not only was the iPhone 12 more than three times faster for median download speed than the iPhone 11 during Q3 2021, South Korea’s iPhone 12 download speed beat iPhone 13 download speed in five of the countries we analyzed: Canada, France, Japan, U.K. and the U.S.
United Arab Emirates
U.A.E. had the fastest speeds on Android 5G devices
While the median download speeds across 4G devices in the U.A.E. during Q3 2021 handily beat those of all the other countries in this analysis, the country’s 5G download speeds were even faster. We can see from this data that some of the 4G devices can perform much better when on a faster network. Even the slowest 4G device on this list, the Huawei P30 Pro, had a median download speed of 68.26 Mbps in U.A.E. compared to 30.20 Mbps in the U.K. on the same device.
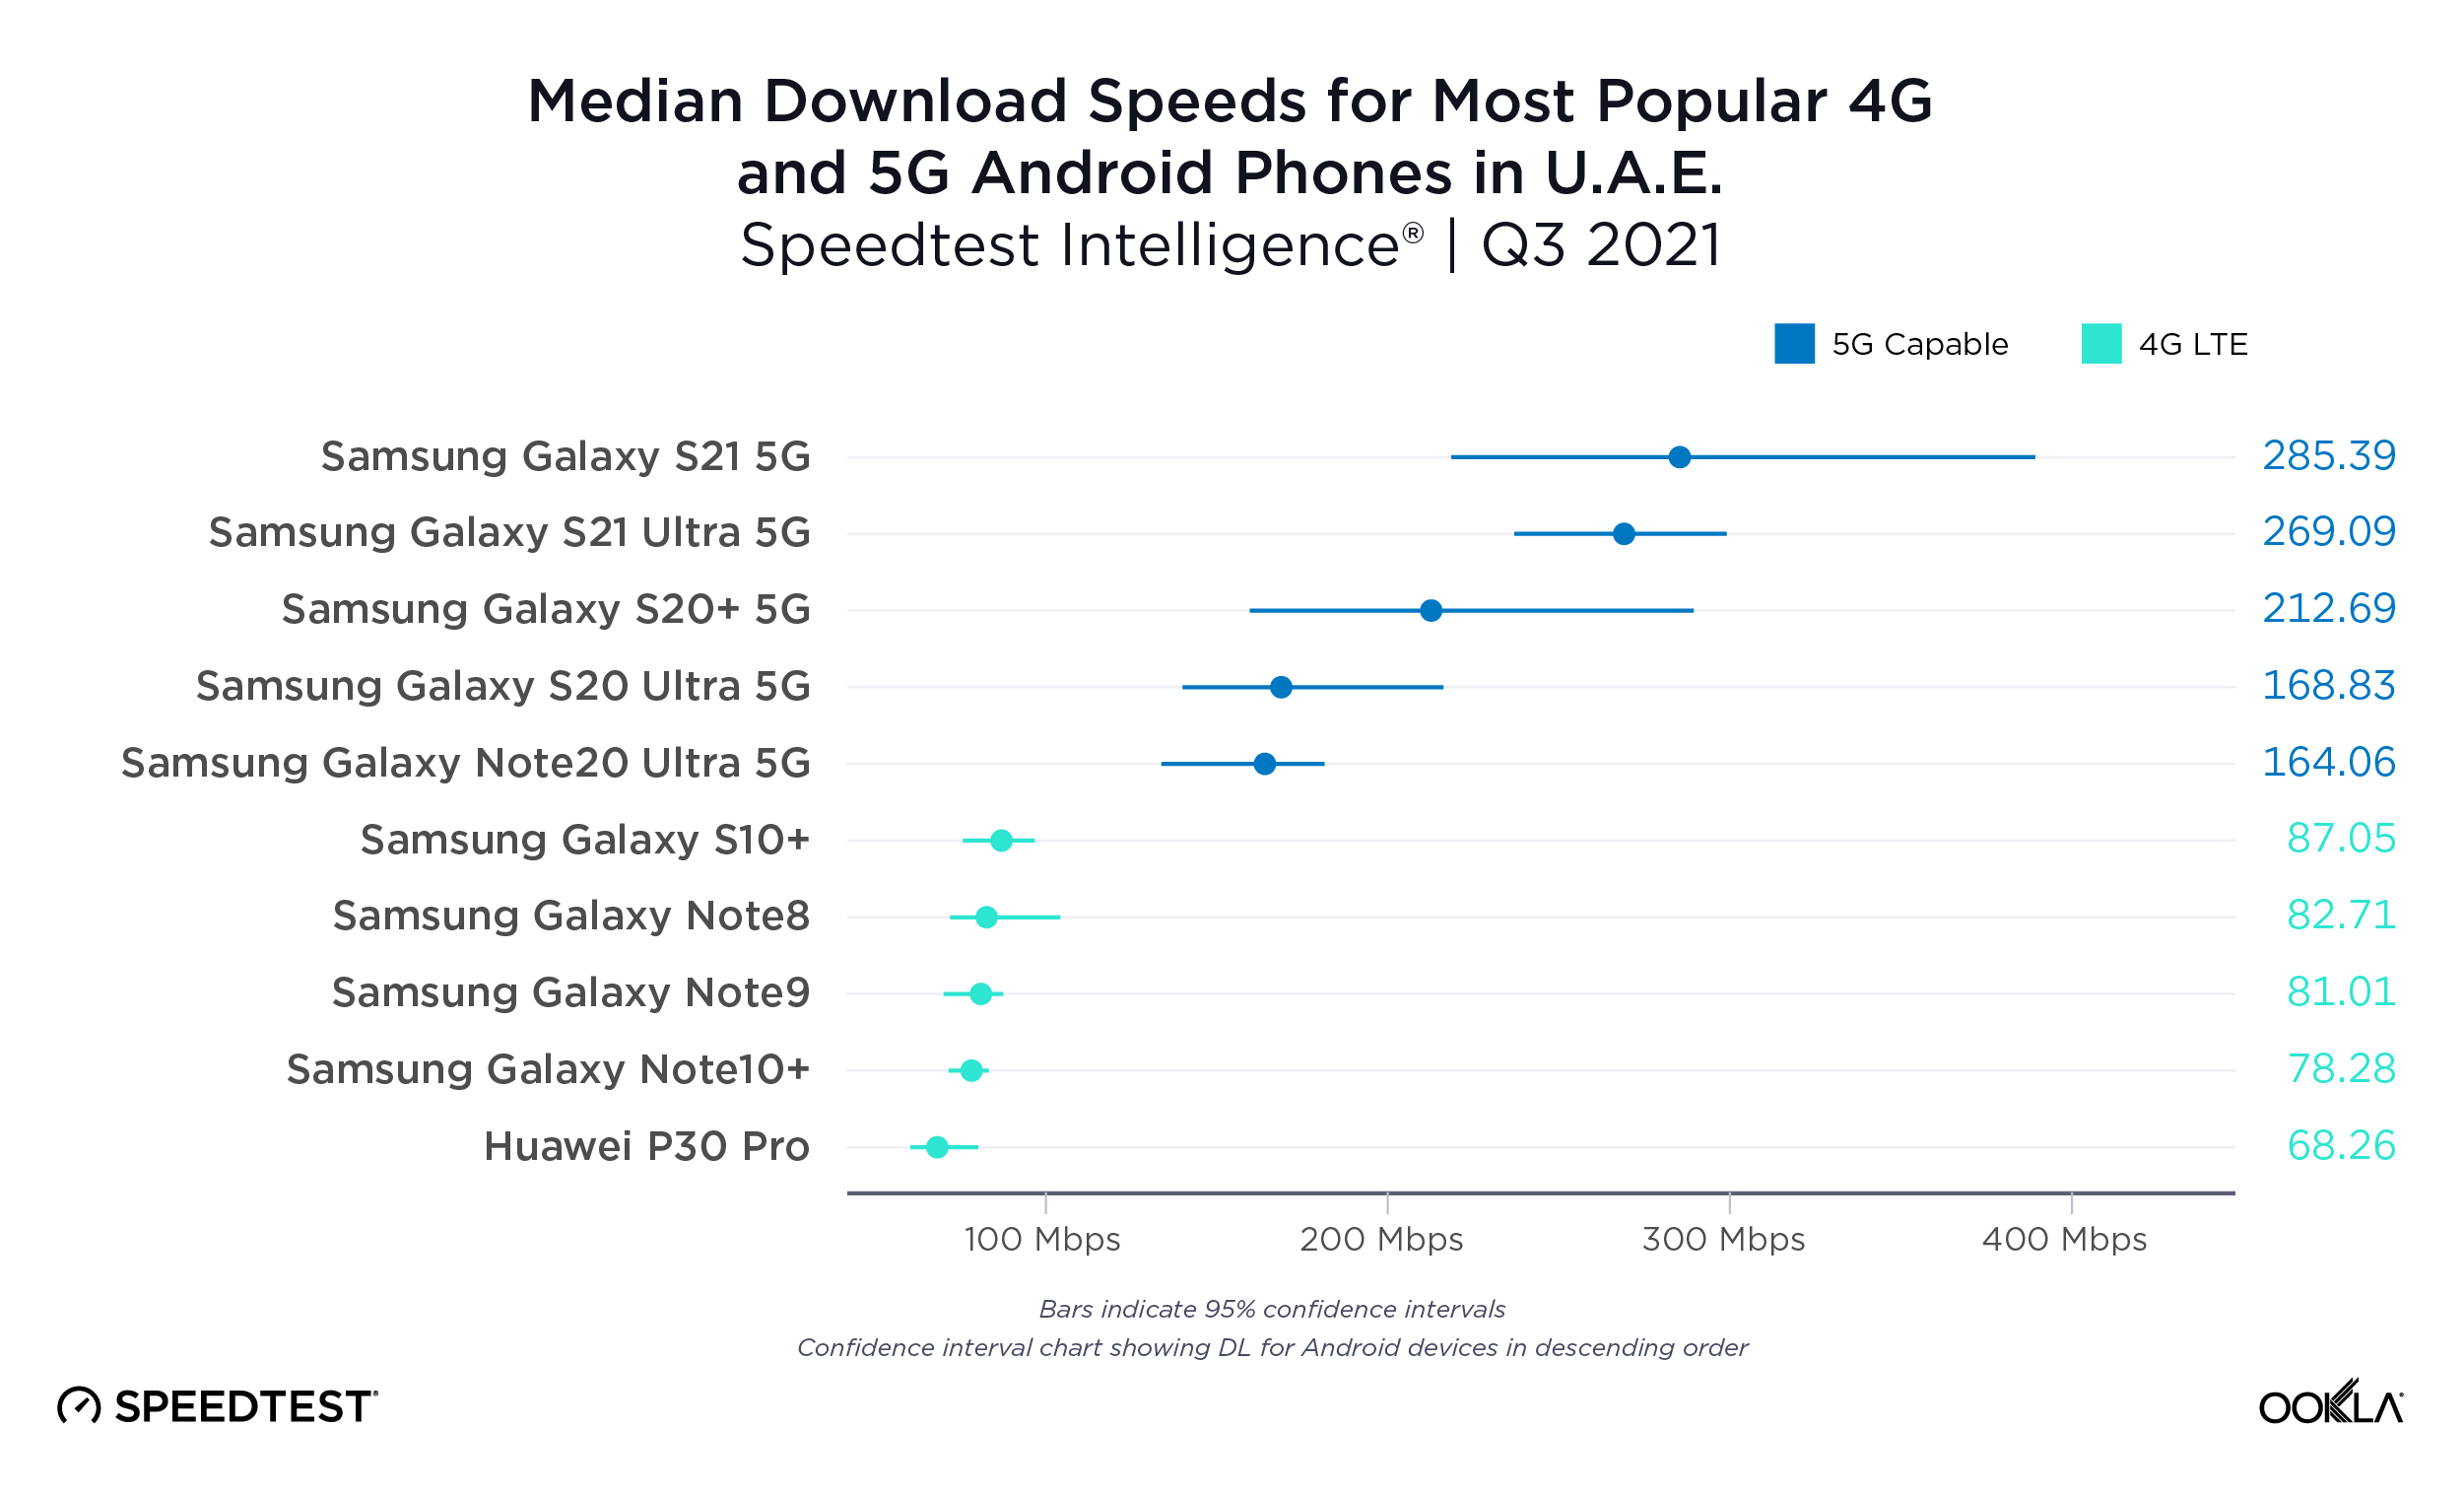
A similar story can be told for 5G devices where the U.A.E. was competing only with Saudi Arabia and South Korea for the fastest median performance on devices listed during Q3 2021. The Samsung Galaxy S21 5G showed a median download speed of 285.39 Mbps in the U.A.E. compared to 215.10 Mbps in South Korea while the Galaxy S21 Ultra 5G showed a median download speed of 269.09 Mbps in the U.A.E. and 261.21 Mbps in Saudi Arabia.
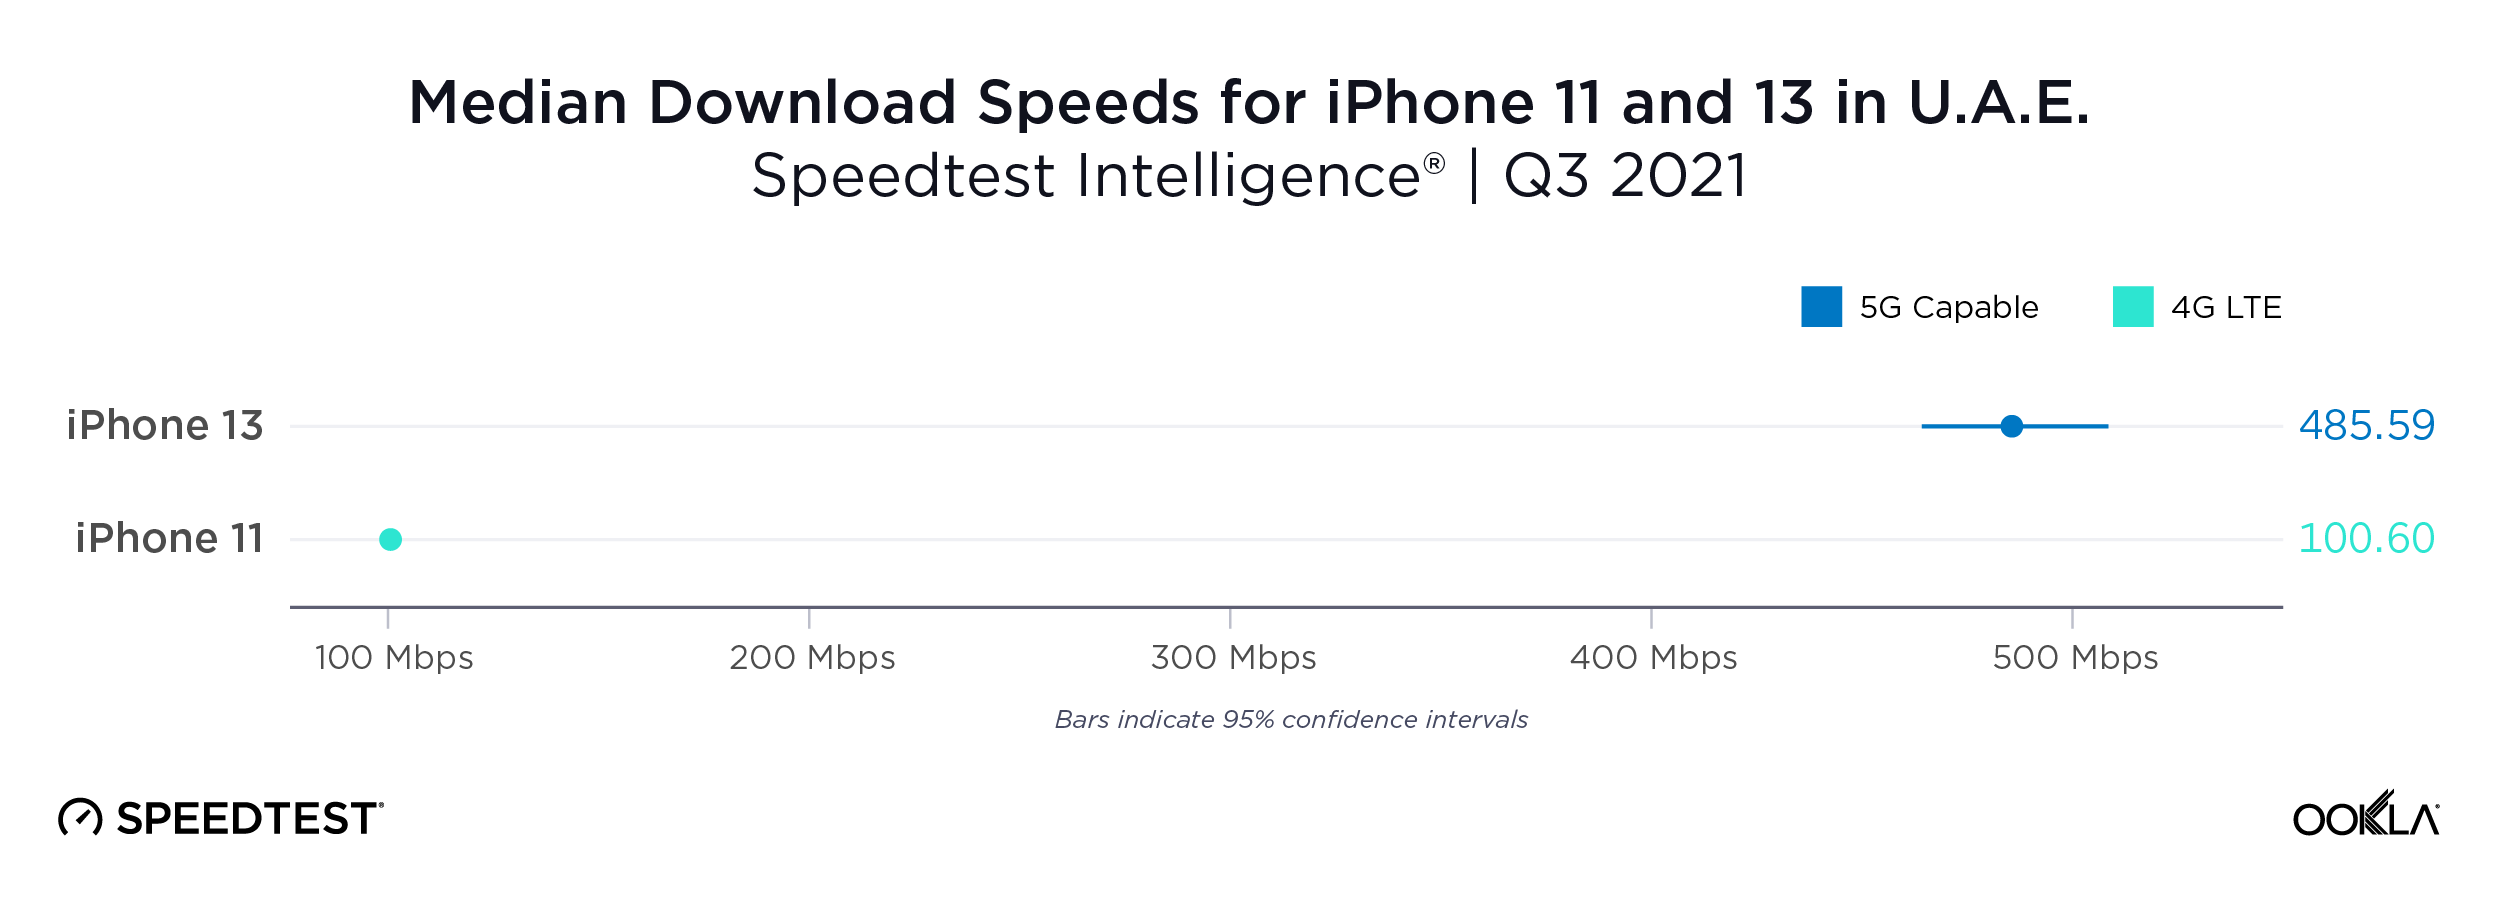
iPhone 13 more than four times faster than iPhone 11 in U.A.E.
Not only did the U.A.E. have the fastest median download speed over iPhone 13 that we saw in this analysis, the 485.59 Mbps download speed was faster than any phone in any country that we analyzed in Q3 2021. The iPhone 13 capitalized on fast 5G in the U.A.E. to have a median download speed that was more than four times faster than that of the iPhone 11.
United Kingdom
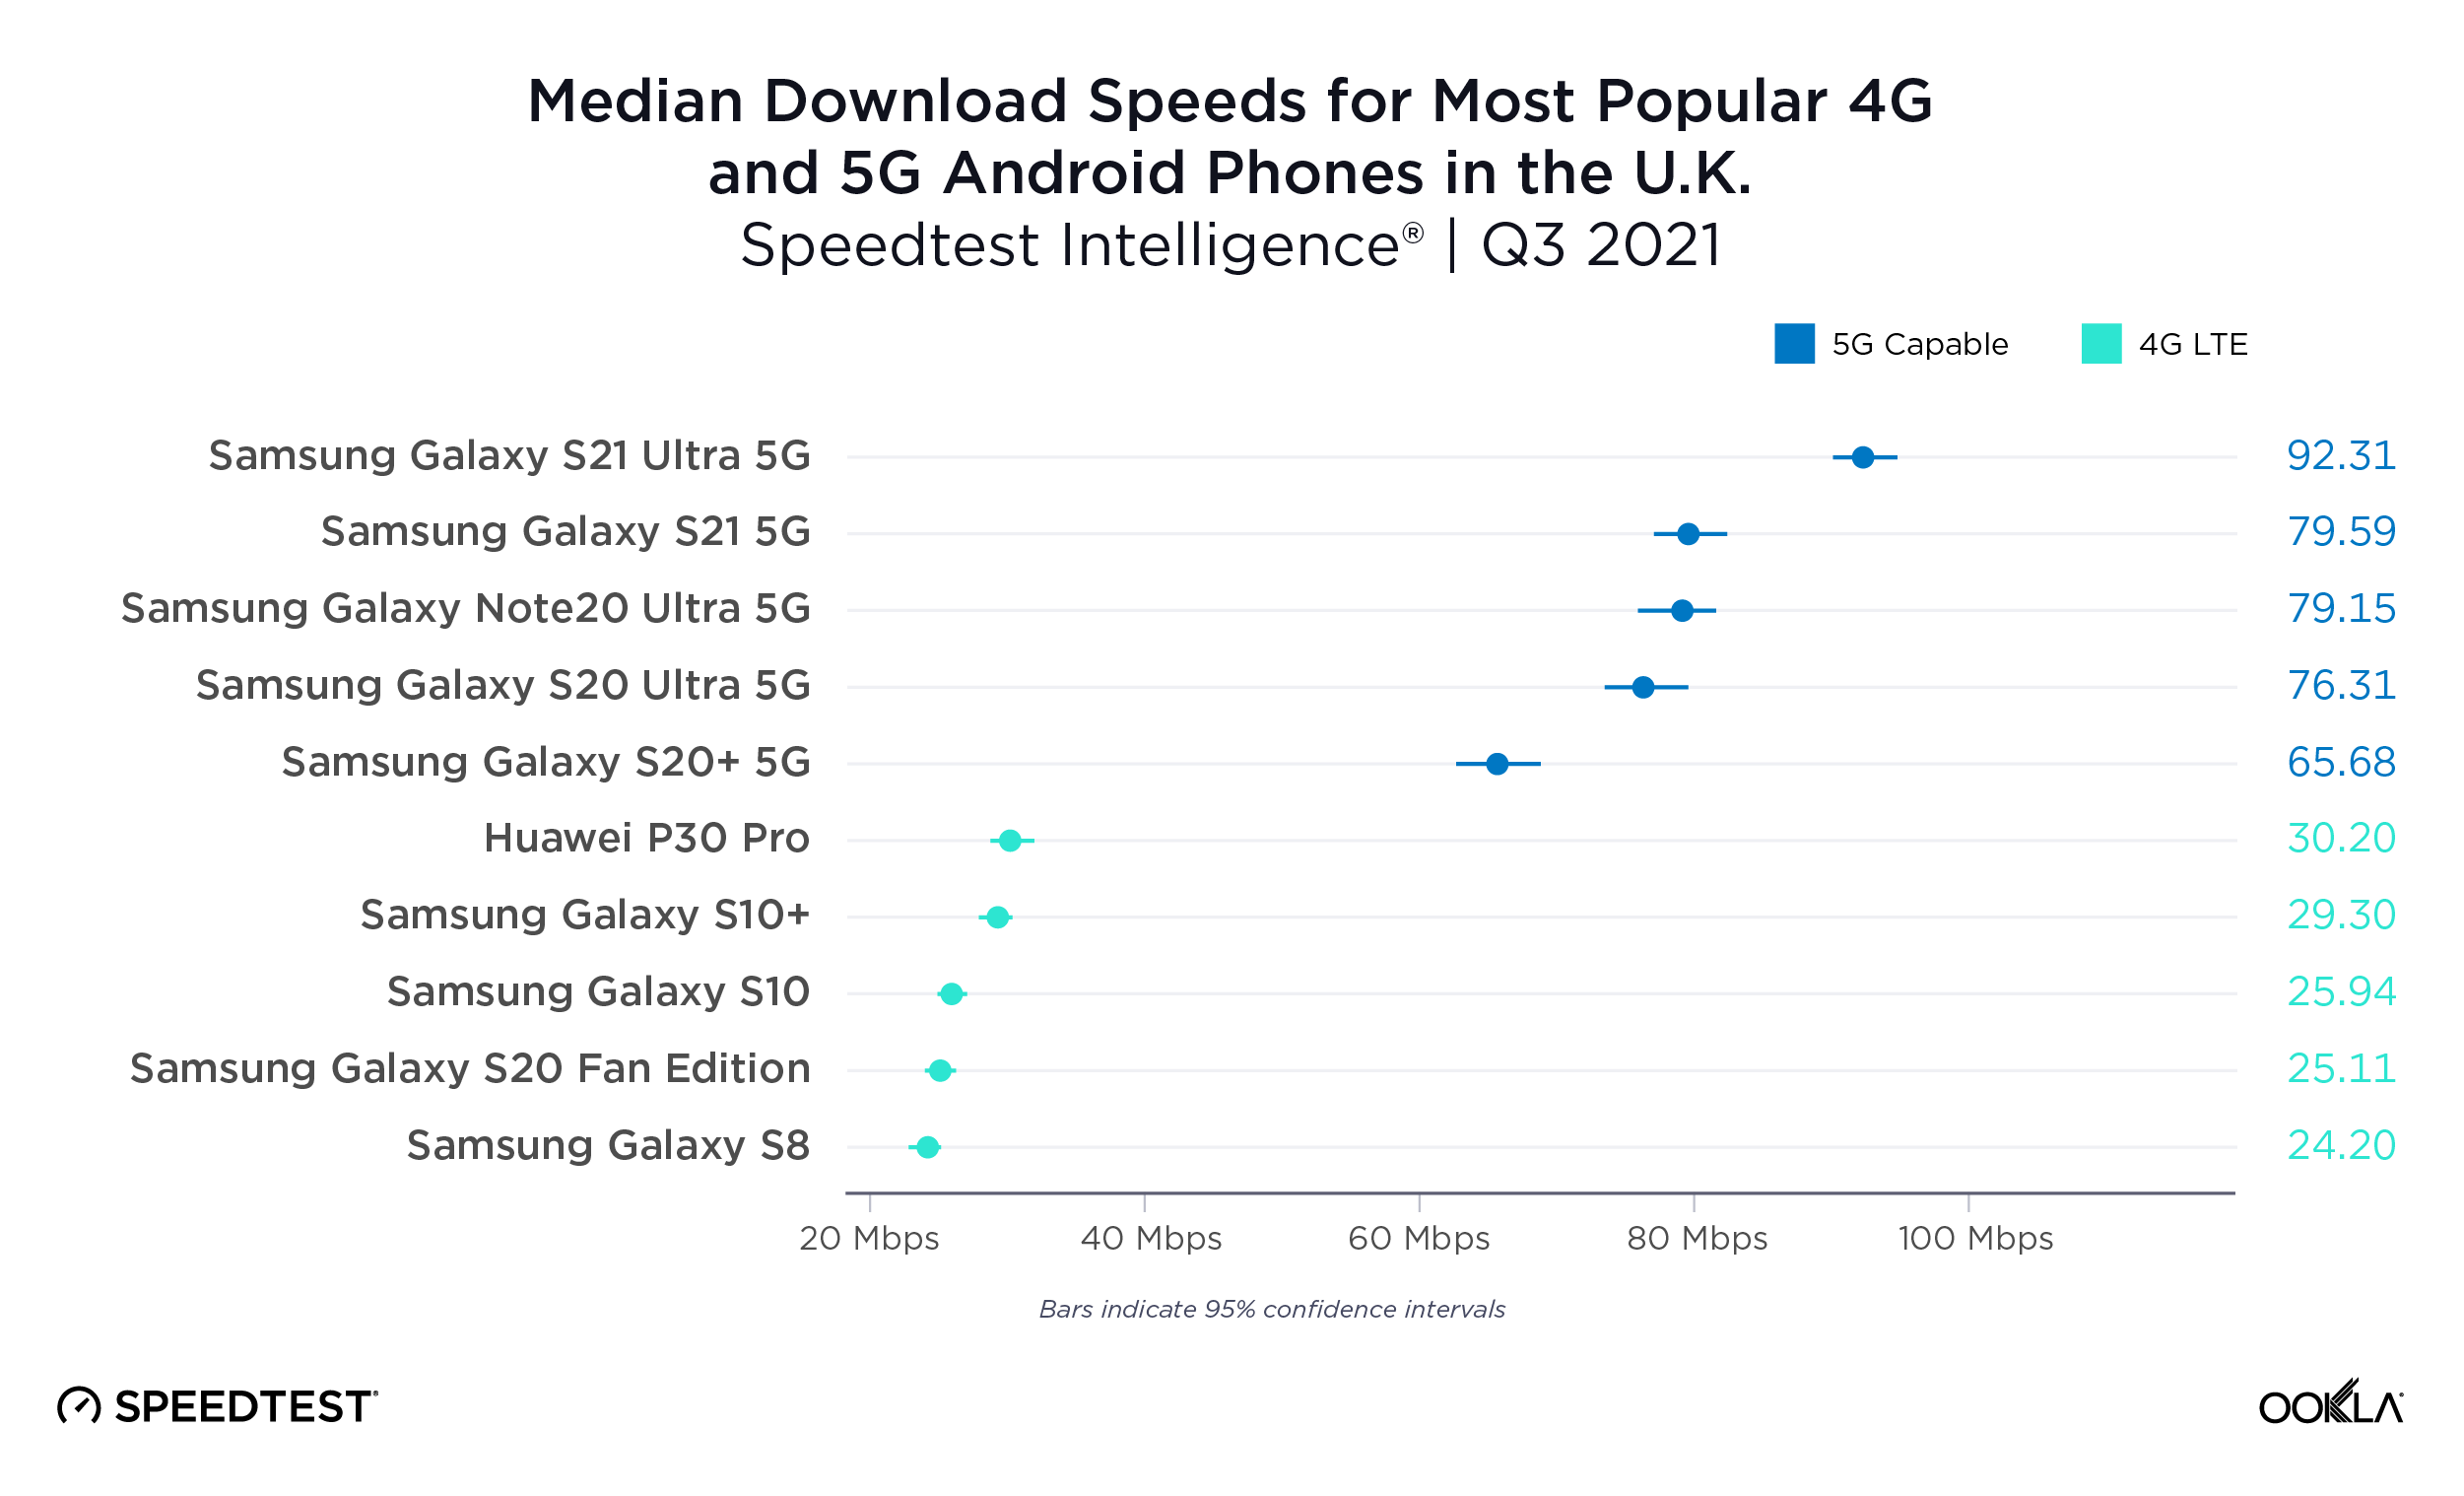
5G represents a solid improvement over 4G on Android devices in the U.K.
Consumers upgrading from one of the most popular 4G devices in the United Kingdom to one of the most popular 5G-capable devices would have seen a 2-3X increase in median download speed during Q3 2021. This is in part because the 4G devices on this list were slower in the U.K. than elsewhere in the world during Q3 2021 as 4G speeds have stagnated in the U.K. For example, the Samsung Galaxy S8 showed a median download speed of 24.20 Mbps in the U.K., 37.67 Mbps in France and 46.31 Mbps in Canada. All five of the 5G-capable devices that we analyzed in both the U.S. and the U.K. were faster in the U.K. during Q3 2021.
iPhone 13 more than five times faster than the iPhone 11 in the U.K.
Our analysis of Speedtest Intelligence data from Q3 2021 showed that the iPhone 13 had a median download speed that was more than five times faster than that on the iPhone 11. This makes the iPhone 13 very much worth the upgrade if speed is your main concern.

United States
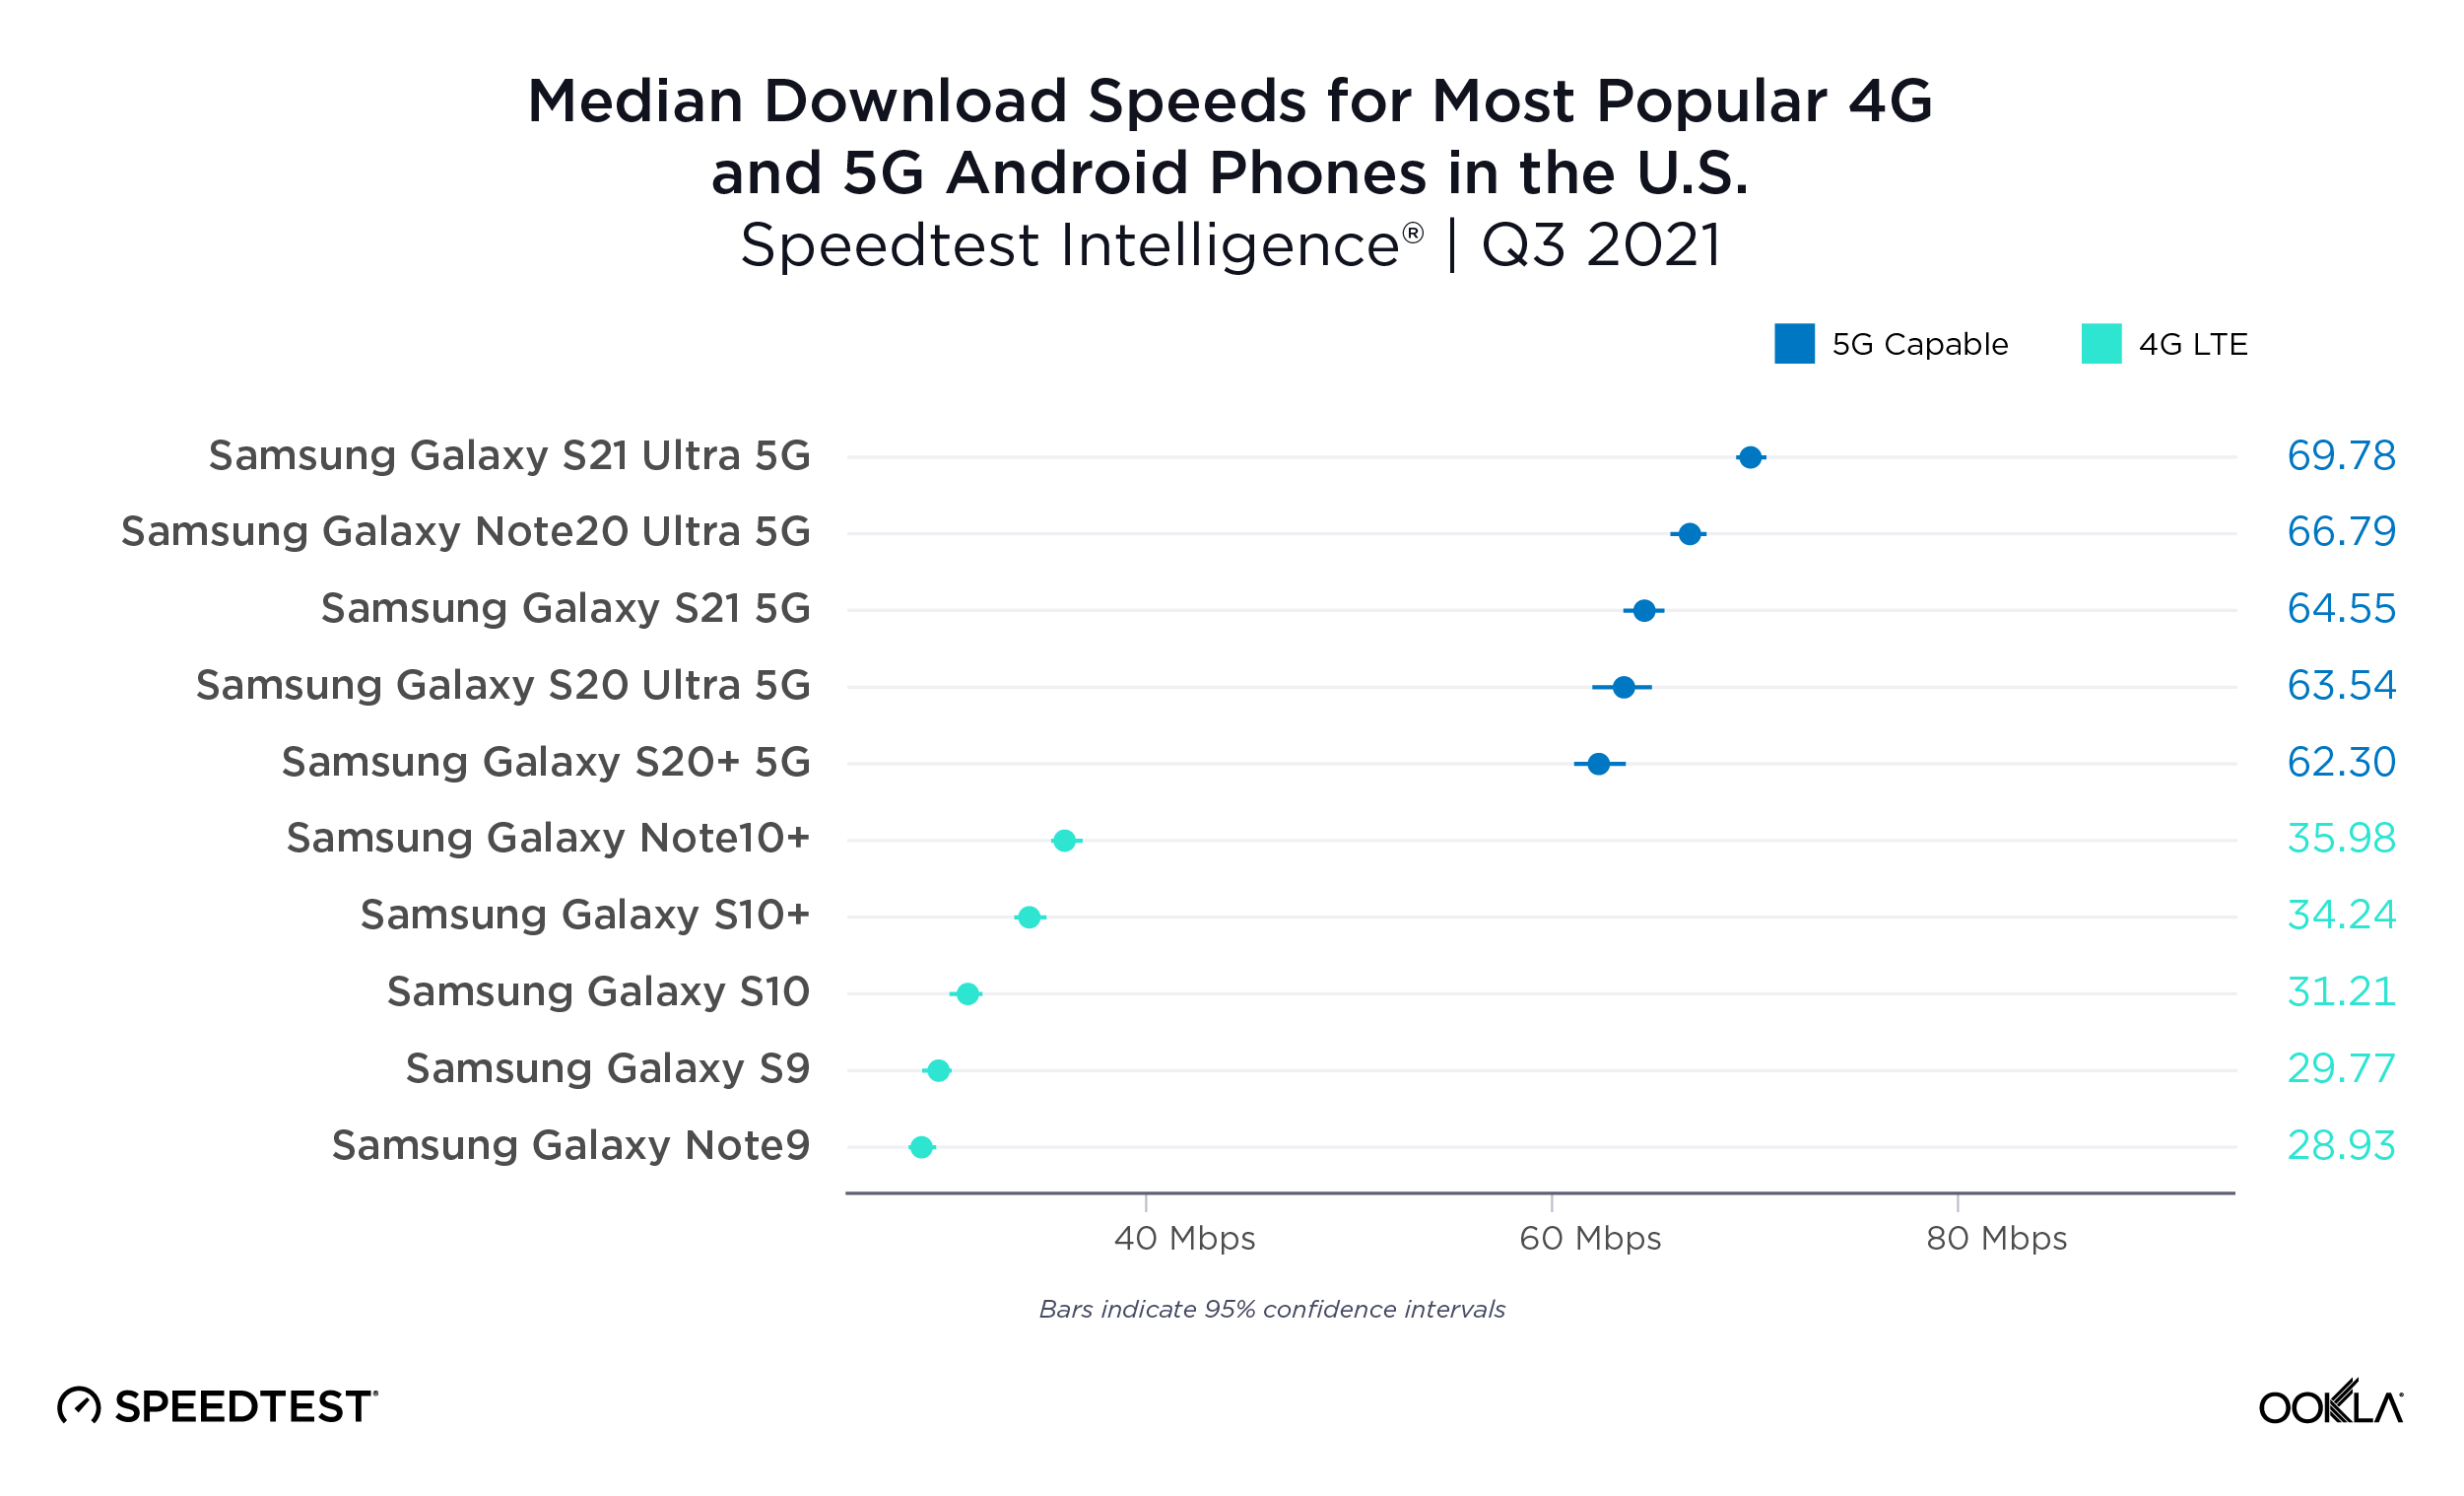
5G Android devices were twice as fast as 4G in the U.S.
The most popular 4G devices in the U.S. were about half as fast for median download speed as the most popular 5G-capable devices during Q3 2021. The Samsung Galaxy S21 Ultra 5G showed the highest median download speed among these devices at 69.78 Mbps, compared to the fastest 4G device surveyed, the Note10+ at 35.98 Mbps. That said, 5G-capable devices in the U.S. underperformed when compared to other countries, except Japan and South Africa.
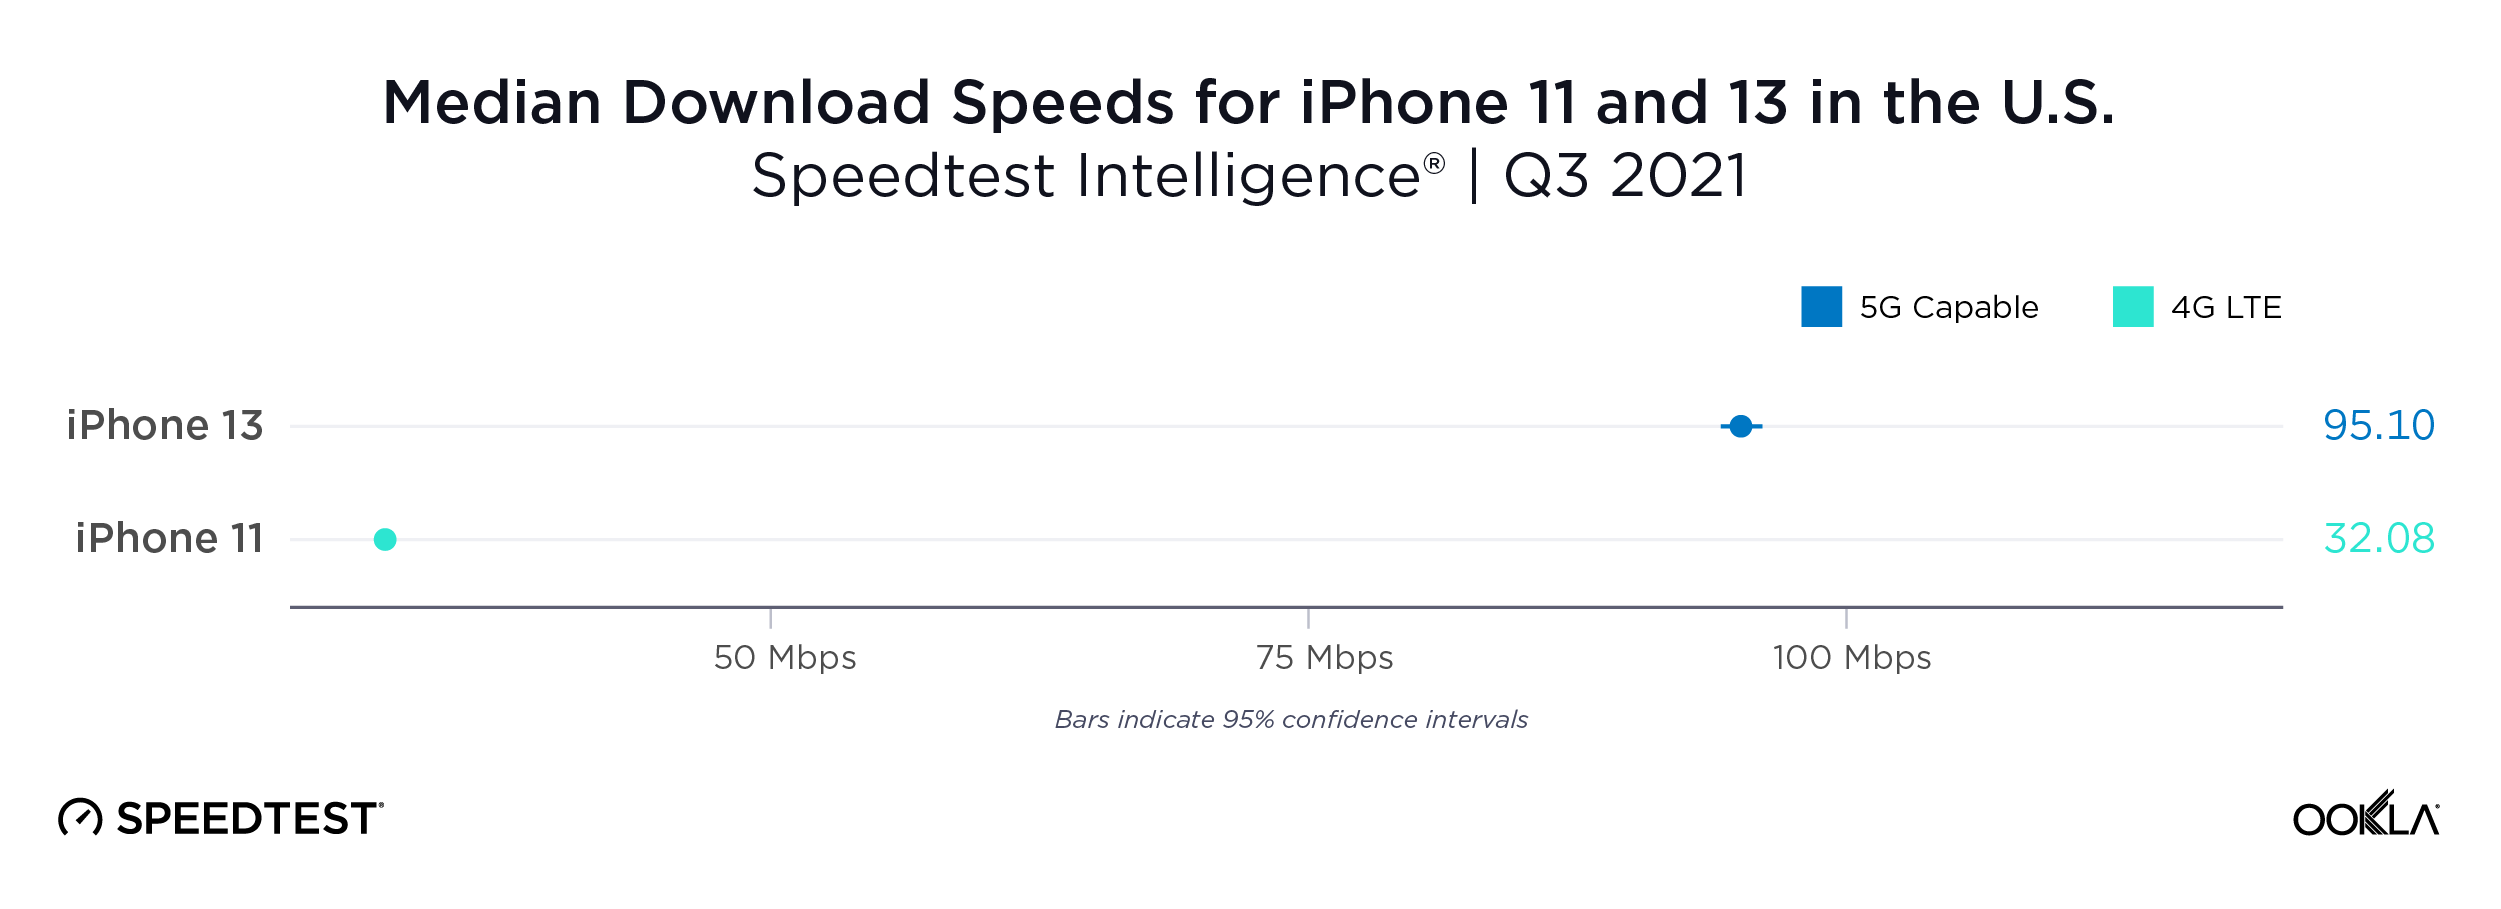
iPhone 13 nearly three times as fast as the iPhone 11 in the U.S.
Data from Speedtest Intelligence reveals that median download speed on the iPhone 13 was nearly three times as fast as that on the iPhone 11 in the U.S. during Q3 2021.
Our analysis shows that increased speed is one of the benefits of upgrading your 4G phone to a 5G-capable one, regardless of where you live but not all countries see the same speed increases. Customers in Saudi Arabia, the U.A.E, China and South Korea will see especially good performance if upgrading an Android phone. The U.A.E., Saudi Arabia, China and Australia have especially good speeds on the iPhone 13. Whatever choice you make for your next phone, take a Speedtest® on Android or iOS to make sure your mobile operator is delivering the speeds you want to see.
Ookla retains ownership of this article including all of the intellectual property rights, data, content graphs and analysis. This article may not be quoted, reproduced, distributed or published for any commercial purpose without prior consent. Members of the press and others using the findings in this article for non-commercial purposes are welcome to publicly share and link to report information with attribution to Ookla.