| December 20, 2021

Growing and Slowing: The State of 5G Worldwide in 2021


5G continues to offer new and exciting ways of rethinking everything from streaming video to performing remote surgery. However, not everyone shares equally in these possibilities as many countries do not have access to 5G and even those that do, do not experience the same level of performance from their 5G connections. We examined Speedtest Intelligence® data from Q3 2021 Speedtest® results to see how 5G speeds have changed, where download speeds are the fastest at the country and capital level, where 5G deployments have increased and what worldwide 5G Availability looked like in Q3 2021. We also looked at countries that don’t yet have 5G to understand where consumers are seeing improvements in 4G access.

5G slowed down at the global level

Median-Speeds-Worldwide_1221-01

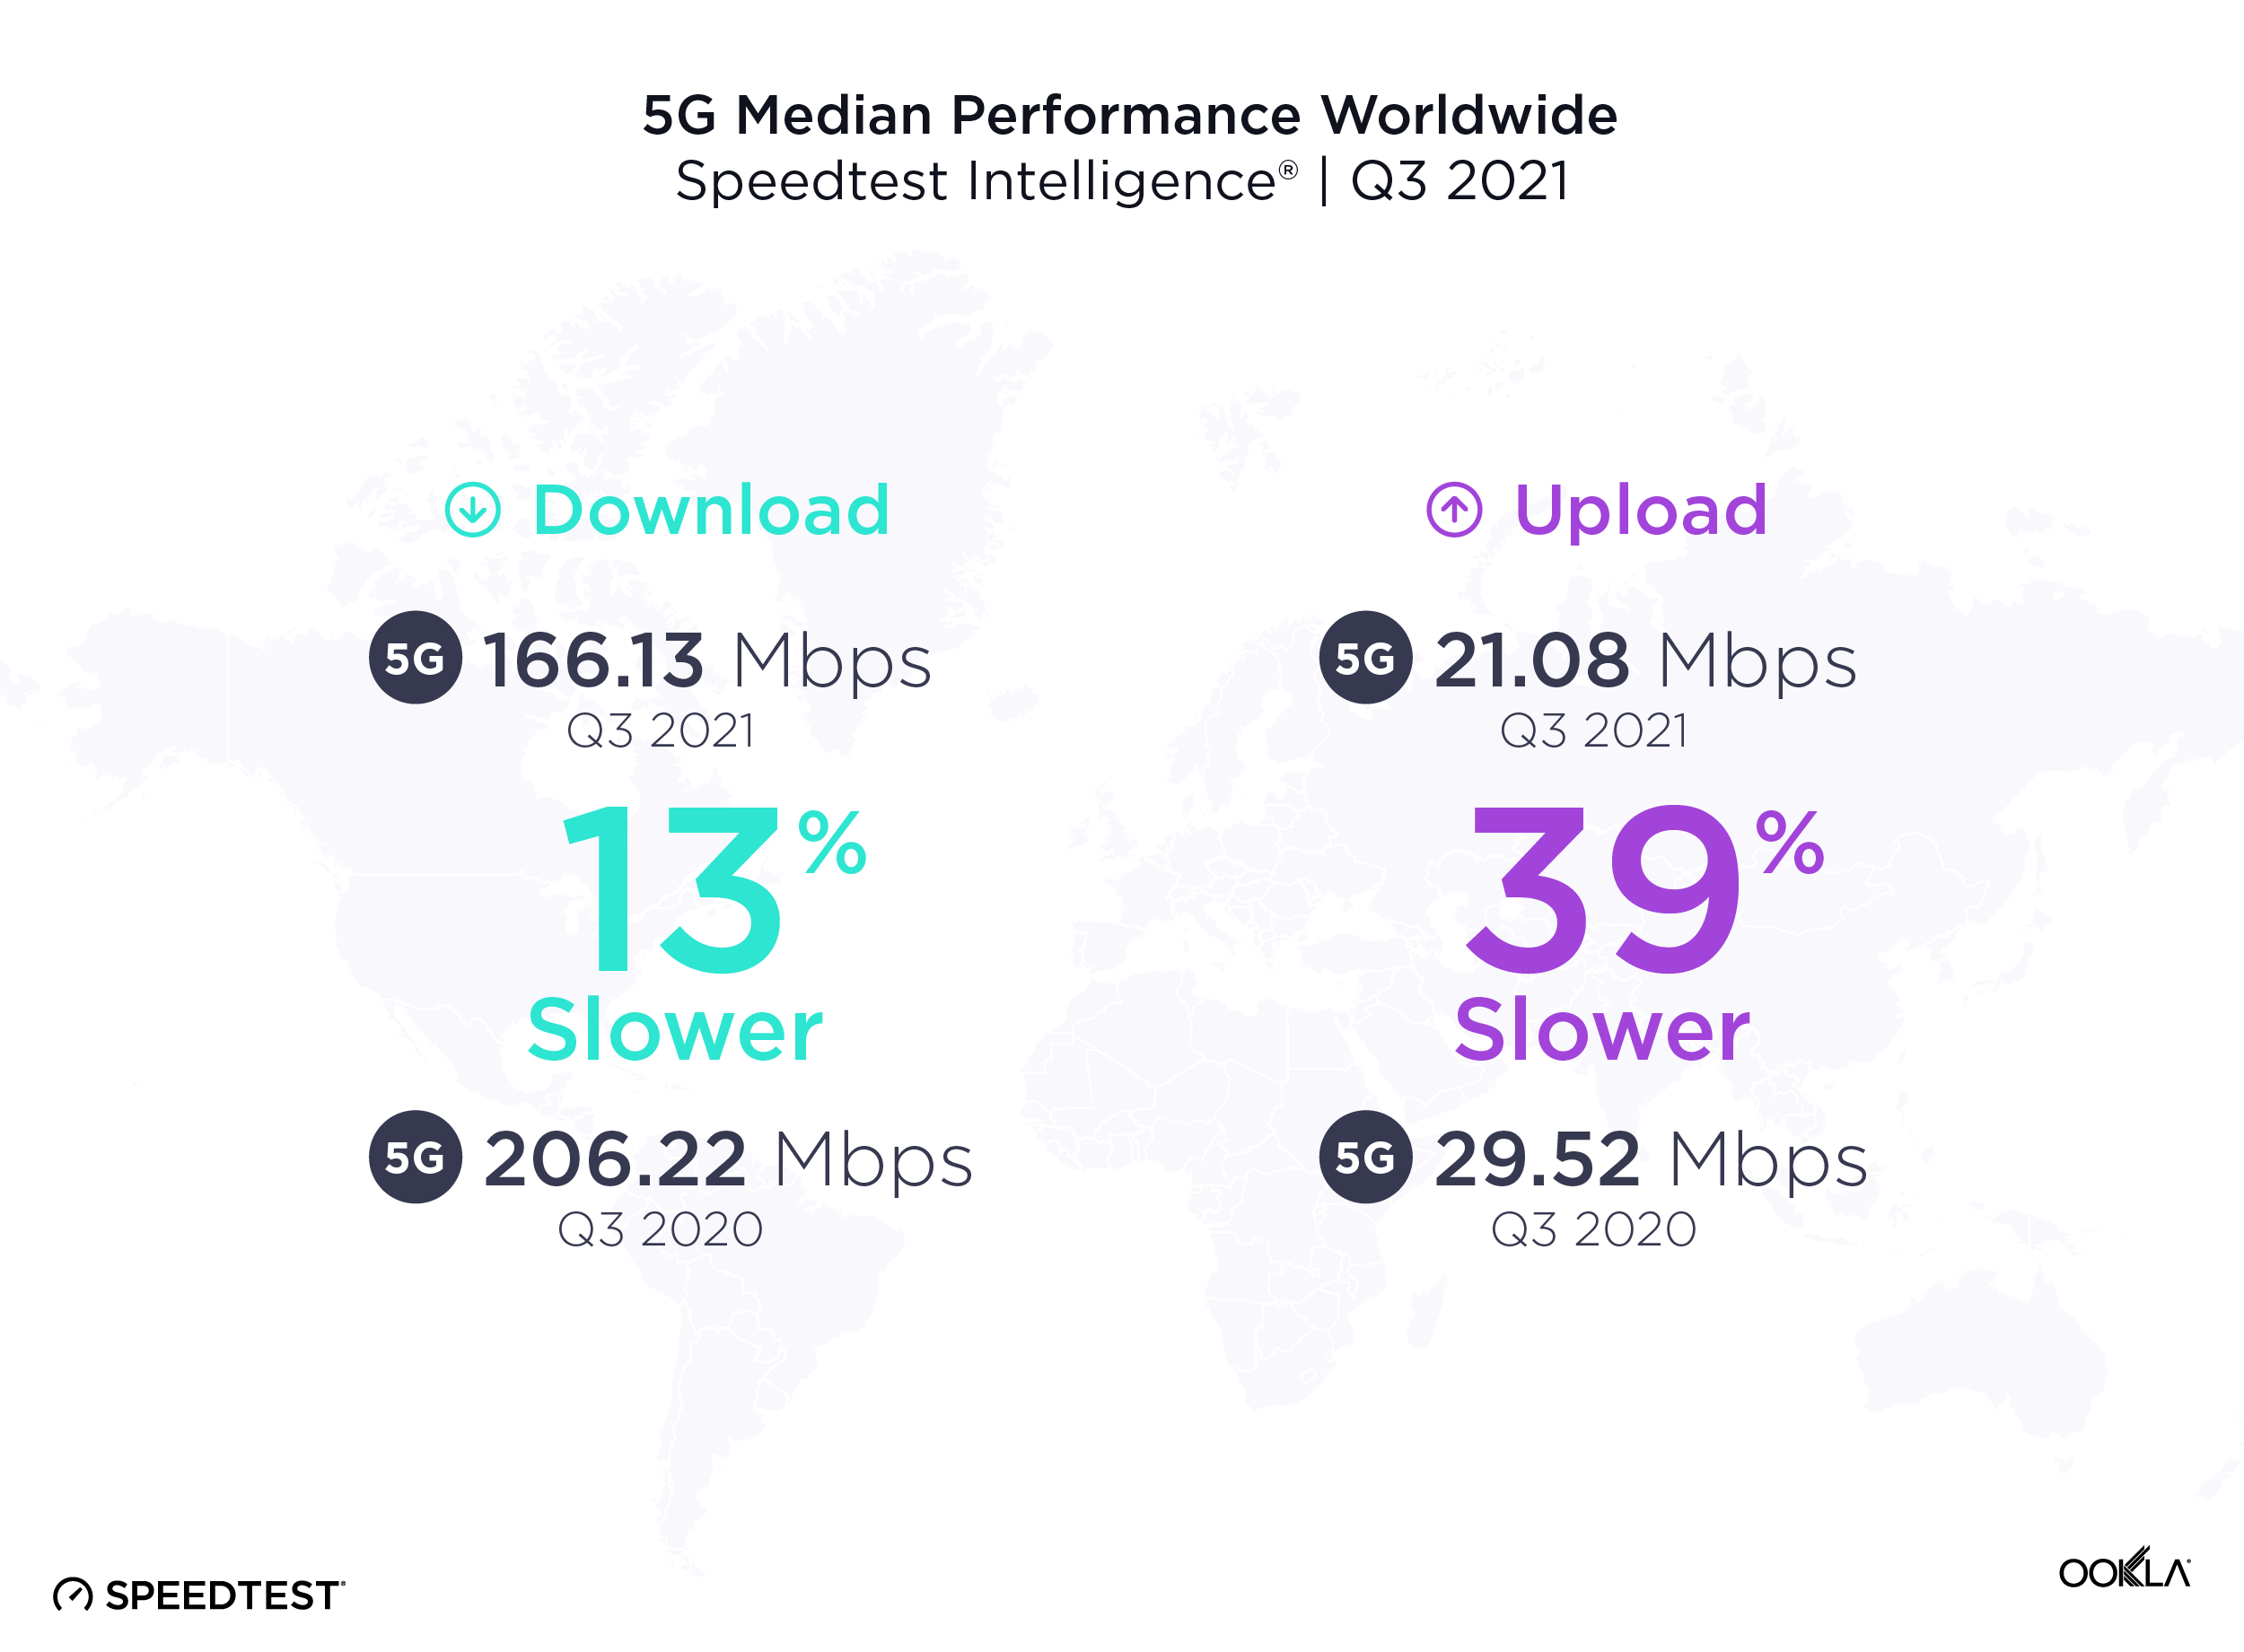
It’s common to see new mobile access technologies slow down as adoption scales, particularly early on in the tech cycle. Over the past year from Q3 2020 to Q3 2021, the median global 5G download speed fell to 166.13 Mbps, down from 206.22 Mbps in Q3 2020. Median upload speed over 5G also slowed to 21.08 Mbps (from 29.52 Mbps) during the same period.

More users are logging on to existing 5G networks, and we’re also at the stage in the evolution of 5G where countries that have historically had slower speeds are starting to offer 5G. In addition, the widespread use of dynamic spectrum sharing that has been used to boost early 5G coverage weighs on 5G download speeds. While the dip in speeds looks like a letdown, it’s more of a compromise to enable broader access. With additional spectrum and further deployments slated for 2022, we anticipate speeds will begin to pick up again.

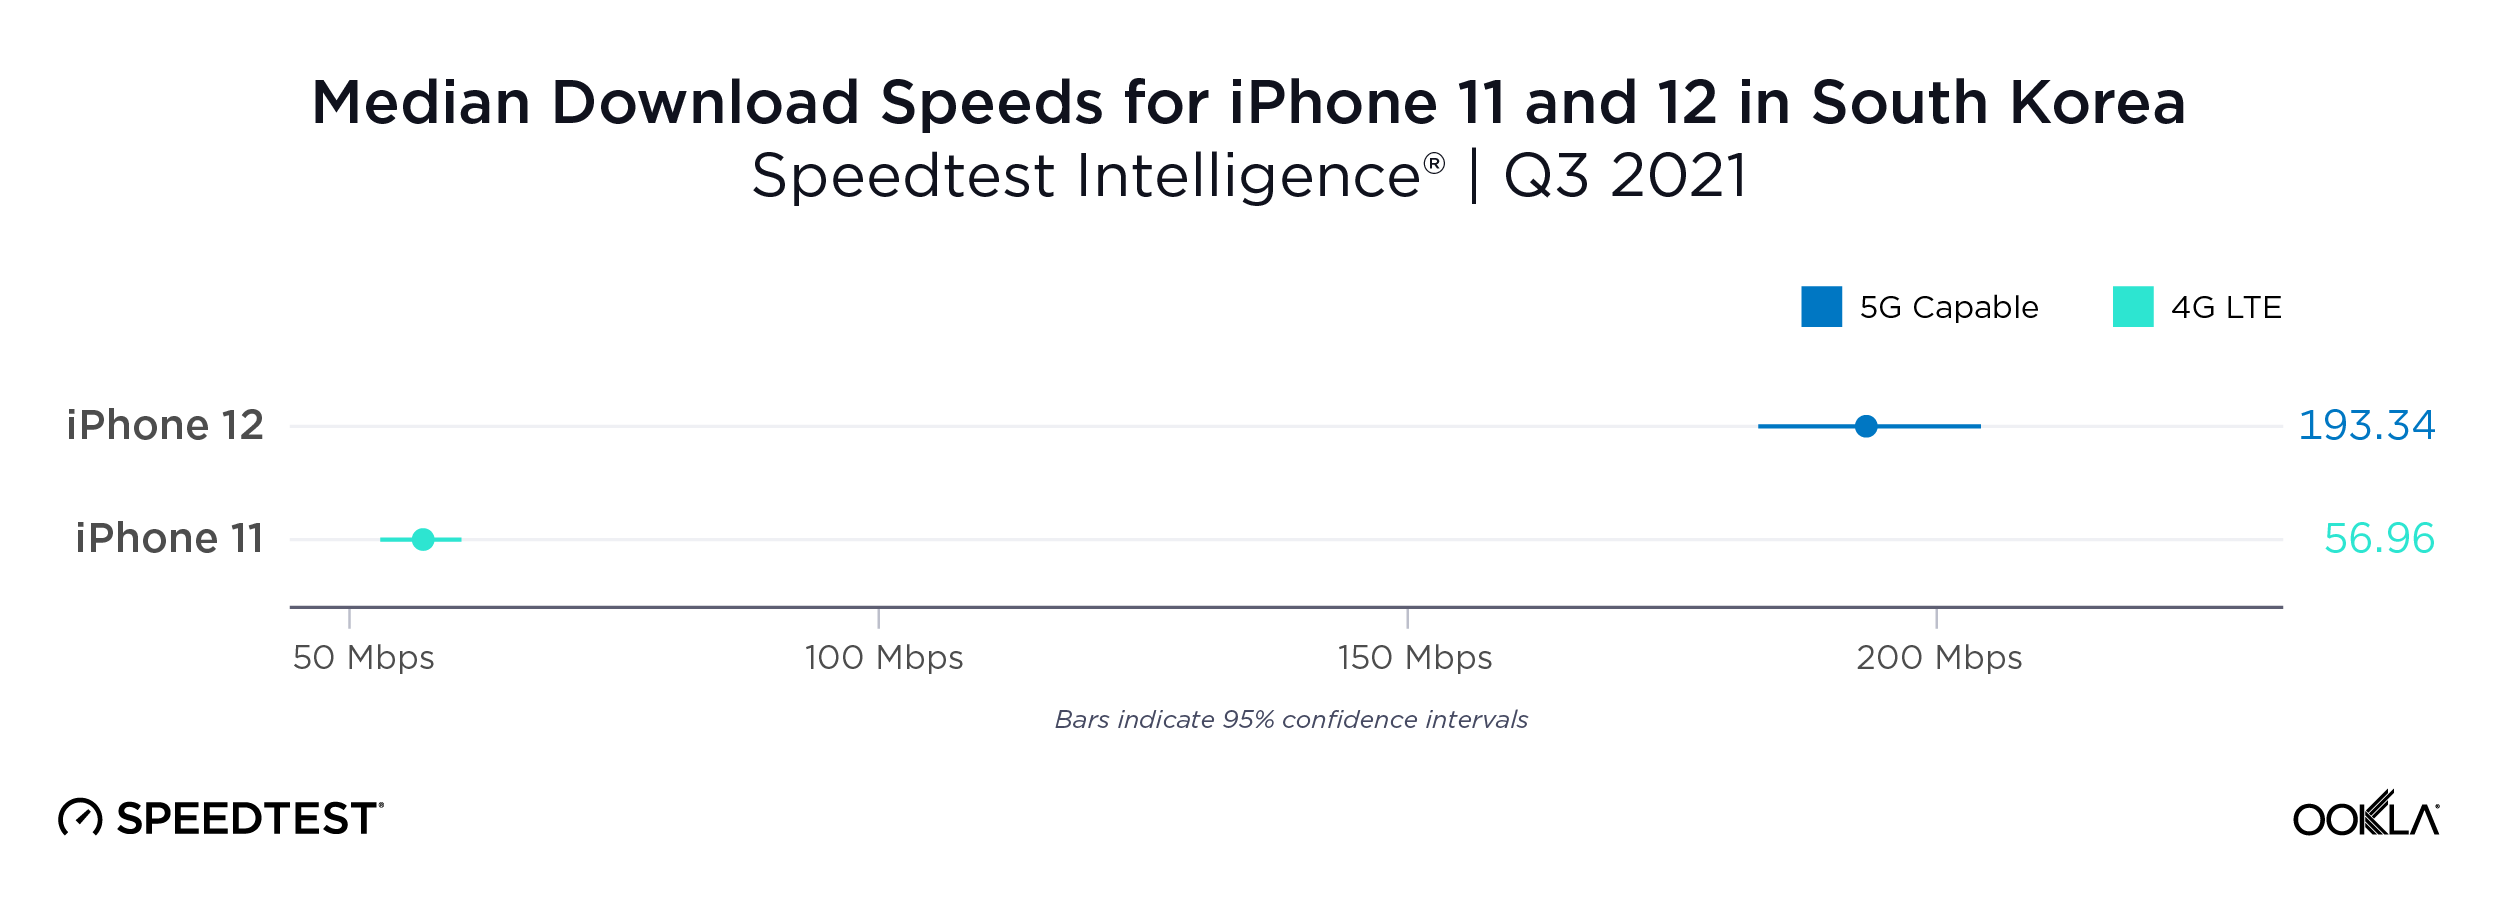
South Korea had the fastest 5G in the world

ookla_5g-download_performance_countries_1221-01-1

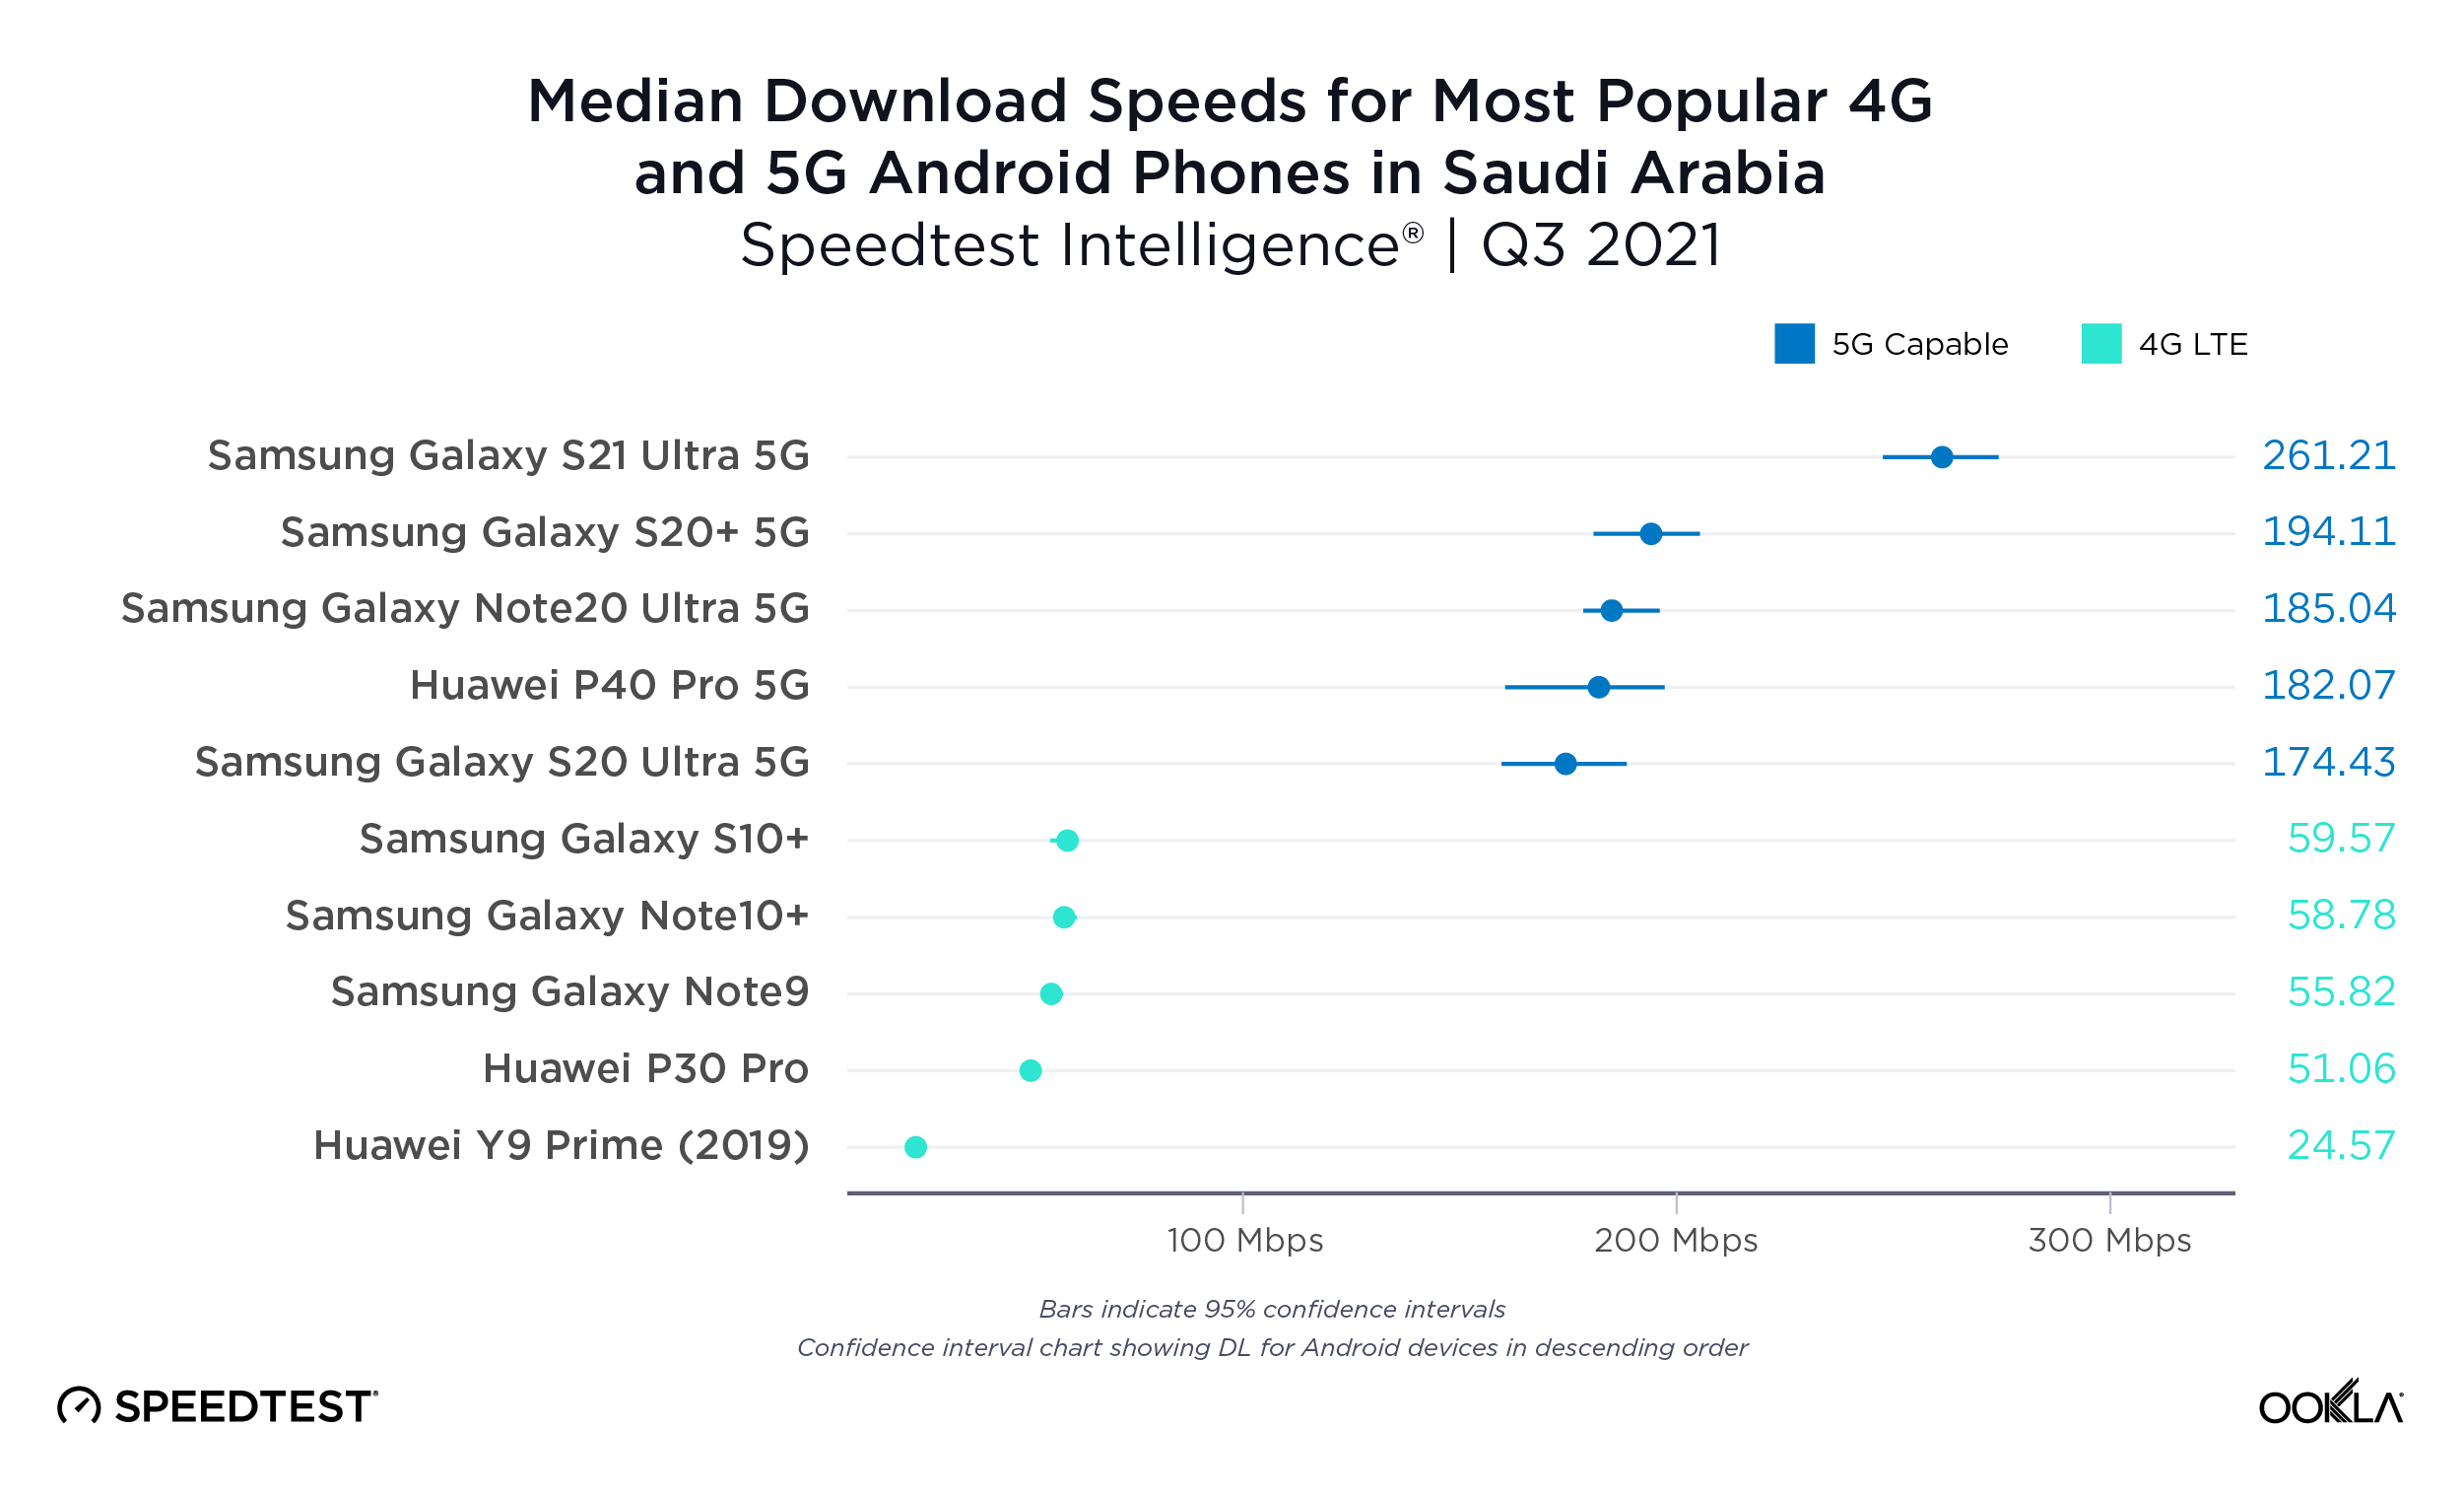
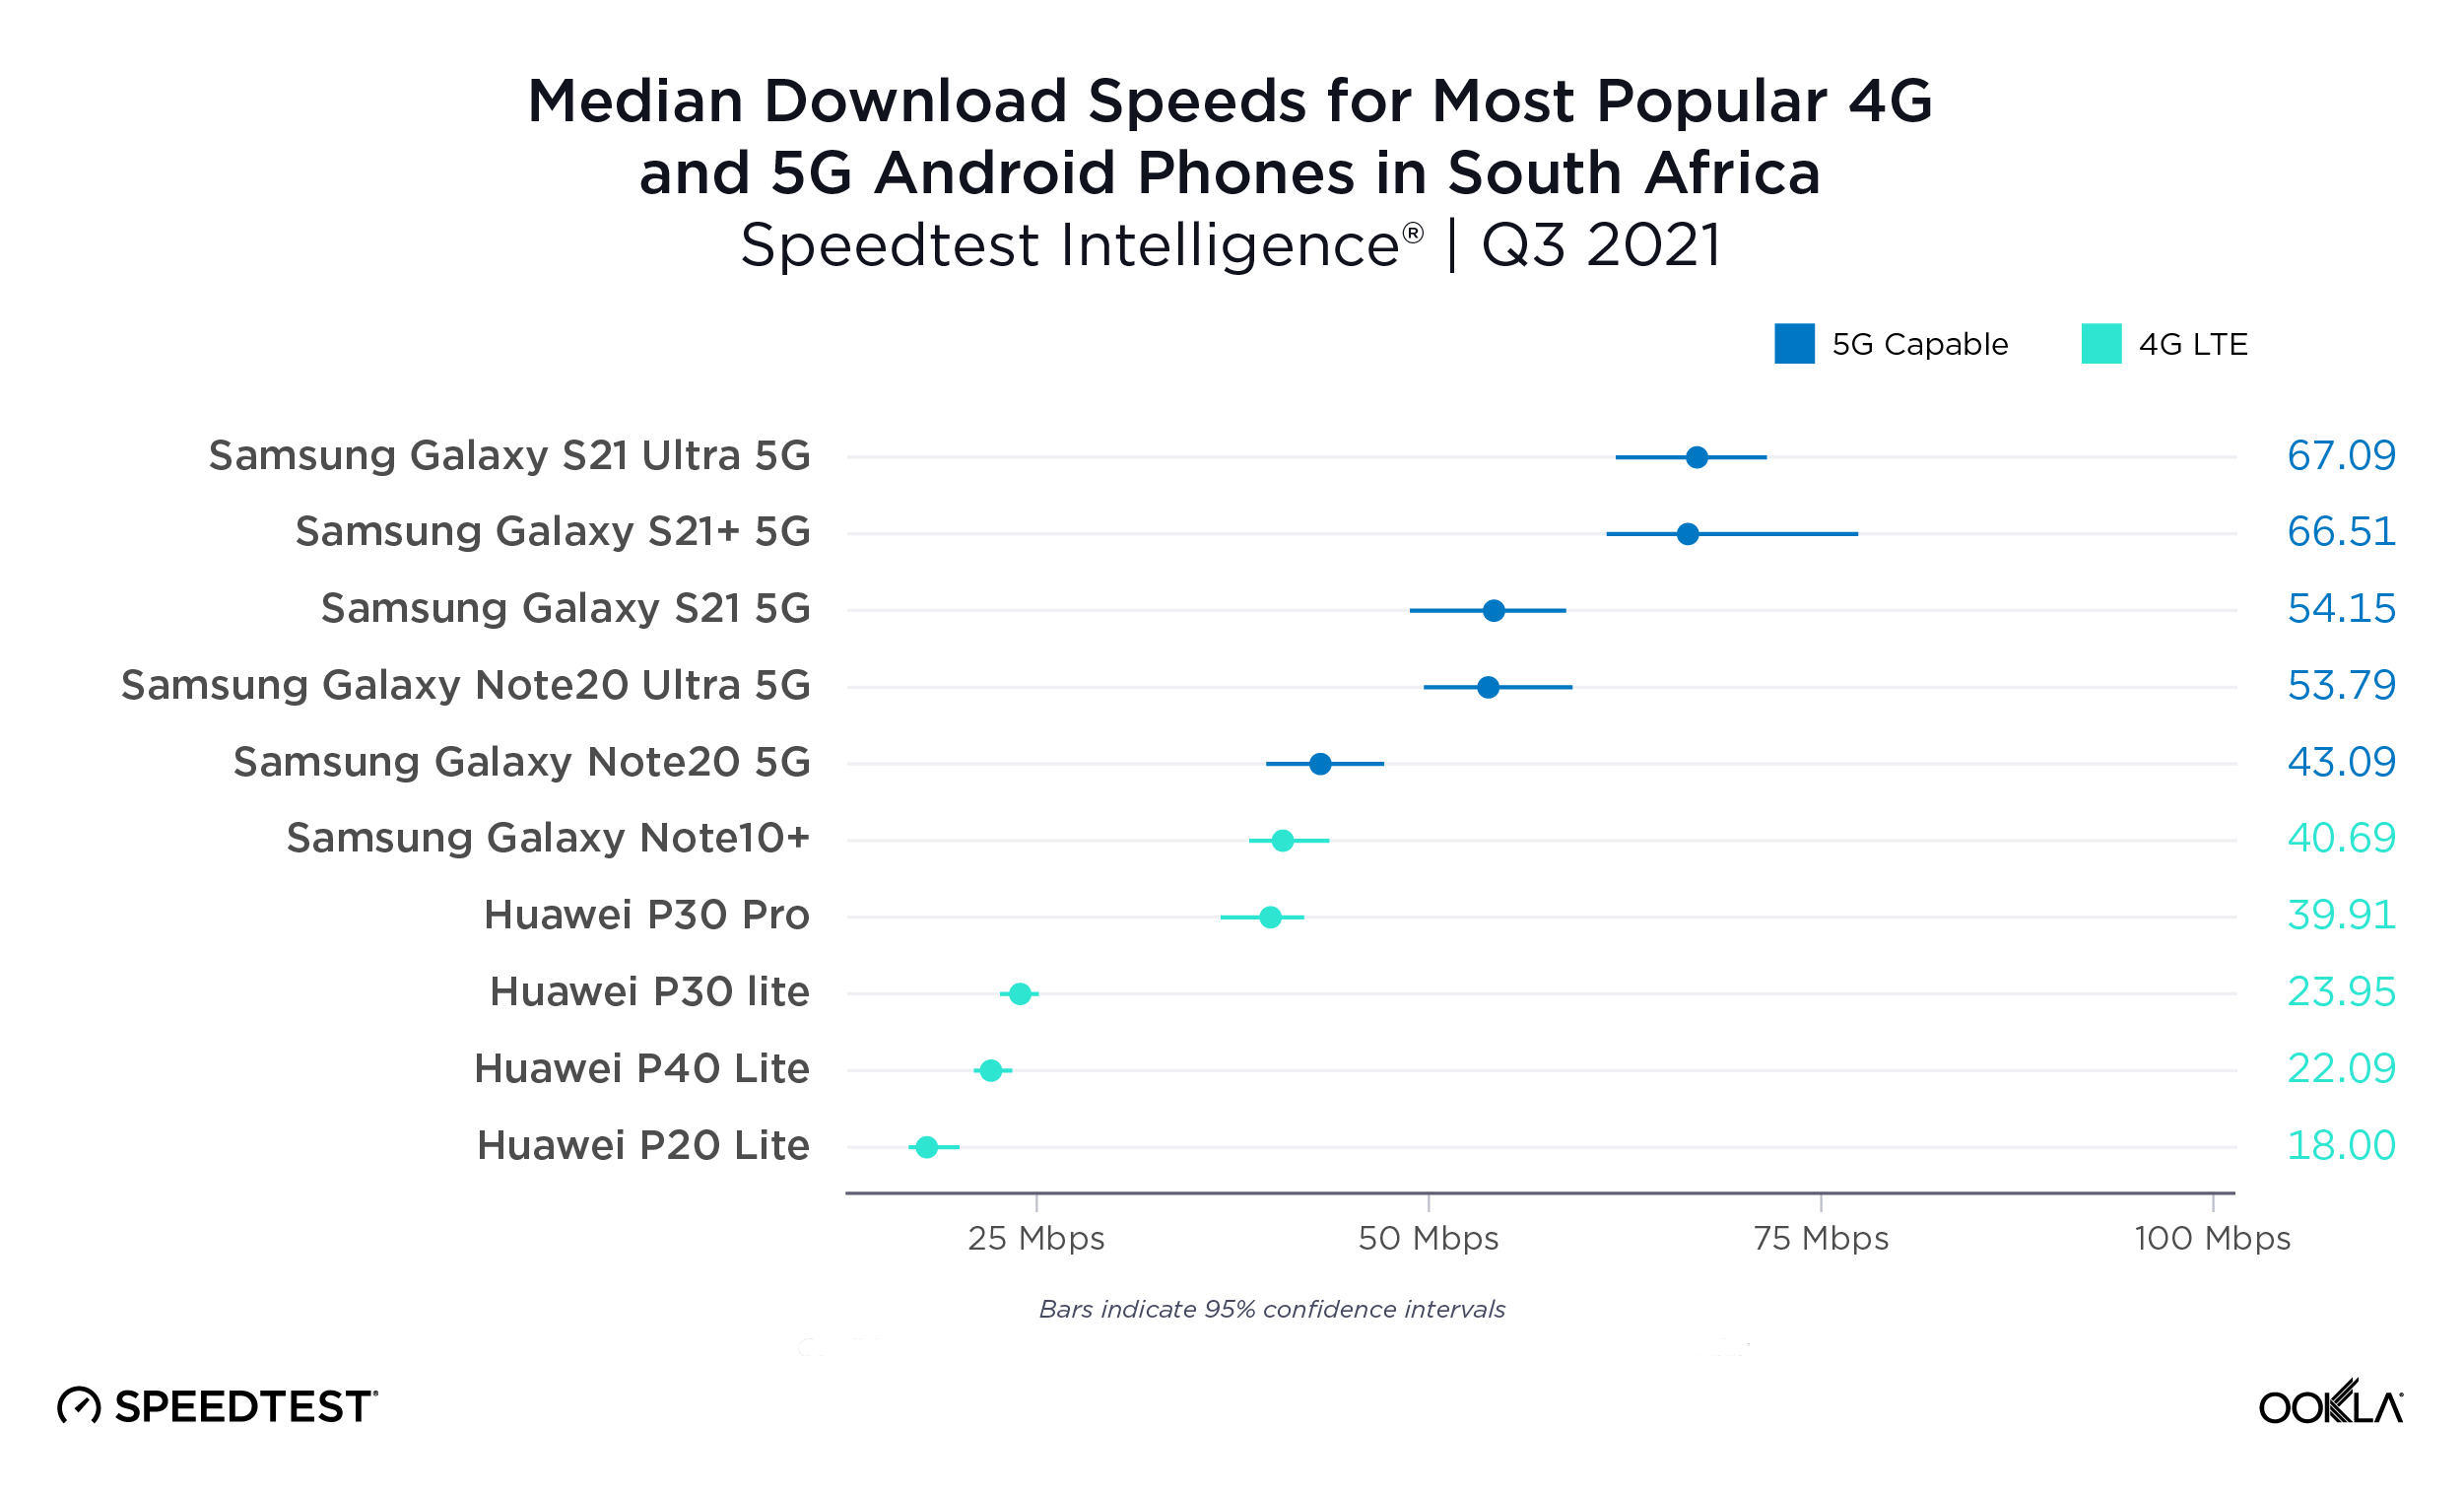
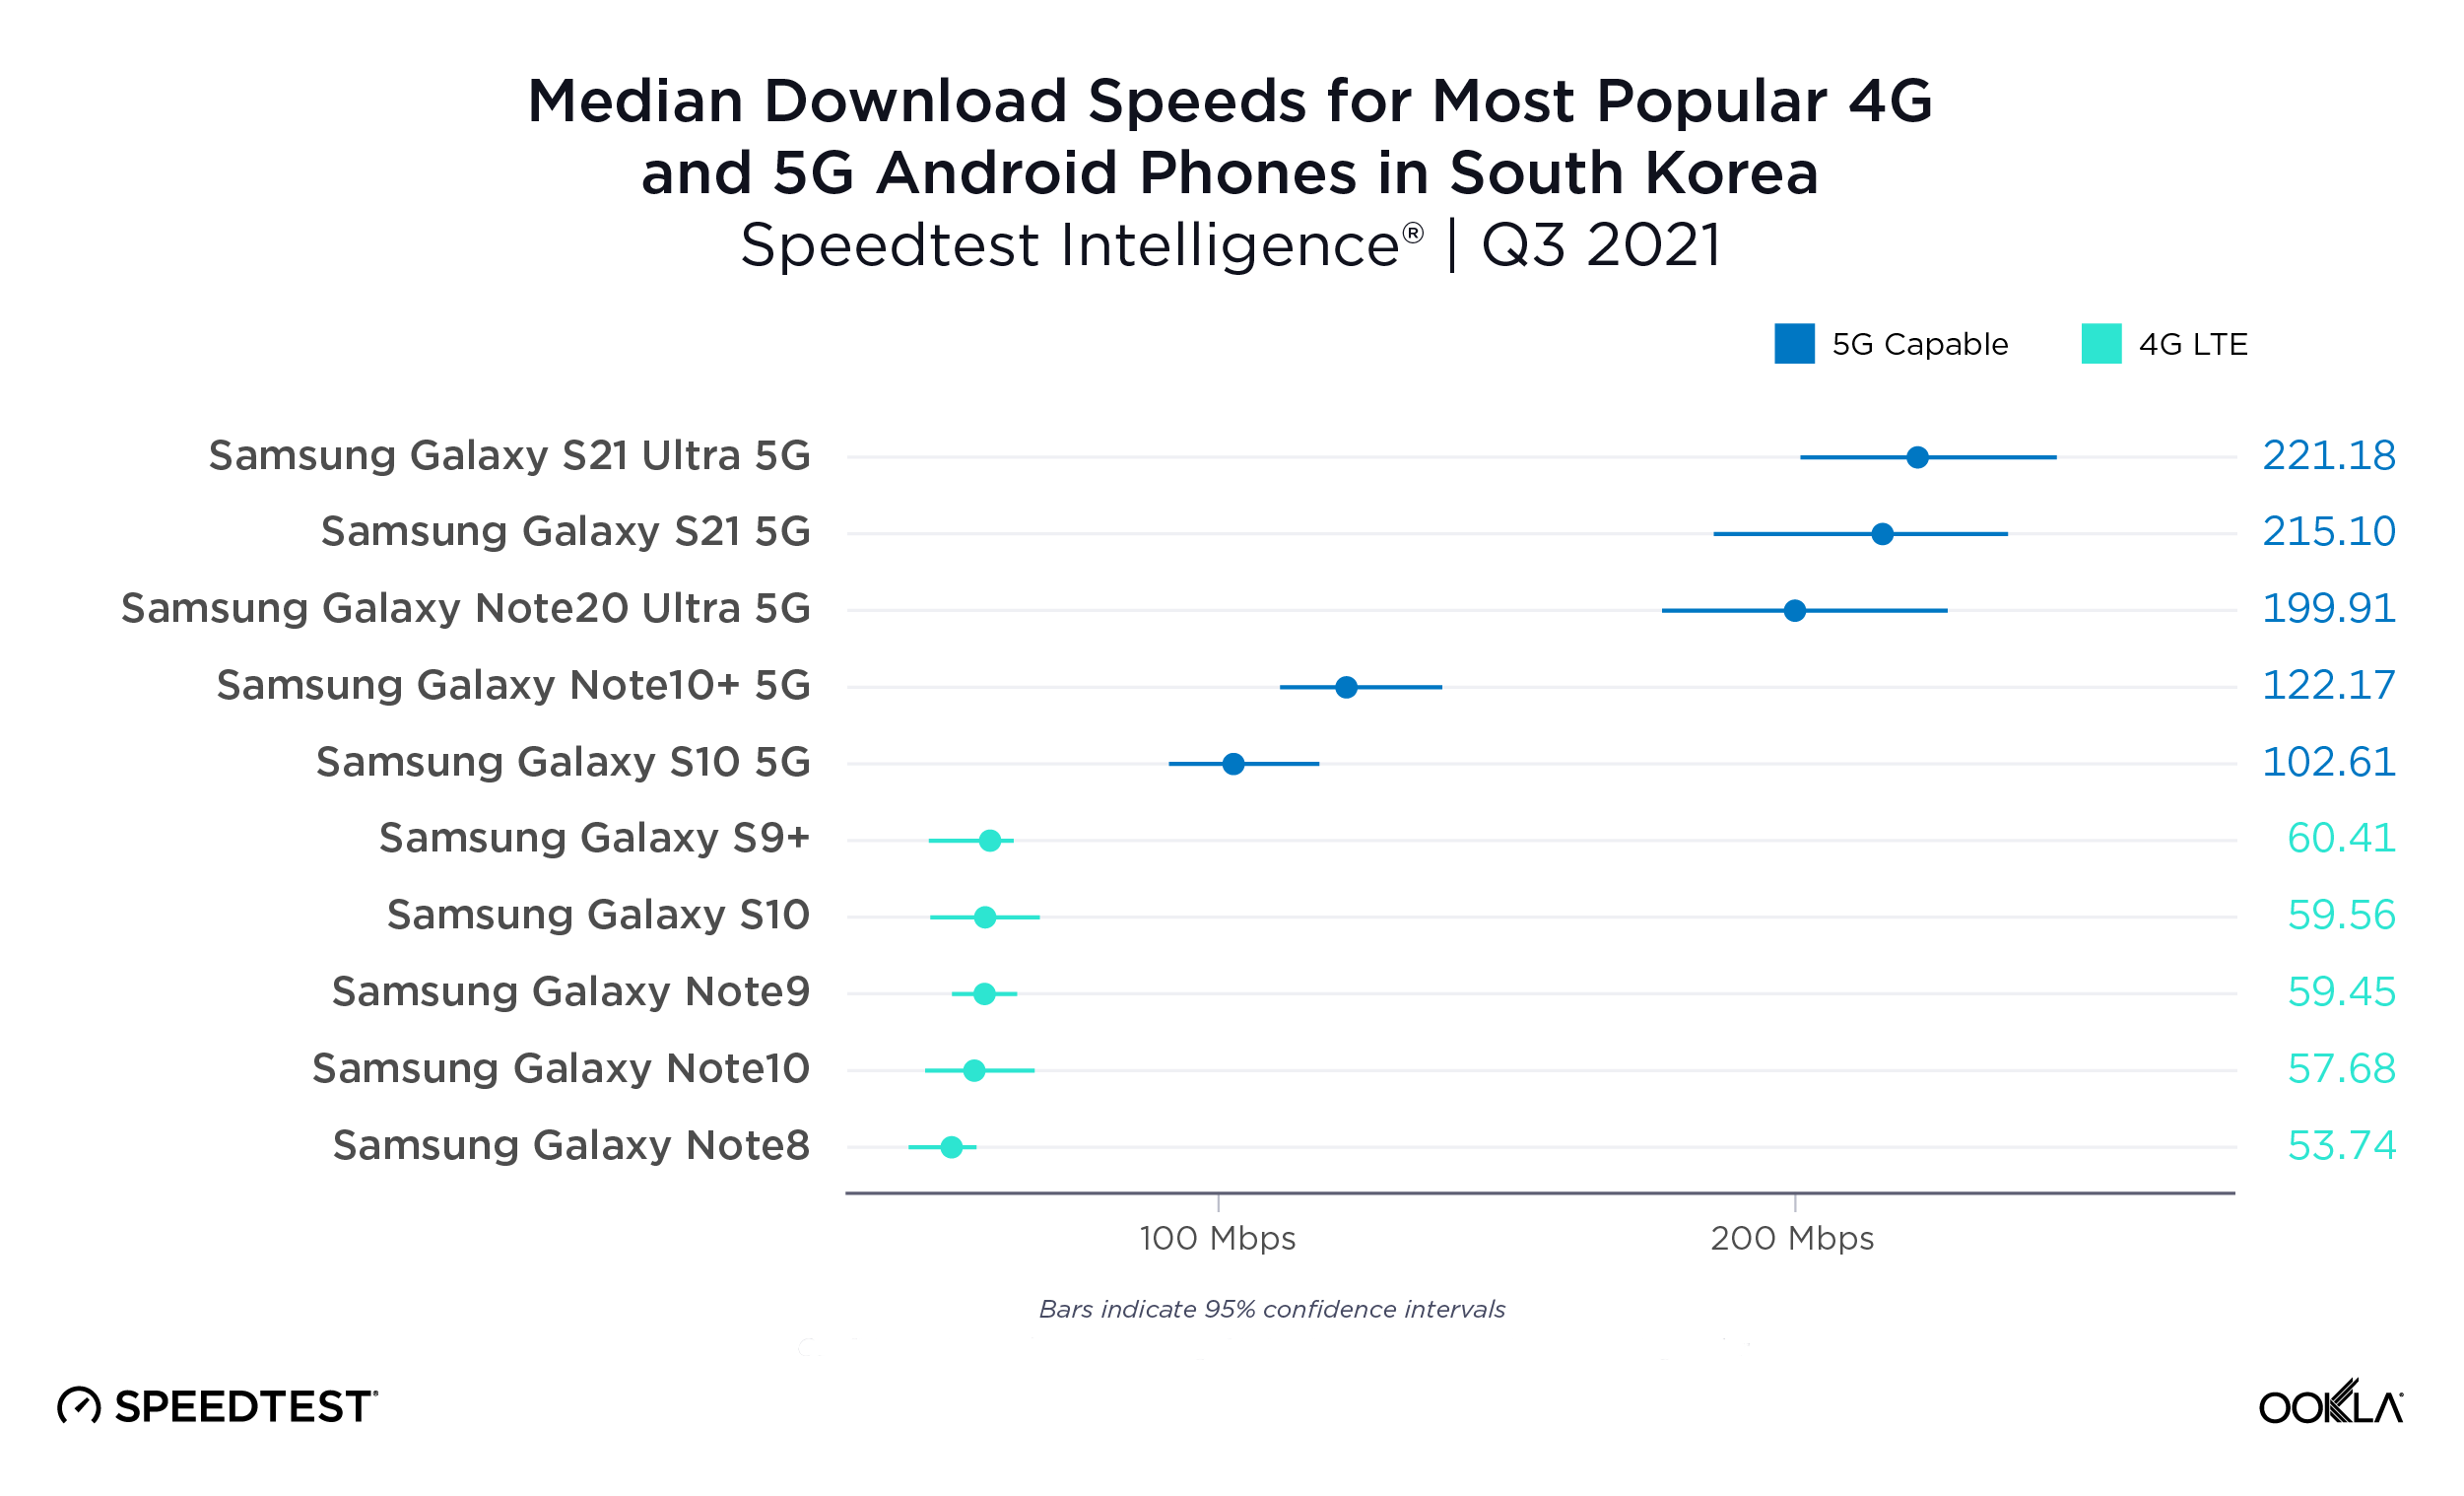
South Korea had the fastest median download speed over 5G during Q3 2021, leading a top 10 list that included Norway, United Arab Emirates, Saudi Arabia, Qatar, Kuwait, Sweden, China, Taiwan and New Zealand. Sweden, China, Taiwan and New Zealand were new to the top 10 in 2021 while South Africa (whose 5G was brand new last year), Spain and Hungary fell out of the top 10.

5G expanded to 13 additional countries
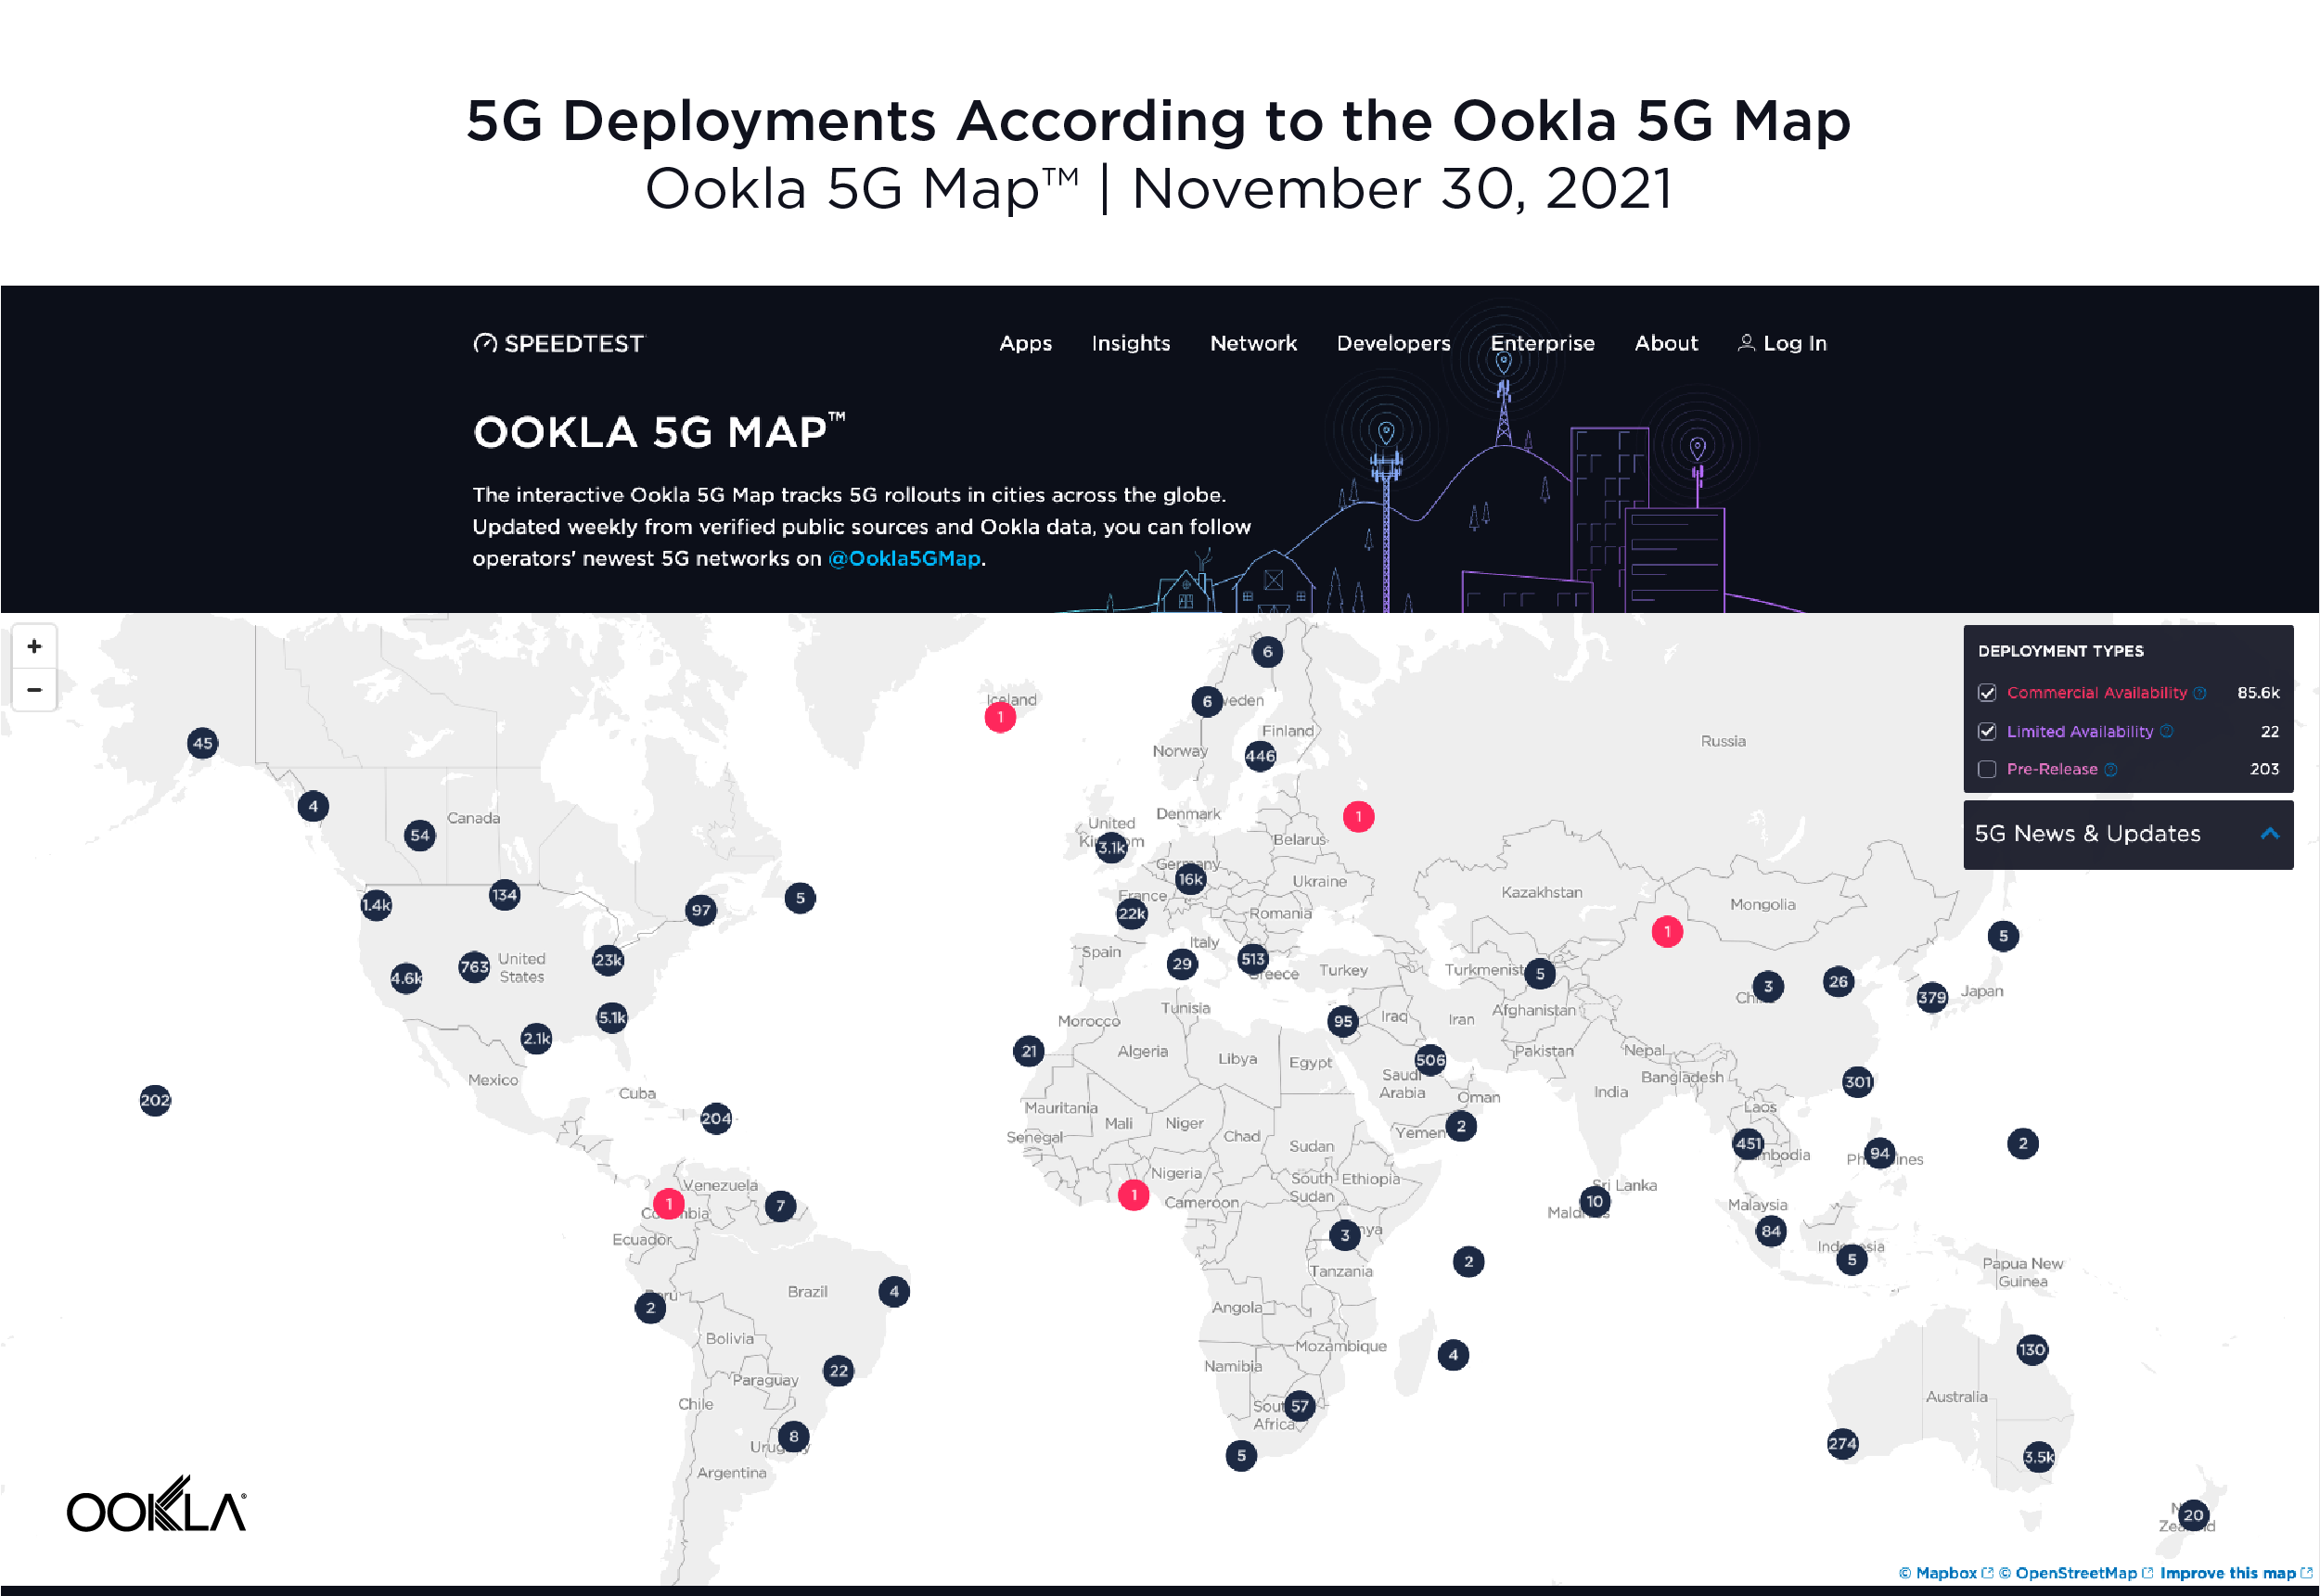
ookla_5G-map_1221-01

According to the Ookla® 5G Map, there were 5G deployments in 112 countries as of November 30, 2021. That’s up from 99 countries on the same date a year ago. The total number of deployments increased dramatically during the same time period with 85,602 deployments on November 30, 2021 compared to 17,428 on November 30, 2020, highlighting the degree to which 5G networks scaled during the year. Note that there are often multiple deployments in a given city.

Seoul and Oslo lead world capitals for 5G

ookla_5g-download_performance_capitals_1221-01

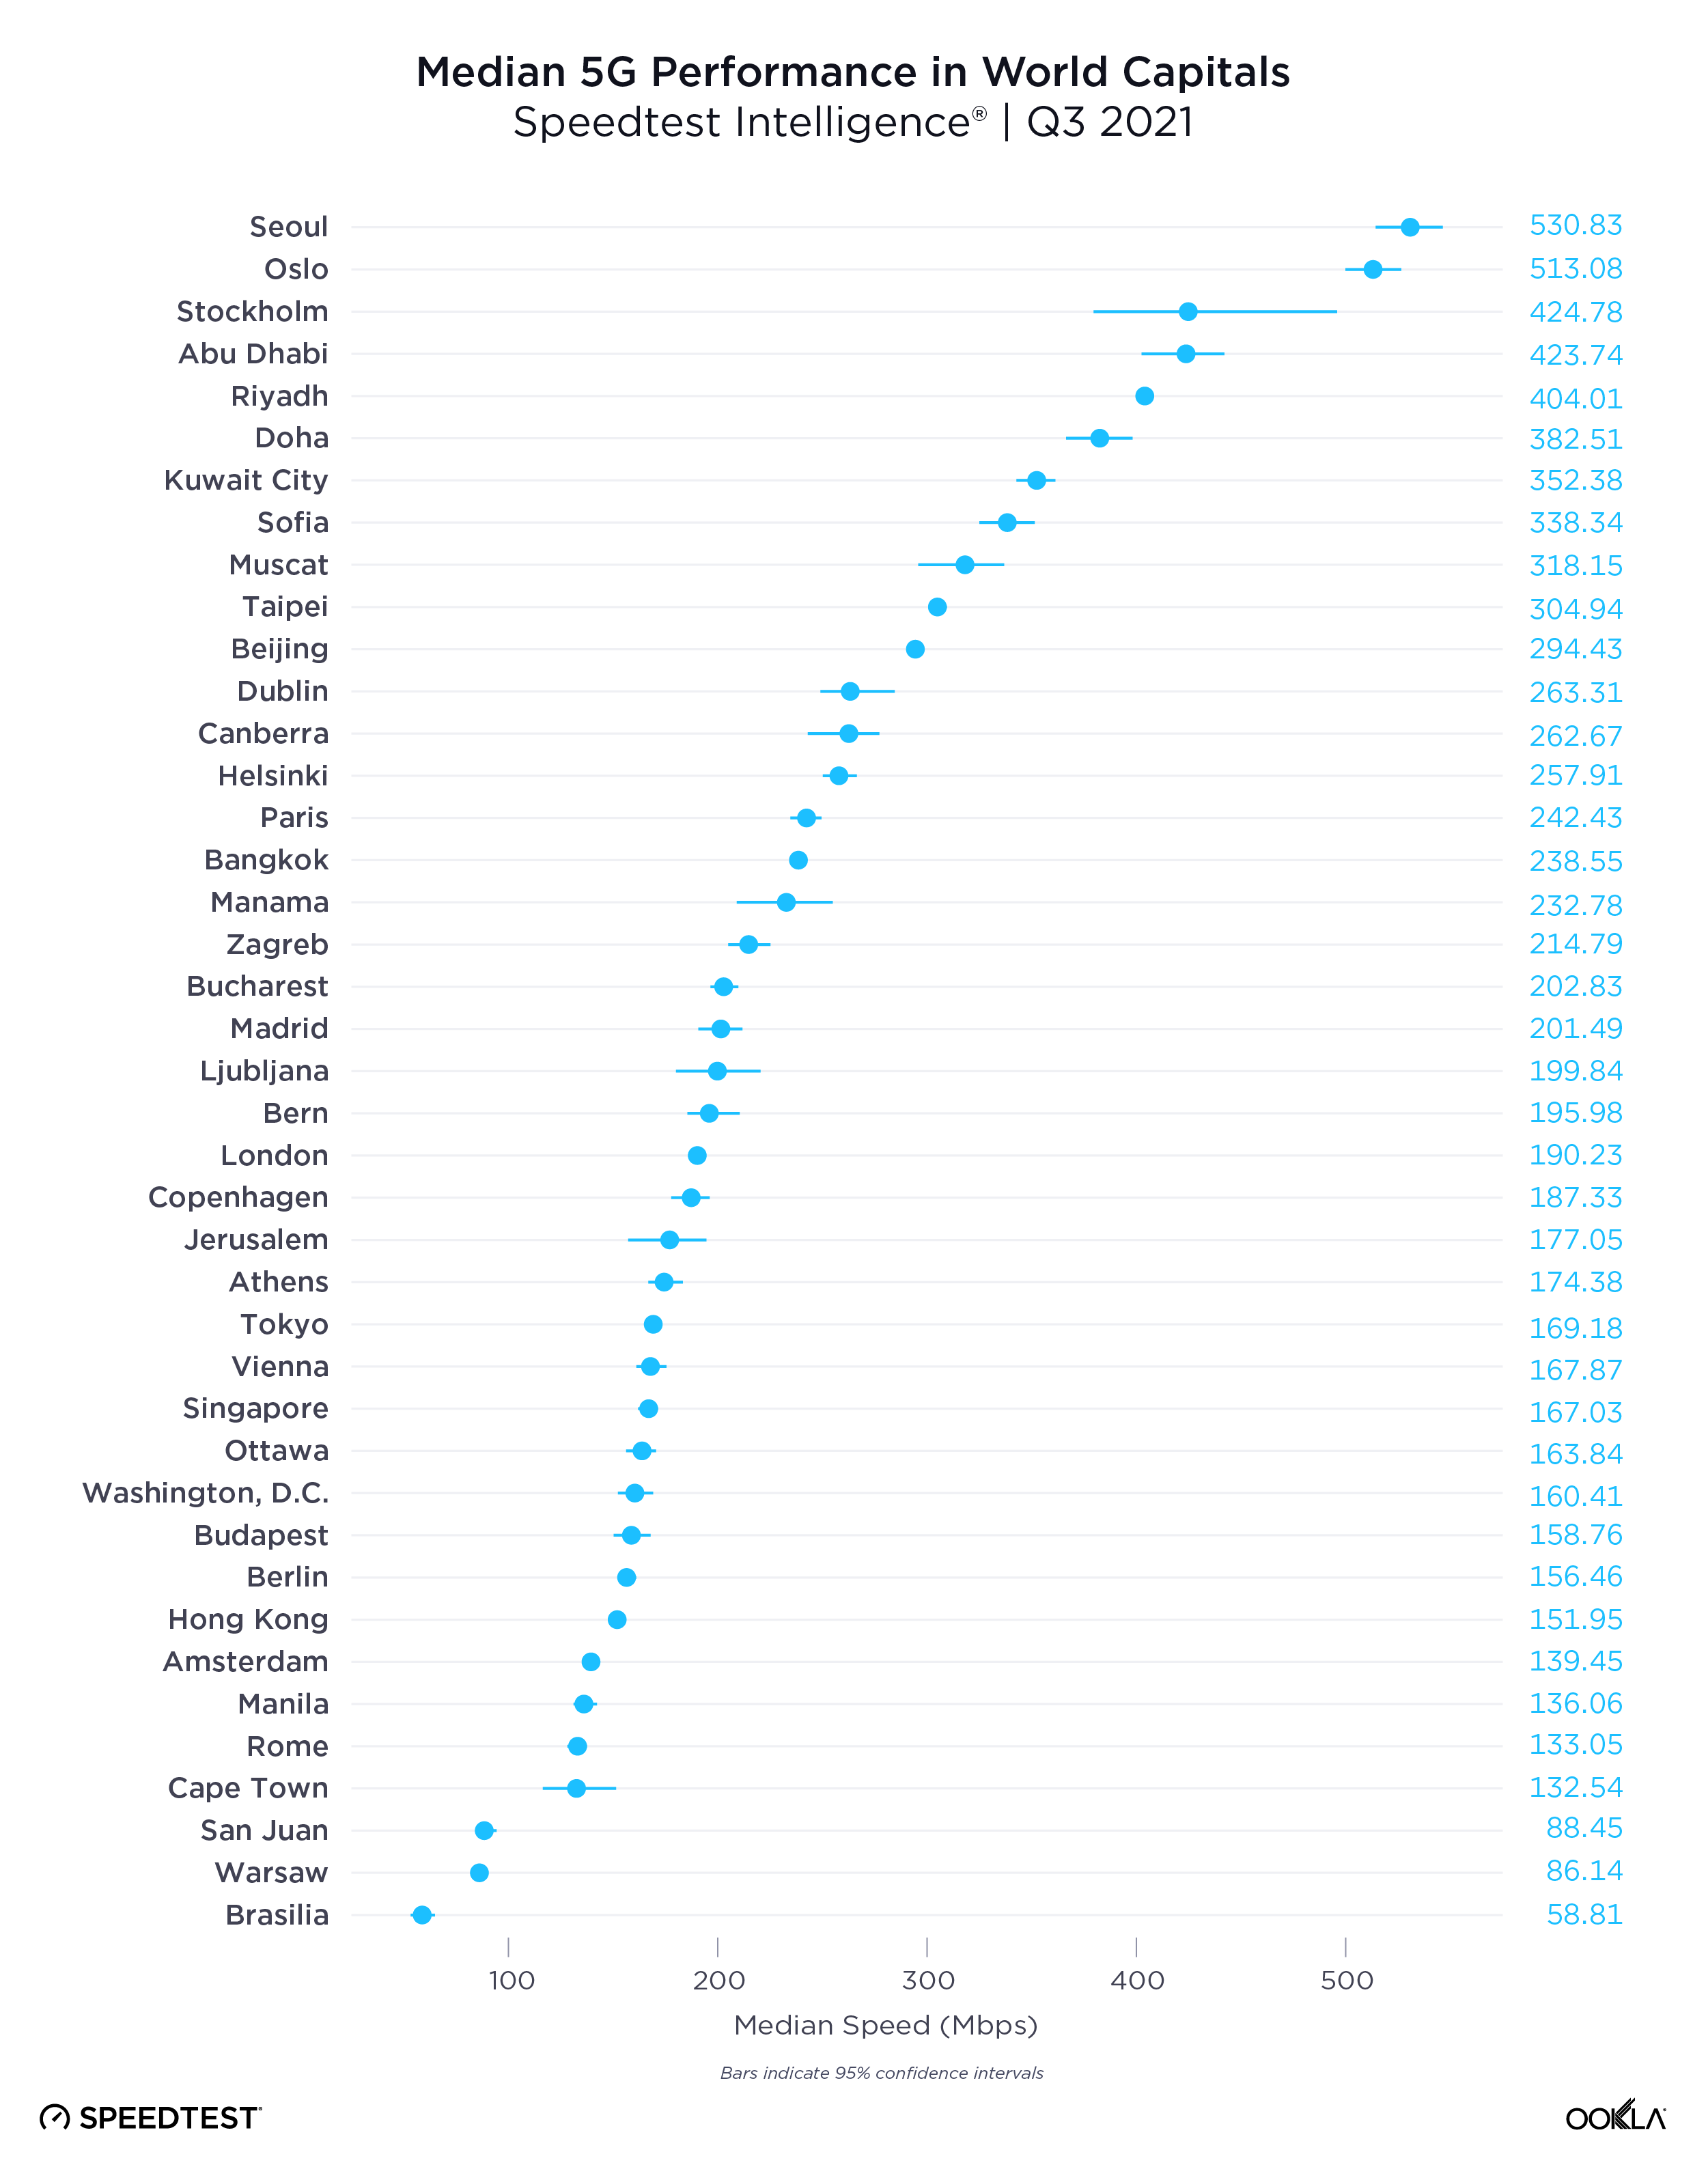
Speedtest Intelligence data from Q3 2021 shows a wide range of median 5G speeds among global capitals. Seoul, South Korea and Oslo, Norway were in the lead with 530.83 Mbps and 513.08 Mbps, respectively; Abu Dhabi, United Arab Emirates; Riyadh, Saudi Arabia and Doha Qatar followed. Brasilia, Brazil had the slowest median download speed over 5G on our list, followed by Warsaw, Poland; Cape Town, South Africa and Rome, Italy. Stockholm, Sweden and Oslo, Norway had some of the the fastest median upload speeds over 5G at 56.26 Mbps and 49.95 Mbps, respectively, while Cape Town had the slowest at 14.53 Mbps.

The U.S. had the highest 5G Availability

The presence of 5G is only one indicator in a market, because even in markets where 5G has launched, coverage and adoption can be pretty low. We analyzed 5G Availability to see what percent of users on 5G-capable devices spent the majority of their time on 5G, both roaming and on-network during Q3 2021.

ookla_5g-availability_countries_1221-01

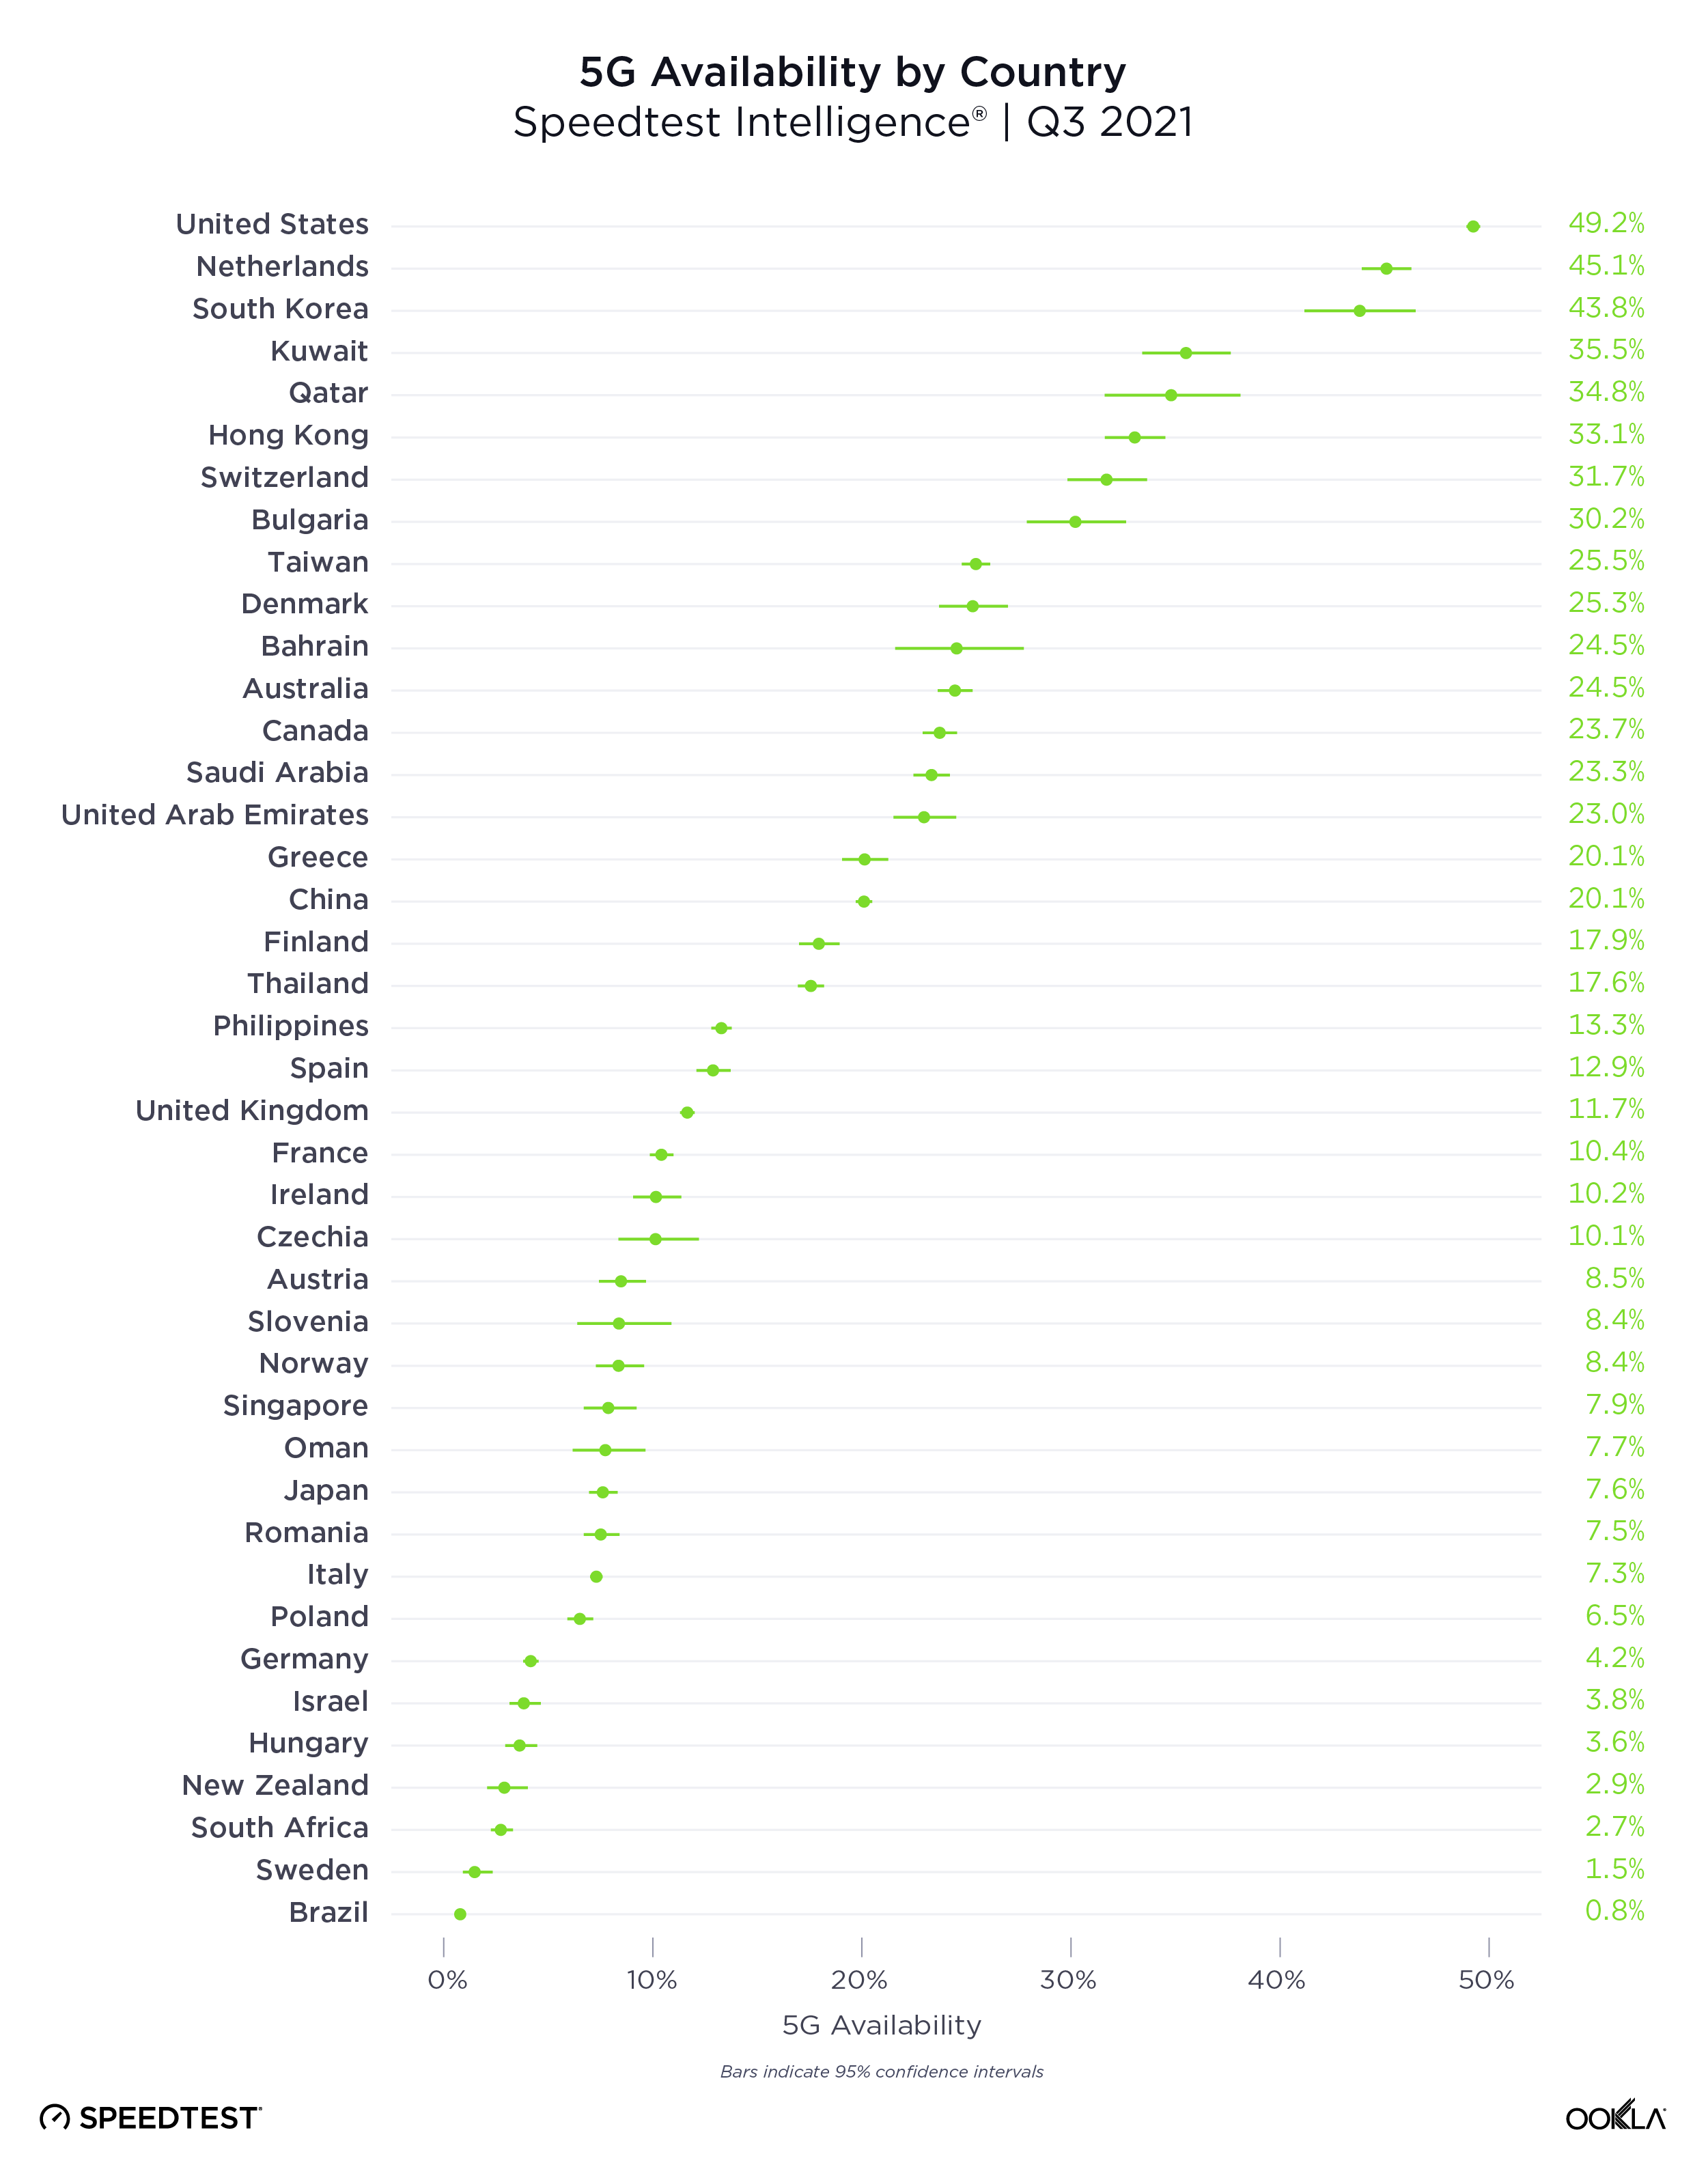
The United States had the highest 5G Availability at 49.2%, followed by the Netherlands (45.1%), South Korea (43.8%), Kuwait (35.5%) and Qatar (34.8%). Brazil had the lowest 5G Availability on our list at 0.8%, followed by Sweden (1.5%), South Africa (2.7%), New Zealand (2.9%) and Hungary (3.6%).

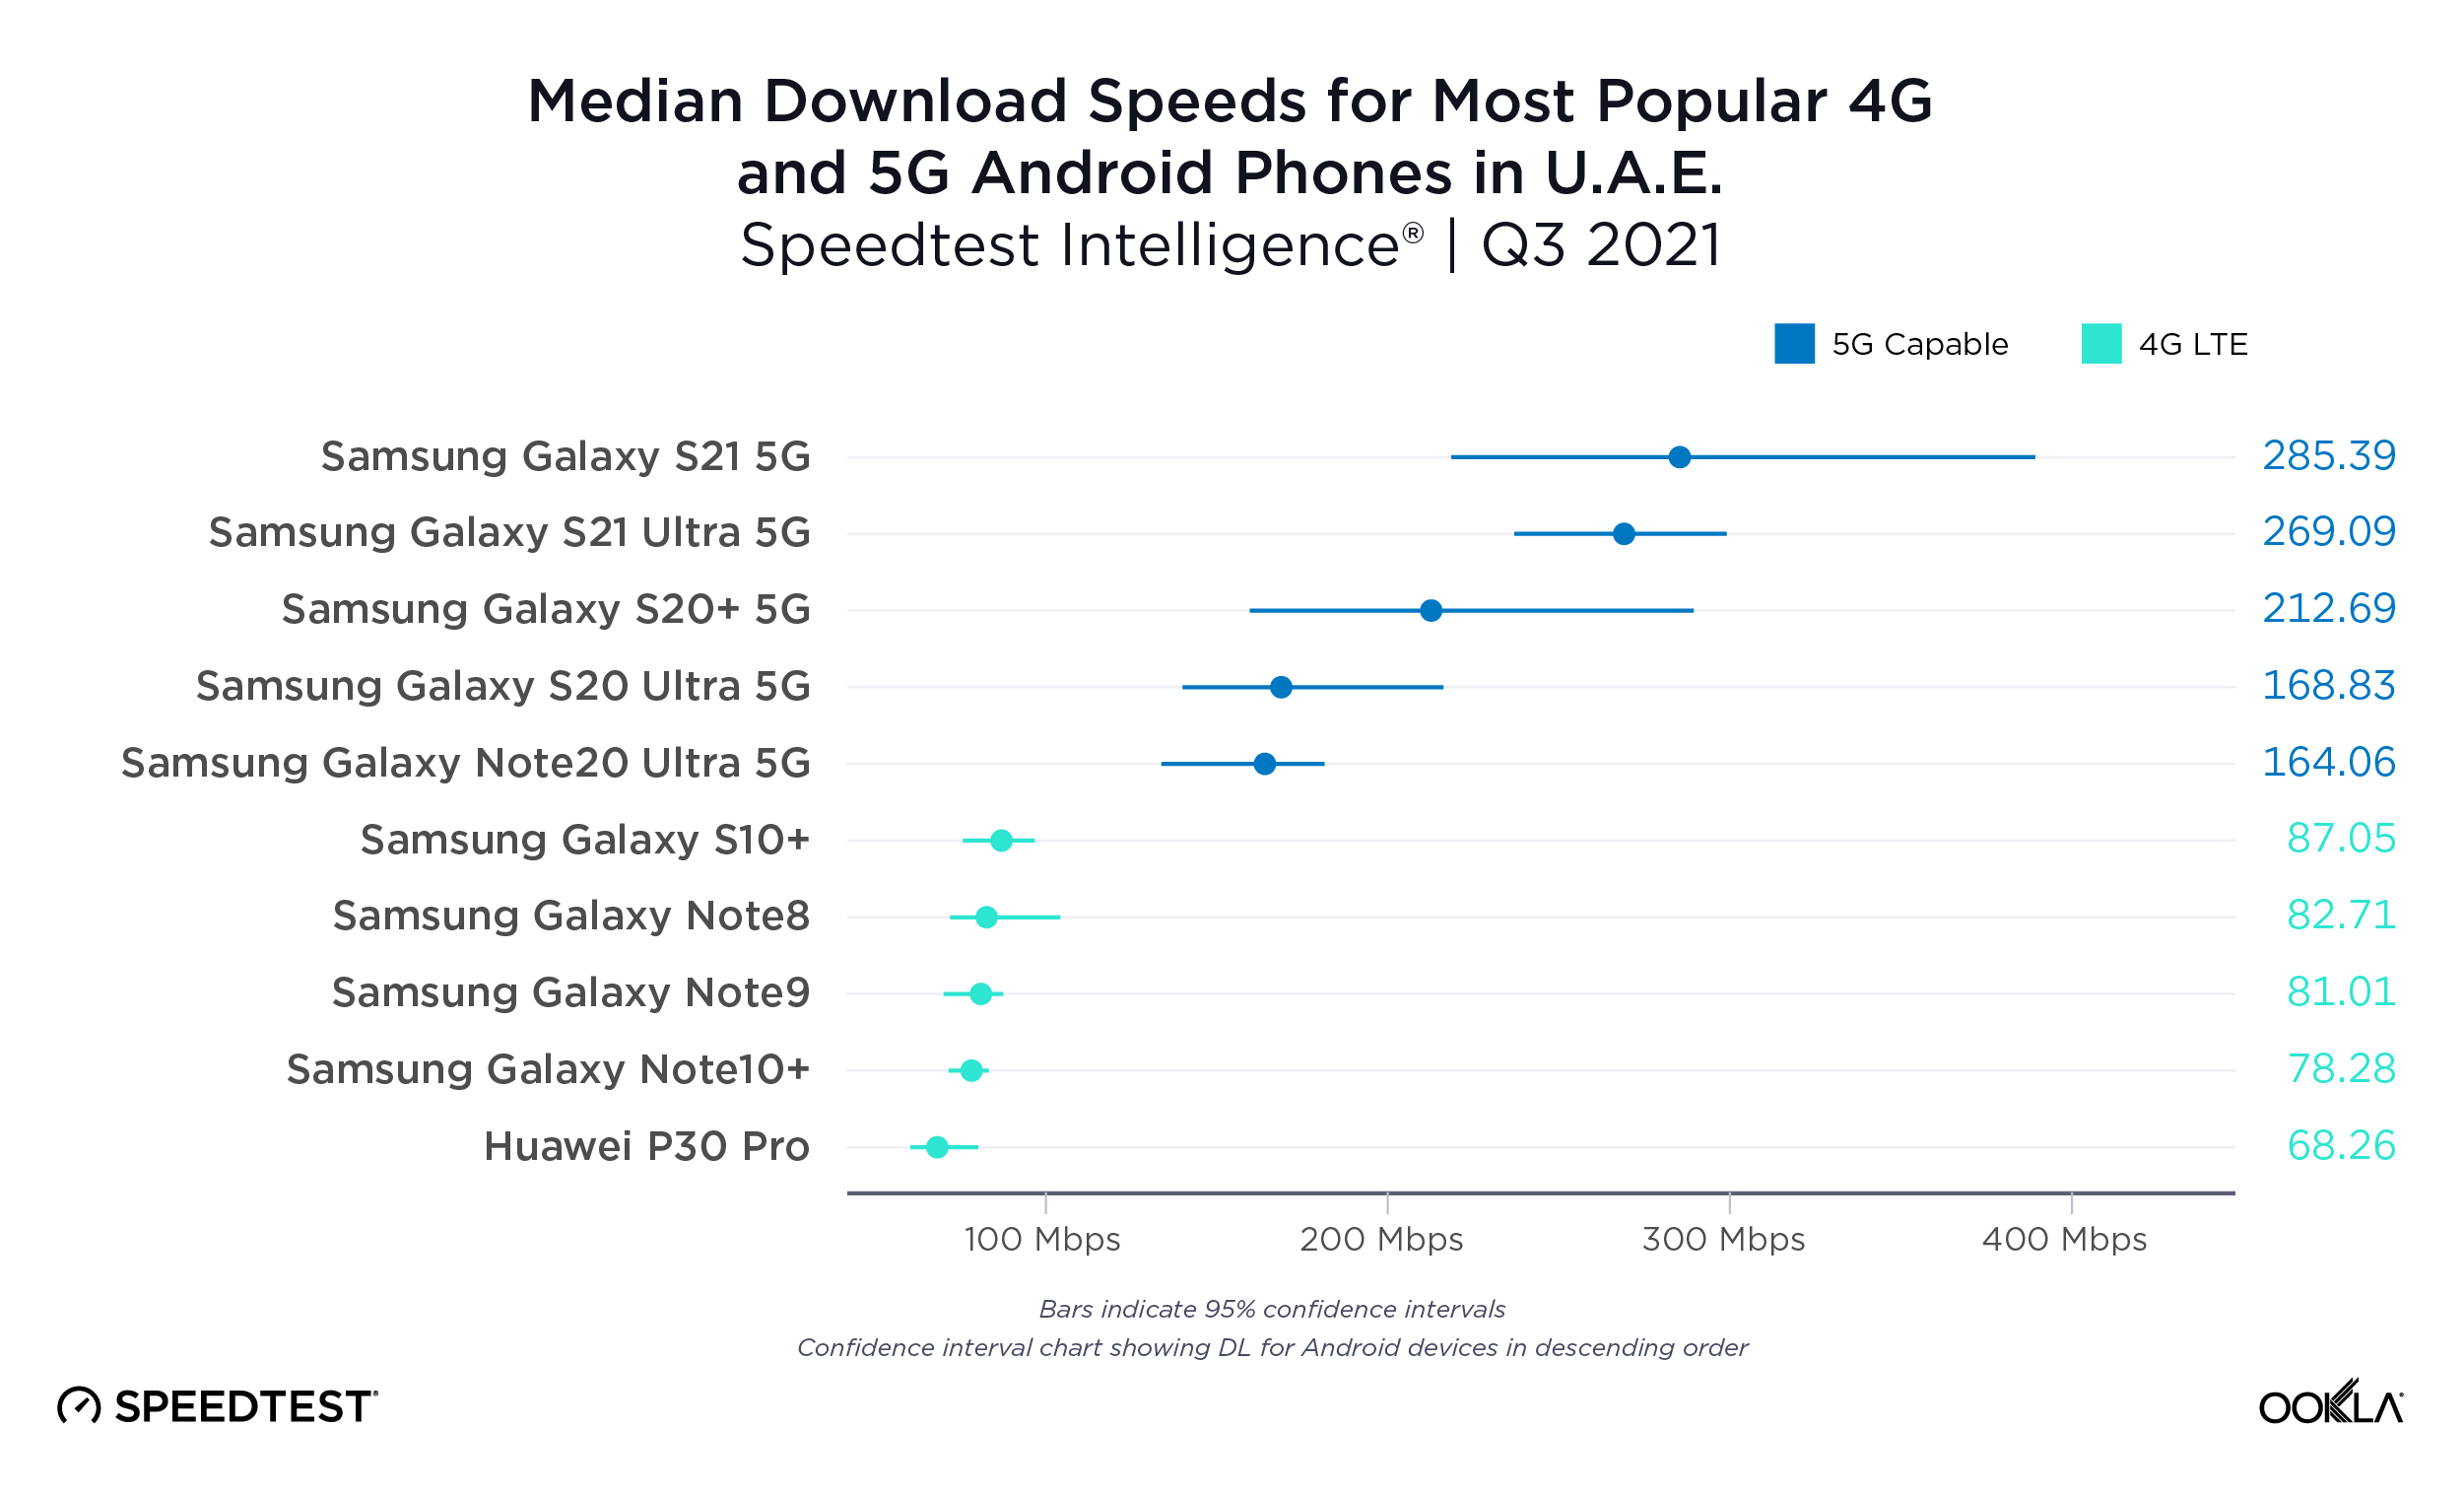
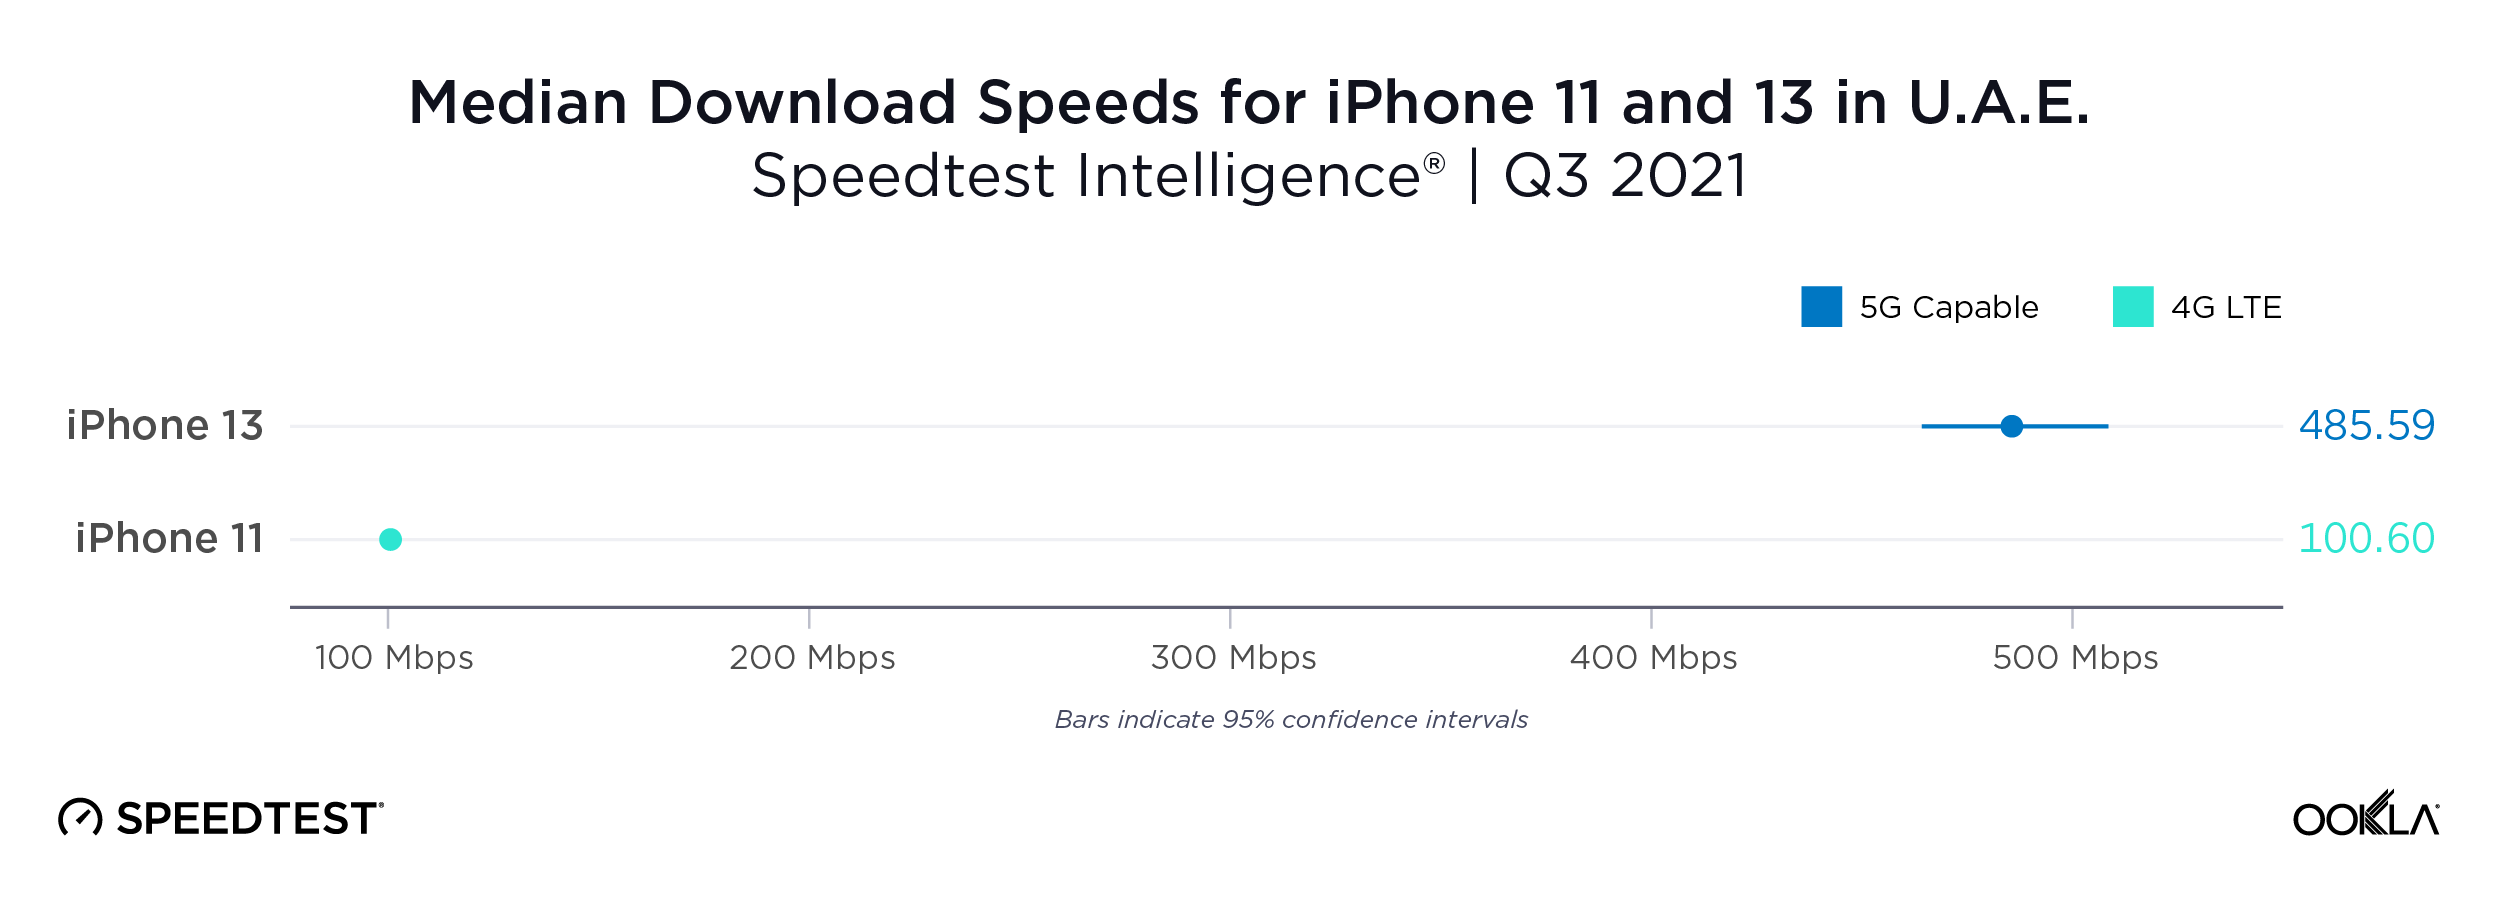
Not all 5G networks are created equal

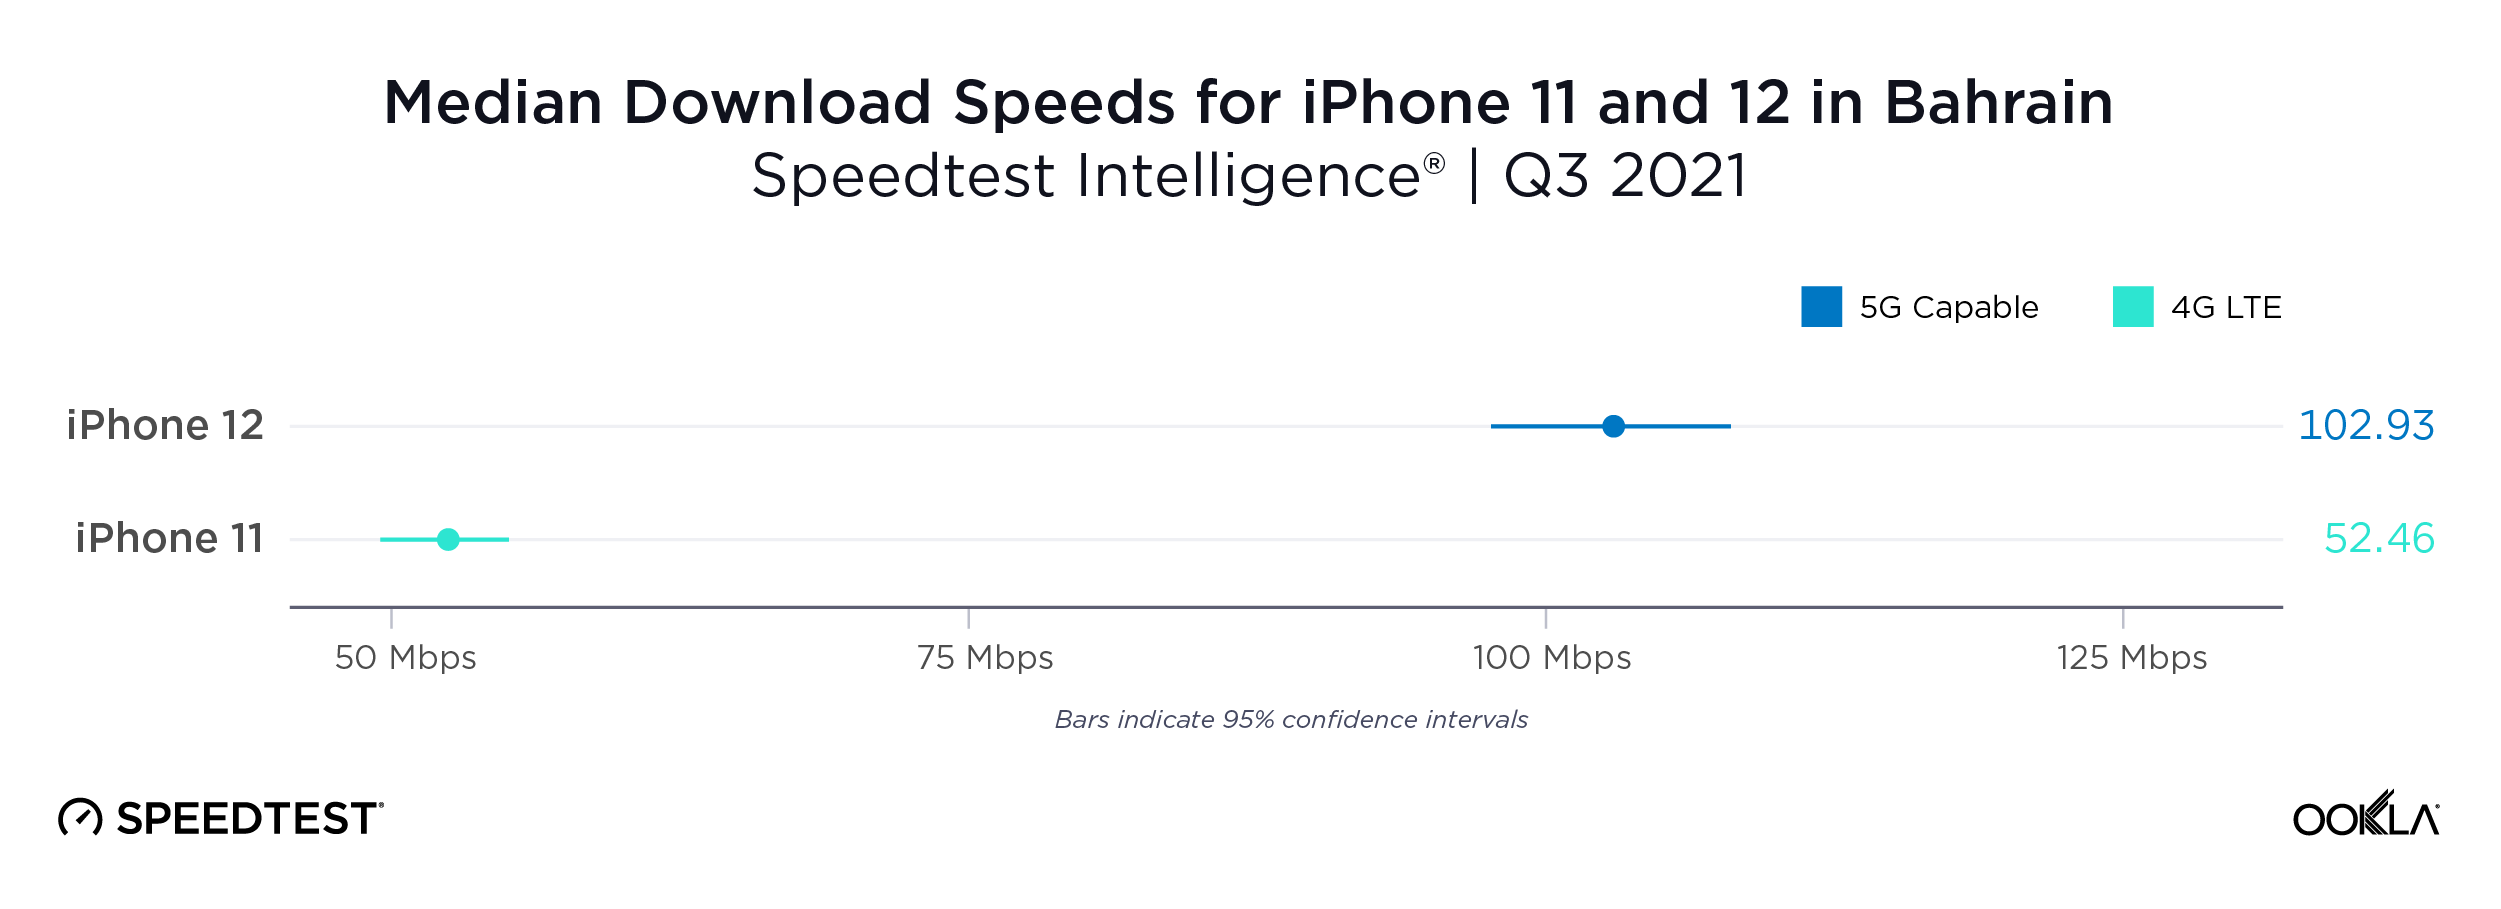
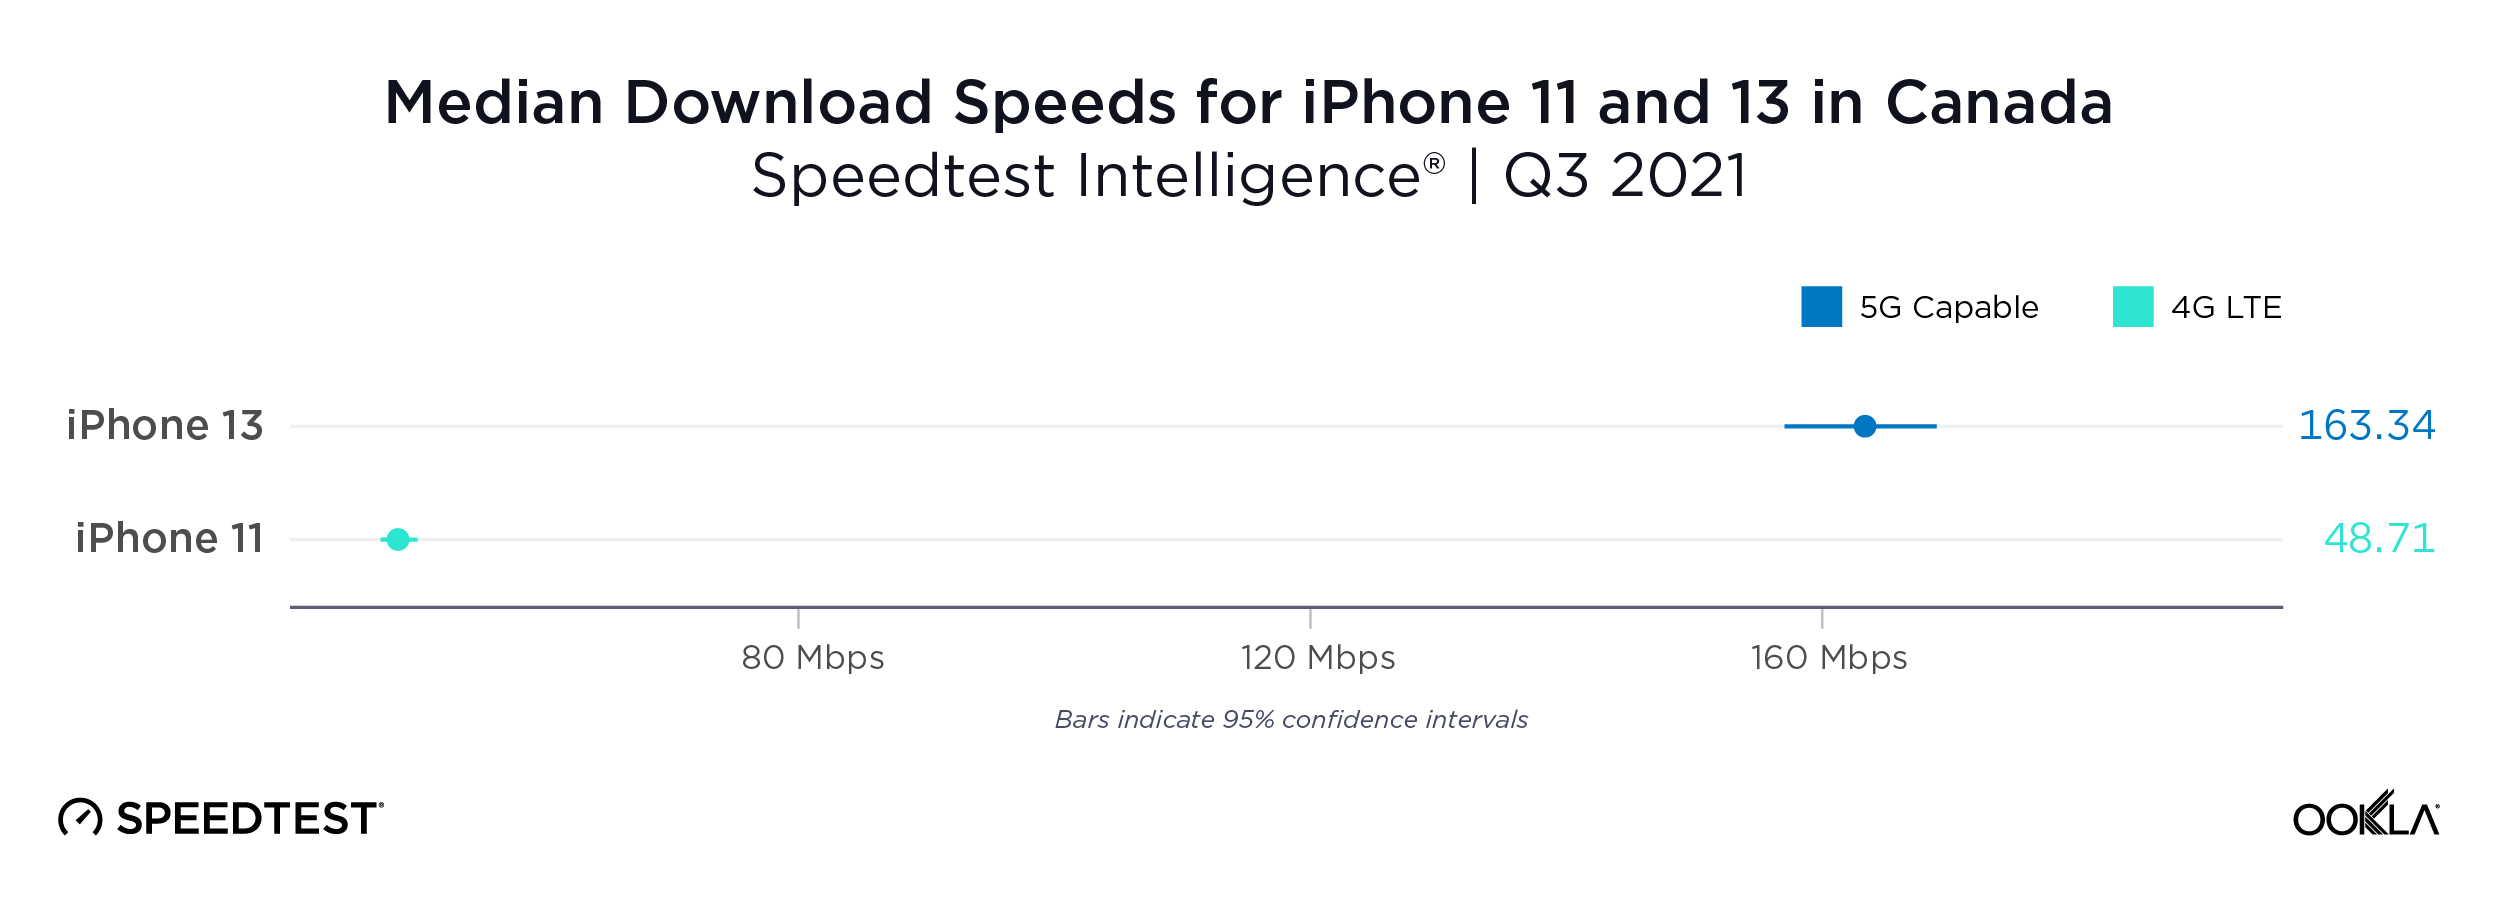
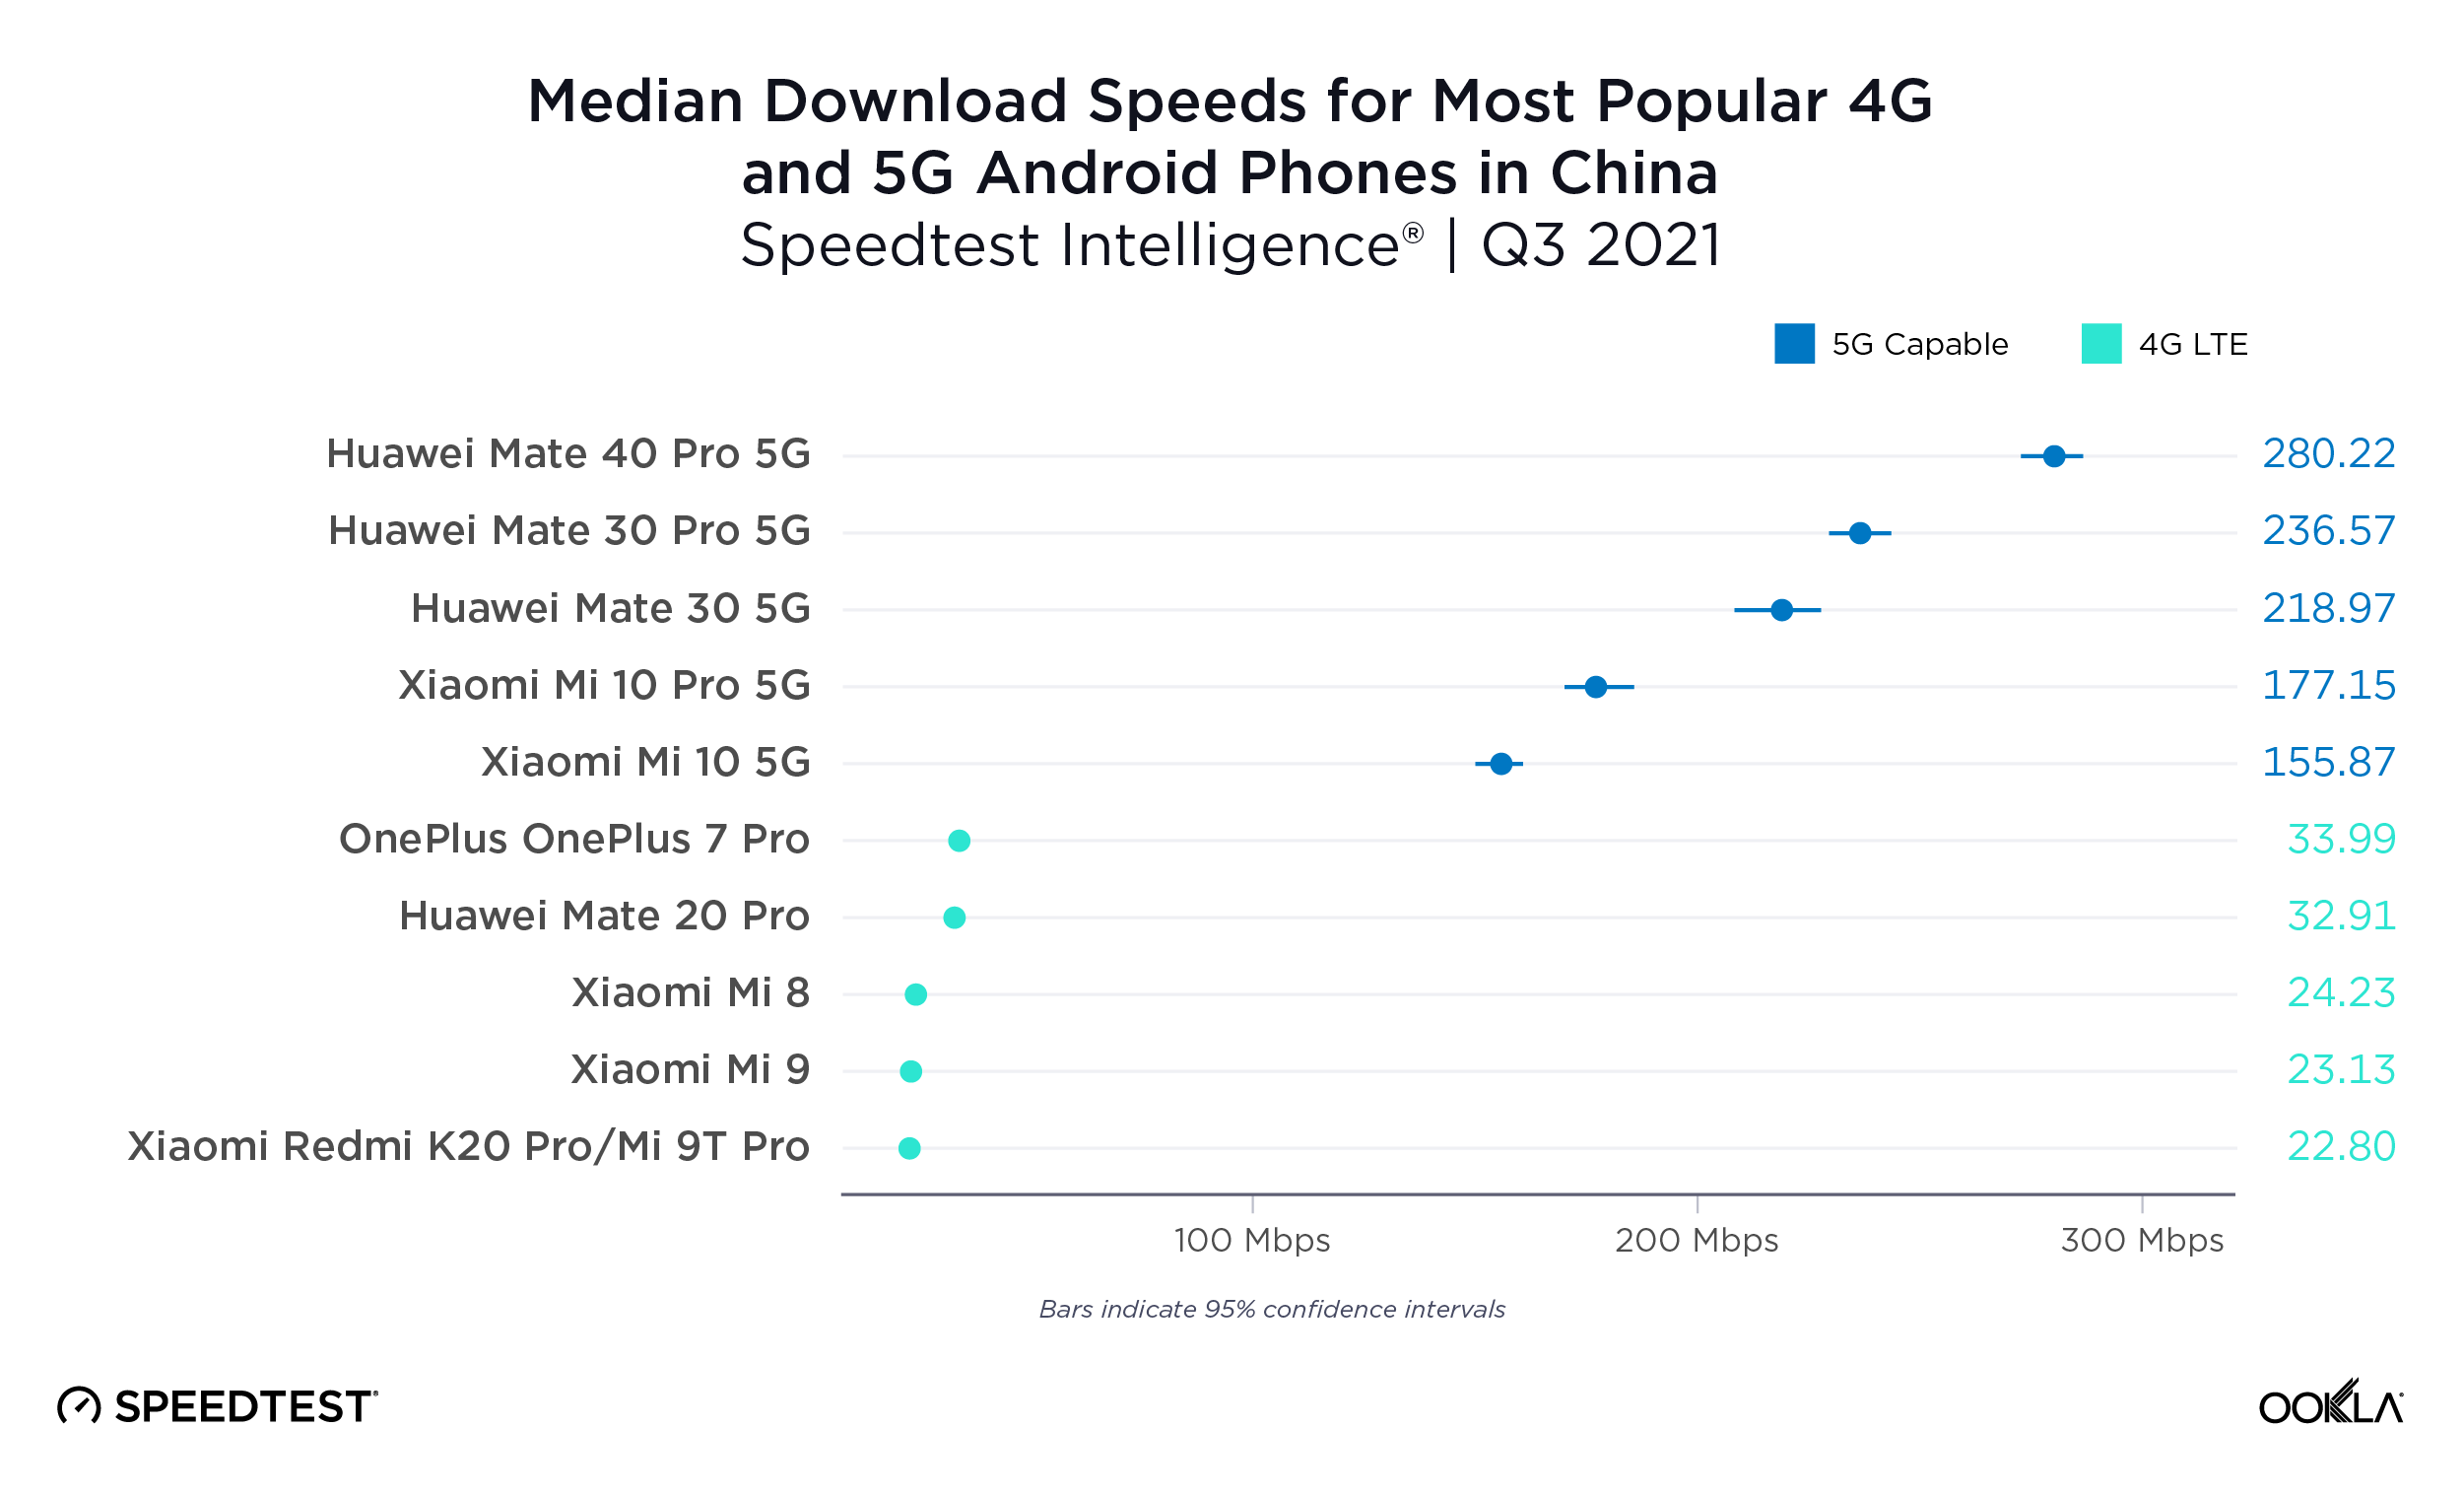
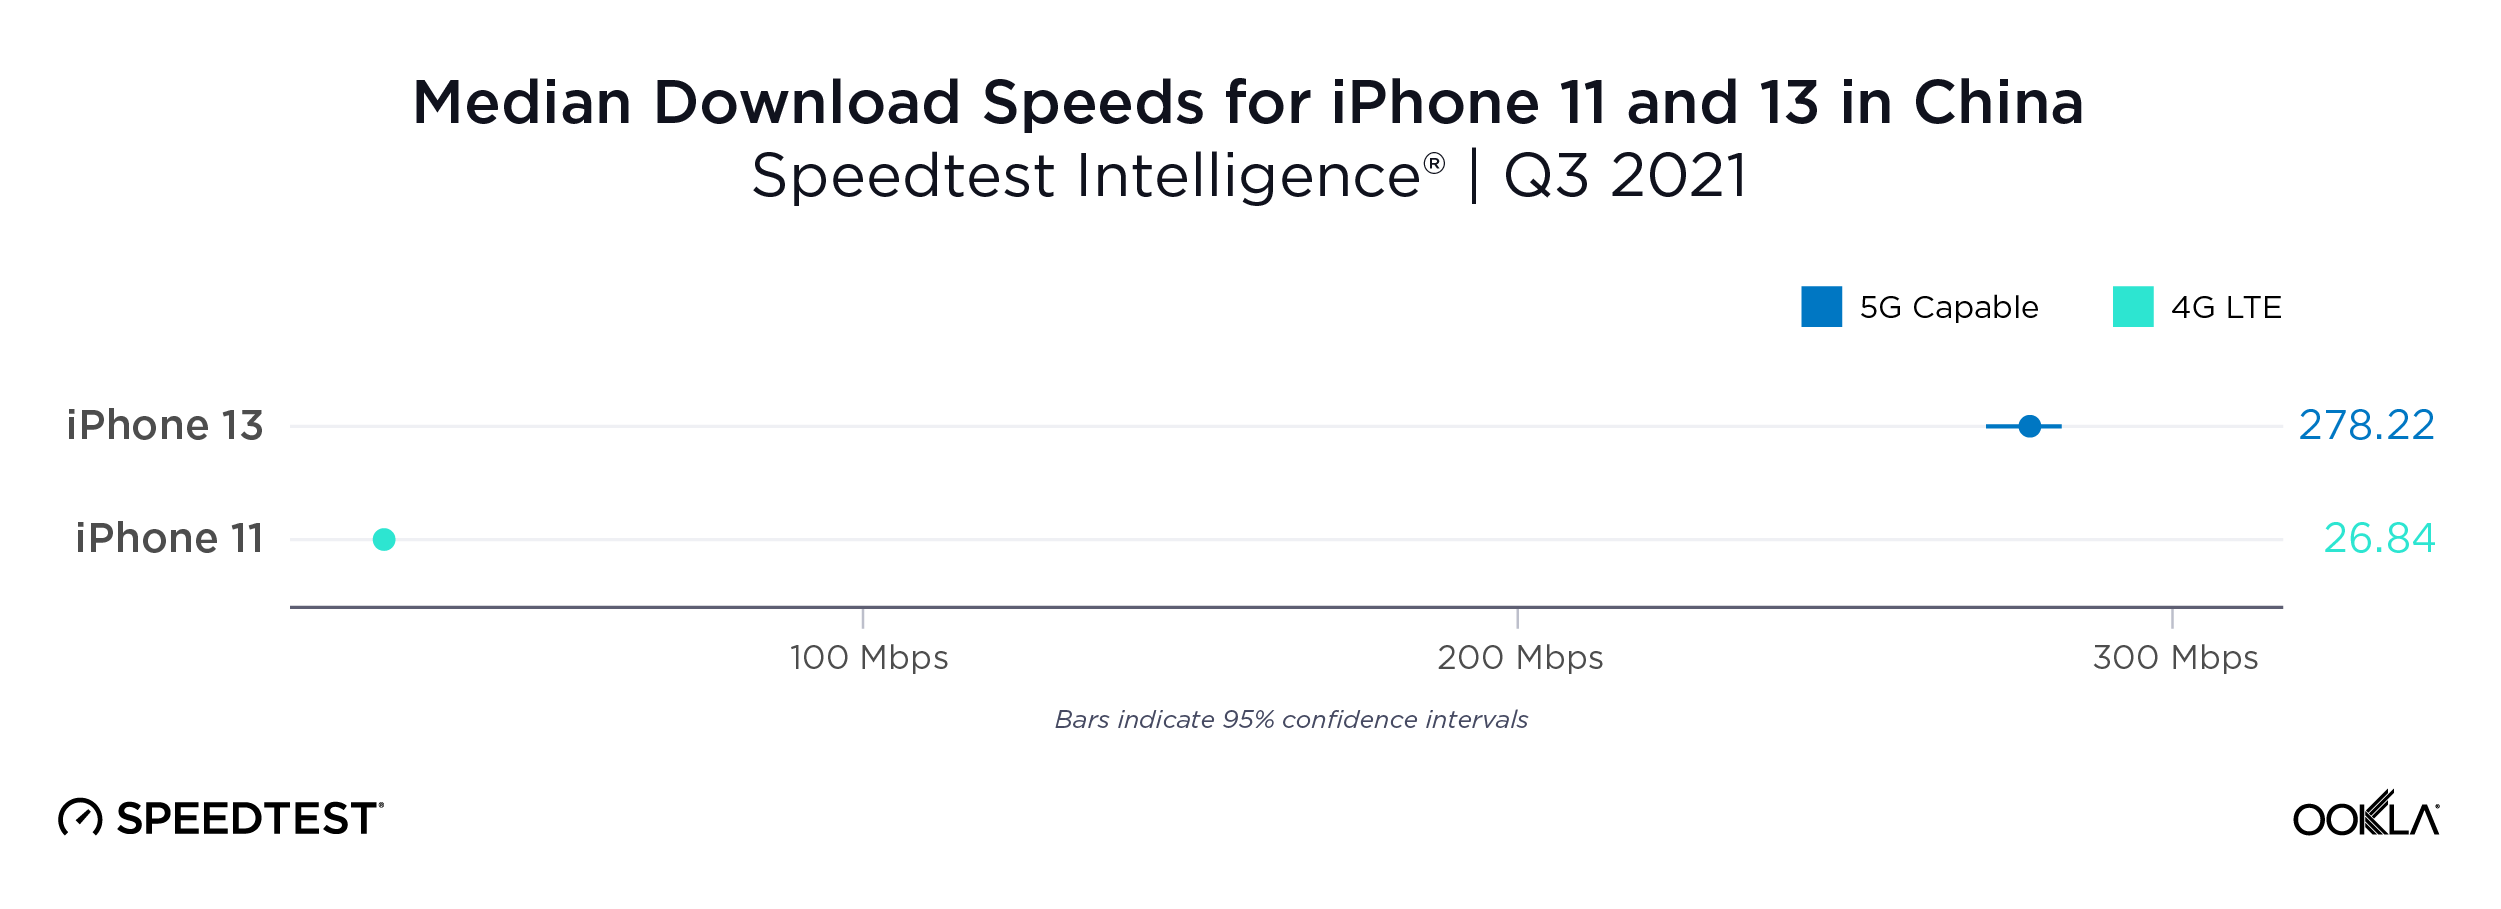
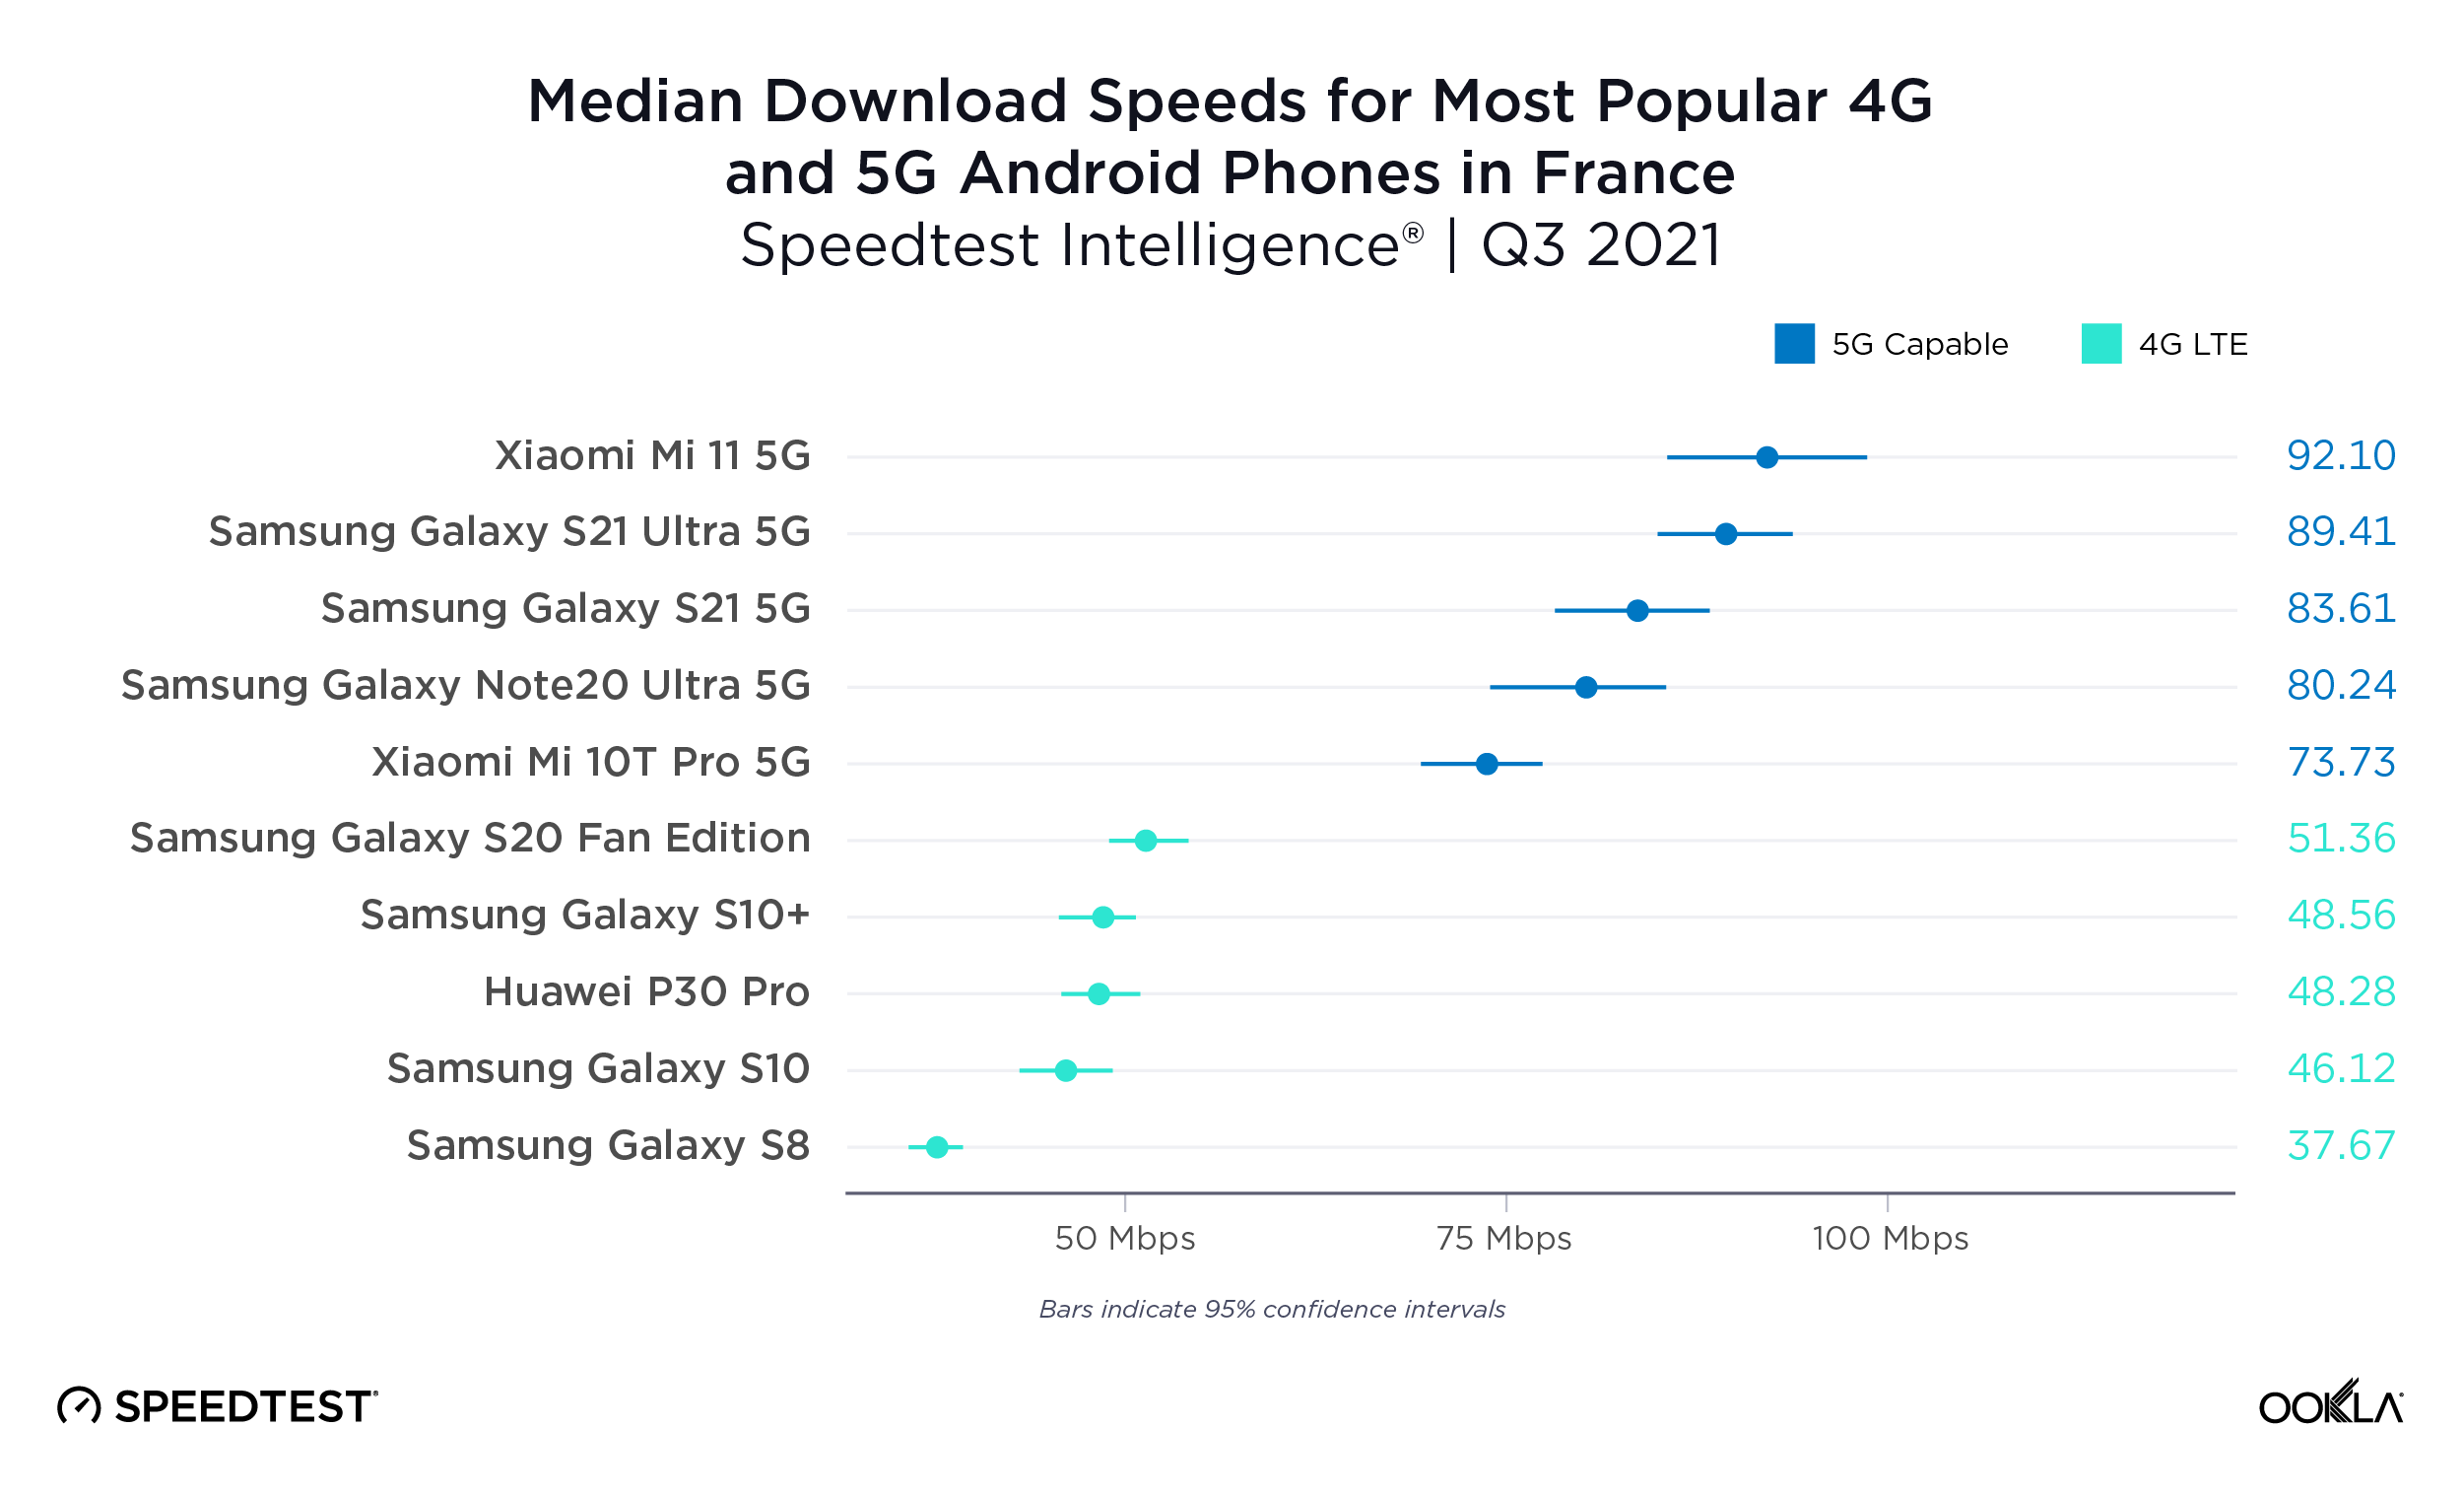
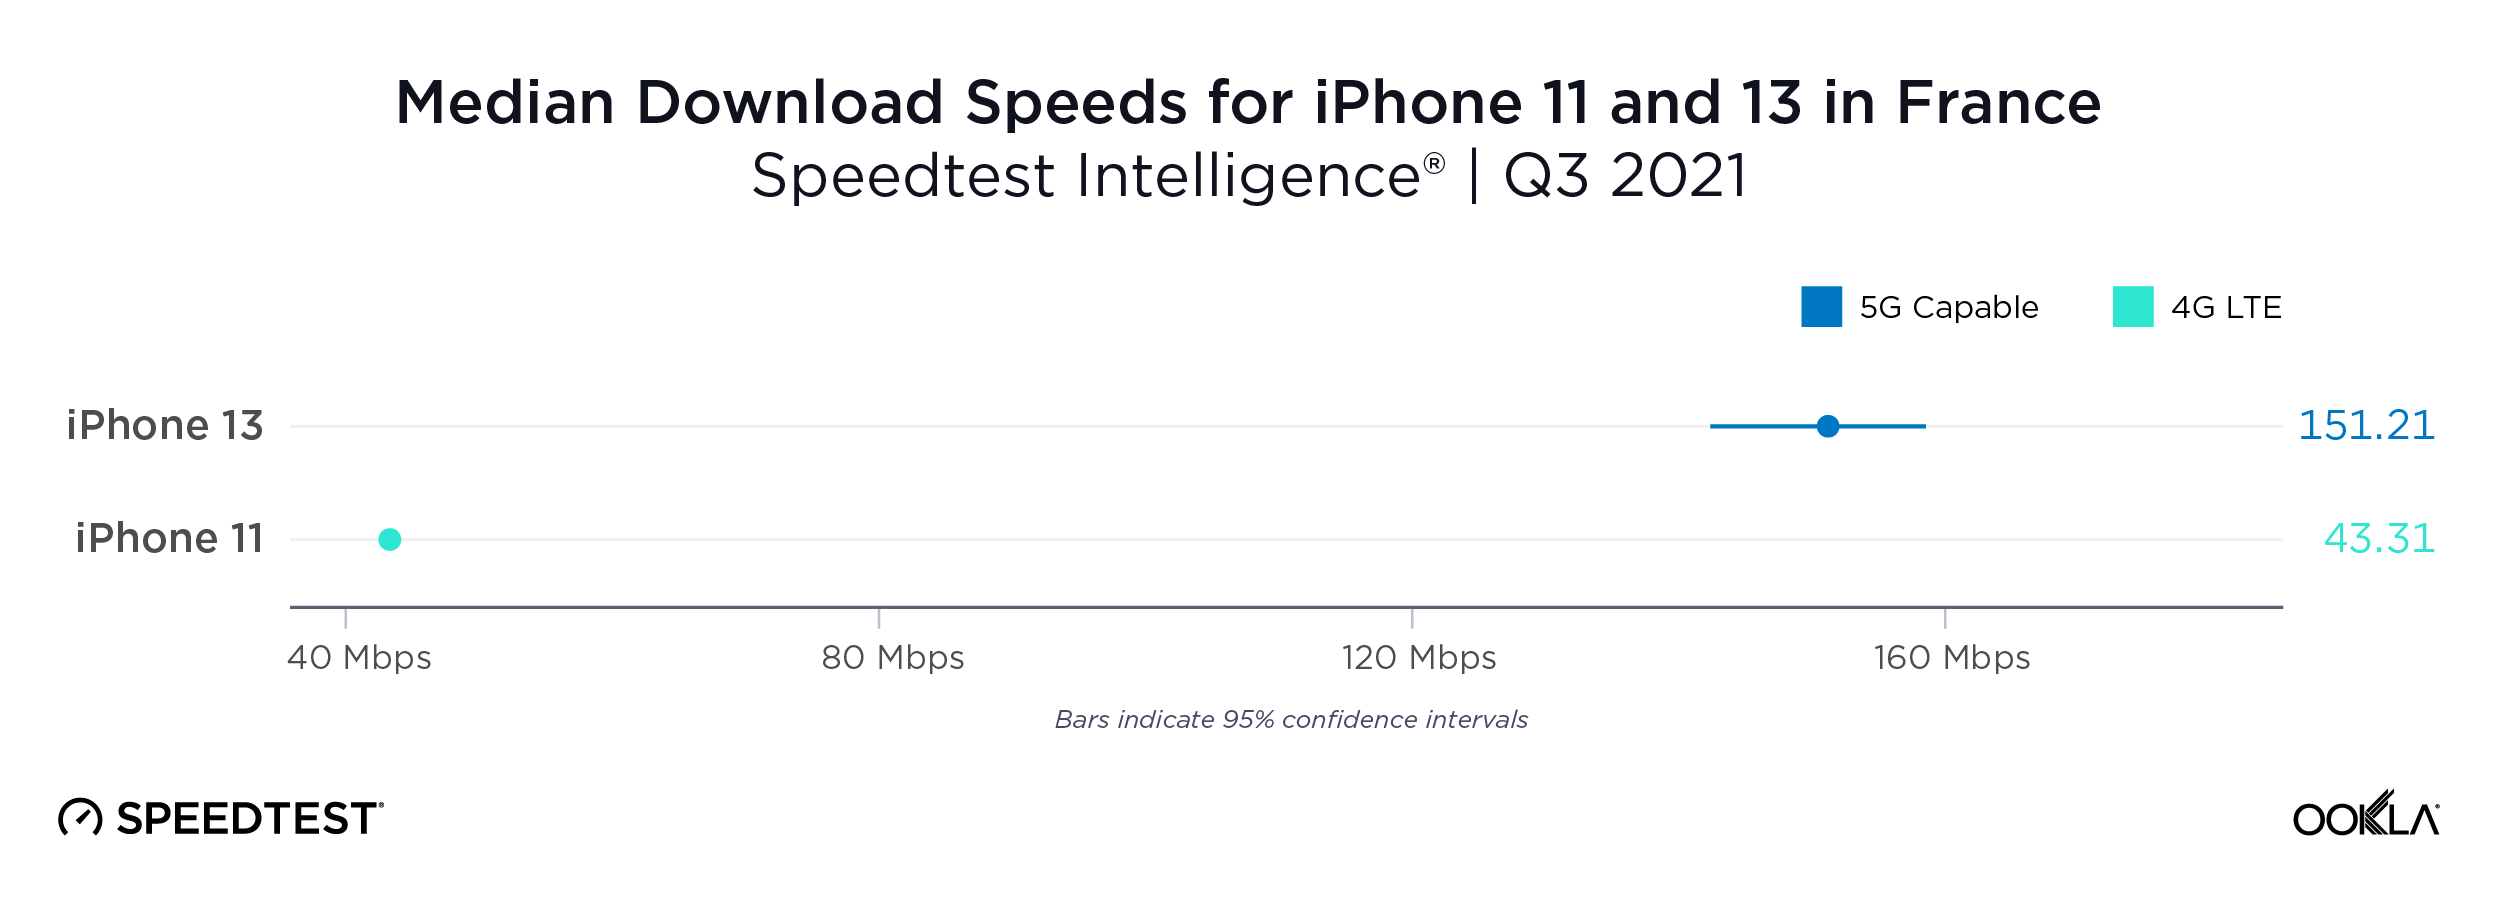
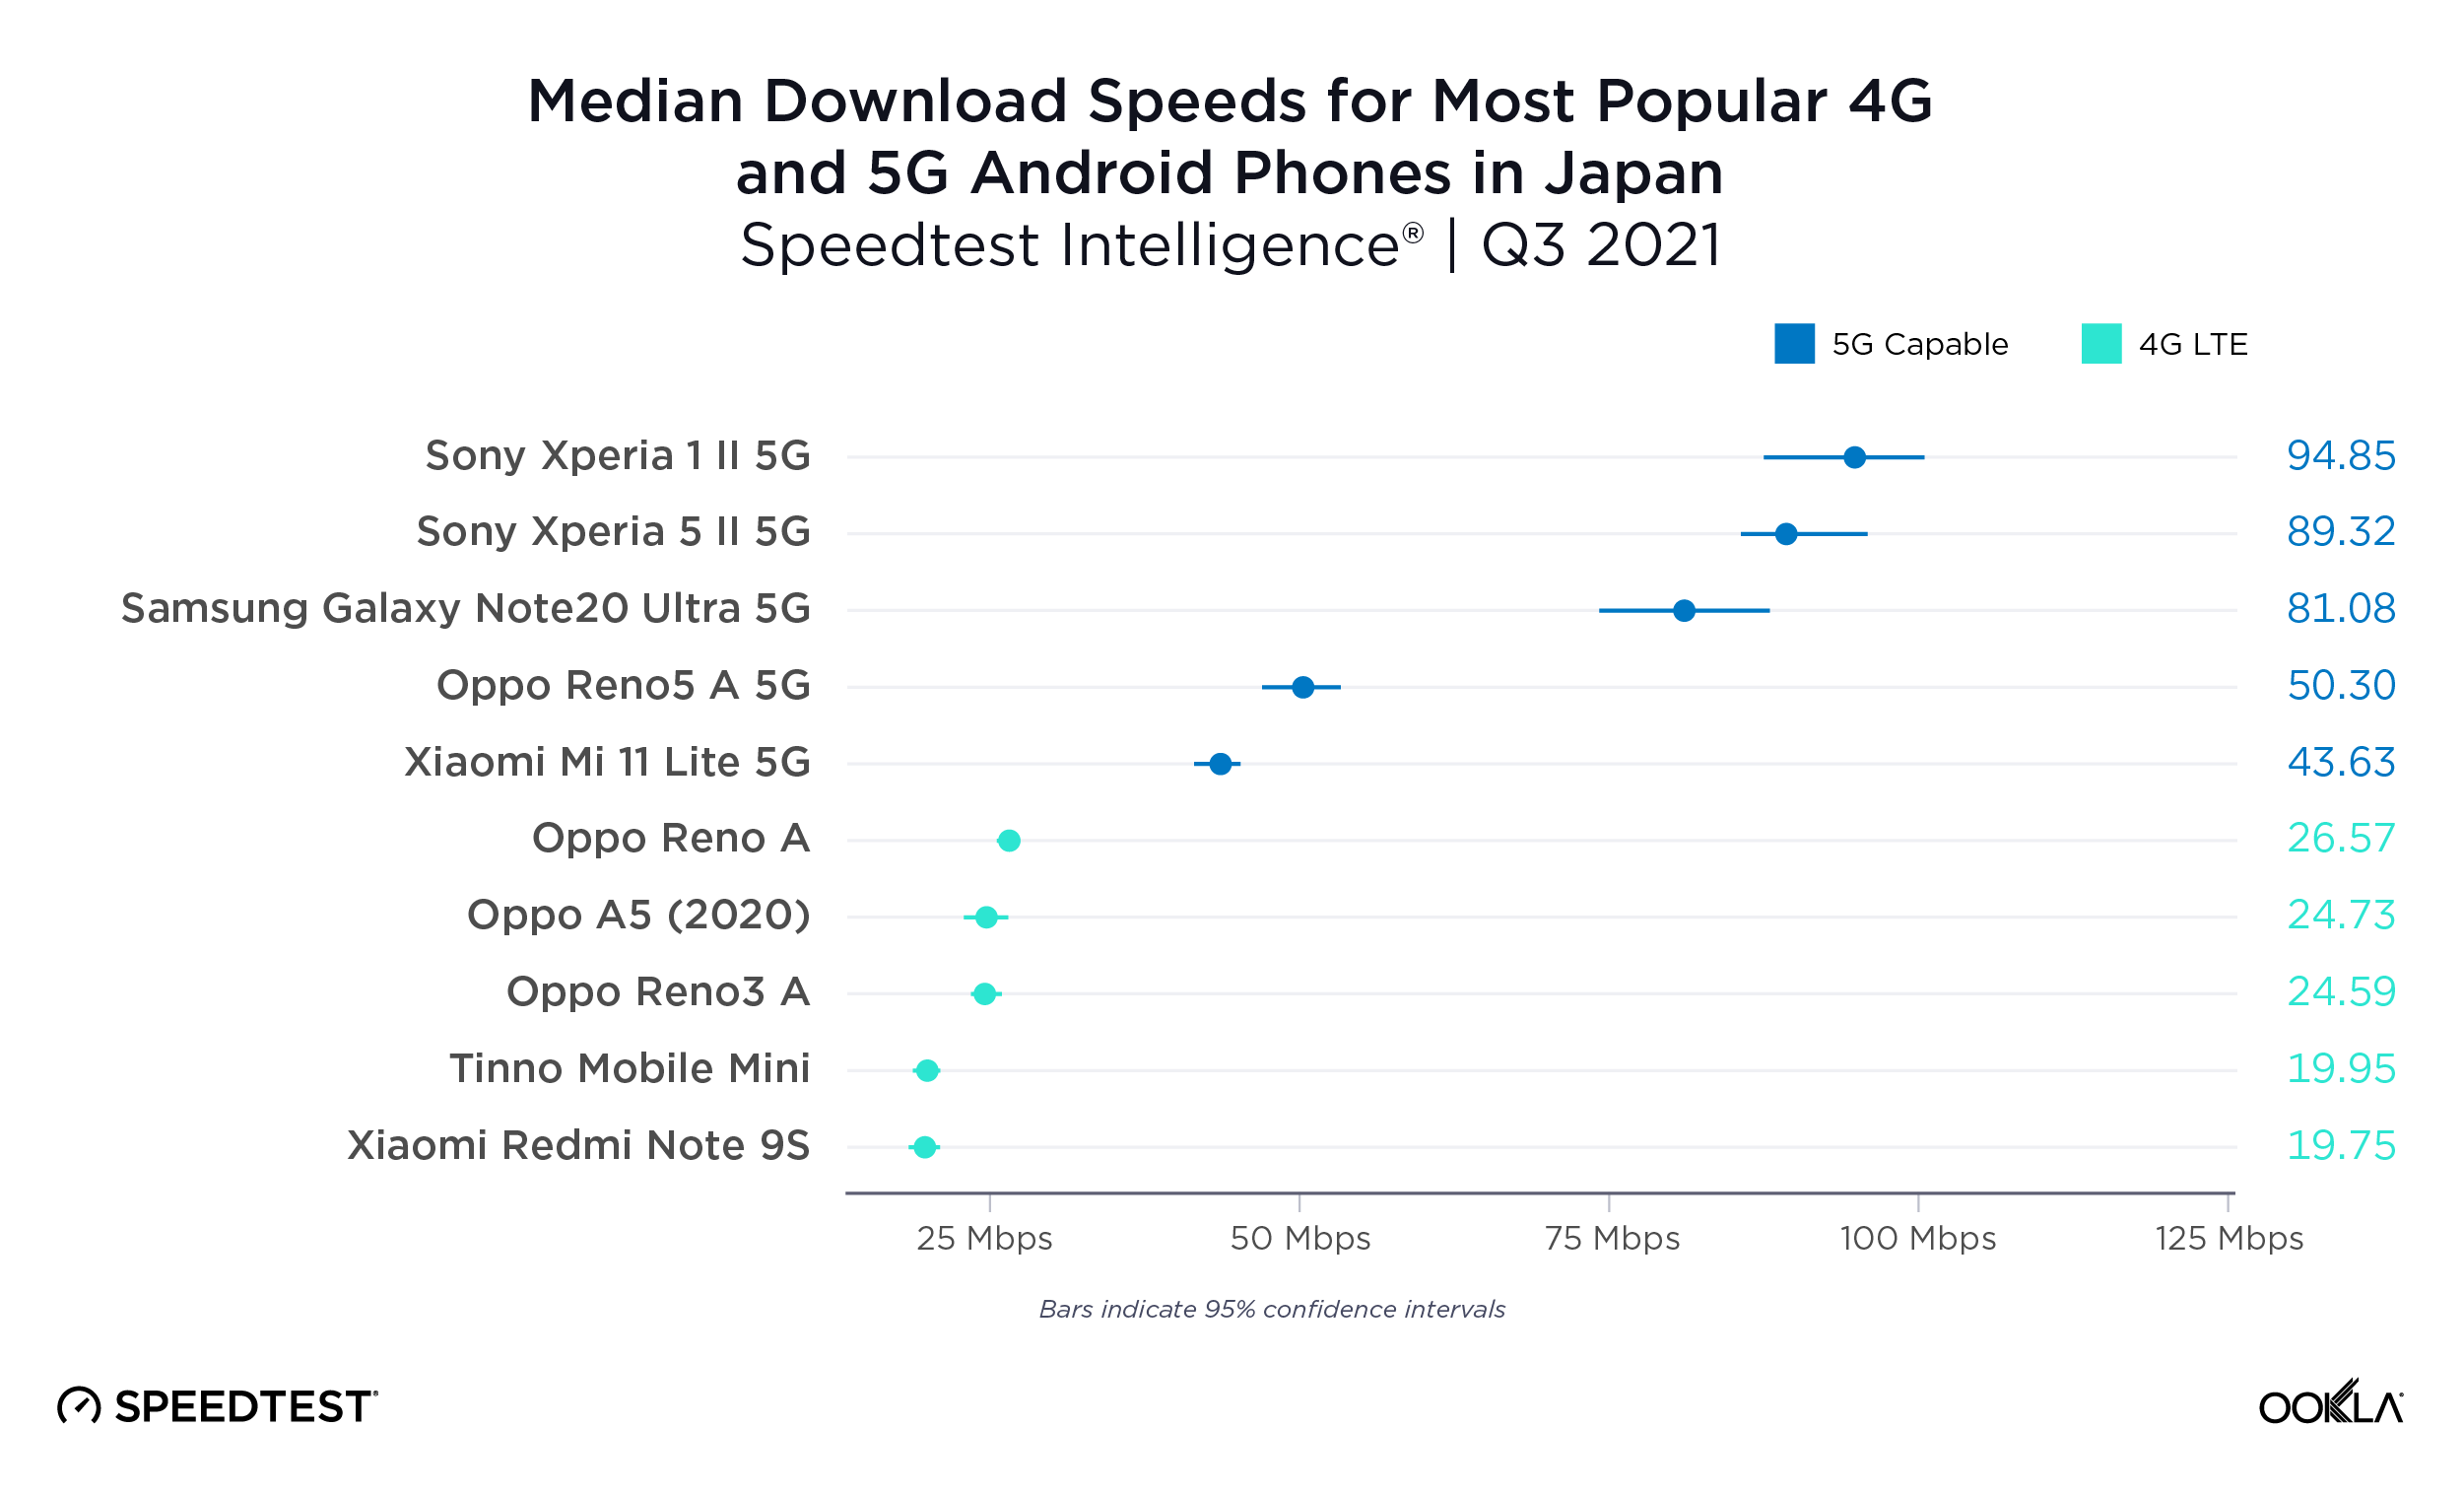
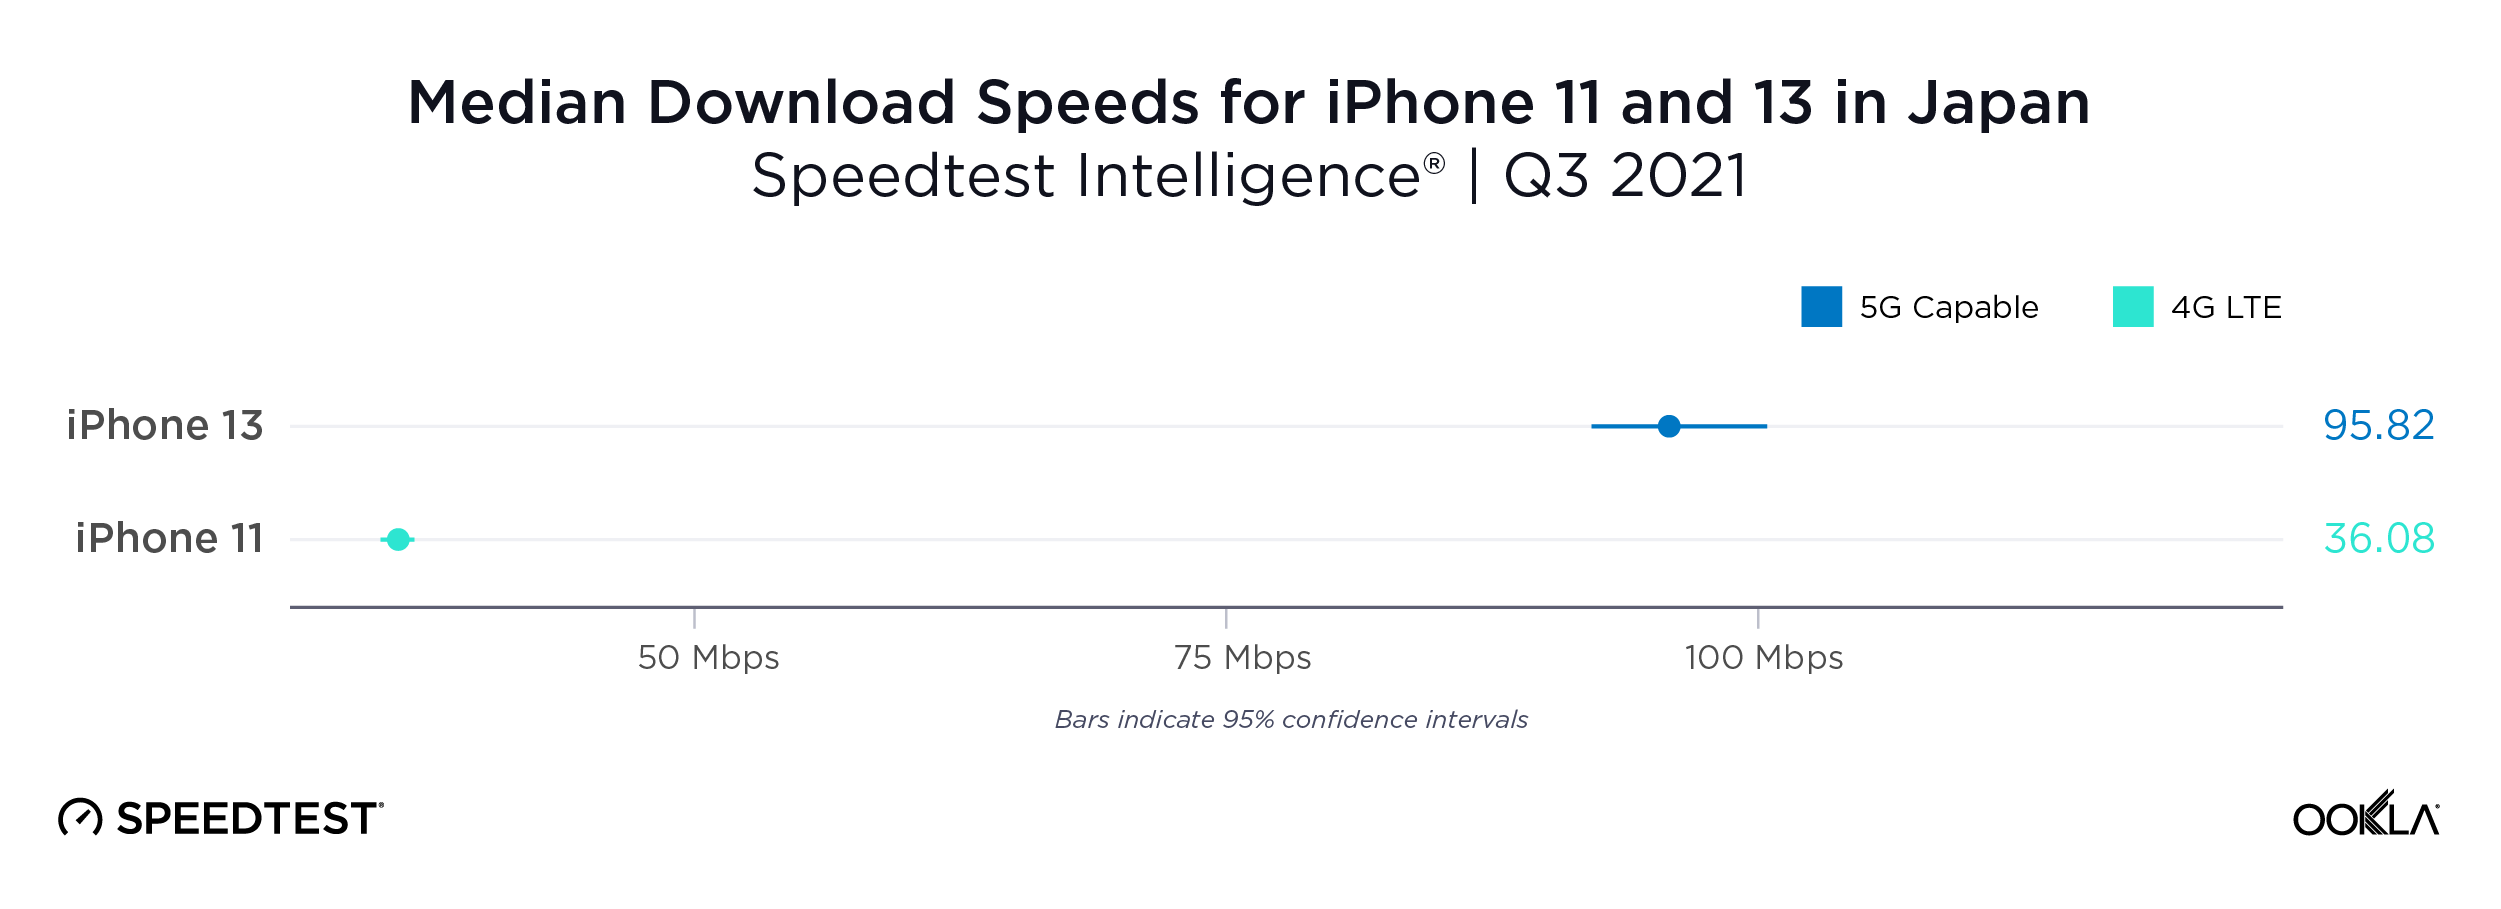
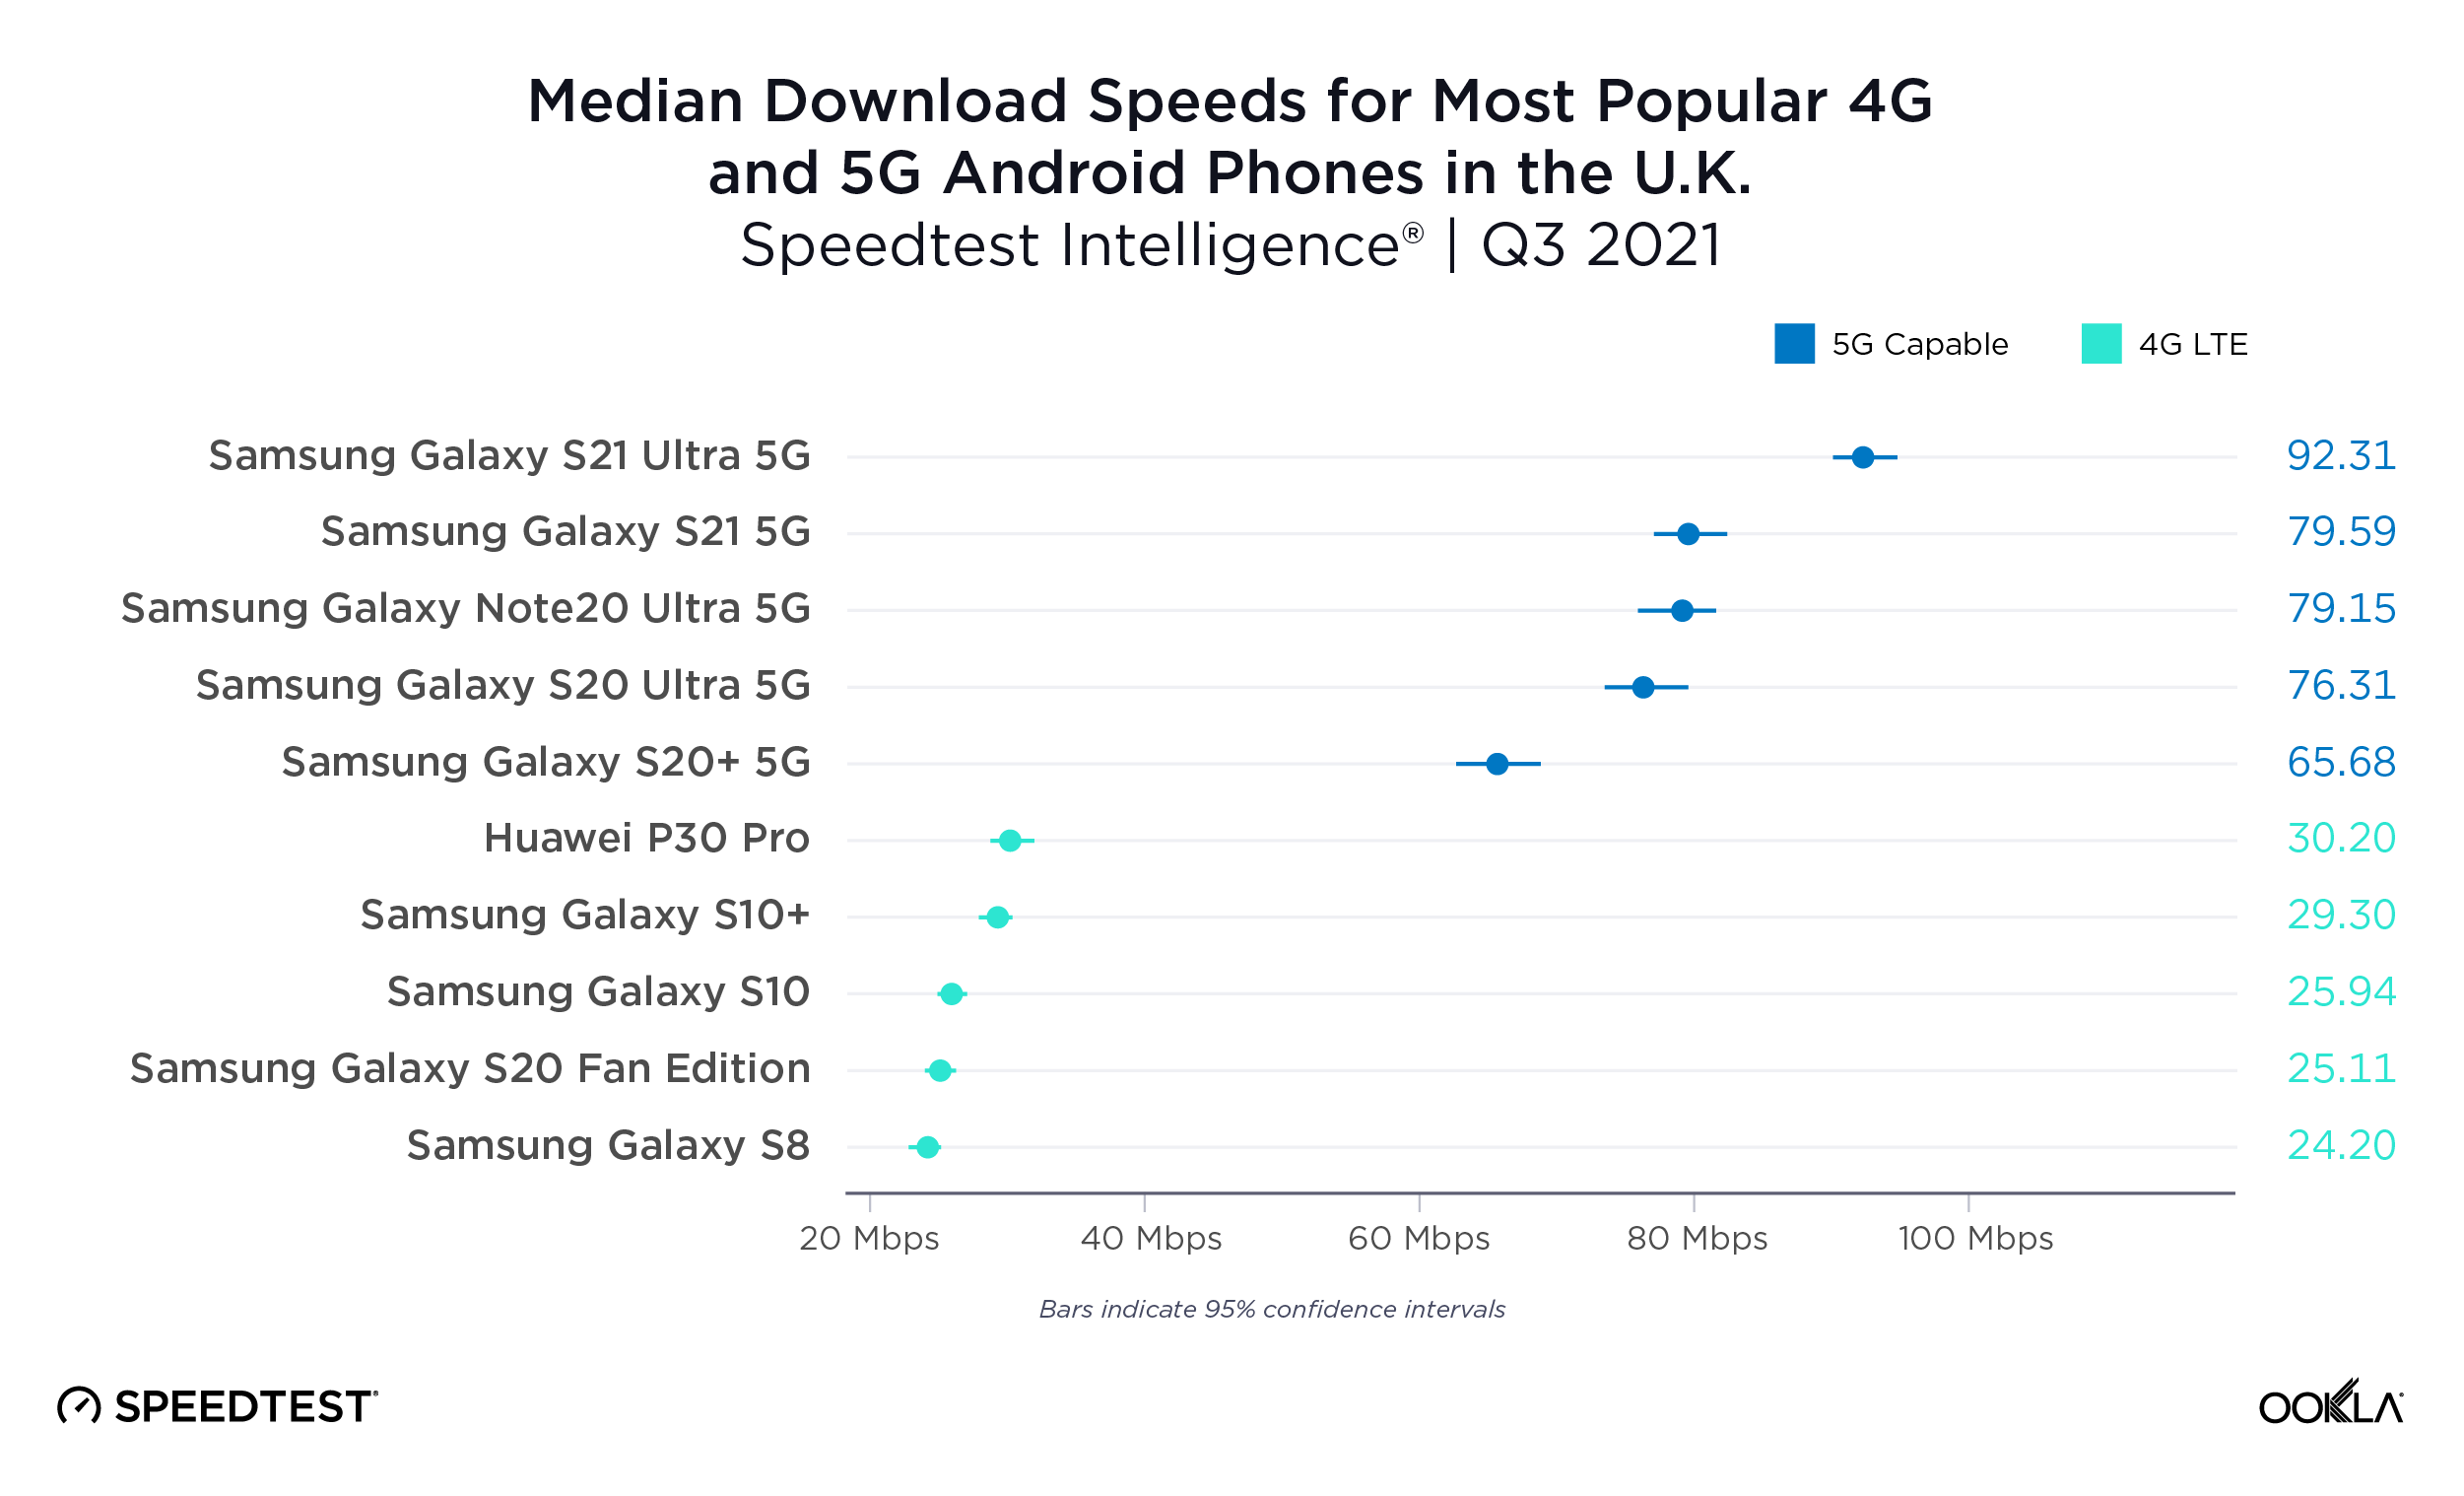
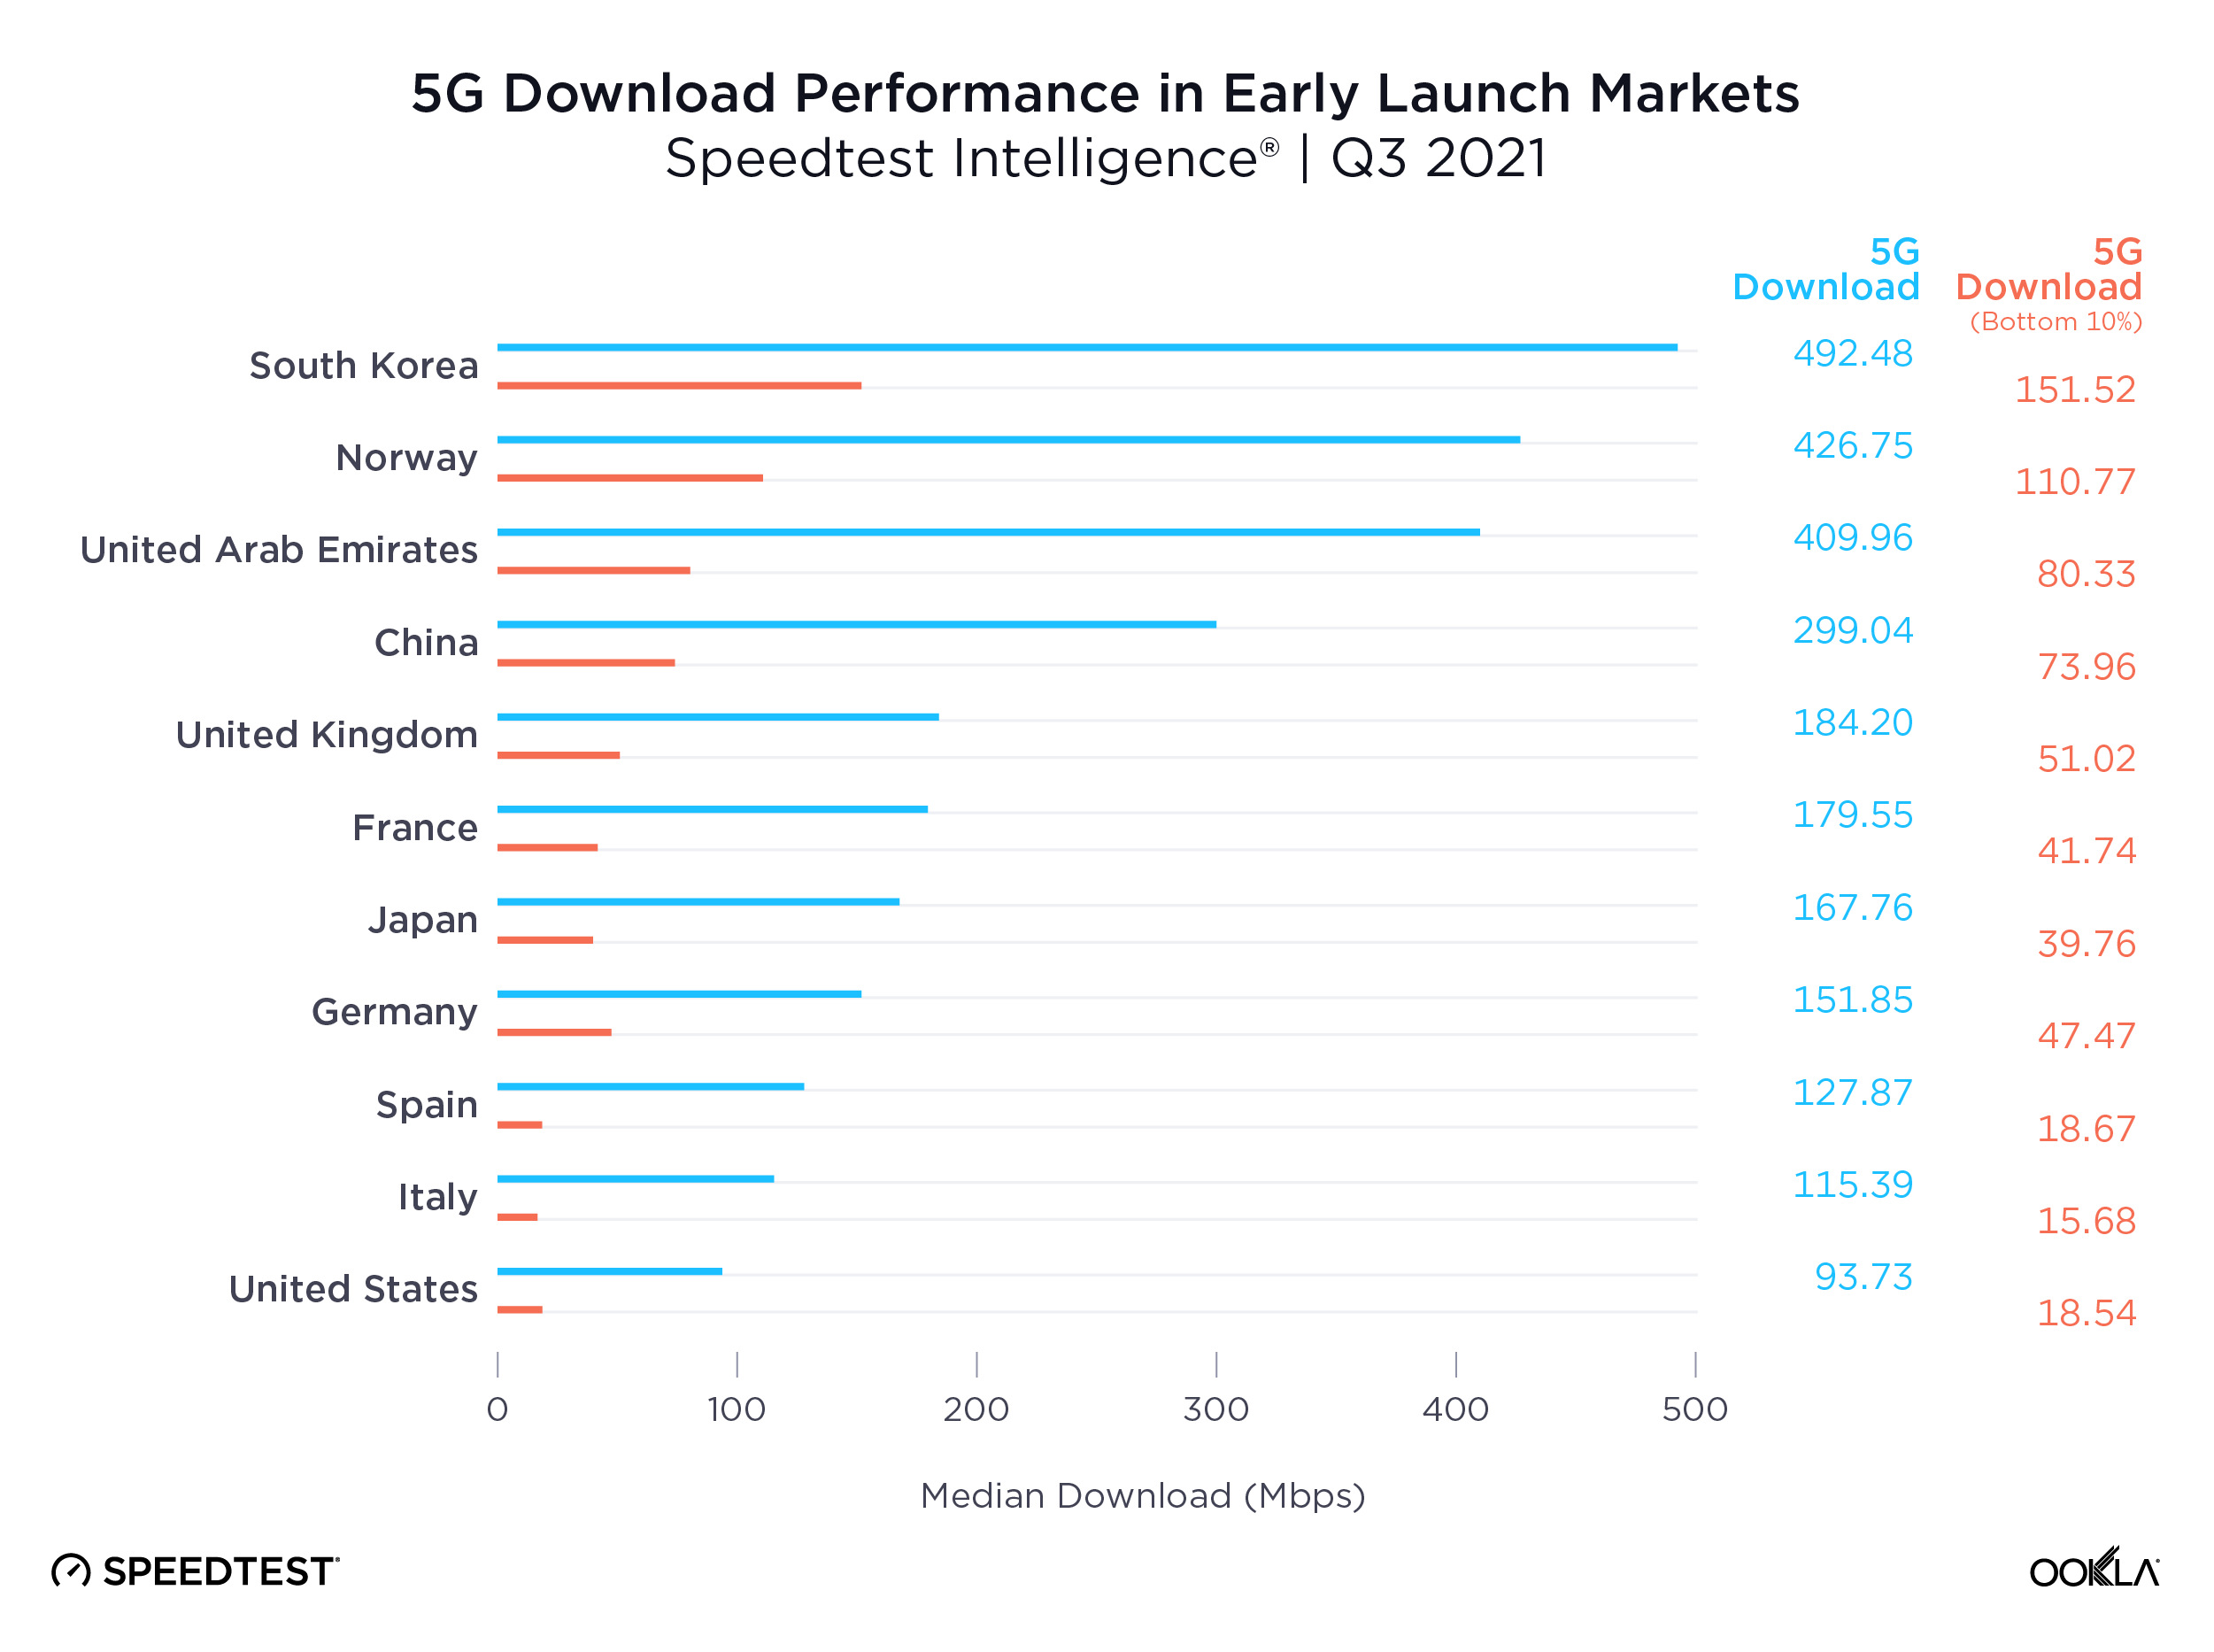
Ookla Speedtest Intelligence data shows a growing disparity in the performance of 5G networks worldwide, even among the pioneer markets who were among the first to launch the new technology. We see leading markets such as South Korea, Norway, the UAE and China pulling well ahead of key European markets, the U.S. and Japan on 5G download speeds, creating what increasingly looks like two tiers of 5G markets.

ookla_5g-download_performance_1221-01

Part of the reason for this divergence is access to key 5G spectrum bands, with Verizon and AT&T in the U.S. for example, soon to deploy their C-band spectrum holdings for 5G use. However, what really seems to separate these markets is the level of 5G network densification. The number of people per 5G base station ranges from 319 in South Korea and 1,531 in China, to 4,224 in the EU and 6,590 in the US, according to the European 5G Observatory’s International Scoreboard during October 2021.

Despite the noise around 6G, 5G still has a long way to run

Median 5G mobile download speeds across these markets are respectable relative to the International Telecommunication Union’s (ITU) IMT-2020 target of 100 Mbps for user experienced download data rates. However, 5G Speedtest® results in each market demonstrate significant variability, with the bottom 10th percentile only recording speeds in excess of the IMT-2020 target in South Korea and Norway, and falling significantly short in many other markets, with Spain, Italy and the U.S. below 20 Mbps.

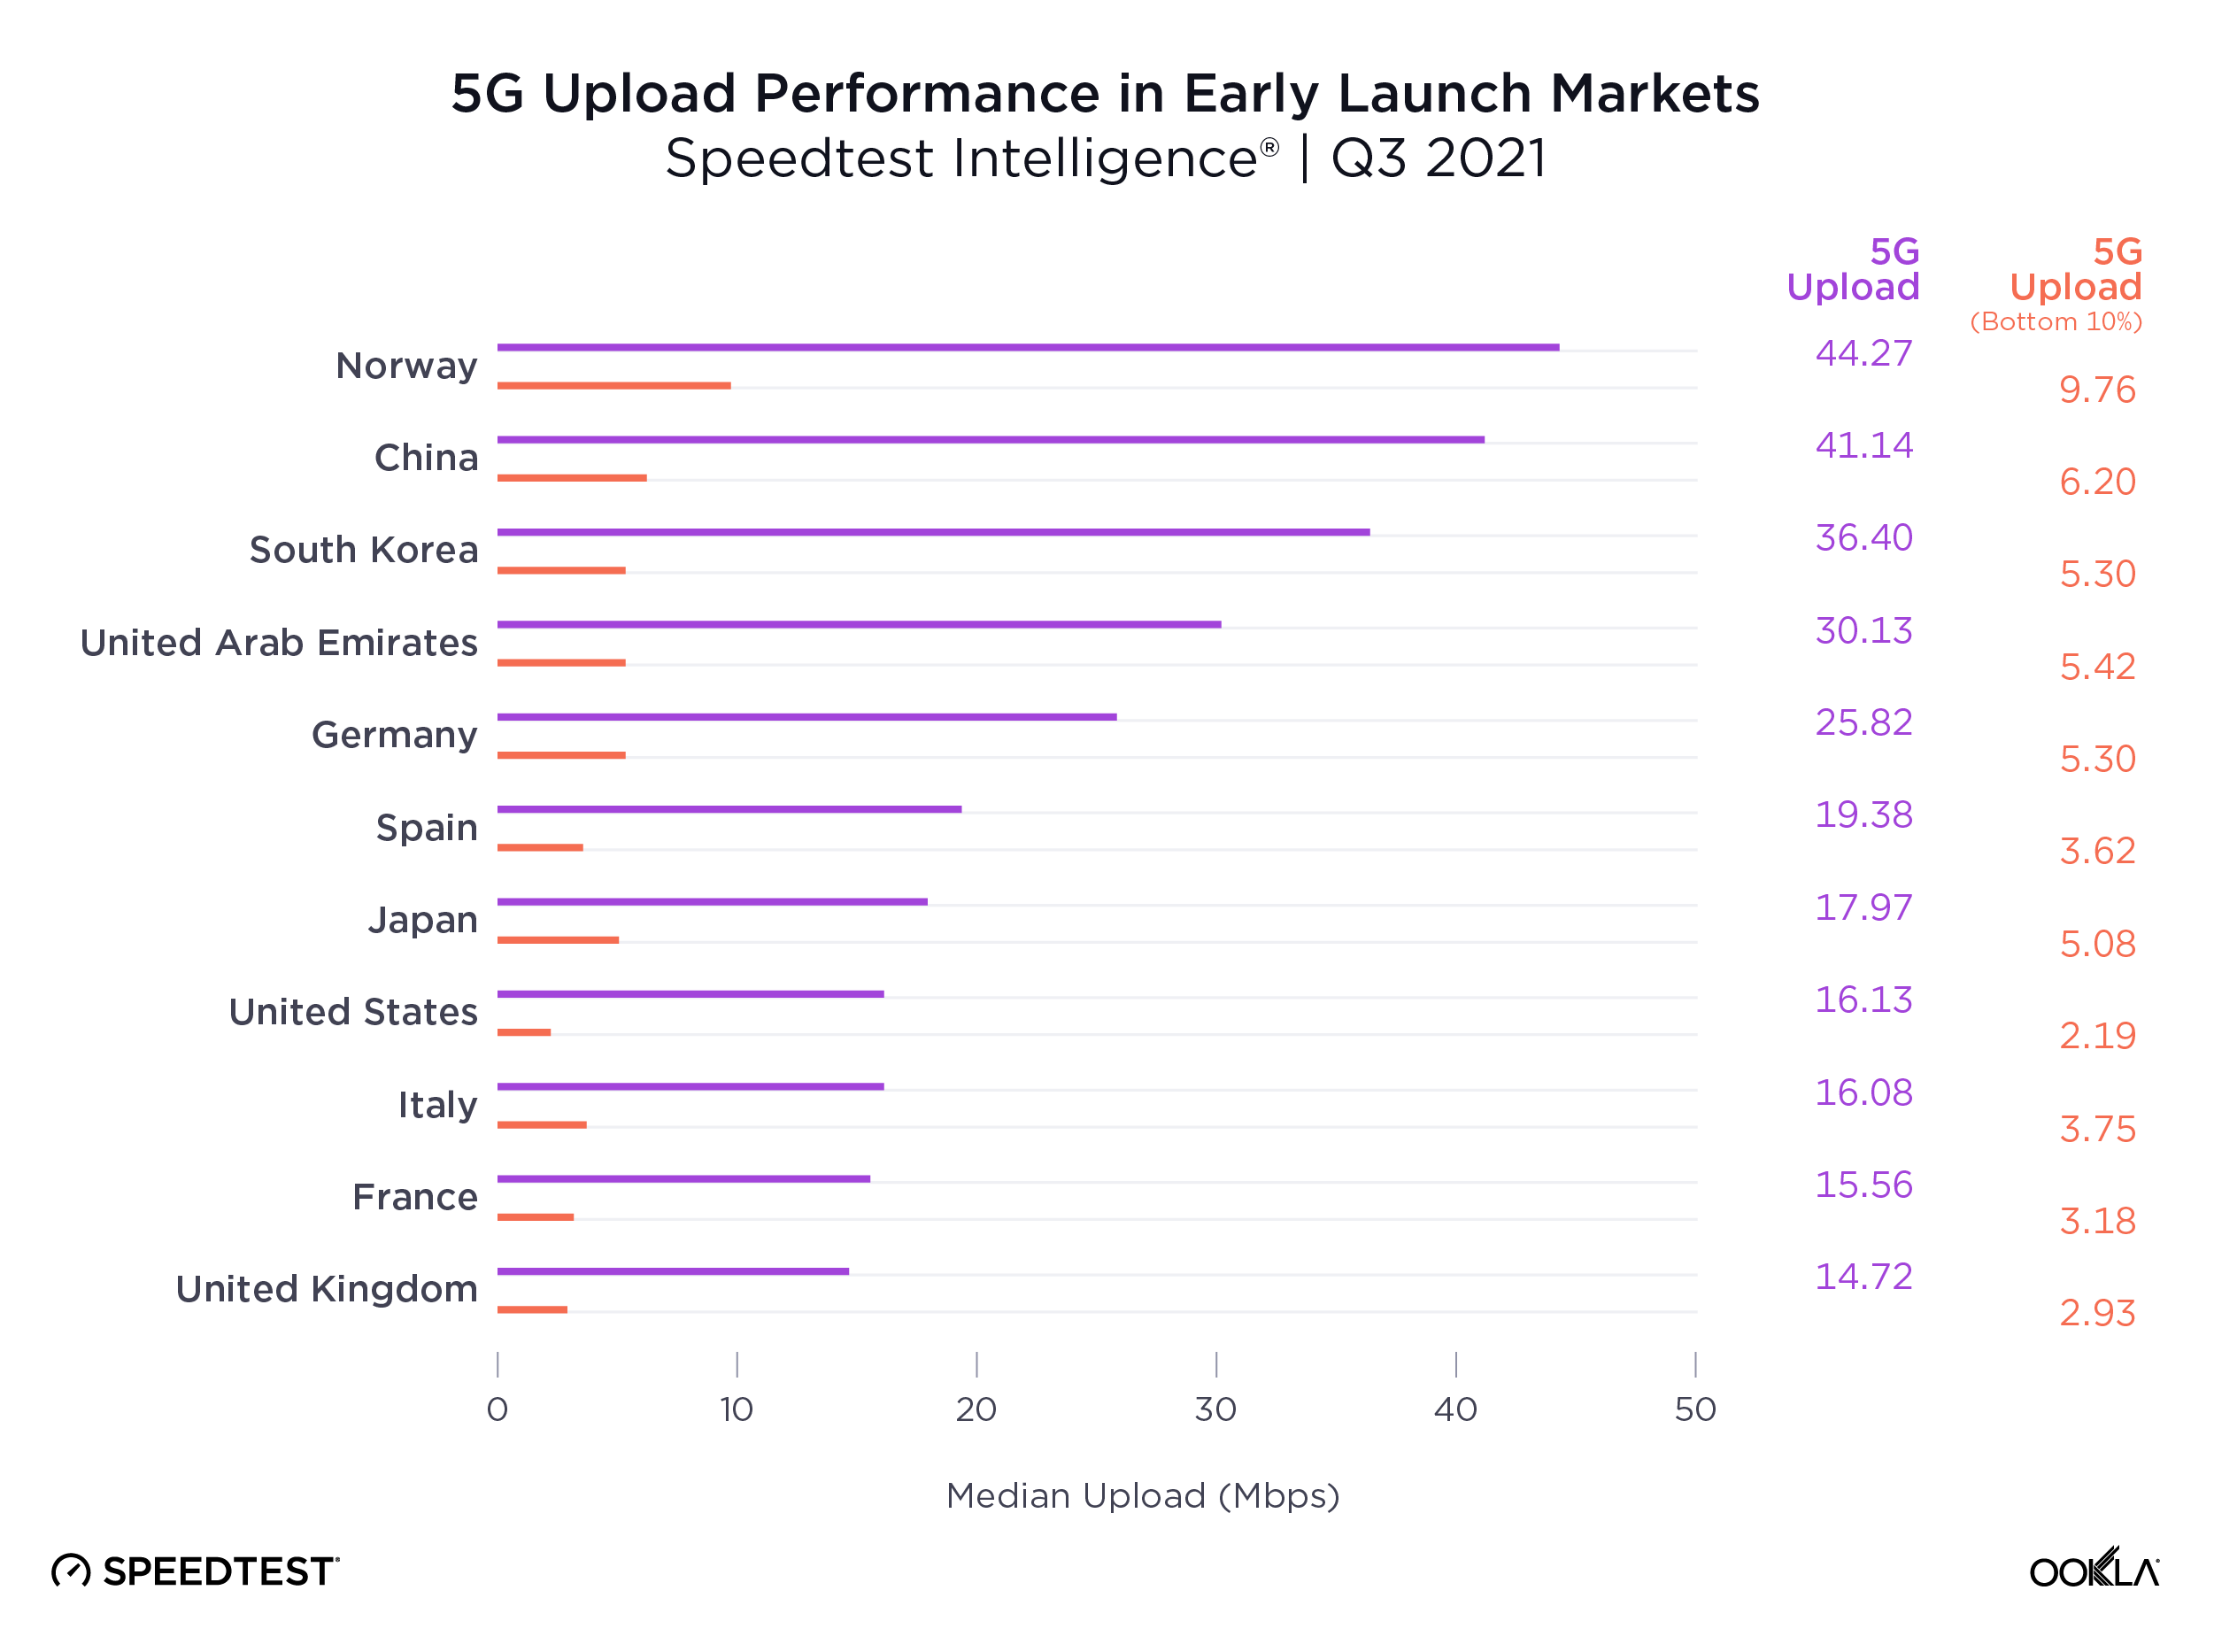
The story gets worse for upload speeds, where no market’s median speed broke the IMT-2020 recommended 50 Mbps, and where the bottom 10th percentile lay in single digits across the board. Operators are clearly prioritizing download speeds over upload, which makes sense given the asymmetric nature of demand, with most consumer applications requiring higher download speeds. However, as operators increasingly look to target the enterprise market with 5G connectivity and consumer demand for services such as video calling and mobile gaming continues to rise, operators will need to boost upload speeds.

ookla_5g-upload_performance_1221-01-1

Demand for mobile internet bandwidth continues to grow, up 43% year-on-year in Q3 2021 according to Ericsson’s latest mobility report. Looking ahead to 2022, operators will need to increase the capacity of their 5G networks to tackle this growing demand while driving network speeds to new heights. We’ve seen the impact the deployment of new spectrum can have on congested networks during 2021, with Reliance Jio witnessing a bump in 4G LTE performance and consumer sentiment following its acquisition of additional spectrum in India.

Where 5G still fails to reach

Speedtest Intelligence showed 70 countries in the world where more than 20% of samples were from 2G and 3G connections (combined) during Q3 2021 and met our statistical threshold to be included. These are mostly countries where 5G is still aspirational for a majority of the population. As excited as we are about the expansion of 5G, we do not want to see these countries left behind. Not only are 2G and 3G decades old, they are only sufficient for basic voice and texting, social media and navigation apps. To deliver rich media experiences or video calling, users need access to 4G or higher. Having so many consumers on 2G and 3G also prevents mobile operators from refarming that spectrum to make 4G and 5G networks more efficient.

Countries That Still Rely Heavily on 2G and 3G Connections
Speedtest IntelligenceⓇ | Q3 2021
Country 2G & 3G Samples
Central African Republic 89.9%
Palestine 84.7%
Yemen 72.4%
Turkmenistan 71.8%
Micronesia 56.3%
Madagascar 55.0%
Belarus 53.2%
Rwanda 51.7%
Kiribati 48.4%
Equatorial Guinea 47.6%
Afghanistan 44.4%
South Sudan 43.4%
Guyana 42.3%
Guinea 37.0%
Angola 36.8%
Cape Verde 35.9%
Tajikistan 35.6%
Zimbabwe 34.7%
Benin 34.4%
Togo 33.8%
Ghana 33.0%
Sierra Leone 31.7%
Antigua and Barbuda 30.2%
Vanuatu 30.1%
Lesotho 30.0%
Syria 29.6%
Moldova 29.4%
Saint Kitts and Nevis 28.9%
Mozambique 28.8%
Sudan 28.4%
Palau 28.3%
Grenada 28.1%
Tanzania 27.6%
Uganda 27.5%
Niger 27.5%
Gabon 27.5%
Haiti 27.4%
Suriname 27.4%
Tonga 27.3%
Liberia 27.0%
Namibia 26.7%
Swaziland 26.5%
The Gambia 26.3%
Saint Vincent and the Grenadines 26.3%
Dominica 26.3%
Somalia 26.1%
Cook Islands 26.0%
Zambia 25.9%
Barbados 25.7%
Armenia 25.5%
Algeria 25.4%
Papua New Guinea 25.2%
Jamaica 24.5%
Venezuela 24.2%
Ethiopia 24.1%
Uzbekistan 24.0%
El Salvador 23.5%
Honduras 23.1%
Nigeria 23.0%
Solomon Islands 22.8%
Caribbean Netherlands 22.7%
Botswana 22.3%
Anguilla 21.7%
Mauritania 20.6%
Saint Lucia 20.5%
Bosnia and Herzegovina 20.3%
Burundi 20.3%
Ecuador 20.2%
Ukraine 20.1%
Trinidad and Tobago 20.0%

We were pleased to see the following countries come off the list from last year, having dropped below the 20% threshold: Azerbaijan, Bangladesh, Belize, Burkina Faso, Cameroon, Costa Rica, Côte d’Ivoire, DR Congo, Iraq, Kenya, Laos, Libya, Maldives, Mali, Mauritius, Mongolia, Nicaragua, Paraguay and Tunisia. While countries like Palestine, Suriname, Ethiopia, Haiti and Antigua and Barbuda are still on this list, they have improved the percentage of their samples on these outmoded technologies when compared to last year (dropping 10-15 points, respectively), 2G and 3G samples in Belarus increased 6.7 points when comparing Q3 2021 to Q3 2020.

We’re excited to see how performance levels will normalize as 5G expands to more and more countries and access improves. Keep track of how well your country is performing on Ookla’s Speedtest Global Index.

Ookla retains ownership of this article including all of the intellectual property rights, data, content graphs and analysis. This article may not be quoted, reproduced, distributed or published for any commercial purpose without prior consent. Members of the press and others using the findings in this article for non-commercial purposes are welcome to publicly share and link to report information with attribution to Ookla.

| December 20, 2021

Starlink Expands but Q3 2021 Performance Flattens in Some Areas


Satellite internet is making headlines across the globe as Starlink continues to launch service in new countries and Viasat plans to acquire Inmarsat. We’re here to check in on our ongoing series on satellite internet performance around the globe with fresh data from Q3 2021 to see if Starlink’s performance is holding up and how satellite internet compares to fixed broadband in 12 countries.

United States: Starlink fastest, speeds decreasing

Consumers in the U.S. looking to use satellite service to connect to the internet will find that performance was mostly flat when comparing Q3 2021 to Q2 2021. Starlink’s median download speed decreased from 97.23 Mbps during Q2 2021 to 87.25 Mbps in Q3 2021, which could be a function of adding more customers. HughesNet followed distantly at 19.30 Mbps (comparable to the 19.73 Mbps we saw in Q2 2021) and Viasat third at 18.75 Mbps (18.13 Mbps in Q2 2021). For comparison, the median download speed for all fixed broadband providers in the U.S. during Q3 2021 was 119.84 Mbps (115.22 Mbps in Q2 2021).

ookla_satellite-performance_us_1221-01-1

Starlink’s median upload speed of 13.54 Mbps (down from 13.89 Mbps in Q2 2021) was much closer to that on all fixed broadband (18.03 Mbps in Q3 2021 and 17.18 Mbps in Q2 2021). Viasat and HughesNet followed at 2.96 Mbps (3.38 Mbps in Q2 2021) and 2.54 Mbps (2.43 Mbps in Q2 2021), respectively.
As we saw last quarter, Starlink, which uses low earth orbit (LEO) satellites, was the only satellite internet provider with a median latency anywhere near that seen on fixed broadband in Q3 2021 (44 ms and 15 ms, respectively). Viasat and HughesNet, which both utilize higher “geosynchronous” orbits, had median latencies of 629 ms and 744 ms, respectively.

Starlink performance varies at the county level

We saw sufficient samples during Q3 2021 to analyze Starlink performance in 304 counties in the U.S. While there was about a 100 Mbps range in performance between the county with the fastest median download speed (Santa Fe County, New Mexico at 146.58 Mbps) and the county with the slowest median download speed (Drummond Township, Michigan at 46.63 Mbps), even the lower-end speeds are well above the FCC’s Baseline performance tier of at least a 25 Mbps download speed.

ookla_united_states_median_download_starlink_map_1221g-01-1

Satellite internet performance elsewhere in the world

We examined satellite internet performance in countries with an established market share to see how well their speeds compare to local fixed broadband. We’re excited to add analysis on satellite performance in Australia and Belgium this quarter.

Australia: Starlink outperformed Viasat and fixed broadband average

Starlink radically outperformed Viasat in Australia during Q3 2021 with a median download speed of 138.12 Mbps to Viasat’s 15.60 Mbps. Starlink also outpaced Viasat for median upload speed at 22.63 Mbps and 1.04 Mbps, respectively. Compared to the median download speed over all fixed broadband of 51.17 Mbps, Starlink could be an attractive alternative to traditional fixed broadband on all levels except latency where Starlink showed 42 ms vs. 10 ms for all fixed broadband combined.

ookla_satellite-performance_au_1221-01-1

Belgium: Starlink dramatically faster than fixed broadband

Starlink’s median download speed of 127.46 Mbps during Q3 2021 was dramatically faster than the country’s median download for all fixed broadband of 72.90 Mbps. At 16.73 Mbps, Starlink’s median upload speed was only slightly slower than the overall median of 17.98 Mbps. However, Starlink’s 49 ms latency was higher than the country’s average of 13 ms. Starlink was the only satellite internet provider with adequate samples to analyze in Belgium during Q3 2021.

ookla_satellite-performance_be_1221-01

Brazil: Viasat close to national average

Viasat’s median download speed in Brazil improved to 66.32 Mbps during Q3 2021 (up from 60.30 Mbps in Q2 2021. This was close to the national median for fixed broadband of 71.50 Mbps. Viasat’s median upload speed (1.06 Mbps) was much slower, however, than that on fixed broadband (36.37 Mbps), and Viasat’s latency was much higher (615 ms vs 6 ms).

ookla_satellite-performance_br_1221-01-1

Canada: Starlink performance relatively flat

Our previous article showed that Starlink’s median download speed exceeded that of fixed broadband in Canada during Q2 2021 (86.92 Mbps vs. 84.24 Mbps). In Q3 2021, Starlink’s median download speed decreased slightly to 84.55 Mbps while that over all fixed broadband increased to 90.67 Mbps. This is in line with what we expect to see on new technologies as additional users are added to a system. Starlink’s median upload speed was slower than fixed broadband (13.87 Mbps vs. 20.67 Mbps). Latency on Starlink was much higher (56 ms vs. 12 ms). Starlink is still a viable alternative to fixed broadband in Canada, especially for consumers without access to other options.

ookla_satellite-performance_ca_1221-01-1

Starlink faster than overall fixed broadband in 5 provinces

Starlink showed enough samples to analyze performance in nine out of 10 provinces in Canada during Q3 2021. Starlink’s Q3 2021 median download speed was faster than the median for all fixed broadband in five provinces: Manitoba (81.04 Mbps vs. 65.91 Mbps), Nova Scotia (109.60 Mbps vs. 99.82 Mbps), Prince Edward Island (118.02 Mbps vs. 46.86 Mbps), Quebec (92.59 Mbps vs. 72.07 Mbps) and Saskatchewan (97.67 Mbps vs. 57.59 Mbps). Download speeds were comparable between Starlink and overall fixed broadband in New Brunswick (104.56 Mbps vs. 104.28 Mbps), and overall fixed broadband was faster than Starlink in Alberta (92.65 Mbps vs. 82.48 Mbps), British Columbia (111.36 Mbps vs. 87.34 Mbps) and Ontario (86.26 Mbps vs. 79.54 Mbps).

ookla_canada_median_download_starlink_map_1221g-01

Chile: HughesNet slower than fixed broadband average

HughesNet was hard pressed to compete with Chile’s fixed broadband, which ranked fourth in the world during October 2021. HughesNet showed a 15.21 Mbps median download speed compared during Q3 2021 with the country’s fixed broadband average of 133.81 Mbps during the same period. Median upload speeds also showed a wide gap (3.50 Mbps for HughesNet to 62.18 Mbps on fixed broadband), and HughesNet’s latency was very high (626 ms vs. 8 ms).

ookla_satellite-performance_cl_1221-01-1

Colombia: HughesNet slow but improving

HughesNet’s median download speed increased in Q3 2021 to 12.12 Mbps (up from 9.28 Mbps during Q2 2021), compared with Colombia’s 46.08 Mbps for fixed broadband overall (35.90 Mbps in Q2 2021). Median upload speed was also slower using the satellite internet provider (3.05 Mbps) than fixed broadband (10.50 Mbps), and latency was much higher on satellite (753 ms vs. 15 ms).

ookla_satellite-performance_co_1221-01-1

France: Starlink speeds decreasing, remains faster than fixed broadband average

Starlink users in France saw a median download speed of 102.15 Mbps in Q3 2021 (down from 139.39 Mbps in Q2 2021, likely due to increased usage). Starlink’s download speed easily beat the country-wide median for fixed broadband of 75.47 Mbps (up from 70.81 Mbps in Q2 2021). Starlink’s upload speed during Q3 2021 was slower than the fixed broadband median (19.84 Mbps vs. 56.66 Mbps), and Starlink’s latency was higher (54 ms vs. 13 ms).

ookla_satellite-performance_fr_1221-01

Germany: Starlink faster than country average for fixed broadband

Starlink’s median download speed in Germany of 95.40 Mbps was much faster than the country median of 60.99 Mbps during Q3 2021. Starlink was slightly slower for upload speed than overall fixed broadband (17.63 Mbps vs. 21.05 Mbps) and Starlink showed a higher latency (45 ms vs. 15 ms).

ookla_satellite-performance_de_1221-01-1

Mexico: Viasat faster than HughesNet for downloads

Viasat, with a median download speed of 14.94 Mbps during Q3 2021 (up from 13.95 Mbps in Q2 2021), was faster than HughesNet (10.64 Mbps in Q3 2021, down from 11.92 Mbps in Q2 2021) but slower than the country’s median for fixed broadband (33.14 Mbps in Q3 2021, 29.99 Mbps in Q2 2021). HughesNet was slightly faster than Viasat for upload speed during Q3 2021 (3.21 Mbps vs. 2.03 Mbps). While Viasat’s latency was high (675 ms vs 12 ms for fixed broadband), it was lower than HughesNet’s (748 ms).

ookla_satellite-performance_mx_1221-01-1

New Zealand: Starlink slowed slightly, remained faster than fixed broadband average

Starlink’s Q3 2021 median download speed (120.10 Mbps, down from 127.02 Mbps in Q2 2021, likely due to increased usage) was much faster than New Zealand’s median fixed broadband download speed (84.98 in Q3 2021 up from 78.85 Mbps in Q2 2021). Starlink was slower than New Zealand’s overall fixed broadband for Q3 2021 upload speed (16.87 Mbps vs. 23.62 Mbps). While Starlink’s median latency improved from 101 ms in Q2 2021 to 81 ms in Q3 2021, it was still slower than New Zealand’s median for all fixed broadband of 7 ms during Q3 2021.

ookla_satellite-performance_nz_1221-01-1

United Kingdom: Starlink nearly twice as fast as fixed broadband average

Starlink showed a much faster median download speed in the U.K. during Q3 2021 (111.66 Mbps, up from 108.30 Mbps in Q2 2021) than the country’s median for fixed broadband (53.16 Mbps in Q3 2021, up from 50.14 Mbps in Q2 2021). Starlink’s upload speed was comparable to the median for all fixed broadband in the U.K. (16.02 Mbps vs. 15.77 Mbps), and the latency was pretty good, given the distance traveled (37 ms vs. 15 ms).

ookla_satellite-performance_uk_1221-01-1

We look forward to updating this data again next quarter with new locations as satellite internet continues to become a more viable option for many. If you’re using satellite internet, take a Speedtest to help us provide an accurate picture of real-world performance.

Ookla retains ownership of this article including all of the intellectual property rights, data, content graphs and analysis. This article may not be quoted, reproduced, distributed or published for any commercial purpose without prior consent. Members of the press and others using the findings in this article for non-commercial purposes are welcome to publicly share and link to report information with attribution to Ookla.

| December 14, 2021

Find Out if 5G is Worth the Upgrade: A Multi-Country Analysis

The holidays are nearly here and with them the desire to treat yourself or a loved one to an upgraded phone, just because. The first question you’re likely to ask yourself as you browse new models is “To 5G or not to 5G?” Once you check the Ookla 5G Map to see if your operator has deployed 5G in your area, you’ll probably want to know if the 5G speeds are worth the extra cost. We’ve analyzed Speedtest Intelligence® data from the most popular Android and iPhone devices around the world during Q3 2021 to help you see if it’s worth the upgrade. Click a country from the list to jump down to the related analysis.

Australia | Bahrain | Canada | China
France | Japan | Saudi Arabia | South Africa
South Korea | United Arab Emirates | United Kingdom | United States
Our analysis includes data on the five 4G Android devices in each country with the largest number of results during Q3 2021 as well as the five most popular 5G-capable Android devices. We have also compared the iPhone 13 to the iPhone 11. Even the fastest device can only perform at the level of the network it’s on. For that reason, speeds for the same device vary widely from country to country in the data below. Remember that speeds can also vary within a country and the performance you see will depend on the infrastructure in your area.

Australia

5G Samsung devices more than twice as fast as most popular 4G devices in Australia

Although only a year separates the release of the Samsung Galaxy S10 series and the S20 series devices, the latter were definitely faster in Australia during Q3 2021. Even the slowest 5G-capable device on this list, the Galaxy S20+ 5G was much faster than the fastest 4G phone, the Galaxy S10+.

ookla_android_performance_australia_1121-01

iPhone 13 wallops iPhone 11 for speed in Australia

Australians who recently upgraded their iPhone 11 for an iPhone 13 would have seen a more than 4X increase in median download speed during Q3 2021. If speed is your number one concern, this upgrade is necessary.

ookla_iphone_performance_australia_1121-01

Bahrain

5G Samsung variants live up to the hype in Bahrain

Fewer 5G-capable phones made our list in Bahrain during Q3 2021 due to sample counts, but those that did roundly outperformed the most popular 4G devices. The median download speed of 5G-capable devices on this list was more than two times faster than the median for 4G devices on this list.

ookla_android_performance_bahrain_1121-01

iPhone 12 85% faster than iPhone 11 in Bahrain

There weren’t sufficient samples to analyze performance of the brand new iPhone 13 in Bahrain during Q3 2021, but median download speed on the iPhone 12 was 85.0% faster than that on the iPhone 11.

ookla_iphone_performance_bahrain_1121-01

Canada

Not all 5G Android devices offer a massive improvement in Canada

Q3 2021 data from Canada shows that 5G isn’t the only way to get a fast connection. While the fastest 5G-capable device among the top five most popular (the Samsung Galaxy S21 Ultra 5G) offered very fast median download speeds, two 4G devices (the Note10+ and the S10+) were nearly as fast as the slowest 5G-capable device on this list (the S20 Fan Edition 5G). To upgrade or not is definitely a question here of which device you are upgrading from and which you plan to upgrade to.

ookla_android_performance_canada_1121-01

iPhone 13 more than three times as fast as the iPhone 11 in Canada

Canadians looking for fast mobile performance on Apple devices will enjoy an upgrade to the iPhone 13 whose median download speed in Q3 2021 was more than three times as fast as that on the iPhone 11.

ookla_iphone_performance_canada_1121-01

China

5G offers major advantages on Android in China

There is no question as to whether consumers with one of the five most popular 4G Android devices would see faster speeds with one of the five most popular 5G Android devices. The 4G devices on this list saw median download speeds in the 22.00 to 34.00 Mbps range during Q3 2021 while the 5G-capable devices showed median download speeds between 155.87 Mbps (Xiaomi Mi 10 5G) and 280.22 Mbps (Huawei Mate 40 Pro 5G).

ookla_android_performance_china_1121-01

iPhone 13 more than ten times faster than iPhone 11 in China

China was home to the largest performance increase when comparing the iPhone 11 to the iPhone 13. Median download speed on the iPhone 13 was more than ten times faster during Q3 2021 than on the iPhone 11. Some of this difference may reflect market conditions where users in more rural areas have older phones and poorer infrastructure, but it’s still an impressive difference.

ookla_iphone_performance_china_1121-01

France

French 5G offers a decent speed boost on Android

The most popular 4G devices in France showed median download speeds between 37.67 Mbps (Samsung Galaxy S8) and 51.36 Mbps (S20 Fan Edition) during Q3 2021. These were easily topped by the 5G-capable devices which showed median download speeds of 73.73 Mbps (Xiaomi Mi 10T Pro 5G) to 92.10 Mbps (Xiaomi Mi 11 5G).

ookla_android_performance_france_1121-01

iPhone 13 more than three times faster than iPhone 11 in France

French consumers who upgraded from the iPhone 11 to the iPhone 13 during Q3 2021 would have tripled their median download speed potential on the 5G-capable iPhone 13.

ookla_iphone_performance_france_1121-01

Japan

Android 5G devices are faster in Japan, but not always fast

The most popular 4G devices in Japan during Q3 2021 were much slower than the most popular 5G-capable devices. Speedtest Intelligence showed median download speeds on 4G devices ranging from 19.75 Mbps (Xiaomi Redmi Note 9S) to 26.57 Mbps (Oppo Reno A). Even the slowest 5G-capable device on this list, the Xiaomi Mi 11 Lite 5G at 43.63 Mbps, was 56% faster than the fastest 4G devices. However, the fastest 5G-capable device on this list, the Sony Xperia 1 II 5G, was twice as fast as that at 94.85 Mbps.

ookla_android_performance_japan_1121-01

iPhone 13 more than twice as fast as iPhone 11 in Japan

In Japan, the median download speed of the iPhone 13 was more than twice as fast as that over the iPhone 11 during Q3 2021. This was one of the smallest differences in performance between the iPhone 11 and 13 that we saw in our analysis.

ookla_iphone_performance_japan_1121-01

Saudi Arabia

5G Android devices are much faster than 4G in Saudi Arabia

Median download speeds on the most popular 5G-capable devices were fast in Saudi Arabia compared to most other markets. 5G-capable speeds ranged from 174.43 Mbps for the Samsung Galaxy S20 Ultra 5G to 261.21 Mbps for the S21 Ultra 5G. 5G is definitely worth the upgrade in Saudi Arabia.

ookla_android_performance_saudi-arabia_1121-2-01

iPhone 13 was more than five times faster than the iPhone 11 in Saudi Arabia

Not only did Saudi Arabia show the second fastest median download speed over iPhone 13 during Q3 2021, the iPhone 13 was also more than five times faster than the iPhone 11.

ookla_iphone_performance_saudi-arabia_1121-01

South Africa

5G shows a small improvement over 4G on Android in South Africa

The most popular 4G devices in South Africa showed a wide range of median download speeds during Q3 2021, from 18.00 Mbps (Huawei P20 Lite) to 40.69 Mbps (Samsung Galaxy Note10+). South Africa’s median download speeds on the most popular 5G devices were among the lowest we saw, from 43.09 Mbps on the Samsung Galaxy Note20 5G to 67.09 Mbps on the S21 Ultra 5G.

ookla_android_performance_south-africa_1121-01

iPhone 12 was almost twice as fast as the iPhone 11 in South Africa

There weren’t sufficient samples in South Africa to analyze the iPhone 13, so we compared the iPhone 12 to the iPhone 11. The median download speed on the iPhone 12 was almost twice as fast as that on the iPhone 11 during Q3 2021.

ookla_iphone_performance_south-africa_1121-01

South Korea

4G Android devices in South Korea are fast, 5G even faster

The median download speeds we saw on the most popular 4G devices in South Korea during Q3 2021 rivaled the 5G speeds in South Africa with speeds ranging from 53.74 Mbps on the Samsung Galaxy Note8 to 60.41 Mbps on the S9+. However, median performance on 5G-capable devices was even faster. There was a wide variety in speeds among the most popular 5G-capable with the S10 5G showing a median download speed of 102.61 Mbps and the S21 Ultra 5G coming in at 221.18 Mbps. 5G is worth the upgrade in South Korea and consumers have a variety of high-performing devices to choose from.

ookla_android_performance_south-korea_1121-01

iPhone 12 more than three times faster than iPhone 11 in South Korea

South Korea did not have enough samples from the new iPhone 13, so we compared the iPhone 12 to the iPhone 11. Not only was the iPhone 12 more than three times faster for median download speed than the iPhone 11 during Q3 2021, South Korea’s iPhone 12 download speed beat iPhone 13 download speed in five of the countries we analyzed: Canada, France, Japan, U.K. and the U.S.

ookla_iphone_performance_south-korea_1121-01

United Arab Emirates

U.A.E. had the fastest speeds on Android 5G devices

While the median download speeds across 4G devices in the U.A.E. during Q3 2021 handily beat those of all the other countries in this analysis, the country’s 5G download speeds were even faster. We can see from this data that some of the 4G devices can perform much better when on a faster network. Even the slowest 4G device on this list, the Huawei P30 Pro, had a median download speed of 68.26 Mbps in U.A.E. compared to 30.20 Mbps in the U.K. on the same device.

ookla_android_performance_uae_1121-2-01-1

A similar story can be told for 5G devices where the U.A.E. was competing only with Saudi Arabia and South Korea for the fastest median performance on devices listed during Q3 2021. The Samsung Galaxy S21 5G showed a median download speed of 285.39 Mbps in the U.A.E. compared to 215.10 Mbps in South Korea while the Galaxy S21 Ultra 5G showed a median download speed of 269.09 Mbps in the U.A.E. and 261.21 Mbps in Saudi Arabia.

iPhone 13 more than four times faster than iPhone 11 in U.A.E.

Not only did the U.A.E. have the fastest median download speed over iPhone 13 that we saw in this analysis, the 485.59 Mbps download speed was faster than any phone in any country that we analyzed in Q3 2021. The iPhone 13 capitalized on fast 5G in the U.A.E. to have a median download speed that was more than four times faster than that of the iPhone 11.

ookla_iphone_performance_uae_1121-01

United Kingdom

5G represents a solid improvement over 4G on Android devices in the U.K.

Consumers upgrading from one of the most popular 4G devices in the United Kingdom to one of the most popular 5G-capable devices would have seen a 2-3X increase in median download speed during Q3 2021. This is in part because the 4G devices on this list were slower in the U.K. than elsewhere in the world during Q3 2021 as 4G speeds have stagnated in the U.K. For example, the Samsung Galaxy S8 showed a median download speed of 24.20 Mbps in the U.K., 37.67 Mbps in France and 46.31 Mbps in Canada. All five of the 5G-capable devices that we analyzed in both the U.S. and the U.K. were faster in the U.K. during Q3 2021.

ookla_android_performance_uk_1121-01

iPhone 13 more than five times faster than the iPhone 11 in the U.K.

Our analysis of Speedtest Intelligence data from Q3 2021 showed that the iPhone 13 had a median download speed that was more than five times faster than that on the iPhone 11. This makes the iPhone 13 very much worth the upgrade if speed is your main concern.

ookla_iphone_performance_uk_1121-01

United States

5G Android devices were twice as fast as 4G in the U.S.

The most popular 4G devices in the U.S. were about half as fast for median download speed as the most popular 5G-capable devices during Q3 2021. The Samsung Galaxy S21 Ultra 5G showed the highest median download speed among these devices at 69.78 Mbps, compared to the fastest 4G device surveyed, the Note10+ at 35.98 Mbps. That said, 5G-capable devices in the U.S. underperformed when compared to other countries, except Japan and South Africa.

ookla_android_performance_us_1121-01

iPhone 13 nearly three times as fast as the iPhone 11 in the U.S.

Data from Speedtest Intelligence reveals that median download speed on the iPhone 13 was nearly three times as fast as that on the iPhone 11 in the U.S. during Q3 2021.

ookla_iphone_performance_us_1121-01

Our analysis shows that increased speed is one of the benefits of upgrading your 4G phone to a 5G-capable one, regardless of where you live but not all countries see the same speed increases. Customers in Saudi Arabia, the U.A.E, China and South Korea will see especially good performance if upgrading an Android phone. The U.A.E., Saudi Arabia, China and Australia have especially good speeds on the iPhone 13. Whatever choice you make for your next phone, take a Speedtest® on Android or iOS to make sure your mobile operator is delivering the speeds you want to see.

Ookla retains ownership of this article including all of the intellectual property rights, data, content graphs and analysis. This article may not be quoted, reproduced, distributed or published for any commercial purpose without prior consent. Members of the press and others using the findings in this article for non-commercial purposes are welcome to publicly share and link to report information with attribution to Ookla.

| October 4, 2021

Massive Facebook, Instagram and WhatsApp Outage Happening Now


Facebook is currently experiencing a rarely seen global outage that is taking out Facebook, Instagram, WhatsApp and Facebook Messenger.

3:30 p.m. PDT — The outage appears to be resolved

As of 3:30 p.m. PDT, Facebook is back up and user reports to Downdetector are declining. This is how Luke Deryckx, CTO of Ookla®, summed up today’s events:

The global Facebook outage is now one of the largest ever tracked on Downdetector® in terms of the total number of reports (over 14 million as of 3:30 p.m. PDT) and duration; this is an extremely impactful event.

The combined popularity of Facebook, Instagram, WhatsApp and Facebook Messenger means that billions of users have been impacted by the services being entirely offline today. But the scope of the impact extends far beyond direct users of these services.

Many people may not realize the reach of Facebook’s services into other seemingly unrelated applications. Facebook operates one of the largest advertising networks in the world, used by countless websites and mobile applications. Facebook also provides a method to authenticate (log in) for users of many internet applications. Any service that relies on Facebook for any part of its infrastructure will have experienced problems today to a varying degree.

The cascading impact of an outage to a core service like this can be confusing for people experiencing problems with a service seemingly completely unrelated to Facebook. When Facebook goes down, it’s a bad day on the internet, and today is particularly stormy.

We make a point to highlight the most widespread outages on Downdetector with a banner at the top of the page to inform our users where the true source of the outage likely lies.

downdetector-banner-facebook-outage

1:00 p.m. PDT — A global view of the outage

The Facebook outage continues and has become the largest outage we’ve ever seen on Downdetector with over 10.6 million problem reports from all over the globe. The U.S. had the most reports at over 1.7 million followed by Germany (1.3 million), the Netherlands (915,000), the United Kingdom (789,000) and Italy (400,000).

Downdetector_affected-countries_1021-01

We are also seeing an increase in reports across many other online sites and services as the Facebook outage causes cascading impacts. Expect a turbulent day on the internet.

10:00 a.m. PDT — Facebook outage extends across all the company’s apps

No word yet from Facebook on what caused the outage, but as of 9:30 a.m. PDT, we saw over 5.6 million reports about issues with the company’s services from around the world on Downdetector. The reports started rolling in around 8:15 a.m. PDT and are continuing.

In the U.S. alone there were upwards of 123,000 problem reports for Facebook, 98,000 for Instagram, 34,000 for WhatsApp and 9,800 for Facebook Messenger. Most users are reporting troubles with the website and apps overall.

Downdetector_facebook_1021-01-1

Downdetector_instagram_1021-01-1

Downdetector_whatsapp_1021-01-1

Downdetector_facebook_messenger_1021-01-1

This outage is still very much ongoing. Turn to the Downdetector pages for Facebook, Instagram, WhatsApp and Facebook Messenger for up to the minute updates.

Editor’s note: This article changed form on October 4 to include a timetable of updates. The content itself was unchanged.

Ookla retains ownership of this article including all of the intellectual property rights, data, content graphs and analysis. This article may not be quoted, reproduced, distributed or published for any commercial purpose without prior consent. Members of the press and others using the findings in this article for non-commercial purposes are welcome to publicly share and link to report information with attribution to Ookla.

| September 8, 2021

Despite All Odds, Global Internet Speeds Continue Impressive Increase


“A lot has changed” we wrote in our 2019 global roundup of internet speeds based on the Speedtest Global Index. Little did we know how much was about to change. But two things remain the same: the internet is getting faster and the Speedtest Global Index is still a fantastic resource for tracking improvements on a global and country level (if we do say so ourselves). Today we’re taking a look back at how much internet speeds have increased over the past four years and which countries have seen some of the largest gains.

Mobile download speed jumped 59.5% over the last year globally, fixed broadband up 31.9%

The global mean of download speeds improved over the last 12 months on both mobile and fixed broadband to 55.07 Mbps and 107.50 Mbps, respectively, in July 2021. Mobile saw an increase of 59.5% when comparing July 2020 to July 2021 and fixed broadband saw an increase of 31.9%, according to the Speedtest Global Index.

ookla_global-index_world-speeds_0921-1

Looking further back, mean download speed over mobile was 98.9% faster in July 2021 than in July 2019, 141.4% faster when comparing July 2021 to July 2018, and 194.0% faster when comparing July 2021 to June 2017, the month we began tracking speeds on the Speedtest Global Index. Over the last two years there were only two months when the global average for mobile download speed did not show an upward slope: February and March 2020. Speeds began increasing again in April 2020, but did not recover to pre-February levels until May 2020. This coincides with initial lockdowns due to COVID-19 in many countries.

On fixed broadband, mean download speed was 68.2% faster in July 2021 than in July 2019, 131.3% faster in July 2021 than in July 2018, and 196.1% faster in July 2021 than in June 2017. There was a similar dip in download speed over fixed broadband in March of 2020 as we saw on mobile. The speed increased again in April 2020 but did not recover to a pre-March level until April 2020.

Top 10 rankings are somewhat constant over three years, U.S. and Canada slip off in 2021

There has been surprising parity of which countries continue to occupy the top 10 spots on the Speedtest Global Index in July of each year. However, the lists for mobile and fixed broadband are radically different, with only one country (South Korea) showing up on both lists in 2021.

ookla_fastest-countries_mobile_0921

The United Arab Emirates and South Korea maintain their first and second place rankings for mobile in both 2020 and 2021 and China and Qatar merely flip-flop for third and fourth place. It’s interesting to see Australia and Canada decline in the rankings although their speeds have increased dramatically during the past three years. 5G is shifting mobile rankings where even countries with 5G (which few countries had in 2019) need a strong 5G focus to maintain their presence at the top of the list lest they be outpaced by other countries with larger investments in 5G.

ookla_fastest-countries_fixed_0921

The fixed broadband rankings are more dynamic than those on mobile. Monaco traveled up and down the top 10 from sixth place in 2019 to 10th in 2020 to first place in 2021. Singapore ranked first or second in all three years and Hong Kong (SAR) was in the top four. Romania was solidly in fifth place while South Korea dropped lower in the ranking every year. Chile and Denmark both debuted in the top 10 in 2021 and the United States dropped off the list.

Most of the top 10 countries perform well for fixed and mobile

We were curious to see if countries that made the top 10 in July 2021 for either mobile or fixed broadband were also performing well on the other medium, so we plotted the percentage difference from the global average for mobile download speed against download speed on fixed broadband. Note that the global average increased between 2020 and 2021 and that Liechtenstein and Monaco are not included in this comparison as they did not have sufficient samples to be listed on both axes.

2020/2021 chart of leading country performance again global averages

Most countries that made the top 10 in July 2021 for either mobile or fixed broadband were performing well over the global average for both at that point in time. South Korea and the U.A.E. stood out with mean mobile download speeds that were more than 240% faster than the global average and fixed broadband downloads that were more than 70% faster than the global average. China’s mobile download speed was more than 180% faster than the global average and the country was more than 70% faster than the global average for fixed broadband. Switzerland’s mobile and fixed broadband download speeds were close to 100% faster than the global average.

Chile and Thailand are in a quadrant that shows both had faster than average fixed broadband download speeds, but their mobile download speeds were slower than the global average in July 2021. Australia, Bulgaria, Cyprus and Saudi Arabia were in the opposite quadrant with faster than average mobile speeds and below average fixed broadband speeds.

Comparing the chart for July 2021 to that of July 2020, we saw a wide variety of outcomes. Countries with increases compared to the global average on mobile and fixed broadband included Australia, Cyprus, Denmark, Hong Kong, Romania and the U.A.E. Chile and Norway showed dramatic increases compared to the global average on fixed broadband and declines on mobile. Bulgaria, China, Kuwait, Saudi Arabia and Switzerland increased on mobile but showed little change on fixed. South Korea and Qatar increased on mobile compared to the global average and declined on fixed. Singapore and Thailand declined on both mobile and fixed broadband compared to the global average.

We’re interested to see how global speeds and rankings change over time as individual countries and their providers choose to invest in different technologies. Track your country’s performance using monthly updates on the Speedtest Global Index. Check the Ookla 5G Map for up-to-date information on 5G deployments where you live, and if you want more in-depth analyses, subscribe to Ookla Research.

Ookla retains ownership of this article including all of the intellectual property rights, data, content graphs and analysis. This article may not be quoted, reproduced, distributed or published for any commercial purpose without prior consent. Members of the press and others using the findings in this article for non-commercial purposes are welcome to publicly share and link to report information with attribution to Ookla.

| August 4, 2021

How Starlink’s Satellite Internet Stacks Up Against HughesNet and Viasat around the Globe

The satellite internet race is heating up, with more competitors serving more areas than even a quarter ago. We’re back with a broader look at internet network performance for satellite providers across the globe based on Q2 2021 data from Speedtest Intelligence.

Starlink speeds beat competitors in the U.S., can’t top fixed broadband

Given that satellite internet is often the only solution for folks with little to no fixed broadband access, the Speedtest® results we saw coming from HughesNet, Starlink and Viasat during Q2 2021 were encouraging. However, Starlink was the only satellite internet provider in the United States with fixed-broadband-like latency figures, and median download speeds fast enough to handle most of the needs of modern online life at 97.23 Mbps during Q2 2021 (up from 65.72 Mbps in Q1 2021). HughesNet was a distant second at 19.73 Mbps (15.07 Mbps in Q1 2021) and Viasat third at 18.13 Mbps (17.67 Mbps in Q1 2021). None of these are as fast as the 115.22 Mbps median download speed for all fixed broadband providers in the U.S. during Q2 2021, but it beats digging twenty miles (or more) of trench to hook up to local infrastructure.

ookla_satellite_internet_comparison_us_0821

Starlink’s median upload speed of 13.89 Mbps (up from 13.77 Mbps in Q1 2021) was much closer to that on fixed broadband (17.18 Mbps in Q2 2021, 15.99 Mbps in Q1 2021). Viasat had the second fastest upload speed among satellite providers at 3.38 Mbps (3.48 in Q1 2021). HughesNet was third (2.43 Mbps in Q1 and Q2 2021).

Critically, Starlink was the only satellite internet provider with a median latency that was anywhere near that seen on fixed broadband in Q2 2021 (45 ms and 14 ms, respectively). A low latency connection is more responsive, making it essential for many common applications such as voice and video calling, gaming and live streaming of content. Starlink is able to achieve these lower latency numbers through the use of their low earth orbit (LEO) satellite constellation. At altitudes between 550-1200 km, these satellites are physically closer to the earth’s surface than traditional satellite providers. Therefore it takes less time for the signal to relay back to a downlink station on earth, ensuring a much more responsive connectivity experience for the user. Viasat and HughesNet both utilize considerably higher “geosynchronous” orbits of around 35,000 km for their satellites. This allows them to serve much wider swaths of the Earth’s surface with fewer satellites, but with a dramatic increase in latency in our data of 630 ms and 724 ms respectively.

Satellite internet speeds in the U.S. are increasing, mostly

Consumers are used to incremental increases in fixed broadband performance as that’s a developed technology with a stable market share. Satellite internet is newer and speeds fluctuate as technologies improve and as more users are added to sometimes crowded networks. Data from Speedtest Intelligence during Q1-Q2 2021 shows some of these struggles as median download speeds for both Starlink and HughesNet dipped in February and then rose again through the period only to dip again in June. This could be related to seasonal weather patterns. Viasat’s median download speed rose slightly from January through April and then started to decline slightly in May and June. We’ll continue watching the performance of these companies over time to see if they reach the steady climb that fixed broadband enjoys.

ookla_satellite_internet_monthly_comparison_us_0821

Starlink performance varies at the county level, but not widely

We saw sufficient samples during Q2 2021 to analyze Starlink performance in 458 counties in the U.S. While there was about a 100 Mbps range in performance between the county with the fastest median download speed (Morgan County, Alabama at 168.30 Mbps) and the county with the slowest median download speed (Madison County, Indiana at 64.51 Mbps), even the lower-end speeds are well above the FCC’s Baseline performance tier of at least a 25 Mbps download speed. We also saw many more counties qualify for analysis during Q2 2021 than we saw in Q1 2021.

ookla_united_states_download_speeds_starlink_map_0821

Satellite internet performance elsewhere in the world

The ambition and potential of satellite internet providers is of course to increase internet access across the globe. To that end, we examined satellite internet performance in countries with an established market share.

Brazil: Viasat download speed is comparable to fixed broadband, upload is not

Viasat’s 60.30 Mbps median download speed during Q2 2021 in Brazil was very close to the national average for fixed broadband of 61.38 Mbps. Viasat’s median upload speed (1.05 Mbps) was much slower, however, than that on fixed broadband (28.75 Mbps), and Viasat’s latency was much higher (613 ms vs 7 ms).

ookla_satellite_internet_comparison_br_0821

Canada: Starlink beats fixed broadband download speeds

Our previous article showed that Starlink’s median download speed was slower than fixed broadband in three provinces and faster in two. Data from Q2 2021 shows that Starlink’s median download speed exceeded that of fixed broadband in Canada (86.92 Mbps vs. 84.24 Mbps), making Starlink a reasonable alternative to fixed broadband in Canada. Starlink’s median upload speed was slower than fixed broadband (13.63 Mbps vs. 17.76 Mbps). Latency on Starlink was much higher (55 ms vs. 12 ms), but many customers in remote areas would gladly accept a latency in that range in exchange for having access to internet service.

ookla_satellite_internet_comparison_ca_0821

Starlink performance varies at the province level, but not widely

Starlink showed enough samples to analyze performance in 8 provinces in Canada during Q2 2021. Starlink’s Q2 2021 median download speed was faster than fixed broadband in five provinces (Manitoba, New Brunswick, Nova Scotia, Quebec and Saskatchewan), though samples in Nova Scotia were few enough and showed enough variability that there is room for interpretation. Download speeds were comparable between Starlink and overall fixed broadband in two provinces (Alberta and Ontario) and fixed broadband was faster in British Columbia.

ookla_canada_download_speeds_starlink_map_0821

Chile: HughesNet shows comparable speeds here and in the U.S.

At 15.43 Mbps, the median download speed for HughesNet in Chile during Q2 2021 was not fast, especially compared with the country’s fixed broadband average of 111.94 Mbps. Median upload speeds also showed a wide gap (3.23 Mbps for HughesNet to 39.48 Mbps on fixed broadband), and HughesNet’s latency was very high (678 ms vs. 8 ms).

ookla_satellite_internet_comparison_cl_0821

Colombia: HughesNet is slowest

The slowest performance we saw for HughesNet was in Colombia, where fixed broadband speeds are also slower than in other countries surveyed. HughesNet showed a median download speed of 9.28 Mbps during Q2 2021, compared with Colombia’s 35.90 Mbps for fixed broadband overall. Median upload speed was also slower using the satellite internet provider (3.03 Mbps) than fixed broadband (8.56 Mbps), and latency was much higher on satellite (799 ms vs. 17 ms).

ookla_satellite_internet_comparison_co_0821

France: Where the fastest Starlink download speeds are

Satellite internet users in France saw the fastest median download speeds from Starlink of all countries we surveyed during Q2 2021. At 139.39 Mbps, Starlink’s download speed easily beat the country-wide average for fixed broadband of 70.81 Mbps. Starlink’s upload speed was slower than the fixed broadband average, but still respectable (29.35 Mbps vs. 52.56 Mbps), and Starlink’s latency was higher (53 ms vs. 13 ms).

ookla_satellite_internet_comparison_fr_0821

Germany: Starlink far surpasses local fixed broadband

Consumers looking for fast internet in Germany have a great option in Starlink. Starlink’s median download and upload speeds were much faster than the country averages for fixed broadband in Q2 2021. The only drawback is Starlink’s 37 ms latency, compared to the 15 ms average for fixed broadband.

ookla_satellite_internet_comparison_de_0821

Mexico: Viasat and HughesNet are comparable, though slower than fixed broadband

Mexico has options when it comes to satellite internet, and the faster of the two options appears to be Viasat, for now. With a median download speed of 13.95 Mbps in Mexico during Q2 2021, Viasat was faster than HughesNet (11.92 Mbps) but slower than the country’s average for fixed broadband (29.99 Mbps). Median upload speed told a similar story, though HughesNet was slightly faster than Viasat (3.25 Mbps vs. 2.01 Mbps). While Viasat’s latency was high (672 ms vs 13 ms for fixed broadband), it was lower than HughesNet’s (714 ms).

ookla_satellite_internet_comparison_mx_0821

New Zealand: Starlink is faster than fixed broadband

Data from Speedtest Intelligence shows that Starlink’s median download speed was much faster than New Zealand’s average fixed broadband download speed during Q2 2021 (127.02 Mbps vs. 78.85 Mbps), and the upload speeds were nearly identical (23.61 Mbps vs. 23.51 Mbps). Starlink did have a much higher latency (101 ms vs. 7 ms). Starlink is relatively new in the country and does not have a large market share yet; we’ll be interested to see how their speeds hold up under heavier use.

ookla_satellite_internet_comparison_nz_0821

United Kingdom: Starlink beats fixed broadband providers

Starlink showed a much faster median download speed in the U.K. during Q2 2021 (108.30 Mbps) than the country’s average for fixed broadband (50.14 Mbps). Starlink’s upload speed was also slightly faster (15.64 Mbps vs. 14.76 Mbps), and the latency was pretty good, given the distance traveled (37 ms vs. 15 ms). This brings Starlink closer to contender status for consumers across the U.K., not just those stranded in internet-free zones in Northern Scotland, once the service interruptions are under control. It also shows that because satellite internet is not constrained by the infrastructure of a given country, there is the potential to radically outperform fixed broadband.

ookla_satellite_internet_comparison_uk_0821

This data is changing rapidly as satellite internet providers launch new service locations and improve their technology. We’ll be excited to see if Starlink is still the satellite provider to beat next quarter and in what other countries satellite internet provides a viable alternative to fixed broadband.

Ookla retains ownership of this article including all of the intellectual property rights, data, content graphs and analysis. This article may not be quoted, reproduced, distributed or published for any commercial purpose without prior consent. Members of the press and others using the findings in this article for non-commercial purposes are welcome to publicly share and link to report information with attribution to Ookla.

| July 6, 2021

5G in Italy: Where Next Generation Access Stands Today


Italy is a 5G pioneer as the fourth European country to commercially launch 5G services; it is also a highly competitive market. TIM recently announced a 5G cloud network and WindTre extended 5G dynamic spectrum sharing (DSS) to 93% of the country. Vodafone is partnering with Huawei on a 5G RAN network and Iliad has been looking to grow its customer base with aggressive pricing for 5G. We looked at Speedtest Intelligence® data from Q2 2021 to see if network performance is leading the way as well. Our analysis includes data on 5G performance among neighboring countries, fastest providers at the country level and performance and fastest providers in Italy’s ten largest cities.

Switzerland has the fastest 5G among Italy’s neighbors

5G performance in Italy and neighboring countries has seen some wild swings over the past year. Switzerland ended Q2 2021 with the fastest median 5G download speed on this list at 177.33 Mbps. France was second (169.16 Mbps), Slovenia third (145.78 Mbps), Austria a close fourth (143.98 Mbps) and Italy fifth (122.54 Mbps).

ookla_median-5g_performance_italy_0721-4

Switzerland was also fastest for median upload speed over 5G during Q2 2021 at 36.37 Mbps. Slovenia was second (25.42 Mbps), Austria third (21.97 Mbps), Italy fourth (16.43 Mbps) and France fifth (15.95 Mbps). We often see 5G speeds decline after the initial launch period as more users adopt the technology, both adding congestion to cell sites and additional tests using slower devices.

Italy auctioned spectrum for 5G use in October 2018, but only allocated 200 MHz of mid-band spectrum (3.4-3.8 GHz). The relatively narrow bands that were allocated, coupled with the comparatively high price paid by operators, has helped to drive network sharing agreements designed to speed the rollout and lower the overall cost of 5G deployment. In February 2019, TIM and Vodafone announced plans to combine their tower interests in Italy, including passive and active network sharing in towns with less than 100,000 inhabitants. Later that year, WINDTRE and Fastweb (a fixed-line and MVNO operator) agreed to share their network assets in order to more rapidly deploy 5G for their customers. Italian operators have also boosted 5G coverage by using DSS to deploy 5G using existing 4G-LTE spectrum. While Italy appeared to be following suit with much of Europe in restricting Huawei’s involvement in national telecoms infrastructure, reports indicate that Vodafone Italy has received conditional approval from the Italian government to deploy Huawei equipment in its 5G radio access network. This is a definite boost for Huawei in the region and for competition in the network equipment space in Europe.

TIM was the fastest operator in Italy for 5G

5G performance varied widely among Italy’s top providers and TIM was solidly in the lead with a median download speed over 5G of 282.94 Mbps and an upload speed of 24.50 Mbps during Q2 2021. These were 58.3% and 48.4% faster, respectively, than Vodafone’s second-fastest 5G download and upload speeds (178.73 Mbps and 16.51 Mbps, respectively). Iliad was third fastest for 5G download speed and fourth for upload. WINDTRE was fourth fastest for 5G download and third for upload speeds.

ookla_5g_performance_providers_italy_0721

Naples had the fastest 5G among Italy’s largest cities

Naples had the fastest median 5G download speed among the ten most populous cities in Italy at 223.98 Mbps during Q2 2021. Turin was second and Bologna third. Milan, Bari and Rome were a close fourth, fifth and sixth for 5G download speed while Palermo had the slowest 5G download speed on the list at 104.97 Mbps. Median upload speeds were relatively close between cities, although Catania’s 26.62 Mbps placed them far ahead of other cities. Rome had the slowest median upload speed over 5G on this list.

TIM was the operator with the fastest 5G in Rome during Q2 2021, showing a median download speed of 270.41 Mbps.

ookla_5g_performance_cities_italy_map_0721-1

Italy is clearly capable of impressive 5G speeds. We’ll be interested to see if other providers make the necessary investments to catch up to TIM. This could bring up speeds across the country and improve Italy’s standing compared to neighboring countries. Learn more about how Speedtest Intelligence can help you benchmark your 5G performance against competitors.

Ookla retains ownership of this article including all of the intellectual property rights, data, content graphs and analysis. This article may not be quoted, reproduced, distributed or published for any commercial purpose without prior consent. Members of the press and others using the findings in this article for non-commercial purposes are welcome to publicly share and link to report information with attribution to Ookla.

| May 19, 2021

Choose Your National Park Adventure: The Best Places to Work Remotely or Digitally Disconnect

The great outdoors provided a refuge to many last year when travel options were limited. Now that many are vaccinated, national parks in Canada and the U.S. expect a surge in the number of visitors over the summer months. To find out if those visitors will be able to stretch the definition of “remote work” or if they should count on being unplugged, we looked at mobile internet performance, availability and coverage in national parks in Canada and the U.S. We included data from Q3 2020-Q1 2021 to account for the variability in dates that parks were actually open over the last year.

Gateway Arch had the fastest download speed among U.S. parks, Waterton Lakes in Canada

Fastest parks in the U.S. are near urban areas

national-parks-tables-1

According to data from Speedtest®, U.S. travelers looking for time in the great outdoors this summer without giving up mobile performance should stick to national parks located in or near urban areas. Gateway Arch National Park, located on the shores of the Mississippi River in St. Louis, Missouri, is definitely at an advantage when it comes to accessing the faster speeds that come with urban infrastructure. Gateway Arch had the fastest median download speed on our list of national parks in the U.S. Saguaro National Park and Mount Rainier National Park share a similar story and were second and third for median download speed, respectively. Saguaro borders on Tucson, Arizona and Mount Rainier is very near to Tacoma, Washington. For comparison, the median download speed over mobile in the U.S. during Q1 2021 was 41.19 Mbps.

Denali National Park in Alaska was an exception, placing seventh on this list despite being located deep in the center of the state, far from major cities.

Quick take: Whether you’re posting from the top of the Gateway Arch or Mt. Rainier, there’s a high likelihood that you can livestream your view from national parks located near urban areas.

Slowest parks in the U.S. are in more remote locations

national-parks-tables-2

On the other hand, U.S. travelers wanting to disconnect can achieve those dreams by visiting parks that are farther from major cities or nestled deep in difficult terrain. Sequoia National Park in California had the slowest median download speed on our list at a barely manageable 1.43 Mbps — not even enough to stream a 720p video. Yellowstone was second slowest and Lassen Volcanic National Park in California third. If you’re dreaming of visiting Sequoia National Park but need a slightly faster connection, try neighboring Kings Canyon National Park where the median download speed, while still only 5.40 Mbps, was 277.6% faster.

These slow speeds are a good reminder that sometimes visiting the great outdoors can be about slowing down and enjoying the offscreen splendor. You can always post your pics later.

Canadian parks show a narrower range of speeds

national-parks-tables-3
We can’t say if Canadians are better at logging off while discovering national parks than folks in the U.S. or if service is harder to get, but there were far fewer parks with sufficient data to report on in Canada. As a result, the spread in download performance was not nearly as wide for Canadian national parks as it was for those in the U.S. And, unlike the U.S., all of the Canadian national parks that made our list were in more remote locations.

Waterton Lakes National Park had the fastest median download speed during the period. Jasper and Banff were second and third, respectively. Riding Mountain National Park had the slowest median download speed, followed by Yoho National Park and Saguenay-St. Lawrence National Park. For comparison, the median mobile download speed in all of Canada was 66.90 Mbps during Q1 2021.

38 national parks across the U.S. and Canada show 5G

5G offers the fastest speeds for travelers looking to make arrangements on the go or tether to a laptop to fit in a few hours of remote work. Data from Android users with 5G-capable phones during Q3 2020-Q1 2021 showed 36 national parks in the U.S. and two in Canada with sufficient samples to confirm 5G at least somewhere in the park.

national-parks-tables-4

Speedtest data showed 5G in 36 U.S. National Parks from Florida to Washington. If the park you want to visit is on this list, you should have access to all that 5G has to offer at least somewhere in the park.

national-parks-tables-5

In Canada, only Banff and Jasper showed a sufficient number of 5G samples to make the list.

4G Availability varies widely among U.S. parks, less so in Canada

In many cases, National Parks are located in gorgeous rural locations — exactly where you’d expect not to find 4G. We looked at 4G Availability, the percent of users on all Android devices that spend the majority of their time on 4G and above (both roaming and on-network), across both countries’ park systems to see where users can connect to a modern signal.

Because terrain varies widely in parks, the presence of 4G in a park does not mean service is uniformly available throughout that park (so prepare your emergency contact plan accordingly).

Less remote U.S. national parks have higher 4G Availability

national-parks-tables-6
Cuyahoga Valley National Park in Ohio had the highest 4G Availability of any U.S. National Park, followed by Gateway Arch in Missouri and Hot Springs in Arkansas. All but four of the 10 U.S. National Parks with the highest 4G Availability were on the list of parks with the fastest median download speeds. Even the parks on this list that are farther from cities are still close to areas like highways that are often better served by mobile infrastructure.

national-parks-tables-7-1

If you’re looking to unplug while in the outdoors, try Sequoia National Park in California and Big Bend National Park in Texas. These two parks had the lowest 4G Availability of all the U.S. National Parks. There was significant overlap between the list of national parks with the lowest 4G Availability and those with the slowest median download speeds. With 4G Availability numbers like these, spectral efficiency will suffer and the network will likely not be able to serve as many people per cell, dragging down your mobile performance. Save yourself the frustration — log off and enjoy the view.

Only two Canadian parks show less than 50% 4G Availability

national-parks-tables-8
Elk Island had the highest 4G Availability among national parks in Canada, Waterton Lakes National Park was second and Mount Revelstoke National Park third. The national parks on this list had strong 4G Availability regardless of their proximity to or distance from population centers.

national-parks-tables-9

Kootenay National Park had the lowest 4G Availability among national parks in Canada. La Mauricie was second and Gros Morne third. It’s worth noting that the Canadian National Parks on this list had, for the most part, much higher 4G Availability than the U.S. National Parks with the lowest 4G Availability.

Mobile service not guaranteed

We’ve mentioned this throughout the article, but median performance only applies where you can actually get a signal. Below, we’ve mapped the Canadian and U.S. National Parks with the fastest and slowest speeds and the highest and lowest 4G Availability from our lists above to show how varied that coverage can be.

ookla_national_parks_can_0521

Although Waterton Lakes National Park had the fastest download speed among Canadian National Parks, travelers will only find reliable 4G service in the eastern half of the park, particularly along Highway 5, the first half of Red Rock Parkway, and the road to the Waterton Valley View Point. There’s also spotty connectivity on the Crypt Lake Trail. Meanwhile, we saw a 4G signal along most of the roads in Elk Island National Park and at the southeast and southwest corners of Flyingshot Lake. Knowing where service is and is not could help Canadians exercise their right to disconnect.

It’s not surprising that Riding Mountain National Park showed the slowest download speed among Canadian National Parks as even the major roads often only have 2G or 3G service. Visitors to this park have the best chance of connecting to 4G around Clear Lake. Parks Canada warns there is no cell coverage in Kootenay National Park and Speedtest data mostly backs this up. We saw almost no service along Highway 93 along the length of the park. There were small pockets of 4G service near the Stanley Glacier and Radium Hot Springs, but visitors facing an emergency will likely need to seek out the emergency phone at Kootenay Crossing as advised by the Park.

ookla_national_parks_us_0521

In the U.S., Gateway Arch National Park and Cuyahoga Valley National Park both show service in all or most of the park. This is not surprising given that Gateway Arch covers only 91 (mostly flat) acres in St. Louis. The gaps in 4G service at Cuyahoga Valley are few given that the park covers more than 32,000 acres (for comparison, Yellowstone has 2,221,766 acres). Either park would be good destinations if you need to be connected most of the time.

Mobile service is much poorer at both Big Bend National Park and Sequoia National Park. Visitors to Big Bend should be able to connect to a 2G or 3G signal if they are along the north and western service roads while the south and eastern service roads show spotty or no service at all. Most of the major roads at Sequoia show no service at all, with only a couple of spots where 4G peeks through. If you’re traveling to either of these parks, plan on being mostly off the grid.

5G all the time or completely disconnected, we hope this data will help you get outside and enjoy nature this summer — either with your mobile lifeline or completely off the grid. If you do visit a national park in Canada or the U.S., take a Speedtest® on Android or iOS to help us provide even better information next year.

Ookla retains ownership of this article including all of the intellectual property rights, data, content graphs and analysis. This article may not be quoted, reproduced, distributed or published for any commercial purpose without prior consent. Members of the press and others using the findings in this article for non-commercial purposes are welcome to publicly share and link to report information with attribution to Ookla.

| May 5, 2021

Starlink: Bridging the Digital Divide or Shooting for the Stars?

Elon Musk has a vision to use Starlink satellites to deliver world-class internet speeds to the rural households that have been left behind by so many infrastructure projects over the years. It’s a noble goal, and one that’s become increasingly necessary given our reliance on the internet over the past year. It could also help bridge the glaring gaps in performance between cities and rural communities which the Biden administration is prioritizing in the American Jobs Plan. Starlink is still in beta phase, but we decided to use data from Speedtest Intelligence® to investigate Q1 2021 performance in the U.S. and Canada to see if the program is living up to expectations.

Starlink speeds are sometimes a vast improvement, sometimes not

ookla_united_states_median_download_starlink_map_0521-3
In the U.S. during Q1 2021, median download speeds from Starlink ranged from 40.36 Mbps in Columbia County, Oregon to 93.09 Mbps in Shasta County, California. These represented everything from a dramatic improvement over other fixed broadband providers (545.6% faster in Tehama County, California) to a disappointment (67.9% slower in Clay County, Missouri).

ookla_united_states_download_comparison_starlink_map_0521-3

Starlink shows a narrower range of performance in Canada

ookla_canada_median_download_starlink_map_0521-3

Starlink’s Q1 2021 median download speeds in Canadian provinces showed a smaller range than in the U.S. with a low of 53.61 Mbps in Ontario and a high of 80.57 Mbps in Saskatchewan. Percentage difference when compared to all other fixed broadband providers also showed a narrower range. In Saskatchewan and Manitoba, Starlink customers reported median download speeds 59.6% and 38.5% faster than those for all other fixed broadband providers combined. In Québec, median download speeds were nearly equal, with Starlink performing only 3.4% slower. In B.C., Alberta, Ontario and New Brunswick, on the other hand, Starlink’s median download speeds were 20.9%, 24.2%, 29.5% and 40.7% slower than other fixed broadband providers, respectively.

ookla_canada_download_comparison_starlink_map_0521-3

Starlink latency is up to 486% higher in U.S., 369% in Canada

A reasonable latency is critical to effective internet use. If your latency is too high, you might be the one on the video call with the tinny voice who’s answering questions when the conversation’s already moved on. If you’re a gamer, you already know that latency can cause your characters to stutter-step around at critical moments. Starlink plans to use low-Earth orbit satellites with laser links to radically decrease latency in rural areas. What we’re seeing so far, though, is that Starlink’s latency is higher than the alternatives, often much higher.

ookla_united_states_latency_comparison_starlink_map_0521-3

Starlink’s latency was higher in all but one of the U.S. counties surveyed during Q1 2021. The exception was Mariposa County, California where Starlink’s latency was 17.4% lower than that of all other providers combined. Median latency values on Starlink were observed from 31 ms (Kittitas County, Washington) all the way up to 88 ms (Otsego County, Michigan). For comparison, median latency values for all other providers combined ranged from 8 ms (Fairfax County, Virginia) to 47 ms (Daviess County, Kentucky).

ookla_canada_latency_comparison_starlink_map_0521-3

In Canada, Starlink’s latency was higher in all provinces surveyed during Q1 2021. With median latency values from 34 ms (B.C.) to 61 ms (Saskatchewan), Starlink’s latency was 209.1% to 369.2% higher than that of all other providers combined.

Starlink meets minimum tier for FCC’s Rural Development Opportunity Fund

In order to compete for the FCC’s Rural Digital Opportunity Fund (RDOF), providers must meet the minimum performance tier (25 Mbps download / 3 Mbps upload / 100 ms latency). We analyzed Speedtest® results for users with more than two tests during Q1 2021 to see whether Starlink could potentially qualify for this funding.

ookla_percentage_users_fcc_performance_tiers_0521

In both the U.S. and Canada, Starlink provided competitive or better service at the minimum (25/3/100) tier. In the U.S., 86.7% of Starlink users met this threshold, compared with 83.2% of those on all other fixed broadband providers. Although the FCC’s criteria don’t apply north of the border, 85.6% of Canadian Starlink users met the Minimum threshold, compared with 77.8% for all other providers. Starlink showed a smaller proportion of users meeting the baseline and above baseline tiers than all other providers combined.

Given this data, it’s safe to say Starlink could be a cost-effective solution that dramatically improves rural broadband access without having to lay thousands of miles of fiber.

Musk’s Starlink experiment is certainly fascinating and we applaud any effort to get better service for rural residents. That said, it’s clearly early days for the rapidly growing Starlink, and results from Q1 may not be indicative of future performance. We’ll be watching to see how performance improves as more satellites are launched and as more users join the service. If you’re on Starlink, take a Speedtest to share how your connection is performing.

Editor’s note: this article was updated on May 17 with a sentence clarifying how this data should be interpreted.

Ookla retains ownership of this article including all of the intellectual property rights, data, content graphs and analysis. This article may not be quoted, reproduced, distributed or published for any commercial purpose without prior consent. Members of the press and others using the findings in this article for non-commercial purposes are welcome to publicly share and link to report information with attribution to Ookla.

| April 19, 2021

Saudi 5G Is Fast, and New Spectrum Allocations Should Make it Faster

pdf_download_button_ar-1

Saudi Arabia has a new plan to allocate or improve 23 GHz of spectrum to boost 5G speeds and coverage and potentially best other countries in the Gulf Cooperation Council (GCC), This region has been ahead of the 5G curve since early days with Qatar launching commercially available 5G in 2018 and Bahrain, Kuwait, Saudi Arabia and the United Arab Emirates following soon after in 2019.

It’s good company to be in, but having such technologically advanced neighbors can obscure the progress Saudi Arabia has made and how well the country is doing compared with the world. This article looks at mobile speeds and 5G adoption in GCC countries and then closely examines Saudi mobile performance, including information on fastest providers, time spent on 5G and how the new spectrum could improve performance.

UAE has fastest mobile speeds in GCC, Saudi Arabia third

ookla_median-mobile-speeds_gcc_0421_en
There was a wide range of median mobile speeds across the GCC over the past year, despite 5G presence in nearly all of the countries. United Arab Emirates (UAE) consistently had the fastest median download speed over mobile, with 100.99 Mbps during Q1 2021. Qatar was second with 90.92 Mbps during Q1 2021 and Saudi Arabia was third (67.61 Mbps). Kuwait, Oman and Bahrain formed a tight group at the bottom of the rankings with median download speeds of 42.52 Mbps, 37.52 Mbps and 36.76 Mbps, respectively, during Q1 2021. Of these countries, only Oman did not have commercially-available 5G until 2021.

Kuwait showed the largest increase in median download speed among GCC countries when comparing Q1 2020 to Q1 2021 at 84.0%. UAE saw the second largest increase (61.6%), Saudi Arabia third (48.2%), Qatar fourth (53.2%), Bahrain fifth (43.8%) and Oman sixth (21.6%).

Median upload speeds over mobile were much slower than download speeds in all GCC countries during 2020, as is often the case. UAE had the fastest upload speed during Q1 2021 at 23.62 Mbps. Qatar was second (21.96 Mbps), Saudi Arabia third (17.06 Mbps), Kuwait fourth (16.22 Mbps), Oman fifth (12.75 Mbps) and Bahrain sixth (10.17 Mbps).

5G adoption is highest in Saudi Arabia

The ratio of samples from devices that are connected to 5G to the number of samples from all 5G-capable devices speaks to the maturity of the 5G market in each country. Saudi Arabia had the highest ratio among GCC countries during Q1 2021. Qatar was second and UAE third, Kuwait fourth and Bahrain fifth. Oman, which only launched commercially-available 5G during Q1 2021, was a distant sixth.
ookla_5g-device-ratio_gcc_0421_en

Qatar had the highest 5G Availability

ookla_gcc_5g_availability_map_0421_en

One way to understand the state of a 5G network is by looking at 5G Availability — the proportion of users spending the majority of their time on 5G. Mobile users with 5G-capable devices in Qatar had the highest 5G Availability among GCC countries with 38.1% during Q1 2021. Saudi Arabia was second (31.9%), Kuwait third (31.8%), UAE fourth (30.5%) and Bahrain fifth (17.3%). 5G Availability in Oman, where 5G was not commercially available until Q1 2021, was 3.0%.

5G in Saudi Arabia is much faster than global average

ookla_5g-download-speed_saudi-arabia_world_0421_en

We compared Saudi Arabia’s median download speed over 5G with an average of 5G download speeds around the world during Q1 2021 and found that Saudi Arabia’s 5G is 127% faster at 322.42 Mbps.

stc was the fastest operator in Saudi Arabia, Mobily had highest rating and NPS

Speedtest Consumer Sentiment™ data provides rich insights into customer satisfaction over time, as well as competitive benchmarking, by providing data on both customers’ overall satisfaction with their network providers (based on a five-star scale) and Net Promoter Score (NPS). This data set is gathered from single-question surveys presented to users at the end of a Speedtest. Operators and government regulators across the globe use this data to monitor improvements over time. A comparison of Q1 2021 ratings data from Saudi Arabia’s top providers to their speeds during the same period, we can explore the relationship between customer satisfaction and network performance.

ookla_median-mobile-speeds_saudi-arabia_0421_en

There was a wide spread among download speeds for Saudi Arabian mobile operators during Q1 2021 with stc showing the fastest median download and upload speeds at 76.81 Mbps and 19.71 Mbps, respectively. Mobily was second for download and upload speeds (62.36 Mbps and 13.29 Mbps, respectively) and Zain third (39.62 Mbps and 11.29 Mbps, respectively).

Mobily had the highest rating and the highest NPS among top providers in Saudi Arabia in Q1 2021. Substantively, there was not enough difference between the ratings of stc and Zain to determine a second and third ranking. stc was second for NPS and Zain third. It’s worth noting that the NPS was negative for all three operators, indicating that users were not likely on average to recommend the service to friends or family.

How Saudi Arabia will use additional spectrum to maximize performance

On March 30, Saudi Arabia’s Communications and Information Technology Commission (CITC) released the 3-year “Outlook for Commercial and Innovative Use of the Spectrum in Saudi Arabia.” The program includes a plan to make more than 23 GHz of spectrum available for innovative and commercial use: 4 GHz licensed, 6.2 GHz unlicensed and more than 13 GHz of lightly licensed spectrum. This balanced approach should maintain protection of key uses in their primary bands while supporting a range of technologies, including: mobile, satellite — including non-geostationary satellite orbit (NGSO), high altitude platform station (HAPS), air to ground and Wi-Fi/WiGig.

CITC will allocate the 600 MHz and 3800 – 4000 MHz bands for mobile use in 2021. The sub-1 GHz should help Saudi operators maximize the distance their 5G signals can travel as T-Mobile has done in the U.S.. This is important in a country with vast areas to span between major cities.

Meanwhile, the addition of the 3800 – 4000 MHz band to the already provided 3400-3800 MHz in the C-band should enable operators to add massive capacity to their networks and leverage the fully market-tested network infrastructure as well as a plethora of 5G capable devices. Specifically, with the recent mobile chipsets capable of FDD+TDD NR Carrier Aggregation, these provide a stepping stone and a smooth transition to standalone 5G, and allow operators to deploy an ideal mix of 5G coverage and capacity.

Saudi Arabia and the GCC as a whole are interesting markets to watch and we’ll continue using data from Speedtest Intelligence® to see if Saudi performance continues to improve and how the rankings shift as Oman ramps up their 5G program. For sneak peeks at how countries around the world are performing on a monthly basis, visit the Speedtest Global Index.

Ookla retains ownership of this article including all of the intellectual property rights, data, content graphs and analysis. This article may not be quoted, reproduced, distributed or published for any commercial purpose without prior consent. Members of the press and others using the findings in this article for non-commercial purposes are welcome to publicly share and link to report information with attribution to Ookla.