| February 12, 2020

How Roaming Affects Mobile Speeds in Europe

Last year, we conducted an expansive analysis of mobile roaming in the European Union. We’re updating our data to see which countries have the best roaming speeds and how roaming affects time spent on Wi-Fi. This analysis is based on Speedtest data from Android devices in Europe during Q3-Q4 2019. Despite Brexit, we’ve included data from the United Kingdom to keep parity year-over-year, as the roaming agreement remains in place for 2020 and this data involves travel within a specific set of countries.

Roaming in Europe typically means slower download speeds

Mobile roaming speeds are affected by the deals struck between individual mobile operators on a country-by-country basis. This means roaming speeds can depend on the plan a subscriber has selected in their home country and on what is offered in the country of destination.

Out of the 28 countries we examined, residents of 22 countries experienced slower speeds when roaming elsewhere in Europe than they do in their home countries. Travelers from the Netherlands experience the most significant loss in speed, with a roaming download speed that is 54.7% slower than at home. However, users in Slovakia barely notice a change in download speed with a roaming download speed only 2.6% slower than the mean download speed in Slovakia during this period.

Roaming vs. Local Mobile Download Speeds in Europe
Speedtest® Data | Q3-Q4 2019
Country Local Speeds (Mbps) Roaming Speed Upload (Mbps) % Change
Austria 46.30 35.93 -22.4%
Belgium 50.95 33.38 -34.5%
Bulgaria 55.32 30.95 -44.1%
Croatia 52.40 43.73 -16.6%
Cyprus 43.50 21.04 -51.6%
Czech Republic 47.00 36.37 -22.6%
Denmark 48.38 32.28 -33.3%
Estonia 42.61 43.90 3.0%
Finland 43.38 41.46 -4.4%
France 44.34 34.00 -23.3%
Germany 34.07 30.48 -10.5%
Greece 39.90 45.03 12.9%
Hungary 45.53 29.55 -35.1%
Ireland 26.73 32.05 19.9%
Italy 33.64 40.98 21.8%
Latvia 33.20 38.54 16.1%
Lithuania 46.72 39.73 -15.0%
Luxembourg 52.55 34.61 -34.1%
Malta 48.88 32.30 -33.9%
Netherlands 62.52 28.31 -54.7%
Poland 33.07 25.57 -22.7%
Portugal 34.49 36.34 5.4%
Romania 37.84 33.69 -11.0%
Slovakia 34.74 33.83 -2.6%
Slovenia 39.34 32.67 -16.9%
Spain 34.28 27.56 -19.6%
Sweden 48.52 36.55 -24.7%
United Kingdom 36.36 34.96 -3.8%

Upload speeds locally are also mostly faster than those experienced while roaming. Cyprus, Denmark, and the Netherlands all had relatively high mean upload speeds locally, but they also had the largest loss in roaming upload speeds ranging from 31.3% to 36.7% slower upload speeds on mobile roaming.

Residents of some European countries do benefit from faster speeds when roaming on mobile. Users from Estonia, Portugal, Greece, Latvia, Ireland, and Italy all experienced faster download speeds when roaming elsewhere in Europe than they did in their home countries during Q3-Q4 2019. Italian and Irish travelers gained the most when roaming with download speeds that were 21.8% and 19.9% faster than their local speeds, respectively.

A total of 12 countries had higher mean upload speeds while roaming than they experienced locally during this period. France, Latvia, and Ireland benefitted the most with an increase in upload speeds that ranged from 26.5% to 21.4% while roaming.

Latency increases dramatically while roaming in Europe

Unlike mean download and upload speeds, latency is almost always dramatically different while roaming. This is because roaming signals are routed through a user’s home network, making latency a significant issue for Europeans when traveling.

Local vs. Roaming Latency in Europe
Speedtest® Data | Q3-Q4 2019
Country Local Latency (ms) Roaming Latency (ms) % Change
Austria 26 84 220.4%
Belgium 27 83 205.7%
Bulgaria 27 127 368.3%
Croatia 33 89 166.0%
Cyprus 23 213 825.5%
Czech Republic 26 74 187.6%
Denmark 26 100 287.9%
Estonia 25 76 201.5%
Finland 27 97 254.6%
France 41 82 98.8%
Germany 38 87 128.1%
Greece 29 129 349.8%
Hungary 25 93 272.6%
Ireland 35 100 185.0%
Italy 50 91 81.2%
Latvia 26 95 268.2%
Lithuania 27 107 302.2%
Luxembourg 23 83 262.6%
Malta 19 136 611.6%
Netherlands 28 87 208.3%
Poland 35 109 209.2%
Portugal 30 109 258.8%
Romania 30 113 275.3%
Slovakia 31 76 105.5%
Slovenia 24 74 208.2%
Spain 45 107 137.4%
Sweden 29 118 304.3%
United Kingdom 38 103 173.1%

In their home country, residents of Malta (19 ms), Luxembourg (22 ms) and Cyprus (23 ms) enjoyed the lowest latencies in Europe. Residents of France, Spain and Italy experienced the highest latencies in their home countries at 41 ms, 45 ms and 50 ms, respectively.

European residents experienced an increase of at least 81.2% in their latency when visiting other countries within Europe. Residents from Cyprus, Malta and Bulgaria experience the biggest increase in latency when visiting other countries in Europe, ranging from Cyprus’ 825.5% to Bulgaria’s 368.3%. The countries that experienced the smallest increase in latency were Italy (81.2%), France (98.8%) and Germany (128.1%).

Locals spend more time on Wi-Fi than visitors in Europe

While there are no roaming changes within the E.U., users often opt to connect to Wi-Fi to avoid additional data overages at home and abroad. The following table compares the percentage of time spent on Wi-Fi by a resident of a country with that of a visitor to the same country during Q3-Q4 2019.

Percentage of Time Spent on Wi-Fi in Europe
Speedtest® Data | Q3-Q4 2019
Country Local Customers Visitors % Change
Austria 75.5% 40.5% -46.3%
Belgium 77.9% 35.8% -54.1%
Bulgaria 74.0% 60.3% -18.5%
Croatia 74.3% 53.8% -27.5%
Cyprus 79.3% 70.2% -11.5%
Czech Republic 80.1% 46.6% -41.8%
Denmark 78.7% 60.3% -23.4%
Estonia 70.3% 51.9% -26.2%
Finland 63.0% 60.3% -4.4%
France 69.3% 48.7% -29.7%
Germany 80.0% 47.1% -41.1%
Greece 79.3% 64.3% -19.0%
Hungary 76.8% 47.8% -37.8%
Ireland 75.6% 58.9% -22.0%
Italy 70.9% 55.1% -22.2%
Latvia 68.8% 49.2% -28.4%
Lithuania 73.8% 52.2% -29.2%
Luxembourg 72.4% 30.8% -57.4%
Malta 79.4% 65.9% -17.1%
Netherlands 81.8% 49.1% -40.1%
Poland 70.2% 58.2% -17.1%
Portugal 76.5% 61.9% -19.0%
Romania 69.6% 64.1% -7.9%
Slovakia 76.2% 40.1% -47.4%
Slovenia 70.7% 24.7% -65.2%
Spain 78.3% 62.8% -19.7%
Sweden 81.8% 53.8% -34.3%
United Kingdom 79.3% 60.9% -23.1%

As we saw last year, Finnish residents spent the least amount of time on Wi-Fi at 63.0%. Latvia showed the second lowest time spent on Wi-Fi (68.8%), followed by France (69.3%). Residents from the Netherlands, Sweden and the Czech Republic spent the most time on Wi-Fi at 81.8%, 81.8%, and 80.1%, respectively.

Visitors to Cyprus, Malta and Greece spent the most amount of time on Wi-Fi during this period. Time spent on Wi-Fi by visitors ranged from 64.3% in Greece to 70.2% in Cyprus. Visitors to Slovenia, Luxembourg and Belgium as a destination country spent the least amount of time on Wi-Fi at 25.7%, 30.8% and 35.8%, respectively.

Are you interested in more data on roaming performance? Read more here!

Ookla retains ownership of this article including all of the intellectual property rights, data, content graphs and analysis. This article may not be quoted, reproduced, distributed or published for any commercial purpose without prior consent. Members of the press and others using the findings in this article for non-commercial purposes are welcome to publicly share and link to report information with attribution to Ookla.

| March 2, 2020

Mobile and Fixed Broadband Speeds and 4G Availability in Spain

Versión en español

We investigated Spain’s fixed broadband and mobile network performance, 4G Availability, how Spain’s speeds and coverage compare with neighboring European countries and the performance and 4G Availability of top providers in Spain’s ten largest cities during Q3-Q4 2019. In addition to ranking Spain’s providers by top speeds and coverage, we also analyzed the effects of mobile plans with speed caps on Speedtest® results and ranked the providers on consistency of their network performance.

Spain and France were the fastest on our list for fixed broadband

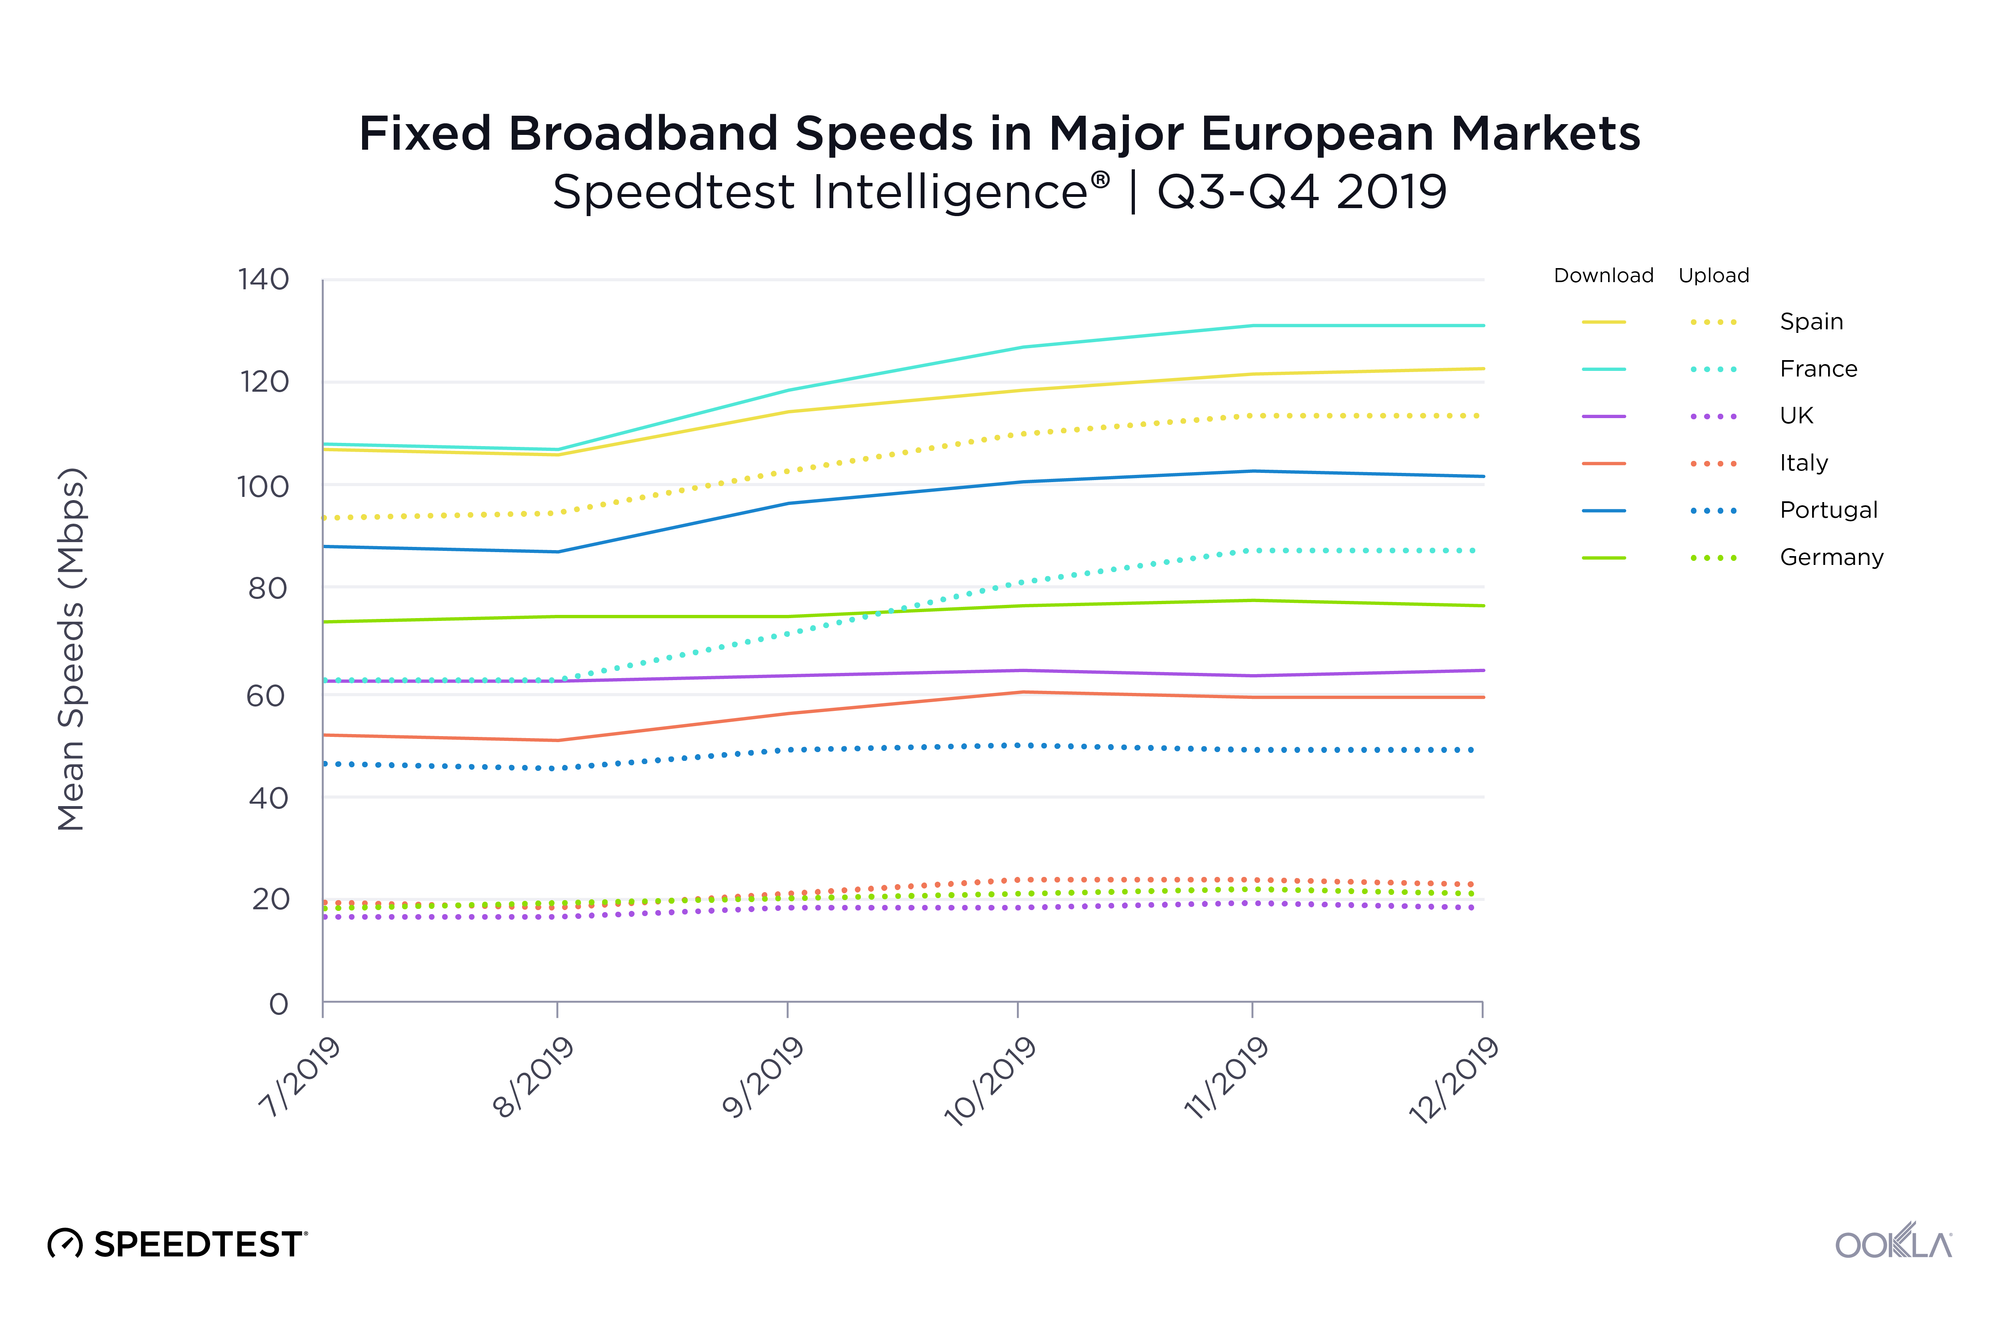
We compared Spain’s fixed broadband performance at the country level to several other western European countries during Q3-Q4 2019. Spain was well positioned for mean download speed on fixed broadband at 113.72 Mbps, second only to France’s 119.37 Mbps. Spain had the fastest mean upload speed on this list at 103.72 Mbps. Italy had the slowest mean download speed on this list at 56.72 Mbps while the United Kingdom had the slowest mean upload speed at 18.28 Mbps.
fixed-broadband-speeds-eng-1

France showed the highest increase in mean download speed during Q3-Q4 2019 at 21.5%, followed by Portugal and Italy at 15.4% and Spain at 14.5%. Speeds remained relatively flat for this period for Italy, the U.K. and Germany.

An examination of latency over fixed broadband during Q3-Q4 2019 revealed a very different performance order. Portugal had the lowest latency during this period at 16 ms. Germany and the U.K. were tied for second at 23 ms. Spain was third (25 ms), Italy fourth (30 ms) and France fifth (32 ms).
Spain ranks fourth for mobile download speed

mobile-speeds-eng-1

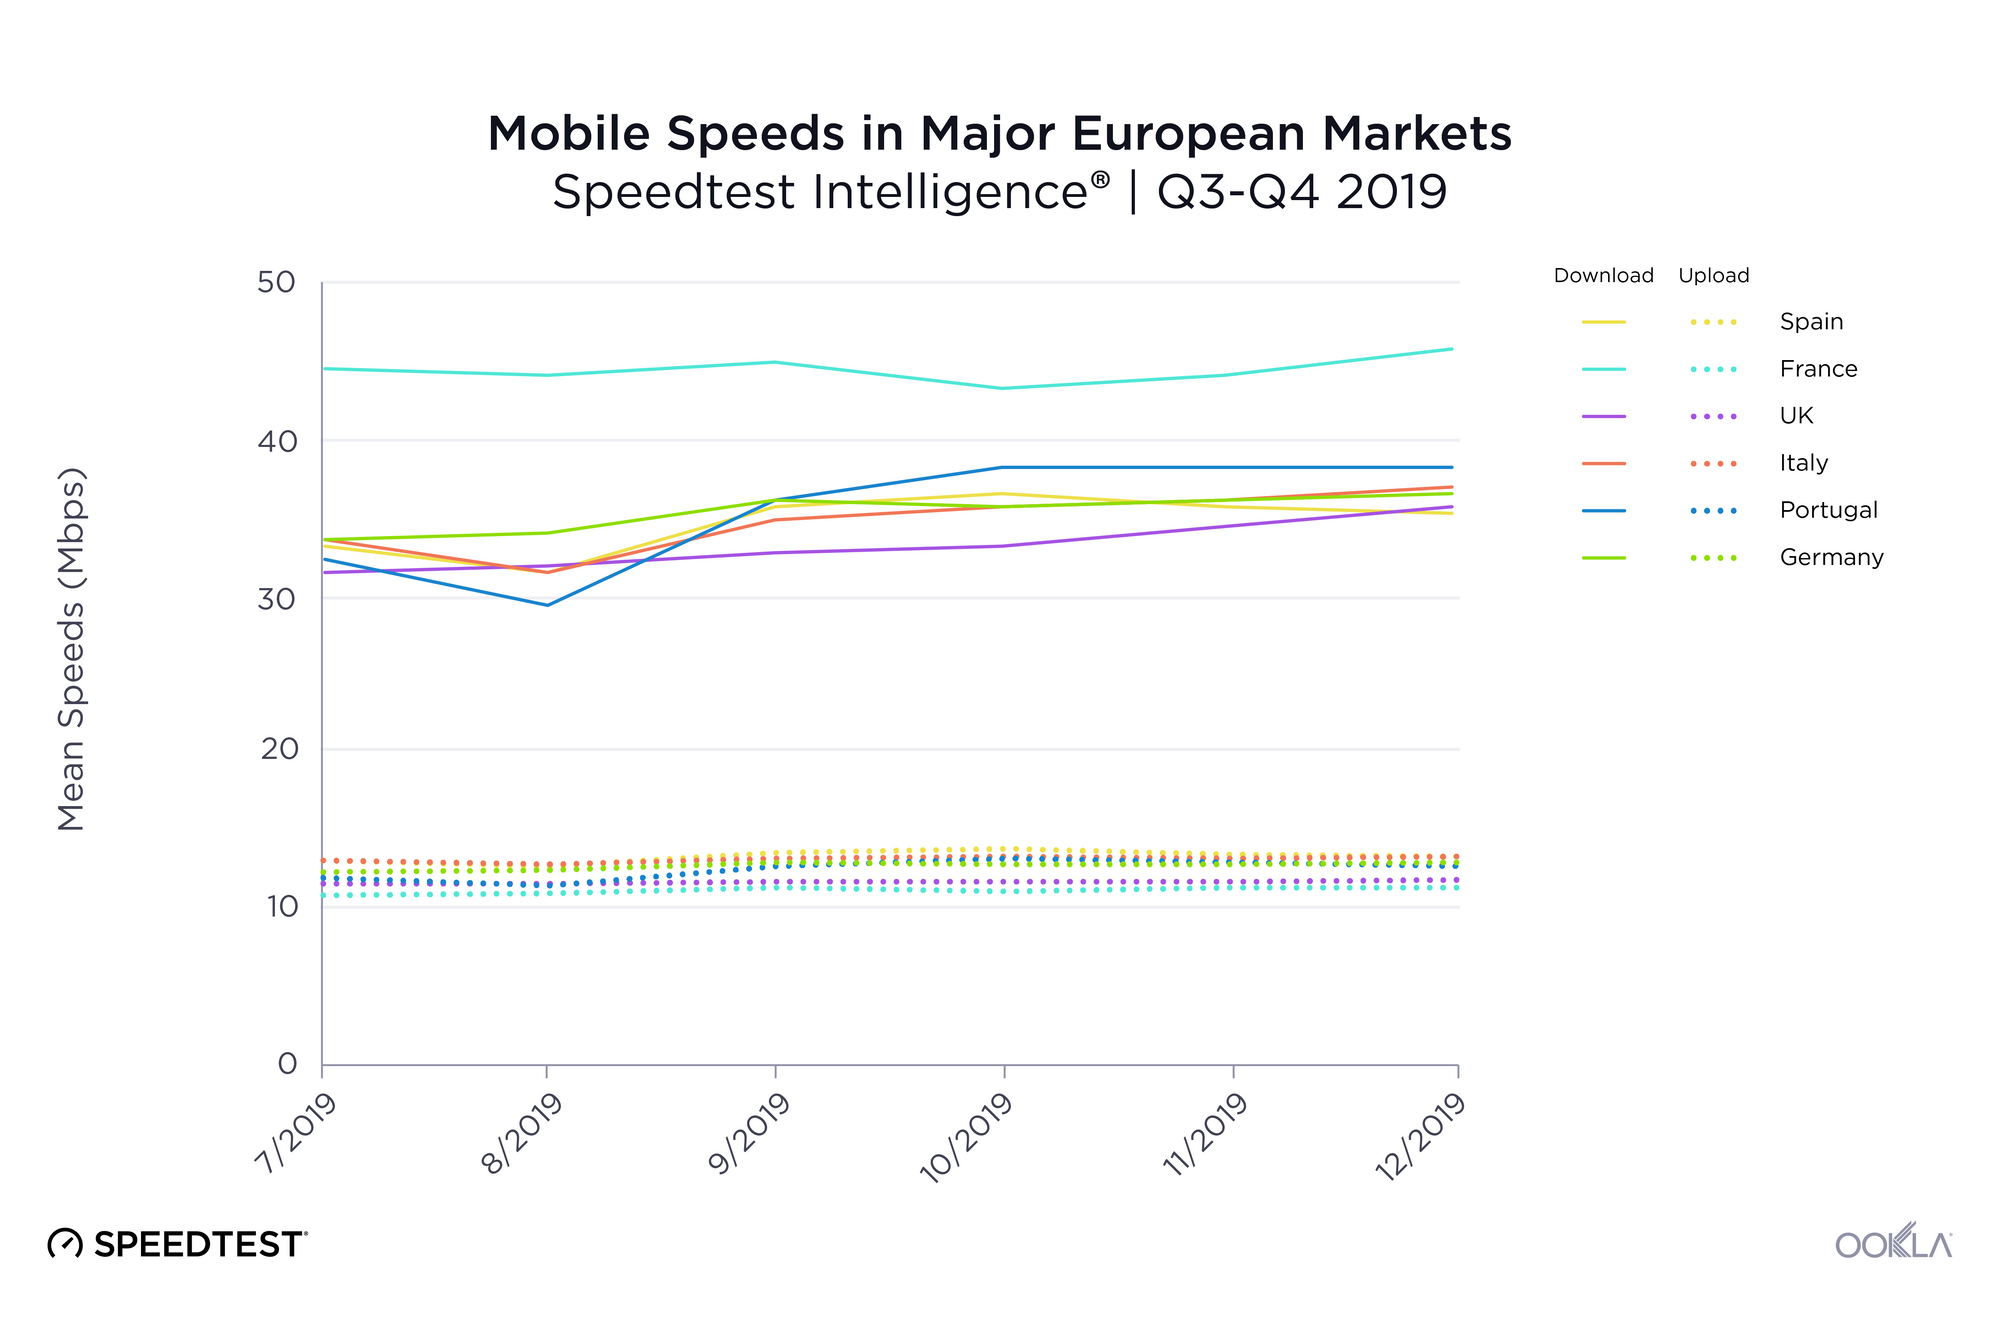
Spain did not rank as well for mean download speed over mobile as they did on fixed broadband, coming in fourth with 33.97 Mbps during Q3-Q4 2019. This was 22.8% slower than first-place France. However, Spain showed the fastest mean upload speeds on mobile at 13.12 Mbps during Q3-Q4 2019.

Portugal saw the largest increase in mobile download speed during Q3-Q4 2019 at 18.4%. Spain’s mean download speed over mobile increased only 6.7% during this period. France showed the smallest increase in mobile download speed at 2.8%.

As we saw on fixed broadband, Portugal had the lowest mobile latency at 32 ms. Germany was second at 41 ms, France third at 43 ms, the U.K. fourth at 44 ms, Spain fifth at 47 ms and Italy last at 52 ms.

United Kingdom and Spain lead in 4G Availability

We used data from Speedtest coverage scans on Android to compare 4G Availability in each market during Q3-Q4 2019. While the U.K. showed the highest 4G Availability at 88.8%, Spain tied for a very close second, with 4G available in 87.7% of tested locations. Germany had the lowest 4G Availability at 72.1% during this period.

4G Availability in Major European Markets
Speedtest Intelligence® | Q3-Q4 2019
Country 4G Availability
United Kingdom 88.8%
Spain 87.7%
France 87.7%
Italy 86.7%
Portugal 85.0%
Germany 72.1%

Looking specifically at Spain’s top mobile providers, Orange had the highest 4G Availability at 88.1%. Movistar was second, Yoigo third, and Vodafone fourth.

4G Availability by Provider in Spain
Speedtest Intelligence® | Q3-Q4 2019
Provider 4G Availability
Orange 88.1%
Movistar 87.7%
Yoigo 87.4%
Vodafone 86.1%

Spain’s 5G deployments are expanding

5G-Deployments-in-Spain-0220-1
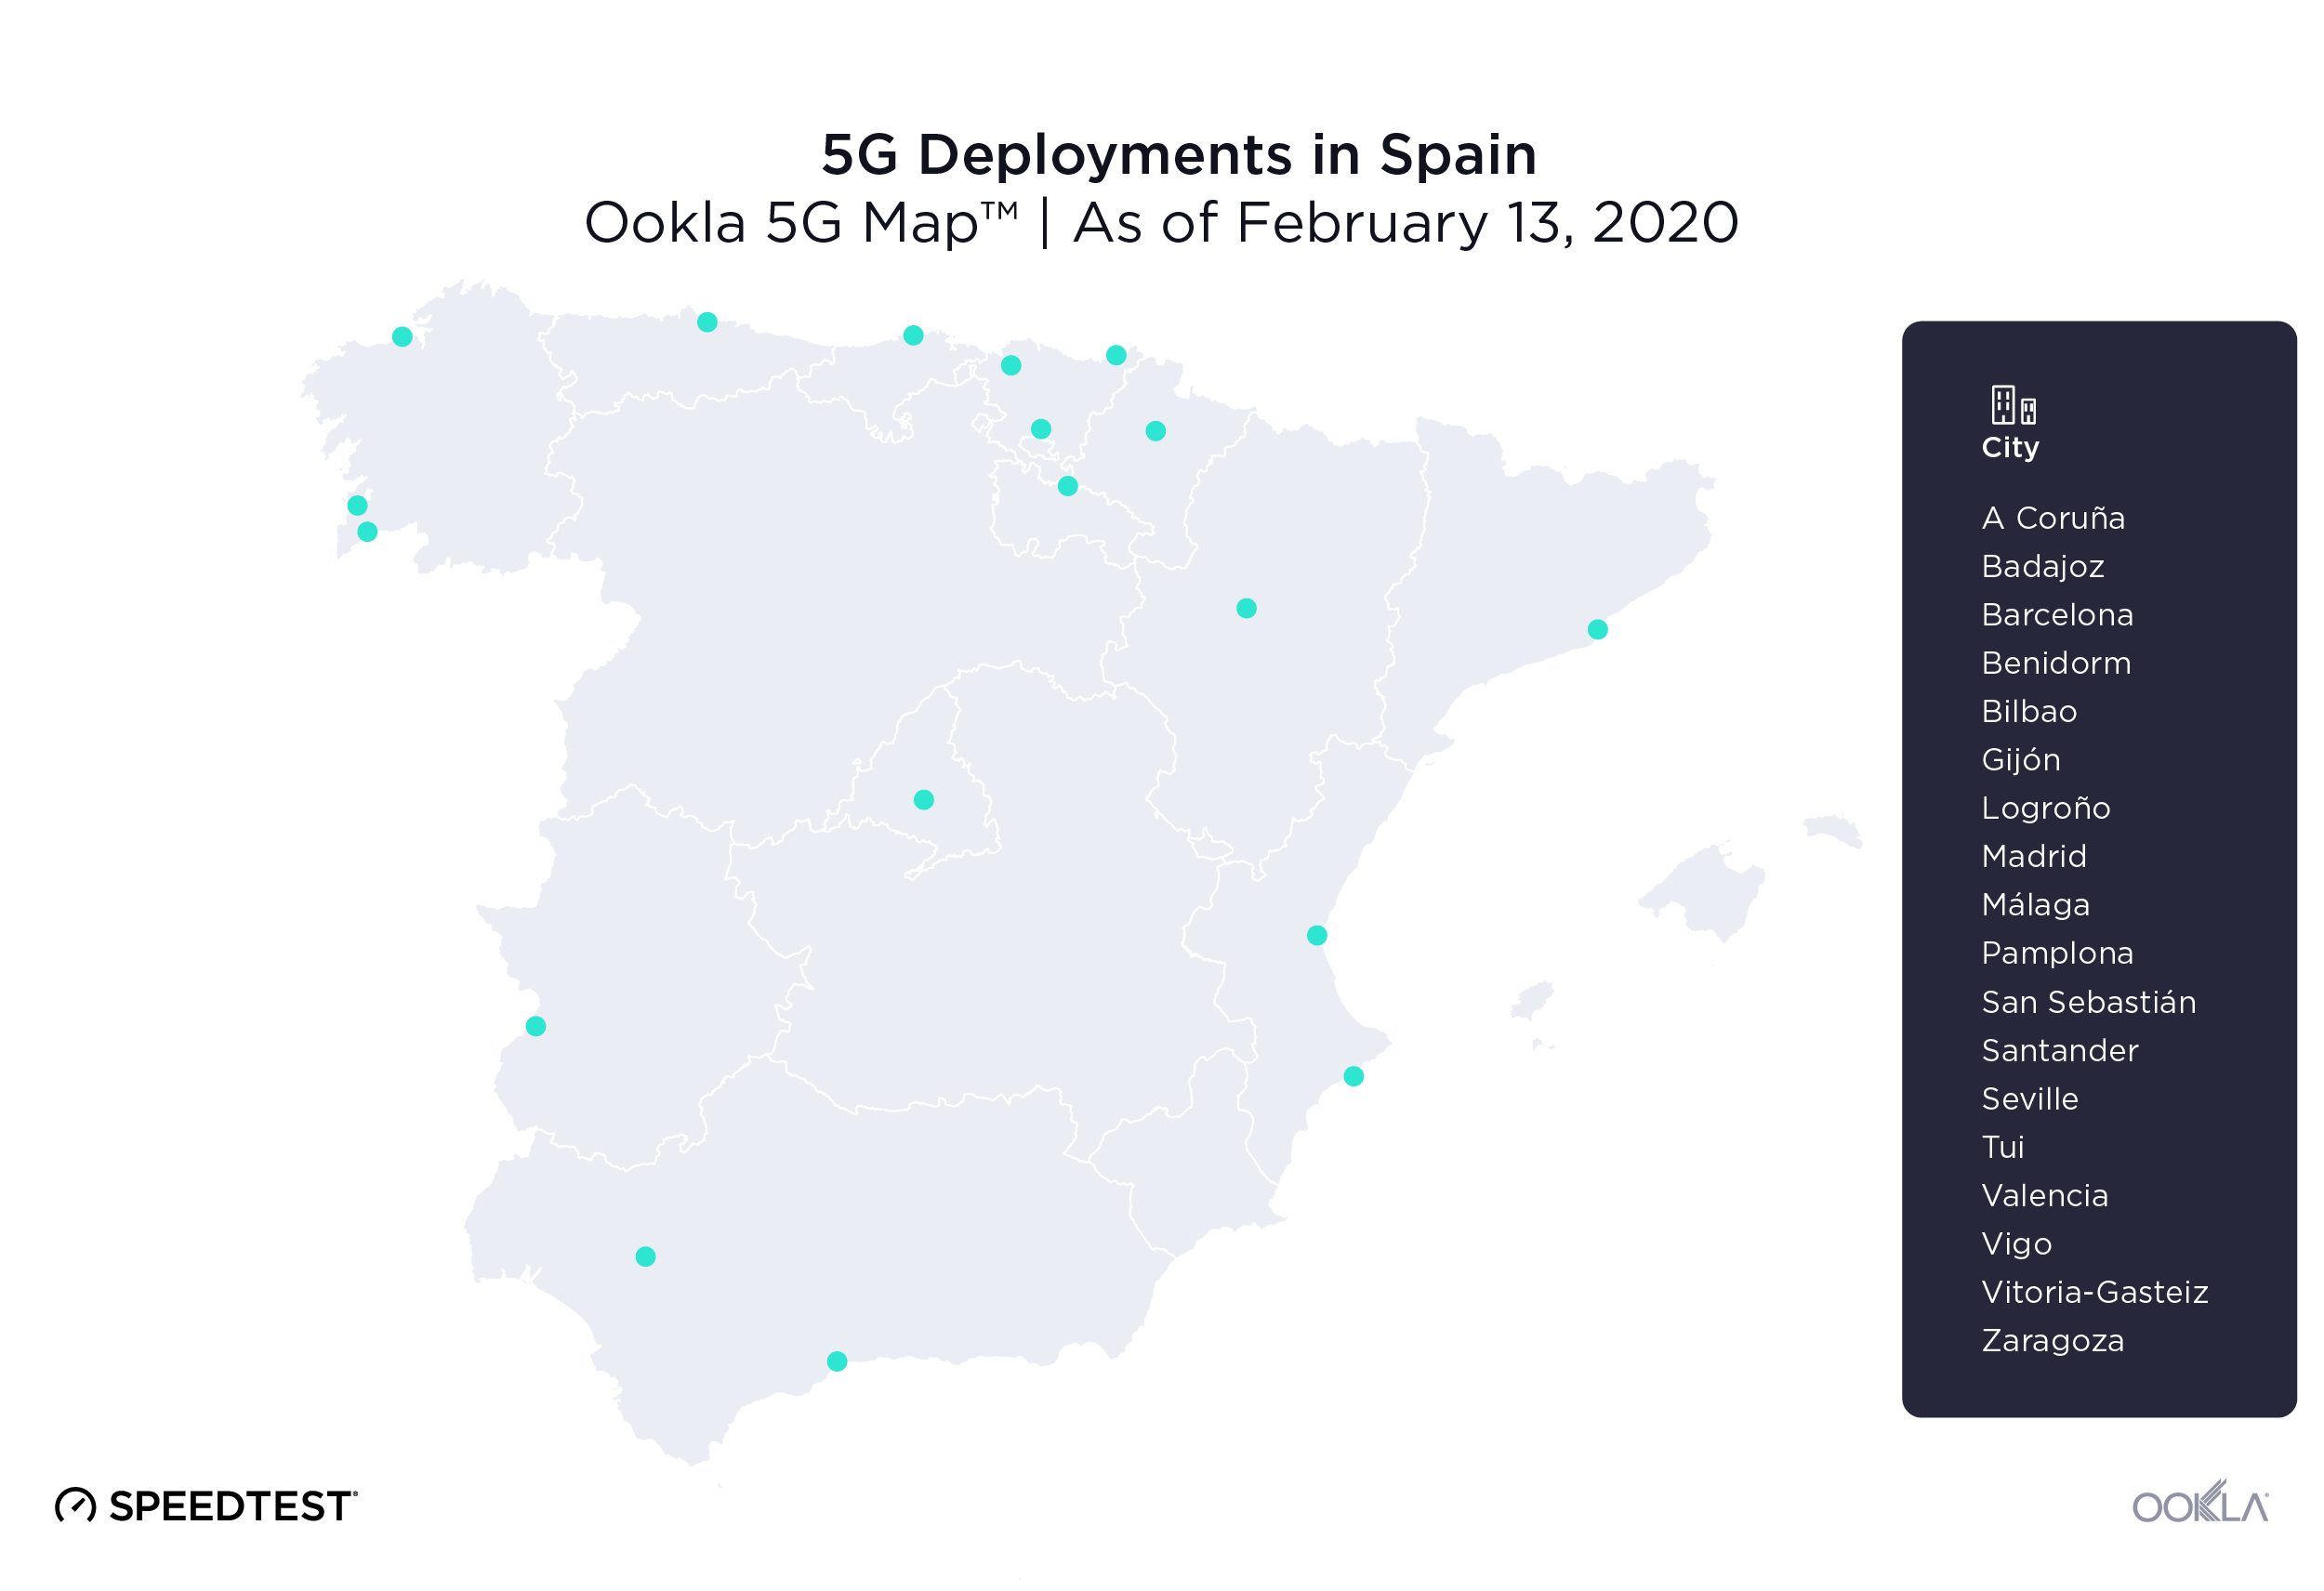
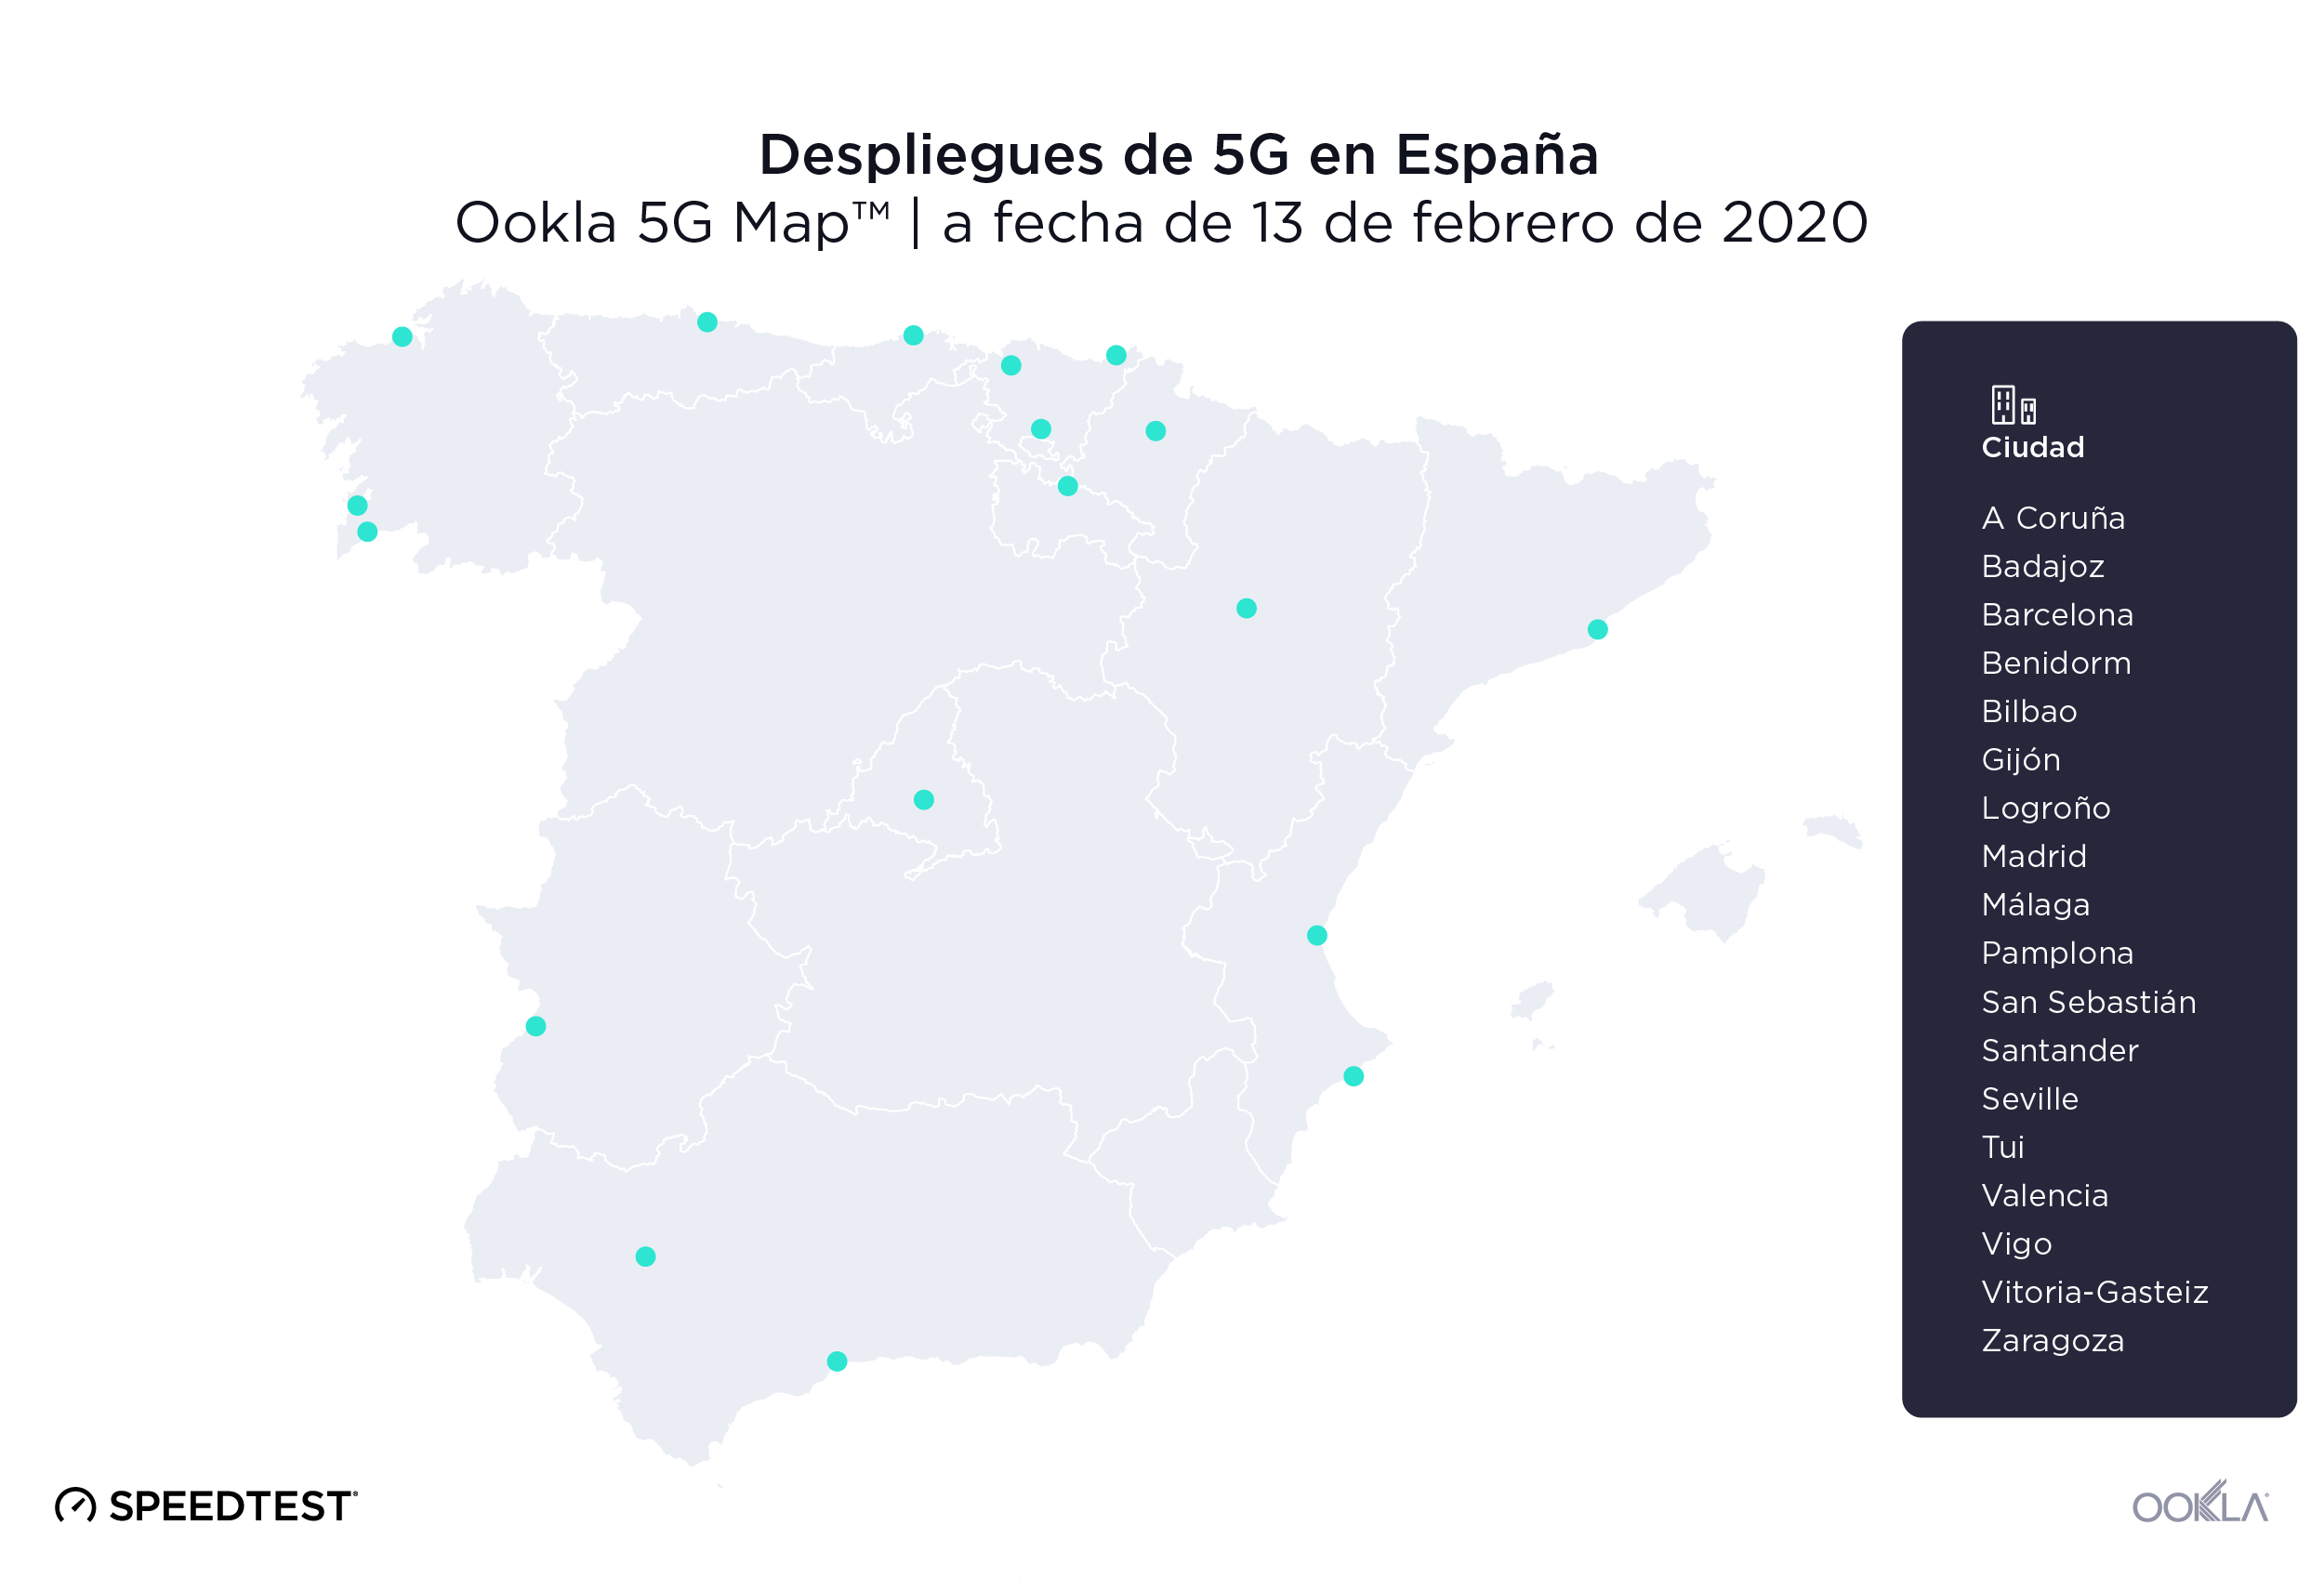
The excitement for 5G is evident in Spain. Vodafone had commercially available 5G deployments in a total of 18 Spanish cities as of February 13, 2020, including Barcelona, Madrid, Valencia, Málaga and Bilbao. Speedtest data reveals the mean download speed on 5G for Spain in Q3-Q4 2019 was 350.68 Mbps — an order of magnitude faster than the national average for mobile download speed — and the mean upload speed over 5G was 31.82 Mbps. Mean latency over 5G in Spain was 27 ms during Q3-Q4 2019.

MÁSMÓVIL was Spain’s fastest fixed broadband provider

Using Speed Score, a metric that combines measures of download and upload speed, to compare top ISPs in Spain during Q3-Q4 2019, we found that MÁSMÓVIL led with a score of 133.75 on fixed broadband. Orange was in second place with 115.25, followed by Vodafone (105.07) and Movistar (103.01).

Fixed Broadband Performance by Provider in Spain
Speedtest Intelligence® | Q3-Q4 2019
Provider Speed ScoreTM
MÁSMÓVIL 133.75
Orange 115.25
Vodafone 105.07
Movistar 103.01

Movistar was Spain’s fastest mobile operator

Movistar had the highest Speed Score among Spain’s mobile operators during Q3-Q4 2019 at 37.76. Orange was second at 33.02, Vodafone third at 26.34 and Yoigo fourth at 22.43. As we will discuss below, overall speed performance can be impacted by the speed caps and tariff plans that are in place in Spain.

Mobile Performance by Operator in Spain
Speedtest Intelligence® | Q3-Q4 2019
Provider Speed ScoreTM
Movistar 37.76
Orange 33.02
Vodafone 26.34
Yoigo 22.43

Speed capping affects overall performance

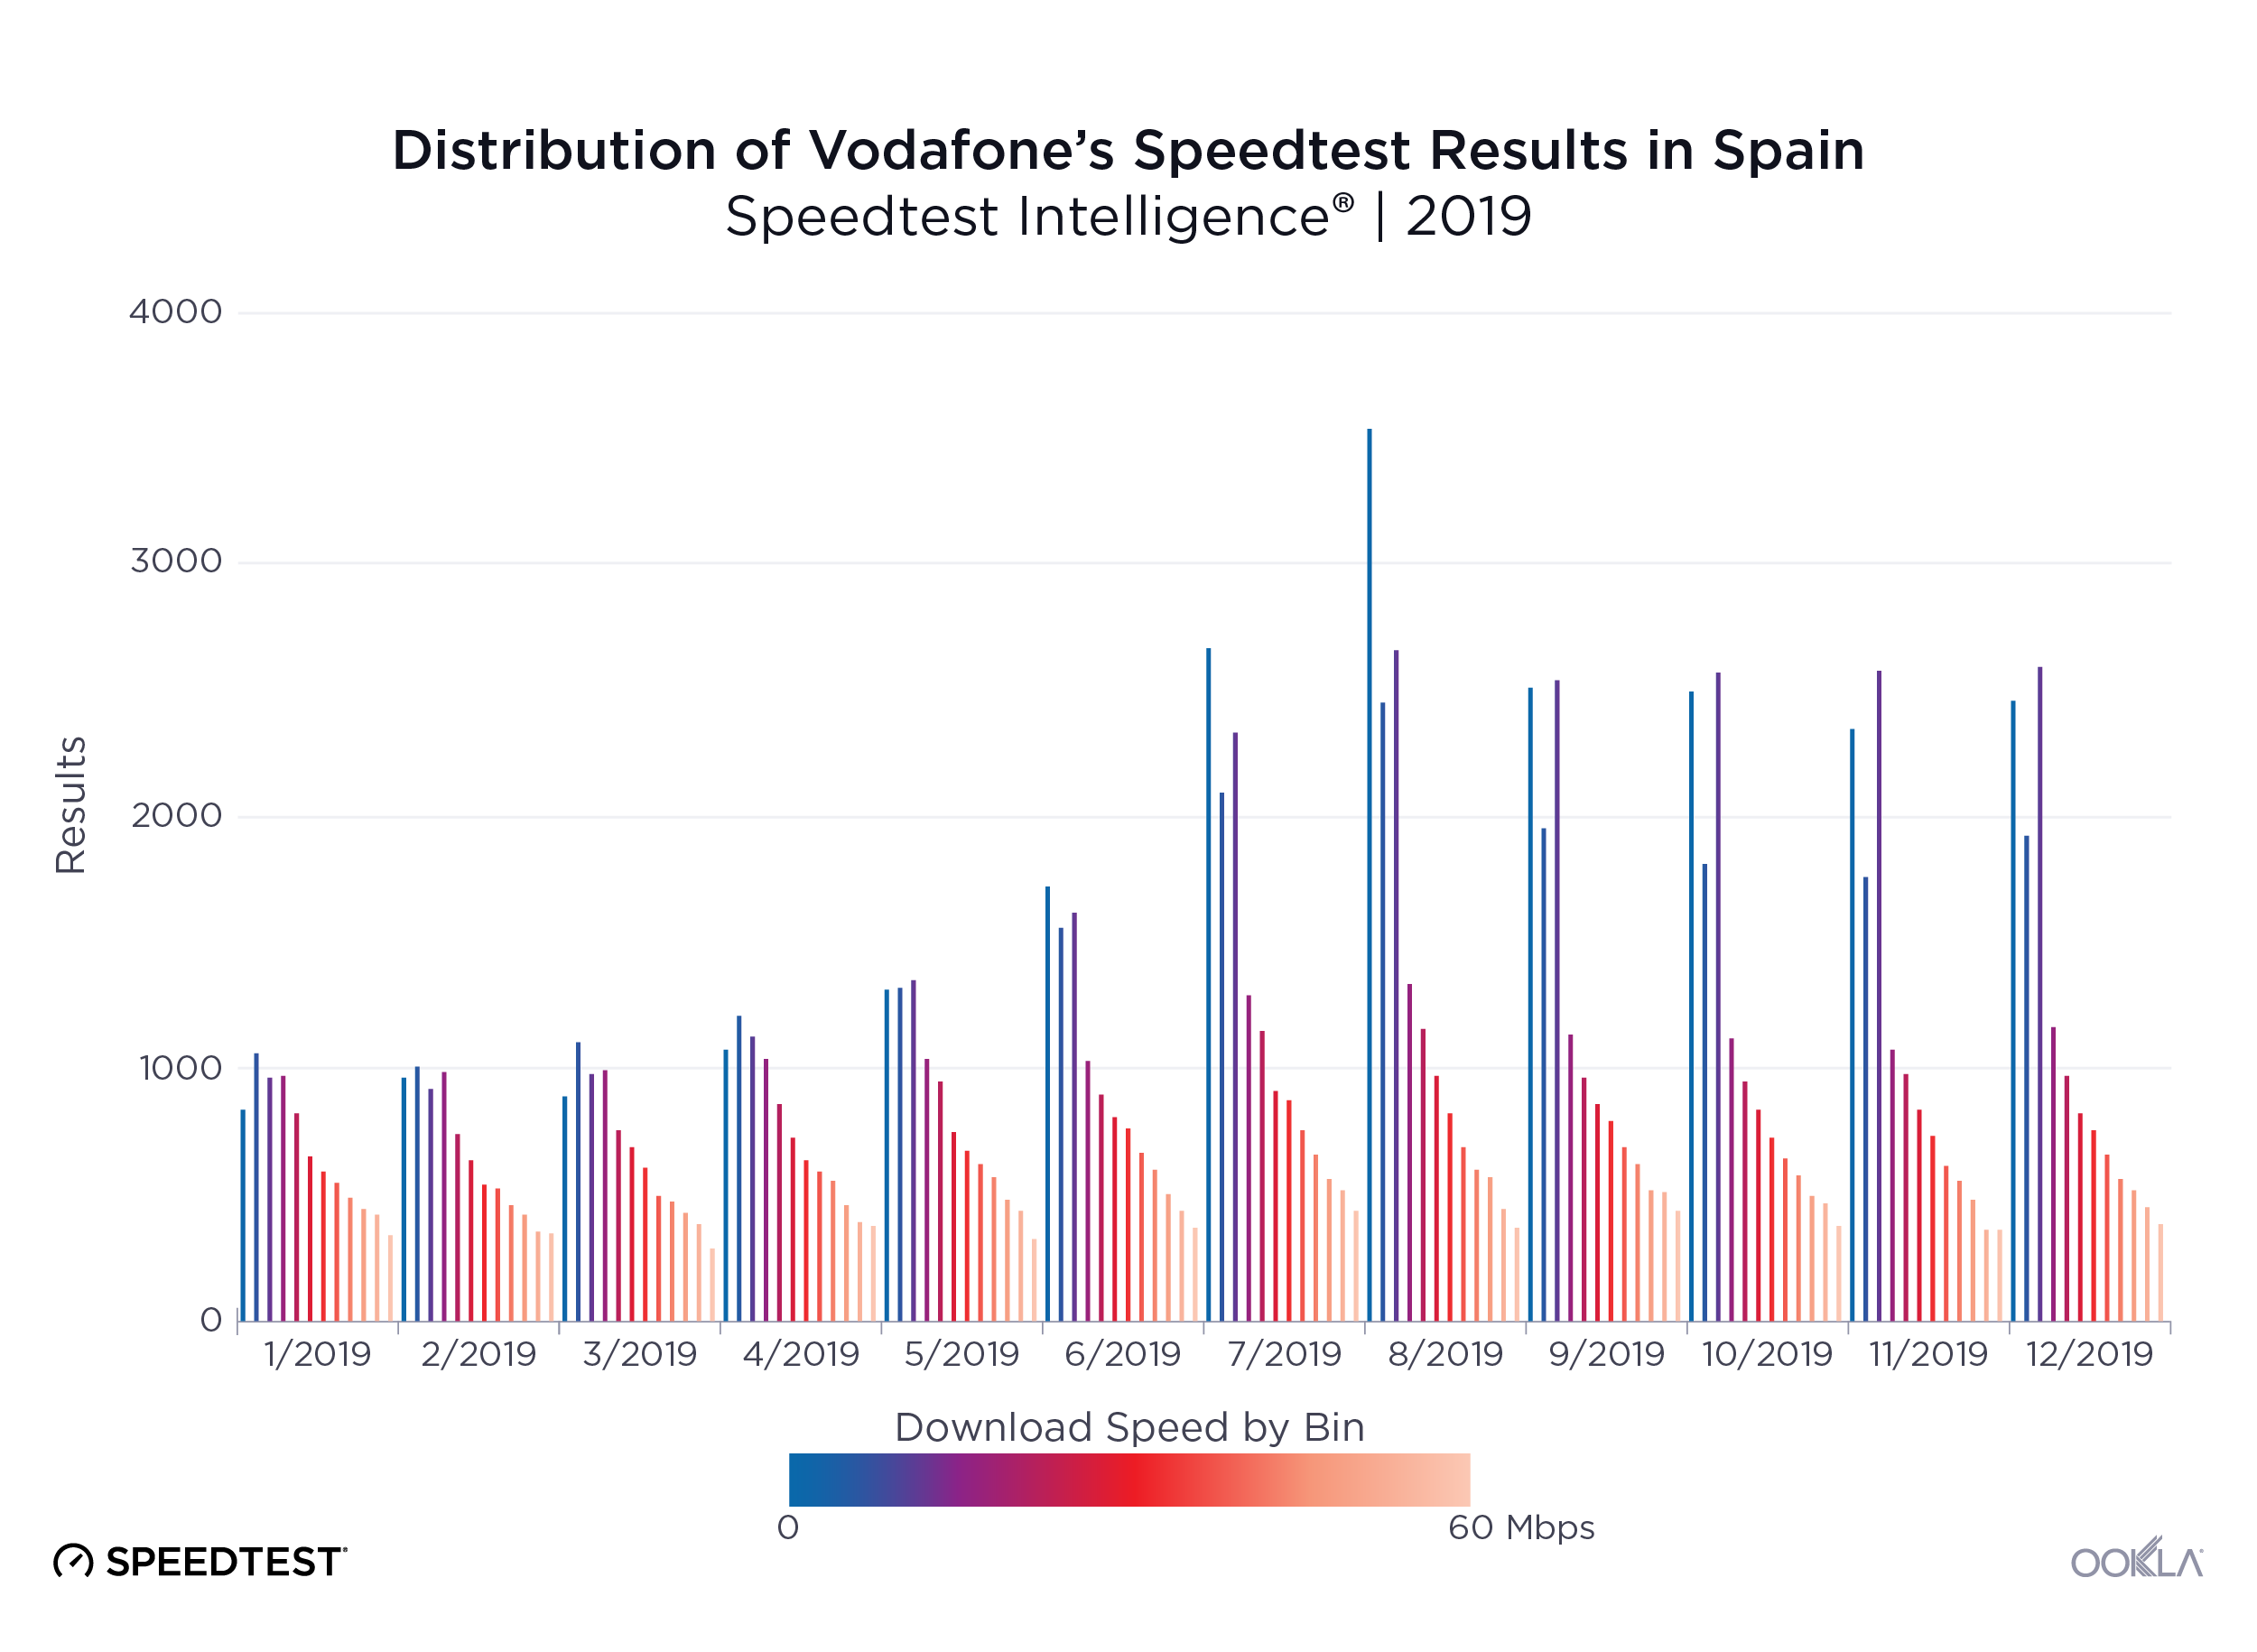
Speed capping, a limit of service imposed onto an internet connection by an operator, allows operators to also offer plans that focus on affordability rather than maximum performance.
Ookla_Distribution-Speedtest-Results_Vodafone_Spain_0220-3_en
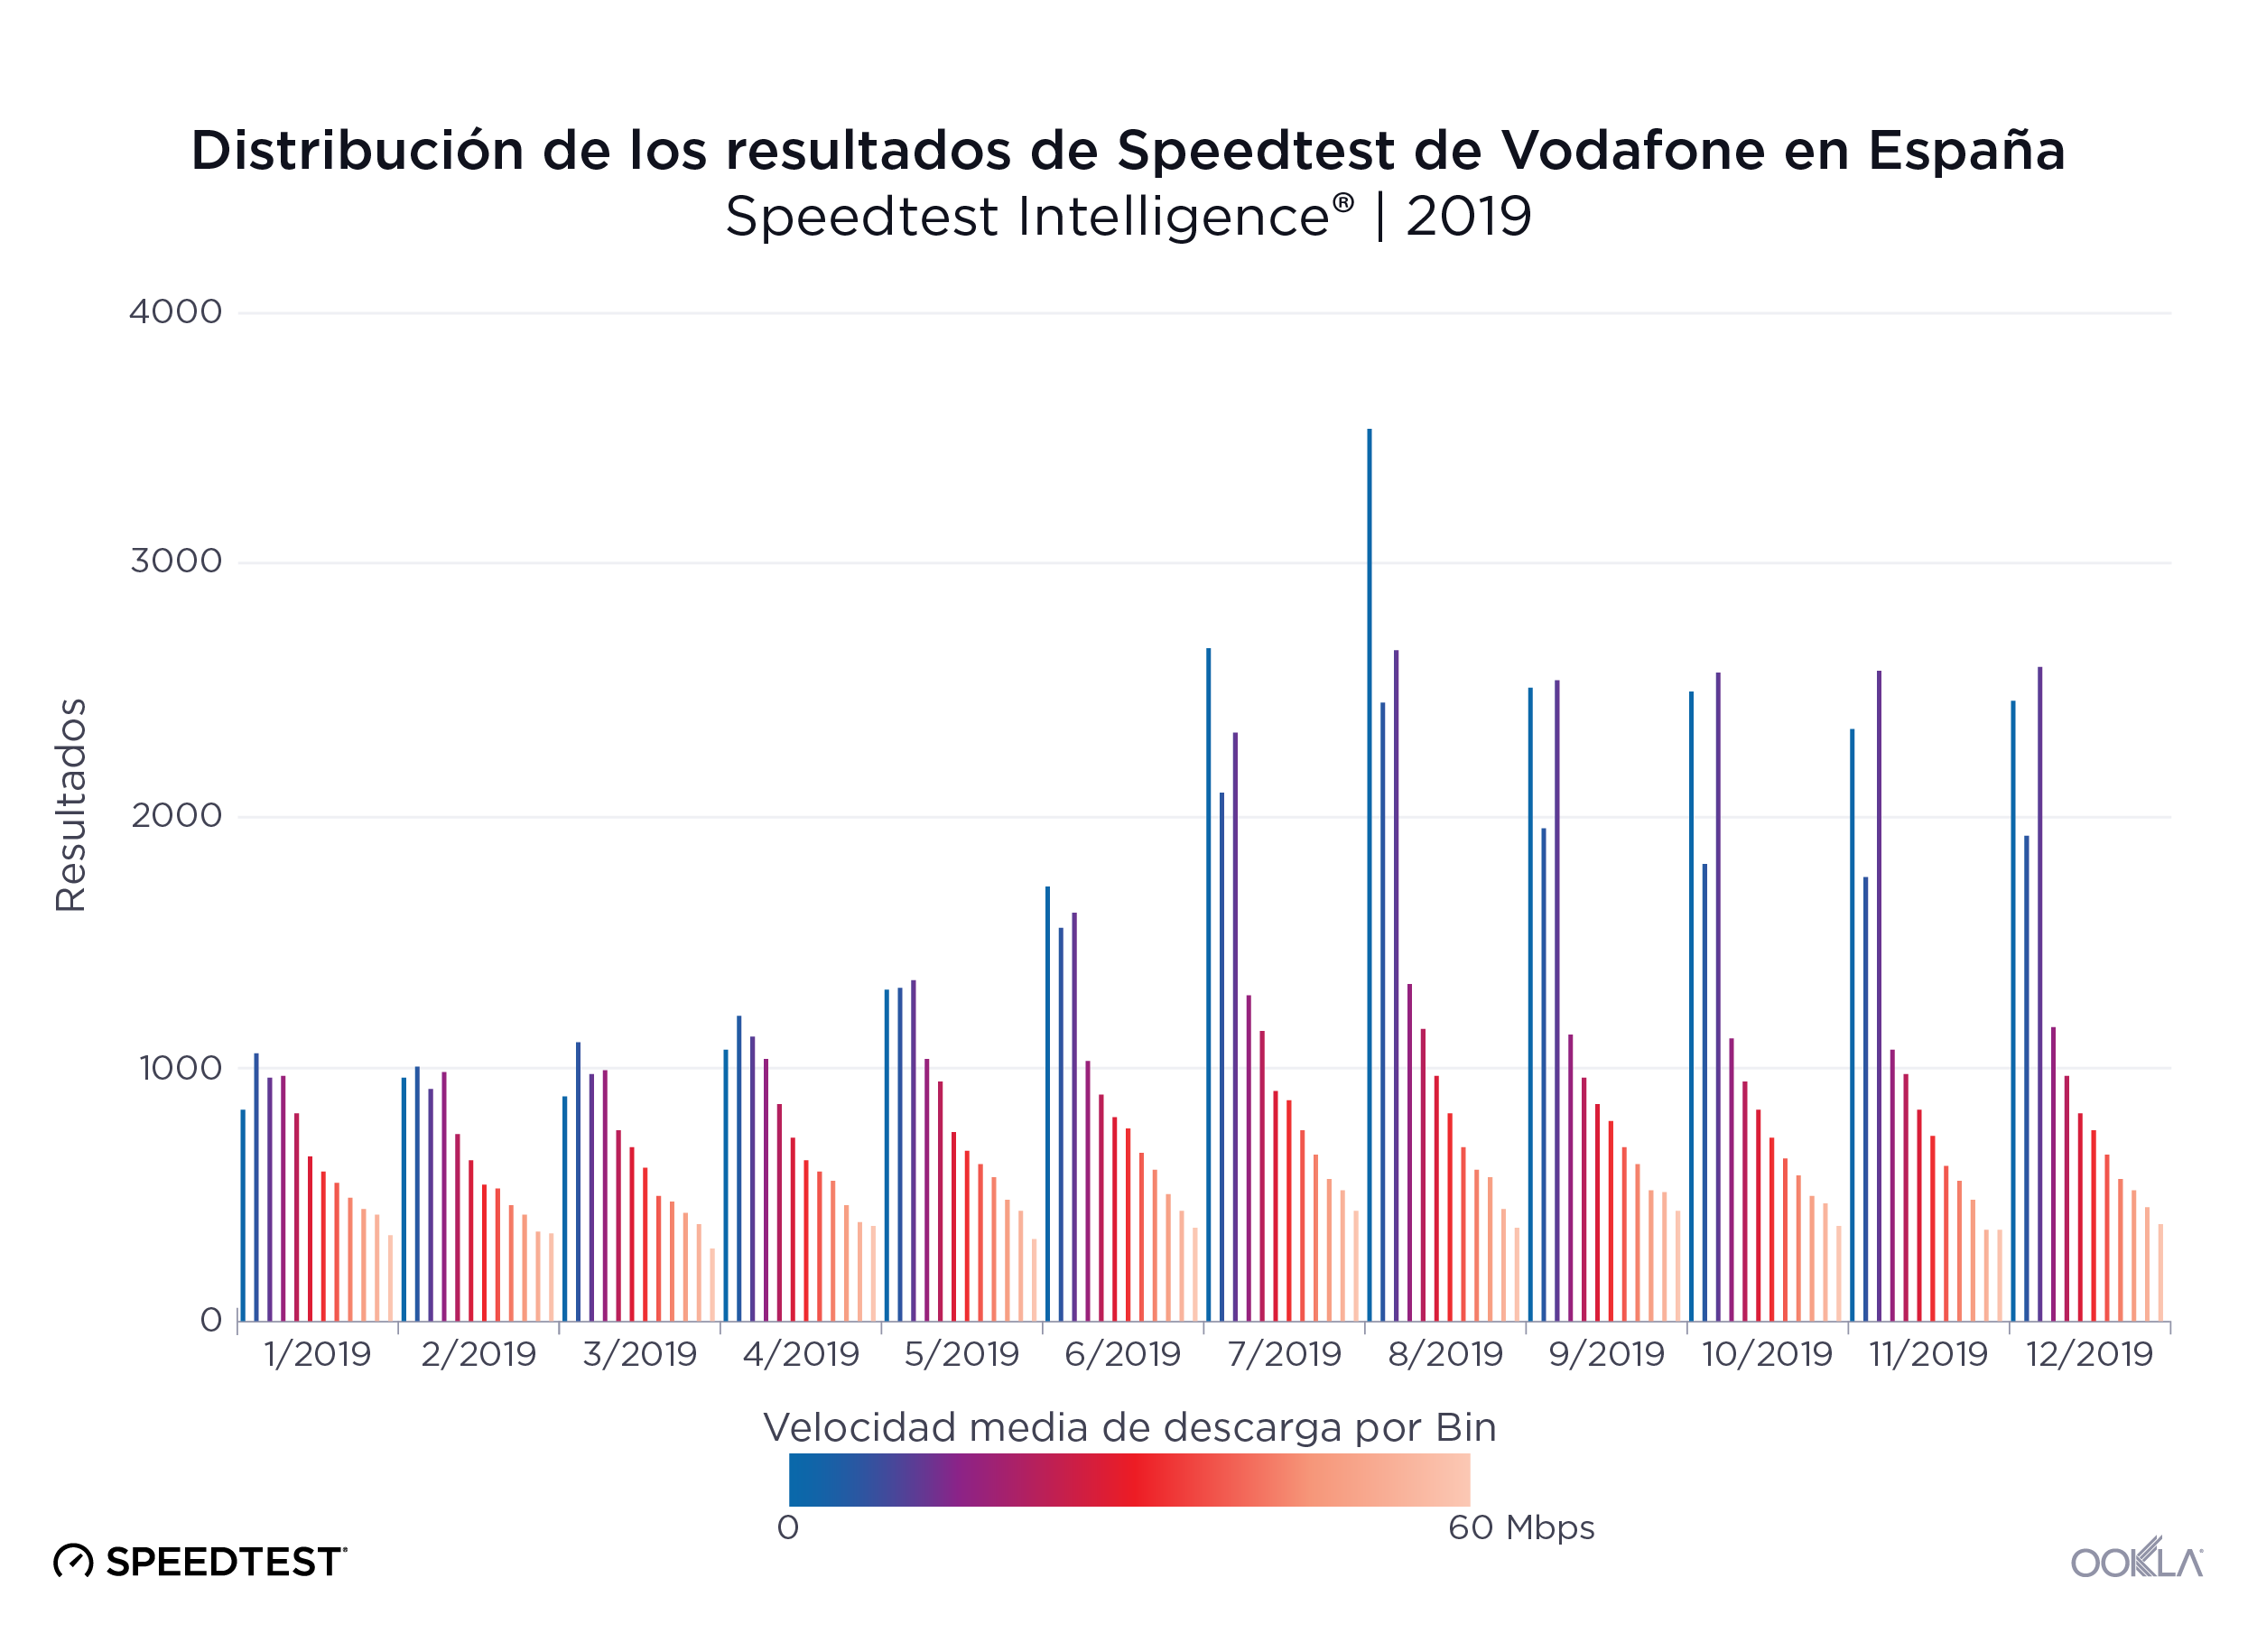
The chart above shows how Vodafone’s introduction of subscription plans that use speed capping affected the distribution of download speeds. While those plans (with caps at 2 Mbps and 10 Mbps, respectively) were available starting in April, we don’t see the true effect on average speeds until May and June when the 0-5 Mbps and 10-15 Mbps buckets start to spike. We’ve only showed bins up to 60 Mbps to make this and the following graphs more legible.

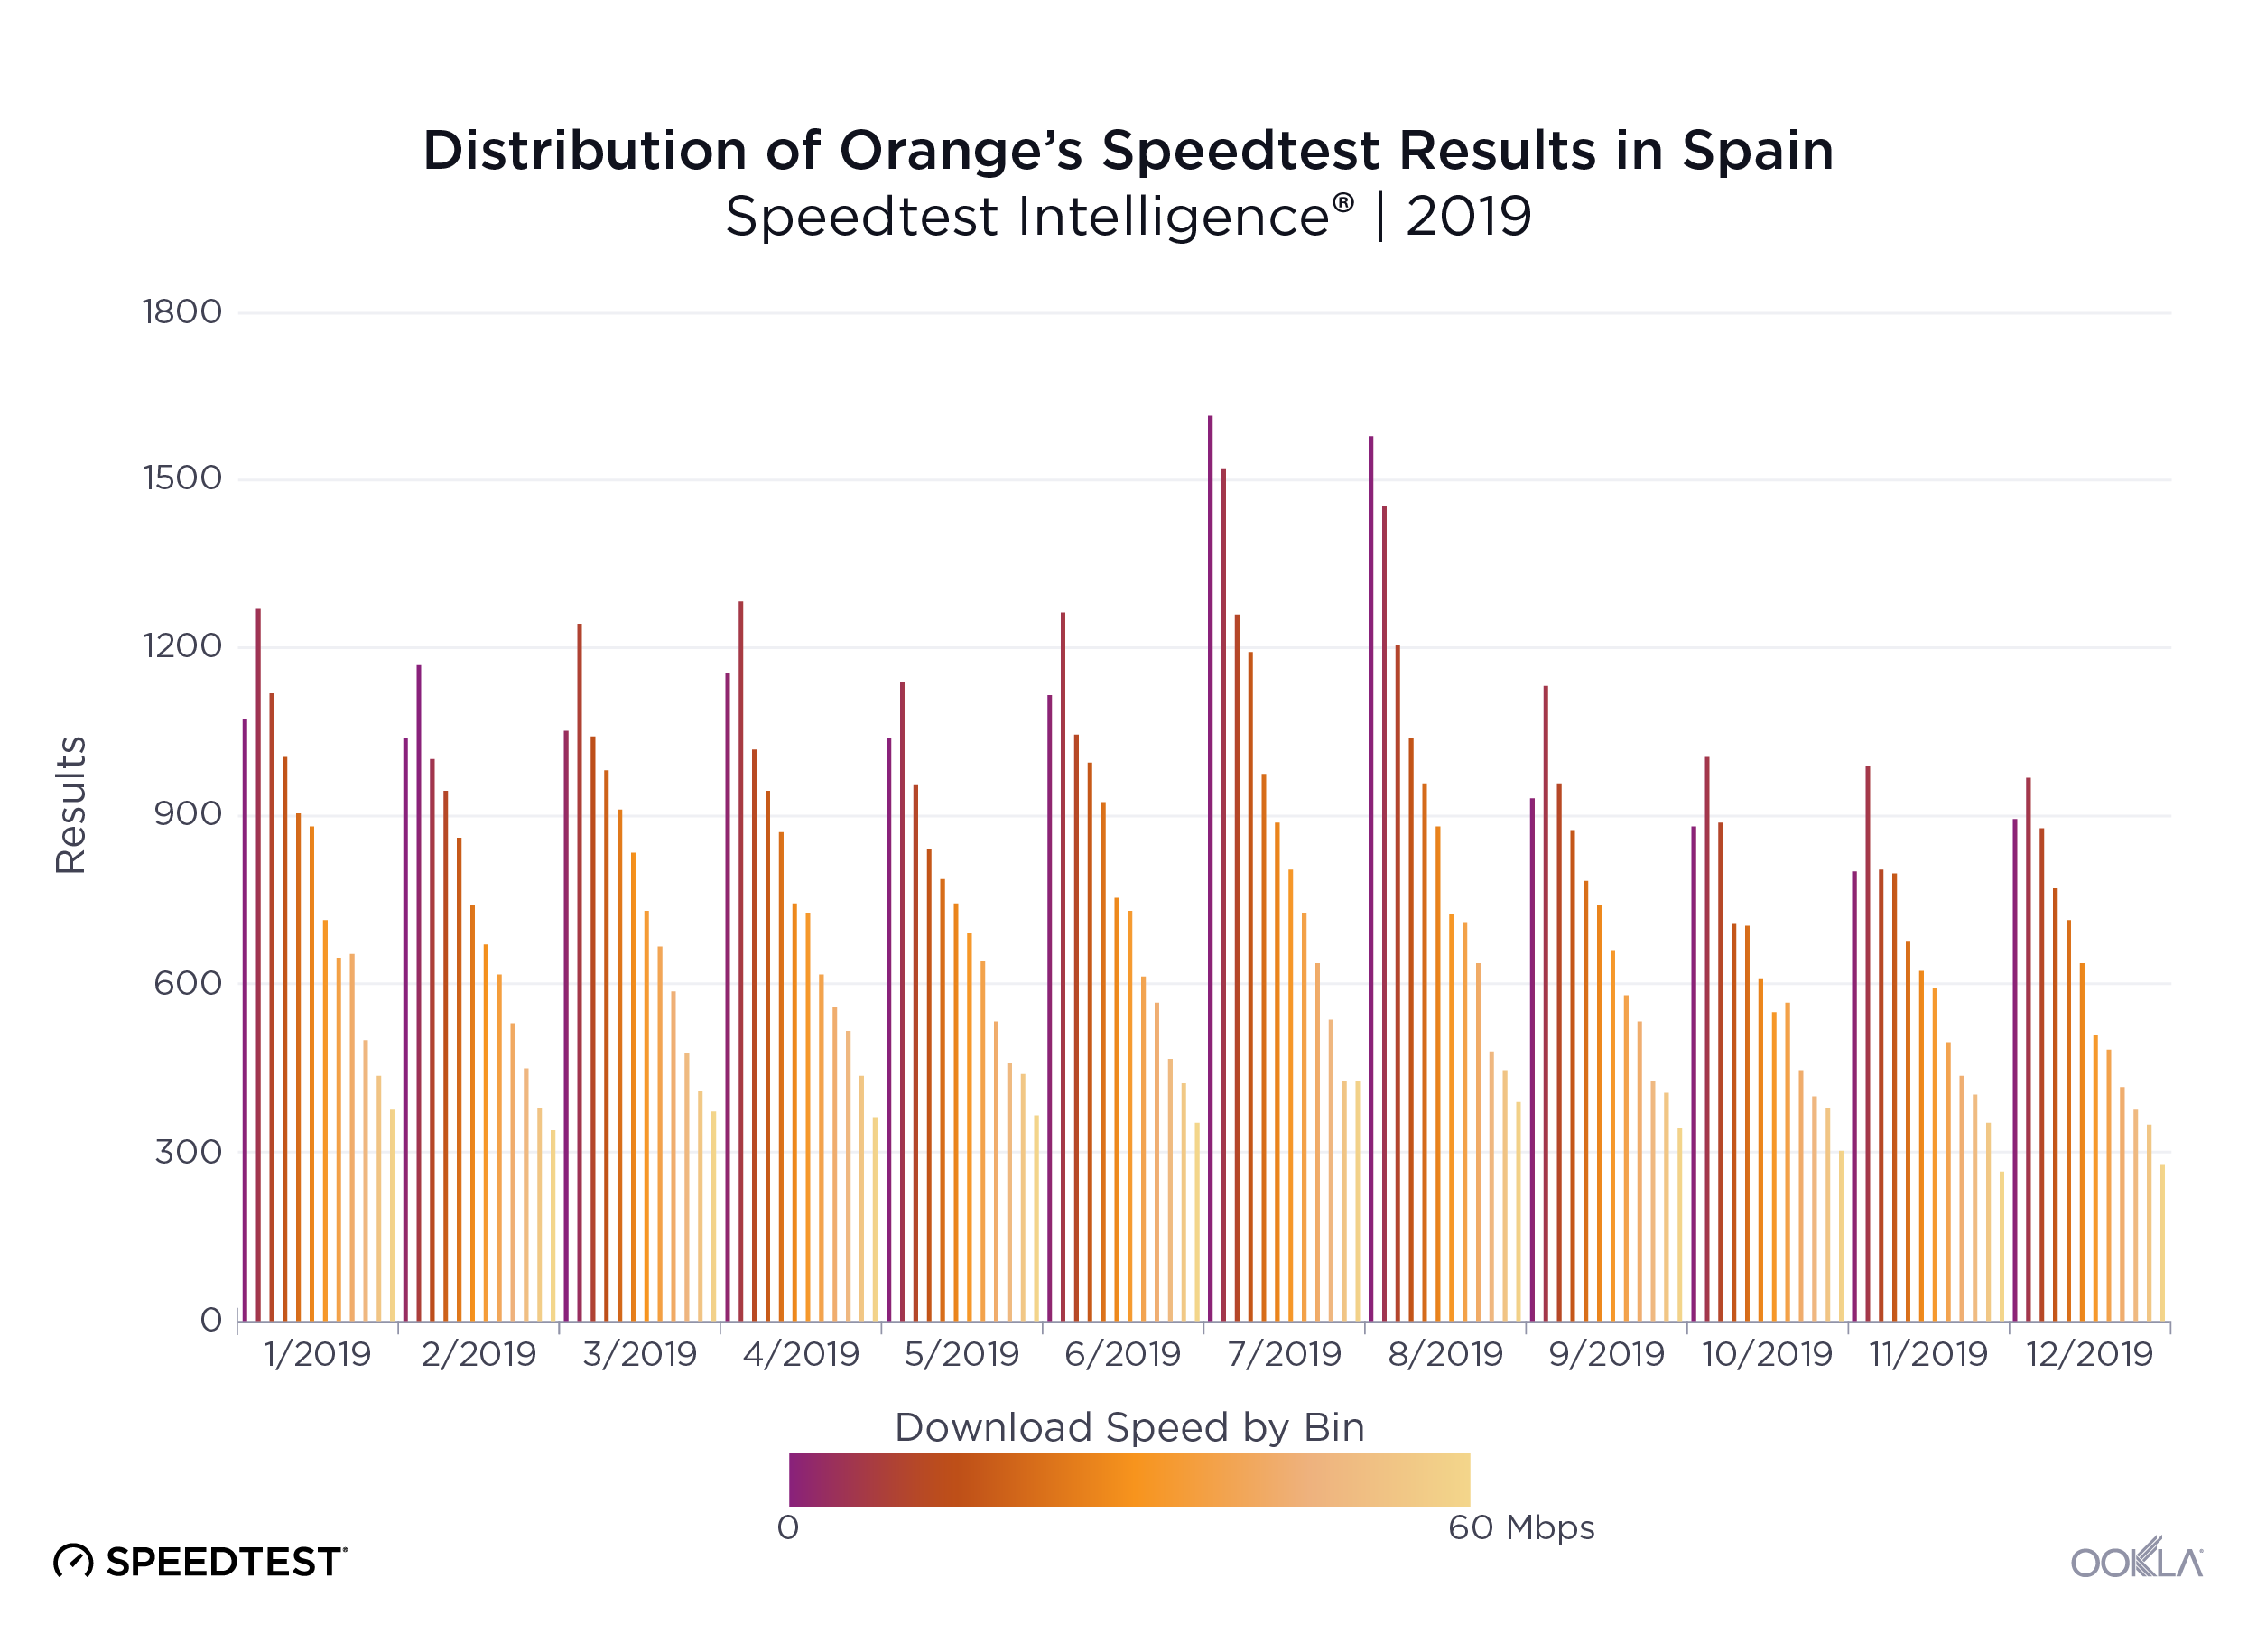
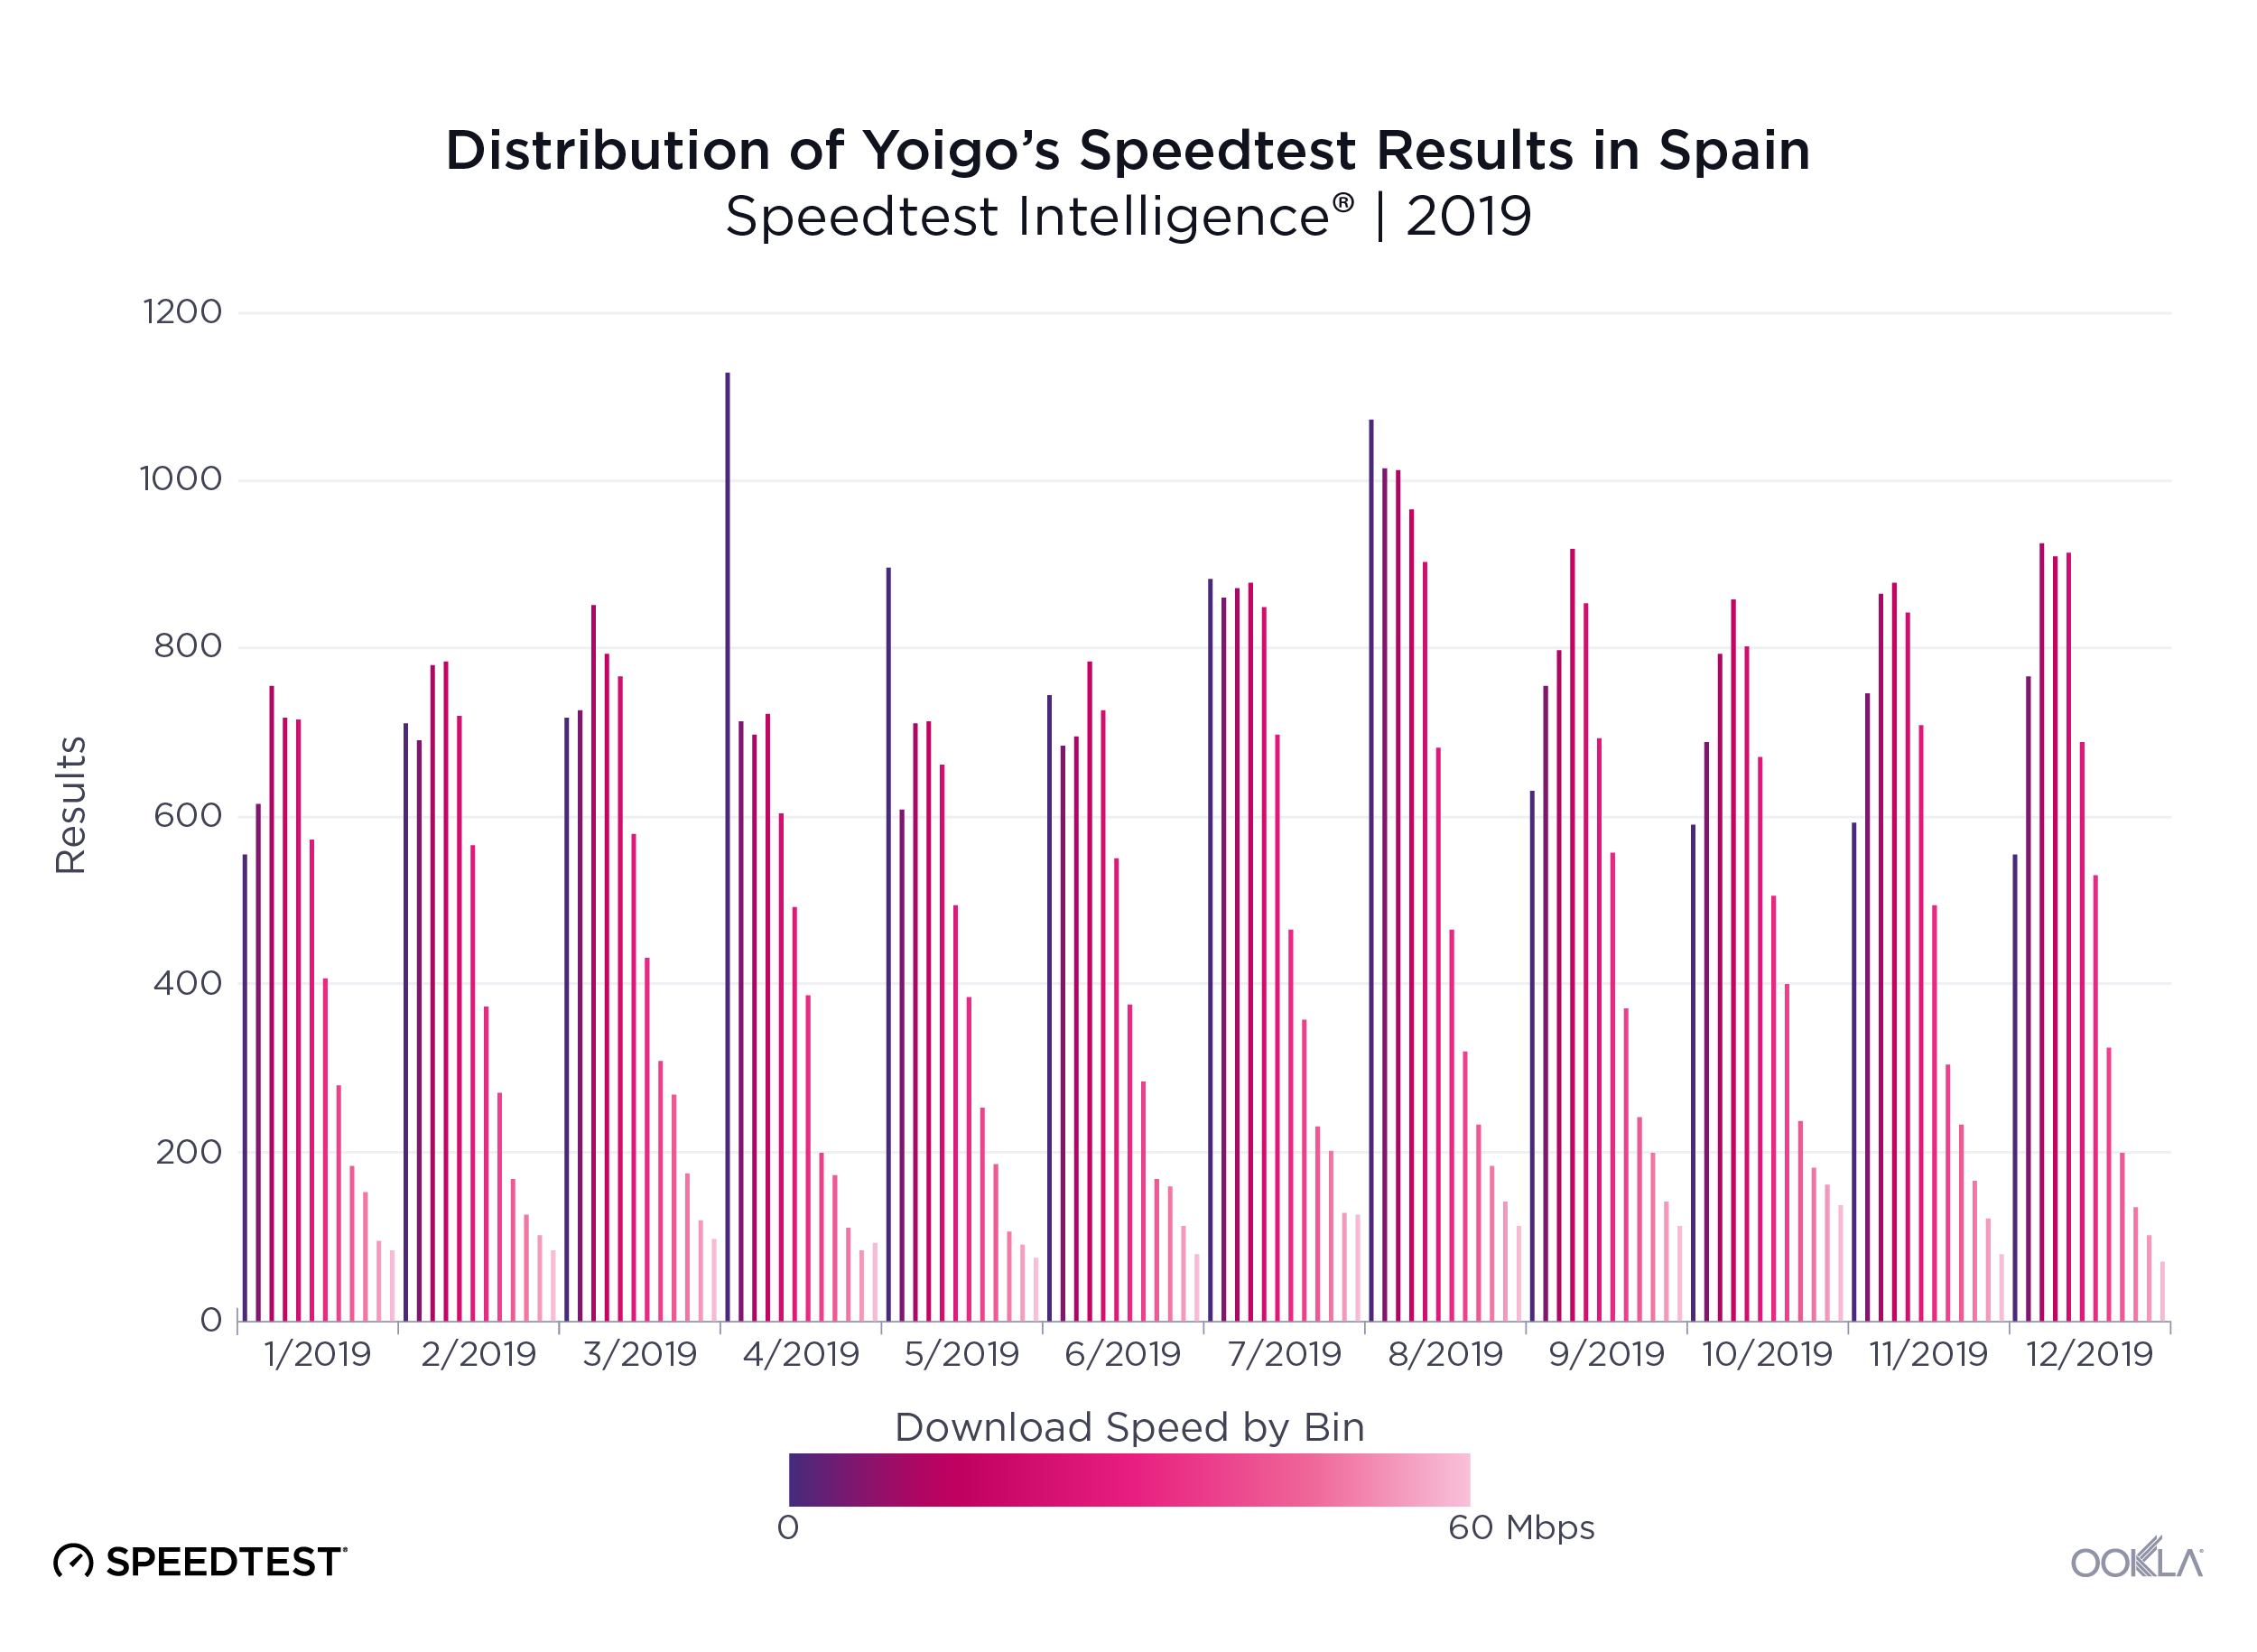
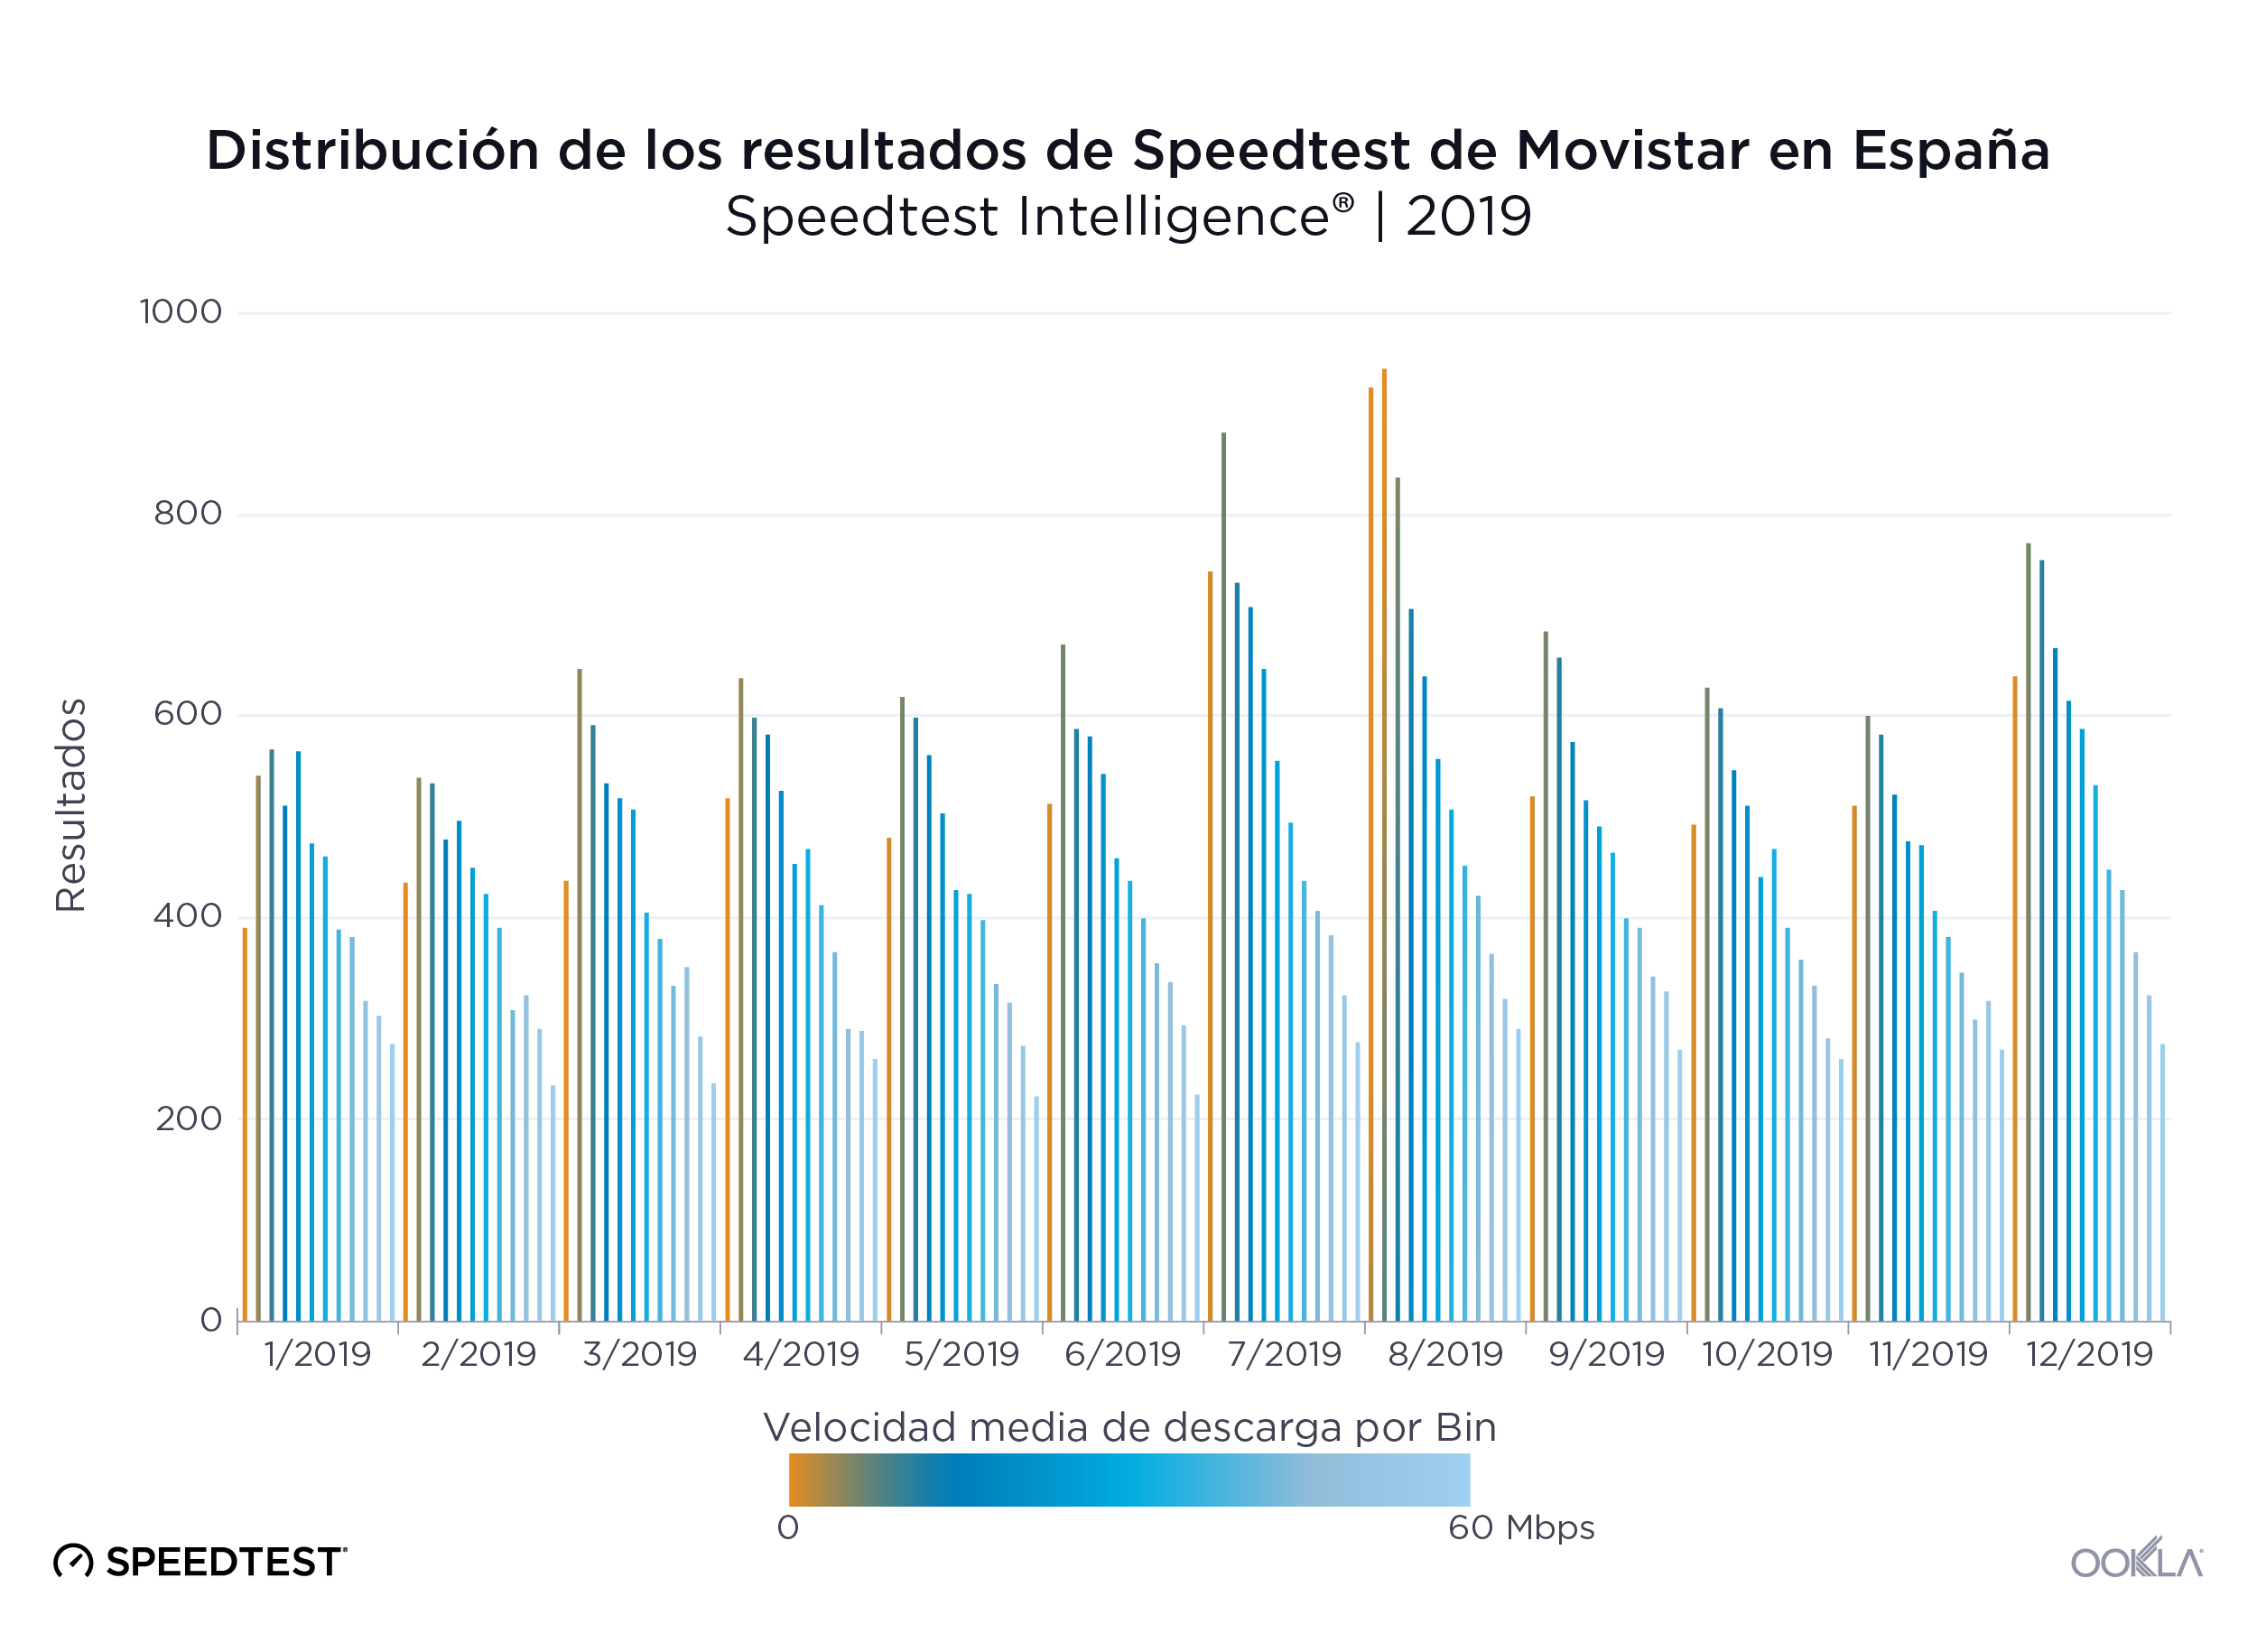
In contrast, we see more even distributions of download speeds among all other mobile operators in Spain.
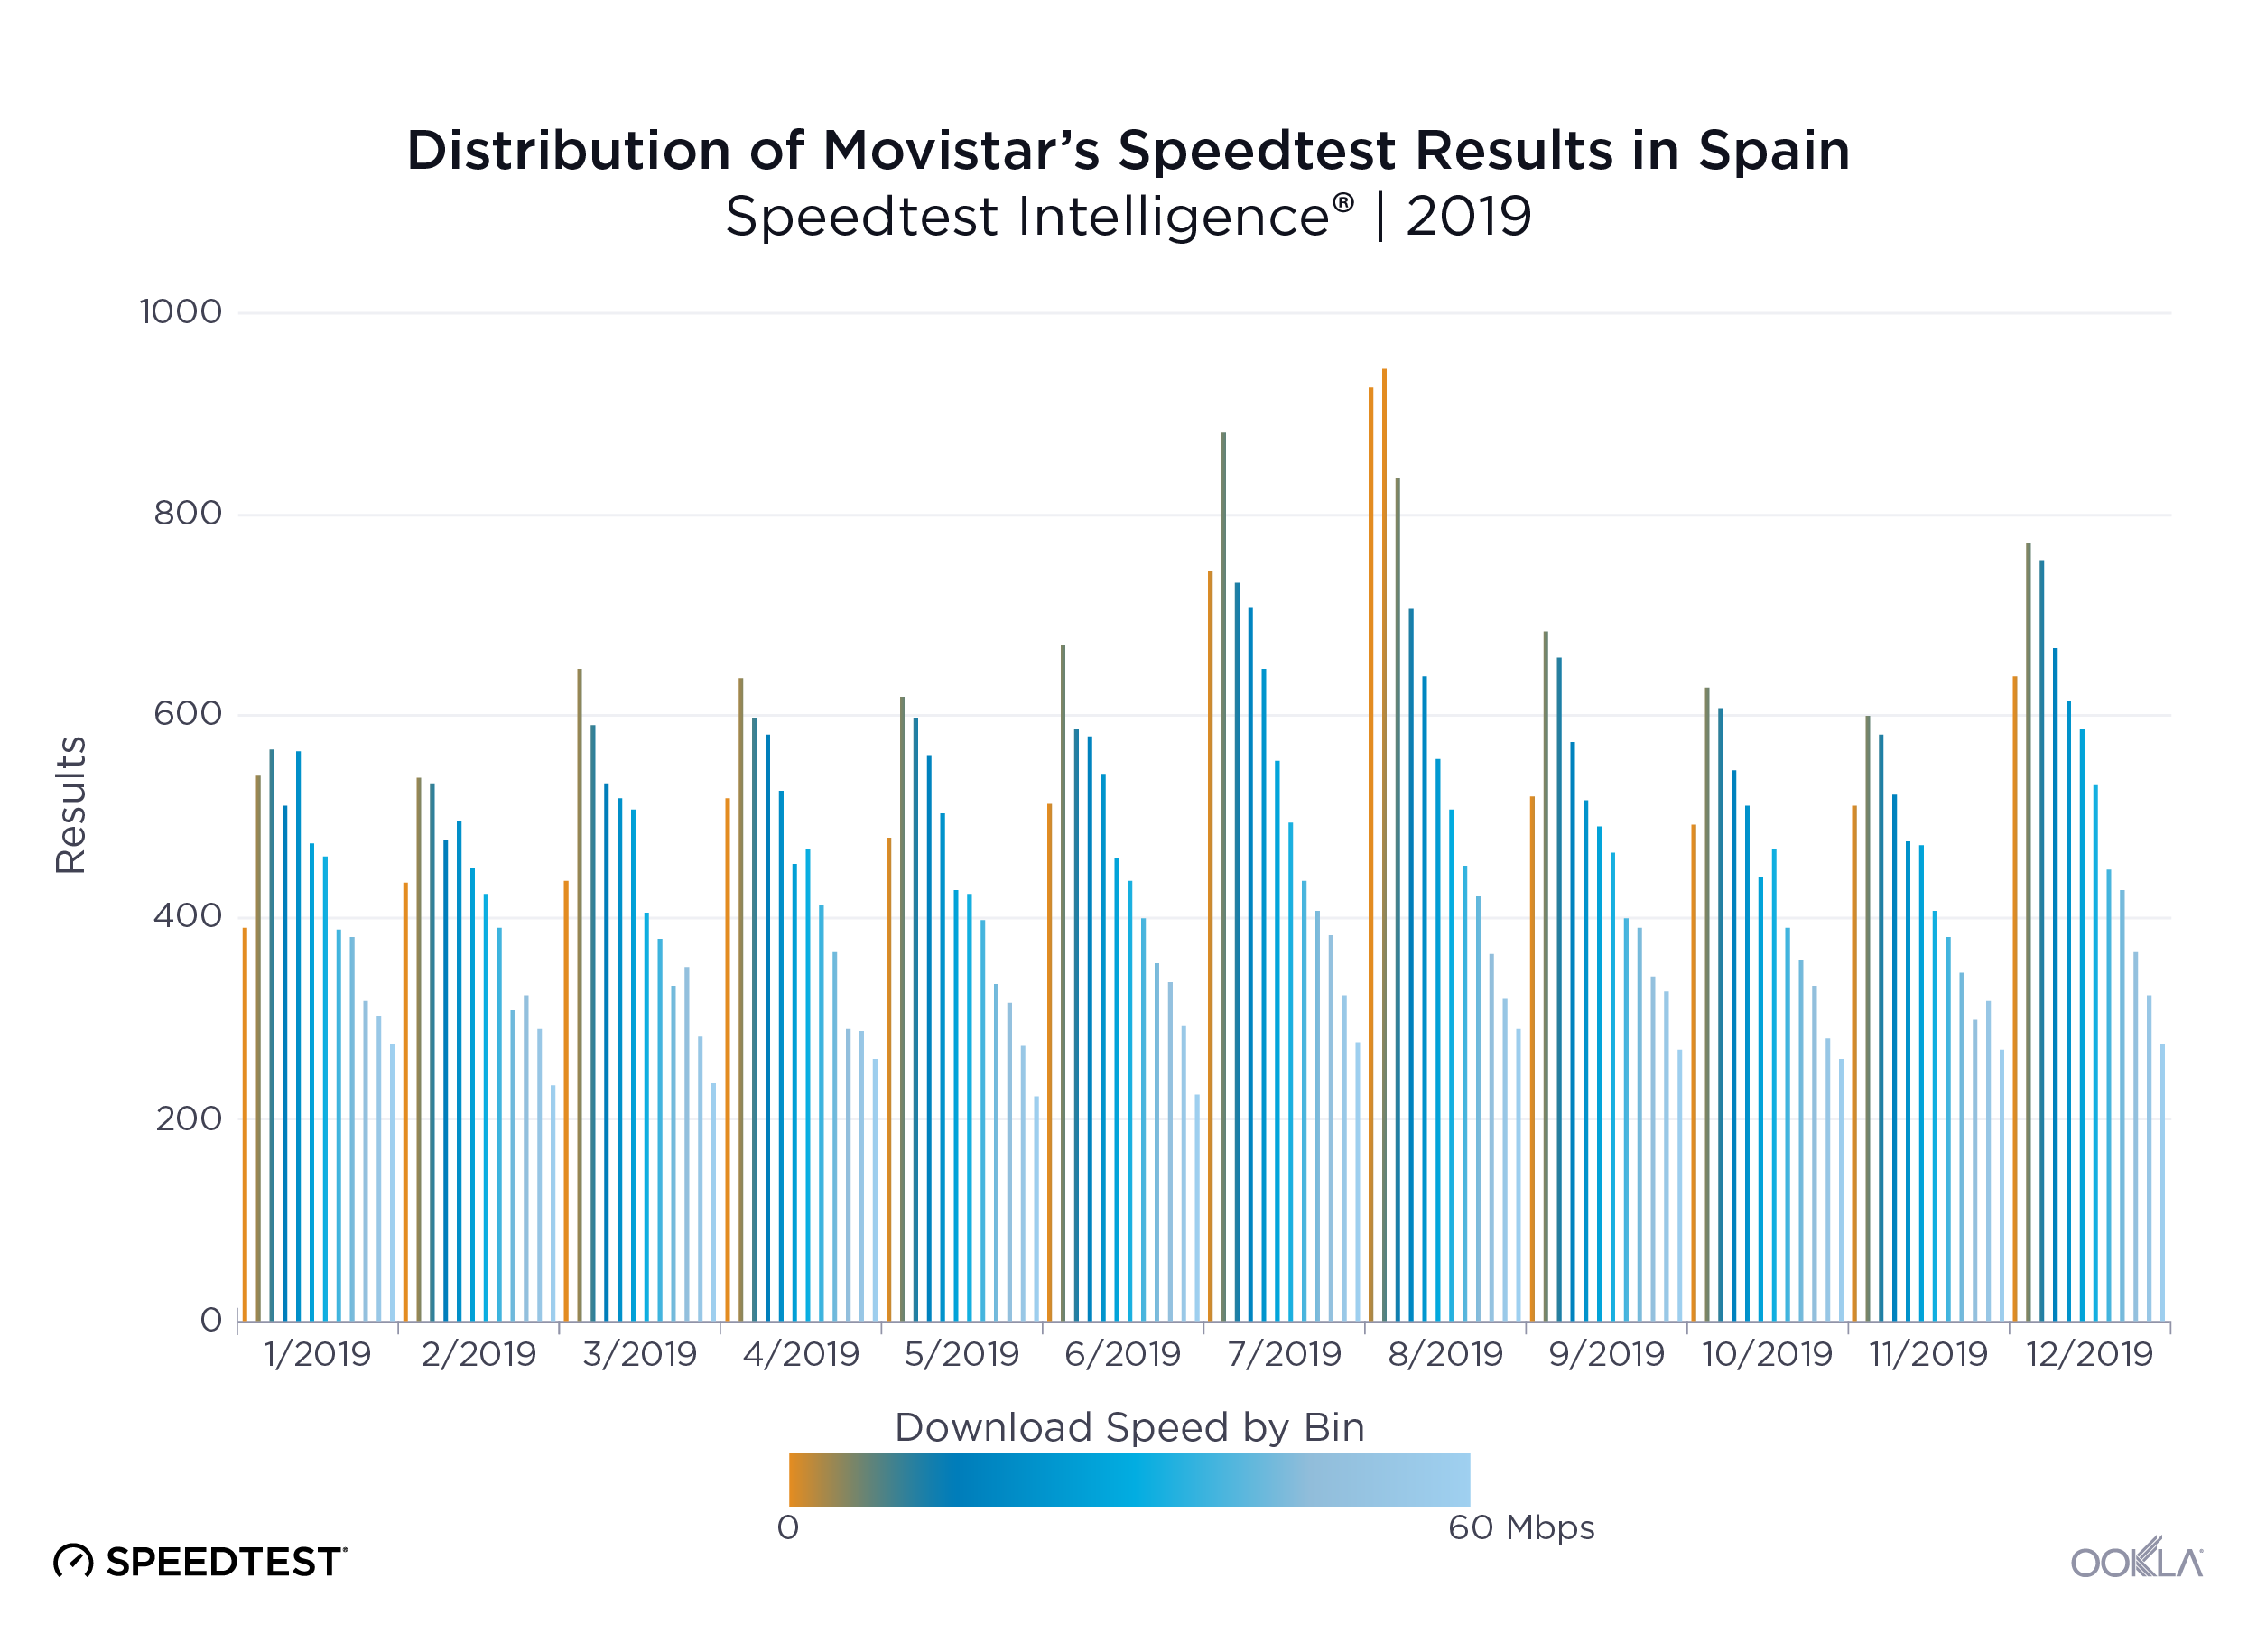
Ookla_Distribution-Speedtest-Results_Movistar_Spain_0220-3_en
Ookla_Distribution-Speedtest-Results_Orange_Spain_0220-3_en
Ookla_Distribution-Speedtest-Results_Yoigo_Spain_0220-3_en

MÁSMÓVIL and Movistar (mobile) offer the most consistent speeds

Speed is important, but if those speeds are inconsistent, it becomes difficult for users to reliably use their devices to stream HD video, browse the web or use online gaming. We used Speedtest data to calculate each top provider’s APS (Acceptable Performance Score) in Spain during Q3-Q4 2019.

APS for fixed broadband measures the percentage of samples that equal or exceed a download speed of 25 Mbps and also equal or exceed an upload speed of 3 Mbps. MÁSMÓVIL provided the most consistent experience in Spain on fixed broadband in Q3-Q4 2019 with an APS of 81.6%. Movistar was in last place with an APS of 61.9%.

Speed Consistency by Provider on Fixed Broadband
Speedtest Intelligence® | Q3-Q4 2019
Provider APS
MÁSMÓVIL 81.6%
Orange 75.1%
Vodafone 73.5%
Movistar 61.9%

APS on mobile measures the percentage of samples that equal or exceed a download speed of 5 Mbps and also equal or exceed an upload speed of 1 Mbps. Movistar took the top spot for consistency on mobile broadband with an APS of 88.9%. Vodafone had the lowest consistency score with an APS of 79.8%.

Speed Consistency by Operator on Mobile
Speedtest Intelligence® | Q3-Q4 2019
Provider APS
Movistar 88.9%
Orange 84.3%
Yoigo 82.6%
Vodafone 79.8%

Madrid led fixed and mobile broadband speeds
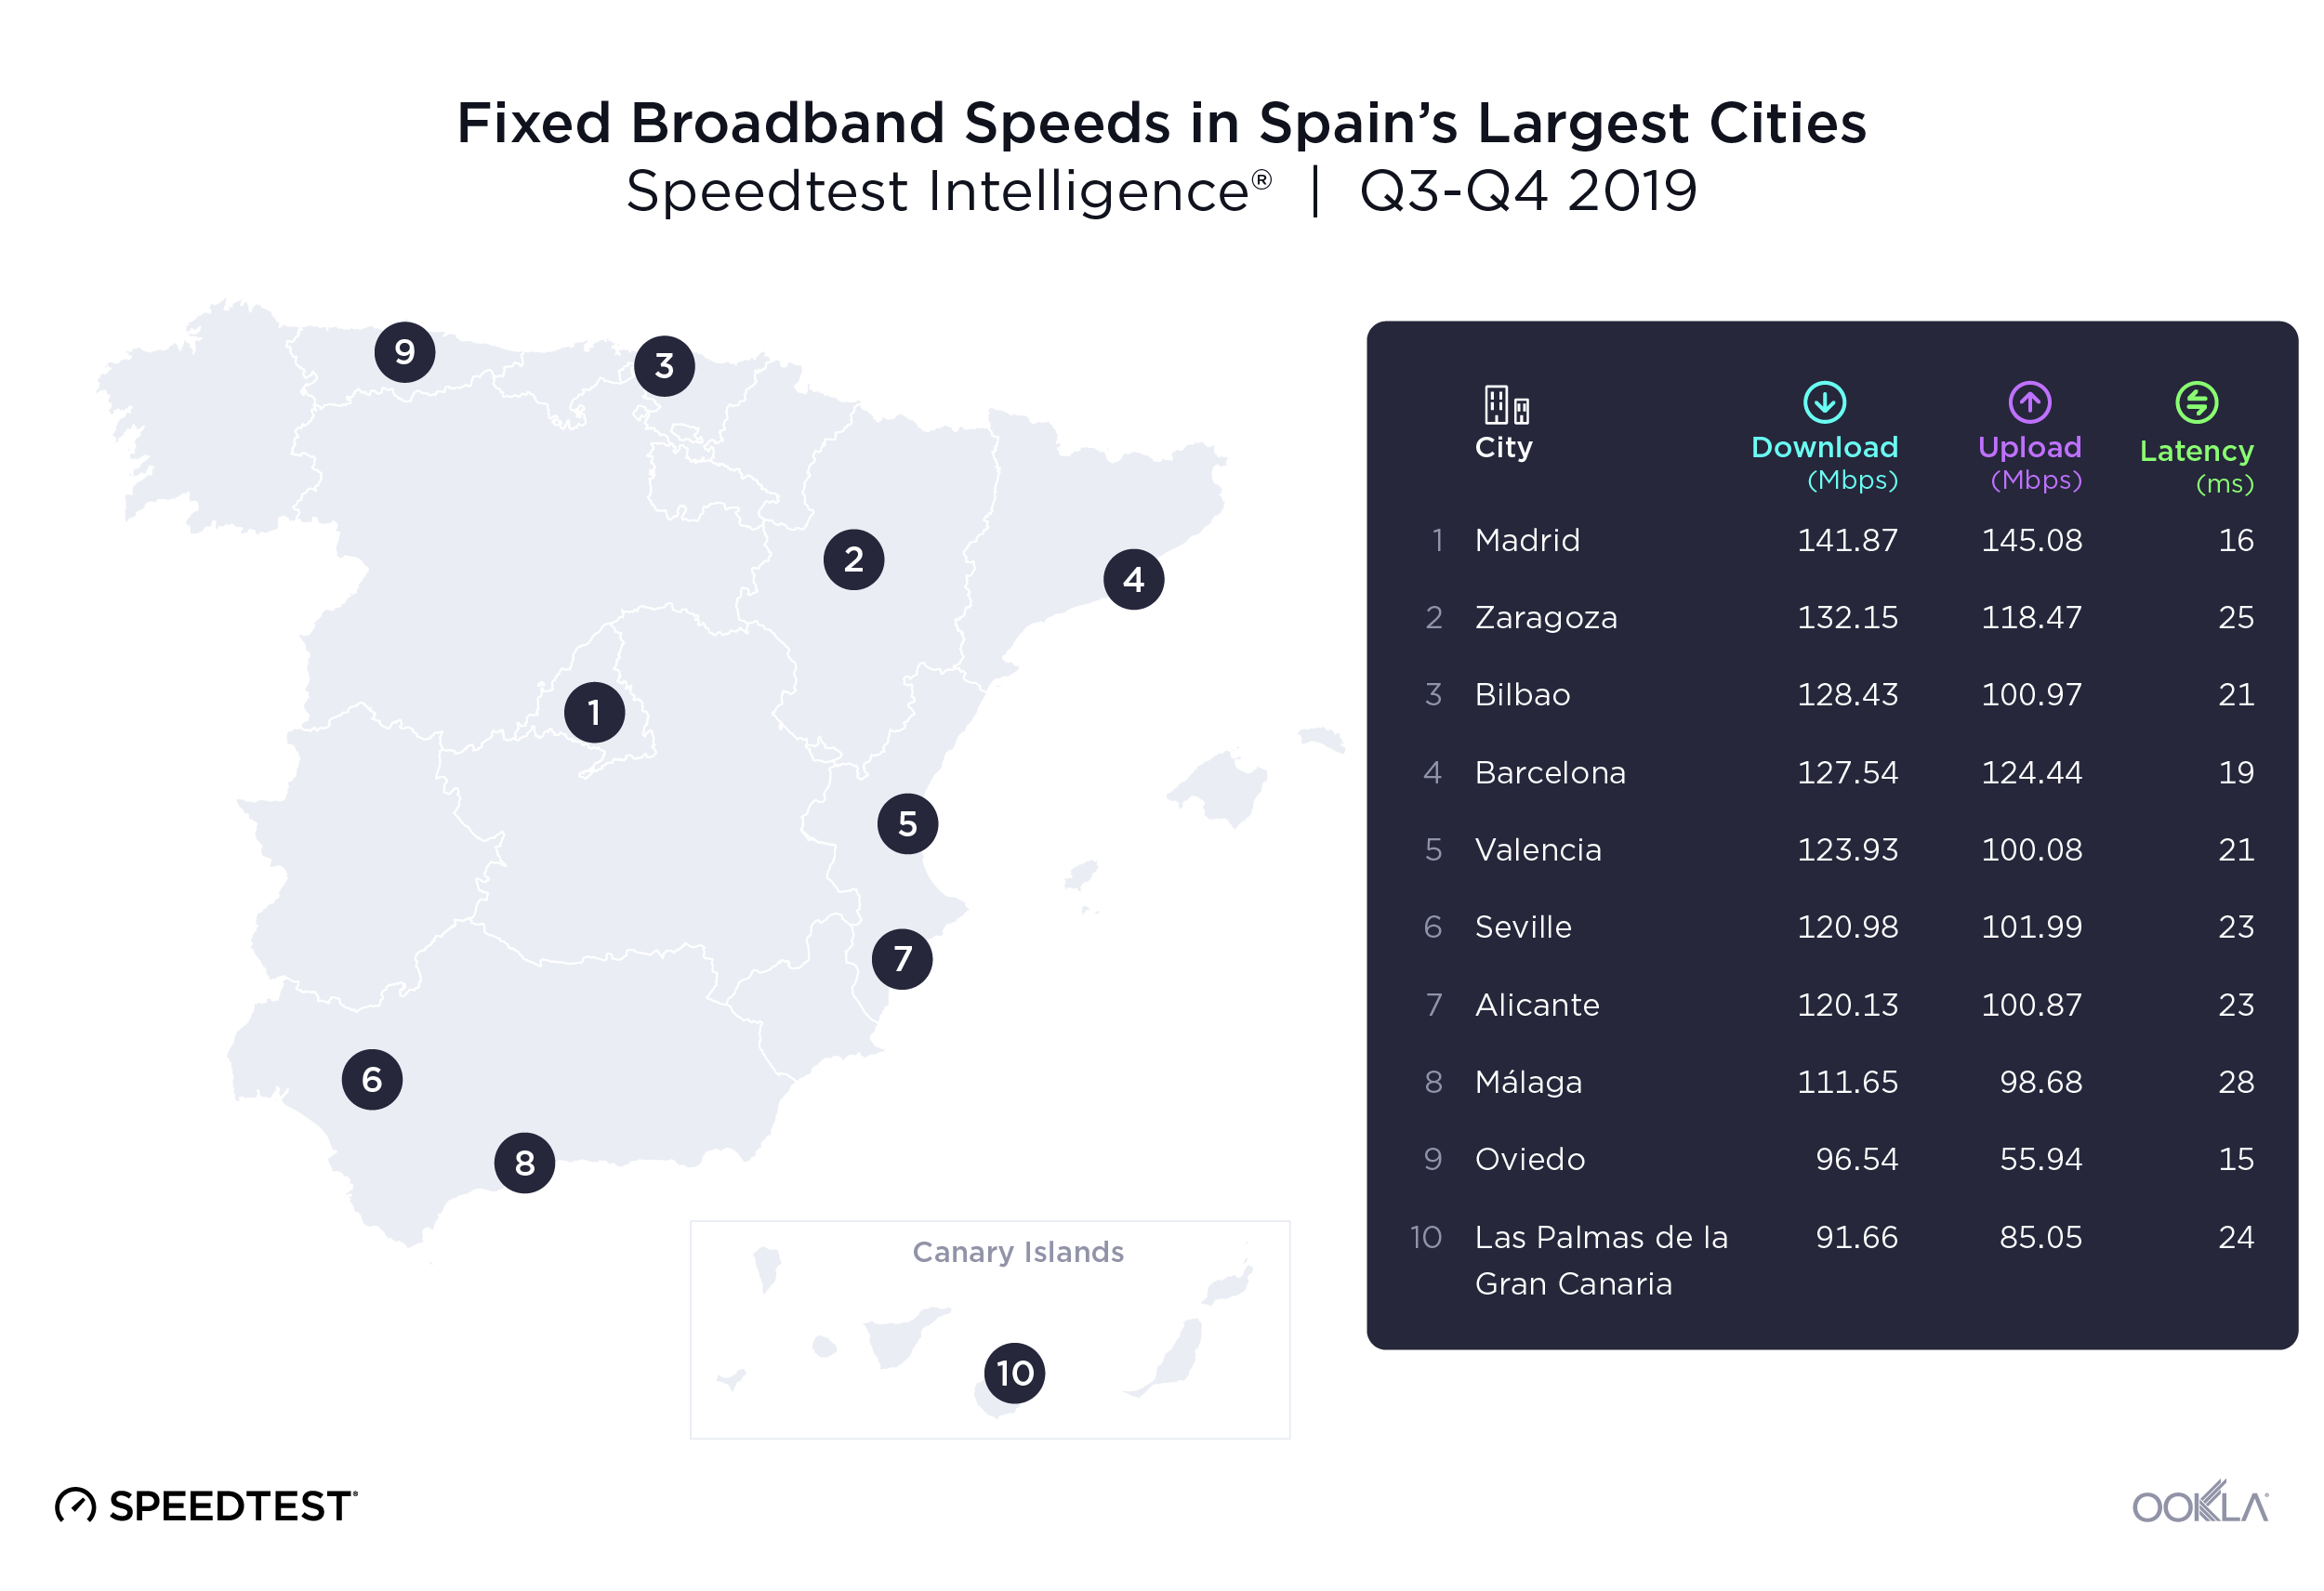
Ookla_Fixed-Broadband-Speeds_Spain_0220-1
We used Speedtest data from 2,183,336 user-initiated tests to investigate internet speeds in Spain’s ten most populous cities during Q3-Q4 2019. Madrid had the fastest mean download speeds on both fixed broadband and mobile.

Mean download speeds on fixed broadband ranged from 141.87 Mbps in Madrid to 91.66 Mbps in Las Palmas de la Gran Canaria, a 35.4% difference. Madrid also had the fastest mean upload speed over fixed broadband at 145.08 Mbps. Oviedo took the last place in upload speeds on fixed broadband with a 61.4% slower upload speed than Madrid.

Oviedo had the lowest latency over fixed broadband of the cities on our list during Q3-Q4 2019 at 15 ms. Málaga had the highest latency at 28 ms.
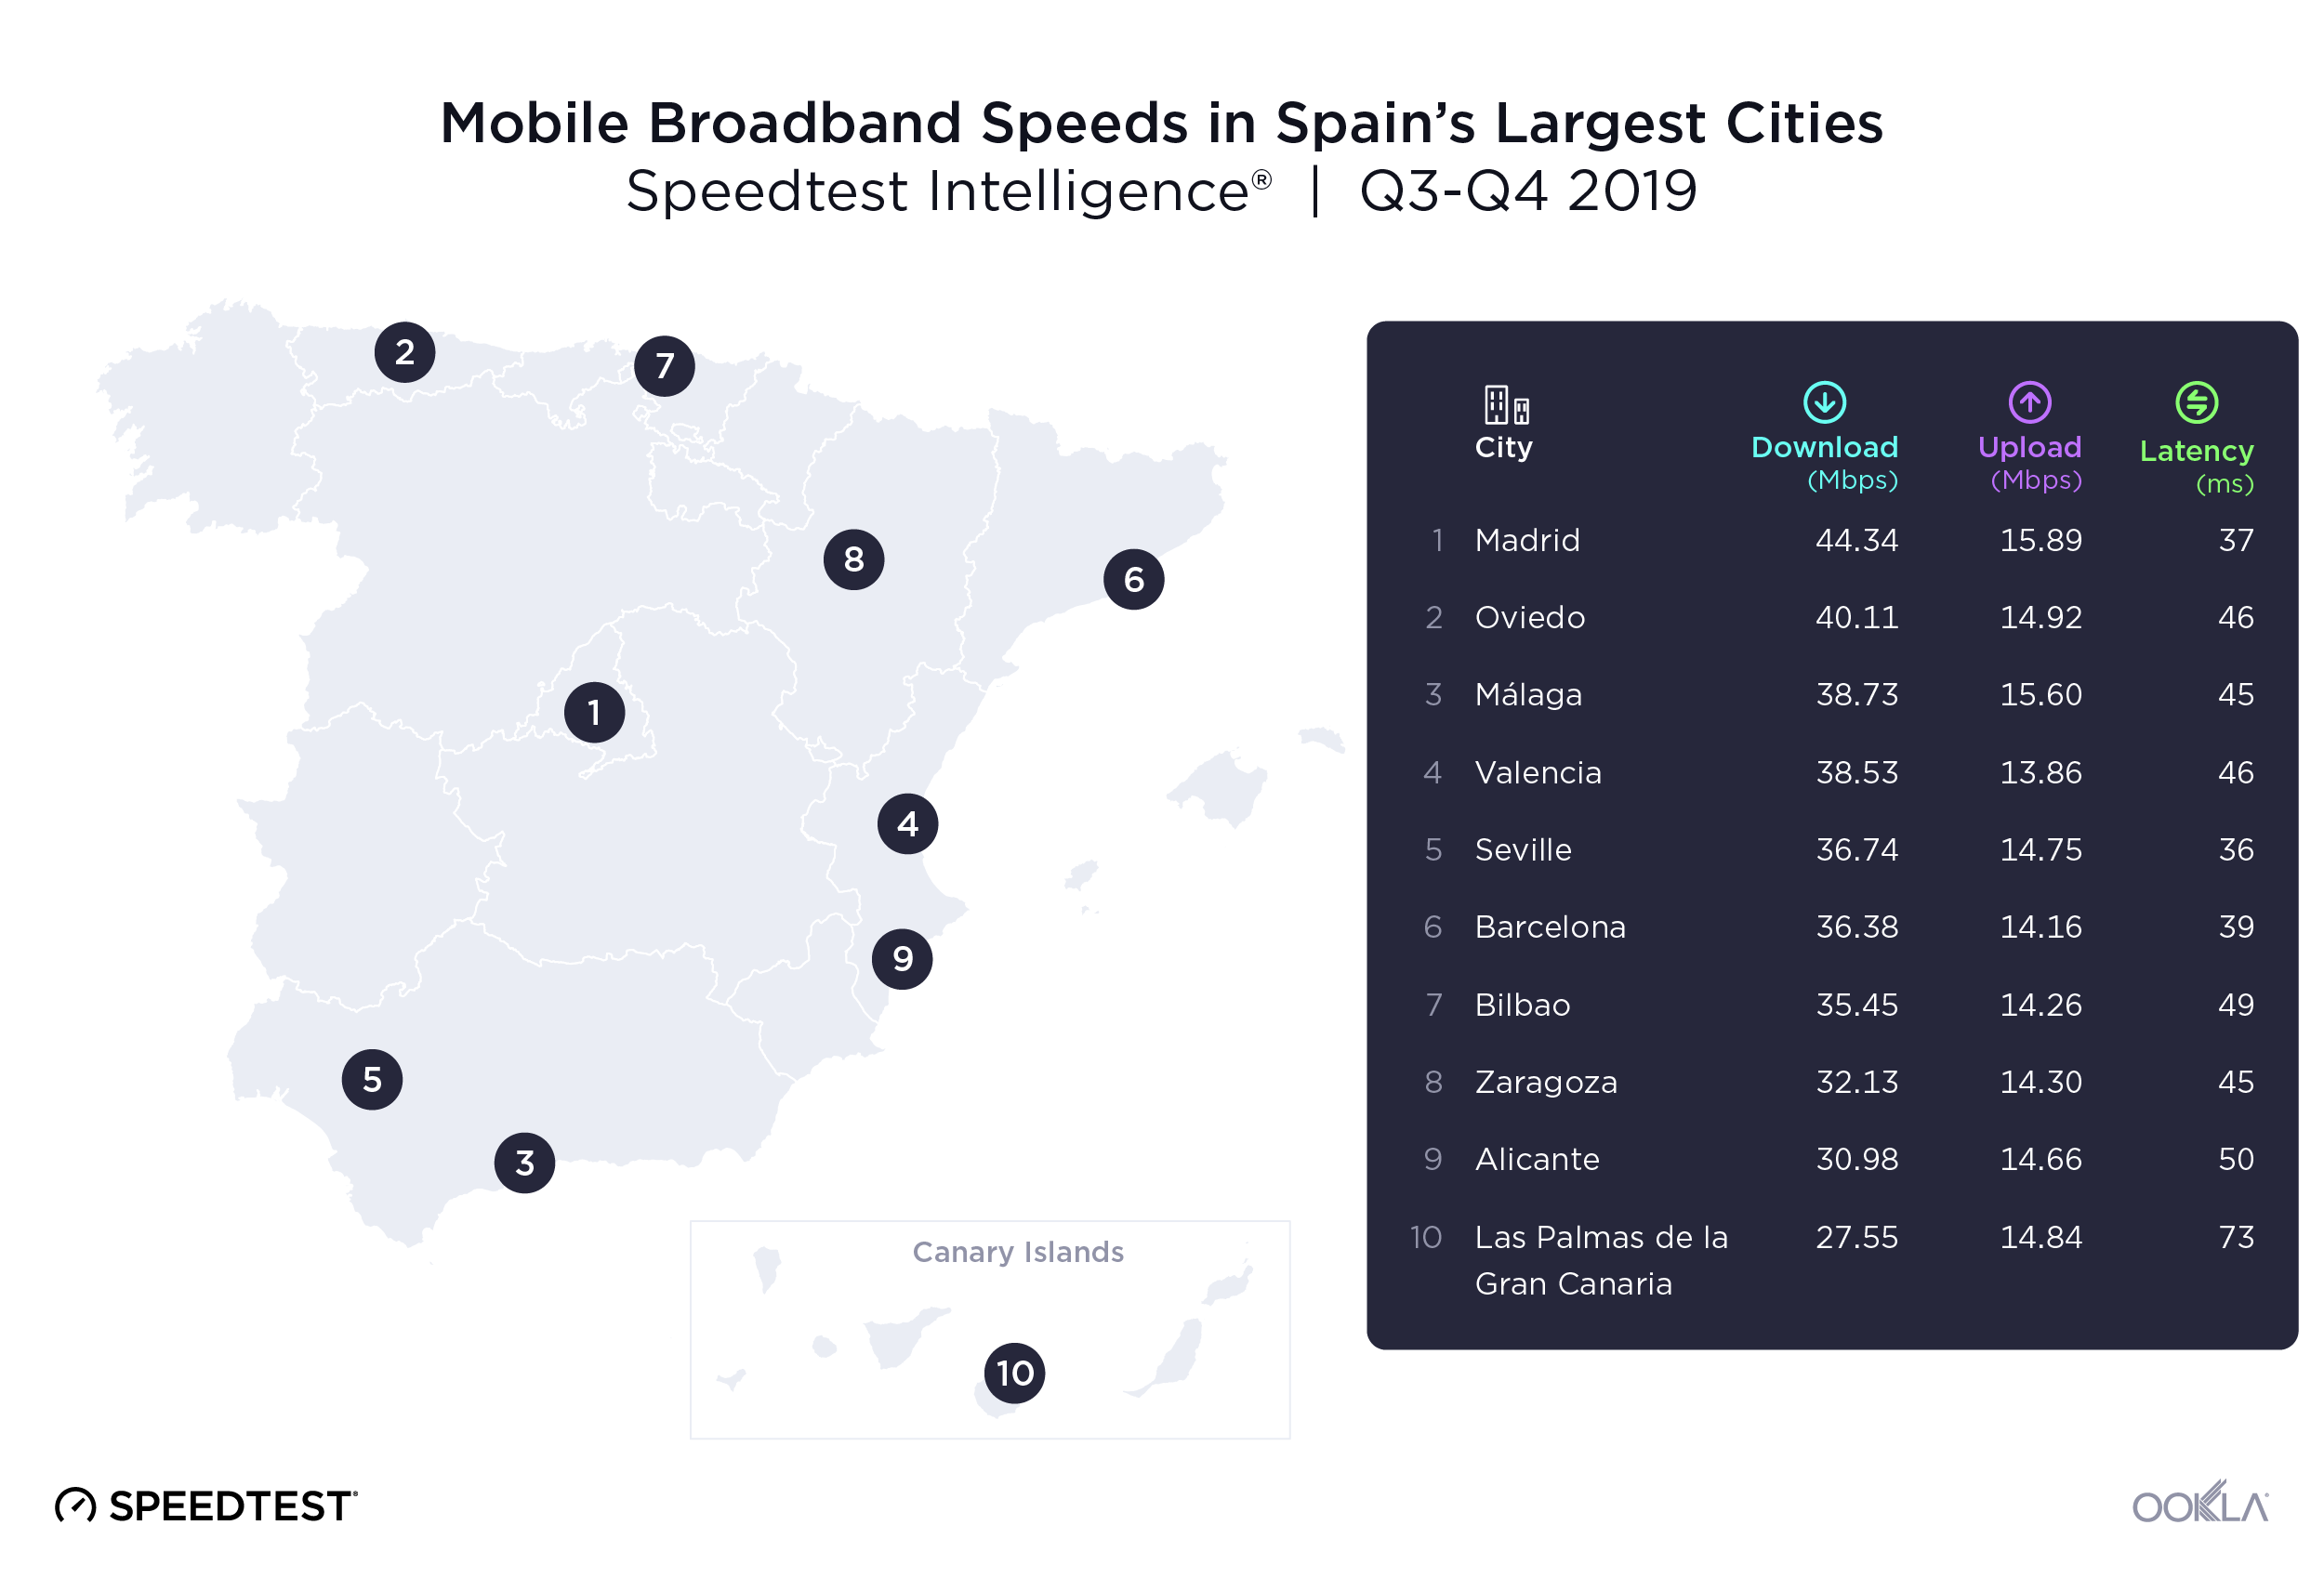
Ookla_Mobile-Broadband-Speeds_Spain_0220-1
The gap between fastest and slowest speeds between Spanish cities on mobile broadband was similar to what we saw fixed broadband during Q3-Q4 2019. Madrid once again led in performance on mobile broadband with a mean download speed of 44.35 Mbps and a mean upload speed of 15.89 Mbps. Las Palmas was in last place on download speeds with a 37.9% slower mean download speed than Madrid. Valencia had the slowest mean upload speed over mobile at 13.86 Mbps. Seville had the lowest latency over mobile at 36 ms during Q3-Q4 2019 and Las Palmas had the highest mobile latency at 73 ms.

Zaragoza led 4G Availability in Spain’s most populous cities

4G Availability in Spain’s Largest Cities
Speedtest Intelligence® | Q3-Q4 2019
City 4G Availability
Zaragoza 97.2%
Valencia 97.1%
Seville 96.8%
Málaga 96.7%
Oviedo 95.4%
Madrid 95.1%
Las Palmas de la Gran Canaria 95.0%
Alicante 94.6%
Bilbao 94.3%
Barcelona 87.7%

4G Availability was higher in Spain’s largest cities than the country’s average, with Zaragoza having the highest 4G Availability at 97.2% of tested locations. Barcelona had the lowest 4G Availability on our list at 87.7%.

MÁSMÓVIL was fastest fixed broadband provider in 6 cities

Looking specifically at Speed Score in individual Spanish cities during Q3-Q4 2019, we found MÁSMÓVIL was the fastest provider in six cities: Málaga, Seville, Zaragoza, Madrid, Valencia and Alicante. Adamo, the fastest fixed provider in Barcelona, had the highest Speed Score on the list at 185.29. Vodafone was the fastest provider in Bilbao and Oviedo.

Fixed Broadband Performance by Operator in Spain’s Largest Cities
Speedtest Intelligence® | Q3-Q4 2019
City Provider Speed ScoreTM
Barcelona Adamo 185.29
Málaga MÁSMÓVIL 156.24
Seville MÁSMÓVIL 148.78
Madrid MÁSMÓVIL 145.83
Bilbao Vodafone 144.65
Zaragoza MÁSMÓVIL 144.40
Oviedo Vodafone 143.85
Valencia MÁSMÓVIL 143.99
Alicante MÁSMÓVIL 143.72
Las Palmas Orange 114.46

Looking at the fastest Spanish providers on mobile broadband for each city during Q3-Q4 2019, Movistar dominated the list with the fastest Speed Score in 7 cities. Movistar also had the highest Speed Score overall at 52.04 in Seville. Vodafone was the fastest mobile provider in Madrid (35.67). Orange was the fastest provider in Barcelona (35.37) and Oviedo (45.10).

Mobile Performance by Operator in Spain’s Largest Cities
Speedtest Intelligence® | Q3-Q4 2019
City Provider Speed ScoreTM
Seville Movistar 52.04
Valencia Movistar 50.80
Alicante Movistar 50.36
Málaga Movistar 48.97
Bilbao Movistar 48.86
Oviedo Orange 45.10
Zaragoza Movistar 40.79
Madrid Vodafone 35.67
Las Palmas Movistar 35.37
Barcelona Vodafone 31.37

We look forward to following these markets and investigating the changing landscape of internet performance and mobile coverage in Europe. Want to learn more about fixed and mobile speeds in different markets? Click here to read more Ookla Research.

Editor’s note: This article was updated on March 4, 2020 to correct an editing error that incorrectly reported the figures for mobile APS.

Velocidades de banda ancha fija y móvil, y disponibilidad de 4G en España

Hemos investigado el rendimiento de la banda ancha fija y móvil, así como la disponibilidad de 4G en España. También hemos comparado las velocidades y la cobertura españolas con las de los países europeos vecinos, así como el rendimiento y la disponibilidad de 4G de los principales proveedores de las diez ciudades más grandes de España en el segundo semestre de 2019. Además de clasificar a los proveedores españoles por su velocidad y cobertura máximas, también hemos analizado los efectos de los planes móviles con limitaciones de velocidad basándonos en los resultados de Speedtest® y hemos clasificado a los proveedores según la constancia del rendimiento de sus redes.

España y Francia fueron los países más rápidos de nuestra lista de banda ancha fija

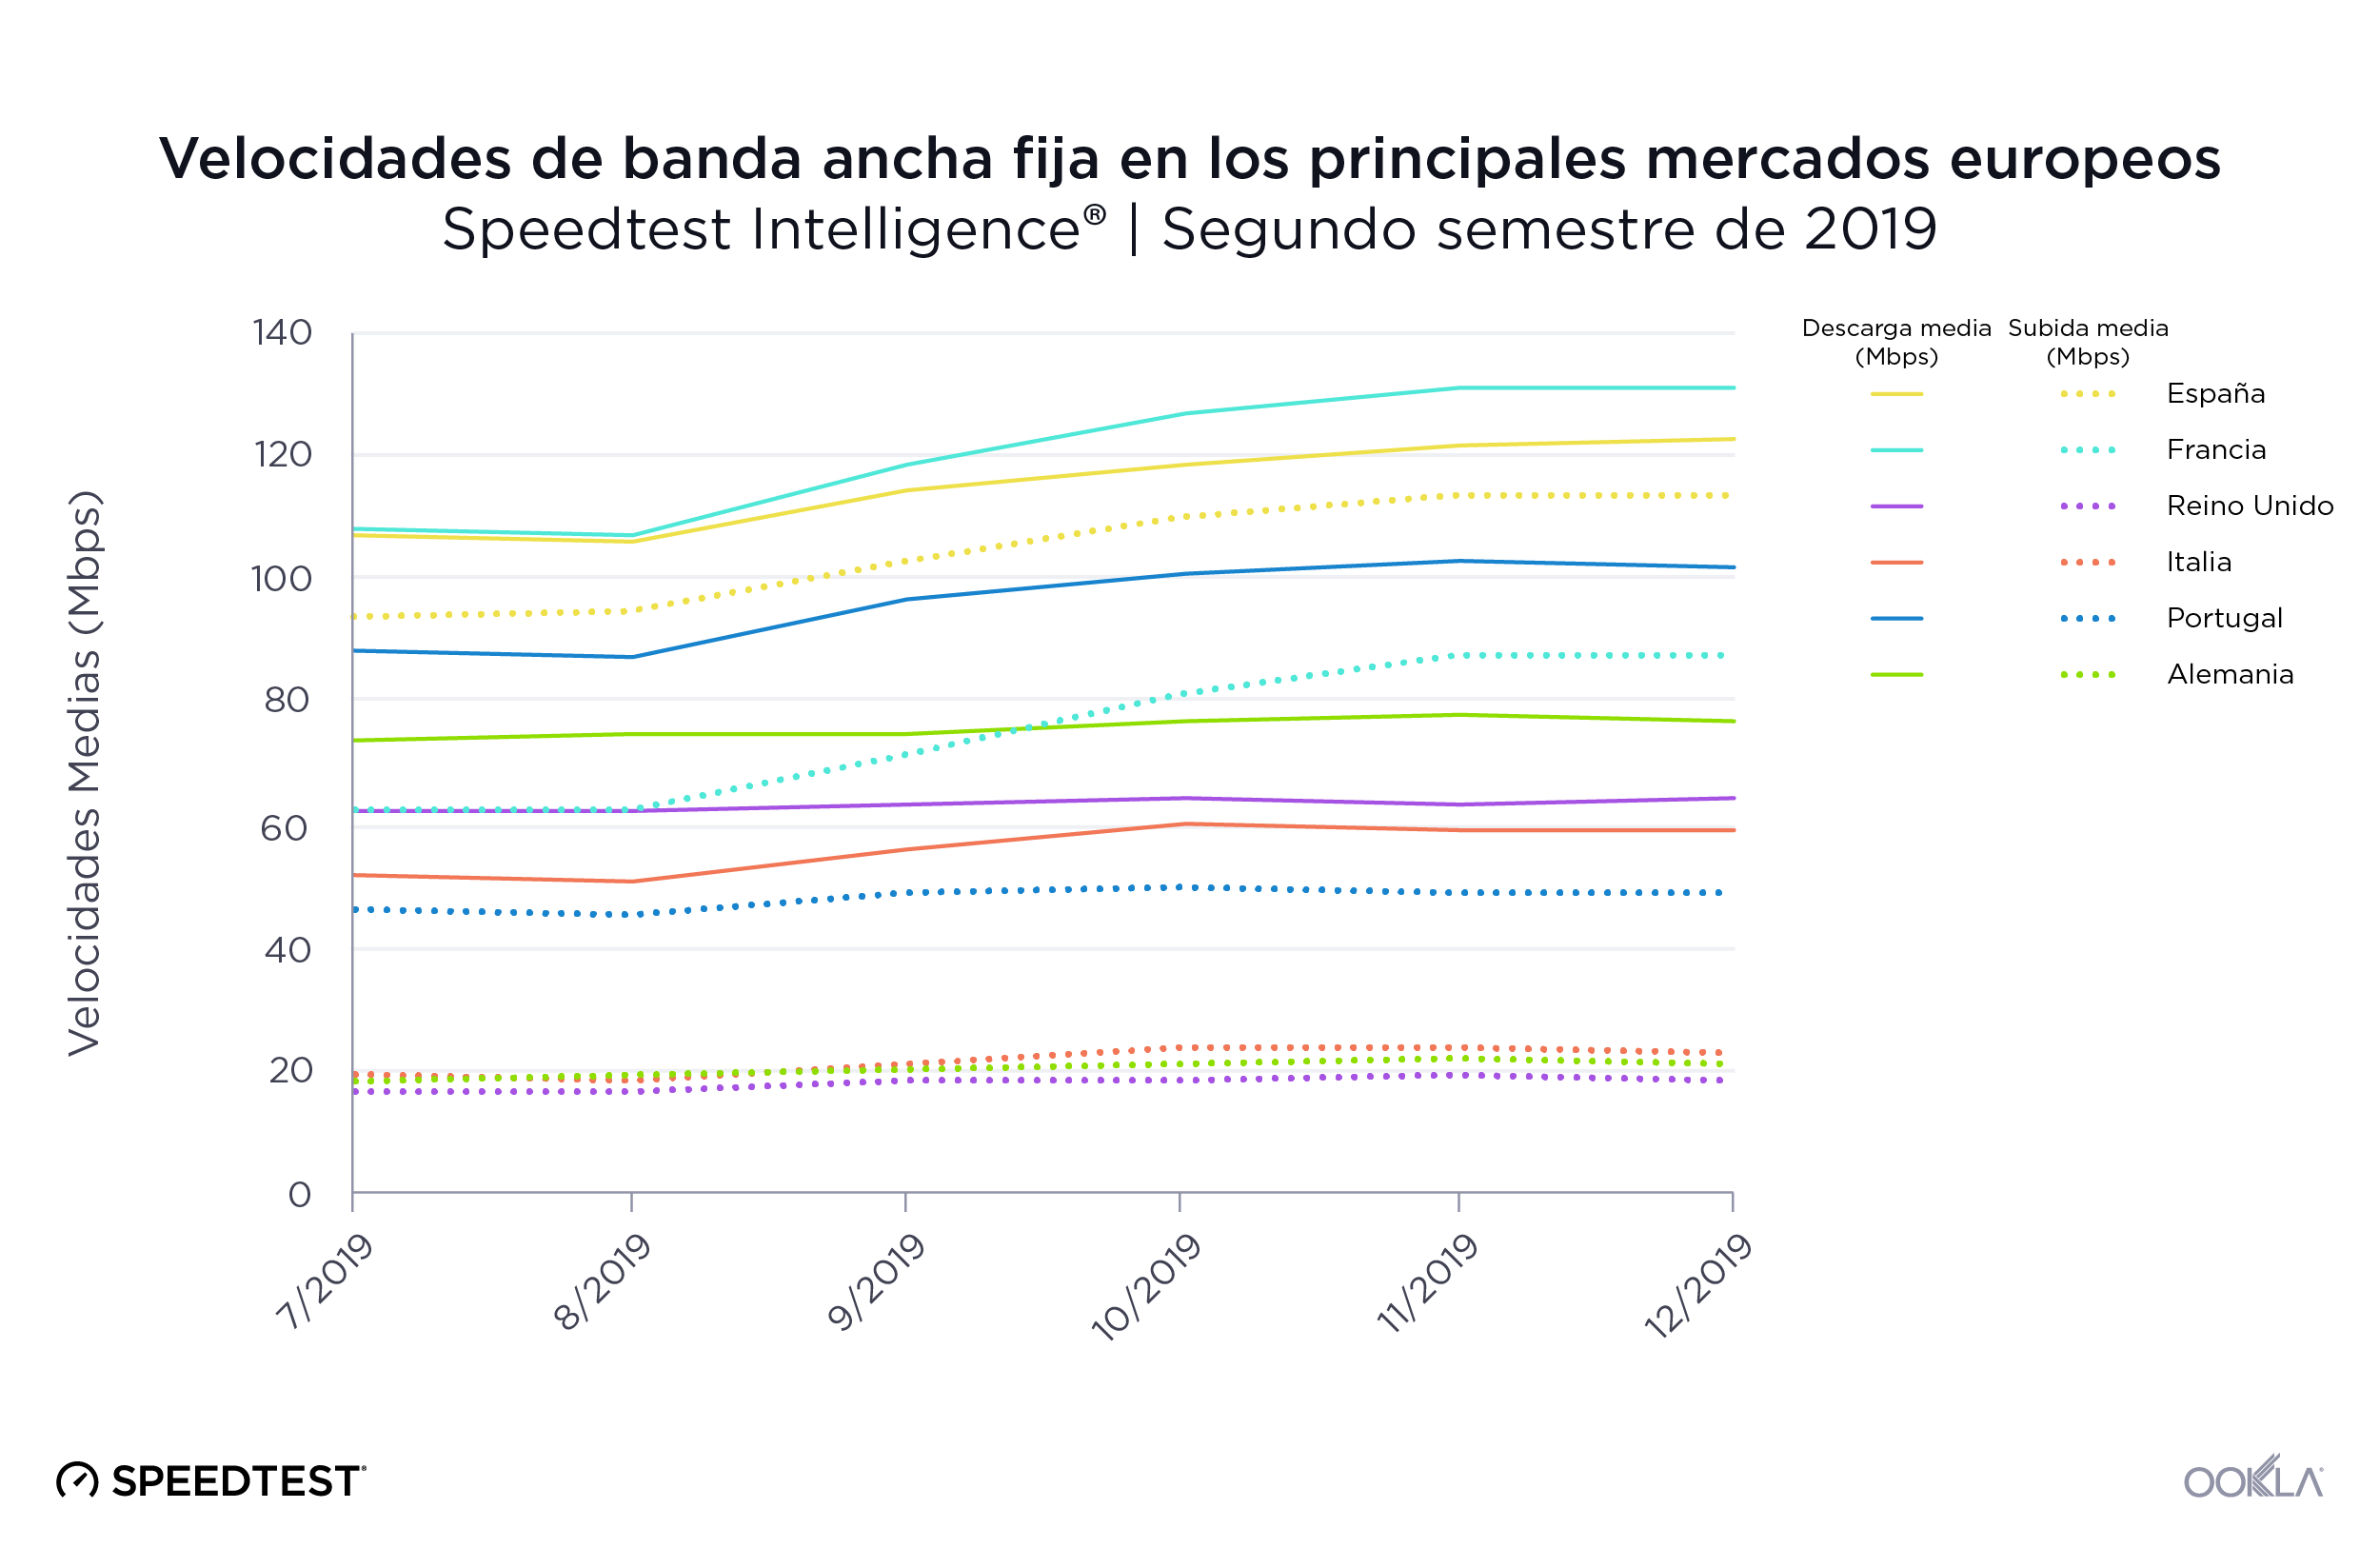
Hemos comparado el rendimiento de la banda ancha fija de España a nivel de país con varios otros países de la Europa occidental en el segundo semestre de 2019. España obtuvo una buena posición en cuanto a velocidad de descarga media en banda ancha fija, con 113,72 Mbps, en segundo lugar solo después de los 119,37 Mbps de Francia. España registró la velocidad de subida media más alta de esta lista: 103,72 Mbps. Italia obtuvo la velocidad de descarga media más baja de esta lista, 56,72 Mbps, mientras que el Reino Unido registró la velocidad de subida media más baja, 18,28 Mbps.
fixed-broadband-speeds-sp-2

Francia registró el mayor aumento en la velocidad de descarga media del segundo semestre de 2019, con el 21,5 %, seguida de Portugal y Italia, con el 15,4 %, y España, con el 14,5 %. Las velocidades se mantuvieron relativamente invariables durante este periodo en Italia, Reino Unido y Alemania.

Un análisis de la latencia en banda ancha fija en el segundo semestre de 2019 reveló una clasificación por rendimiento muy distinta. Portugal se anotó la latencia más baja de este periodo: 16 ms. Alemania y Reino Unido empataron en el segundo puesto con 23 ms. España resultó tercera (25 ms), Italia cuarta (30 ms) y Francia quinta (32 ms).

España, cuarto país en velocidad de descarga en Internet móvil
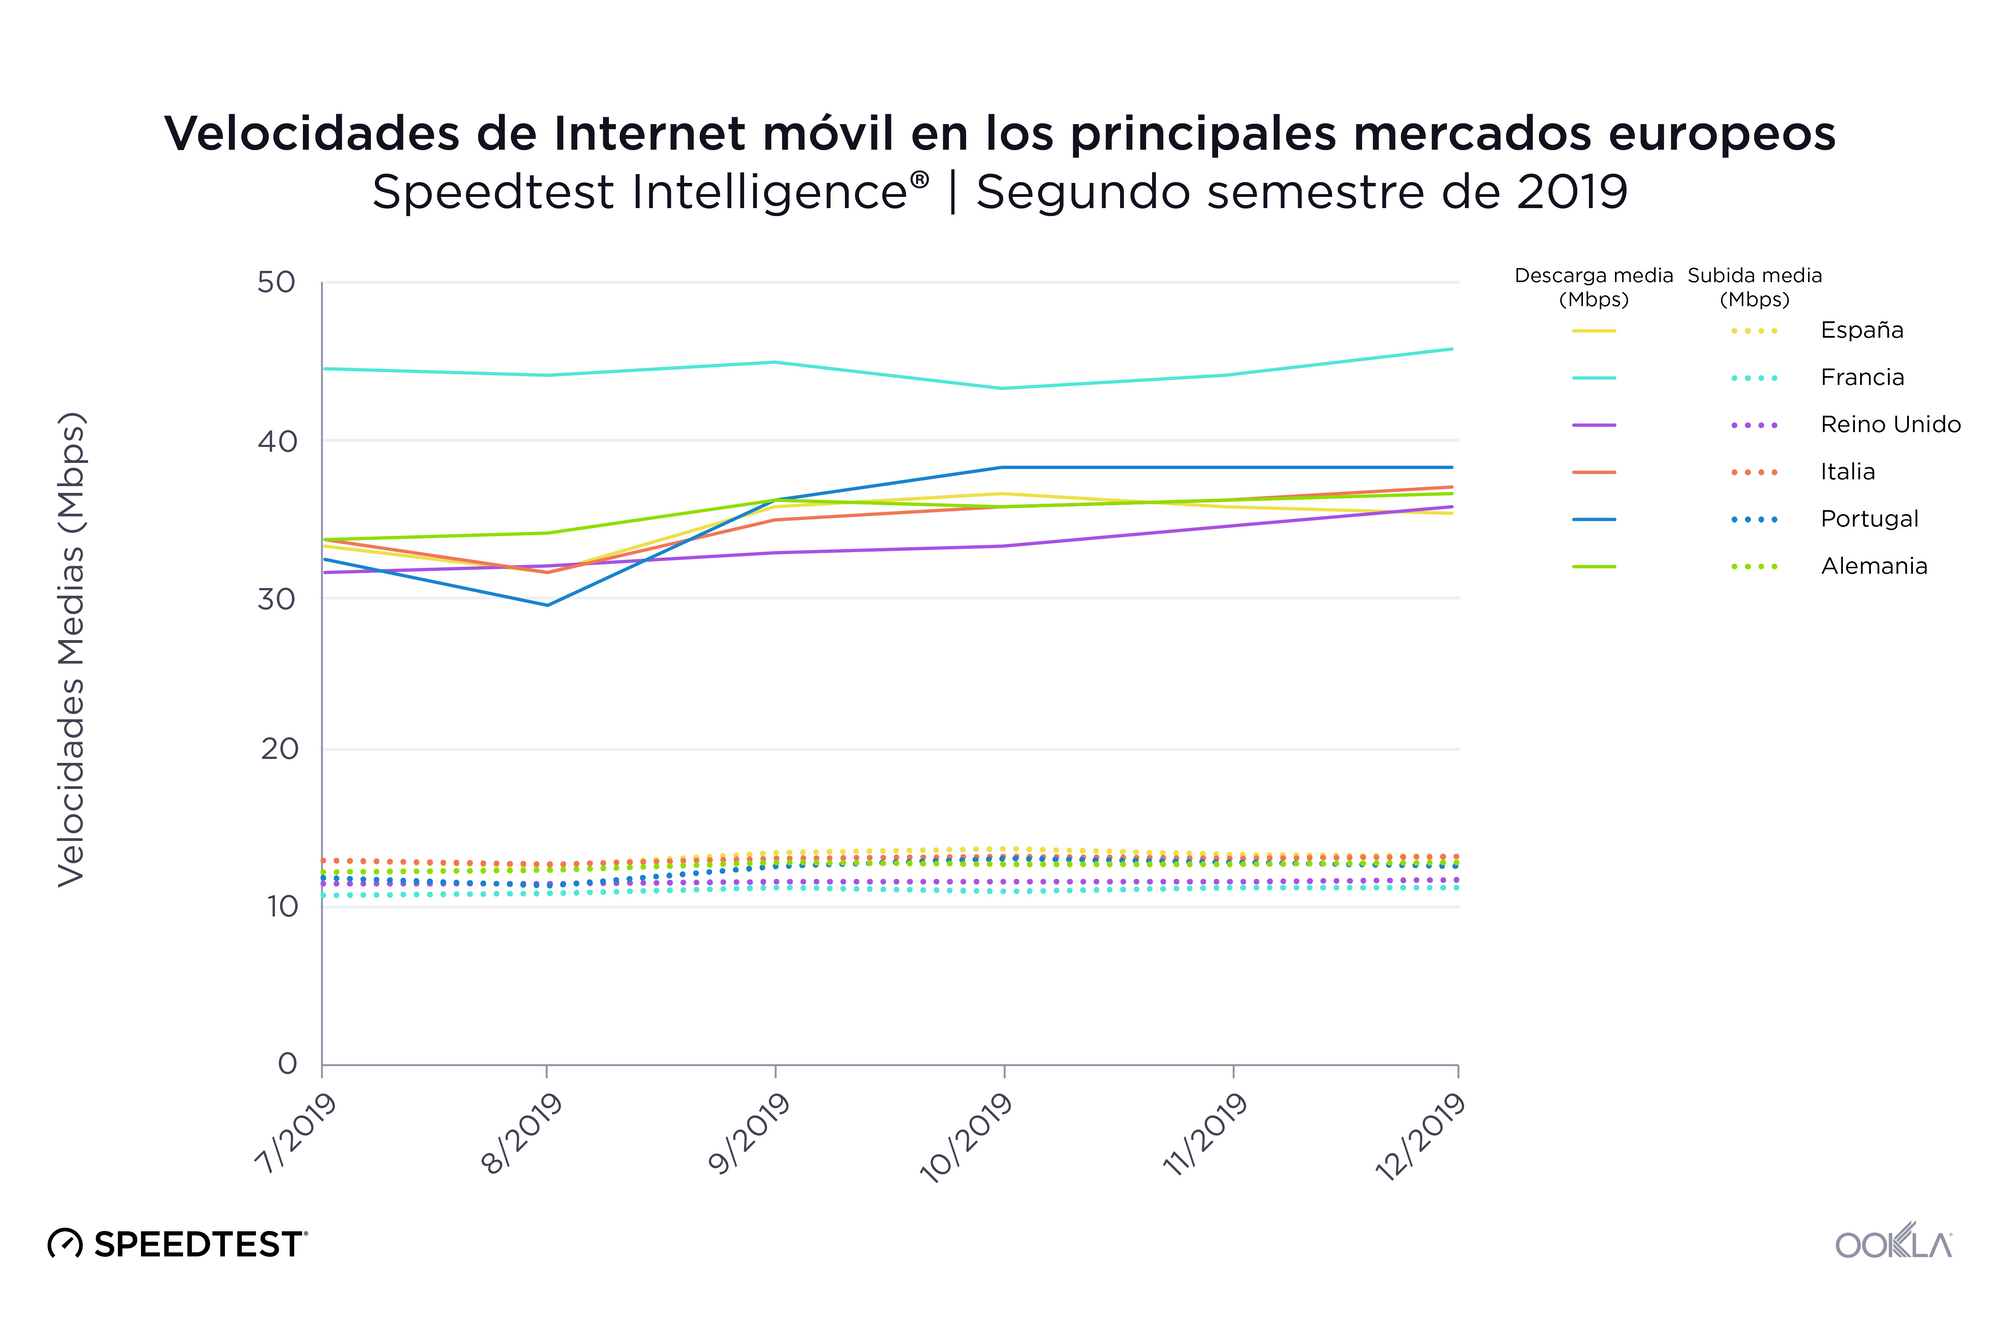
mobile-speeds-sp-3

La clasificación de España en velocidad de descarga media por móvil no fue tan buena como la de banda ancha fija, quedándose con un cuarto puesto con 33,97 Mbps en el segundo semestre de 2019. Esto supuso una velocidad un 22,8 % más lenta que la del primer país clasificado, Francia. Sin embargo, España registró las velocidades de subida medias más altas en Internet móvil, con 13,12 Mbps en el segundo semestre de 2019.

Portugal experimentó el mayor aumento en velocidad de descarga de Internet móvil en el segundo semestre de 2019, el 18,4 %. La velocidad de descarga media de España en Internet móvil aumentó solo un 6,7 % en este periodo. Francia registró el menor aumento de velocidad de descarga de Internet móvil, un 2,8 %.

Como vimos en la banda ancha fija, la latencia móvil más baja fue la de Portugal, con 32 ms. Alemania fue segunda con 41 ms, Francia tercera con 43 ms, Reino Unido cuarto con 44 ms, España quinta con 47 ms e Italia última con 52 ms.

Reino Unido y España, líderes en disponibilidad de 4G

Utilizamos datos de exploraciones de cobertura de Speedtest en Android para comparar la disponibilidad de 4G en cada mercado en el segundo semestre de 2019. Mientras que el Reino Unido mostró la mayor disponibilidad de 4G con el 88,8 %, España y Francia ocuparon el segundo lugar, con 4G disponible en el 87,7 % de las ubicaciones probadas. Durante ese período, Alemania tuvo la menor disponibilidad de 4G con un 72,1 %.

Disponibilidad de 4G en los principales mercados europeos
Speedtest Intelligence® | Segundo semestre de 2019
País Disponibilidad de 4G
Reino Unido 88,8 %
España 87,7 %
Francia 87,7 %
Italia 86,7 %
Portugal 85,0 %
Alemania 72,1 %

Si nos fijamos específicamente en los principales proveedores móviles de España, Orange ofreció la mayor disponibilidad de 4G con un 88,1 %. Movistar fue segundo, Yoigo tercero, y Vodafone cuarto.

Disponibilidad de 4G por proveedor en España
Speedtest Intelligence® | Segundo semestre de 2019
Proveedor Disponibilidad de 4G
Orange 88,1 %
Movistar 87,7 %
Yoigo 87,4 %
Vodafone 86,1 %

Los despliegues de 5G en España se están expandiendo
5G-Deployments-in-Spain-0220_es
El entusiasmo por el 5G es evidente en España. Vodafone desplegó 5G comercialmente disponible en un total de 18 ciudades españolas a fecha del 13 de febrero de 2020, incluidas Barcelona, Madrid, Valencia, Málaga y Bilbao. Los datos de Speedtest revelan que en España la velocidad media de descarga en 5G en el segundo semestre de 2019 fue de 350,68 Mbps (velocidad superior a la media nacional para Internet móvil) y la velocidad de subida media por 5G fue de 31,82 Mbps. La latencia media por 5G en España fue de 27 ms en el segundo semestre de 2019.

MÁSMÓVIL fue el proveedor de banda ancha fija más rápido de España

Al utilizar Speed Score™, sistema que combina mediciones de velocidades de descarga y de subida, para comparar los principales proveedores de servicios de Internet de España en el segundo semestre de 2019, descubrimos que MÁSMÓVIL obtuvo los mejores resultados, con una puntuación de 133,75 en banda ancha fija. Orange ocupó el segundo lugar con 115,25, seguido de Vodafone (105,07) y Movistar (103,01).

Rendimiento de la banda ancha fija en España por proveedor
Speedtest Intelligence® | Segundo semestre de 2019
Proveedor Speed ScoreTM
MÁSMÓVIL 133,75
Orange 115,25
Vodafone 105,07
Movistar 103,01

Movistar fue el operador móvil más rápido de España

Movistar obtuvo la máxima puntuación de velocidad de entre los operadores móviles de España en el segundo semestre de 2019, con 37,76. Orange fue segundo con 33,02, Vodafone la tercera con 26,34 y Yoigo cuarta con 22,43. Como veremos más adelante, el rendimiento general de la velocidad puede verse afectado por los límites de velocidad y los planes de tarifas vigentes en España.

Rendimiento de Internet móvil en España por operador
Speedtest Intelligence® | Segundo semestre de 2019
Proveedor Speed ScoreTM
Movistar 37,76
Orange 33,02
Vodafone 26,34
Yoigo 22,43

La limitación de velocidad afecta al rendimiento general

La limitación de la velocidad, una restricción de servicio impuesta a una conexión de Internet por los operadores, permite a estos ofrecer también planes que se centren en la asequibilidad más que en el rendimiento máximo.
Ookla_Distribution-Speedtest-Results_Vodafone_Spain_0220-3_es
En el gráfico anterior se muestra cómo los planes de suscripción con limitación de velocidad introducidos por Vodafone afectaron a la distribución de las velocidades de descarga. Aunque esos planes (con limitaciones de 2 Mbps y 10 Mbps, respectivamente) estaban disponibles desde abril, no vemos un efecto verdadero en las velocidades medias hasta mayo y junio cuando las medidas de 0-5 Mbps y 10-15 Mbps empiezan a sobresalir.

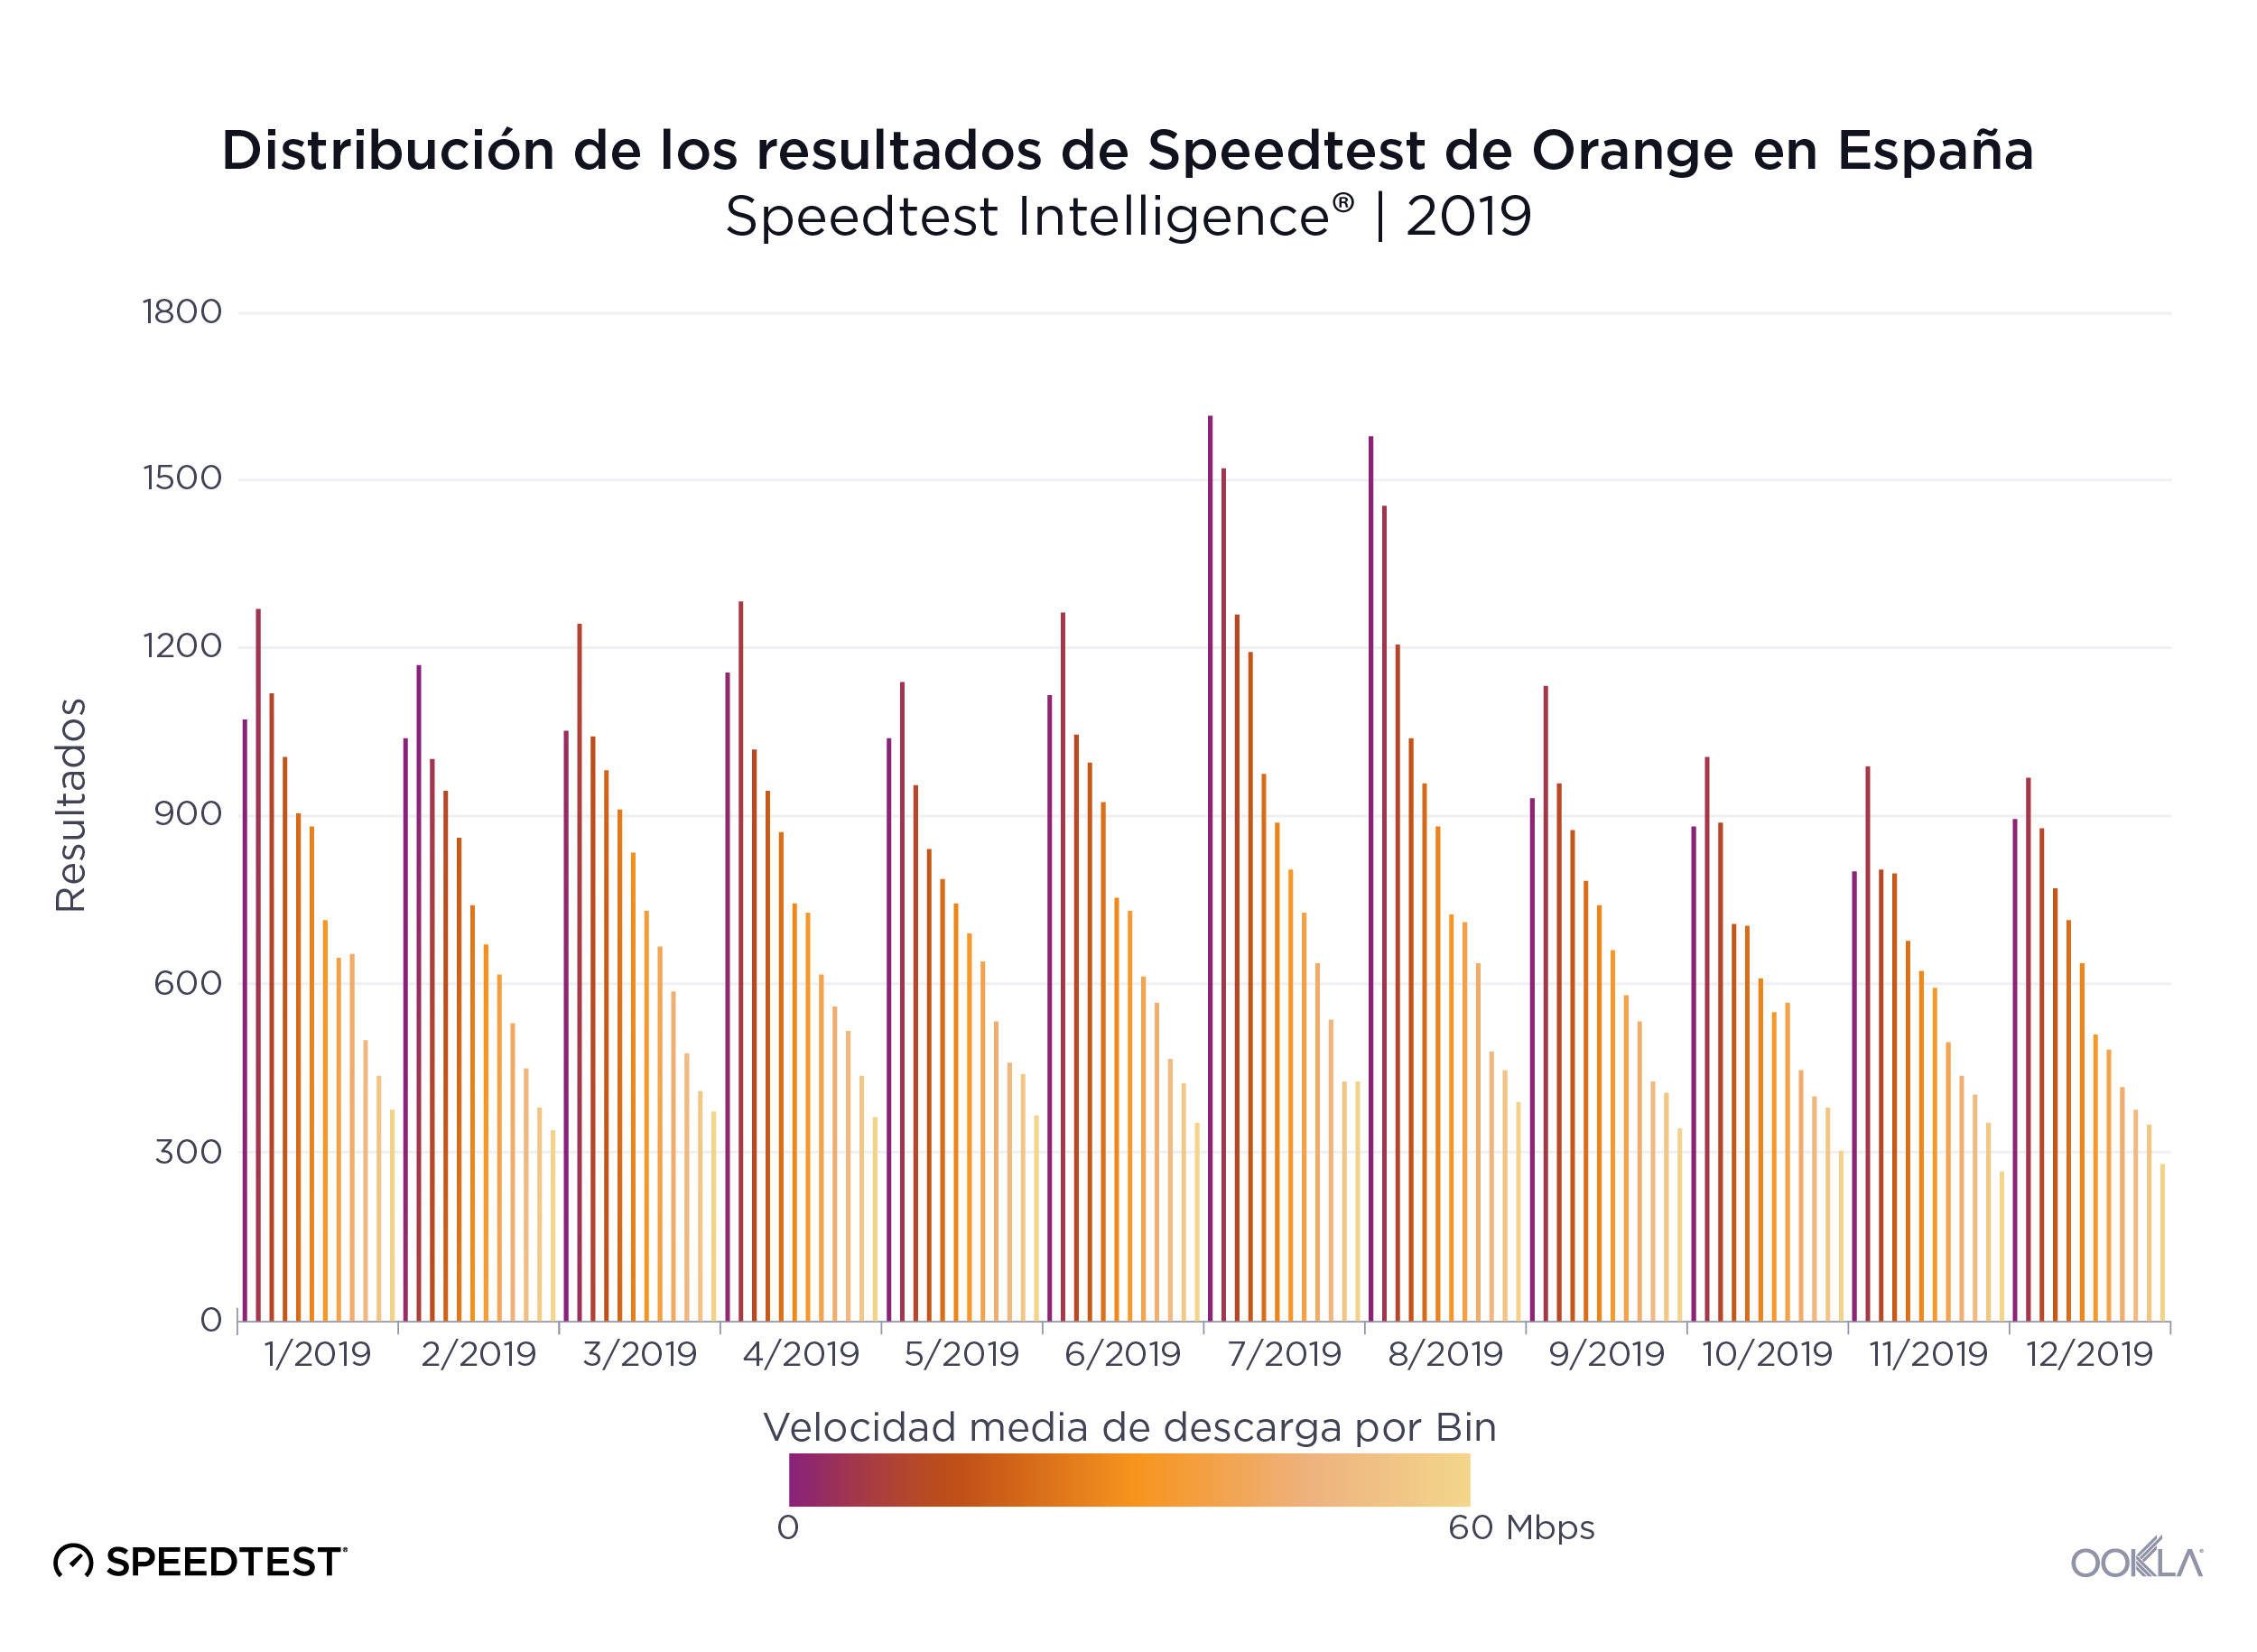
En cambio, en el resto de operadores móviles de España vemos distribuciones más uniformes de las velocidades de descarga.
Ookla_Distribution-Speedtest-Results_Movistar_Spain_0220-3_es
Ookla_Distribution-Speedtest-Results_Orange_Spain_0220-3_es
Ookla_Distribution-Speedtest-Results_Yoigo_Spain_0220-3_es

MÁSMÓVIL y Movistar (móvil) ofrecen las velocidades más constantes

La velocidad es importante, pero si no es constante, resulta difícil que los usuarios utilicen sus dispositivos con fiabilidad para transmitir vídeo de alta definición, navegar por la web o jugar en línea. Utilizamos los datos de Speedtest para calcular la PRA (puntuación de rendimiento aceptable) de cada uno de los principales proveedores de España durante el segundo semestre de 2019.

La PRA de banda ancha fija mide el porcentaje de muestras que igualan o superan una velocidad de descarga de 25 Mbps y que también igualan o superan una velocidad de subida de 3 Mbps. MÁSMÓVIL proporcionó el mayor nivel de constancia de España en banda ancha fija en el segundo semestre de 2019 con una PRA de 81,6 %. Movistar quedó en último lugar con una PRA del 61,9 %.

Constancia de velocidad por proveedor en banda ancha fija
Speedtest Intelligence® | Segundo semestre de 2019
Proveedor PRA
MÁSMÓVIL 81,6 %
Orange 75,1 %
Vodafone 73,5 %
Movistar 61,9 %

La PRA de Internet móvil mide el porcentaje de muestras que igualan o superan una velocidad de descarga de 5 Mbps y que también igualan o superan una velocidad de subida de 1 Mbps. Movistar ocupó el primer lugar en constancia de banda ancha móvil con una PRA del 88,9 %, Vodafone obtuvo la puntuación más baja en constancia con una PRA del 79,8 %.

Constancia de velocidad por operador en Internet móvil
Speedtest Intelligence® | Segundo semestre de 2019
Proveedor PRA
Movistar 88,9 %
Orange 84,3 %
Yoigo 82,6 %
Vodafone 79,8 %

Madrid lideró las velocidades de banda ancha fija y móvil
Ookla_Fixed-Broadband-Speeds_Spain_0220_es-2
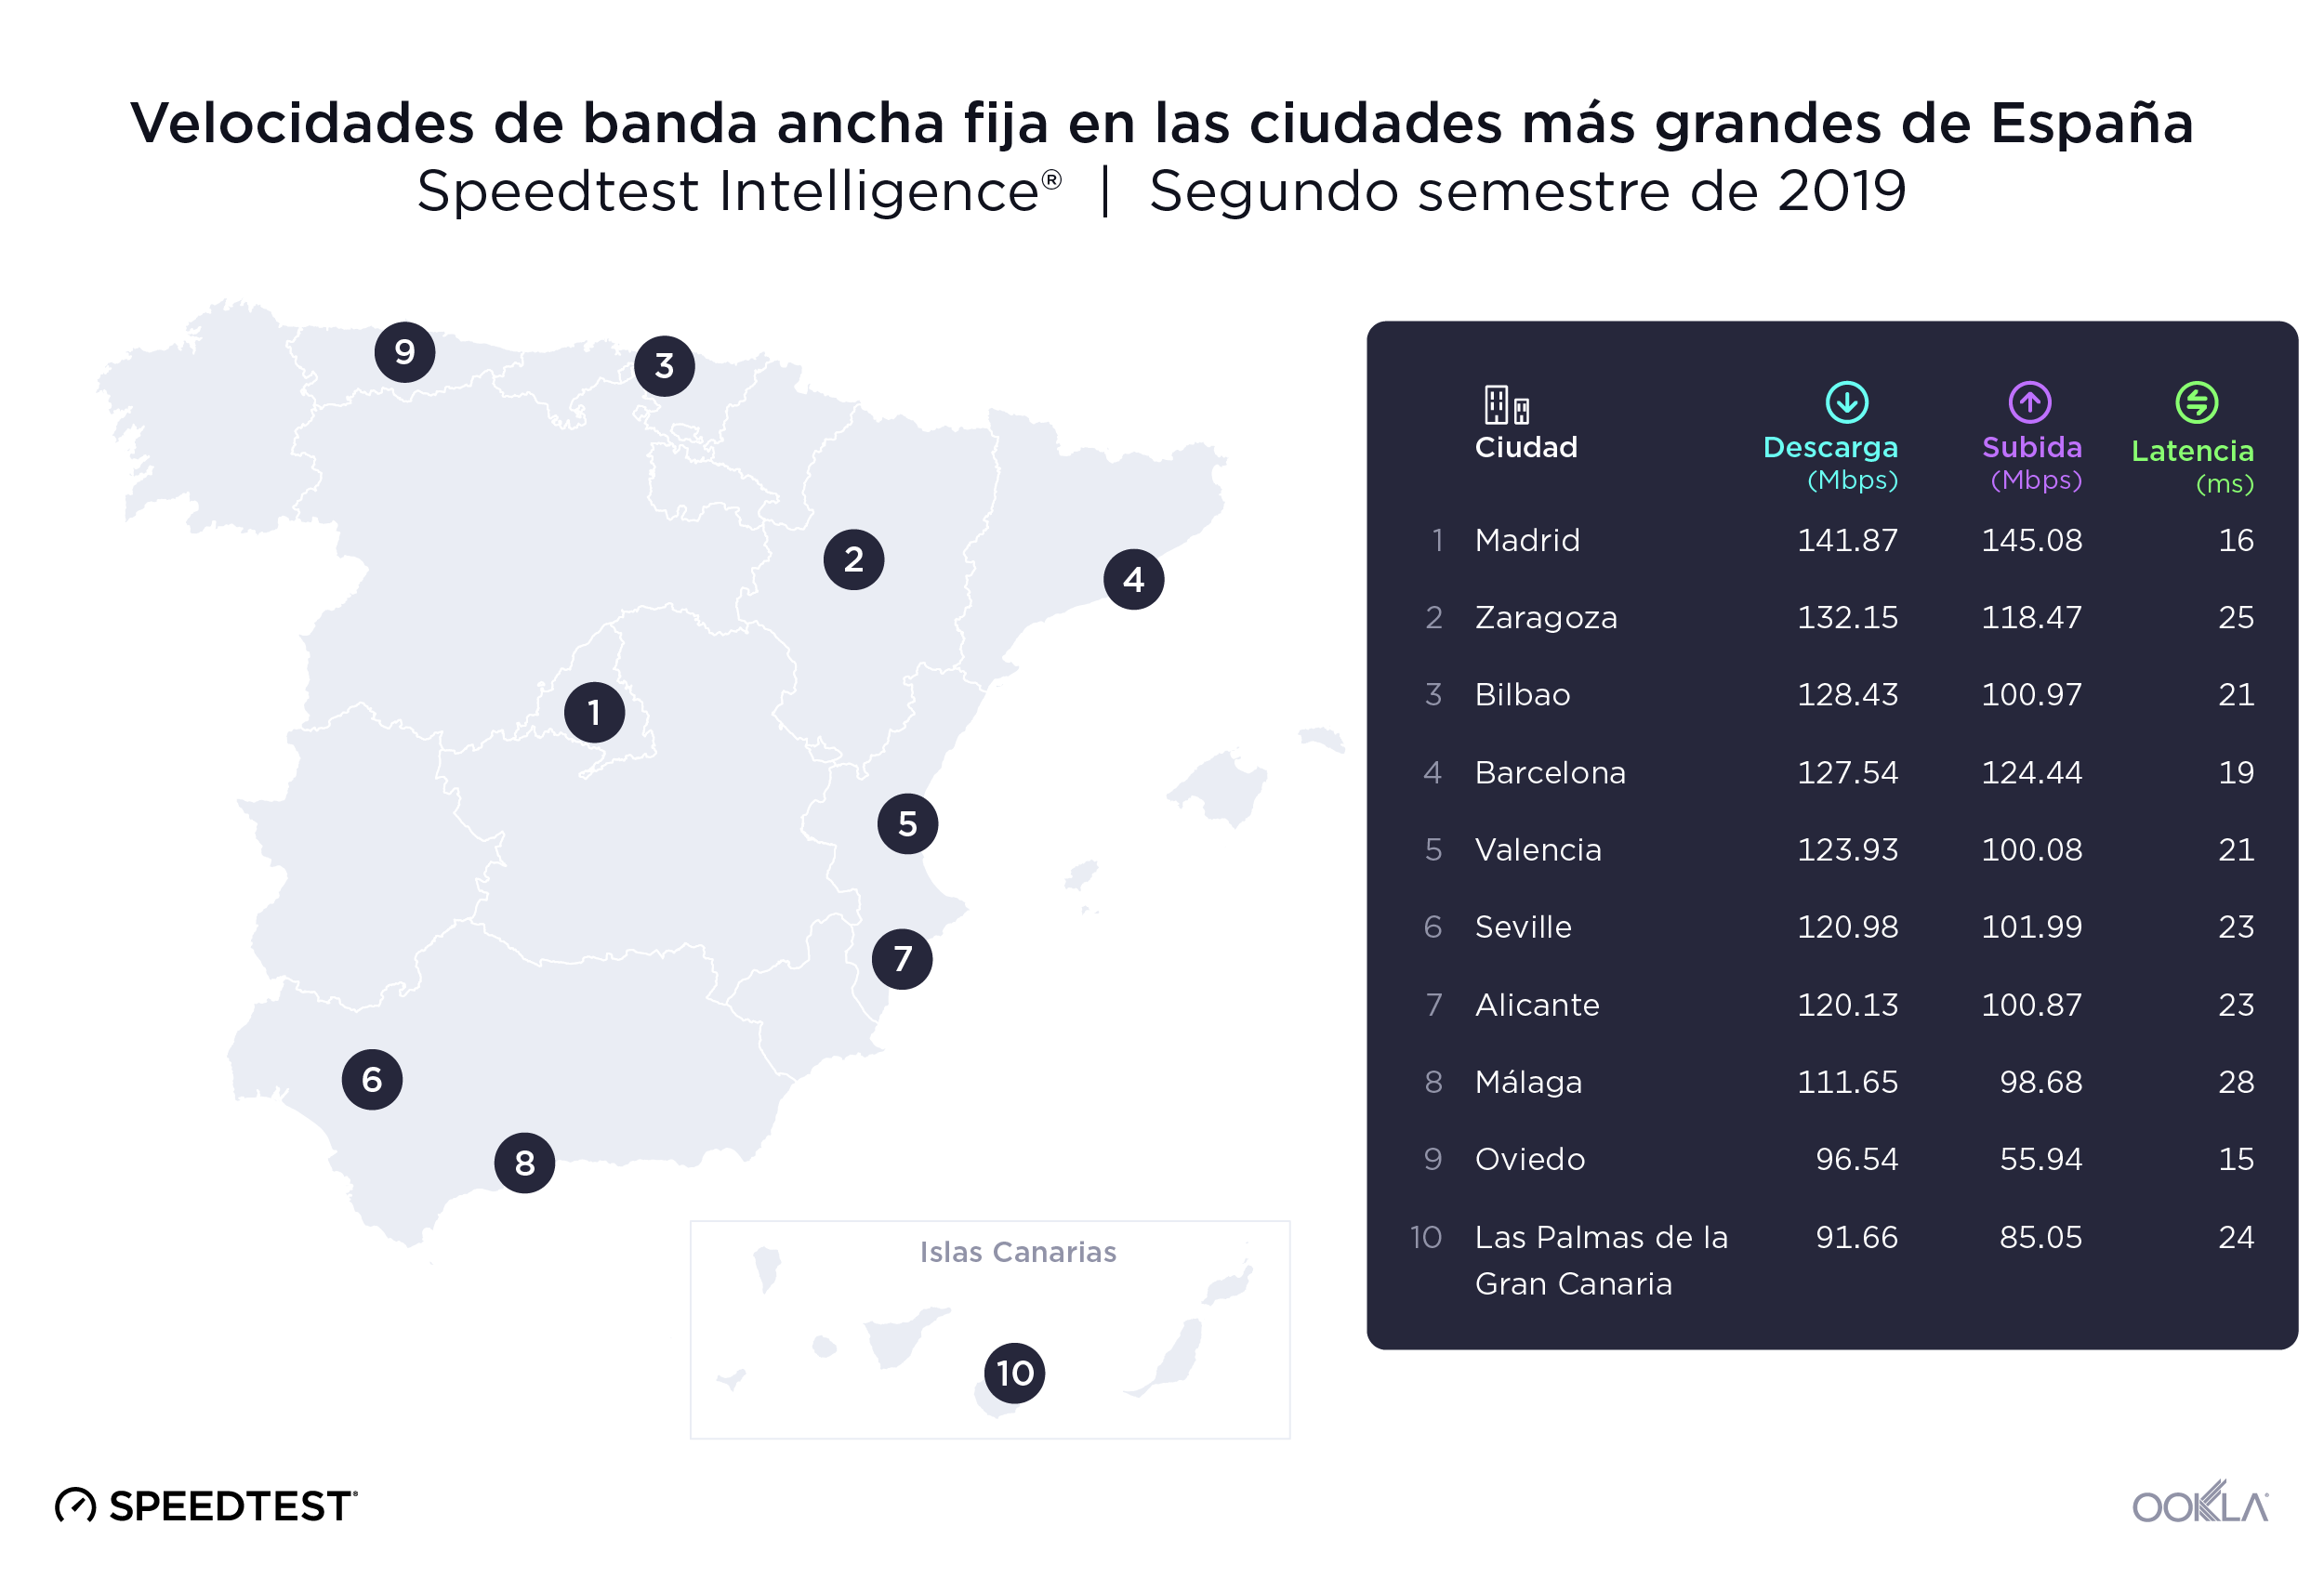
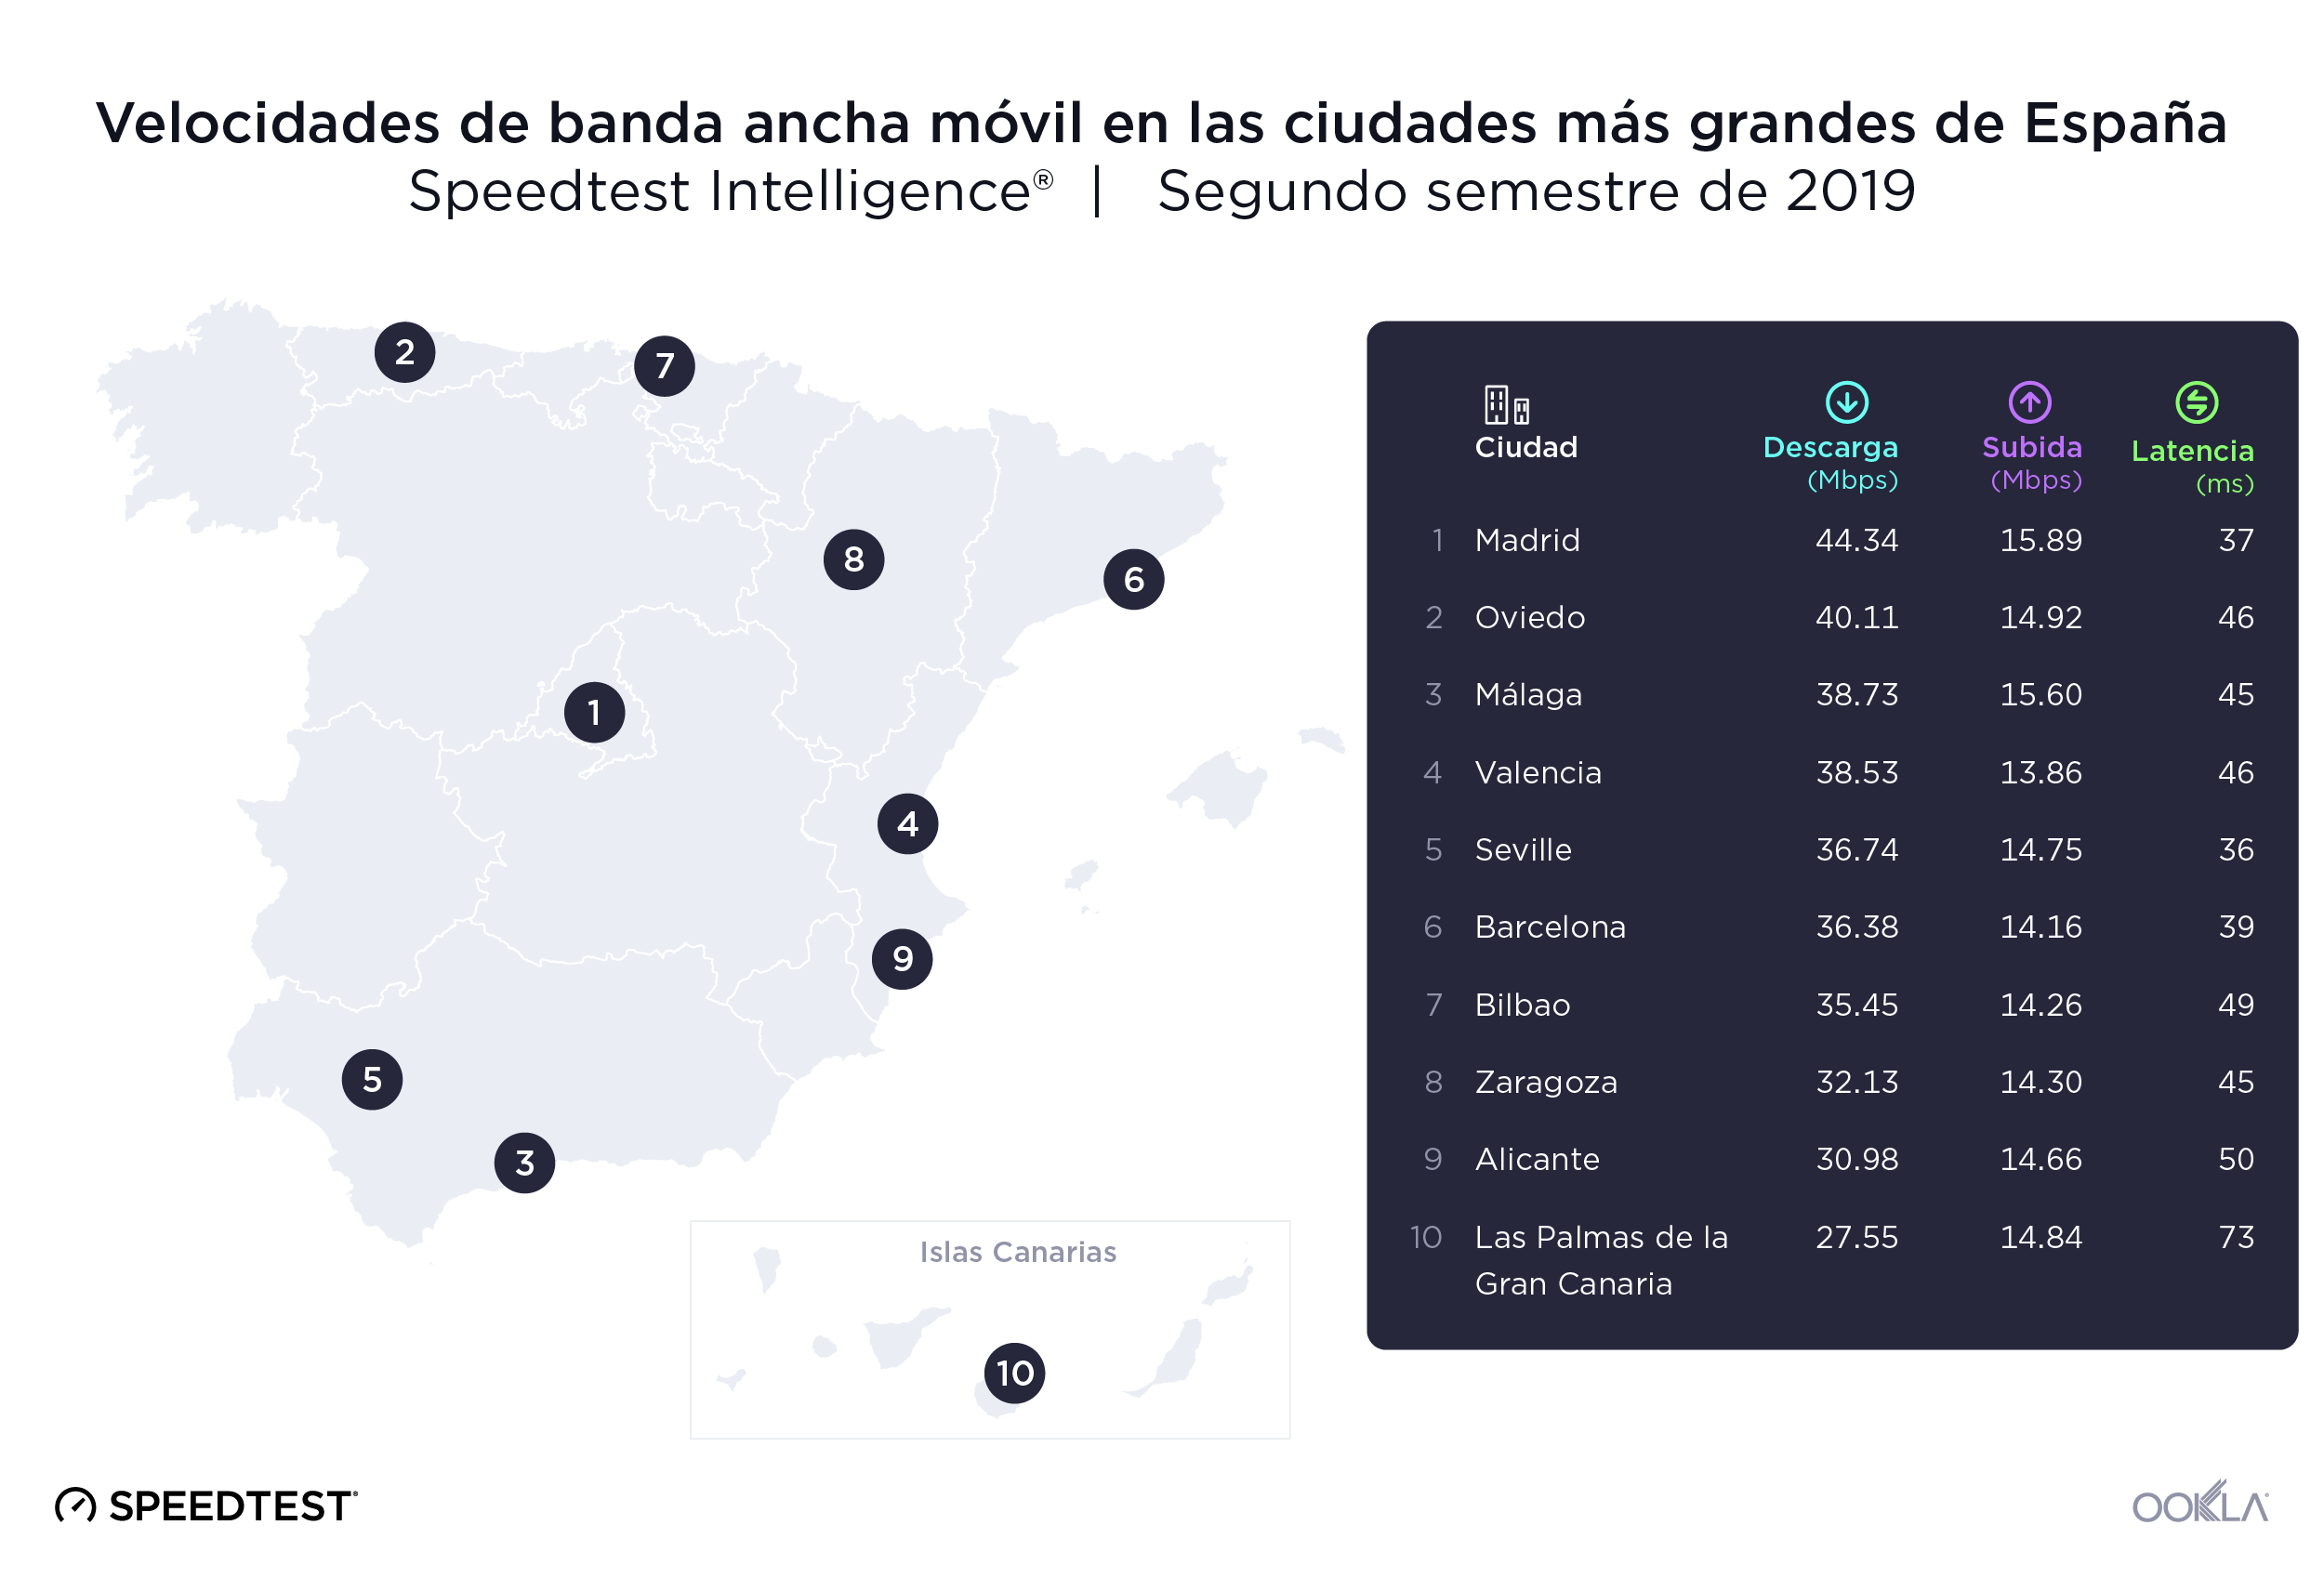
Para estudiar las velocidades de Internet de las diez ciudades más pobladas de España en el segundo semestre de 2019 utilizamos los datos de Speedtest de 2.183.336 pruebas realizadas por los usuarios. Madrid registró las velocidades medias de descarga más altas tanto en banda ancha fija como en Internet móvil.

Las velocidades medias de descarga por banda ancha fija oscilaron entre los 141,87 Mbps de Madrid y los 91,66 Mbps de Las Palmas de la Gran Canaria, una diferencia del 35,4 %. Madrid registró también la velocidad de subida media más alta por banda ancha fija, con 145,08 Mbps. Oviedo ocupó el último lugar en velocidad de subida por banda ancha fija con un 61,4 % menos de velocidad de subida que Madrid.

Oviedo tuvo la menor latencia en banda ancha fija de las ciudades de nuestra lista durante el segundo semestre de 2019, con 15 ms. Málaga registró la latencia más alta, con 28 ms.
Ookla_Mobile-Broadband-Speeds_Spain_0220_es-1
La brecha entre las velocidades más rápidas y más lentas de las ciudades españolas por banda ancha móvil fue similar a la que apreciamos en la banda ancha fija en el segundo semestre de 2019. Madrid volvió a liderar el rendimiento de la banda ancha móvil con una velocidad media de descarga de 44,35 Mbps y una velocidad media de subida de 15,89 Mbps. Las Palmas quedó en último lugar en velocidades de descarga con un 37,9 % menos de velocidad media de descarga que Madrid. Valencia registró la velocidad de subida media más baja por Internet móvil: 13,86 Mbps. Sevilla obtuvo la menor latencia por Internet móvil con 36 ms en el segundo semestre de 2019 y Las Palmas registró la mayor latencia por Internet móvil con 73 ms.

Zaragoza lideró la disponibilidad de 4G en las ciudades españolas más pobladas

Disponibilidad de 4G en las ciudades más grandes de España
Speedtest Intelligence® | Segundo semestre de 2019
Ciudad Disponibilidad de 4G
Zaragoza 97,2 %
Valencia 97,1 %
Sevilla 96,8 %
Málaga 96,7 %
Oviedo 95,4 %
Madrid 95,1 %
Las Palmas de la Gran Canaria 95,0 %
Alicante 94,6 %
Bilbao 94,3 %
Barcelona 87,7 %

La disponibilidad de 4G en las ciudades más grandes de España superó el promedio del país, siendo Zaragoza la de mayor disponibilidad de 4G con el 97,2 % de las ubicaciones analizadas. Barcelona tuvo la menor disponibilidad de 4G de nuestra lista, con el 87,7 %.

MÁSMÓVIL fue el proveedor de banda ancha fija más rápido de 6 ciudades

Si nos fijamos específicamente en la puntuación de velocidad en cada una de las ciudades españolas en el segundo semestre de 2019, vemos que MÁSMÓVIL fue el proveedor más rápido en seis ciudades: Málaga, Sevilla, Zaragoza, Madrid, Valencia y Alicante. Adamo, el proveedor fijo más rápido de Barcelona, consiguió la puntuación de velocidad más alta de la lista con 185,29. Vodafone fue el proveedor más rápido en Bilbao y Oviedo.

Rendimiento de la banda ancha fija por operador en las ciudades más grandes de España
Speedtest Intelligence® | Segundo semestre de 2019
Ciudad Proveedor Speed ScoreTM
Barcelona Adamo 185,29
Málaga MÁSMÓVIL 156,24
Sevilla MÁSMÓVIL 148,78
Madrid MÁSMÓVIL 145,83
Bilbao Vodafone 144,65
Zaragoza MÁSMÓVIL 144,40
Valencia MÁSMÓVIL 143,99
Oviedo Vodafone 143,85
Alicante MÁSMÓVIL 143,72
Las Palmas Orange 114,46

Si nos fijamos en los proveedores españoles más rápidos en banda ancha móvil de cada ciudad en el segundo semestre de 2019, Movistar dominó la lista con la puntuación de velocidad más alta en 7 ciudades. Movistar consiguió también la puntuación de velocidad máxima, con 52,04 en Sevilla. Vodafone fue el proveedor de Internet móvil más rápido en Madrid (35,67). Orange fue el proveedor más rápido de Barcelona (35,37) y Oviedo (45,10).

Rendimiento de Internet móvil por operador en las ciudades más grandes de España
Speedtest Intelligence® | Segundo semestre de 2019
Ciudad Proveedor Speed ScoreTM
Sevilla Movistar 52,04
Valencia Movistar 50,80
Alicante Movistar 50,36
Málaga Movistar 48,97
Bilbao Movistar 48,86
Oviedo Orange 45,10
Zaragoza Movistar 40,79
Madrid Vodafone 35,67
Barcelona Orange 35,37
Las Palmas Movistar 31,37

Nos encantará seguir la evolución de estos mercados y estudiar el cambiante panorama del rendimiento de Internet y de la cobertura móvil en Europa. Si desea obtener más información sobre las velocidades fijas y móviles en diferentes mercados, haga clic aquí para leer más información de Ookla.

Nota del editor: Este artículo fue actualizado el 4 de marzo del 2020 que para corregir un error de edición que reportaba cifras incorrectas del PRA móvil.

Ookla retains ownership of this article including all of the intellectual property rights, data, content graphs and analysis. This article may not be quoted, reproduced, distributed or published for any commercial purpose without prior consent. Members of the press and others using the findings in this article for non-commercial purposes are welcome to publicly share and link to report information with attribution to Ookla.

| April 14, 2020

Can’t Connect? The Most Significant Online Service Outages in Q1 2020

“We’re experiencing problems at the moment” became an all-too-familiar phrase during the first three months of 2020. As we continue with our series of most significant outages across the globe, this article examines major web and online service outages from Q1 2020 using Downdetector® data. Outages came under increased scrutiny as COVID-19 spread and more people began working or studying from home, gaming, video conferencing and using more online services than ever before. However, we saw significant outages both before and after this time. The six categories of outages we’re highlighting here are: collaboration platforms, gaming, telecom operators, streaming services, social media and financial institutions.

Collaboration platforms

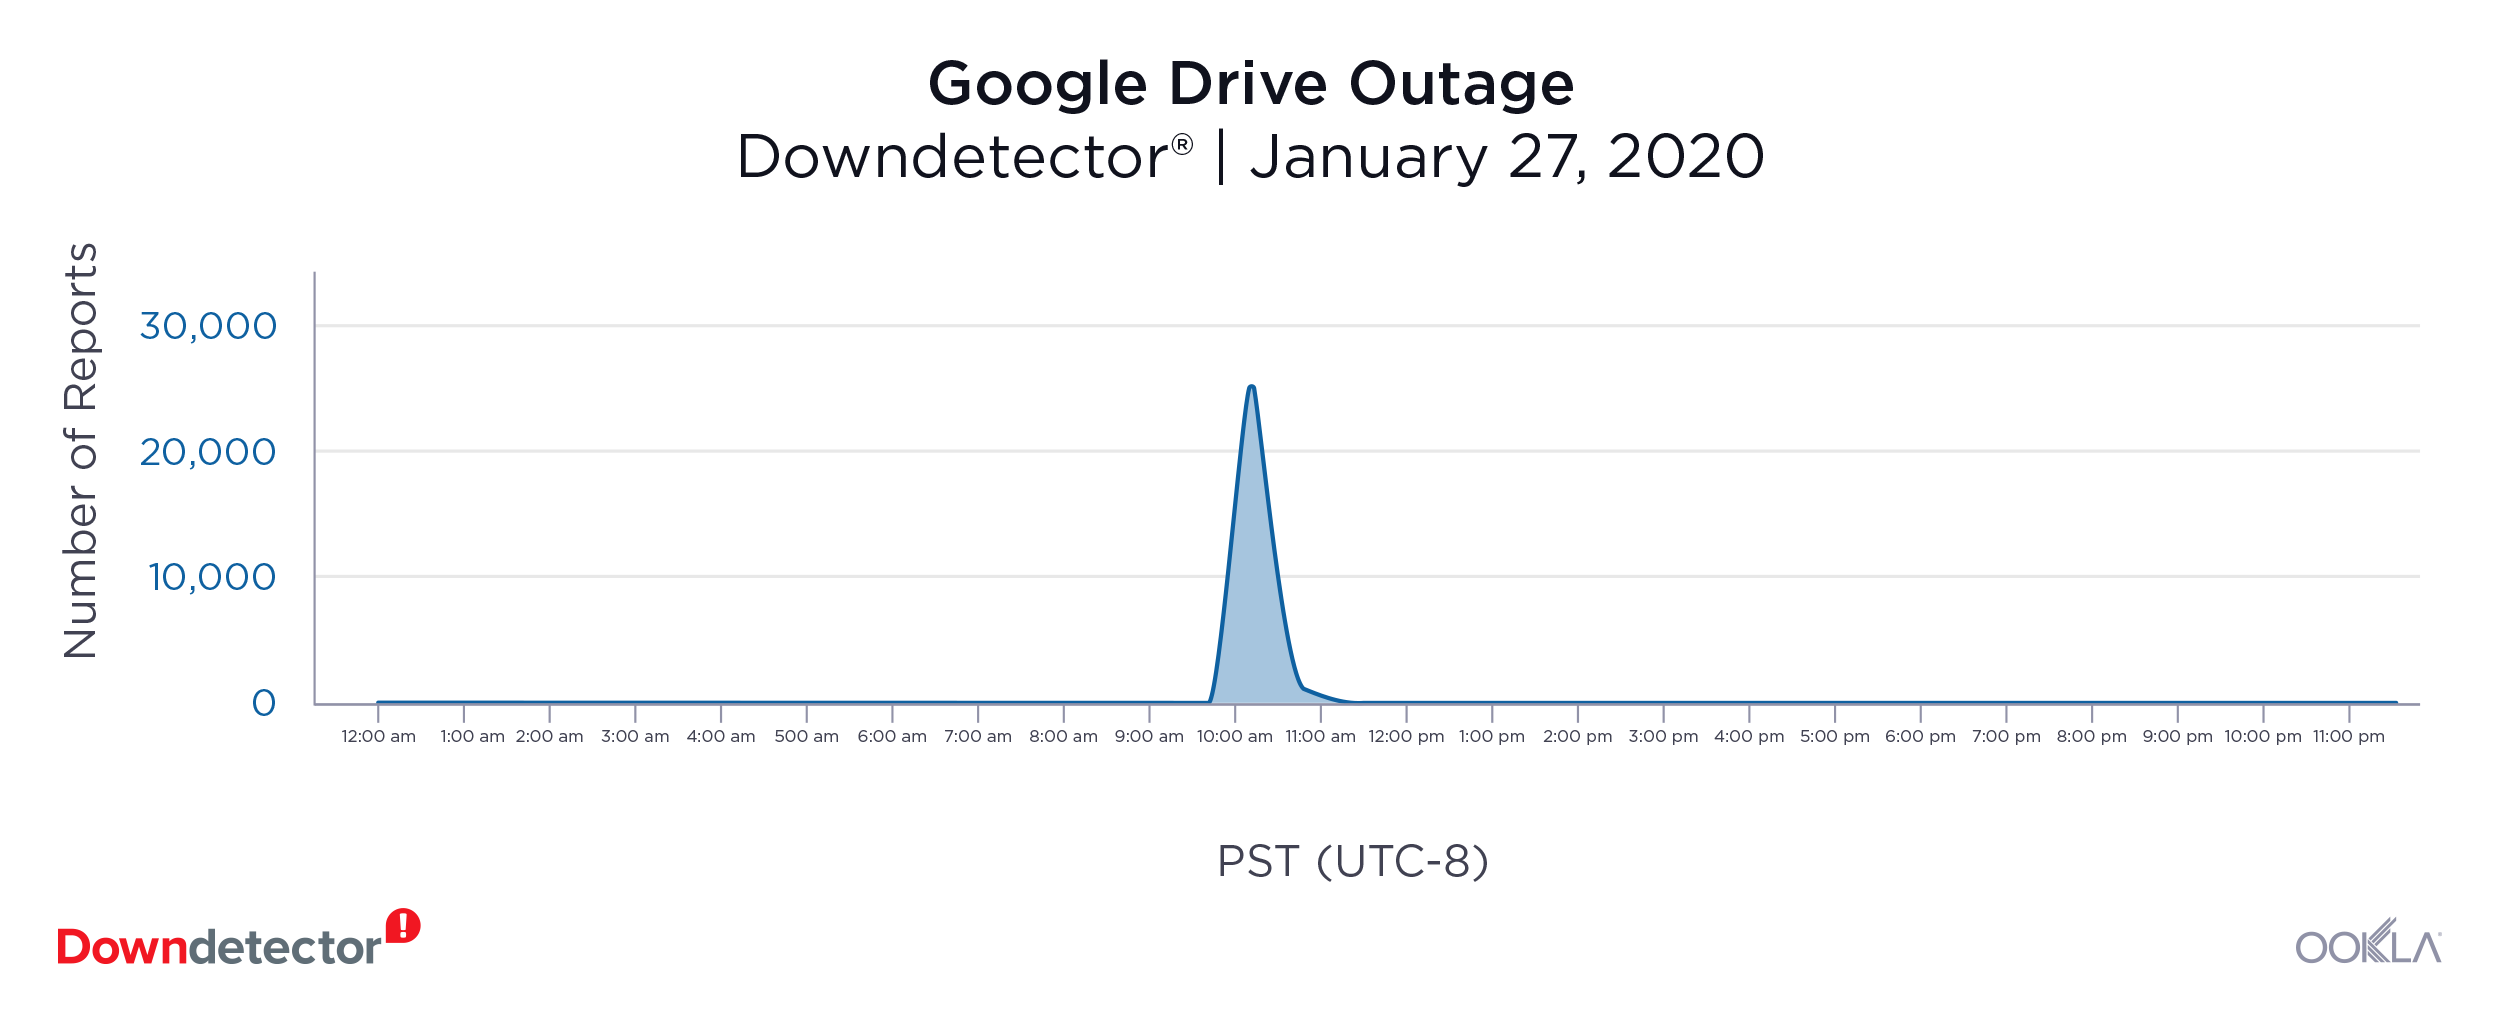
Google Drive (January 27, 2020): 24,558 outage reports at peak

1-Google-Drive-1
Users of Google’s popular file storage and synchronization service rushed to Downdetector when receiving the following error message: “Google Docs encountered an error. Please try reloading this page, or coming back to it in a few minutes.” on January 27. The outage reportedly lasted an hour and Downdetector received 24,558 reports during the peak fifteen minutes of the outage. Most reports originated from the US, but users also reported problems in Germany, Japan, Mexico, the Netherlands and the UK.

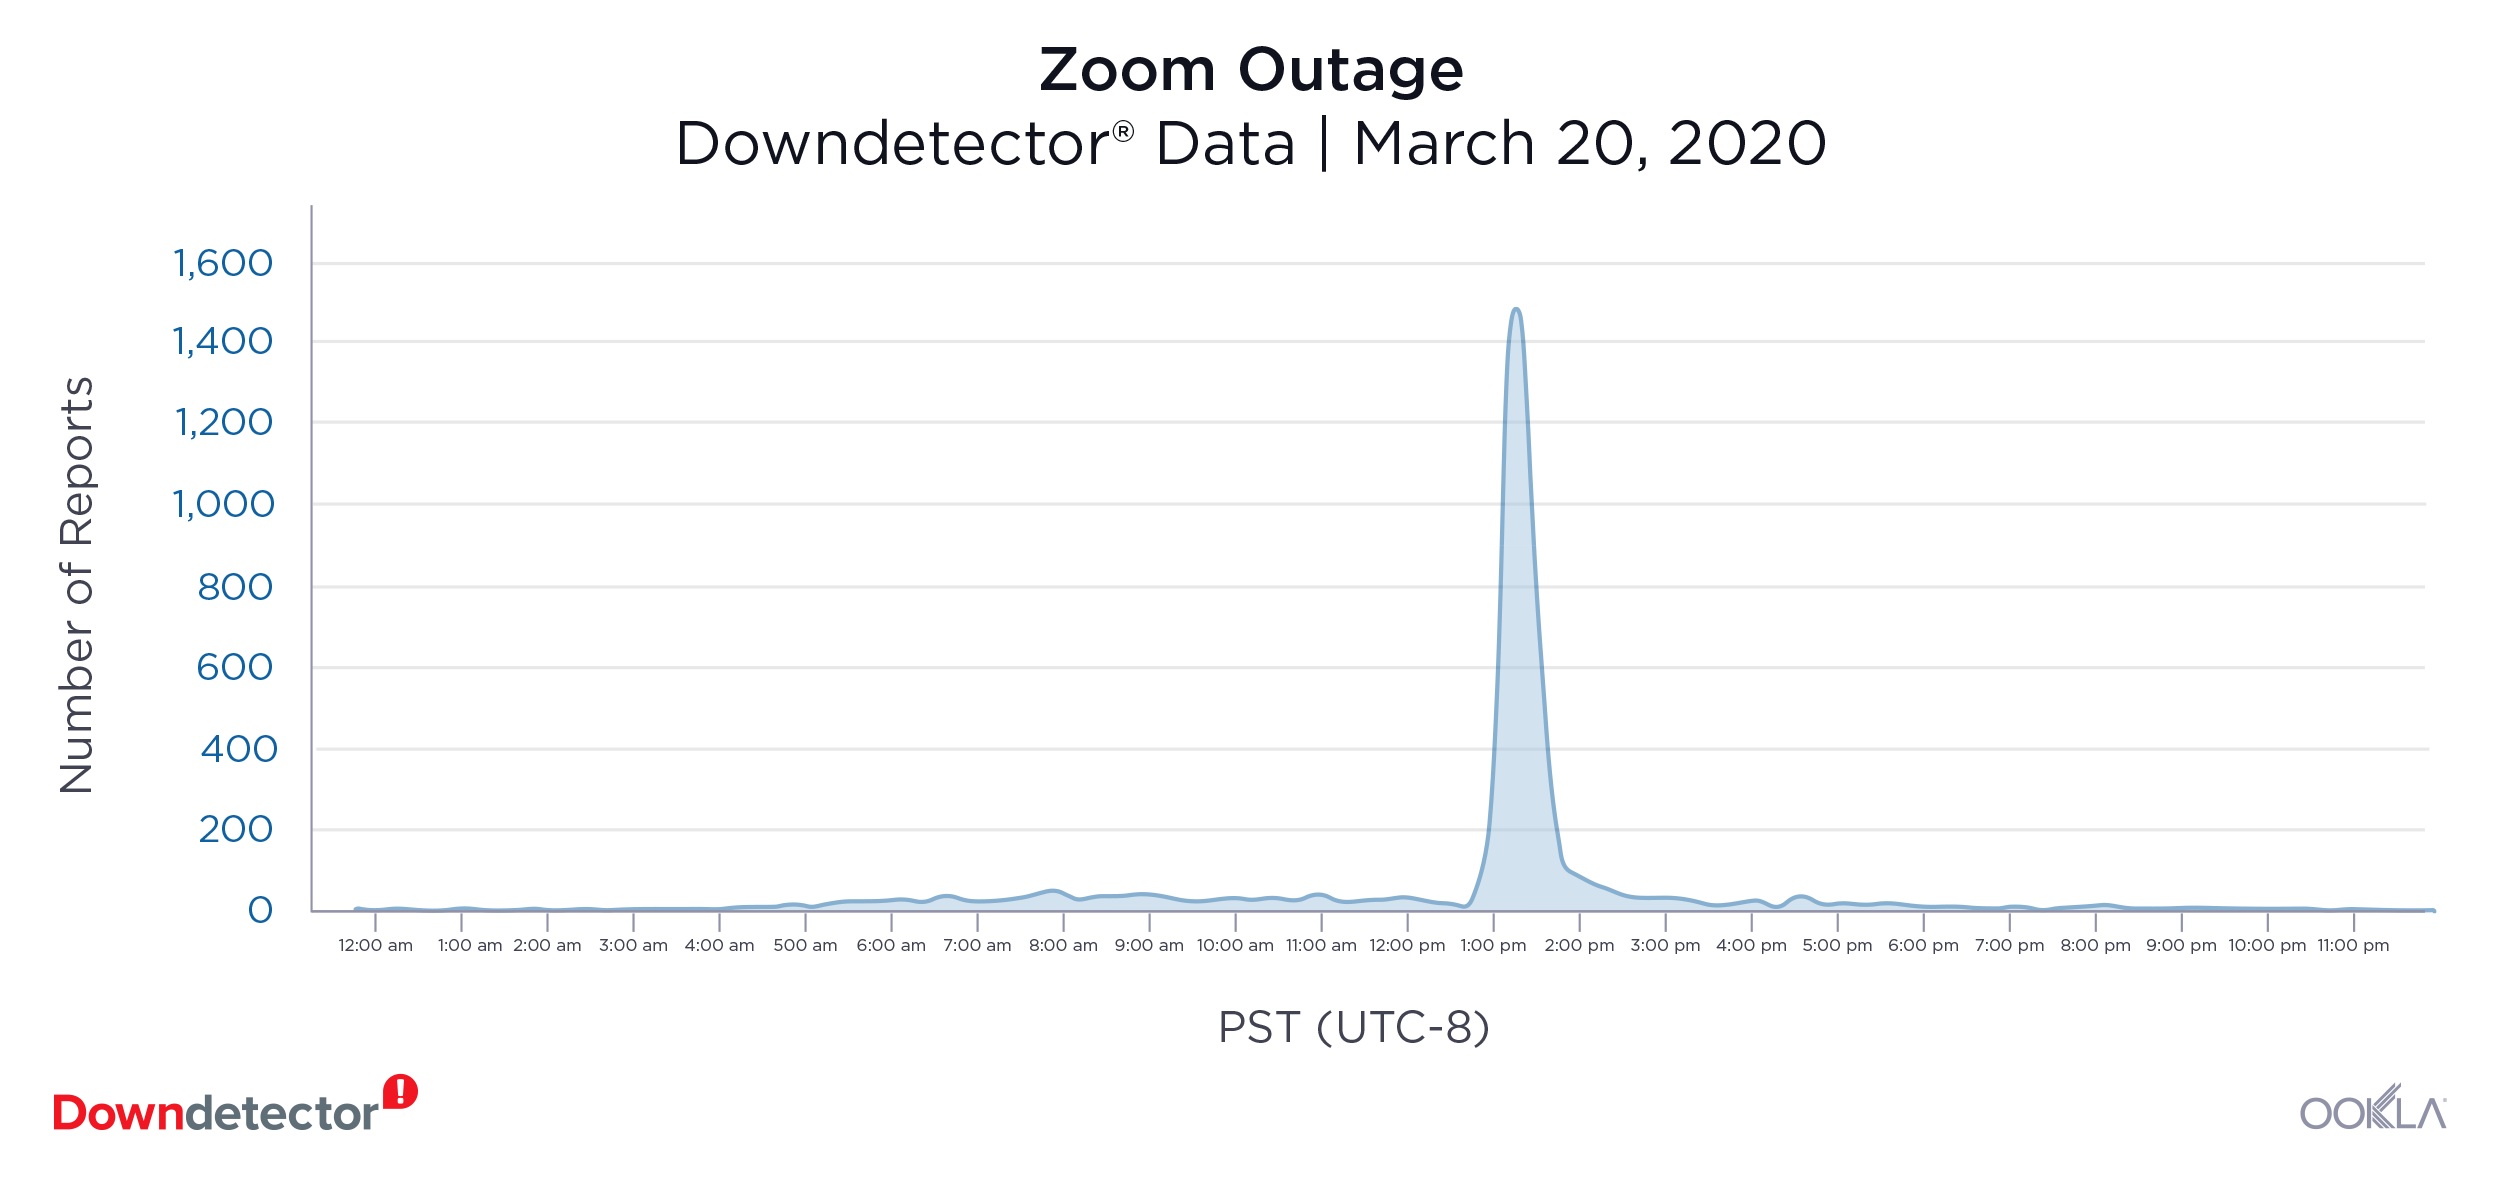
Zoom (March 20, 2020): 1,483 reports at peak

2-Zoom-1
Video conferencing software like Zoom has become an important tool to communicate. Amid an increase in volume, Zoom users, mostly in the U.S., reported an outage on March 20 that left people unable to access the service or make calls. The service also experienced a smaller outage on March 5 with 586 reports at the peak. Both outages lasted approximately two hours.

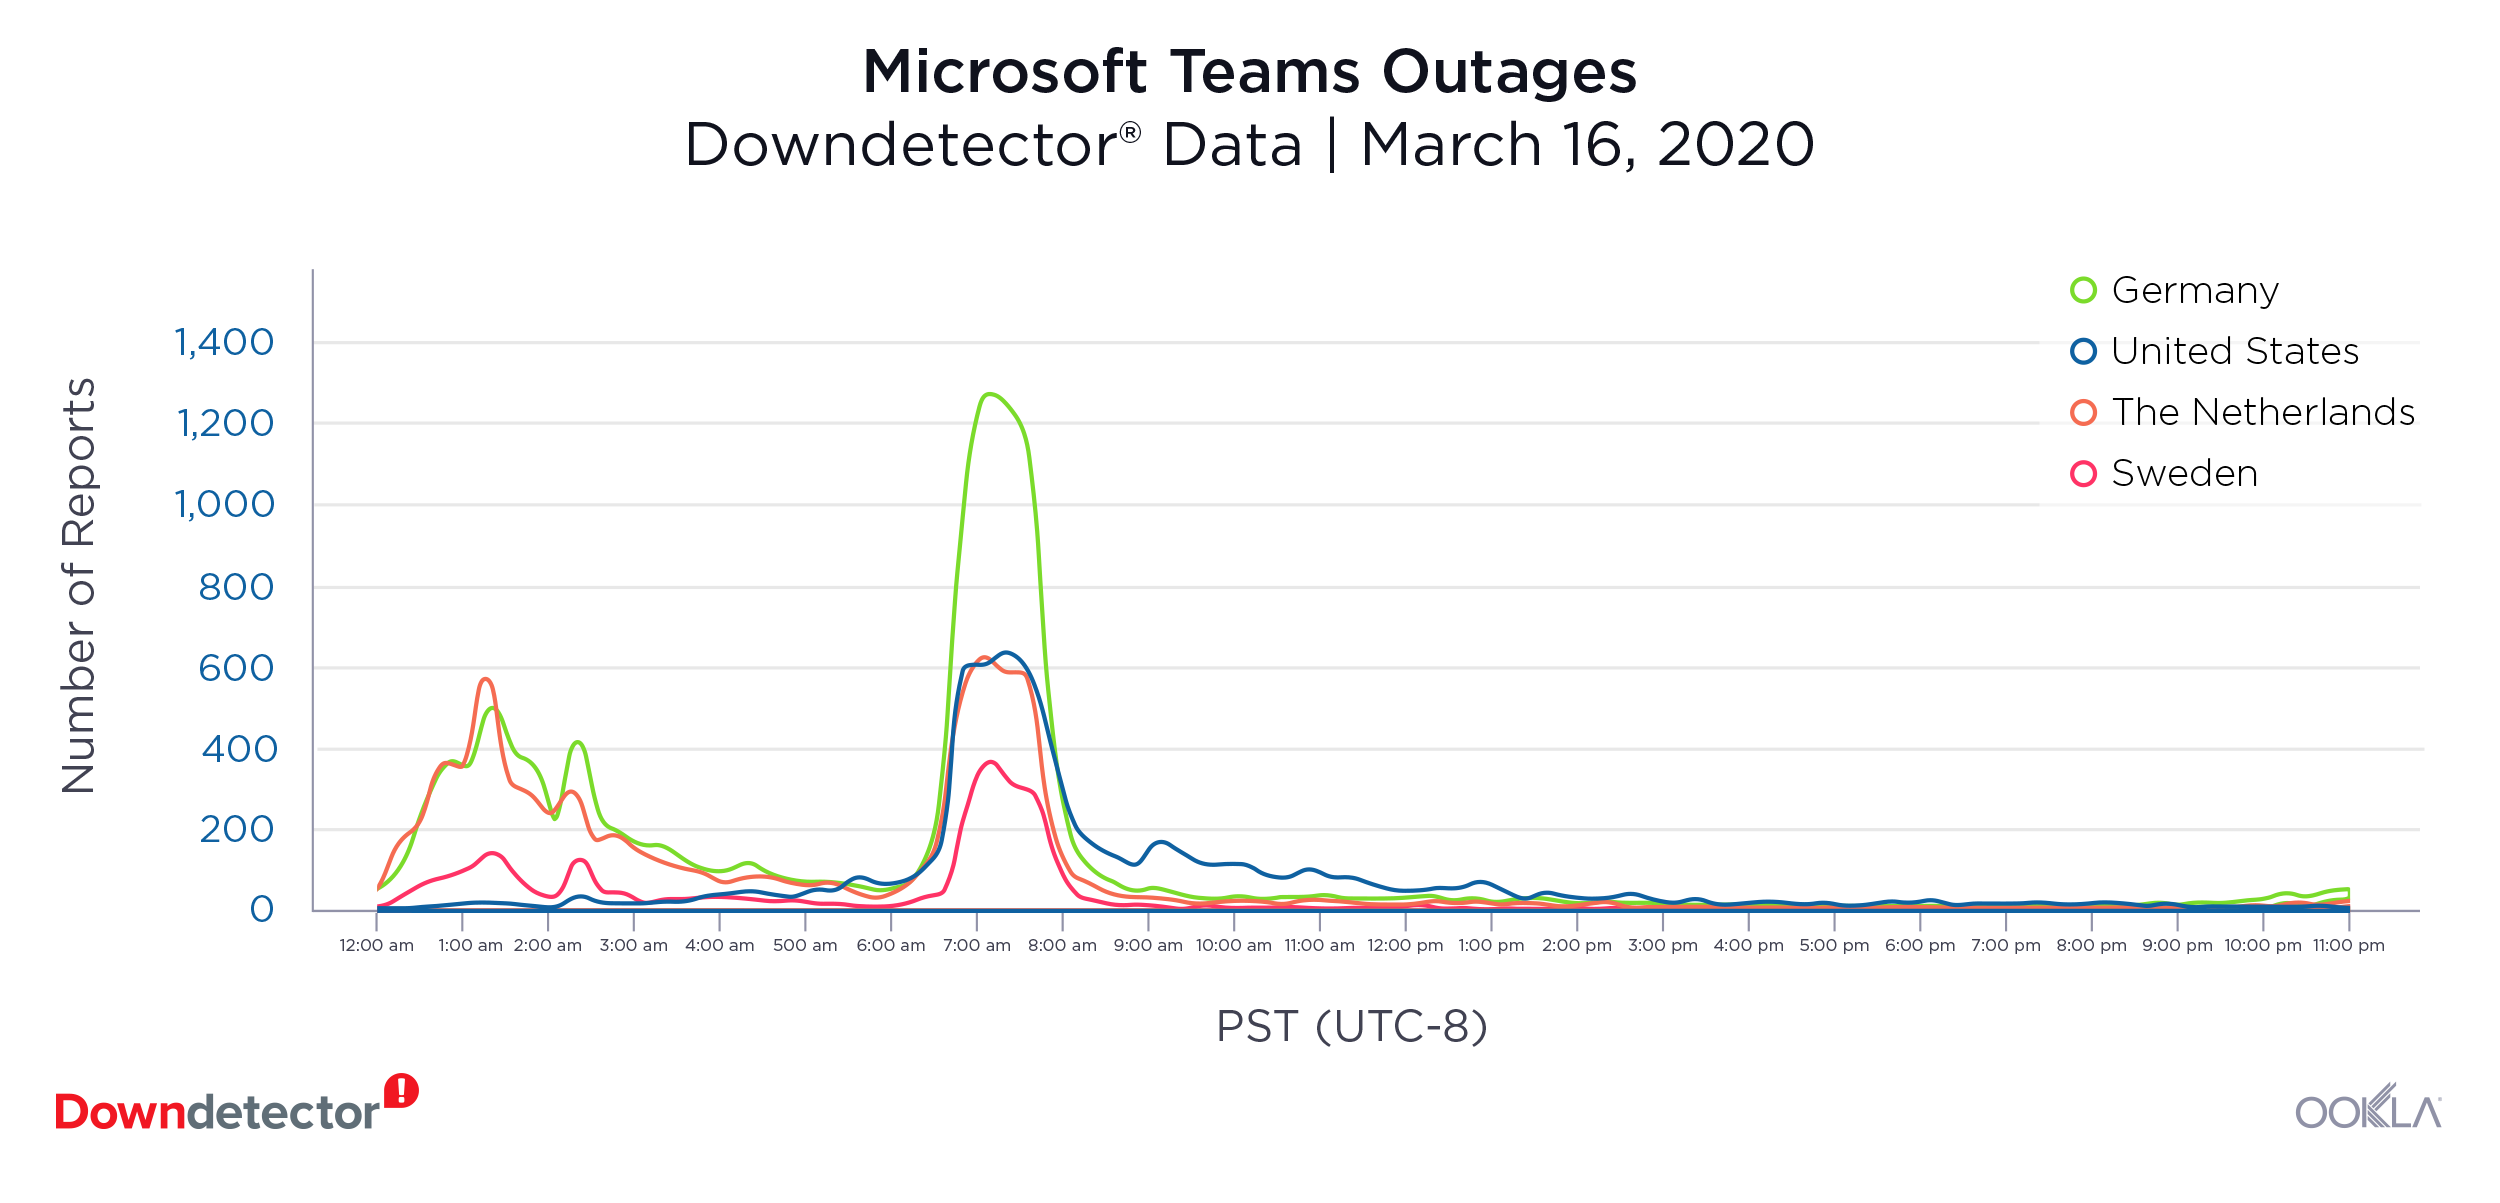
Microsoft Teams (March 16): Multiple outages

3-Teams
Microsoft Teams experienced a worldwide outage on March 16. The collaboration platform that streamlines communication in an organization was reportedly down for users in Germany, the Netherlands, Sweden and the U.S. The duration of the outage varied by country, but lasted more than six hours in most and recurred in the Netherlands for a period on March 17. Teams also experienced a significant outage over the span of five hours on February 2 when 9,386 users in the U.S. reported problems at the peak.

Gaming

Steam (multiple outages)

Steam-Bar-Outage-1
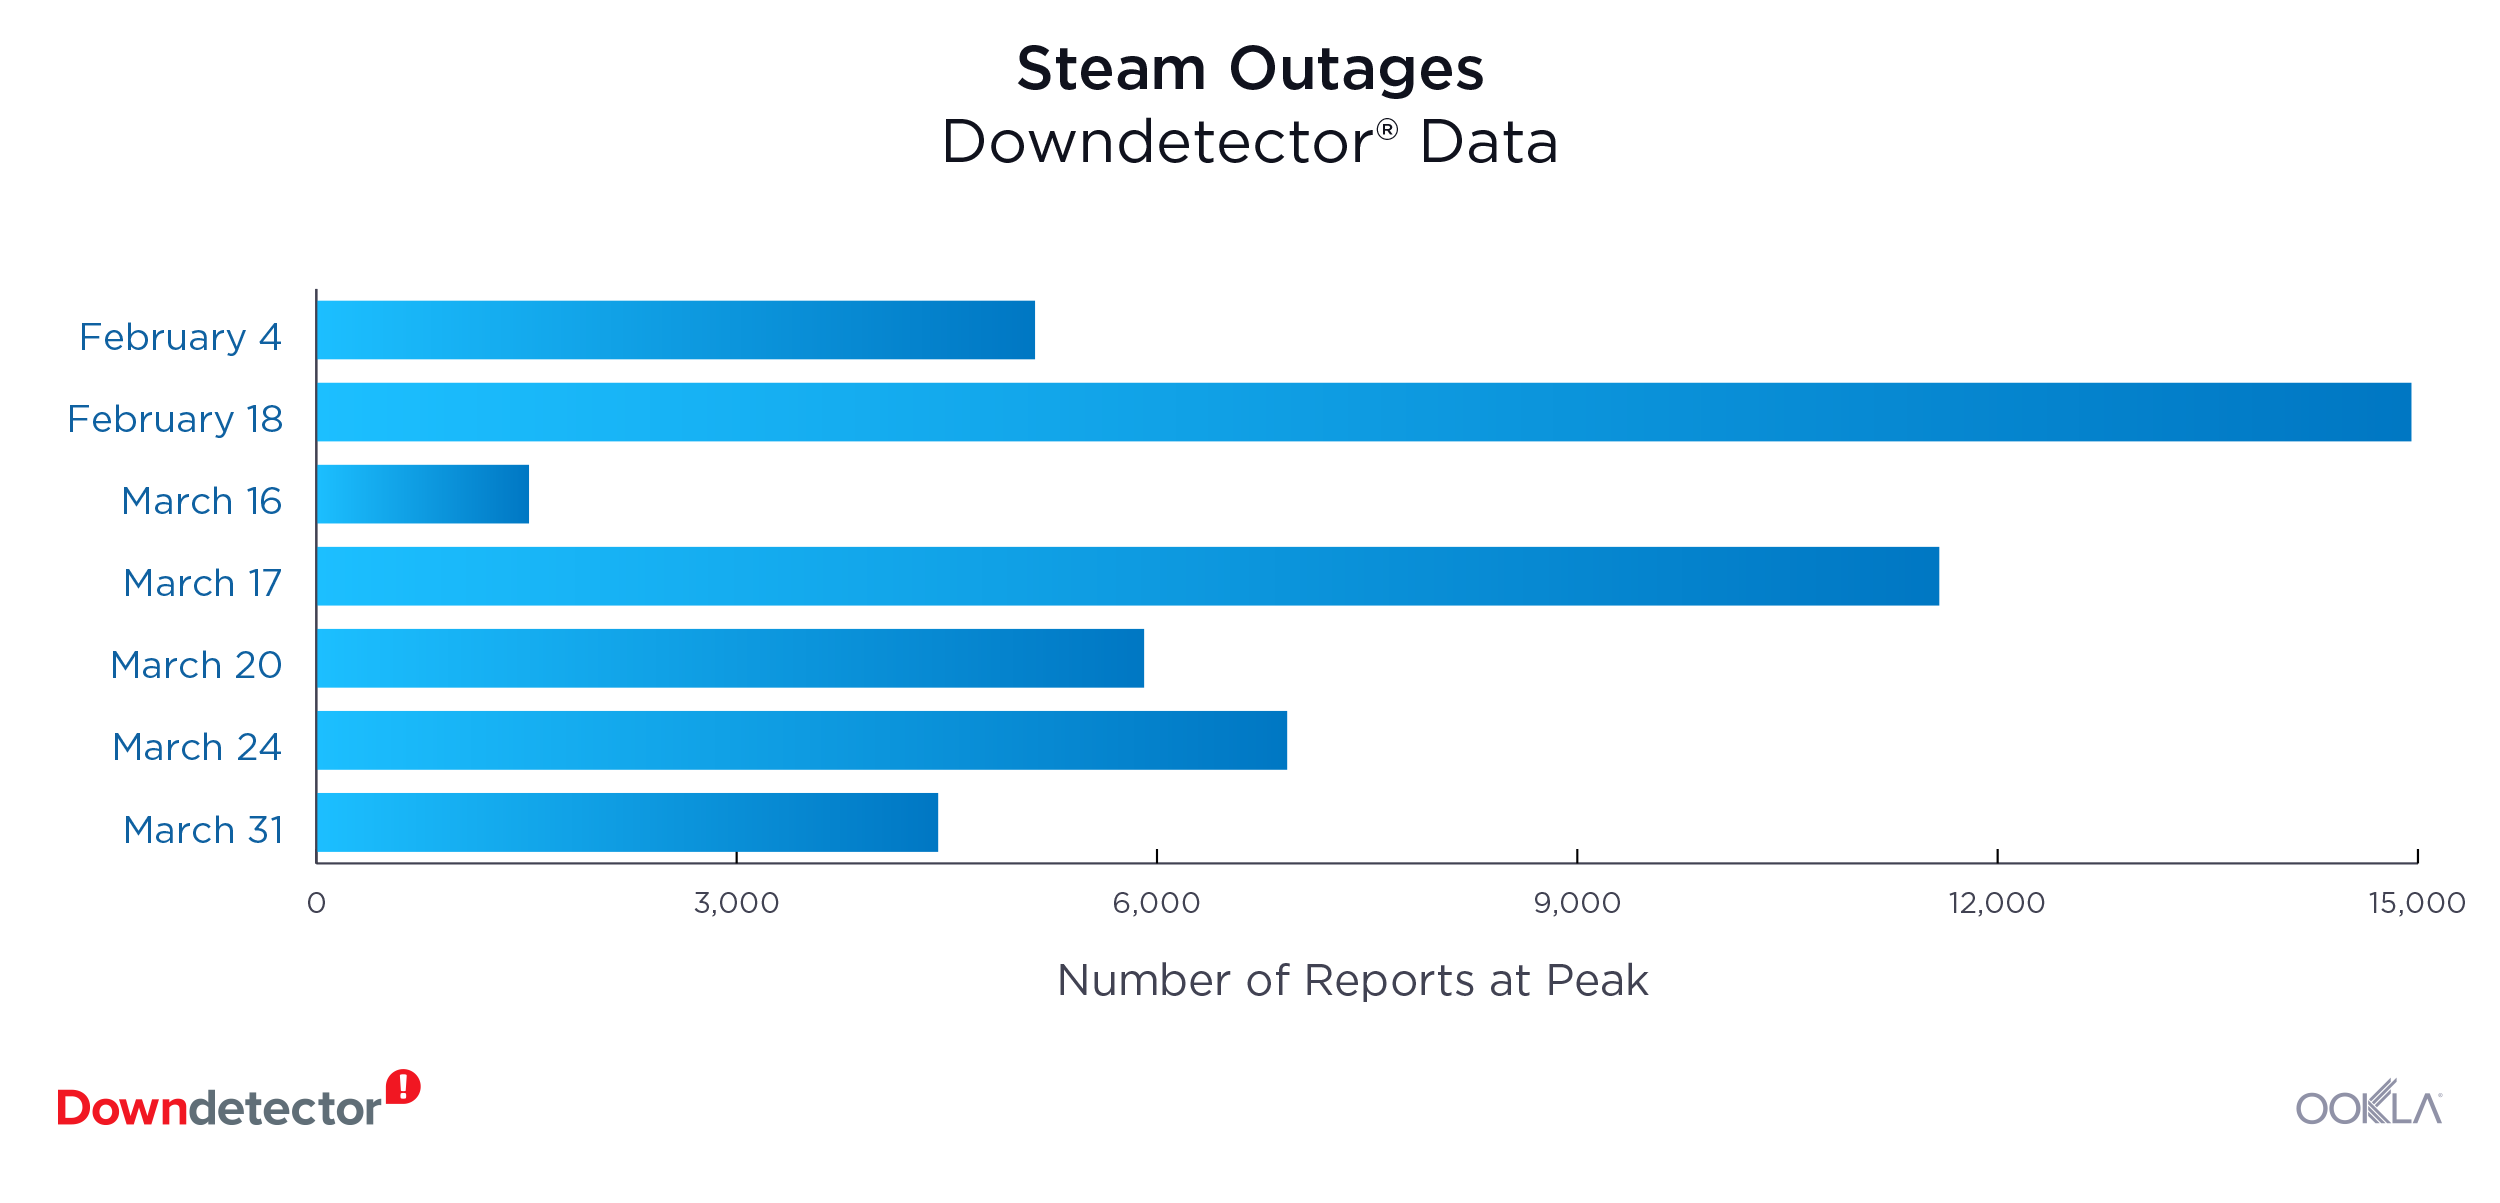
Steam suffered nine major outages during Q1 2020 (seven of which are pictured above), according to reports from users in Germany, the U.K. and the U.S. The largest outage took place on February 18 when the gaming platform was down for about three hours and 14,955 users reported issues at the peak of the outage. Steam users rushed to Downdetector again on March 17, which was Steam’s second largest outage with 11,585 reports at the peak of the outage. The two subsequent Tuesdays also proved problematic for Steam with 6,931 outages during the peak on March 24 and 4,440 outages during the March 31 peak.

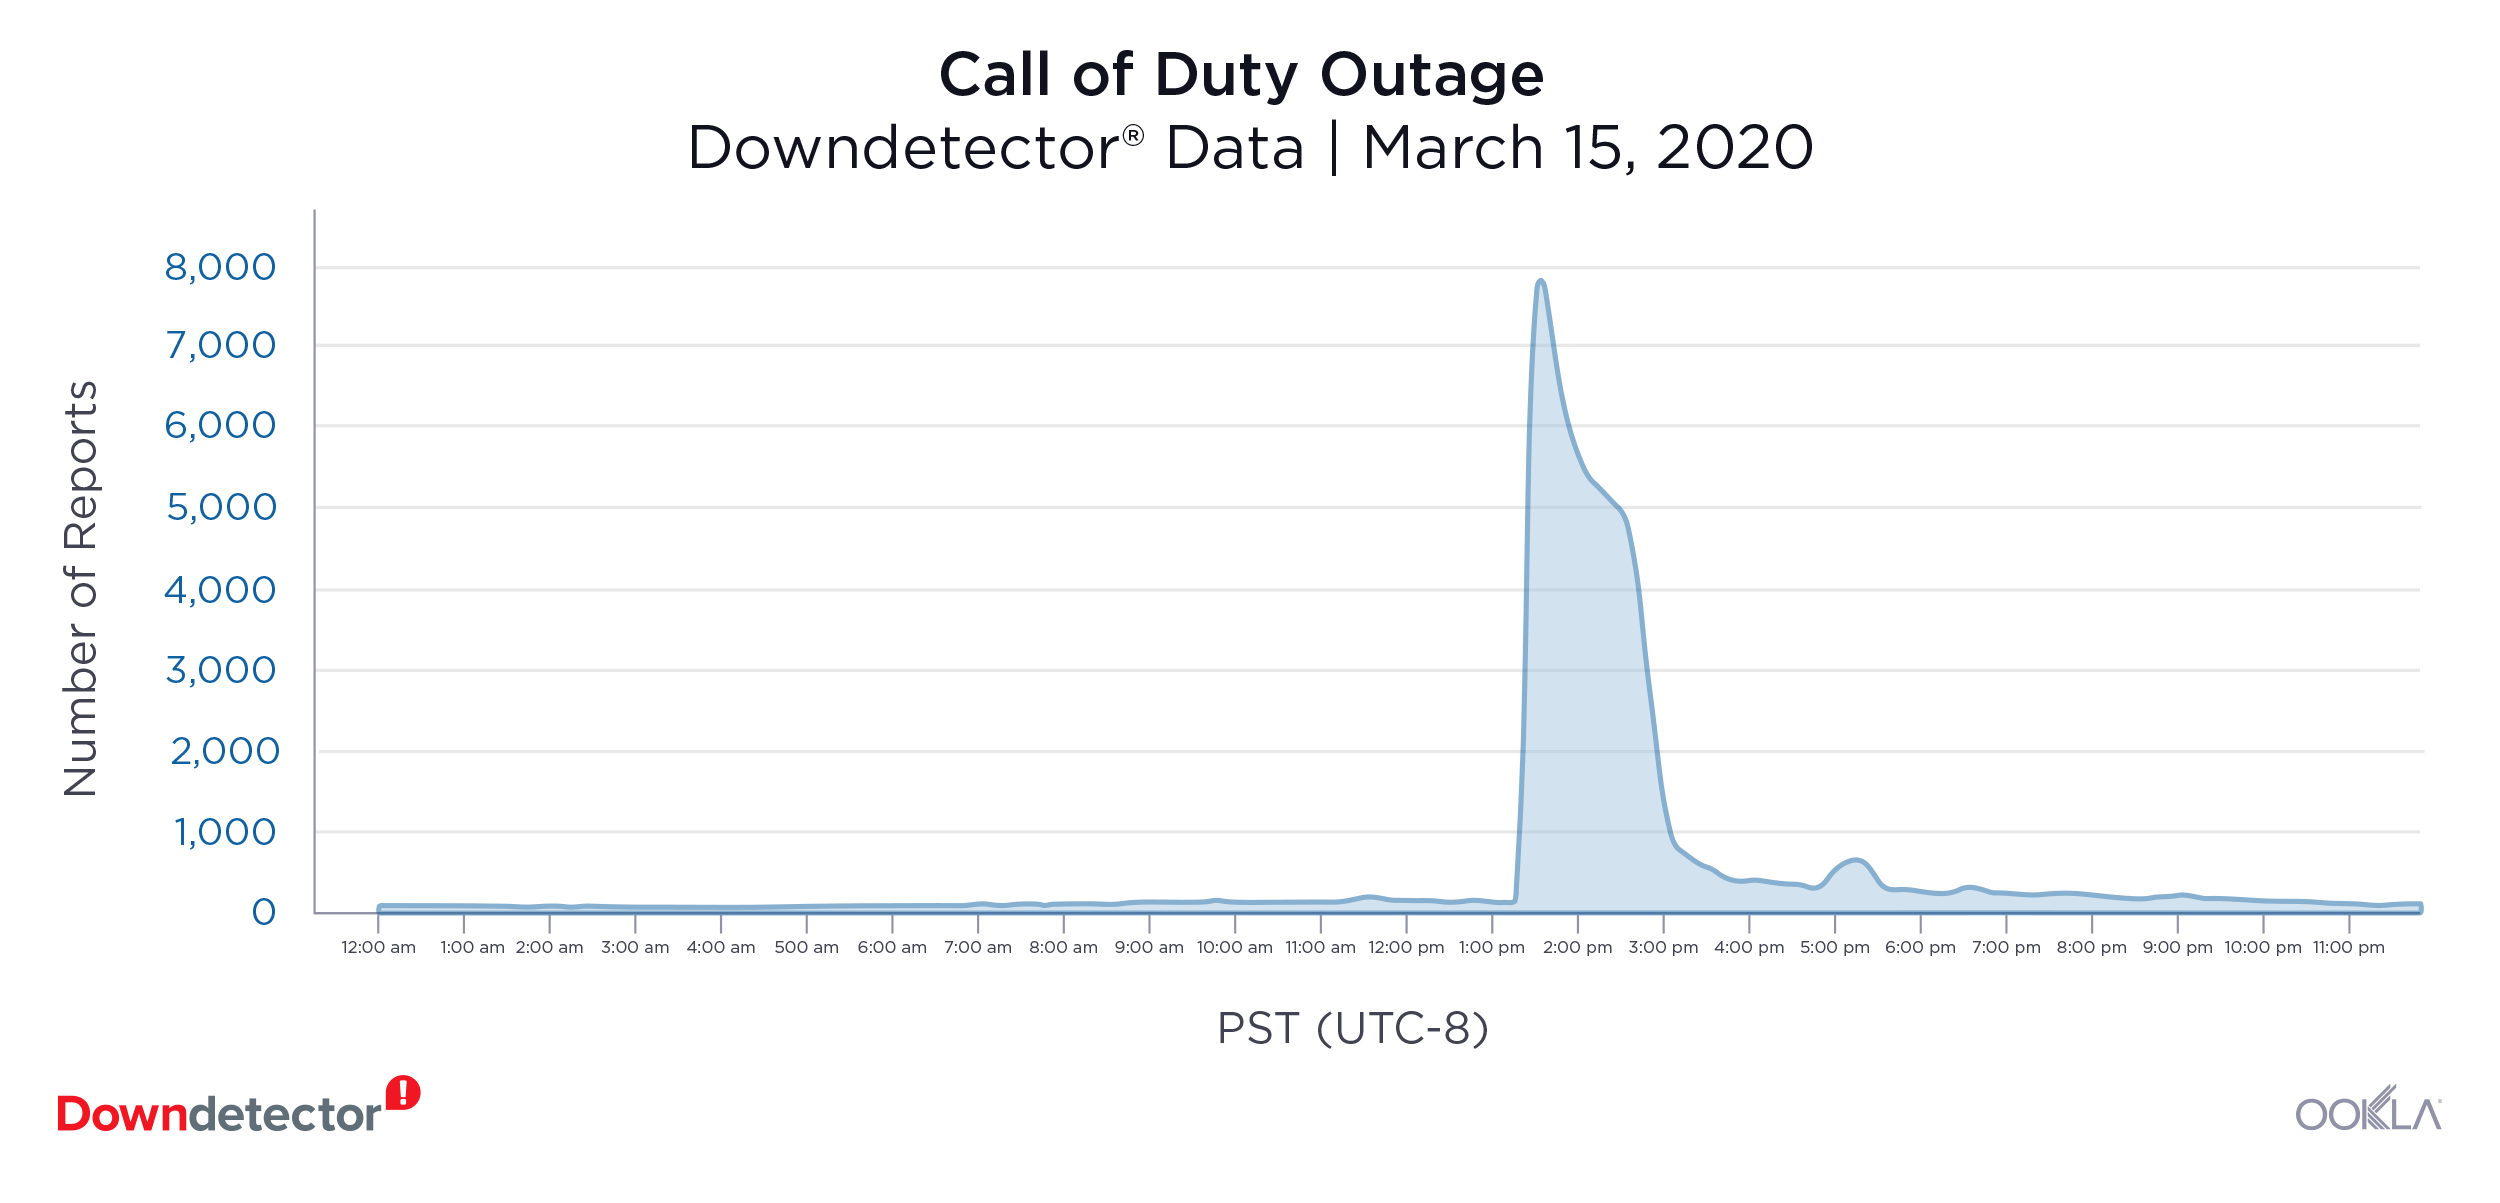
Call of Duty (March 15): 7,761 outages at peak

4-Call-of-Duty
Users in the U.S. reported multiple Call of Duty outages during Q1 2020. The largest outage took place on March 15, with 7,761 reports at the peak of an outage that primarily affected the server connection of the gaming platform. Gamers were unable to play with friends for about four hours that day. On March 17, Call of Duty had a smaller outage with 3,549 reports at peak.

Fortnite (March 17): 3,998 reports at peak

5-Fortnite

On March 17, Fornite tweeted “We’re currently investigating issues with logins, matchmaking, the Item Shop, and other Fortnight services. We’ll provide an update when these are resolved,” after users reported having problems with the gaming platform. Users were unable to access Fornite for about four hours that day. Most of the reports came from France, Germany, Japan, the Netherlands, Spain, the U.K. and the U.S.

Telecom providers

Italy

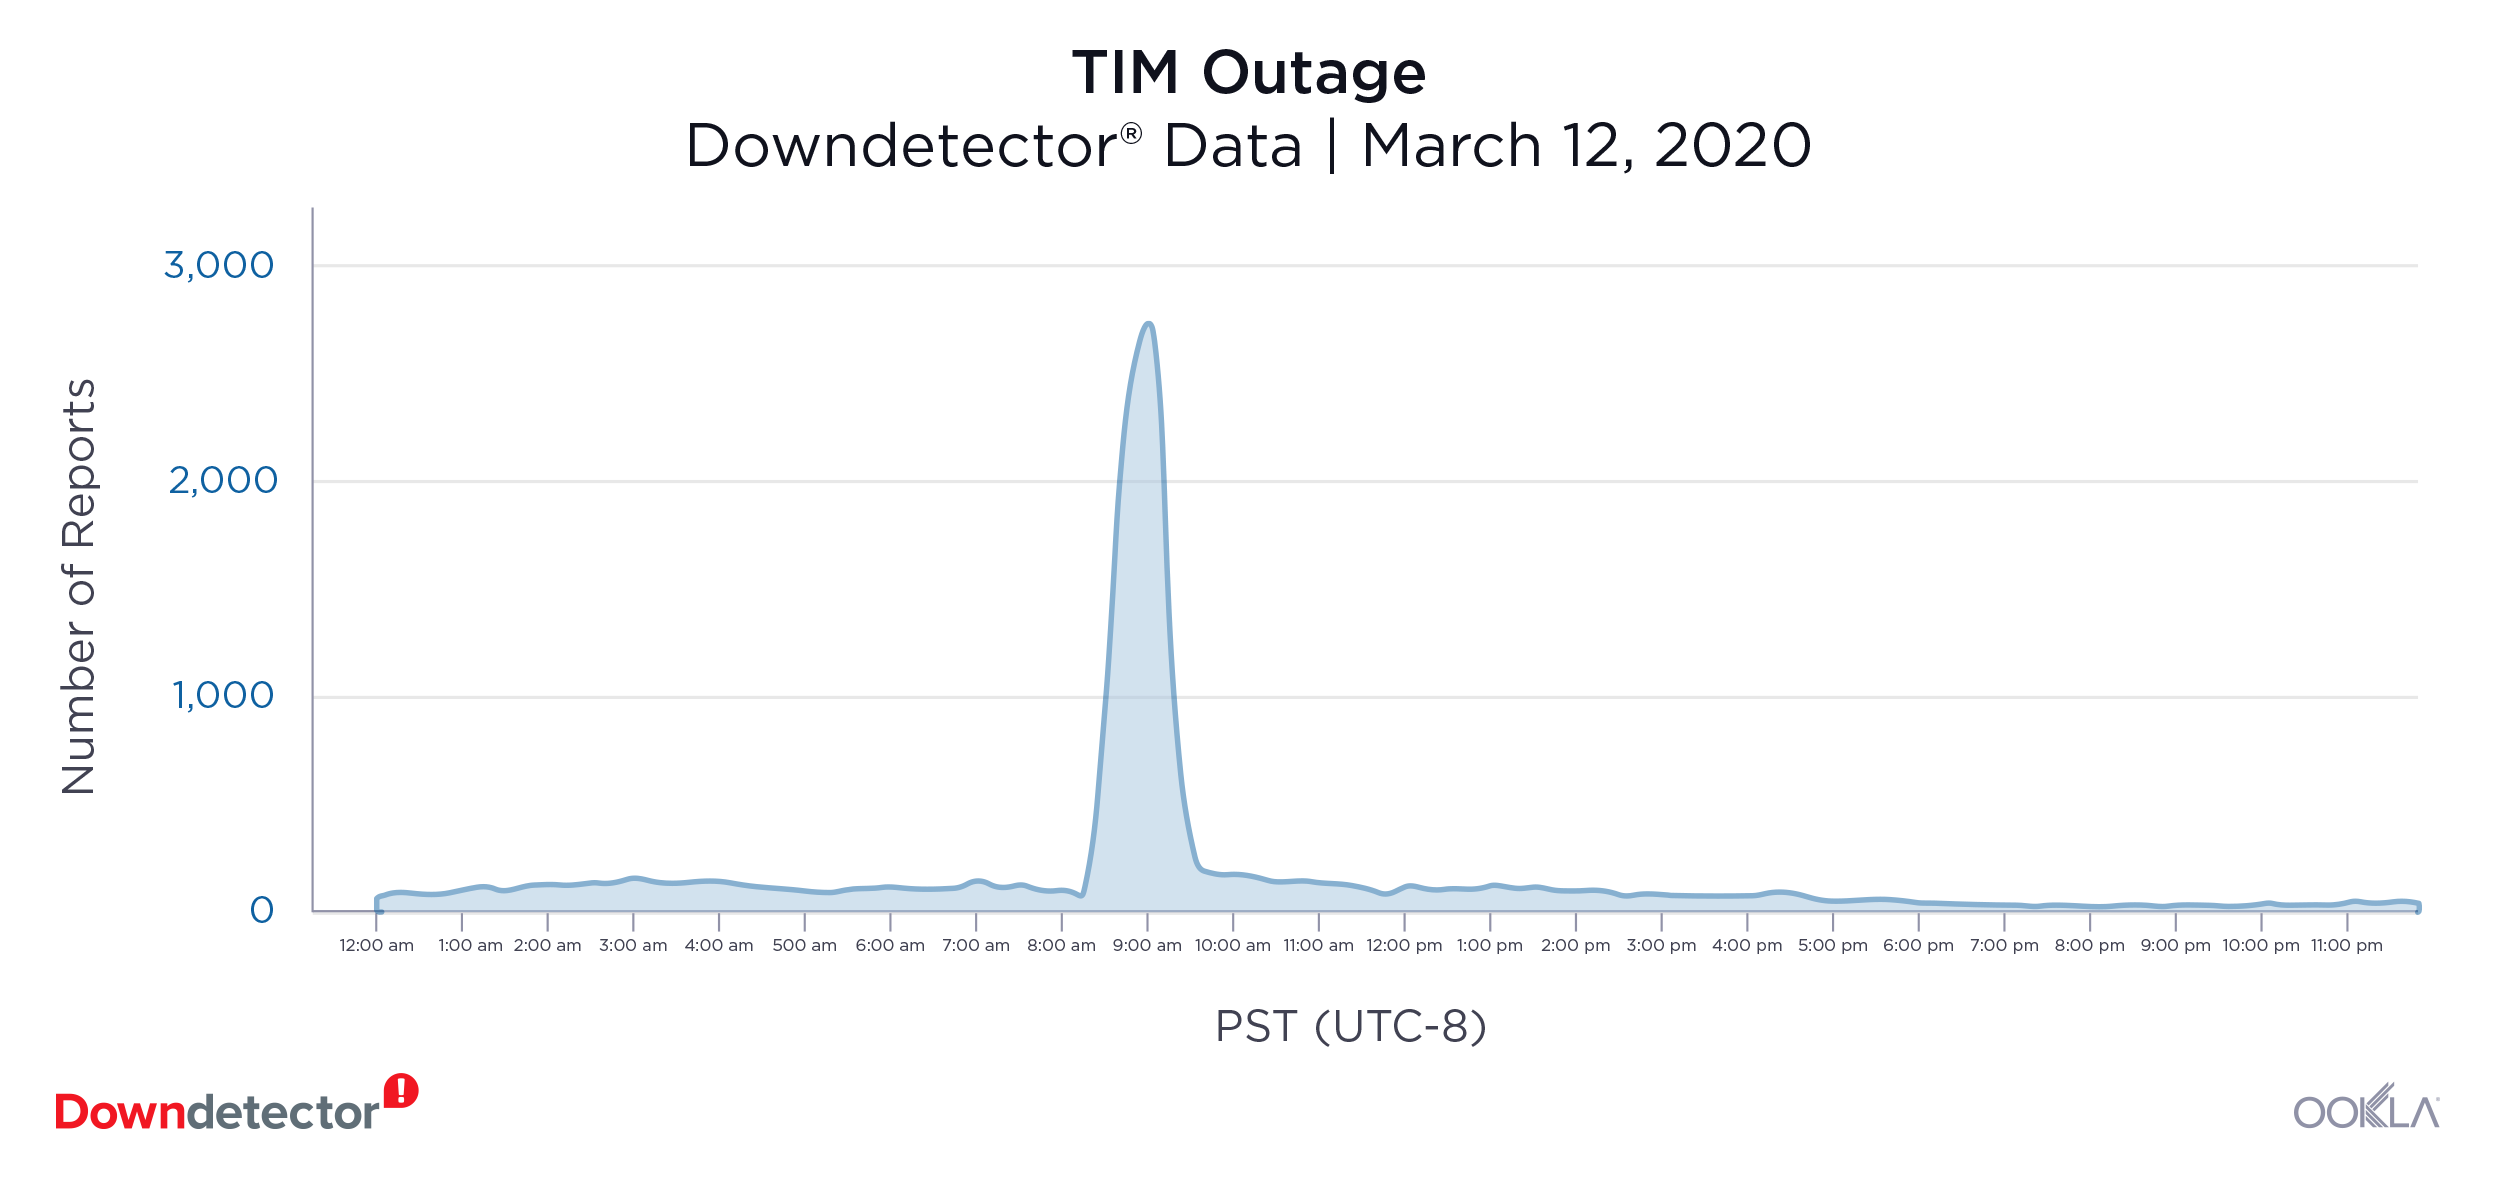
TIM Italy (March 12): 2,667 reports at peak

6-TIM
Users throughout Italy flooded Downdetector with reports of problems with their mobile internet connections on March 12. The outage lasted close to an hour and showed 2,667 reports at the peak of the outage. TIM had a smaller outage the day before with 1,337 reports at the peak of the outage.

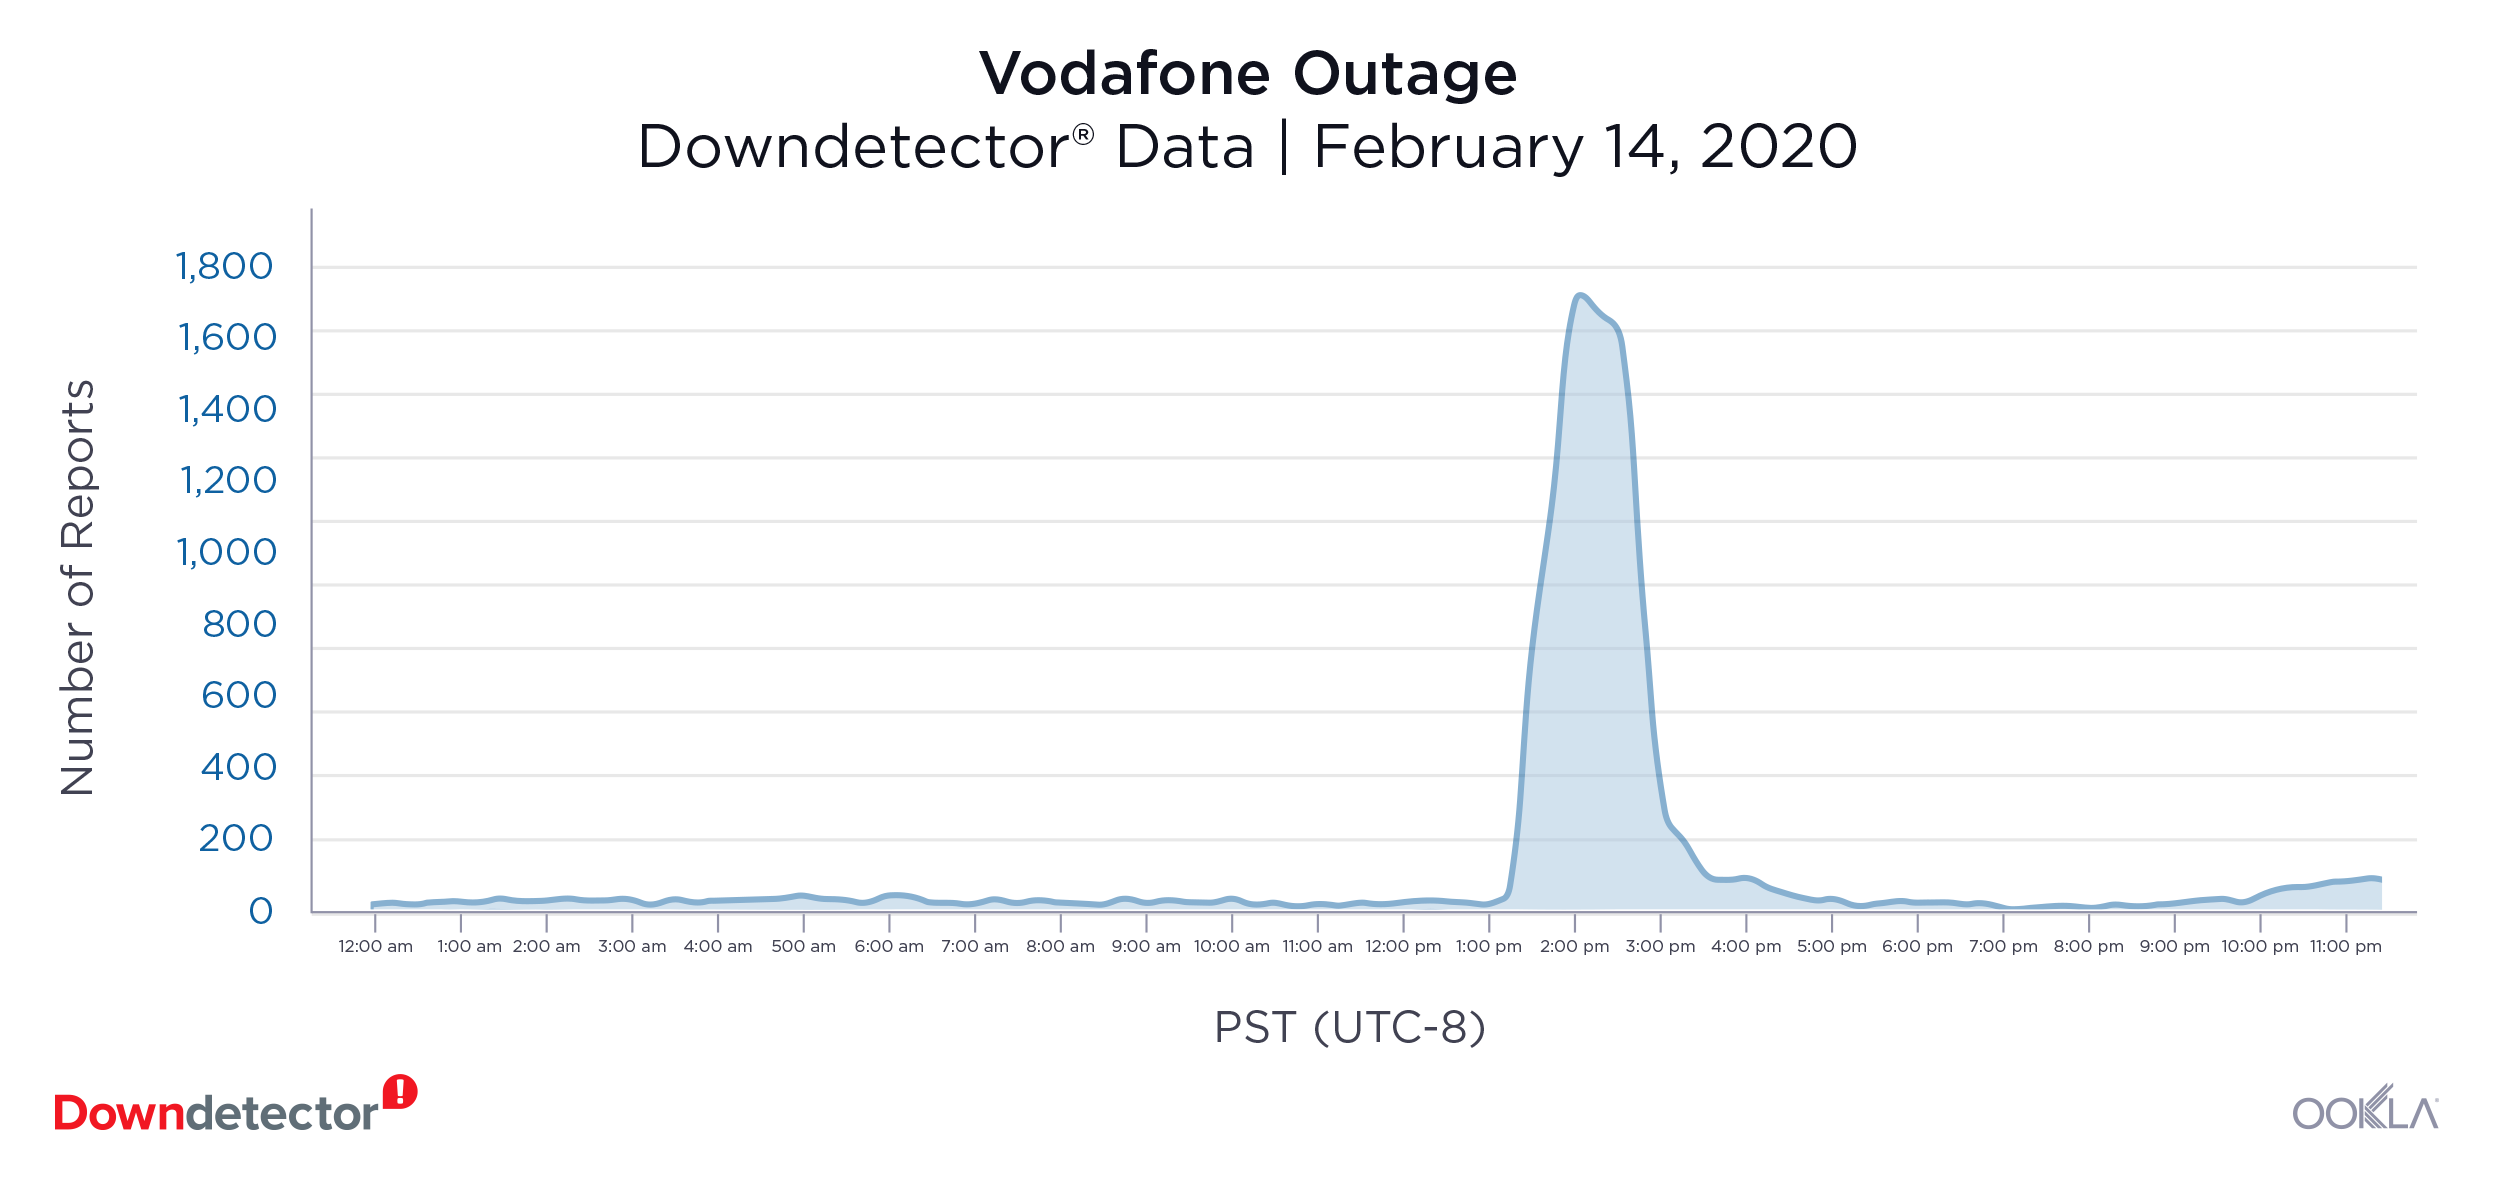
Vodafone Italy (February 14th): 1,733 reports at peak

7-Vodafone
Vodafone users in Italy reported having problems with their mobile service on February 14. The outage lasted four hours and peaked at 1,733 reports. Users also reported problems with their mobile internet connection.

United States

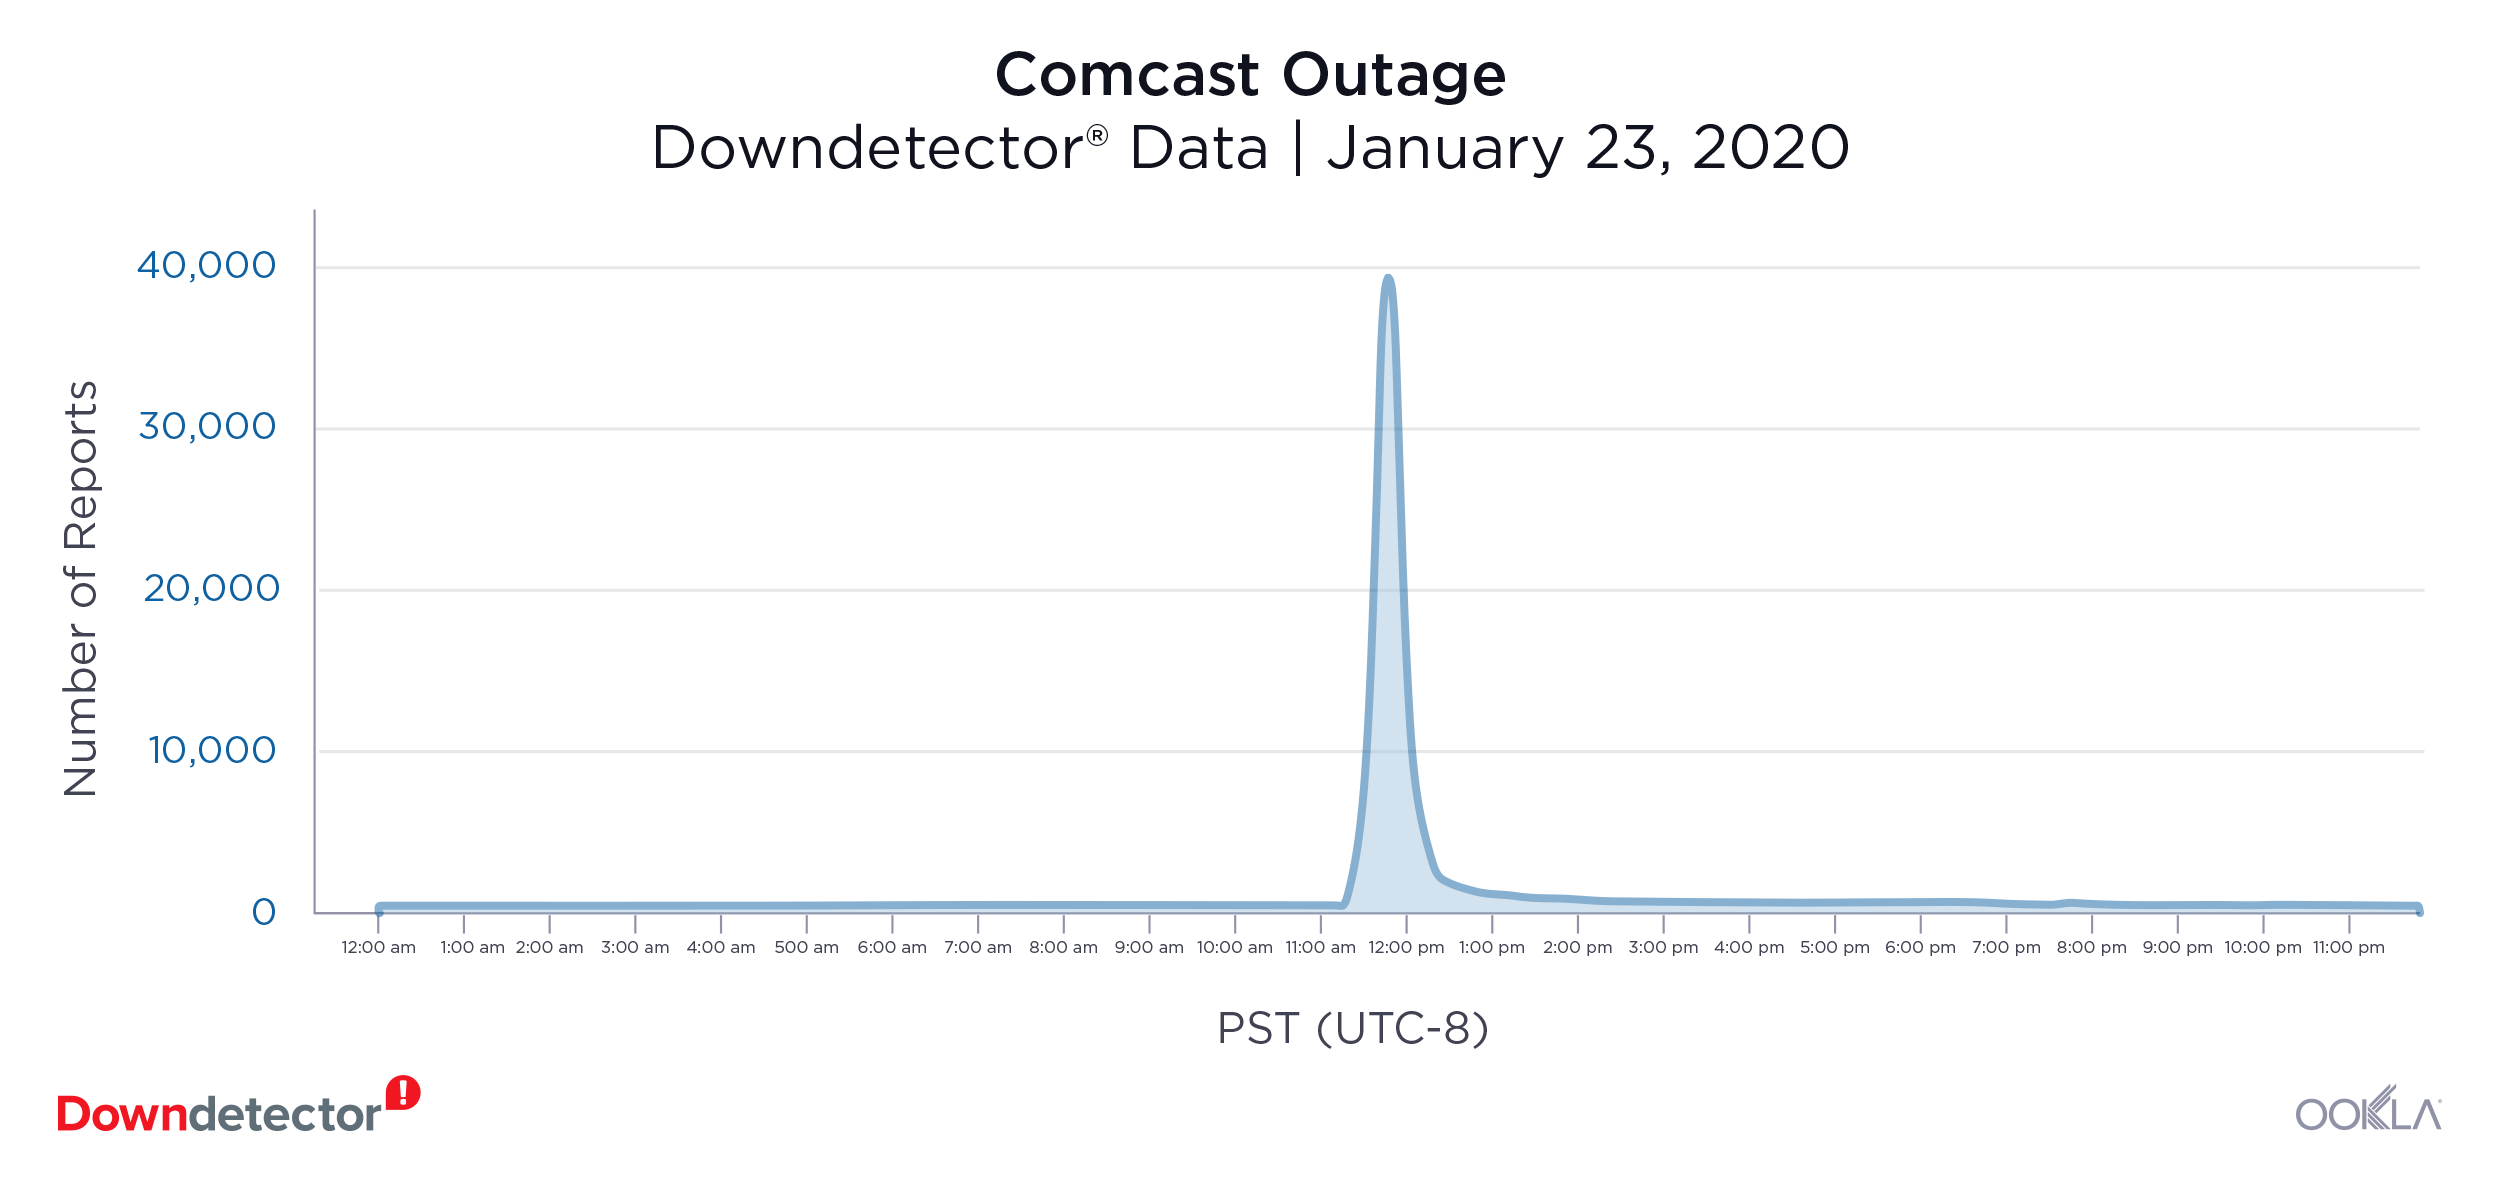
Comcast (January 23): 39,638 reports at peak

8-Comcast
The U.S. internet service provider experienced a major outage on January 23. The outage lasted for two hours with 39,638 reports at the peak of the outage. Weeks later, the service experienced a smaller outage on March 3 with 1,124 reports during the peak.

United Kingdom

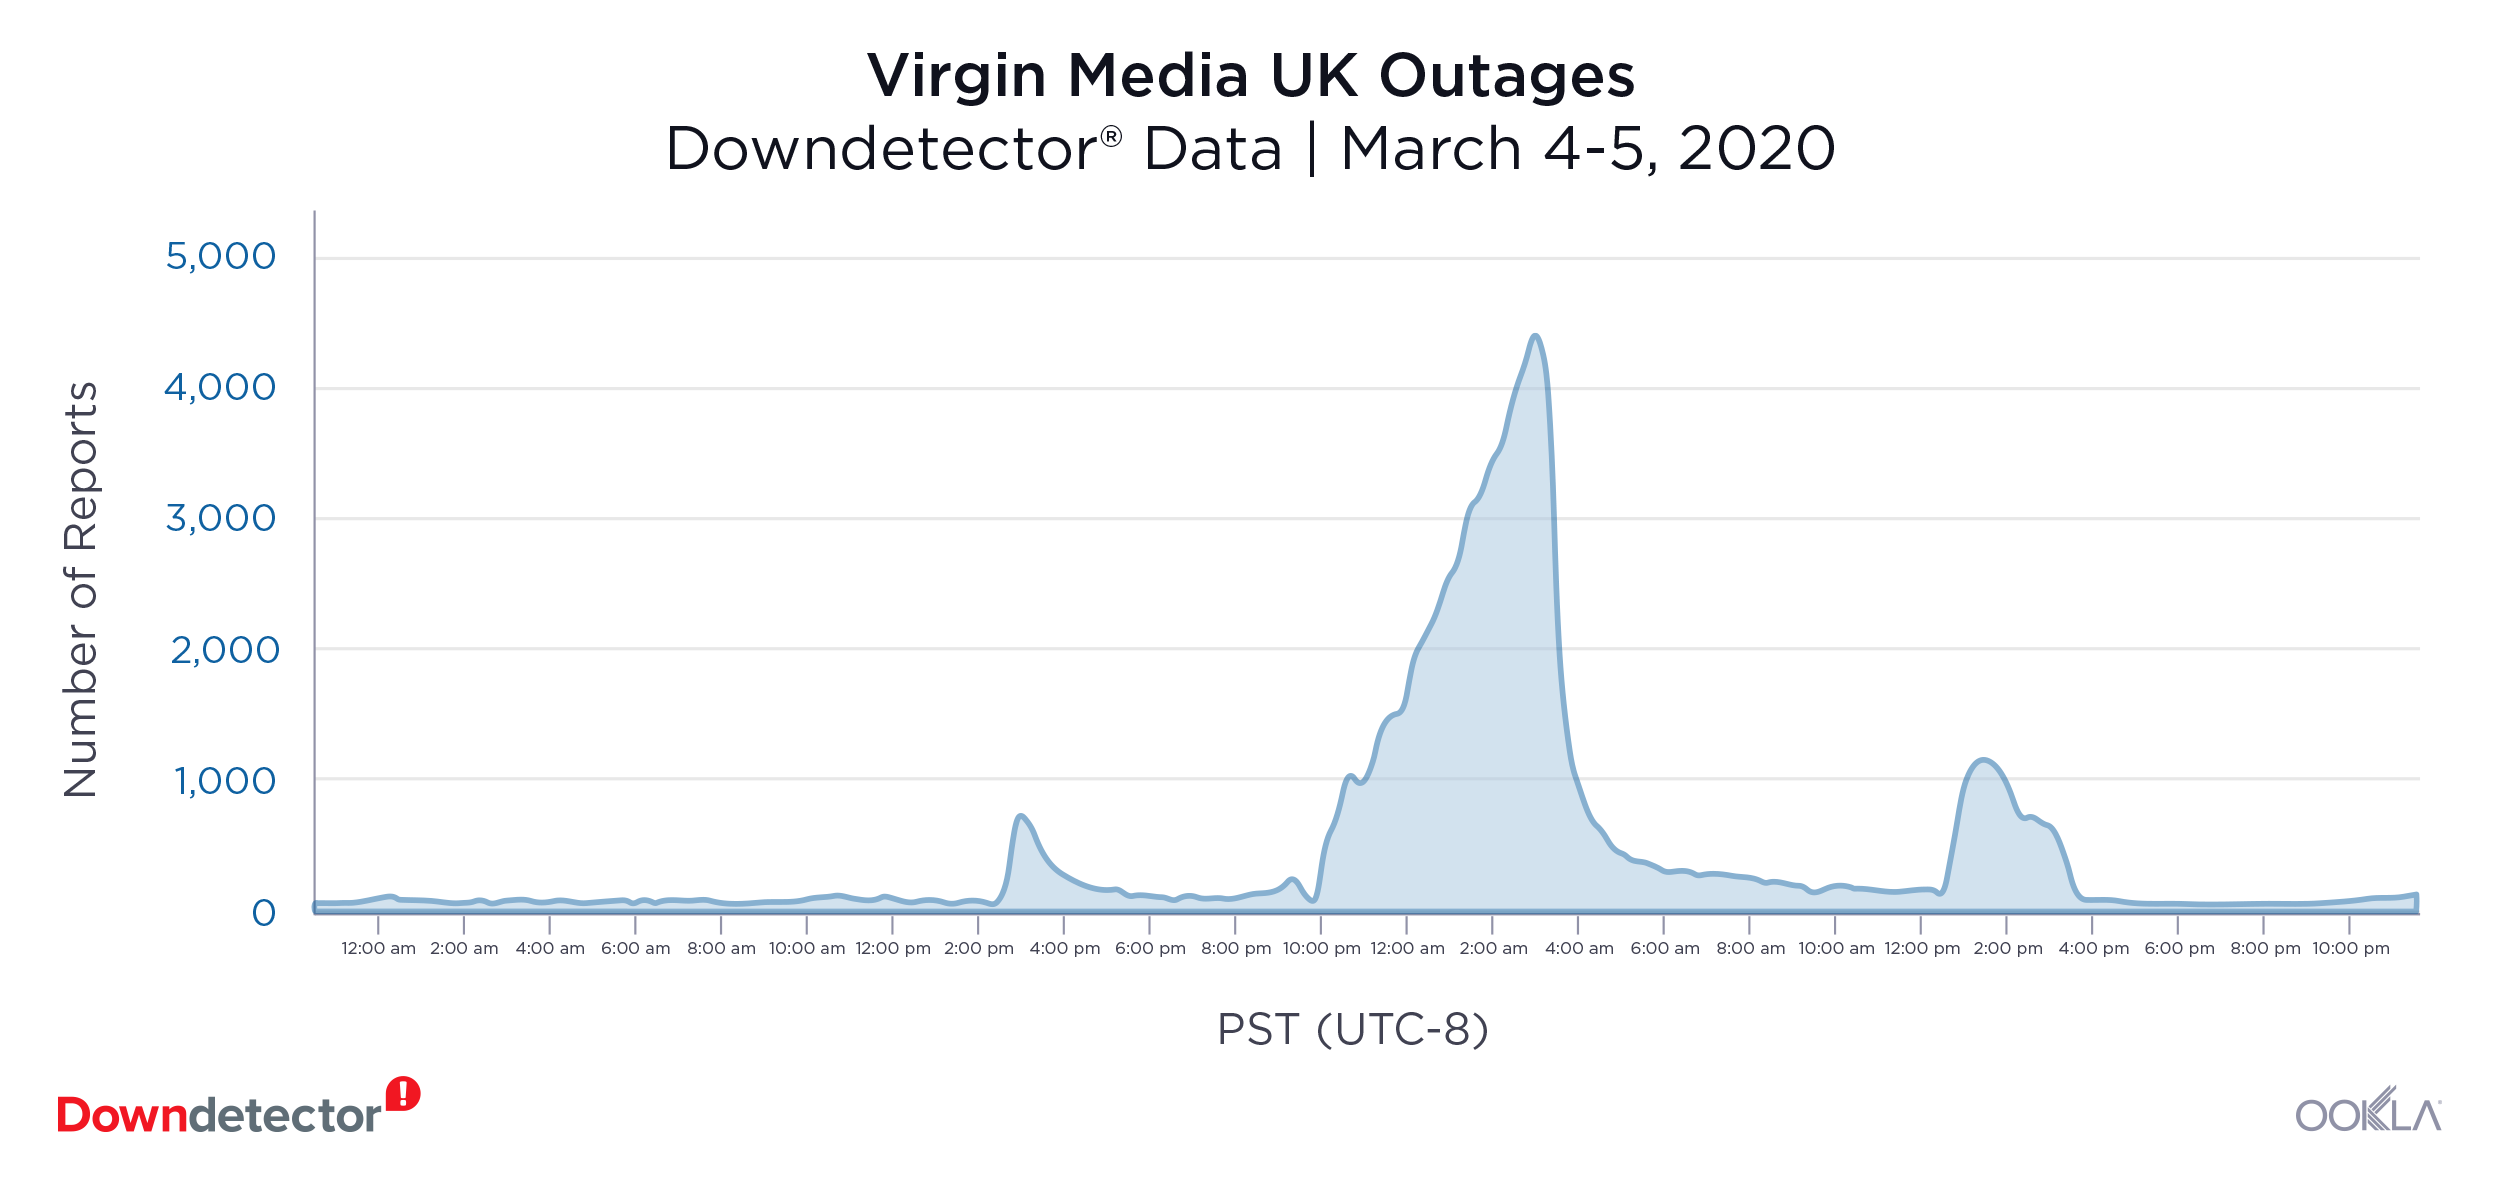
Virgin Media (March 4-5): 4,348 reports at peak

9-Virgin-UK
Users in the U.K. reported their internet service was not working during Virgin Media’s outage starting on March 4 and continuing through March 5. The outage peaked on March 5 when 4,348 users reported issues.

Social Media

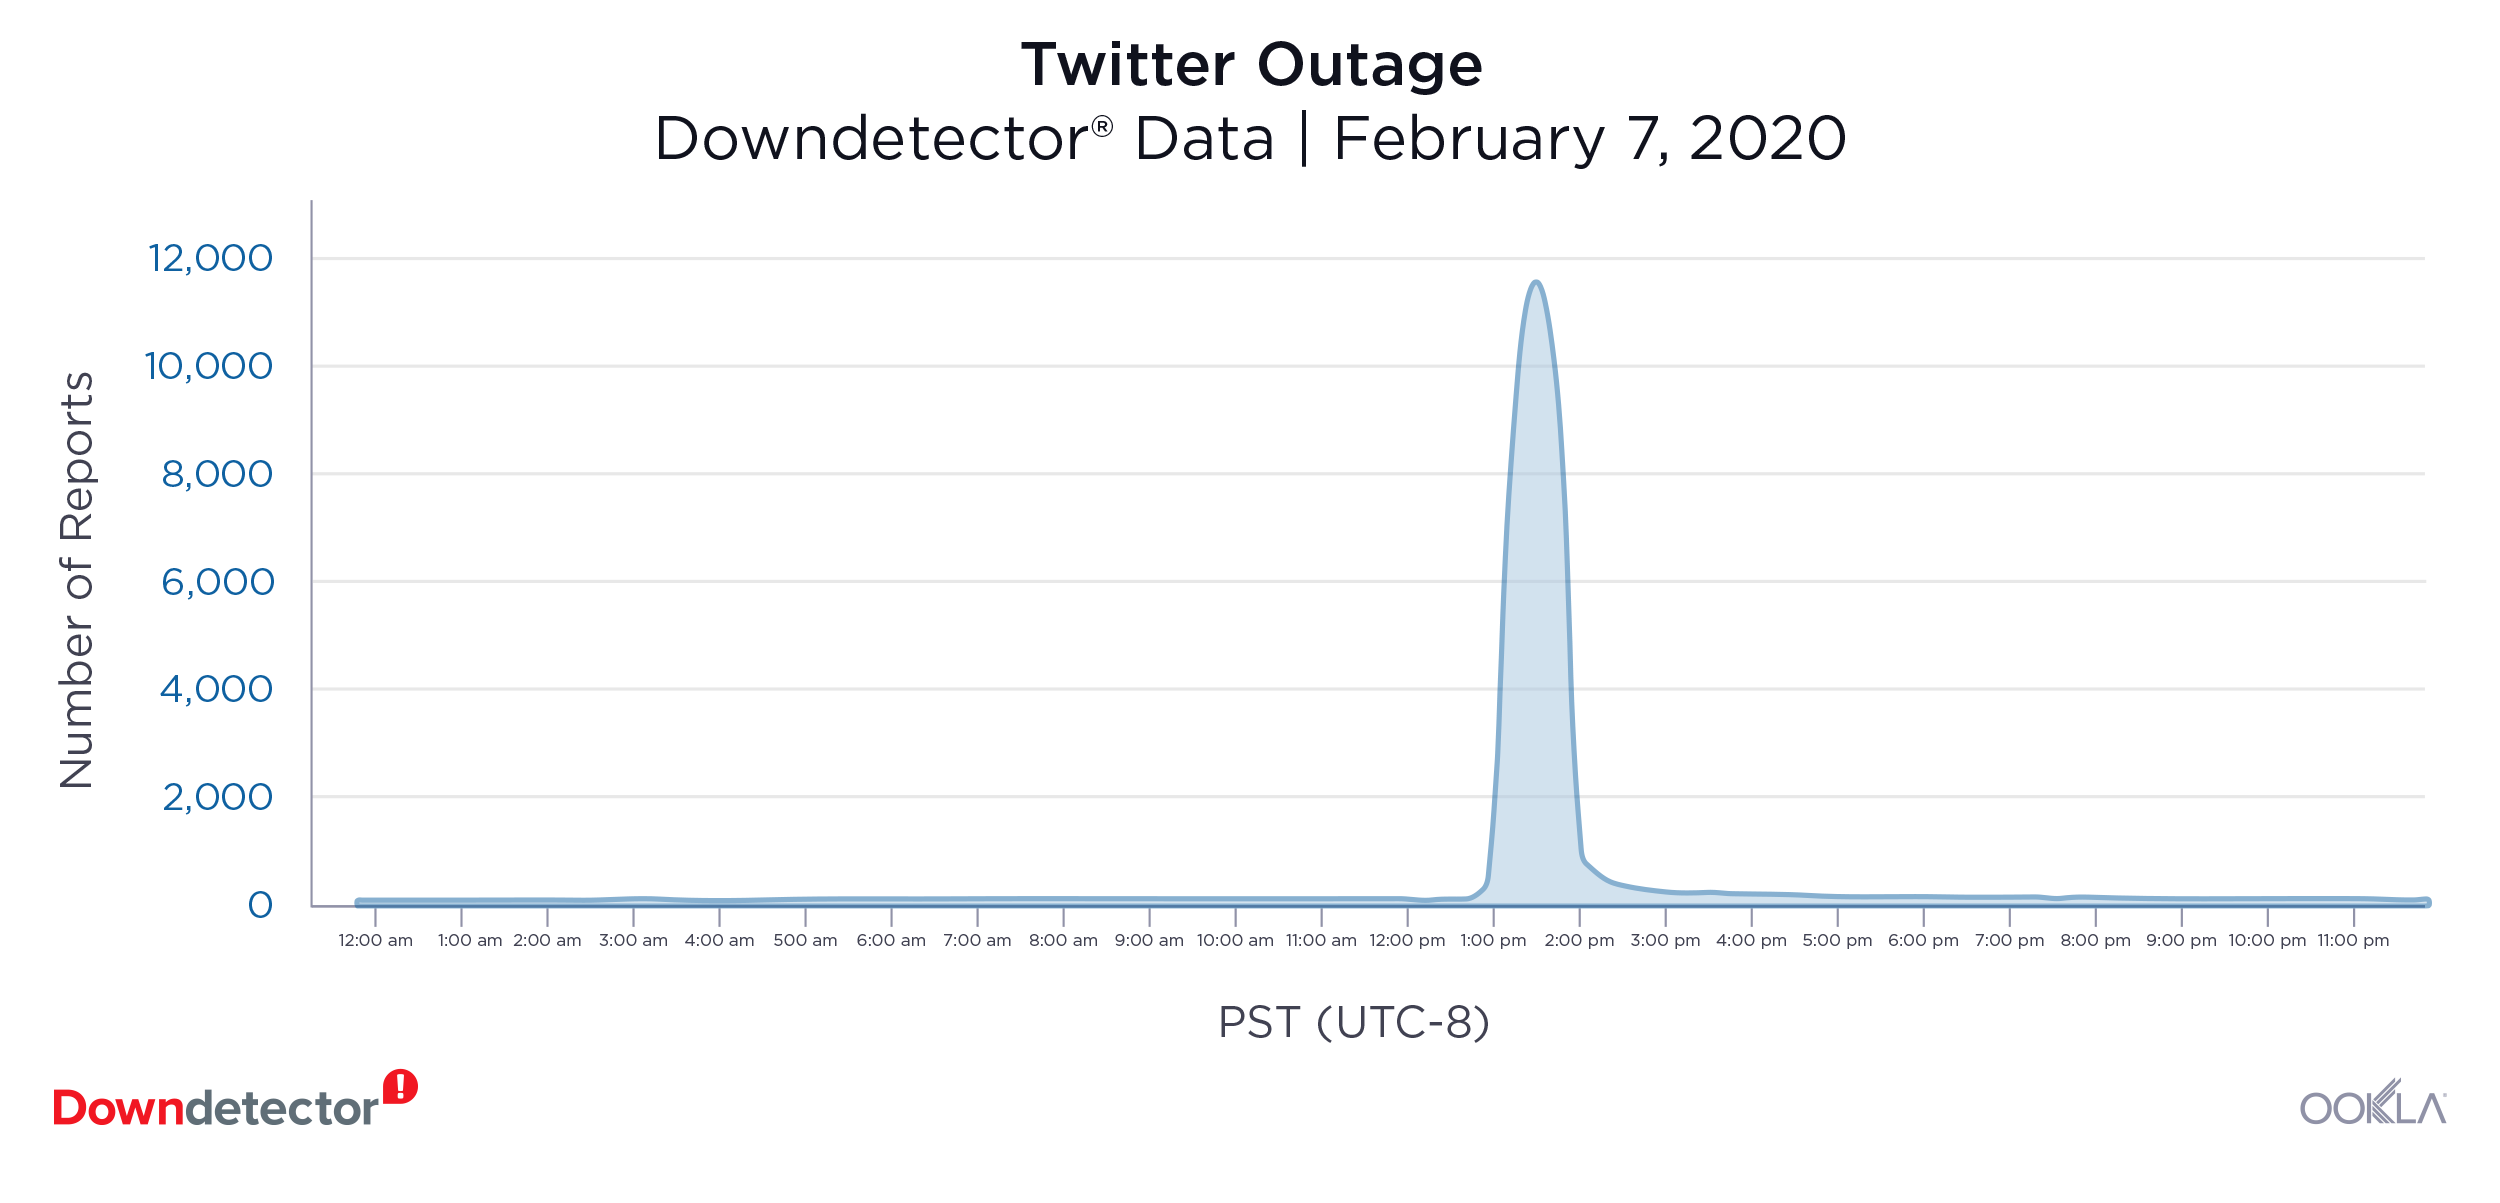
Twitter (February 7): 11,542 reports at peak

10-Twitter-1
The largest social media outage in Q1 2020 belonged to Twitter. On February 7, users in the Twitterverse were unable to tweet, retweet or like tweets for about two hours. Over 11,500 U.S. users reported problems during the peak of the outage. Users in Germany, Japan and the U.K. also reported problems with the platform.

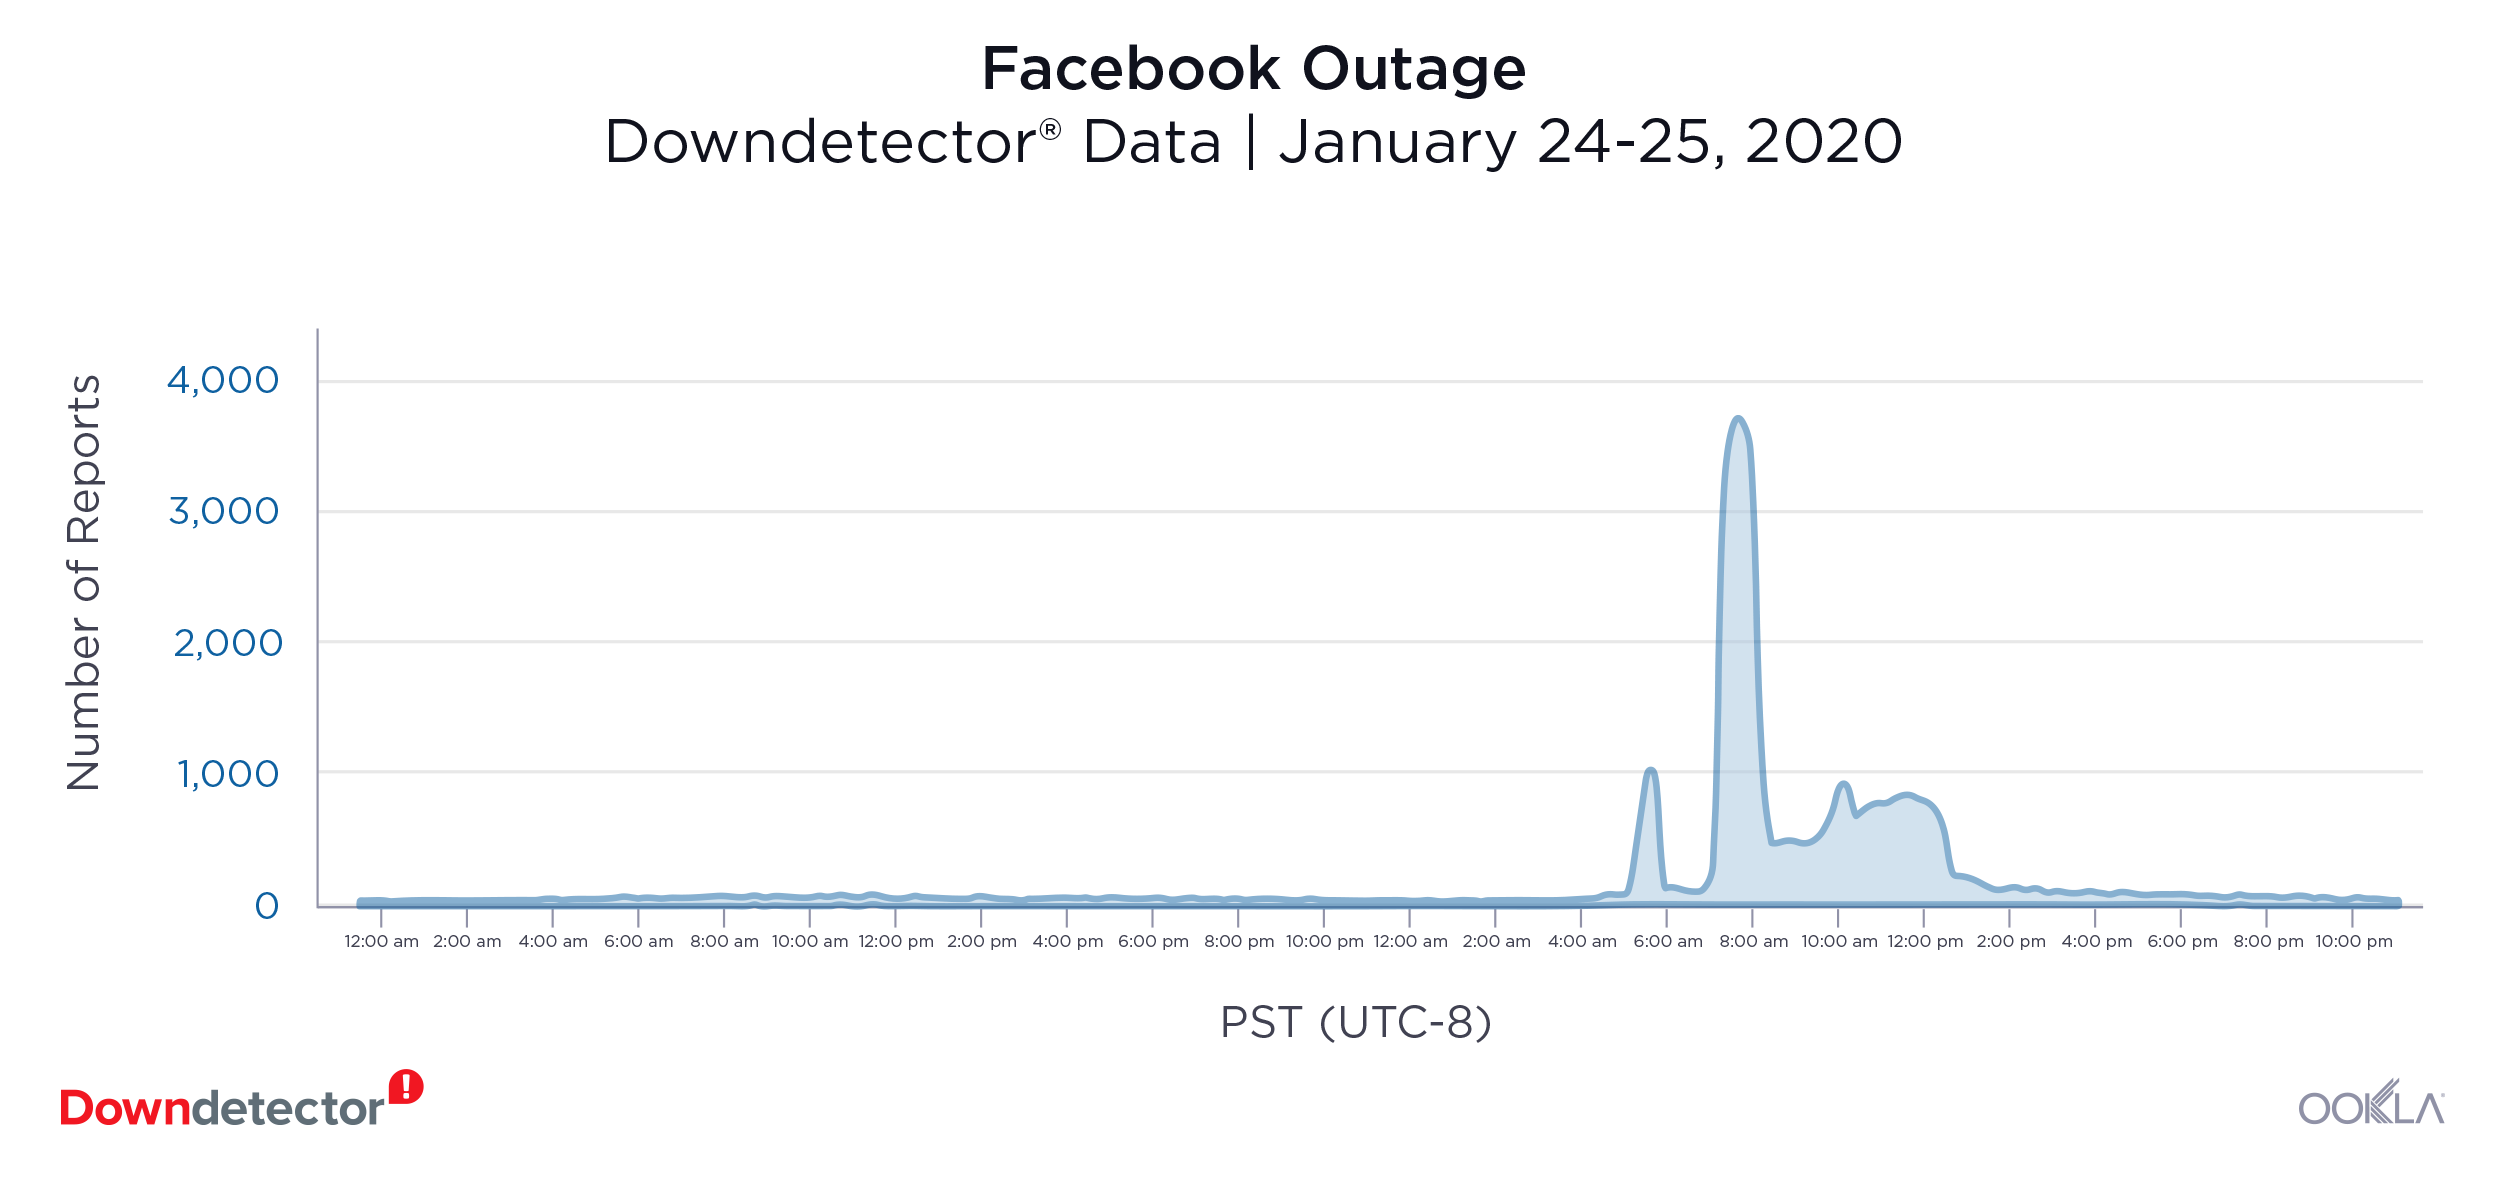
Facebook (January 24-25): 3,718 reports at peak

11-Facebook
Facebook users reported problems with the site on Downdetector starting on January 24. Most users reported problems with their newsfeed or the inability to log in to the social media platform. At the peak of the outage, there were 3,718 reports from users in the U.S. Users in Germany and the U.K. also reported problems that day. Users were still experiencing issues through January 25.

Streaming Services

Streaming-bar-outages

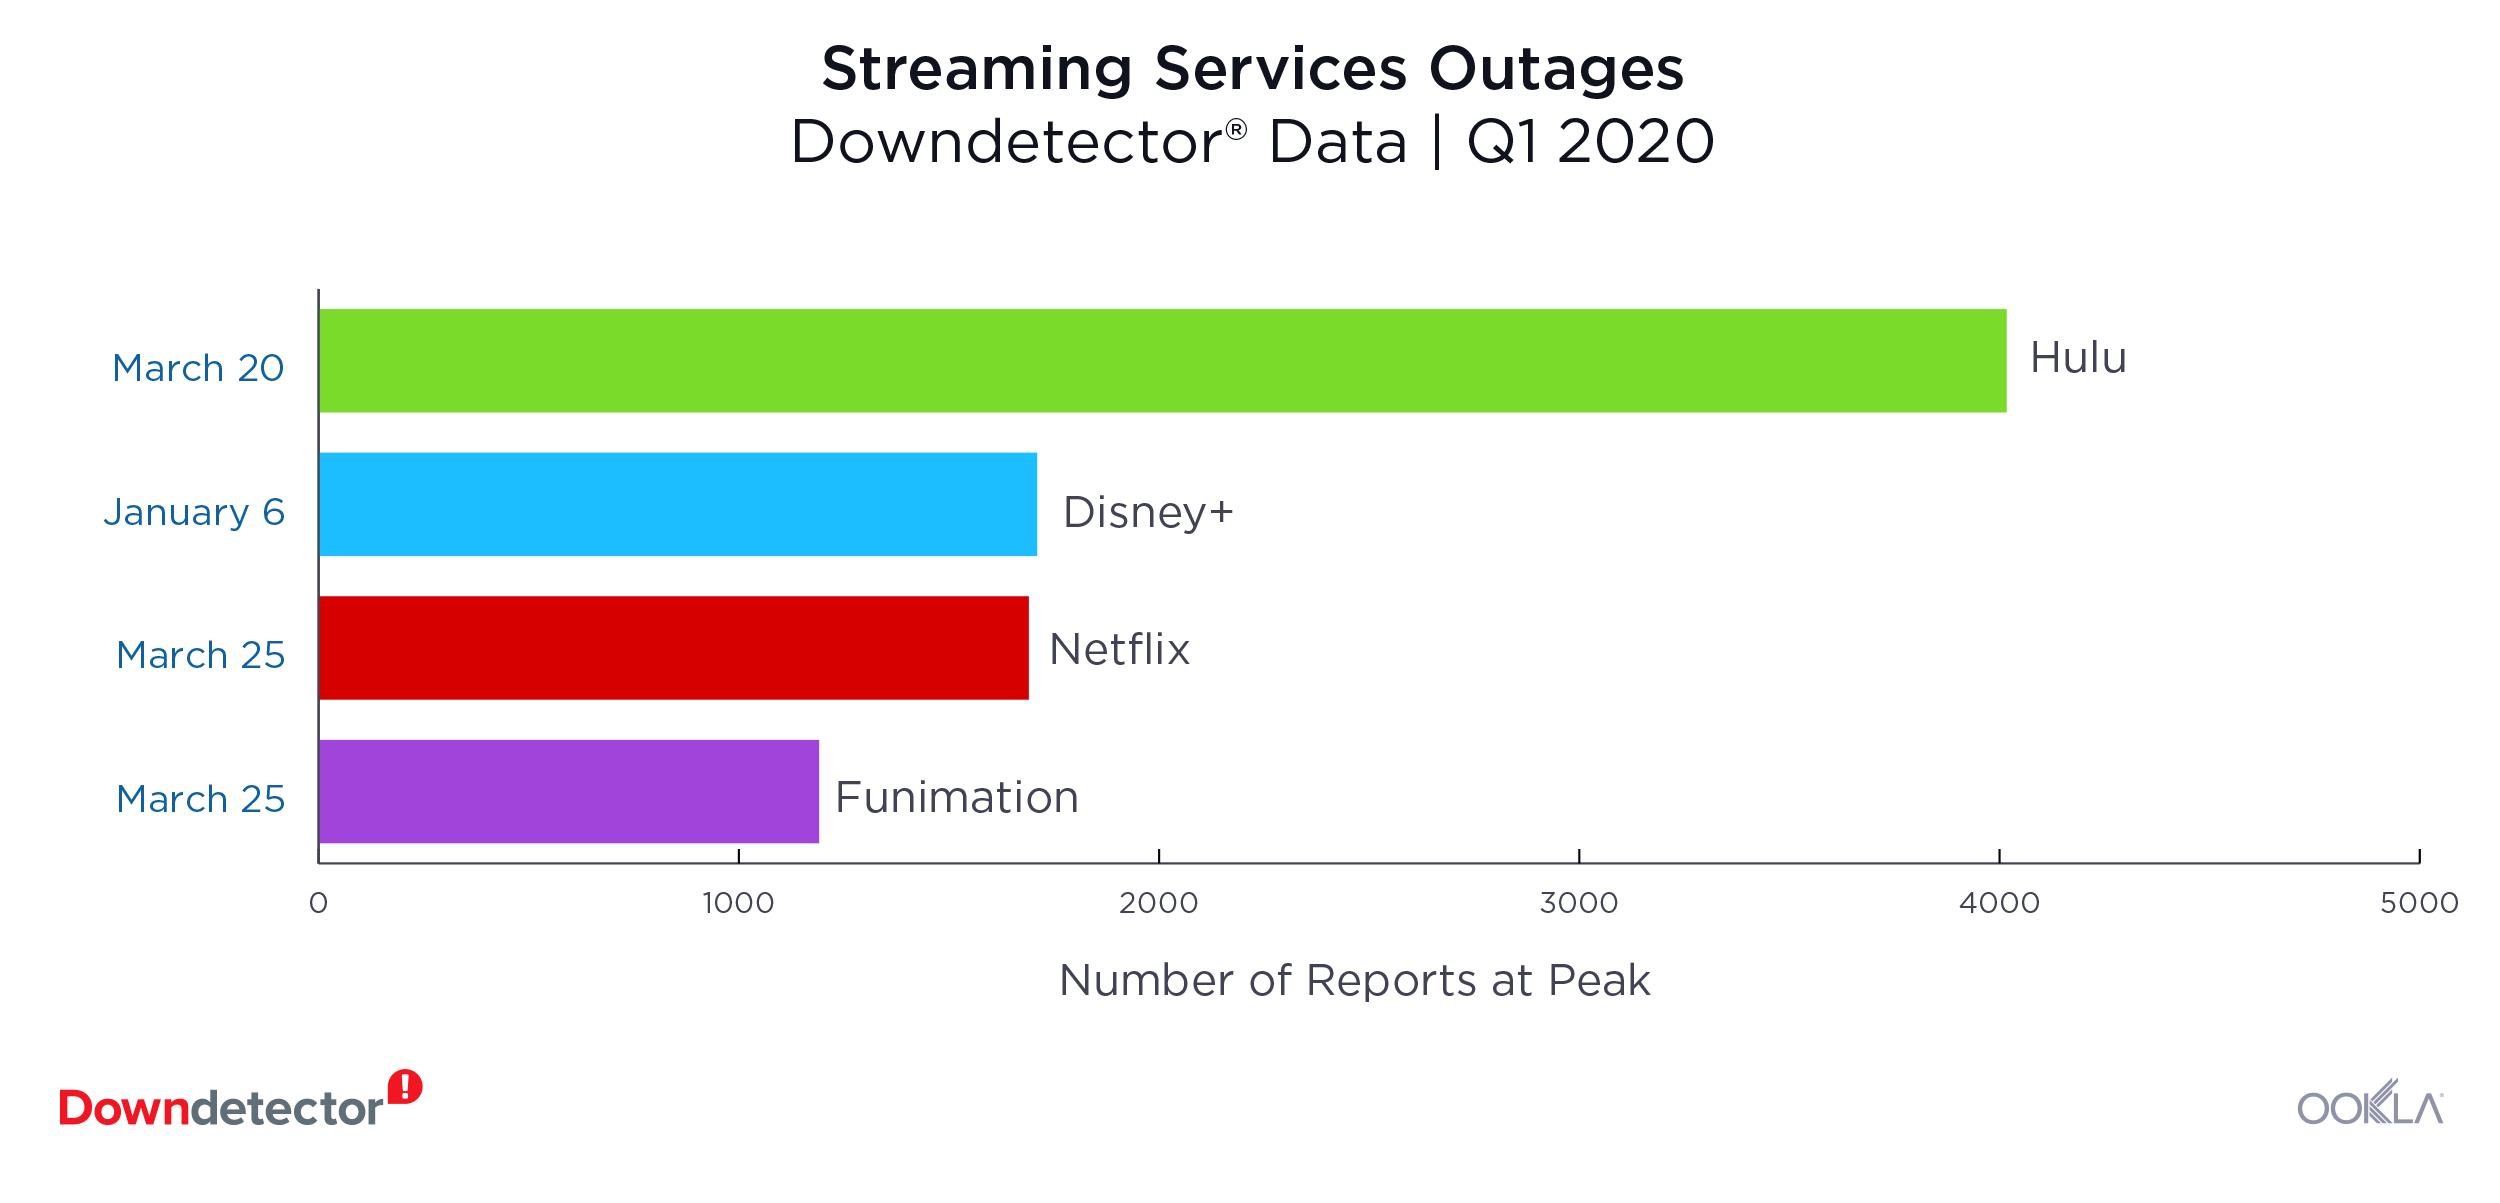
Hulu (March 20): 4,017 reports at peak

People hoping to binge-watch their favorite shows while in quarantine were disappointed to find Hulu was down on March 20. Users complaints on Downdetector included not being able to log in or of the player not working properly. The outage lasted approximately two hours.

Disney+ (January 6): 1,710 reports at peak

Disney + experienced an outage at the beginning of Q1 2020 that reached 1,710 reports at the peak. For an hour, users in the U.S. reported they were unable to log in to the platform.

Netflix (March 25): 1,690 reports at peak

For two hours on March 25, thousands of Netflix users were unable to stream their favorite shows. At the peak of Nexflix’s biggest outage in Q1 2020, 1,690 users reported problems in the U.S.

Funimation (March 25): 1,191 reports at peak

Anime lovers in the US reported problems with Funimation towards the end of Q1 2020. Most users complained of not being able to log in to the service for about an hour that day. There were 1,191 reports at the peak of the outage.

Financial Services

Robinhood (multiple outages)

robinhood-barchart

Robinhood had multiple fumbles during Q1 2020, leaving users frustrated with the financial service. The most significant outage took place on March 2 with 14,429 reports at the peak of the outage. Robin Hood experienced additional outages on March 3 and March 9 with 3,538 and 3,119 reports during the respective peaks.

Is an outage disrupting your day? You’re not alone. Find out if there’s an outage and bond with other frustrated users on Downdetector and read about other significant outages here.

Editor’s note: This article was updated on April 14 to clarify the Steam section and related graphic.

Ookla retains ownership of this article including all of the intellectual property rights, data, content graphs and analysis. This article may not be quoted, reproduced, distributed or published for any commercial purpose without prior consent. Members of the press and others using the findings in this article for non-commercial purposes are welcome to publicly share and link to report information with attribution to Ookla.

| July 14, 2020

The Most Significant Online Service Outages in Q2 2020

“Try again later” was a phrase that frustrated users all over the world during the multiple online service outages in Q2 2020. This article is the third installment in our quarterly series tracking the most significant web and online service outages. Analyzing Downdetector® data from Q2 2020, we focused on user-reported service disruptions in five categories: social media, communications service providers, collaboration platforms, gaming and financial institutions.

Social media

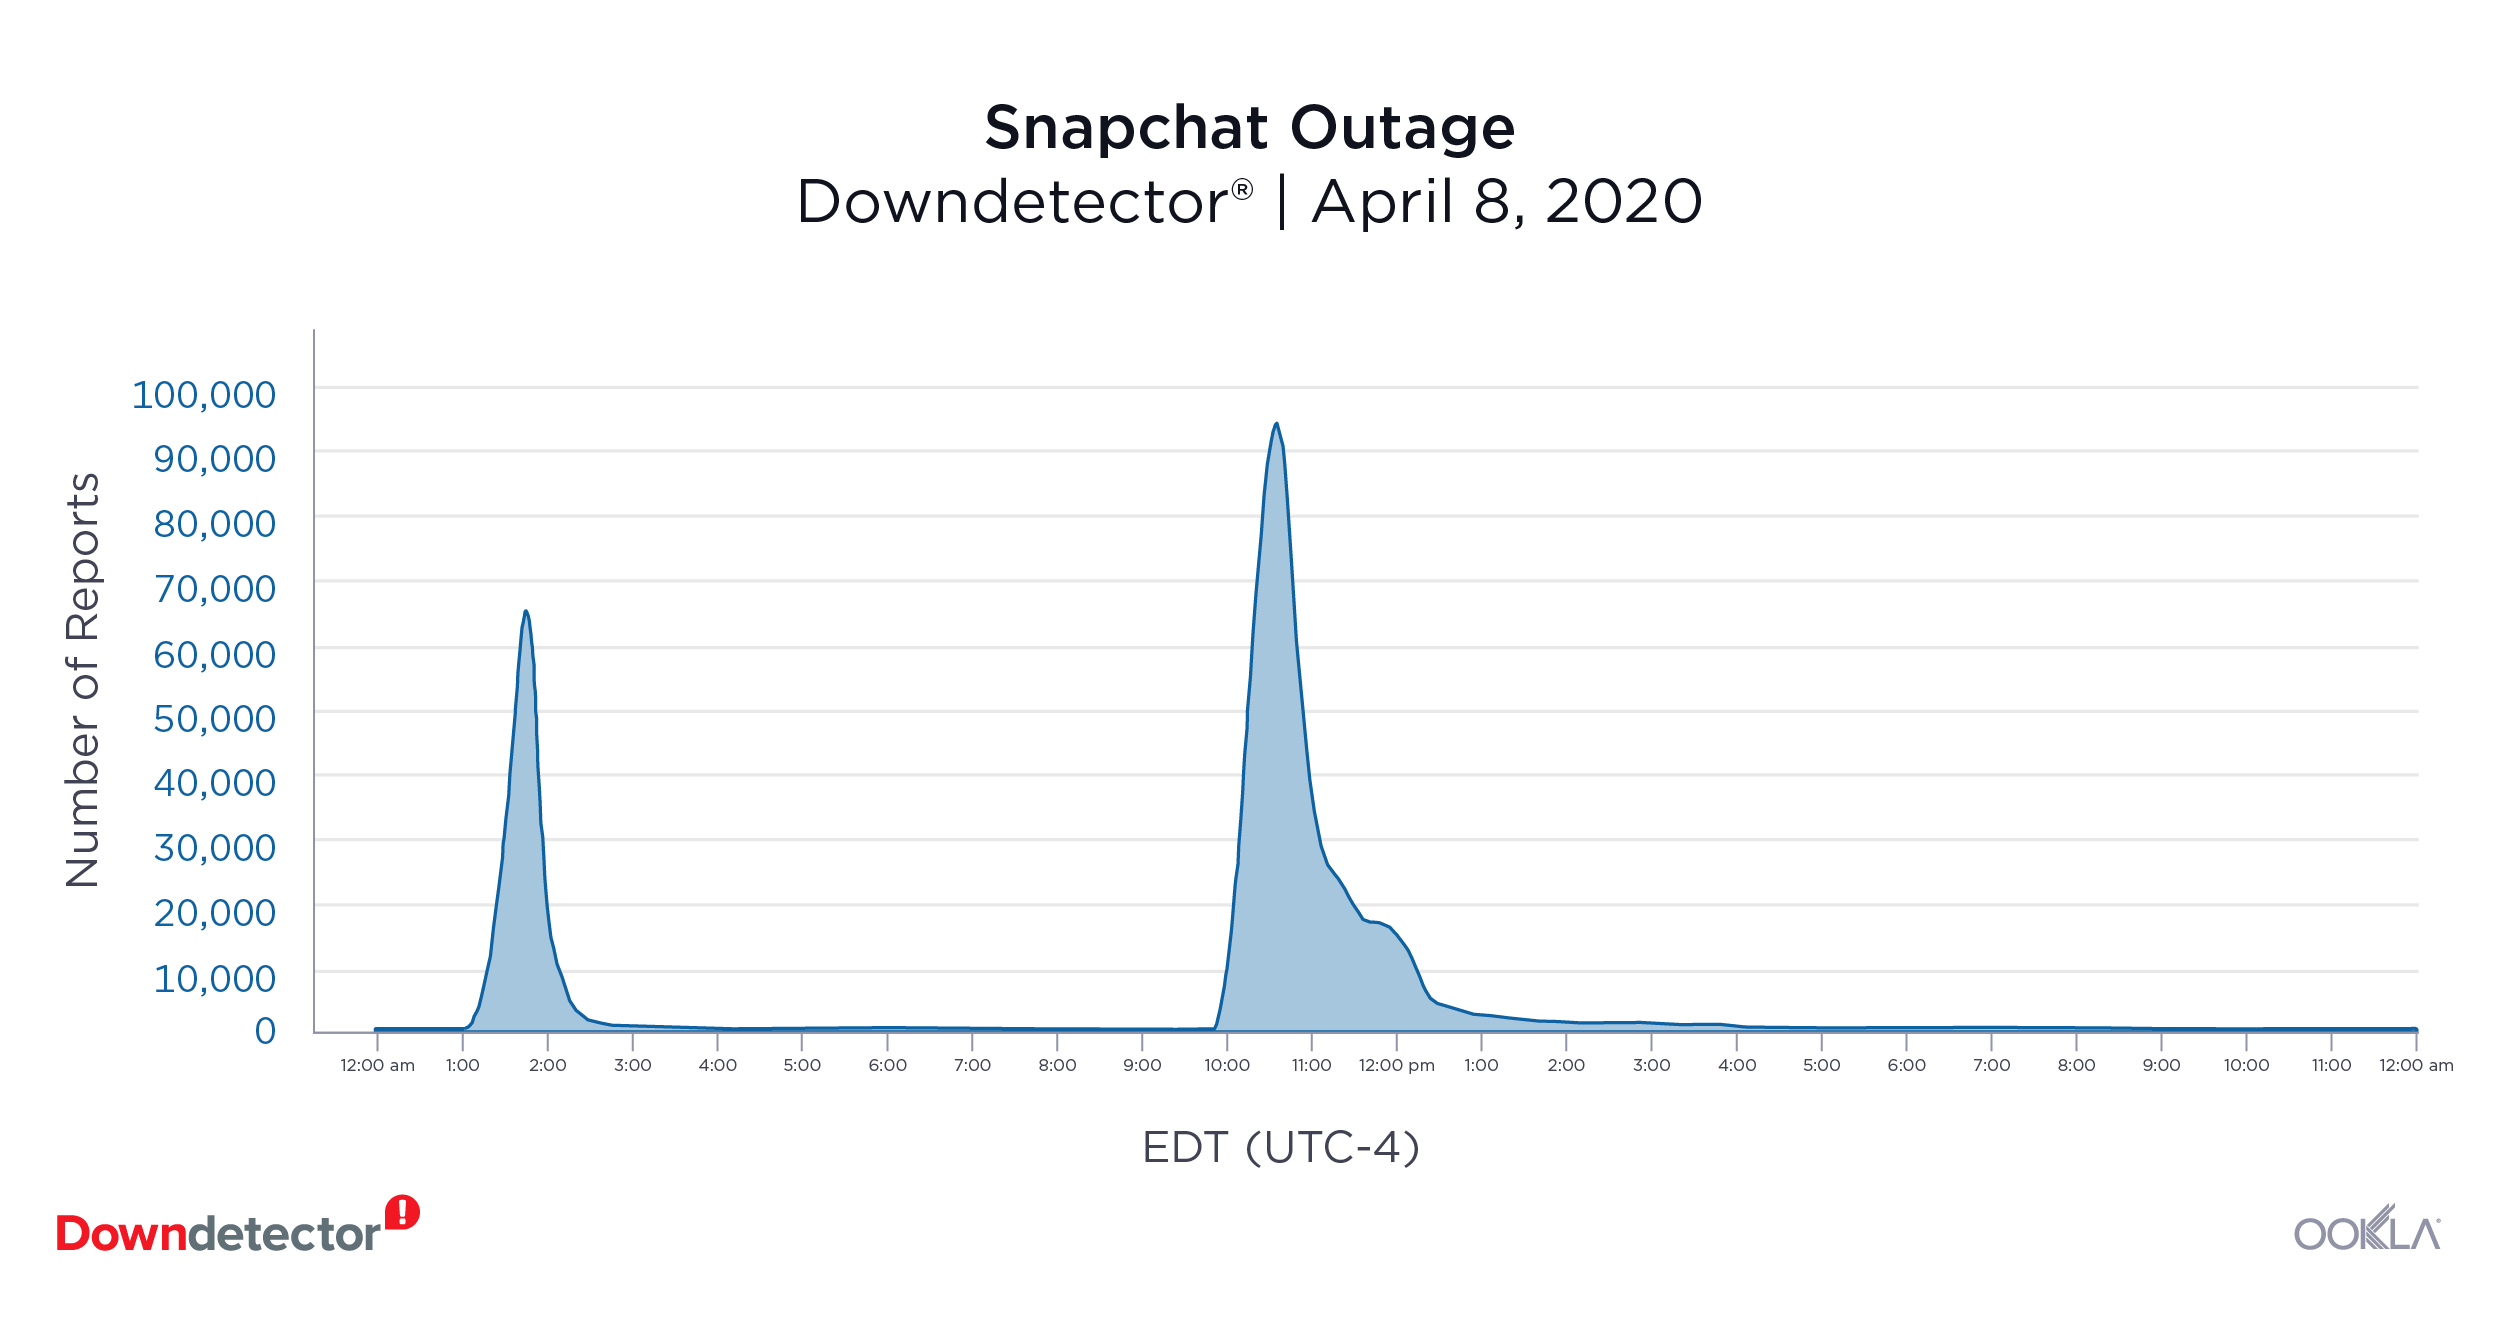
Downdetector_Snapchat_Outage_0720-1

Snapchat (April 8, 2020): 93,671 reports at peak

Snapchat users began to report problems with the mobile app early on April 8. At the peak of outage reports, there were 93,671 reported issues in the U.S in one 15-minute period. User reports rolled in over a total period of approximately two hours. Users in the United Kingdom and the Netherlands also reported problems with Snapchat during the same time period.

TikTok (May 6, 2020): 49,701 reports at peak

Many U.S. and U.K. users of the popular video-based social media platform struggled to log into their accounts on May 6. Over 49,000 users in the U.S. reported problems logging in, viewing and uploading videos to TikTok that evening.

Tinder (June 12, 2020): 6,967 reports at peak

Users of the mobile dating app Tinder rushed to Downdetector when they encountered problems logging in, sending and receiving messages on the morning of June 12. Almost 7,000 users from the U.S. reported problems with the app, and issues were also reported in the U.K. and Germany.

Communications service providers

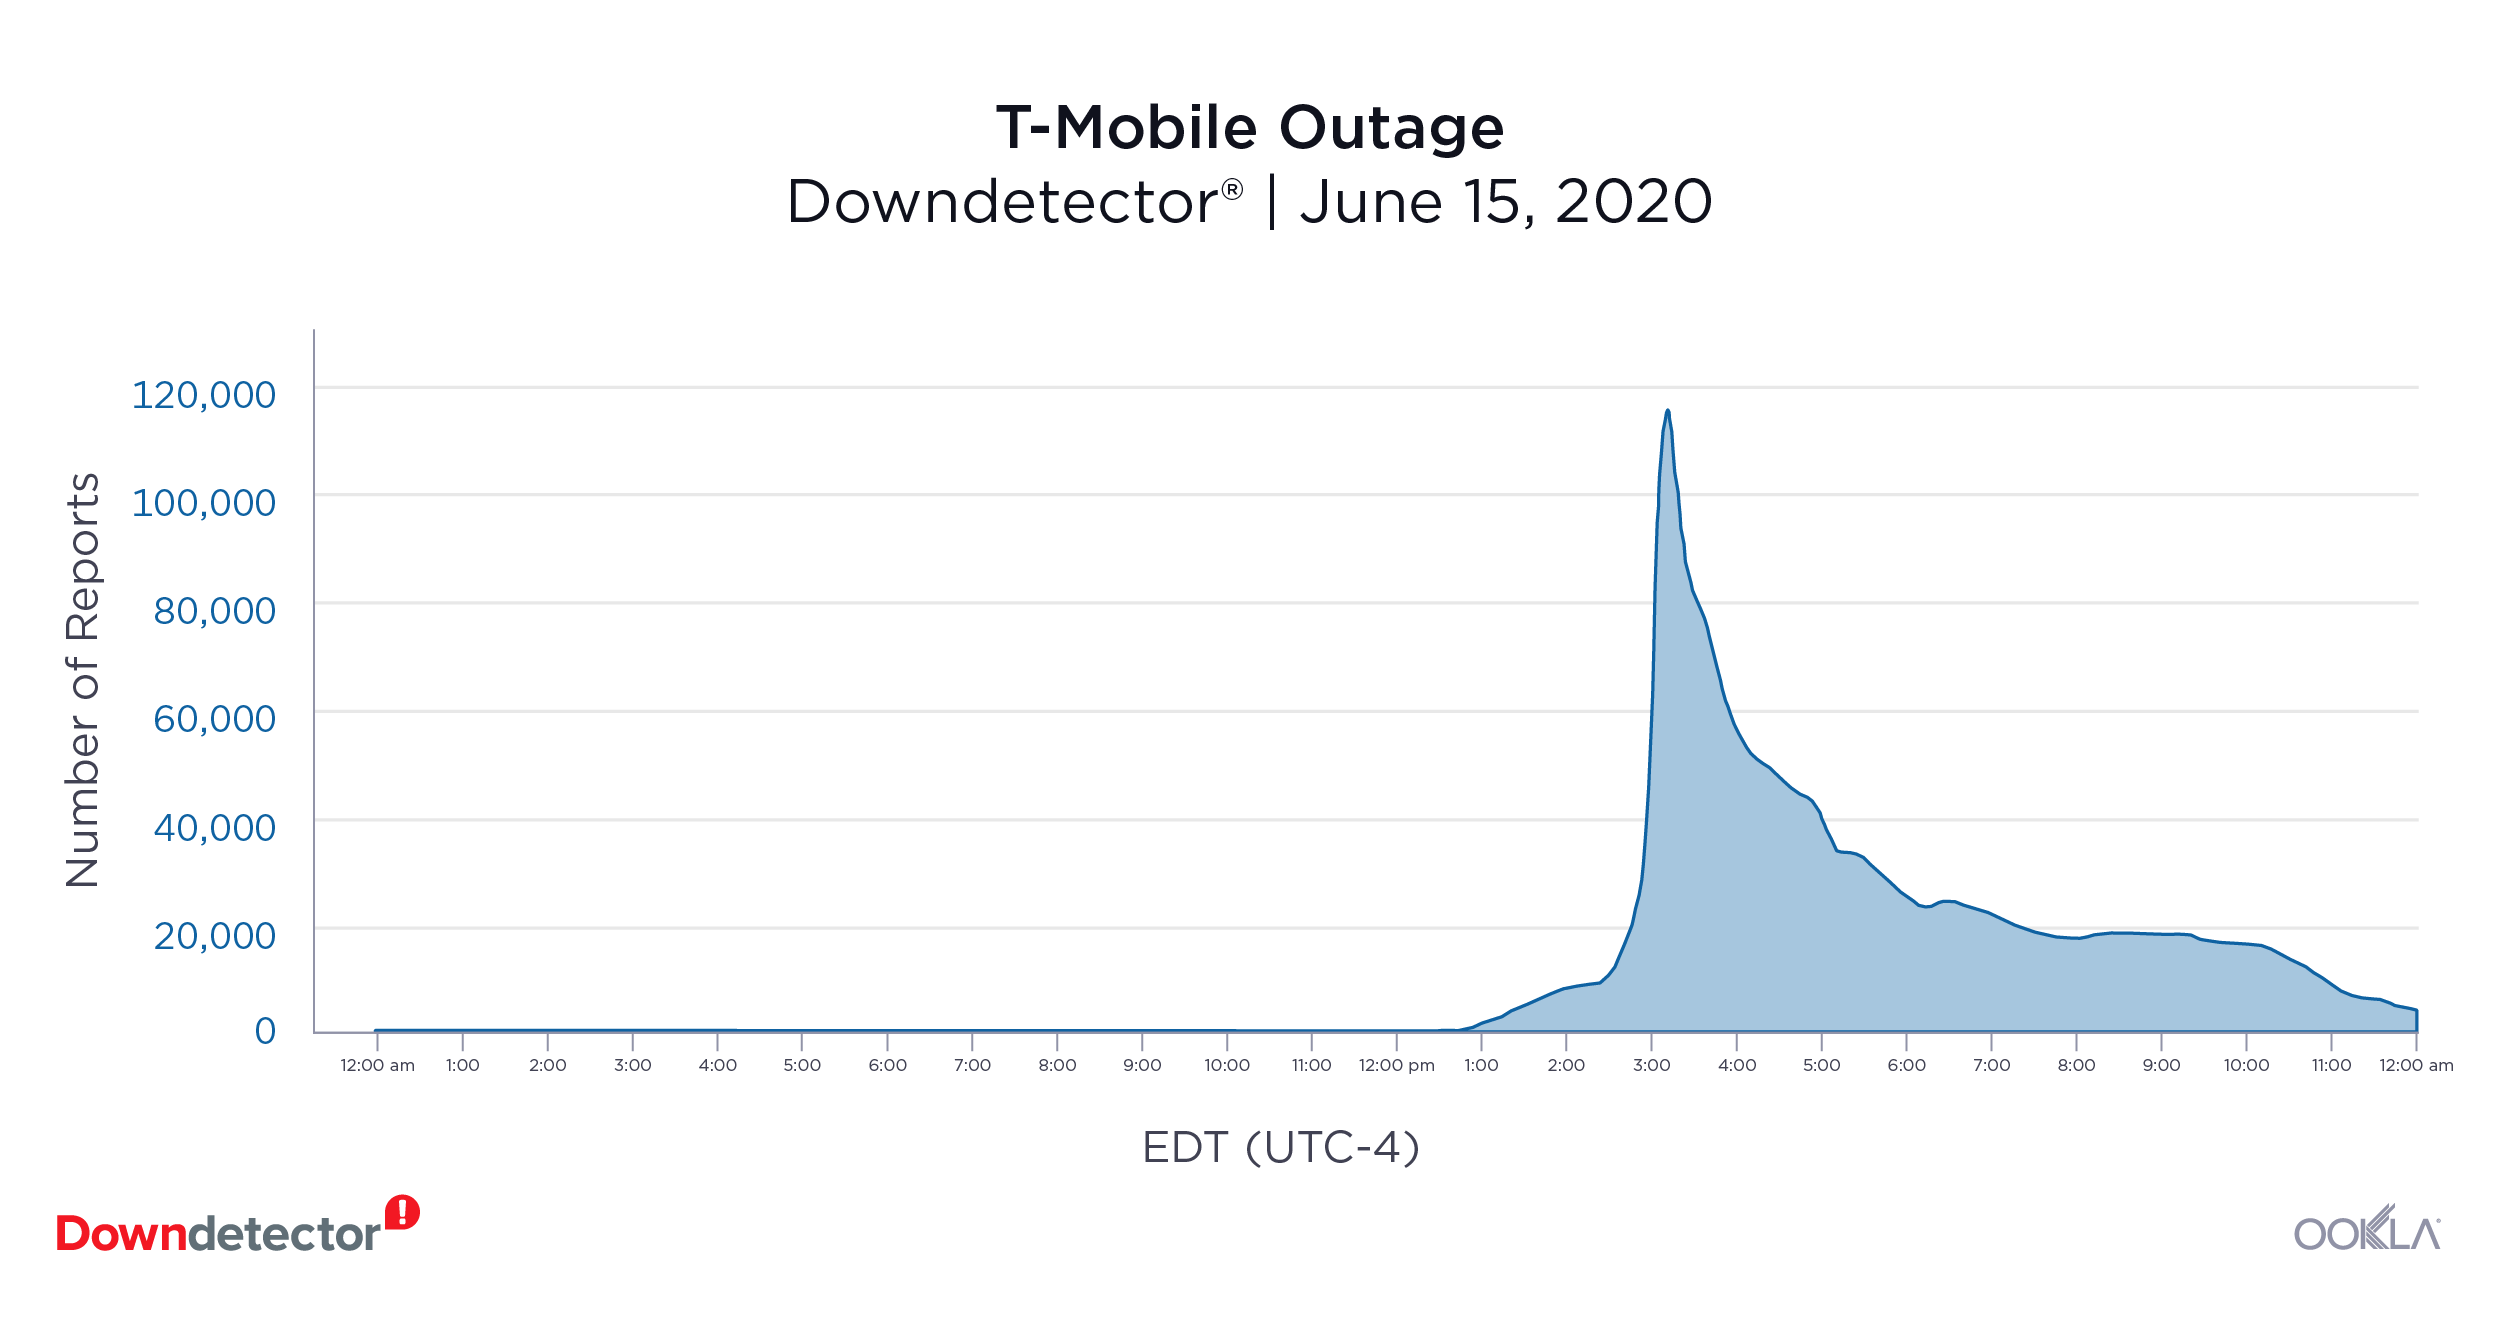
Downdetector_T-Mobile_Outage_0720-1

T-Mobile (June 15, 2020): 113,980 reports at peak

U.S. mobile operator T-Mobile suffered a major outage on June 15. Customers reported problems with their mobile phone service, mobile internet connection and their ability to text friends and family. Reports came in over a period of almost ten hours that evening, peaking with 113,980 reports in one 15-minute period. Other mobile network operators also received a significant volume of problem reports that day as their own customers were unable to reach T-Mobile customers, leading to perceived service issues.

U.K. Mobile Operators: Virgin Media (April 27), TalkTalk (May 29) and Vodafone (June 9)

U.K. telecom providers Virgin Media, TalkTalk and Vodafone each struggled with outages in Q2 2020. Virgin Media UK customers rushed to Downdetector on April 27 when they started having problems with their service. Users reported problems throughout the day over a period of about six hours. About 77% of Downdetector reports cited a problem with their cable internet service. The outage had multiple peaks during the day, with 40,397 reports during the highest peak.

TalkTalk users reported problems with their internet connection on May 29, with a peak of 31,942 user reports. According to Downdetector data, the majority of reports came from Manchester, London, Glasgow and Birmingham.

On June 9, Vodafone UK experienced a smaller, but not insignificant outage. During the outage, 94% of Downdetector problem reports cited issues with the mobile network service. At the peak of reported issues, 9,686 Downdetector users reported problems with the network.

Telcel (May 27, 2020): 5,091 reports at peak

Customers of Mexican operator Telcel reported problems with their network on May 27. Over 5,000 reports were recorded during the peak of problem reporting, 95% of which were about Telcel’s mobile network. Most reports came from Mexico City.

Collaboration platforms

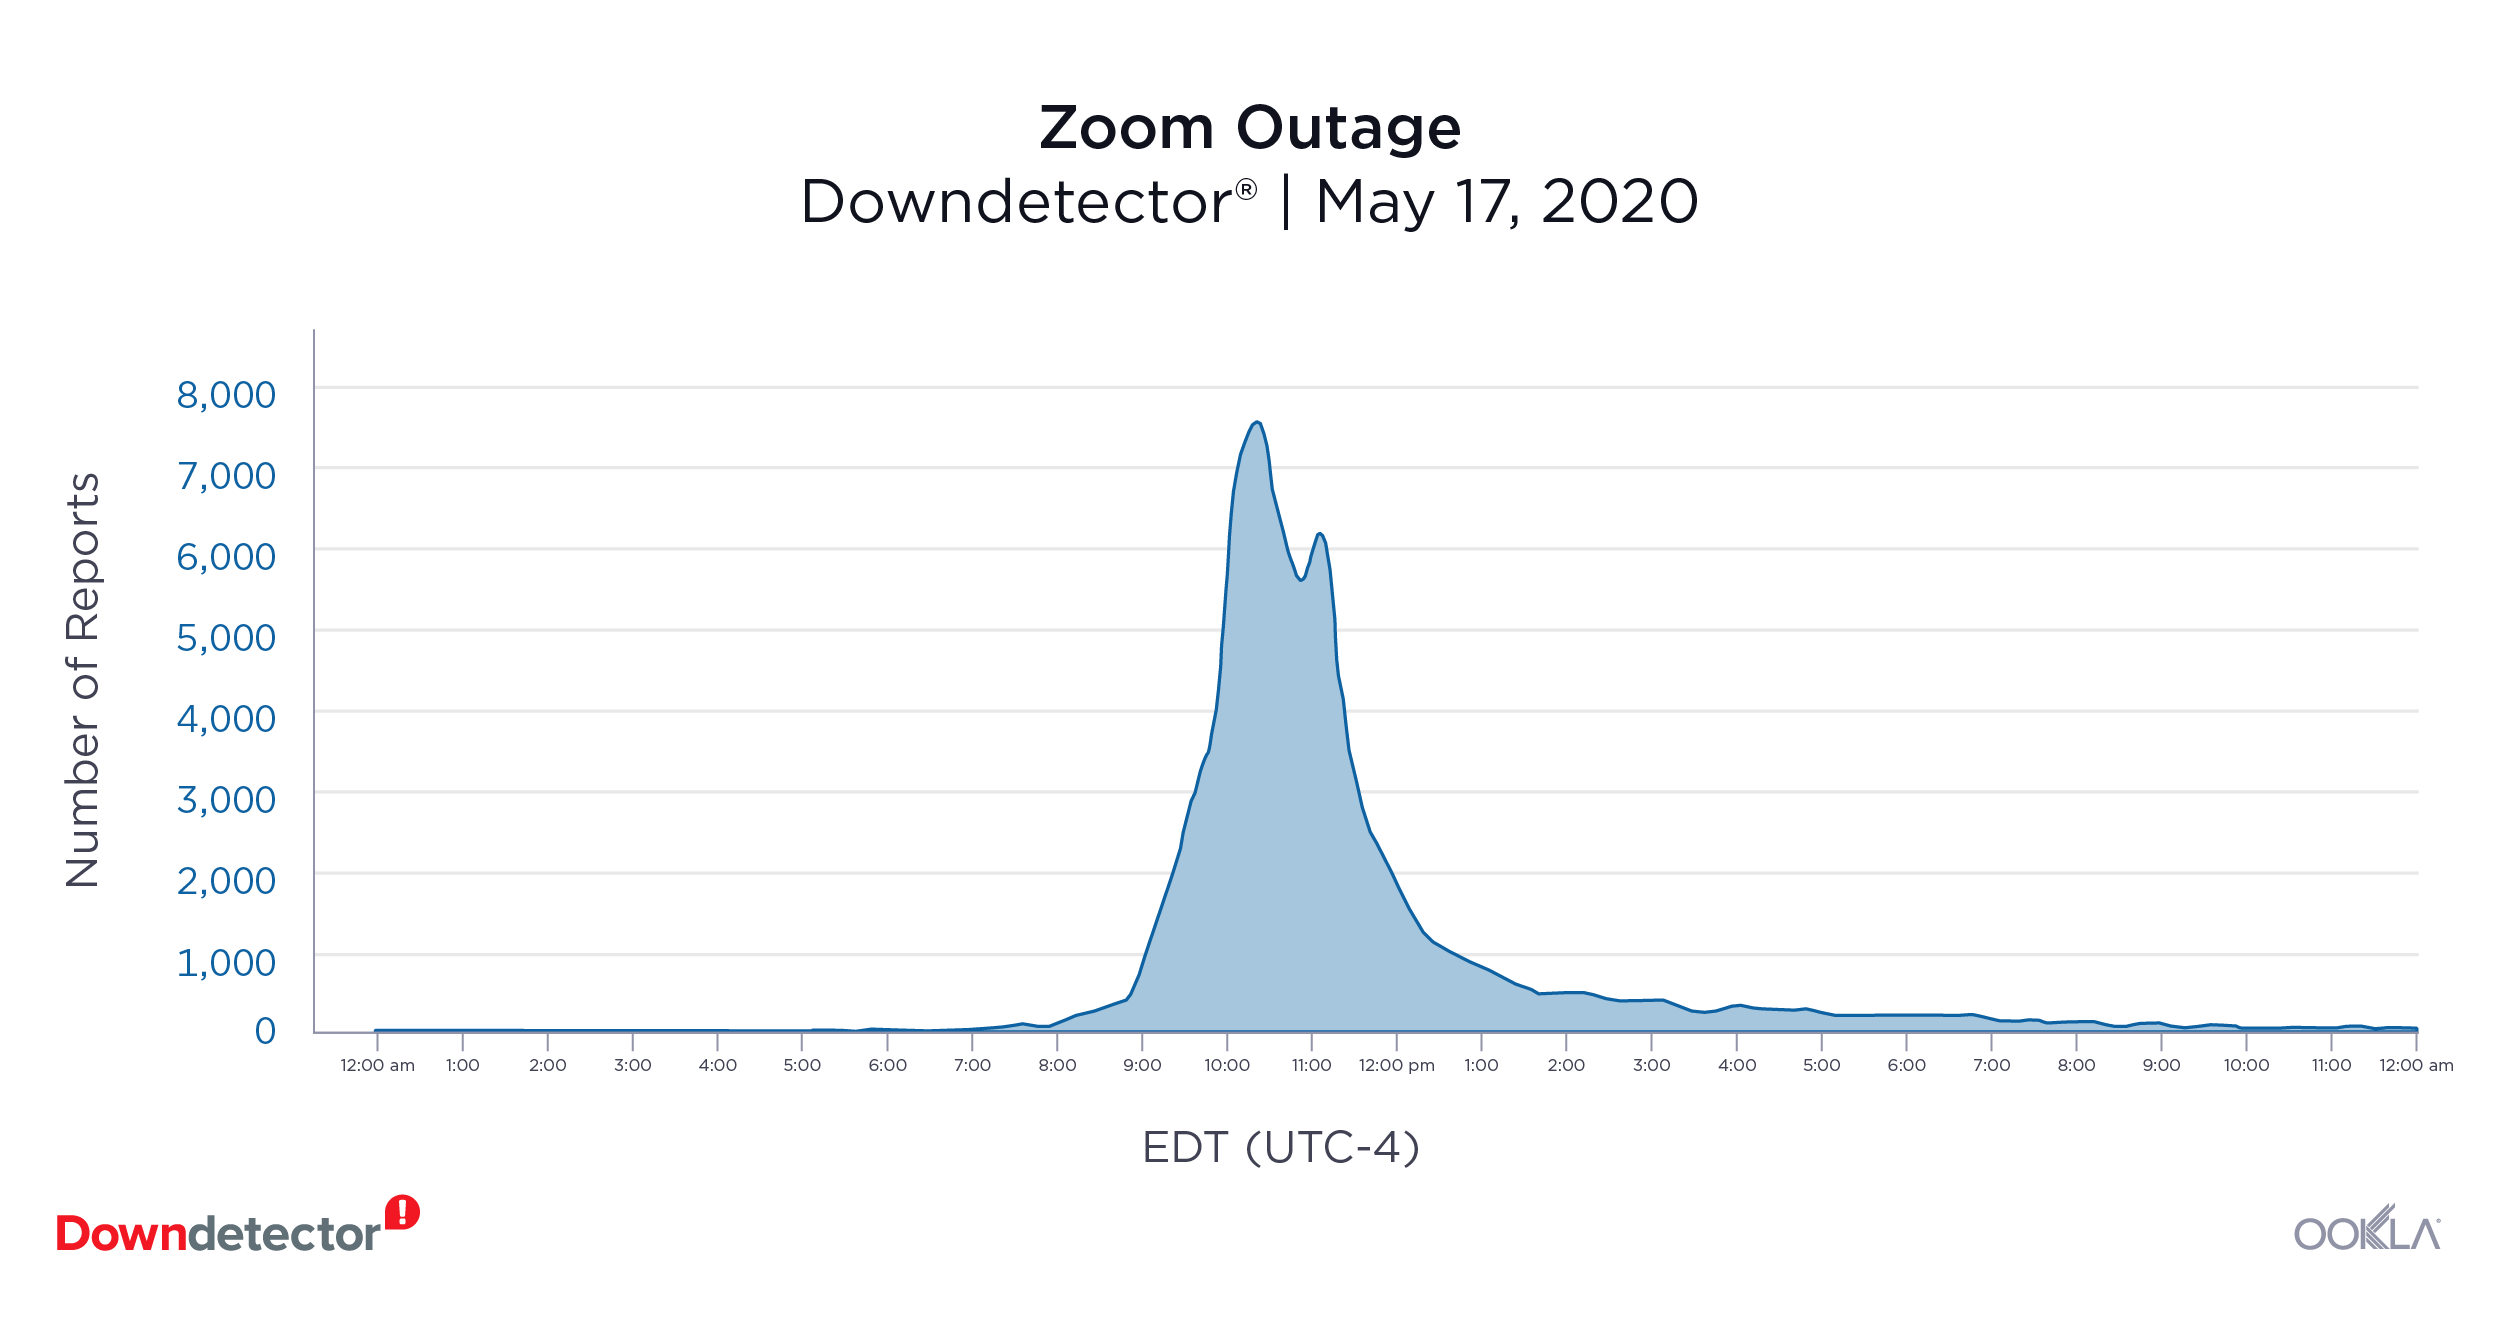
Downdetector_Zoom_Outage_0720-1

Zoom (May 17, 2020): 7,523 reports at peak

Video conferences and virtual dates were interrupted on May 17 when Zoom experienced problems in multiple countries. Downdetector measured a peak of 7,523 user-reported issues in one 15-minute period in the U.S., but the outage was also felt in Europe. Most users reported problems with the video conferencing feature of the online service.

Slack (May 12, 2020): 4,163 reports at peak

The popular business communication provider Slack experienced a disruption in their service on May 12, with a peak of 4,163 user-reported issues in 15 minutes. Most users who reported problems on Downdetector were located in San Francisco, Los Angeles, San Jose, and Seattle. Most reports pointed to problems connecting to the online service.

Office 365 (June 14, 2020): 2,056 reports at peak

On June 14, Australian users of Microsoft’s subscription service Office 365 reported issues, with a peak of 2,056 over 15 minutes. Users were unable to log into any of the Office 365 apps and experienced problems connecting to the server. Users in New Zealand also reported issues that day.

Gaming

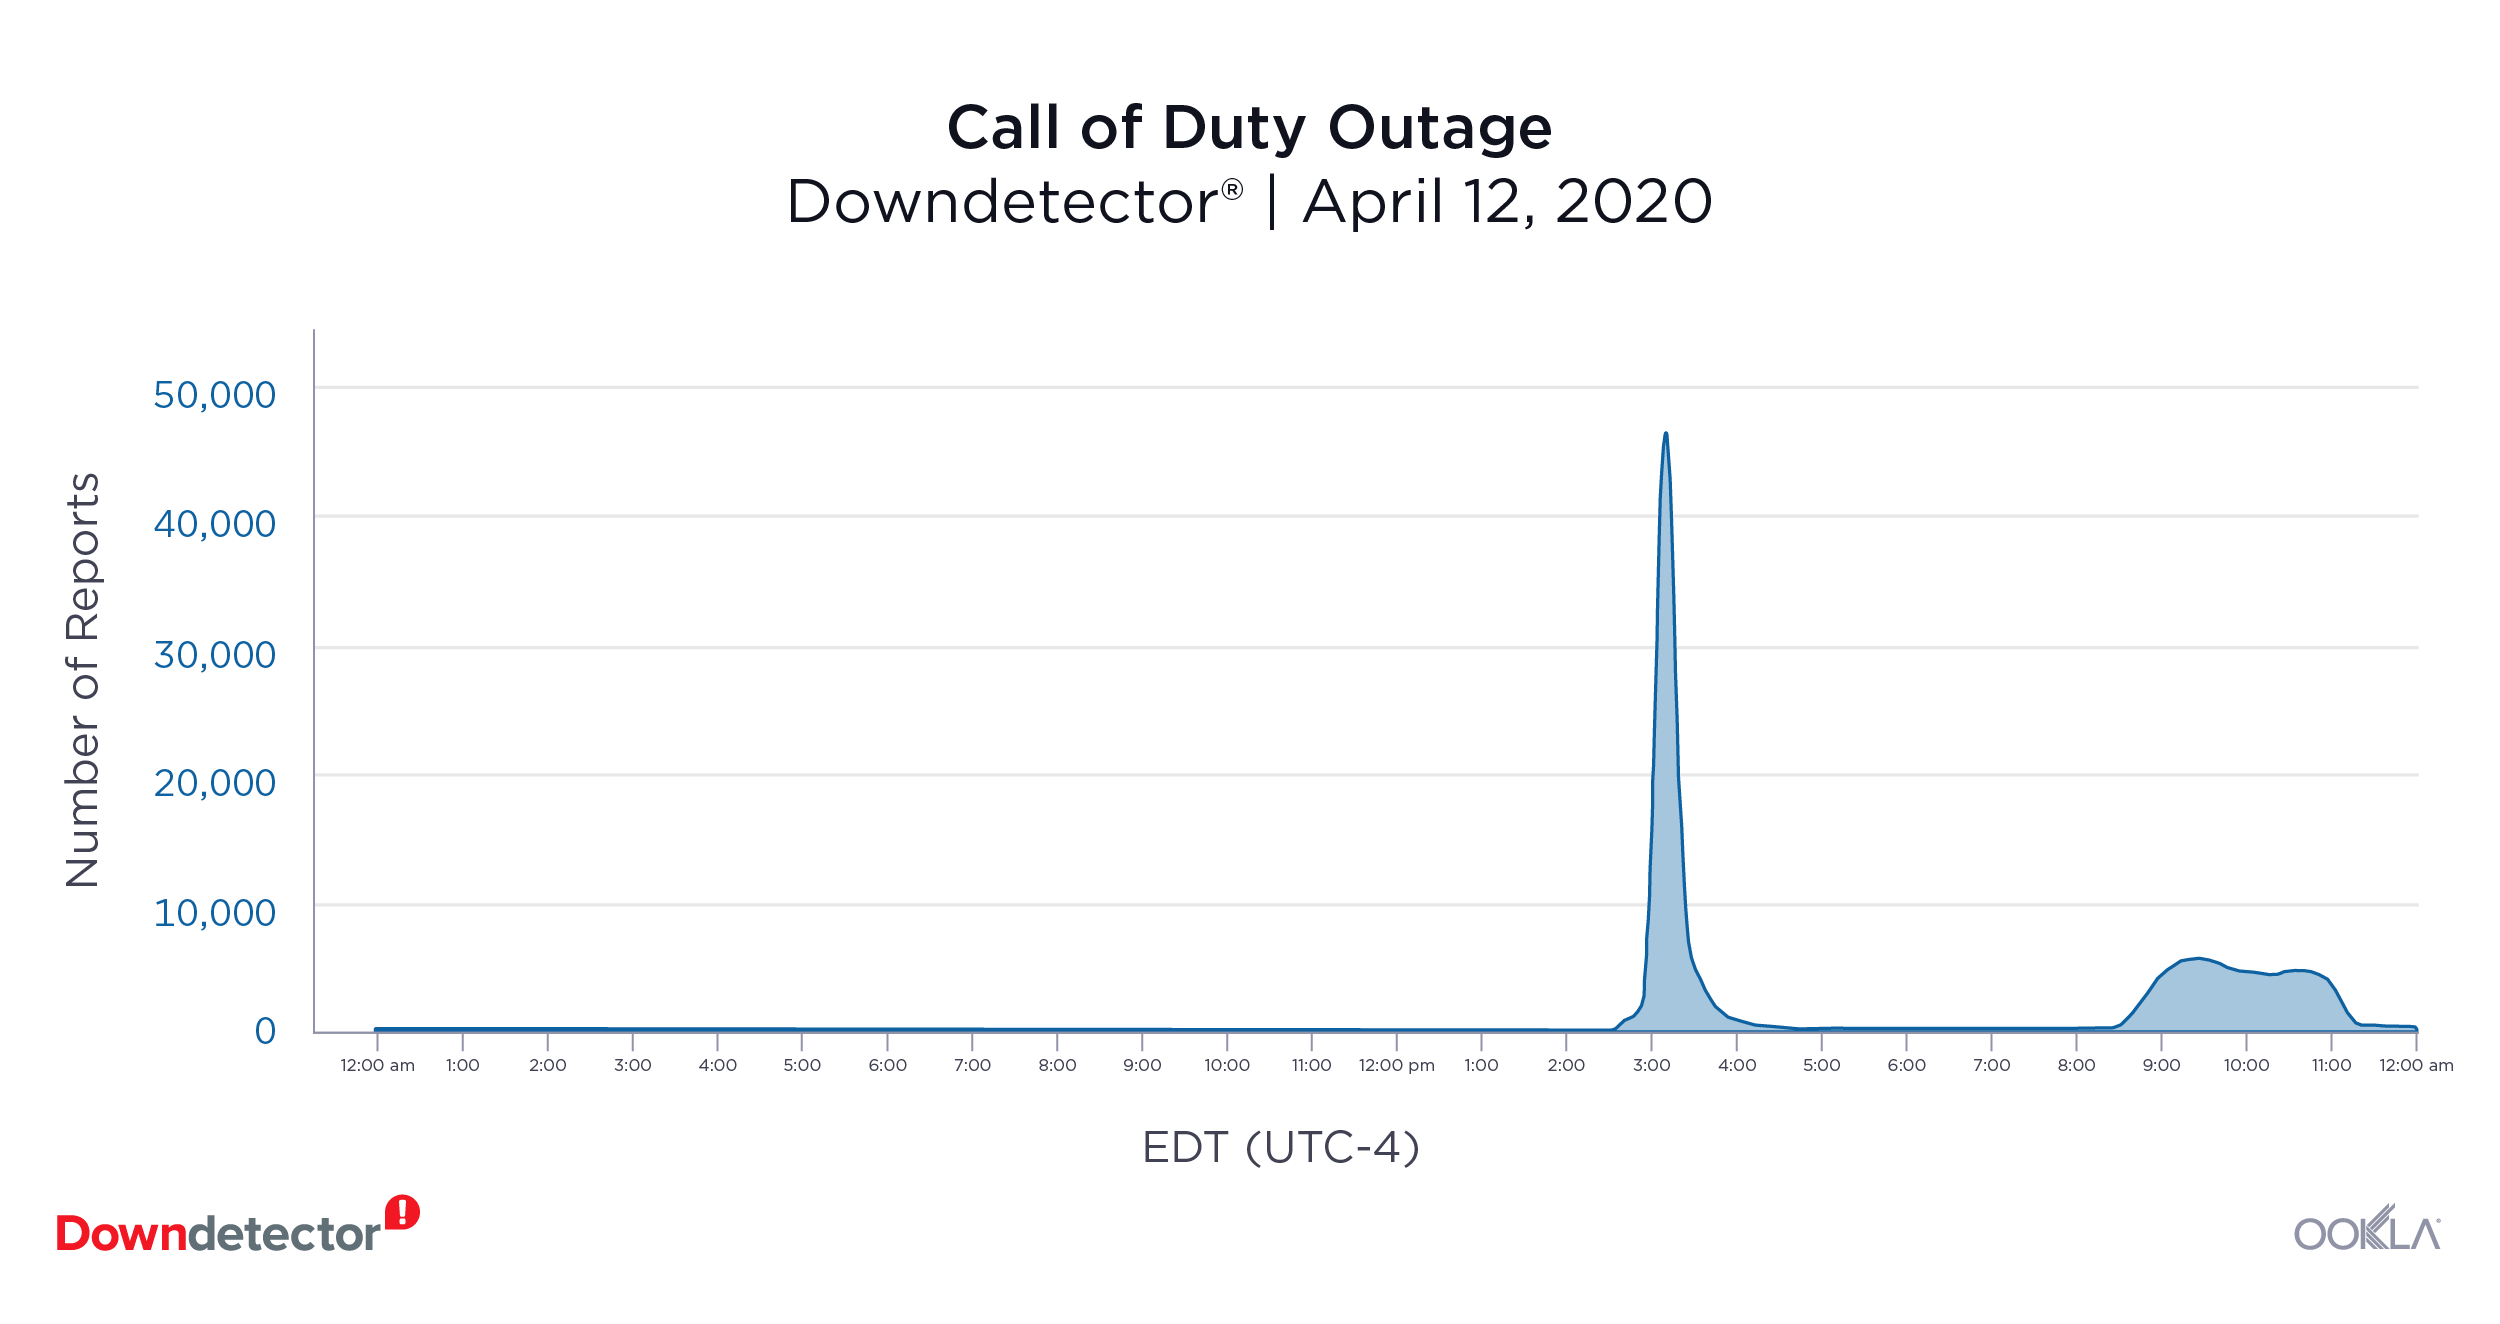
Downdetector_CallofDuty_Outage_0720-2

Call of Duty (April 12, 2020): 46,278 reports at peak

U.S. players of Call of Duty were unable to connect to the game’s servers on April 12. Users from Dallas, Chicago, Houston, Philadelphia and New York City flooded Downdetector with reports when they encountered problems with the game. At the peak of Downdetector reports, more than 46,000 users reported issues.

Financial institutions

Downdetector_BBVA_Outage_0720-1

BBVA Bancomer (June 10, 2020): 1,198 reports at peak

On June 10, customers of BBVA Bancomer in Mexico reported issues with their online banking service. More than 1,000 reports were recorded at the peak of reporting, with many users unable to log in or use the app over a period of approximately four hours The majority of reported issues came from Mexico City, Guadalajara and Monterrey.

Want to know when an online service is down? Keep up with outages by visiting Downdetector.

Ookla retains ownership of this article including all of the intellectual property rights, data, content graphs and analysis. This article may not be quoted, reproduced, distributed or published for any commercial purpose without prior consent. Members of the press and others using the findings in this article for non-commercial purposes are welcome to publicly share and link to report information with attribution to Ookla.

| November 18, 2020

ICYMI: Ookla Data and Research from October 2020

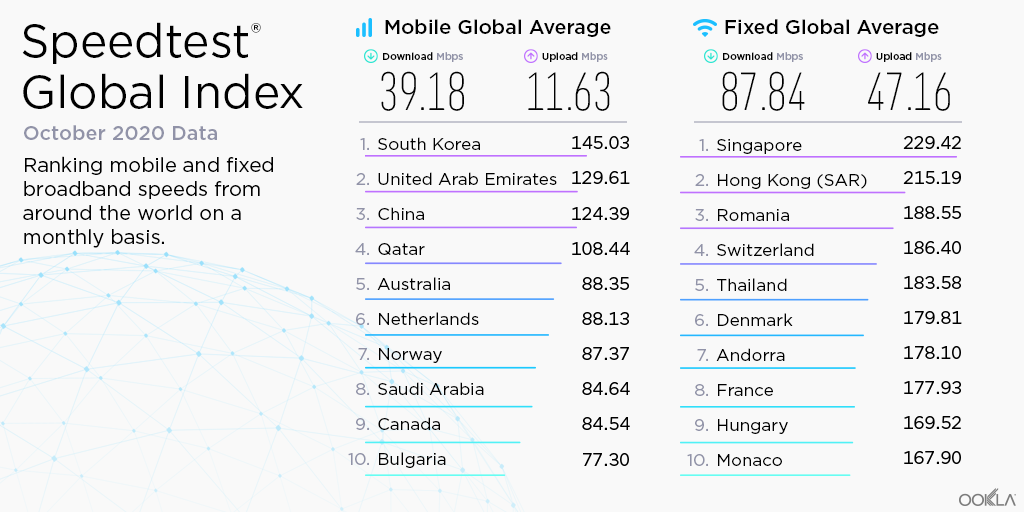
Highlights from the Speedtest Global IndexTM

Global-Index-Tweet-Image-Oct-2020
These are the top stories from October 2020:

  • Australia is back in the top 5 for mobile for the first time since November 2019.
  • Luxembourg had a substantial rank change on mobile, moving up 11 places. This is likely due to two thirds of Luxembourg’s top providers now providing 5G.
  • The U.S. has finally broken the top thirty on mobile for the first time, coming in at 27th. Again, this is likely due to new 5G developments.
  • With Andorra’s largest fixed broadband provider offering 300 Mbps and 700 Mbps service plans, the country has seen a steady increase in monthly performance since February of this year.
  • Cyprus has seen steady increases in fixed broadband speed over the last few months, with one of the country’s top providers now offering fixed broadband plans up to 300 Mbps. The country now ranks 68th.

Articles worth a second look

Rakuten is Leveraging O-RAN to Reimagine Mobile and it Could Change the Way We Use Our Phones Forever

Discover how O-RAN works and how Rakuten is using a fully virtual, cloud-native mobile network approach to disrupt mobile markets around the world.

Upgrades in Mobile Speeds in India Come with Expanded 4G Availability


Comparing India to neighboring countries for mobile internet speeds and 4G Availability, this market snapshot includes information about the country’s fastest operators.

Make Better Funding Decisions with Accurate Broadband Network Data: A Guide for Federal, State and Local Governments (White Paper)


Federal, state and local policymakers are tasked with spending on broadband development. Learn how inaccurate data on network performance negatively impacts these government funding efforts with this white paper, including a case study from New York.

How to Improve In-Building Network Performance and Coverage with Crowdsourced Data (White Paper)


Use this white paper to learn how to discover heavily populated buildings with poor network coverage or quality — then how to make low-cost improvements to indoor network performance and coverage.

“Unable to Connect” — The Most Significant Online Service Outages in Q3 2020


Discover which online services around the world suffered the most widely reported incidents in Q3 2020 based on data from Downdetector®.

How Downdetector Works


Learn how Downdetector spots outages, assesses the geography of issues and determines how many problem reports it takes to indicate an incident with a site or online service.

Ookla retains ownership of this article including all of the intellectual property rights, data, content graphs and analysis. This article may not be quoted, reproduced, distributed or published for any commercial purpose without prior consent. Members of the press and others using the findings in this article for non-commercial purposes are welcome to publicly share and link to report information with attribution to Ookla.

| December 21, 2020

ICYMI: Ookla Data and Research from November 2020


Highlights from the Speedtest Global IndexTM

Global-Index-Tweet-Image-Nov-2020

These are the top stories from November 2020:

  • Thailand is back in third place for fixed broadband. The country has seen steady increases in fixed broadband since November 2019 when it was in 19th place.
  • New 5G rollouts were the likely cause for the United Kingdom’s 10-spot climb to 32nd place in mobile.
  • Kuwait has reached its highest mobile ranking to date — 11th place. This is most likely due to all major operators offering 5G in the country.
  • Monaco showed a sharp increase in download speed over fixed broadband. The country jumped six places since October and is now fourth for fixed broadband.

Articles worth a second look

Massive Expansions and Huge Improvements in Speed: The Worldwide Growth of 5G in 2020


Learn more about the growth of 5G, which countries had the fastest 5G, which had the best coverage — and which are still relying on 2G and 3G.

5G Advances Across the U.K., but Access Varies Widely by Country


A comprehensive look at the state of 5G in the United Kingdom, this report reveals differences in speed by country and by operator.

Exploring the Relationship Between Network Performance and NPS in Germany, Austria and Switzerland


Does network performance impact customer satisfaction? Find out in this analysis of network performance, NPS and five-star ratings of top providers in Austria, Germany and Switzerland.

The Relationship Between Network Performance and Customer Satisfaction in the Philippines


Internet speeds in the Philippines have increased dramatically in recent years. Discover how network performance of top providers has affected customer satisfaction.

Treat Yourself to a Hack Day: Make a Physical Speedtest Gauge


Create the perfect gift for yourself or a loved one and build your own ethernet-enabled physical Speedtest gauge with these simple instructions.

Prioritizing Broadband Funding to Close the Digital Divide [Webinar]


Policymakers need accurate, reliable data to make broadband funding decisions that benefit their constituents. Watch the 30-minute webinar recording to learn how network data from Speedtest® can help policymakers improve their jurisdictions’ broadband availability and performance.

Ookla retains ownership of this article including all of the intellectual property rights, data, content graphs and analysis. This article may not be quoted, reproduced, distributed or published for any commercial purpose without prior consent. Members of the press and others using the findings in this article for non-commercial purposes are welcome to publicly share and link to report information with attribution to Ookla.

| June 16, 2021

How COVID-19 Affected Roaming for Mobile Speeds in Europe

Roaming might seem like an unusual topic in a time when inter-country travel has been largely prohibited, but we wanted to build on our previous analysis to see how roaming performance and behaviors evolved over the past year. This analysis examines Speedtest data from Android devices in the European Union (E.U.) and the United Kingdom (U.K.) from Q1 2020 through Q1 2021. We’ve included the U.K. to maintain continuity with pre-Brexit reports.

Roaming speeds were slower in most European countries in Q1 2021

Speedtest Intelligence® again showed that consumers who are roaming outside their home countries often experience slower speeds. During Q1 2021, 19 out of the 26 European countries with statistically viable roaming sample sizes experienced slower median roaming download speeds than median local download speeds. Cyprus and Malta had too few roaming samples to be included in this year’s analysis for Q1 2021.

For the seven countries that saw increased speeds, Latvians experienced the largest increase in median download speed when roaming elsewhere in Europe at 23.4%, which was followed closely by Estonia (22.8%) and Ireland (19.5%). Greece, Romania and Slovenia saw increases of more than 5%. The U.K. saw about the same speeds roaming and locally with an increase of only 0.5% when roaming. Hungary also saw comparable roaming download speeds to local speeds with a decrease of only 0.5% when roaming.

Median Local vs. Roaming Download Speeds in Europe
Speedtest Intelligence® | Q1 2021
Country Local Download (Mbps) Roaming Download (Mbps) % Change
Austria 36.19 26.13 -27.8%
Belgium 43.90 27.52 -37.3%
Bulgaria 61.76 29.74 -51.8%
Croatia 48.23 31.3 -35.1%
Czechia 31.35 19.74 -37.0%
Denmark 50.11 22.18 -55.7%
Estonia 34.34 42.16 22.8%
Finland 43.02 31.68 -26.4%
France 34.68 29.62 -14.6%
Germany 27.56 20.14 -26.9%
Greece 32.38 35.51 9.7%
Hungary 28.66 28.51 -0.5%
Ireland 14.99 17.91 19.5%
Italy 25.24 21.66 -14.2%
Latvia 22.69 28.00 23.4%
Lithuania 33.66 30.80 -8.5%
Luxembourg 40.65 26.31 -35.3%
Netherlands 77.52 26.48 -65.8%
Poland 26.51 23.13 -12.7%
Portugal 26.16 23.74 -9.3%
Romania 25.12 26.80 6.7%
Slovakia 23.79 20.94 -12.0%
Slovenia 27.63 29.58 7.1%
Spain 23.78 18.21 -23.4%
Sweden 38.26 23.16 -39.5%
United Kingdom 27.96 28.09 0.5%

Every other country on our list saw decreases in median download speeds of 8.5% or more while roaming, with customers from the Netherlands experiencing the largest drop (65.8%) from a local speed of 77.52 Mbps to 26.48 Mbps while roaming. Customers from Denmark and Bulgaria experienced roaming speeds less than half of what they’re accustomed to at home with decreases of 55.7% and 51.8%, respectively.

Roaming decreased during the pandemic while speeds increased

The COVID-19 pandemic has upended countless lives with multiple lockdowns throughout 2020 and 2021 and severe limits to movement across borders. Data from Speedtest Intelligence reflects this decrease in roaming with roaming samples markedly down when comparing Q1 2021 to Q1 2020. We saw the most roaming samples during Q3 2020 and Q1 2020, which corresponds to increased lockdowns and movement restrictions in Q2 and Q4 2020 in response to the first and second waves of the pandemic.

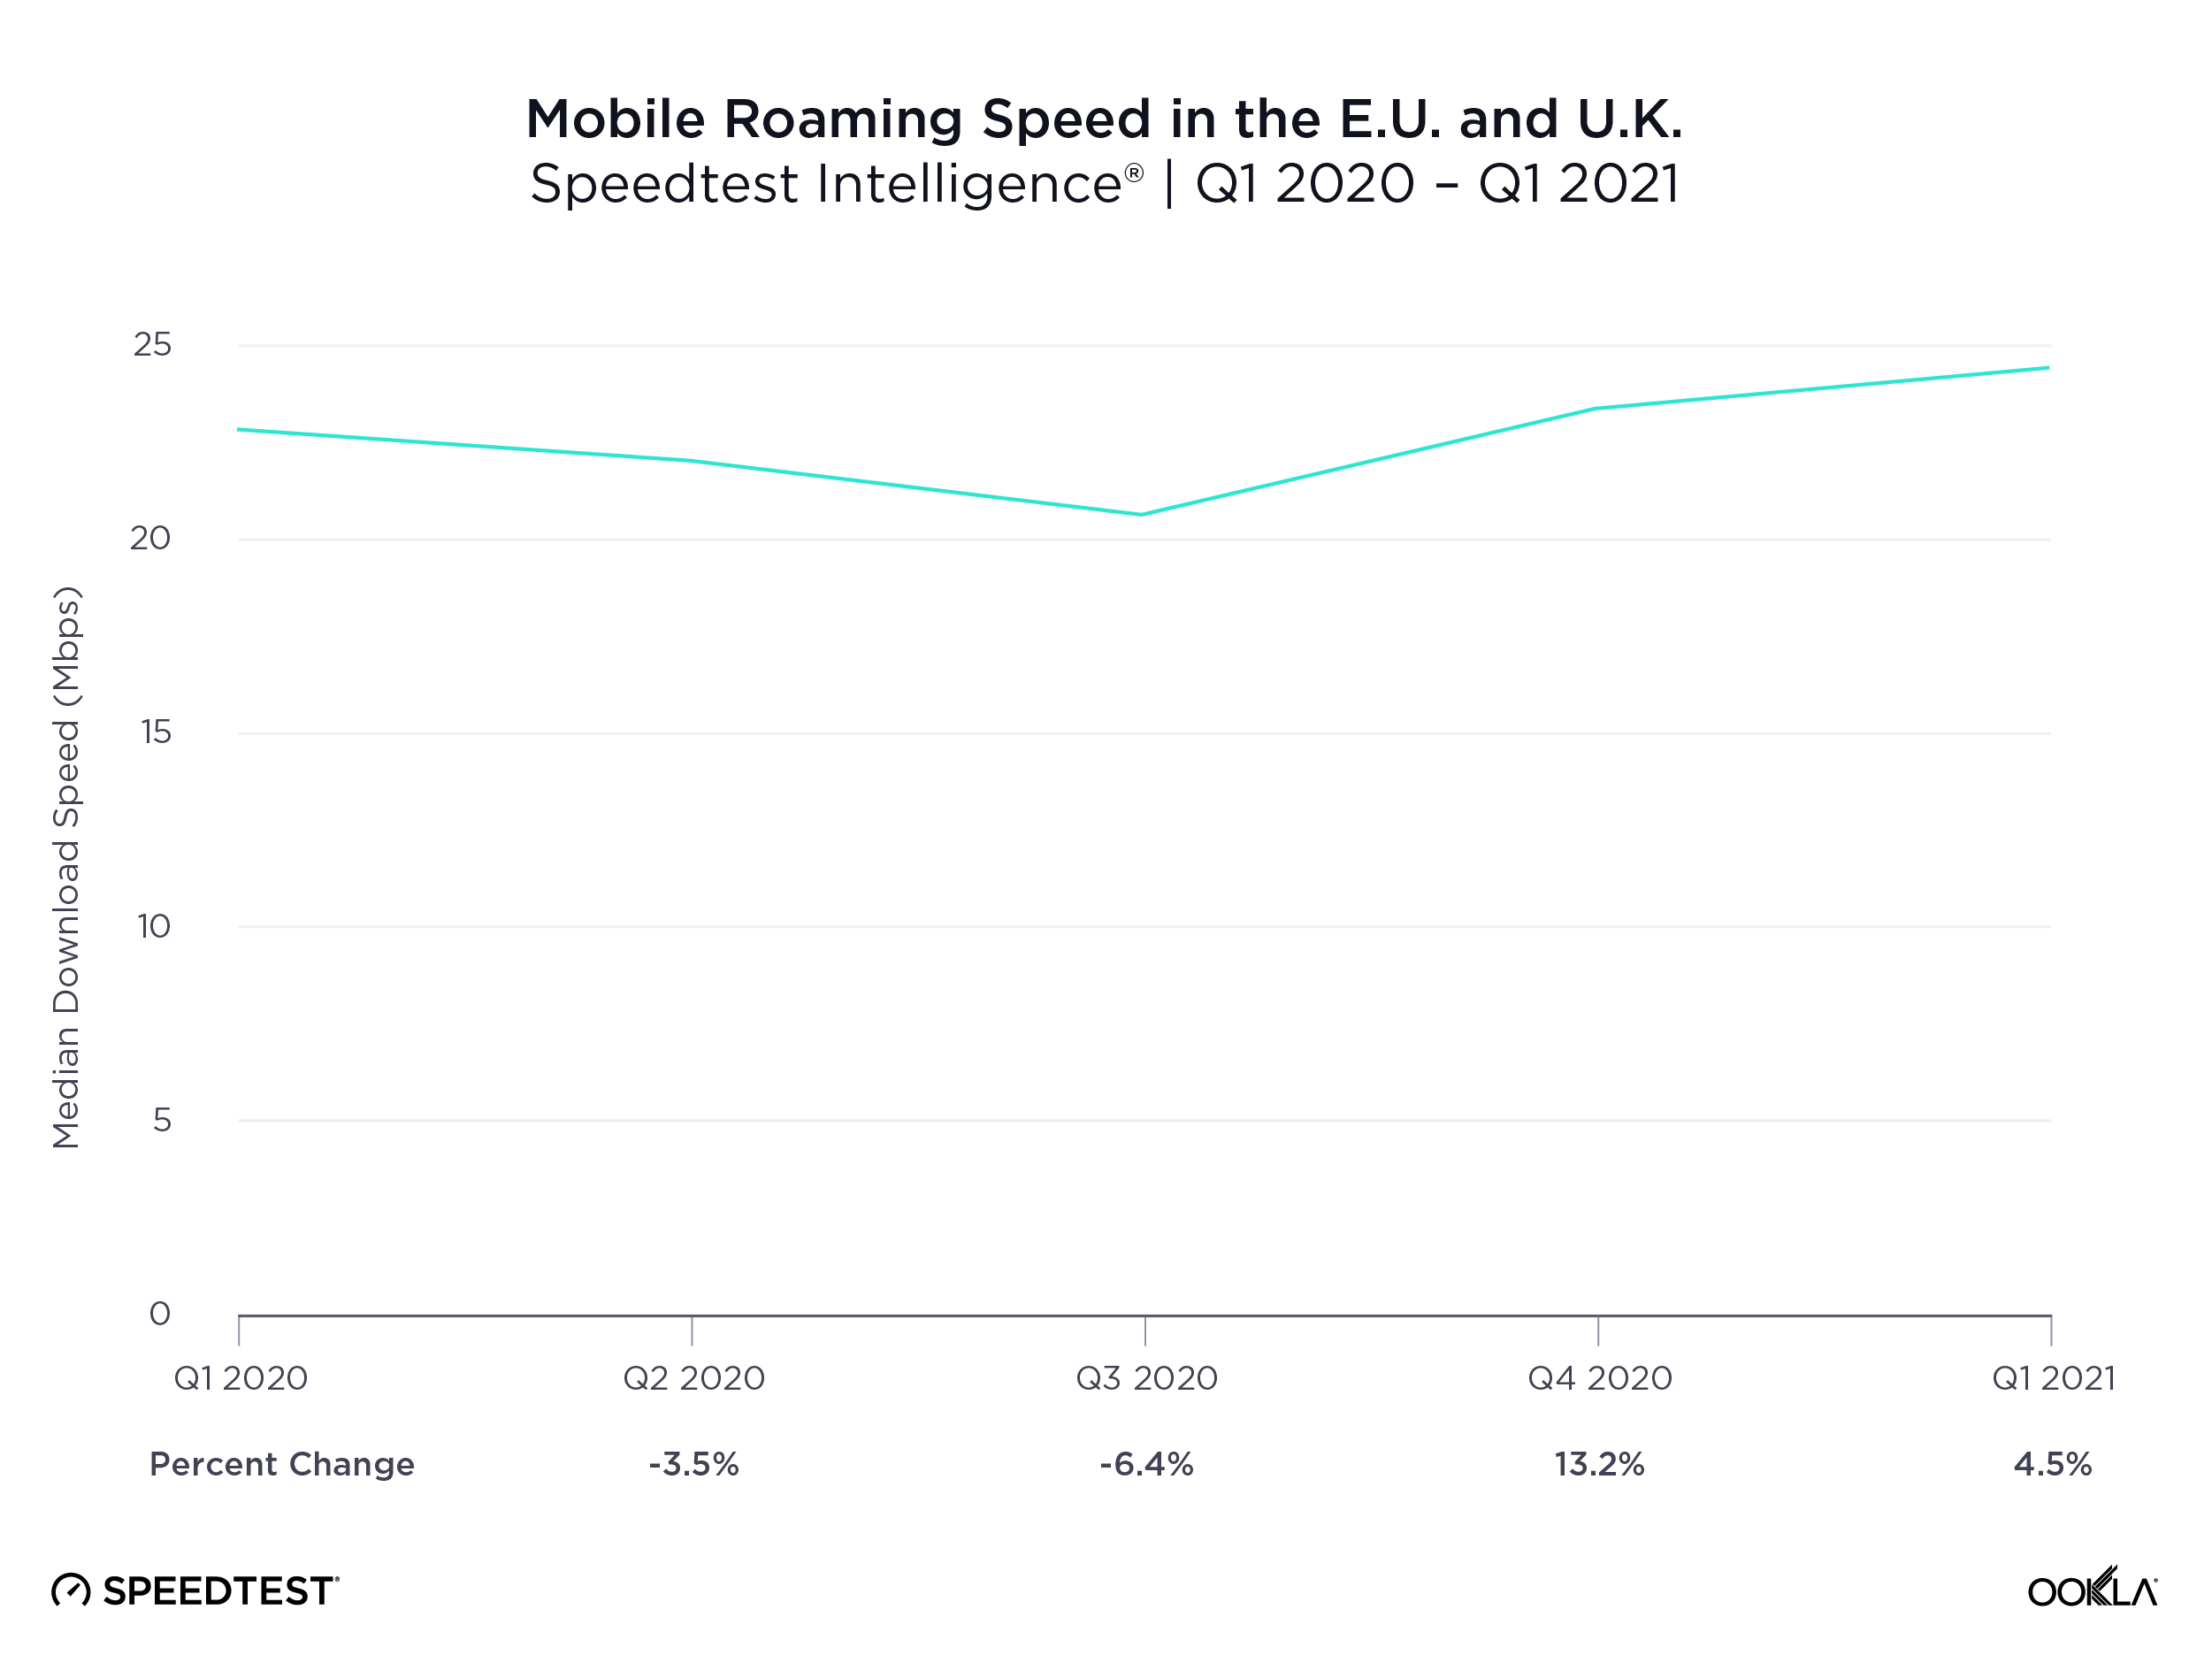
Roaming speeds for all European countries combined increased 6.9% between Q1 2020 and Q1 2021, though the increase was not linear. Median download speed while roaming decreased from 22.89 Mbps in Q1 2020 to 22.09 in Q2 2020 and slipped down to 20.68 Mbps in Q3 2020. Roaming speeds began to increase in Q4 2020 with the median download speed rising to 23.42 Mbps, and Q1 2021 saw a further increase to 24.47 Mbps.

ookla_roaming_quarter_change_eu_0621-1

Estonia saw the biggest year-over-year increase in median roaming download speed, Slovakia and Italy saw the largest decrease

Median European Roaming Download Speeds
Speedtest Intelligence® | Q1 2020 – Q1 2021
Country Q1 2020 Download (Mbps) Q1 2021 Download (Mbps) % Change
Europe (All Countries Combined) 22.89 24.47 6.9%
Austria 24.39 26.13 7.1%
Belgium 23.78 27.52 15.7%
Bulgaria 22.81 29.74 30.4%
Croatia 29.28 31.30 6.9%
Czechia 20.23 19.74 -2.4%
Denmark 21.38 22.18 3.7%
Estonia 27.82 42.16 51.5%
Finland 32.18 31.68 -1.6%
France 24.57 29.62 20.6%
Germany 20.74 20.14 -2.9%
Greece 41.07 35.51 -13.5%
Hungary 25.10 28.51 13.6%
Ireland 22.08 17.91 -18.9%
Italy 26.98 21.66 -19.7%
Latvia 26.38 28.00 6.1%
Lithuania 22.60 30.80 36.3%
Luxembourg 18.82 26.31 39.8%
Netherlands 18.39 26.48 44.0%
Poland 17.01 23.13 36.0%
Portugal 23.78 23.74 -0.2%
Romania 23.64 26.80 13.4%
Slovakia 26.16 20.94 -20.0%
Slovenia 25.30 29.58 16.9%
Spain 15.05 18.21 21.0%
Sweden 21.36 23.16 8.4%
United Kingdom 29.48 28.09 -4.7%

2020 also posed many challenges for telecom operators around the world as customers shifted use patterns. Despite these challenges, many Europeans saw increases in median roaming speeds year-over-year. In fact, customers in 17 out of the 26 countries analyzed saw faster download speeds while roaming elsewhere in Europe when comparing Q1 2020 to Q1 2021. Estonians saw the largest increase at 51.5% (from 27.82 Mbps to 42.16 Mbps), the Netherlands was next with a 44.0% jump (from 18.39 Mbps to 26.48 Mbps) and Luxembourg saw a 39.8% increase in download speed (from 18.82 Mbps to 26.31 Mbps).

Countries whose customers experienced year-over-year decreases in median downloads speed while roaming include Slovakia (20.0% decrease), Italy (19.7%), Ireland (18.9%), Greece (13.5%), the U.K. (4.7%), Germany (2.9%), Czechia (2.4%), Finland (1.6%) and Portugal (0.2%).

While the year-over-year change is an interesting baseline metric, it’s also important to note only Denmark, Germany, Poland and Spain had consistently slower median roaming download speeds than the European average during every quarter from Q1 2020 to Q1 2021. Every other country had at least one quarter where speeds were faster than the European average.

Outbound roaming speeds varied drastically from country to country from Q1 2020 to Q1 2021

Roaming speeds are heavily dependent on agreements between individual operators, which means they can vary dramatically by country and by operator. We looked closely at outbound roaming for individual countries to see how different countries’ networks performed during COVID-19 lockdowns.

Customers from the Netherlands roaming in France saw the fastest median roaming download speed in all of Europe during Q1 2021 at 70.46 Mbps. Customers from Germany roaming in Portugal experienced the slowest median roaming download speed during Q3 2020 at 0.42 Mbps.

Here were some of the fastest roaming speeds from select countries to other countries within Europe between Q1 2020 and Q1 2021:

  • Netherlands to France (70.46 Mbps in Q1 2021)
  • Bulgaria to the U.K. (58.21 Mbps in Q4 2020)
  • Netherlands to Poland (55.77 Mbps in Q1 2021)
  • Denmark to Sweden (40.46 Mbps in Q4 2020)
  • Finland to Estonia (48.41 Mbps in Q1 2020)

Here were some of the slowest roaming speeds between Q1 2020 and Q1 2021:

  • Germany to Portugal (0.42 Mbps in Q3 2020)
  • Czechia to France (4.98 Mbps in Q3 2020)
  • France to Portugal (5.54 Mbps in Q3 2020)
  • Hungary to France (5.95 Mbps in Q3 2020)
  • Poland to Belgium (7.59 Mbps in Q1 2020)

We’ll continue to watch roaming speeds over the next year to see how roaming changes as more countries reopen and travel picks up again. If you’re interested in learning more about roaming speeds for your business or country, please click here.

Ookla retains ownership of this article including all of the intellectual property rights, data, content graphs and analysis. This article may not be quoted, reproduced, distributed or published for any commercial purpose without prior consent. Members of the press and others using the findings in this article for non-commercial purposes are welcome to publicly share and link to report information with attribution to Ookla.

| July 27, 2021

Oslo Tops the List of World Capitals with the Fastest 5G in Q1-Q2 2021

Mobile operators are rapidly expanding 5G deployments across the globe, with 16,410 new 5G deployments across 109 countries added to the Ookla 5G Map in June 2021 alone. Huge investments in 5G are being made to increase performance, especially in major cities. We used Speedtest Intelligence® to see which world capitals have the best 5G speeds and availability, based on locations with commercially available 5G during Q1-Q2 2021.

Oslo, Norway was the fastest world capital for 5G during Q1-Q2 2021

ookla_fastest_5g_download_speed_world_capitals_0721

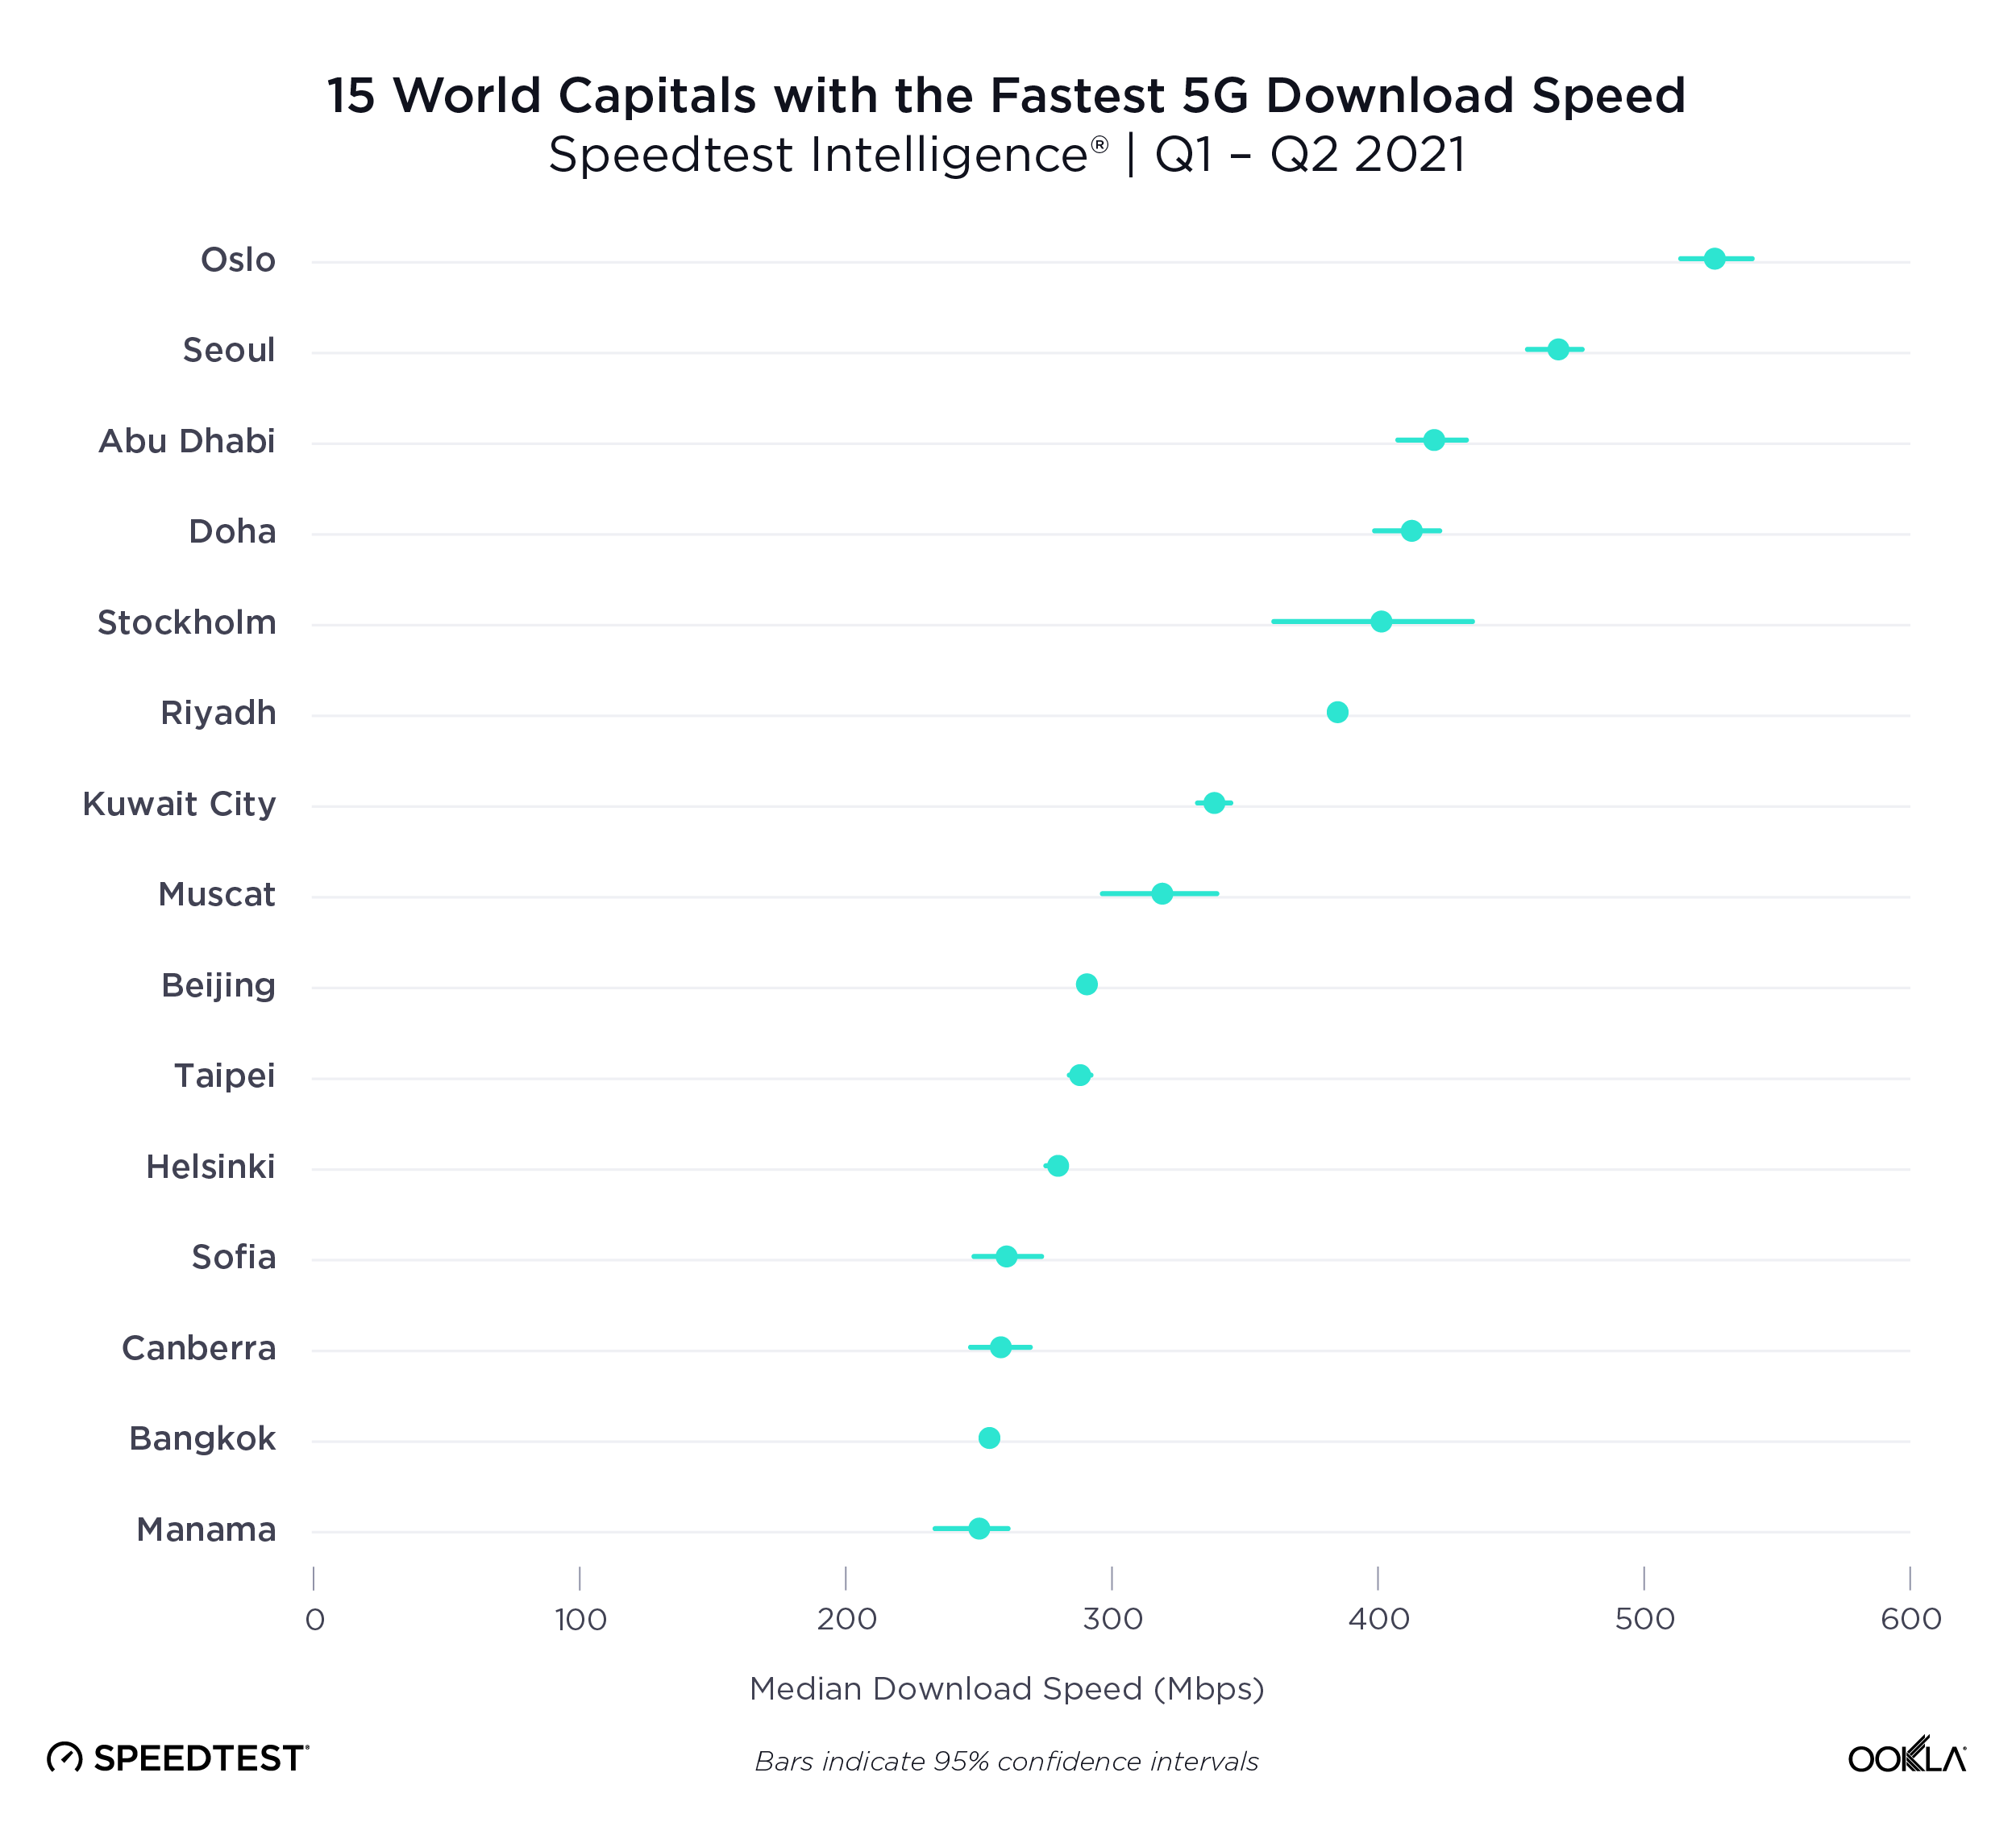
The race for fastest 5G performance among world capitals was extremely competitive during Q1-Q2 2021. Oslo, Norway had the fastest 5G of any world capital, clocking in with a median download speed of 526.74 Mbps. Seoul, South Korea had the second fastest median download speed over 5G at 467.84 Mbps; Abu Dhabi, United Arab Emirates was third (421.26 Mbps); Doha, Qatar fourth (413.40 Mbps) and Stockholm, Sweden fifth (401.30 Mbps). Riyadh, Saudi Arabia (384.66 Mbps); Kuwait City, Kuwait (338.97 Mbps), Muscat, Oman (318.95 Mbps); Beijing, China (291.19 Mbps); and Taipei, Taiwan (287.86 Mbps); rounded out the top 10. Helsinki, Finland showed a median 5G download speed of 279.59 Mbps; Sofia, Bulgaria 260.55 Mbps; Canberra, Australia 258.39 Mbps; Bangkok, Thailand 253.73 Mbps; Manama, Bahrain 249.71; Dublin, Ireland 223.01; Luxembourg City, Luxembourg 209.98 Mbps; Paris, France 208.48 Mbps and Bucharest, Romania 203.44 Mbps.

We saw median 5G download speeds between 150 Mbps and 200 Mbps in the following world capitals during Q1-Q2 2021: Ottawa, Canada (196.11 Mbps); Hanoi, Vietnam (195.99 Mbps); Bratislava, Slovakia (188.23 Mbps); Madrid, Spain (183.37 Mbps); Bern, Switzerland (175.69 Mbps); Rome, Italy (171.79 Mbps); London, United Kingdom (167.50 Mbps); Tokyo, Japan (167.02 Mbps); Athens, Greece (164.95 Mbps); Copenhagen, Denmark (162.75 Mbps); Ljubljana, Slovenia (158.50 Mbps); Hong Kong (153.78) and Washington, D.C., United States (151.80 Mbps).

Cape Town, South Africa was the slowest world capital for 5G in Q1-Q2 2021

ookla_slowest_5g_download_speed_world_capitals_0721

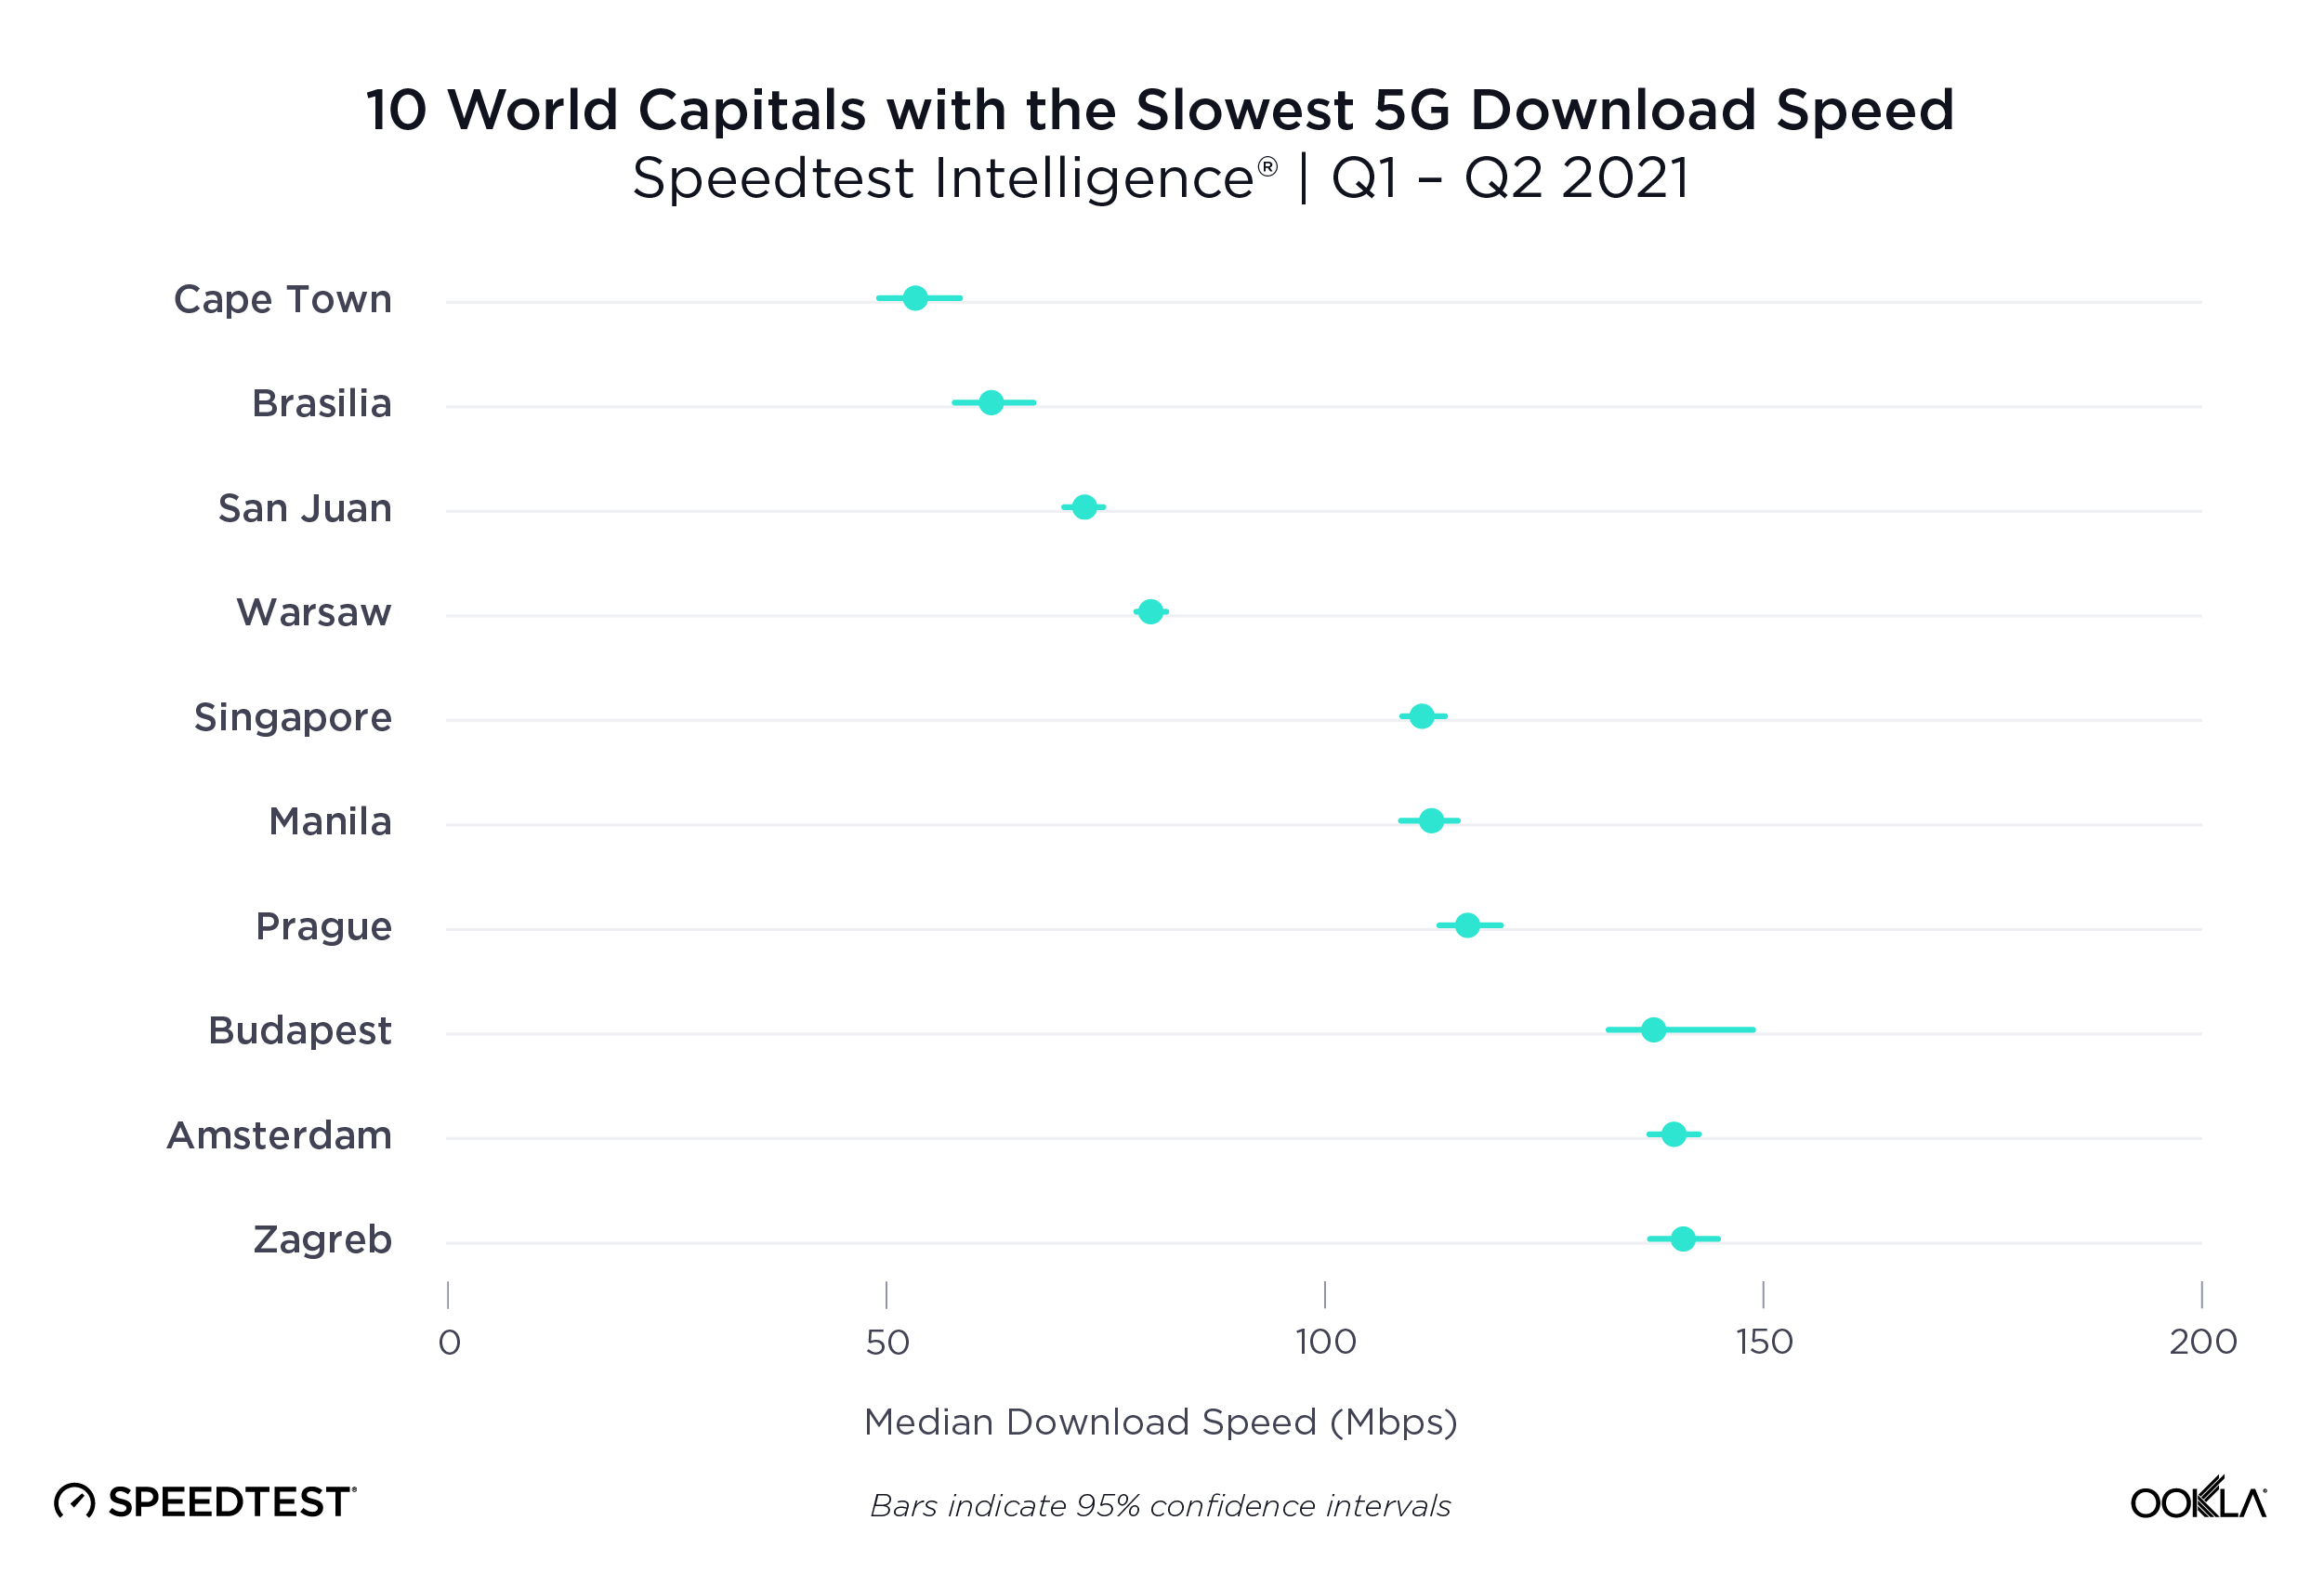
Speedtest Intelligence shows Capetown, South Africa had the slowest median download speed over 5G during Q1-Q2 2021 at 53.33 Mbps. Other world capitals with slower median 5G download speeds included: Brasilia, Brazil (62.18 Mbps); San Juan, Puerto Rico (72.59 Mbps); Warsaw, Poland (80.18 Mbps); Singapore (111.20 Mbps); Manila, Philippines (112.23 Mbps); Prague, Czechia (116.30 Mbps); Budapest, Hungary (137.54 Mbps); Amsterdam, Netherlands (139.75 Mbps); Zagreb, Croatia (140.92 Mbps); Vienna, Austria (144.93 Mbps); Jerusalem, Israel (145.17 Mbps); and Berlin, Germany (148.16 Mbps).

Capitals not mentioned on either of these lists did not have sufficient 5G samples during Q1-Q2 2021 to be included in this report.

The fastest 5G speeds are yet to come

5G is rapidly improving across the world and we’re eager to see how countries, cities and operators continue to perform during Q3 2021 and beyond. If you want to see how your 5G network performs against these benchmarks, please download the Android or iOS app, and take a Speedtest®. Learn more about 5G provider performance in select cities here, and visit the Ookla 5G MapTM to see which providers are offering 5G in your area.

Editor’s note: This article was updated on July 28 to reorganize the content for clarity.

Ookla retains ownership of this article including all of the intellectual property rights, data, content graphs and analysis. This article may not be quoted, reproduced, distributed or published for any commercial purpose without prior consent. Members of the press and others using the findings in this article for non-commercial purposes are welcome to publicly share and link to report information with attribution to Ookla.

| September 13, 2021

5G in the United Kingdom is Getting Faster and Boosting Consumer Sentiment


More and more communities are gaining access to 5G networks and speeds in the United Kingdom as operators expand 5G deployments across the nation. 3’s 5G network covers 30% of the “outdoor population”, Vodafone offers 5G service to 123 towns and cities, O2 has 5G in over 180 towns and cities and EE plans on having 5G provide “signal to over 90% of UK landmass” by 2028. Despite this progress, London achieved mediocre 5G speeds compared to other world capitals in our recent analysis.

Our 2020 U.K. report showed disparate 5G access across the U.K. despite improved speeds. So we used data from Ookla® Speedtest Intelligence® to examine Q1-Q2 2021 performance in the U.K. to see how 5G compares with major trading partners, how 5G is boosting speeds, which top operators have the fastest 5G and highest availability, how consumers are rating their network experience, what each U.K. country’s 5G performance and availability is, and the fastest cities in the U.K. for 5G.

The U.K. is ahead of European trade partners for 5G, can’t beat South Korea and China

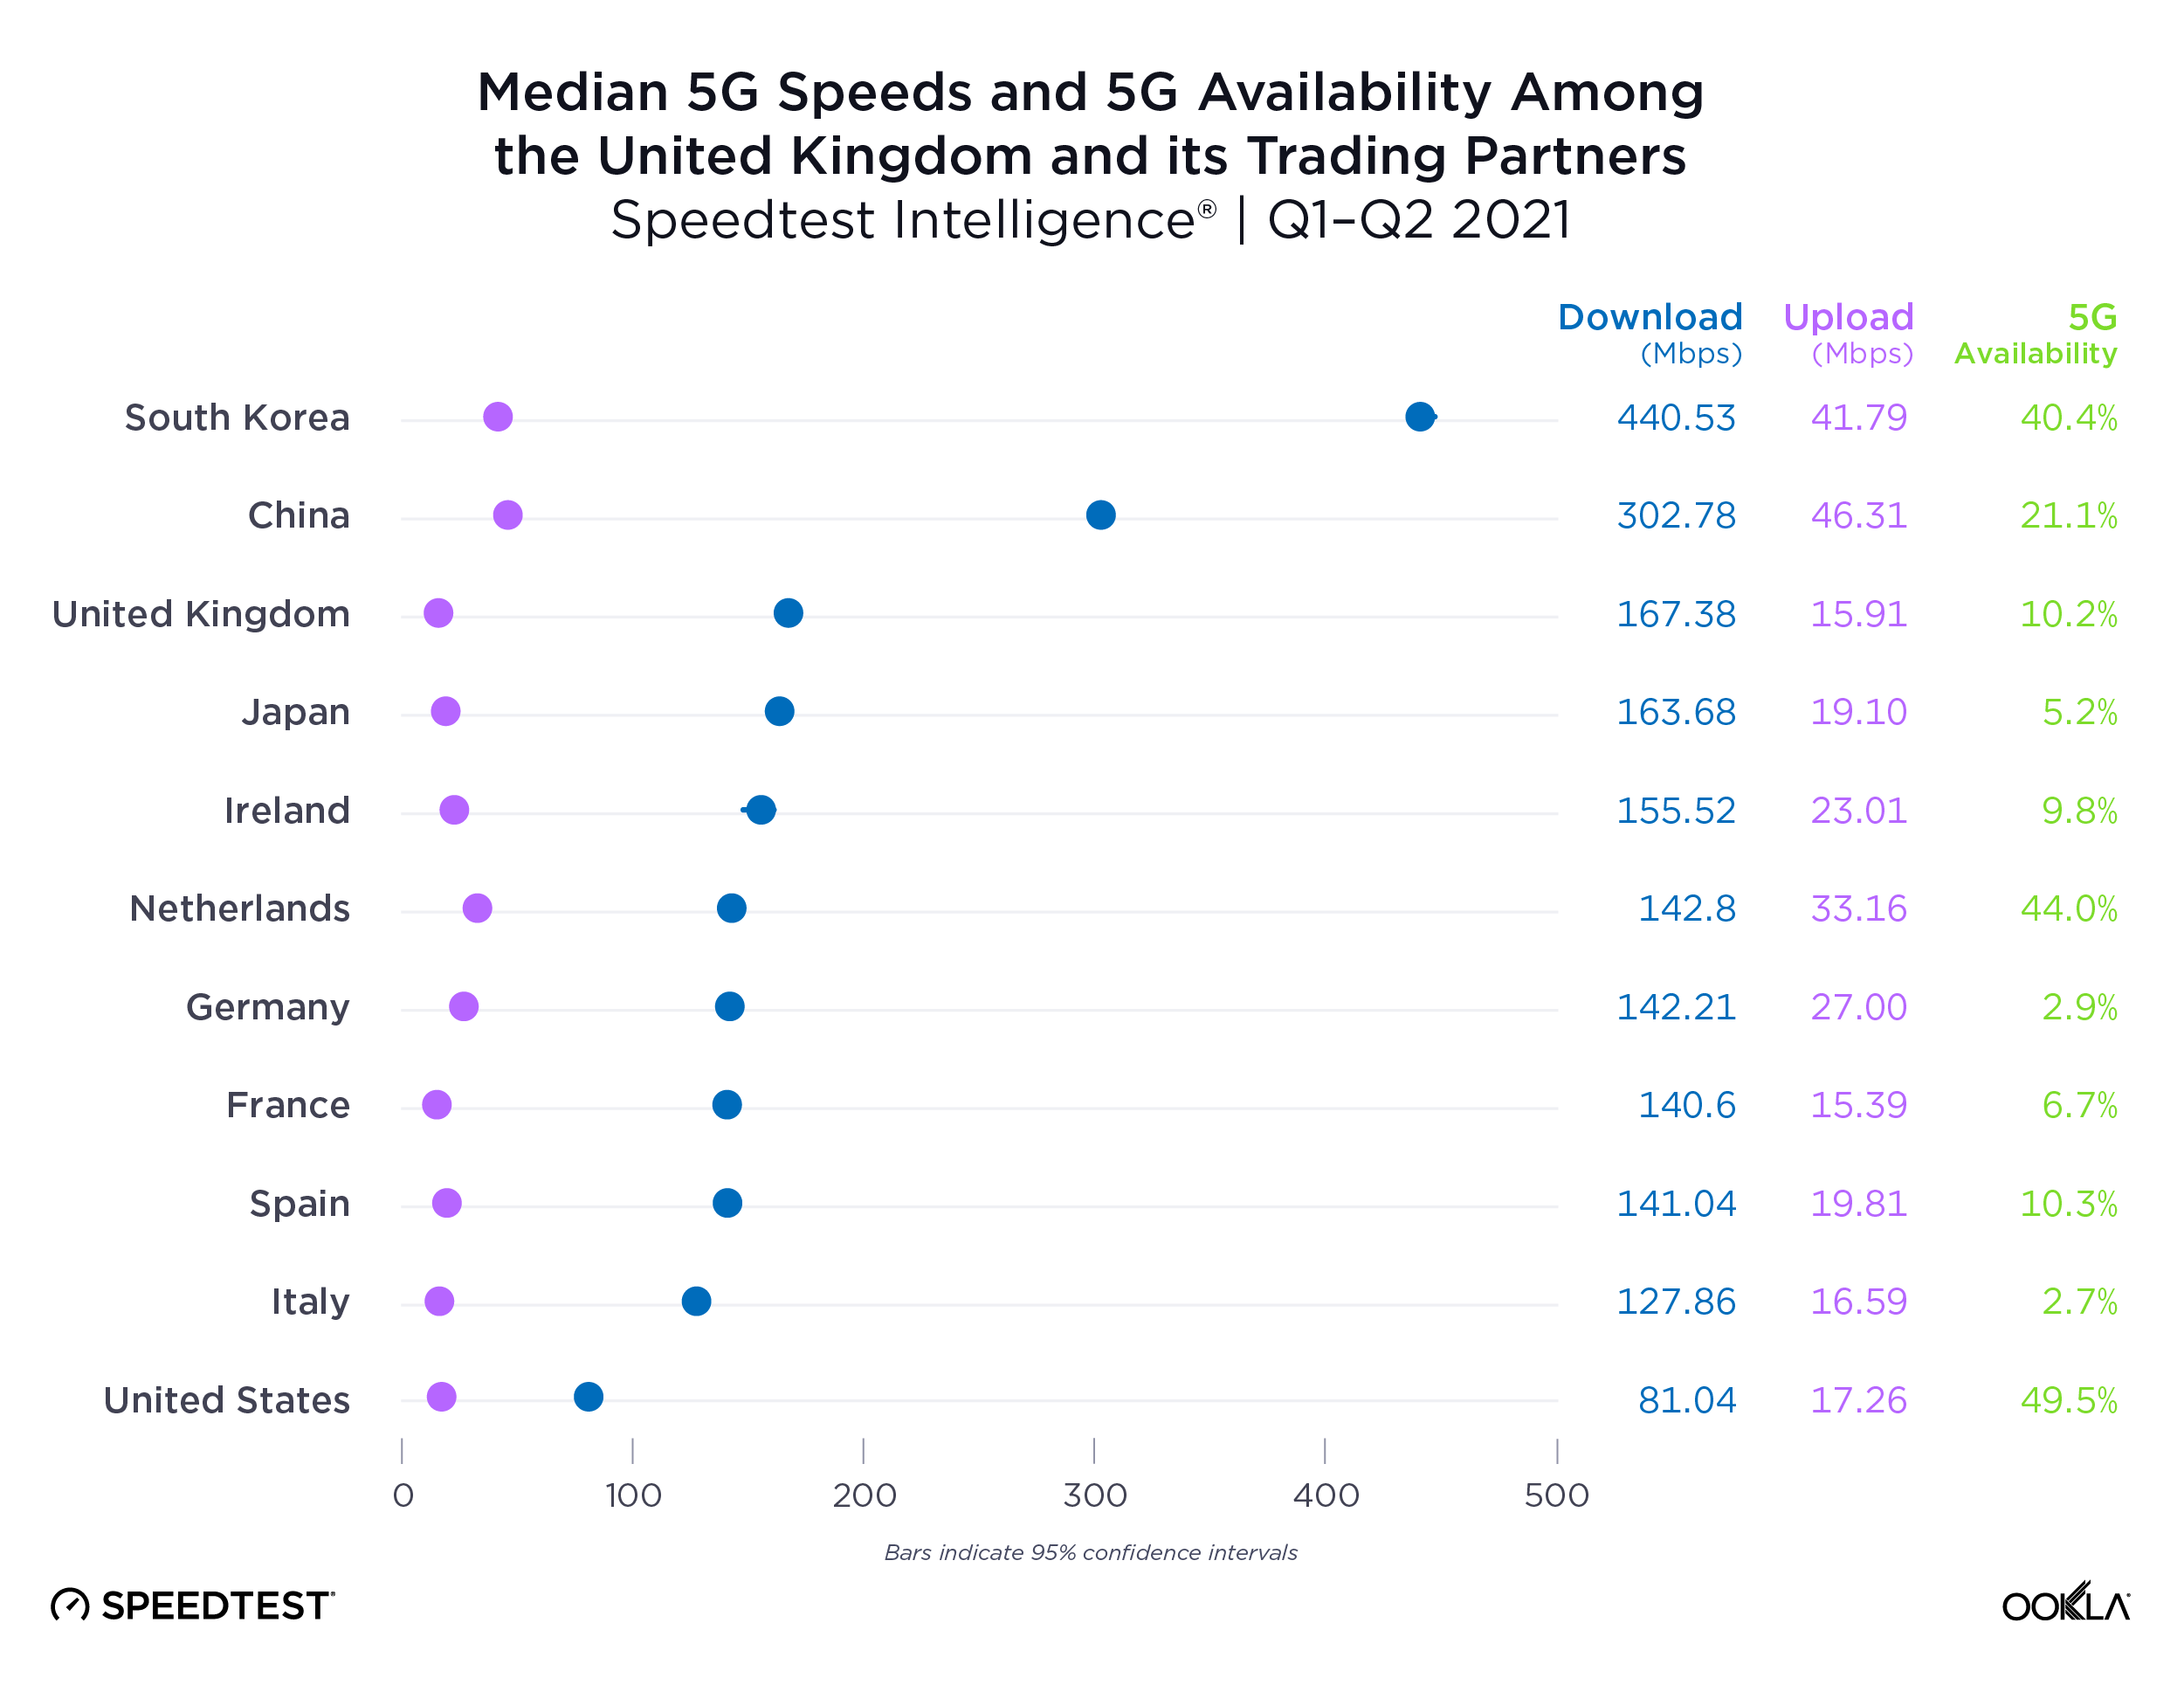
ookla_speedtest_median_5g-speed_availability_uk_0921
Speedtest Intelligence found South Korea and China had the fastest median 5G download speeds among the U.K’s top trading partners at 440.53 Mbps and 302.78 Mbps, respectively, during Q1-Q2 2021. The U.K. had the next fastest download speed on the list at 167.38 Mbps, edging out Japan (163.68 Mbps). The United States had the slowest 5G download speed among the U.K.’s top trading partners with a median of 81.04 Mbps. China had the fastest median 5G upload speed on the list at 46.31 Mbps, followed by South Korea (41.79 Mbps) and the Netherlands (33.16 Mbps). Upload speed in the U.K. lagged behind every other top trading partner except France at 15.91 Mbps.

The U.K. is far behind trading partners for 5G Availability

Speedtest Intelligence shows a wide divide between 5G Availability in these nations during Q1-Q2 2021. The U.S. led the way with 49.5% of consumers with 5G capable devices experiencing 5G connections a majority of the time. The Netherlands was second at 44.0% and South Korea third at 40.4%. The U.K. landed squarely in the middle of the list with 10.2% 5G Availability.

5G is helping to lift stagnant mobile download speeds

ookla_median-mobile-download-speeds_uk_0921-1

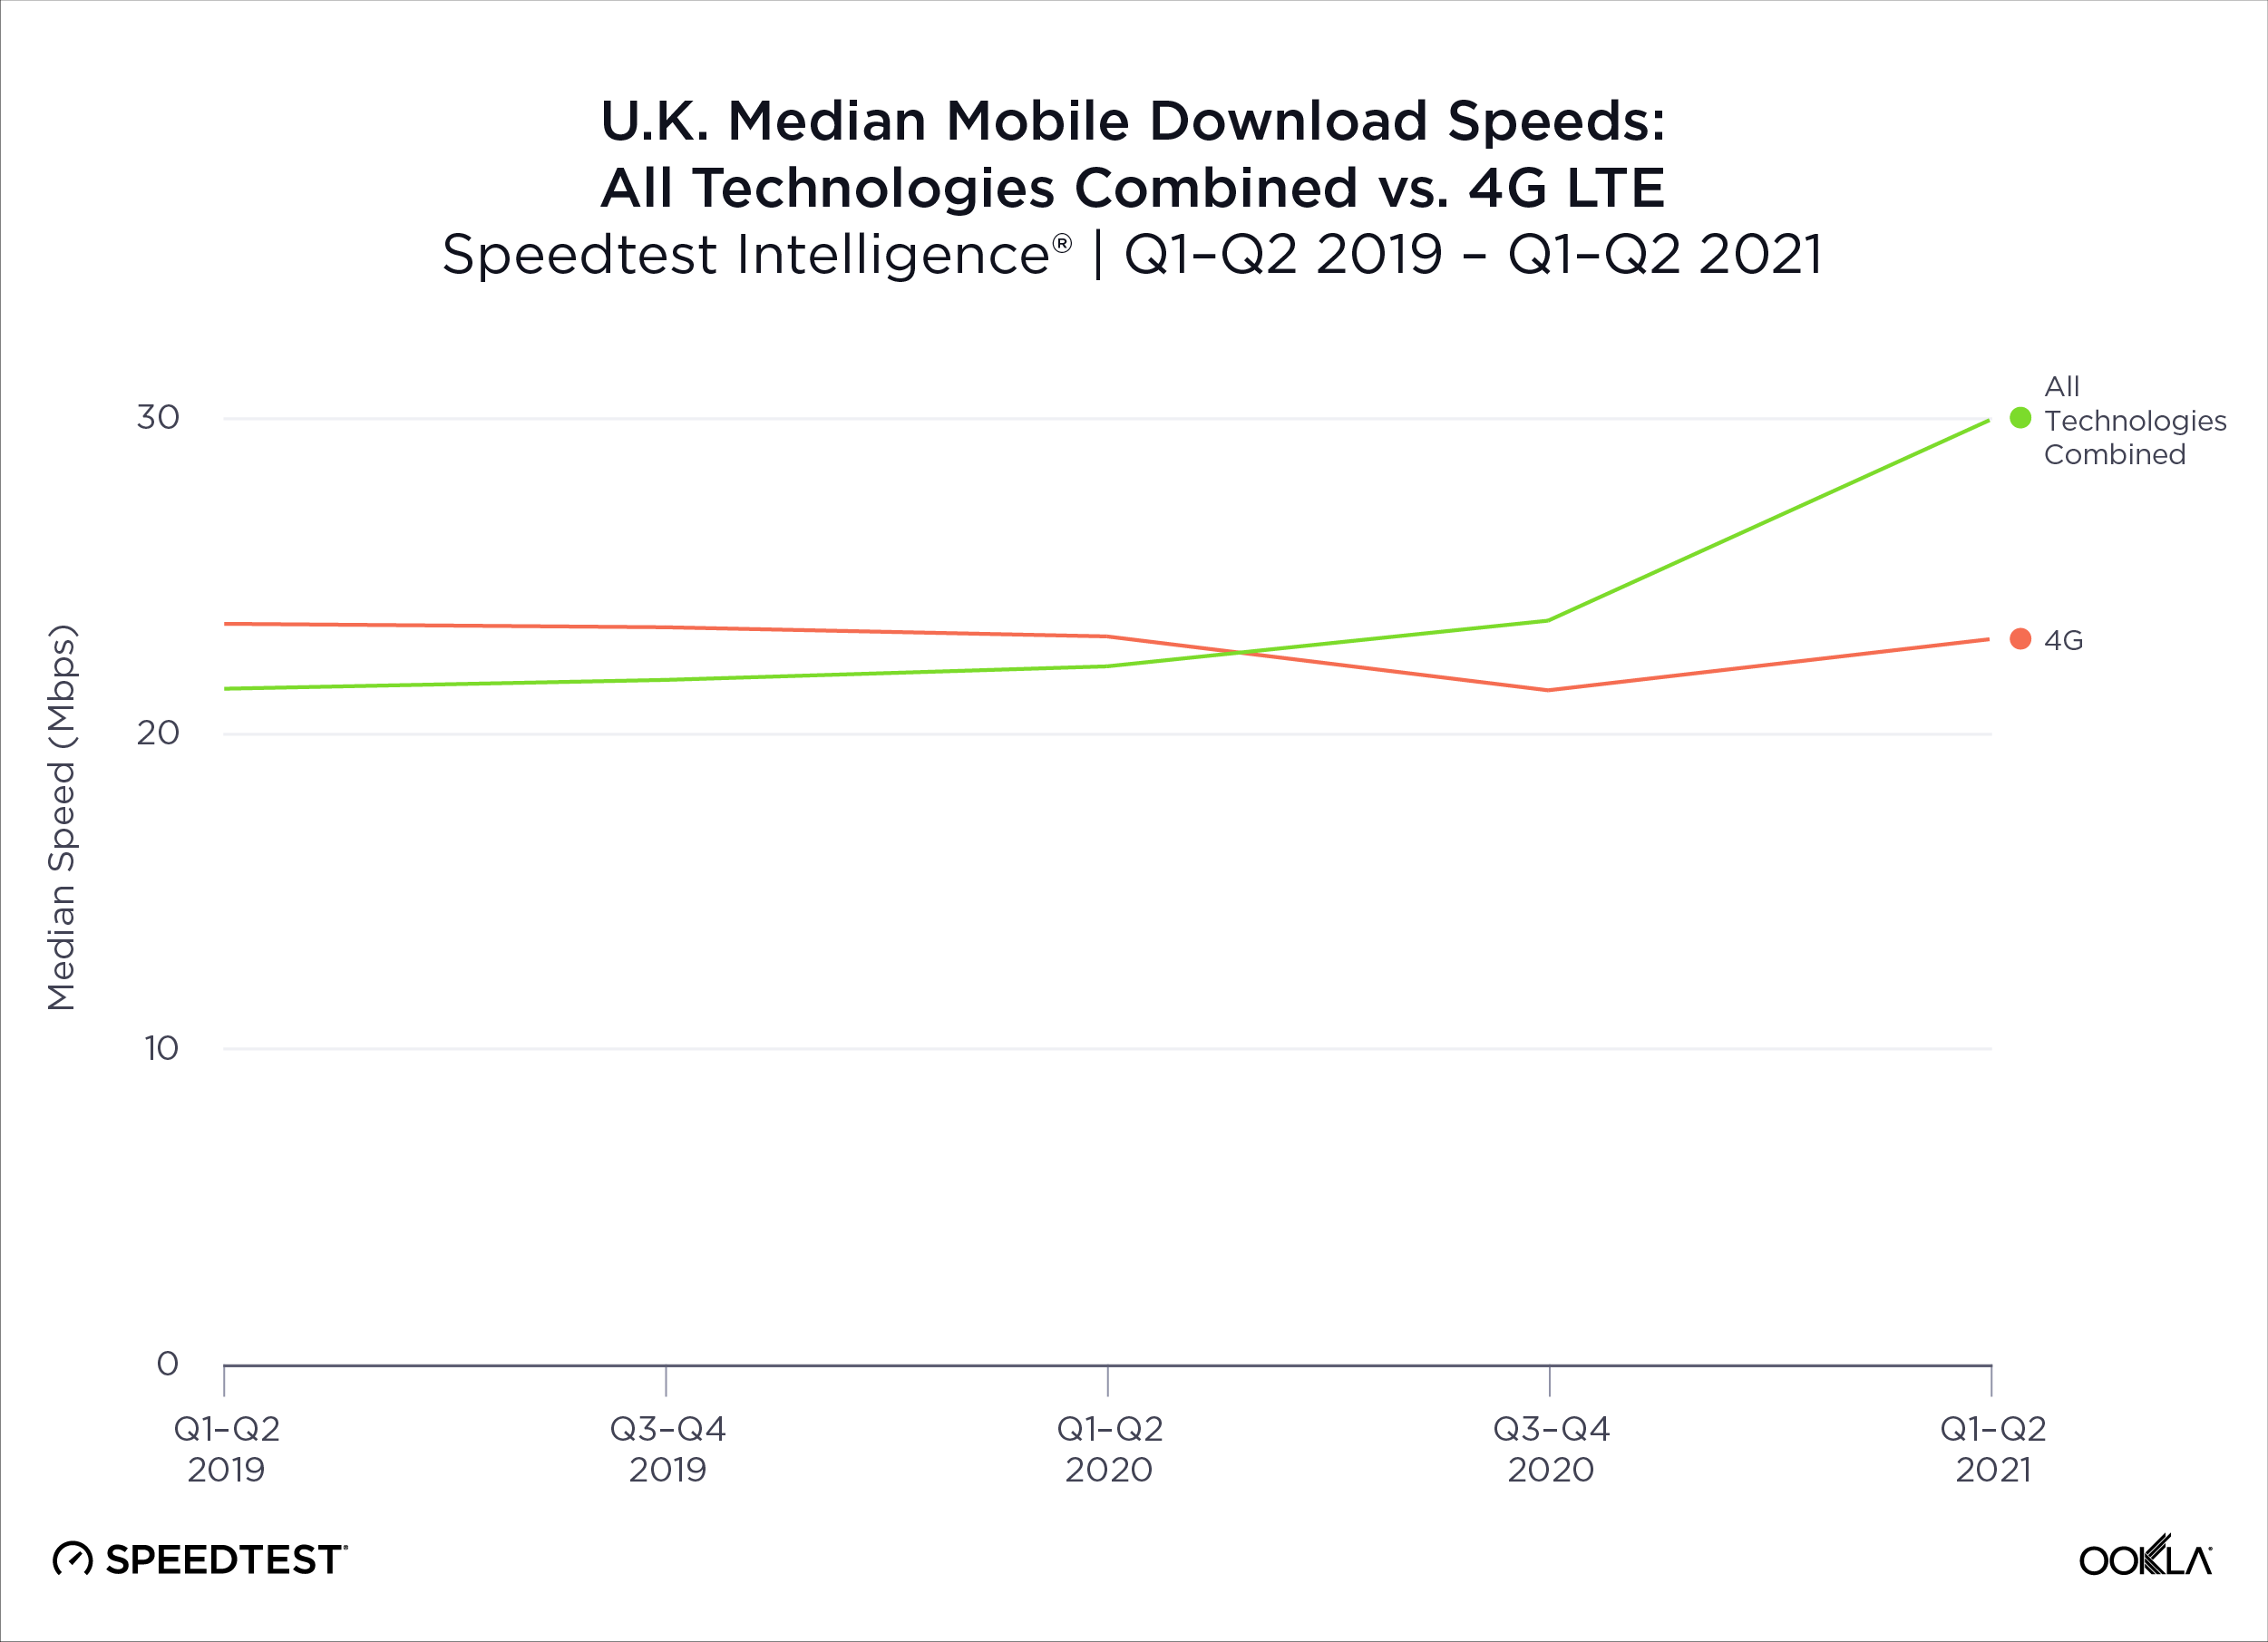
Q1-Q2 2021 marked a noticeable upward trend in median download speed over all technologies in the U.K. after two years of stagnant speeds. Q1-Q2 2019 started at 21.44 Mbps and speeds began rising as late as Q3-Q4 2020 to 23.60 Mbps before further increasing to 29.96 Mbps in Q1-Q2 2021. During this same period, 4G LTE download speeds remained nearly constant: starting at 23.50 Mbps in Q1-Q2 2019 and decreasing slightly over time to 23.01 Mbps during Q1-Q2 2021.

This boost in the U.K. during Q1-Q2 2021 is due to a giant surge in consumers switching to 5G service. According to Speedtest Intelligence, nearly seventy thousand more customers performed a Speedtest® over 5G in Q1-Q2 2021 than in Q3-Q4 2020. 5G is inherently faster, which boosts median download speeds and we suspect speeds will continue to improve as network operators continue to build out their 5G networks to reach more and more customers.

3 had the fastest median 5G download speed in the U.K., EE had the highest 5G Availability

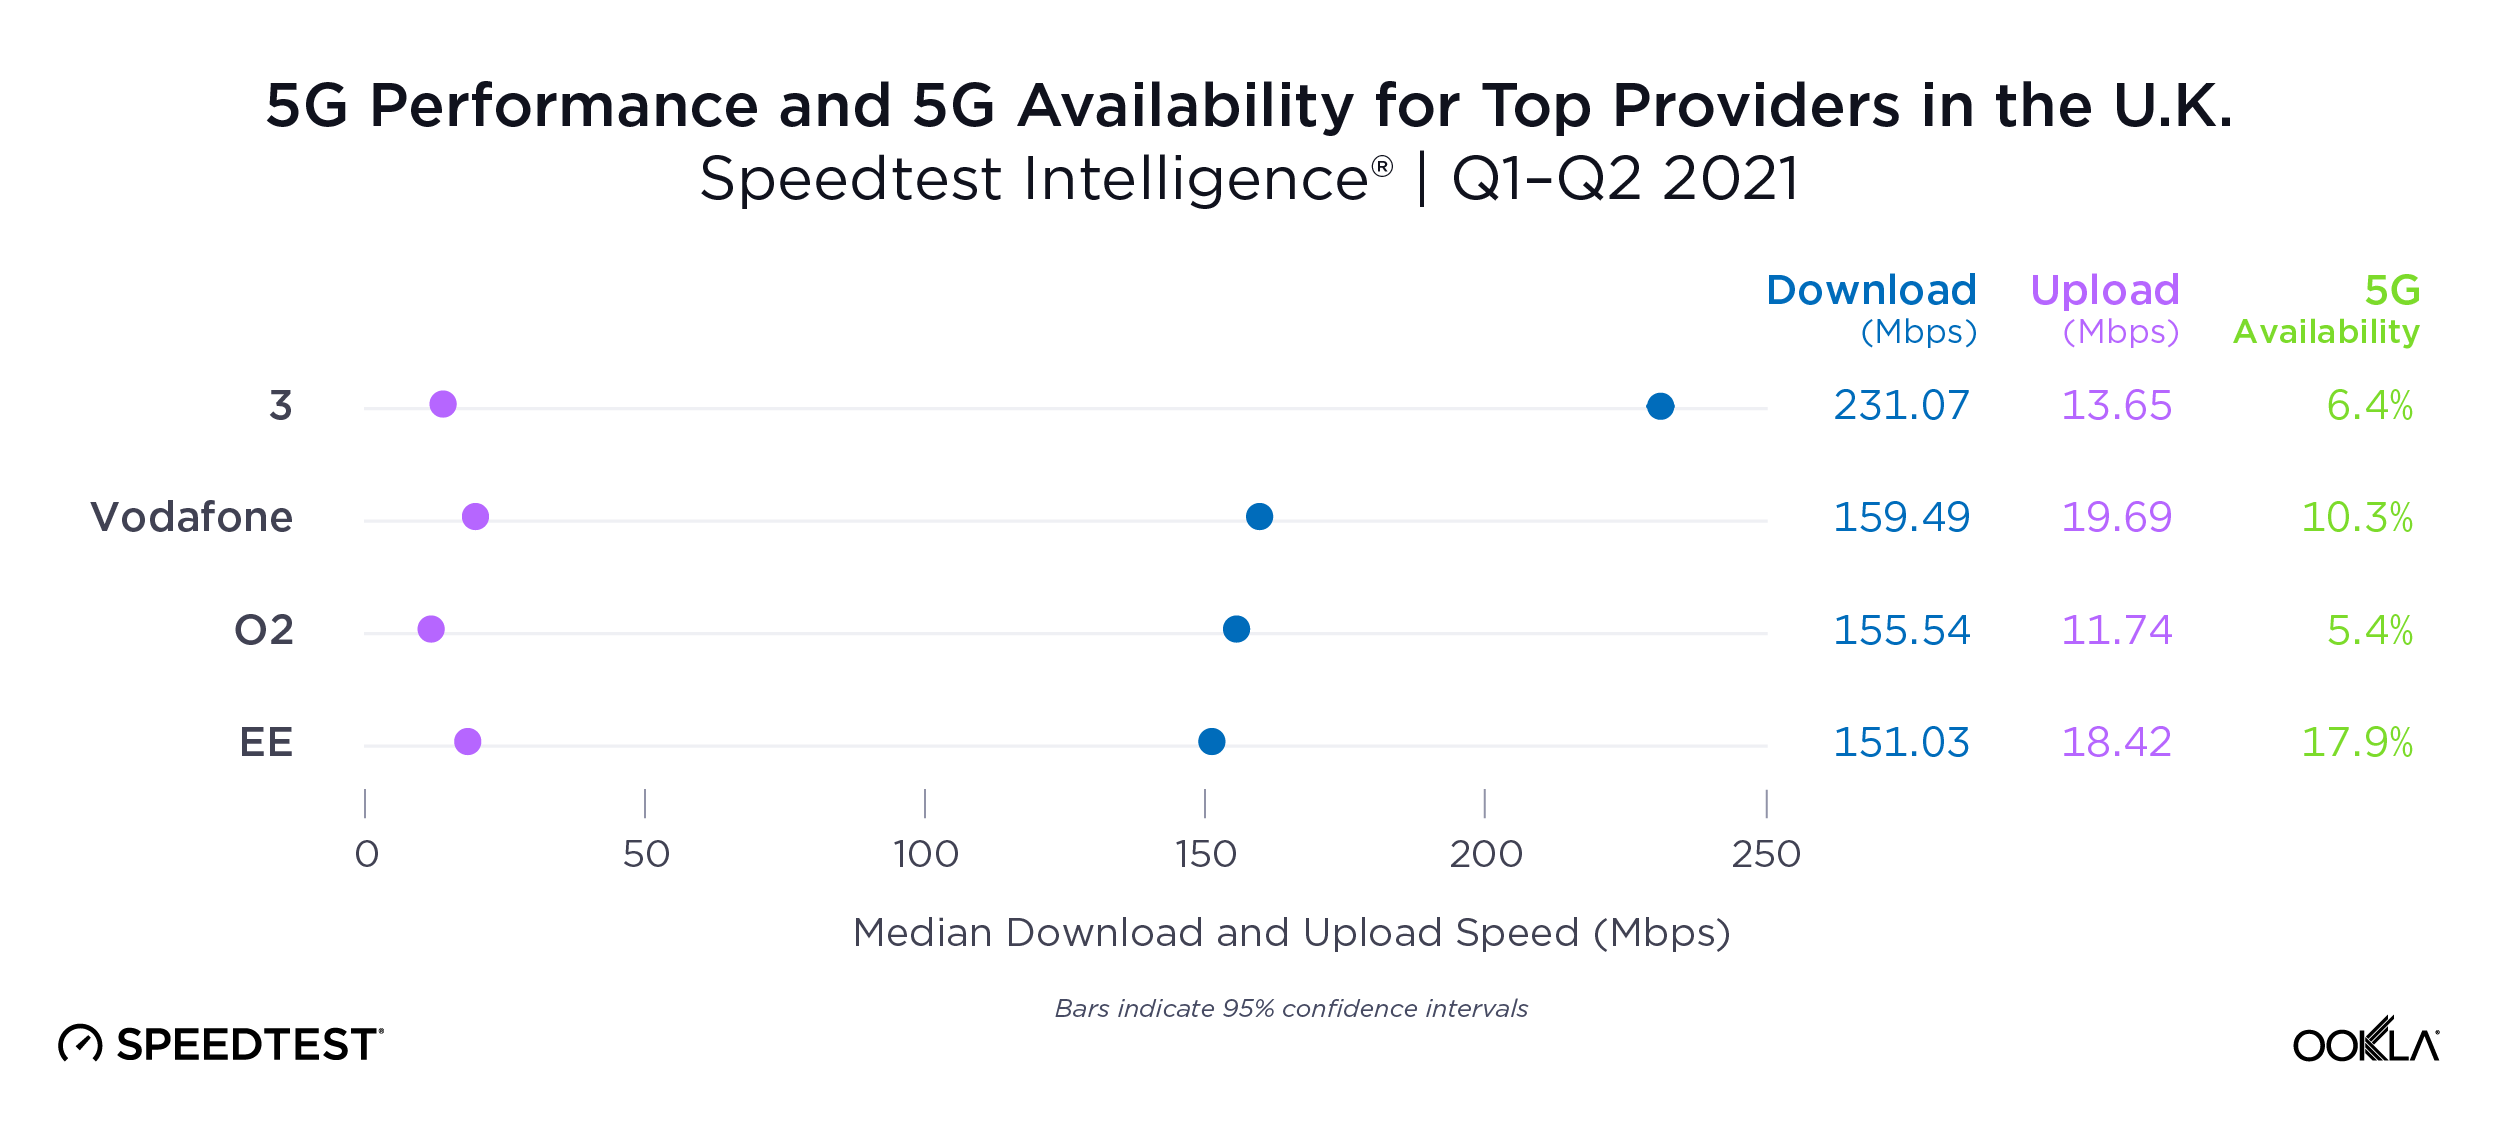
ookla_5g_performance_providers_uk_0921

Speedtest Intelligence revealed a decisive win for U.K. operator 3 during Q1-Q2 2021, with a median 5G download speed of 231.07 Mbps. Vodafone followed at 159.49 Mbps, O2 was next at 155.54 Mbps and EE last at 151.03 Mbps. Vodafone had the fastest median 5G upload at 19.69 Mbps during Q1-Q2 2021, followed by EE (18.42 Mbps), 3 (13.65 Mbps) and O2 (11.74 Mbps).

EE had the best 5G Availability at 17.9%. Vodafone was next at 10.3%, 3 followed (6.4%) and O2 was last (5.4%).

Consumers in the U.K. on 5G are more satisfied with their provider than those on 4G

ookla_nps_providers_uk_0921

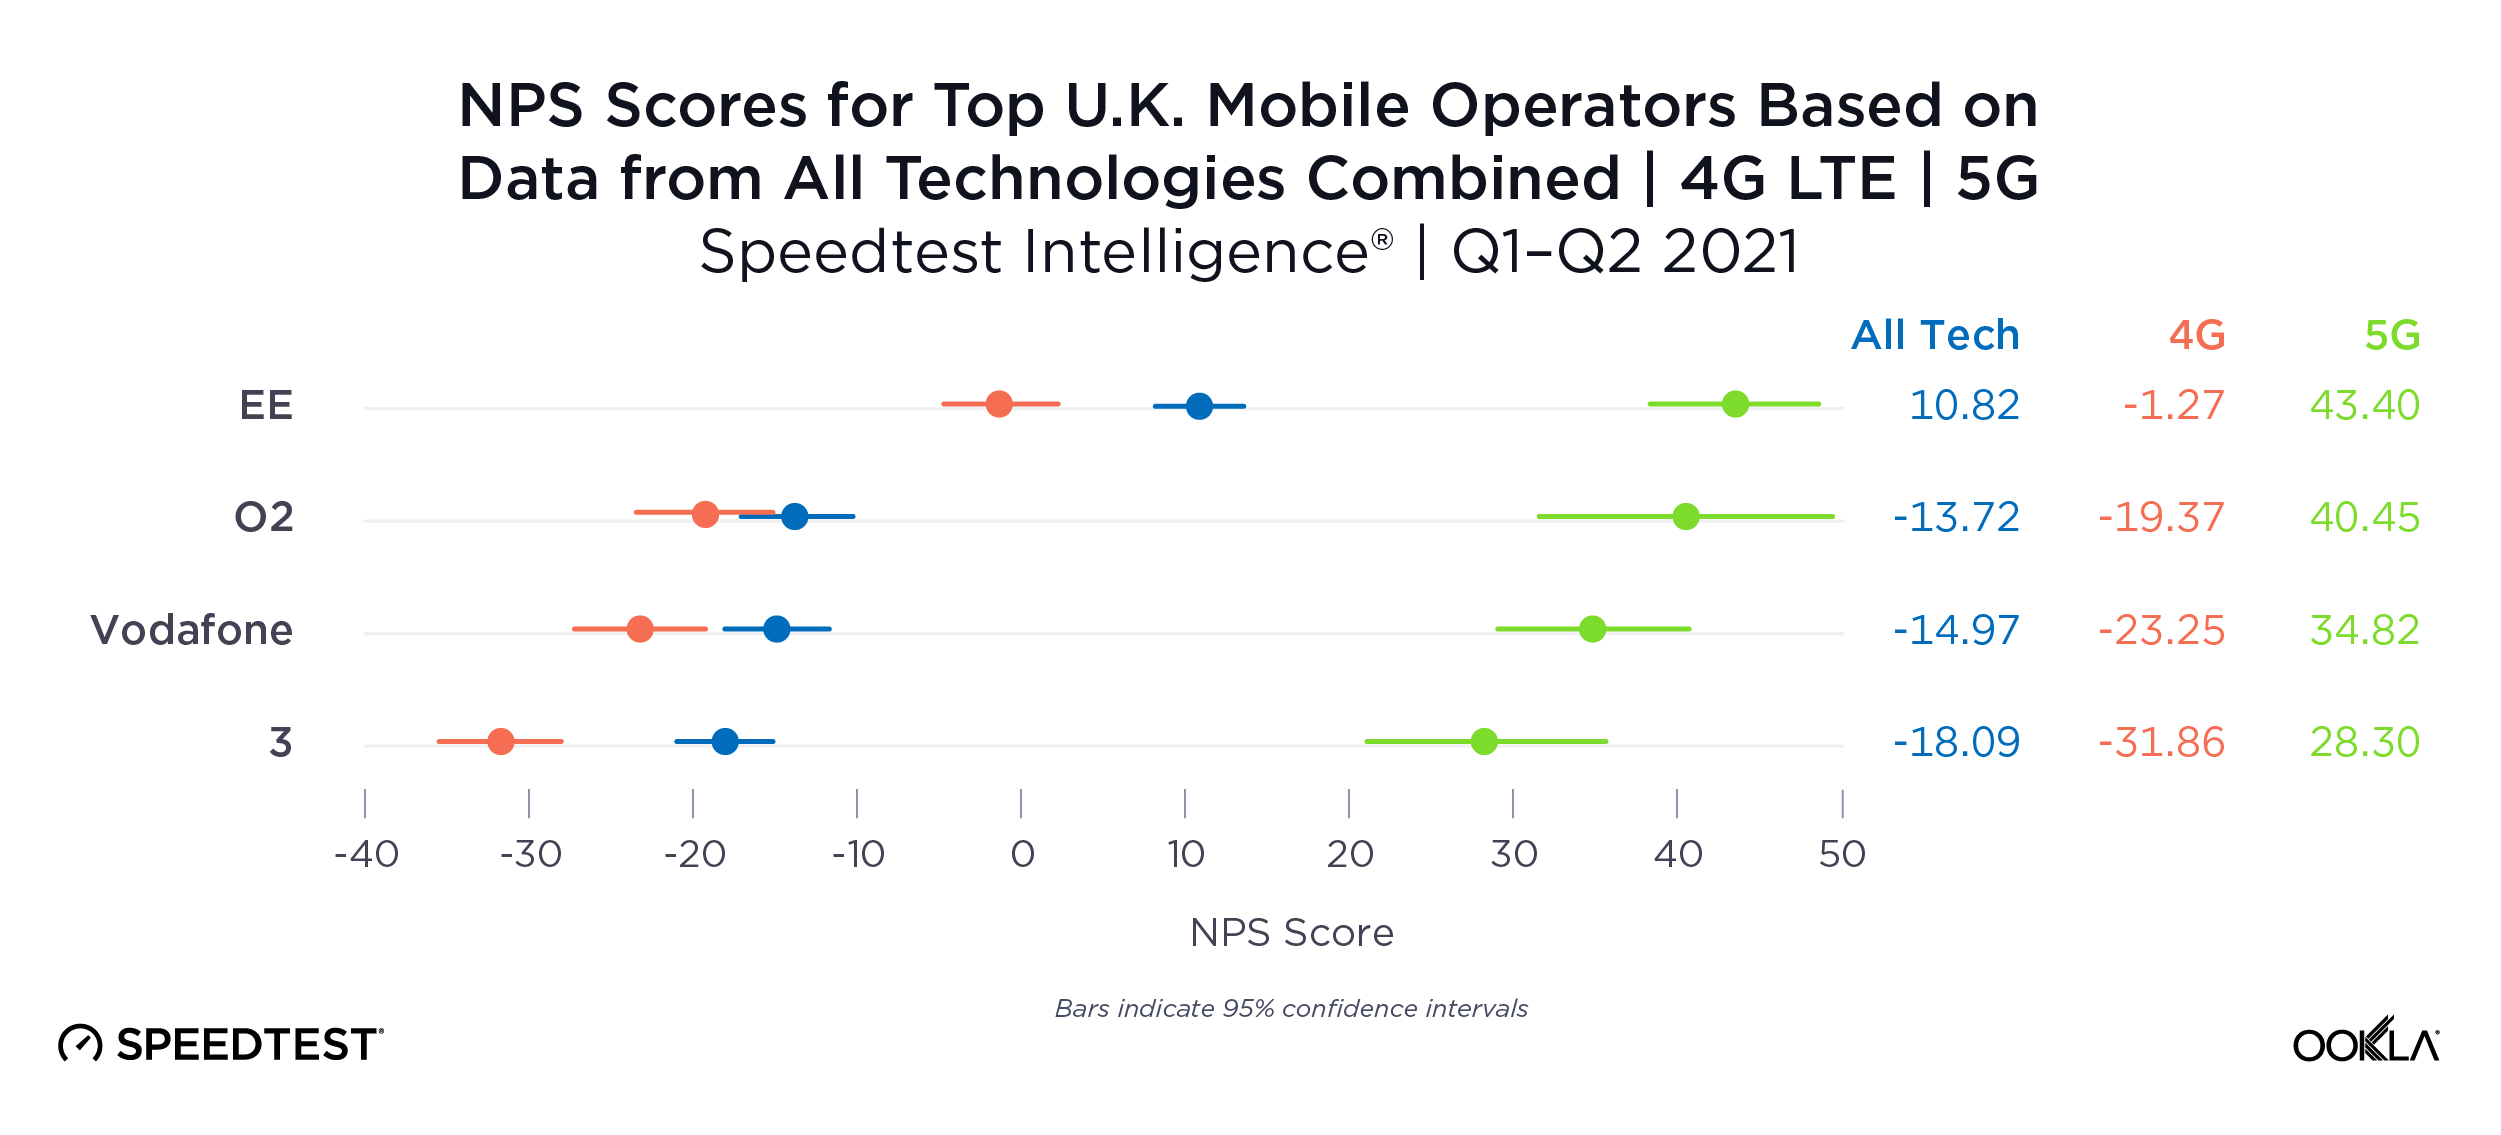
Speedtest Consumer Sentiment gauges customer satisfaction with their mobile operator’s service. After users take a Speedtest, we ask them how likely they are to recommend their provider to friends or family on a 0 to 10 scale. These Net Promoter Score (NPS) ratings are categorized into Detractors (score 0-6), Passives (score 7-8), and Promoters (score 9-10). NPS is calculated as (% Promoters – % Detractors) x 100. Any NPS score above 0 indicates that a provider’s audience is more loyal than not.

During Q1-Q2 2021, EE received the only positive NPS among mobile operators at 10.82. O2 followed at -13.72, Vodafone was next at -14.97 and 3 was last at -18.09.

When we split NPS out by the technology users were on when they responded, those numbers all shifted negatively for users on 4G LTE, with EE shifting into negative territory (-1.27 from 10.82), O2 dropping slightly (-19.37 from -13.72), while Vodafone dropped from -14.97 to -23.25 and 3 dropped from -18.09 to -31.86.

When looking at NPS scores only from 5G results, NPS improves enormously for every operator, with EE earning an NPS of 43.40, which was followed by O2 (40.45), 3 (34.82) and Vodafone (28.30). It’s clear: consumers using 5G are much happier with their mobile experience.

Scotland had the fastest 5G download speed among U.K. countries, England had the highest 5G Availability

ookla_mobile_performance_uk_map_0921

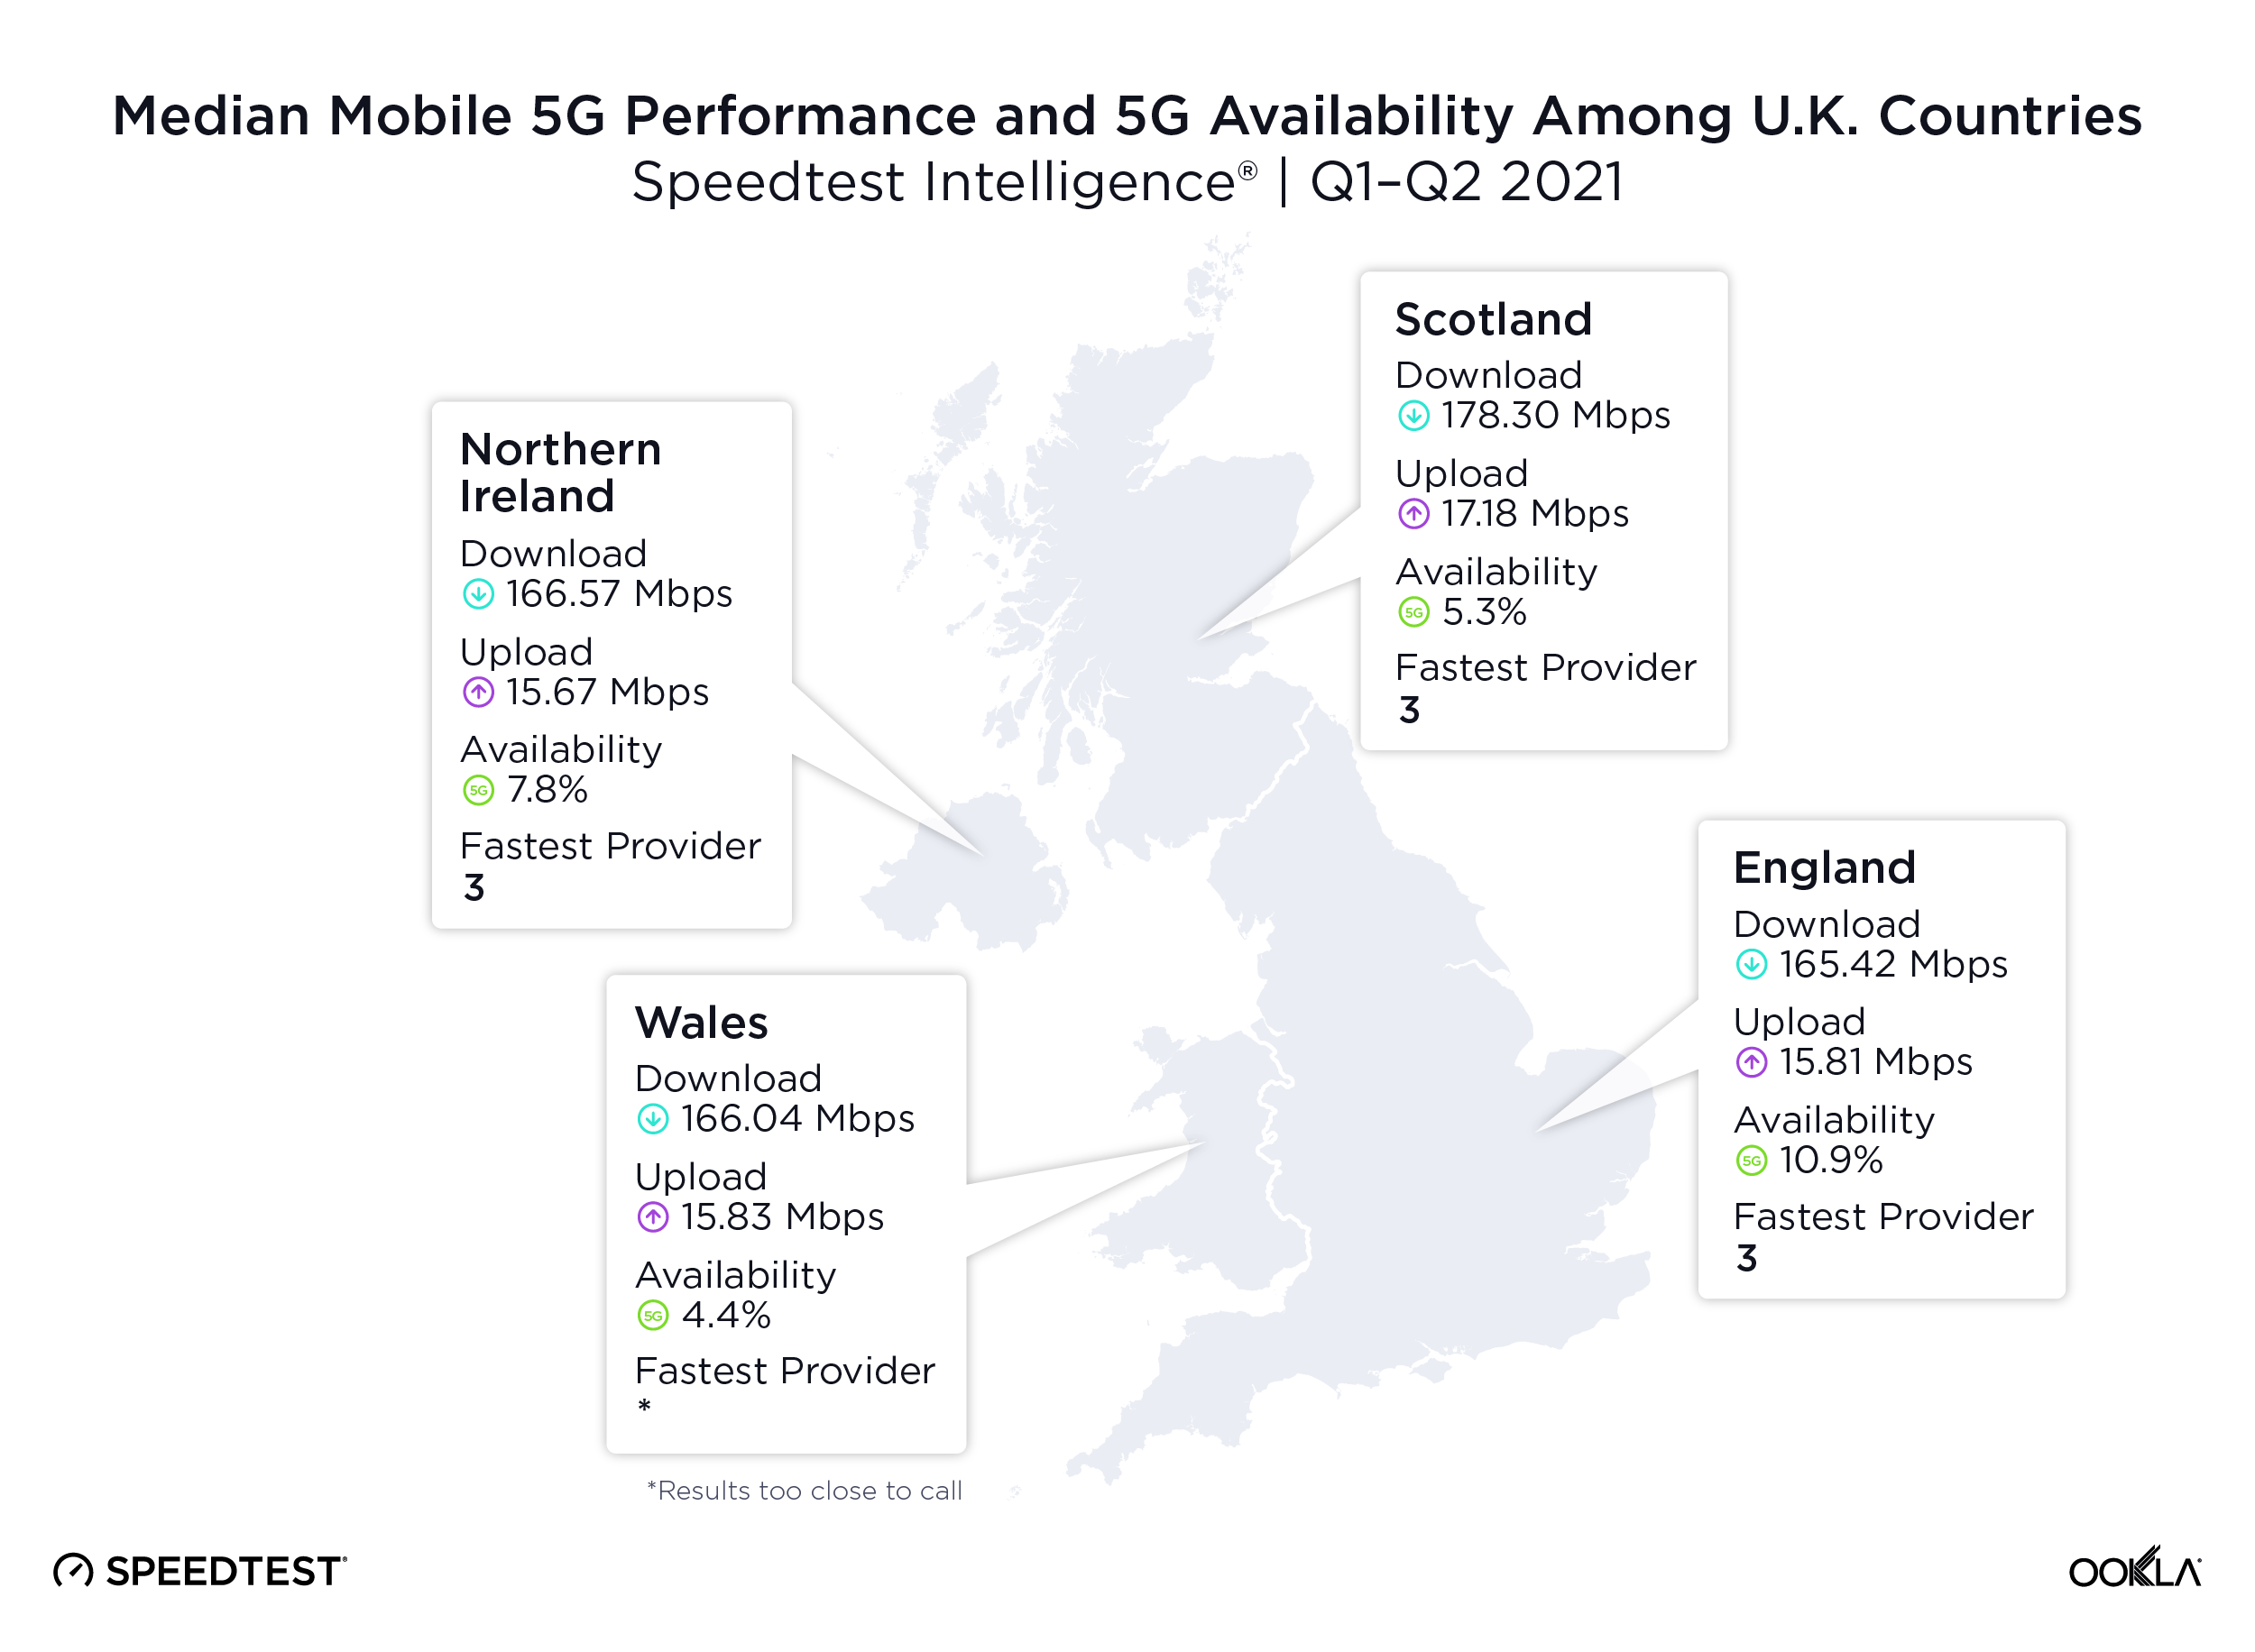
Scotland had the fastest median 5G speeds in the U.K. during Q1-Q2 2021 at 178.30 Mbps download and 17.18 Mbps upload. Northern Ireland followed at 166.57 Mbps (15.67 Mbps upload) along with Wales at 166.04 Mbps (15.83 Mbps upload). England, which has a much higher 5G usage, had a median 5G download speed of 165.42 Mbps (15.81 Mbps upload).

England led for 5G Availability among U.K. countries at 10.9%. Northern Ireland followed at 7.8%, Scotland was next at 5.3% and Wales was last at 4.4%.

3 had the fastest 5G download speeds in England, Scotland and Northern Ireland. EE had the best 5G Availability in England

Mobile operator 3 achieved the fastest median 5G download speeds in three U.K. countries during Q1-Q2 2021: England, Northern Ireland and Scotland. Utilizing C-band spectrum across the U.K., 3 achieved median 5G download speeds of 232.39 Mbps in England, 379.41 Mbps in Northern Ireland and 220.10 Mbps in Scotland. Wales didn’t reach our statistical threshold for analysis.

Vodafone had the fastest median upload speeds in England (19.68 Mbps). Scotland was too close to call, though Vodafone had a median upload speed of 21.23 Mbps while EE was at 20.71 Mbps. Northern Ireland was also too close to call for median upload speed with 3 at 20.16 Mbps and EE at 20.08 Mbps.

EE had the highest 5G Availability in England at 19.5%, while Scotland was too close to call. Northern Ireland and Wales showed too few samples to be analyzed for 5G Availability.
Glasgow had the fastest 5G among the U.K.’s major cities during Q1-Q2 2021

ookla_fastest_5g_download_speed_uk_0921-1
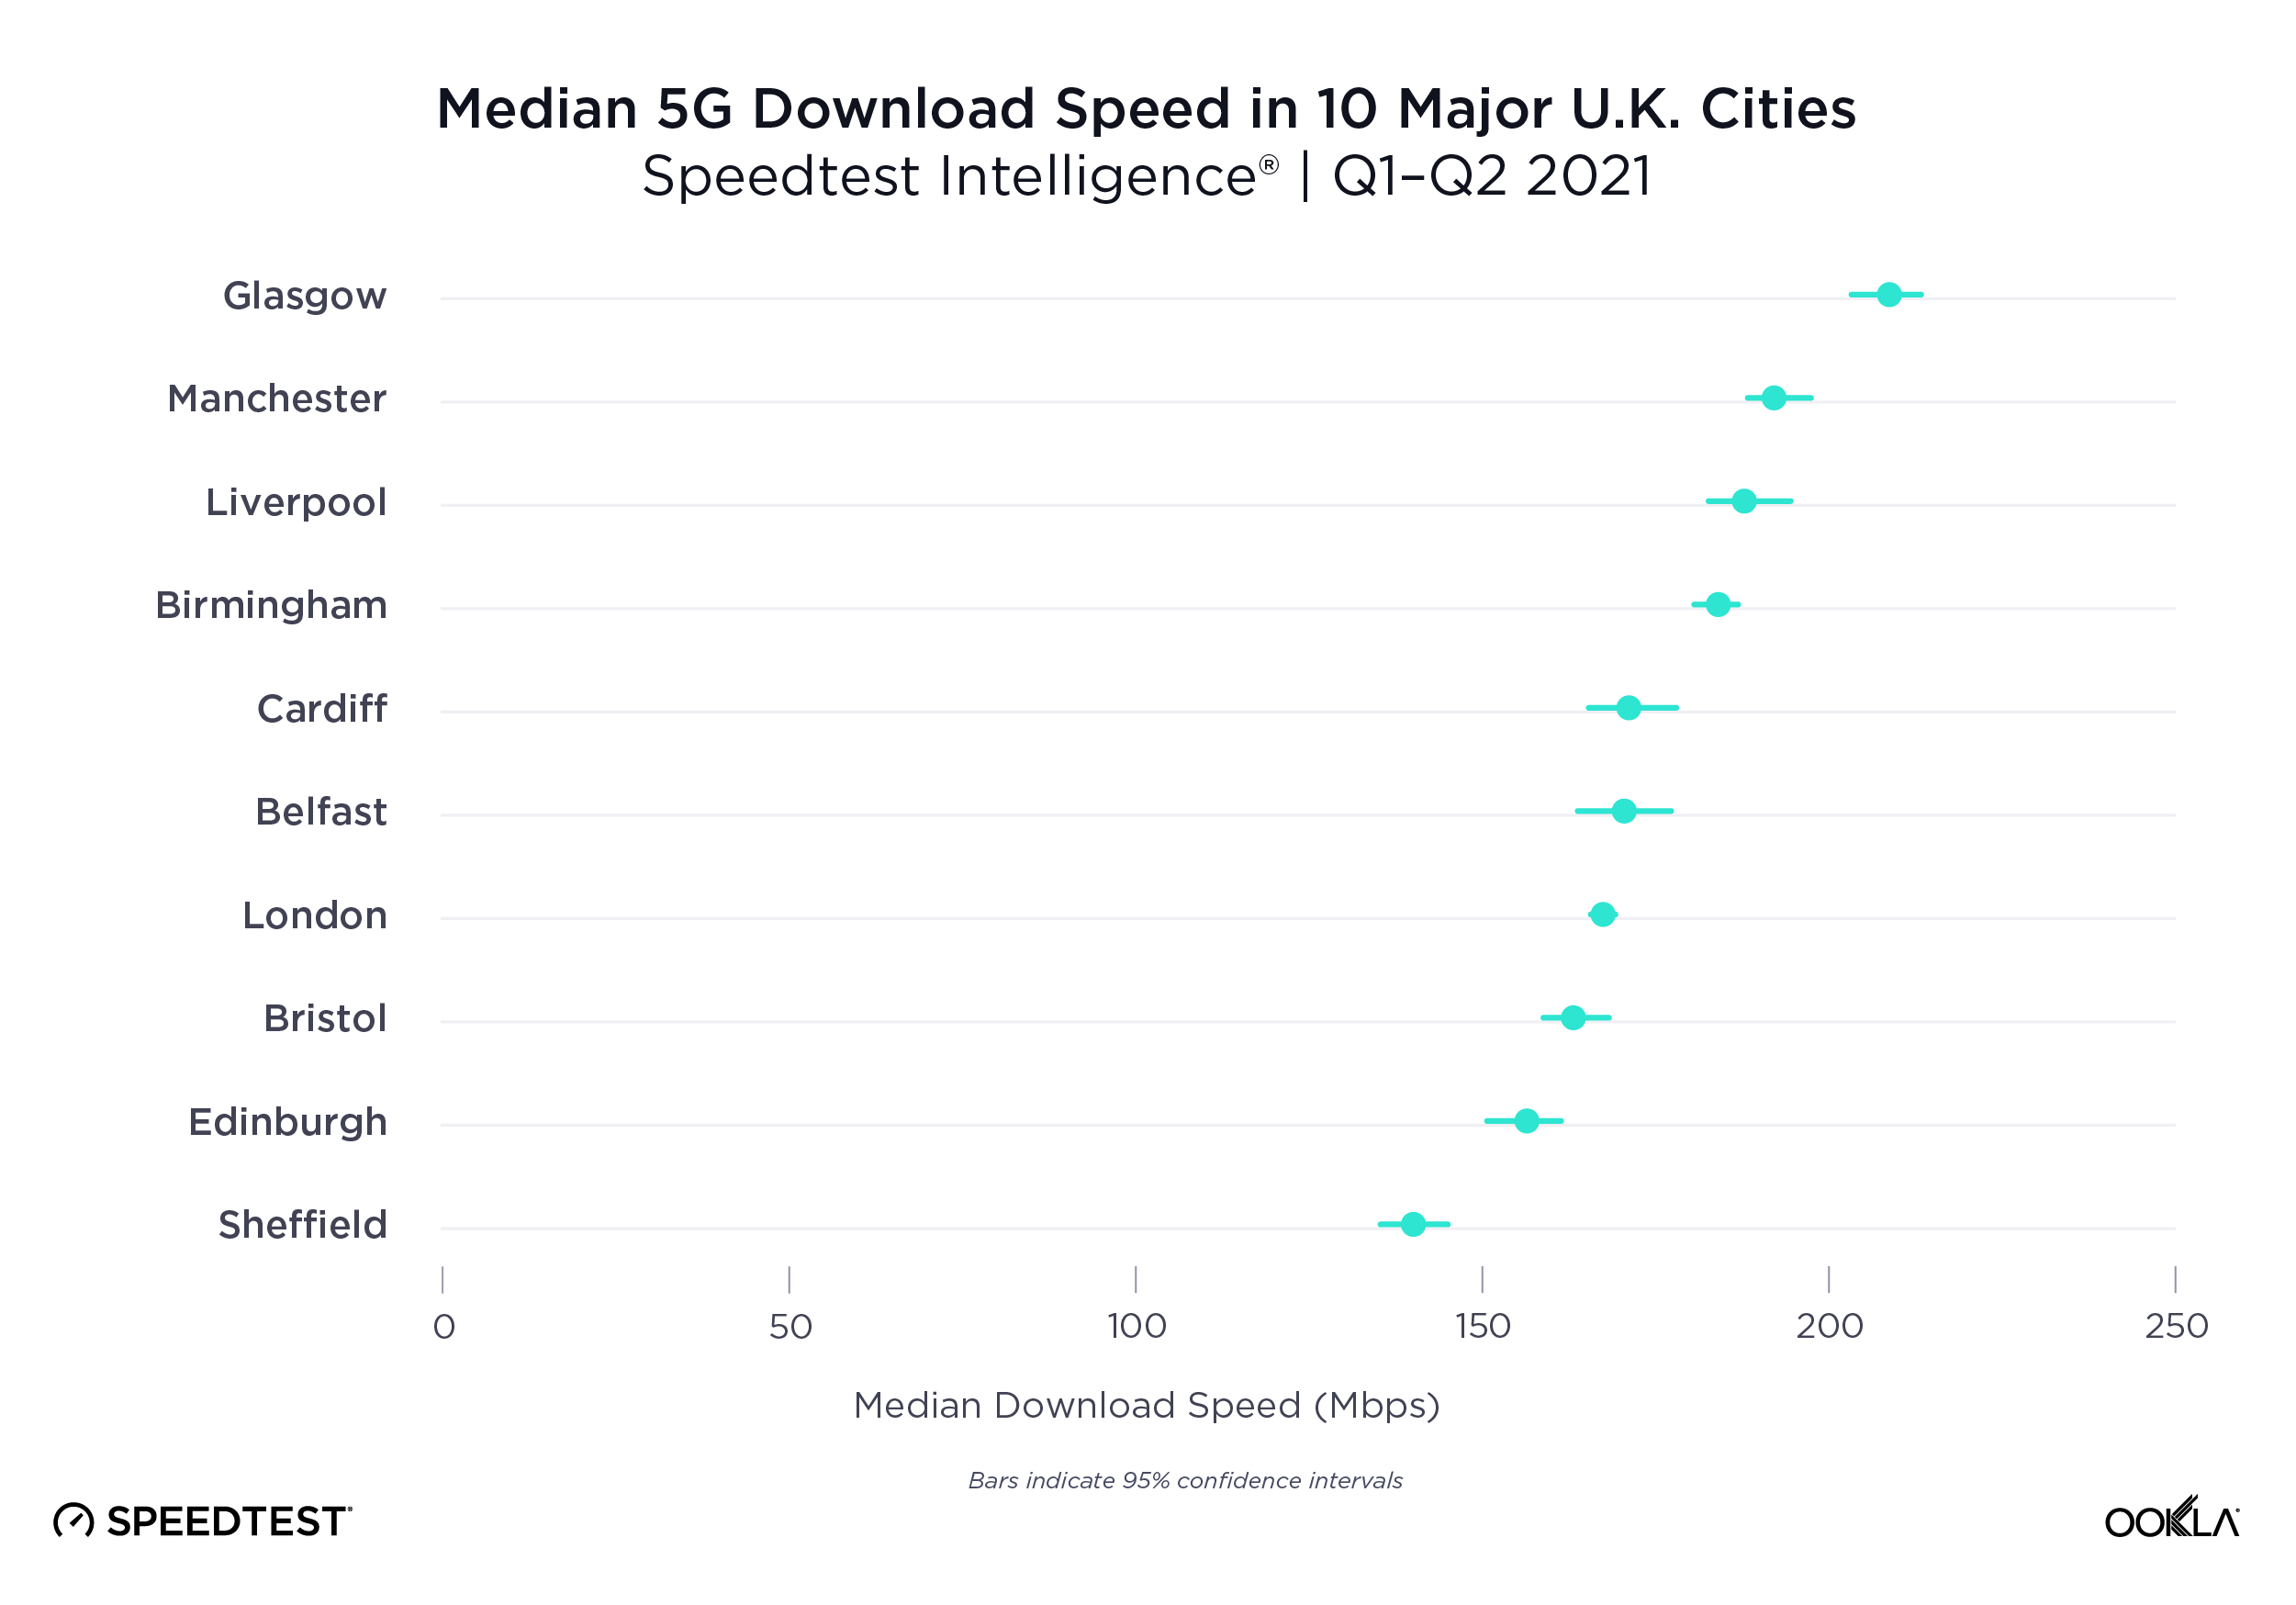
Examining 5G performance in 10 major cities in the U.K. during Q1-Q2 2021, Speedtest Intelligence revealed Glasgow had the fastest median 5G download at 208.80 Mbps. Manchester had the second fastest download on this list at 192.24 Mbps, followed by Liverpool. Sheffield had the slowest 5G download. London’s median 5G download speed trailed most major cities at 167.50 Mbps.

There was no statistically fastest upload speed among the U.K.’s major cities, though Glasgow and Manchester led at 21.43 Mbps and 20.60 Mbps, respectively.

Future of 5G experience in the U.K.

While the arrival of 5G in the U.K. has brought faster speeds to consumers, we’re also seeing an acceleration in moves by the government and network operators to drive further improvements in network coverage and performance.

In March 2021, Ofcom awarded spectrum via auction in the 700 MHz and 3.6-3.8 GHz bands, with EE, O2 and Vodafone all increasing their C-band spectrum holdings, and 3, EE and O2 winning spectrum in the 700 MHz band. The award of the U.K.’s remaining C-band spectrum to mobile operators will help boost 5G performance, and Ofcom has allowed them to trade spectrum in order to help defragment U.K. operators’ C-band holdings. Shortly after the auction, O2 and Vodafone announced they had reached a spectrum trading deal resulting in holdings that are closer and/or contiguous and therefore offer greater performance.

The allocation of the U.K.’s 700 MHz spectrum band, with its superior propagation properties, will be critical in helping the government deliver on its promise of majority (U.K. population) 5G coverage by 2027. In addition, the government has proposed changes to laws in England which seek to speed up network deployment and increase coverage. These include allowing increases to cell mast height and width, the use of building-based sites closer to highways and relaxing rules on the placement of radio equipment cabinets.

Spectrum refarming will be incredibly important for the U.K. as operators begin to sunset spectrum in favor of 5G, but until that happens, we suspect 5G speeds won’t accelerate at the same rate we’ve seen in other countries like South Korea and China.

Until then, we’ll be closely monitoring data in the U.K. and seeing how operators continue to improve their networks and expand 5G access. Do you want to see how your operator performs against the data we found? Download the Android or iOS Speedtest app, and take a Speedtest®.

Ookla retains ownership of this article including all of the intellectual property rights, data, content graphs and analysis. This article may not be quoted, reproduced, distributed or published for any commercial purpose without prior consent. Members of the press and others using the findings in this article for non-commercial purposes are welcome to publicly share and link to report information with attribution to Ookla.

| December 6, 2021

Ookla Video Analytics Reveals the State of Global Video Experience


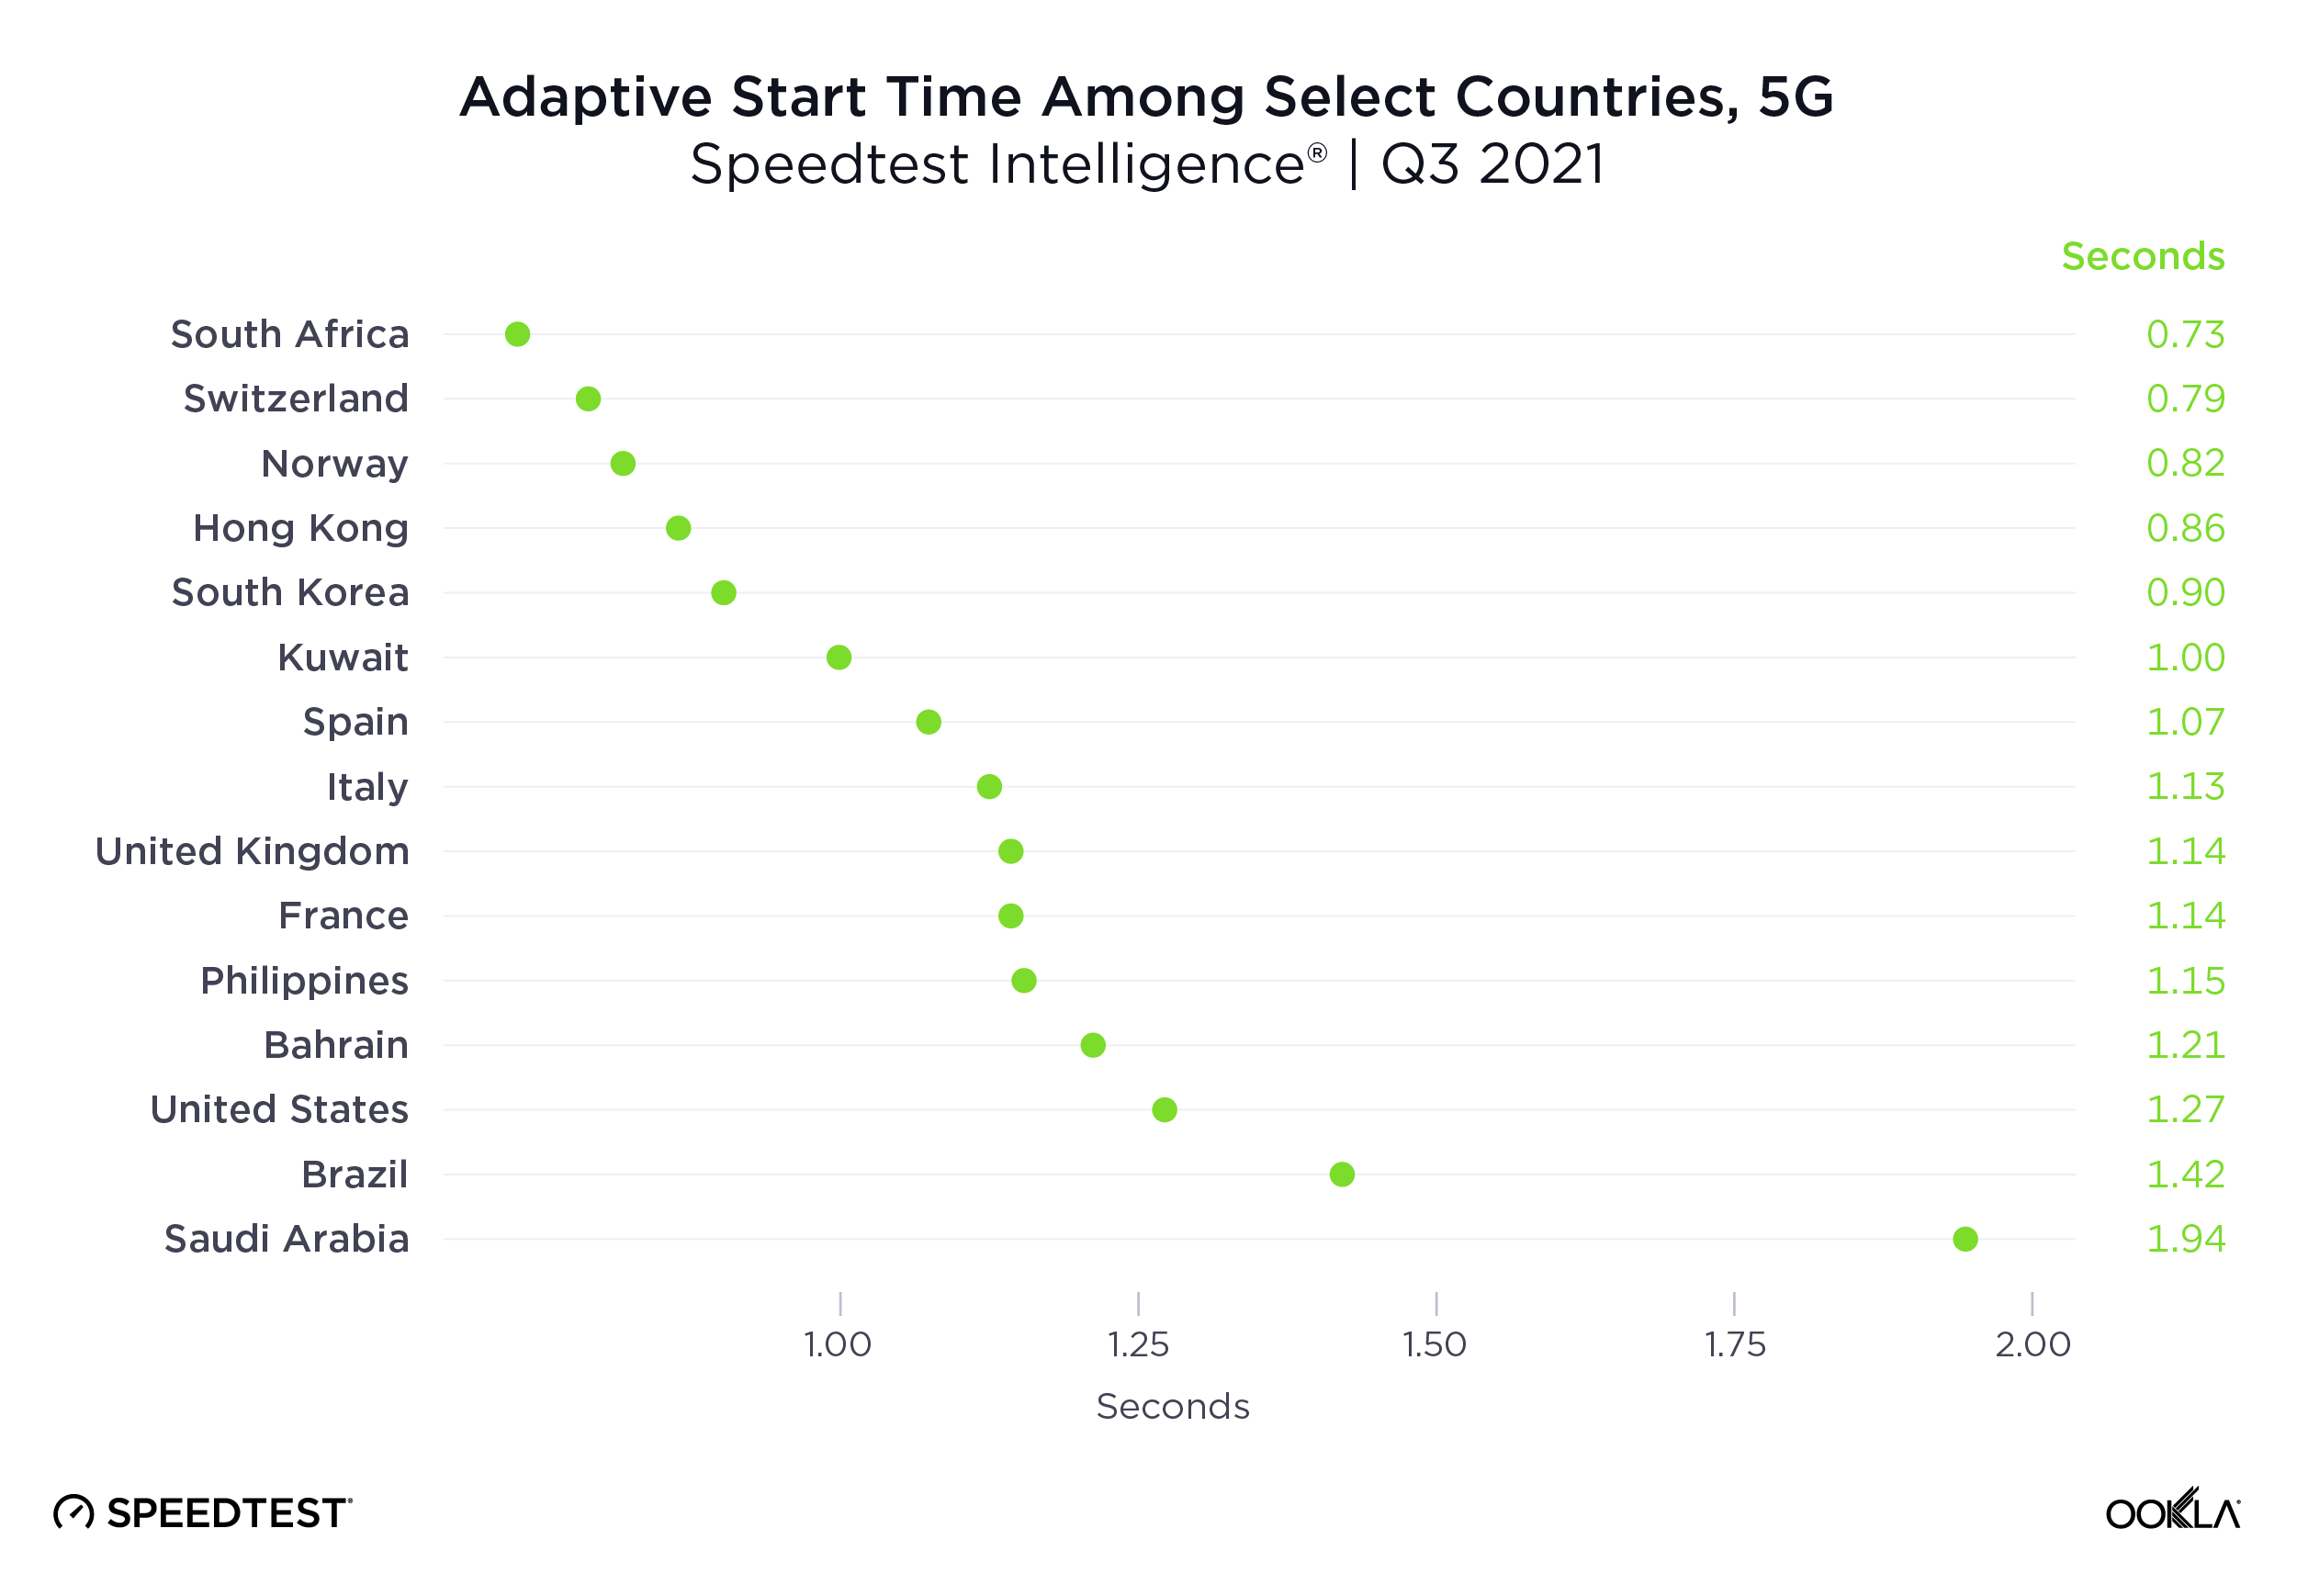
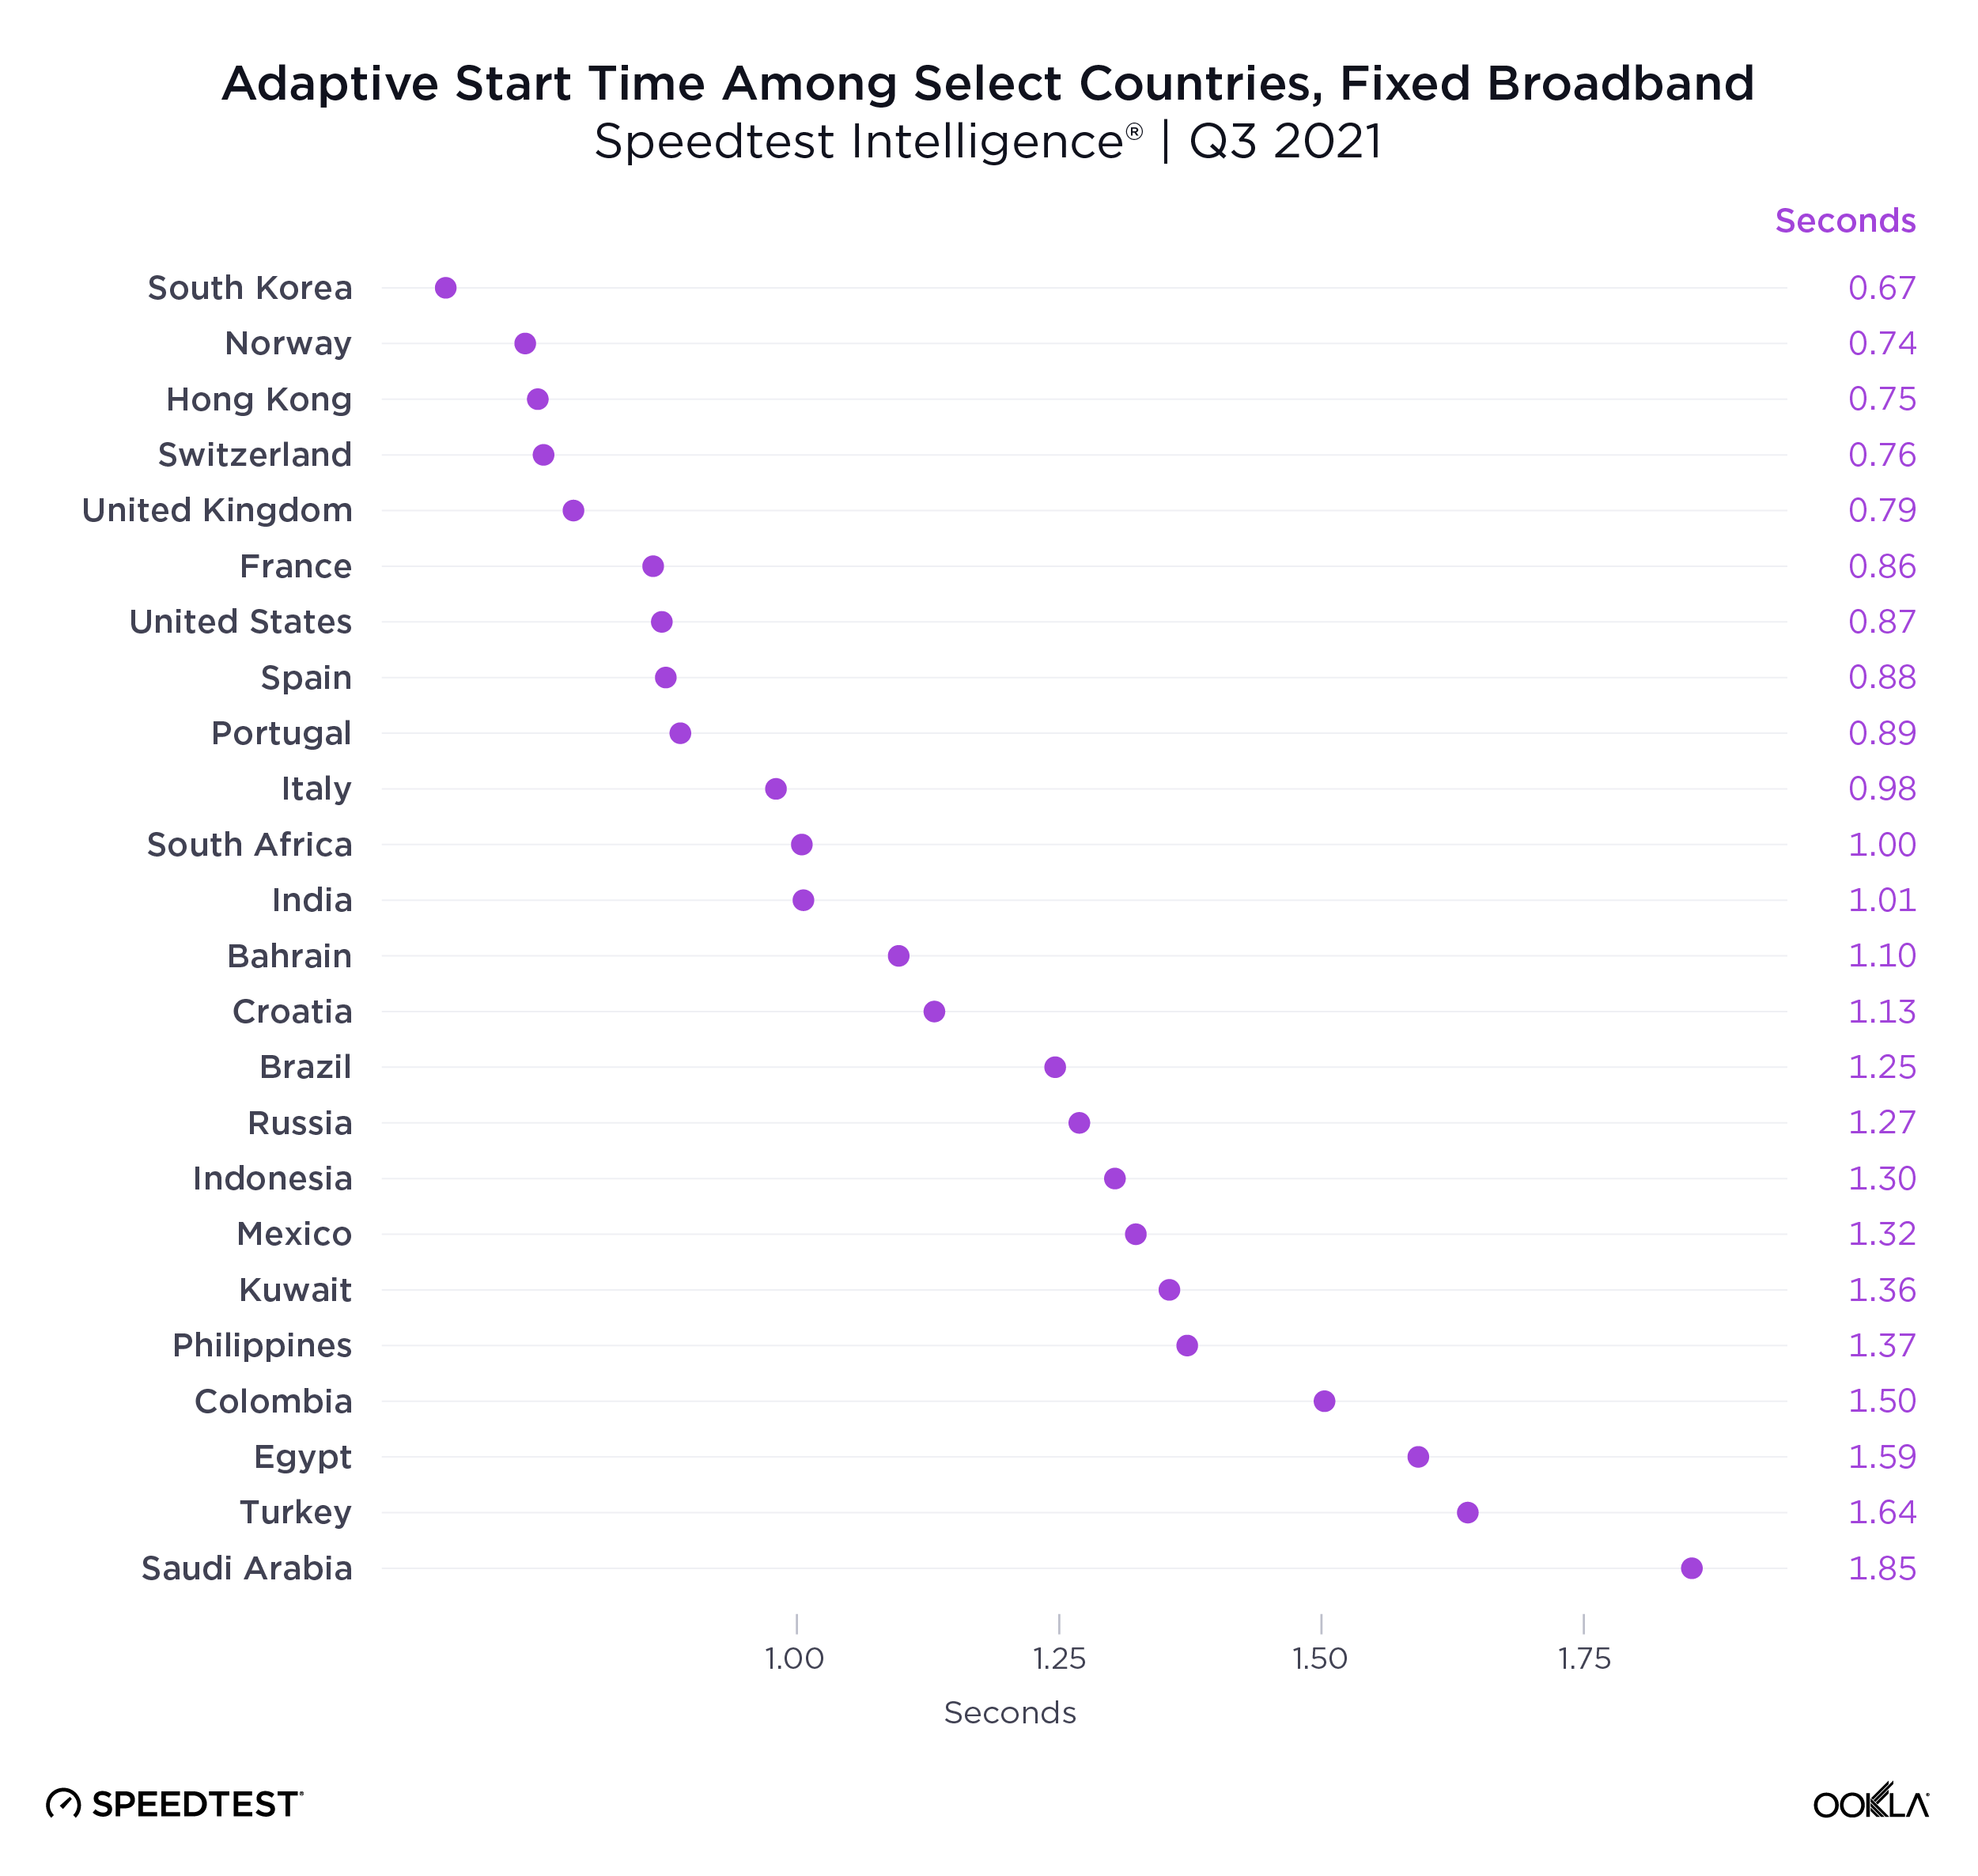
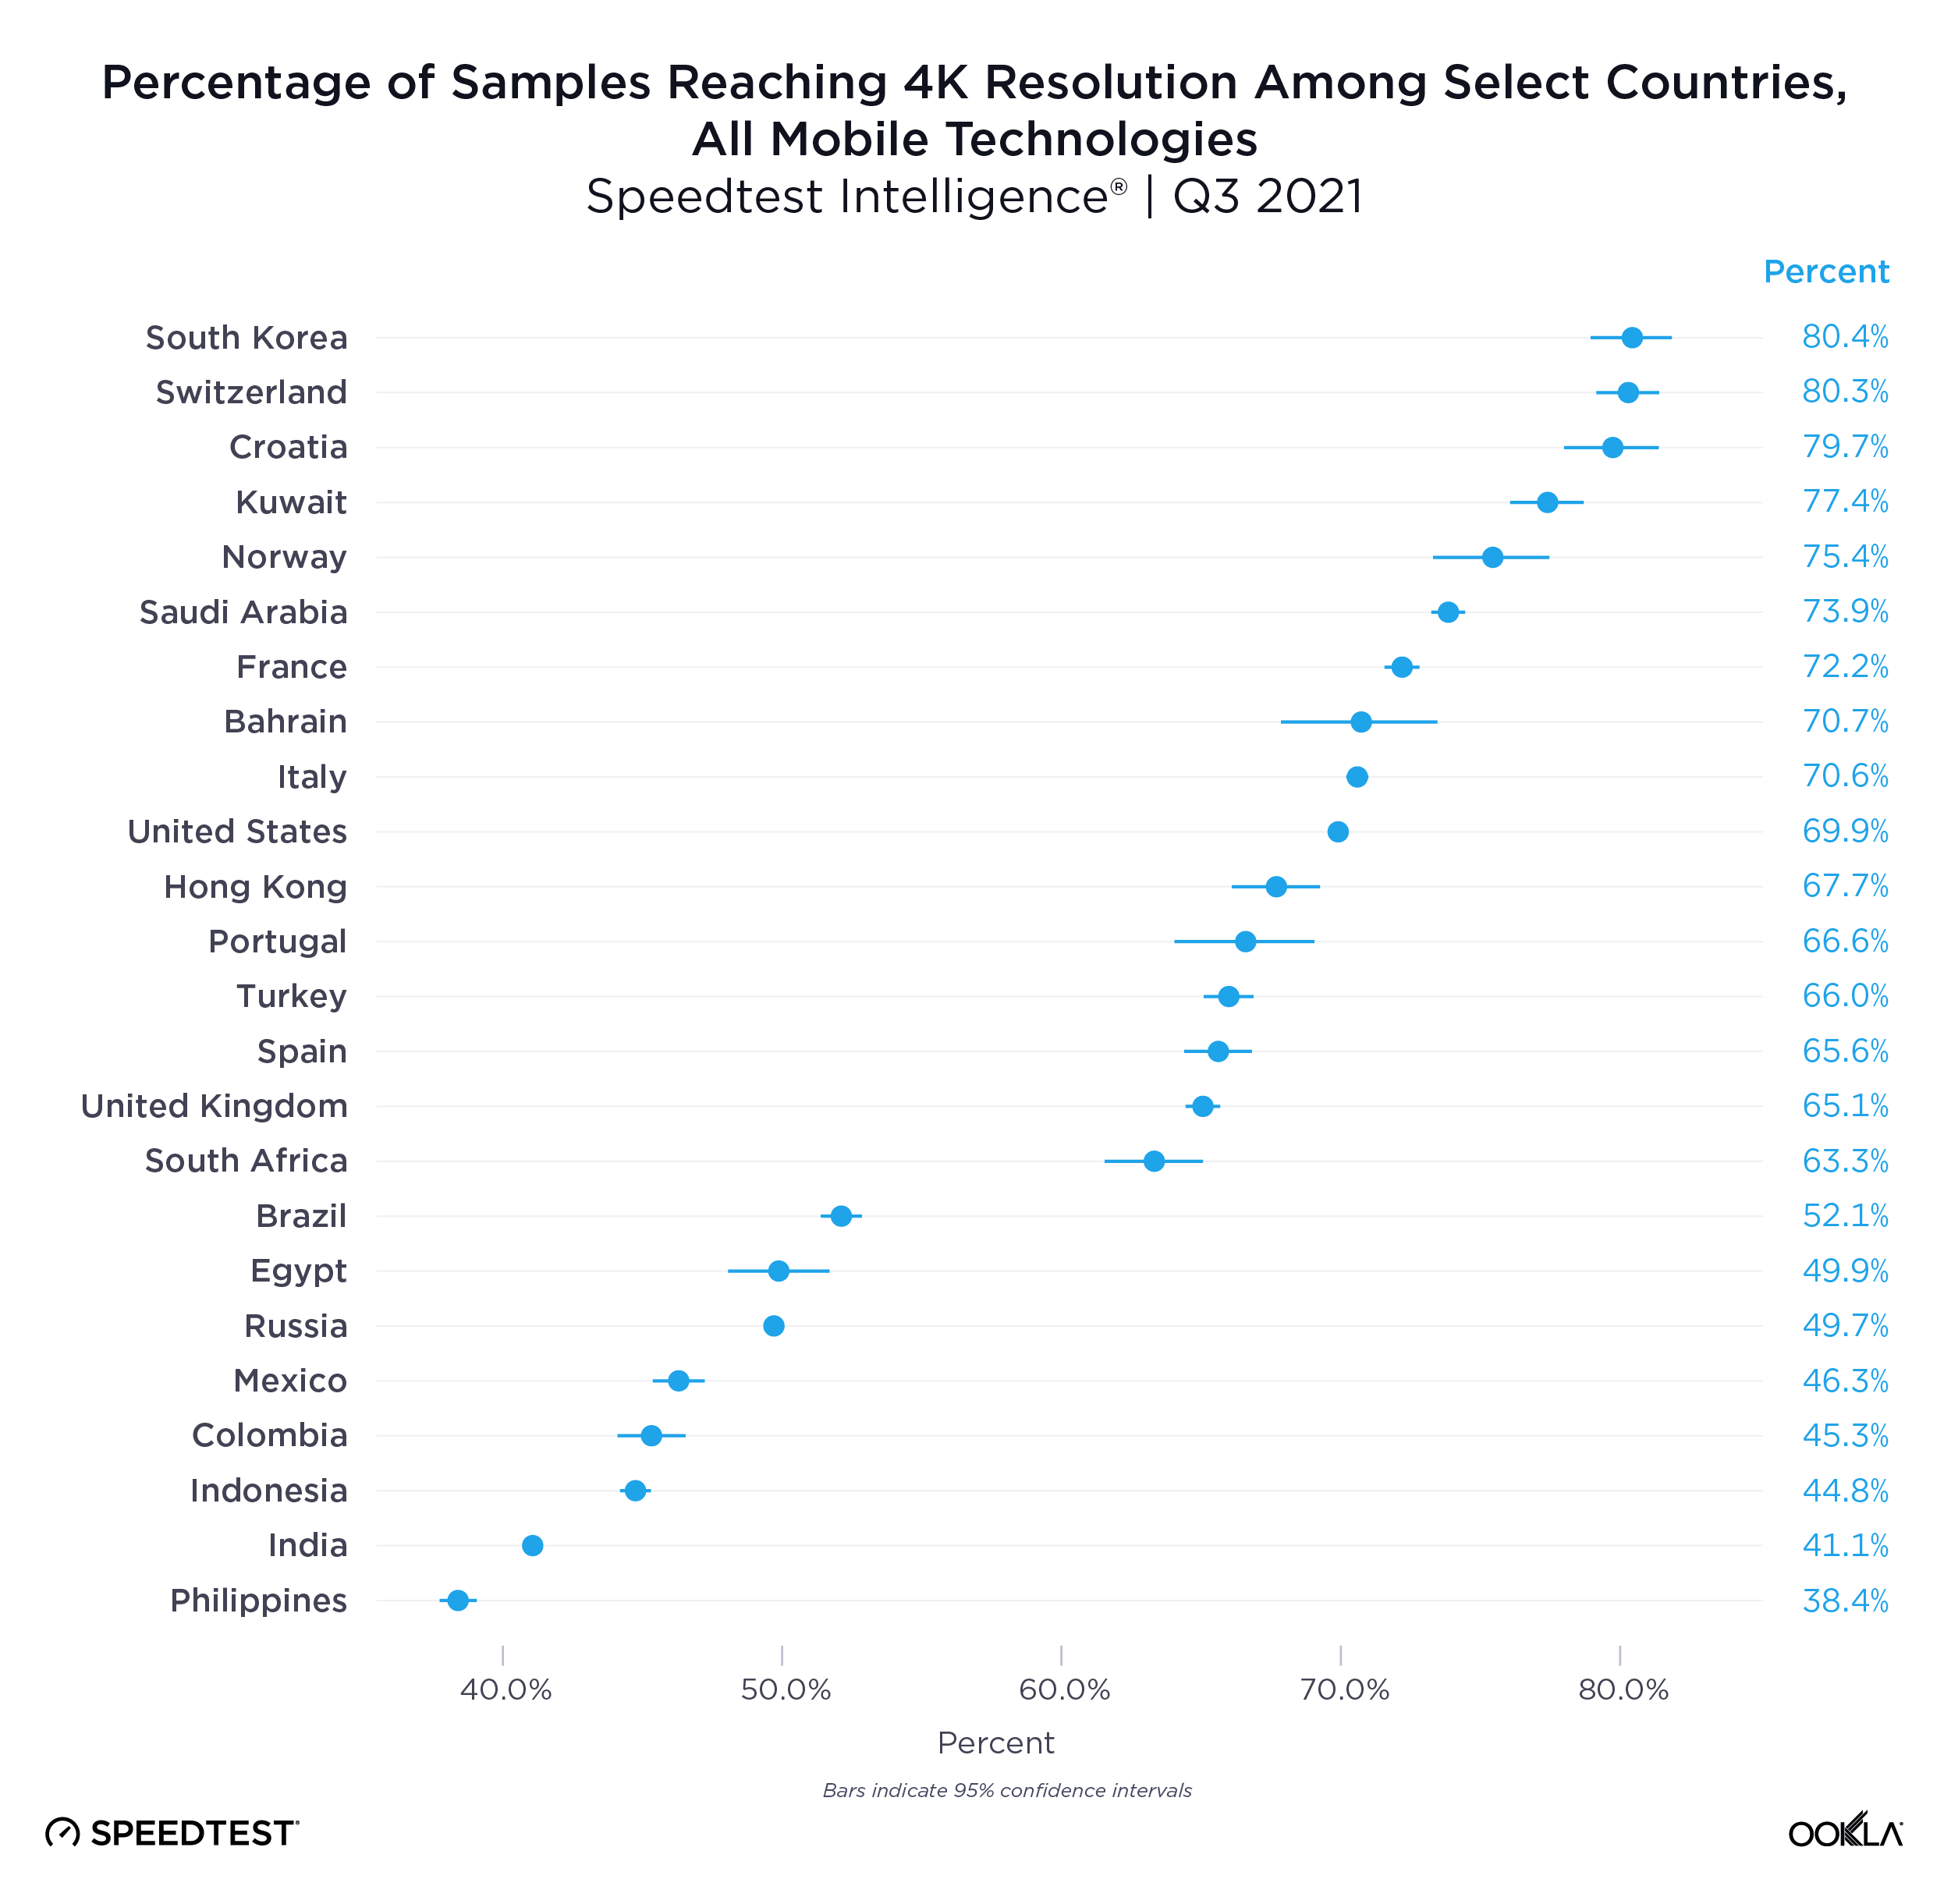
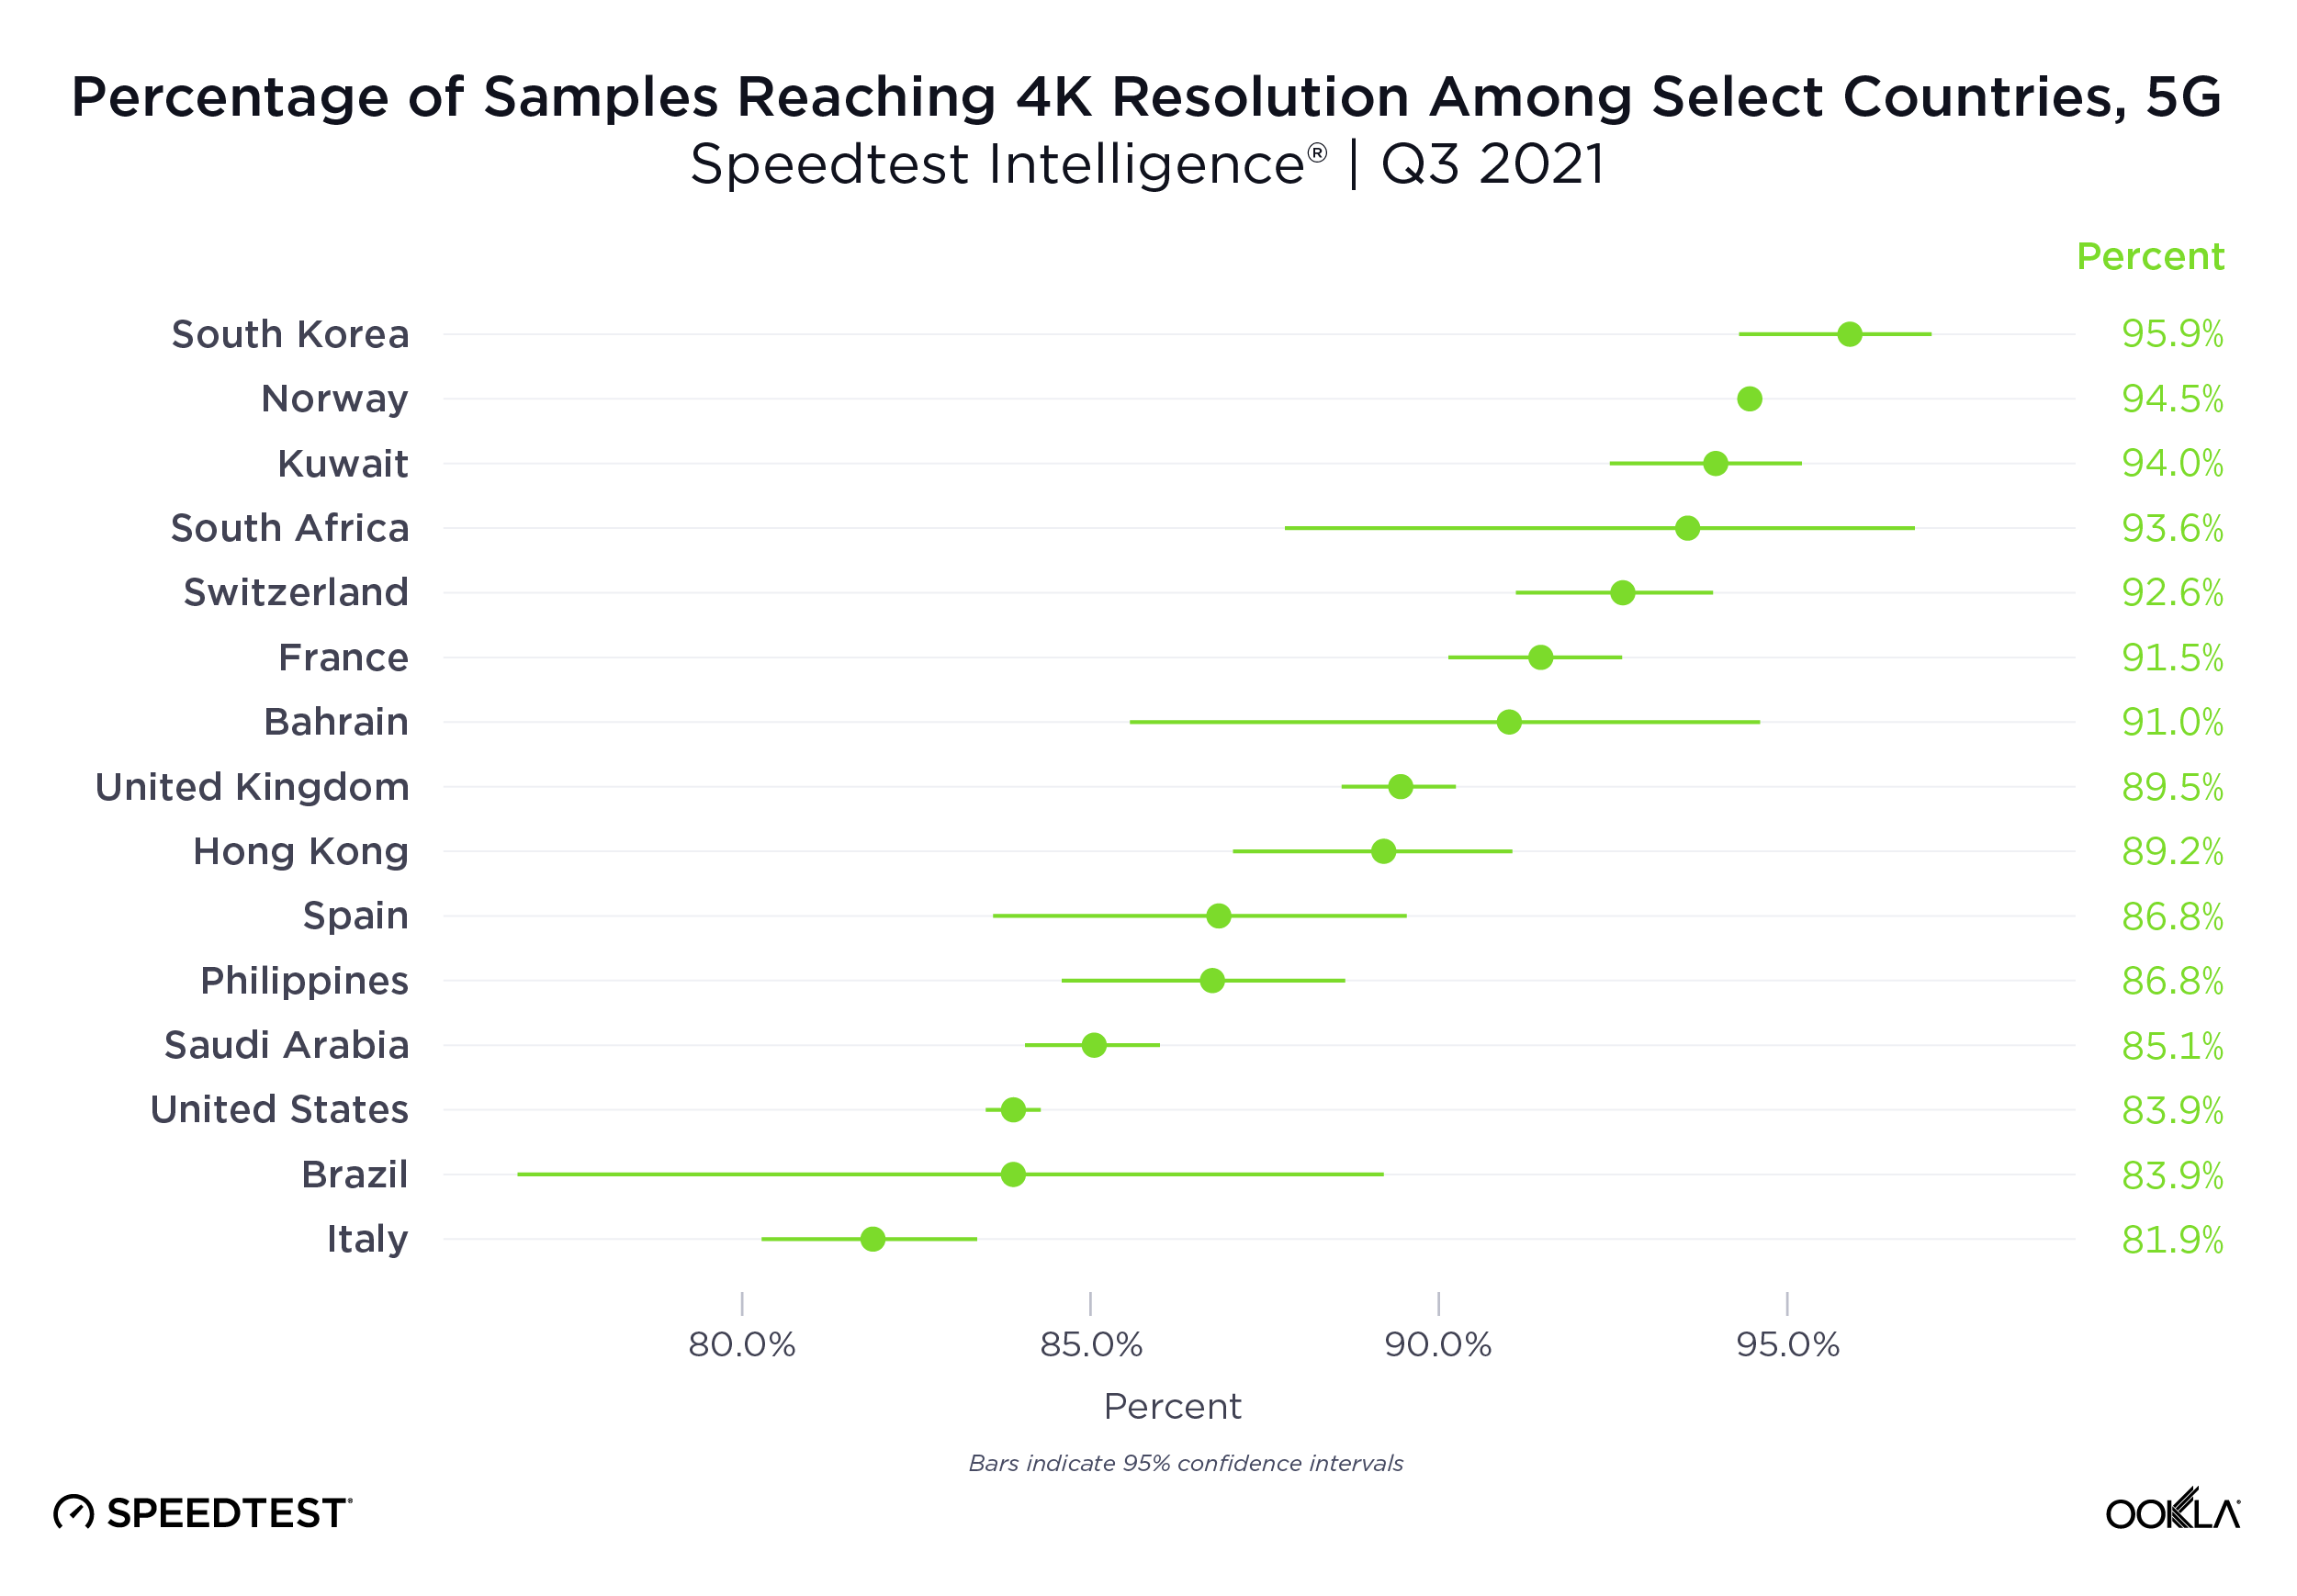
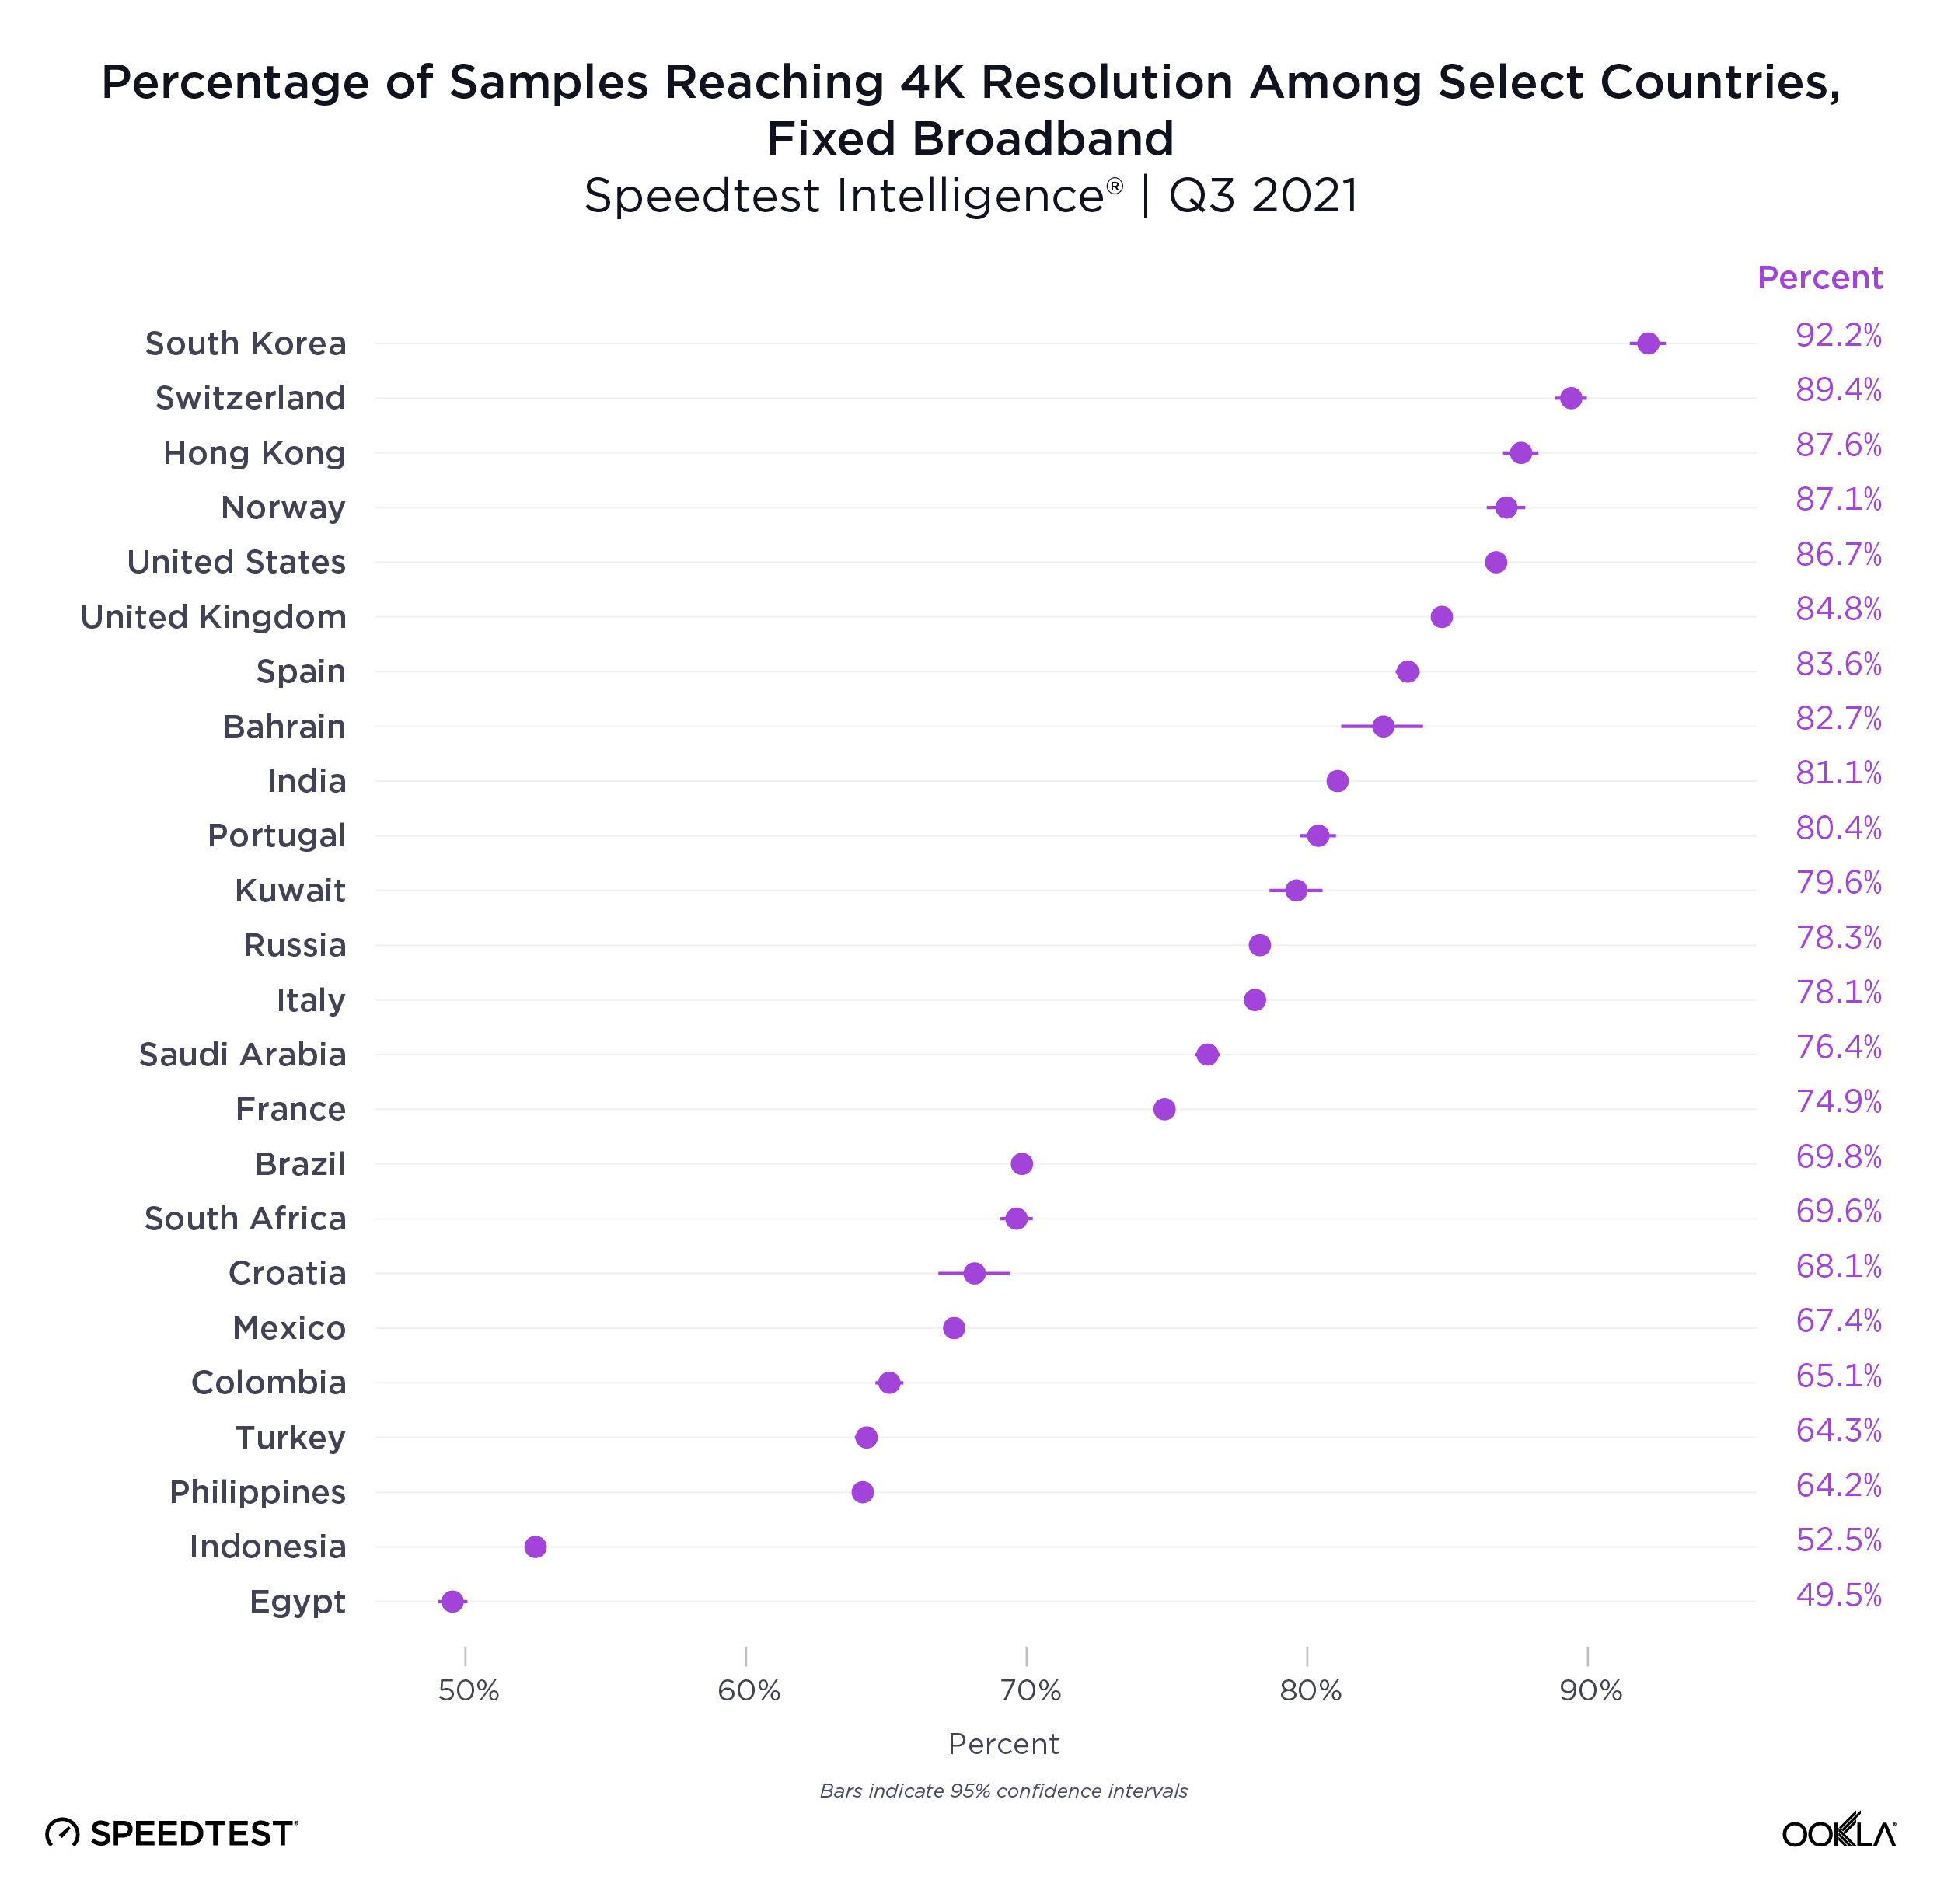
Video is essential to today’s internet across the world. We use it to watch shows and movies, stream live events and even keep up to date on our favorite cats on social media. Ookla® launched video testing in the Speedtest® app for iOS and Android earlier this year so consumers can measure the quality of their video experience. Already, millions of video tests have been initiated by consumers. Today we’re sharing some of that data to provide insight into video experience around the world, specifically, we’ve analyzed adaptive start time and highest overall video resolution over all mobile technologies, 5G and fixed broadband in select countries during Q3 2021.

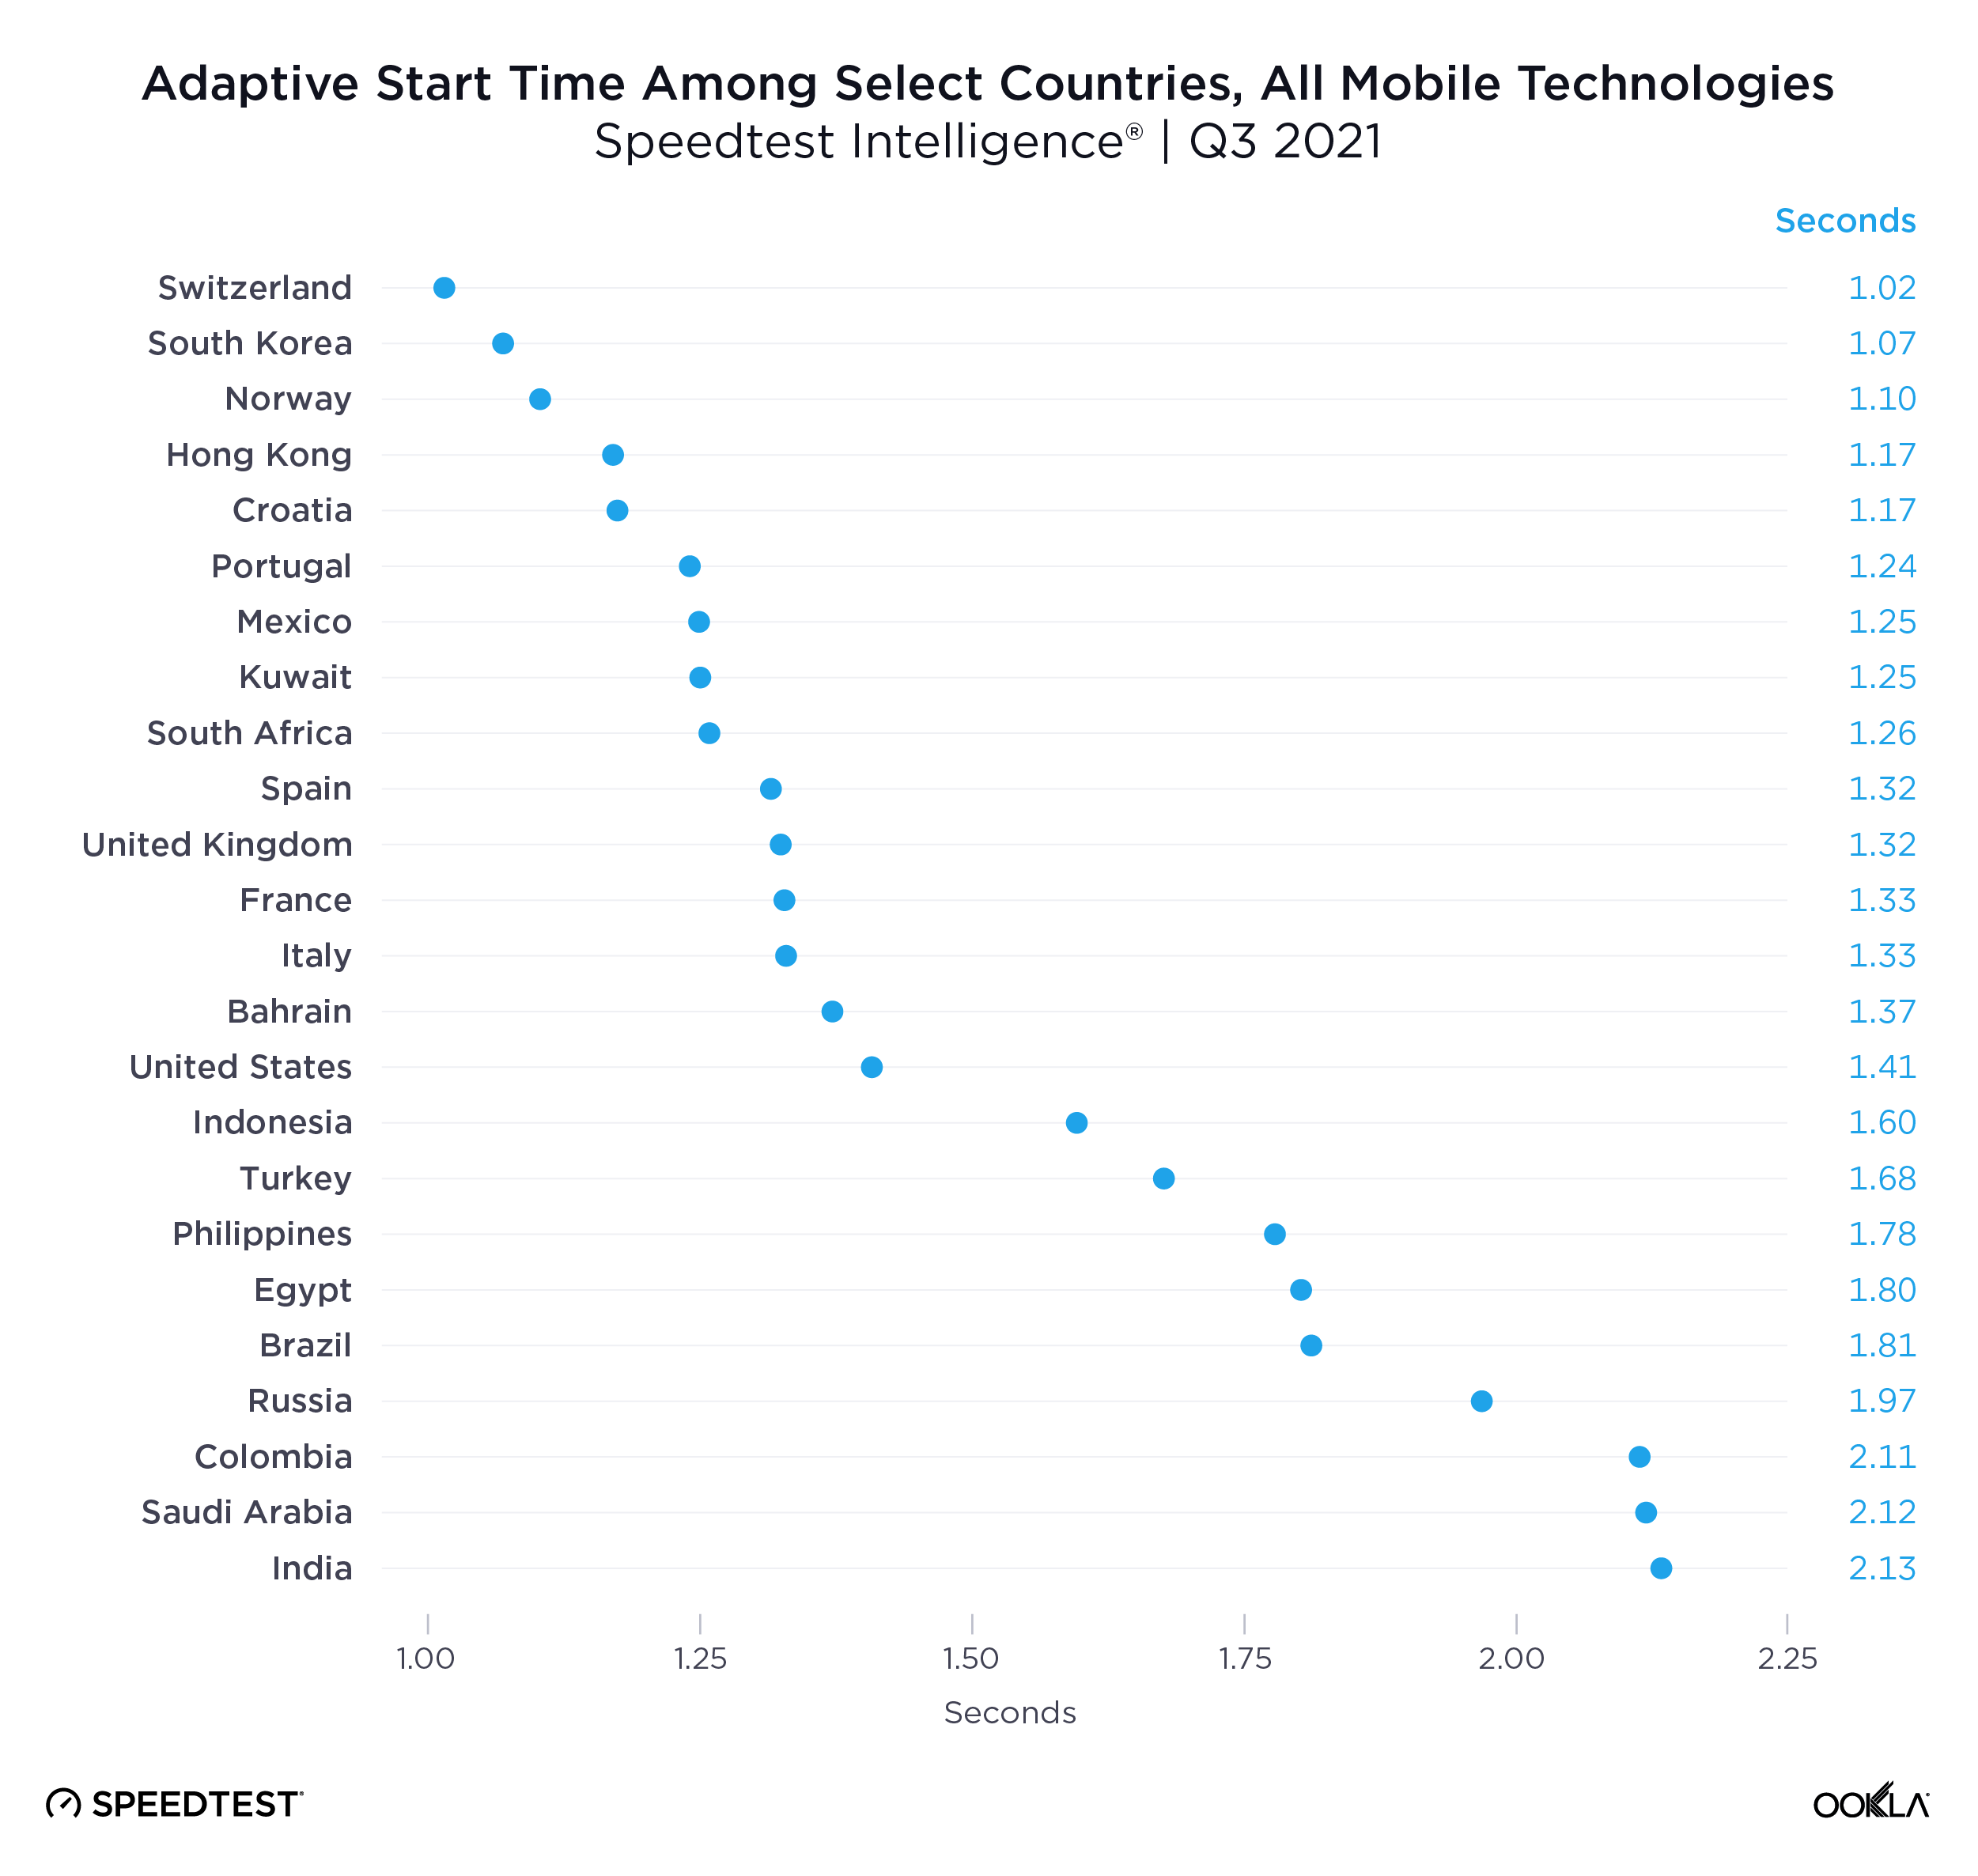
Switzerland had the fastest adaptive start time for all mobile technologies, South Africa fastest for 5G

Video streaming services use adaptive bitrate technology

All modern video streaming platforms use adaptive bitrate technology to automatically adjust video quality based on network conditions and device capabilities in order to display the highest quality video that a device can support, while minimizing buffering and slow video start time. Speedtest Video Analytics provides deep insights and competitive benchmarking for device and network video streaming capabilities.

Adaptive start time — the time it takes for adaptive bitrate playback to initiate — allows us to see how quickly videos are loading. A 2012 study found that users will leave a video if it doesn’t begin playing within two seconds. We have to imagine in 2021, that timeframe is being squeezed even further. Our analysis shows how countries are performing against this important benchmark.

ookla_adaptive-start-time_all-mobile-tech_1121-01-3

Speedtest Intelligence® reveals that Switzerland had the fastest median adaptive start time for all mobile technologies combined among the countries we analyzed at 1.02 seconds during Q3 2021. South Korea and Norway were close behind at 1.07 seconds and 1.10 seconds, respectively. Five more countries achieved a median adaptive start time at or under 1.25 seconds during Q3 2021, including Hong Kong (SAR) and Croatia (1.17 seconds), Portugal (1.24 seconds), and Kuwait and Mexico (1.25 seconds). All but three of the remaining countries we surveyed achieved a median adaptive start time between 1.25 seconds and 2.00 seconds during Q3 2021 except Colombia (2.11 seconds), Saudi Arabia (2.12 seconds) and India (2.13 seconds).

Most 5G-capable video tests showed blazing fast adaptive start times

ookla_adaptive-start-time_5g_1121-01

We’ve seen median 5G download speeds zoom ahead of traditional mobile technologies, even reaching median download speeds 10 times faster than on 4G LTE. It’s no surprise Video Analytics revealed adaptive start time was often much faster on 5G than on all mobile technologies combined. Five countries achieved median adaptive start times faster than 1.00 second during Q3 2021: South Africa (0.73 seconds), Switzerland (0.79 seconds), Norway (0.82 seconds), Hong Kong (0.86 seconds) and South Korea (0.90 seconds). Video Analytics shows the only countries with a median 5G adaptive start time slower than 1.25 seconds were the United States (1.27 seconds), Brazil (1.42 seconds) and Saudi Arabia (1.94 seconds).

Five countries’ adaptive start time improved more than 0.25 seconds on 5G compared to all technologies combined during Q3 2021: the Philippines (-0.62 seconds), South Africa (-0.53 seconds), Brazil (-0.39 seconds), Hong Kong (-0.31 seconds) and Norway (-0.29 seconds). However, several countries showed a less than 0.20 second improvement when comparing adaptive start rate on 5G to that on all technologies combined during Q3 2021: the U.S. (-0.14 seconds), Bahrain (-0.16 seconds), South Korea and Saudi Arabia (-0.17 seconds), and the United Kingdom (U.K.) and France (-0.18 seconds).

Adaptive start time is not always faster on fixed broadband

ookla_adaptive-start-time_fixed_1121-01-1

Speedtest Intelligence showed a narrower range for adaptive start time on fixed broadband than on 5G with every country on our list achieving between 0.67 and 1.85 seconds during Q3 2021. Ten countries on our list achieved a median adaptive start time faster than 1.00 second during Q3 2021: South Korea (0.67 seconds), Norway (0.74 seconds), Hong Kong (0.75 seconds), Switzerland (0.76 seconds), the U.K. (0.79 seconds), France (0.86 seconds), the U.S. (0.87 seconds), Spain (0.88 seconds), Portugal (0.89 seconds) and Italy (0.98 seconds).

Twenty out of the 24 countries we surveyed had a median fixed broadband adaptive start time faster than 1.50 seconds during Q3 2021. Colombia (1.50 seconds), Egypt (1.59 seconds), Turkey (1.64 seconds) and Saudi Arabia (1.85 seconds) were the only countries with a median adaptive start time slower than 1.50 seconds on fixed broadband during Q3 2021.

South Korea video tests reached 4K resolutions at the highest proportion on mobile and fixed broadband

Video resolution is incredibly important in the experience of streaming video and the higher the resolution, the more definition and clarity we are able to see. These days, the difference between an SD and 4K experience is gigantic. Resolution is measured in the numbers of pixels in a 16:9 ratio, with 2160 pixel height representing a 4K picture. Video Analytics measures the resolution rates, which represent the portion of samples that reach a particular resolution. In this analysis, we evaluated the resolution rates for 4K, typically the highest resolution users will need.

ookla_highest-video-resolution_all-mobile-tech_1121-01

Using Speedtest Intelligence, we found South Korea and Switzerland had the highest overall successful resolution rates for all mobile technologies combined during Q3 2021, reaching 4K resolutions 80.4% and 80.3% of the time, respectively. Croatia (79.7%), Kuwait (77.4%) and Norway (75.4%) were the only other countries on our list that achieved 4K video resolution more than 75.0% of the time. Only seven countries on our list did not reach a 4K resolution at least 50% of the time on all mobile technologies combined: the Philippines (38.4%), India (41.1%), Indonesia (44.8%), Colombia (45.3%), Mexico (46.3%), Russia (49.7%) and Egypt (49.9%).

5G led to higher video resolution, but 4K mobile devices still remain rare

ookla_highest-video-resolution_5g_1121-01

5G provided a higher resolution for mobile devices during Q3 2021 than all technologies combined. Every country we surveyed reached a 4K resolution over 80.0% of the time over 5G. In fact, six out of the 14 countries we surveyed for 5G achieved a 4K resolution more than 90.0% of the time, including South Korea (95.9%), Norway (94.5%), Kuwait (94.0%), South Africa (93.6%), Switzerland (92.6%) and France (91.5%). On the lower end of our list, only Italy (81.9%), Brazil (83.9%) and the U.S. (83.9%) achieved 4K resolutions less than 85.0% of the time.

While this is great news for the future of mobile devices, 4K resolutions in mobile devices still aren’t common: Sony is the only popular device manufacturer producing 4K mobile devices. In the meantime, users who can connect to 5G through either a hot spot or fixed wireless access (FWA) will reap the benefits of being able to stream on 4K devices like computers, televisions or tablets.

South Korean fixed broadband delivers ultra-high definition resolutions

ookla_highest-video-resolution_fixed_1121-01

Speedtest Intelligence reveals South Korea had the highest fixed broadband 4K resolution rate among countries surveyed at 92.2% during Q3 2021. Other countries that achieved 4K resolution rates above 85.0% on fixed broadband during Q3 2021 included: Switzerland (89.4%), Hong Kong (87.6%), Norway (87.1%) and the U.S. (86.7%). Every other country in our analysis achieved 4K resolution rates between 65.0% and 85.0%, except Egypt (49.5%), Indonesia (52.5%), the Philippines (64.2%) and Turkey (64.3%).

Video Analytics gives you the information you need about your video playback

We’re excited to share more about video performance and quality of experience using Video Analytics in the coming months. In the meantime, if you want to learn more about Video Analytics and how it can help you benchmark and improve your network, please join our upcoming webinar, December 9 by clicking here.

Ookla retains ownership of this article including all of the intellectual property rights, data, content graphs and analysis. This article may not be quoted, reproduced, distributed or published for any commercial purpose without prior consent. Members of the press and others using the findings in this article for non-commercial purposes are welcome to publicly share and link to report information with attribution to Ookla.