| September 18, 2023

New Speedtest Data Shows Starlink Performance is Mixed — But That’s a Good Thing

Satellite providers are playing no small part in the rapid expansion of global connectivity. Some experts predict there will be 58,000 satellites orbiting the earth by 2030 — a nearly 725% increase from 2023. Ookla® is back with our ongoing satellite internet series with compelling, fresh data for satellite providers in Africa, Europe, and Oceania during Q2 2023, including SpaceX’s Starlink, Viasat, and Skylogic.

This analysis includes Starlink Net Promoter Score (NPS) data for France, Germany, Italy, New Zealand, and the United Kingdom, year-over-year data for satellite providers in Europe and Oceania from Q2 2022 to Q2 2023, and new Q2 2023 data from Starlink in Africa.

Starlink users across different continents continue to love the service

Using Speedtest Intelligence®, we examined NPS ratings data for Starlink users against an aggregate of all fixed broadband providers combined. 

NPS is based on Speedtest® user responses after being asked how likely they are to recommend their provider to friends or family on a 0 to 10 scale. NPS ratings are categorized into Detractors (score 0-6), Passives (score 7-8), and Promoters (score 9-10), and is calculated as (% Promoters – % Detractors) x 100. Any NPS score above 0 indicates that a provider’s audience is more loyal than not.

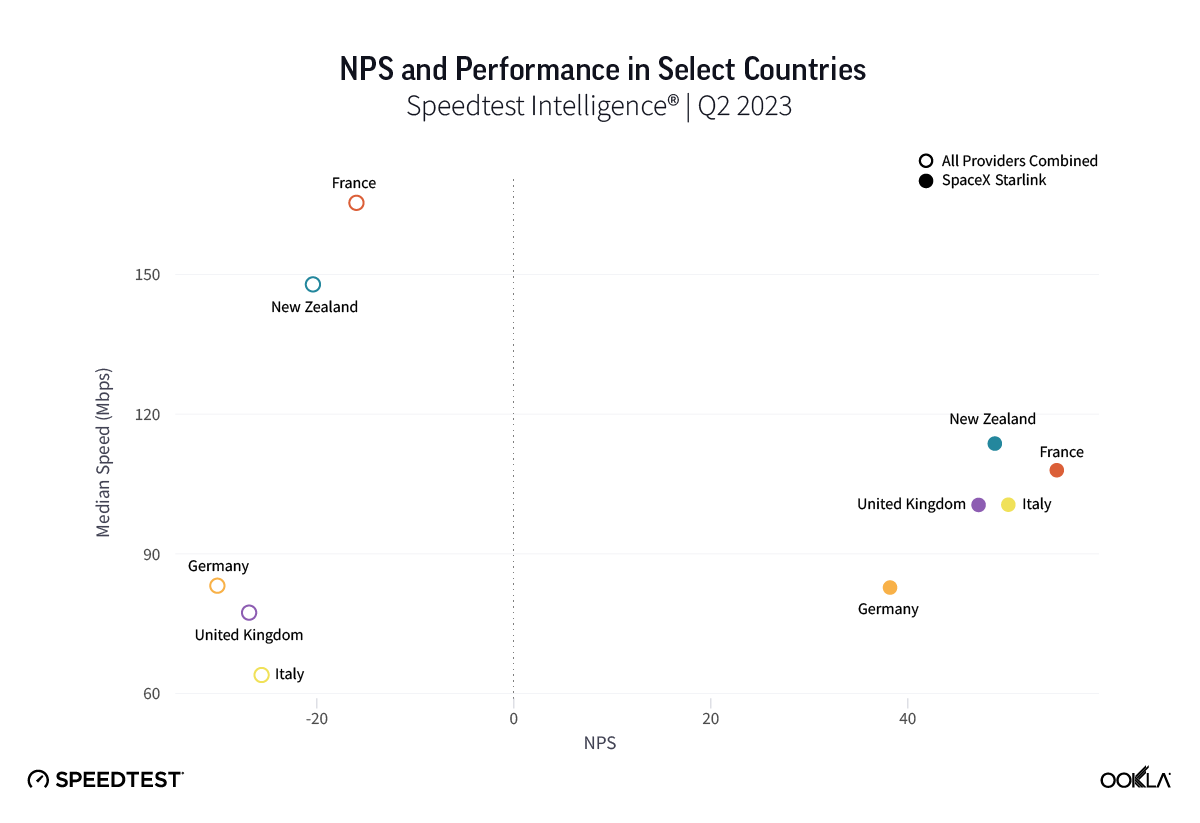
Chart of NPS Performance in Select Countries

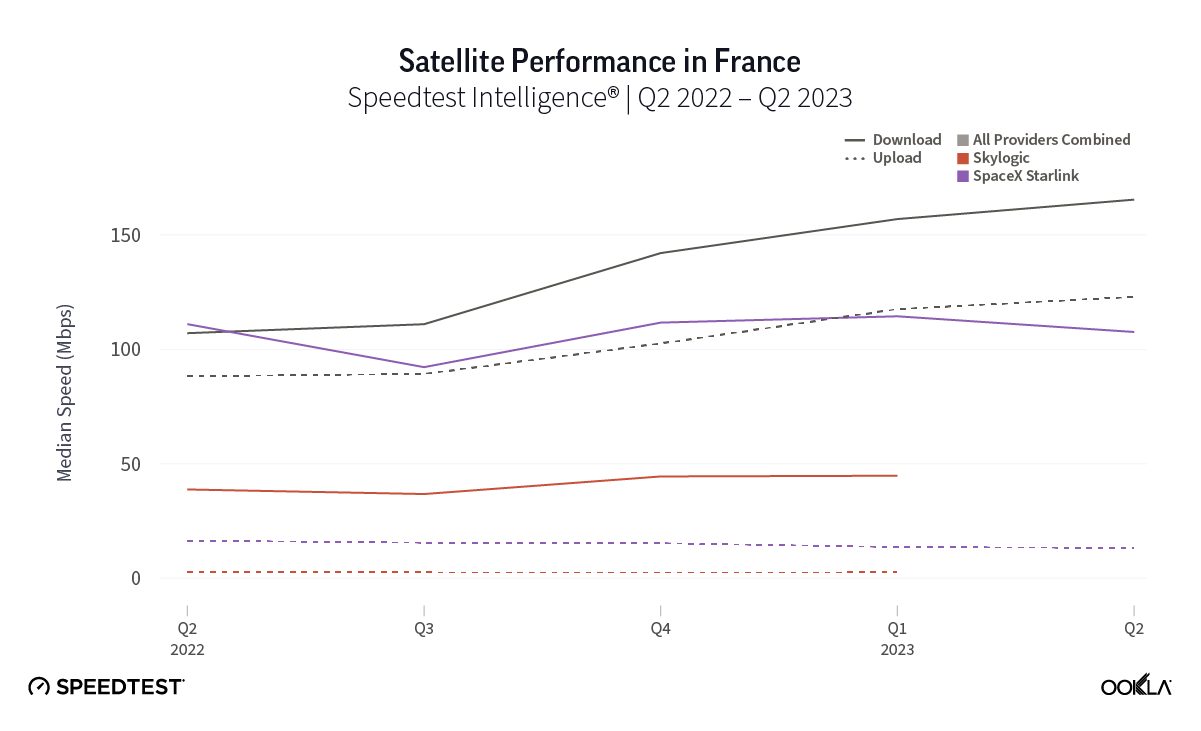
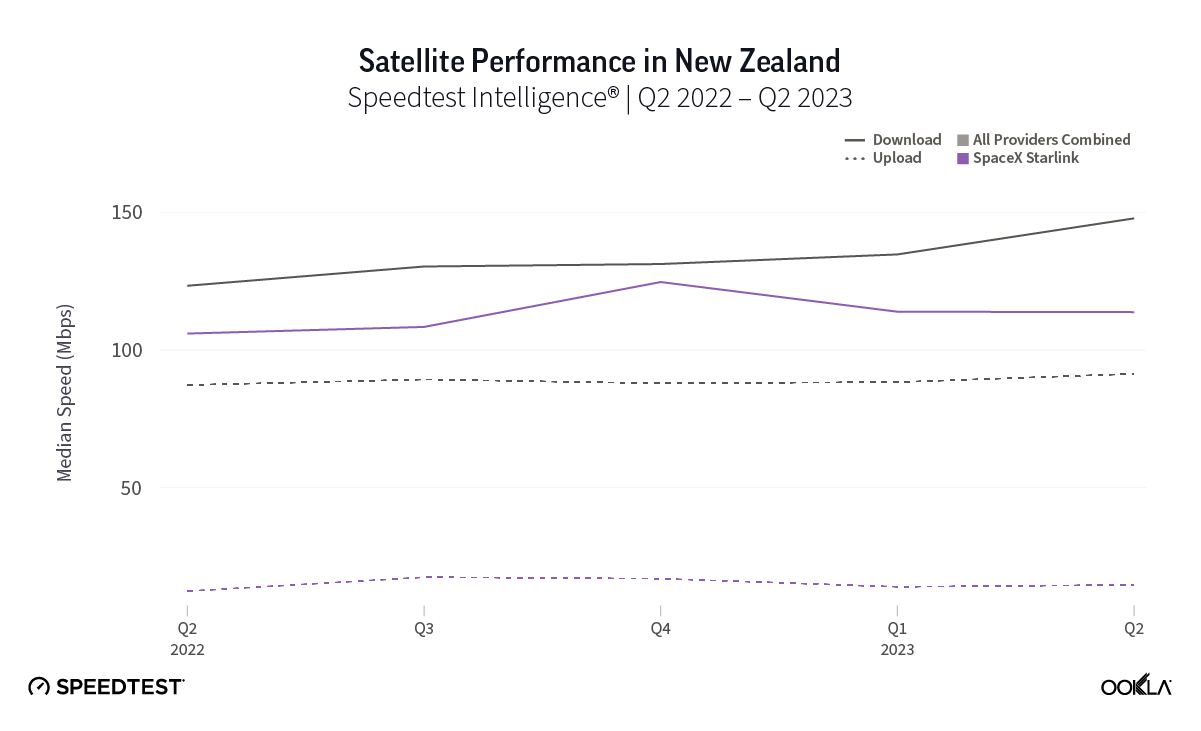
As you can see from the above image, Starlink users in France, Germany, Italy, New Zealand, and the U.K. had an NPS score much higher than the aggregate score for all fixed broadband providers combined during Q2 2023. France had the highest NPS among the aggregate of fixed broadband providers for the countries we surveyed at -15.98 and fixed broadband providers had a much faster median download speed at 165.37 Mbps to Starlink’s 107.56 Mbps. In New Zealand there was a similar story with the aggregate of fixed broadband providers having a -20.40 NPS to Starlink’s 48.83, while having a faster median download speed 147.86 Mbps to 113.78 Mbps during Q2 2023.

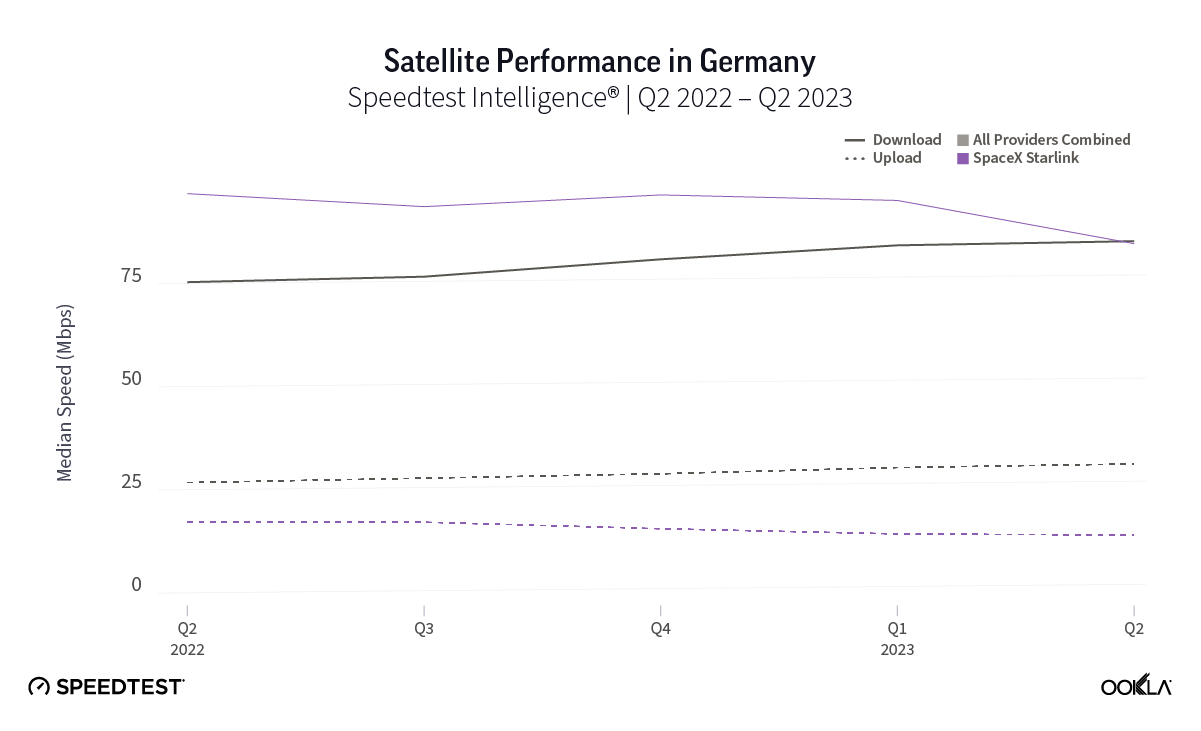
Germany, which had the lowest NPS rating of aggregate of fixed broadband providers in Europe at -30.10, also had the smallest difference in NPS with Starlink scoring 38.19. Interestingly, the aggregate of fixed broadband providers and Starlink both had similar median download speeds at 83.16 Mbps and 82.56 Mbps, respectively, during Q2 2023.

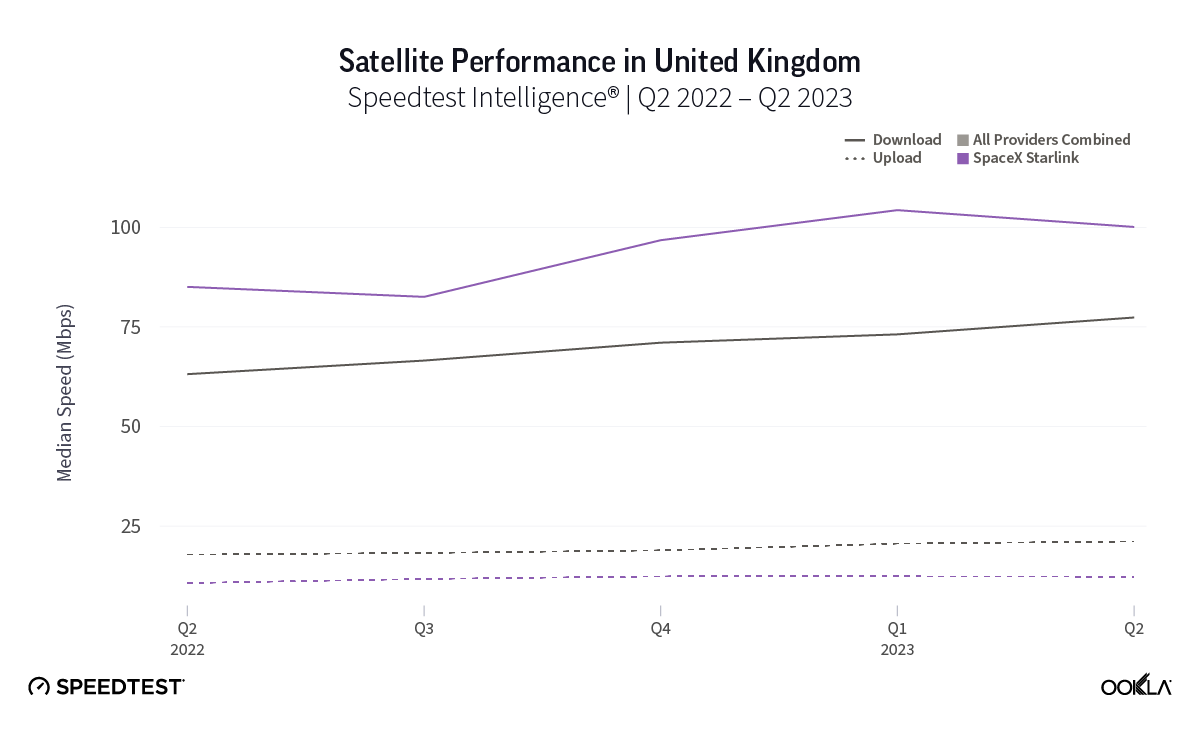
Of note, Starlink had much higher NPS ratings and median download speeds than the aggregate of all fixed providers combined in Italy and the U.K., respectively, during Q2 2023. Starlink’s NPS was 50.20 to -25.61 for the aggregate of all fixed broadband providers in Italy during Q2 2023, while the median download speeds were 100.68 Mbps to 63.99 Mbps. In the U.K., Starlink’s NPS was 47.18 to -26.88 for the aggregate of all fixed broadband providers combined, with the median download speeds a little closer, 100.11 Mbps to 77.38 Mbps, respectively. 

In our last report, we found a wide NPS gap between U.S. rural Starlink users — who often have fewer options for fixed broadband access — and the corresponding aggregate of fixed broadband providers. Given that all five of these countries have rural or remote regions that are underserved or not served by traditional broadband offerings, it may be no surprise that Starlink users who reside in those areas may feel positive about having access to fast broadband internet. 

Starlink speeds over 100 Mbps in 14 European countries during Q2 2023, speeds stabilizing across Europe

Key takeaways:

  • Starlink results were the fastest among satellite providers we surveyed.
  • Starlink quarter-to-quarter speeds improved or remained about the same (between 5% and -5%) in 23 countries, while decreasing in 4 countries.
  • Among the 27 European countries we surveyed, Starlink had median download speeds greater than 100 Mbps in 14 countries, greater than 90 Mbps in 20 countries, and greater than 80 in 24 countries, with only three countries failing to reach 70 Mbps.
  • Skylogic, while delivering speeds slower than Starlink, showed stabilized broadband speeds over the past year for those seeking a Starlink alternative.

Over the past year, we’ve seen huge developments in the global satellite market, Europe notwithstanding, with Amazon’s Project Kuiper moving forward, the EU creating its own satellite constellation, and OneWeb and Eutelsat merging. While Starlink continues to lead for performance among satellite providers we surveyed, Starlink has experienced some major hurdles over the past year as users flock to the service and speeds have subsequently dipped — but of note those concerns seem to have started allaying in most of Europe during Q2 2023.

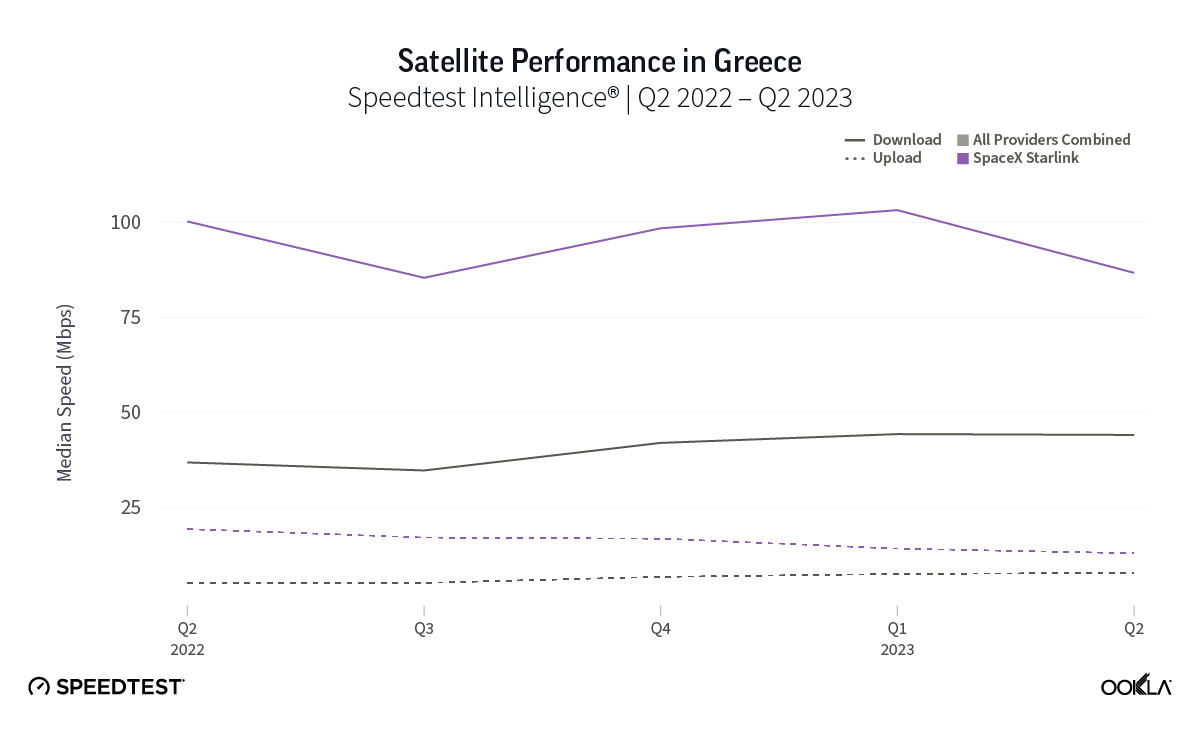
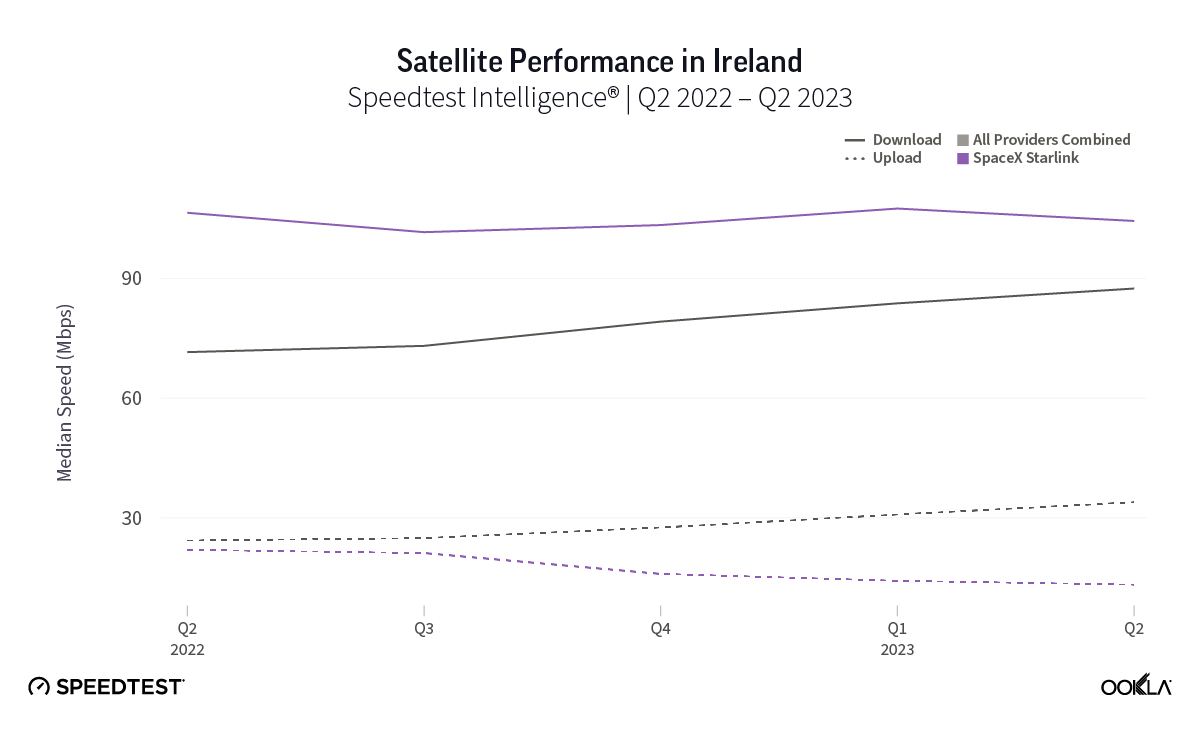
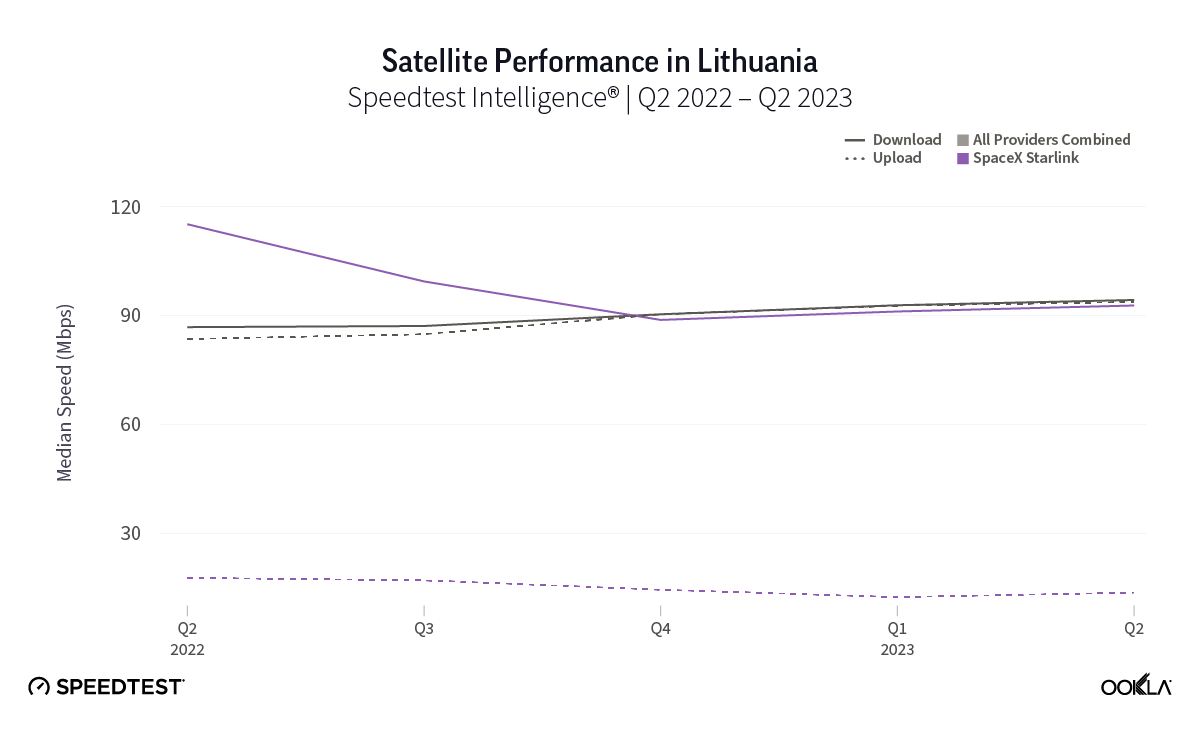
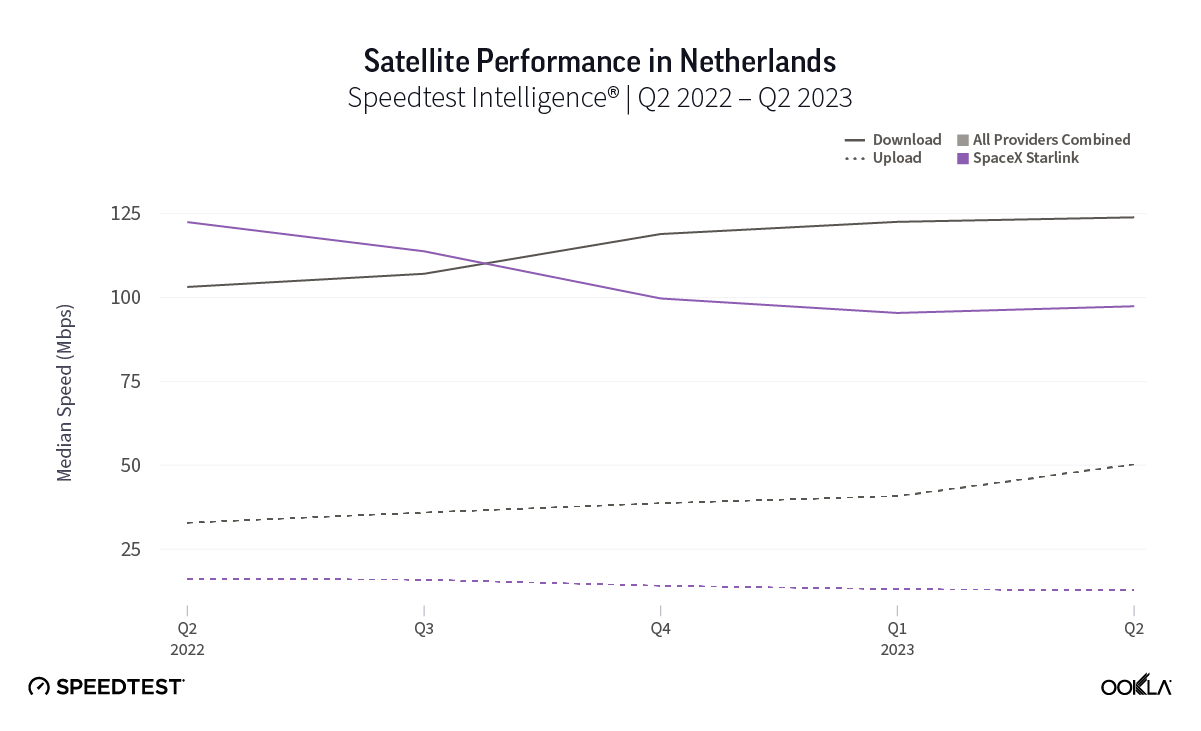
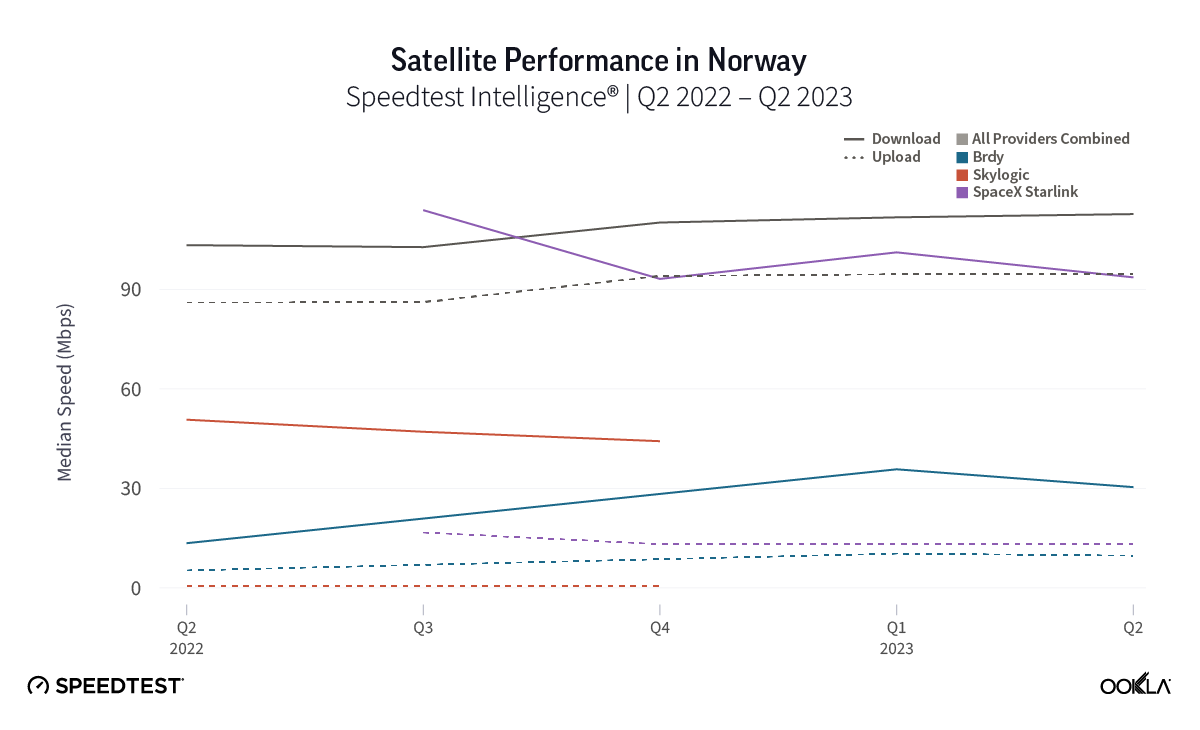
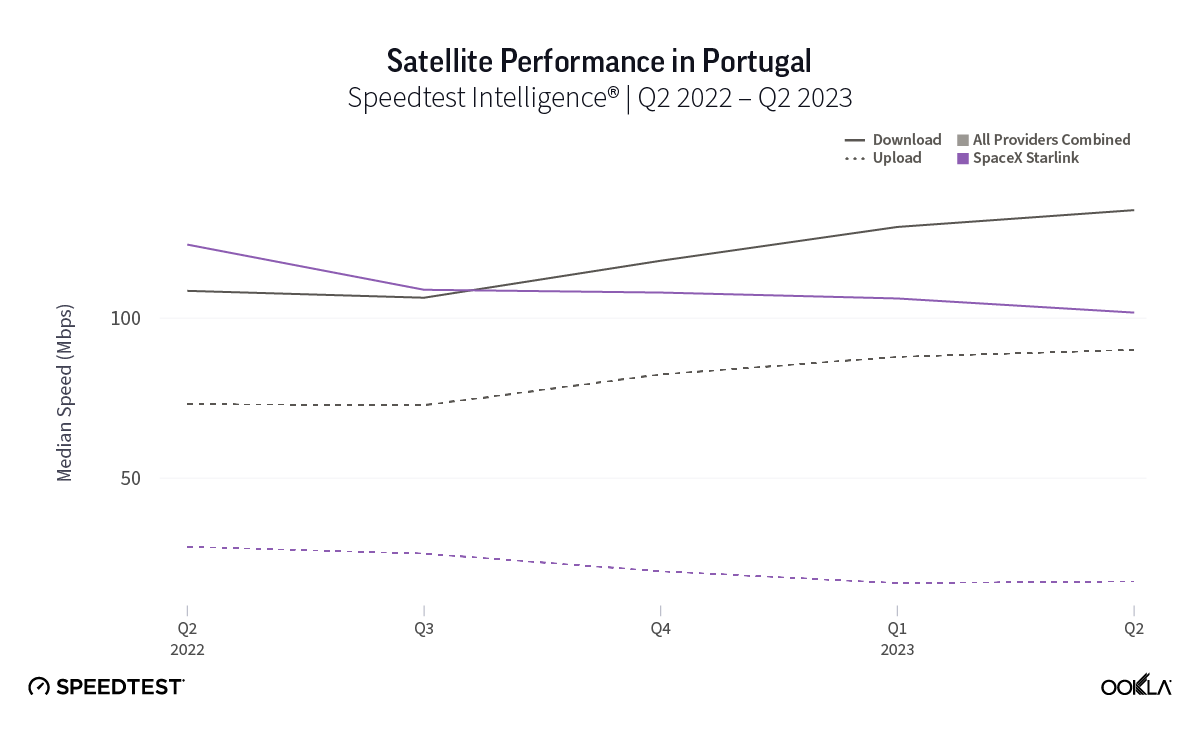
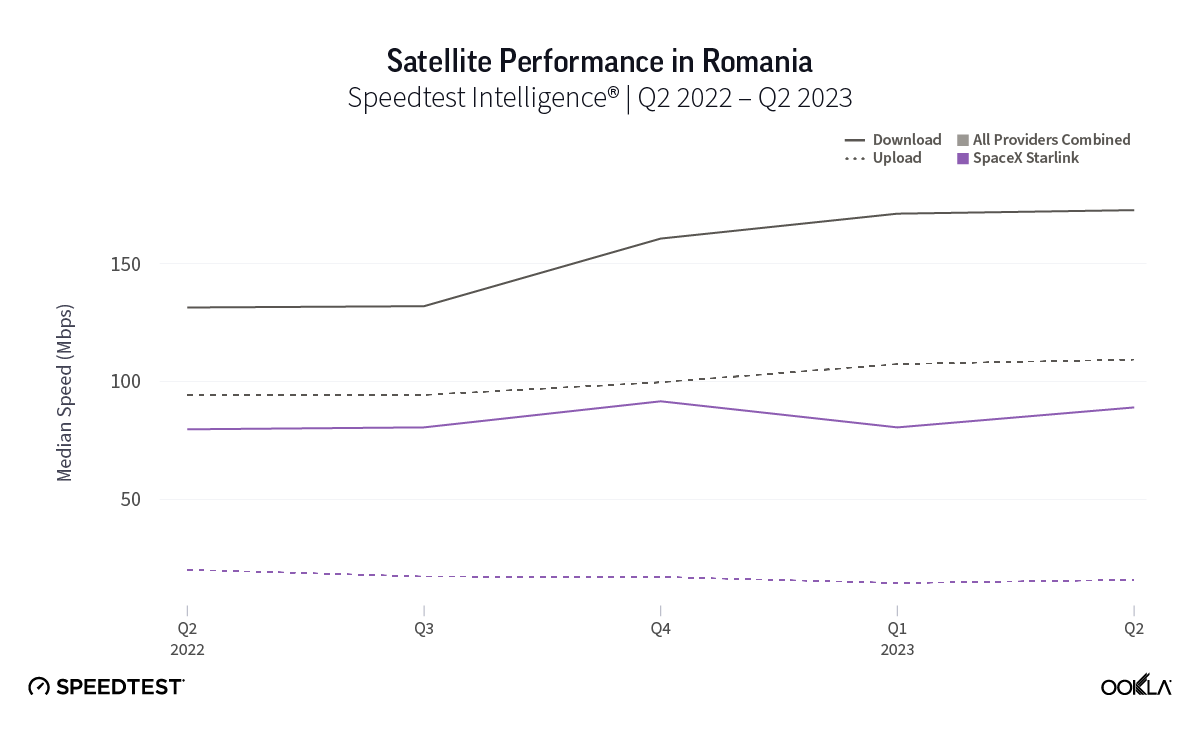
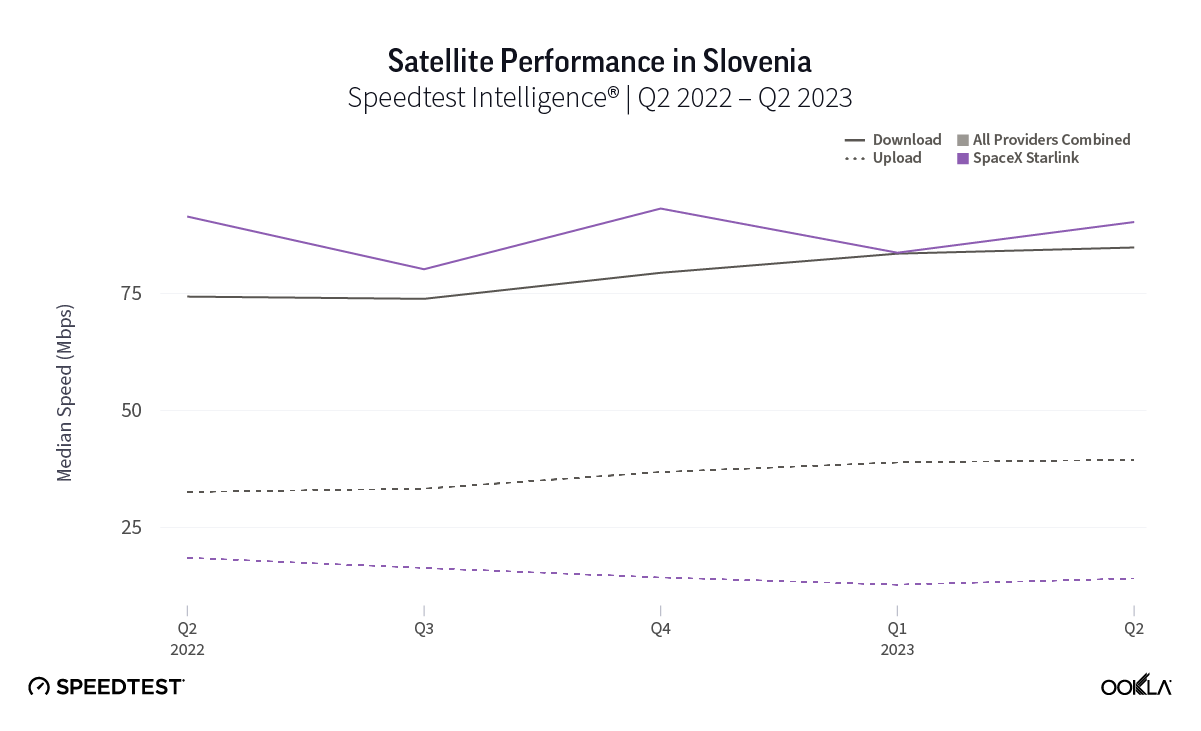
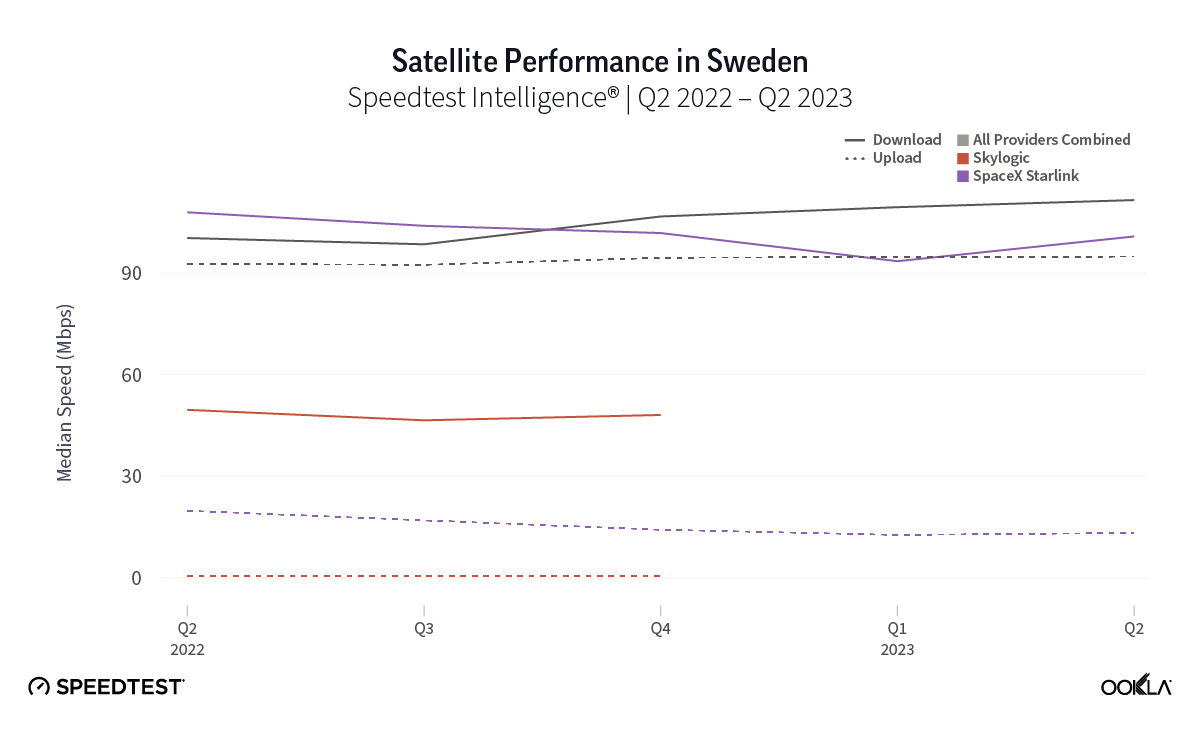
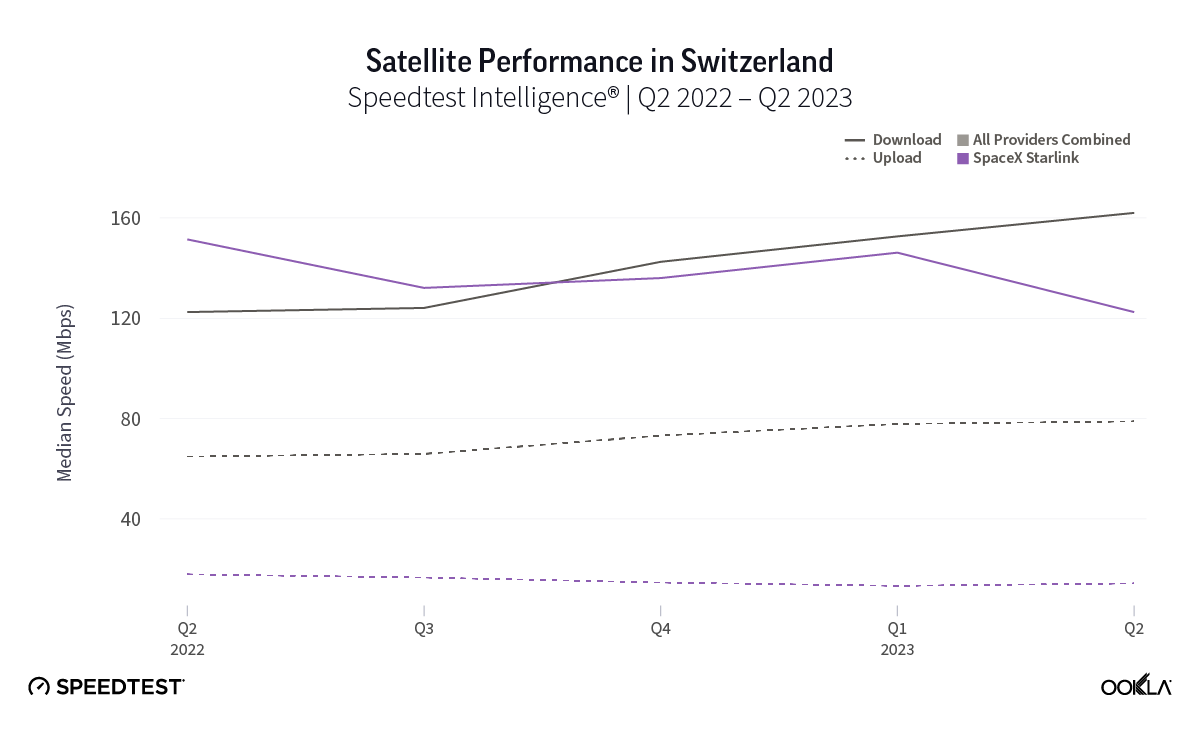
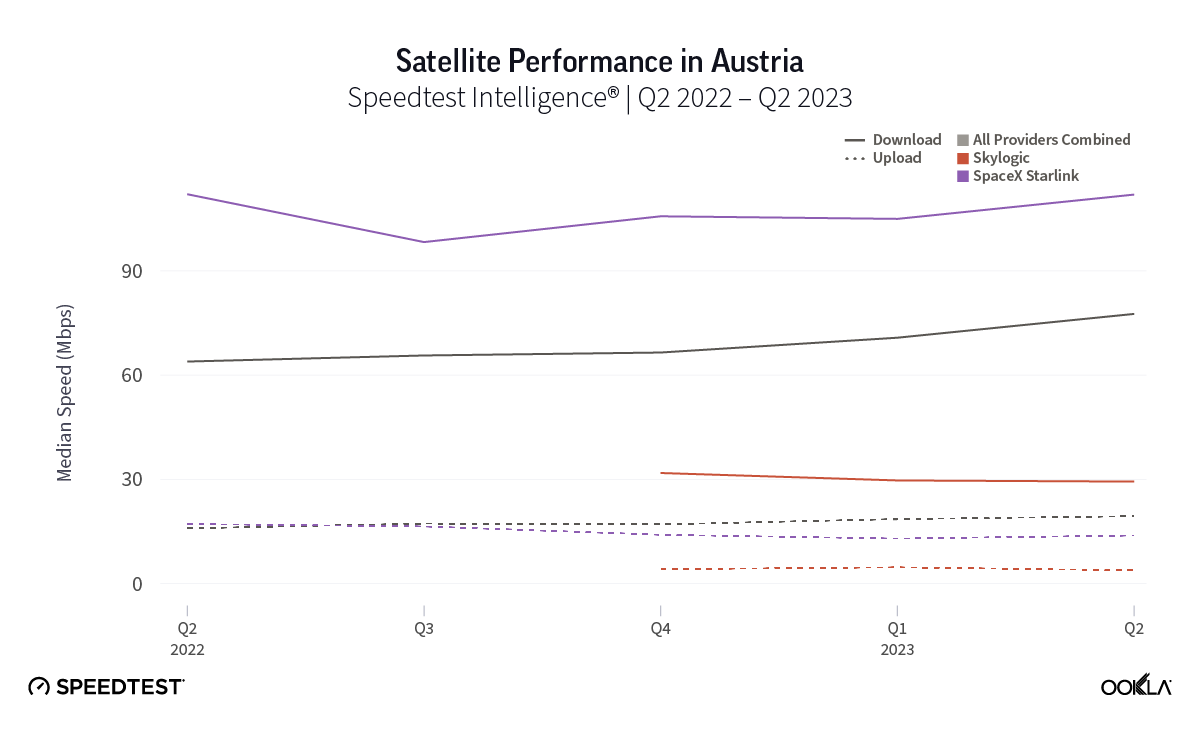
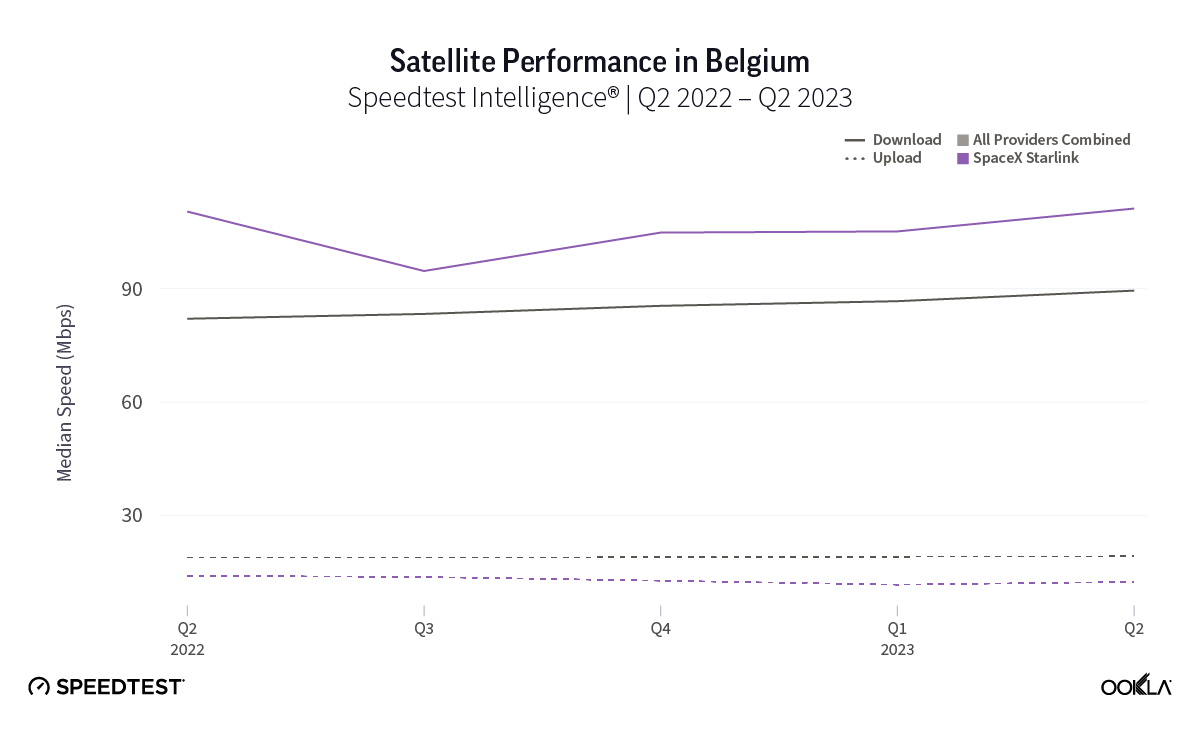
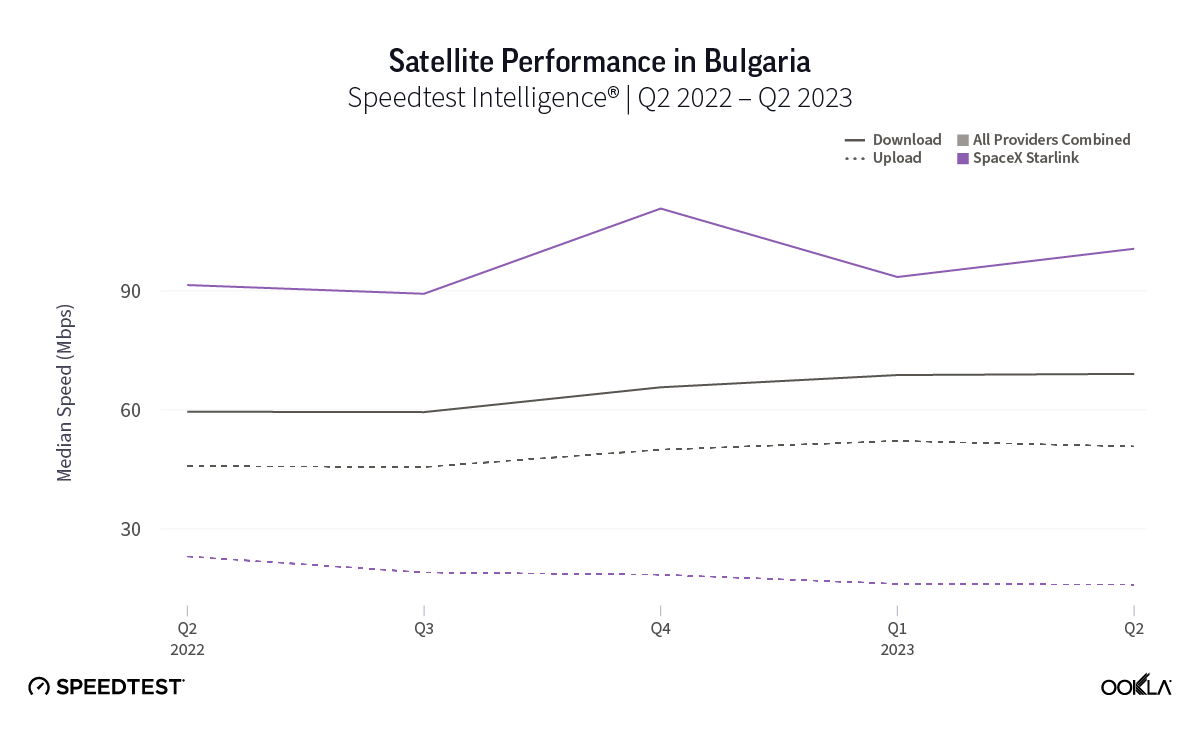
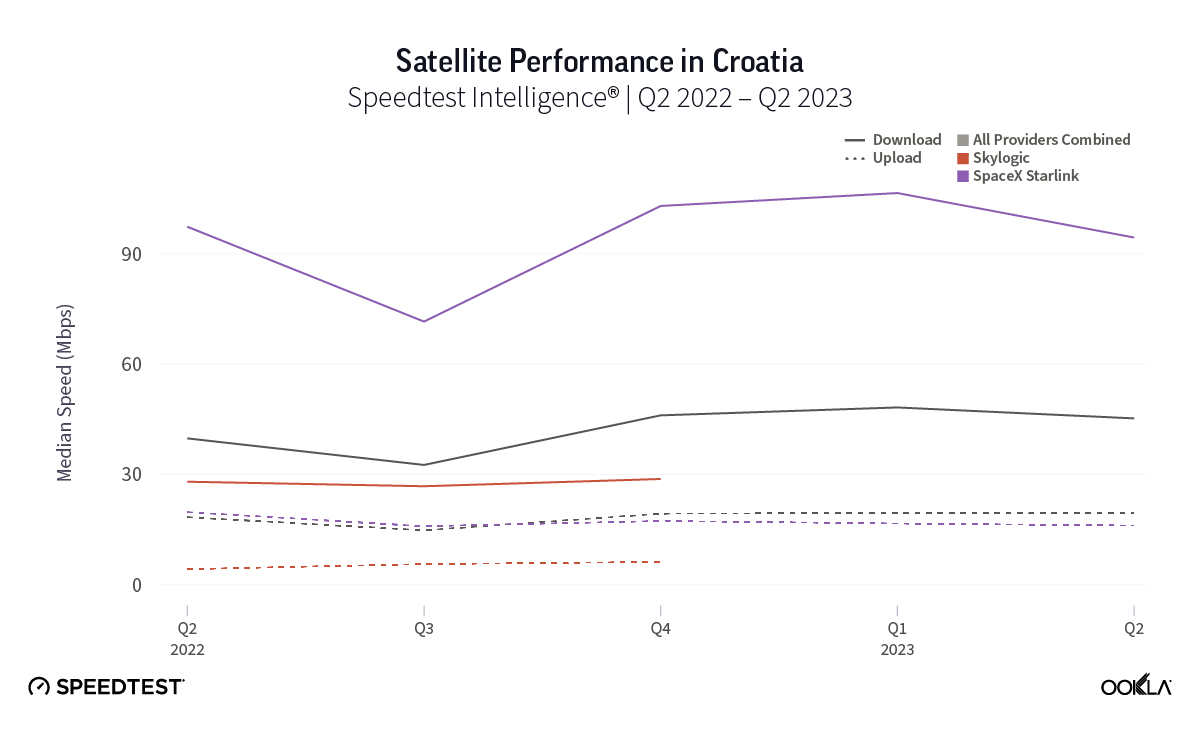
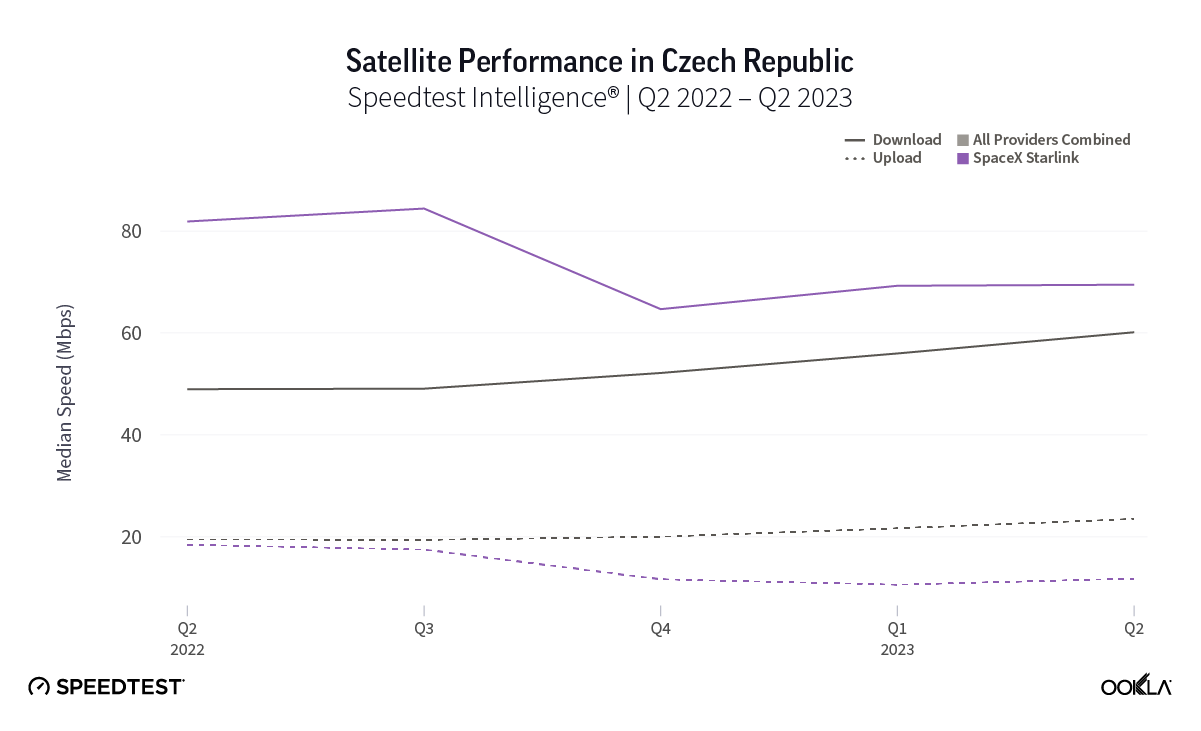
At first glance, year-over-year median download speeds for Starlink are about the same (-5% to 5%) or better (greater than 5%) from Q2 2022 to Q2 2023 in 15 countries and slower (decreasing more than 5%) in 8 countries. But among the 27 countries we surveyed during Q2 2023, Starlink had speeds faster than the aggregate of all fixed broadband providers combined in 11 countries (Austria, Belgium, Bulgaria, Croatia, Czechia, Estonia, Greece, Ireland, Italy, Latvia, and the U.K.) Those speeds were most notably faster in Croatia and Greece for Starlink at 94.41 Mbps to 45.24 Mbps and 108.97 to 44.09 Mbps, respectively, during Q2 2023. Speeds were about the same in four countries (Finland, Slovenia, Germany, and Lithuania), and speeds were slower than the aggregate of fixed broadband providers in 12 countries, most notably in Poland, Spain, Romania, Denmark, and France which saw between 50% and 105% faster aggregate fixed broadband speeds than Starlink.

Quarterly download speeds stabilizing or improving

Looking at results from Q1 2023 to Q2 2023, median download speeds for Starlink remained about the same (between 5% and -5%) in 23 countries, while decreasing in four countries. That’s a big deal, especially given Starlink had median download speeds greater than 100 Mbps in 14 countries, and greater than 90 Mbps in 20 countries, and greater than 80 in 24 countries — with only three countries failing to reach 70 Mbps.

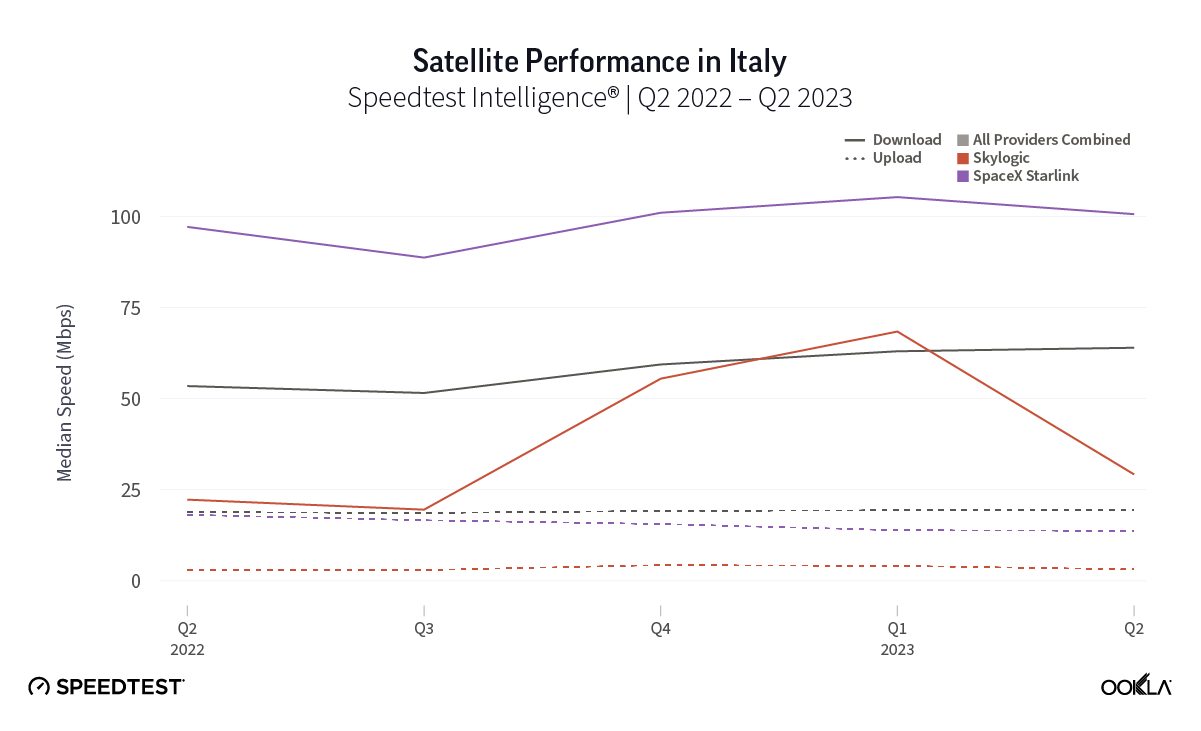
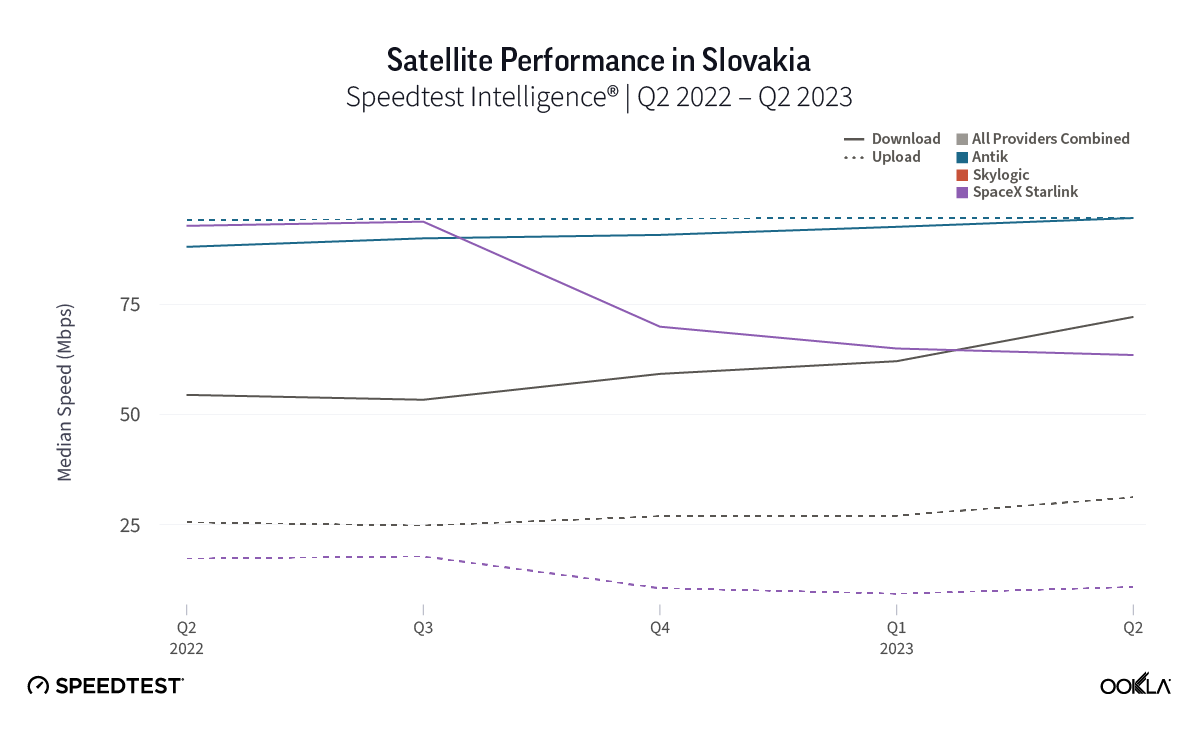
While trailing Starlink speeds, Skylogic recorded median download speeds in Italy at 29.21 Mbps during Q2 2023, a roughly 27% statistical increase year-over-year from 22.28 Mbps during Q2 2022. Notably, Skylogic recorded a median download speed of 68.44 Mbps in Italy during Q1 2023. Among the various countries we recorded Skylogic data for during the past year, the range of median download speeds varied between 19.53 Mbps and 68.44 Mbps, with most speeds between 28 and 50 Mbps, all fast enough to stream 4K video online. Viasat, had relatively similar download speeds in Germany and Italy at 17.22 Mbps and 17.45 Mbps, respectively, during Q2 2023. 

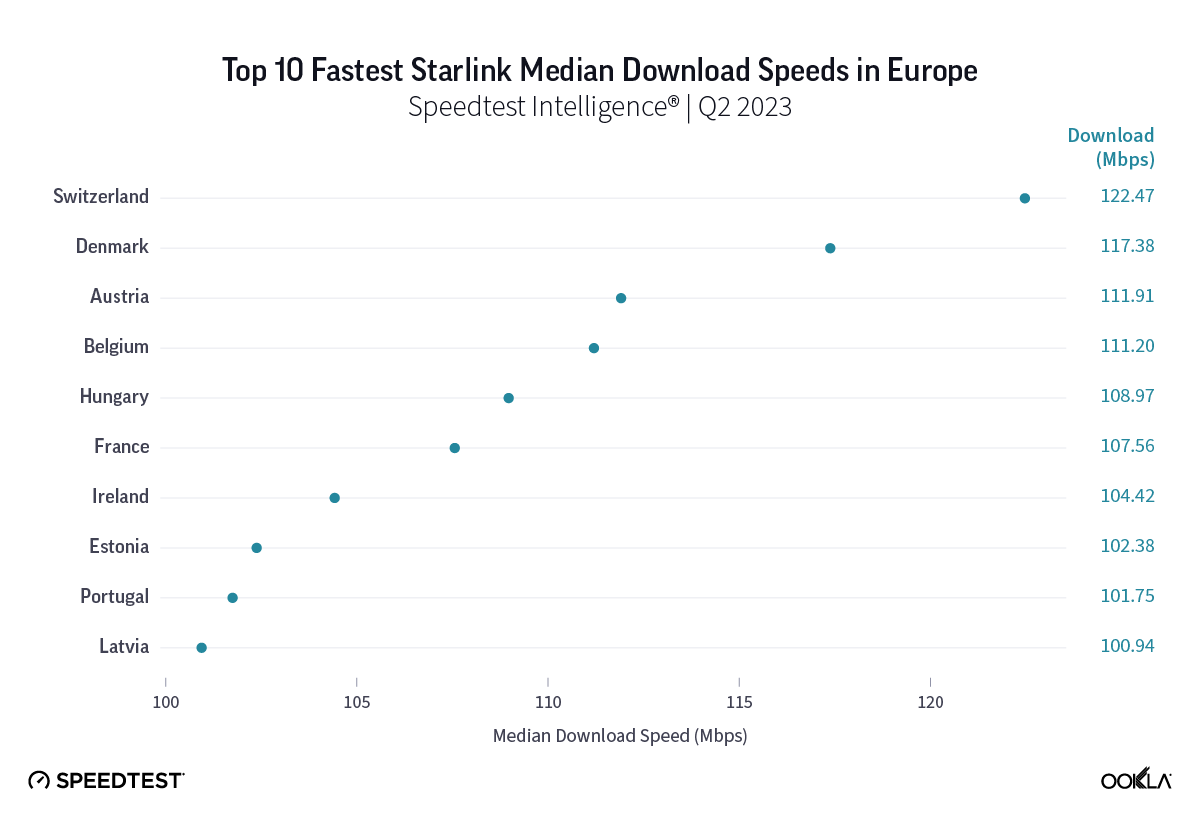
Top 10 fastest Starlink download speeds in European countries

Chart of Top 10 Fastest Starlink Median Download Speeds in Europe

Starlink in Switzerland had one of the fastest median download speed among countries with Starlink during Q2 2023 at 122.47 Mbps, followed by Denmark (117.38 Mbps), Austria (111.91 Mbps), Belgium (111.20 Mbps), Hungary (108.97 Mbps), France (107.56 Mbps), Ireland (104.42 Mbps), Estonia (102.38 Mbps), Portugal (101.75 Mbps), and Latvia (100.94 Mbps). Sweden, Italy, Bulgaria, and the U.K. all followed but had speeds greater than 100 Mbps.

Upload speeds for Starlink are down year over year, but quarterly speeds almost all improved or were about the same

Upload speeds for Starlink mostly decreased notably year over year, with only the U.K. showing an improved median upload speed in Q2 2023 out of 27 countries surveyed. However, looking quarter to quarter, Q2 2023 upload speeds for Starlink stayed about the same or improved in 25 out of 27 countries, with only Greece and Ireland showing declines. For upload speeds, Starlink all 27 countries we surveyed had upload speeds between 10 Mbps and 15 Mbps except Portugal (17.70 Mbps), Hungary (16.91 Mbps), Croatia (16.12 Mbps), Bulgaria (15.93 Mbps), Romania (15.82 Mbps), Spain (15.79 Mbps), and Poland (9.11 Mbps). Starlink in Greece was the only instance of a satellite provider in Europe having an upload speed greater than the aggregate of all fixed providers combined, 12.97 Mbps for Starlink to 7.85 Mbps for the aggregate of fixed broadband providers combined. Skylogic showed upload speeds lower than 4 Mbps in both Austria and Italy during Q2 2023. Viasat had upload speeds of 3.51 Mbps in Germany and 4.69 Mbps in Italy during Q2 2023. 

Multi-server latency is stabilizing for Starlink users across Europe

As an low-earth orbiting (LEO) satellite internet provider, Starlink has a leg up on some satellite competitors who rely on further away geosynchronous-earth orbit (GEO) and medium-earth orbit (MEO) satellite constellations. However, once again, all the aggregates of all fixed broadband providers in Europe had much lower multi-server latencies than Starlink, Viasat (which had latencies over 600 ms) and Skylogic (which had latencies over 700 ms). That being said, Starlink still saw multi-server latencies under 60 ms in the U.K. (51.26 ms), Spain (53.37 ms), Portugal (55.84 ms), and Belgium (59.34 ms). Starlink saw most countries’ multi-server latencies between 60 and 90 ms.

Starlink speeds stabilize in Oceania

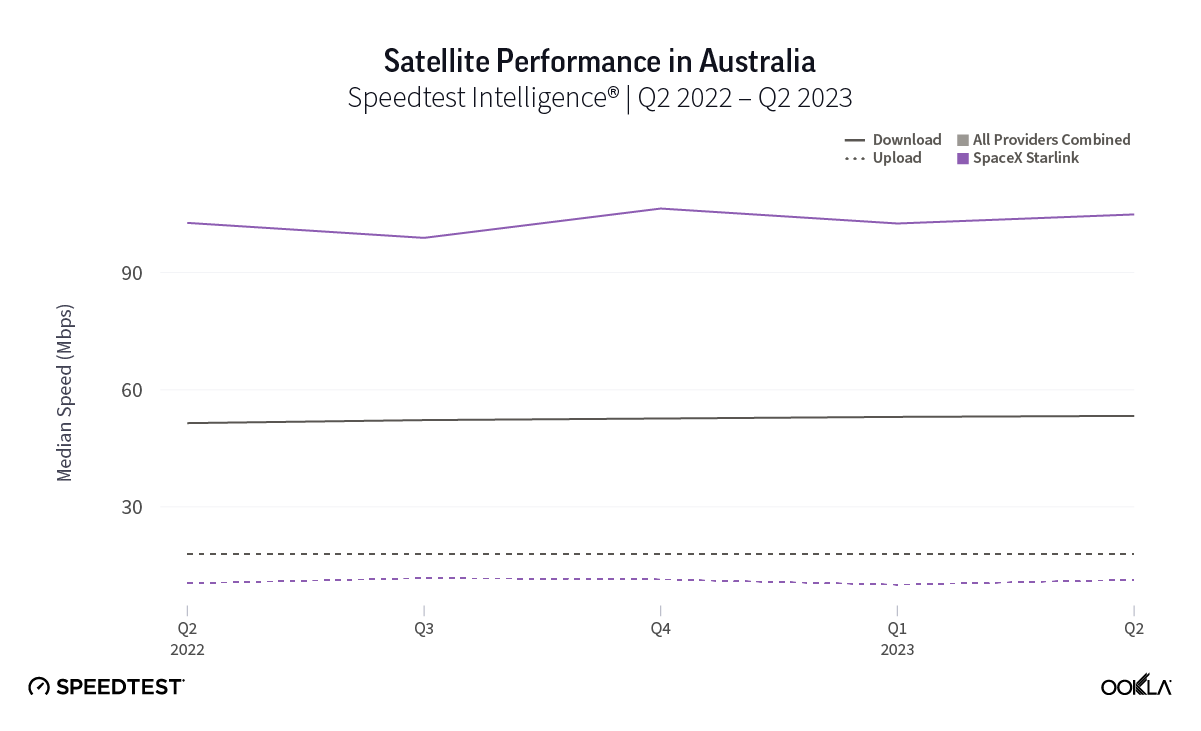
Oceania, the second least densely populated continent in the world to Antarctica, has rural and remote populations that benefit from (and even rely on) satellite internet connections. Luckily for rural and remote Starlink users, they’ve probably seen a good amount of stability over the past year with Q2 2023 median download speeds in New Zealand at 113.78 Mbps (105.99 Mbps in Q2 2022) and Australia at 104.92 Mbps (102.76 Mbps in Q2 2022). Tonga, which is very remote, saw download speeds drop from 45.25 Mbps in Q2 2022 to 37.95 Mbps in Q2 2023. 

Upload speeds also showed some stability with Australia going from 10.45 Mbps in Q2 2022 to 11.33 Mbps during Q2 2023 and New Zealand going from 12.31 Mbps to 14.62 during the same time period. Tonga saw a notable drop in speeds year over year from 19.26 Mbps in Q2 2022 to 6.66 Mbps Q2 2023. 

Multi-server latency, which usually will be higher for satellite internet options, showed promising results for Starlink in Oceania during Q2 2023. Multi-server latency dropped noticeably in New Zealand year over year, going from 89.38 ms in Q2 2022 to 46.42 ms in Q2 2023. Australia saw a more modest drop with multi-server latency going from 63.04 ms to 59.78 ms from Q2 2022 to Q2 2023. Tonga saw an increase in multi-server latency from 125.24 ms to 137.16 ms during the same time period.

Starlink in Africa is off to a promising start

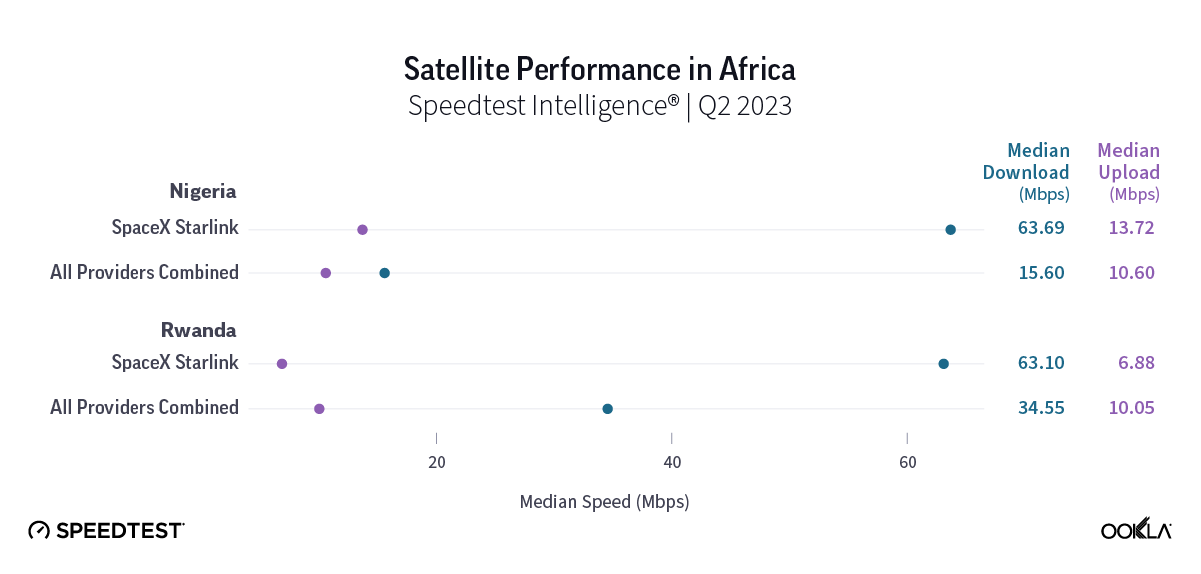
Chart of Satellite Performance in Africa, Q2 2023

Starlink, which first launched on the African continent in Nigeria this past January, is showing intriguing early results. Speedtest Intelligence showed that Starlink in Nigeria had a faster median download speeds than all aggregate fixed broadband providers combined at 63.69 Mbps to 15.60 Mbps during Q2 2023. Upload speeds were more similar during the same time period with Starlink at 13.72 Mbps and the aggregate of all fixed broadband providers combined at 10.60 Mbps. Starlink did have a marginally higher multi-server latency at 55.88 ms to 50.26 ms during Q2 2023.

In Rwanda, median download speeds were a little closer with Starlink recording a median download speed at 63.10 Mbps in Q2 2023 compared to the aggregate of all fixed broadband providers combined at 34.55 Mbps. Starlink trailed behind for median upload speed at 6.88 Mbps to 10.05 Mbps for fixed broadband providers during Q2 2023. Multi-server latency for Starlink was much higher at 320.45 ms to 29.04 ms for fixed broadband providers during the same time period.

The 2023 space revolution is off to a huge start

Here are some major updates about what’s next for various different satellite competitors:

After delays, Amazon’s Project Kuiper aim to launch prototype satellites this fall

Facing a series of rocket-related delays, Amazon recently announced it could send its first two Project Kuiper prototypes into orbit in late September. That news follows a recently announced $120 million 100,000-square-foot satellite processing facility at NASA’s Kennedy Space Center in Florida. Planning on offering internet service in 2025, Amazon is slated to have half of its 3,236 LEO satellite constellation in space by 2026.

China’s grand ambitions to provide internet connectivity to over 362 million people

According to the Wall Street Journal, over 362 million people in China don’t have access to the internet — which is about 1 in every 4 people in China, a large portion of which live in rural or remote communities. In order to overcome that connectivity gap, China is looking to the sky to create its own satellite constellation with potentially over 12,000 satellites. China’s biggest gap seems to be with recreating the success of SpaceX’s reusable rockets — however, initial tests are far underway and a host of reusable rockets are slated for test launches in 2024. 

SpaceX’s Starlink service offerings are about to rapidly expand

While Starlink continues to lead among satellite providers in most areas of the world, their expansion is only starting. Looking at the Starlink availability map, Starlink has an incredibly busy rest of 2023 and 2024 in Africa, Asia, and South America — and they’re marking their intent to expand into most of the world. That comes as Starlink marked launching over 5,000 satellites into space at the end of August. With some wiley entrepreneurs already renting out their Starlink “Dishy McFlatfaces” to vacationers and campers for $25-30 dollars a day, satellite connectivity is truly becoming a full-time gig.

Viasat’s bad luck might affect entire industry

Viasat launched the first of its three long-awaited Viasat-3 arrays — but then their first satellite suffered an antenna anomaly, which prevented a large reflector to deploy that affects whether or not the satellite can operate as intended. While Viasat is rushing to solve the issue, this could ultimately trigger a $420 million insure claim for the loss of the $700 million satellite. With such a high-value loss, this could send ripples through the satellite industry, causing insurance premiums to skyrocket for companies looking to mitigate potential losses through insurance. All of this comes on the heels of acquiring Inmarsat in May for $7.3 billion to expand its satellite arrays and spectrum holdings. We’ll be watching to see whether or not Viasat can find a solution. 

Eutelsat and OneWeb merger imminent, big moves abound

The Eutelsat and OneWeb merger should make competitors take notice — combining satellite networks, expanding enterprise offerings, and competing in emerging markets has big revenue potential — with OneWeb having an already established LEO network of 630 satellites and Eutelsat offering 36 GEO satellites. Of note, OneWeb recently inked a deal with Telstra in Australia to provide satellite backhaul for locations “where satellite backhaul is a preferred or only viable option.” OneWeb is also partnering with the European Space Agency to develop a next-gen 5G beam-hopping satellite, which could quickly increase connectivity for people traveling or for disaster areas that need emergency connectivity. Shareholders are set to vote on approving the merger on Sept. 28.

European Union greenlights multi-orbit constellation

With grand ambitions to launch a multi-orbit, €6 billion constellation in 2024, the European Union is partnering with a consortium of industry players including Airbus, SES, Eutelsat, Hispasat, and Thales to develop the EU’s IRIS² project. The EU still expects to have the first of its satellites go live by the end of 2024 and have a fully operational constellation by 2027.

HughesNet aiming to launch Jupiter 3 array in Q2 2023

HughesNet successfully launched its Jupiter 3 array on July 29, which aims to provide U.S. and Latin America consumers with higher broadband download speeds. While the actual satellite will take some time to reach its geosynchronous orbit and deploy, this satellite adds 500 Gbps of Ka-band capacity for HughesNet, which could see consumers reaching download speeds between 50 Mbps and 100 Mbps. We’ll be eagerly awaiting Speedtest® results from HughesNet’s Jupiter 3 array.

Ookla will continue monitoring new satellite internet developments

2023 continues to be an important year for satellite internet providers. Satellite connectivity is something we’ll be watching closely and we’ll continue our series next quarter with Q3 2023 data from select continents including North America. In the meantime, be sure to download the Speedtest app for Windows and Mac computers or for iOS or Android for devices and see how your satellite internet stacks up to our results.

Ookla retains ownership of this article including all of the intellectual property rights, data, content graphs and analysis. This article may not be quoted, reproduced, distributed or published for any commercial purpose without prior consent. Members of the press and others using the findings in this article for non-commercial purposes are welcome to publicly share and link to report information with attribution to Ookla.

| February 16, 2025

5G in High Places: Indoor Coverage Across the World's Iconic Skyscrapers

Skyscrapers are not just architectural achievements; they also test the limits of telecommunications and connectivity systems. These structures highlight both the obstacles and innovations required for seamless connectivity in high-rise environments. This report, using data from Cell Analytics™, benchmarks the 5G indoor coverage experience in nine of the world’s most iconic buildings by analyzing the average Reference Signal Received Power (RSRP) and Reference Signal Received Quality (RSRQ), providing critical insights into the signal strength and quality that subscribers experience within these architectural marvels.

Icons That Shape Skylines

Modern skyscrapers are more than just towering structures—they shape city skylines, serve as commercial and cultural hubs, and play a crucial role in defining a nation’s global presence. Their impact also goes beyond aesthetics. They contribute significantly to a city’s economy by attracting businesses, investors, and tourists. For example, the Burj Khalifa in Dubai has helped position the city as a global business and tourism hub, drawing millions of visitors each year. Similarly, the Empire State Building in New York remains a historic landmark and one of the most visited tourist attractions in the world.

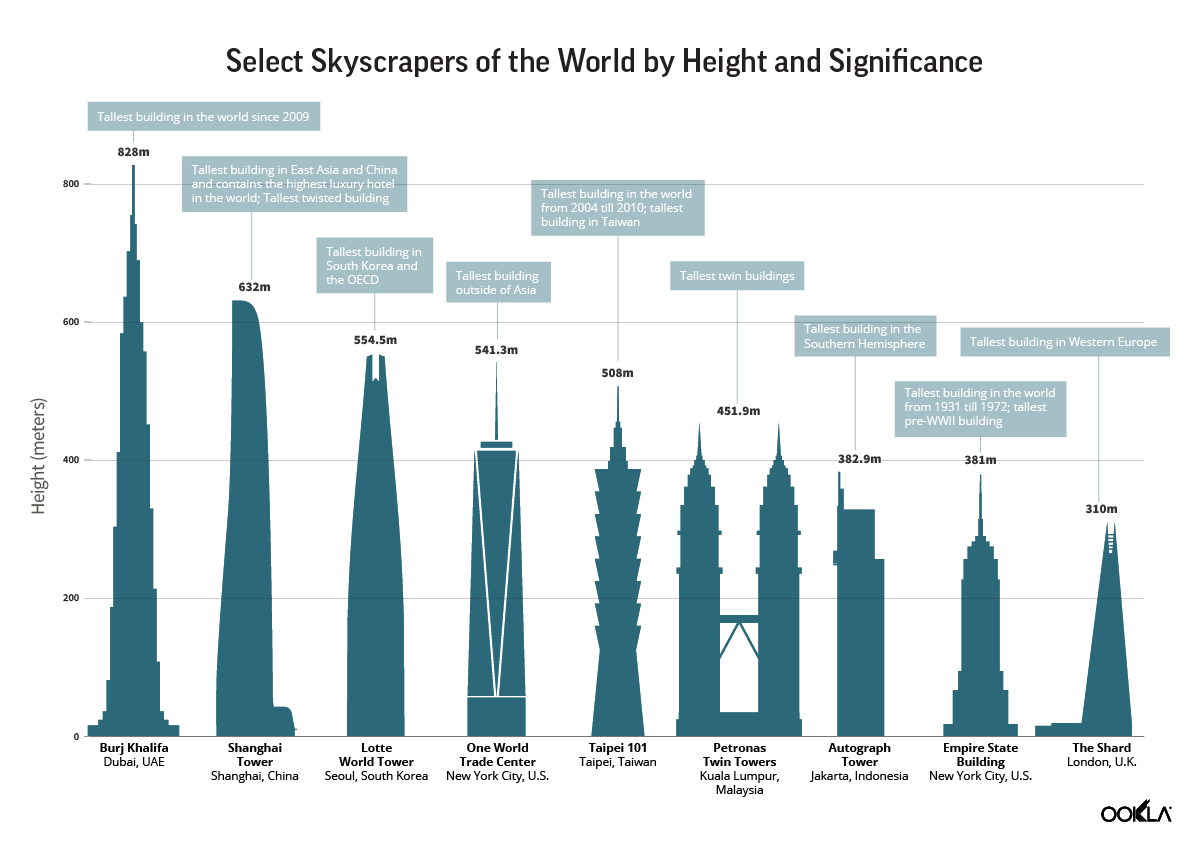
Using Ookla® Cell Analytics™ data, we analyzed nine of the most iconic buildings in the world, recognized for their unique architectural designs, global influence, and economic and cultural significance.

Chart of select skyscrapers of the world by height and significance

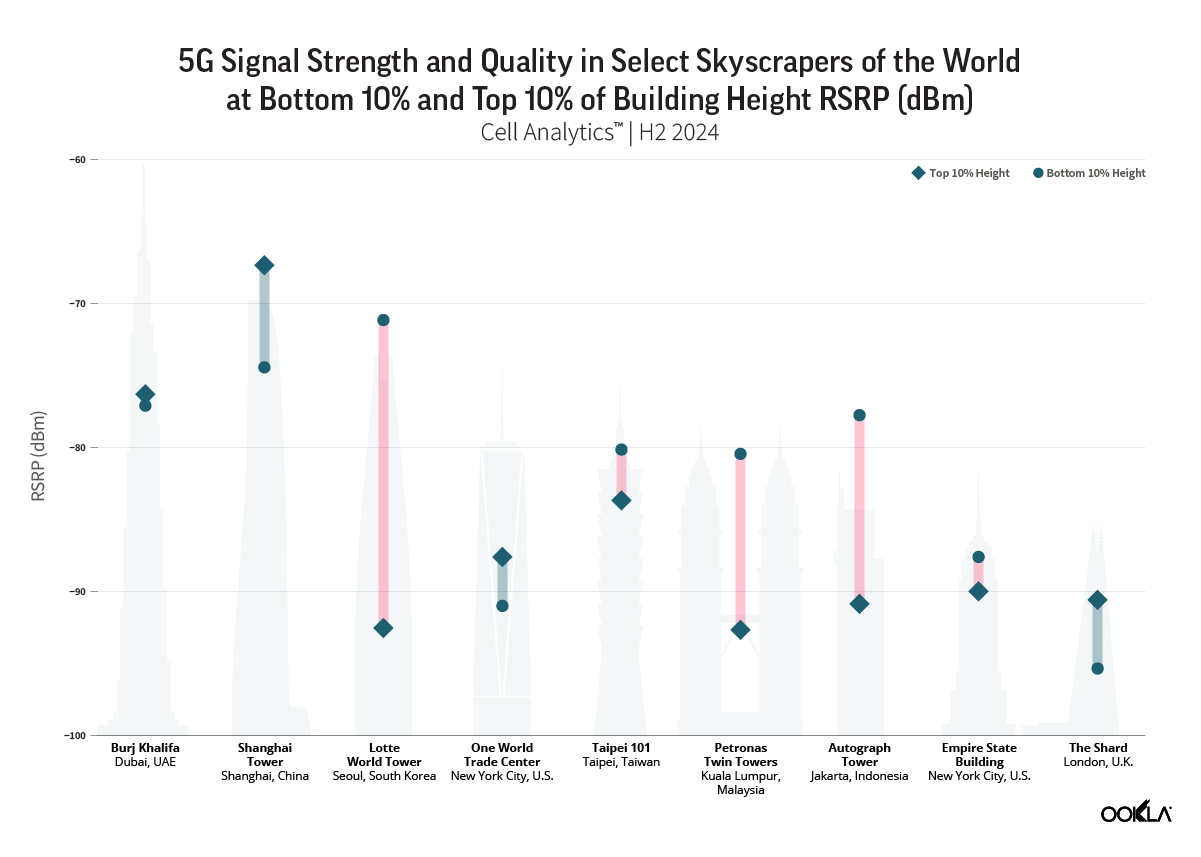
Most skyscrapers provide strong signal strength but coverage gaps still exist

Drilling down into data at the individual building from the second half of 2024, we evaluated subscribers’ 5G indoor experience by measuring the average Reference Signal Received Power (RSRP) and Reference Signal Received Quality (RSRQ). RSRP represents the network signal strength received by a mobile phone. An RSRP value that exceeds -90 dBm indicates superior coverage. If the signal strength is between -90 dBm and -100 dBm, then network coverage is considered good. Below this range, expect slower download speeds and potential network disconnections. RSRQ is a metric used to evaluate the quality of the reference signal received by a device. A value of -10 dB or higher indicates excellent network quality while a value between -10 dB and -15 dB is considered good. An RSRQ value lower than -15 dB is poor or indicates no signal at all.

Overall, the ​​5G indoor coverage across the nine skyscrapers reveals that most buildings provide superior 5G signal strength, as well as excellent network quality. However, some still face challenges in ensuring consistent connectivity. Shanghai Tower recorded the strongest 5G signal among all buildings, with a weighted average RSRP of -71.04 dBm of all samples detected inside the building. This suggests a well-optimized indoor network, likely supported by China’s extensive 5G infrastructure. As China is one of the major leaders in 5G deployment, major urban centers like Shanghai benefit from advanced indoor network solutions, such as small cells and distributed antenna systems (DAS), ensuring strong coverage even in high-rise environments.

Burj Khalifa in UAE, and the Empire State Building New York City, showed strong 5G coverage, with average RSRP values of -85.53 dBm and -83.19 dBm, respectively. Both buildings also reported very good signal quality, with an average RSRQ of -11.07 dB and -11.95 dB respectively. The Empire State Building, completed in 1931, has undergone modernization efforts to enhance its telecommunications infrastructure. Similarly, the Burj Khalifa benefits from Dubai’s extensive 5G rollout, with the UAE ranking among the top countries in 5G performance.

The Shard in London reported the weakest 5G coverage among the selected buildings, with an average RSRP of -96.69 dBm. The Shard’s glass-heavy design may contribute to this weaker performance, as glass can reflect and absorb mobile signals. The building also reported a much weaker signal strength in the lower 10% with RSRP value of -113 dBM, indicating that in certain areas of the building, users are experiencing poor 5G coverage and quality.

Taipei 101 and the Petronas Twin Towers in Kuala Lumpur, showed good average 5G RSRP but experienced weaker signals in certain areas. The lower 10% RSRP values for both buildings were below -100 dBm (-105.00 dBm for Taipei 101 and -101.00 dBm for Petronas Twin Towers), suggesting that parts of these buildings may suffer from inconsistent coverage. Taipei 101 was designed to withstand earthquakes and typhoons, incorporating thick concrete and reinforced steel, which can interfere with mobile signals. While the Petronas Twin Towers currently lack a dedicated indoor 5G coverage solution.

One World Trade Center in New York City and Autograph Tower in Jakarta had similar 5G characteristics, with very good average RSRP around -85 dBm or better, but the reported lower 10% values suggest potential dead zones or weaker coverage in some areas.

From lobby to observation deck

Using Cell Analytics data, we compared the 5G the average RSRP and RSRQ at two different height levels in each skyscraper: Bottom 10% of the building height, which represents coverage on the lower floors, based on samples collected closest to the ground floor, and Top 10% of the building height, which represents the highest levels, based on samples collected at the floors nearest to the top of the building.

Several skyscrapers showed minimal differences in 5G signal strength and quality between the lowest and highest floors. Burj Khalifa, One World Trade Center, Taipei 101, and the Empire State Building all had RSRP variations of 3 dBm or less between measurements taken at the bottom and top levels. The Burj Khalifa, the tallest building in the world at 828 meters, reported a slight improvement from -77.09 dBm at the lower floors to -76.30 dBm at the top.

Burj Khalifa, Taipei 101, and the Empire State Building also reported consistent 5G RSRQ between their lower and top floors, indicating stable 5G network quality. All four buildings have high-altitude observation decks, where strong 5G coverage is essential for tourists, businesses, and building operations.

In contrast, some skyscrapers exhibited noticeably larger differences between the lower and top floors RSRP and RSRQ, with weaker 5G signals at their higher levels. Petronas Twin Towers, Lotte World Tower, and Autograph Tower all showed a significant decline in signal strength as elevation increased. Petronas Twin Towers recorded a relatively strong -80.44 dBm at nearer to ground levels, but this dropped to -92.67 dBm at the top. This is mainly due to the lack of a dedicated indoor 5G coverage solution, with most 5G signals coming from outdoor cell towers. Similarly, the RSRP at Lotte World Tower fell from -71.14 dBm at the lower floors to -92.54 dBm for samples at the highest point. This suggests that while the lower sections of these buildings benefit from stronger 5G coverage, the network infrastructure at the upper floors may not be as robust.

Reliable 5G coverage in skyscrapers requires targeted network solutions

Skyscrapers play a key role in modern cities as business hubs, residential spaces, and major tourist attractions, making strong indoor 5G coverage essential. Tourists visiting observation decks, businesses operating in high-rise offices, and residents in skyscraper apartments all require seamless connectivity for work, communication, and entertainment. However, the primary challenge lies in delivering consistent performance and quality across various indoor settings, where issues may be confined to certain floors or sections. Modern building materials, such as low-emissivity (Low-E) glass, can significantly impact 5G signal attenuation by blocking or reflecting radio frequencies, especially in high-frequency bands like mmWave.

These challenges highlight the need for dedicated indoor solutions such as small cell deployments, distributed antenna systems (DAS), and enhanced in-building network infrastructure. An alternative to deploying in-building 5G systems is to selectively offload usage to Wi-Fi provided these systems are designed, optimized, and operated to deliver an equivalent quality of experience – this can be done using Ekahau.

As 5G continues to evolve, telecom providers and building developers must work together to improve indoor network quality, ensuring that users at all levels of a skyscraper experience fast, stable, and uninterrupted connectivity. For operators, 5G indoor deployments are a strategic avenue to monetize their investments through advances such as massive IoT (IoT), enhanced mobile broadband (eMBB), and fixed wireless access (FWA), which will all play an important role in transformation across sectors such as industrial automation, retail applications, and smart cities.

Ookla can assist operators in identifying buildings or indoor venues with coverage or capacity issues using crowdsourced data and diagnosis. Powered by millions of signal measurements collected daily by Speedtest®, Cell Analytics provides intelligence about wireless service quality, RF measurements, data usage, user density, cell site locations, and much more. To find out more about Cell Analytics, please get in touch.

Ookla retains ownership of this article including all of the intellectual property rights, data, content graphs and analysis. This article may not be quoted, reproduced, distributed or published for any commercial purpose without prior consent. Members of the press and others using the findings in this article for non-commercial purposes are welcome to publicly share and link to report information with attribution to Ookla.
| April 16, 2025

Mind the Gap: London's 5G Performance Lags Behind Other UK Cities

Londoners spend more time in mobile signal not-spots, or coverage gaps, and experience slower 5G speeds than residents of other UK cities—resulting in poorer performance in everyday tasks such as web browsing.

London is the sprawling metropolis at the heart of the UK economy, home to one of the world’s largest and most lucrative service hubs, supporting a vast network of finance and technology firms. Beyond its strategic time zone and English-language advantage for accessing both American and Asian markets, London’s prosperity has been founded on the availability of world-class infrastructure that facilitates doing business.

The city’s reputation for international competitiveness has not, however, been matched by the quality of its telecommunications infrastructure. In recent years, a flurry of media reports has highlighted the frustrations of Londoners—and visitors alike—that experience frequent issues using mobile devices indoors, underground, and in busy areas. These problems, reported as being more pronounced than in other UK and European cities, typically manifest as poor quality of experience in everyday tasks such as web browsing, video streaming, and gaming.

This article is the first and a high-level prelude to a series exploring the competitiveness of mobile networks in European towns and cities—starting in the UK with city-level comparisons to London, and followed by a deeper, more comprehensive analysis among international peers coming in research later this year. 

Key Takeaways:

  • London lags behind the UK’s largest cities across key 5G performance indicators, and the gap to top-performing Glasgow is widening. In Q1 2025, London trailed other UK cities in 5G network consistency—a key indicator of performance at the lower end of the user experience—as well as in median download and upload speeds. Mobile users in London and Belfast experienced the weakest outcomes among UK cities, with median 5G download speeds of approximately 115 Mbps in both cities, significantly behind Glasgow’s 185 Mbps. London’s marked underperformance makes the UK unique in Western European terms—not only are the disparities between its major cities wider, but it is also unusual for the capital to be the primary laggard.
  • Mobile users in London spend more time in signal not-spots with no service than residents of other UK cities, reflecting lingering coverage gaps indoors and across key transport routes. The proportion of Londoners spending the majority of their time in locations with no service (0.7%) remained higher than in other UK cities in Q1 2025, but has improved significantly from 3.7% in Q1 2023. This progress reflects operator investments in network densification through small cells and the ongoing rollout of mobile coverage across the London Underground—historically one of the city’s largest mobile not-spots—which have together enhanced overall network availability in the capital. Time spent on 2G networks increased, however, across several UK cities over the last year, including Birmingham and Manchester, as the advancement of the 3G sunset in the UK contributed to greater propensity for 2G fallback.
  • The gap in 5G availability between the UK’s major cities and the national average has significantly narrowed over the past year. In Q1 2024, Leeds led UK cities in 5G availability, with a 21 percentage point gap above the national average. By Q1 2025, London had taken the lead in 5G availability among major UK cities, and that gap above the national average had narrowed to 13 percentage points. This trend reflects progress in 5G network expansion in smaller UK towns and rural areas in recent months, which has moved at a faster pace than coverage improvements in larger cities. Overall, median 5G download speeds fell by more than 7% on average across major UK cities between Q1 2024 and Q1 2025, likely reflecting the impact of shifting network load from older technologies onto 5G, which contributed to broader improvements in overall mobile network performance in most UK cities in the same period.

A confluence of factors has created unique headwinds for mobile network deployments in UK cities in recent years, particularly in dense urban settings like London

The deployment of 5G networks in higher-frequency spectrum—most commonly the 3.5 GHz band—continues to present significant challenges for operators globally. Like their counterparts across Europe, UK mobile operators have had to invest heavily in network densification during the 5G cycle. The widespread deployment of small cells at street level across UK cities illustrates the scale of effort required to increase network capacity and overcome the more limited propagation attributes of mid-band spectrum.

Over time, the city environment itself has become increasingly hostile to the operation of high-performing mobile networks. Across developed markets, advancements in building design and stricter regulations have led to a proliferation of highly insulated, airtight structures. These developments often incorporate low-E glass, metal cladding, and reinforced concrete—materials that, collectively, turn new and retrofitted buildings into de facto Faraday cages. London, in particular, presents unique challenges among UK cities, with a high concentration of high-rise buildings featuring deep floorplates. 

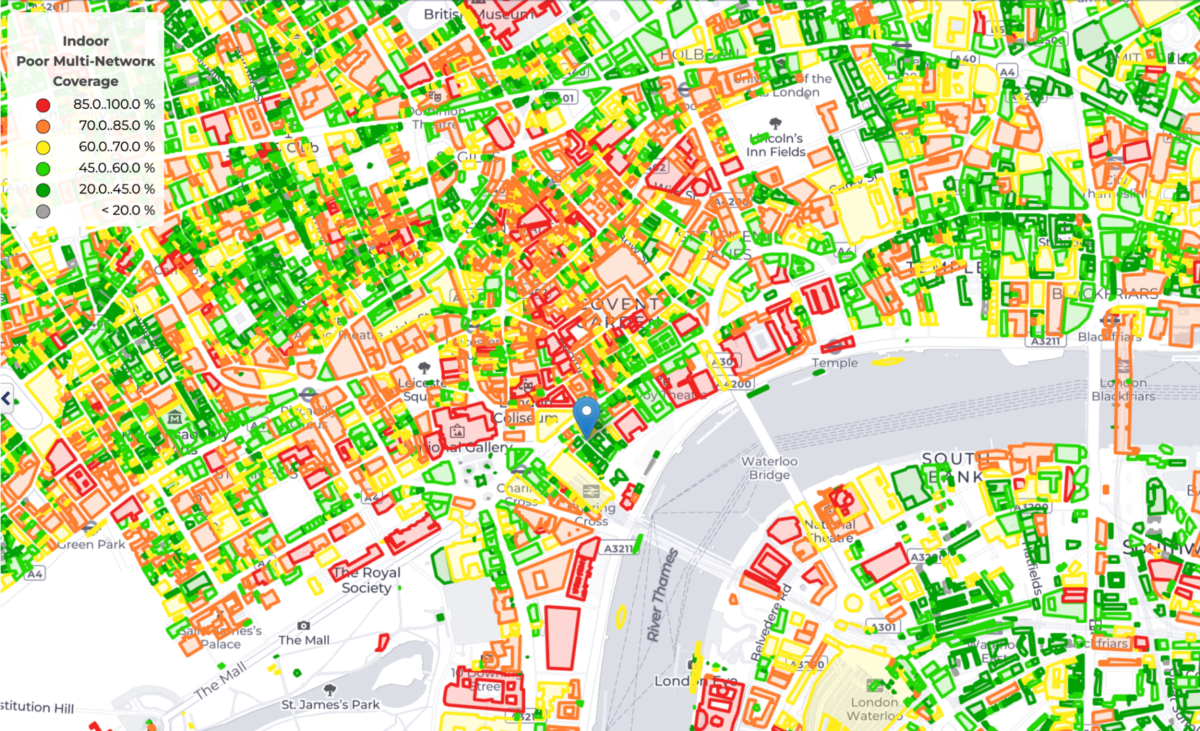
Indoor Mobile Not-Spots Have Proliferated Across Central London, Particularly in Dense Settings with New and Retrofitted Builds (Image: Ookla Cell Analytics)

While the UK’s Part L Building Regulations are not unique or unusually stringent by European standards, they have evolved alongside a set of factors particular to the UK context that have significantly hindered mobile operators’ ability to deliver high-performing 5G networks in dense urban environments. The roots of these factors stem as far back as 2017, well before the commercialization of the country’s first 5G networks, when the UK government introduced changes to the Electronics Communications Code (ECC) in an effort to accelerate mobile network rollouts and reduce costs by streamlining access to land for telecommunications deployments. 

The Digital Economy Act, which reformed the ECC, granted mobile operators and tower companies greater rights to access land on more favorable financial terms in the UK. The intention was to curb inflated lease costs, particularly in cases where landowners appeared to demand “ransom rents.” However, rather than accelerating network rollouts, the reforms triggered widespread legal disputes, uncertainty in lease negotiations, and delays in site access and upgrades. 

The impact of these land access reforms has been especially acute in dense urban settings such as London, where rooftop deployments play a disproportionate role due to limited ground-level space for mobile equipment. In London, the sheer number of individual property owners—including private landlords, commercial building managers, and housing associations—results in highly fragmented land ownership, making rooftop sites significantly more complex to manage, both legally and logistically, than rural ground leases.

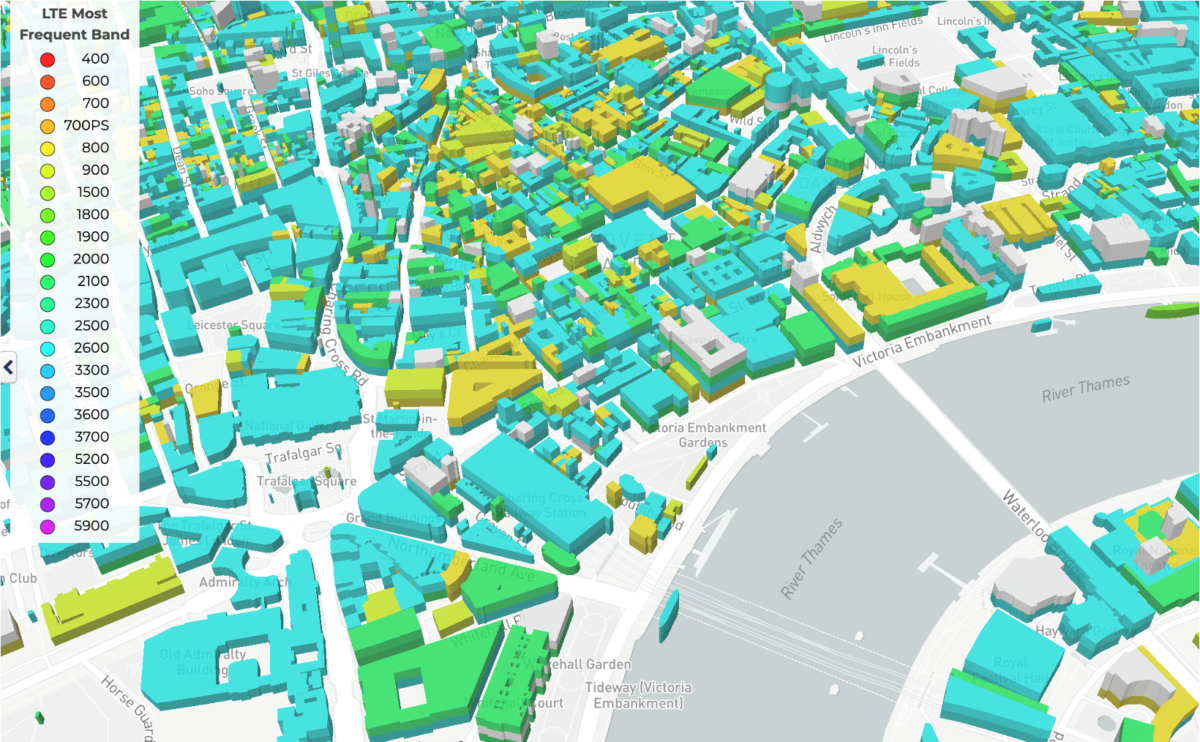
The Combination of Increasing Building Density, Use of New Insulation Materials, and Decline in Rooftop Site Availability Has Resulted in More Frequent Fallback to Less Capable Low-Band Spectrum in UK Cities like London (Image: Ookla Cell Analytics)

The EEC further compounded this complexity by disrupting long-standing rooftop leasing arrangements in cities like London, leading to thousands of disputes since 2017 over issues such as ransom rents, blocked site upgrades, and non-renewals. The regulation reduced potential rental income by as much as 80% to 90% for some landlords, significantly discouraging the availability of rooftop space for mobile network deployments. This effect was particularly pronounced in London, where building owners have seen greater commercial value in alternative uses for scarce rooftop space, such as bars, gardens, or solar panel installations, hindering the ability of operators to densify their networks. 

The UK is the only European country to have adopted such a unilateral price-cutting approach to site access during the 5G cycle. To ease tensions between operators and land owners, the UK government introduced further changes in the “2022 Product Security and Telecommunications Infrastructure Act.” These updates aimed to encourage alternative dispute resolution, simplify lease renewals, and extend the provisions from the EEC to agreements signed before 2017. However, the reforms retained the reduced rental model, meaning while procedural barriers were reduced, incentives for property owners to host rooftop sites remained weak, failing to stem the decline in rooftop site availability in cities like London in recent years.

Combined with the UK’s decision to impose stricter controls on the use of telecom equipment from non-European vendors than those seen elsewhere in Europe, which diverted time and resources toward network rebuilds rather than expansion and upgrades, UK operators have faced significant headwinds in deploying mobile network infrastructure during the 5G cycle.

Progress in the 5G rollout belies lingering performance disparities among the UK’s major cities

Despite significant progress countrywide in improving 5G networks with additional sites, more spectrum availability (some of it from the refarming of 3G), and an expanded 5G standalone (SA) footprint, disparities continue to exist among the UK’s cities. The gap between the best- and worst-performing major cities in median 5G download and upload speeds, for example, widened between Q1 2024 and Q1 2025, based on analysis of Speedtest Intelligence® data.

The Gap in 5G Download Speeds Between Glasgow and Other UK Cities Has Widened
Speedtest Intelligence® | Q1 2024 – Q1 2025


In Q1 2025, Glasgow led the UK with median 5G download speeds reaching 185 Mbps, which was as much as 47% higher than in London, the slowest major city, and 24% higher than in Birmingham, the next best performer. This ranking profile extended to 5G network consistency, which measures the proportion of Speedtest samples that meet a minimum download and upload speed threshold of 25 Mbps and 3 Mbps. While more than 85% of Speedtest samples met this threshold in Glasgow, fewer than 75% did in London, which exhibited the lowest consistency rate among major UK cities and was the only one aligned with the national average that includes both rural and urban areas.

London’s underperformance at the lower percentiles of measures like download speeds is particularly notable, as it strongly reflects the experience of mobile users in more challenging conditions—such as at the network edge, during peak hours, or in congested areas. The city’s lower consistency score and weaker 10th percentile download and upload speeds suggest that Londoners are more likely to encounter poor mobile performance compared to residents of other major UK cities.

Londoners Experience Less Consistent 5G Performance Than Residents of Other UK Cities
Speedtest Intelligence® | Q1 2025

The UK stands out in Western Europe for both the scale of the performance gap between its major cities and the unusual fact that its capital is the lagging city. Most regional peers more closely resemble the profile of neighboring France, where Paris ranks among the top three cities nationally for 5G network consistency, as well as median download and upload speeds. In France, the gap in 5G network consistency between the best- and worst-performing cities was as narrow as 5 percentage points in Q1 2025—a disparity that is half that of the UK.

The UK's Cities Exhibit a Greater Range in 5G Consistency Than Other Western European Countries
Speedtest Intelligence® | Q1 2025

In practical terms, London’s underperformance in metrics like 5G download speed and consistency translates into poorer QoE outcomes in everyday tasks like web browsing. In Q1 2025, for example, median web page load times to popular global websites were higher in London than in nine out of ten other major UK cities.

Londoners Spend More Time Waiting on Popular Websites to Load
Speedtest Intelligence® | Q1 2025

Mobile not-spots continue to be a fixture of everyday life in UK cities, particularly in London

The combination of factors outlined earlier, including the shift toward insulation materials that inhibit signal propagation, the collapse in rooftop rental fees reducing access to mobile sites, and the use of higher-frequency spectrum for 5G, has posed challenges for mobile operators across all UK cities seeking to reduce the prevalence of mobile not-spots. These challenges have been particularly pronounced in the cities with the highest levels of density, most notably London.

Deep indoor and underground spaces (e.g., transport systems like the London Underground network) remain the primary contributors to time spent with no mobile signal or fallback to 2G networks. These cell edge scenarios are highly disruptive for the end-user, resulting in limited access to basic telephony features like texting and calling and a substantial increase in device-side power consumption. 

Londoners Spend More Time in Mobile Not-Spots Than the UK Average
Speedtest Intelligence® | Q1 2024 – Q1 2025

The proportion of mobile users in London spending the majority of their time in locations with no network access at all (0.7%) was higher than in other major UK cities in Q1 2025 (an observation related to the capital city that again defies Western European norms). By contrast, less than 0.3% of mobile users in Belfast, Bristol and Sheffield spent the majority of their time in not-spots in the same period. Overall, time spent with no service accounted for as much as 2.6% of quarterly network usage in Q1 2025 in London, significantly higher than the national average.

Despite the disproportionate scale of mobile not-spots lingering in London, recent operator investments in network densification and progress in the ongoing rollout of 4G and 5G coverage throughout the London Underground network are driving dramatic improvements in outcomes. The proportion of Londoners spending the majority of their time in locations with no service has more than halved over the last two years, reflecting a much more pronounced pace of improvement than other UK cities and putting the capital on course to fall into line with other large cities like Birmingham and Manchester.

The Proportion of Mobile Users Spending the Majority of Their Time on 2G Has Increased in Several UK Cities
Speedtest Intelligence® | Q1 2024 – Q1 2025 (Including Roaming Samples)

The advancement of the UK’s 3G sunset, which is set to be substantially complete by the end of this year, is reflected in a sharp reduction in the proportion of mobile users spending the majority of their time on 3G networks. In London, for example, this proportion fell from over 4.5% in Q1 2023 to less than 0.7% in Q1 2025.

The 3G sunset has, however, contributed to an increase in 2G fallback in UK cities at the cell edge where 4G and 5G networks are unavailable. Time spent on 2G increased across several UK cities over the last year, including Liverpool, where this trend has resulted in a larger share of users spending the majority of their time on 2G than in areas with no service at all (a rarity among UK cities). 

The Decline in 3G Usage Has Been Similarly Rapid Across UK Cities
Speedtest Intelligence® | Q1 2023 – Q1 2025

Cities that take a proactive approach to telecoms feature the best 5G outcomes

Glasgow’s position as the leading UK city in key 5G performance indicators is unlikely to be an outcome achieved by mere chance. Beyond the contribution of inherent structural factors related to building composition, such as a lower prevalence of high-rise developments relative to other major UK cities, Glasgow’s 5G leadership is also likely rooted in its early and proactive approach to supporting telecoms infrastructure.

The city was among the first in Europe to establish a dedicated “Telecoms Unit”, which streamlined access to city-owned assets for telecom deployments, provided standardized agreements for rental fees, and consolidated telecoms functions within the local authority to reduce departmental siloes. This proactive approach facilitates inward investment in network infrastructure and better 5G outcomes. 

Ookla retains ownership of this article including all of the intellectual property rights, data, content graphs and analysis. This article may not be quoted, reproduced, distributed or published for any commercial purpose without prior consent. Members of the press and others using the findings in this article for non-commercial purposes are welcome to publicly share and link to report information with attribution to Ookla.
| December 20, 2021

Starlink Expands but Q3 2021 Performance Flattens in Some Areas


Satellite internet is making headlines across the globe as Starlink continues to launch service in new countries and Viasat plans to acquire Inmarsat. We’re here to check in on our ongoing series on satellite internet performance around the globe with fresh data from Q3 2021 to see if Starlink’s performance is holding up and how satellite internet compares to fixed broadband in 12 countries.

United States: Starlink fastest, speeds decreasing

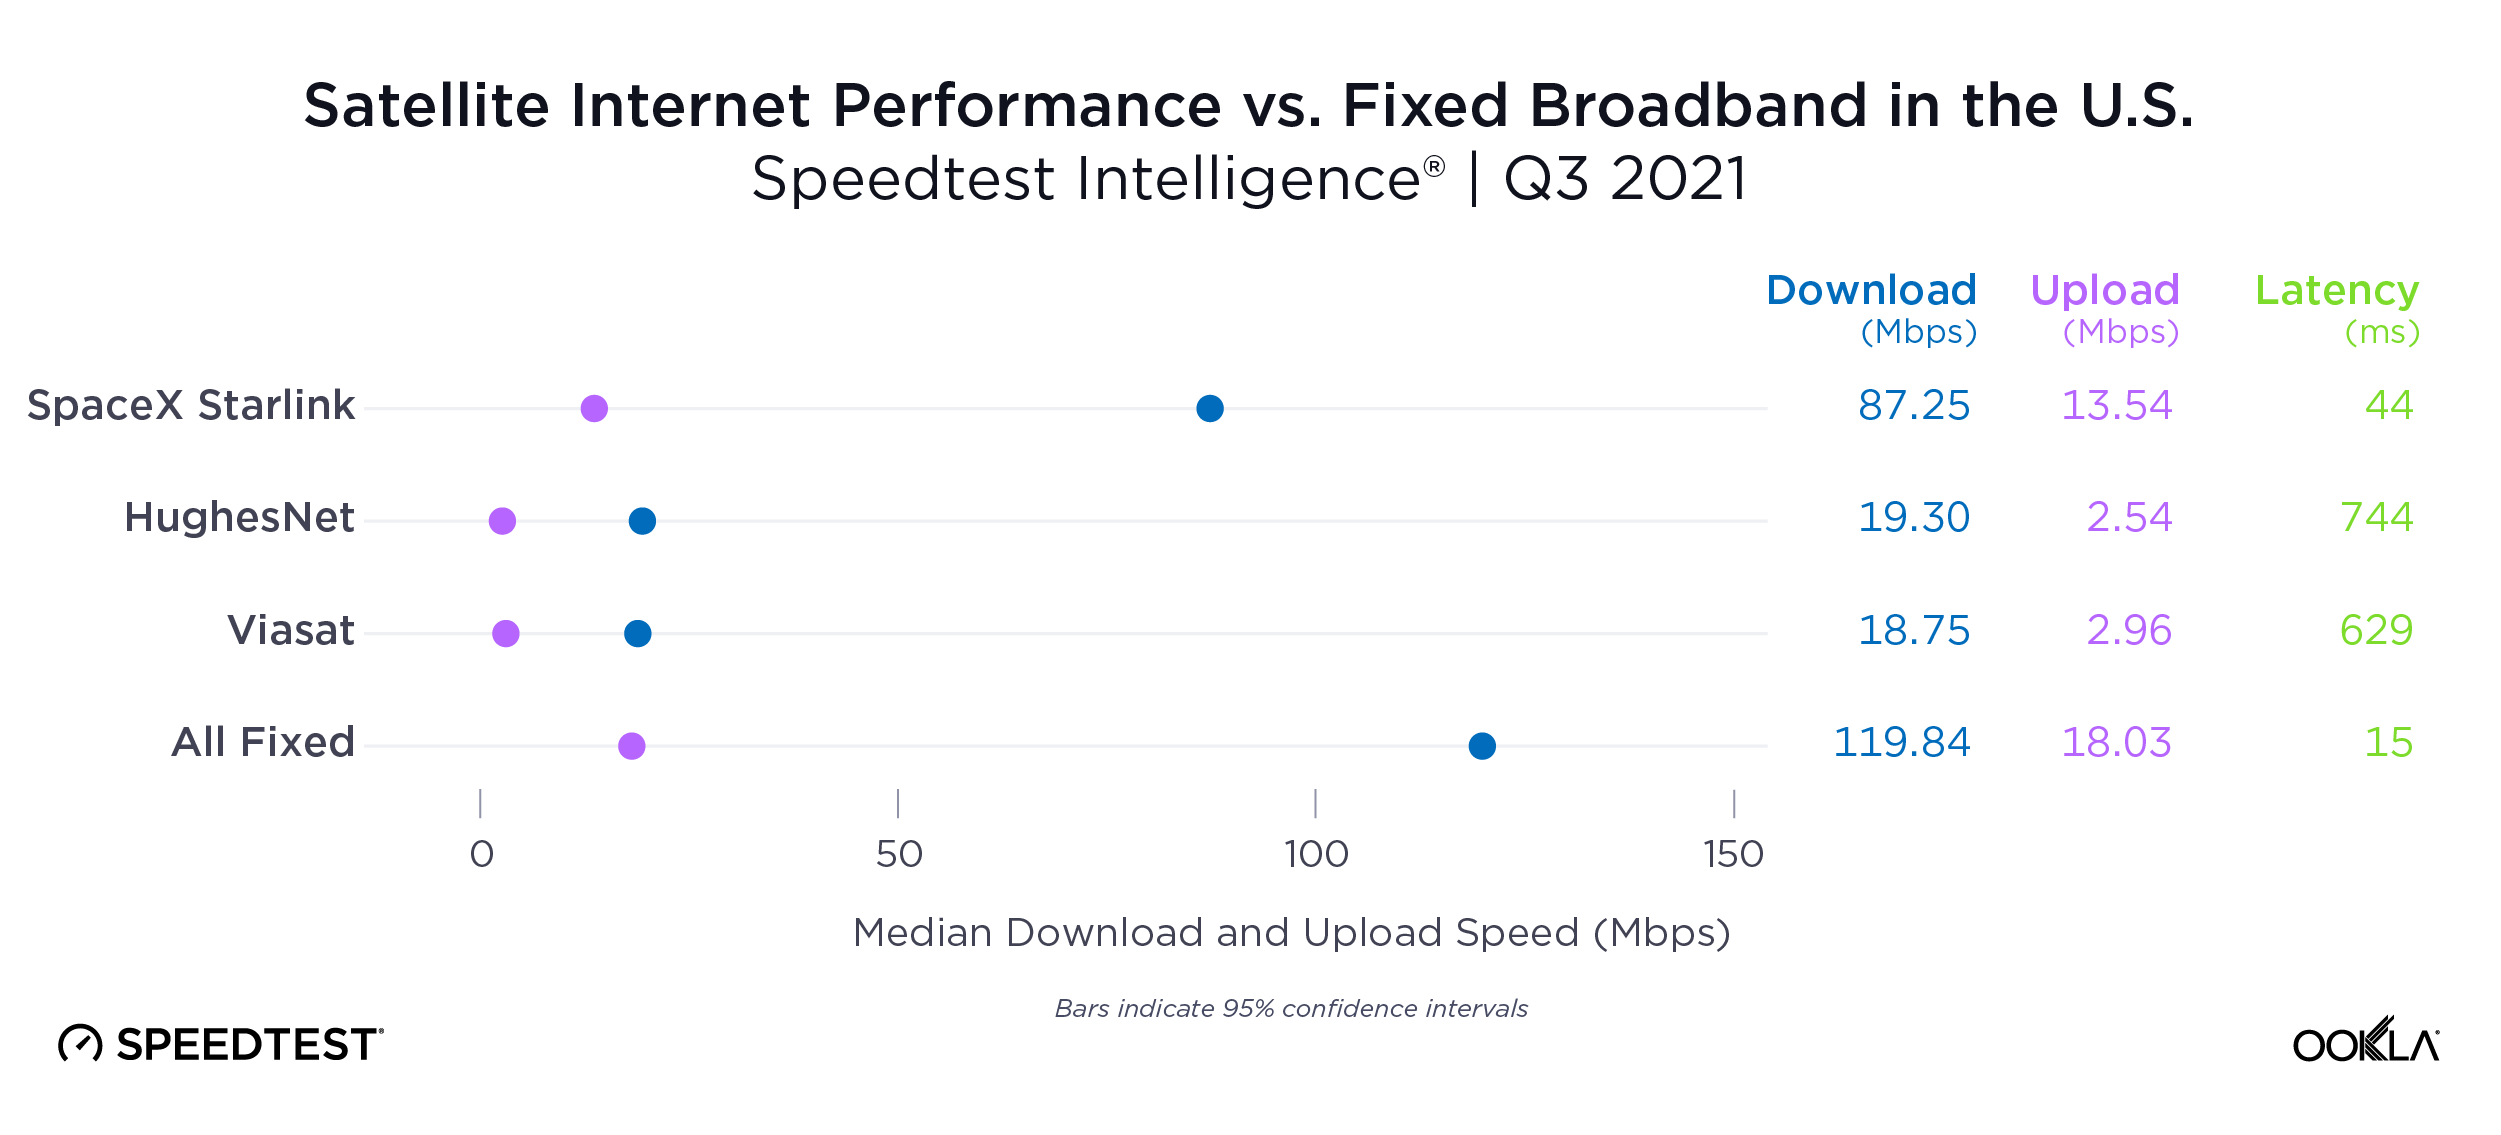
Consumers in the U.S. looking to use satellite service to connect to the internet will find that performance was mostly flat when comparing Q3 2021 to Q2 2021. Starlink’s median download speed decreased from 97.23 Mbps during Q2 2021 to 87.25 Mbps in Q3 2021, which could be a function of adding more customers. HughesNet followed distantly at 19.30 Mbps (comparable to the 19.73 Mbps we saw in Q2 2021) and Viasat third at 18.75 Mbps (18.13 Mbps in Q2 2021). For comparison, the median download speed for all fixed broadband providers in the U.S. during Q3 2021 was 119.84 Mbps (115.22 Mbps in Q2 2021).

ookla_satellite-performance_us_1221-01-1

Starlink’s median upload speed of 13.54 Mbps (down from 13.89 Mbps in Q2 2021) was much closer to that on all fixed broadband (18.03 Mbps in Q3 2021 and 17.18 Mbps in Q2 2021). Viasat and HughesNet followed at 2.96 Mbps (3.38 Mbps in Q2 2021) and 2.54 Mbps (2.43 Mbps in Q2 2021), respectively.
As we saw last quarter, Starlink, which uses low earth orbit (LEO) satellites, was the only satellite internet provider with a median latency anywhere near that seen on fixed broadband in Q3 2021 (44 ms and 15 ms, respectively). Viasat and HughesNet, which both utilize higher “geosynchronous” orbits, had median latencies of 629 ms and 744 ms, respectively.

Starlink performance varies at the county level

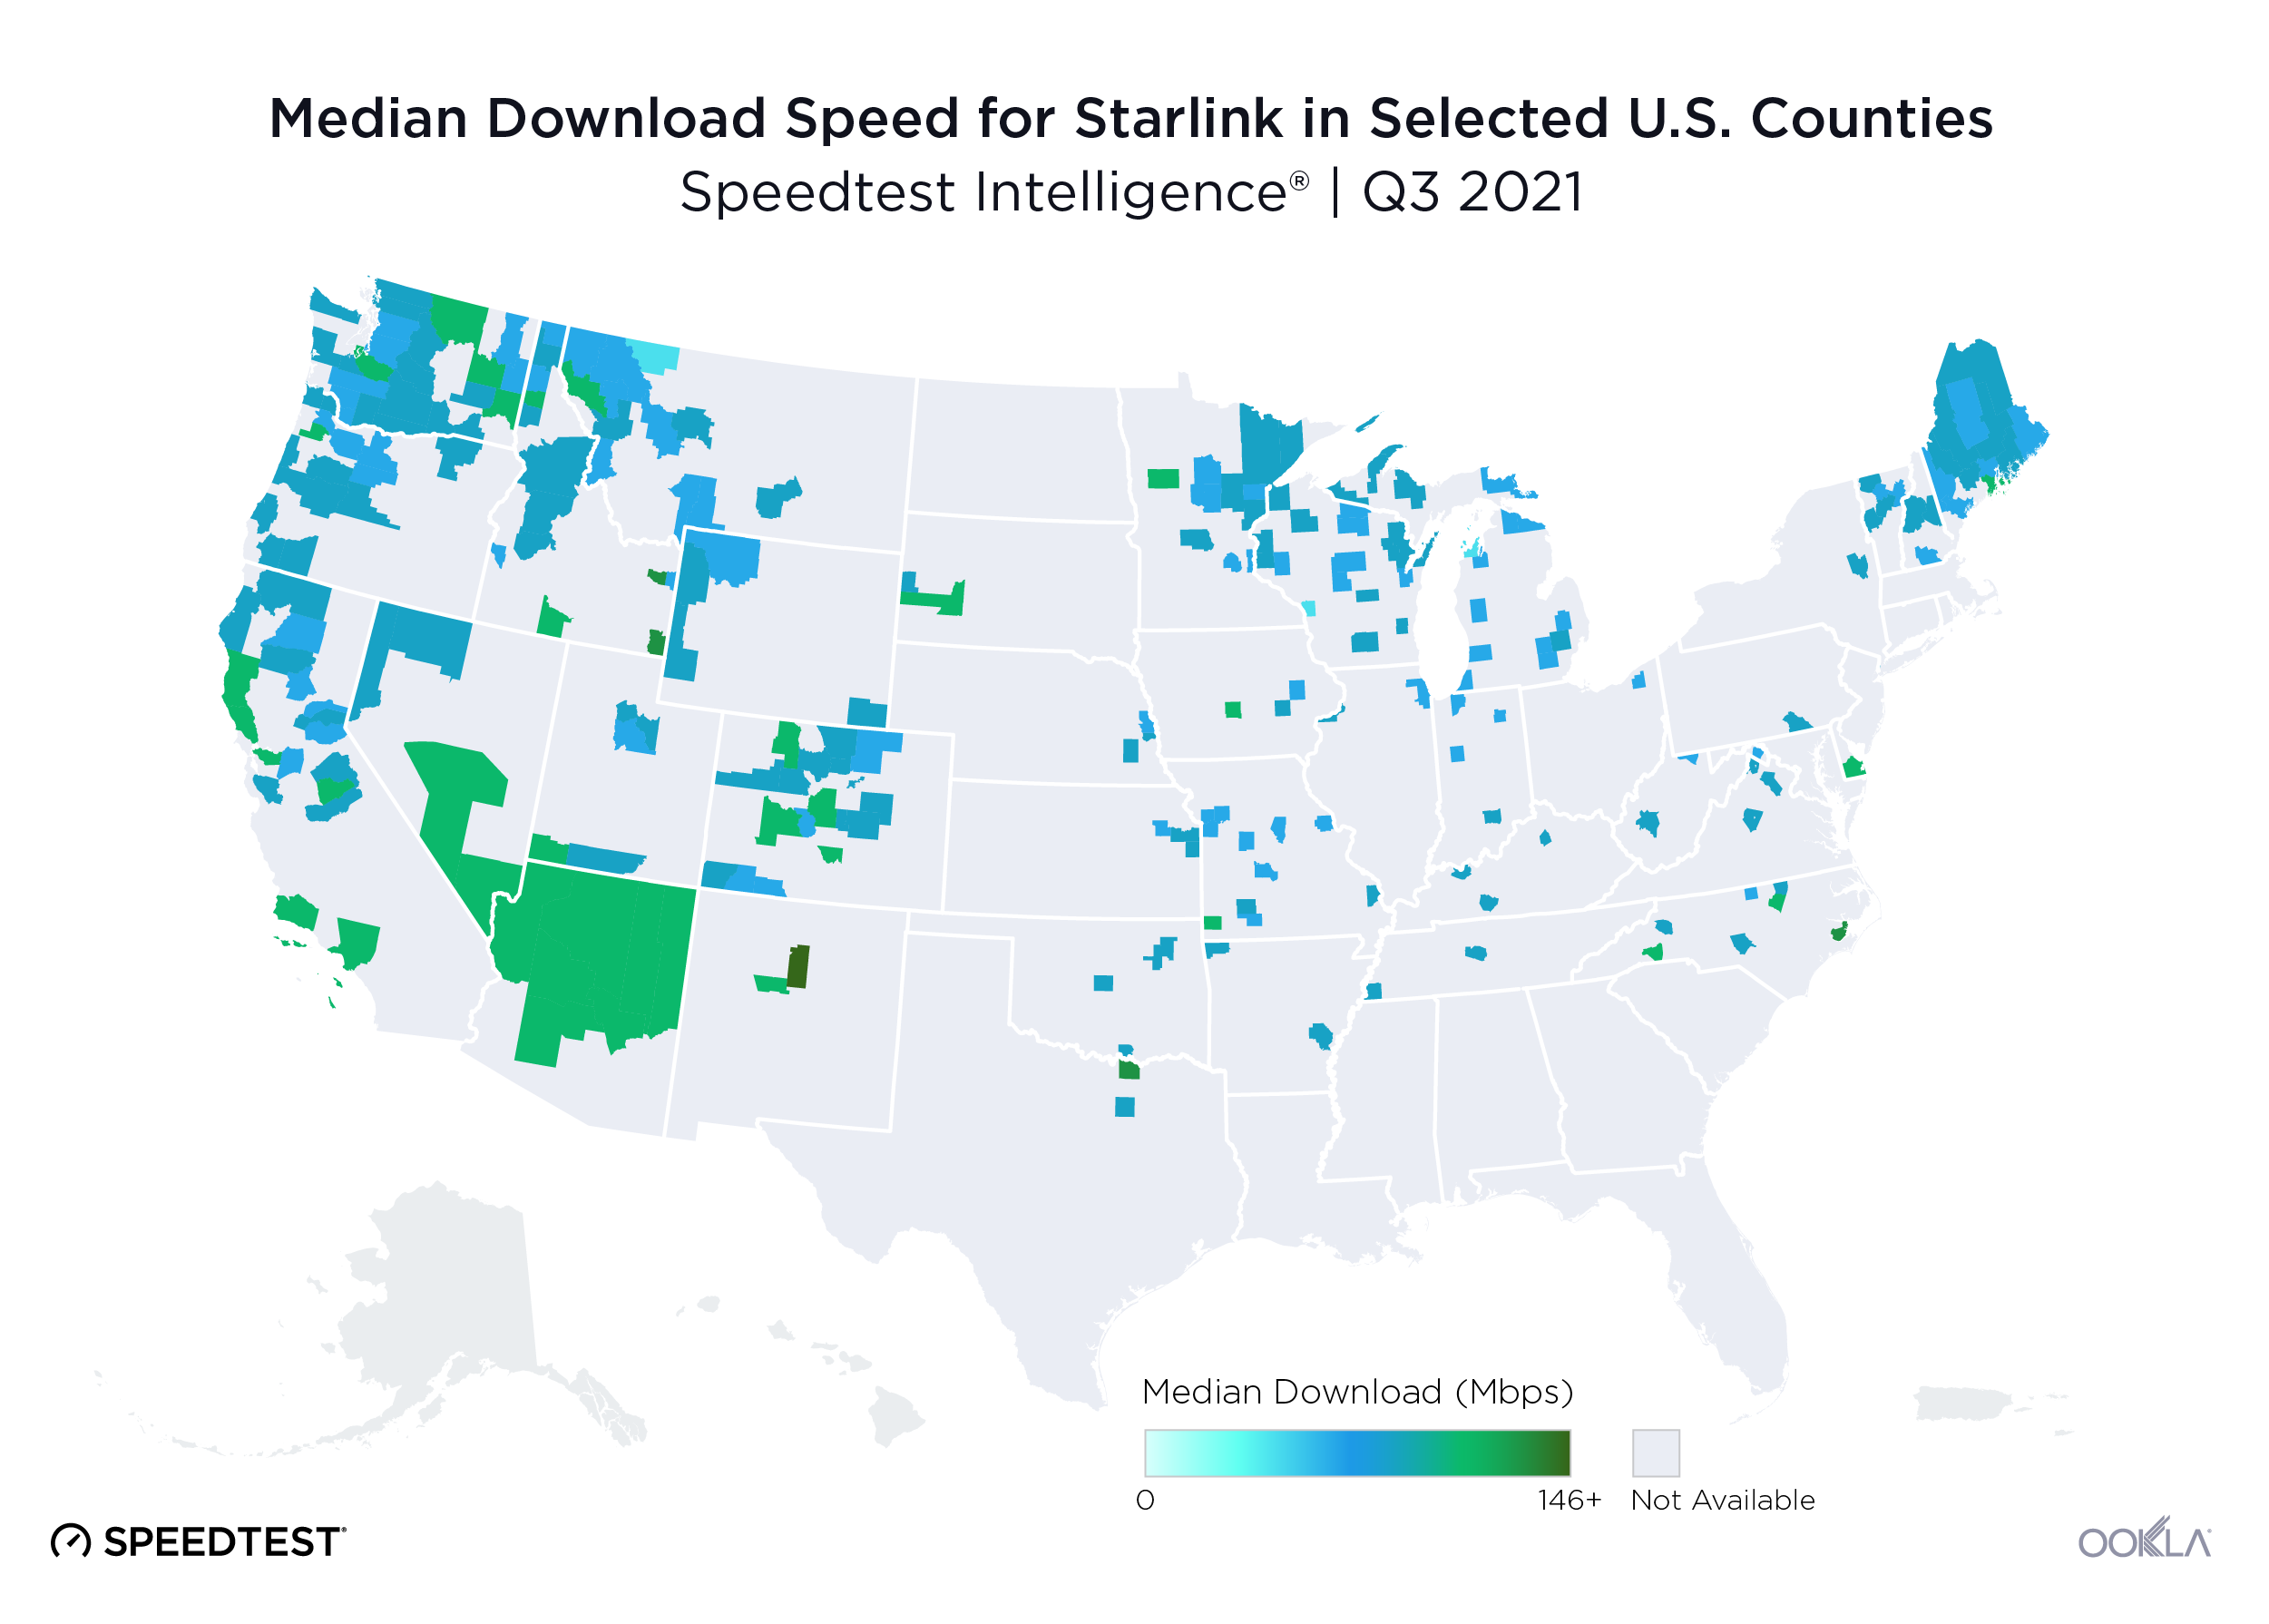
We saw sufficient samples during Q3 2021 to analyze Starlink performance in 304 counties in the U.S. While there was about a 100 Mbps range in performance between the county with the fastest median download speed (Santa Fe County, New Mexico at 146.58 Mbps) and the county with the slowest median download speed (Drummond Township, Michigan at 46.63 Mbps), even the lower-end speeds are well above the FCC’s Baseline performance tier of at least a 25 Mbps download speed.

ookla_united_states_median_download_starlink_map_1221g-01-1

Satellite internet performance elsewhere in the world

We examined satellite internet performance in countries with an established market share to see how well their speeds compare to local fixed broadband. We’re excited to add analysis on satellite performance in Australia and Belgium this quarter.

Australia: Starlink outperformed Viasat and fixed broadband average

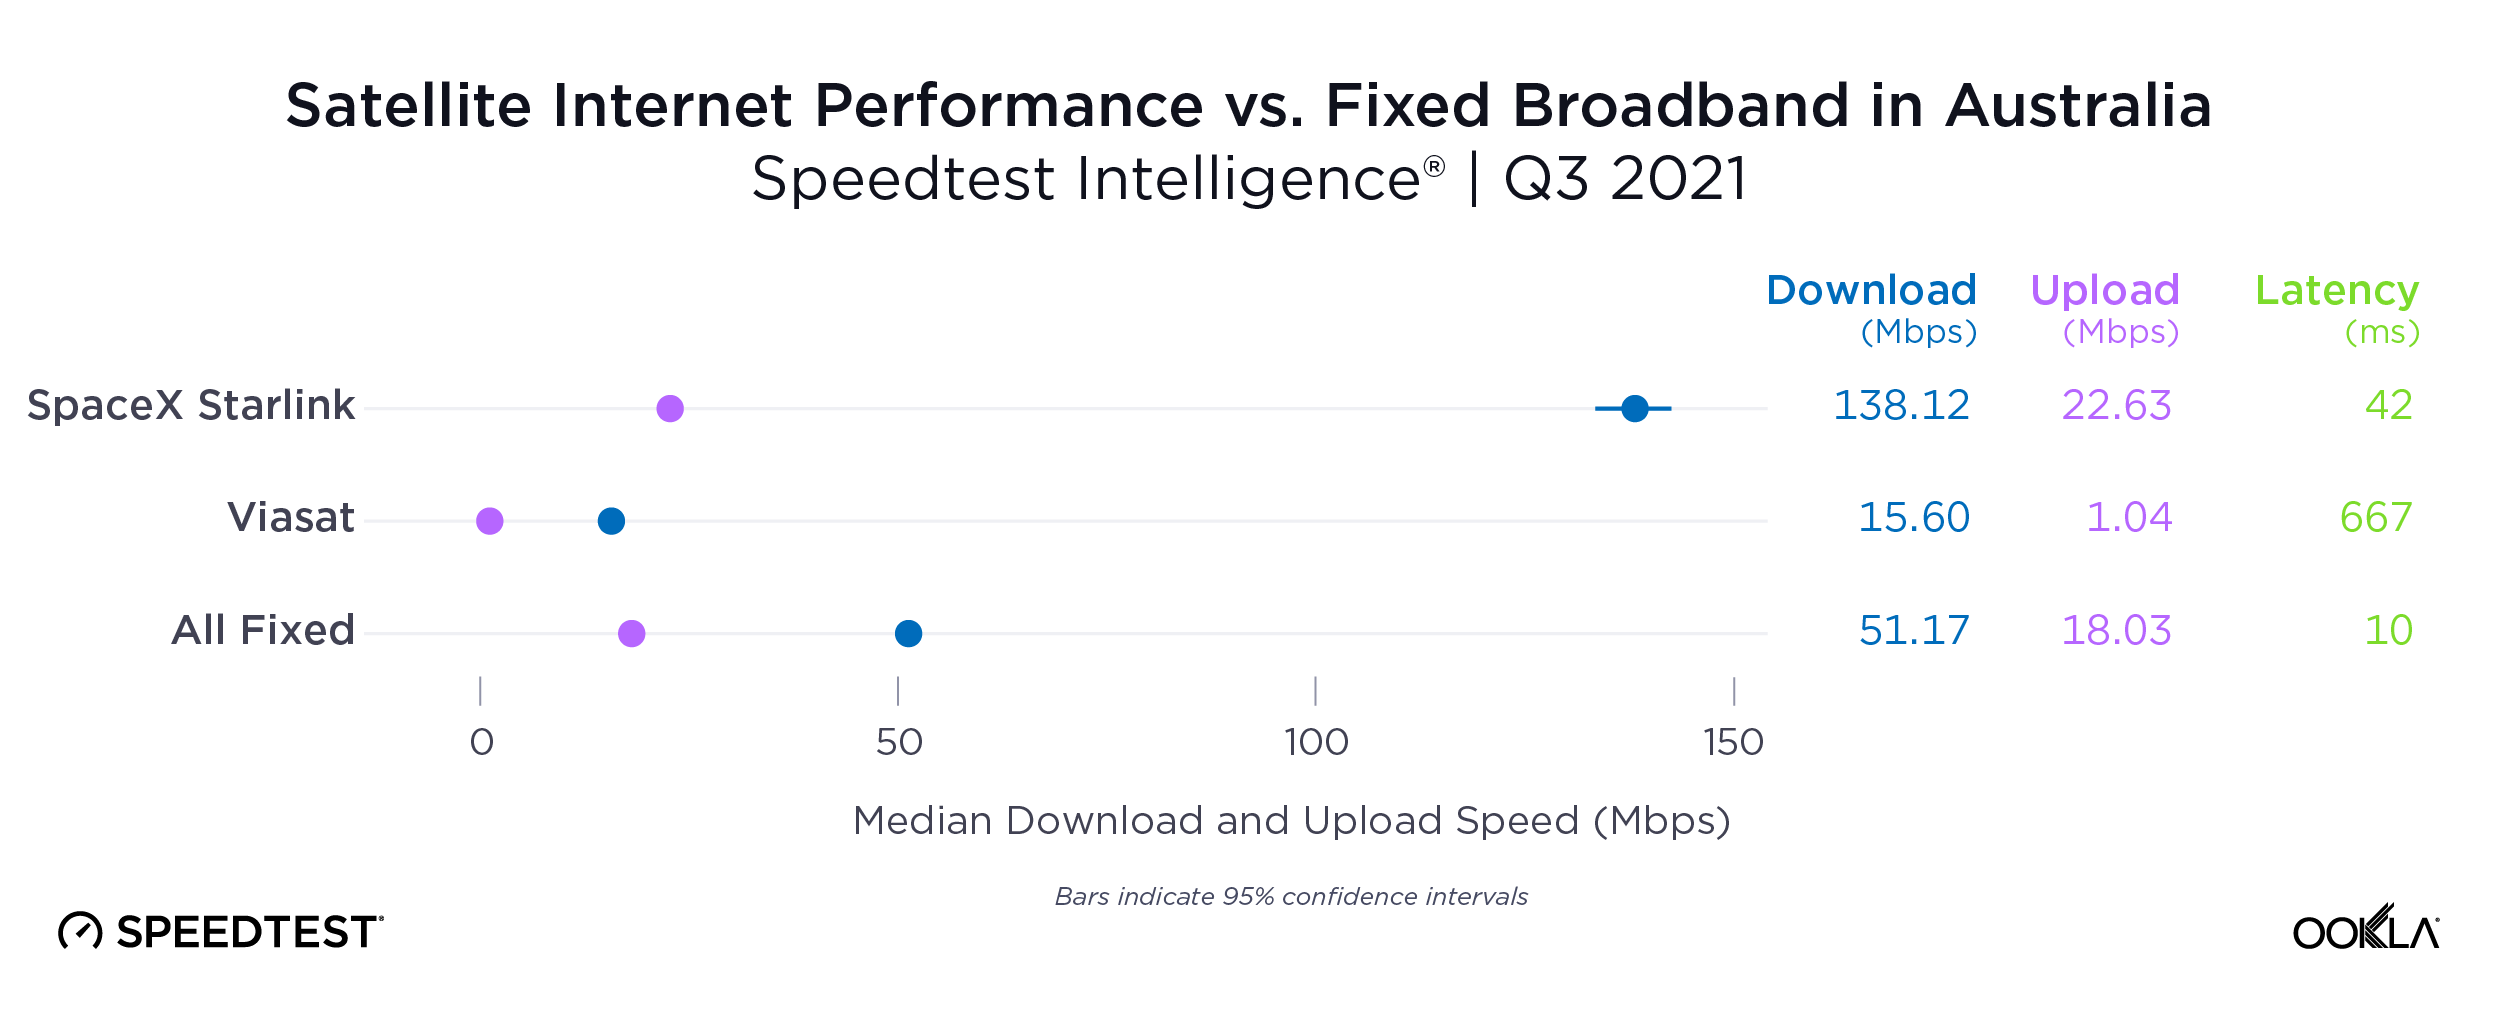
Starlink radically outperformed Viasat in Australia during Q3 2021 with a median download speed of 138.12 Mbps to Viasat’s 15.60 Mbps. Starlink also outpaced Viasat for median upload speed at 22.63 Mbps and 1.04 Mbps, respectively. Compared to the median download speed over all fixed broadband of 51.17 Mbps, Starlink could be an attractive alternative to traditional fixed broadband on all levels except latency where Starlink showed 42 ms vs. 10 ms for all fixed broadband combined.

ookla_satellite-performance_au_1221-01-1

Belgium: Starlink dramatically faster than fixed broadband

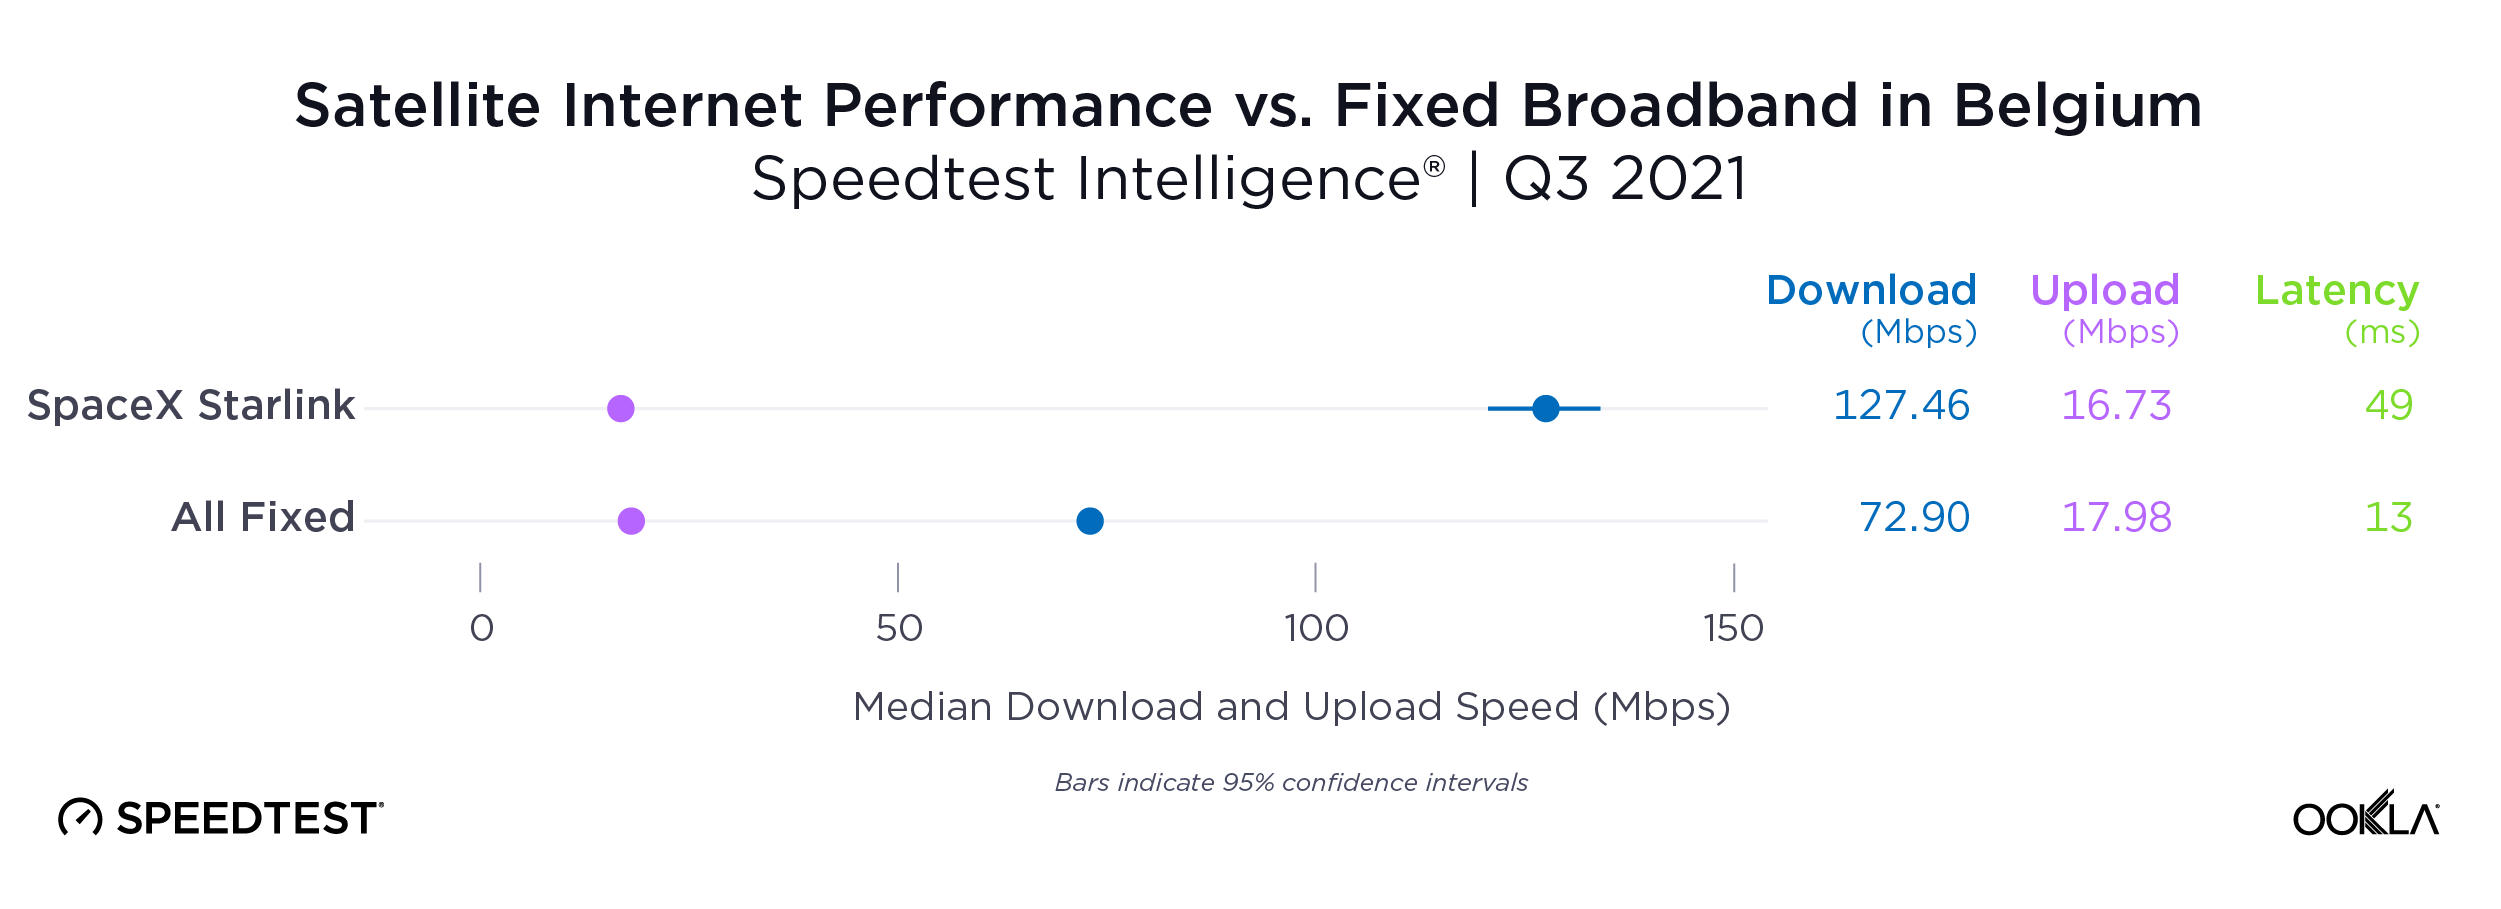
Starlink’s median download speed of 127.46 Mbps during Q3 2021 was dramatically faster than the country’s median download for all fixed broadband of 72.90 Mbps. At 16.73 Mbps, Starlink’s median upload speed was only slightly slower than the overall median of 17.98 Mbps. However, Starlink’s 49 ms latency was higher than the country’s average of 13 ms. Starlink was the only satellite internet provider with adequate samples to analyze in Belgium during Q3 2021.

ookla_satellite-performance_be_1221-01

Brazil: Viasat close to national average

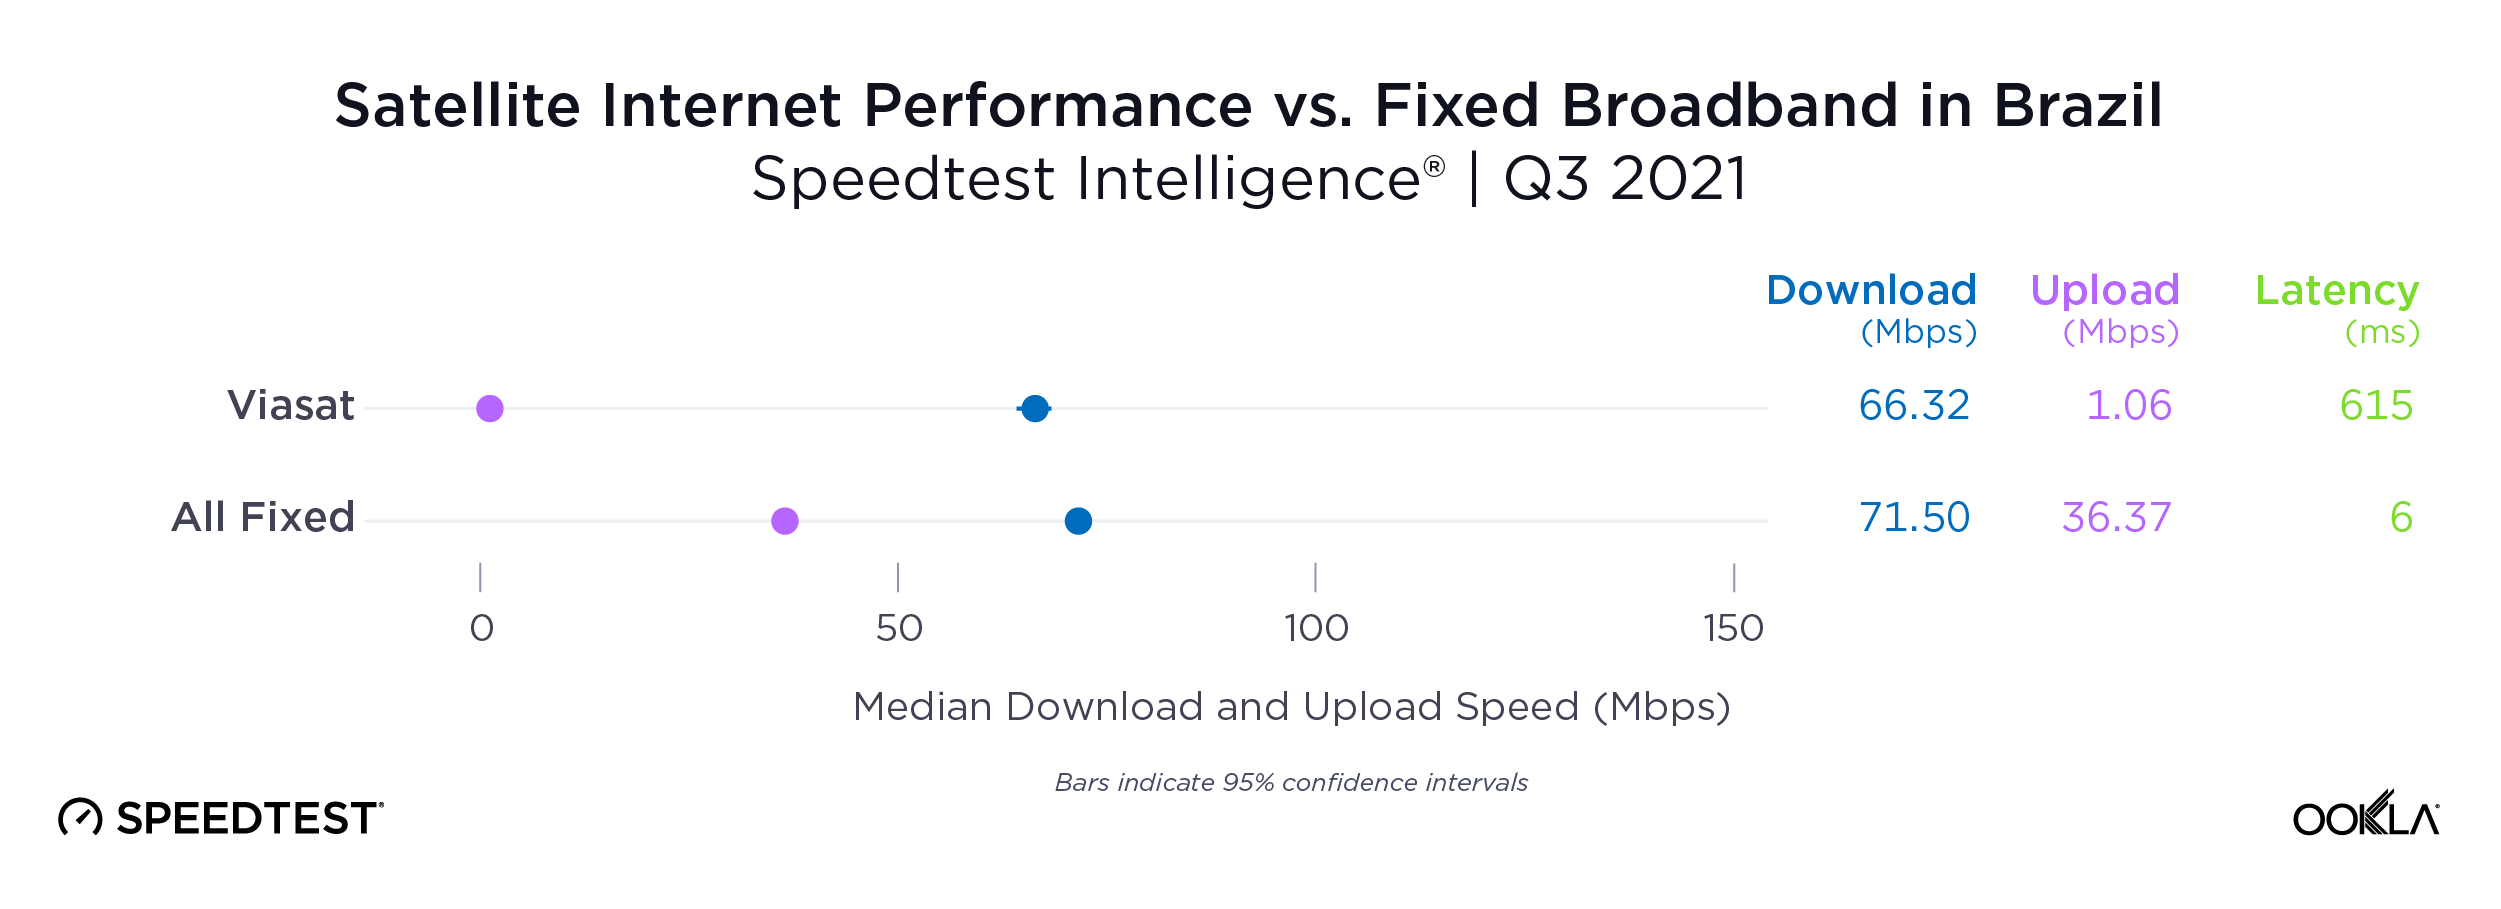
Viasat’s median download speed in Brazil improved to 66.32 Mbps during Q3 2021 (up from 60.30 Mbps in Q2 2021. This was close to the national median for fixed broadband of 71.50 Mbps. Viasat’s median upload speed (1.06 Mbps) was much slower, however, than that on fixed broadband (36.37 Mbps), and Viasat’s latency was much higher (615 ms vs 6 ms).

ookla_satellite-performance_br_1221-01-1

Canada: Starlink performance relatively flat

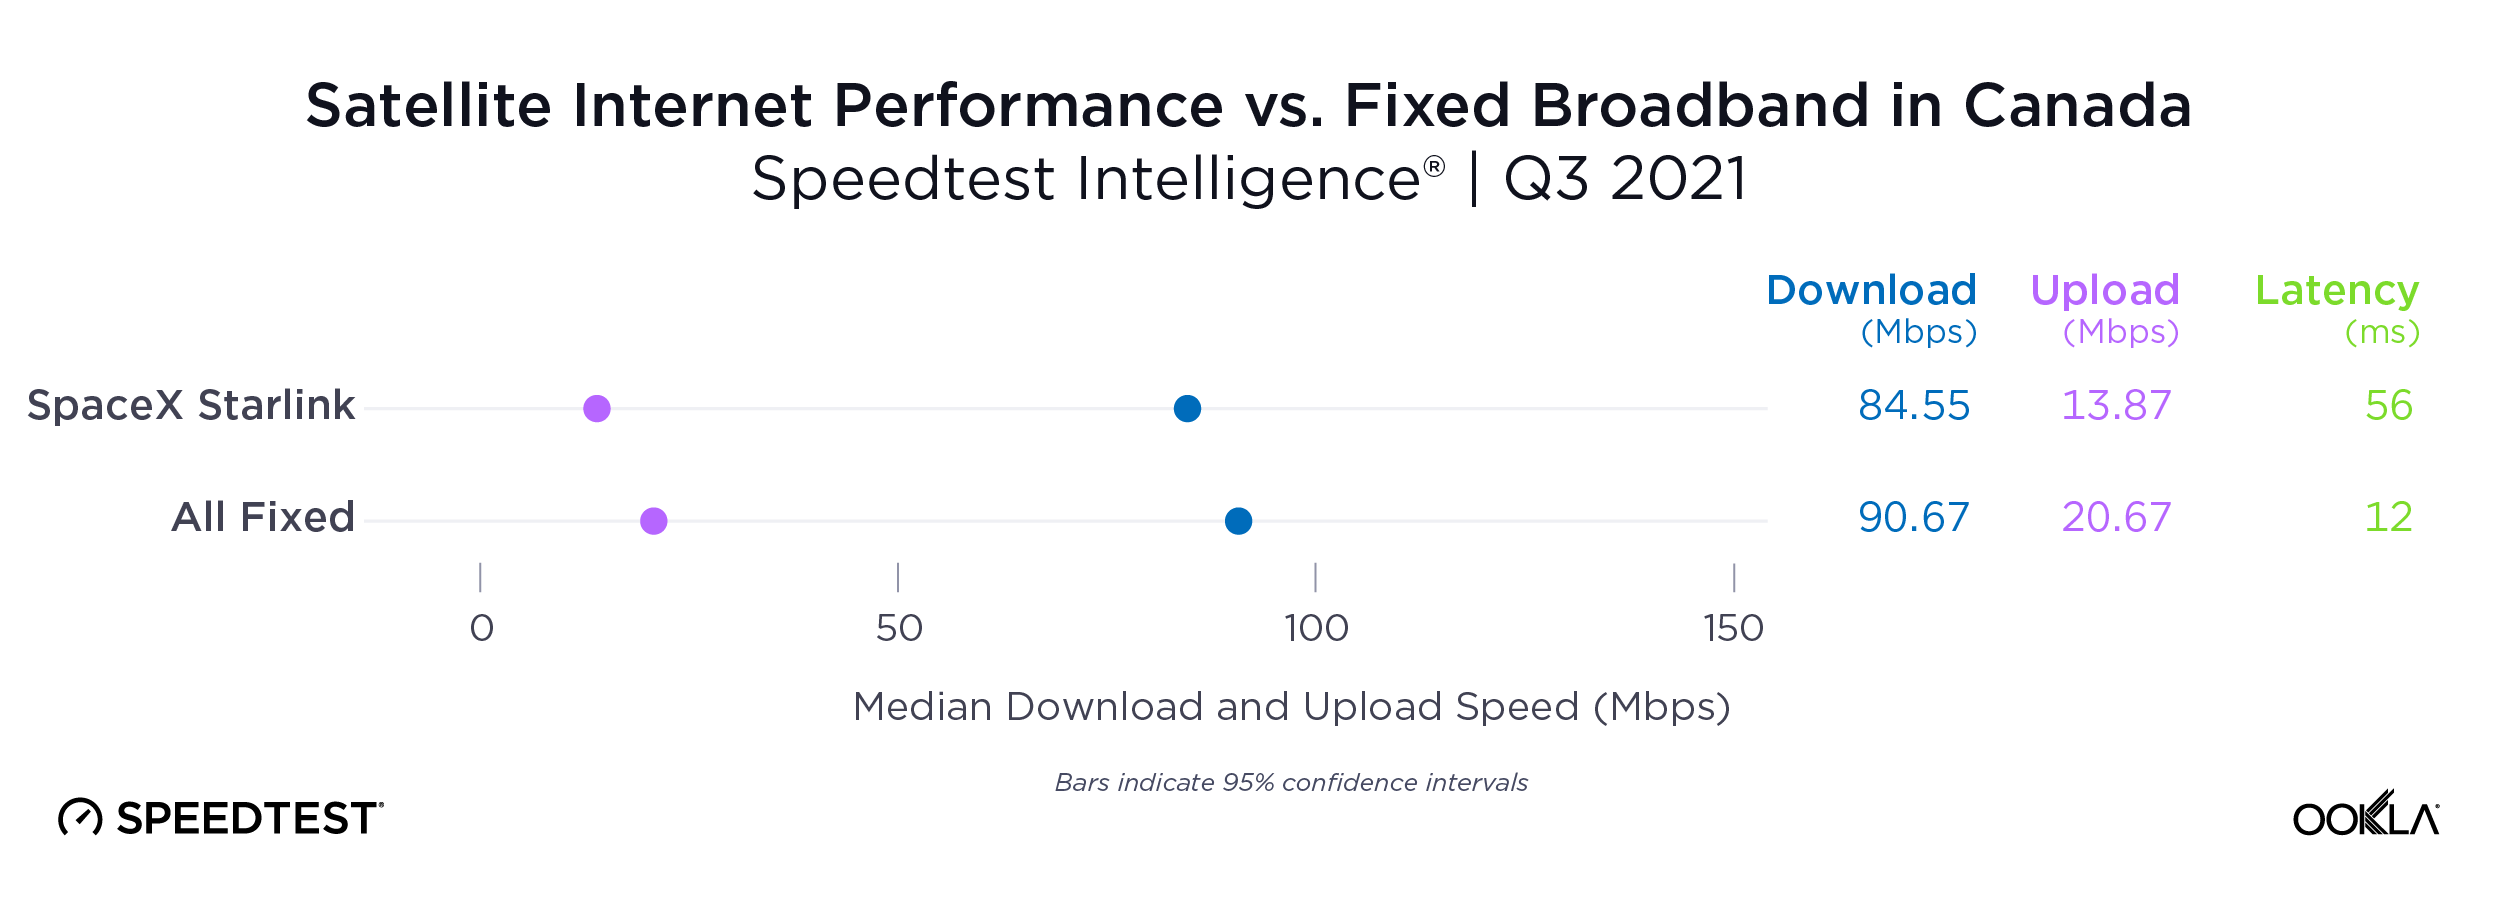
Our previous article showed that Starlink’s median download speed exceeded that of fixed broadband in Canada during Q2 2021 (86.92 Mbps vs. 84.24 Mbps). In Q3 2021, Starlink’s median download speed decreased slightly to 84.55 Mbps while that over all fixed broadband increased to 90.67 Mbps. This is in line with what we expect to see on new technologies as additional users are added to a system. Starlink’s median upload speed was slower than fixed broadband (13.87 Mbps vs. 20.67 Mbps). Latency on Starlink was much higher (56 ms vs. 12 ms). Starlink is still a viable alternative to fixed broadband in Canada, especially for consumers without access to other options.

ookla_satellite-performance_ca_1221-01-1

Starlink faster than overall fixed broadband in 5 provinces

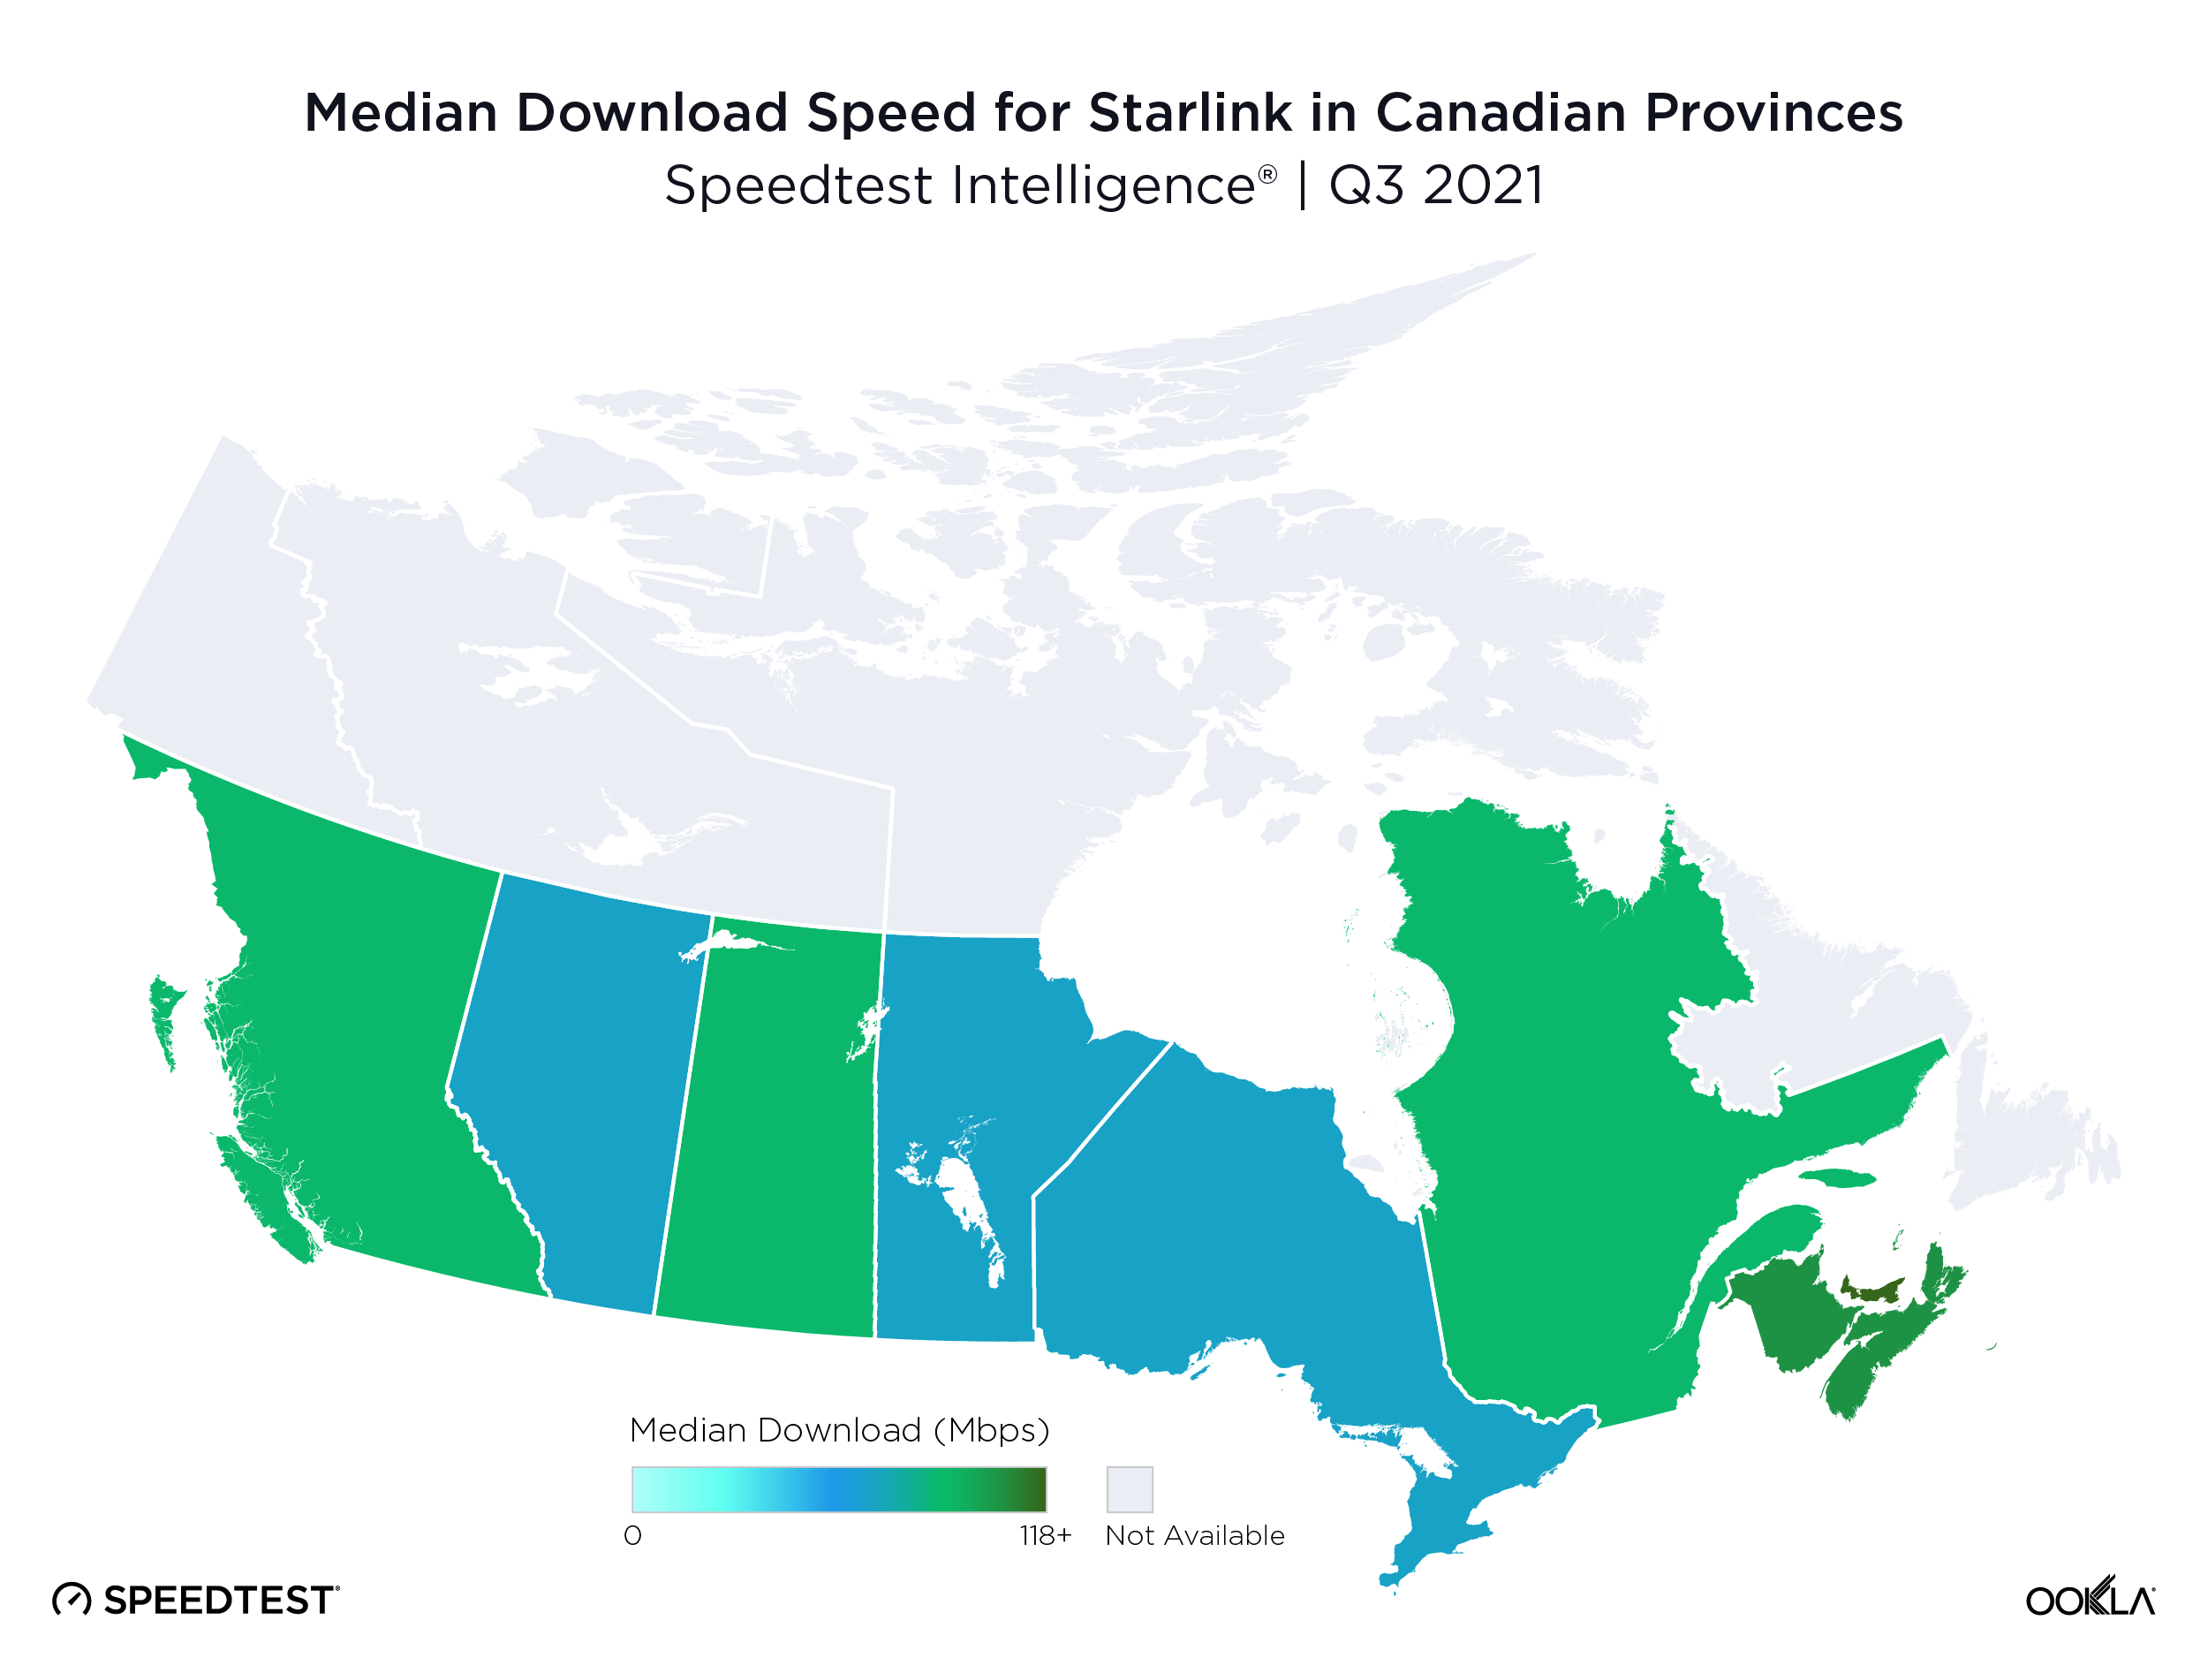
Starlink showed enough samples to analyze performance in nine out of 10 provinces in Canada during Q3 2021. Starlink’s Q3 2021 median download speed was faster than the median for all fixed broadband in five provinces: Manitoba (81.04 Mbps vs. 65.91 Mbps), Nova Scotia (109.60 Mbps vs. 99.82 Mbps), Prince Edward Island (118.02 Mbps vs. 46.86 Mbps), Quebec (92.59 Mbps vs. 72.07 Mbps) and Saskatchewan (97.67 Mbps vs. 57.59 Mbps). Download speeds were comparable between Starlink and overall fixed broadband in New Brunswick (104.56 Mbps vs. 104.28 Mbps), and overall fixed broadband was faster than Starlink in Alberta (92.65 Mbps vs. 82.48 Mbps), British Columbia (111.36 Mbps vs. 87.34 Mbps) and Ontario (86.26 Mbps vs. 79.54 Mbps).

ookla_canada_median_download_starlink_map_1221g-01

Chile: HughesNet slower than fixed broadband average

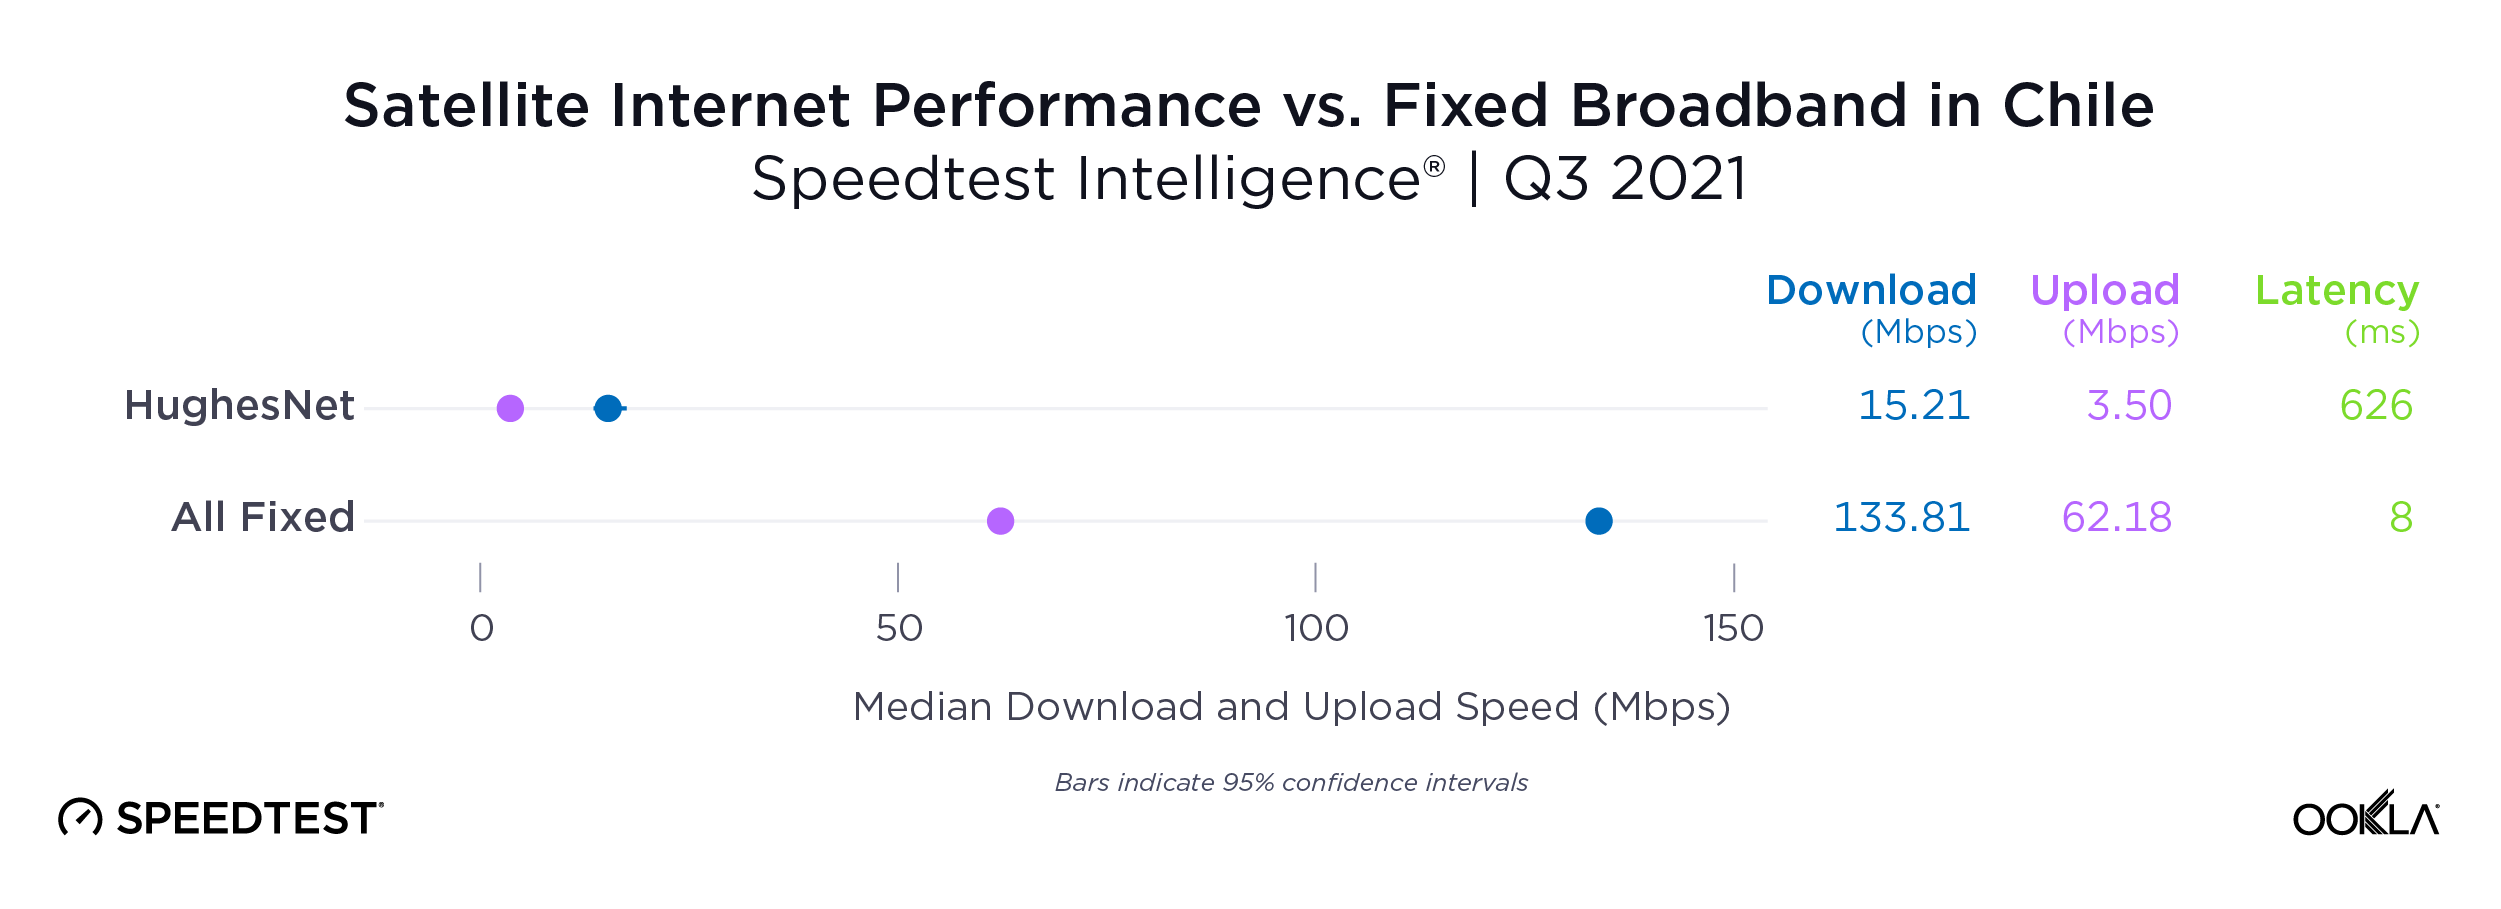
HughesNet was hard pressed to compete with Chile’s fixed broadband, which ranked fourth in the world during October 2021. HughesNet showed a 15.21 Mbps median download speed compared during Q3 2021 with the country’s fixed broadband average of 133.81 Mbps during the same period. Median upload speeds also showed a wide gap (3.50 Mbps for HughesNet to 62.18 Mbps on fixed broadband), and HughesNet’s latency was very high (626 ms vs. 8 ms).

ookla_satellite-performance_cl_1221-01-1

Colombia: HughesNet slow but improving

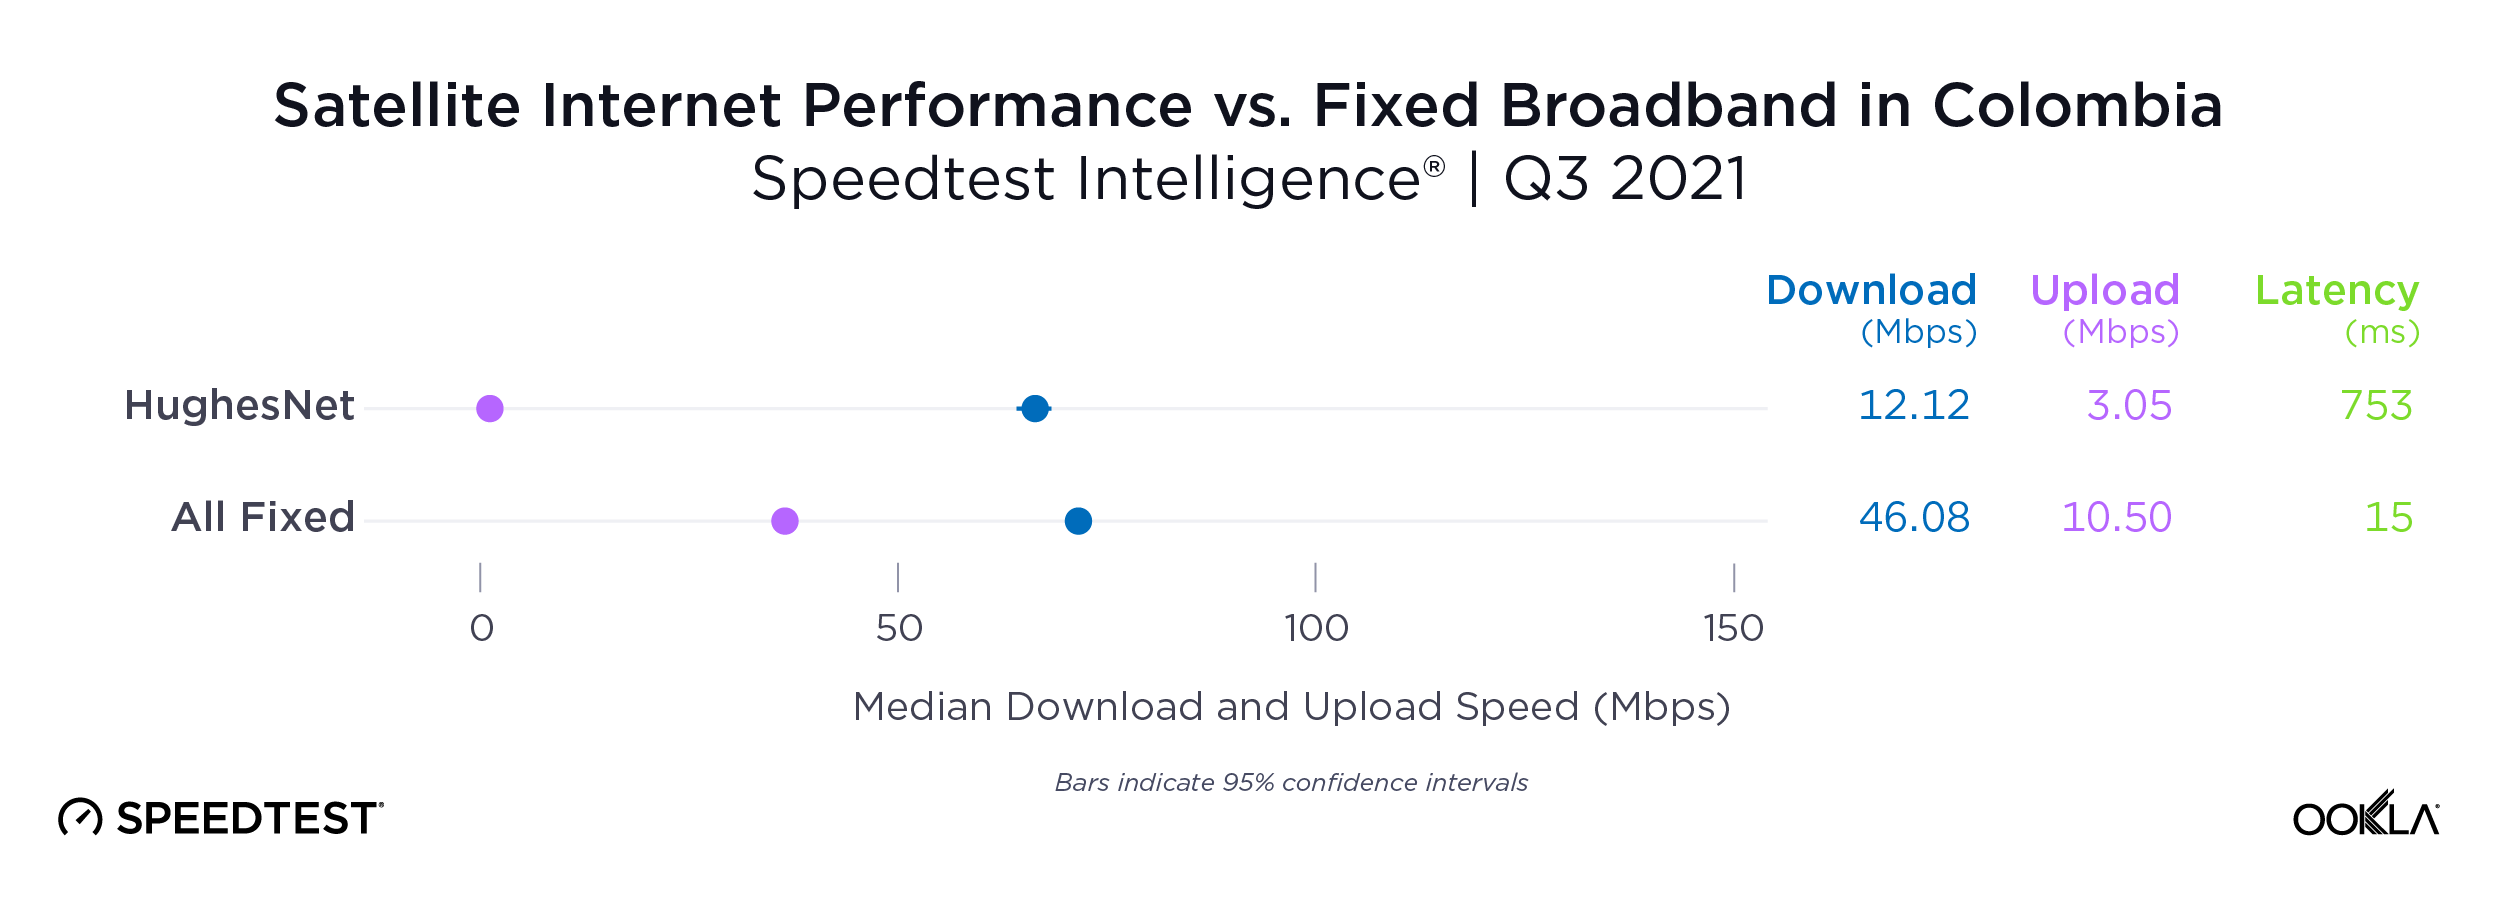
HughesNet’s median download speed increased in Q3 2021 to 12.12 Mbps (up from 9.28 Mbps during Q2 2021), compared with Colombia’s 46.08 Mbps for fixed broadband overall (35.90 Mbps in Q2 2021). Median upload speed was also slower using the satellite internet provider (3.05 Mbps) than fixed broadband (10.50 Mbps), and latency was much higher on satellite (753 ms vs. 15 ms).

ookla_satellite-performance_co_1221-01-1

France: Starlink speeds decreasing, remains faster than fixed broadband average

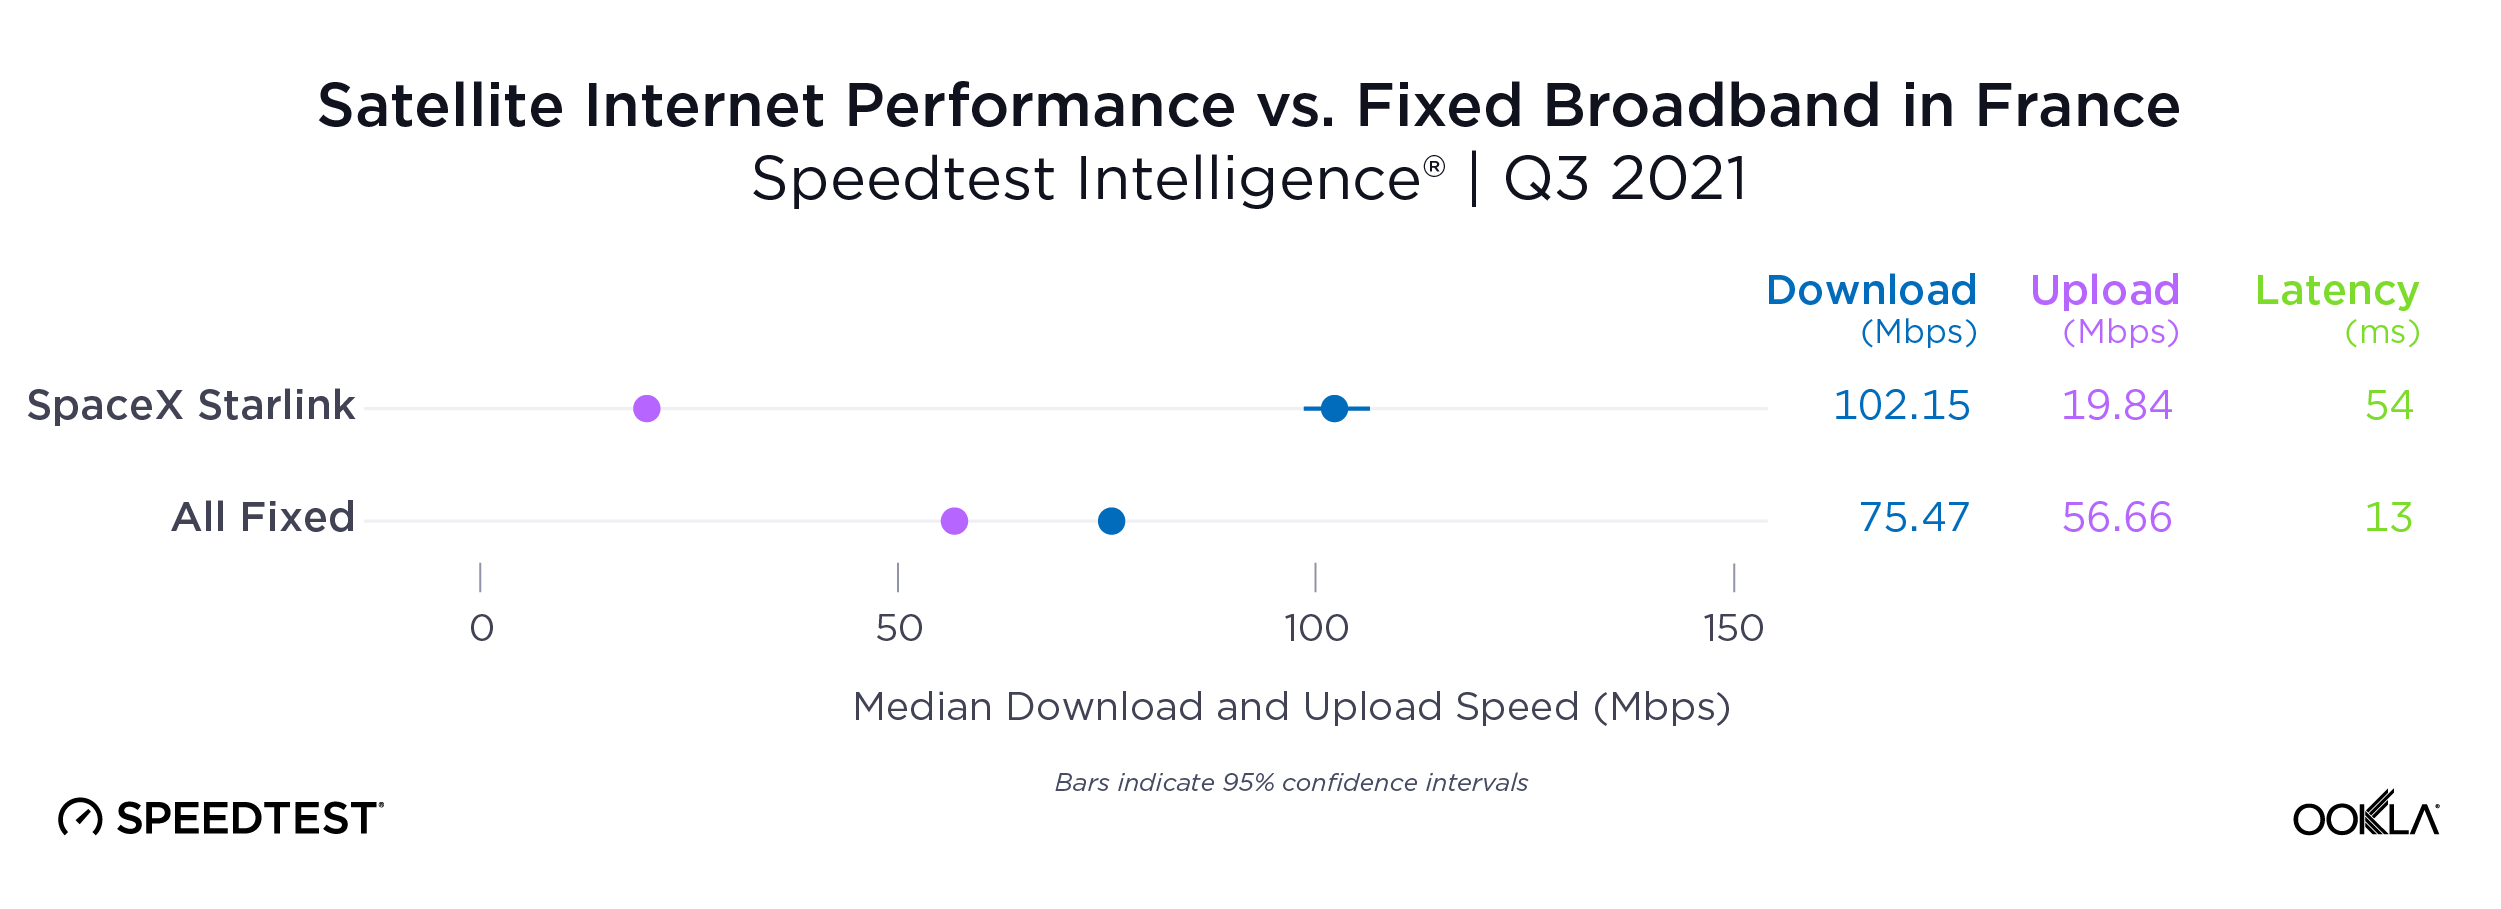
Starlink users in France saw a median download speed of 102.15 Mbps in Q3 2021 (down from 139.39 Mbps in Q2 2021, likely due to increased usage). Starlink’s download speed easily beat the country-wide median for fixed broadband of 75.47 Mbps (up from 70.81 Mbps in Q2 2021). Starlink’s upload speed during Q3 2021 was slower than the fixed broadband median (19.84 Mbps vs. 56.66 Mbps), and Starlink’s latency was higher (54 ms vs. 13 ms).

ookla_satellite-performance_fr_1221-01

Germany: Starlink faster than country average for fixed broadband

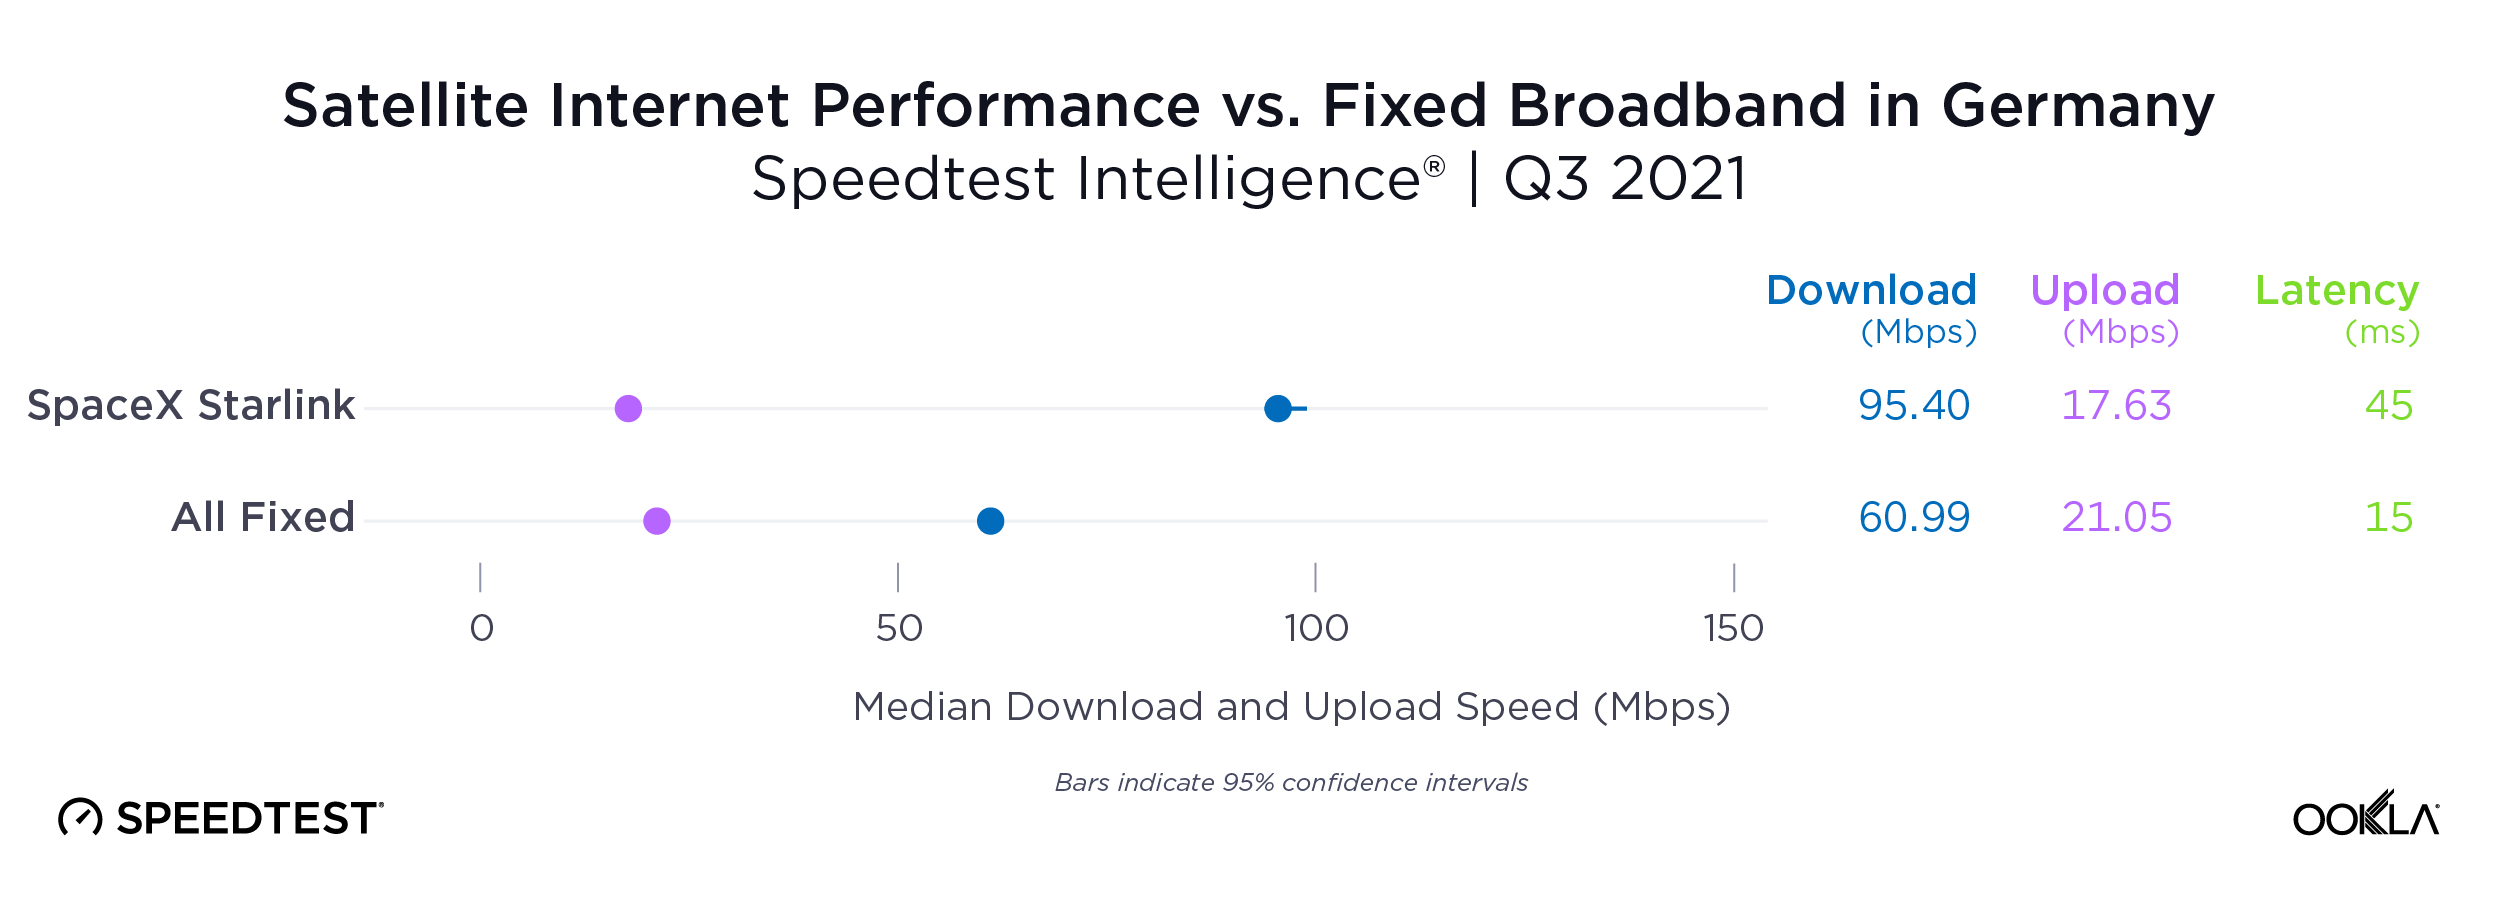
Starlink’s median download speed in Germany of 95.40 Mbps was much faster than the country median of 60.99 Mbps during Q3 2021. Starlink was slightly slower for upload speed than overall fixed broadband (17.63 Mbps vs. 21.05 Mbps) and Starlink showed a higher latency (45 ms vs. 15 ms).

ookla_satellite-performance_de_1221-01-1

Mexico: Viasat faster than HughesNet for downloads

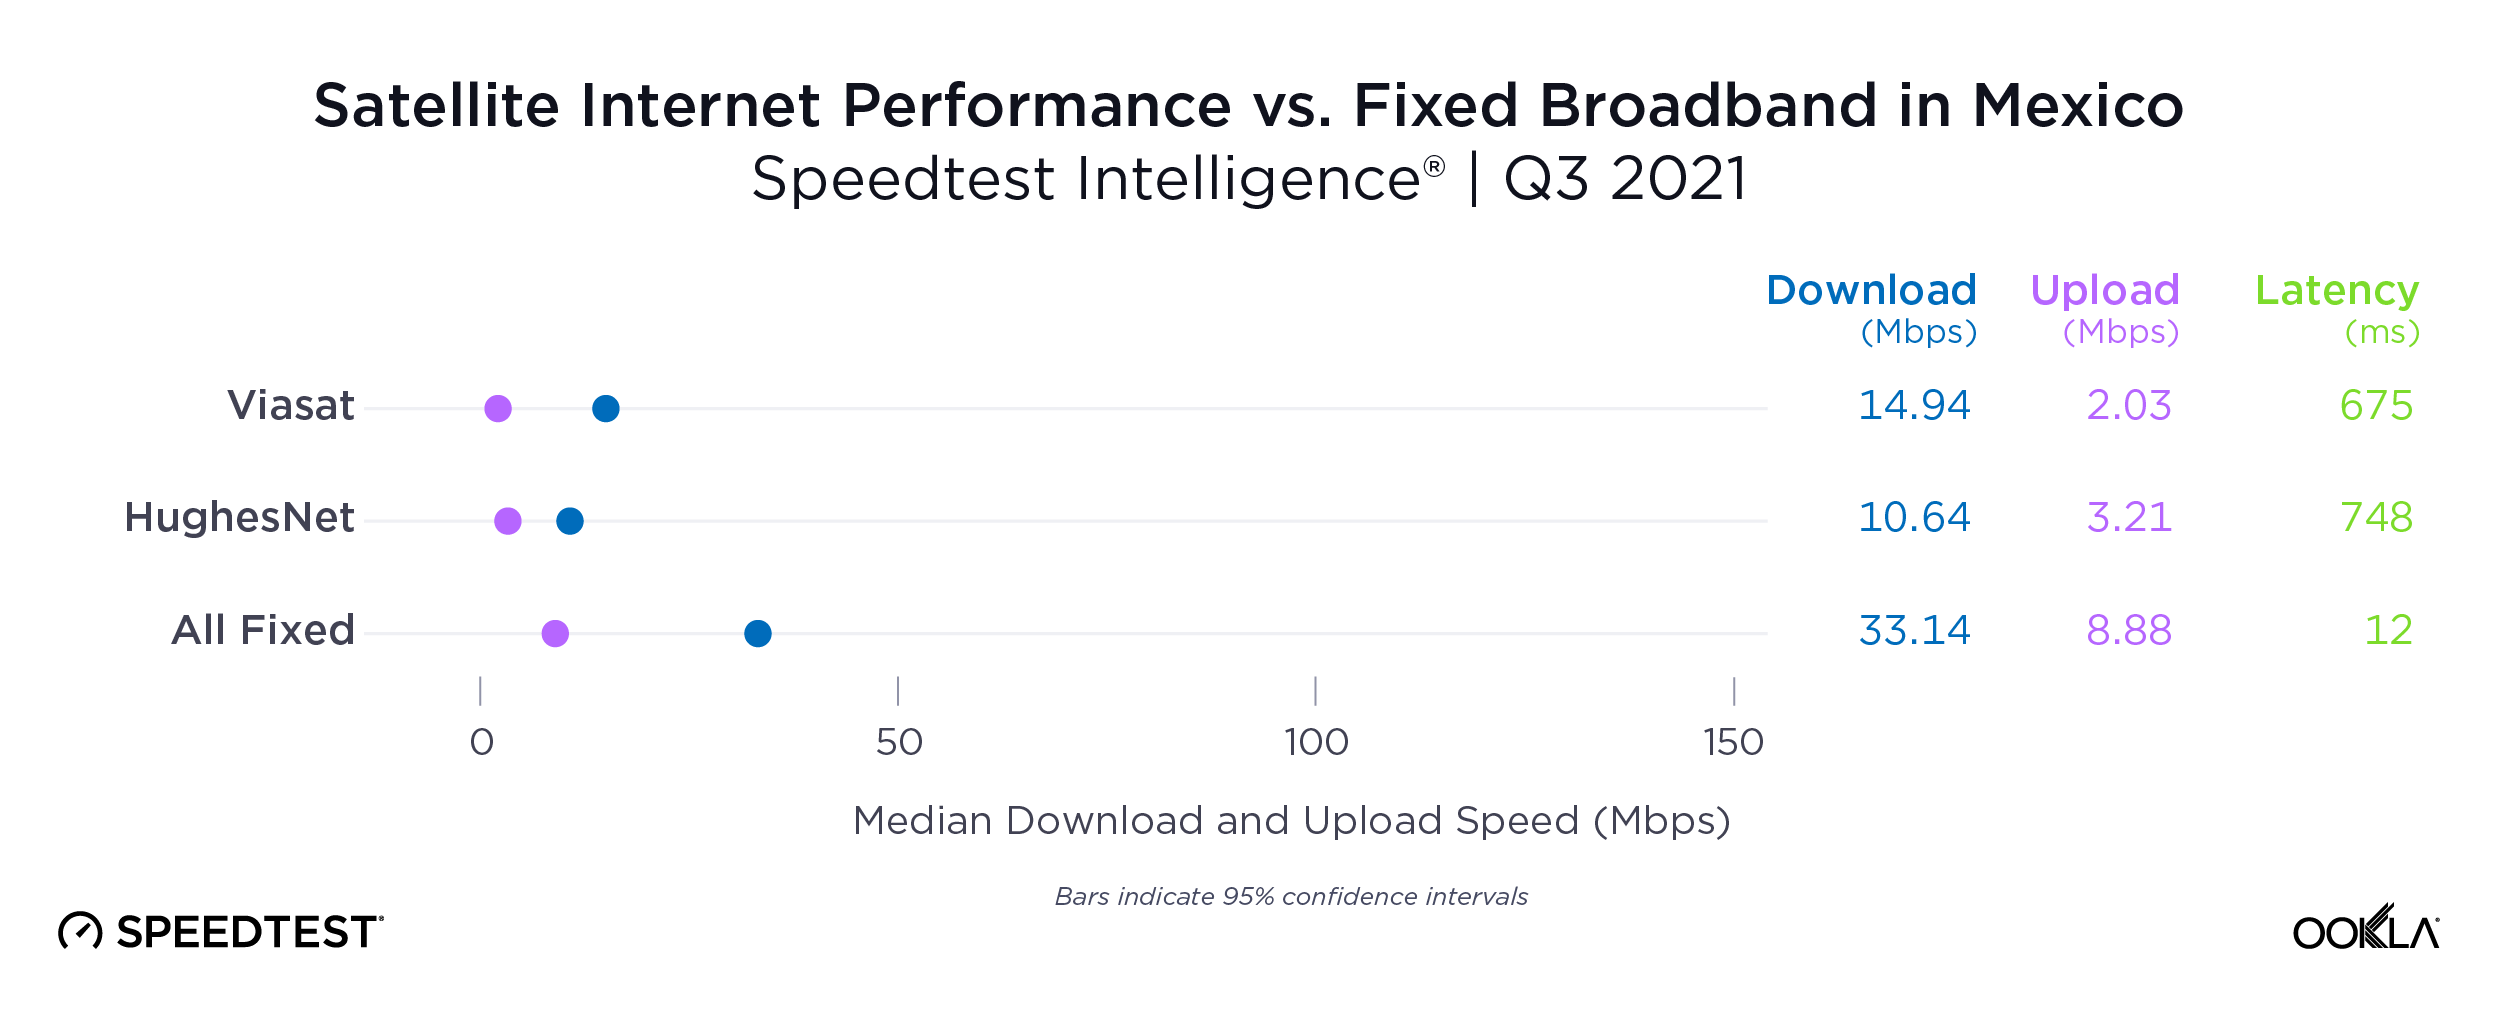
Viasat, with a median download speed of 14.94 Mbps during Q3 2021 (up from 13.95 Mbps in Q2 2021), was faster than HughesNet (10.64 Mbps in Q3 2021, down from 11.92 Mbps in Q2 2021) but slower than the country’s median for fixed broadband (33.14 Mbps in Q3 2021, 29.99 Mbps in Q2 2021). HughesNet was slightly faster than Viasat for upload speed during Q3 2021 (3.21 Mbps vs. 2.03 Mbps). While Viasat’s latency was high (675 ms vs 12 ms for fixed broadband), it was lower than HughesNet’s (748 ms).

ookla_satellite-performance_mx_1221-01-1

New Zealand: Starlink slowed slightly, remained faster than fixed broadband average

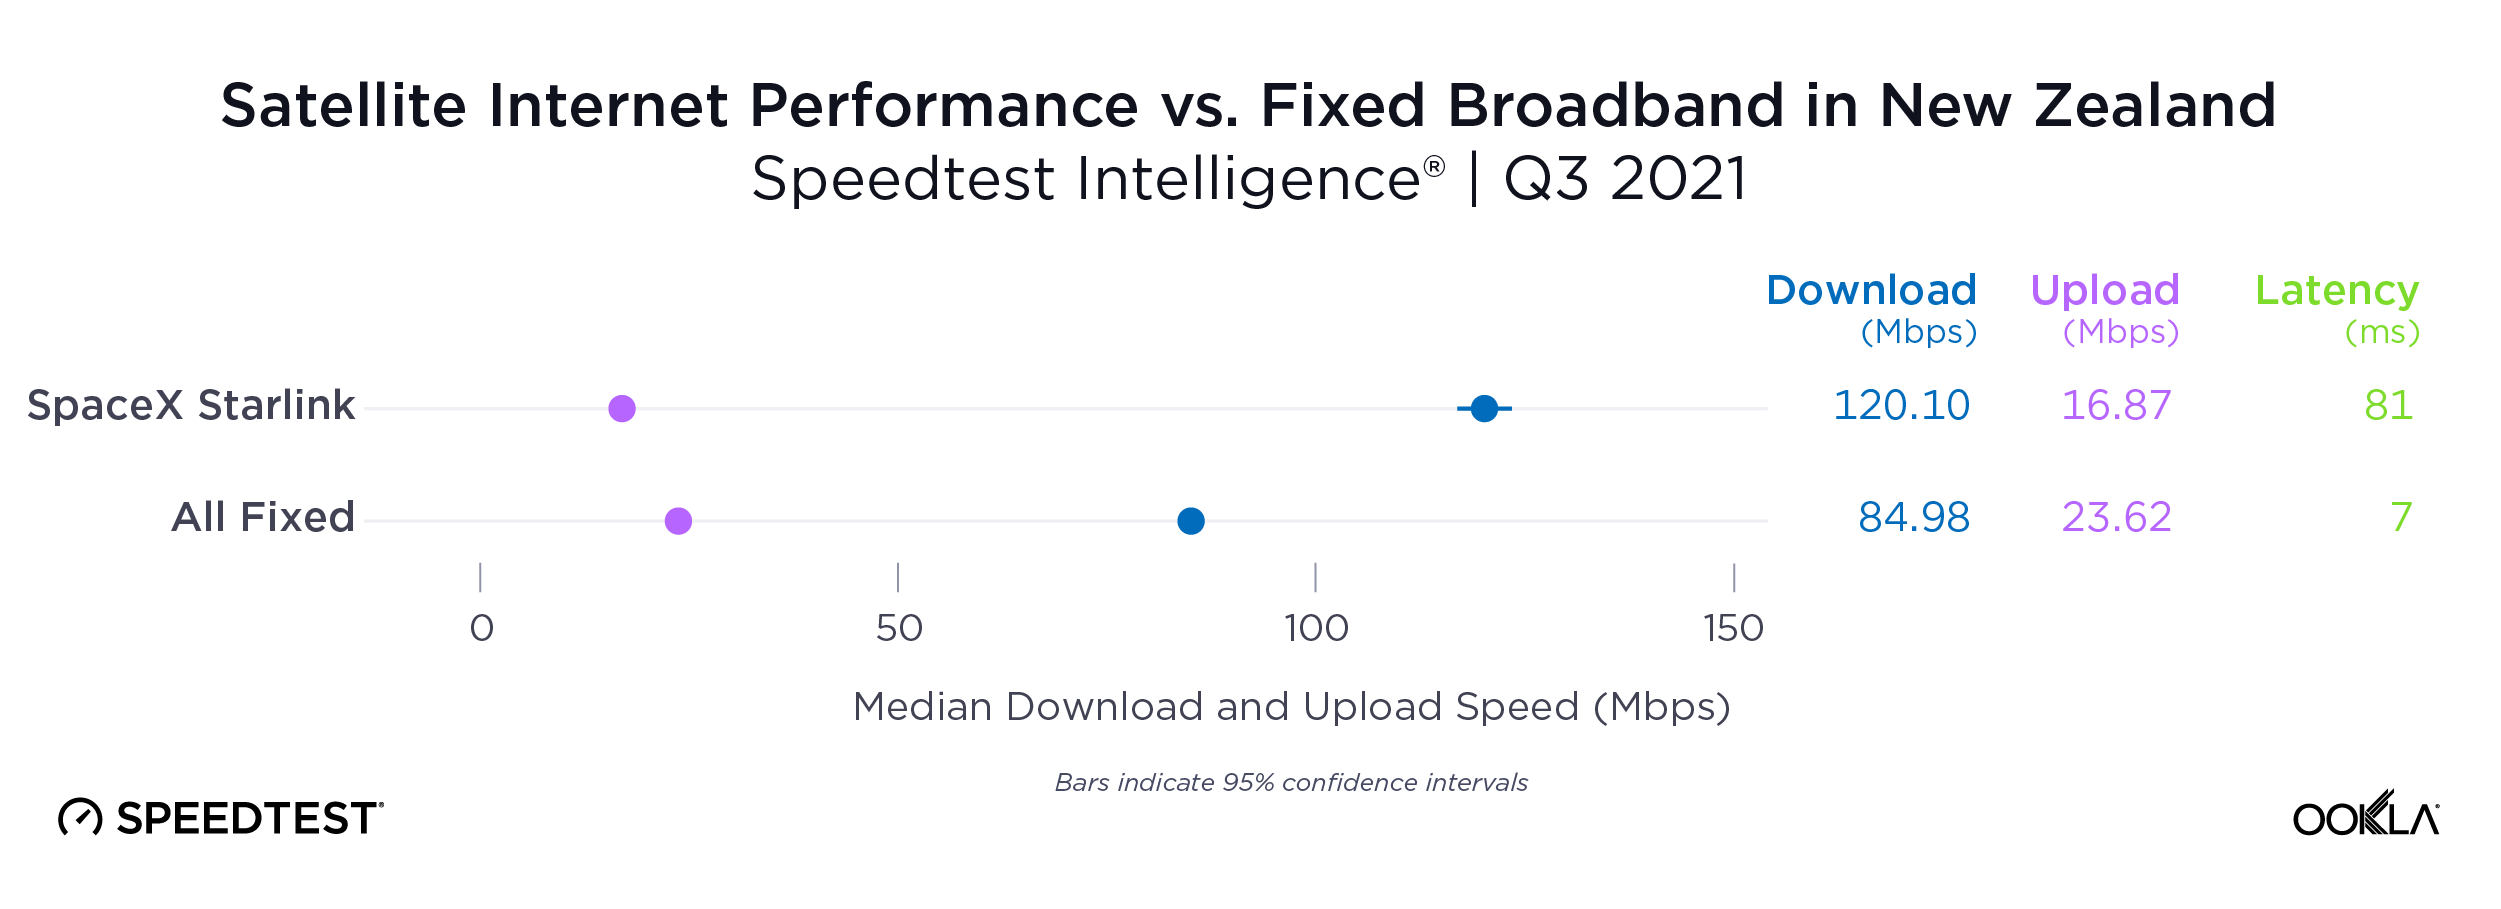
Starlink’s Q3 2021 median download speed (120.10 Mbps, down from 127.02 Mbps in Q2 2021, likely due to increased usage) was much faster than New Zealand’s median fixed broadband download speed (84.98 in Q3 2021 up from 78.85 Mbps in Q2 2021). Starlink was slower than New Zealand’s overall fixed broadband for Q3 2021 upload speed (16.87 Mbps vs. 23.62 Mbps). While Starlink’s median latency improved from 101 ms in Q2 2021 to 81 ms in Q3 2021, it was still slower than New Zealand’s median for all fixed broadband of 7 ms during Q3 2021.

ookla_satellite-performance_nz_1221-01-1

United Kingdom: Starlink nearly twice as fast as fixed broadband average

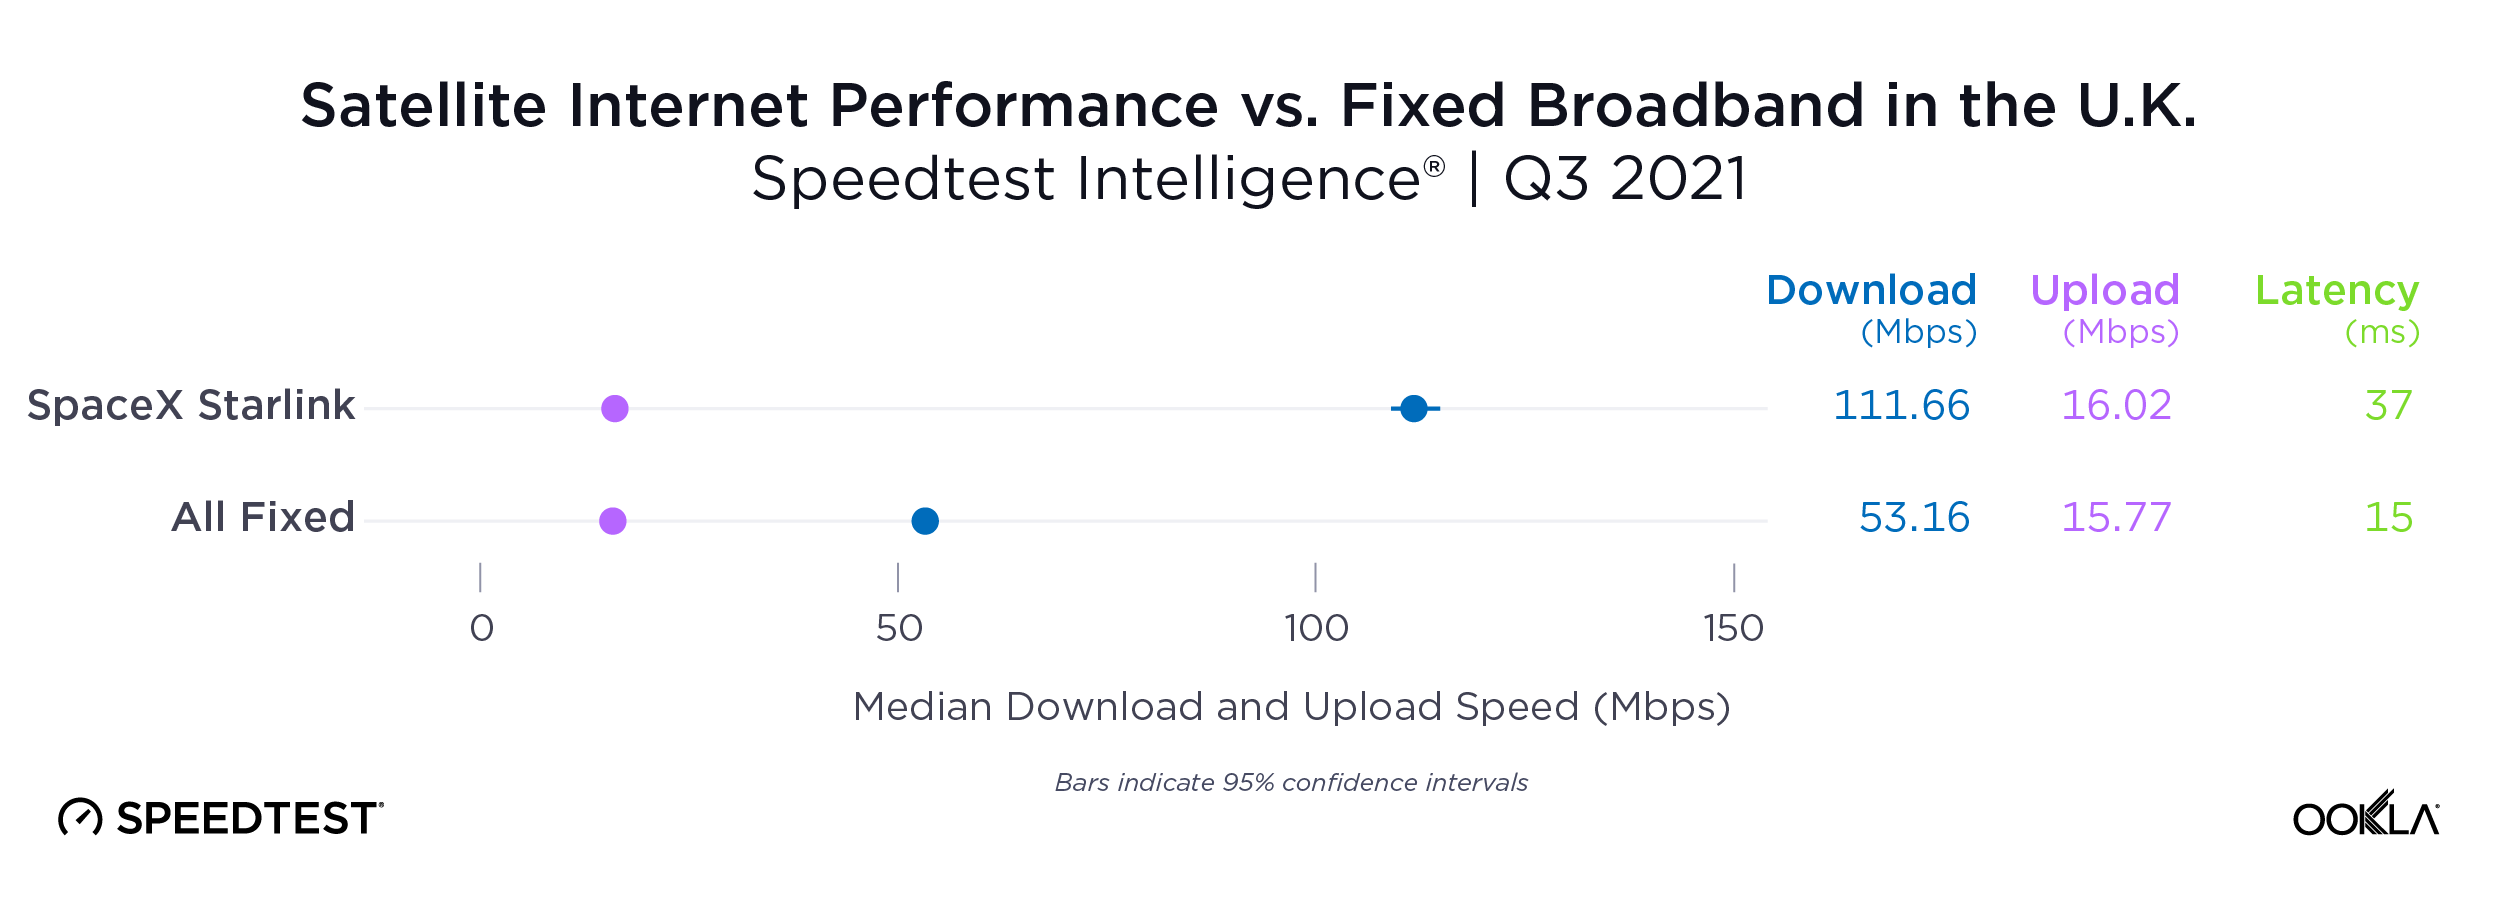
Starlink showed a much faster median download speed in the U.K. during Q3 2021 (111.66 Mbps, up from 108.30 Mbps in Q2 2021) than the country’s median for fixed broadband (53.16 Mbps in Q3 2021, up from 50.14 Mbps in Q2 2021). Starlink’s upload speed was comparable to the median for all fixed broadband in the U.K. (16.02 Mbps vs. 15.77 Mbps), and the latency was pretty good, given the distance traveled (37 ms vs. 15 ms).

ookla_satellite-performance_uk_1221-01-1

We look forward to updating this data again next quarter with new locations as satellite internet continues to become a more viable option for many. If you’re using satellite internet, take a Speedtest to help us provide an accurate picture of real-world performance.

Ookla retains ownership of this article including all of the intellectual property rights, data, content graphs and analysis. This article may not be quoted, reproduced, distributed or published for any commercial purpose without prior consent. Members of the press and others using the findings in this article for non-commercial purposes are welcome to publicly share and link to report information with attribution to Ookla.
| September 20, 2022

Starlink Slowed in Q2, Competitors Mounting Challenges

Ookla® has covered SpaceX’s Starlink satellite internet for over a year now with our ongoing series on satellite internet performance. We’ve seen Starlink launch in new locations across the world, and while some speeds have shown signs of slowing down from their initial launches, the newly announced T-Mobile partnership with Starlink could extend the benefit of satellite connections to the mobile market.

Today, we have fresh data on satellite performance during Q2 2022 in Europe, Oceania, North America, and South America. This analysis includes results from eight additional countries, two new providers, and expanded data for Starlink, HughesNet, and Viasat. We also examine how Starlink’s internet performance has changed over the past year in Canada, France, Germany, New Zealand, the United Kingdom, and the United States.

Starlink speeds decreased in every country we surveyed over the past year as more users sign up for service

Chart of Starlink performances in select countries

Speedtest Intelligence® reveals that median download speeds for Starlink fell across Canada, France, Germany, New Zealand, the U.K, and the U.S., dropping between 9% and 54% from Q2 2021 to Q2 2022 as more users signed up for the service. However, Starlink still reached a median download speed of at least 60 Mbps in North America during Q2 2022, which is more than enough for at least one connected device to do most everything on the internet including streaming video, downloading games, and chatting on video with friends and family.

Upload speeds also slowed on Starlink, with speeds decreasing across all of the countries we’ve tracked over the past year. Latency fared a little better with latency remaining relatively flat (though high when compared to fixed broadband) in most countries. New Zealand was the outlier, with latency dropping 23 ms. For most users, we still suspect these dips are still worthwhile for areas that have no service, slow service, or few affordable options for fast internet.

Starlink in Puerto Rico was the fastest satellite provider in North America

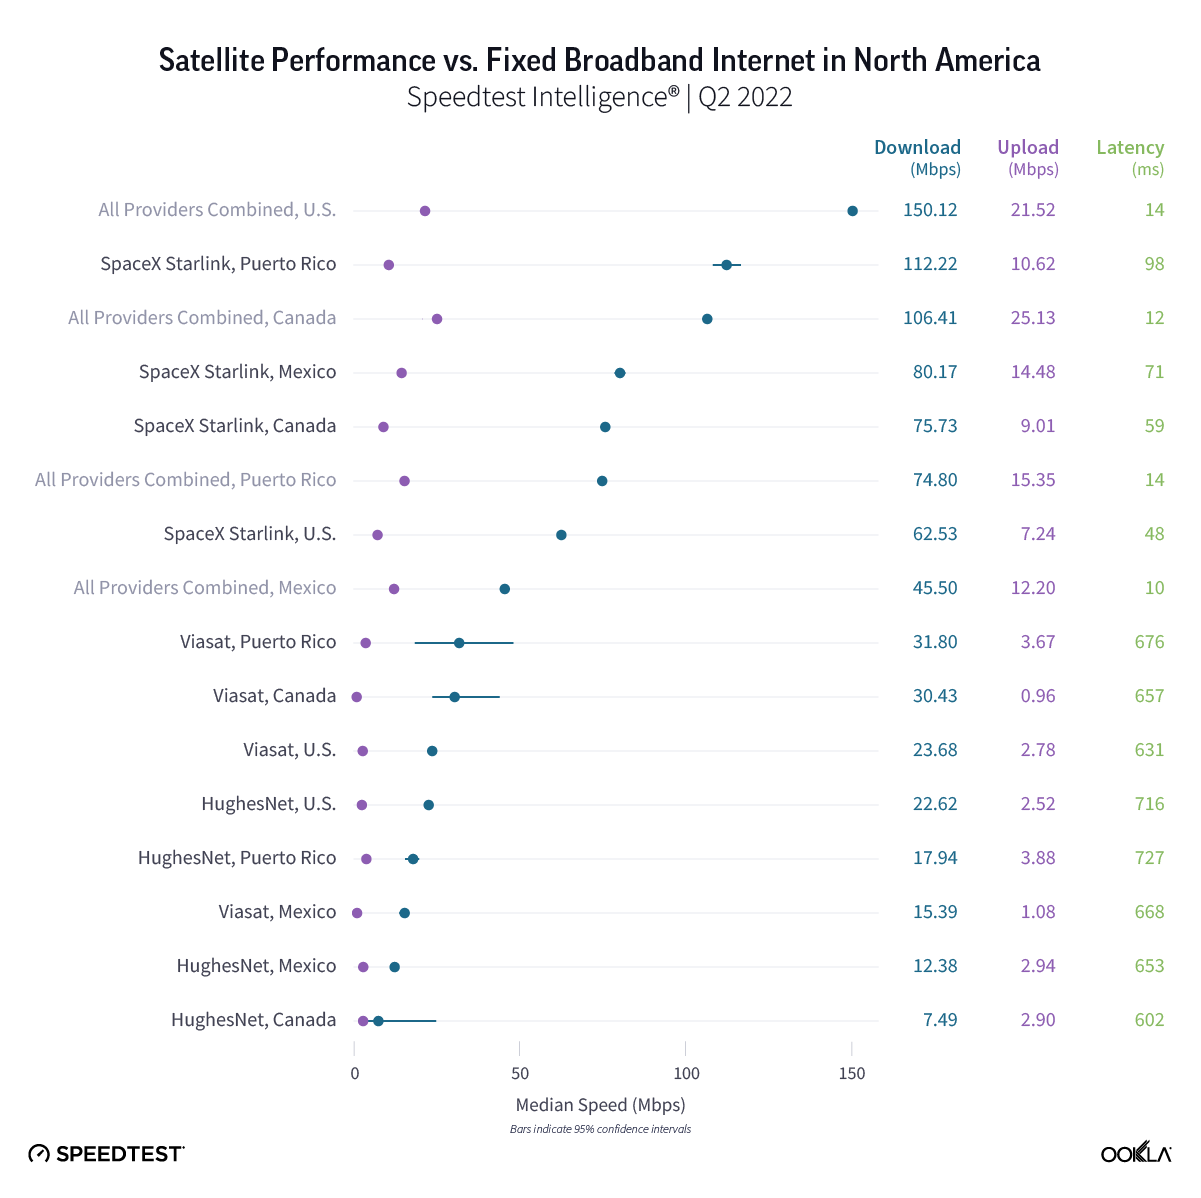
Chart of Satellite performance versus fixed broadband internet in North America

Starlink in Puerto Rico had the fastest satellite internet in North America during Q2 2022 with a median download speed of 112.22 Mbps, followed by Starlink in Mexico (80.17 Mbps), Canada (75.73 Mbps), and the U.S. (62.53 Mbps). Starlink in Puerto Rico and Mexico was faster than their countries’ fixed broadband providers combined (74.80 Mbps and 45.50 Mbps, respectively), while fixed broadband in the U.S. (150.12 Mbps) and Canada (106.41 Mbps) was faster than each country’s satellite providers.

In every country except Mexico, fixed broadband upload speeds were faster than satellite speeds. Starlink in Mexico edged out fixed broadband providers 14.48 Mbps to 12.20 Mbps. Latency was higher for every satellite provider compared to fixed broadband. Starlink in the U.S. had the lowest median latency among satellite providers at 48 ms.

Starlink outperformed fixed broadband average in 16 European countries

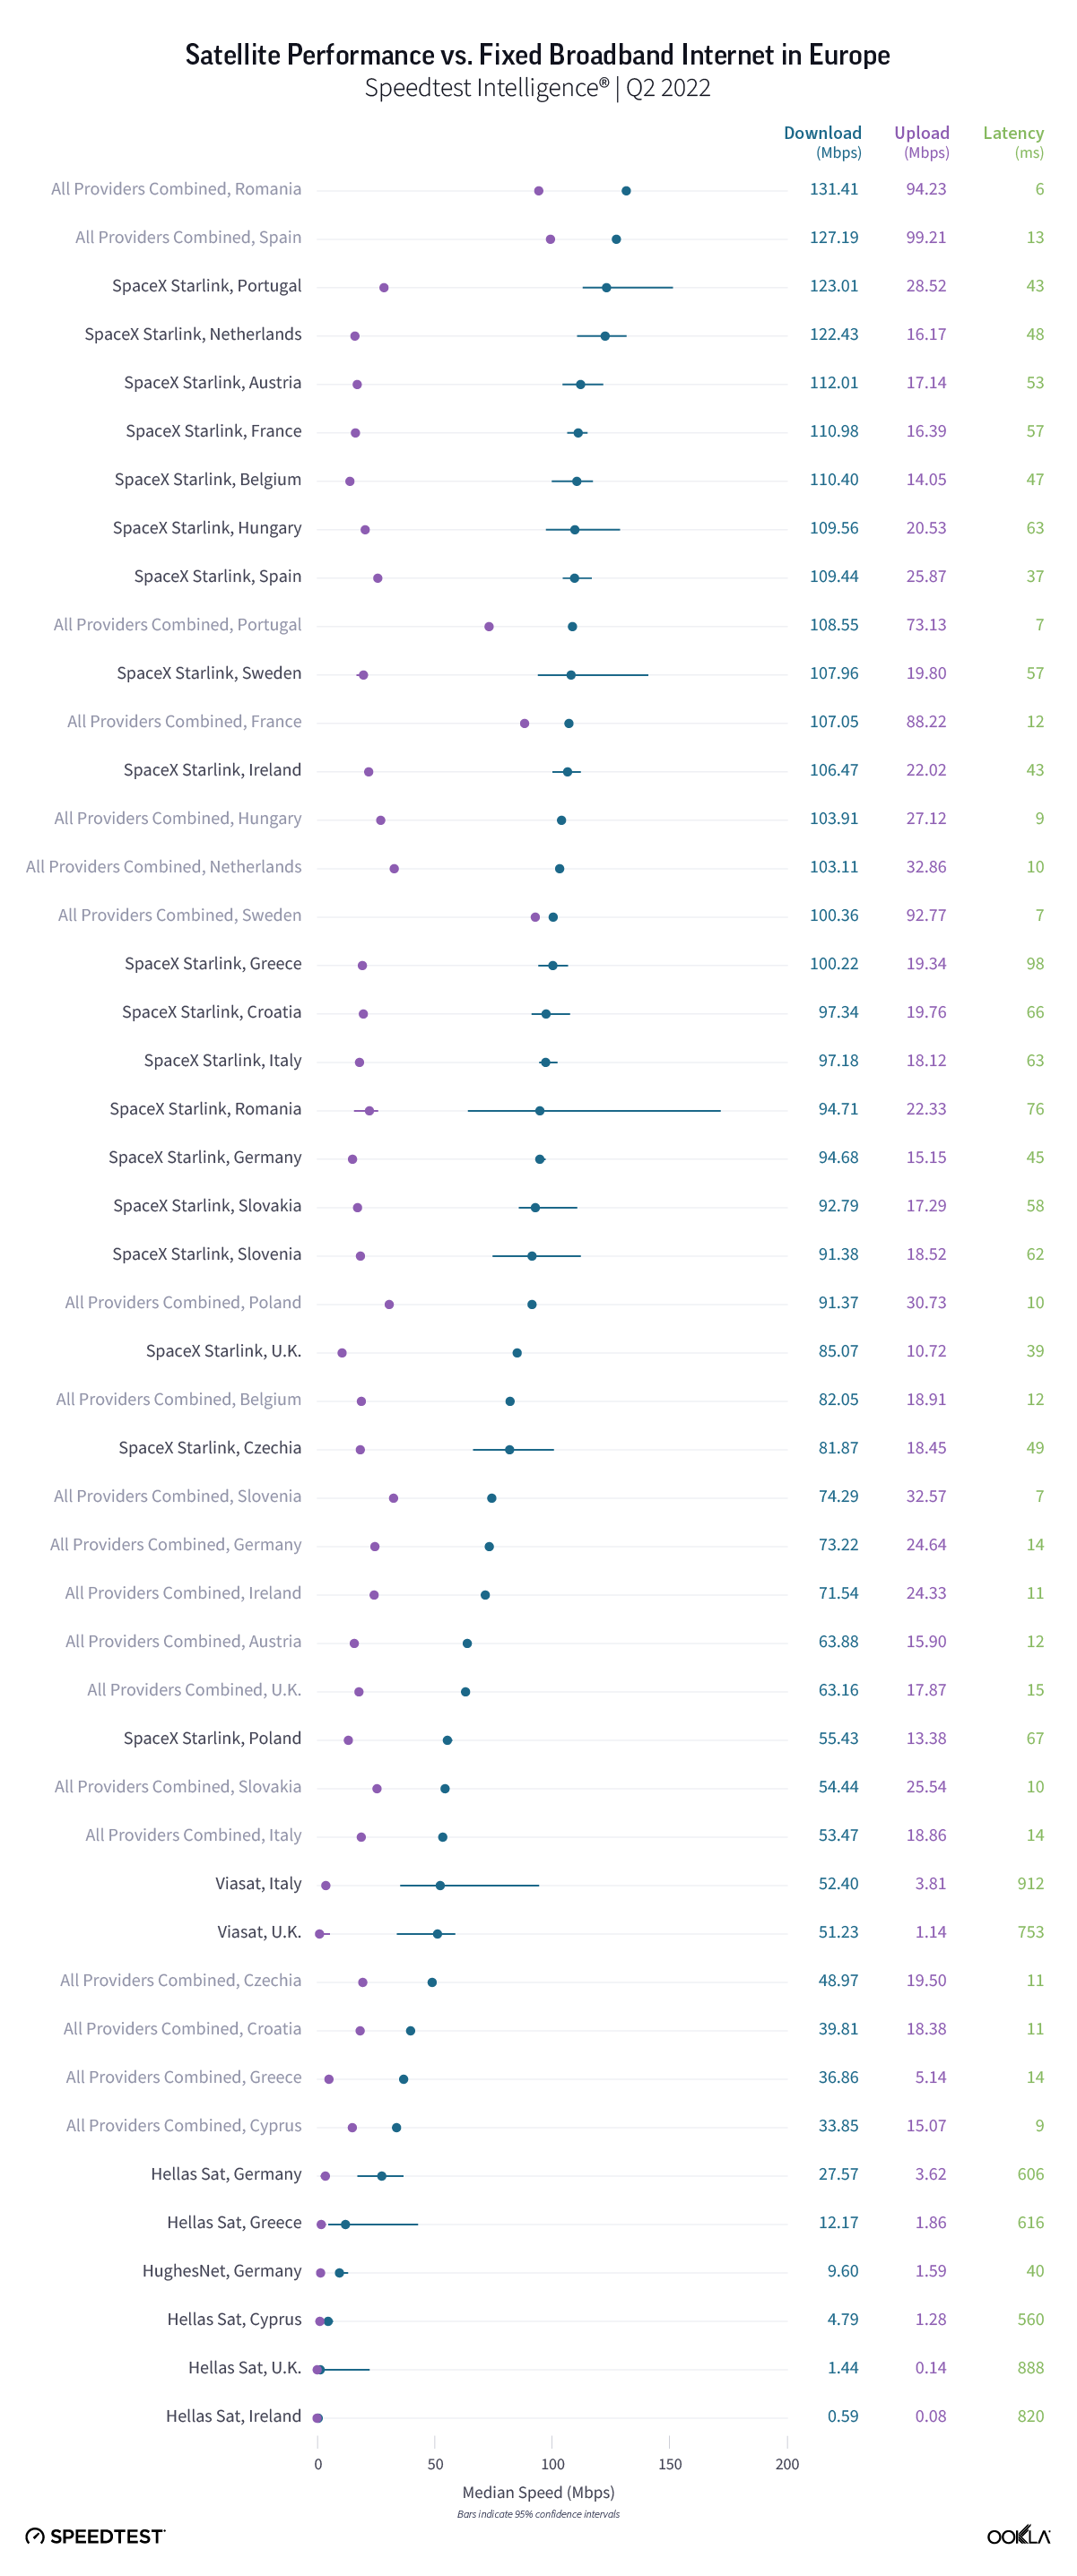
Chart of Satellite performance versus fixed broadband internet in Europe

Speedtest Intelligence shows Starlink was fast in Europe during Q2 2022, outperforming fixed broadband median download speed in 16 countries and reached download speeds over 100 Mbps in 10 countries. In contrast, fixed broadband only achieved median download speeds over 100 Mbps in six countries: Romania, Spain, Portugal, France, Hungary, and the Netherlands during Q2 2022. Starlink was fastest for median download speed in Portugal at 123.01 Mbps, the Netherlands (122.43 Mbps), Austria (112.01 Mbps), France (110.98 Mbps), and Belgium (110.40 Mbps). Romania and Spain were the only countries to have fixed broadband beat Starlink for fastest median download speed, achieving 131.41 Mbps and 127.19 Mbps, respectively.

For upload, Starlink in Greece and Austria was the only satellite provider to achieve faster upload speeds than all fixed broadband providers combined at 19.34 Mbps to 5.14 Mbps, and to 17.14 Mbps to 15.90 Mbps, respectively. Fixed broadband providers in Spain (99.21 Mbps), Romania (94.23 Mbps), Sweden (92.77 Mbps), France (88.22 Mbps), Lithuania (83.54 Mbps), and Portugal (73.13 Mbps) all recorded median upload speeds greater than 70 Mbps, with the closest satellite provider being Starlink in Portugal at 28.52 Mbps.

All satellite providers fell far behind fixed broadband providers in the whole of Europe for latency during Q2 2022. Starlink in Spain and the United Kingdom recorded the lowest satellite latencies at 37 ms and 39 ms, respectively — still a far cry from the closest fixed broadband latency, which was 14 ms in Germany, Greece, and Italy.

Starlink in Brazil was the fastest satellite provider in South America

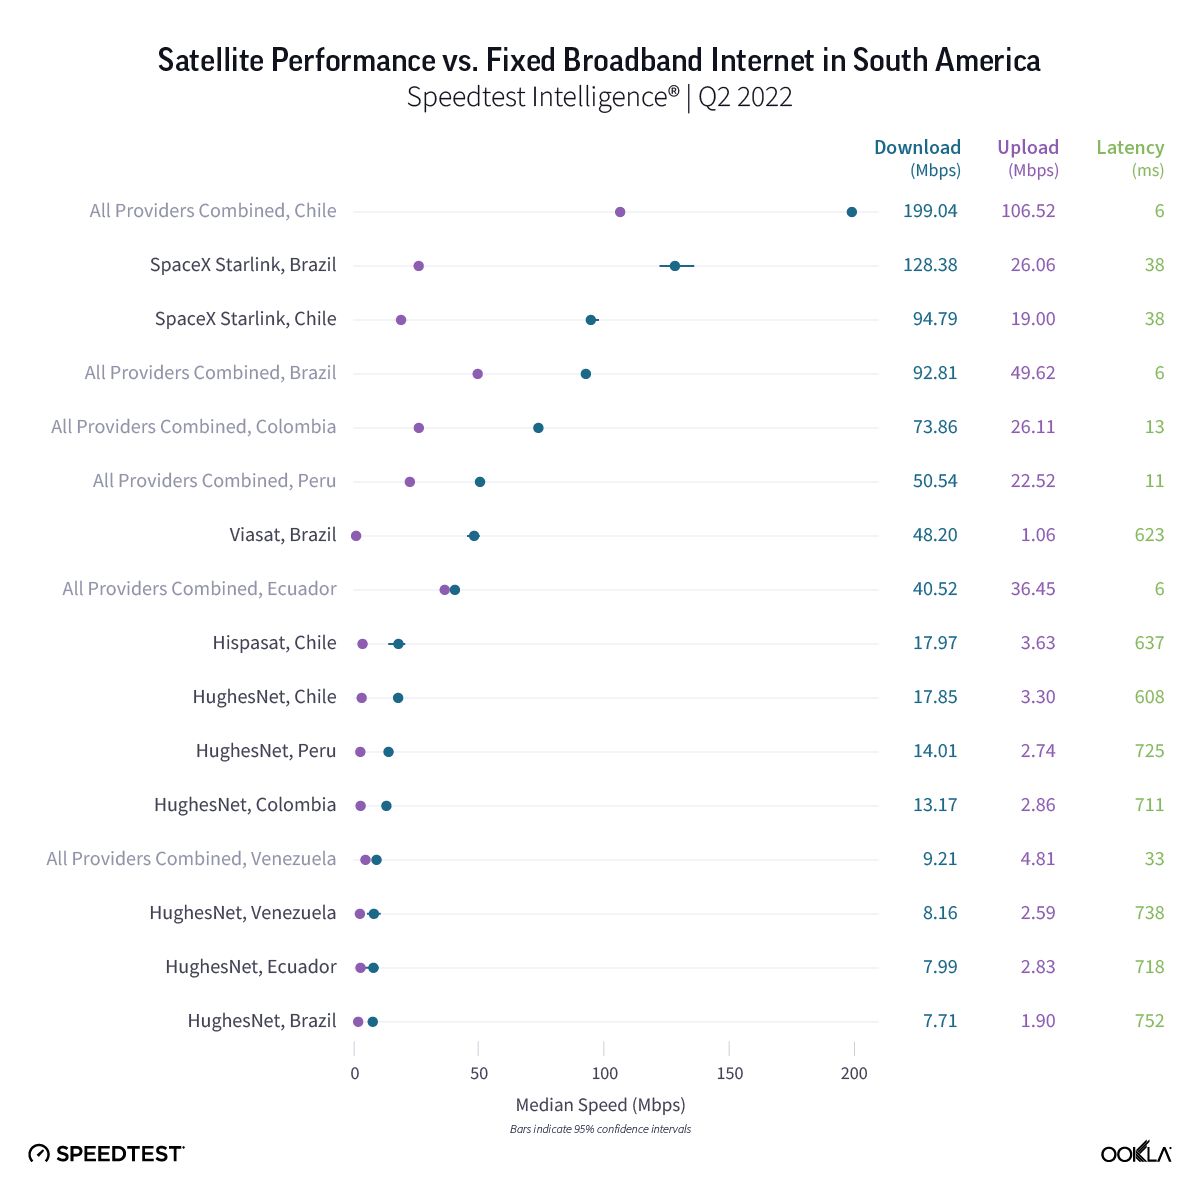
Chart of Satellite performance versus fixed broadband internet in South America

Our analysis of Speedtest Intelligence data found Starlink in Brazil was the fastest satellite provider in South America with a median download speed of 128.38 Mbps during Q2 2022, followed by Starlink in Chile at 94.79 Mbps. Chilean fixed broadband internet was still much faster for those who could get access to it. The Speedtest Global Index™ found Chile had the second fastest fixed broadband internet in the world with a median download speed of 211.43 Mbps during August 2022. Starlink in Brazil was the only satellite provider to be faster than its country’s fixed broadband providers combined.

Like last quarter, South American fixed broadband providers surpassed satellite providers in each respective upload speeds during Q2 2022. All satellite providers had a higher median latency than fixed broadband, though Starlink in Brazil and Chile had latencies of 38 ms.

Starlink in New Zealand was the fastest satellite provider in Oceania 

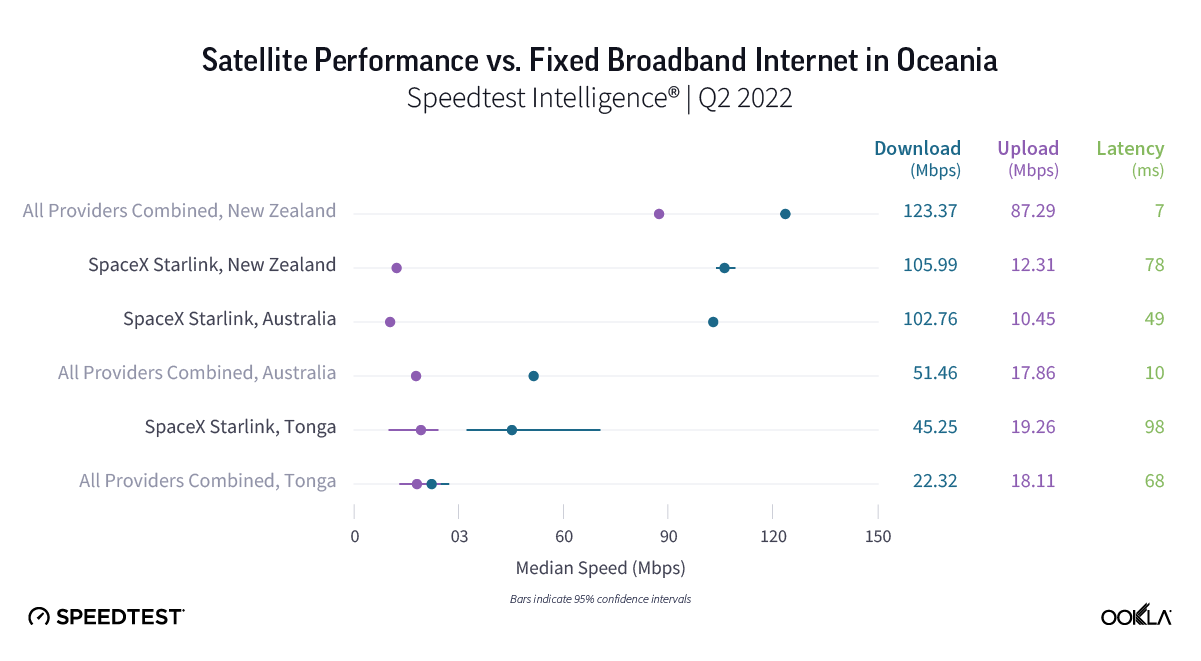
Chart of Satellite performance versus fixed broadband internet in Oceania

Starlink’s fastest median download speed in Oceania was in New Zealand at 105.99 Mbps, though this still fell short of fixed broadband providers in the country. Starlink in Australia was faster than fixed broadband providers by a wide margin at 102.76 Mbps to 51.46 Mbps during Q2 2022. Starlink outperformed fixed broadband providers in new-to-our-list Tonga 45.25 Mbps to 22.32 Mbps. 

New Zealand’s fixed broadband dominated for the fastest median upload speed in Oceania at 87.29 Mbps during Q2 2022, while Australia’s fixed broadband fell far behind with an upload speed of 17.86 Mbps. Both speeds were still faster than Starlink’s median upload speeds in New Zealand and Australia (12.31 Mbps and 10.45 Mbps, respectively). Tonga didn’t have a statistical winner for fastest upload speed, but Starlink reached 19.26 Mbps and fixed broadband 18.11 Mbps. Fixed broadband also had a lower median latency than Starlink during Q1 2022, which clocked in at 49 ms in Australia, 78 ms in New Zealand, and 98 ms in Tonga.

Biggest questions lie ahead, but competition will be good for consumers

Satellite connectivity is coming to mobile, with Starlink’s new partnership with T-Mobile and new mobile devices becoming satellite enabled. This will cause ripples across North America, which is a net positive for consumers who live in areas with low mobile and fixed broadband connectivity. Connecting with the world won’t be a question of how anymore, it will be a question of how good your experience is. That’s hopefully a win-win for consumers, especially as more providers vie for the fastest and best satellite experience — a true global space race.

Starlink isn’t stopping there — they’re trying to get into airplanes, cruise ships, and cars. But they’re not the only satellite provider making moves; Viasat is launching its Viasat-3 fleet, OneWeb is combining business with Eutelsat, and Amazon is sending 3,236 Project Kuiper satellites into orbit. We’ll be here monitoring the skies in our ongoing satellite series. Take a Speedtest® to help us provide an accurate and more complete picture of real-world performance. And if we’re missing data on your satellite network, send us a screenshot of your speed on Twitter or Facebook.

Ookla retains ownership of this article including all of the intellectual property rights, data, content graphs and analysis. This article may not be quoted, reproduced, distributed or published for any commercial purpose without prior consent. Members of the press and others using the findings in this article for non-commercial purposes are welcome to publicly share and link to report information with attribution to Ookla.
| June 28, 2022

Here’s How Fast Starlink Has Gotten Over the Past Year

It’s been a year since we first examined SpaceX’s Starlink satellite internet, which launched its public beta in November 2020. Today we’re updating our ongoing series on satellite internet performance with data from Q1 2022 in Europe, Oceania, North America, and South America, including results from 10 additional countries. We’re also examining how Starlink’s internet performance has changed over the past year in the United States and Canada.

Starlink speeds increased nearly 58% in Canada and 38% in the U.S. over the past year

chart of Starlink and fixed broadband performance in Canada and the United States

Speedtest Intelligence® reveals that median download speeds for Starlink dramatically increased from Q1 2021 to Q1 2022 in the U.S. and Canada, as did speeds for all fixed broadband providers combined. In the U.S., Starlink median download speeds improved roughly 38% from 65.72 Mbps in Q1 2021 to 90.55 Mbps in Q1 2022. In Canada, Starlink’s download speed leapt ahead nearly 58% from 61.84 Mbps to 97.40 Mbps during the same time period.

However, Speedtest Intelligence also showed that upload speeds for Starlink decreased at least 33% in the U.S. (16.29 Mbps in Q1 2021 to 9.33 Mbps in Q1 2022) and at least 36% in Canada (16.69 Mbps to 10.70 Mbps) during the same time period. Median latency on Starlink marginally increased from 40 ms to 43 ms in the U.S. and from 51 ms to 55 ms in Canada during the past year. For many Starlink users, we suspect these changes are negligible.

Starlink in Mexico was the fastest satellite provider in North America

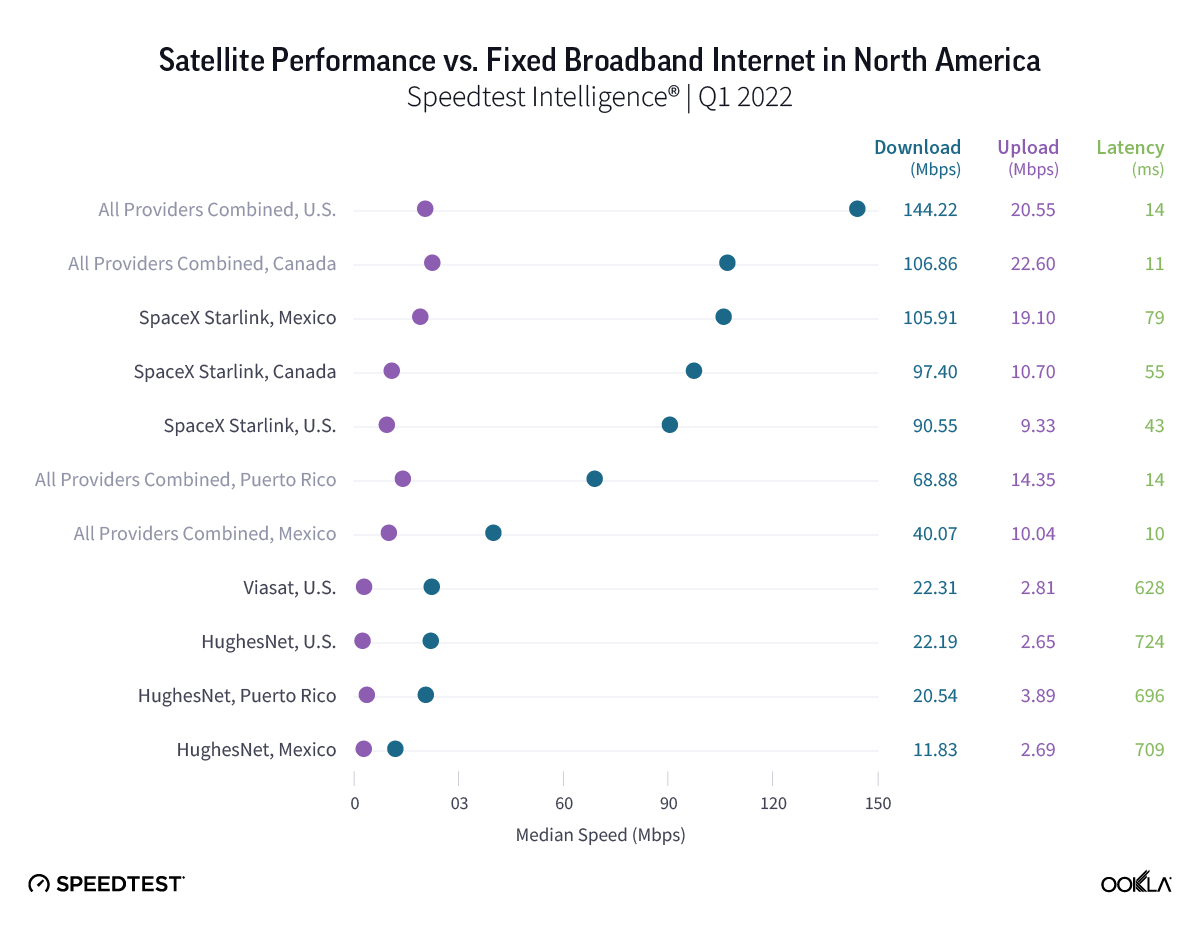
Chart of Satellite performance versus fixed broadband internet in North America

Starlink in Mexico had the fastest satellite internet in North America during Q1 2022 with a median download speed of 105.91 Mbps, followed by Starlink in Canada (97.40 Mbps) and the U.S. (90.55 Mbps). Mexico’s fixed broadband download speed (40.07 Mbps) was much slower than Starlink, while Starlink download speeds were slower than fixed broadband for all providers combined in the U.S. (144.22 Mbps) and Canada (106.86 Mbps). Puerto Rico, new to our list, showed HughesNet had the fastest satellite internet on the island territory at 20.54 Mbps, though fixed broadband was much faster at 68.88 Mbps.

Starlink in Lithuania was the fastest satellite provider in Europe

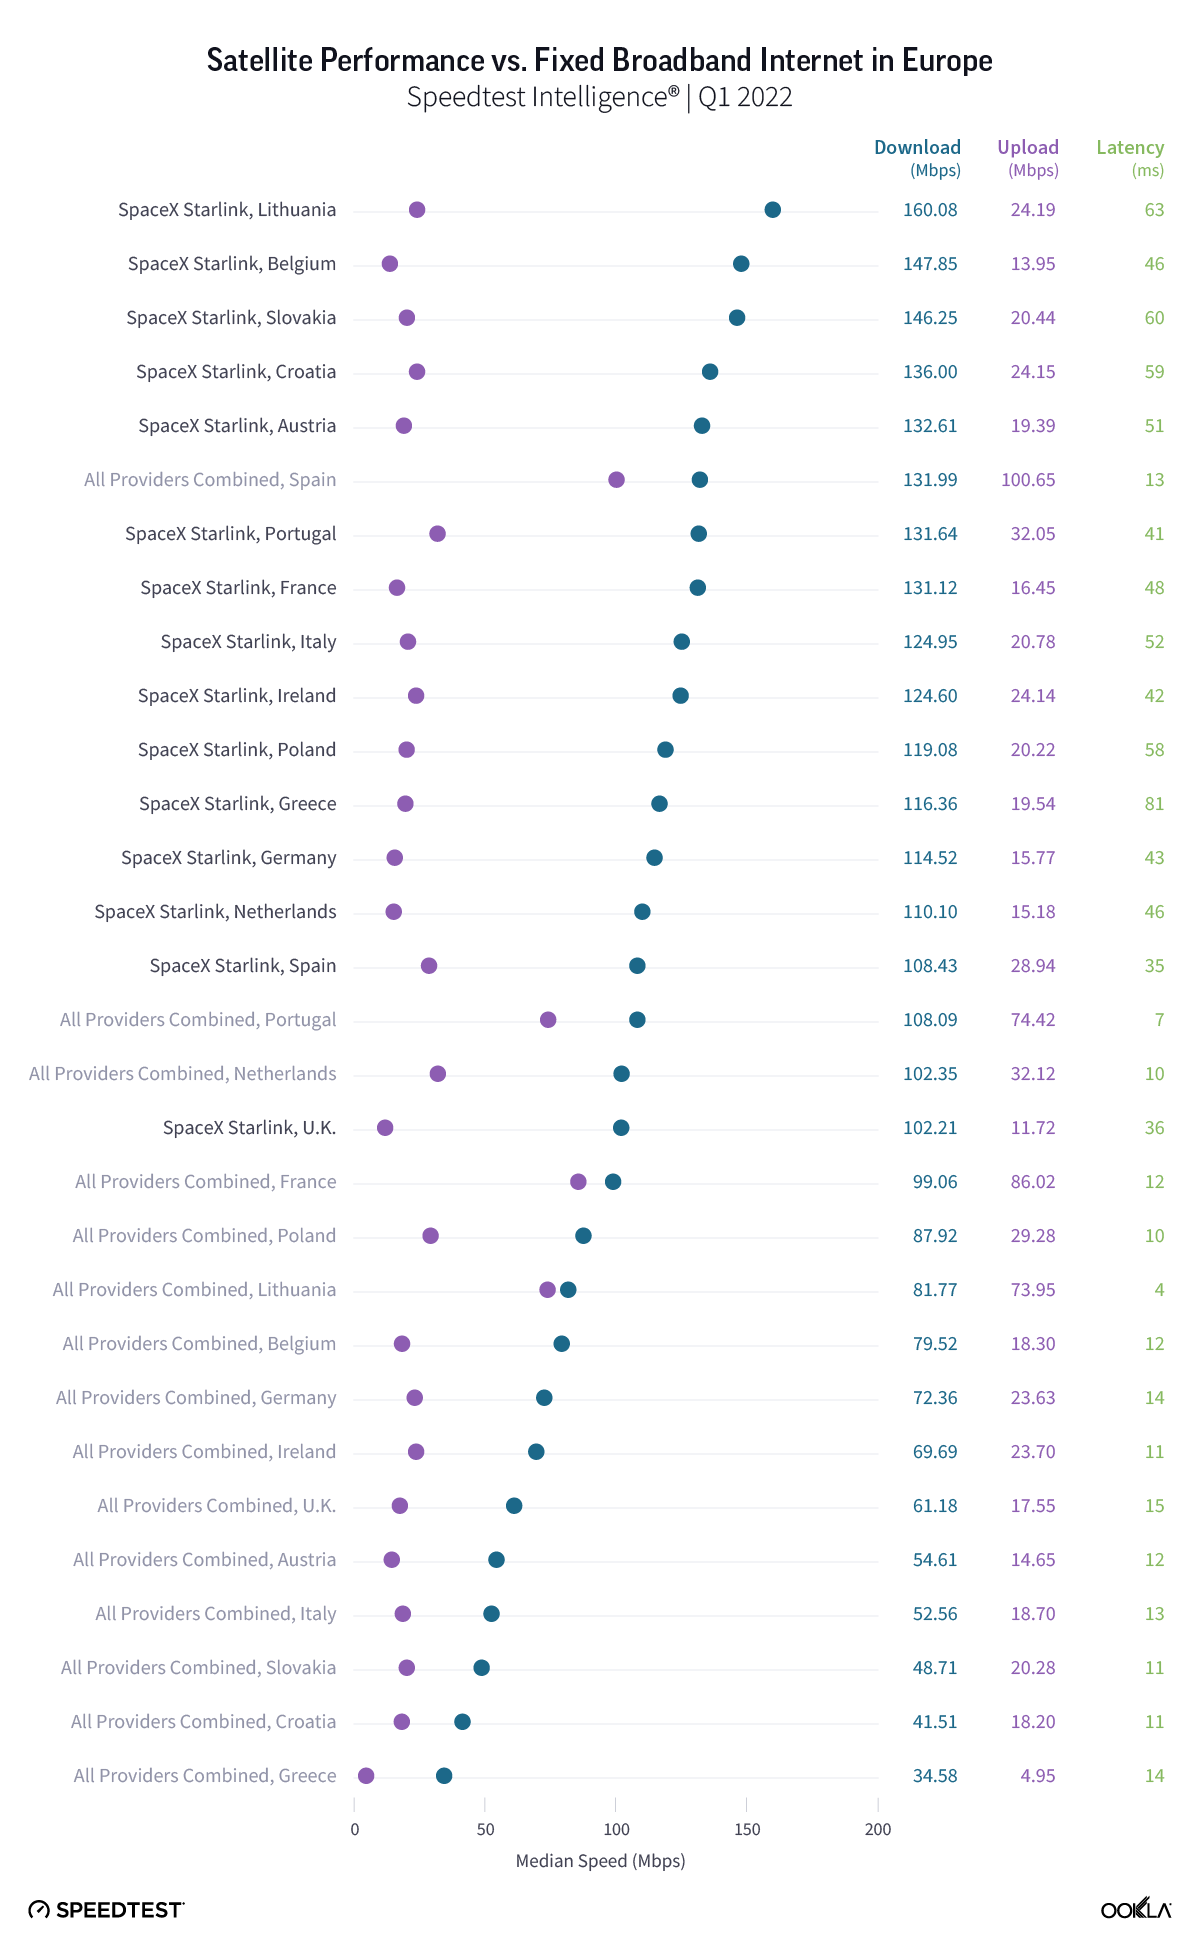
Chart of satellite performance versus fixed broadband internet in Europe

Speedtest Intelligence showed that Starlink blazed ahead in Europe during Q1 2022, with Starlink achieving a 100+ Mbps median download speed in every country where it was commercially available. In contrast, fixed broadband only achieved median download speeds over 100 Mbps in Spain, Portugal, and the Netherlands during Q1 2022. Starlink was fastest for download speed in Lithuania at 160.08 Mbps, followed by Belgium (147.85 Mbps), Slovakia (146.25 Mbps), Croatia (136.00 Mbps), and Austria (132.61 Mbps). Spain was the only country to have its fixed broadband beat Starlink for fastest median download speed, achieving 131.99 Mbps to Starlink’s 108.43 Mbps within the country.

For upload, fixed broadband providers in Spain (100.65 Mbps), France (86.02 Mbps), Portugal (74.42 Mbps), and Lithuania (73.95 Mbps) all recorded median speeds greater than 70 Mbps, while the closest satellite provider, Starlink in Portugal, trailed at 32.05 Mbps.

All satellite providers fell far behind fixed broadband providers in the whole of Europe for latency during Q1 2022, with Starlink in Spain and the United Kingdom recording the highest satellite latencies at 35 ms and 36 ms, respectively — a far cry from the lowest fixed broadband latency, which was 15 ms in the U.K.

Starlink in Chile was the fastest satellite provider in South America

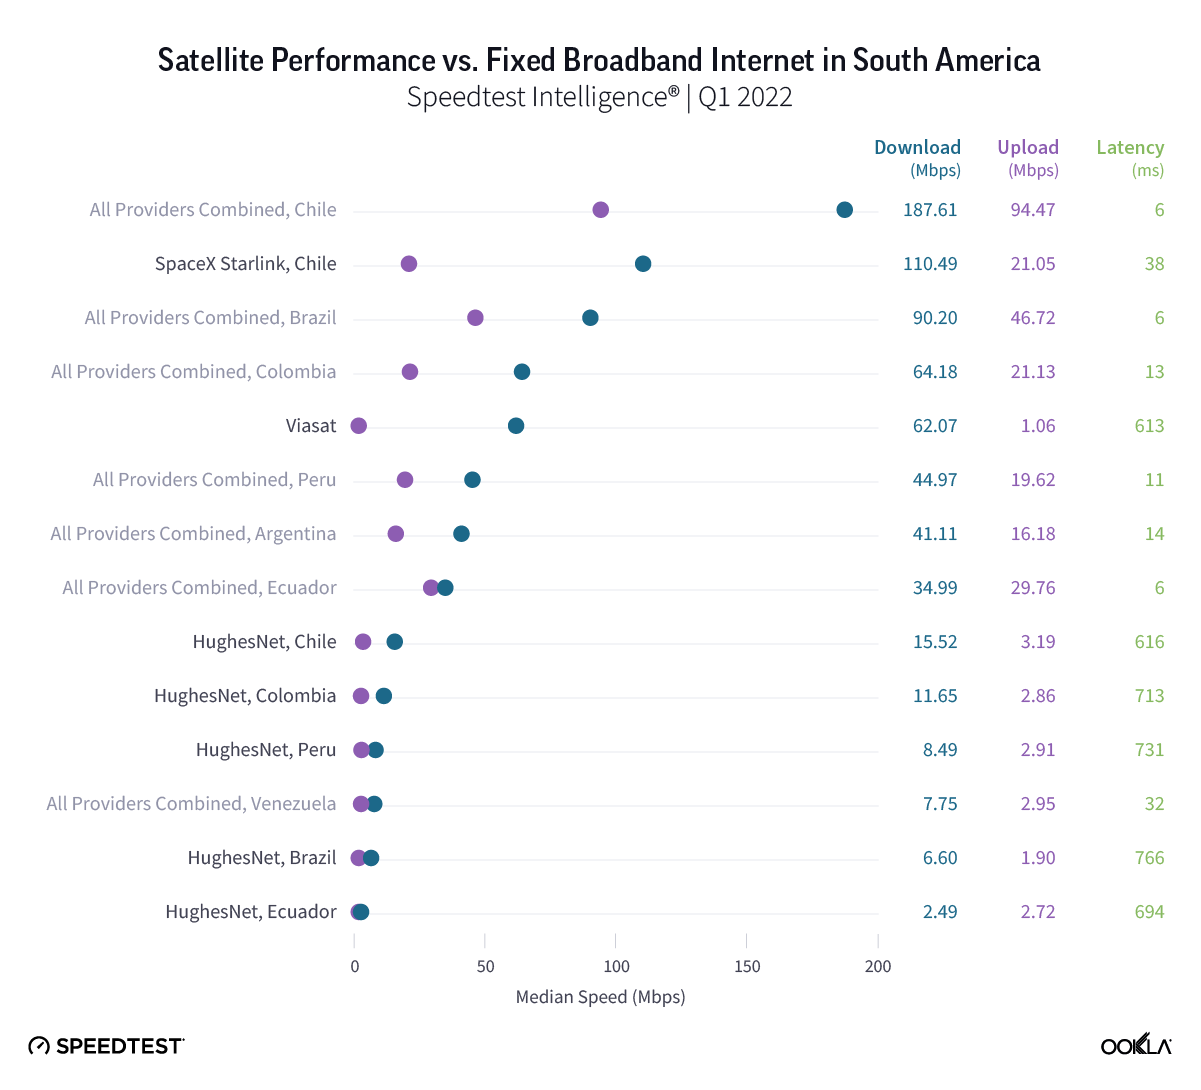
Chart of Satellite performance versus fixed broadband internet in South America

Our analysis of Speedtest Intelligence data found Starlink in Chile was the fastest satellite provider in South America with a median download speed of 110.49 Mbps during Q1 2022. Although Chilean fixed broadband internet was much faster for those who could get access to it. In fact, during May 2022, the Speedtest Global Index™ found Chile had the second fastest fixed broadband internet in the world with a median download speed of 206.97 Mbps, just a hair shy of Singapore’s first place speed of 209.21 Mbps. 

No South American satellite provider surpassed its country’s fixed broadband download or upload speeds during Q1 2022. Viasat in Brazil had a noteworthy median download speed of 62.07 Mbps, though still fell short of the country’s fixed broadband speed of 90.20 Mbps. All satellite providers had a higher median latency than fixed broadband, though Starlink in Chile had a latency of 38 ms.

Starlink in Australia was the fastest satellite provider in Oceania

Chart of Satellite performance versus fixed broadband internet in Oceania

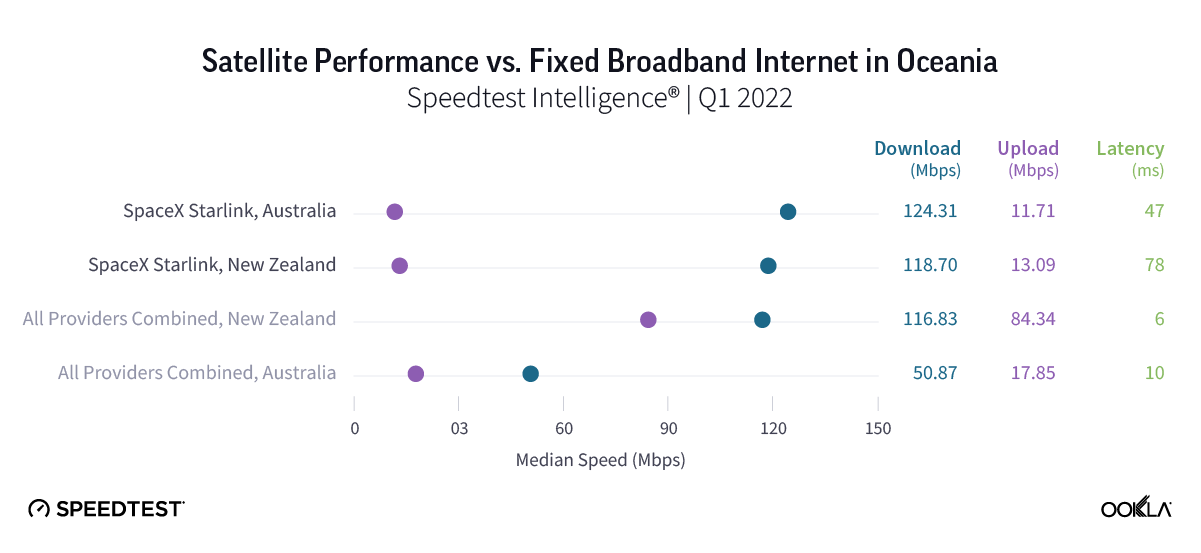
Starlink raced ahead in Oceania, recording faster median download speeds than fixed broadband in both Australia and New Zealand. In Australia, Starlink had a median download speed of 124.31 Mbps, much faster than Australian fixed broadband at 50.87 Mbps for download during Q1 2022. The comparison in New Zealand was much closer with Starlink’s median download speed at 118.70 Mbps and fixed broadband at 116.83 Mbps during Q1 2022.

New Zealand’s fixed broadband dominated for the fastest median upload speed in Oceania at 84.34 Mbps during Q1 2022, while Australia’s fixed broadband fell far behind with an upload speed at 17.85 Mbps. Both speeds were still faster than Starlink’s median upload speeds in New Zealand and Australia (13.09 Mbps and 11.71 Mbps, respectively). Fixed broadband also had a faster median latency than Starlink during Q1 2022, which clocked in at 47 ms in Australia and 78 ms in New Zealand.

Consumers are flocking to Starlink, but competitors are close behind

As we’ve continued to see over the past year, Starlink’s low-earth orbit satellites (LEOs) provide a life-changing service for consumers in rural areas that might not otherwise have access to high-speed internet. However, more companies are looking to compete with Starlink and launch their own LEO constellations, including Amazon’s Project Kuiper, which recently received FCC permission to test their own satellite service and is slated to launch later this year, and Viasat which is set to merge with Inmarsat and launch new constellations by 2023.

We’ll continue to monitor the skies in our ongoing satellite series, but if you’re using satellite internet, take a Speedtest® to help us provide an accurate and more complete picture of real-world performance.

Editor’s note: This article was amended on June 28 to clarify percentage increases in the U.S. and Canada and to update the percent change for upload for Canada.

Ookla retains ownership of this article including all of the intellectual property rights, data, content graphs and analysis. This article may not be quoted, reproduced, distributed or published for any commercial purpose without prior consent. Members of the press and others using the findings in this article for non-commercial purposes are welcome to publicly share and link to report information with attribution to Ookla.
| January 27, 2025

Impact Analysis: Storm Éowyn Tests the Resilience of Telecoms Infrastructure in the UK and Ireland

Record power outages have crippled mobile network infrastructure, underscoring the need for network hardening as severe weather events become more frequent.

The UK and Ireland are in recovery mode after Storm Éowyn wreaked havoc on electricity and telecoms infrastructure in recent days. With record wind gusts exceeding 180 km/h recorded in Ireland and a ‘major incident’ declared on the Isle of Man, the storm has been historic in both its strength and the extent of the damage caused across the islands.

Key Takeaways:

  • Storm Éowyn triggered a rapid, severe and sustained decline in mobile performance across all operators in Ireland and parts of the UK, particularly Northern Ireland and Scotland, on a scale not seen before. On the day the storm made landfall (24th January), median mobile download speeds in Ireland (10.04 Mbps) were 78% lower than the preceding 7-day average of 47.43 Mbps, while median latency was 23% higher at 47.6 ms. In Scotland and Northern Ireland, mobile download speeds at the 10th percentile—a critical metric reflecting the poorest network performance—dropped significantly on the same day, falling by 63% to 2.19 Mbps and by 74% to 1.31 Mbps, respectively, compared to the 7-day average. 
  • Network disruptions drove a dramatic deterioration in quality of experience (QoE) in bread-and-butter consumer applications. Consistency—an important metric indicating the proportion of Speedtest samples meeting minimum download and upload speed thresholds—dropped sharply on the day of the storm, falling by over 20 percentage points to 60.3% in Northern Ireland and by nearly 40 percentage points to 52.3% in Ireland compared to the preceding 7-day average. On the day following the storm (25th January), as power restoration efforts were still in their early stages, Video Score—a key indicator of QoE in gaming activities—remained significantly suppressed, falling by over 23 points compared to the preceding 7-day average in Northern Ireland.
  • The unprecedented scale of impact on telecoms infrastructure serves as the latest and most high-profile call to action for hardening networks against increasingly frequent and severe storms in the UK and Ireland. Record daily consumer-initiated Speedtest volumes and a 62% surge in Speedtests conducted on Starlink connections in Ireland on the storm day, compared to the preceding 7-day average, highlight the severity of the telecoms infrastructure disruptions as consumers scrambled to troubleshoot issues and turned to alternative connectivity solutions like satellite.

Ireland’s state electricity supplier, ESB Networks, reported “unprecedented” power outages affecting over 725,000 premises (equivalent to as much as one-third of all homes in the country), with restoration times expected to exceed a week in the hardest-hit areas. The extensive damage to the electricity grid has had severe knock-on effects on both fixed and mobile network infrastructure, with well over a thousand mobile sites taken offline due to disruptions to mains power and downed trees causing damage to overhead fibre cabling along roads.

The impacts have been significant across operators. In Ireland, Eir reported that fixed broadband faults were affecting 160,000 premises, with more than 900 mobile sites knocked offline, while Vodafone said more than 10% of its mobile site footprint was affected. Similarly, in the UK, there were elevated reports of network outages across telecoms operators on Downdetector, with the largest concentration of disruptions in the worst hit areas in Scotland and Northern Ireland.

This storm, the most severe to date, follows a series of disruptive weather events across the UK and Ireland during recent winter months. In December, Ookla published detailed research on the impact of Storm Darragh, highlighting the unique challenges posed by widespread, prolonged power outages on mobile networks. These challenges included a dual strain: increased network load as fixed broadband outages shifted traffic to mobile infrastructure and a diminished mobile site grid due to power outages at mobile sites. Together, these factors significantly degrade mobile network performance, reducing overall network availability and pushing more subscribers into the cell edge.


Mobile users in Ireland see marked declines across all performance metrics, with network impacts continuing

Analysis of Speedtest Intelligence® data highlights the significant impact of Storm Éowyn on mobile network performance in Ireland. Download and upload speeds saw sharp and sustained declines, accompanied by increased latency and jitter across all operators nationwide. The deterioration started early on Friday morning, 24th January, as the storm made landfall. While some recovery was observed the following day (25th January), all performance metrics remain materially below pre-storm levels nationally.

Despite the absence of active network sharing in Ireland—limited to cooperation on passive infrastructure, which relies on a common mains power supply at shared sites—the storm’s impacts were felt similarly across operators. Notably, the performance profile across operators during the storm closely mirrored pre-storm trends. For instance, Three maintained its lead in download speed and demonstrated a faster recovery on this metric compared to other operators.

Storm Éowyn Blows Down Mobile Performance in Ireland Across All Metrics and Operators
Speedtest Intelligence® | January 2025

In addition to a decline in metrics like Consistency—designed to measure the proportion of Speedtest samples reflecting a consistent quality of experience (QoE)—the storm-induced network disruptions led to a substantial increase in failed or partially completed Speedtest sessions across all operators on the day of the storm. Similarly, the severe decline in 10th percentile performance—where aggregate download speeds plummeted by over 87%, from a 7-day average of 3.97 Mbps to just 0.51 Mbps—highlights the extent of performance degradation experienced by Irish mobile users at the bottom end.

Storm Éowyn Triggers Sharp Deterioration in Consistency Across All Operators
Speedtest Intelligence® | January 2025

On the day of the storm, Consistency dropped to a low of 38% at 09:00 on Friday nationally and remained below 55% in the evening. While there was an improvement the following day (25th January), reaching a high of 66% at 16:00, the overall profile remains significantly below the pre-storm baseline.

Storm Éowyn Triggers Sharp, Sustained Decline in Consistency Across Ireland
Speedtest Intelligence® | January 2025

It is notable that the limited penetration of battery backup solutions in Ireland’s mobile site grid—typically providing only four to eight hours of power where available—stands in sharp contrast to regions like the Nordics and Australia, which have implemented comprehensive policy measures to harden telecoms infrastructure, as highlighted in a recent Ookla article. This shortfall has resulted in a disproportionate reliance on stationary and mobile generators in the Irish context.

While mobile generators have high operating costs, which limit their feasibility for prolonged or widespread deployment across the mobile site grid in Ireland, they offer operators valuable deployment flexibility. Mobile operators can proactively position generators at key sites based on forecasted storm tracks and leverage distributed fuel dumps across the country to enable rapid refueling during post-storm operations.

Analysis of Speedtest Intelligence data underlines the impact of these efforts on service continuity and restoration. On the morning of the storm, Eir publicly reported deploying mobile generators to key sites in County Cork—one of the worst-affected areas—to restore mobile services ahead of mains power being restored. This proactive approach (which all operators adopted) is reflected in a sharp recovery of Eir’s Consistency score in Cork, which rebounded from as low as 59% on the day of the storm to as high as 95% the following day. This rate of recovery outpaced other operators in the county for this metric, highlighting the important role of rapid power restoration using generator solutions.


Mobile network disruptions extend to Scotland and Northern Ireland

While Ireland experienced some of the most severe and widespread impacts of Storm Éowyn, it was not alone. In Northern Ireland, power outages affecting 30% of premises at their peak were reported by NIE Networks, the primary energy provider in the region. Similarly, in Scotland, over 100,000 homes were left without power, with restoration efforts expected to continue for several days. These widespread power outages have impacted mobile site uptime in both regions.

Storm Éowyn's Impact on Consistency was more pronounced in Northern Ireland than Scotland
Speedtest Intelligence® | January 2025

Speedtest Intelligence data indicates a decline in mobile performance across multiple metrics among operators in Northern Ireland and Scotland, with Northern Ireland experiencing the greatest impact. Mobile download speeds at the 10th percentile plummeted on the day of the storm, falling 63% to 2.19 Mbps in Scotland and 74% to 1.31 Mbps in Northern Ireland relative to the seven-day average before the storm.

Storm Éowyn Pulls Down Mobile Performance Across Several Metrics in Scotland and Northern Ireland
Speedtest Intelligence® | January 2025

Similar to Ireland, the penetration of battery backup solutions installed at mobile sites in the UK remains limited. In its latest annual ‘Connected Nations‘ report, Ofcom noted that only around 20% of all mobile sites in the UK have some backup functionality at the RAN for more than 15 minutes, while only around 5% of sites are able to withstand a six-hour power loss (excluding battery backup for transmission traffic). It has consulted on revised ‘Resilience Guidance’ for the UK’s telecoms operators, published a call for input (CFI) on power backup for mobile networks and is now working with the government to determine if additional resilience measures are needed. 

Ookla retains ownership of this article including all of the intellectual property rights, data, content graphs and analysis. This article may not be quoted, reproduced, distributed or published for any commercial purpose without prior consent. Members of the press and others using the findings in this article for non-commercial purposes are welcome to publicly share and link to report information with attribution to Ookla.
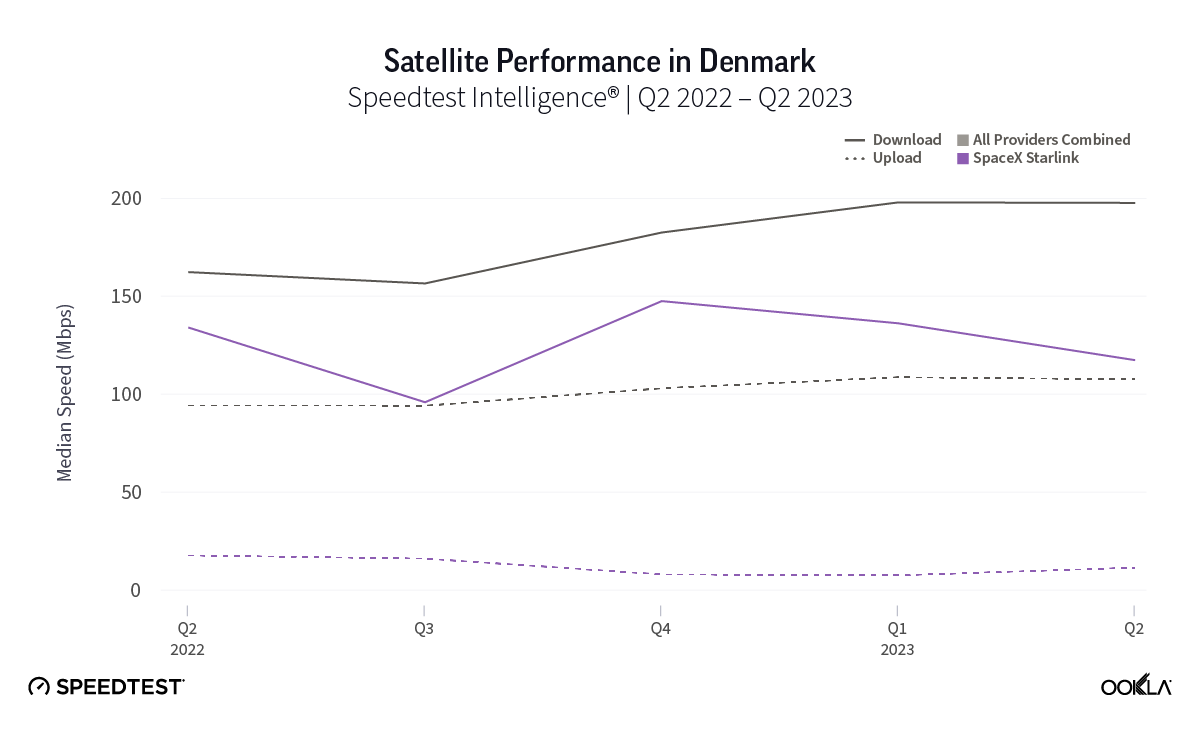
| December 22, 2024

Ringing in the New Year - How do 5G Networks Cope Under Stress?

5G Networks Support NYE Festivities Across Major Cities

Major events present a unique challenge for mobile networks, particularly sporting events where users congregate in concentrated numbers, and where sharing of video to social media, and to friends and family is a key use case. Ringing in the New Year is another case in point – for many years network operators published statistics on the number of voice calls made, messages sent, and the amount of data traffic their networks handled. While the rise of over-the-top (OTT) communications platforms such as WhatsApp have put a damper on these press releases, there remains a sizeable impact on operators’ networks. For example, Belgian operator Proximus noted a 95% increase in mobile data traffic on New Year’s Eve in 2023 compared to 2022. The trend isn’t uniform across markets, with Australia’s Telstra consistently seeing lower data usage on New Year’s Eve, with its customers using 30% less data than average, according to a news source. What is clear is that the New Year presents network operators with the challenge of serving sufficient bandwidth to customers attending major New Year celebrations, allowing them to share the moment, but also to support the mass wishing of “Happy New Year” across a variety of channels.

We reviewed Speedtest Intelligence data for New Year’s Eve 2023/24, to analyse how 5G networks coped with the surge in demand and change in traffic patterns at New Year, across a selection of major cities featuring some of the largest New Year celebrations around the globe. We focused in on median performance alongside the 10th percentile, in order to evaluate the spread of performance from the median user to those experiencing more challenging network conditions which would impact their experience at New Year.

Worst 10% of Speedtest samples reveal network challenges

We zeroed in on 5G upload performance first. Network operators universally allocate more spectral capacity to the downlink, as most mobile use cases lean more heavily on downloading data to the end-user device. However, the usage profile at the New Year is different, with video sharing, video streaming and calling, as well as uploading content to social media, more prevalent. These are all activities that are supported by uplink from the device.

Our data shows a significant gap between upload performance for the median user, and those in the lower 10th percentile – those experiencing the worst 10% of performance samples. Half the cities in our analysis recorded 10th percentile upload performance of less than 1 Mbps, with speeds ranging from 0.30 Mbps in Berlin, to 6.09 Mbps in Dubai. These sub-par speeds make it nearly impossible to upload photos or videos.

User Experience – Assessing the Worst 10% of Performance Samples on New Year's Eve
Speedtest data, New Year's Eve 23/24, 8pm – 1am

It was a similar picture for New Year revellers based on download speeds and latency. Despite more capacity being allocated to the downlink, performance for the lowest 10% of samples tumbled significantly compared to the median experience, with cities in APAC (Bangkok, Hong Kong, Sydney and Tokyo) in particular suffering, recording 10th percentile 5G download speeds of less than 10 Mbps. Latency was more of a mixed story across cities. At one end of the scale, Tokyo recorded a variance in latency between the median and 90th percentile (the worst 10% of latency samples) of just 19 ms, while Sydney saw a much wider gap of almost 200 ms. At 200 ms of latency users are likely to experience frustratingly slow loading times, unresponsive applications, and poor video quality.

Our data also showed the degree to which New Year usage pulled down 5G performance for the worst 10% of samples. New York, and cities in Europe saw less of an impact at New Year’s Eve compared to their global counterparts. Berlin, London, New York and Paris saw 5G download speeds for 10th percentile drop by between 1.13 Mbps and 6.88 Mbps. In contrast, Bangkok, Hong Kong and Sydney saw performance drop by between 15.13 Mbps and 21.44 Mbps. Dubai and Rio de Janeiro recorded the largest variance, however with faster 5G speeds they still outpaced the remaining markets by a significant margin. Upload performance for the worst 10% of samples followed a similar trend to download, however latency performance was more varied. Berlin, Dubai, New York, Rio de Janeiro and Tokyo saw very little difference between New Year Eve latency performance and the Q4 2023 average. However, Paris, Hong Kong and London saw an increase in latency for the worst 10% off samples of between 22 ms and 36 ms, while Bangkok and Sydney fared worst, with an increase of 61 ms and 171 ms respectively.

Impact of New Year's Eve Traffic on Users With the Worst 10% of Samples
Speedtest data, Q4 2023 vs New Year's Eve 23/24, 8pm – 1am

Addressing network pain points

Addressing network pain points for users affected by poor performance in dense urban areas is a challenging task. For major events like the recent Paris Olympics, which we reported on earlier this year, network operators will typically deploy temporary network assets such as cells on wheels (CoWs) to add extra network capacity, which can then be removed once the event concludes. Network operators can also look to build private networks, to provide dedicated capacity to support the operations of the event, including routing traffic for broadcasting purposes. However, city authorities also have an important role to play here, as highlighted in our recent whitepaper with Dublin City Council and the City Telecoms Association. Having a holistic view of network performance and its evolution across a city, as well as international benchmarks, provides city authorities with the data and insights to engage more constructively with network operators and regulators, and help introduce more effective policies to deliver meaningful change for end-users. We’ll continue to benchmark and report on city and state performance, based on Speedtest Intelligence data. For more information, please contact us.

Ookla retains ownership of this article including all of the intellectual property rights, data, content graphs and analysis. This article may not be quoted, reproduced, distributed or published for any commercial purpose without prior consent. Members of the press and others using the findings in this article for non-commercial purposes are welcome to publicly share and link to report information with attribution to Ookla.
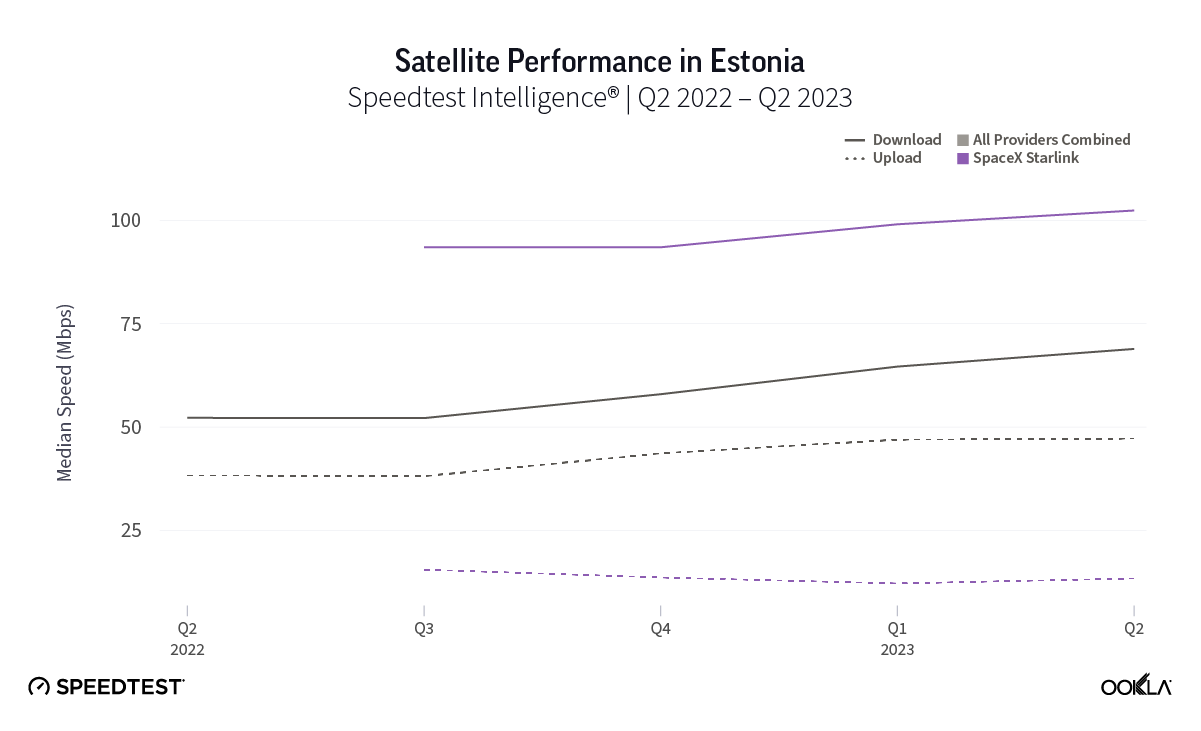
| November 4, 2024

Smartphone User Survey Reveals Habits and Frustrations

In a recent study conducted by Omdia and commissioned by Ookla, over 2,000 smartphone users across the U.S. and U.K. were surveyed to learn about consumer usage patterns, satisfaction levels, and pain points. The findings highlight user expectations in each country, from cost concerns to reliable connectivity to fast browsing speeds and more.

Read on for a look at some of the key findings from our study, or you can download our full white paper for a deeper dive into its findings, with in-depth analysis and the complete survey results.

Wi-Fi remains crucial alongside widespread cellular data usage

In a survey focused primarily on smartphone users, the results showed that Wi-Fi continues to play a vital role for all users. This underscores the enduring importance of Wi-Fi in users’ connectivity strategies, even as 5G technology continues to gain traction.

Network outages: a critical issue for user satisfaction

While not the most frequently cited frustration, network outages emerge as a critical issue with far-reaching implications for user satisfaction and loyalty. The survey reveals that outages have a disproportionate impact on customer perceptions and behavior. Respondents strongly considered switching carriers as a result of network outages and emphasized the importance of timely communication from their providers to alleviate frustration and maintain trust.

In such a dynamic and complex connectivity ecosystem, tools like Speedtest® and Downdetector® play vital roles. By providing objective data on network performance and real-time information on service outages, these tools help address many of the key issues highlighted in our survey. For instance, Speedtest data can help providers pinpoint areas for improvement to enhance customer satisfaction and reduce churn, while Downdetector’s outage reporting can help service providers address user concerns about prompt updates during network issues.

Want to explore all of the findings from our latest smartphone survey? Download the white paper to see all of the survey questions, results, and in-depth analysis.

Ookla retains ownership of this article including all of the intellectual property rights, data, content graphs and analysis. This article may not be quoted, reproduced, distributed or published for any commercial purpose without prior consent. Members of the press and others using the findings in this article for non-commercial purposes are welcome to publicly share and link to report information with attribution to Ookla.
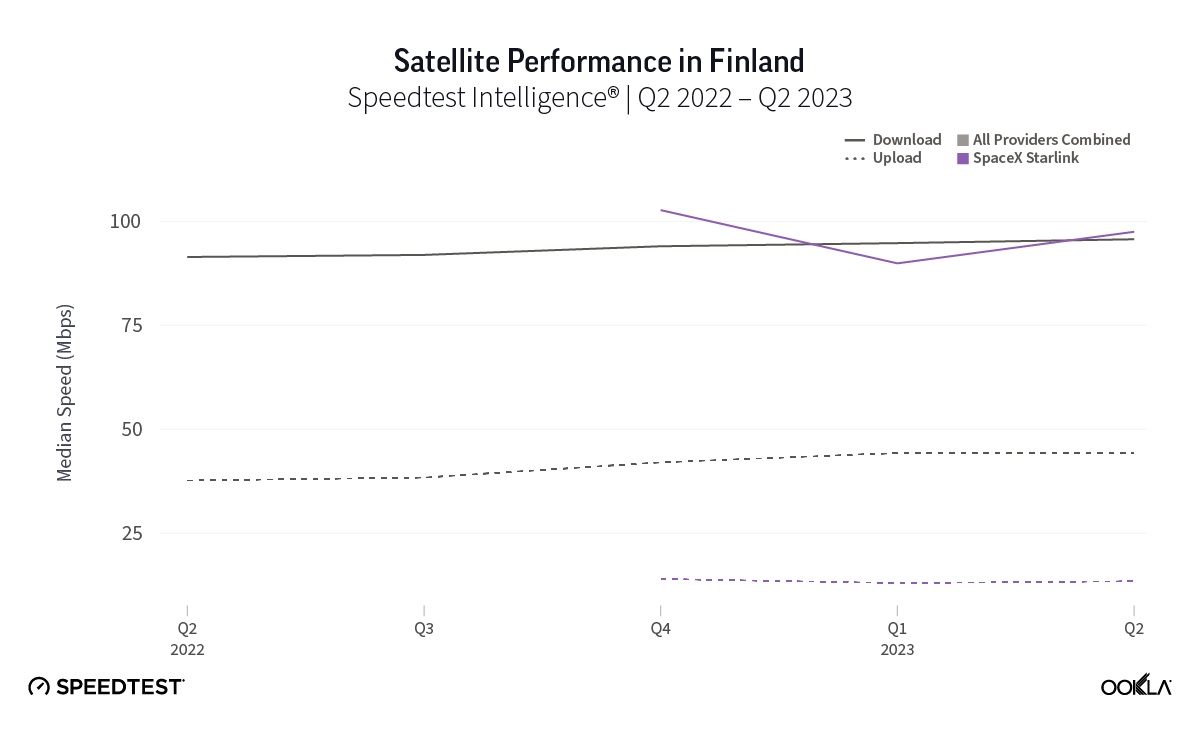
| June 17, 2024

Your Guide to Airport Wi-Fi and Mobile Performance at 50+ Global Airports in 2024

Airports around the world have been packed with travelers this year, which puts extra stress on the Wi-Fi. With summer travel already well in swing in the northern hemisphere, we’re back with fresh data for our series on airport Wi-Fi performance to help you plan for connectivity at all your connections. You’ll find information about Wi-Fi on free networks provided by the individual airports as well as mobile speeds at some of the busiest airports in the world during Q1 2024. Read on for a look at internet performance at over 50 of the world’s busiest airports with data on download speed, upload speed, and latency.

Key takeaways

  • The seven fastest airports for downloads over Wi-Fi were in the United States: San Francisco International Airport, Newark Liberty International Airport, John F. Kennedy International Airport, Phoenix Sky Harbor International Airport, Seattle–Tacoma International Airport, Dallas Fort Worth International Airport, and Harry Reid International Airport.
  • Six U.S. airports had the fastest uploads over Wi-Fi: San Francisco International Airport, Phoenix Sky Harbor International Airport, Newark Liberty International Airport, Seattle–Tacoma International Airport, Dallas Fort Worth International Airport, and John F. Kennedy International Airport.
  • The fastest mobile download speeds on our list were at Hamad International Airport in Doha, Qatar, Shanghai Hongqiao International Airport in China, and Phoenix Sky Harbor International Airport in the U.S.
  • Eight of the 10 airports with the fastest mobile upload speeds were in China.
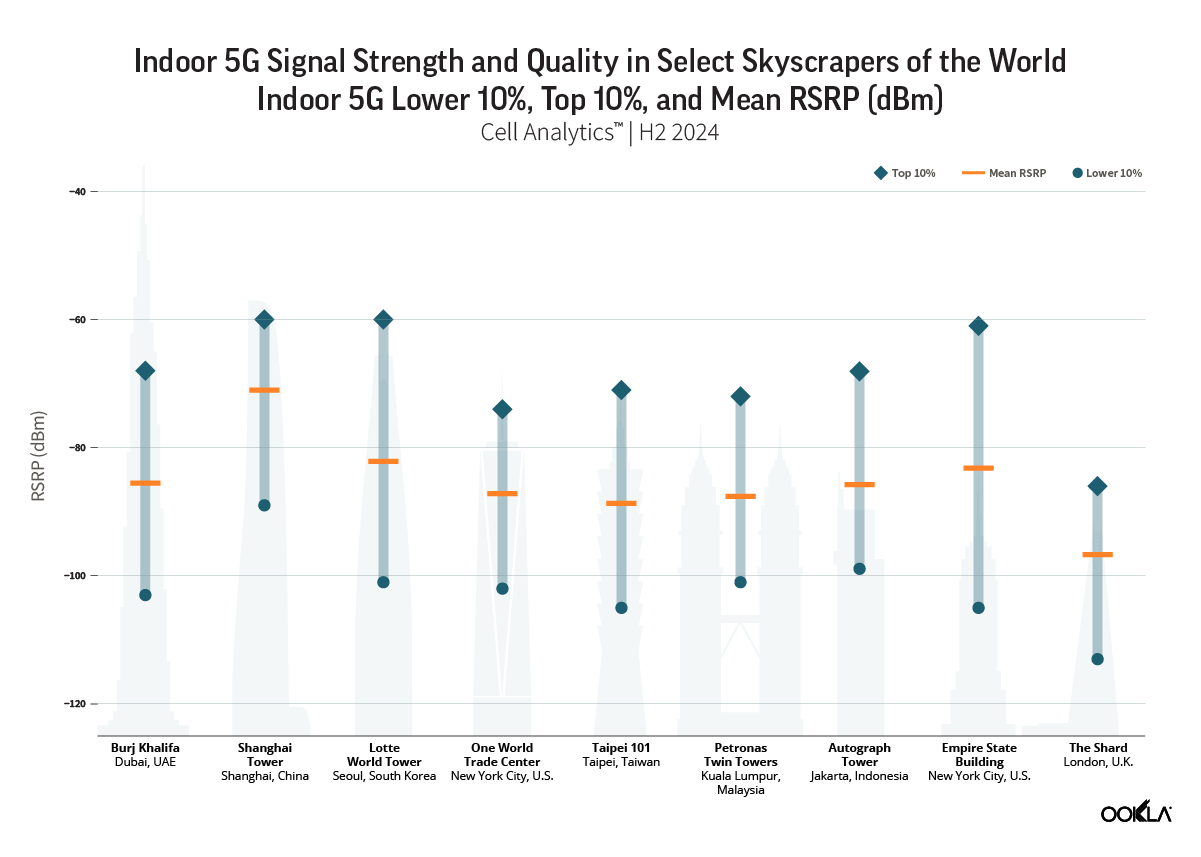
9 airports have 100+ Mbps Wi-Fi download speeds

Speedtest Intelligence® showed seven of the nine airports with median Wi-Fi download speeds over 100 Mbps were in the U.S.:

  • San Francisco International Airport (173.55 Mbps),
  • Newark Liberty International Airport (166.51 Mbps),
  • John F. Kennedy International Airport (151.59 Mbps),
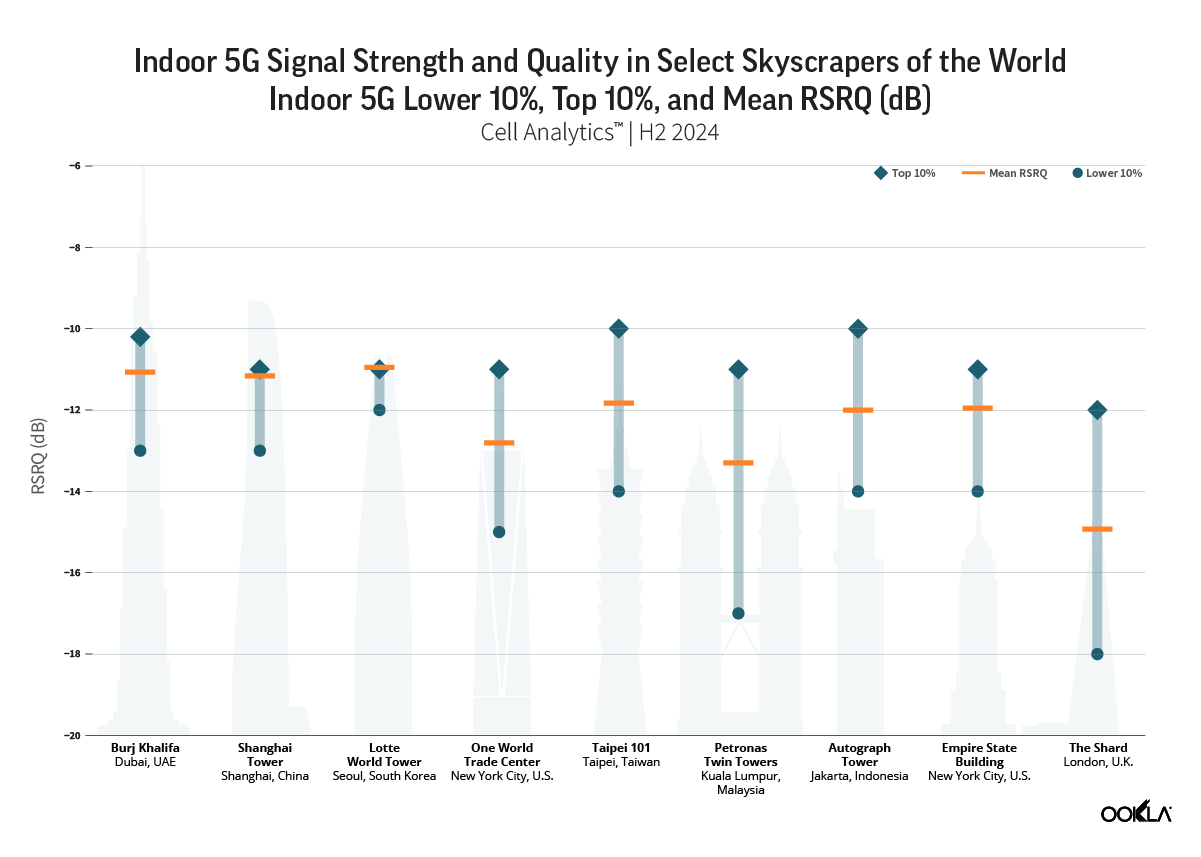
  • Phoenix Sky Harbor International Airport (151.28 Mbps),
  • Seattle–Tacoma International Airport (137.31 Mbps),
  • Dallas Fort Worth International Airport (119.92 Mbps), and
  • Harry Reid International Airport (107.84 Mbps).

Charles de Gaulle Airport in Paris, France and China’s Hangzhou Xiaoshan International Airport rounded out the list with median download speeds of 107.13 Mbps and 101.01 Mbps, respectively. Hartsfield–Jackson Atlanta International Airport and Sea–Tac had the lowest median multi-server latency on Wi-Fi of any of the airports surveyed during Q1 2024.

Hover on the pins on the map below to see full details for download and upload speeds as well as latency at all the airports analyzed.

Fixed Broadband Internet Speeds Over Free Wi-Fi at Global Airports
Speedtest Intelligence® | Q1 2024
A map showing fixed broadband speeds in selected global airports.

At Ookla®, we’re dedicated to making sure the networks you depend on are always at their best. With Ekahau®, our Wi-Fi solution, we know firsthand just how challenging it can be to optimize Wi-Fi at airports, especially when you have up to 900 people waiting at each boarding gate during the busiest travel times. While the speeds achieved by these top airports are impressive, we saw two smaller U.S. airports with median Wi-Fi download speeds over 200 Mbps during our U.S.-only analysis of airport Wi-Fi in the fall.

Six airports on our list use multiple SSIDs for their Wi-Fi networks for different terminals or to take advantage of the coverage advantages of 2.4 GHz and the speed advantages of 5 GHz frequencies. We have included data for all the SSIDs with sufficient samples in the map and reported in the text on the best result when using multiple SSIDs results in dramatically different speeds.

Eighteen airports on our list had median Wi-Fi download speeds of less than 25 Mbps. Mexico City International Airport in Mexico had the lowest median Wi-Fi download speed at 5.11 Mbps, followed by:

  • Tan Son Nhat International Airport in Vietnam (7.07 Mbps),
  • Beijing Capital International Airport in China (9.45 Mbps),
  • Cairo International Airport in Egypt (10.62 Mbps), and
  • Tokyo Haneda Airport in Japan (11.37 Mbps).

You may struggle with everything from video chatting to streaming at any airport with a download speed below 25 Mbps. Latency is also a factor in performance so if your airport is one of the three with a median Wi-Fi latency over 60 ms, a mobile hotspot may be a better option for a stable connection.

Wi-Fi 6 has arrived

Our analysis shows at least 15 airports on our list were using the new Wi-Fi 6 standard in their Wi-Fi setup. Wi-Fi 6 uses Multi-User Multiple Input, Multiple Output (MU-MIMO) and Orthogonal Frequency Division Multiple Access (OFDMA) to increase performance and throughput, especially when serving multiple devices. This offers a real advantage at a large public location like an airport. In order to get maximum benefit from Wi-Fi 6, consumers would need to be using Wi-Fi 6-compatible devices. Speedtest data shows a fairly even split between airports that saw faster download speeds on Wi-Fi 6 and airports where Wi-Fi 6 results were comparable to those on other earlier Wi-Fi generations.

As you know, international travel can be complicated. Even if the airport offers free Wi-Fi, you may encounter other barriers to access. For example, a local number is required in Cairo to receive the access code to connect to the airport Wi-Fi. And while we’d love to include other large airports like Nigeria’s Murtala Muhammed International Airport in future Wi-Fi analyses, they currently do not offer free Wi-Fi so we have included mobile data below.

11 airports show mobile speeds over 200 Mbps

Speedtest® data shows mobile speeds massively outpaced Wi-Fi, with 14 airports showing faster median downloads over mobile than the fastest airport for Wi-Fi. Hamad International Airport in Qatar had the fastest median download speed over mobile on our list at 442.49 Mbps during Q1 2024, followed by:

  • Shanghai Hongqiao International Airport (341.19 Mbps),
  • Phoenix Sky Harbor International Airport (295.94 Mbps),
  • Shanghai Pudong International Airport (264.71 Mbps),
  • Chongqing Jiangbei International Airport (258.42 Mbps), and
  • Istanbul Airport (255.51 Mbps).

Mobile Network Speeds at Global Airports
Speedtest Intelligence® | Q1 2024

Fastest mobile speeds at airports in Africa and South America

Jomo Kenyatta International Airport in Kenya had the fastest mobile download speeds of the four African airports we analyzed at 88.12 Mbps during Q1 2024. São Paulo/Guarulhos International Airport in Brazil was the faster of the two Latin American airports analyzed with a median download speed of 55.44 Mbps.

Airports with slow mobile speeds

Mobile can’t fix everything, because six airports came in with a median mobile download speed below 25 Mbps. Mexico City International Airport was again at the bottom with 8.75 Mbps, followed by:

  • Josep Tarradellas Barcelona–El Prat Airport (15.21 Mbps),
  • Orlando International Airport (15.84 Mbps),
  • Adolfo Suárez Madrid–Barajas Airport (20.37 Mbps),
  • Chhatrapati Shivaji Maharaj International Airport (20.96 Mbps), and
  • Indira Gandhi International Airport (21.80 Mbps).

Latency on mobile was generally higher than that on Wi-Fi with 46 airports showing a Wi-Fi latency lower than the lowest latency on mobile, 27.51 ms at China’s Shanghai Hongqiao International Airport. As noted above, latency is an important factor in performance, so it might be worth investigating the airport Wi-Fi by running a Speedtest if your mobile performance seems to lag.

Airport Wi-Fi or mobile? Connecting on your next trip

We created a quick guide to help you decide whether to try out the Wi-Fi or simply use the local mobile network if you have access. Use it to compare free airport Wi-Fi performance against mobile performance for the 52 airports we have both Wi-Fi and mobile data for during Q1 2024. Twenty-six airports had faster mobile internet than airport Wi-Fi. Eight airports had faster Wi-Fi than mobile, and seven airports showed only a slight distinction between Wi-Fi and mobile or download speeds over 100 Mbps on both, so we gave both the green check marks. We were able to include more airports in the mobile analysis because there were more mobile samples to analyze at those airports than there were samples over Wi-Fi.

Chart of Comparing Airport Wi-Fi and Mobile Speeds at World Airports

The averages reported here are based on real-world data, so your experience may differ, especially on a busy travel day. Take a Speedtest® at the airport to see how your performance compares. Cheers to safe travels and rapid connections wherever you’re flying.

Ookla retains ownership of this article including all of the intellectual property rights, data, content graphs and analysis. This article may not be quoted, reproduced, distributed or published for any commercial purpose without prior consent. Members of the press and others using the findings in this article for non-commercial purposes are welcome to publicly share and link to report information with attribution to Ookla.