
Belgium represents an important cornerstone to the European community and is home to the Council of the European Union, the European Commission, European Parliament and the European Council. However, Belgium is behind the curve among its regional partners in terms of promoting 5G competition with only one 5G provider during the majority of 2021. In this article, we used Ookla® Speedtest Intelligence® to examine Belgium’s fixed and mobile internet performance speeds, as well as regional and provincial performance during Q3 2021. We also examined the European Quarter in Brussels using Ookla Cell Analytics™ to determine which mobile operators had the best signal level and quality.
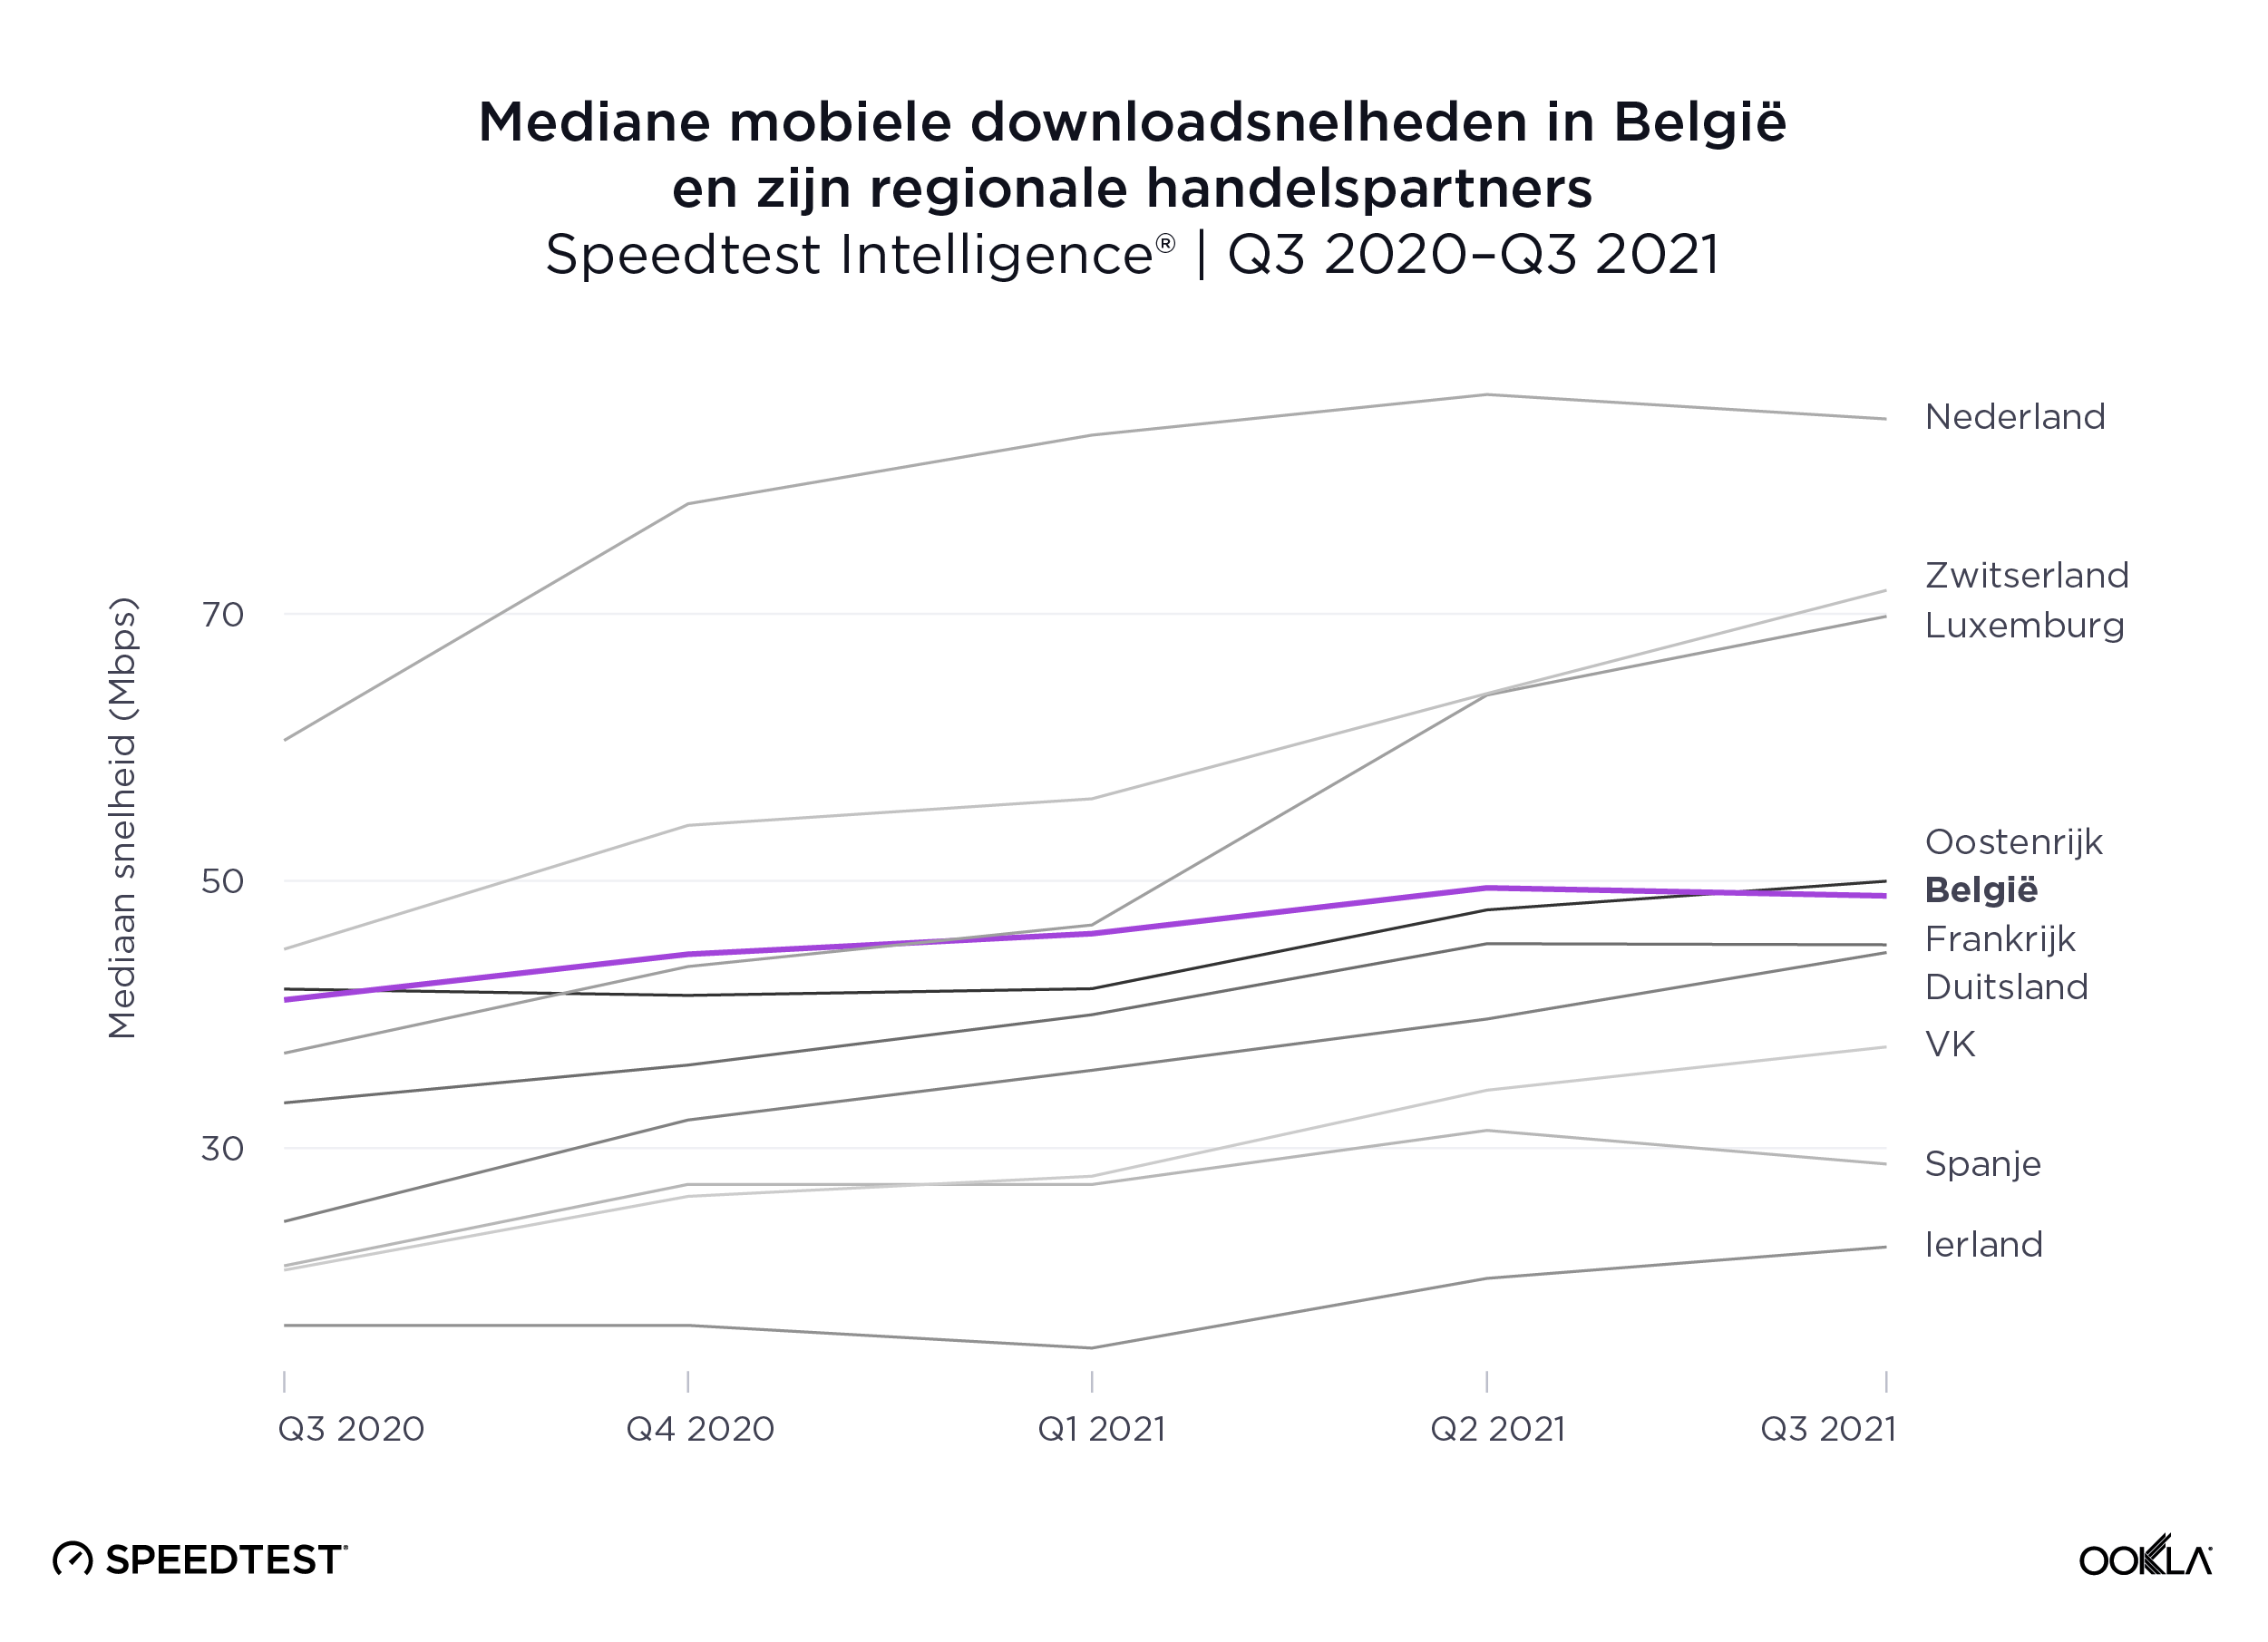
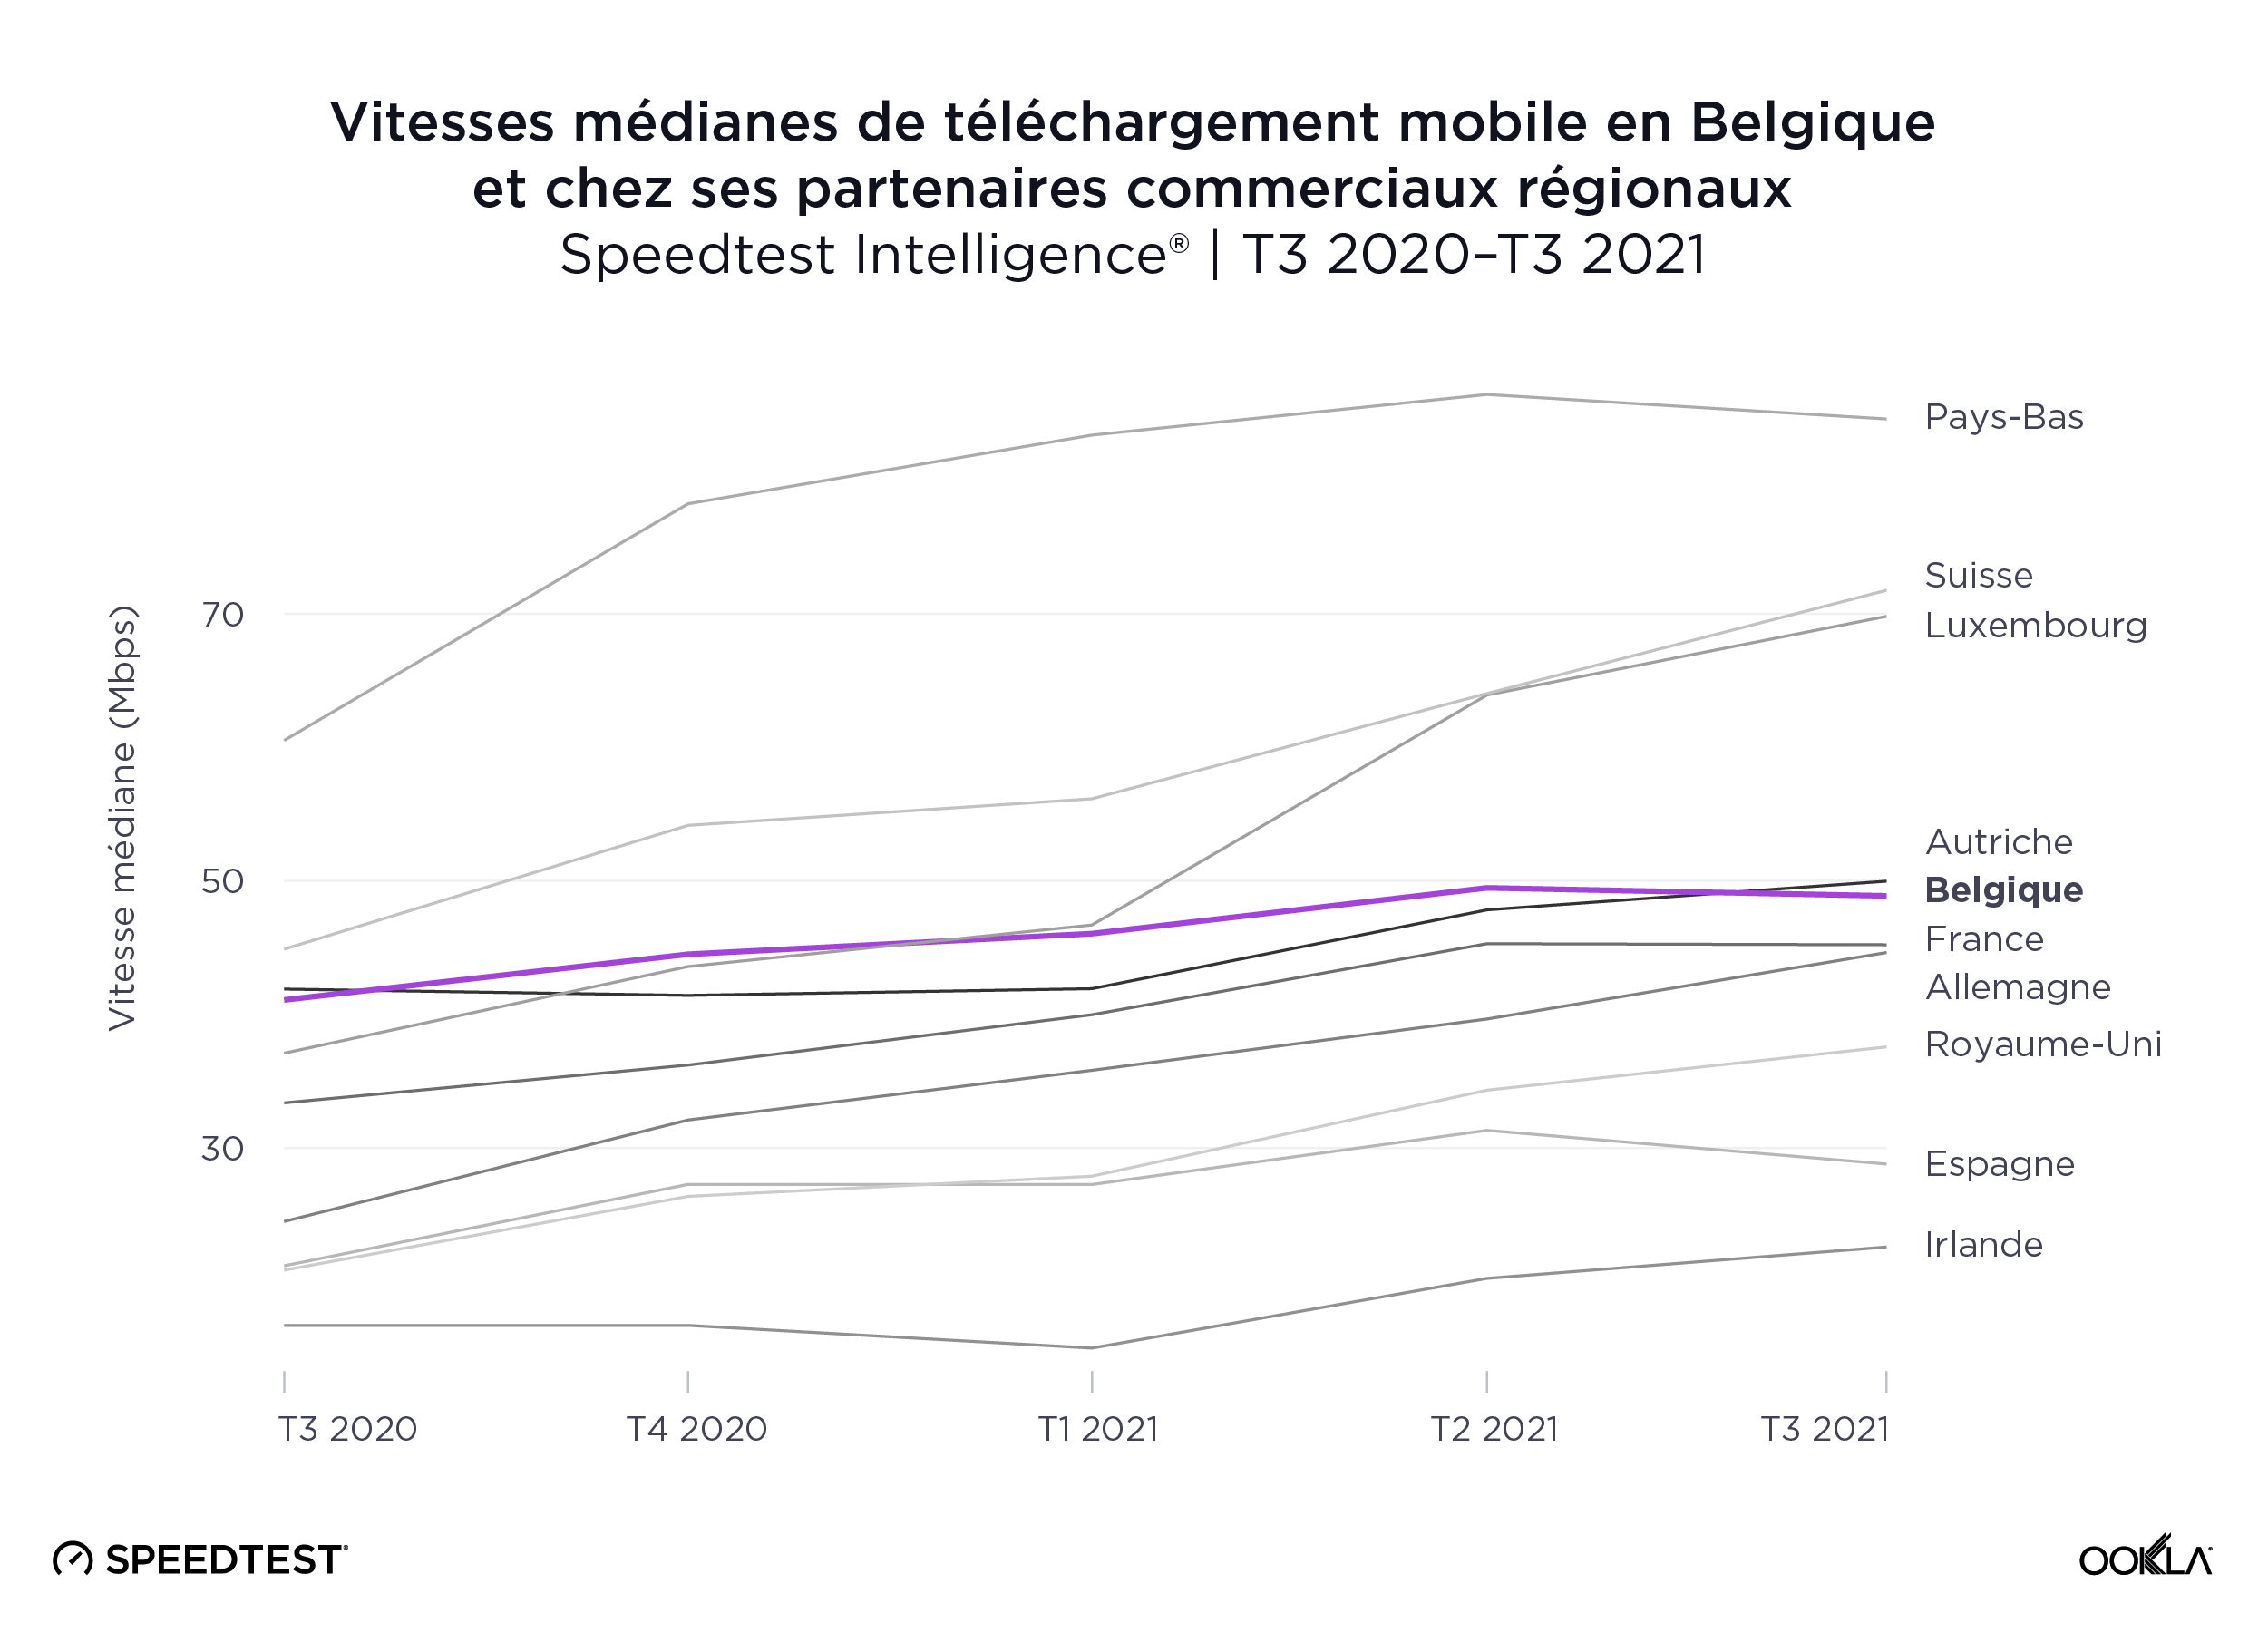
The Netherlands leads among Belgium’s regional trading partners for fastest mobile
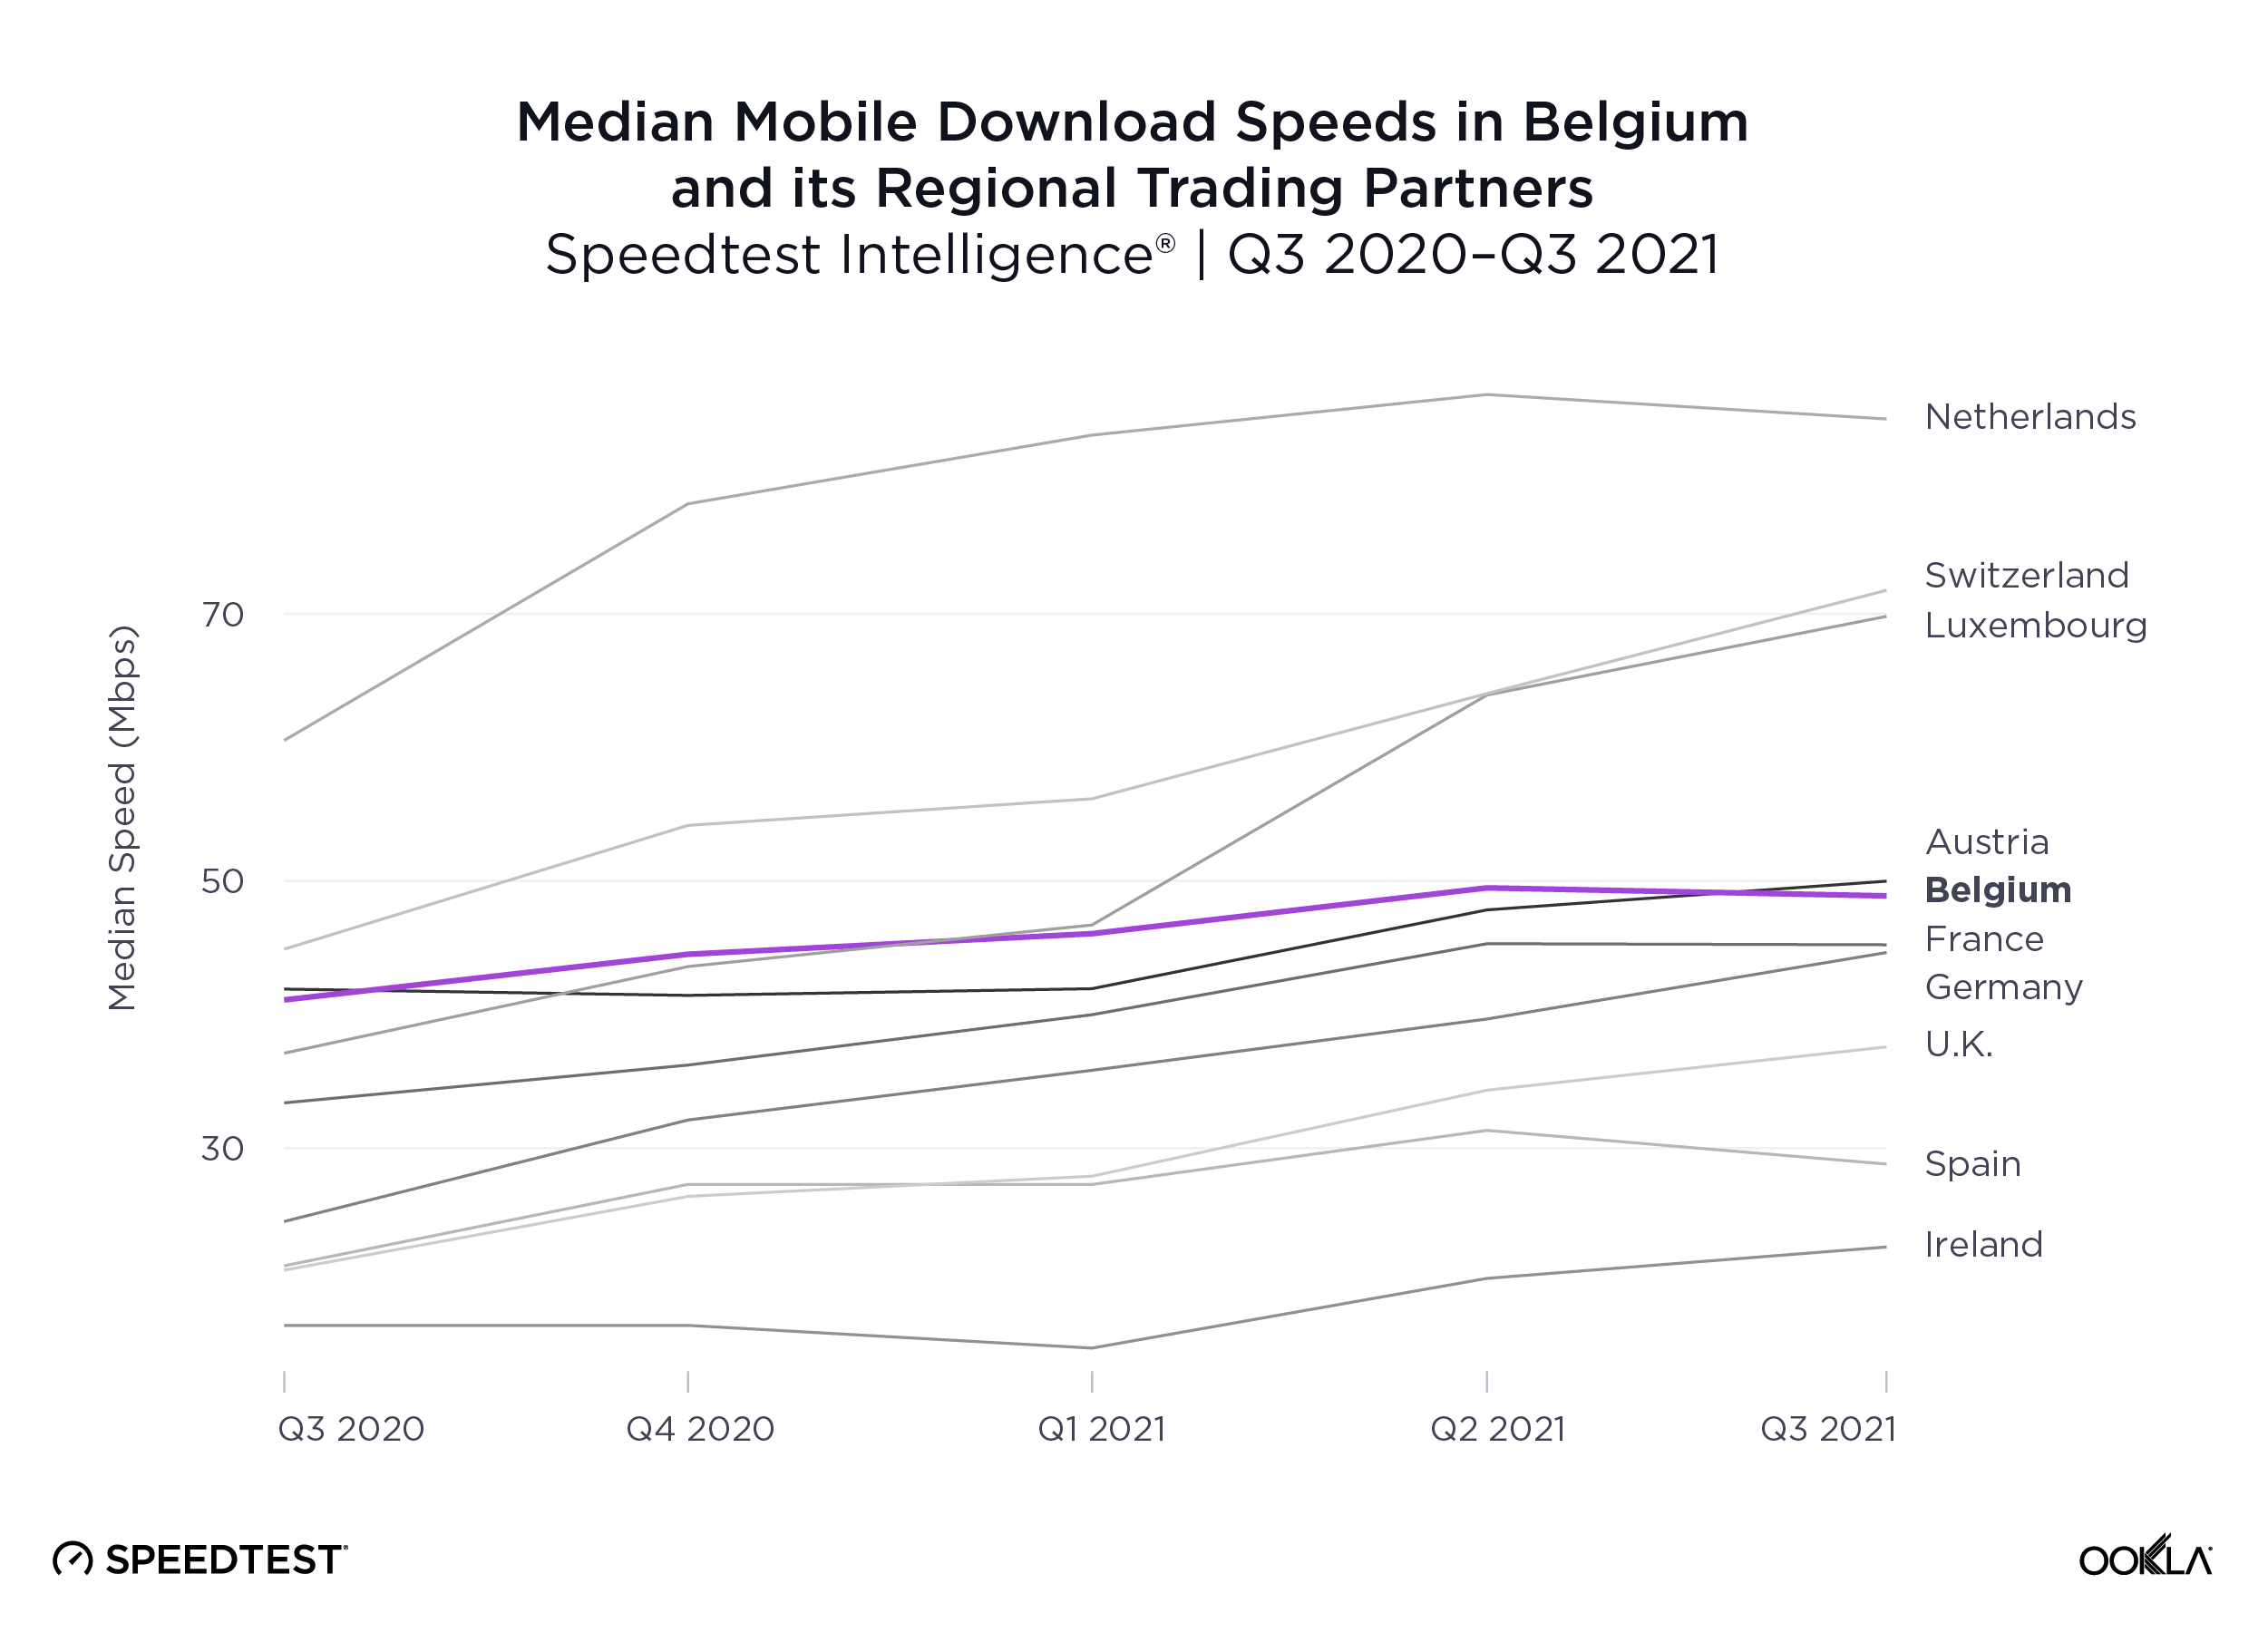
Speedtest Intelligence reveals that the Netherlands had the fastest median mobile download speed among Belgium’s closest regional trade partners at 84.59 Mbps during Q3 2021. Switzerland and Luxembourg followed at 71.76 Mbps and 69.81 Mbps, respectively. Austria was next at 49.98 Mbps, followed by Belgium at 48.88 Mbps.
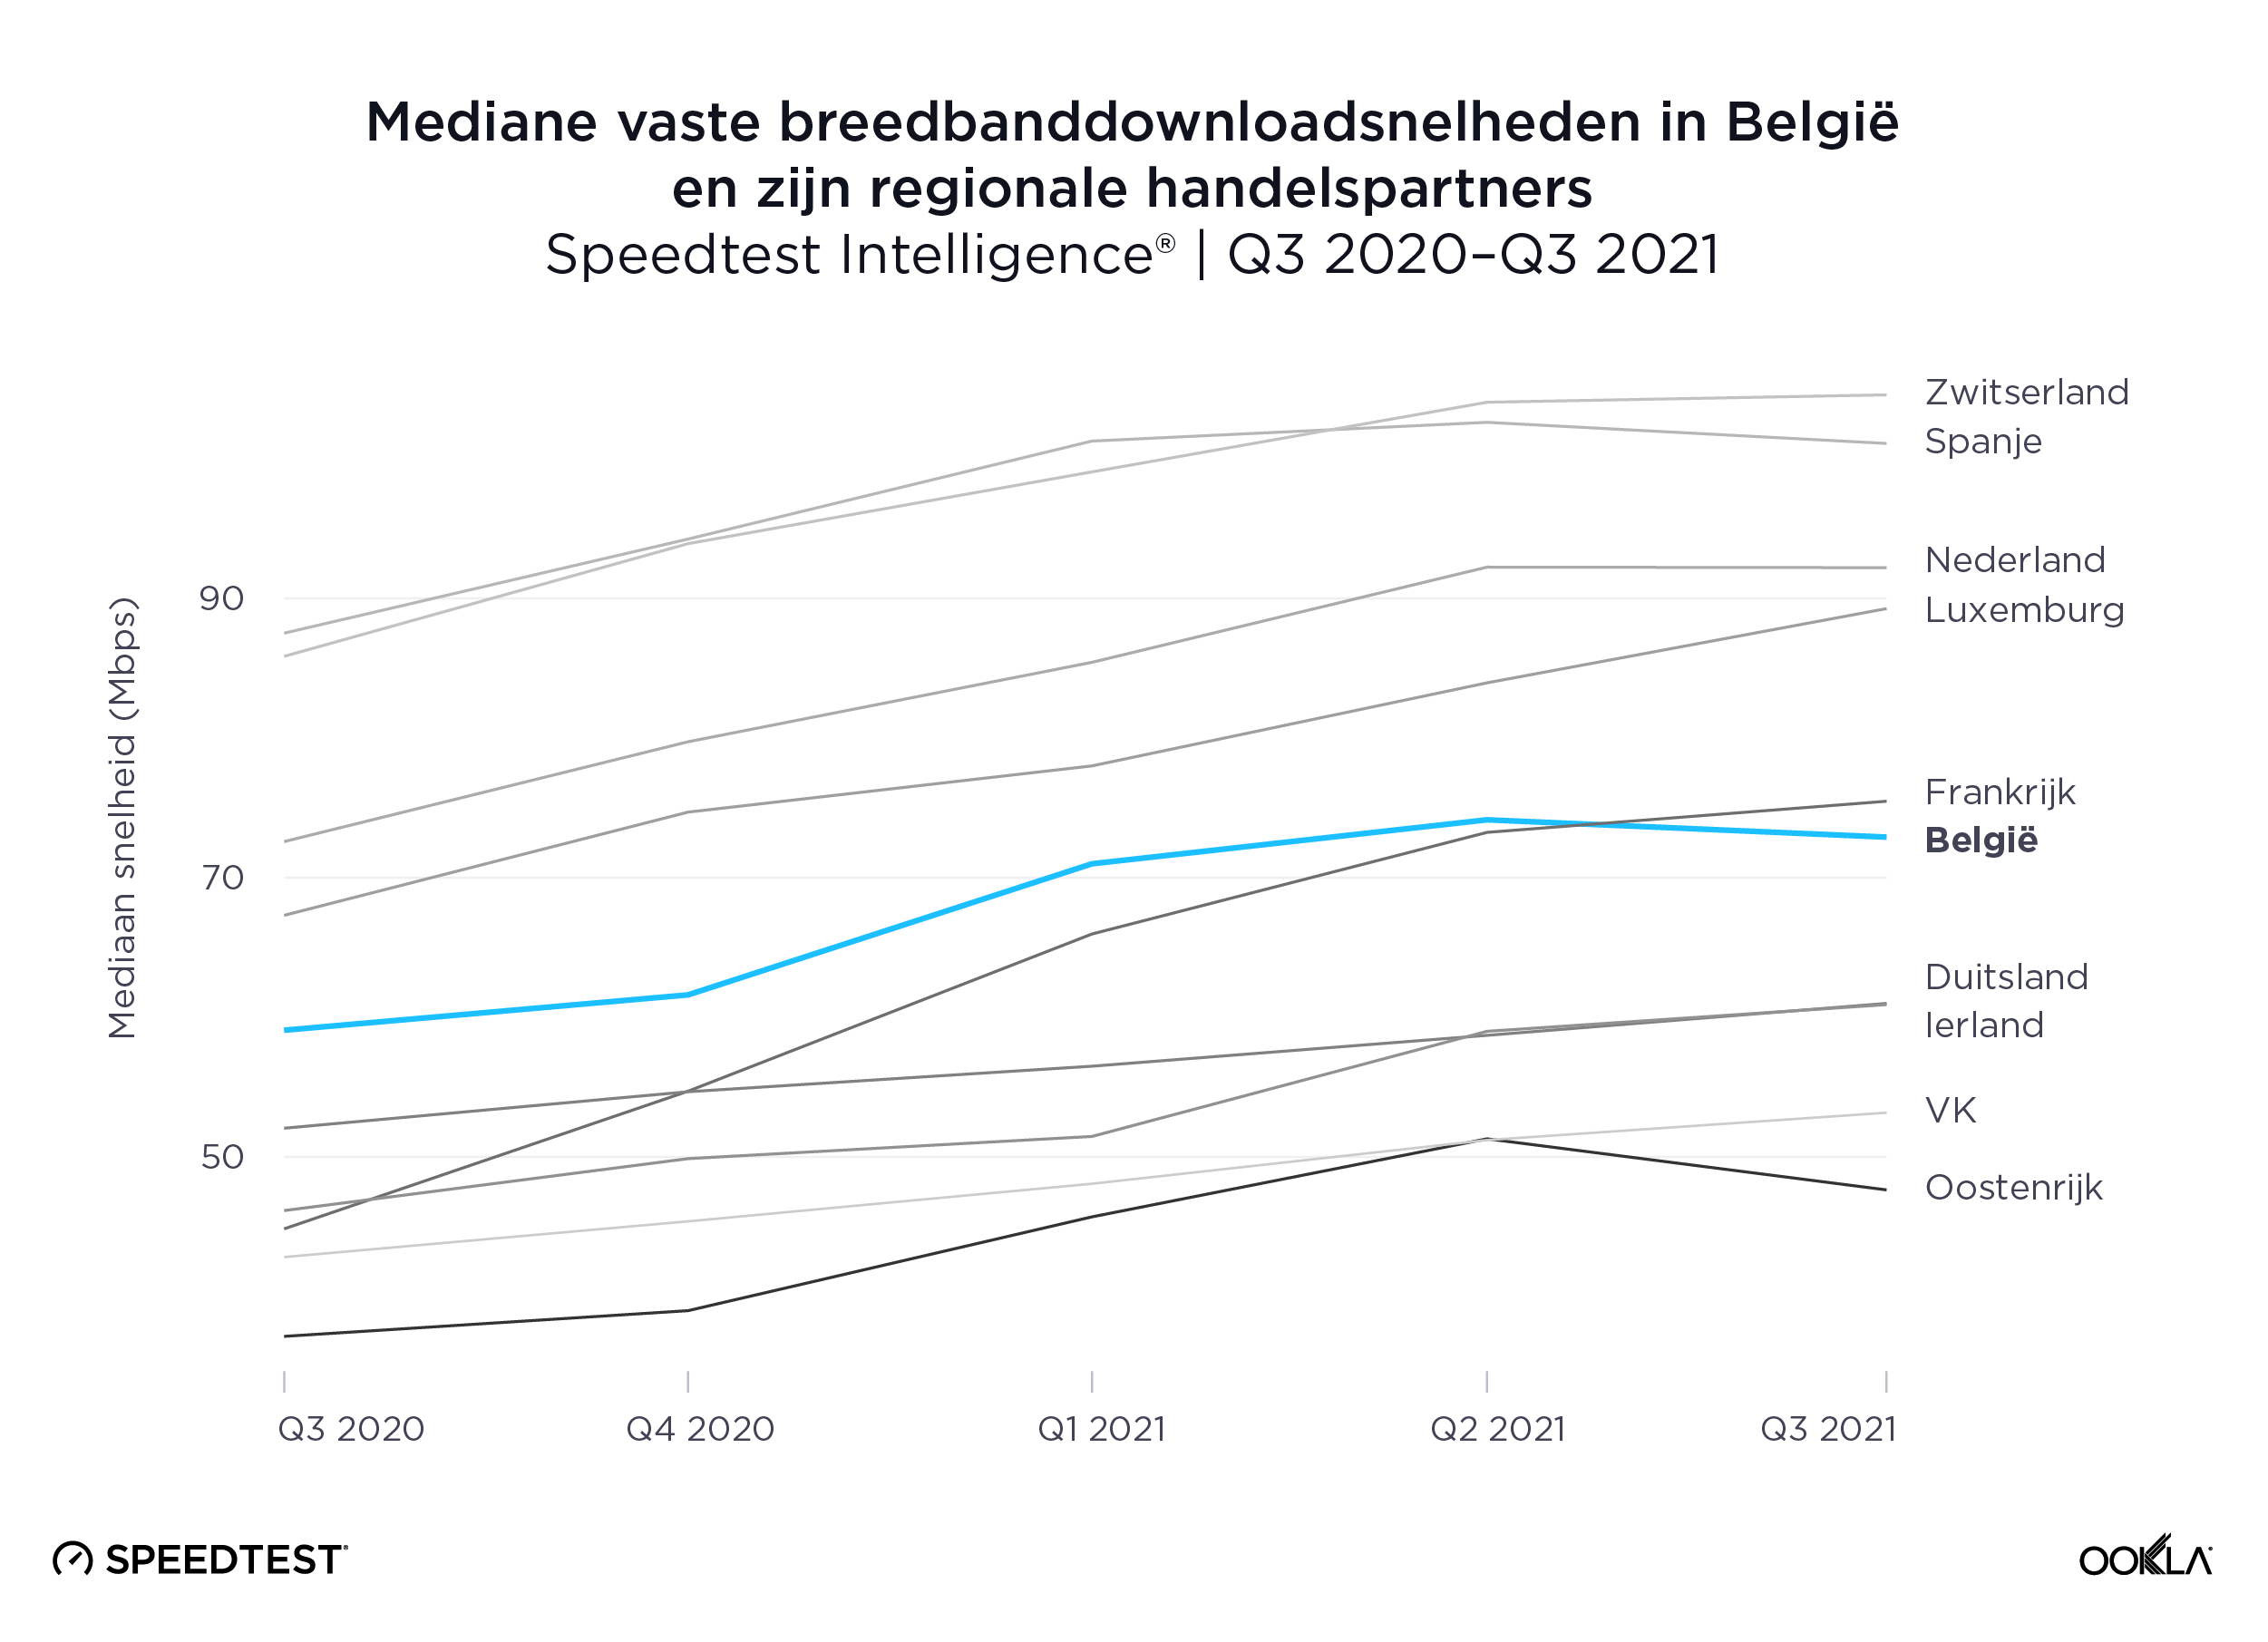
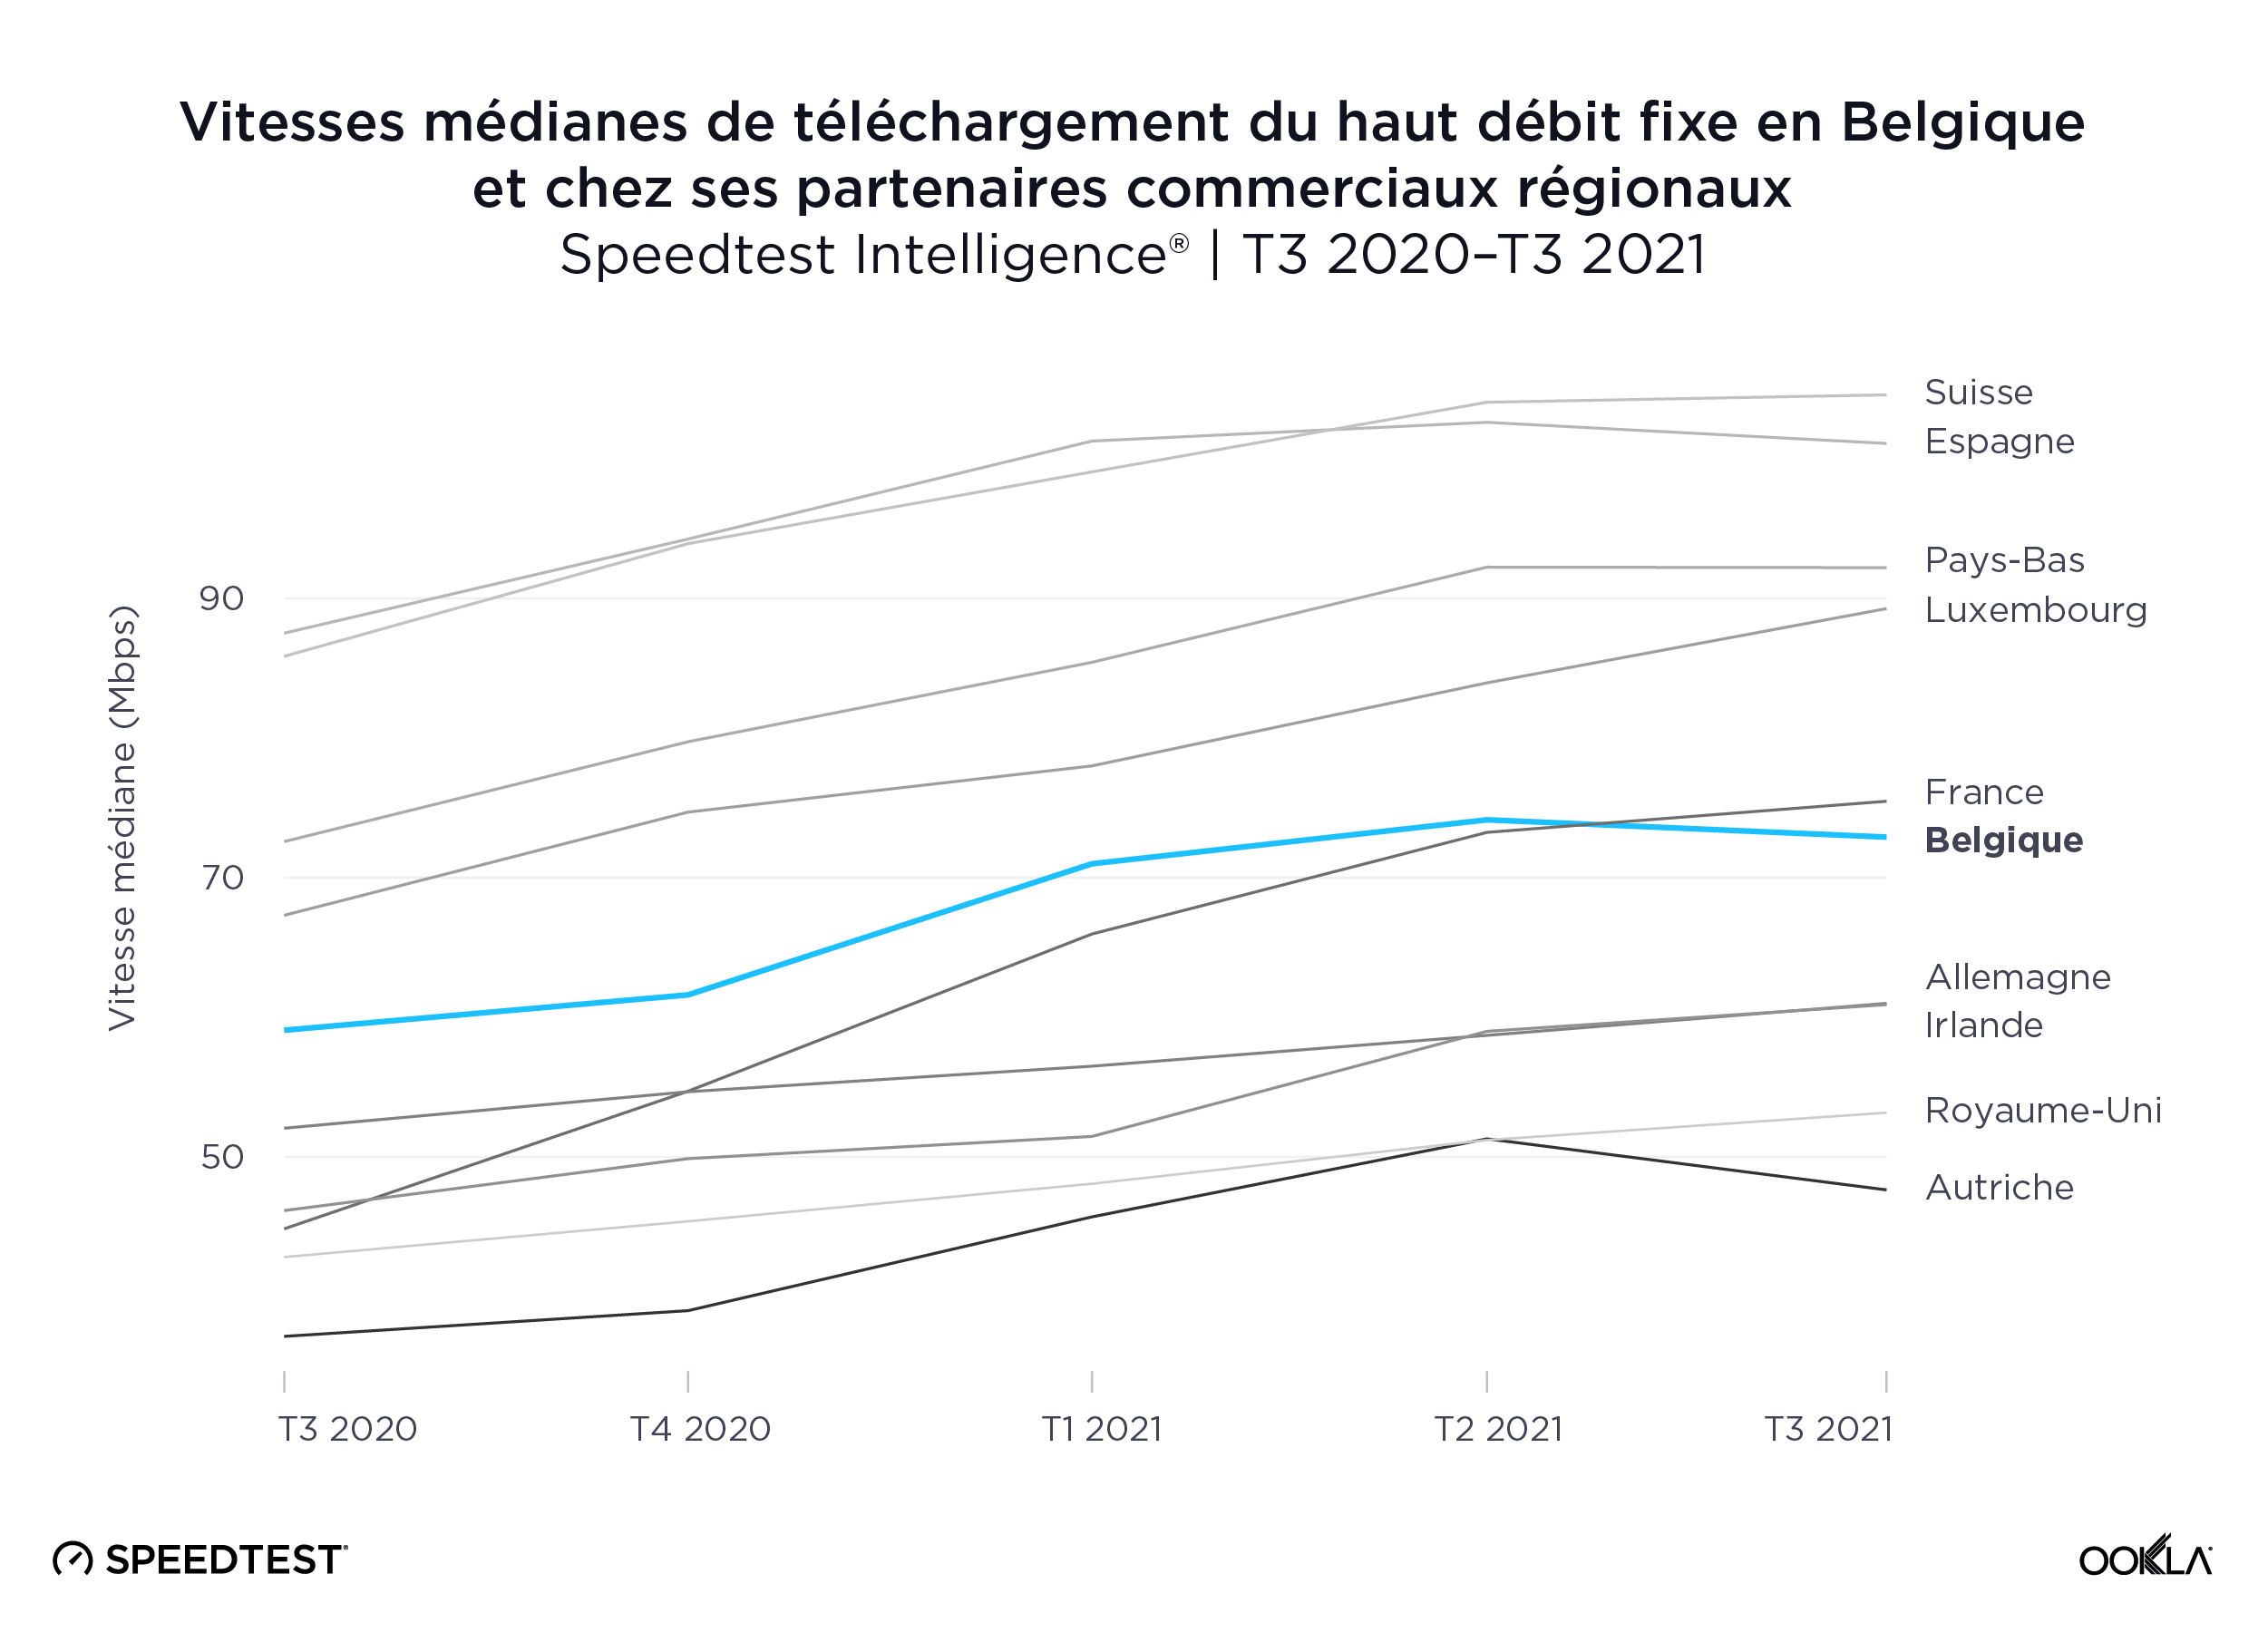
Switzerland and Spain set the European standard with fixed broadband speeds over 100.00 Mbps
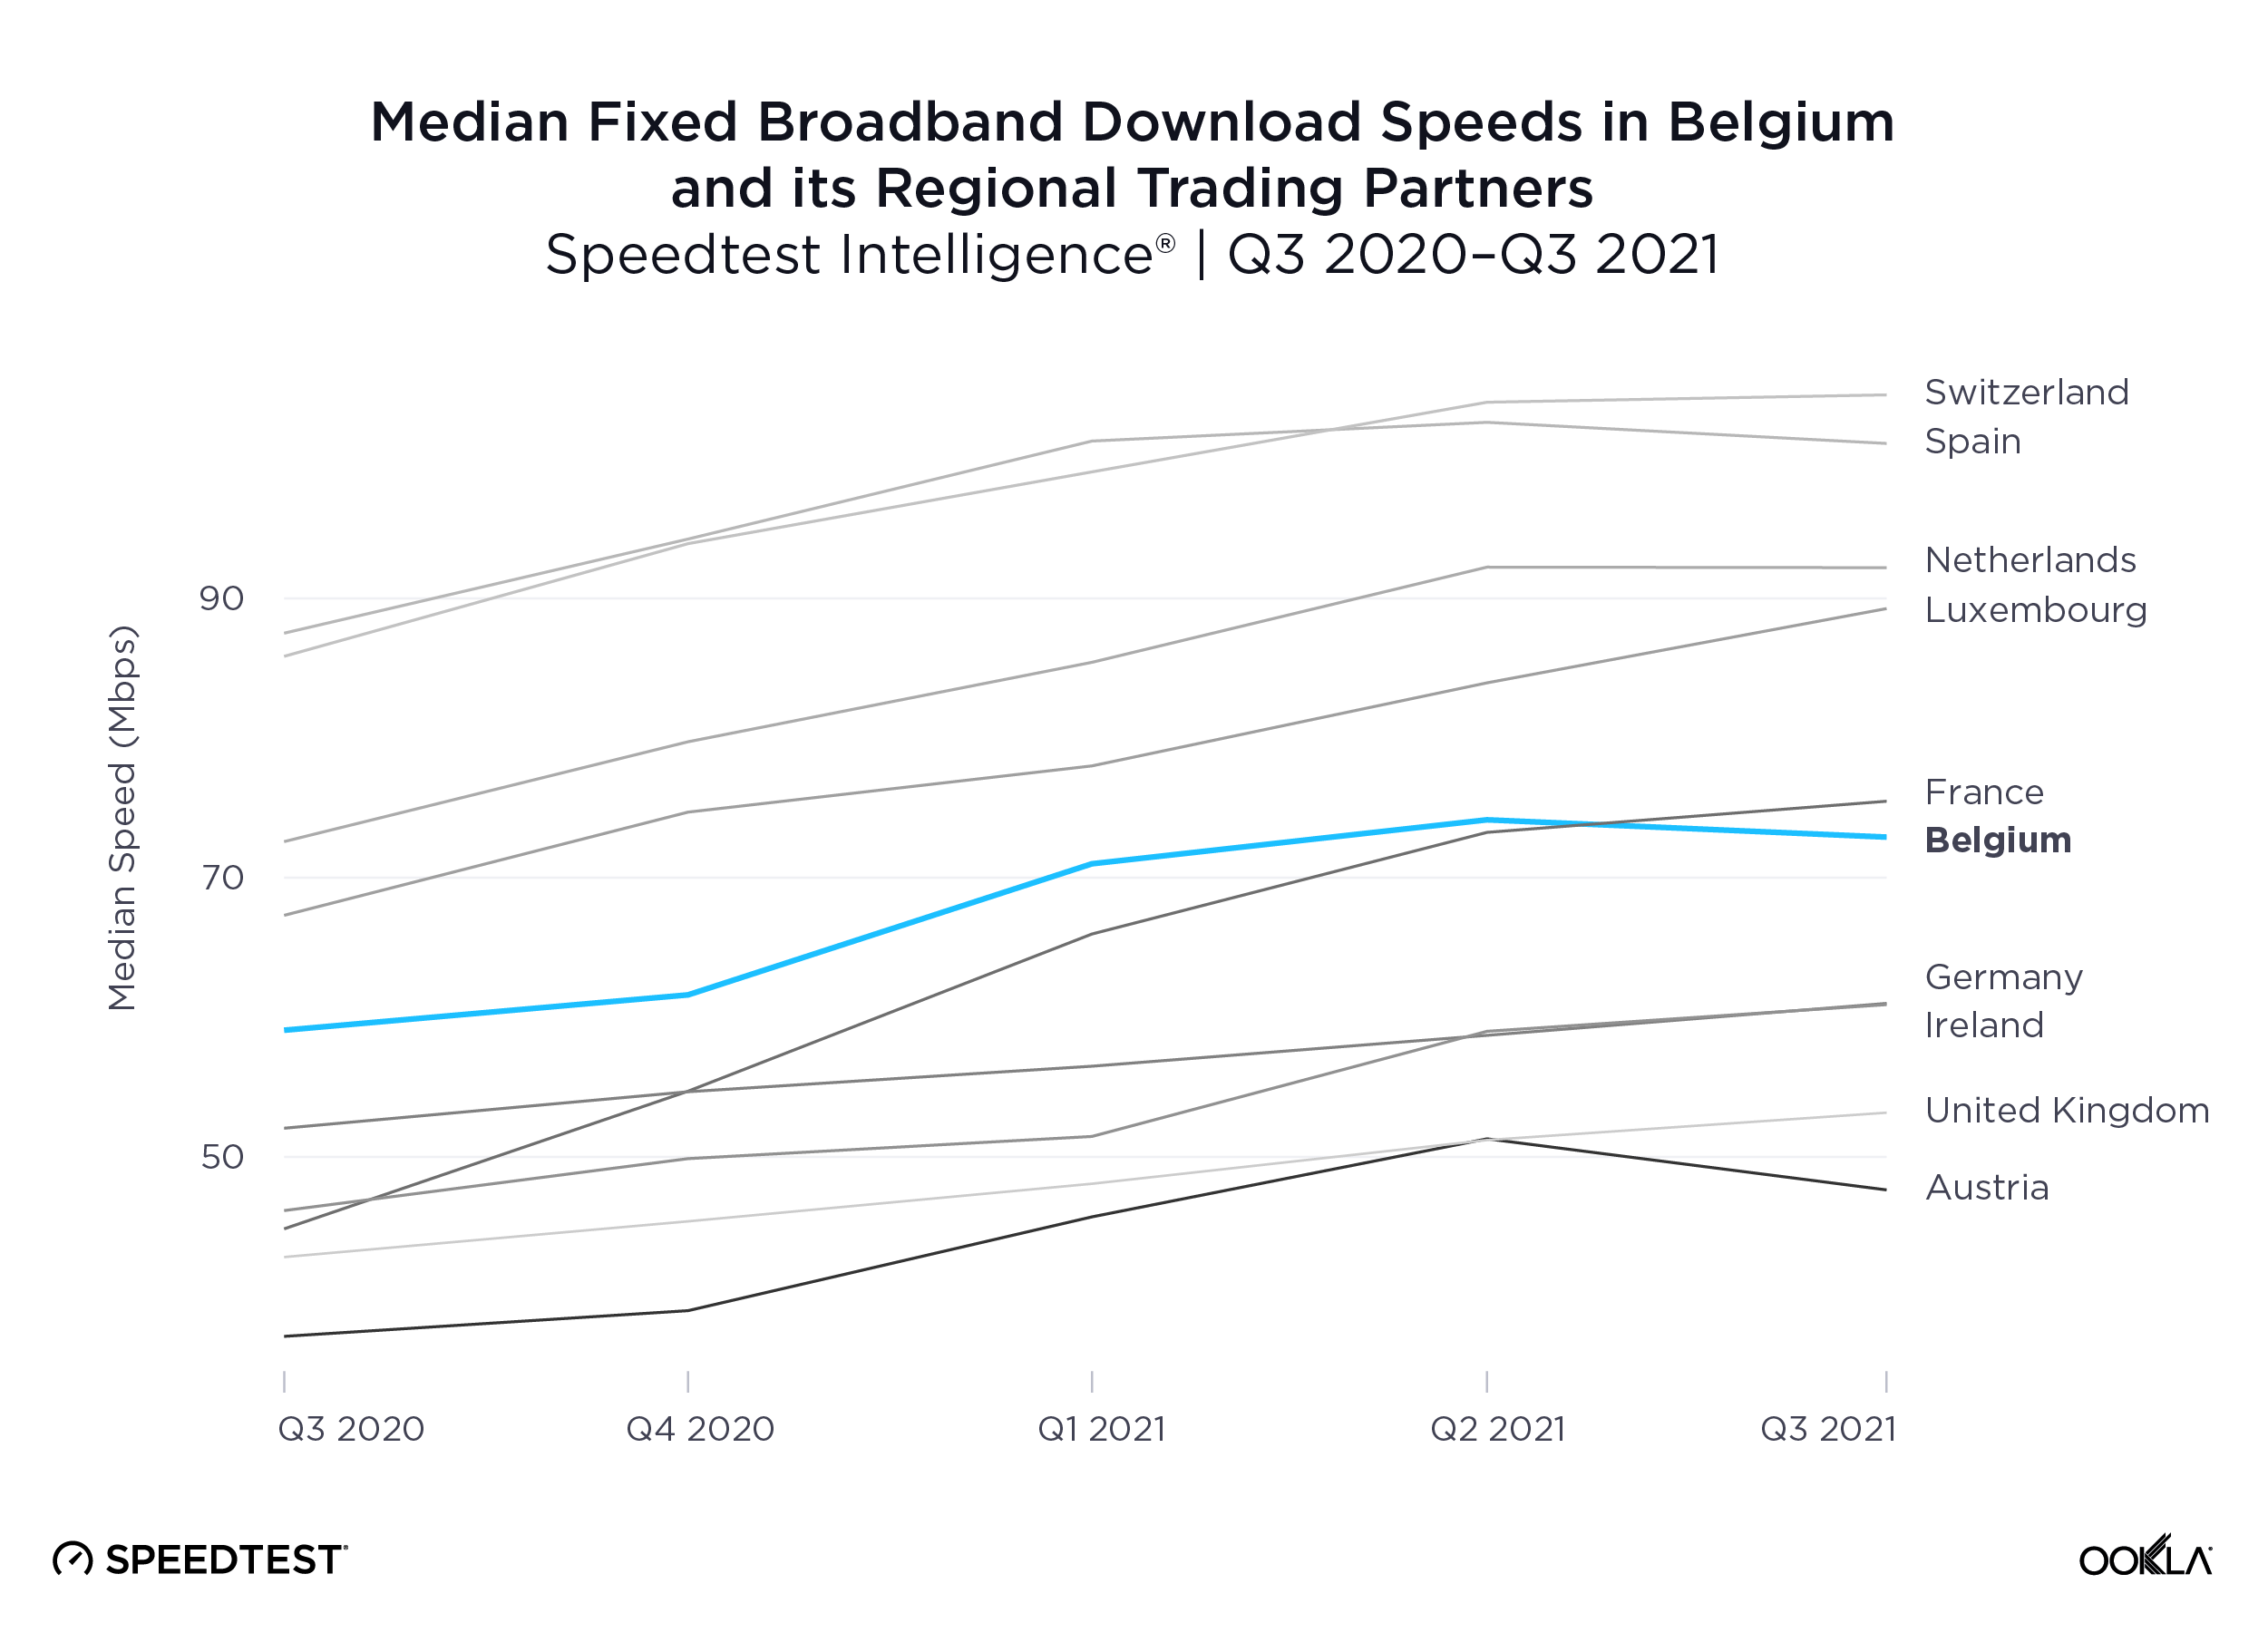
According to Speedtest Intelligence, Switzerland had the fastest median fixed broadband speed among Belgium and its regional trading partners at 104.58 Mbps during Q3 2021, edging out Spain’s 101.10 Mbps. The Netherlands and Luxembourg followed at 92.20 Mbps and 89.27 Mbps, respectively. Belgium’s median fixed broadband download speed of 72.90 Mbps was just slower than France’s at 75.47 Mbps.
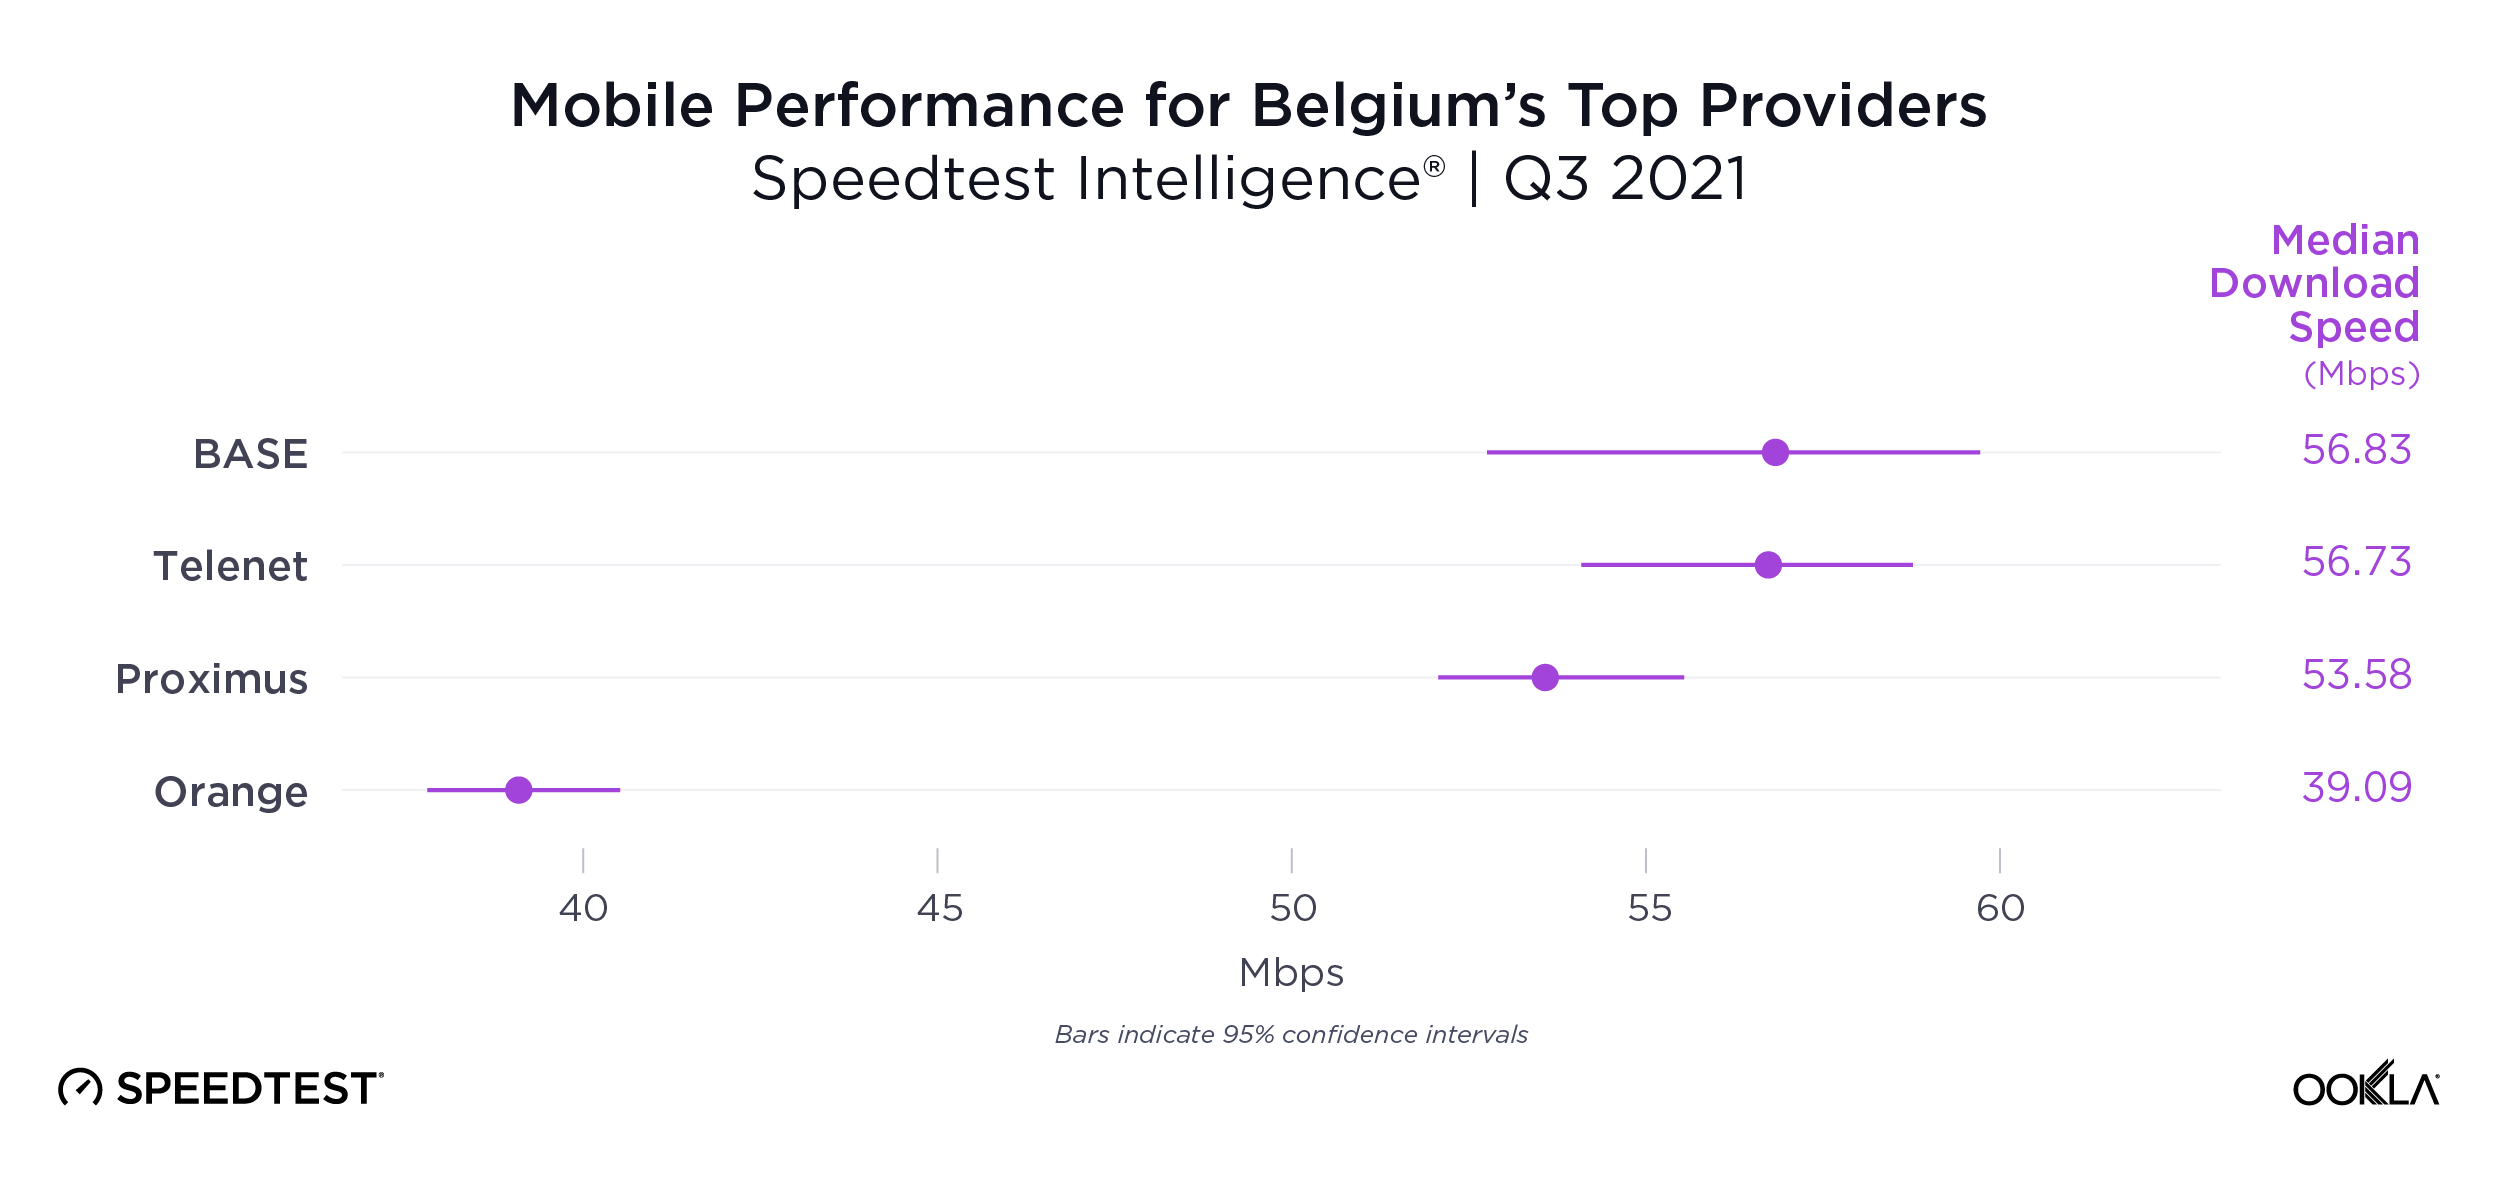
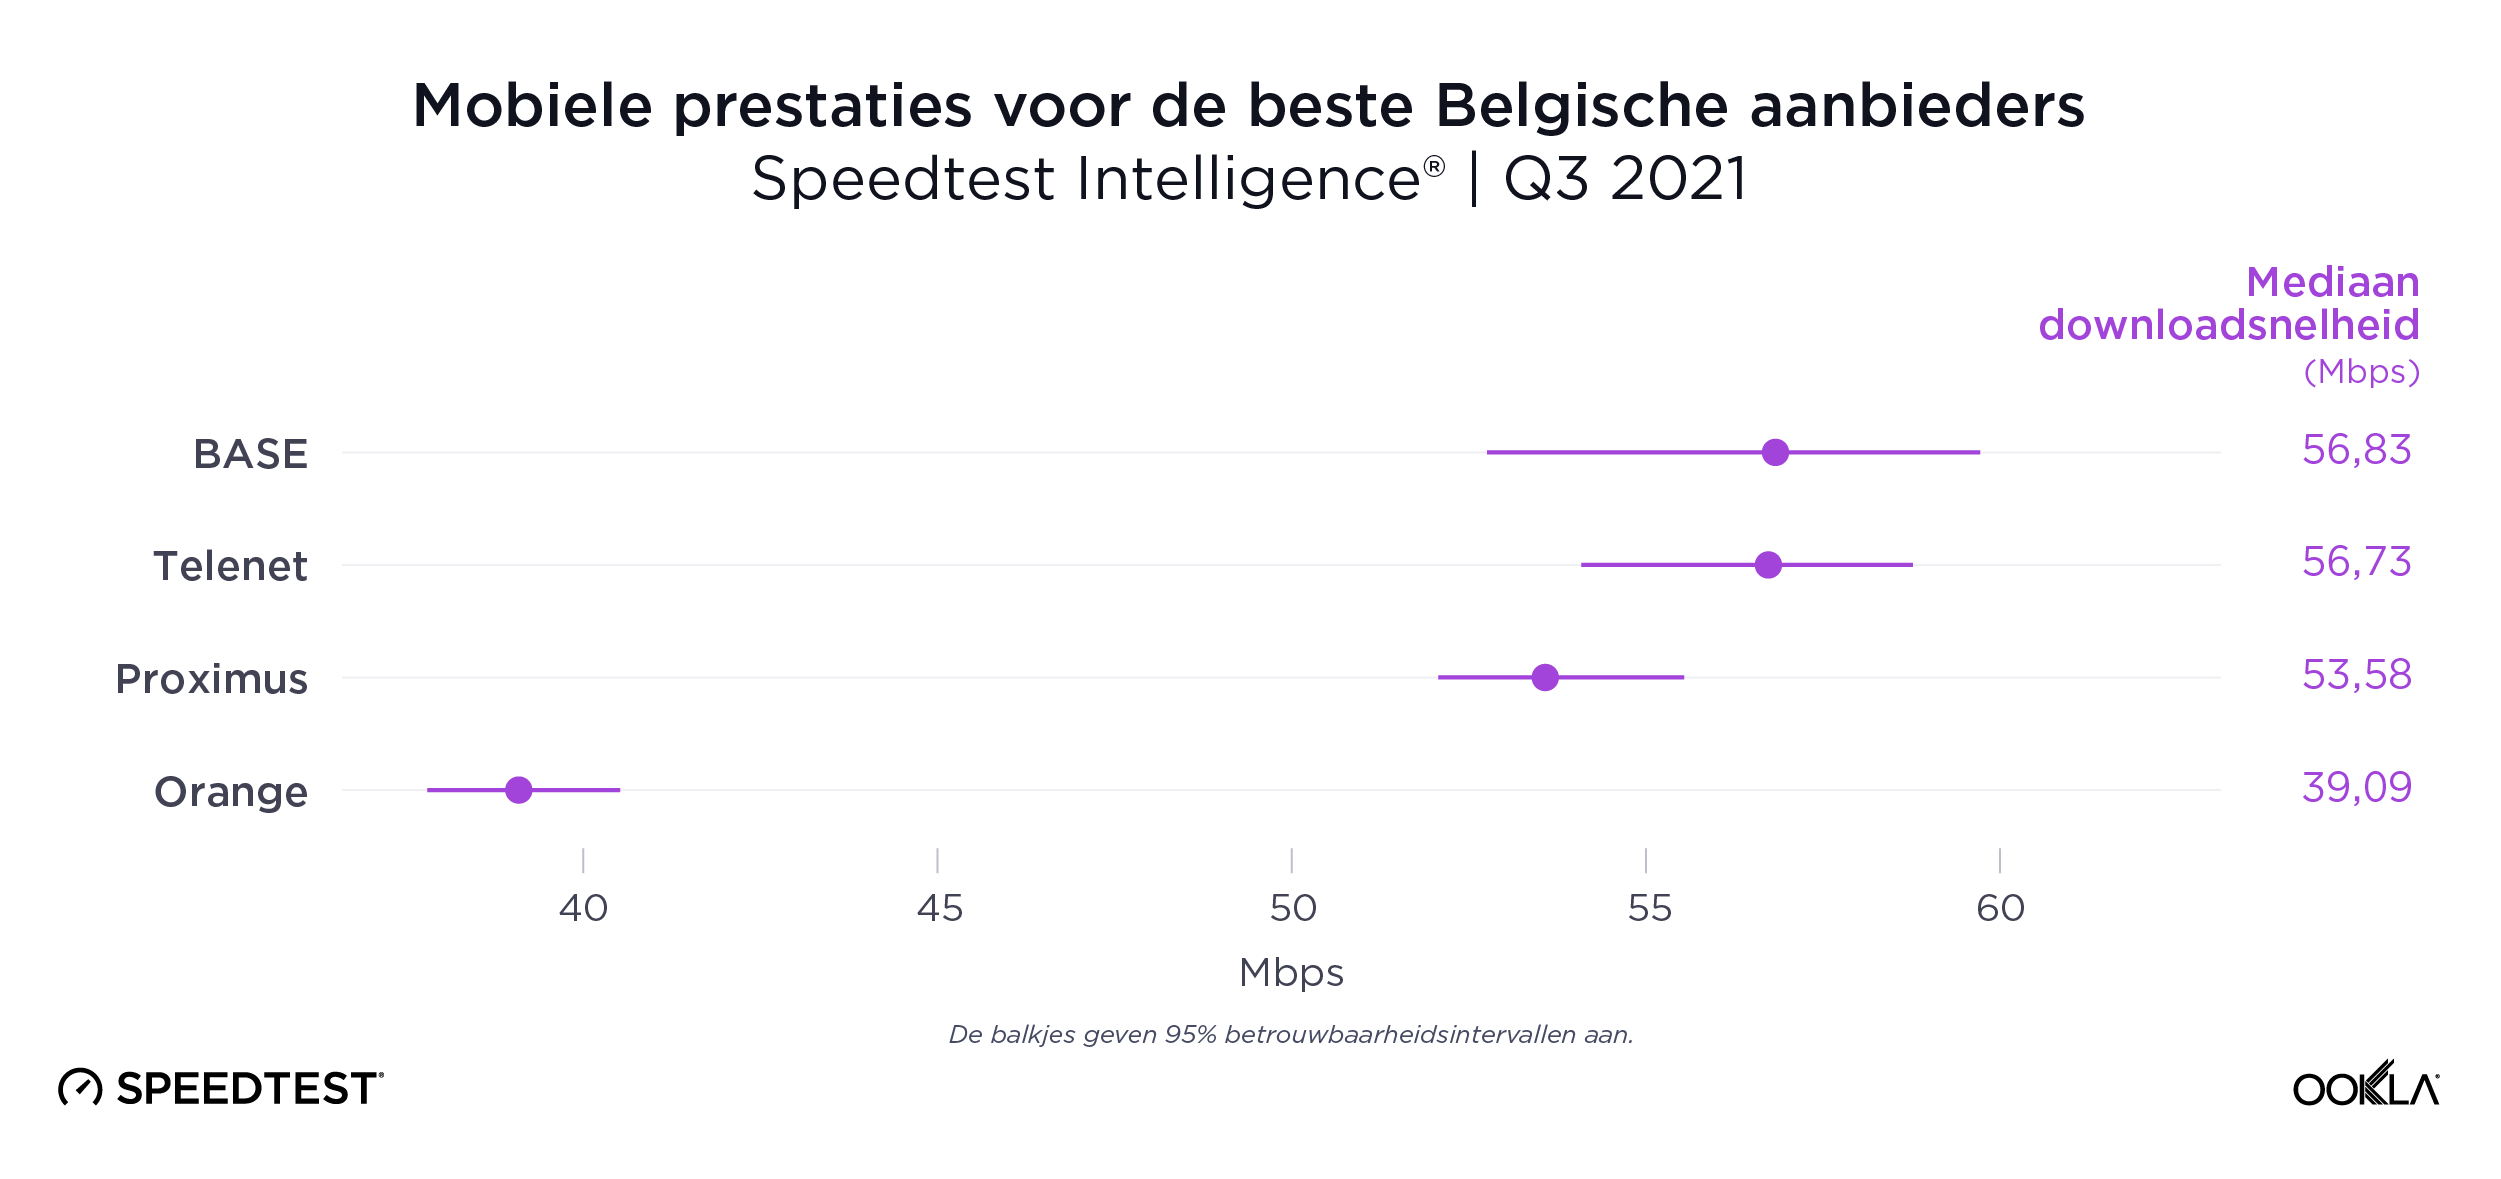
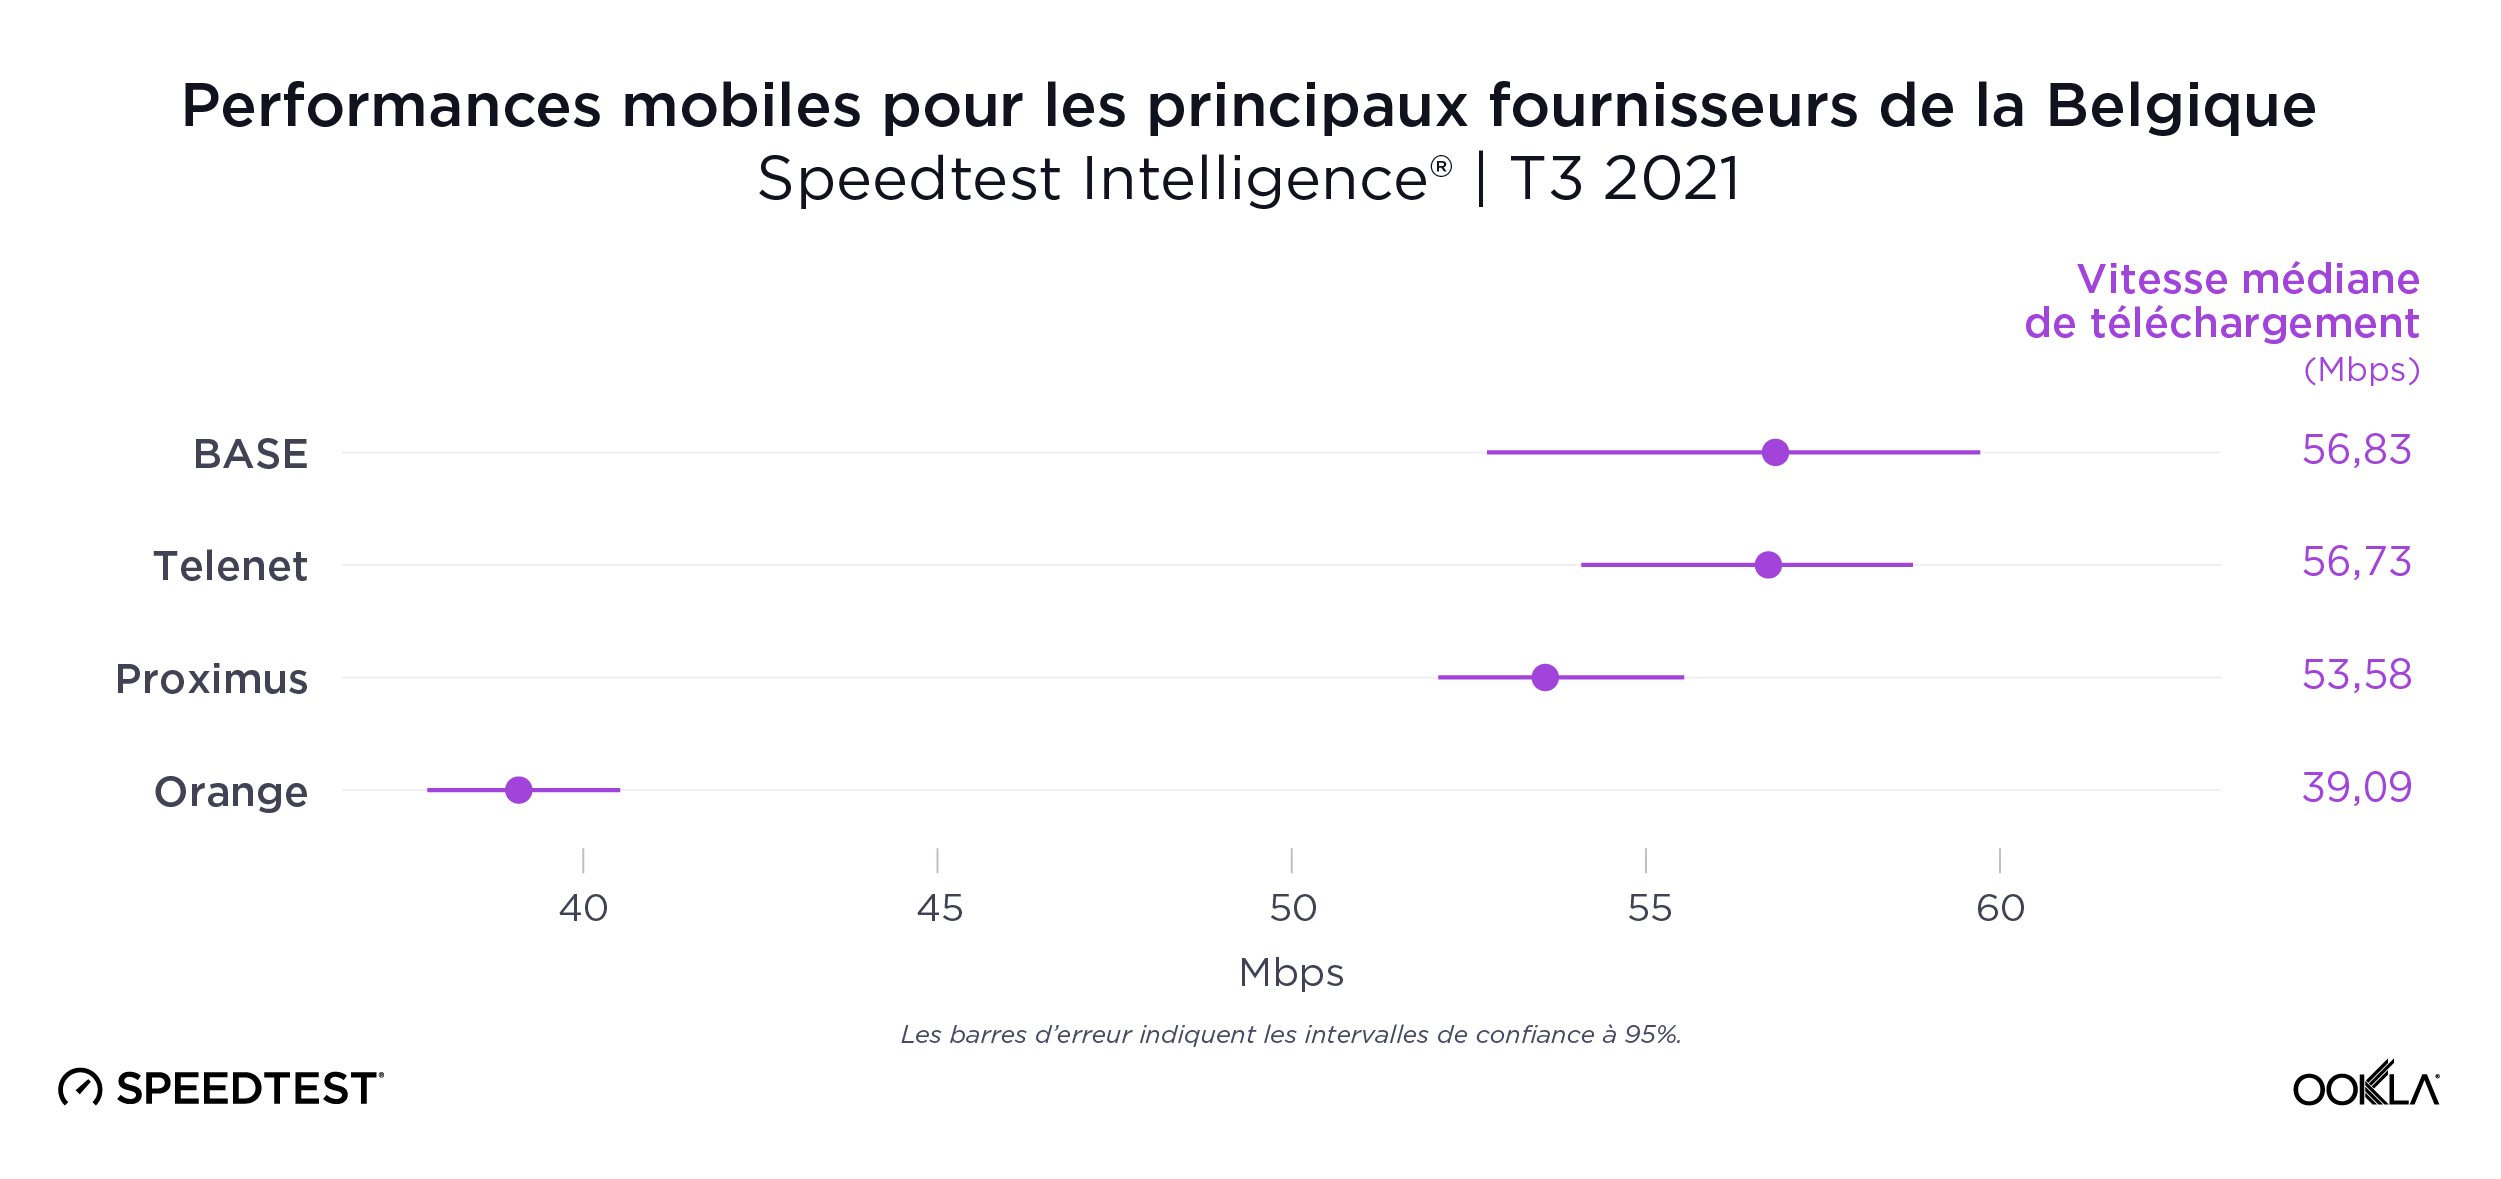
Belgium’s fastest mobile provider was too close to call during Q3 2021 with BASE (56.83 Mbps), Telenet (56.73 Mbps) and Proximus (53.58 Mbps) leading the way. Orange was fourth at 39.09 Mbps. It also must be noted Telenet owns the BASE brand.
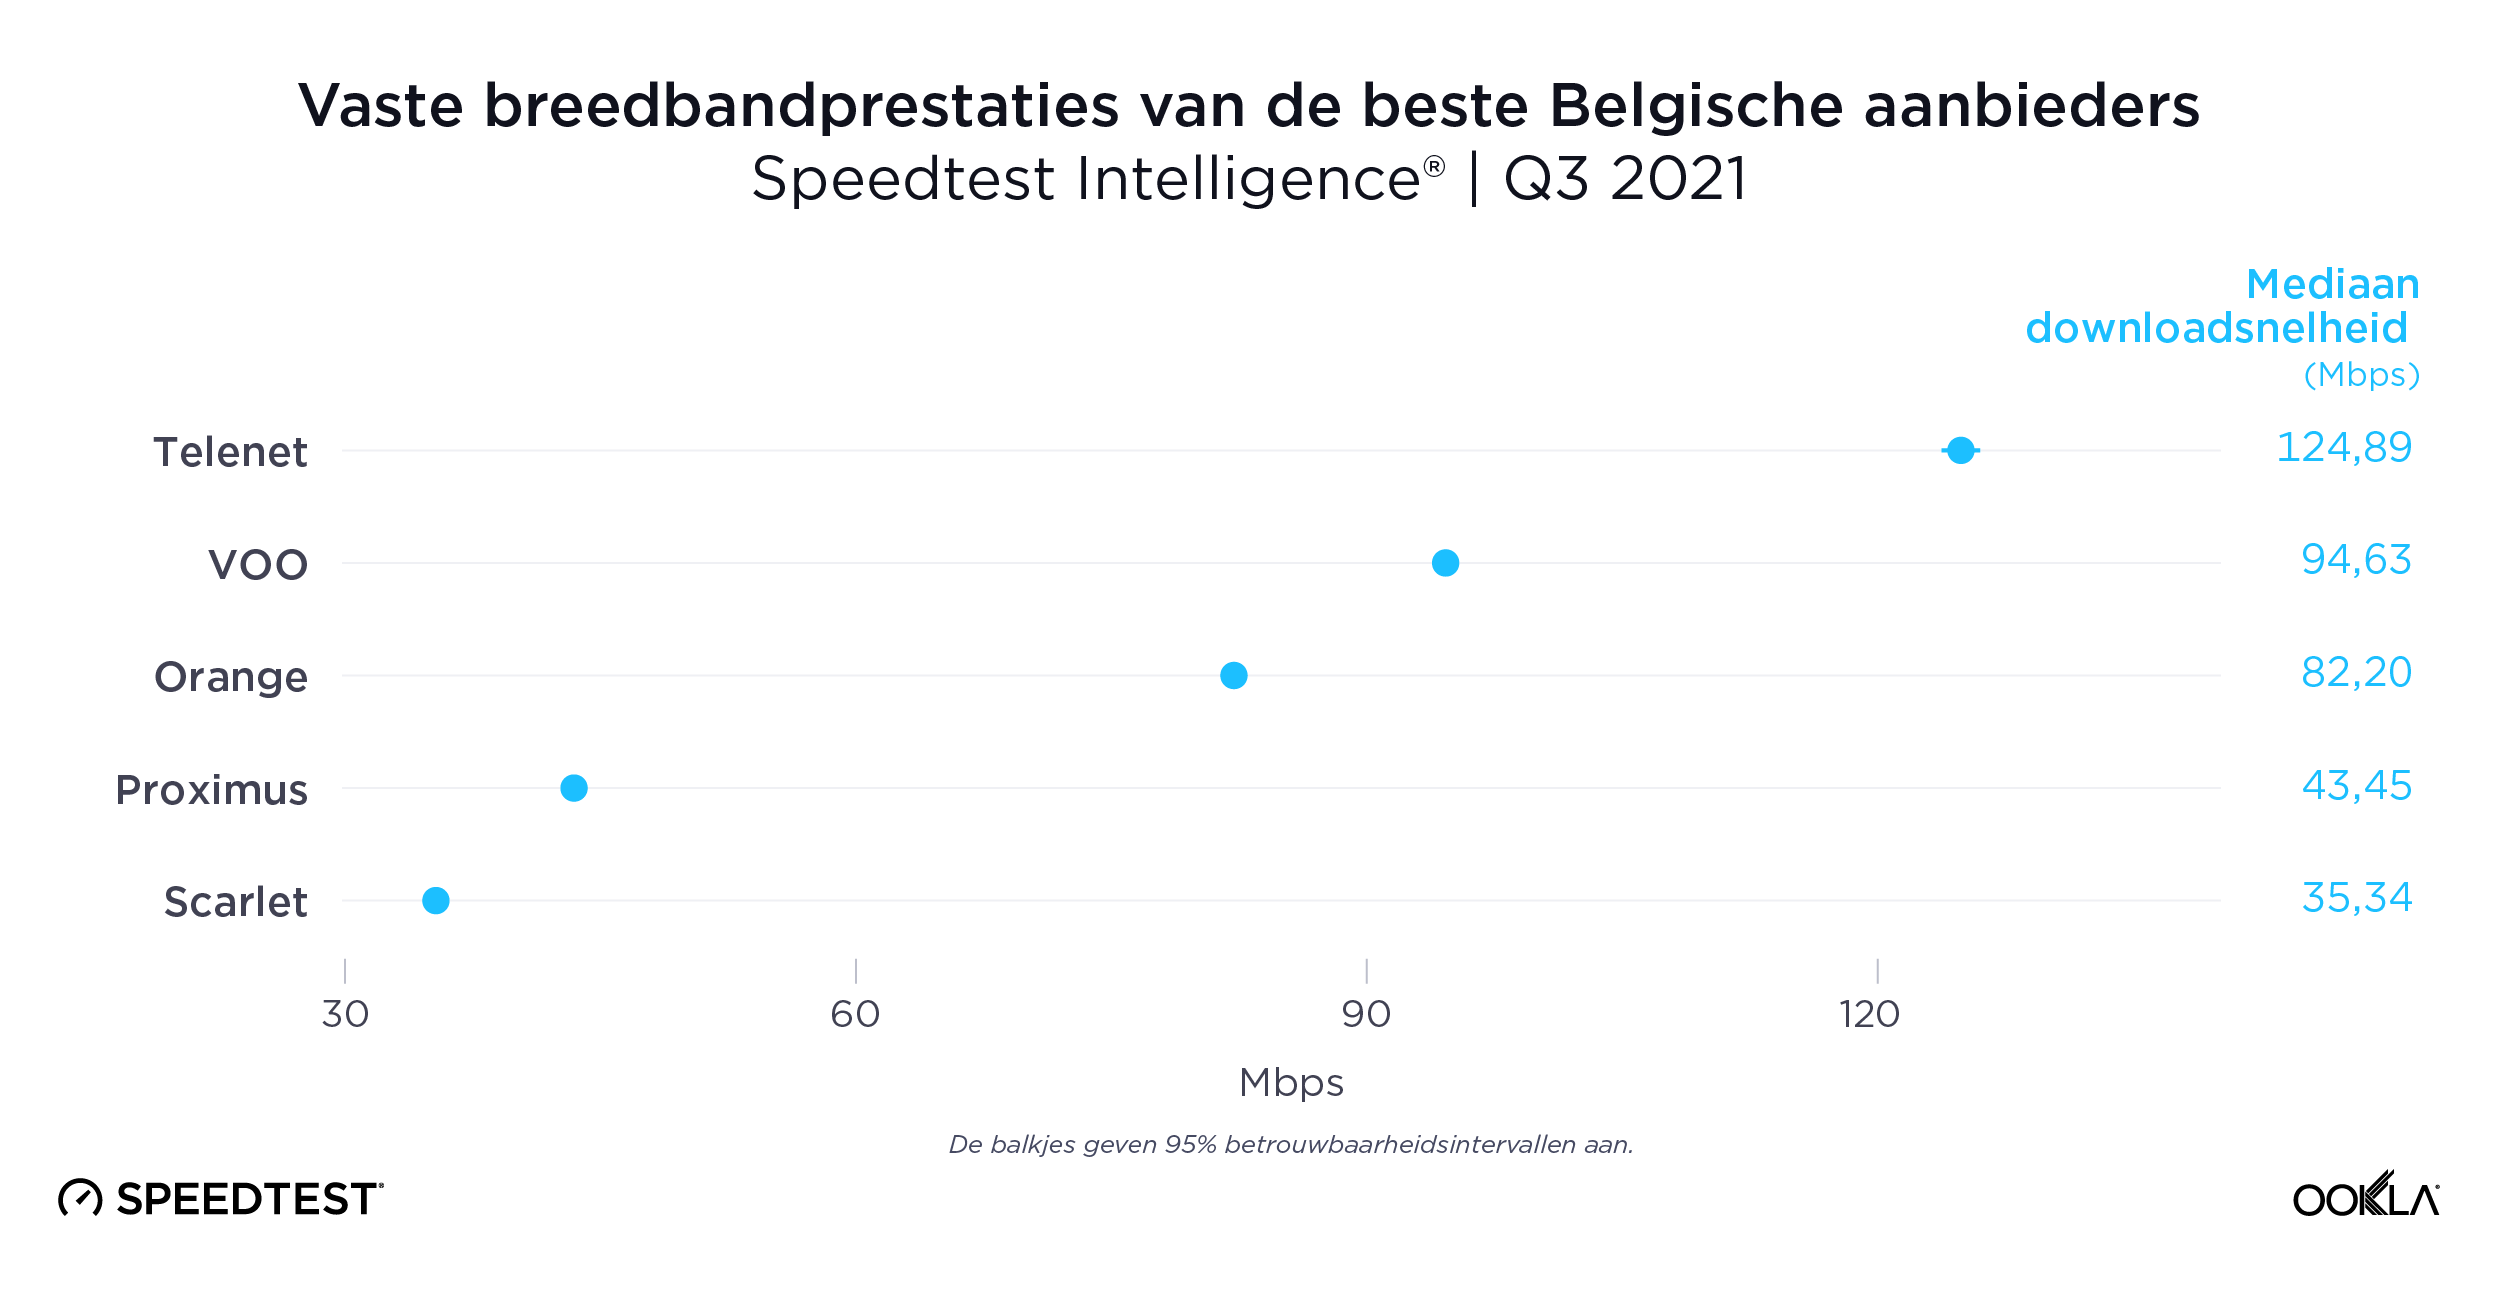
Telenet had the fastest fixed broadband speed
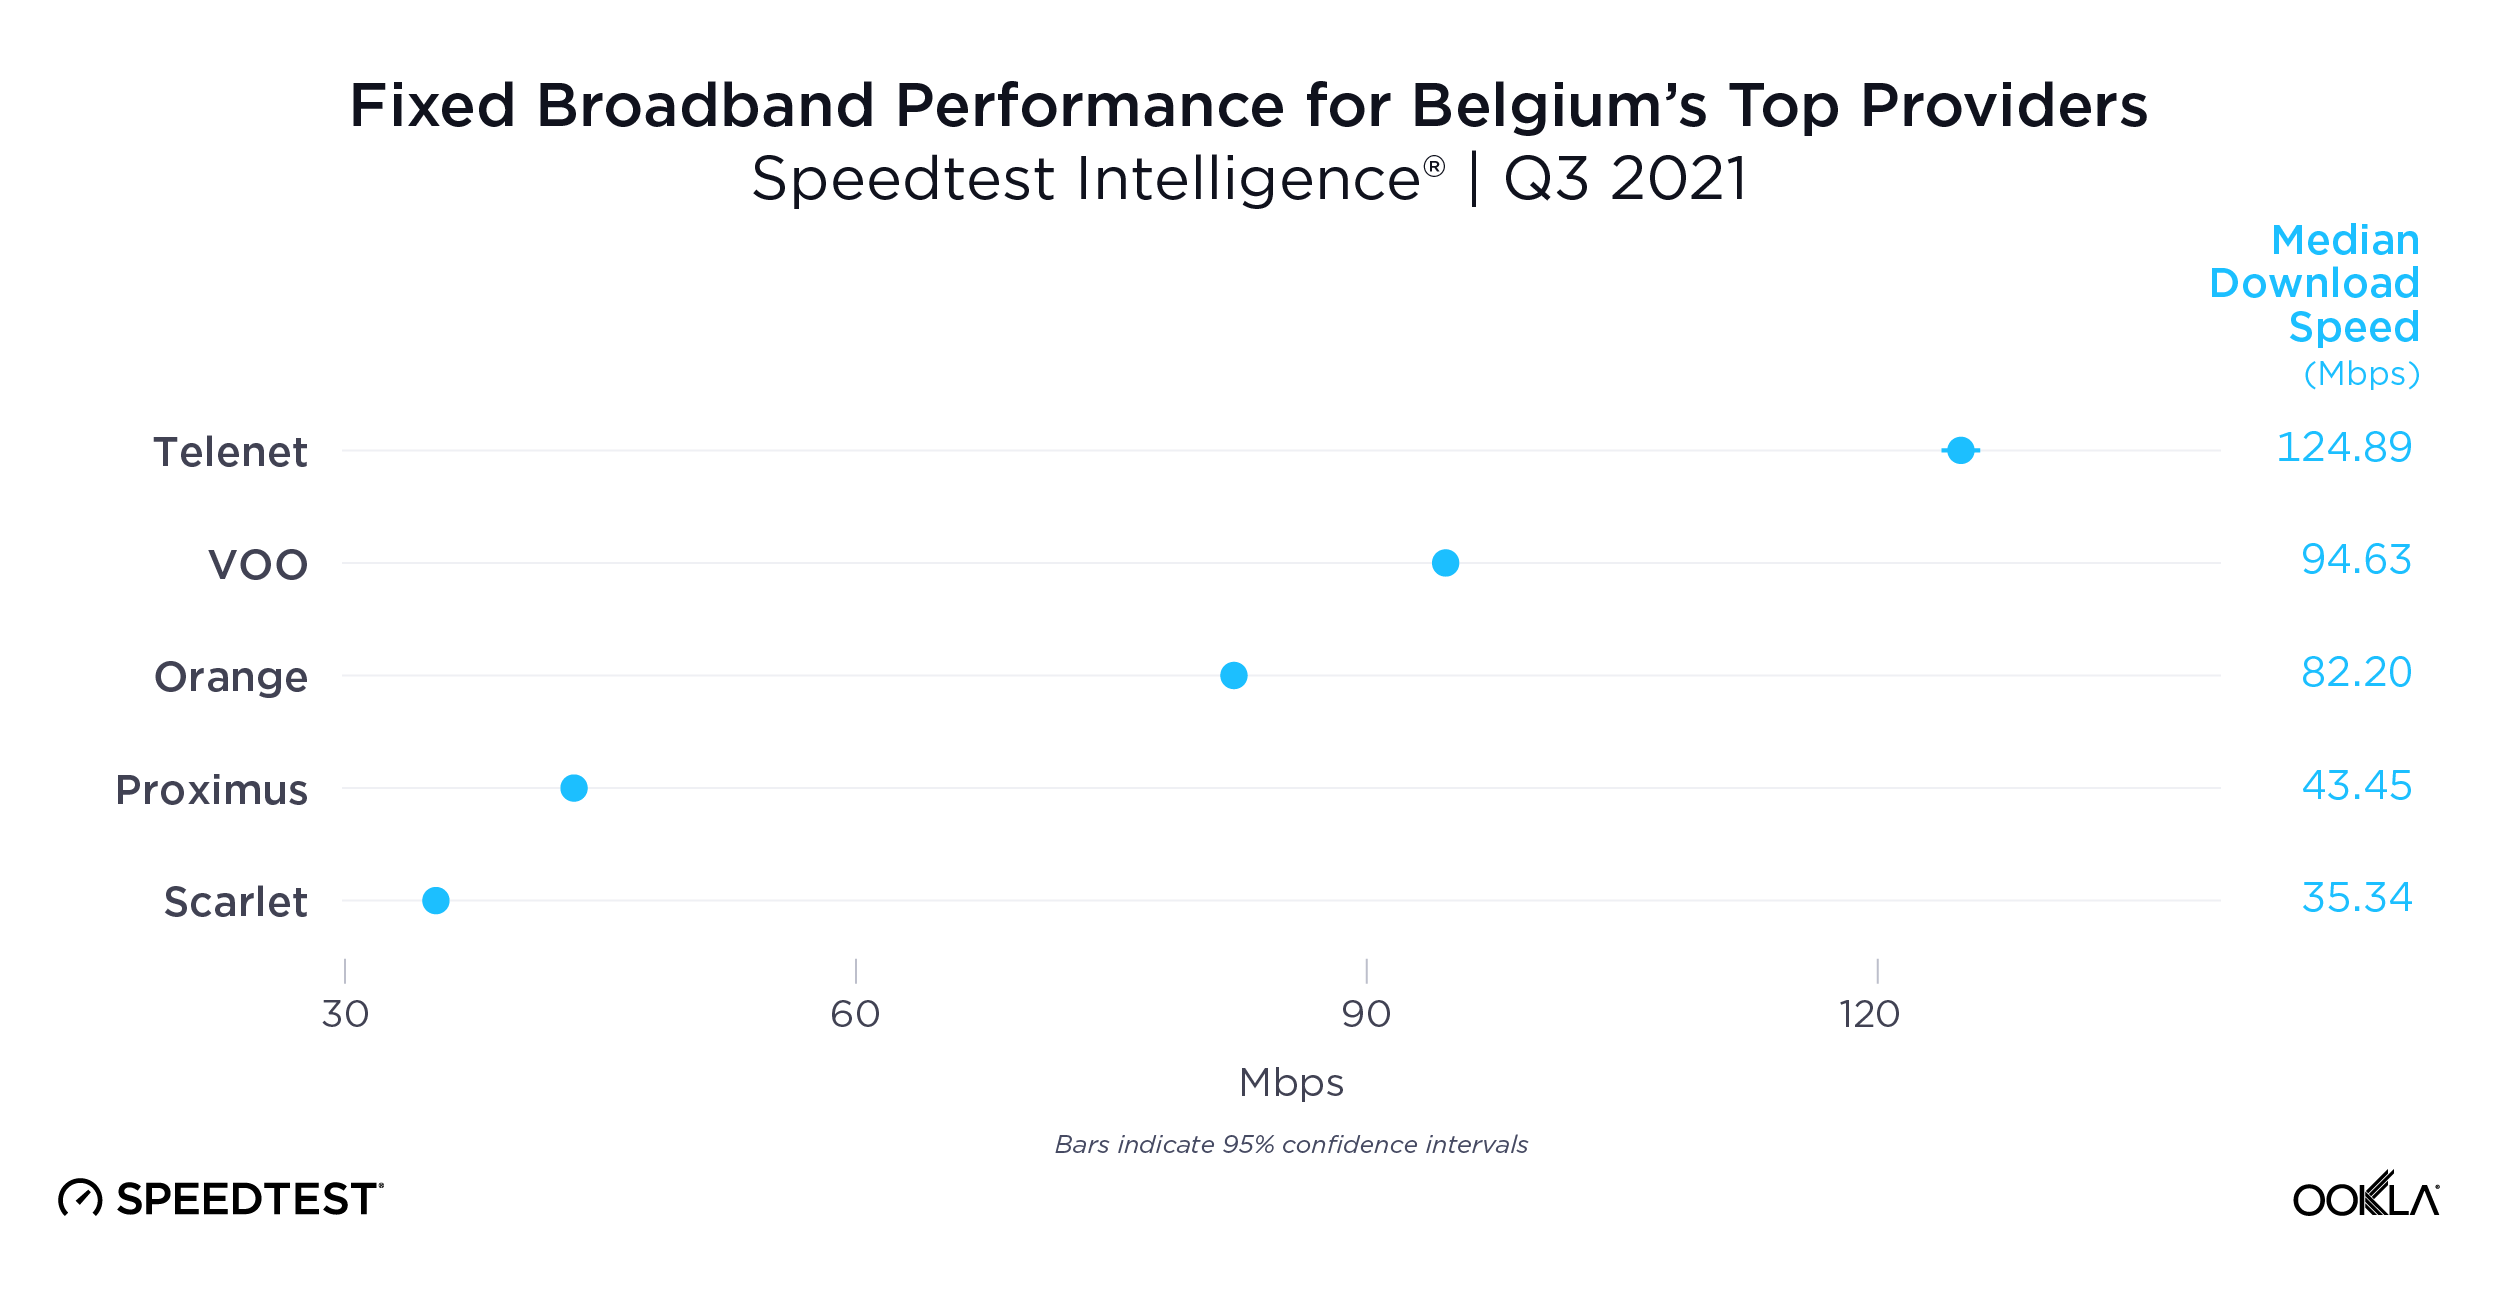
Telenet had the fastest download speed over fixed broadband at 124.89 Mbps. This far outpaced VOO, which followed at 94.63 Mbps. Orange was next on the list at 82.20 Mbps, followed by Proximus (43.45 Mbps) and Scarlet (35.34 Mbps).
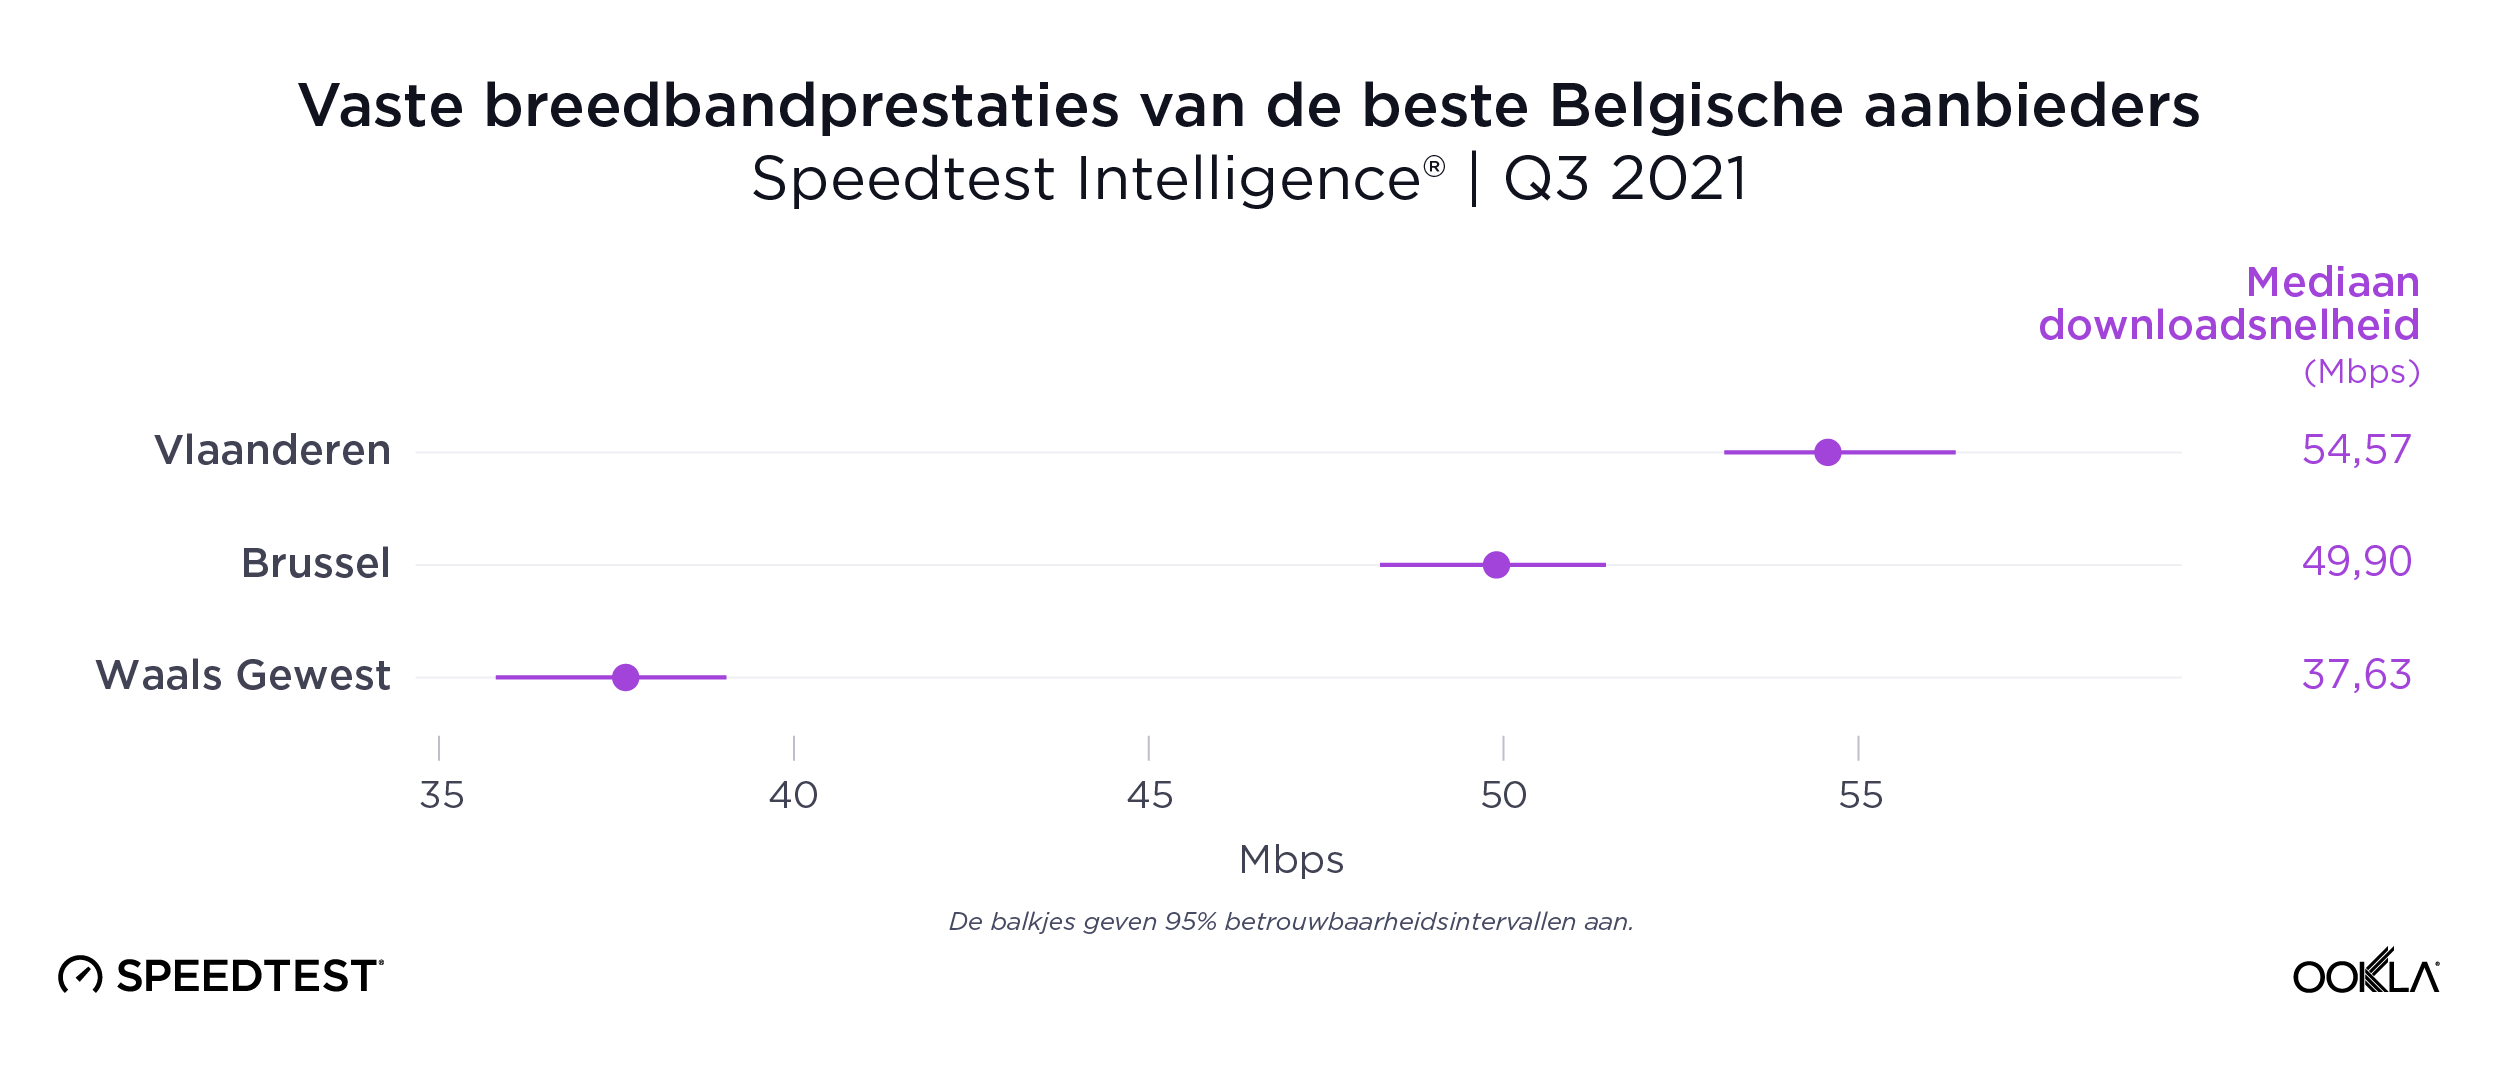
Flanders had faster mobile download speeds than Brussels and the Walloon region
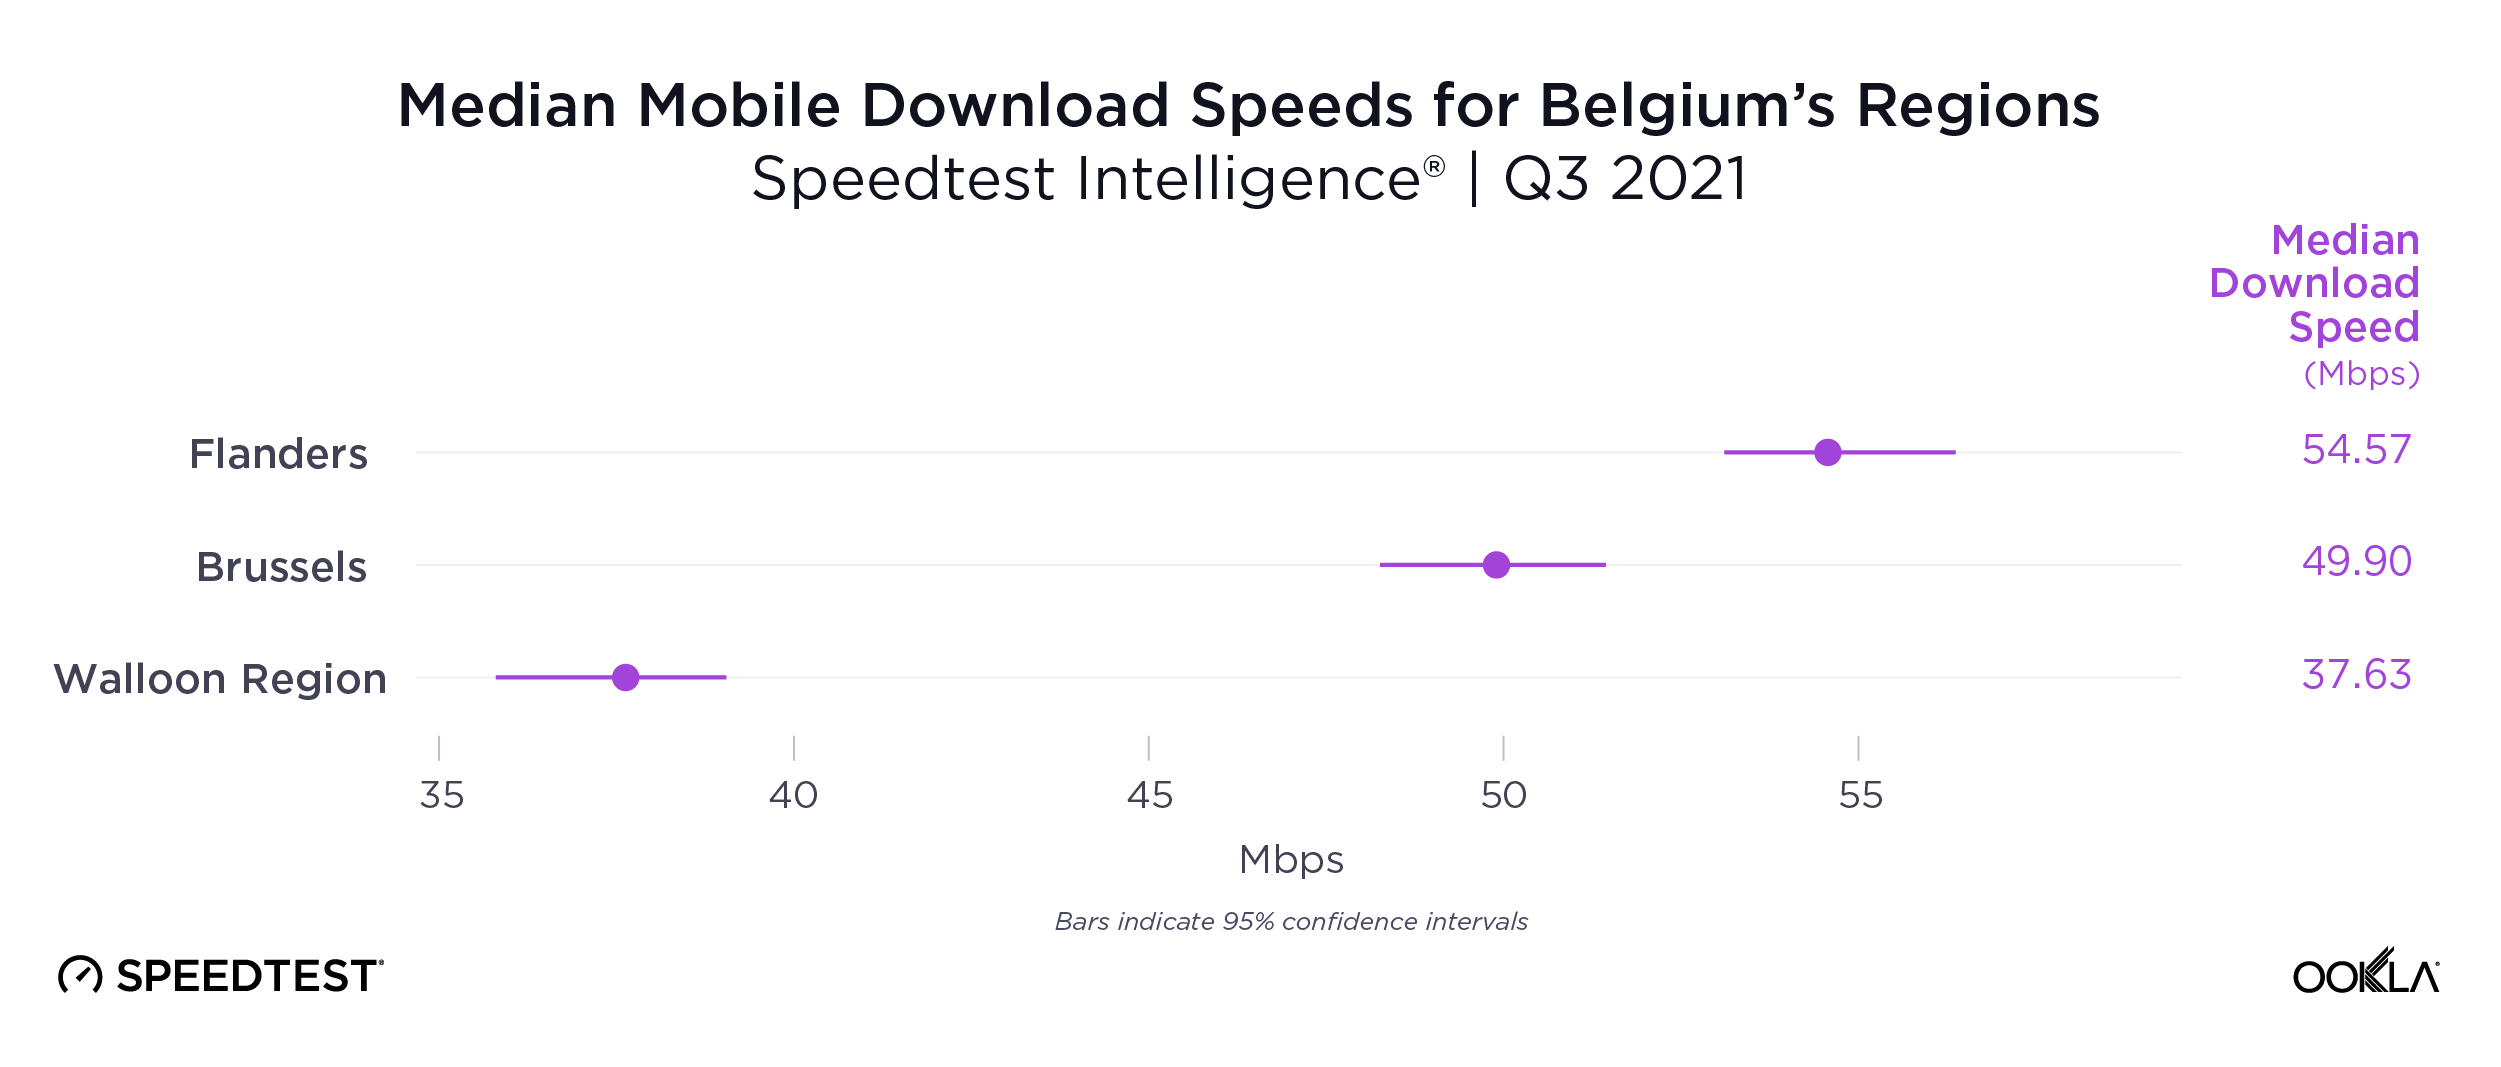
Speedtest Intelligence data uncovered a wide divide between Belgium’s more populous northern Flemish region and the less populous southern Walloon region on mobile performance during Q3 2021. Flanders had a median mobile download speed at 54.57 Mbps to Walloon’s 37.63 Mbps. The Capital Region of Brussels was squarely in the middle on mobile at 49.90 Mbps. This digital divide extended into province-level data, with almost every Flemish province achieving faster median download speeds than Walloon provinces.
Four Flemish provinces had mobile download speeds over 50 Mbps
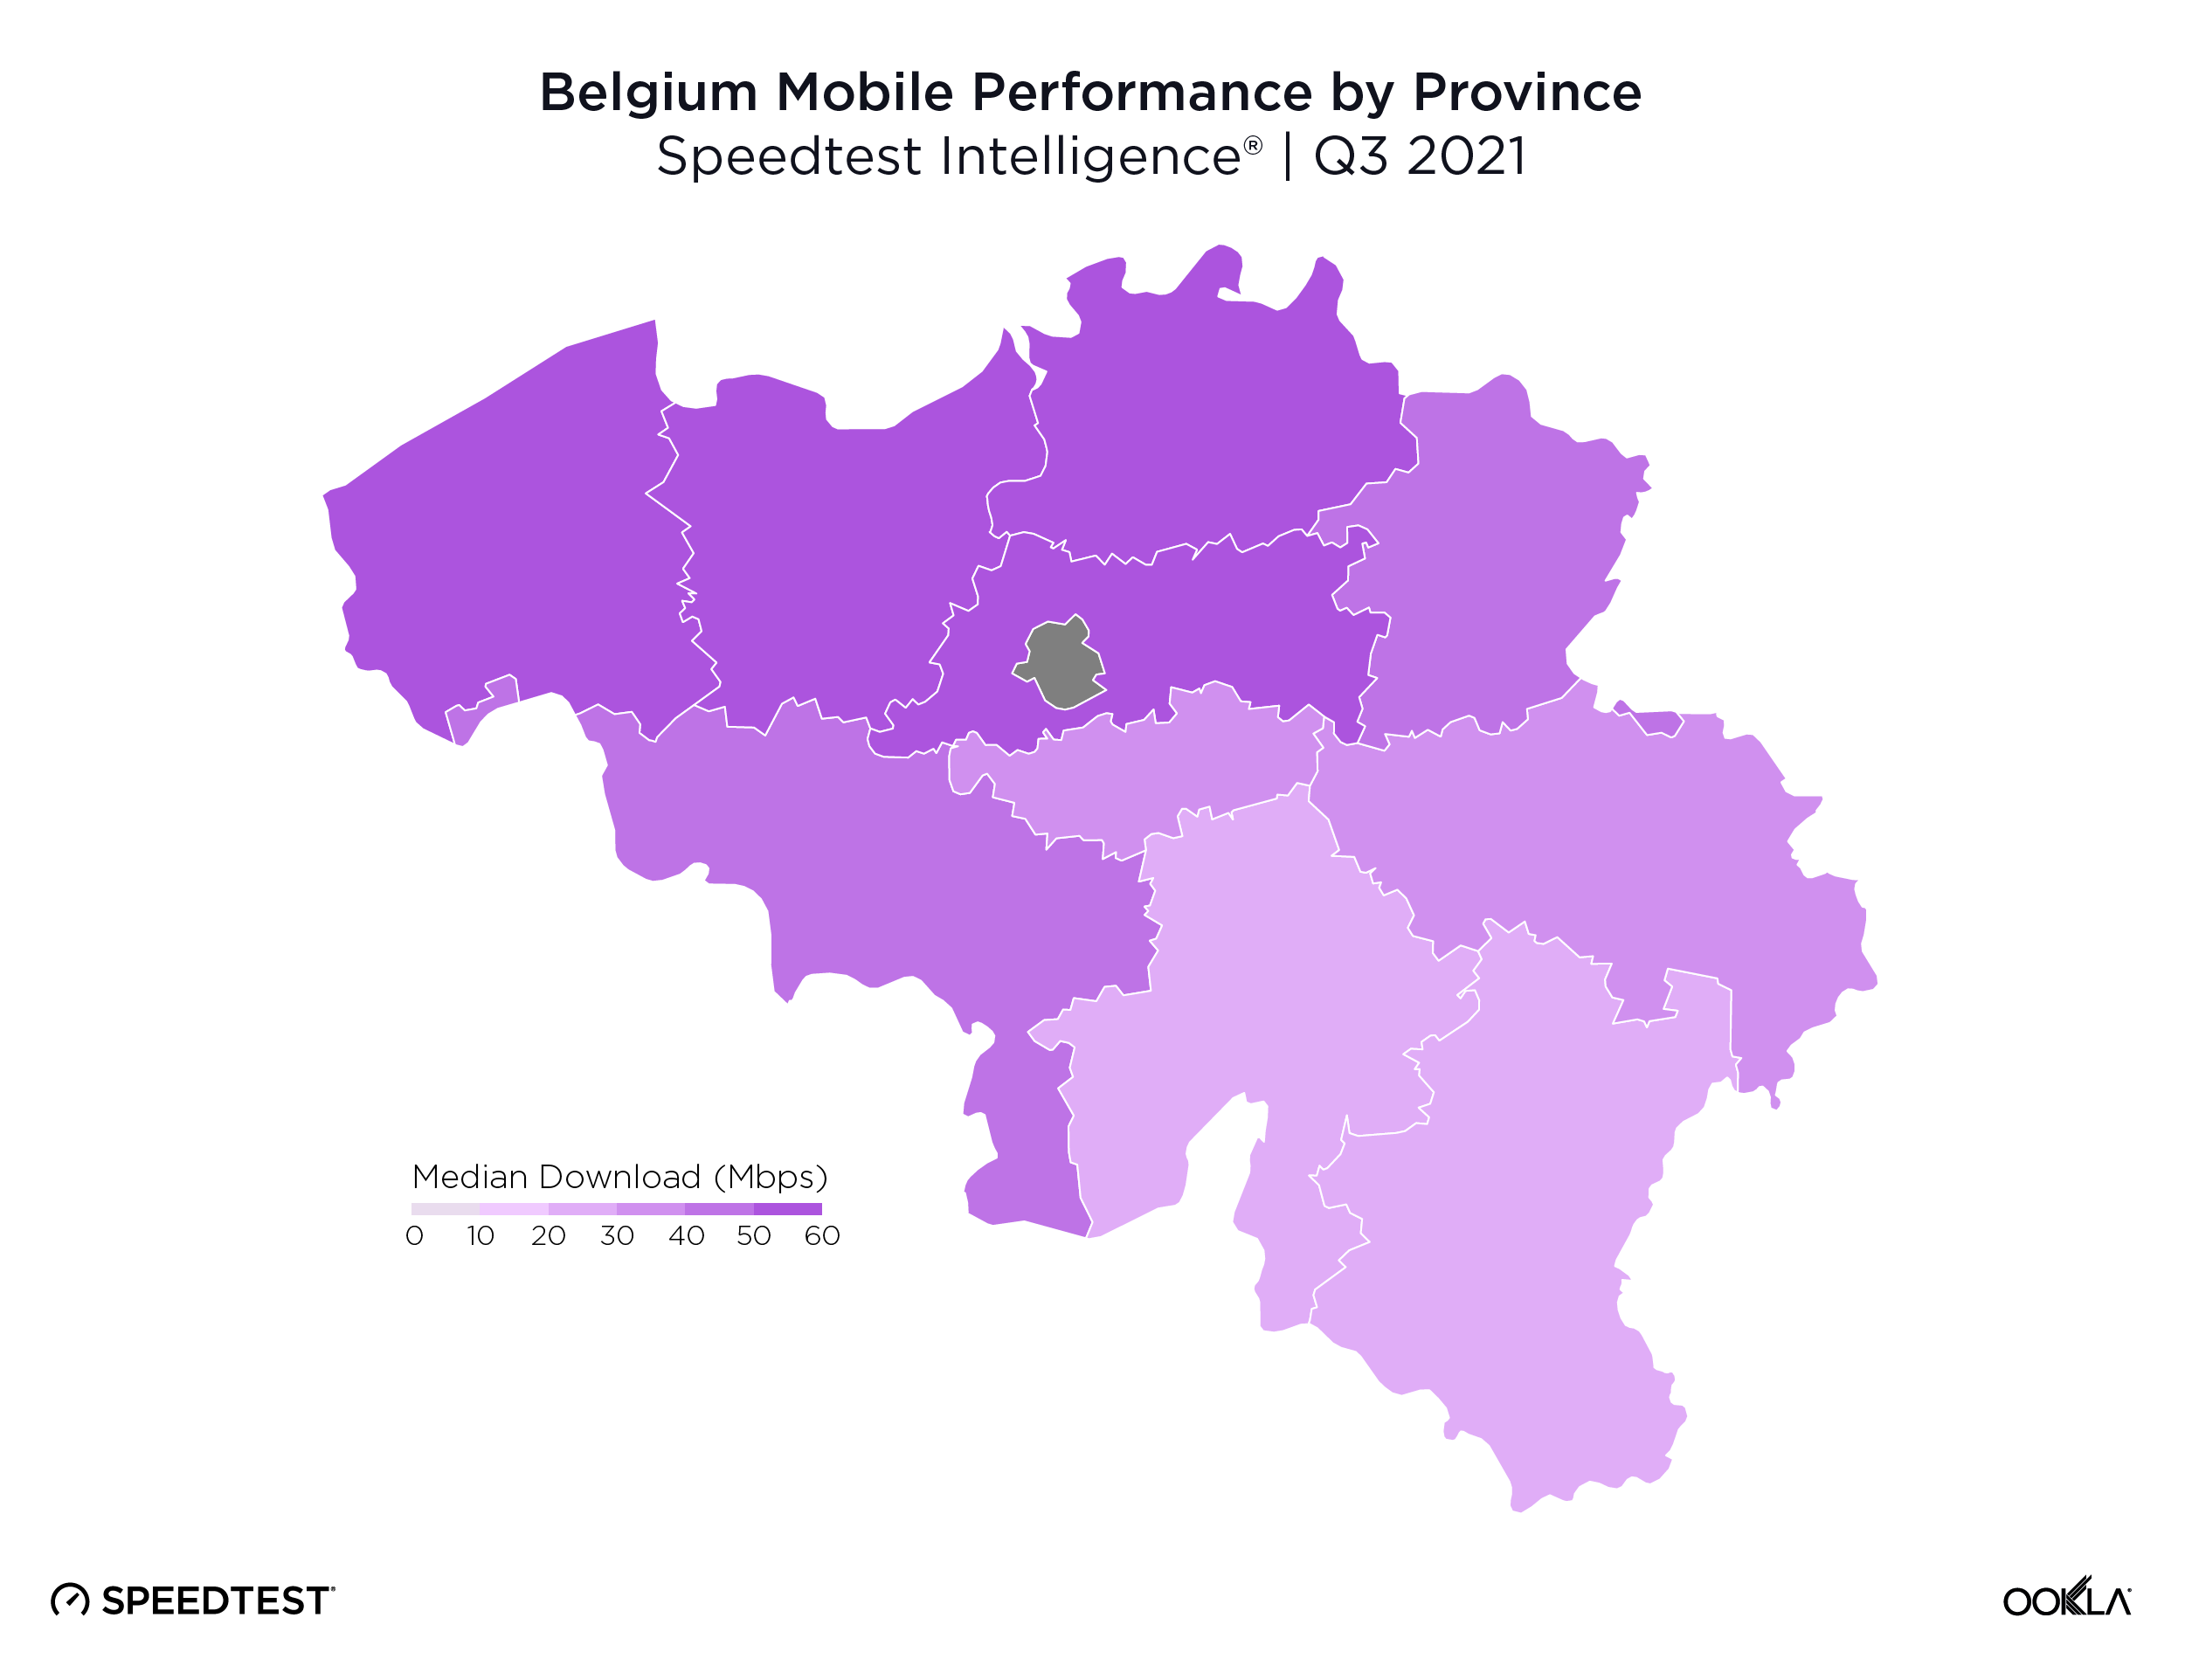
There was no statistically fastest mobile download speed among Belgium’s provinces, though Flemish Brabant (57.47 Mbps), Antwerp (57.30 Mbps), West Flanders (54.95 Mbps) and East Flanders (52.19 Mbps) all notched download speeds above 50.00 Mbps. The Luxembourg province (28.40 Mbps) and Province of Namur (28.71 Mbps) were the only Belgian provinces that fell short of reaching a median mobile download speed of 30.00 Mbps.
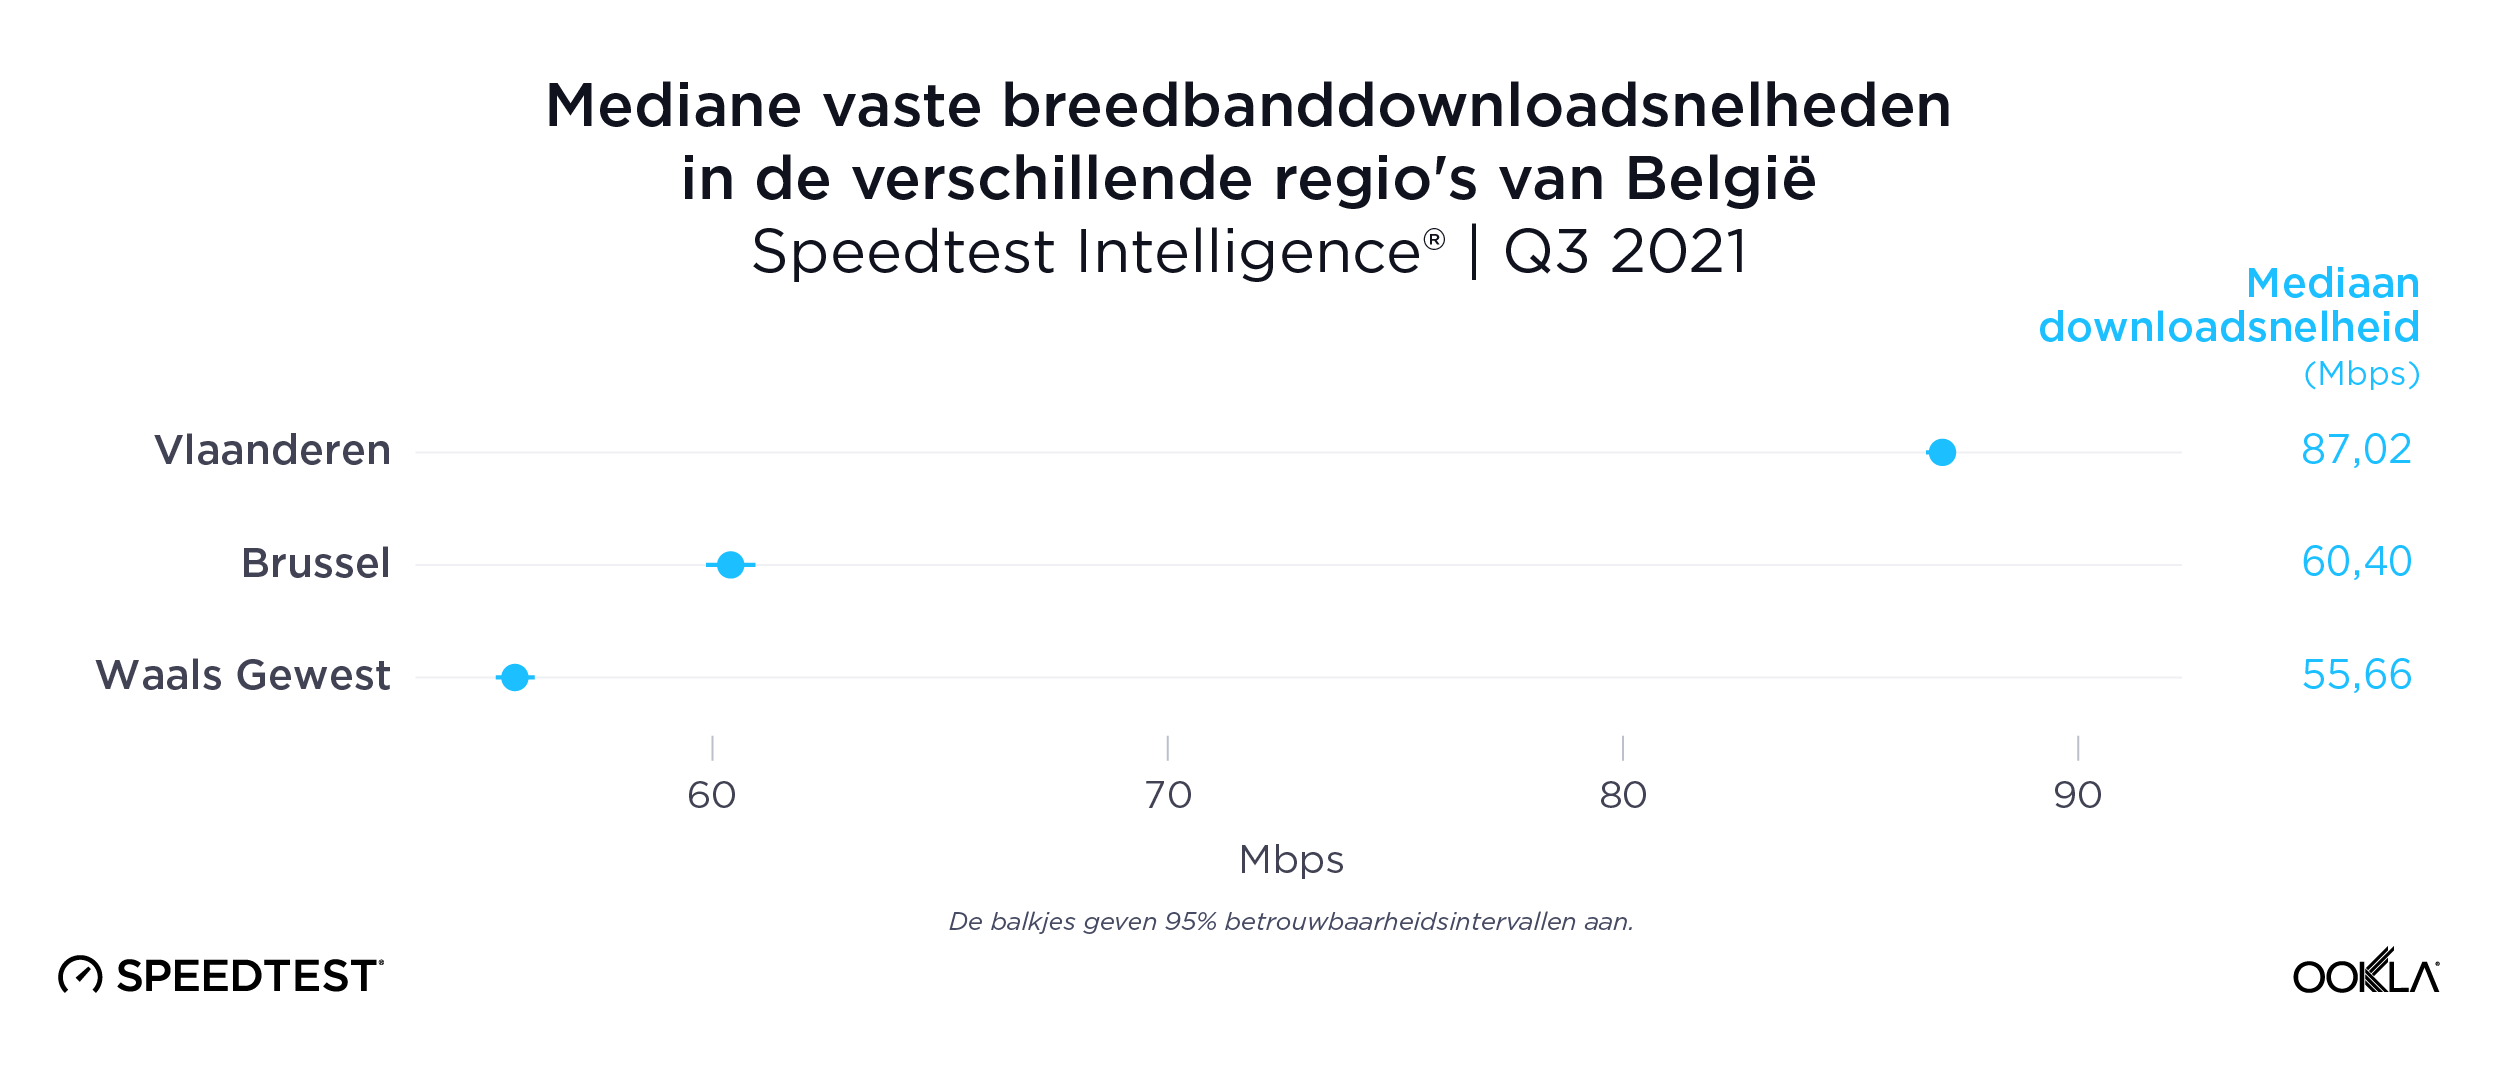
There was a wide divide between Flanders and the Walloon region on fixed broadband

Speedtest Intelligence data revealed the digital divide among Belgium’s regions was even more distant on fixed broadband during Q3 2021. Flanders had a median fixed broadband download speed at 87.02 Mbps to the Walloon’s 55.66 Mbps. The Capital Region of Brussels was again in the middle at 60.40 Mbps.
Limburg was fastest province for fixed broadband
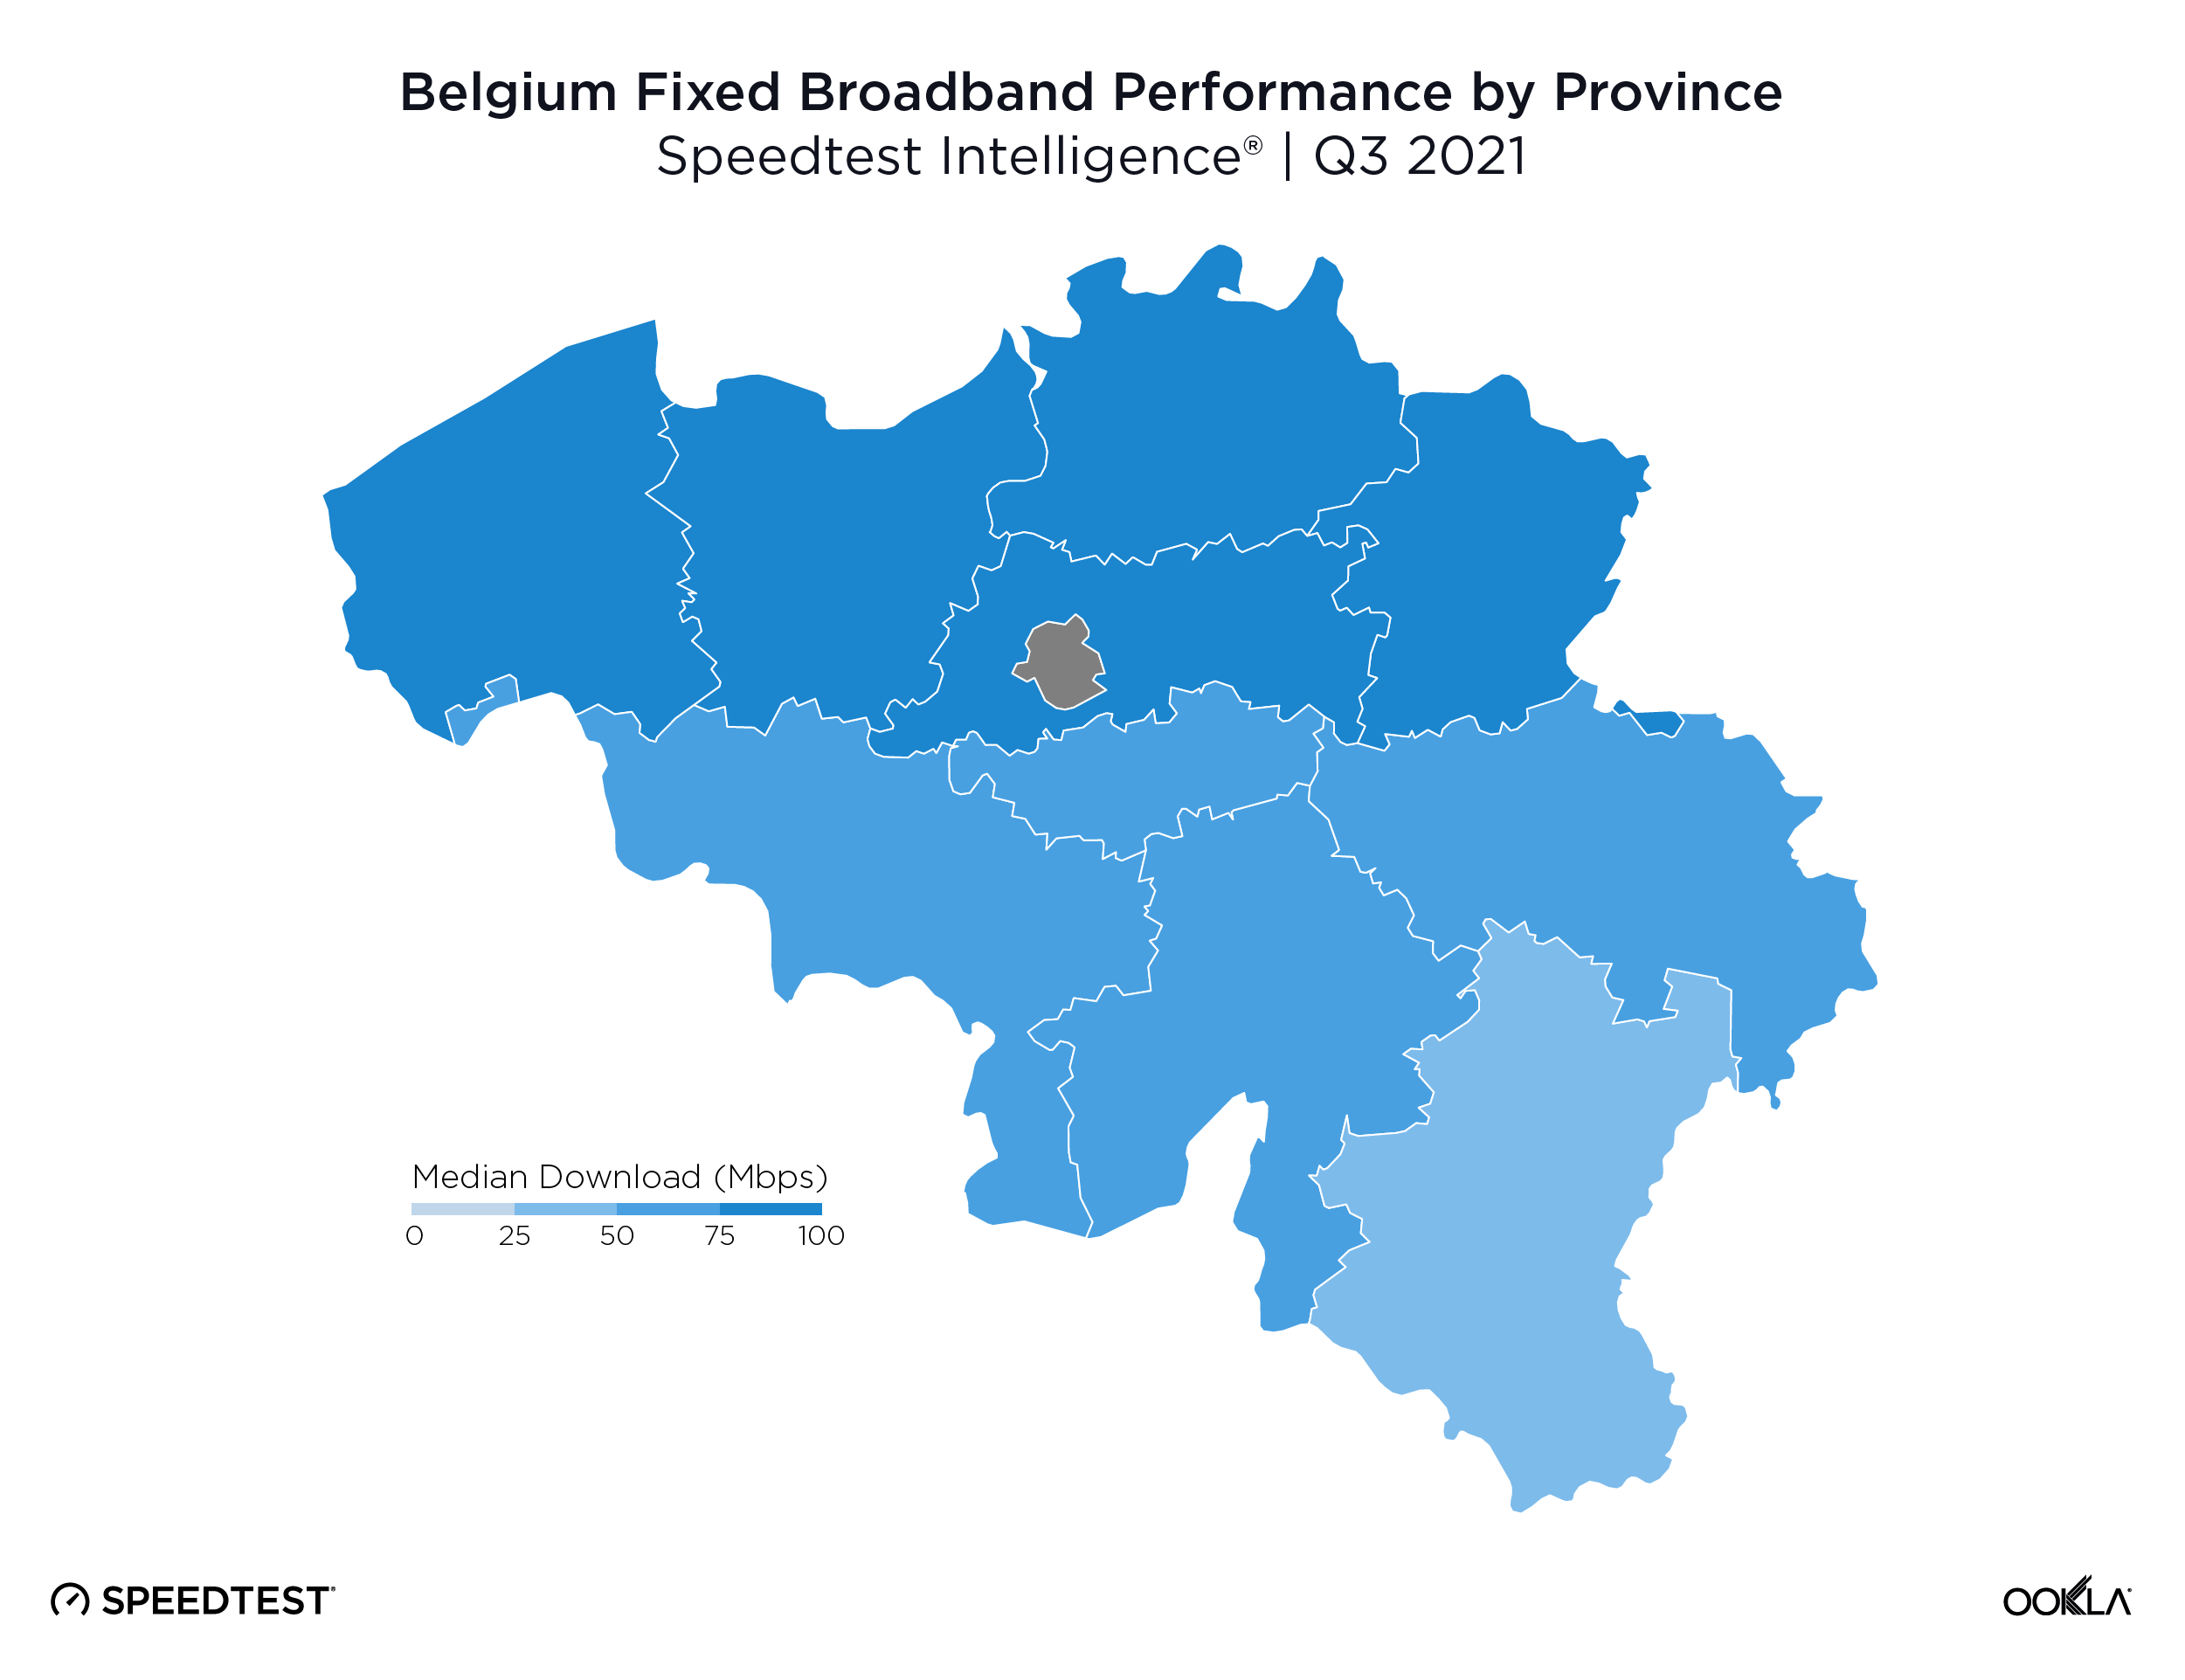
Limburg had the fastest median download speed over fixed broadband at 90.07 Mbps, followed by East Flanders (86.68 Mbps), West Flanders (86.45 Mbps), Antwerp (85.23 Mbps) and Flemish Brabant (84.50 Mbps). There was no fastest province in Wallonia, though Walloon Brabant and the Province of Namur had the fastest median download speeds at 60.15 Mbps and 58.90, respectively.
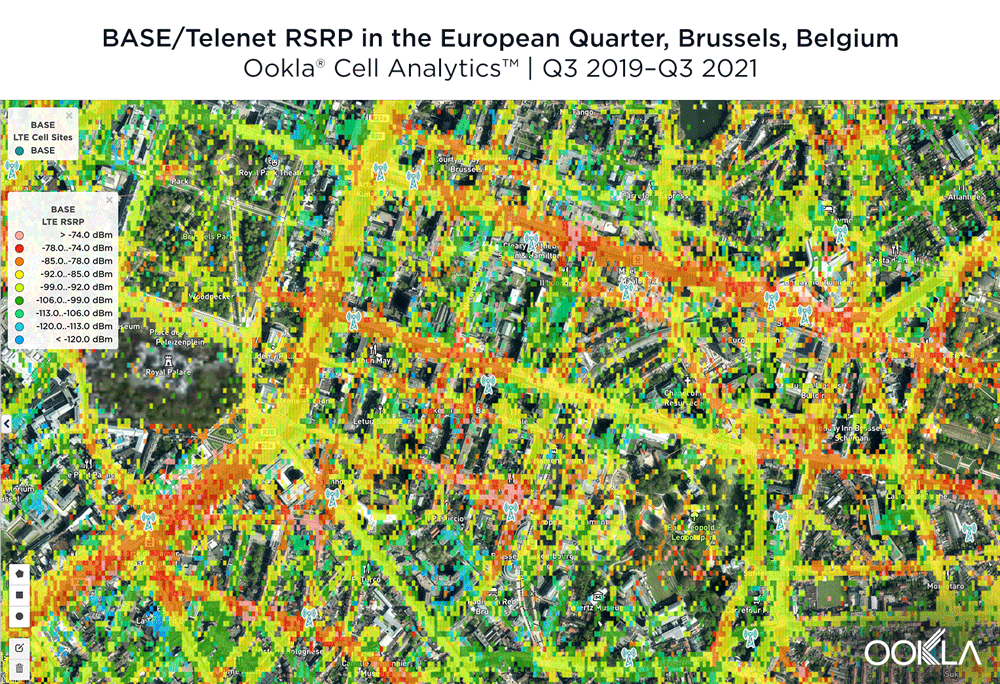
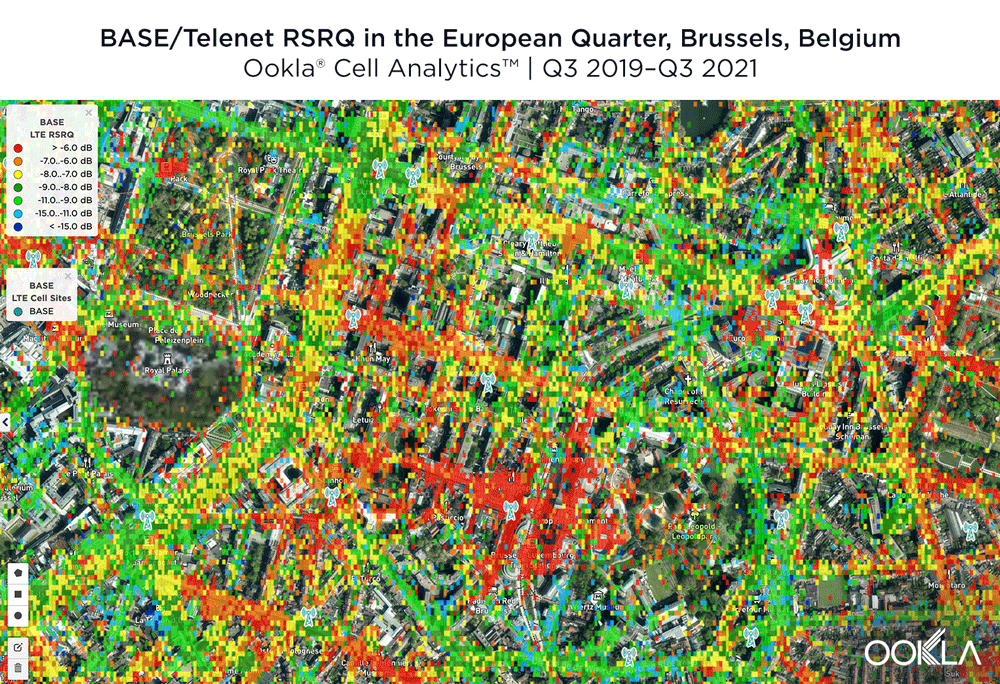
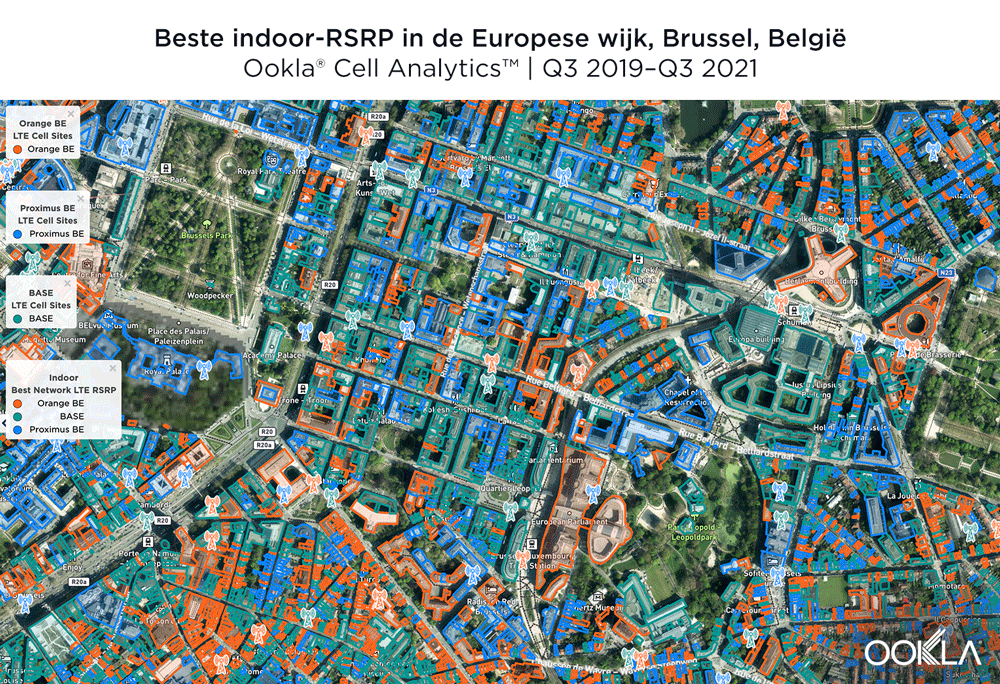
4G LTE Signal Level and Quality varied by provider near the European Quarter in Brussels
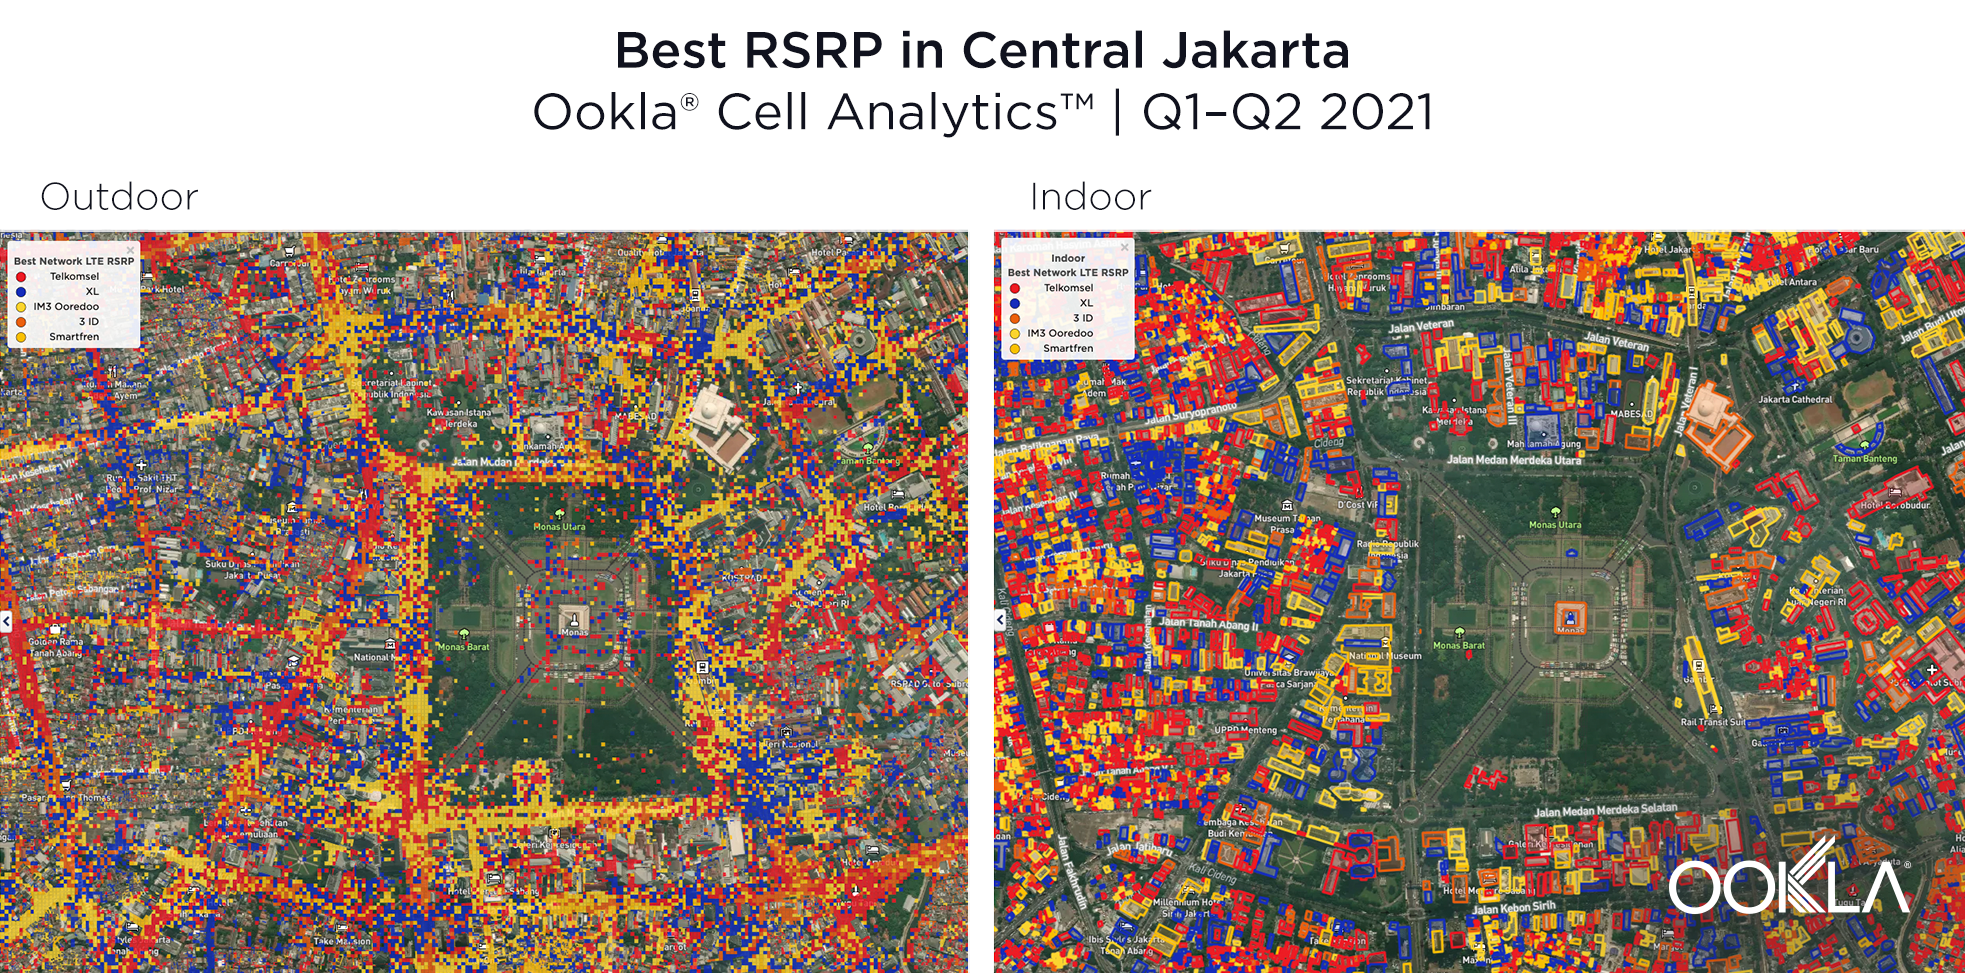
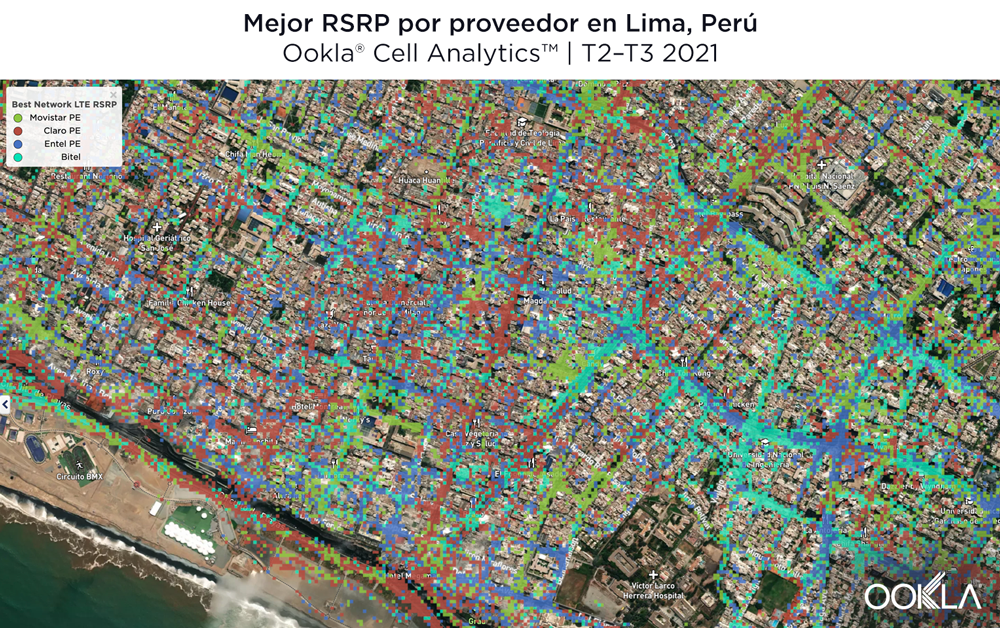
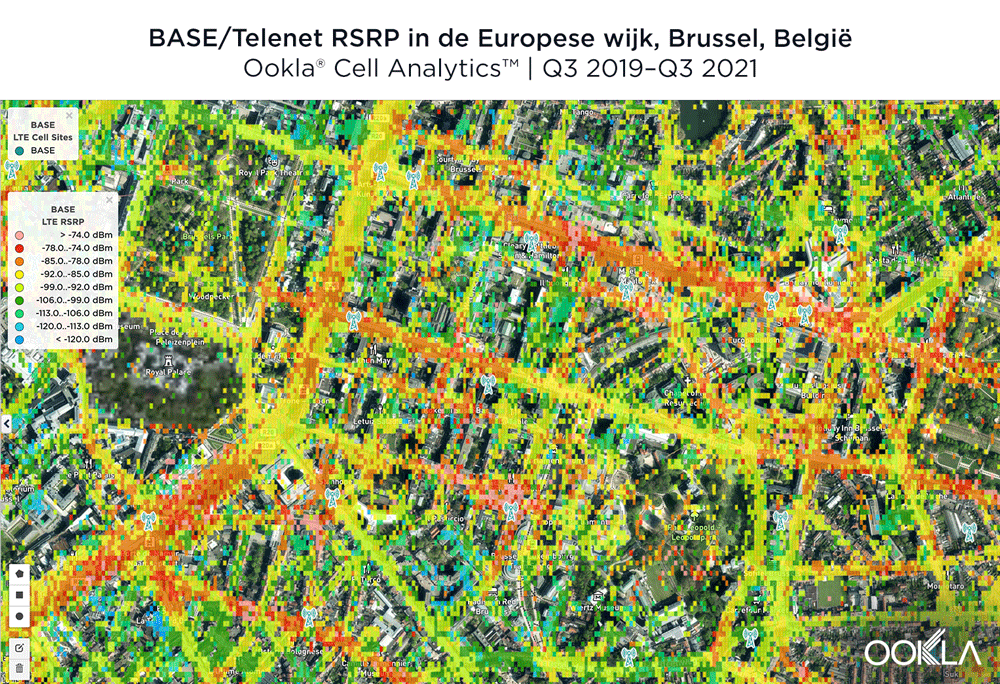
We examined mobile performance in the European Quarter in Brussels using Cell Analytics data from the past 24 months. Each of these maps shows the strongest 4G Signal Level (RSRP) and Signal Quality (RSRQ) signals in this key area, which can assist mobile operators in improving their networks. Cell Analytics identifies the strongest RSRP and RSRQ by mobile network operator for a given area or building when there is a statistically significant winner and color codes that plot bin to the provider’s corresponding color. RSRP provider-level maps show the strength of a signal from individual providers for a given area, with pink and red showing a strong signal and blue indicating a weak signal. Since users can experience poor quality even with a strong signal level, resulting in audio interruptions or slow data speeds, RSRQ provider-level maps show the quality of an operator’s signal for a given area, with red showing a high-quality signal and blue indicating a lower-quality signal. We’ve also included the approximate locations of cell towers in the area.
Tight competition for best 4G LTE RSRP in Brussels
The image below shows where a provider had the strongest 4G LTE RSRP signal strength during the past 24 months. As you can see, BASE/Telenet had a strong presence in the center of the map, achieving the highest RSRP in our polygon area. Proximus and Orange had strong signals around the edges of the map, and Orange had the strongest RSRP in some of the key EU institutions, including the European Commission headquarters and the European Parliament.
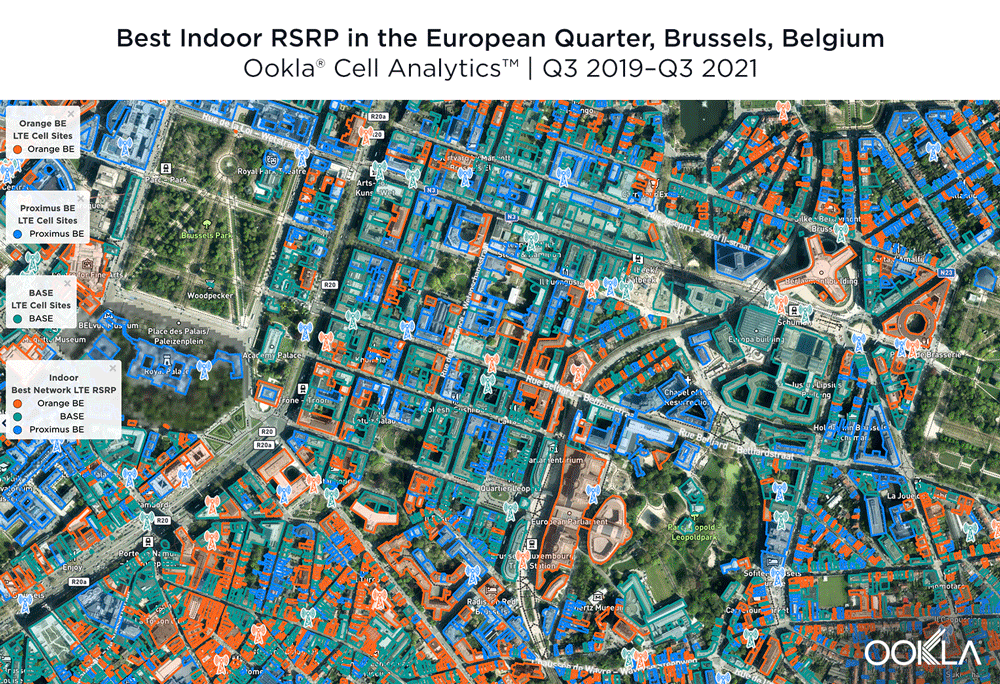
The maps below show where each top provider has high and low signal strength data in the European Quarter. BASE/Telenet showed very strong RSRP near the center of the map, particularly around the major EU buildings, Rue de la Loi and near Av. Marnix, though there were a few weaker areas just southwest of the European Parliament building. Orange showed areas of strong localized RSRP through the map, particularly in the southwest, with a weaker RSRP in blue in the northwest and in the center of the map. Proximus had some areas of strength along Rue de la Loi, and near the core of the European Quarter, though had weaker signals throughout.
BASE/Telenet had the best RSRQ in Brussels’ European Quarter
According to Cell Analytics, BASE/Telenet had the highest RSRQ in the polygon area of the European Quarter we surveyed. The maps below show where each provider had the best RSRQ over the past 24 months, for both indoor and outdoor areas. The image below shows BASE/Telenet had areas near the center of the map of the best RSRQ, while Orange had the best RSRQ near the south of the map — particularly on Av. de la Couronne — and the outskirts of the map toward the east. Proximus had the best RSRQ in some areas of the European Quarter, particularly in the northwest around the Royal Palace of Brussels and Parc Léopold. Indoor RSRQ showed a similar story, with strong competition throughout the map, though Orange showed a stronger showing in the southwest of the map, as well as in some key EU buildings.

The maps below show where each top provider had high and low quality RSRQ signal strength. BASE/Telenet showed very strong areas near the center of the map, particularly around the European Parliament, Square Frère-Orban Park and Parc du Cinquantenaire, though there were a few areas of lower quality just south of the European Parliament building. Orange showed areas of strong localized RSRQ, particularly in the near key EU buildings, though had lower RSRQ areas in blue in the northwest, center and southwest of the map. Proximus had a somewhat similar map to Orange, with areas of higher RSRQ in the east of the map and near the important EU buildings like the Council of the European Union, but generally had lower RSRQ throughout the center of the map, particularly along major throughways like Rue de la Loi.
Belgium has opportunities for fast 5G, but consumers won’t benefit until operators and regulators make 5G easier to implement
Belgium faces a challenging 5G outlook. The Secretary of State for the Brussels Region, Pascal Smet, has indicated a desire to make “Brussels the technology capital of Europe” and a recently commissioned report for the Belgian regulator estimates 5G’s impact on Belgian society as delivering an additional EUR 4-6 billion to GDP annually by 2030, and a further 40,000-80,000 new jobs. However, the auction of key 5G bands has been repeatedly delayed, and as they stand, strict non-ionizing radiation (NIR) limits will ultimately limit the scale of 5G deployment in the market.
Belgium’s plans for a multi-band spectrum auction — including new frequencies for 5G and the renewal of existing licenses — have been on hold for years as a result of disagreements between regional and federal governments, particularly over how the proceeds should be distributed. The country lags behind many of its regional peers in terms of 5G deployment and adoption, and the continued delay led the Belgian regulator, the Belgian Institute for Postal Services and Telecommunications (BIPT) to grant temporary 5G licenses during 2020. Recent proposals, which include holding the proceeds in escrow until agreement can be reached, appear to have broken the deadlock, and the auction is now expected to take place in Q2 2022.
Belgium also has to contend with some very stringent NIR limits, particularly in the Brussels region, which will serve to limit 5G deployment. The Regional Government adopted a “5G roadmap” in mid-July 2021 and is organizing working groups to draft a city-wide rollout plan, and make legislative changes. It has already moved to more than double the NIR limit, but despite this it remains lower than other Belgian regions — still well below EU proposals.
Under the draft legislation of the auction, operators would be required to cover 70% of the Belgian population with 5G within one year, increasing to 99.5% after two years. BIPT also plans to set aside spectrum for a potential fourth mobile network operator, as it seeks to reduce prices in the market. However, a consultation it commissioned in early 2021 on the impact of 5G and a fourth mobile network operator estimated that the entry of a new player would have a negligible impact on employment and investment and an uncertain impact on revenues (+/- 5%, versus flat). As a result, the amount of spectrum reserved for a new entrant has been reduced, to allow B2B operators to bid for some of the remaining frequencies. Proximus, which launched its 5G network during Q3 2020, saw median 5G download and upload speeds at 201.59 Mbps and 20.33 Mbps, respectively, during Q3 2021. With Orange and Telenet making huge investments to expand their 5G network within Belgium — and Telenet launching commercial 5G this week, we’re excited to see what the future holds.
Belgium has the opportunity to improve mobile and fixed broadband speeds for consumers, and we’ll be watching closely to see what happens in the future with our Global Index Market Analyses. Learn more about Ookla Speedtest Intelligence or Cell Analytics by inquiring here.
België loopt achter op EU-collega’s en wordt geconfronteerd met uitdagingen inzake 5G-regelgeving
België vormt een belangrijke hoeksteen van de Europese gemeenschap en is de thuisbasis van de Raad van de Europese Unie, de Europese Commissie, het Europees Parlement en de Europese Raad. België loopt echter achter op zijn regionale partners wat de ondersteuning van 5G-mededinging betreft, met slechts één 5G-provider gedurende het grootste deel van 2021. In dit artikel maakten we gebruik van Ookla® Speedtest Intelligence® com de prestaties van vast en mobiel internet in België te onderzoeken, alsook de regionale en provinciale prestaties tijdens het derde kwartaal van 2021. We hebben ook de Europese wijk in Brussel onderzocht met Ookla Cell Analytics™ om te bepalen welke mobiele operatoren het beste signaalniveau en de beste signaalkwaliteit hadden.
Nederland is koploper onder de regionale handelspartners van België voor snelste mobiel netwerk
Speedtest Intelligence toont aan dat Nederland de snelste mediane mobiele downloadsnelheid had van België’s dichtstbijzijnde regionale handelspartners met 84,59 Mbps tijdens Q3 2021. Zwitserland en Luxemburg volgden met respectievelijk 71,76 Mbps en 69,81 Mbps. Oostenrijk was de volgende met 49,98 Mbps, gevolgd door België met 48,88 Mbps.
Zwitserland en Spanje zetten de Europese standaard met vaste breedbandsnelheden van meer dan 100,00 Mbps
Volgens Speedtest Intelligence had Zwitserland de snelste mediane vaste breedbandsnelheid van België en zijn regionale handelspartners, namelijk 104,58 Mbps tijdens het derde kwartaal van 2021, waarmee het Spanje met zijn 101,10 Mbps voorbleef. Nederland en Luxemburg volgden met respectievelijk 92,20 Mbps en 89,27 Mbps. België’s mediane vaste breedband downloadsnelheid van 72,90 Mbps was net iets trager dan die van Frankrijk met 75,47 Mbps.
BASE, Telenet en Proximus overtroffen Orange voor mobiel
Het verschil tussen de snelste mobiele aanbieders van België was in het derde kwartaal van 2021 zeer klein: BASE (56,83 Mbps), Telenet (56,73 Mbps) en Proximus (53,58 Mbps) gingen aan kop. Orange was vierde met 39,09 Mbps. Er moet ook worden opgemerkt dat Telenet eigenaar is van het merk BASE.
Telenet had de snelste vaste breedbandsnelheid
Telenet had de snelste downloadsnelheid via vaste breedband met 124,89 Mbps. Dit was veel beter dan VOO, dat volgde met 94,63 Mbps. Orange was de volgende op de lijst met 82,20 Mbps, gevolgd door Proximus (43,45 Mbps) en Scarlet (35,34 Mbps).
Vlaanderen had hogere mobiele downloadsnelheden dan Brussel en het Waalse Gewest
Gegevens van Speedtest Intelligence brachten tijdens het derde kwartaal van 2021 een grote kloof aan het licht tussen de meer bevolkte noordelijke Vlaamse regio van België en de minder bevolkte zuidelijke Waalse regio wat mobiele prestaties betreft. Vlaanderen had een mediane mobiele downloadsnelheid van 54,57 Mbps tegenover 37,63 Mbps in Wallonië. Het Brussels Hoofdstedelijk Gewest zat opnieuw in het midden met mobiel op 49,90 Mbps. Deze digitale kloof breidde zich uit tot de gegevens op provincieniveau, waarbij bijna elke Vlaamse provincie hogere mediane downloadsnelheden haalde dan de Waalse provincies.
Vier Vlaamse provincies hadden mobiele downloadsnelheden van meer dan 50 Mbps

Er was geen statistisch snelste mobiele downloadsnelheid onder de Belgische provincies, hoewel Vlaams-Brabant (57,47 Mbps), Antwerpen (57,30 Mbps), West-Vlaanderen (54,95 Mbps) en Oost-Vlaanderen (52,19 Mbps) allemaal downloadsnelheden boven de 50,00 Mbps noteerden. De provincie Luxemburg (28,40 Mbps) en de provincie Namen (28,71 Mbps) waren de enige Belgische provincies die een mediane mobiele downloadsnelheid van 30,00 Mbps niet haalden.
Er was een grote kloof tussen Vlaanderen en Wallonië wat vaste breedband betreft
Uit gegevens van Speedtest Intelligence blijkt dat de digitale kloof tussen de Belgische regio’s in het derde kwartaal van 2021 nog groter was op het gebied van vaste breedband. Vlaanderen had een mediane vaste breedband downloadsnelheid van 87,02 Mbps tegenover 55,66 Mbps in Wallonië. Het Brussels Hoofdstedelijk Gewest zat opnieuw in het midden met 60,40 Mbps.
Limburg was snelste provincie voor vaste breedband

Limburg had de snelste mediane downloadsnelheid via vaste breedband met 90,07 Mbps, gevolgd door Oost-Vlaanderen (86,68 Mbps), West-Vlaanderen (86,45 Mbps), Antwerpen (85,23 Mbps) en Vlaams-Brabant (84,50 Mbps). Er was geen snelste provincie in Wallonië, hoewel Waals-Brabant en de provincie Namen de snelste mediane downloadsnelheden hadden met respectievelijk 60,15 Mbps en 58,90 Mbps.
4G LTE-signaalniveau en -kwaliteit per aanbieder in de buurt van de Europese wijk in Brussel
We onderzochten de mobiele prestaties in de Europese wijk in Brussel met behulp van Cell Analytics-gegevens van de afgelopen 24 maanden. Elk van deze kaarten toont het sterkste 4G-signaalniveau (RSRP) en de signaalkwaliteit (RSRQ) in dit belangrijke gebied, wat mobiele operatoren kan helpen bij het verbeteren van hun netwerken. Cell Analytics identificeert de sterkste RSRP en RSRQ per mobiele-netwerkexploitant voor een bepaald gebied of gebouw wanneer er een statistisch significante winnaar is en kleurt die plotbin de overeenkomstige kleur van de aanbieder. De kaarten op RSRP-aanbiederniveau tonen de sterkte van een signaal van individuele aanbieders voor een bepaald gebied, waarbij roze en rood een sterk signaal aangeven en blauw een zwak signaal. Aangezien gebruikers zelfs met een sterk signaal een slechte kwaliteit kunnen ervaren, met onderbrekingen van het geluid of trage datasnelheden tot gevolg, geven kaarten op aanbiederniveau van RSRQ de kwaliteit van het signaal van een operator voor een bepaald gebied aan, waarbij rood staat voor een signaal van hoge kwaliteit en blauw voor een signaal van lagere kwaliteit. We hebben ook de locaties van gsm-masten in het gebied bij benadering opgenomen.
Scherpe concurrentie voor beste 4G LTE RSRP in Brussel
De onderstaande afbeelding toont waar een aanbieder de afgelopen 24 maanden de sterkste 4G LTE RSRP-signaalsterkte had. Zoals u kunt zien, was BASE/Telenet sterk aanwezig in het midden van de kaart, met de hoogste RSRP in ons polygoongebied. Proximus en Orange hadden sterke signalen rond de randen van de kaart, en Orange had de sterkste RSRP in enkele van de belangrijkste EU-instellingen, waaronder het hoofdkwartier van de Europese Commissie en het Europees Parlement.
De onderstaande kaarten laten zien waar elke topaanbieder een hoge en een lage signaalsterkte heeft in de Europese wijk. BASE/Telenet liet zeer sterke RSRP zien in het centrum van de kaart, met name rond de grote EU-gebouwen, de Wetstraat en bij de Marnixlaan, hoewel er een paar zwakkere gebieden waren net ten zuidwesten van het gebouw van het Europees Parlement. Orange toonde gebieden van sterke gelokaliseerde RSRP door de kaart, vooral in het zuidwesten, met een zwakkere RSRP in blauw in het noordwesten en in het centrum van de kaart. Proximus had enkele sterke zones in de Wetstraat en in het hart van de Europese wijk, maar had overal zwakkere signalen.
BASE/Telenet had de beste RSRQ in de Brusselse Europese Wijk
Volgens Cell Analytics had BASE/Telenet de hoogste RSRQ in het door ons onderzochte polygoongebied van de Europese Wijk. De onderstaande kaarten laten zien waar elke aanbieder de afgelopen 24 maanden de beste RSRQ had, zowel voor binnen- als buitengebieden. De afbeelding hieronder toont dat BASE/Telenet gebieden in het centrum van de kaart had met de beste RSRQ, terwijl Orange de beste RSRQ had in het zuiden van de kaart – met name op Kroonlaan – en aan de rand van de kaart in oostelijke richting. Proximus had het beste RSRQ in sommige delen van de Europese wijk, met name in het noordwesten rond het Koninklijk Paleis van Brussel en het Leopoldpark. Indoor RSRQ kende een gelijkaardig verhaal, met een sterke concurrentie op de hele kaart, hoewel Orange sterker was in het zuidwesten van de kaart, alsook in enkele belangrijke EU-gebouwen.
De onderstaande kaarten laten zien waar elke topaanbieder een hoge en een lage kwaliteit van het RSRQ-signaal had. BASE/Telenet liet zeer sterke gebieden zien in het centrum van de kaart, met name rond het Europees Parlement, het Square Frère-Orban Park en het Jubelpark, hoewel er een paar gebieden van mindere kwaliteit waren net ten zuiden van het gebouw van het Europees Parlement. Orange vertoonde gebieden met een sterke gelokaliseerde RSRQ, vooral in de buurt van belangrijke EU-gebouwen, maar had lagere RSRQ-gebieden in blauw in het noordwesten, midden en zuidwesten van de kaart. Proximus had een kaart die enigszins vergelijkbaar was met die van Orange, met gebieden met een hoger RSRQ in het oosten van de kaart en in de buurt van belangrijke EU-gebouwen zoals de Raad van de Europese Unie, maar met over het algemeen een lager RSRQ in het hele centrum van de kaart, met name langs belangrijke doorgangswegen zoals de Wetstraat.

België heeft kansen voor snelle 5G, maar consumenten zullen er niet van profiteren zolang operatoren en regulatoren 5G niet gemakkelijker om te implementeren maken
België staat voor moeilijke vooruitzichten wat 5G betreft. De staatssecretaris voor het Brussels Gewest, Pascal Smet, heeft de wens geuit om van "Brussel de technologiehoofdstad van Europa" te maken en in een onlangs in opdracht van de Belgische regelgever opgesteld rapport wordt de impact van 5G op de Belgische samenleving geraamd op een extra 4 à 6 miljard euro per jaar voor het BBP tegen 2030, en op nog eens 40 à 80 duizend nieuwe banen. De veiling van belangrijke 5G-banden is echter herhaaldelijk uitgesteld en in de huidige vorm zullen strikte limieten voor niet-ioniserende straling (NIR) uiteindelijk de schaal van de invoering van 5G op de markt beperken.
De Belgische plannen voor een multiband spectrumveiling – inclusief nieuwe frequenties voor 5G en de vernieuwing van bestaande licenties – liggen al jaren stil door onenigheid tussen de regionale en federale regeringen, met name over hoe de opbrengsten moeten worden verdeeld. Het land loopt achter op veel van zijn collega’s in de regio wat betreft de uitrol en de invoering van 5G, en de aanhoudende vertraging heeft de Belgische toezichthouder, het Belgisch Instituut voor Postdiensten en Telecommunicatie (BIPT), ertoe gebracht tijdelijke 5G-vergunningen te verlenen in de loop van 2020. Recente voorstellen, waaronder het in bewaring houden van de opbrengst totdat overeenstemming kan worden bereikt, lijken de impasse te hebben doorbroken, en de veiling zal nu naar verwachting in het tweede kwartaal van 2022 plaatsvinden.
België heeft ook te kampen met een aantal zeer strenge NIR-grenswaarden, met name in de Brusselse regio, die de uitrol van 5G zullen beperken. De regionale regering heeft medio juli 2021 een "5G-routekaart" goedgekeurd en organiseert werkgroepen om een plan voor de uitrol in de hele stad op te stellen en de wetgeving aan te passen. Ze is al overgegaan op meer dan het dubbele van de NIR-grens, maar desondanks blijft het lager dan andere Belgische regio’s – nog steeds ver onder de EU-voorstellen.
Volgens de ontwerpwetgeving van de veiling moeten de exploitanten binnen een jaar 70% van de Belgische bevolking met 5G bereiken, wat na twee jaar moet oplopen tot 99,5%. Het BIPT is ook van plan spectrum te reserveren voor een potentiële vierde mobiele netwerkoperator, omdat het de prijzen op de markt wil verlagen. In een consultatieronde die zij begin 2021 liet uitvoeren over de gevolgen van 5G en een vierde mobiele netwerkoperator werd echter geraamd dat de toetreding van een nieuwe speler een verwaarloosbaar effect zou hebben op de werkgelegenheid en de investeringen en een onzeker effect op de inkomsten (+/- 5%, tegenover vlak). Als gevolg daarvan is de hoeveelheid spectrum die voor een nieuwkomer is gereserveerd, verminderd om B2B-exploitanten in staat te stellen een bod uit te brengen op een deel van de resterende frequenties. Proximus, dat zijn 5G-netwerk lanceerde tijdens Q3 2020, zag mediane 5G-download- en -uploadsnelheden van respectievelijk 201,59 Mbps en 20,33 Mbps tijdens Q3 2021. Nu Orange en Telenet enorme investeringen doen om hun 5G-netwerk in België uit te breiden – en Telenet die deze week commerciële 5G lanceert, zijn we benieuwd naar wat de toekomst brengt.
België heeft de kans om de mobiele en vaste breedbandsnelheden voor consumenten te verbeteren, en wij zullen nauwlettend in de gaten houden wat er in de toekomst gebeurt met onze Global Index Market Analyses. Leer meer over Ookla Speedtest Intelligence of Cell Analytics door hier informeren.
La Belgique a du retard par rapport à ses pairs de l’UE et doit faire face à des défis réglementaires en matière de 5G
La Belgique représente un pilier important pour la communauté européenne et abrite le Conseil de l’Union européenne, la Commission européenne, le Parlement européen et le Conseil européen. Cependant, la Belgique a du retard vis-à-vis de ses partenaires régionaux en termes de promotion de la concurrence pour la 5G avec un seul fournisseur 5G pendant la majeure partie de 2021. Dans cet article, nous avons utilisé Ookla® Speedtest Intelligence® pour examiner les vitesses de performance de l’internet fixe et mobile en Belgique, les performances régionales et provinciales au cours du troisième trimestre 2021. Nous avons également examiné le quartier européen de Bruxelles en utilisant Ookla Cell Analytics™ pour déterminer quels opérateurs mobiles avaient le meilleur niveau et la meilleure qualité de réseau.
Les Pays-Bas sont en tête des partenaires commerciaux régionaux de la Belgique pour la téléphonie mobile la plus rapide
Speedtest Intelligence révèle que les Pays-Bas avaient la vitesse médiane de téléchargement mobile la plus rapide parmi les partenaires commerciaux régionaux les plus proches de la Belgique, à 84,59 Mbps au cours du troisième trimestre 2021. La Suisse et le Luxembourg suivaient avec respectivement. 71,76 Mbps et 69,81 Mbps. Vient ensuite l’Autriche, avec 49,98 Mbps, puis la Belgique, avec 48,88 Mbps.
La Suisse et l’Espagne établissent la norme européenne avec des vitesses de haut débit fixe supérieures à 100,00 Mbps!
Selon Speedtest Intelligence, la Suisse a enregistré la vitesse médiane la plus rapide en matière de haut débit fixe par rapport à la Belgique et ses partenaires commerciaux régionaux, soit 104,58 Mbps au troisième trimestre 2021, devant l’Espagne (101,10 Mbps). Les Pays-Bas et le Luxembourg suivent avec respectivement 92,20 Mbps et 89,27 Mbps. La vitesse médiane de téléchargement du haut débit fixe en Belgique, 72,90 Mbps, était juste inférieure à celle de la France, 75,47 Mbps.
BASE, Telenet et Proximus dépassent Orange pour le mobile
Le classement du fournisseur de téléphonie mobile le plus rapide de Belgique était très serré au cours du troisième trimestre 2021, avec BASE (56,83 Mbps), Telenet (56,73 Mbps) et Proximus (53,58 Mbps) en tête. Orange est quatrième avec 39,09 Mbps. Il faut également noter que Telenet est propriétaire de la marque BASE.
Telenet a le haut débit fixe le plus rapide

Telenet avait la vitesse de téléchargement la plus rapide sur le haut débit fixe, avec 124,89 Mbps. Ce chiffre dépasse de loin celui de VOO, qui suit avec 94,63 Mbps. Orange était le suivant sur la liste avec 82,20 Mbps, suivi de Proximus (43,45 Mbps) et Scarlet (35,34 Mbps).
Les vitesses de téléchargement mobile sont plus rapides en Flandre qu’à Bruxelles et en Wallonie
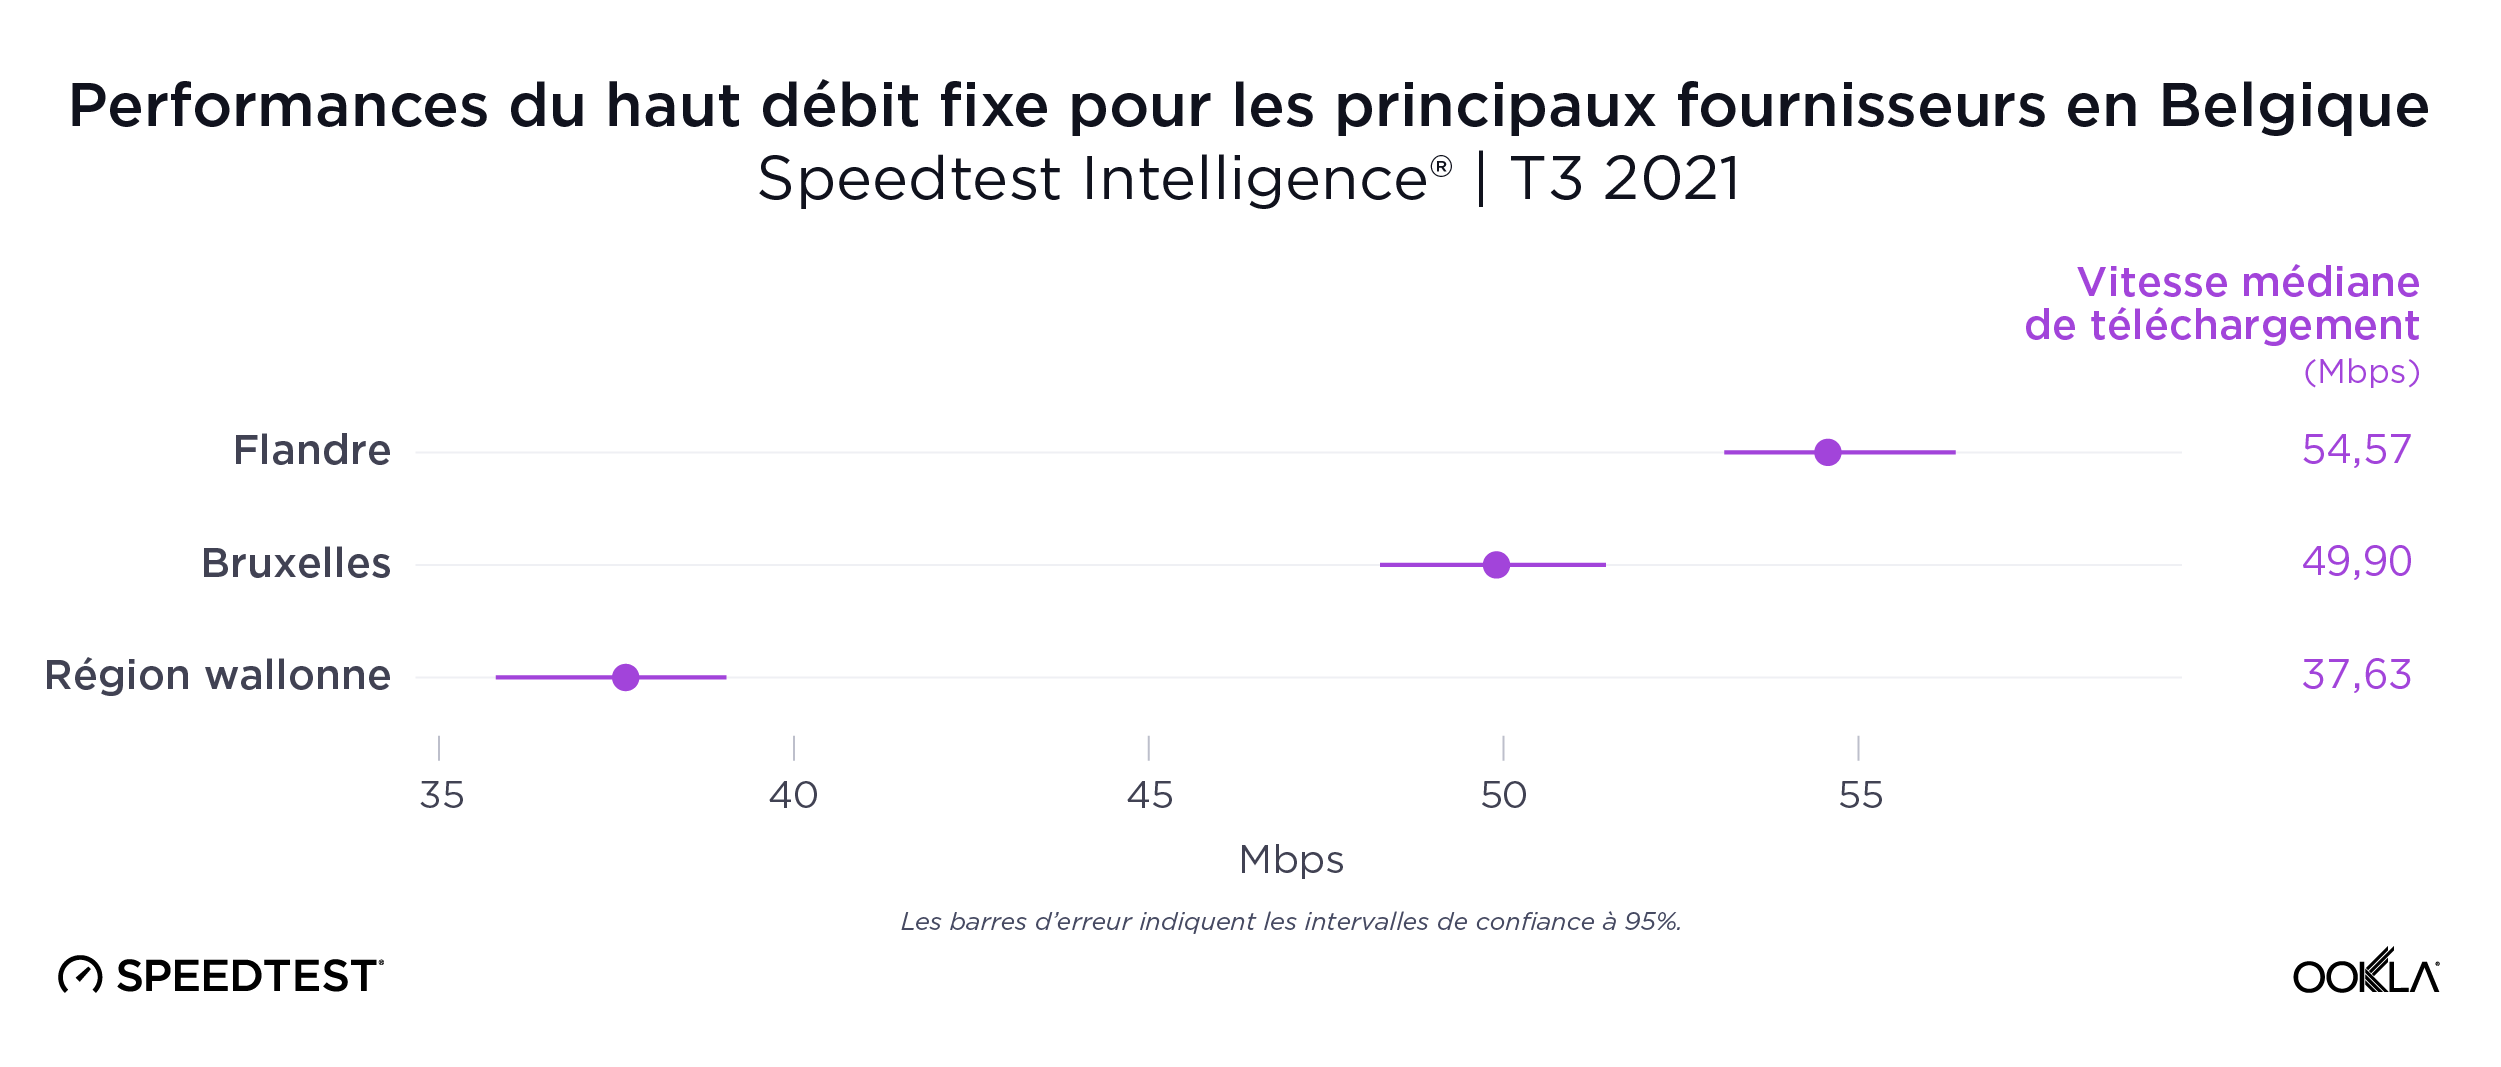
Les données de Speedtest Intelligence ont révélé un large fossé entre le nord de la région flamande, plus peuplée, et le sud de la région wallonne, moins peuplée, en matière de performances mobiles au cours du troisième trimestre 2021. La Flandre avait une vitesse de téléchargement mobile médiane de 54,57 Mbps, contre 37,63 Mbps pour la Wallonie. La région de Bruxelles-Capitale se situait au milieu du classement en matière de téléphonie mobile, avec 49,90 Mbps. Cette fracture numérique s’est étendue aux données au niveau des provinces. Presque toutes les provinces flamandes ont atteint des vitesses de téléchargement médianes plus rapides que les provinces wallonnes.
Quatre provinces flamandes affichent des vitesses de téléchargement mobile supérieures à 50 Mbps
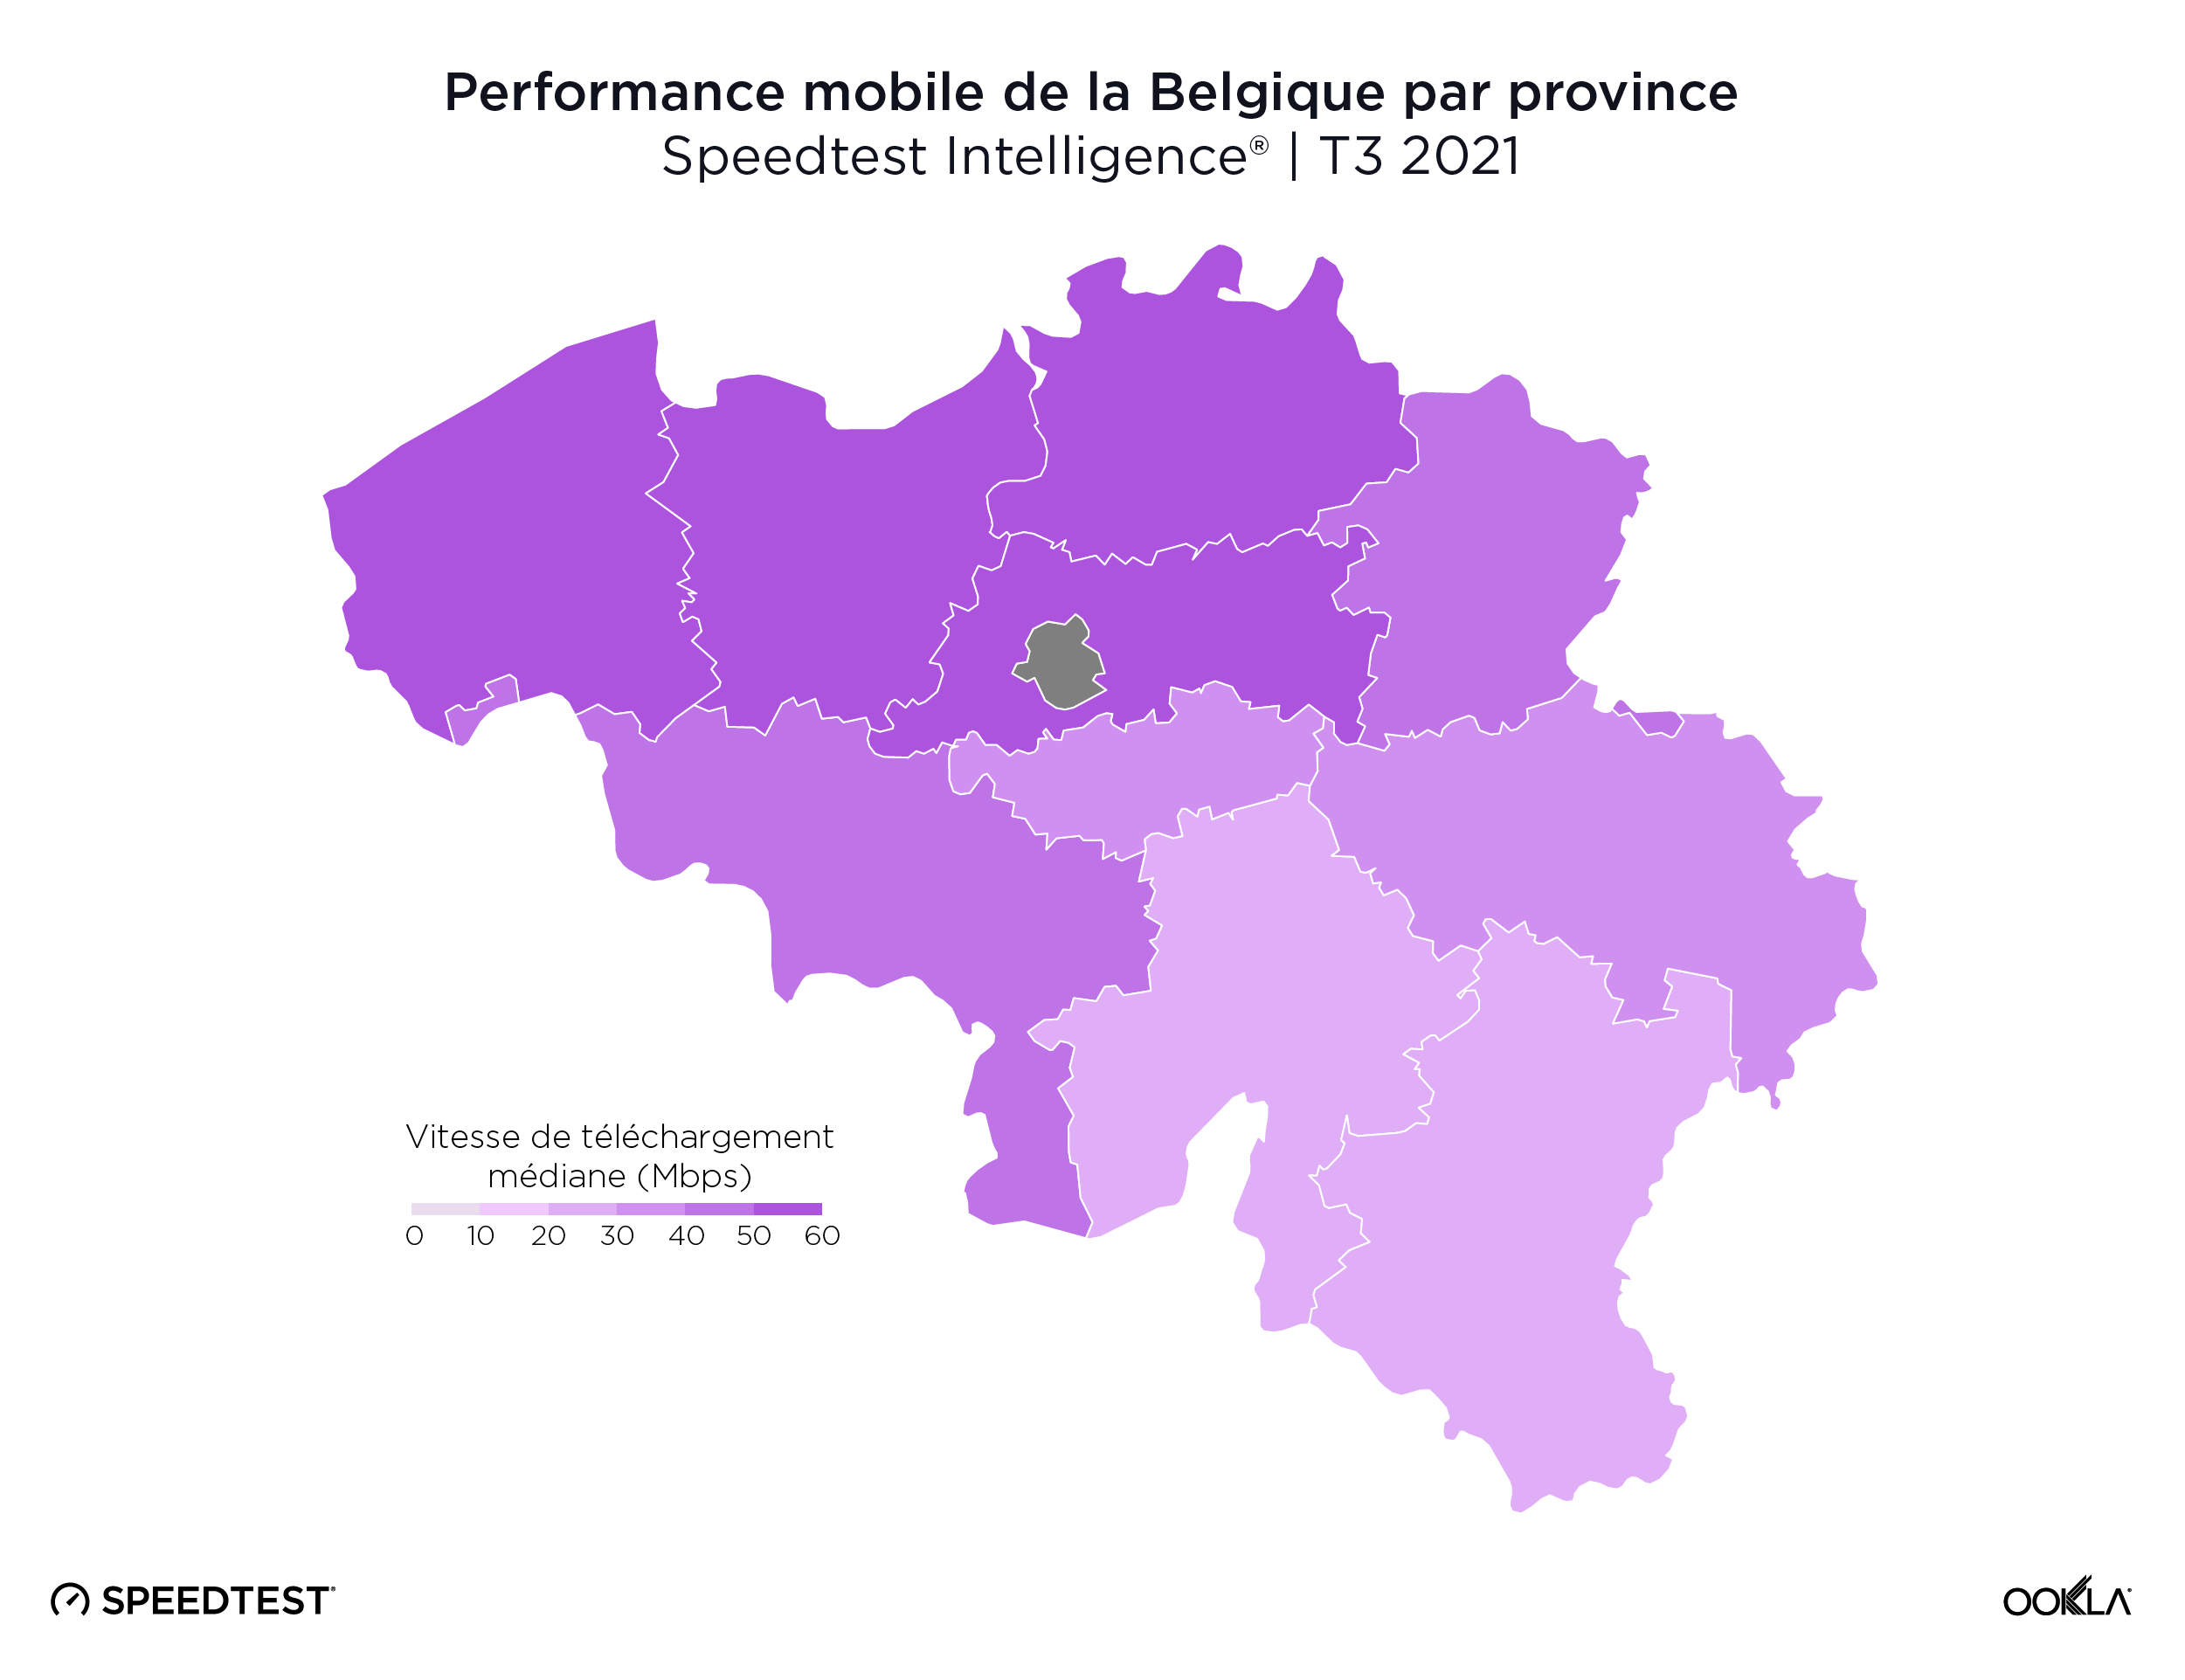
Il n’y a pas eu de vitesse de téléchargement mobile statistiquement la plus rapide parmi les provinces belges, bien que le Brabant flamand (57,47 Mbps), Anvers (57,30 Mbps), la Flandre occidentale (54,95 Mbps) et la Flandre orientale (52,19 Mbps) aient toutes atteint des vitesses de téléchargement supérieures à 50,00 Mbps. La province du Luxembourg (28,40 Mbps) et la province de Namur (28,71 Mbps) sont les seules provinces belges à ne pas avoir atteint une vitesse de téléchargement mobile médiane de 30,00 Mbps.
Un large fossé sépare la Flandre de la région wallonne en matière de haut débit fixe
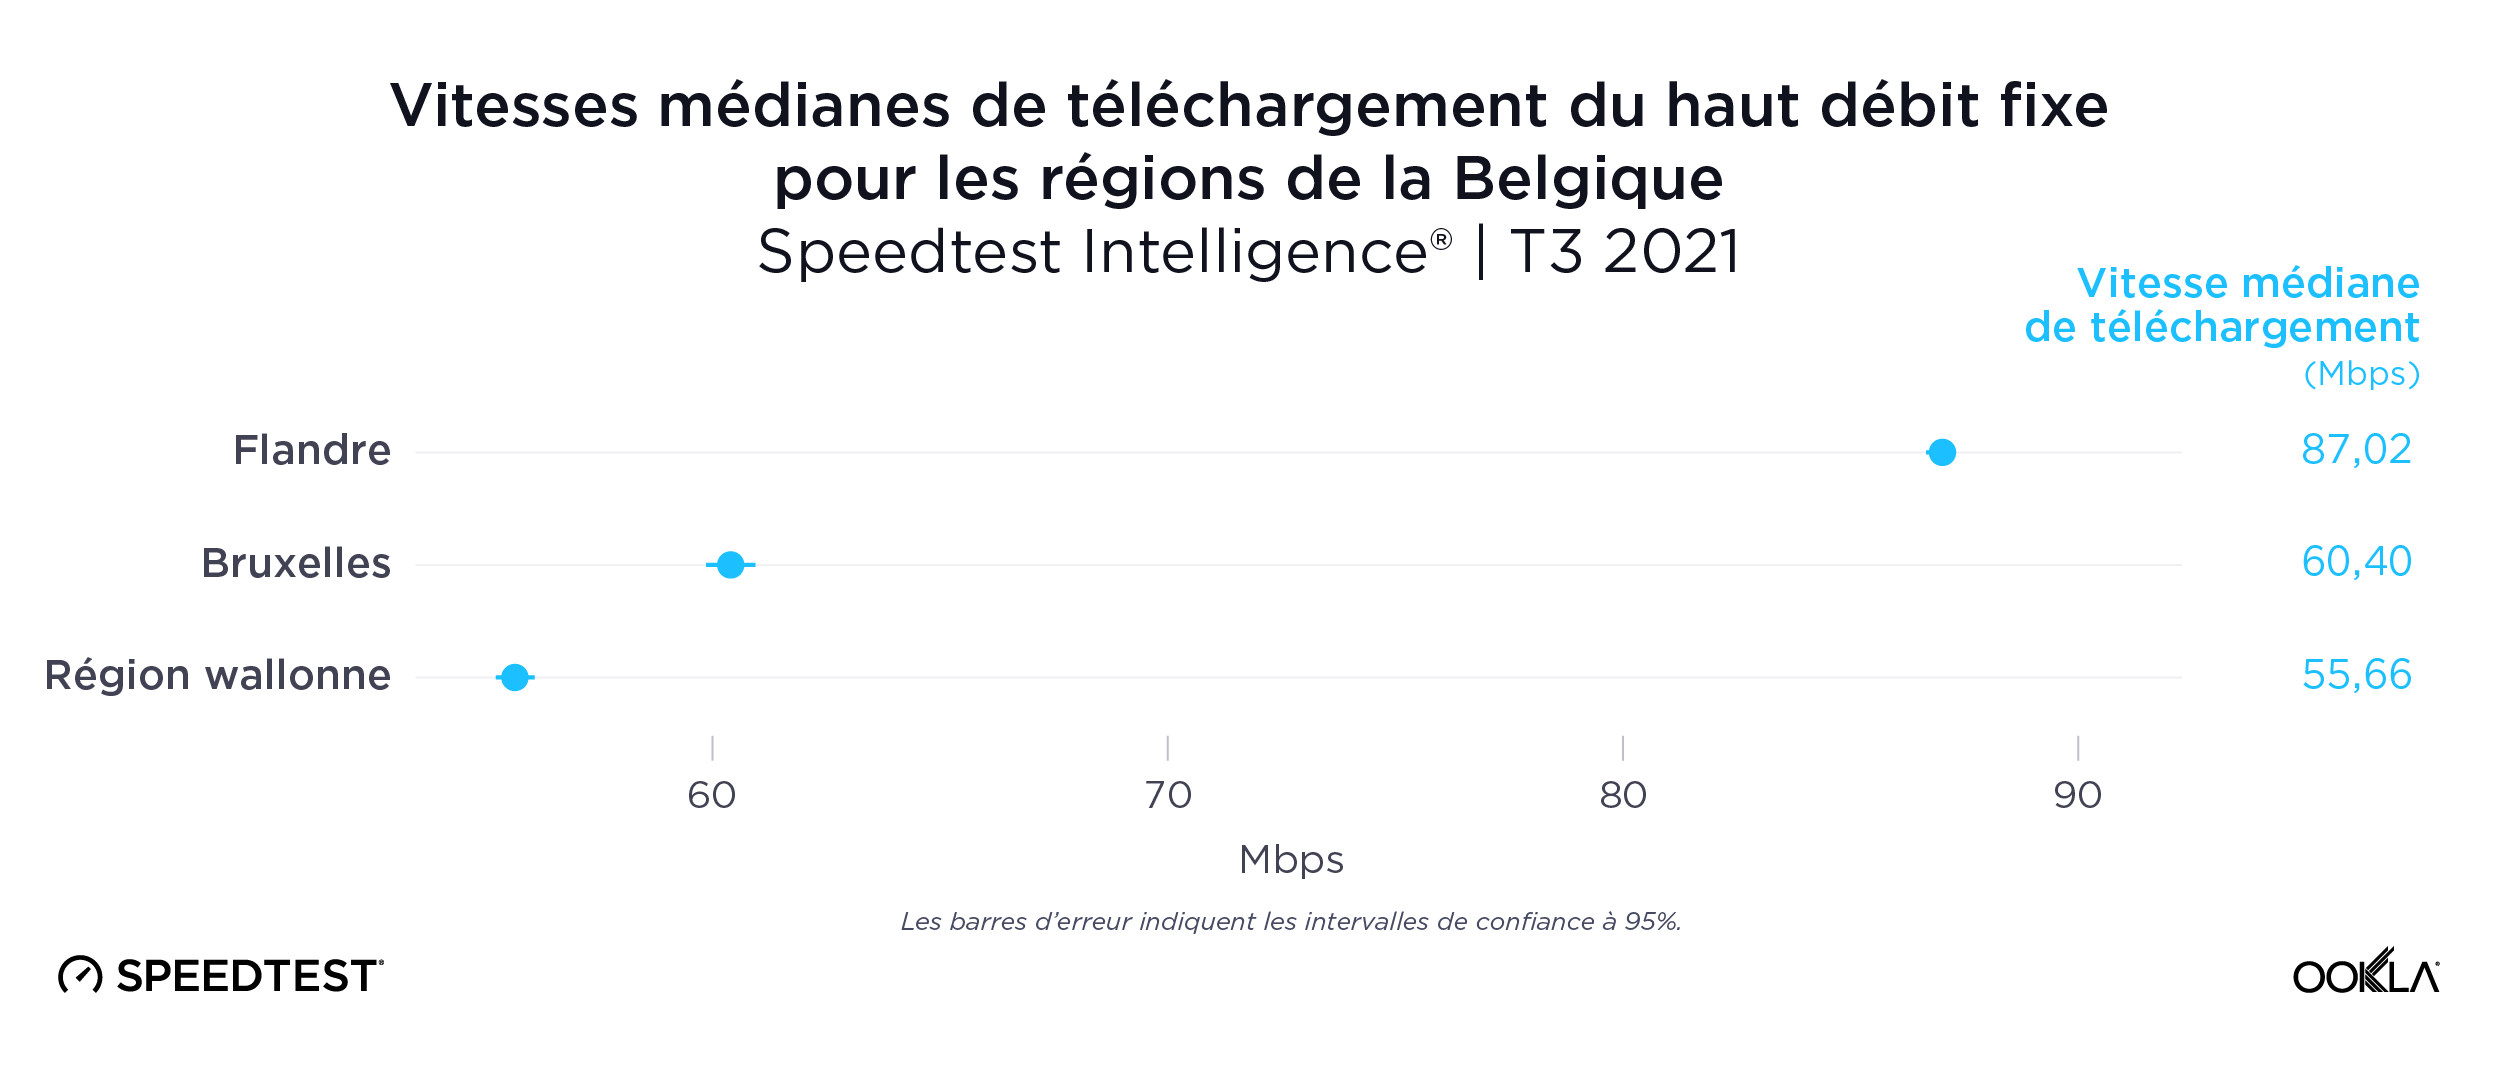
Les données de Speedtest Intelligence ont révélé que la fracture numérique entre les régions de Belgique était encore plus éloignée sur le haut débit fixe au cours du troisième trimestre 2021. La Flandre avait une vitesse médiane de téléchargement à large bande fixe de 87,02 Mbps contre 55,66 Mbps pour la Wallonie. La région de Bruxelles-Capitale se situait à nouveau dans la médiane avec 60,40 Mbps.
Le Limbourg est la province la plus rapide pour le haut débit fixe
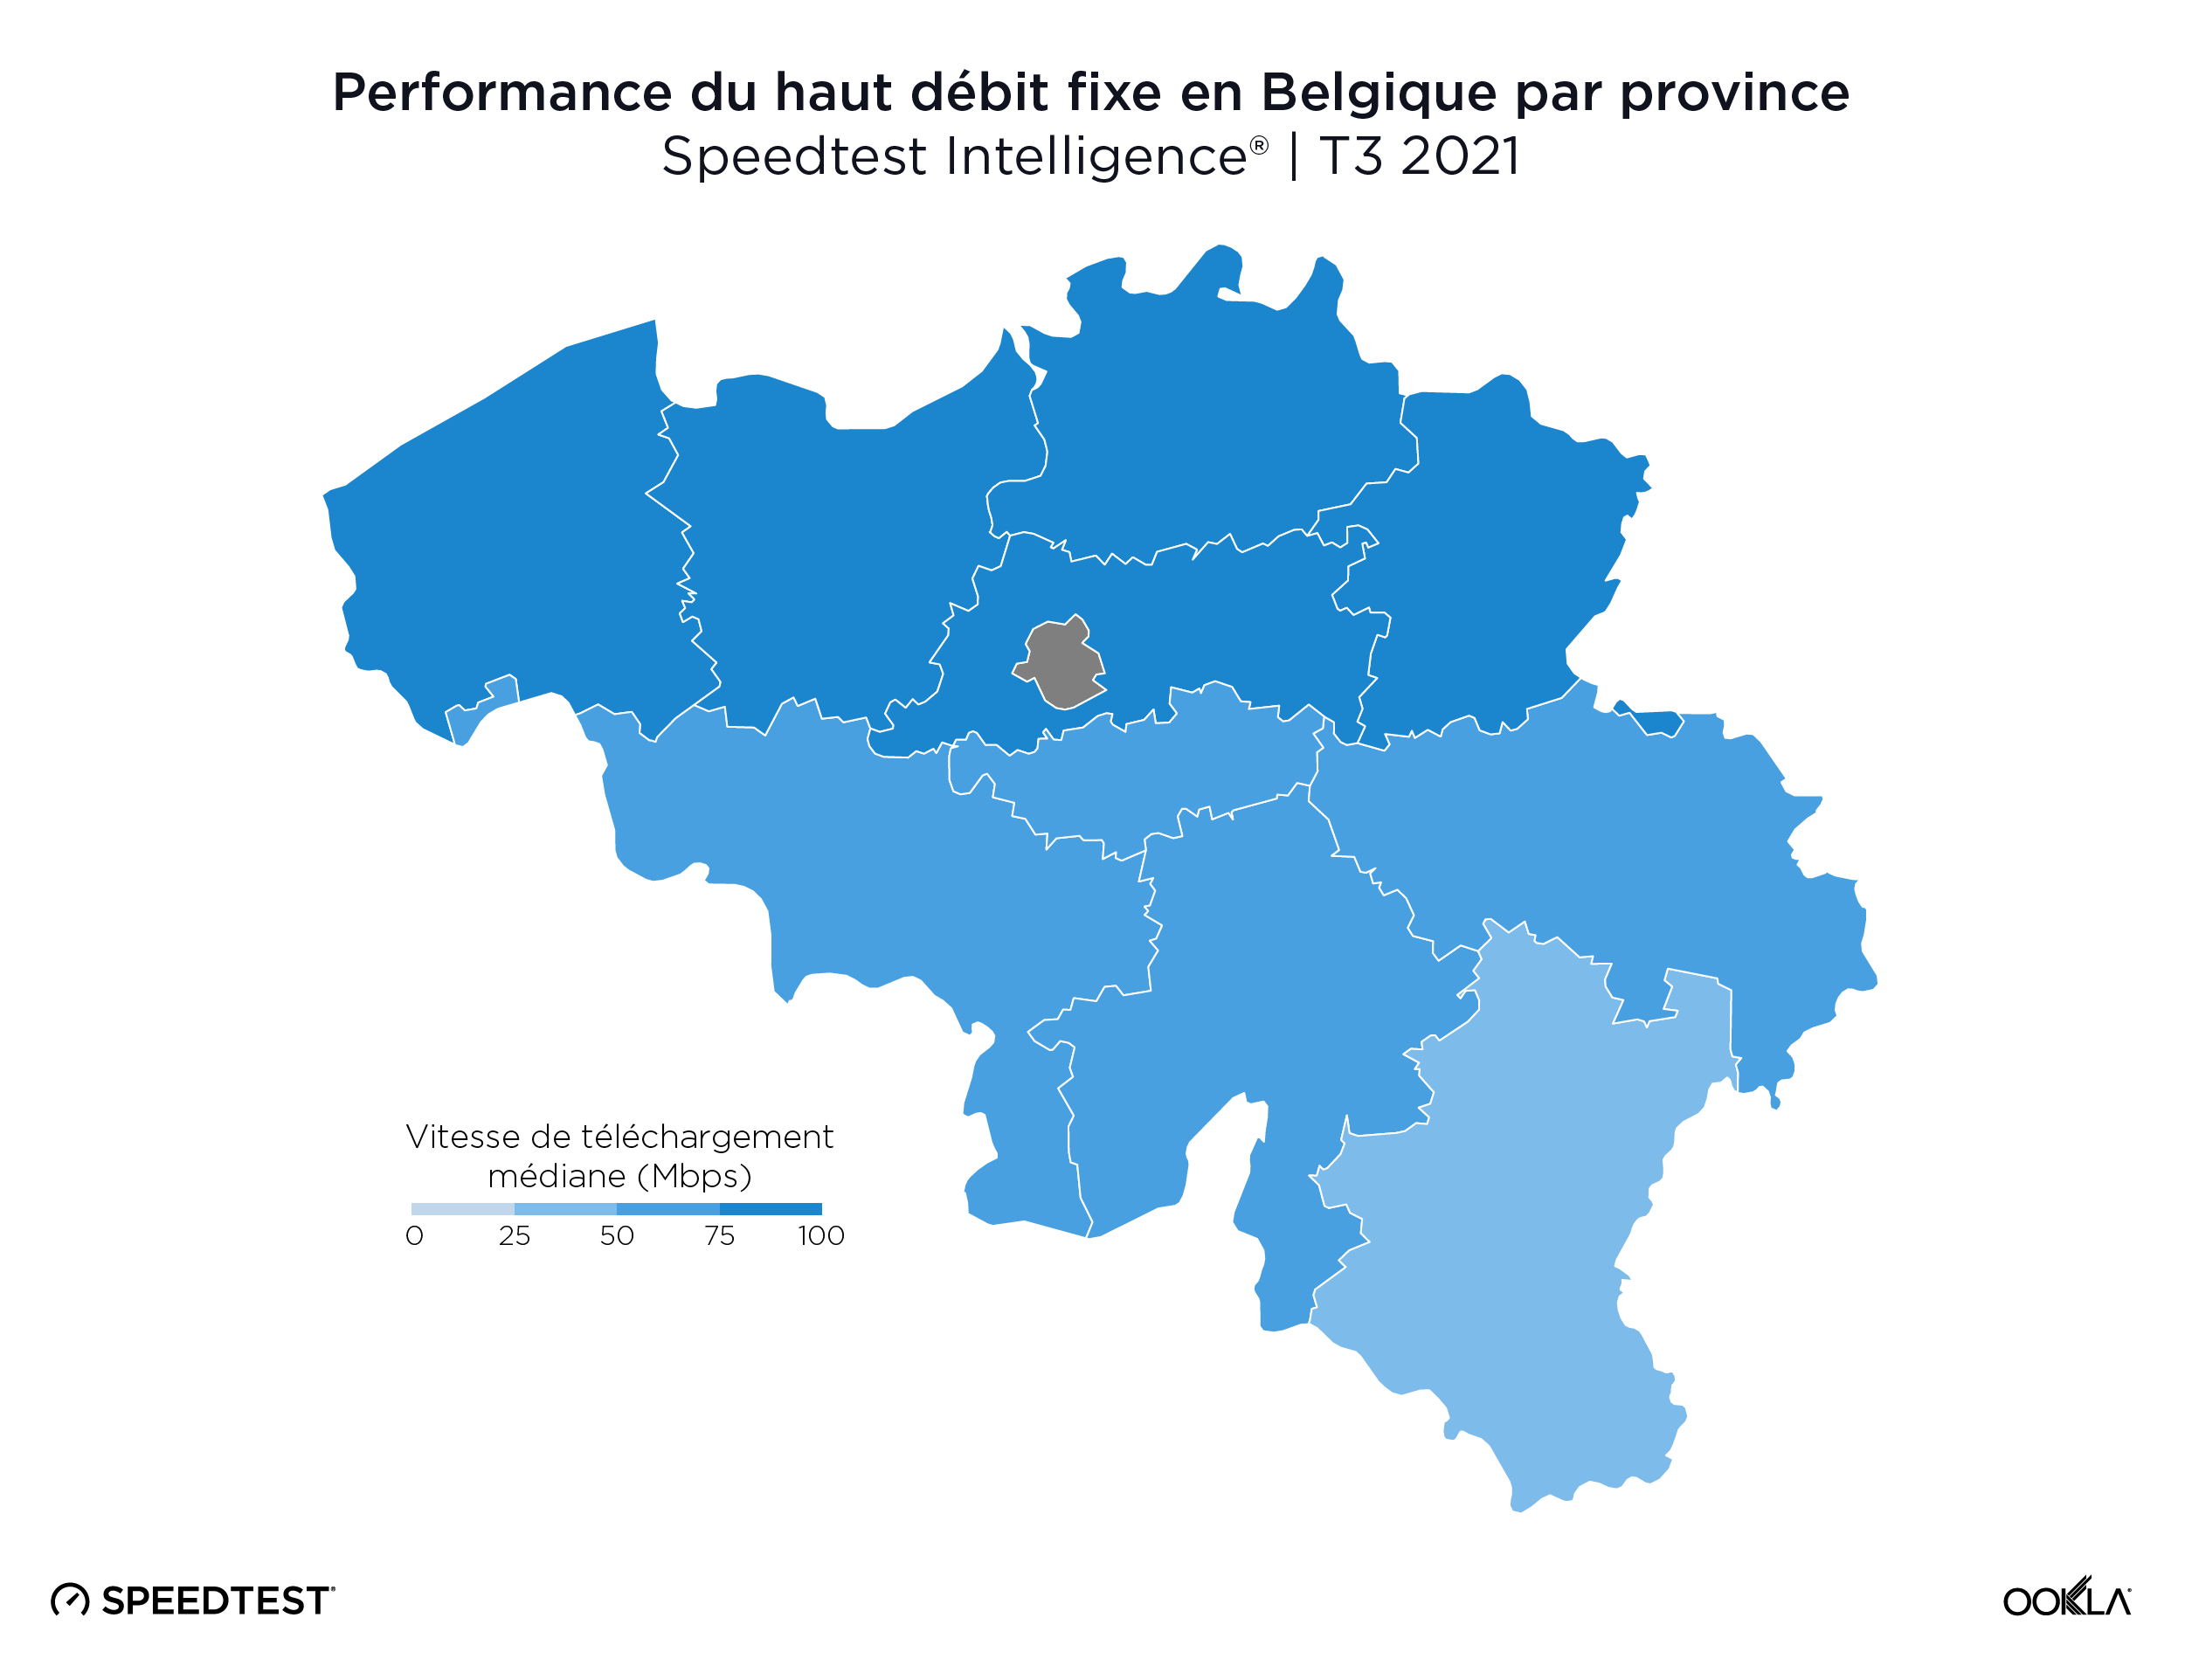
Le Limbourg avait la vitesse de téléchargement médiane la plus rapide sur le haut débit fixe, avec 90,07 Mbps, suivi par la Flandre orientale (86,68 Mbps), la Flandre occidentale (86,45 Mbps), Anvers (85,23 Mbps) et le Brabant flamand (84,50 Mbps). Il n’y a pas de province plus rapide en Wallonie, bien que le Brabant wallon et la province de Namur aient eu les vitesses de téléchargement médianes les plus rapides, avec respectivement 60,15 et 58,90 Mbps.
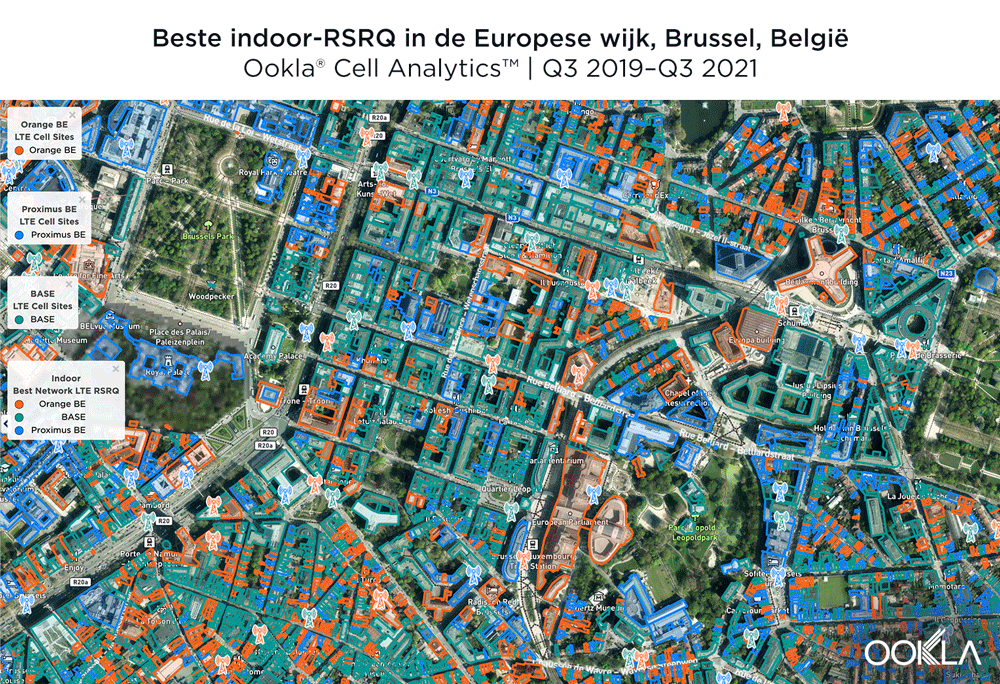
Niveau et qualité du signal 4G LTE selon le fournisseur près du quartier européen de Bruxelles
Nous avons examiné les performances mobiles dans le quartier européen de Bruxelles en utilisant les données de Cell Analytics des 24 derniers mois. Chacune de ces cartes montre les signaux 4G de niveau de signal (RSRP) et de qualité de signal (RSRQ) les plus forts dans cette zone clé, ce qui peut aider les opérateurs mobiles à améliorer leurs réseaux. Cell Analytics identifie le RSRP et le RSRQ les plus forts par opérateur de réseau mobile pour une zone ou un bâtiment donné lorsqu’il y a un gagnant statistiquement significatif et attribue un code couleur à la couleur correspondante du fournisseur. Les cartes RSRP au niveau du fournisseur montrent la force du signal des différents fournisseurs pour une zone donnée, le rose et le rouge indiquant un signal fort et le bleu un signal faible. Les utilisateurs peuvent cependant être confrontés à une qualité médiocre même avec un niveau de signal élevé, ce qui se traduit par des interruptions audios ou des vitesses de données lentes. Les cartes RSRQ au niveau du fournisseur montrent la qualité du signal d’un opérateur pour une zone donnée, le rouge indiquant un signal de haute qualité et le bleu un signal de qualité inférieure. Nous avons également inclus les emplacements approximatifs des tours de téléphonie mobile dans la région.
Une concurrence serrée pour le meilleur RSRP 4G LTE à Bruxelles
L’image ci-dessous montre où un fournisseur a eu la plus forte intensité de signal 4G LTE RSRP au cours des 24 derniers mois. Comme vous pouvez le voir, BASE/Telenet a une forte présence au centre de la carte, obtenant le RSRP le plus élevé dans la zone de notre polygone. Proximus et Orange avaient des signaux forts sur les bords de la carte, et Orange avait le RSRP le plus fort dans certaines des institutions clés de l’UE, y compris le siège de la Commission européenne et le Parlement européen.

Les cartes ci-dessous montrent où chaque fournisseur principal a des données de puissance de signal élevée et faible dans le quartier européen. BASE/Telenet a montré un RSRP très fort près du centre de la carte, en particulier autour des principau’ bâtiments de l’UE, rue de la ’oi et près de l’Av.’Marnix, bien qu’il y ait eu quelques zones plus faibles juste au sud-ouest du bâtiment du Parlement européen. Orange a montré des zones de forte RSRP localisée à travers la carte, en particulier dans le sud-ouest, avec une RSRP plus faible en bleu dans le nord-ouest et au centre de la carte. Proximus avait quelques zones de force le long de la rue de la Loi, et près du cœur du quartier européen, mais avait des signaux plus faibles partout.

BASE/Telenet avait le meilleur RSRQ dans le quartier européen de Bruxelles
Selon Cell Analytics, BASE/Telenet avait le RSRQ le plus élevé dans la zone du polygone du quartier européen que nous avons étudié. Les cartes ci-dessous montrent où chaque fournisseur a eu le meilleur RSRQ au cours des 24 derniers mois, pour les zones intérieures et extérieures. L’image ci-dessous montre que BASE/Telenet avait des zones près du centre de la carte avec le meilleur RSRQ, tandis qu’Orange avait le meilleur RSRQ près du sud de la carte – en particulier sur l’avenue de la Couronne – et la périphérie de la carte vers l’est. Proximus avait le meilleur RSRQ dans certaines zones du quartier européen, notamment au nord-ouest autour du Palais Royal de Bruxelles et du Parc Léopold. Le RSRQ en intérieur a montré un phénomène similaire, avec une forte concurrence sur toute la carte, bien qu’Orange ait montré une meilleure performance dans le sud-ouest de la carte, ainsi que dans certains bâtiments clés de l’UE.

Les cartes ci-dessous montrent où chaque fournisseur principal avait une force de signal RSRQ de haute et de basse qualité. BASE/Telenet a montré des zones très fortes près du centre de la carte, en particulier autour du Parlement européen, du Square Frère-Orban et du Parc du Cinquantenaire, bien qu’il y ait eu quelques zones de moindre qualité juste au sud du bâtiment du Parlement européen. Orange a montré des zones de RSRQ localisées fortes, en particulier près des bâtiments clés de l’UE, mais avait des zones de RSRQ plus faibles en bleu dans le nord-ouest, le centre et le sud-ouest de la carte. Proximus avait une carte assez similaire à celle d’Orange, avec des zones de RSRQ plus élevées à l’est de la carte et près des bâtiments importants de l’UE comme le Conseil de l’Union européenne, mais avait généralement un RSRQ plus faible dans tout le centre de la carte, en particulier le long des grandes voies de circulation comme la rue de la Loi.

La Belgique a des opportunités pour la 5G rapide, mais les consommateurs n’en profiteront pas tant que les opérateurs et les régulateurs ne faciliteront pas la mise en œuvre de la 5G
La Belgique est confrontée à des perspectives difficiles en matière de 5G. Le secrétaire d’État à la Région bruxelloise, Pascal Smet, a fait part de sa volonté de faire de "Bruxelles la capitale technologique de l’Europe" et un rapport récemment commandé par le régulateur belge estime que l’impact de la 5G sur la société belge se traduira par une augmentation du PIB de 4 à 6 milliards d’euros par an d’ici à 2030 et par la création de 40 000 à 80 000 emplois supplémentaires. Cependant, la mise aux enchères des bandes 5G clés a été retardée à plusieurs reprises et, en l’état actuel des choses, les limites strictes des rayonnements non ionisants (RNI) finiront par limiter l’ampleur du déploiement de la 5G sur le marché.
Les plans de la Belgique pour une vente aux enchères de spectre multibande – y compris de nouvelles fréquences pour la 5G et le renouvellement des licences existantes – sont en attente depuis des années en raison de désaccords entre les gouvernements régionaux et fédéraux, en particulier sur la façon dont les recettes devraient être distribuées. Le pays est à la traîne par rapport à ses pairs régionaux en termes de déploiement et d’adoption de la 5G, et le retard persistant a conduit le régulateur belge, l’Institut belge des services postaux et des télécommunications (IBPT), à accorder des licences 5G temporaires au cours de l’année 2020. Des propositions récentes, qui incluent le maintien du produit de la vente sous séquestre jusqu’à ce qu’un accord puisse être trouvé, semblent avoir débloqué la situation, et la vente aux enchères devrait maintenant avoir lieu au deuxième trimestre 2022.
La Belgique doit également faire face à des limites NIR très strictes, notamment dans la région de Bruxelles, qui serviront à limiter le déploiement de la 5G. Le gouvernement régional a ado« té une "feuille de »oute 5G" à la mi-juillet 2021 et organise des groupes de travail pour élaborer un plan de déploie’ent à l’échelle de la ville et apporter des modifications législatives. Elle a déjà pris des mesures pour plus que doubler la limite NIR, mais malgré cela, elle reste inférieure à celle des autres régions–belges – toujours bien en deçà des propositi’ns de l’UE.
Selon le projet de législation de la vente aux enchères, les opérateurs seraient tenus de couvrir 70 % de la population belge avec la 5G dans un’délai d’un an, puis 99,5 % après deu’ ans. L’IBPT prévoit également de réserver des fréquences pour un éventuel quatrième opérateur de réseau mobile, car il cherche à réduire les prix sur le marché. Toutefois, une consult’tion qu’il a commandée début 2021 sur l’impact de la’5G et d’un quatrième opérateur de réseau mobile a esti’é que l’’ntrée d’un nouvel acteur aurait un impact négligeab’e sur l’emp’oi et l’investissement et un impact incertain sur les revenus (+/- 5 %, contre une stabilité). En conséquence, la quantité de spectre réservée à un nouvel entrant a été réduite, afin de permettre aux opérateurs B2B de faire une offre pour certaines des fréquences restantes. Proximus, qui a lancé son réseau 5G au cours du troisième trimestre 2020, a vu les vitesses médianes de téléchargem’nt et d’upload 5G s’établir à 201,59 Mbps et 20,33 Mbps, respectivement, au cours du troisième trimestre 2021. Orange et Telenet ayan’ fait d’énormes investissements pour étendre leur réseau 5G en Belgique, et Telenet lance la 5G commerciale cette semaine, nous sommes impatients de voir ce que l’avenir nous réserve.
La Belgique a la possibilité d’améliorer les vitesses du haut débit mobile et fixe pour les consommateurs, et nous surveillerons de pr’s ce qui se passera à l’avenir avec nos Analyses du marché des Global Index. Pour en savoir plus sur Ookla Speedtest Intelligence ou Cell Analytics, veuillez demander ici.