| February 28, 2023

Chile Writes the Blueprint for Fixed Network Improvement in Latin America

Key messages

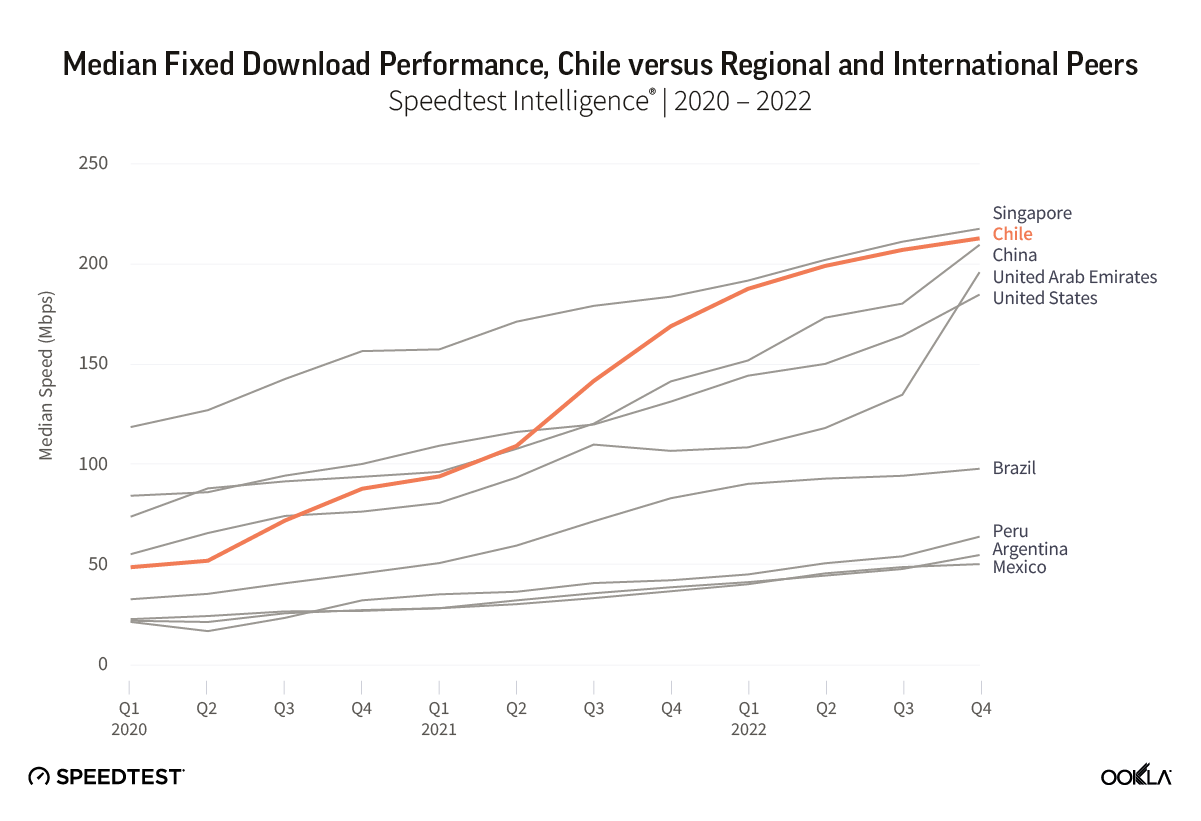
  • From a median download speed of 50.23 Mbps in Q1-Q2 2020 to 205.96 Mbps in Q3-Q4 2022 – Chile punches up on fixed line performance. Chile has been the top performing fixed broadband market across Latin America, consistently outperforming other markets in the region. Over the last three years it has also closed the performance gap to other leading markets globally, and during 2022 consistently featured in the top five of Ookla®’s Speedtest Global Index™, where as of January it placed second.
  • Strong competition the primary driver. Chile’s strong fixed broadband performance — an anomaly in the region — is due primarily to strong competition among Chilean ISPs. Chile has six ISPs with more than 5% market share, all of which are heavily focused on migrating customers to fiber, and five of which recorded median download speeds in excess of 100 Mbps during Q4 2022.
  • Fixed-line investment focused on driving rapid migration to fiber. Strong competition has promoted heavy fixed-line network investment, with reported data indicating capital intensity ratios in excess of 20% in the market. This has translated into a rapid technology migration, shifting the market from a majority of connections via cable (HFC) at the end of 2019, to fiber now comprising almost two-thirds of connections. Furthermore, it has also seen the formation of a neutral network, On*Net, which offers wholesale fiber access to other ISPs.
  • Supporting economic growth in the market. Subject to rising inflation and a market overheated following government intervention post the COVID-19 pandemic, Chile’s economy is expected to contract in 2023 before returning to growth in 2024. Despite this, broadband adoption among businesses continues to advance at a rapid pace, a positive sign in helping support the market’s future growth potential. In addition, broadband performance across the entire market is strong, with median download speeds in all Chilean regions in excess of 100 Mbps as of Q4 2022.

Chile punches up on fixed-line performance

Chile has been a regional leader in fixed line performance in Latin America since 2016, and since then has continually widened its advantage over its regional peers. Over the past three years Chile has driven fixed-line performance increases, from a median download speed of 50.23 Mbps in Q1-Q2 2020 to 205.96 Mbps in Q3-Q4 2022. This makes Chile now a clear anomaly among Latin American markets, having closed the performance gap to the top-performing fixed-line markets worldwide during 2022.

chart of median fixed download performance, chile versus regional and international peers

Chile’s population is predominantly urban-based, with a rural population of just 12.2% in 2021 according to the World Bank. While connecting rural premises with advanced fixed access networks is more costly and less profitable than in urban environments, the urban nature of Chile is not markedly different compared to its peers in Latin America. Brazil has only a marginally greater rural share of population at 12.7%, while Argentina has a lower share, at only 7.8%.

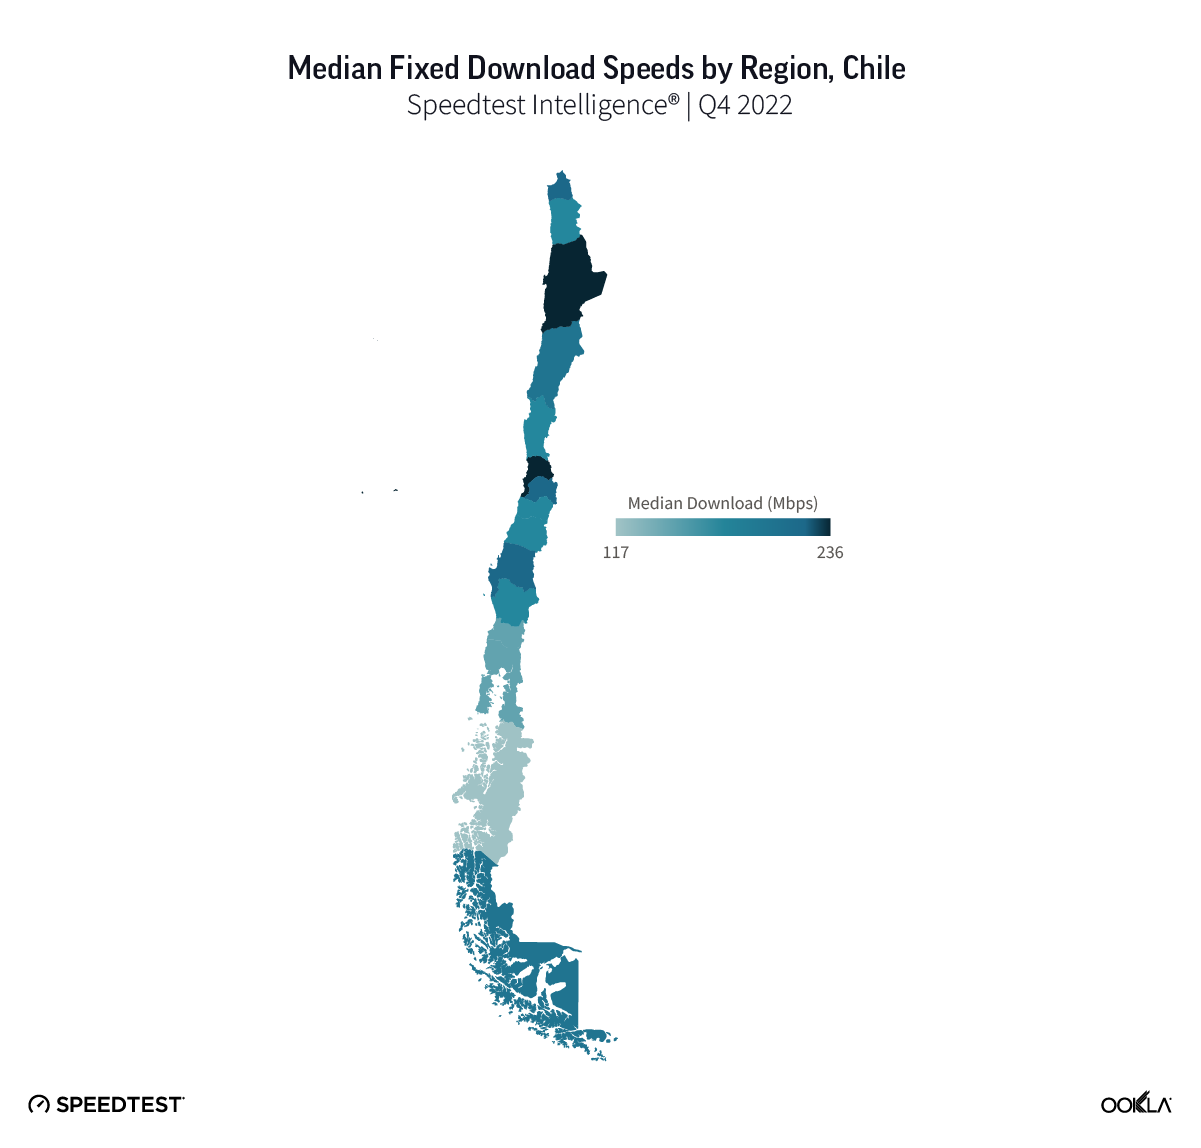
Speedtest Intelligence® data shows that at a regional level within Chile, ISPs are supporting median download speeds in excess of 100 Mbps across all regions during Q4 2022. Santiago Metropolitan Region is the most populous region in Chile, and recorded a median download speed of 215.73, while the region with the largest rural share of population, Maule, recorded a median download of 189.36 Mbps. The lowest median speed was observed in Aysén, with 117.34 Mbps. This relative equity in fixed line performance across regions echoes a 2020 OECD country report on Chile, which highlighted that while economic disparities between Chile’s regions are above the OECD average, it has shown the largest reduction in regional economic inequality among OECD countries since 2008.

map of median fixed download speeds by region in chile

Hyper-competitive fixed broadband market

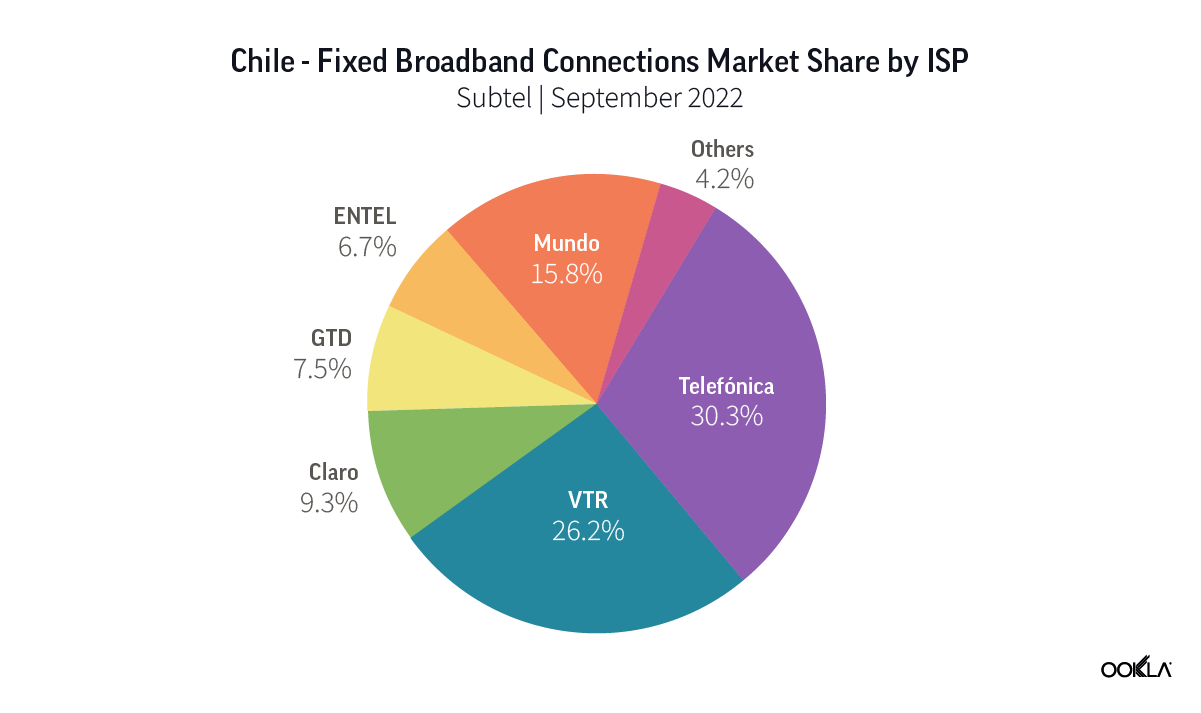
Of the top eight markets in the Speedtest Global Index, Chile had the greatest concentration of ISPs supporting high-speed broadband services. Speedtest data shows eight ISPs active in the Chilean market with more than 3% share of samples, and of these seven supported median download speeds in excess of 100 Mbps. According to the regulator Subtel, Telefonica led the market with 30.3% market share, ahead of second-placed VTR with 26.2%.

Telefonica also led the market in terms of fiber connections, with a market share of 45.7%, followed by Mundo with 25.0%, which in January 2023 announced that it had completed the migration of its customer base from HFC (hybrid fiber-coaxial cable) to fiber-to-the-home (FTTH). Other smaller ISPs are actively deploying fiber or looking for alternative solutions to boost their reach. Entel agreed to sell its fiber network to On*Net Fibra, a joint venture between KKR and Telefonica Chile to provide a neutral fiber network in Chile, in October 2022. This will allow Entel to continue provisioning new households over the larger OnNet network. We also see SpaceX’s Starlink active in the market, alongside Hughesnet, although satellite remains a very small but growing technology within the market.

chart of chile, fixed broadband connections market share by isp

Strong competition driving network investment

Strong competition in Chile’s fixed line market has helped drive network investment, with Chilean ISPs focused on expanding the number of homes passed and migrating to more advanced fiber access. The relatively late launch of 5G networks in the region has enabled operators to focus more heavily on fiber deployment, with a view to increasing fixed broadband adoption and also supporting 5G networks.  The first 5G networks in the market launched in December 2021.

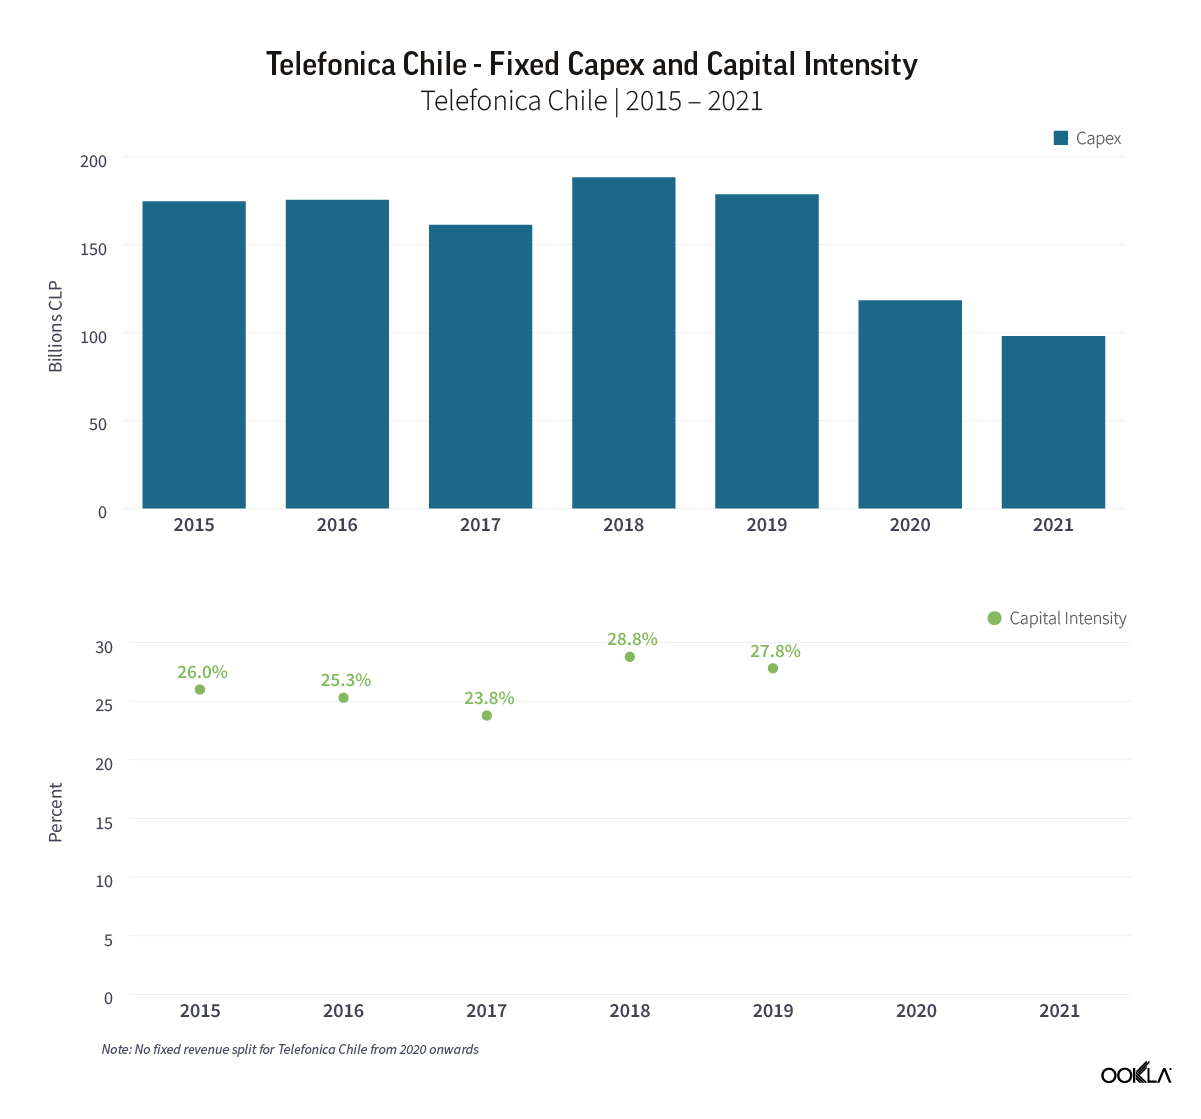
While there is limited reported fixed-line financial data in the market, Telefonica Chile has reported capex historically. Its data shows strong early investment in the market, with capital intensity (capex as a share of revenues) well above 20% from 2015 onwards, peaking at 28.8% of revenues in 2018.

chart of telefonica chile, fixed capex and capital intensity

Telefonica Chile stopped reporting fixed revenues in 2020, however its fixed capex dipped significantly, highlighting the change in strategy from its parent group to deleverage its Latin American operation. This eventually led to KKR’s acquisition of a 60% share in InfraCom from Telefonica, creating On*Net Fibra, a neutral FTTH network joint-venture, which began offering wholesale services in July 2021. Rival ISP VTR confirms the overall trend of strong fixed-line investment in the country, reporting capital intensity in excess of 20% over the past three years. In addition, Mundo announced in early 2022 that it planned to invest $200 million expanding its fiber infrastructure in Chile, and the ISP is targeting 4.5 million homes passed, by the end of 2023.

Accelerating migration to fiber

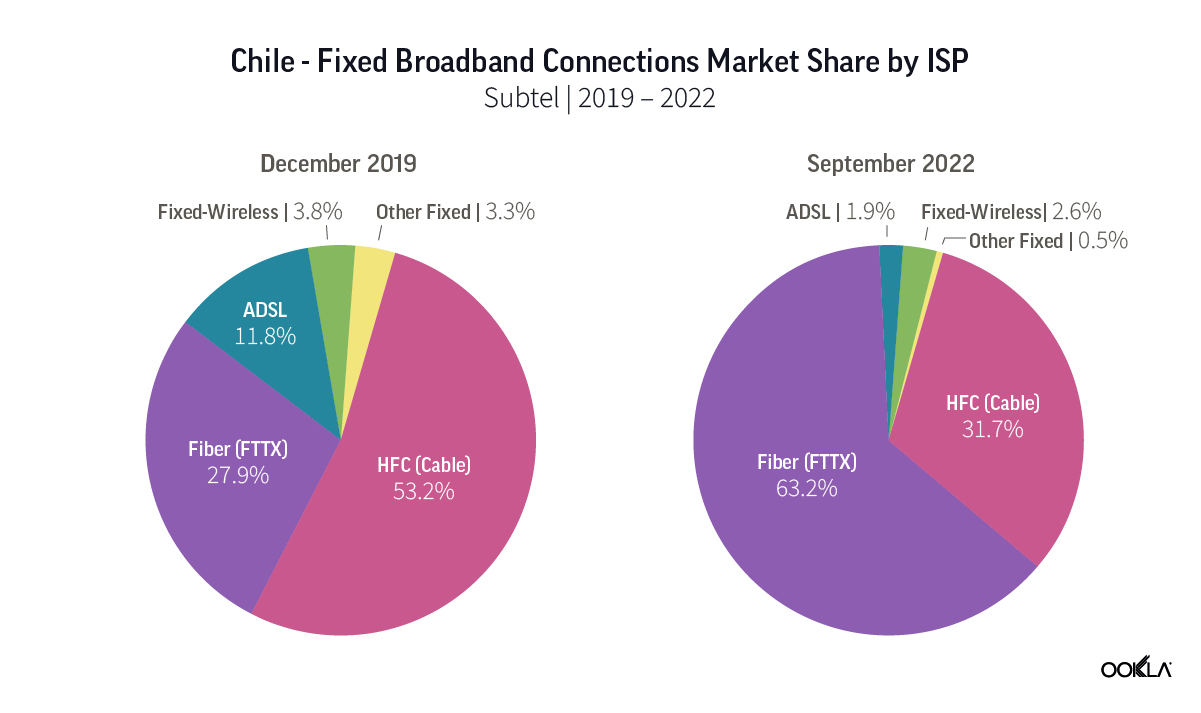
As of 2019, a majority of Chilean broadband connections were supported by hybrid fiber-coaxial (HFC) services, with fiber the second most frequently used technology, followed by ADSL. The transformation of the Chilean fixed broadband market since then has been rapid, with the latest data for September 2022 showing that fiber makes up the majority of broadband connections, with HFC’s share declining strongly, and ADSL’s share dropping below that of wireless broadband connections.

chart of chile, fixed broadband connections market share by isp

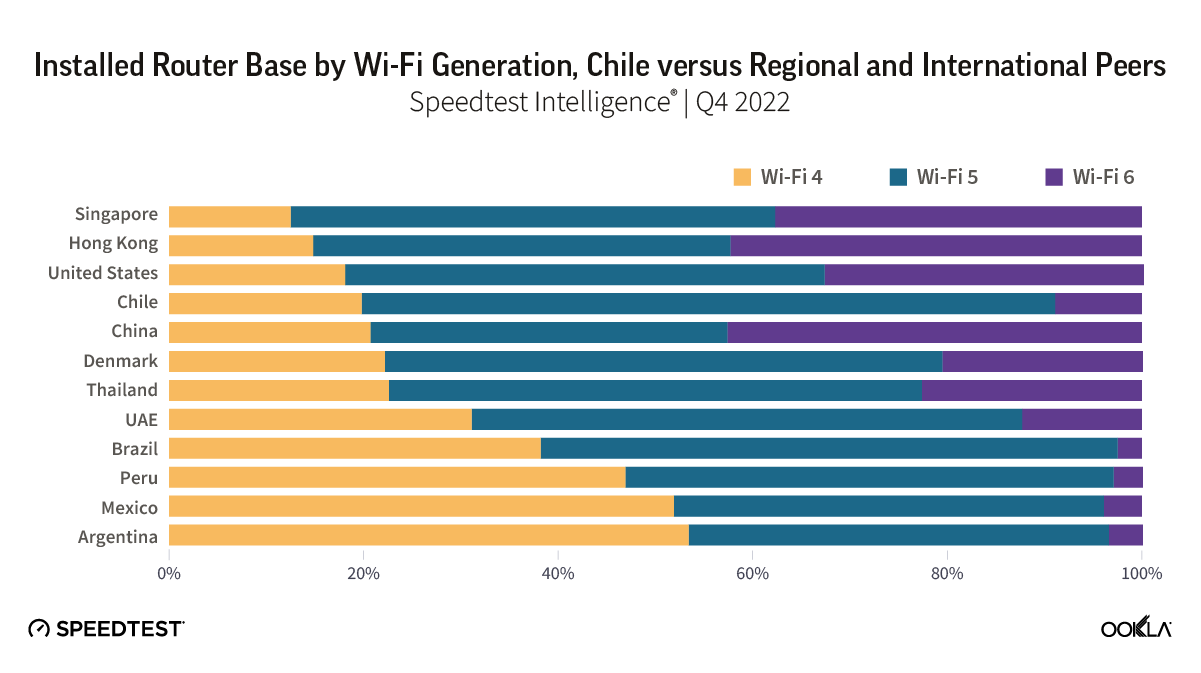
This rapid tech migration has also led to Chile being among the strongest adopters of Wi-Fi 5 and 6 in Latin America, which support faster speeds within business and in the home. In Q4 2022, 71.3% of Chile’s Speedtest samples utilized Wi-Fi 5, with less than 20% utilizing Wi-Fi 4. By contrast, Brazil had 38.2% of samples utilizing Wi-Fi 4, and Argentina 53.4%. Adoption of the newer Wi-Fi 6 routers is slower in Chile compared to international peers, standing at 8.5% as of Q4 2022, however it still leads within Latin America by a significant margin. Within Chile GTD led the pack with 33.5% of samples utilizing Wi-Fi 6 during Q4 2022, followed by WOM with 25.9%, Entel with 21.9% and Telefonica del Sur with 19.4%. By contrast, Claro, Movistar, Mundo and VTR all returned less than 10% in Wi-Fi 6 samples, indicating there is plenty of scope to increase median fixed-line performance yet further in the market. Our analysis of the median download speeds shows a strong correlation with adoption of Wi-Fi routers utilizing 5 GHz spectrum (WiFi 5 and above).

chart of installed router base by wi-fi generation, chile versus regional and international peers

Driving increased fixed broadband adoption

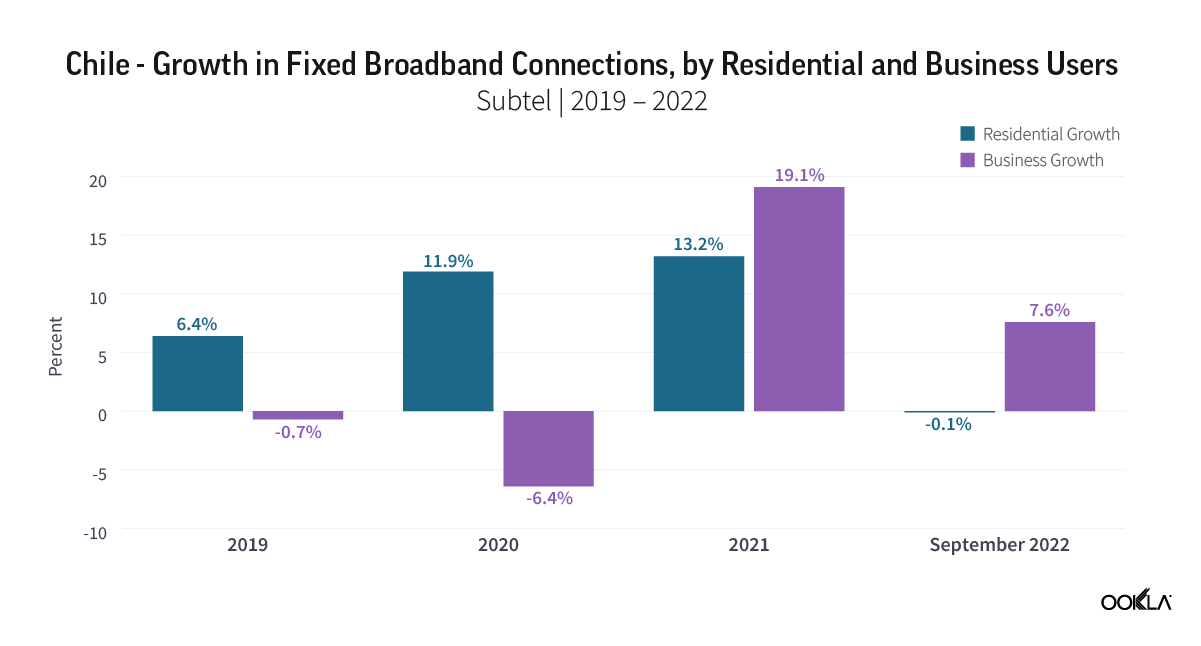
The growth in fixed broadband adoption in Chile was disrupted significantly by the COVID-19 pandemic, and resultant move towards remote working and more people staying at home. Connections growth increased from 5.5% in 2019, to 10.7% in 2020 and 12.8% in 2021, as the importance of home internet connectivity grew.

chart of chile growth in fixed broadband connections by residential and business users

The initial acceleration in connection growth in 2020 was due to growth in residential fixed broadband adoption, with connections increasing by 13% in 2020 and 12% in 2021. Business fixed broadband connections declined in 2020 as the economy contracted, but rebounded strongly in 2021 on the back of government economic stimuli, increasing 19%, and a further 8% in the first three quarters of 2022, demonstrating the important role of broadband in supporting economic growth in the market.

Chile’s economy is forecast to contract in 2023, as inflation continues to impact the market, and fiscal stimuli following the COVID-19 pandemic are unwound. However, the Chilean Central Bank forecasts that the market will rebound in 2024, with growth ranging from 2.25% – 3.25%. A key component of Chile’s future growth will be the ability of businesses to secure fast and reliable internet connections. From an infrastructure point of view, Chile is very well served in this regard, with a very dynamic fixed infrastructure market, as demonstrated by its operators continuing to push on fiber rollout, the emergence of a neutral fiber network with broad coverage, and even the increasing role of satellite connectivity in the market. Such is the success of its Chilean operation, that Telefonica is using the market as a blueprint for its other operations across Latin America. We’ll continue to monitor the rapid progress of Chile’s fixed broadband market as it continues to vie with other leading markets internationally at the top of Ookla’s Global Index. To find out more about Speedtest Intelligence, please get in touch.

Ookla retains ownership of this article including all of the intellectual property rights, data, content graphs and analysis. This article may not be quoted, reproduced, distributed or published for any commercial purpose without prior consent. Members of the press and others using the findings in this article for non-commercial purposes are welcome to publicly share and link to report information with attribution to Ookla.

| February 23, 2023

Announcing Loaded Latency in Ookla® Open Data

In 2020, during the height of the COVID-19 pandemic, Ookla® released our open performance datasets to make our rich database of fixed and mobile network performance available to those who are trying to improve the state of networks worldwide. Each quarter, we update this dataset and make it freely accessible to provide an ongoing, public record of the health and evolution of internet connectivity and accessibility. 

Organizations such as the European Commission, the Organization for Economic Co-operation and Development, and the United Nations, as well as other think tanks and universities have published detailed analyses and recommendations based on this data. There is still much work to be done to ensure every individual in every country has access to adequate and affordable internet in order to work, learn, play, and seek medical treatment, whether they reside in the densest city or remote countryside. According to Omdia, 27% of the world’s population is projected to remain unconnected by 2026.

While we must not lose sight of the critical work to be done to connect those that are un- and under-served today, we must also look to the future. The connectivity use cases of tomorrow will be powered by real-time, immersive experiences, and data is needed by those building and researching new connected experiences to understand the level of responsiveness networks can support today. We are pleased to announce that we are extending our open performance dataset to include additional measures of responsiveness: latency under load for both saturated downlink and uplink. Our Q4 2022 datasets now include loaded latency measurements in Apache Parquet format for network researchers, data scientists, GIS professionals, and hobbyists to analyze and understand more completely the global state of network responsiveness. These measures will continue to be a part of the future performance datasets, updated each quarter for fixed and mobile networks.

We are excited to read the research that can be conducted using these additional data points. Network responsiveness under load can range from excellent to abysmal depending on the network technology, equipment, location, and provider. While our open data provides a digestible, global dataset optimized for spatial analysis, we understand different research projects will have different goals, asking questions that may not be well supported by the available formats. We are committed to supporting academic research institutions seeking to understand the global state of network responsiveness and how it affects nascent and emerging communications technologies. Therefore, we will continue to make additional Speedtest Intelligence® data and other enterprise solutions available to qualified individuals and institutions through our Ookla for Good™ program to further this objective.

To those that have included our open data in their published works: thank you. We believe access to a sufficient, reliable internet connection is a fundamental human right. There is no greater reward than seeing our data driving awareness and policy to change inequities in access to connectivity. We can’t wait to see what you’ll do next. If you’re interested in learning more about the Ookla for Good program, please inquire here.

Ookla retains ownership of this article including all of the intellectual property rights, data, content graphs and analysis. This article may not be quoted, reproduced, distributed or published for any commercial purpose without prior consent. Members of the press and others using the findings in this article for non-commercial purposes are welcome to publicly share and link to report information with attribution to Ookla.
| February 21, 2023

European 5G Performance Trails its International Peers

The European Union’s Digital Decade target is rather ambitious. It wants gigabit connectivity for everyone and ubiquitous 5G coverage by the end of 2030 to assist with digital transformation. When we reflected on 5G progress last year, we concluded that Europe had fallen behind its international peers. In this article, we will assess 5G progress across Europe.  

  • Europe trails others’ performance. Although more spectrum has been awarded over the past year, European 5G performance trailed the likes of the UAE and South Korea. 
  • 5G Availability is on the up. Whilst still behind its international peers, 5G adoption has increased during 2022. This, combined with the greater availability of 5G smartphones and the rollout of 5G networks using low-band spectrum, resulted in higher 5G Availability across most European countries. 
  • A tale of two Europes. In the Nordics and some Eastern European markets (Bulgaria and Cyprus) 5G outperformed the big 5 European economies (U.K., Germany, France, Spain, and Italy). Operators call for more consolidation and regulatory intervention to facilitate 5G investment. 
  • A hotbed for private networks. European governments and regulators are keen supporters of enterprise digitization efforts, and 5G is heralded as a key enabler to assist with that. Over 40% of all private networks worldwide are in Europe, a growing proportion of which are utilizing 5G. 

Mid-band is most assigned spectrum across Europe

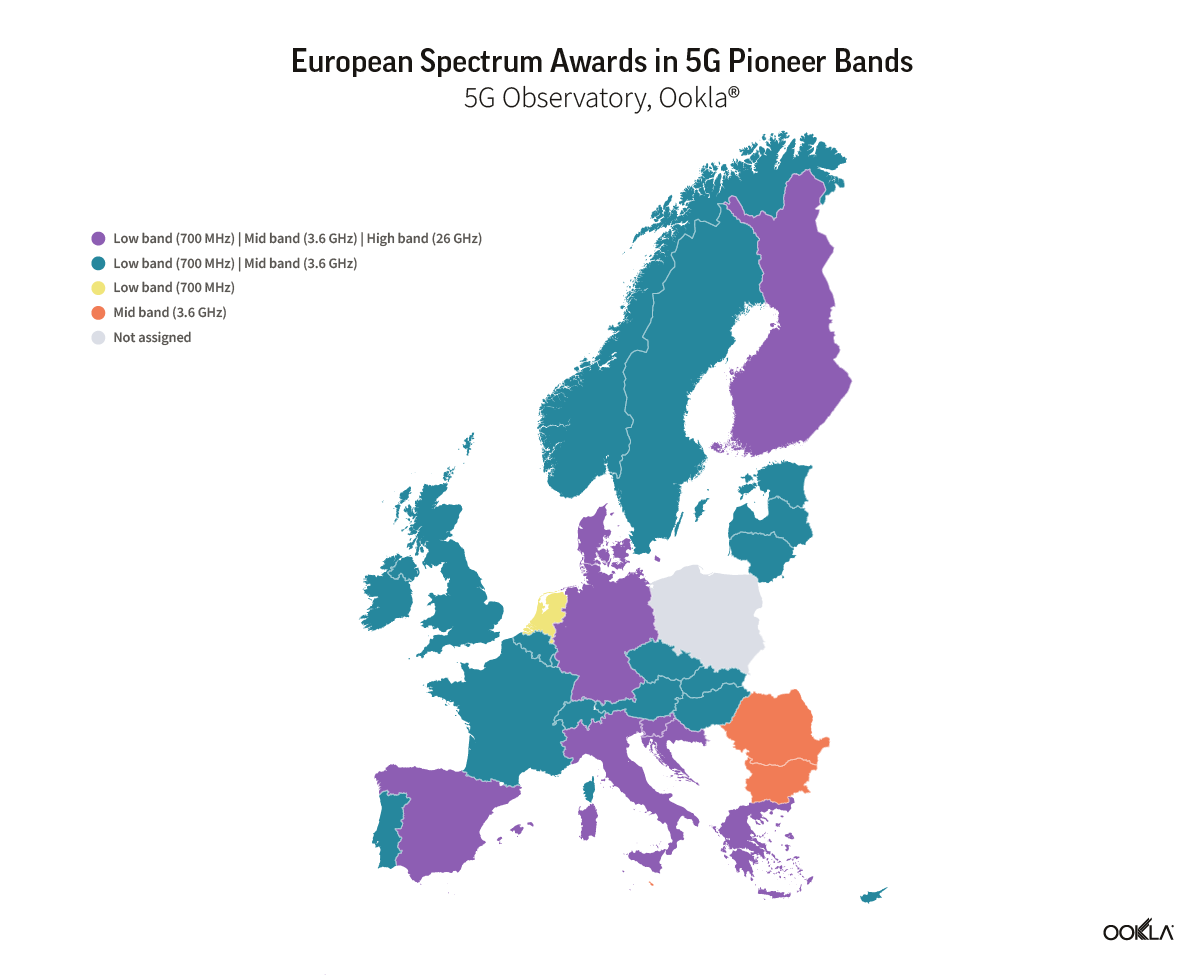
As per the European Commission’s 2016 5G Action Plan, EU countries are meant to make low-band (700 MHz) spectrum available for use by June 30, 2020, and mid- (3.6 GHz) and high-band/mmWave (26 GHz) spectrum by December 31, 2020. At the EU level, there are the so-called 5G pioneer bands. These are the changes compared to when we last reviewed 5G spectrum assignments across Europe: 

  • Four countries still needed to assign spectrum last year. Now, Poland is the only one without dedicated 5G spectrum. 
  • Over the course of last year, three more countries awarded spectrum across all of the 5G pioneer bands, making a grand total of eight countries. 
  • Four more countries awarded spectrum across both low- and mid-band spectrum, tallying up the count to 17.
  • Mid-band spectrum is the most popular spectrum band, with 28 countries already awarded mid-band spectrum — an additional five to when we last took stock. The remaining countries, Poland and Netherlands, will finally auction the 3.5 GHz spectrum in the summer of 2023.
  • 26 countries auctioned spectrum in the 700 MHz bands, compared to 21 a year ago.
  • Eight countries have awarded mmWave spectrum thus far. Spain is the only addition in 2022, raising €36 million. 

map of european spectrum award in 5g pinoeer bands


Legacy networks give way to 4G LTE and 5G 

5G pioneer bands are not the only frequencies that operators use to deploy 5G. As operators shut down legacy networks, they can refarm sub-3GHz frequencies for 4G LTE or 5G. European operators tend to support 2G in the short term, phasing out 3G networks instead. MNOs also look to optimize their network operations, and the upkeep of legacy networks comes with additional cost and complexity.

The rate of network shutdowns is increasing. So far, across Europe, 21 operators across 11 countries have retired 3G networks compared to only two 2G network shutdowns. 2G is still needed to support M2M/IoT use cases, e.g. ongoing long-term enterprise contracts with utility providers. In contrast, operators see less traffic carried over 3G networks hence the desire to retire them. For example, Magyar Telekom noted 2.3% and 0.84% of total voice and data traffic on the 3G network. Proximus stated that 2% of its data traffic uses 3G, while Telenet/Base shared that 3G devices account for just 1% of its network. Looking ahead, 43 operators across 26 countries announced their plans to switch off 2G networks, and 37 operators in 21 countries will pull the plug on 3G.

5G adoption lags, 5G performance doesn’t impress either 

Most European countries have commercial 5G networks in place. However, 5G adoption across Europe lags behind its global peers. According to GSMA Intelligence, in Q4 2022, 5G uptake in Europe accounted for 7.4 % of total mobile connections, a substantial increase over the Q4 2021 level of 2.5%. Across European countries, 5G adoption is at most 21% (Switzerland), compared to 43.1% in the United States, 42.4% in South Korea, China (36.3%), Australia (30.1%), and Japan (28.5%).

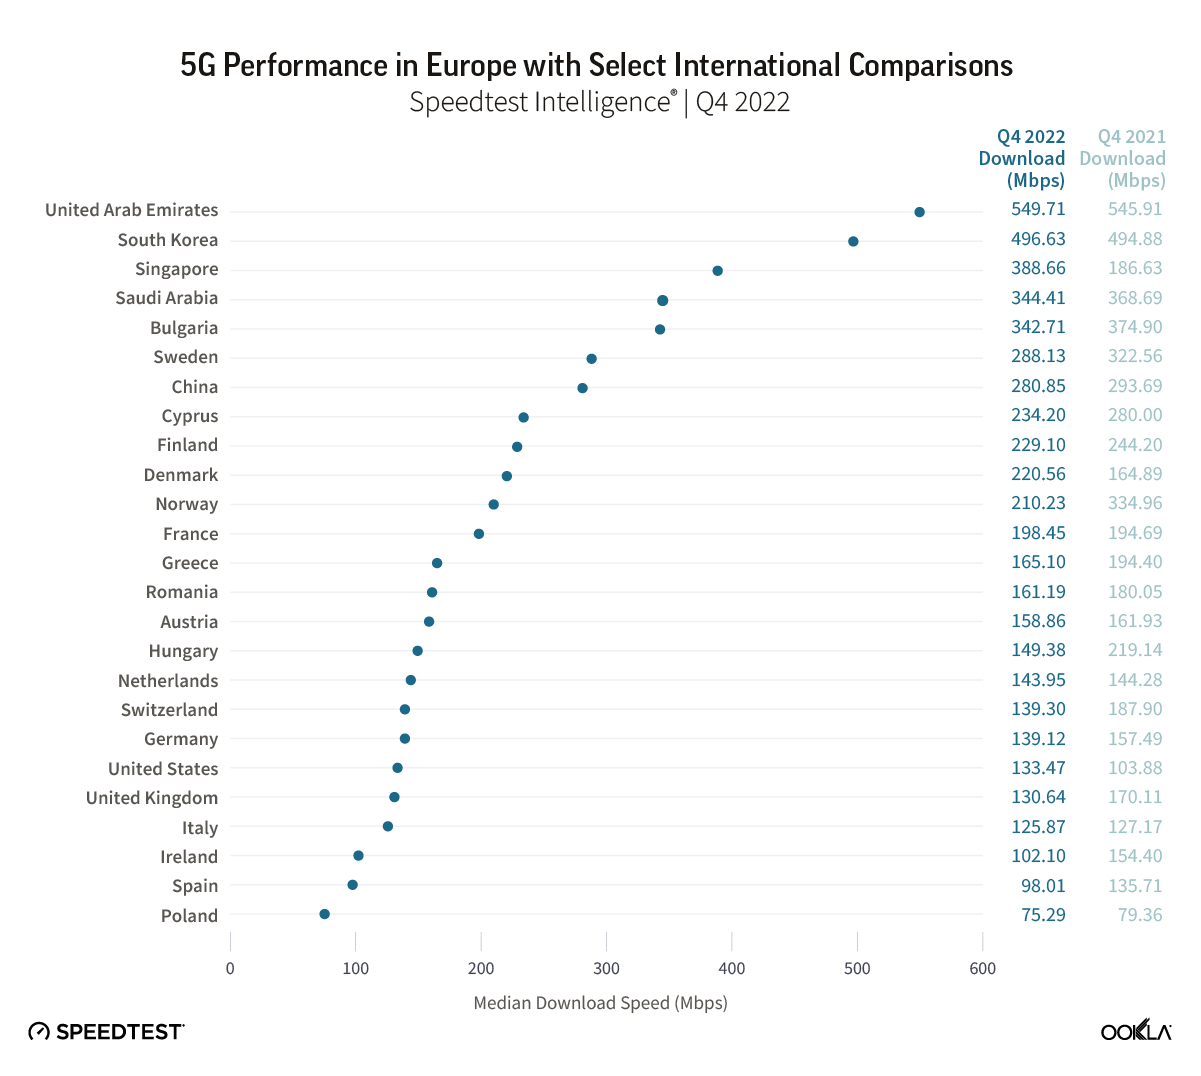
chart of 5g performance in europe with select international comparisons


Our recent article identified four broad clusters of 5G performance based on Speedtest Intelligence® data. Most European countries achieved median 5G download speeds under 200 Mbps, placing them within the 5G Improvers category. Bulgaria was the only country that made it into the 5G Leaders category, which includes the likes of the UAE, South Korea, Singapore, and Qatar, with a median 5G download speed of 342.71 Mbps, a slight decrease compared to last year (374.90 Mbps in Q4 2021). Five countries made it into the High Performers cluster, achieving a median 5G download speed exceeding 200 Mbps: Sweden, Cyprus, Finland, Denmark, and Norway. Interestingly enough, the big five European economies (U.K., Germany, France, Spain, and Italy) were outperformed by the Nordics and two Southern Eastern European markets (Bulgaria and Cyprus). The Nordics have always played a leading role in European telecoms, but the 5G performance gap between them and the big five points to challenges in those markets. 

Across most of Europe, median 5G speeds have actually decreased. This isn’t surprising, as increased adoption leads to higher network congestion, but other factors are at play. Operators feel the pressure of the economic crisis, higher energy costs, and reduced consumers’ spending power. Europe also suffers from fragmentation, low ARPU levels brought about by intense competition, and Capex levels that are half that of the U.S. and Canada. A report by the European Court of Auditors estimates the deployment cost of 5G across all EU member states at around €400 billion. Operators are yet to see additional revenue coming from 5G that can support that level of investment. The optimal market structure and role of governments in supporting the rollout of 5G remains a heavily debated topic as operators’ M&A activities heat up.

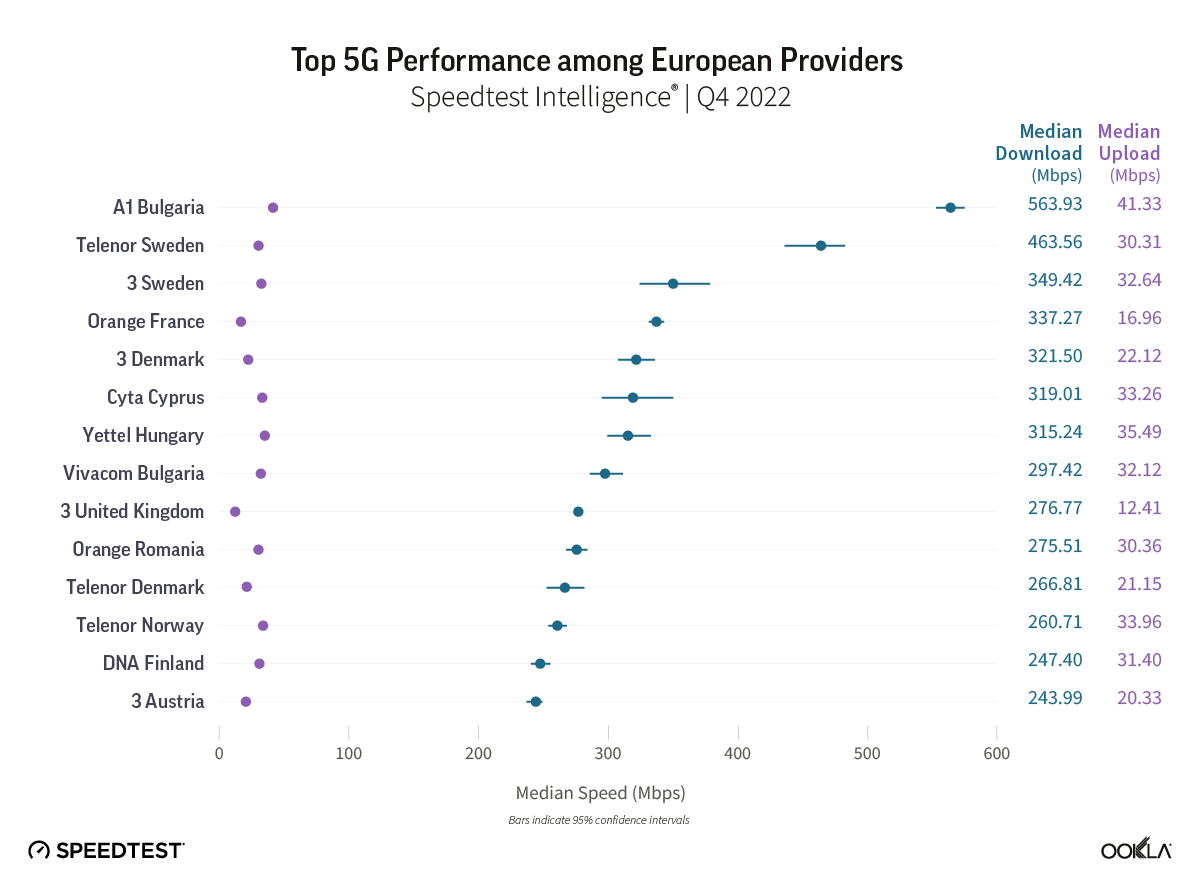
chart of top 5g performing providers in europe


Operators’ performance tells an interesting story as there are vast differences between countries and even within a country. The Nordics operators’ 5G performance tends to rank highly compared to other European countries thanks to having access to dedicated 5G spectrum and supportive regulatory environment. Denmark and Sweden have a greater level of network sharing as two operators share Multi-Operator Core Networks (MOCNs) and spectrum. In some countries, operators have to adhere to conditions stipulated by the 5G license, either in terms of network coverage or the number of 5G sites. For example, in France, each operator had to deploy 3,000 5G sites by the end of 2022. Challenger mobile operators often outperform incumbents — strong results from Three in the chart above are proof of that. 

5G Availability shows improvement

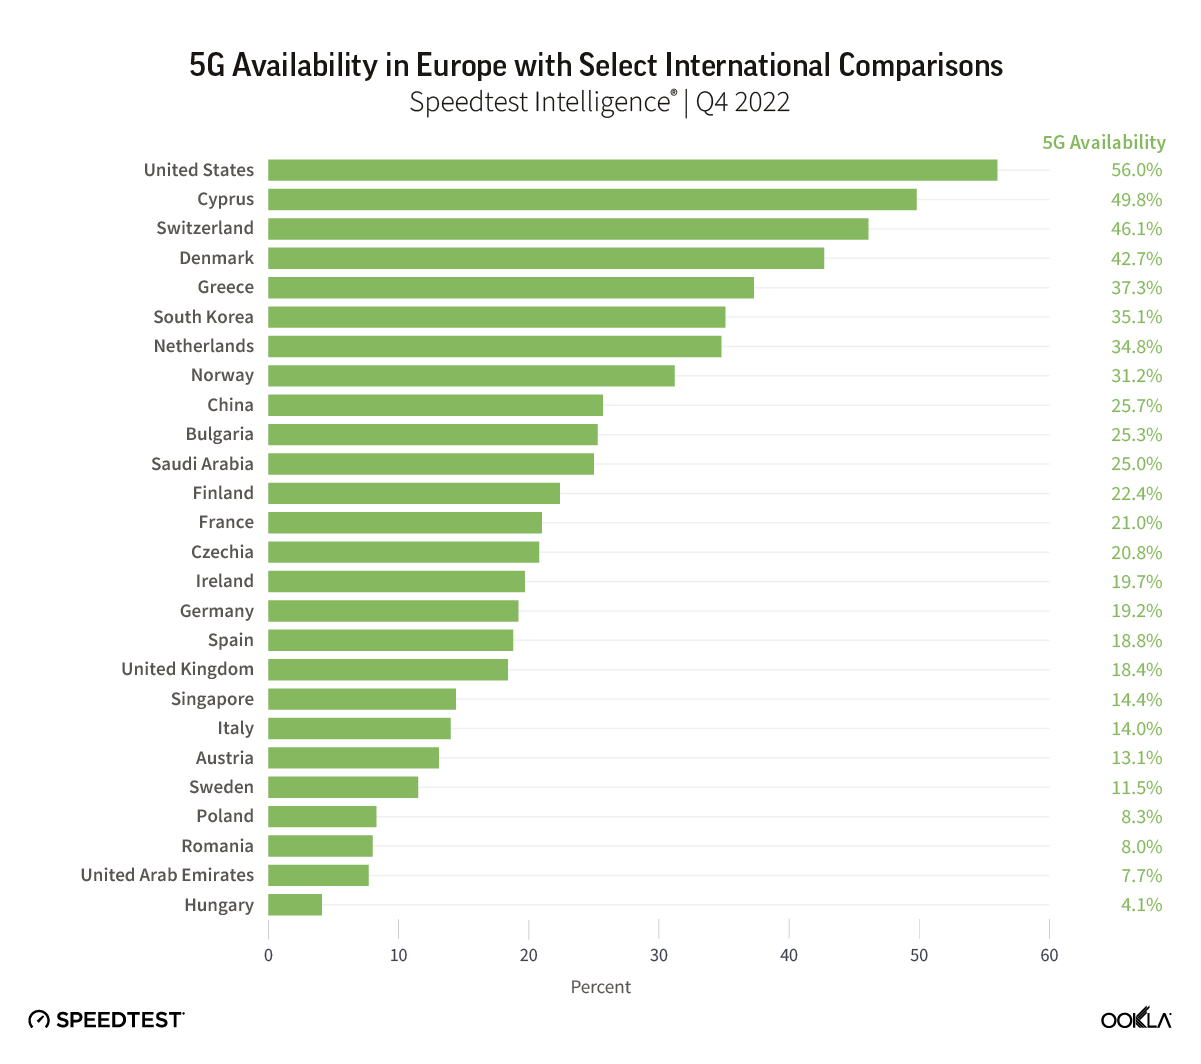
chart of 5g availablity in europe with select international comparisons


Given the growth in 5G adoption, not surprisingly, 5G Availability (the percentage of users on 5G-capable devices that spend most of the time with access to 5G networks) has been on the rise too. 5G Availability is a function of 5G network coverage, and 5G tariff and 5G-capable device adoption. At 56%, the U.S. continues to have the highest level of 5G Availability, having started 5G deployment in the 600 MHz (low band) range and with a large pool of customers owning 5G capable devices. The 600 MHz frequency band has further reach compared to 700 MHz and even the LTE mid-band. Within Europe, 5G Availability exceeds 40% in three countries: Cyprus, Switzerland, and Denmark, but the range is broad across those countries. Cyta Cyprus has reached 67.1% 5G Availability in Q4 2022, thanks to extending 5G coverage to 100% of Cypriots. Swisscom ranks highly too, with 61% Availability in Q4 2022. Its 2022 Annual Report notes that the operator covers 99% of the Swiss population with a basic version of 5G (using Dynamic Spectrum Sharing, which borrows capacity from its LTE spectrum) and 74% with 5G + (delivered using mid-band spectrum). 

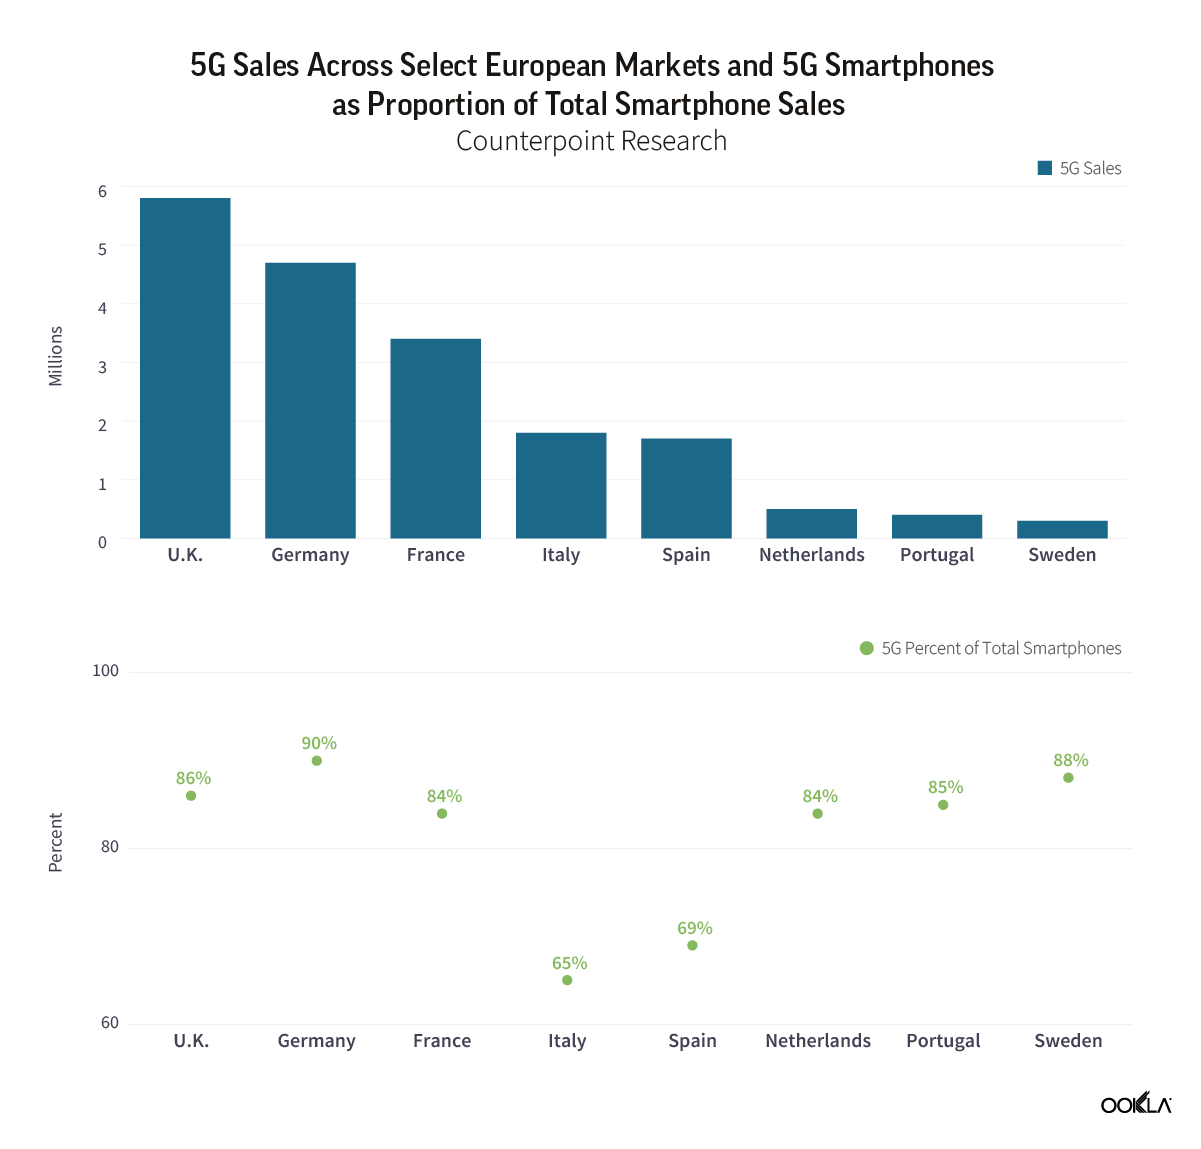
One critical component driving 5G Availability is the affordability and availability of 5G-capable smartphones. According to Counterpoint Research, in Q4 2022, 5G smartphone sales across Europe totaled 26.8 million, equivalent to 67% of total smartphone sales, compared to 84% in North America and 87% across China, Japan, and South Korea. Europe still needs to catch up to other advanced markets in smartphone adoption. Within Europe, there is also wide variation, with Germany at 90%, Sweden at 88%, the UK at 86%, and Eastern European markets at 49%. Over time, smartphone sales will translate into a more extensive installed base of 5G devices and share of overall subscriptions.charts of 5g sales across select eupropean markets and 5g smartphones as proportional of total smartphone sales

A glimmer of hope for 5G investments

As per the EU Commission’s 5G Action plan, operators should extend 5G networks to all urban areas and major roads and railways by 2025 and populated areas by 2030. For Europe to catch up with its peers and to achieve its digital ambitions, it needs more investment. Operators frequently call for a more supportive policy and regulatory ecosystem to stimulate Capex. During Ookla’s Southeast Europe Regulatory Summit, Professor Konstantinos Masselos, President of Hellenic Telecommunications and Post Commission and BEREC Chair 2023, recognized that Europe is still behind the rest of the world, there is a need to fill the gap for investments, and Europe needs to solve demand issues and cost-effectiveness while not forgetting sustainability.

According to Assembly Research, an issue that came to the fore during 2022 was ‘fair share’ – i.e. the idea that tech companies should contribute to telecoms network costs. Many large telcos believe that deploying Europe’s digital infrastructure should be more evenly distributed among those generating traffic (and costs). However, some smaller operators and access seekers, such as MVNOs, are concerned by the possible implications of fair share, arguing that it could create a competitive distortion that puts them at a disadvantage. In addition, an October 2022 report by BEREC found little evidence that large content and application providers should contribute towards the cost of building telecom networks, considering that this model could risk harming Europe’s internet ecosystem.

Nevertheless, the European Commission is considering potential changes to how networks are funded. Commissioner Thierry Breton is poised to launch the EC’s fair share consultation at MWC23, which will reportedly outline proposals on Big Tech’s contribution towards telecoms network costs. Whether the European telcos’ lobbying campaign will bear fruit, only time will tell. But this will also depend on how well telcos outline what ‘fair share’ should look like. In Assembly’s view, the next step is to develop a practical means of implementing fair share, one which telcos have yet to set out in detail. In response to the EC’s forthcoming consultation, the onus is on operators to present compelling, justifiable policy actions, including how contributions to network costs should be calculated and applied.

European regulators support enterprise digitization efforts 

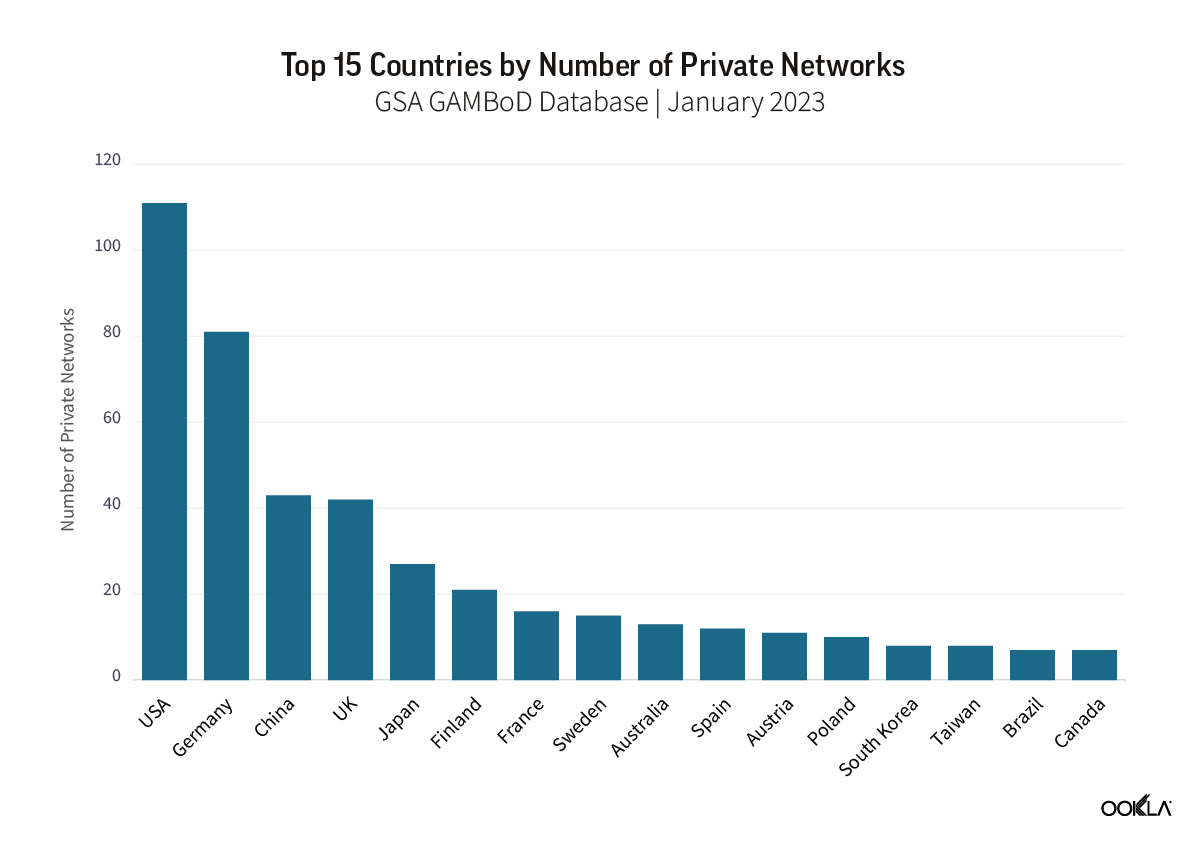
Digitization of different sectors of the economy is key to supporting sustainable development and climate goals. However, enterprise requirements differ. Some prefer to retain control over their networks, isolating them from the public network. Private mobile networks play an important role in broader digital transformation and addressing Industry 4.0 objectives. According to GSA, there were 954 private networks globally, of which almost half were in Europe (405). In terms of the number of private networks, the U.S. ranked first internationally, Germany was second, and the U.K. came fourth, followed by Japan, Finland, France, and Sweden. All of these countries embarked on digitization strategies to strengthen their position as manufacturing hubs, and it is no coincidence that these are also the markets where enterprises can purchase dedicated spectrum.

chart of top 15 countries by number of private networks

Historically, Wi-Fi has been the connectivity choice for private networks. However, mobile technologies such as 4G LTE and 5G are better suited to Operational Technologies’ network requirements of high volume, high reliability, mobility, and always-on operations. In Europe, almost half of the private networks run on 4G LTE (44%), 21% use a mix of 4G and 5G, with 5G accounting for close to 30% of deployments. As we have noted before, the introduction of industrial chipsets, based on Release 16, scheduled to come to market in 2023, will stimulate the private 5G networks market too.

Furthermore, regulators are creating an encouraging environment for enterprises to deploy their own networks to support their digital transformation targets. A dedicated spectrum for private mobile networks has already been allocated to industry players in France, the U.S., Germany, Japan, and the U.K., among others. Recently, Norwegian regulator Nkom opened up a 3.8 – 4.2 GHz band for interested parties to apply for a license to offer private 5G networks. Germany spearheads the Industry 4.0 movement, with some of the country’s biggest industrial players awarded their own 5G spectrum and experimenting with private 5G networks to address their particular needs. Other countries that look to support their national manufacturers standing in the global marketplace look to follow, as we have discussed the case for private networks in India.

Ookla will be at MWC Barcelona 2023 — visit us at our Stand 2i28 in Hall 2 to talk with us about telco trends and to learn about Ekahau’s private 5G offering. If you are interested in what are the new and exciting use cases as we enter the 5G Advance era, join us at the 5G Futures Summit. In the meantime, please contact us if you’re interested in discovering more about Ookla Speedtest Intelligence and its wealth of fixed and mobile consumer-initiated data and insights.


Ookla retains ownership of this article including all of the intellectual property rights, data, content graphs and analysis. This article may not be quoted, reproduced, distributed or published for any commercial purpose without prior consent. Members of the press and others using the findings in this article for non-commercial purposes are welcome to publicly share and link to report information with attribution to Ookla.
| February 16, 2023

European Commission Uses Ookla® Data to Demonstrate Territorial Disparities and the Digital Divide in the EU

The characteristics of places might not define the identity of people living there, but they affect the daily life of every citizen and can prevent them from reaching their full potential and the best life. Persisting territorial disparities, related to phenomena such as depopulation or limited access to services, can become even more visible by observing places rather than individuals. In fact, growing territorial inequality, further exacerbated by the COVID-19 pandemic, limits on people’s lifestyle and life choices, and creates a feeling of being left behind.

The Joint Research Centre of the European Commission recently published a report focused on understanding and identifying territorial disparities and challenges in the EU across a variety of sectors, including access to broadband and the performance of the digital connection, using the Speedtest® by Ookla® Global Fixed and Mobile Network Performance data for Q4 2020. A full comprehension of these challenges and their interlinkages is essential to produce evidence to improve policies, especially for the benefit of those living in vulnerable conditions, in line with the principle of leaving no place and no one behind.

Key findings

High-speed broadband increasingly represents an essential infrastructure to drive the economic and social development of territories. Therefore, the lack of broadband network or poor access to a high-speed connection might cause significant disparities among places and citizens and leave some areas behind in terms of access to services and opportunities, diminishing the quality of life of residents. The connectivity gap, often recognized as an urban-rural digital divide, represents an important challenge to face for some countries and policy makers and may require a joint effort by both public and private initiatives.

Results show that significant differences exist in network speed across the EU-27 countries. Territorial disparities are even more relevant, with most Member States in urban areas enjoying easy access to the highest fixed broadband available (> 100 Mbps), whereas in rural areas a significant percentage of residents have access to an average speed below the minimum standard of 30 Mbps. Only very few countries show access to over 100 Mbps broadband for rural populations (Denmark, Sweden, the Netherlands, Luxembourg).

Regarding mobile broadband, the average speed is generally lower than fixed broadband in all countries, with only a few areas having more than 100 Mbps average speed. Interestingly, the Alpine region across France, Italy and Austria appears to have better connectivity with mobile broadband (over 30 Mbps) than with fixed broadband (under 30 Mbps). The same pattern can be observed in Central Italy and Sardinia, Croatia, and partially in Greece.

To strengthen the evidence of such urban-rural digital divide, the spatial patterns of access to broadband were combined with the population density and the classification of degree of urbanization of municipalities in cities, towns and rural areas (see Figure 01). Results confirm that urban areas present the highest speed in broadband connection, revealing how the areas already most connected in terms of physical networks (i.e., with roads and railways) are also the most connected from the digital point of view. Access to a good broadband connection is most problematic in remote municipalities (with 45 minutes or more from the nearest city by drive), where the average speed is significantly lower than the national averages, especially in countries such as Belgium, Spain, France, and Portugal.

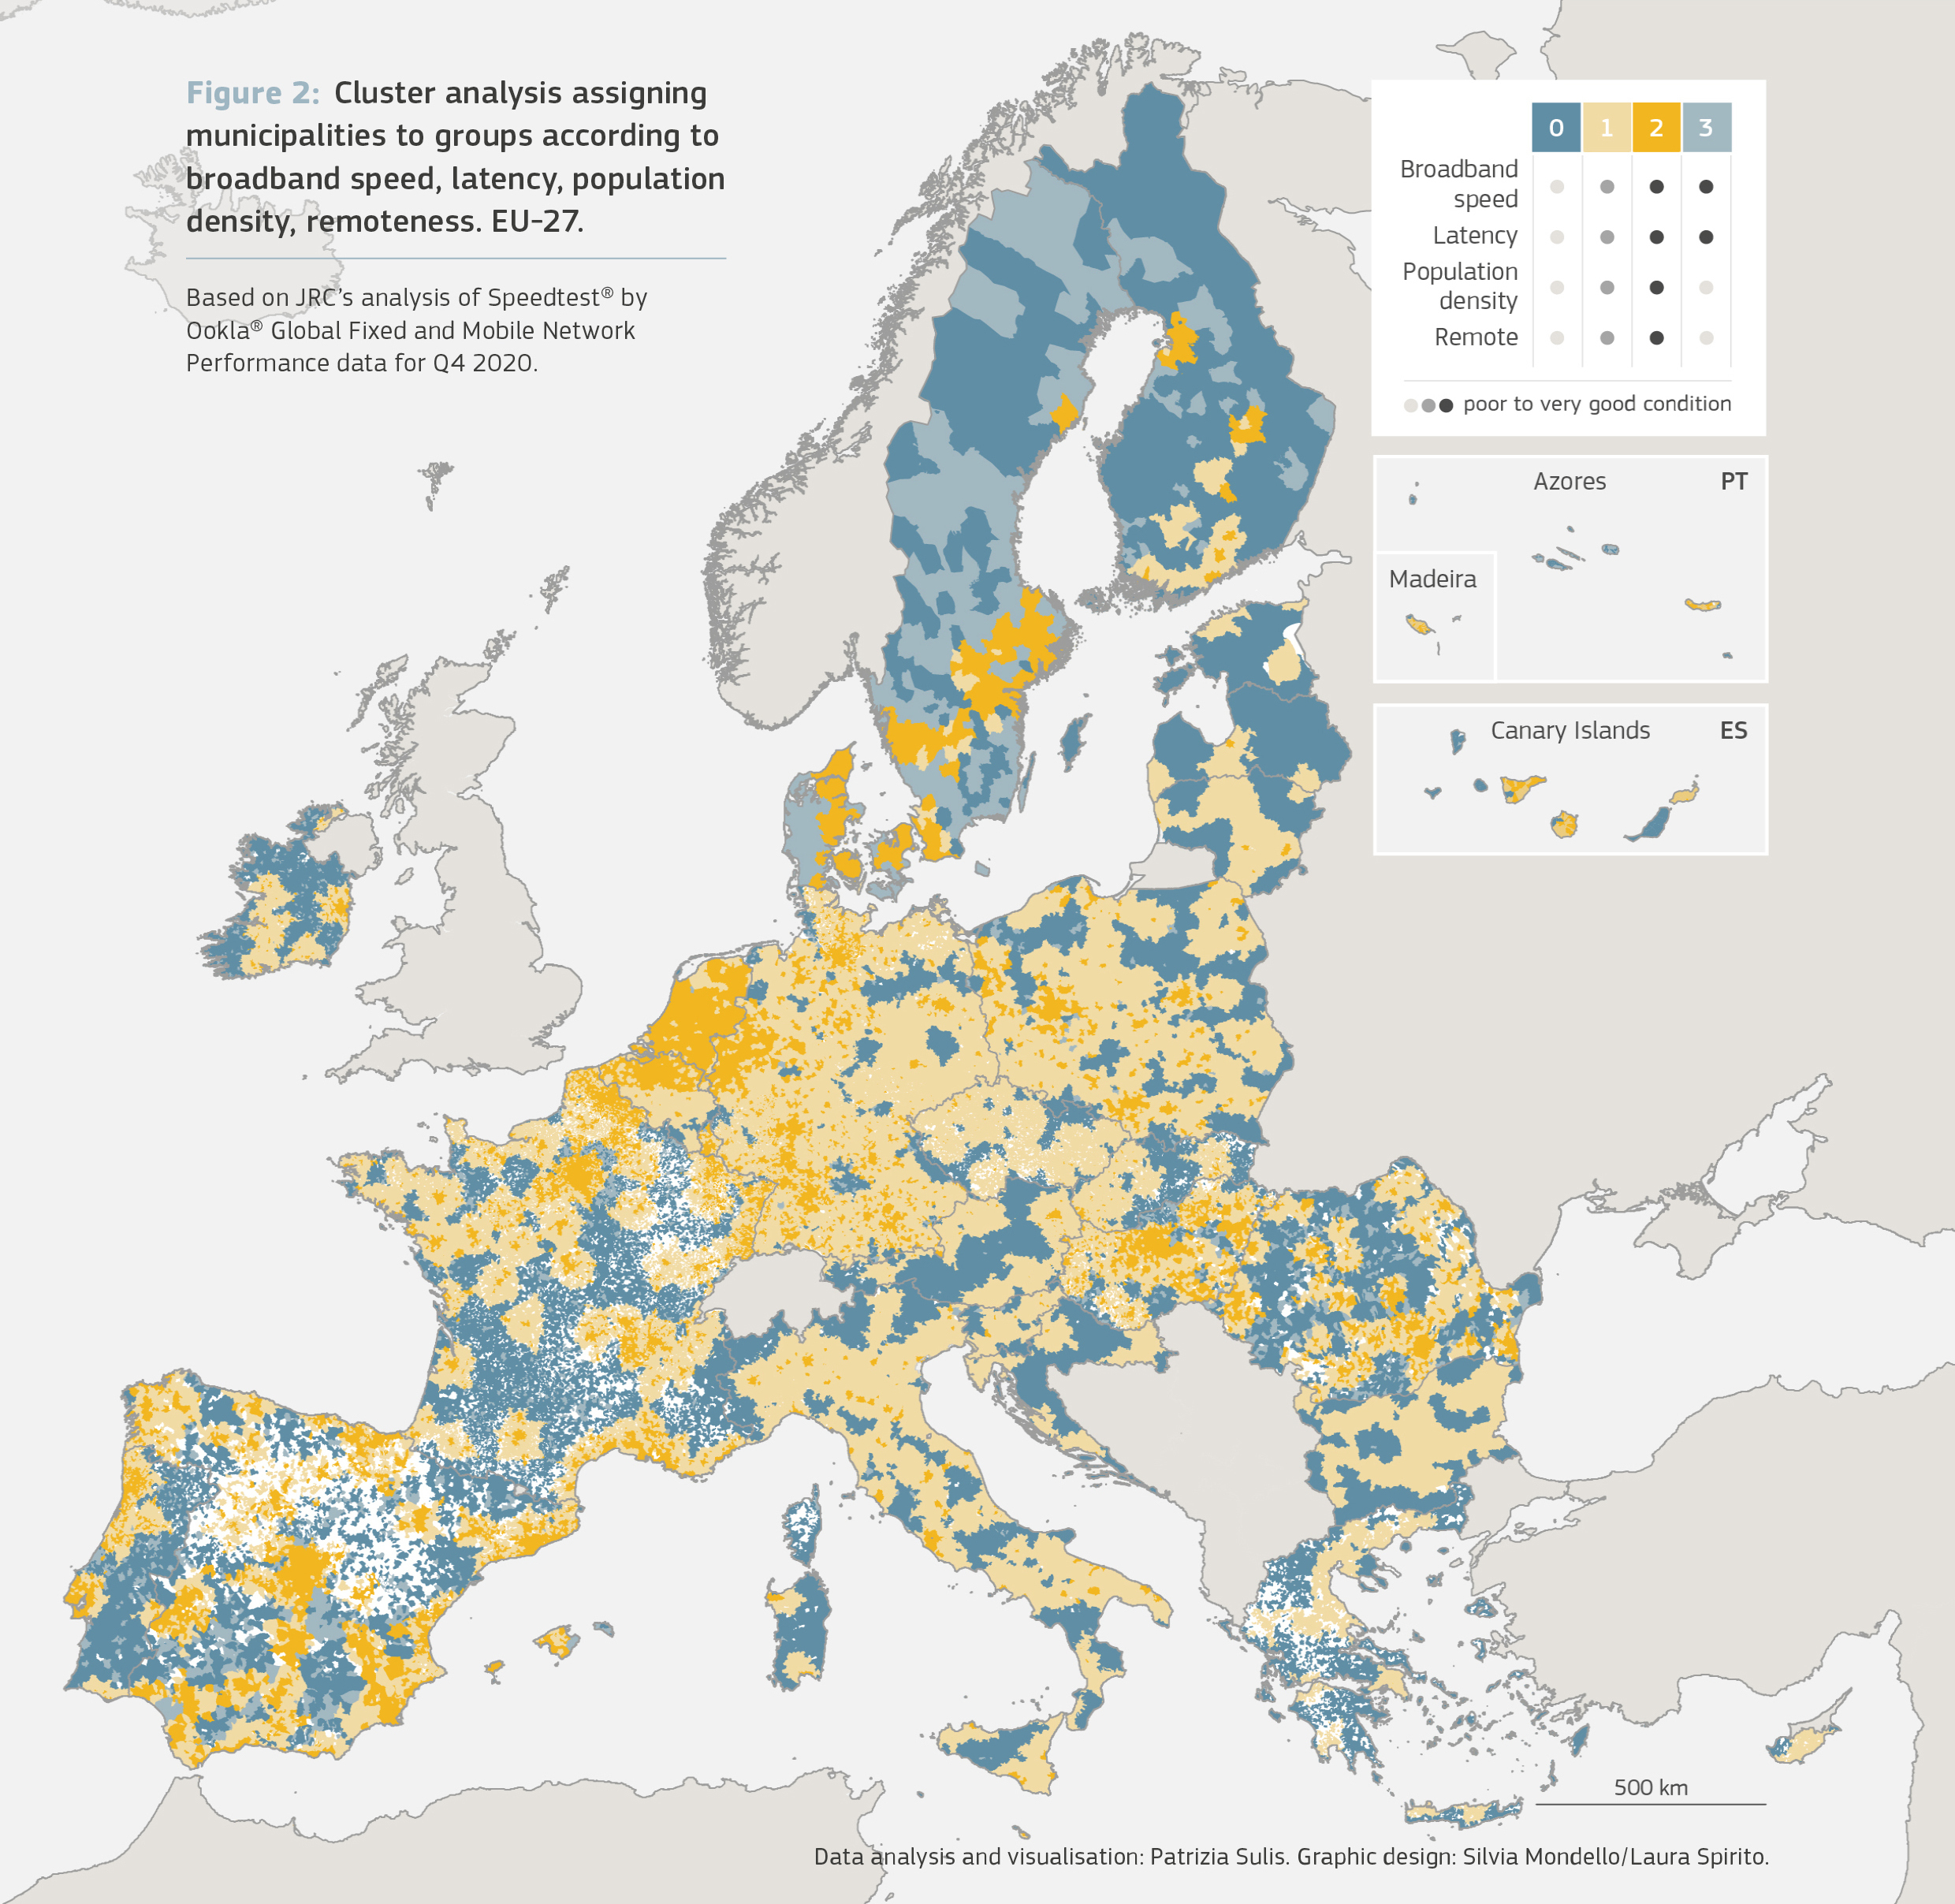
To explore the urban-rural digital divide further, the analysis employed Machine Learning to identify patterns of similarities in terms of vulnerabilities across all areas, regardless of their degree of urbanization, considering the performance of the broadband infrastructure, the population distribution and the remoteness classification of all areas. The areas (belonging to group 0 in Figure 2) are characterized by low speed, high latency, low population density, remoteness, and are identified as the most vulnerable places. However, this analysis also showed that the bad performance of broadband networks is not limited to rural areas. This means that the digital divide is not merely a matter of urban-rural, but mostly a matter of cities versus non-cities: places that would not be considered as disconnected from the physical perspective (not remote areas, but towns close to cities) can still be disconnected from the broadband perspective.

Digitalization can be an opportunity only if its rollout is quick enough to enable rural businesses to remain competitive. However, it is useless without a parallel development of digital literacy and skills for residents in rural areas. Furthermore, digital connectivity is only one player in the game, and it cannot alone overturn the depopulation trends and the other vulnerabilities affecting rural areas.

Without policy support, a lack of or poor access to high-speed broadband might leave some areas behind. Access to broadband and data might help to foster new business and economic activities, especially in vulnerable areas such as rural regions. Exploiting the potential that connectivity and digitalization represent for education and training, cooperation and networking, access to services and markets, can make these areas more attractive to people and businesses.

Cohesion Policy will support the implementation of the EU’s digital agenda. In particular, European Regional and Development Fund investments will focus on digitalization of services for businesses and citizens and rollout of the high-speed broadband. The support will go where it is most needed, i.e. areas where there is a weak take-up of digital technologies or no, or very slow, or very expensive, broadband access or where there is not enough commercial potential to attract private investors.

To read more about this work, the full report is available here.

We are grateful to Patrizia Sulis for her work with our data within the European Commission’s report and guidance in composing this article. For more information, please contact Patrizia Sulis – Scientific Officer – Joint Research Centre, European Commission.

Ookla retains ownership of this article including all of the intellectual property rights, data, content graphs and analysis. This article may not be quoted, reproduced, distributed or published for any commercial purpose without prior consent. Members of the press and others using the findings in this article for non-commercial purposes are welcome to publicly share and link to report information with attribution to Ookla.
| February 2, 2023

How the State of Vermont Gets an Accurate View of Mobile Network Coverage and Quality with Ookla Solutions [Case Study]

When driving along major federal and state-funded roadways, Vermont state residents consistently experience poor cell service and dropped calls. Drivers are unable to call 911 in an emergency with such poor coverage — and in many instances, no coverage — even along many of the state’s federally funded highways. The lack of reliable mobile network coverage has become not only a common complaint from residents, but a real public safety concern. 

The State of Vermont Department of Public Service (PSD) used Ookla Cell AnalyticsTM to identify areas of poor network coverage with crowdsourced data and Ookla Wind® to perform drive testing in those locations to get detailed coverage and performance metrics along state roadways. 


Situation

The FCC coverage maps are based on operator-provided information, and they show that coverage is sufficient in Vermont. Operatorsʼ claims of sufficient coverage have made it difficult for the state to receive the funding needed to address known mobile service issues. On the FCC maps, you can see that both Verizon and AT&T show that their LTE Voice coverage for making phone calls spans across the entire state.

Since these maps are so influential in funding decision processes, Vermont needed a way to prove that the on-the-ground experience of residents does not match up with FCC coverage maps. For PSD, identifying areas that lack service has been a critical step toward the expansion and improvement of mobile wireless service around the state

Read the full case study here.

Ookla retains ownership of this article including all of the intellectual property rights, data, content graphs and analysis. This article may not be quoted, reproduced, distributed or published for any commercial purpose without prior consent. Members of the press and others using the findings in this article for non-commercial purposes are welcome to publicly share and link to report information with attribution to Ookla.
| February 8, 2023

Latency is the Next Frontier of Consumer Experience. Are You Ready?

Internet service providers and mobile operators have spent decades optimizing their networks to provide the best speeds possible so consumers can achieve seamless connected experiences. However, the internet and how we use it is changing; bandwidth is no longer all that matters for networks operators to deliver on the possibilities that a connected world can offer. While latency has always affected connectivity, latency and responsiveness metrics have become increasingly critical to network operators focused on delivering a superior connected experience and supporting evolving consumer use cases. Read on to learn why latency matters to quality of experience, why you need to consider latency now, and how Ookla® can help you measure what matters most.

Bandwidth is now an economics problem, latency is the new opportunity horizon.

Why latency matters

A 2009 study detailed that every 100 ms of additional latency on Amazon.com, cost the company 1% of revenue. While speed has always been the focus for optimization, since the end user delay was caused by the delay of downloading data assets, now that bandwidth has increased for many people around the globe, the bottleneck for these folks is the time delay between two systems communicating.

Latency is the bidirectional roundtrip time between two endpoints.

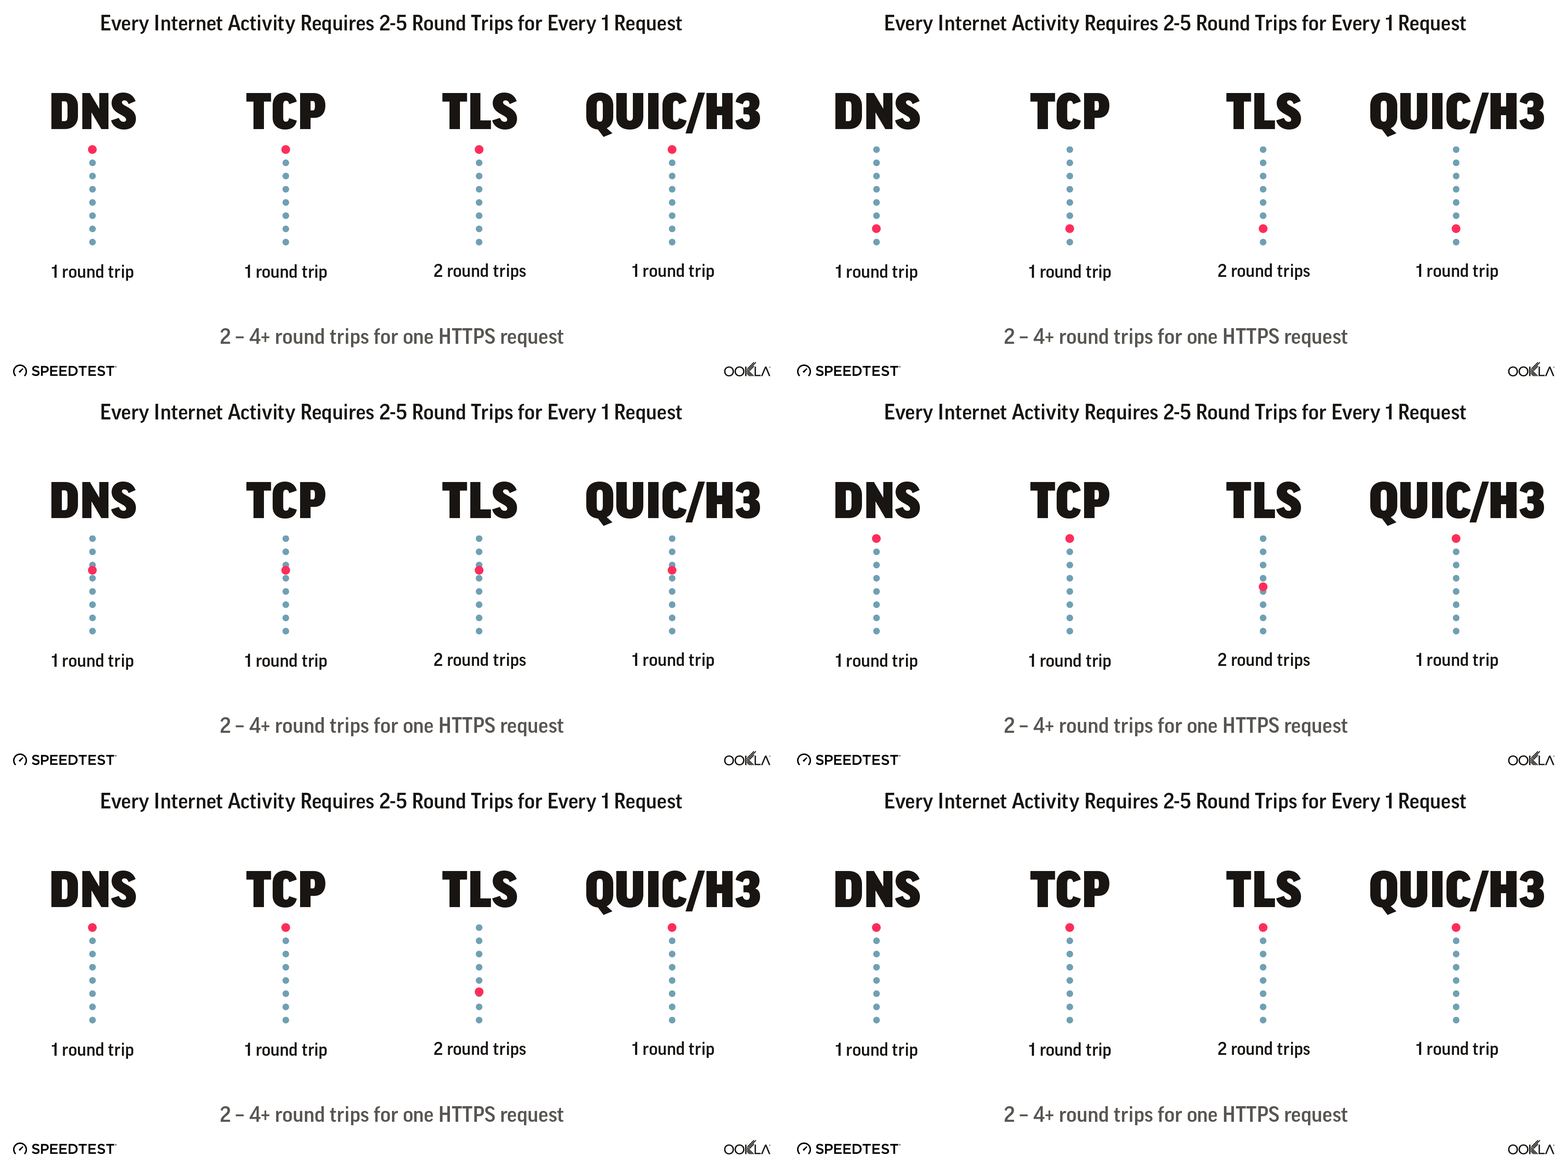
Latency matters for every online experience. While best known for gaming, video conferencing, and streaming video, the underlying internet protocols powering modern experiences rely on bidirectional communication to negotiate encryption keys, determine routing paths, and request resources. As a result, the typical request on the internet requires two to five round trip communications between various entities over different latency sensitive protocols (DNS, TCP, TLS, and QUIC/H3).

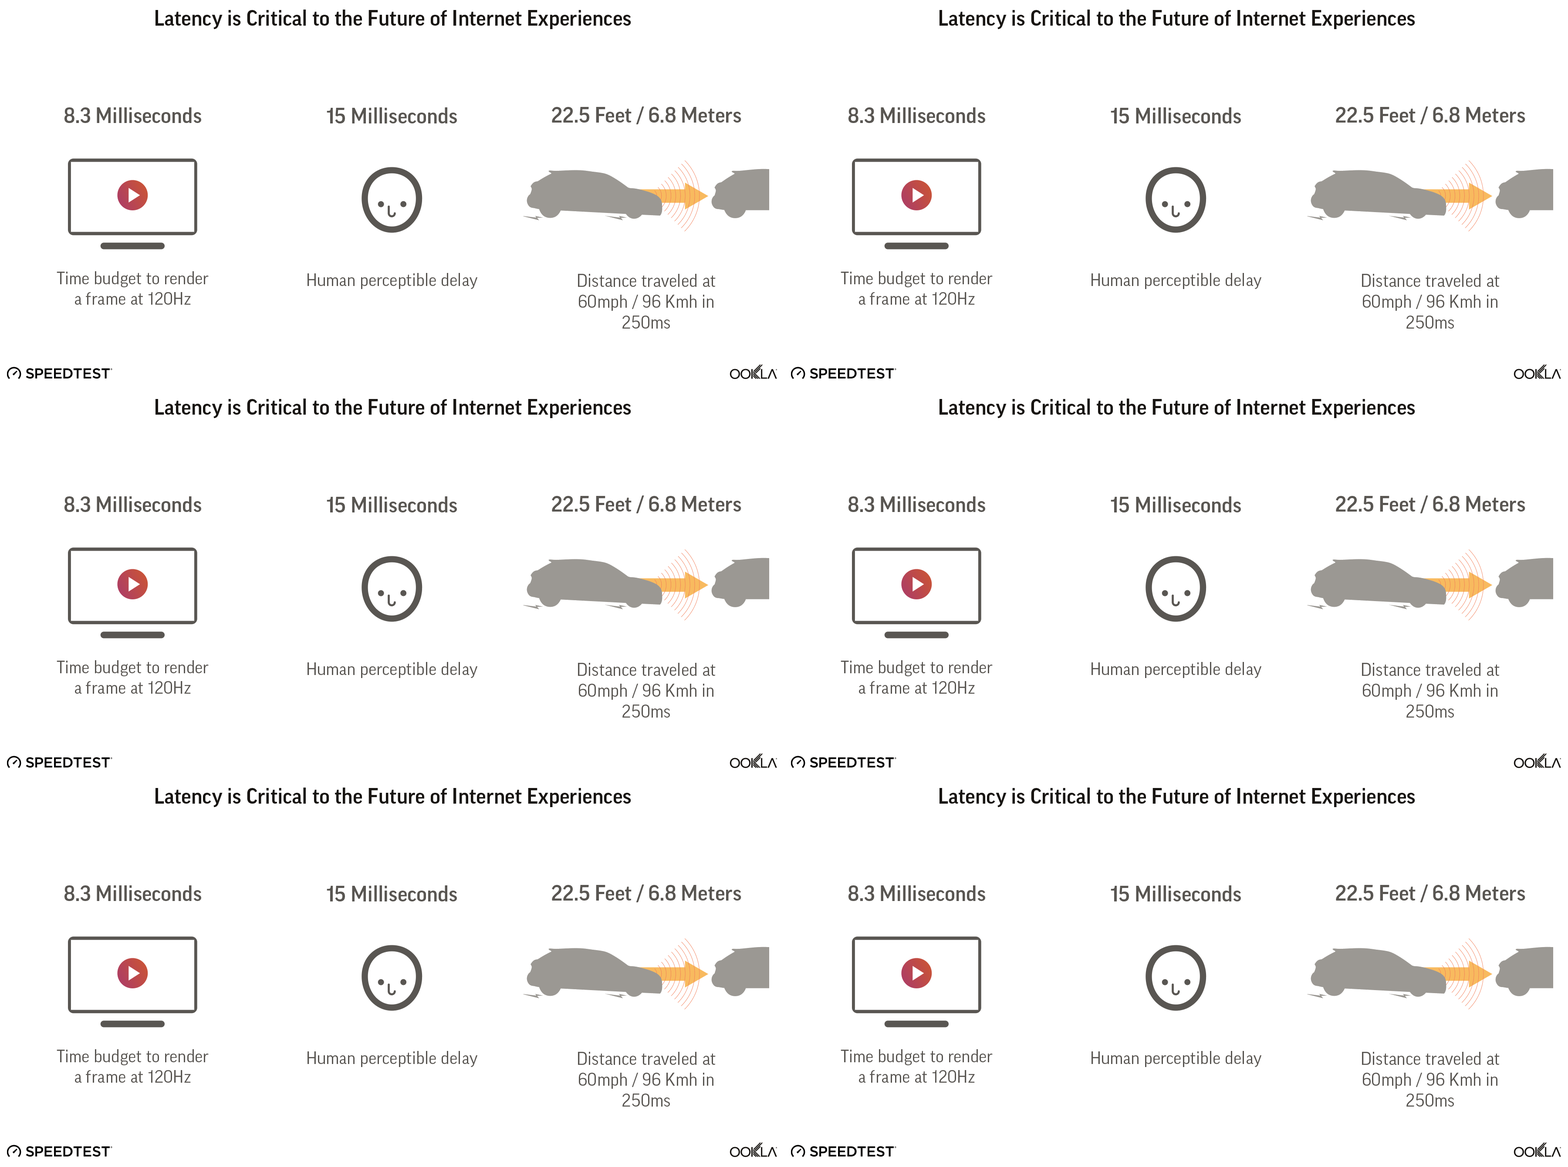
animation showing 1 round trip vs 2 for various internet protocols DNS, TCP, TLS, QUIC/H3

On a gigabit connection, 500 ms of additional latency dramatically affects the page load time. It can take 7x to load a full webpage when latency is high, as seen in the example below.

In addition to web browsing, video and voice calling needs a latency below 300 ms to provide an acceptable experience. This is a physiological threshold — below 300 ms — where the human brain can manage the delay and not speak over other parties. Above the 300 ms barrier, it’s difficult to maintain a coherent conversation.

Think back to the Amazon example above: You may not be directly losing money when your customers see a slow page load due to high latency, but you are providing a poor network experience that will result in increased customer service costs and churn. In fact, one study from the University of Massachusetts Amherst and Akamai concluded “…an increase in the startup delay beyond 2 seconds causes viewers to abandon the video. Using regression, we show that an additional increase of the startup delay by 1 second increases the abandonment rate by 5.8%.” Of course, network operators don’t control the full experience here, and things like CDN location can really affect an end user’s experience, but consumers don’t have visibility into that and the more you can optimize the portions you do control, the less negative feedback you’ll receive.

Latency will matter even more in the very near future

The future of the internet is bidirectional where download and upload communication are necessarily performed simultaneously. Whether AR and VR or self-driving vehicles, this will require dramatic improvements in latency.

animation diagram showing the effects of latency on various internet experiences

How Ookla measures latency

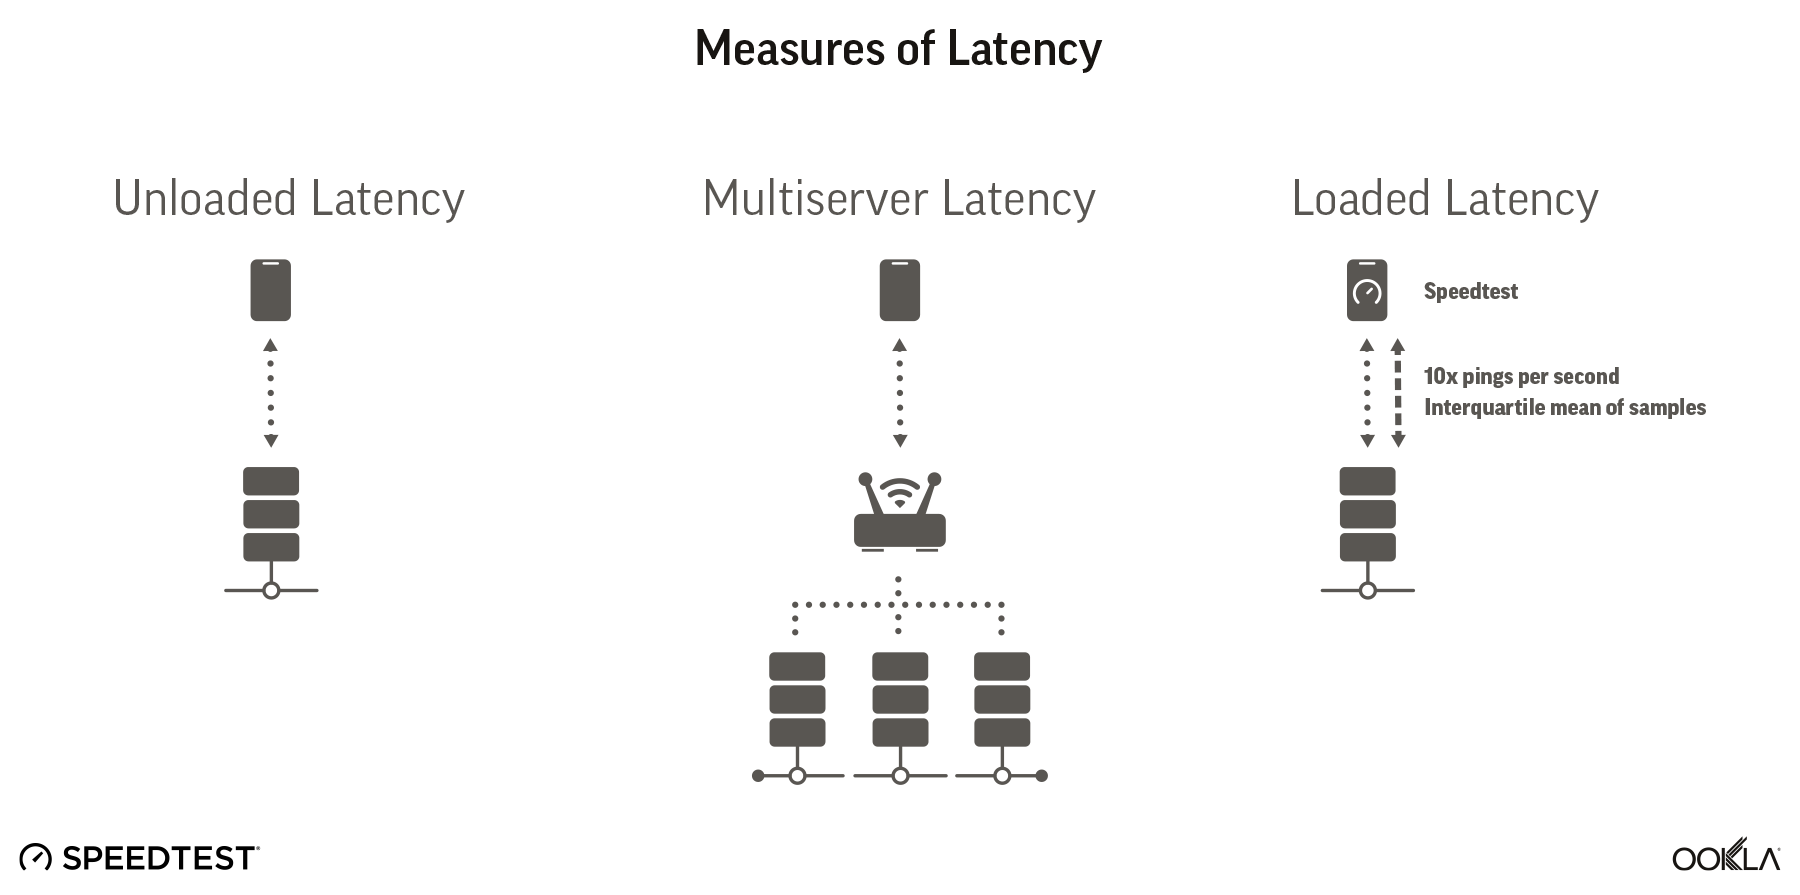
Ookla uses three main measures of latency, each of which helps you understand a specific set of issues.

diagram showing three latency measurements, unloaded latency, multiserver latency and loaded latency

Unloaded latency

Unloaded latency is our classic measure of latency, looking at the time it takes for a bidirectional round trip on the last mile of a connection under no load. This is a best case measure of latency.

Multi-server latency

Multi-server latency measures latency to multiple connections and then takes an average. This is a better representation of a customer’s experience as their connection pulls media and other information from a variety of locations around the internet. Poor multi-server latency can show the need for improvement in peering arrangements and transit. This metric tests to on-net and off-net locations.

Loaded latency

Loaded latency measures latency under a large load. We represent both download loaded latency and upload loaded latency and this metric gives an approximation of how a network performs with poor buffer management or if a background app is using a lot of bandwidth.

Global latency today

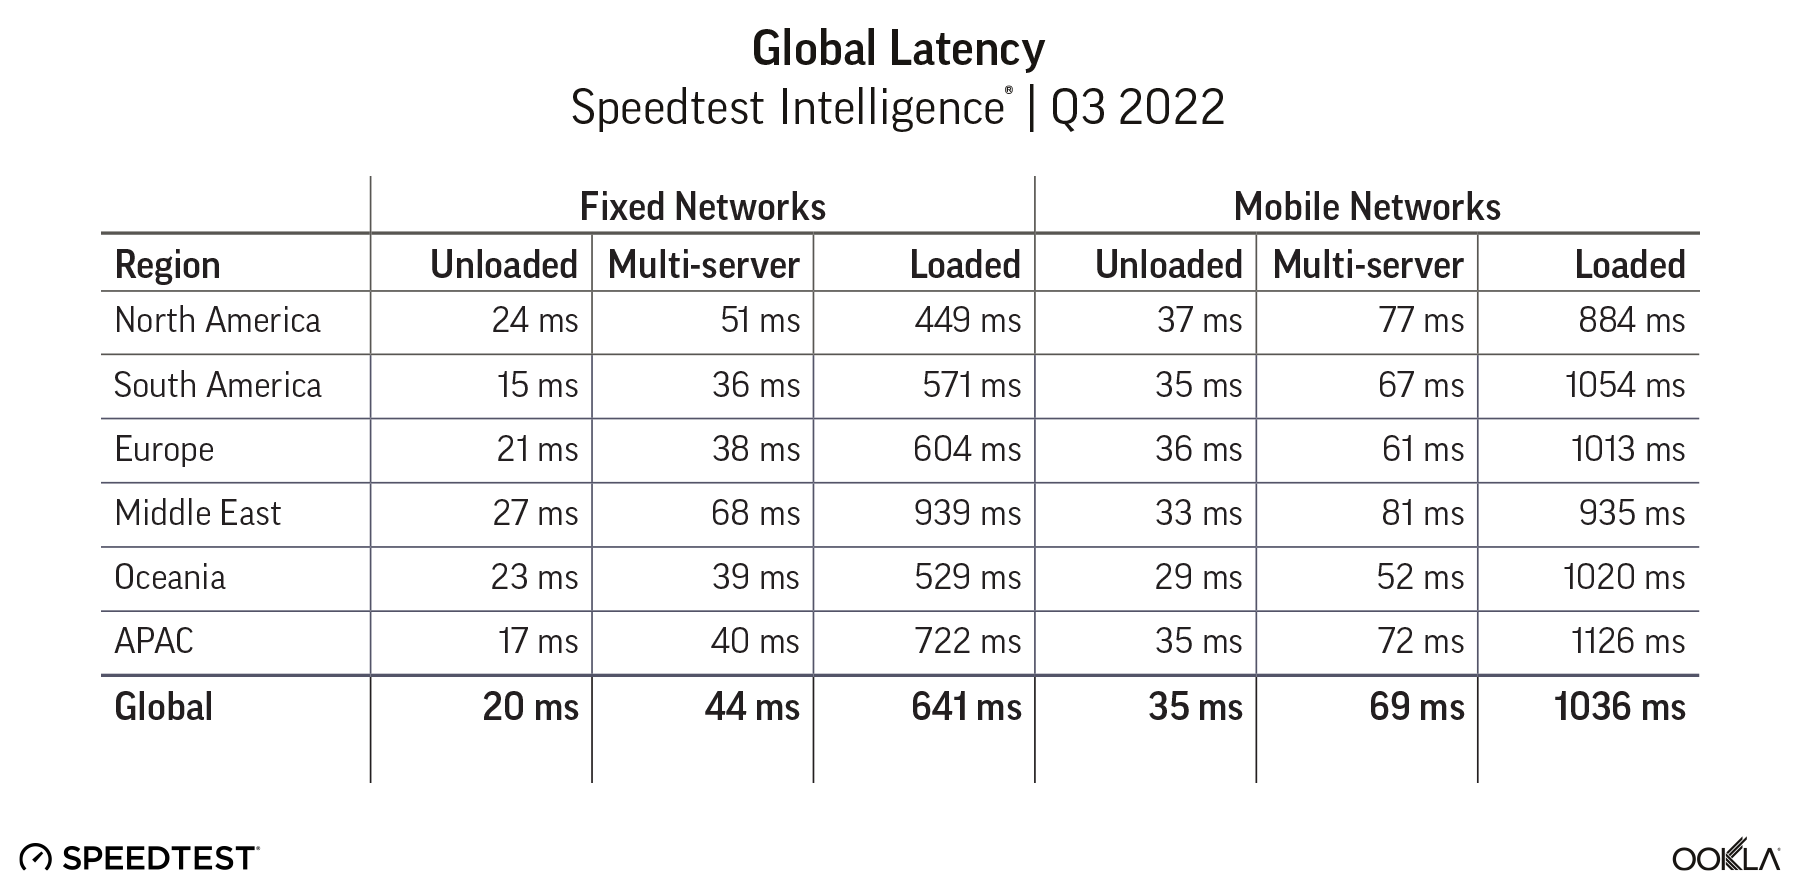
Given the importance of latency to consumer experience today, it’s clear that there is much room for improvement in latency at a global level. Investments in better latency will make for major improvements in connected experiences overall, including video calling, internet shopping, and other day-to-day internet activities.

Table showing fixed and mobile latency data for various regions across the world

Latency is key to present user experiences, and will be the defining factor for unlocking future connected opportunities. The first step to improving latency on your network is to have the data to make informed decisions. Look forward to future articles where we dive into how to use this data to identify common areas of latency bottlenecks and optimize your network. If you’d like to discuss how our data can help you improve latency on your network, stop by Booth 2i28 in Hall 2 at MWC.

Ookla retains ownership of this article including all of the intellectual property rights, data, content graphs and analysis. This article may not be quoted, reproduced, distributed or published for any commercial purpose without prior consent. Members of the press and others using the findings in this article for non-commercial purposes are welcome to publicly share and link to report information with attribution to Ookla.
| February 7, 2023

Discover Hidden Network Problems Using Real-World QoS and QoE Measurements [Webinar]

Consumers care less about speed than they do about the actual connected experiences they’re having, and throughput alone doesn’t provide a full picture into those connected experiences. At Ookla, we’ve been defining network performance standards for nearly two decades. Over the last few years, we’ve adjusted our test collection methods to meet consumers where demand is, which is why our SDK collects user experience metrics for video streaming, video conferencing, gaming, and web browsing. 

Through combining RF and user experience data, operators can get unparalleled insight into a network’s quality of experience (QoE) and quality of service (QoS), at the times and locations consumers care about most. Register for our February 14 webinar to learn more about combining crowdsourced QoS and QoE metrics to get a comprehensive picture of your customers’ network experience. 

Why do user experience metrics matter? 

QoS, often defined by RF measurements like RSRQ and RSRP, is about providing the baseline network performance that customers expect. QoE measures the quality that customers are experiencing in the applications they are using; these metrics focus on end user experiences with a network and connected services, and can help push networks to meet the use cases of tomorrow. Many operators are still defining QoE as they are working to get a better understanding of their customers’ experience making video calls, playing games, streaming entertainment, and accessing their favorite content from mobile devices. 

With Net Promoter Score™ (NPS) tied closely to customer network experience, providing great QoE is a huge opportunity for operators to improve customer satisfaction and reduce customer churn. 

Good signal quality doesn’t equal good user experience 

What do you do when probes, network counters, walk tests, and drive tests show good results, but customers are still experiencing problems? A network can look great internally but otherwise hidden factors can create a poor user experience. 

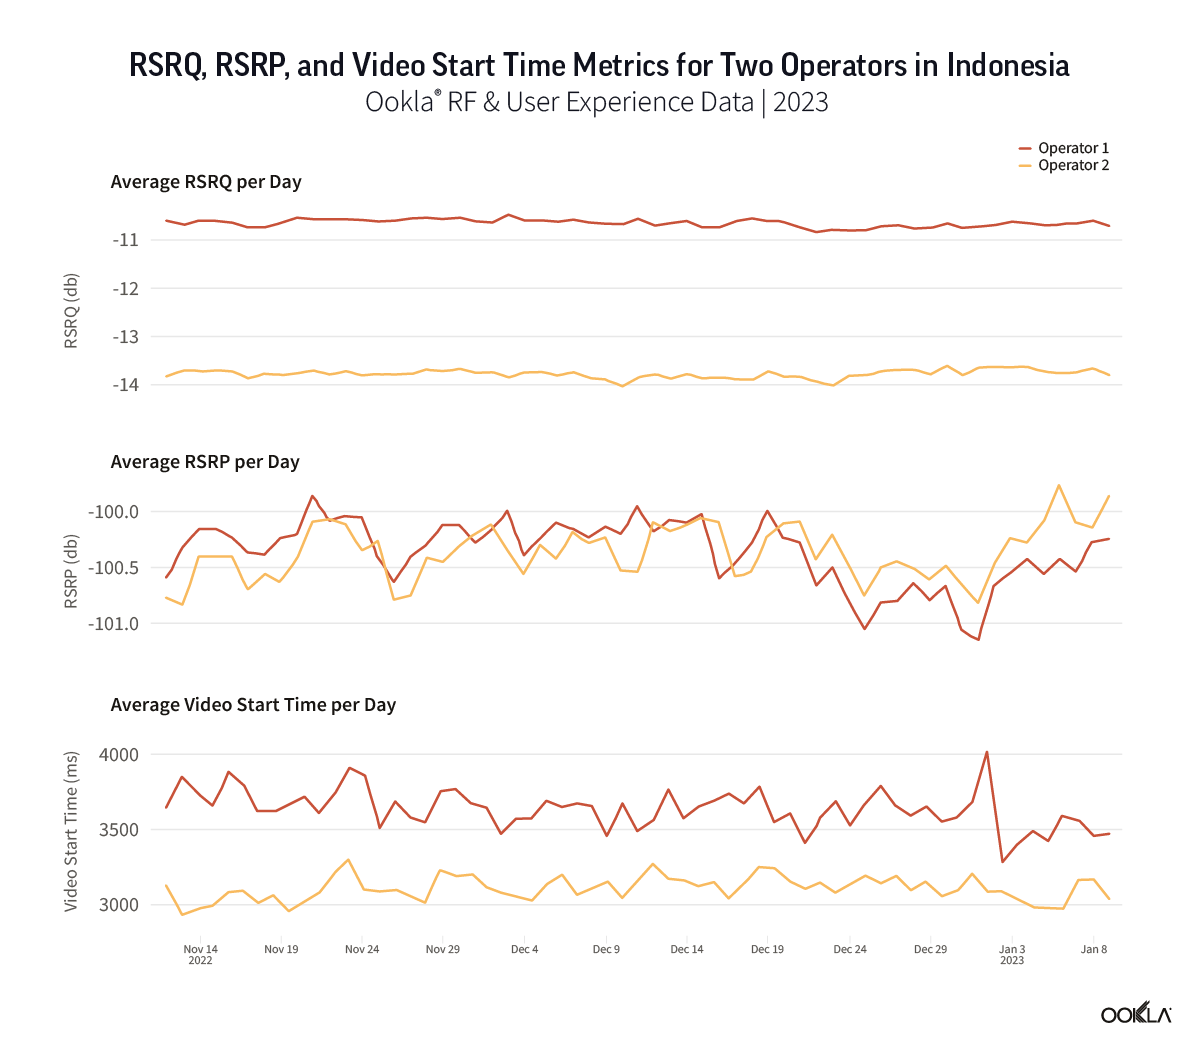
In the example below, we compare RF KPIs with video streaming KPIs for two operators in Indonesia. 

Operator 1 has much better RSRQ and about equal RSRP compared to Operator 2. However, Operator 1 has a significantly slower video start time, resulting in a worse user experience for video streaming. Operator 1 appears to have a hidden problem, such as capacity or provision problems, causing the poor video streaming experience on their network.

Tune into the webinar at 8 a.m. PST / 11 a.m. EST / 4 p.m. GMT on Tuesday, February 14 to see more real-world examples of how QoS and QoE data can be used to discover hidden network problems. A recording will be provided for registrants who can’t join the live presentation. Register now

Ookla retains ownership of this article including all of the intellectual property rights, data, content graphs and analysis. This article may not be quoted, reproduced, distributed or published for any commercial purpose without prior consent. Members of the press and others using the findings in this article for non-commercial purposes are welcome to publicly share and link to report information with attribution to Ookla.
| September 11, 2022

5G Supporting Digital Transformation of the Hajj Experience

This year’s Hajj, held July 7-12, marked an important proof point in the development of Saudi Arabia’s 5G networks and their ability to support increasing numbers of pilgrims, in line with the Saudi Vision 2030 goals. It was the first Hajj to welcome international pilgrims back to Mecca following COVID-19, with one million domestic and international guests allowed to attend. It was also the first stress-test of the nation’s 5G networks, which launched in October 2019. 5G networks are also becoming a central point of innovation for digital services to support the Hajj pilgrim’s experience.

5G network densification driving Saudi Arabia’s performance gains

The first commercial 5G network launched in Saudi Arabia in October 2019. Thanks to early allocation of key spectrum bands for 5G use and strong investment from network operators, Saudi Arabia has rapidly climbed Ookla’s Speedtest Global Index™, moving from 46th place in January 2019 with a median download speed of 22.14 Mbps to 8th place in July 2022 at 96.23 Mbps.

Stc led in terms of 5G base stations (based on reported data), with 6,506 nationally as of December 2021, representing a density of ~5,400 people per 5G base station, putting it on par with operators such as NTT DoCoMo and Deutsche Telekom. According to Speedtest Intelligence®, 5G Availability in the market (the percentage of users with 5G-capable devices who spent a majority of time connected to 5G networks) hit 25% at the end of 2021, supported by the network densification efforts of the nation’s three mobile network operators.

The Saudi Communications, Space & Technology Commission (CST) announced full ICT readiness for the Hajj in late June. Operators have sought to densify their networks around Mecca and locations specific to the Hajj, with over 5,900 mobile towers operational, including 2,600 5G towers, 41% more than in 2021, according to CST. Given the million pilgrims in attendance in 2022, this equates to a maximum density of 385 people per base station (assuming operators have located equipment on each tower). Operators have also installed over 11,000 Wi-Fi access points, with pilgrims offered two hours of free access per day.

Hajj represents a unique challenge for mobile networks

Hajj takes place over a set number of days each year, in specific locations in and around the city of Mecca. It represents a unique demand on telecom networks, considering the number of visitors and their movement and congregation around various locations integral to the pilgrimage. For example, the journey from Mina to Arafat is 13 km and is undertaken by foot, while pilgrims also congregate in locations such as the Masjid al-Haram mosque in Mecca on the final day.

Pilgrims attending the Hajj typically use mobile networks to keep in touch with family and relatives at home and to document their pilgrimage. With a million people in attendance, the build up to the Hajj and ensuring sufficient network infrastructure is in place has become a major project. The CST works with network operators in the region to ensure sufficient network coverage and capacity before Hajj, while also monitoring performance metrics during Hajj. CST also developed business continuity and recovery plans to ensure the continuity of telecom and ICT services for pilgrims.

5G performance during Hajj 2022

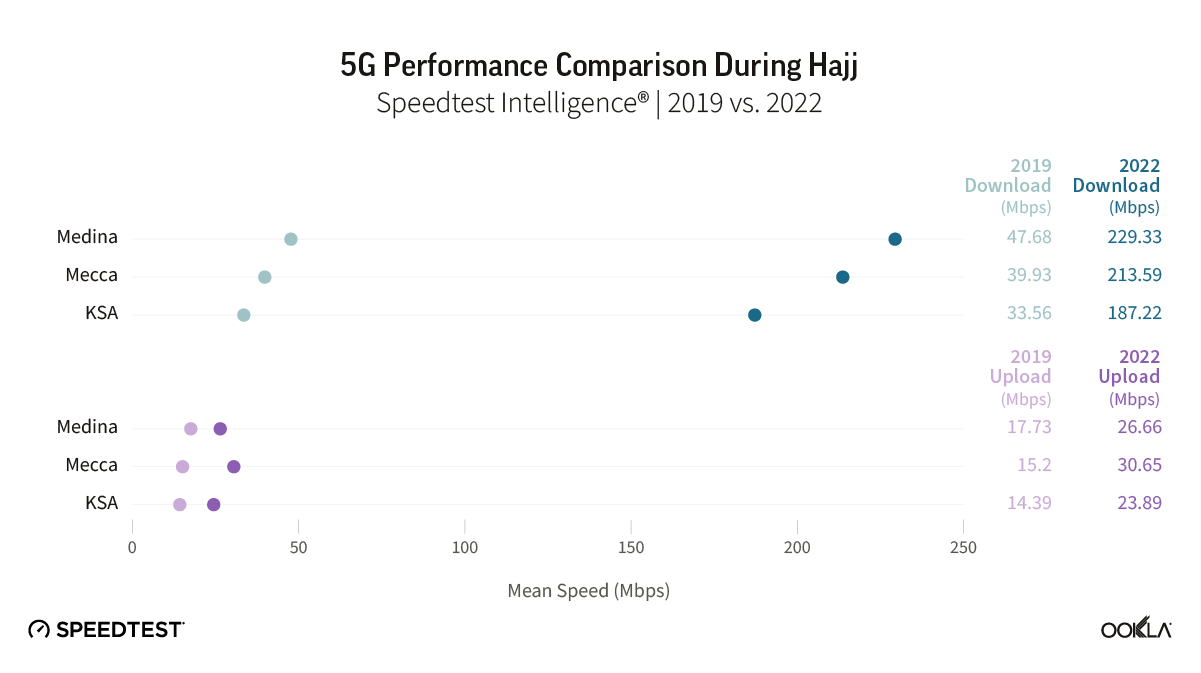
Speedtest Intelligence® data shows that the introduction of 5G has massively boosted network performance in Saudi Arabia. In addition, despite the large number of pilgrims and resultant demand for capacity, the level of network densification at Hajj locations has driven increased performance over and above national levels. During this year’s Hajj, mean download speeds across all technologies in Saudi Arabia clocked in at 187.22 Mbps, while the mean upload speed was 23.89 Mbps. By contrast, the speeds recorded in Medina city were faster, with a mean download speed of 229.33 Mbps and a mean upload speed of 47.68 Mbps.

chart comparing 5G performance during Hajj, 2019 vs. 2022

Operator performance at Hajj locations can vary based on both the network infrastructure deployed and the level of congestion on each network. Speedtest Intelligence data during Hajj 2022 (7-12 July), for the city of Medina showed that stc achieved a median 5G download speed of 470.00 Mbps during Hajj 2022, ahead of Zain with 375.20 Mbps. Mobily led for median 5G upload performance with 40.18 Mps. In Mecca, there was no statistically significant lead for any operator in terms of median 5G download speeds, with Mobily recording 453.00 Mbps and stc 393.73 Mbps, while Mobily led on median 5G upload speed with 54.77 Mbps.

maps of 5G performance of Medina and Mecca during Hajj 2022

The impressive network speeds available in these locations are helping drive increased data use. Ericsson’s Mobility report estimates that global data traffic per user was on average 395 MB per day during 2021, while in GCC States the average was 723 MB. CST reported that daily internet consumption during the Hajj averaged 851 MB per user, an uplift of 142% compared to the average of 352 MB consumed in 2019. Beyond voice calls, video and social media apps including YouTube, TikTok, Facebook, Snapchat, and Instagram were the most heavily used.

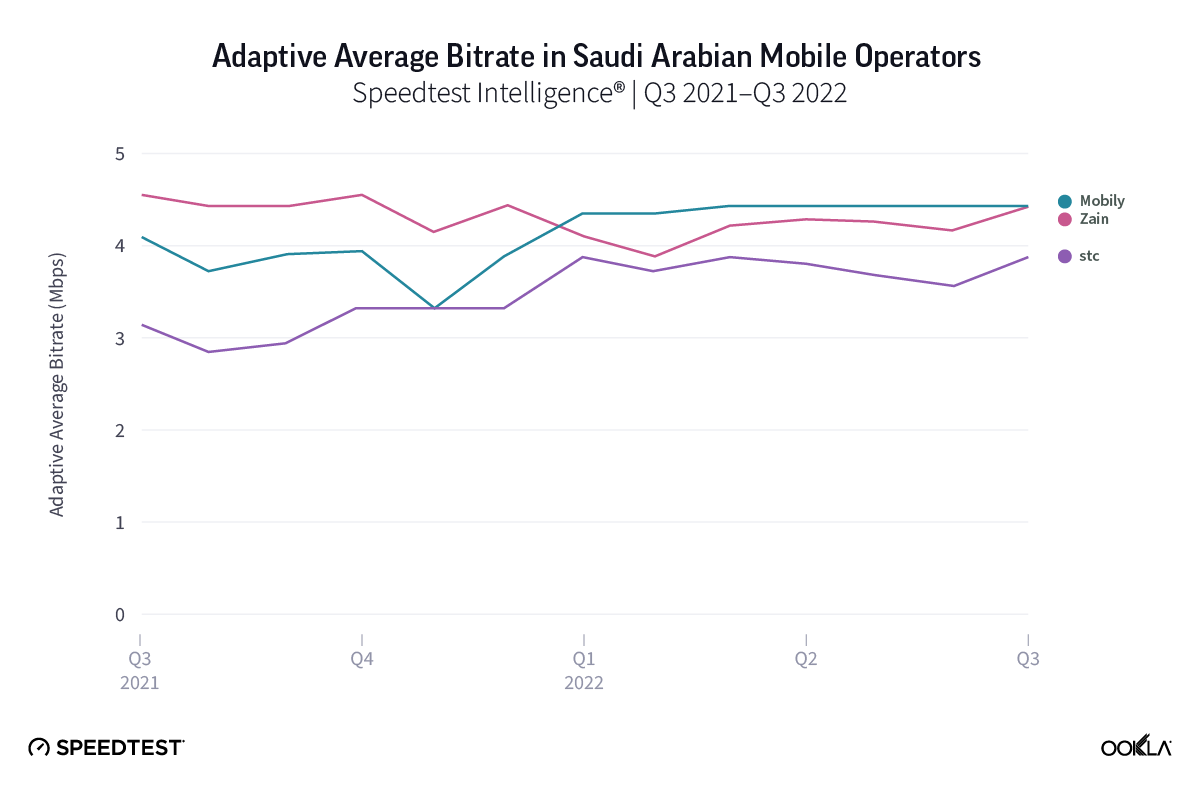
The growth in video calls and social media video use necessitates sufficient network capacity to support an optimal video user experience. Speedtest Intelligence data shows that the adaptive average bitrate supported by 5G networks in the country was 3.97 Mbps in July, up from 3.57 Mbps in December 2021. Supporting a higher bitrate allows networks to serve higher definition video content. As a result, 77.2% of users recorded an adaptive primary video resolution of at least 720p, which is generally considered high definition. Mobily and Zain performed similarly in July, recording an adaptive average bitrate of 4.43 Mbps and 4.42 Mbps respectively.

Chart showing adaptive average bitrate in Saudi Arabia by operators

Mobile networks driving digitization of Hajj services

For several years, Saudi Arabia’s Ministry of Hajj and Umrah has sought to improve the experience and safety of pilgrims visiting the country. Prior to this, managing the Hajj application process, as well as logistics, accommodation, and other important services such as healthcare provision had been a largely manual process, and given the scale of Hajj, subject to errors and delays. The Pilgrim Experience Program was launched in 2019, following a study involving thousands of Muslims worldwide to define their expectations and needs. It seeks to enable new innovations (many supported by mobile network connectivity) designed to enhance the pilgrim’s experience during the Hajj and Umrah (pilgrimage outside of Hajj). Key developments include:

Hajj Smart ID. 2021 saw the introduction of electronic “Hajj cards,” allowing contactless access to all religious sites, accommodation, and transport. These digital passes aimed to facilitate the movement of pilgrims to and from Mecca, reducing waiting times for transport between Mecca and the Holy Sites, while also minimizing the need for human contact (an imperative during the COVID-19 pandemic). This initiative was expanded in 2022 with the introduction of the Hajj Smart ID, enabling pilgrims, Hajj staff, and organizers to access medical services, location data, as well as coordination and communication with the rest of a pilgrim’s group.

Digital Healthcare Services. Healthcare for pilgrims attending Hajj has been a major focus, given the strenuous nature of the pilgrimage and the high temperatures pilgrims are exposed to. The smart bracelet initiative, introduced in 2021, provided pilgrims with a connected wearable health device, which included their personal data as well as health status. The bracelet monitored blood oxygen levels and heart rate in real-time, allowing pilgrims to seek emergency medical or security assistance services. This year, the Saudi Minister of Health launched a “Holodoctor” service in partnership with stc, using 5G connectivity to offer pilgrims medical services via 3D video conference, including inspection, diagnosis, and the disbursement of medicines.

Crowd management. The “Tafweej” program focuses on crowd management for the Hajj, a vital task in light of problems in the past caused by overcrowding which led to fatalities. Organizers have sought to group pilgrims together and schedule movements of these groups using an electronic system that monitors traffic flow at key sites. During 2022’s Hajj, CITC and GPH (General Presidency of Haramain) trialed an indoor smart navigation system to help pilgrims and operations teams navigate the Grand Mosque more efficiently. Stc has also looked to introduce Augmented Reality (AR) services to support this effort, providing virtual guides for Tawaf (the part of Hajj involving circumambulation of the Ka’bah), as well as providing directions and information about the Grand Mosque (Mecca Haram). Saudi Arabia’s Vision’s 2030 goal is to support 30 million pilgrims annually, a huge increase over current levels, and will rely on further innovations built on top of the nation’s rapidly developing 5G networks. Click here to find out more about how Ookla’s Speedtest Intelligence data can offer competitive network insights and support targeted network investment decisions.

Ookla retains ownership of this article including all of the intellectual property rights, data, content graphs and analysis. This article may not be quoted, reproduced, distributed or published for any commercial purpose without prior consent. Members of the press and others using the findings in this article for non-commercial purposes are welcome to publicly share and link to report information with attribution to Ookla.

| January 8, 2023

Hong Kong & Macau: Driving Greater Adoption of Fiber Services in Advanced Telecoms Markets

Key messages

  • Despite ranking highly in Ookla’s Speedtest Global Index™ based on median download speeds, operators in both Hong Kong (SAR) and Macau (SAR) are focussed on driving greater fixed broadband performance and fiber adoption.
  • We see greater proliferation of advanced fiber services in both markets to help encourage user adoption of faster fiber services, including flagship 10 Gbps fiber connections, fiber to the room (FTTR) services, and well as the option for subscribers to purchase multiple Gigabit channels which utilize the same connection, allowing them to allocate channels for different activities.
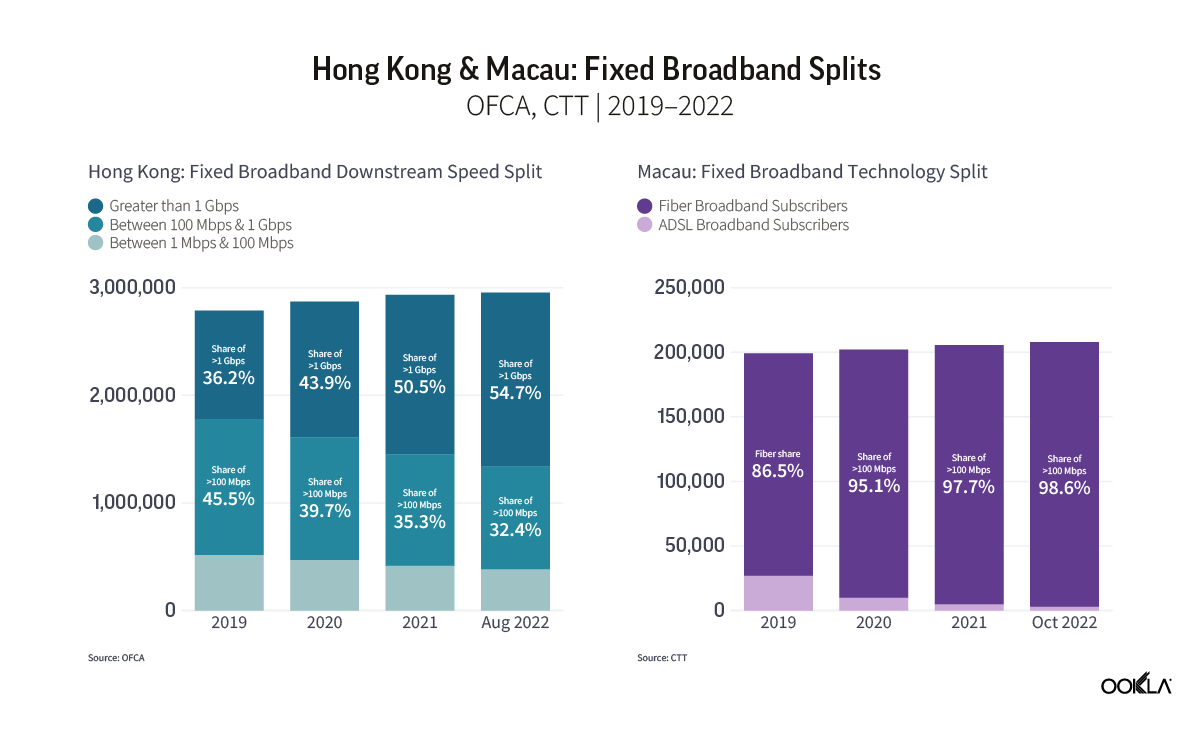
  • The latest statistics from the regulators in both markets point to further increases in fiber penetration over the course of 2022, reaching a high of 84.6% in Hong Kong, and 98.6% in Macau.
  • Ookla® Speedtest Intelligence® data for Q3 2022 shows that China Mobile Hong Kong (CMHK) led the Hong Kong market with a median download speed of 271.99 Mbps, while CTM led the Macau market with a speed of 160.15 Mbps.

Advancing towards a gigabit digital economy

Ookla recently presented at the Communications Association of Hong Kong’s (CAHK) Symposium 2022, “Challenge and Opportunities for Fiber Gigabit Economy”. Markets like Hong Kong  and Macau are advanced in terms of fixed network development and adoption, characterized by low levels of connection growth and strong fiber penetration, and Ookla’s Speedtest Global Index™ ranks Hong Kong 5th and Macau 12th on median fixed download speeds, as of November 2022. The development of fixed broadband networks in Hong Kong and Macau is predominantly driven by market forces, however, the Government of Hong Kong has sought to intervene, by subsidizing the deployment of fiber networks in remote locations, with a view to reducing digital inequality and helping boost the growth of the digital economy.

To track broadband adoption, the Office of the Communications Authority (OFCA) in Hong Kong monitors broadband adoption by advertised speed and technology mix, while the Macau Post and Telecommunications (CTT) monitors broadband adoption by technology. Based on the latest data they provide for 2022:

  • The number of broadband subscribers in Hong Kong rose by 0.7% during the first eight months of 2022, to reach 2.95 million. Fiber-to-the-Home/Building (FTTH/B) penetration stood at 84.6%, and 87.1% subscribed to packages with a maximum download speed equal to or greater than 100 Mbps.
  • Macau saw fixed broadband subscribers grow by 1.1% during the first 10 months of 2022, to reach 208,000, with a fiber penetration rate of 98.6%.

Chart of Hong Kong and Macau fixed broadband splits

Global comparison leaves room for improvement

We used Ookla® Speedtest Intelligence® data to compare broadband performance for Hong Kong and Macau with that of other major cities globally. Hong Kong recorded median Wi-Fi download speeds of 203.46 Mbps in Q3 2022, up from 184.79 Mbps in Q4 2021. Macau, on the other hand, lags behind its peers in terms of its median download speed performance, recording 160.13 Mbps in Q3 2022, up from 136.89 Mbps in Q4 2021. Despite strong download performance, median Wi-Fi upload speeds in Hong Kong lagged behind download performance, at 153.96 Mbps, while Macau recorded a more symmetrical median upload speed of 148.73 Mbps. Greater penetration of fiber in broadband access networks allows providers the ability to offer more symmetrical upload and download speeds.

Chart of Hong Kong and Macau Wi-Fi performance versus major global cities

Hong Kong: China Mobile Hong Kong leads on performance

We examined fixed Wi-Fi performance in Hong Kong, excluding any 5G fixed-wireless internet connections from the analysis. Providers in Hong Kong offer a range of broadband packages based on network speeds, but are also starting to differentiate through additional services such as the provision of fiber to the room and security services. Strong competition continues to drive innovation in the market, with China Mobile Hong Kong (CMHK) offering dual Gigabit fiber connections for additional capacity, and NETVIGATOR offering a Multi-Use Broadband Service, which provides bandwidth on multiple channels (up to four), with separate IP addresses, to allow consumers to divide their activities between channels. The availability of higher speed subscription tiers depends on the provider’s footprint and whether fiber connectivity is to the premises (FTTP) or to the building (FTTB), with some buildings utilizing copper as part of the last mile. Migrating Hong Kong’s remaining FTTB connections (17.8% of total as of August 2022) to FTTH (66.8% of total) would help boost median speeds.

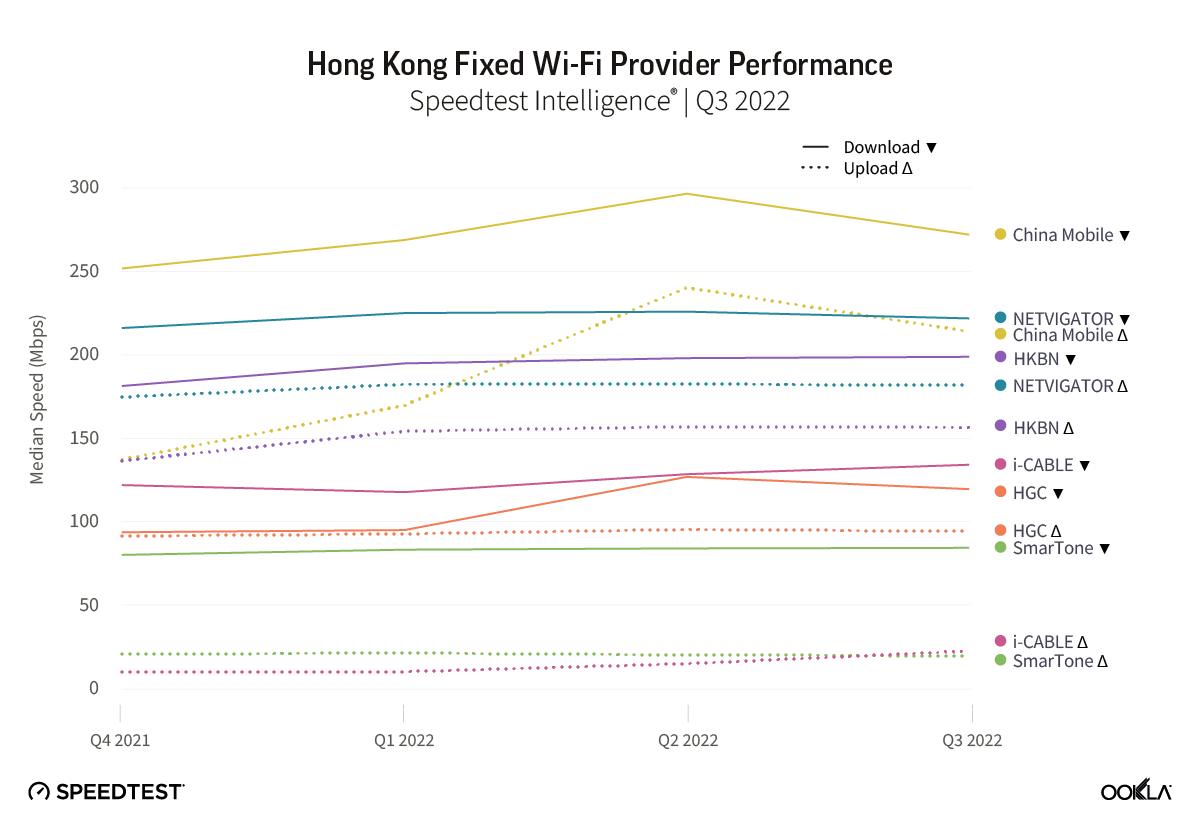
Chart of Hong Kong fixed Wi-Fi provider performance

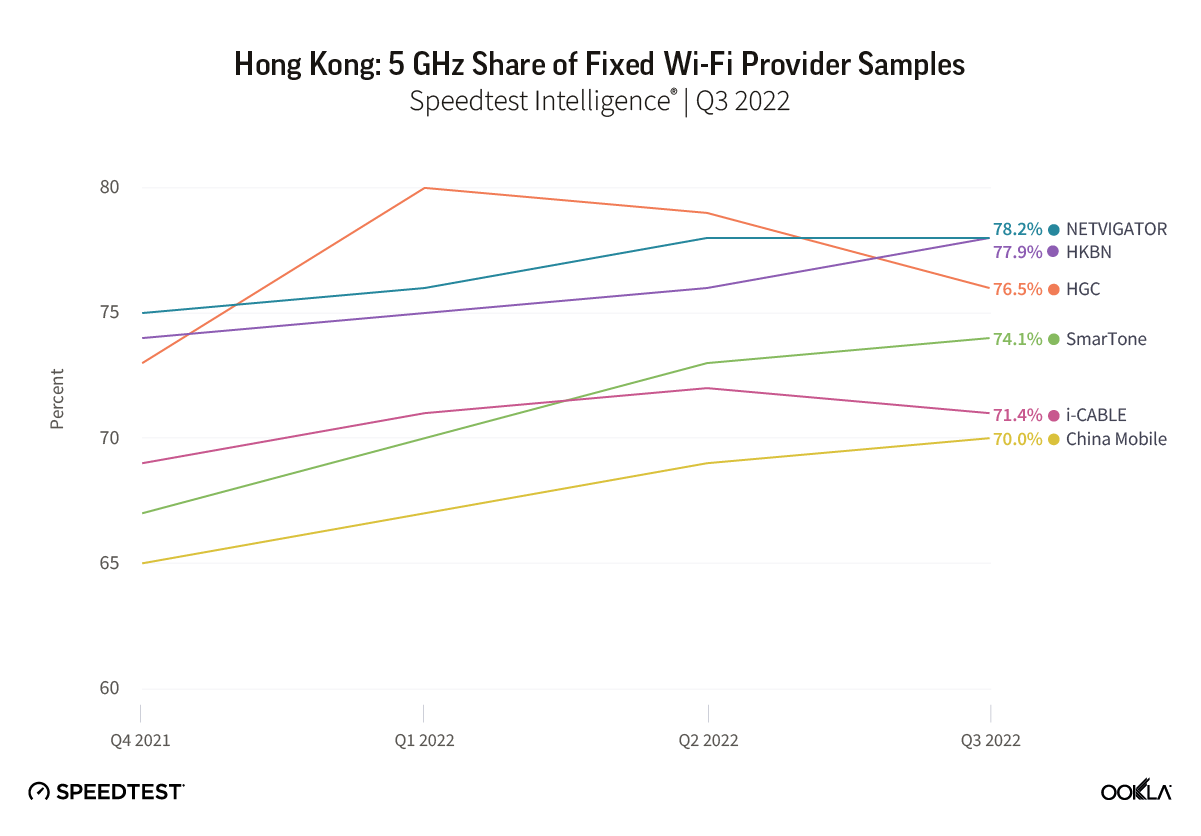
Our examination of fixed broadband Wi-Fi performance in Hong Kong shows that CMHK was the fastest provider overall during Q3 2022, with a median download speed of 271.99 Mbps, followed by NETVIGATOR with 221.79 Mbps. While providers continue to market broadband based primarily on download speeds, services such as video calling and online gaming demand are driving the importance and growth of upload speeds. CMHK also led the market based on median upload speeds at 213.93 Mbps during Q3 2022, followed by NETVIGATOR and HKBN. Looking at the distribution of Wi-Fi samples between 5 GHz, which offers higher capacity than lower frequency bands, NETVIGATOR and HKBN led the market based on the percentage of 5 GHz samples, with 78.2% and 77.9% respectively.

Chart of Hong Kong 5 GHz share of fixed Wi-Fi provider samples

Macau: CTM outstrips MTEL on overall performance

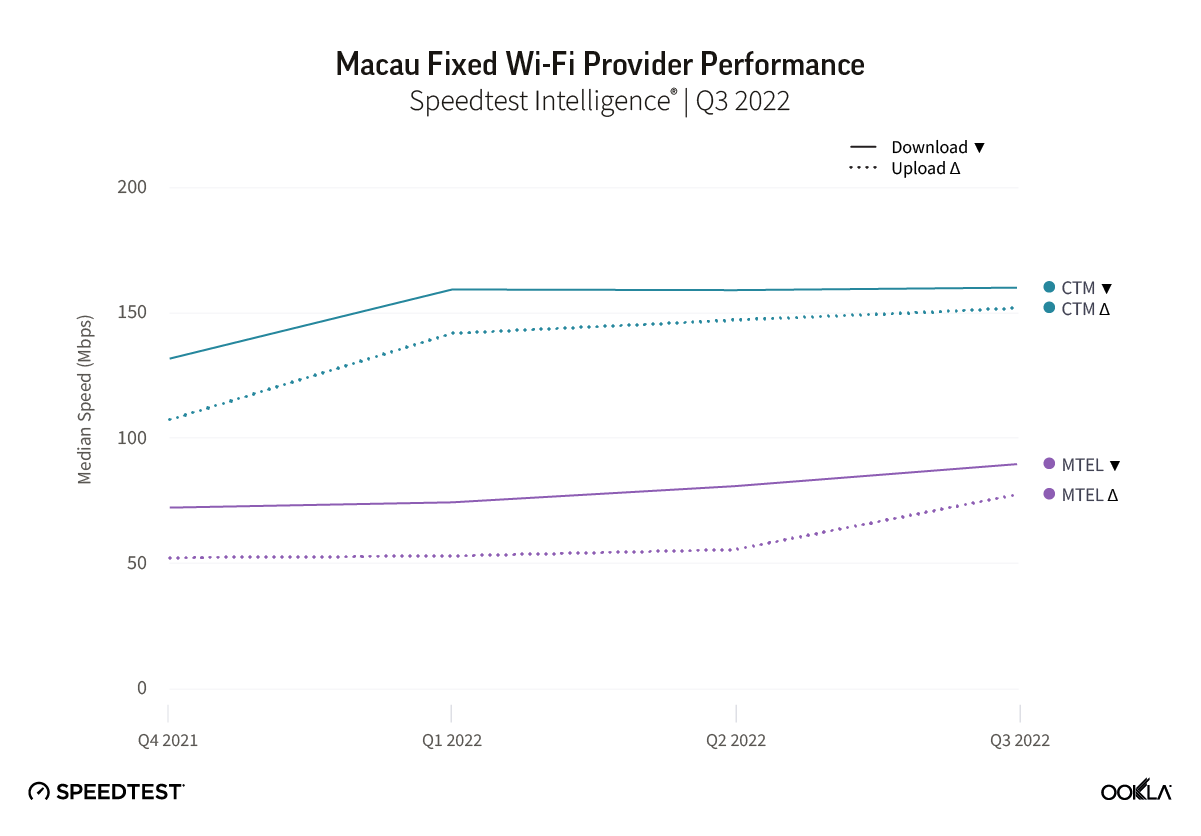
Macau lagged behind Hong Kong on fixed Wi-Fi performance for both median download and upload speeds during Q3 2022, despite the regulator CTT reporting widespread adoption of fiber in the market. Providers CTM and MTEL offer a range of fiber broadband plans for residential users, segmented by speed, with download speeds ranging from 150 Mbps to 10 Gbps for CTM, and from 25 Mbps to 600 Mbps for MTEL.

Chart of Macau fixed Wi-Fi provider performance

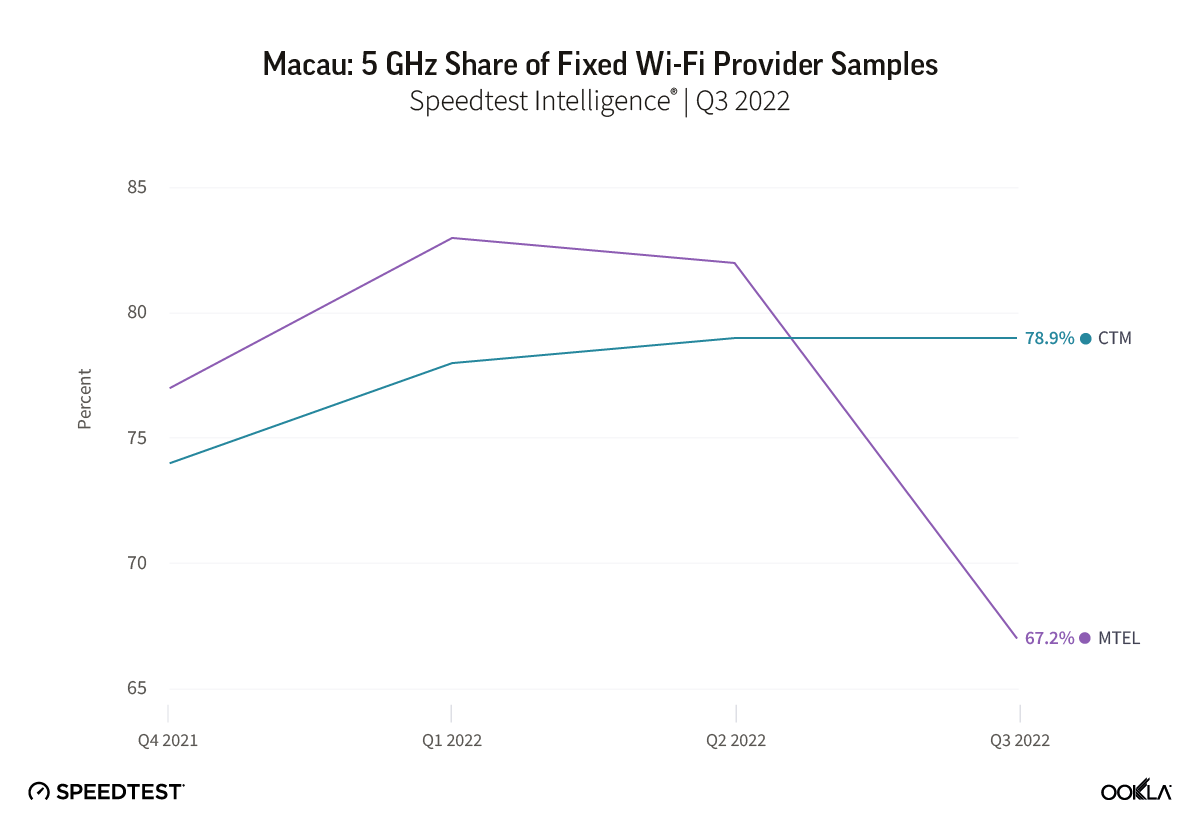
Speedtest Intelligence performance data for Macau during 2022 aligns with CTM’s focus on providing higher broadband speed tiers in the market. CTM maintained a significant performance gap over MTEL, recording a median download speed of 160.15 Mbps compared to MTEL at 89.63 Mbps during Q3 2022. Upload performance between the two providers showed a similar picture, with CTM recording a median speed of 151.96 Mbps in Q3 2022 — almost double that of MTEL which recorded 77.49 Mbps. Looking at the distribution of Wi-Fi samples between 5 GHz and other bands, CTM outstripped MTEL with a greater proportion of samples using 5 GHz during Q3 2022.

Chart of Macau 5 GHz share of fixed Wi-Fi provider samples

In order to maintain or improve their position among top-performing cities globally, providers in Hong Kong and Macau need to drive greater availability of higher-speed broadband services and newer routers, while encouraging existing customers to upgrade to faster speeds. For Hong Kong in particular, improving the penetration of routers which support 5 GHz Wi-Fi could help those providers that currently lag behind in the market on overall performance. We’ll continue monitoring how fixed broadband performs across major cities like Hong Kong and Macau. If you want to learn more about Speedtest Intelligence, please inquire here.

Ookla retains ownership of this article including all of the intellectual property rights, data, content graphs and analysis. This article may not be quoted, reproduced, distributed or published for any commercial purpose without prior consent. Members of the press and others using the findings in this article for non-commercial purposes are welcome to publicly share and link to report information with attribution to Ookla.

| December 18, 2022

Stable and Expanding: The State of Worldwide 5G in 2022


5G is no longer a new technology, however, consumers in many countries are still waiting to see the full benefits of 5G (or even to connect to 5G at all). We examined Speedtest Intelligence® data from Q3 2022 Speedtest® results to see how 5G performance has changed since last year, where download speeds are the fastest at the country level, and how satellite technologies are offering additional options to connect. We also looked at countries that don’t yet have 5G to understand where consumers are seeing improvements in 4G LTE access.

5G speeds were stable at the global level

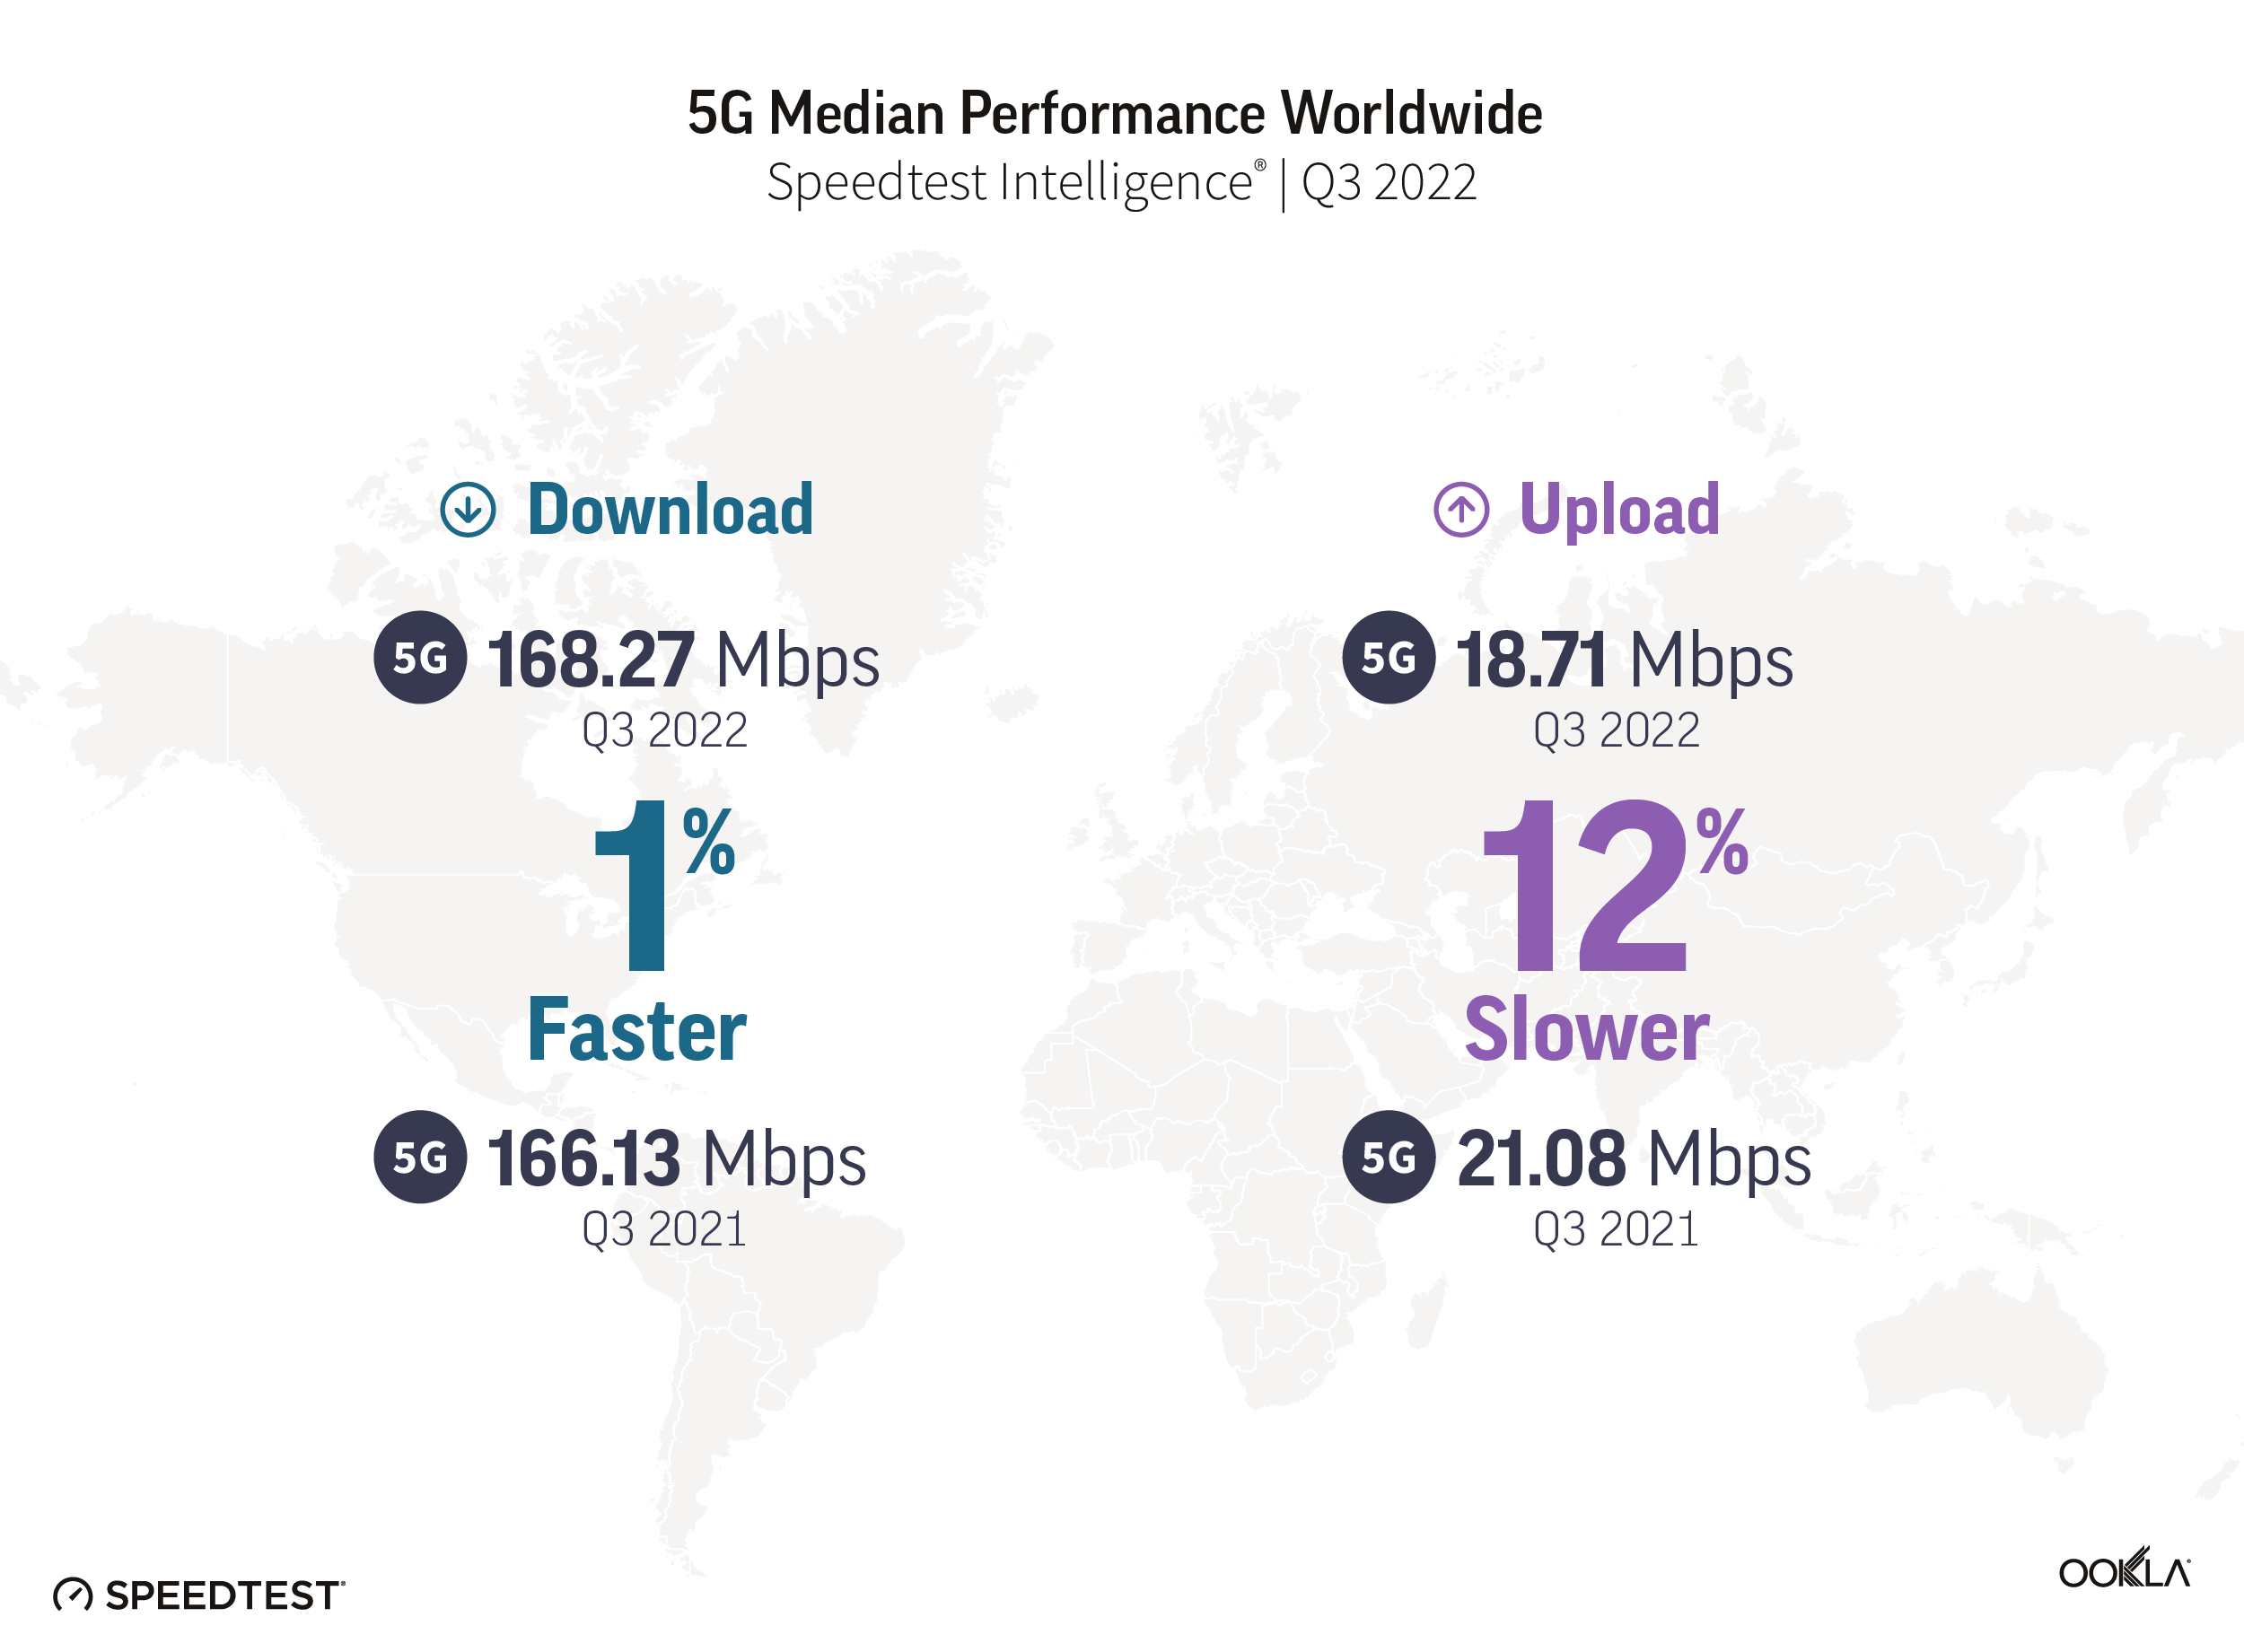
Graphic of 5G median speed performance worldwide.

In 2021, we discussed how an expansion of 5G access led to a decline in overall speed at the global level. This year showed a stabilization in overall speed, even as 5G access broadened, with a median global 5G download speed of 168.27 Mbps in Q3 2022 as compared to 166.13 Mbps in Q3 2021. Median upload speed over 5G slowed slightly to 18.71 Mbps (from 21.08 Mbps) during the same period. According to the Ookla® 5G Map™, there were 127,509 5G deployments in 128 countries as of November 30, 2022, compared to 85,602 in 112 countries the year prior.

South Korea and the United Arab Emirates led countries for 5G speeds

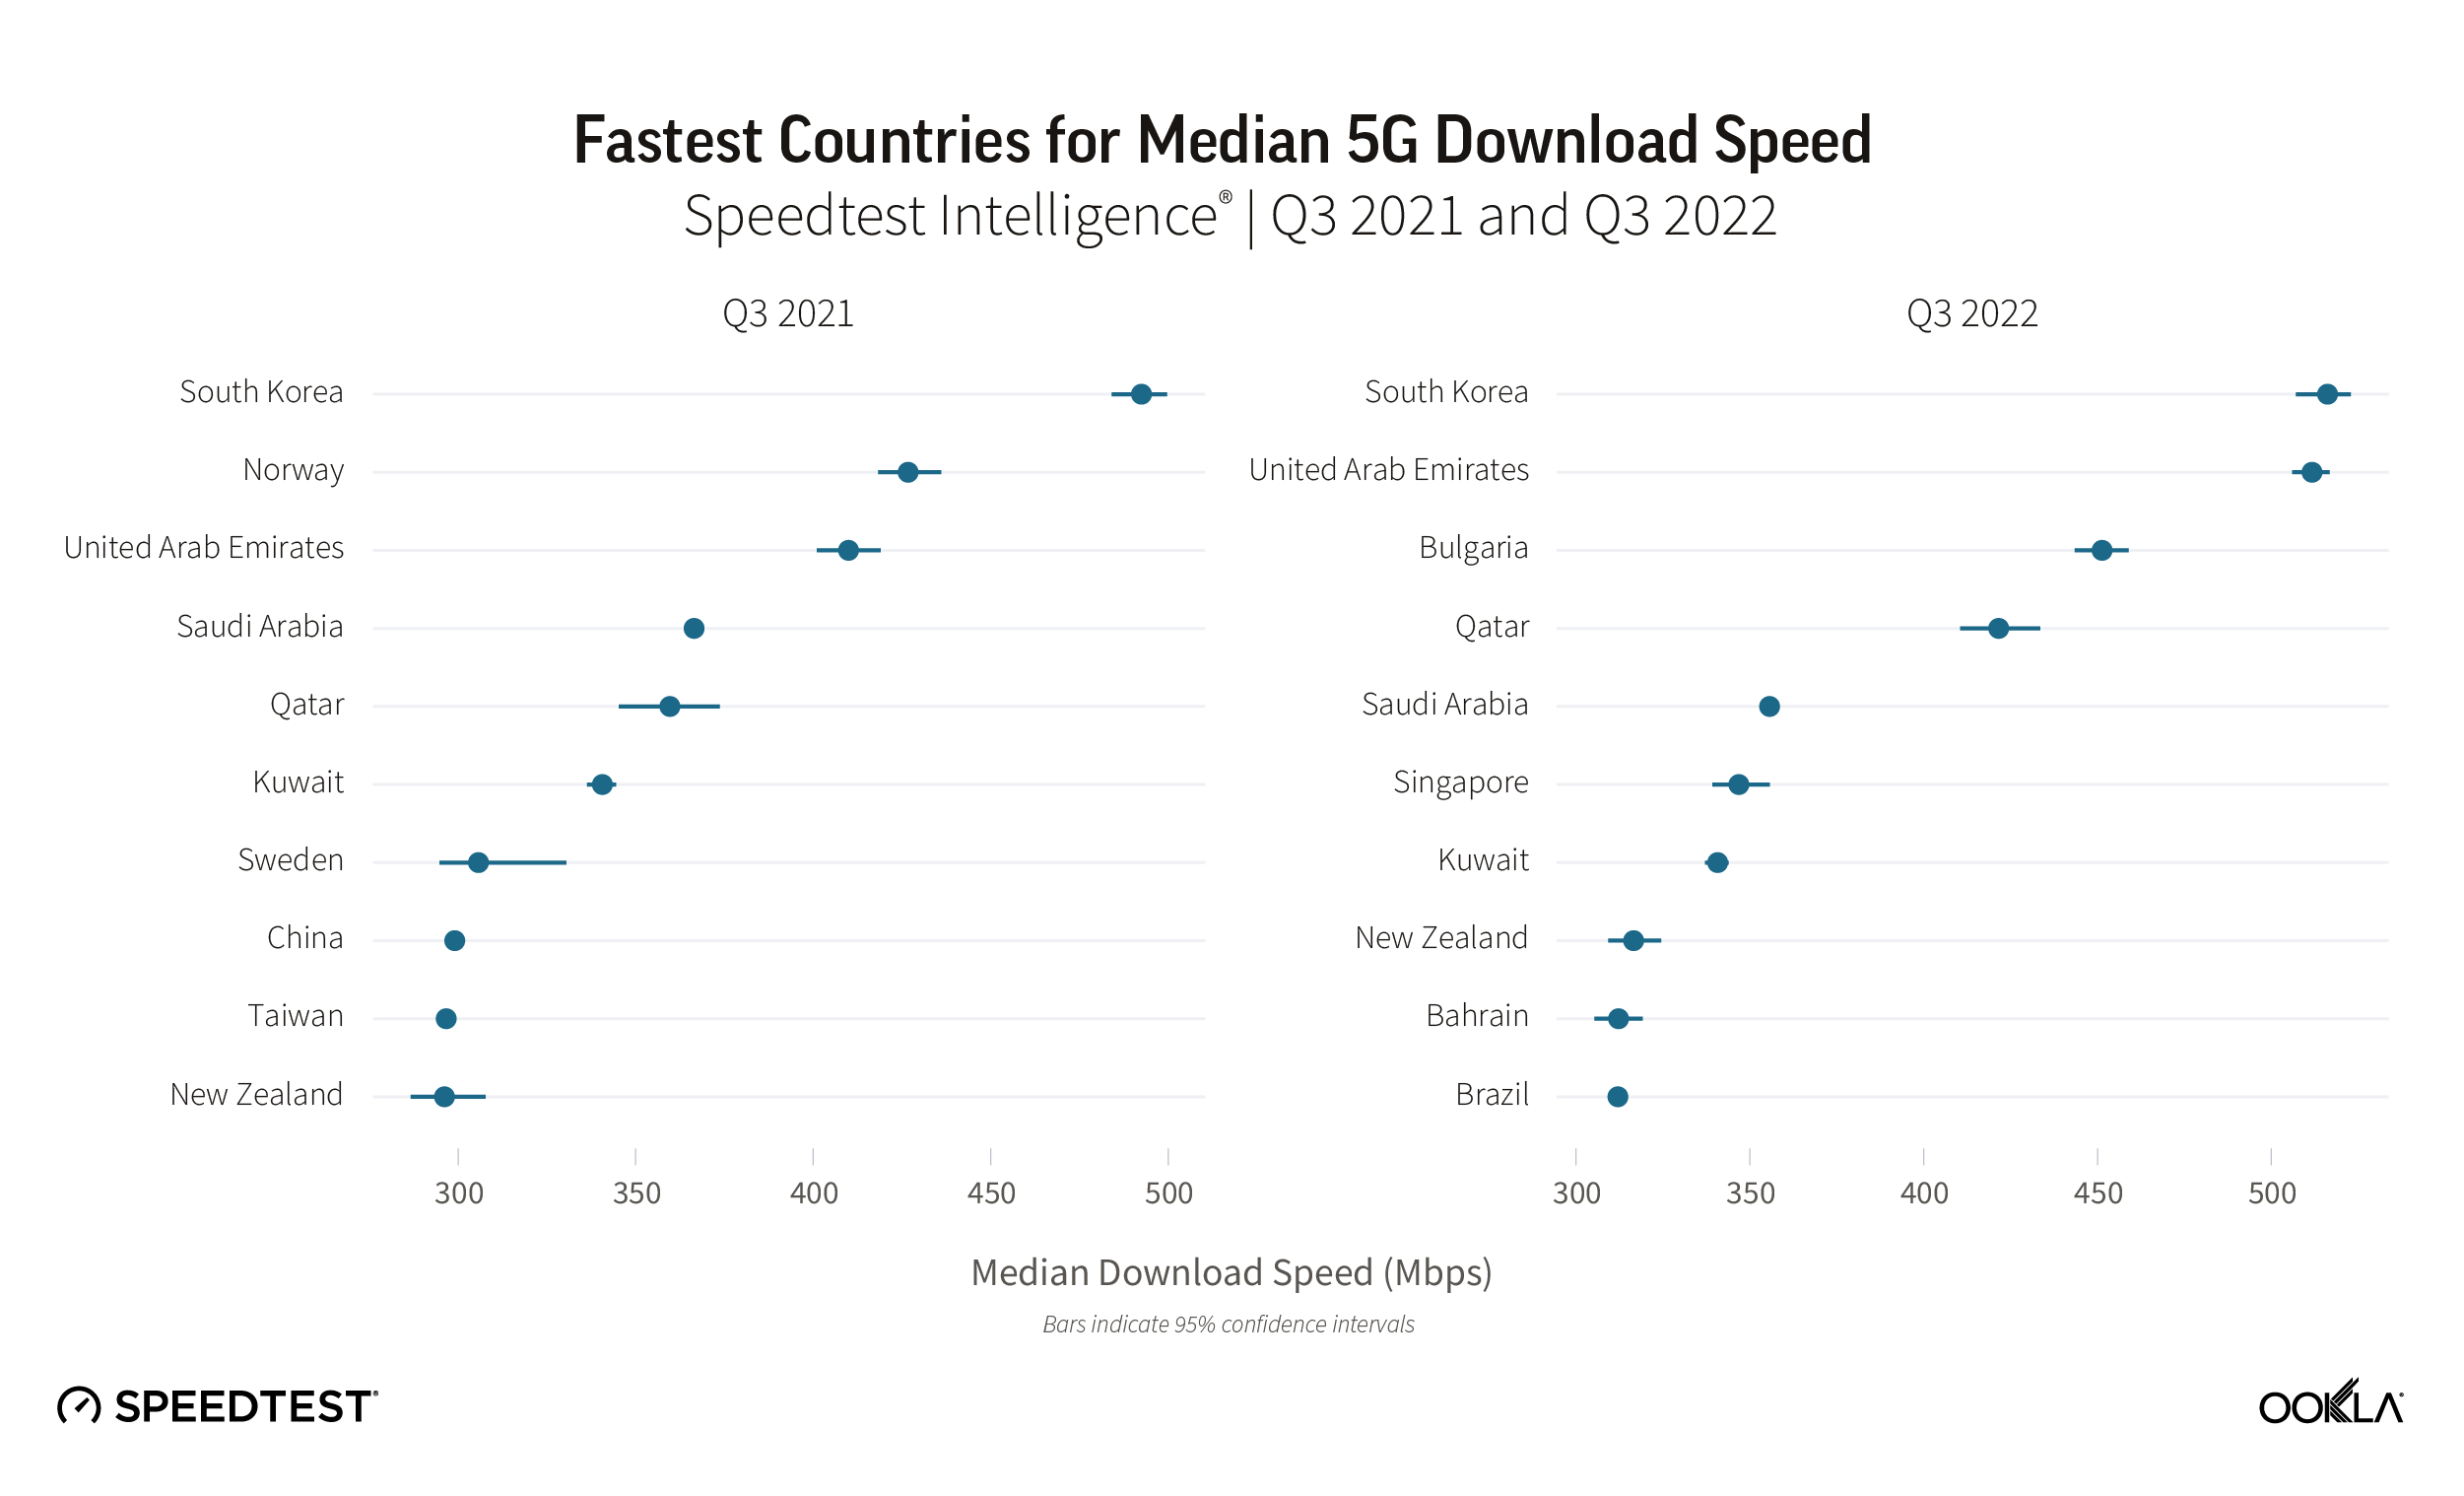
Chart of fastest countries for median 5G download speed

South Korea and the U.A.E. had the fastest median download speed over 5G at 516.15 Mbps and 511.70 Mbps, respectively, during Q3 2022, leading a top 10 list that included Bulgaria, Qatar, Saudi Arabia, Singapore, Kuwait, New Zealand, Bahrain, and Brazil. Bulgaria, Singapore, Bahrain, and Brazil were new to the top 10 in 2022, while Norway, Sweden, China, and Taiwan fell out of the top 10.

Satellite became more accessible but performance slowed

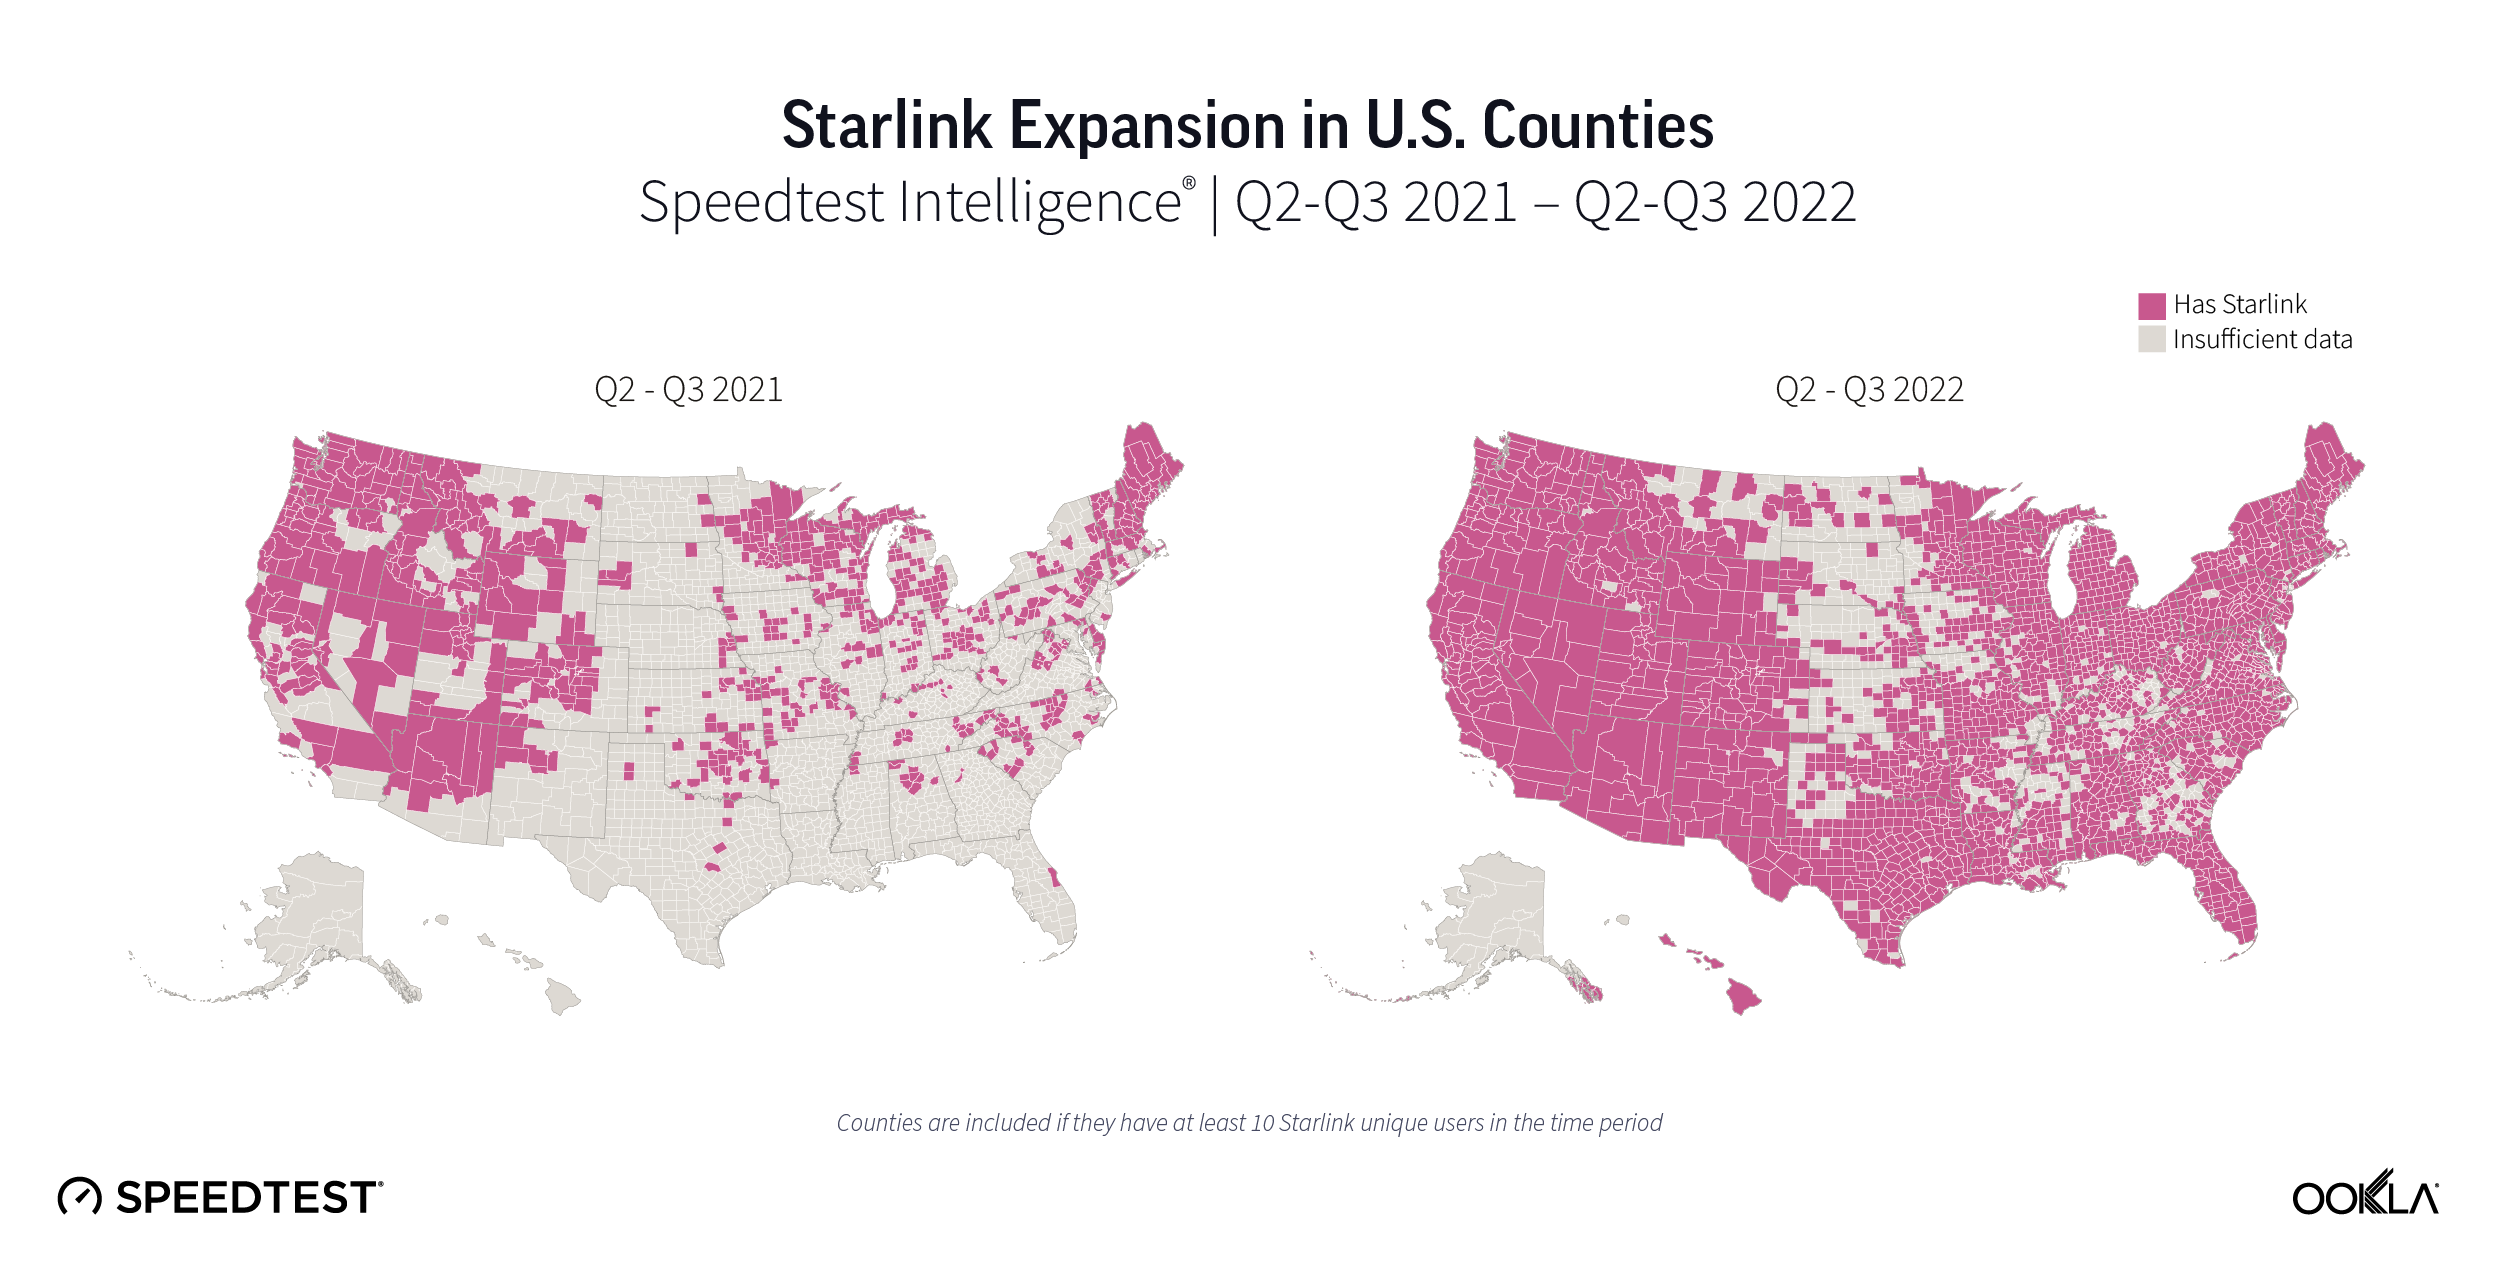
2022 saw a proliferation of fast, low-earth orbit (LEO) satellite internet from Starlink across the world. Q1 2022 saw Starlink speeds increase year over year in Canada and the U.S., with Starlink in Mexico having the fastest satellite internet in North America, Starlink in Lithuania the fastest in Europe, Starlink in Chile the fastest in South America, and Starlink in Australia the fastest in Oceania.
Q2 2022 saw Starlink speeds decrease in Canada, France, Germany, New Zealand, the U.K., and the U.S. from Q1 2022 as Starlink crossed the 400,000 user threshold across the world. Starlink in Puerto Rico debuted as the fastest satellite provider in North America. Starlink outperformed fixed broadband averages in 16 European countries. Starlink in Brazil had the fastest satellite speeds in South America. And Starlink in New Zealand was the fastest satellite provider in Oceania.

During Q3 2022, Starlink performance dipped once again from Q2 2022 in Canada and the U.S., while remaining about the same in Chile. Starlink in Puerto Rico and the U.S. Virgin Islands had the fastest satellite speeds in North America, while Starlink in Brazil again was the fastest satellite provider in South America.

With Viasat, HughesNet, and Project Kuiper set to launch huge LEO constellations in 2023, consumers around the world are poised to have more fast satellite internet options, particularly as the European Commission makes its own play for a constellation and Eutelsat and OneWeb potentially merging.

5G Availability points to on-going challenges

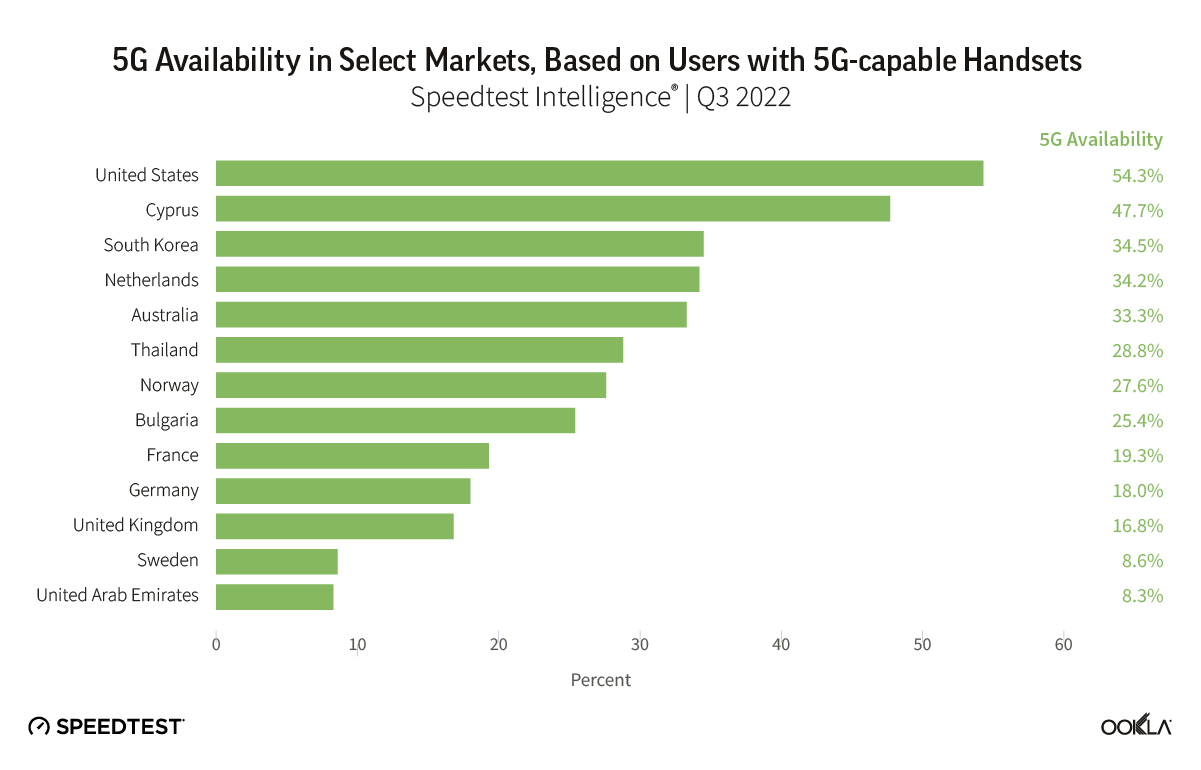
5G Availability measures the proportion of Speedtest users with 5G-capable handsets, who spend a majority of time connected to 5G networks. It’s therefore a function of 5G coverage and adoption. We see wide disparity in 5G Availability among markets worldwide, with for example the U.S. recording 54.3% in Q3 2022, well ahead of markets such as Sweden and the U.A.E., with 8.6% and 8.3% respectively.

Chart of 5G availability in select markets, based on users with 5G-capable handsets

Critical levers for mobile operators to increase 5G Availability include:

  • Increasing 5G coverage by deploying additional base stations
  • Obtaining access to, or refarming, sub-GHz spectrum, to help broaden 5G coverage, as sub-GHz spectrum has superior propagation properties than that of higher frequency spectrum bands.
  • Encouraging 5G adoption among users with 5G-capable handsets.

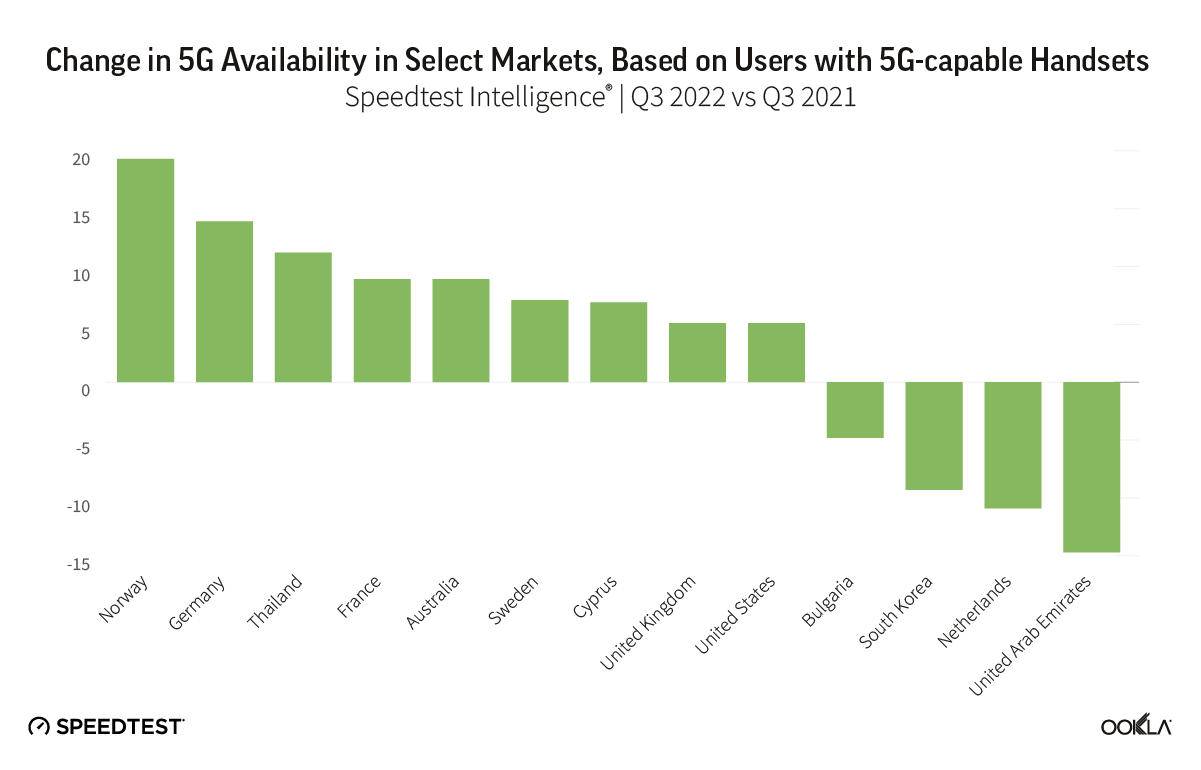
Speedtest Intelligence points to 5G adoption challenges in some markets, with 5G Availability dropping in Bulgaria, South Korea, the Netherlands, and the U.A.E. As more users acquire 5G-capable devices, operators need to balance their pricing models to ensure users have sufficient incentives to purchase a 5G tariff.

Chart of percentage change in 5G availability in select markets, based on users with 5G-capable handsets

Where 5G continues to fail to reach

Speedtest Intelligence showed 29 countries in the world where more than 20% of samples were from 2G and 3G connections (combined) during Q3 2022 and met our statistical threshold to be included (down from 70 in Q3 2021). These are mostly countries where 5G is still aspirational for a majority of the population, which is being left behind technologically, having to rely on decades-old technologies that are only sufficient for basic voice and texting, social media, and navigation apps. We’re glad to see so many countries fall off this list, but having so many consumers on 2G and 3G also prevents mobile operators from making 4G and 5G networks more efficient. If operators and regulators are able to work to upgrade their users to 4G and higher, everyone will benefit.

Countries That Still Rely Heavily on 2G and 3G Connections
Speedtest IntelligenceⓇ | Q3 2021
Country 2G & 3G Samples
Central African Republic 76.2%
Turkmenistan 58.5%
Kiribati 51.6%
Micronesia 47.4%
Rwanda 41.1%
Belarus 39.7%
Equatorial Guinea 37.7%
Afghanistan 36.7%
Palestine 33.5%
Madagascar 27.5%
Sudan 27.4%
Lesotho 26.5%
South Sudan 26.3%
Benin 26.0%
Guinea 25.5%
Cape Verde 24.3%
Tonga 24.3%
Syria 23.4%
The Gambia 23.4%
Ghana 23.3%
Palau 22.9%
Niger 22.8%
Tajikistan 22.7%
Mozambique 22.4%
Guyana 21.8%
Togo 21.8%
Congo 21.1%
Moldova 20.8%
Saint Kitts and Nevis 20.0%

We were pleased to see the following countries come off the list from last year, having dropped below the 20% threshold: Algeria, Angola, Anguilla, Antigua and Barbuda, Armenia, Barbados, Bosnia and Herzegovina, Botswana, Burundi, Caribbean Netherlands, Cook Islands, Dominica, Ecuador, El Salvador, Ethiopia, Gabon, Grenada, Haiti, Honduras, Jamaica, Liberia, Mauritania, Namibia, Nigeria, Papua New Guinea, Saint Lucia, Saint Vincent and the Grenadines, Sierra Leone, Solomon Islands, Somalia, Suriname, Swaziland, Tanzania, Trinidad and Tobago, Uganda, Ukraine, Uzbekistan, Vanuatu, Venezuela, Yemen, Zambia, and Zimbabwe. While countries like Belarus, Cape Verde, Central African Republic, Guinea, Guyana, Madagascar, Palestine, Rwanda, South Sudan, Tajikistan, Togo, and Turkmenistan are still on this list, they have improved the percentage of their samples on these outmoded technologies when compared to last year by at least 10 points. Palestine improved by more than 50 points. 2G and 3G samples in Kiribati increased 3.2 points when comparing Q3 2022 to Q3 2021.

We’re glad to see performance levels normalize as 5G expands to more and more countries and access improves and we are optimistic that 2023 will bring further improvements. Keep track of how well your country is performing on Ookla’s Speedtest Global Index™ or track performance in thousands of cities worldwide with the Speedtest Performance Directory™.

Ookla retains ownership of this article including all of the intellectual property rights, data, content graphs and analysis. This article may not be quoted, reproduced, distributed or published for any commercial purpose without prior consent. Members of the press and others using the findings in this article for non-commercial purposes are welcome to publicly share and link to report information with attribution to Ookla.