Ookla® has recently hosted a webinar on “Accelerating Europe’s Gigabit Revolution: The importance of high-speed internet in the digital era.” We gathered representatives from three European fiber providers, vertically integrated UK Internet Service Provider (ISP) Hyperoptic, Polish open-access fiber network provider, Fiberhost, and Spanish wholesale provider Onvia, to discuss their strategies and challenges related to fiber roll out and adoption. Industry experts from the European Competitive Telecommunications Association (ecta) and two research houses, Assembly Research and Omdia, also joined us.
European Commission’s Digital Decade 2030 Strategy
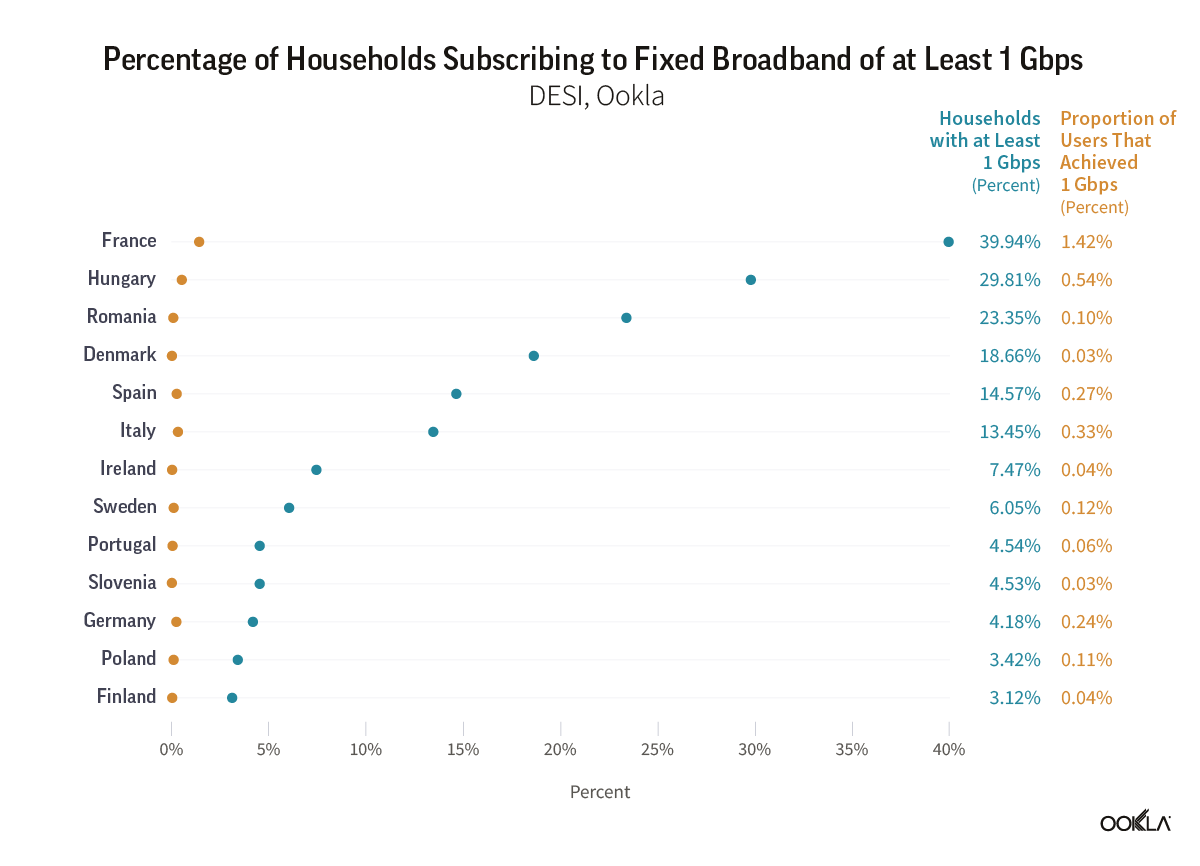
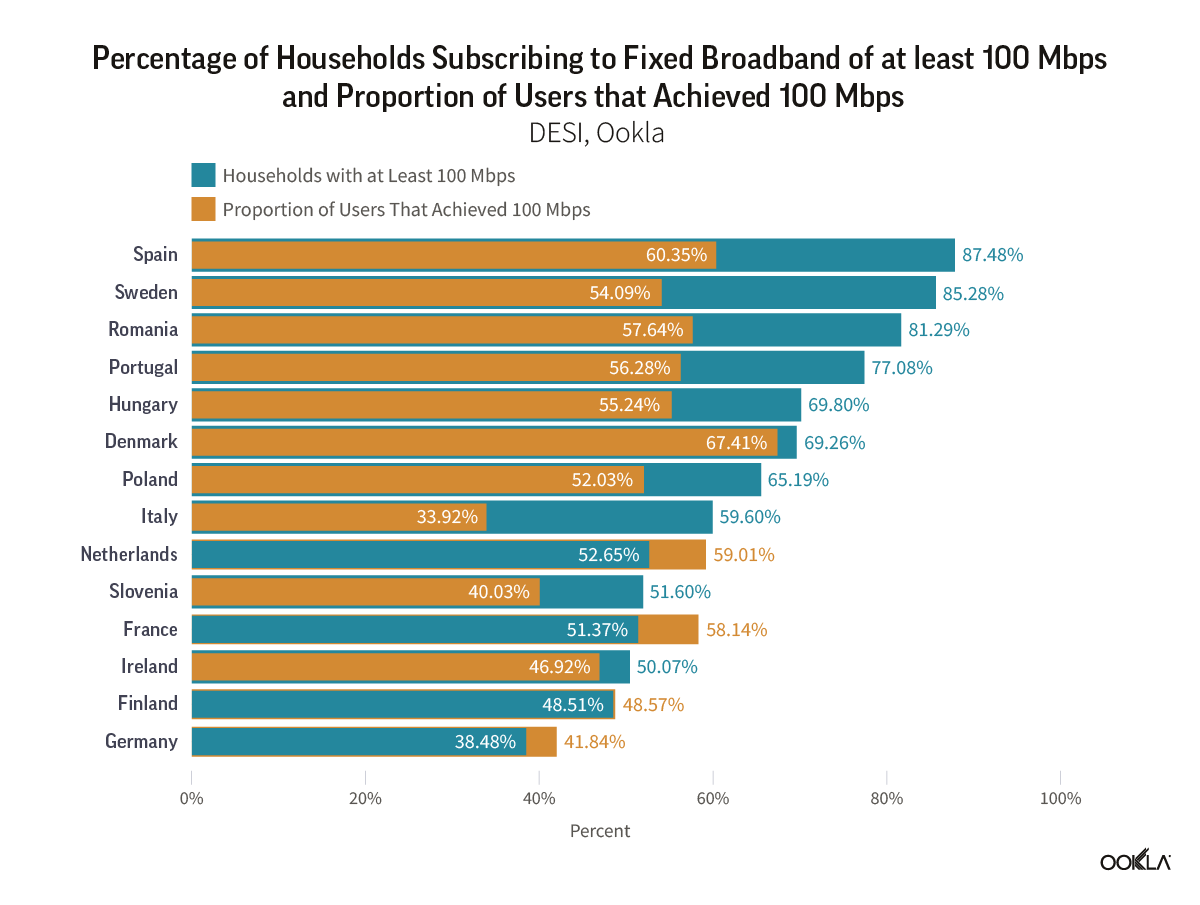
The European Commission’s Digital Decade 2030 strategy, also known as the Digital Compass, is an ambitious roadmap to speed up the digital transformation of Member States by 2030. One of its primary objectives is to enhance digital connectivity, with specific targets such as 100 Mbps services by 2025 and gigabit coverage for all EU households by 2030. We recently published an article to provide a reality check on the progress towards a Gigabit society. Our data suggests a wide gap between advertised and actual speeds for gigabit services, with speeds approaching 100 Mbps commonly seen by users. Despite this gap, our webinar participants were optimistic about achieving the Gigabit Society goal, with 71% supporting that view.
The EU goal predominantly focuses on the availability aspect. However, it is important to note that having fiber networks available does not automatically equate to actual penetration or adoption rates, although it is a necessary prerequisite. Having physical accessibility to network services is, of course, a vital first step before actual usage, which is influenced by multiple factors such as affordability, awareness, and the perceived need for the service.
The European fiber network landscape
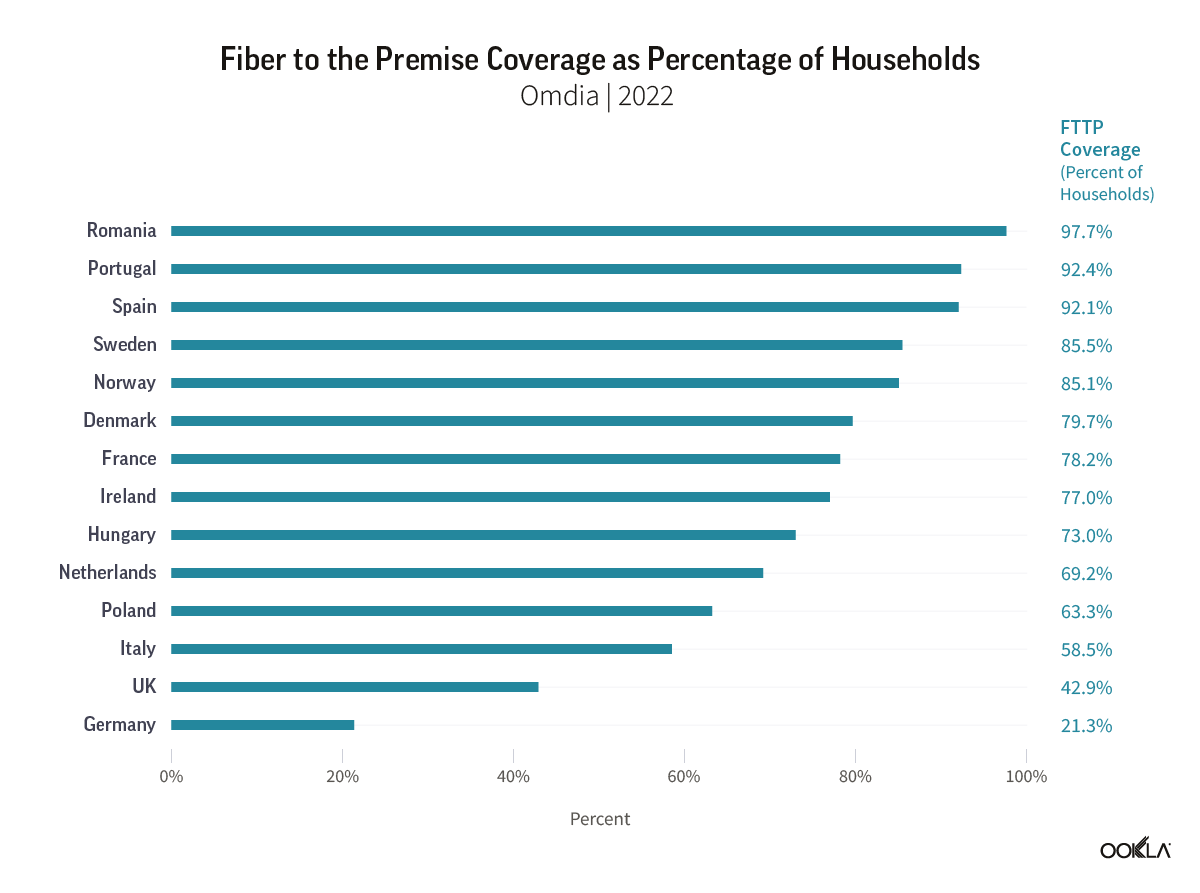
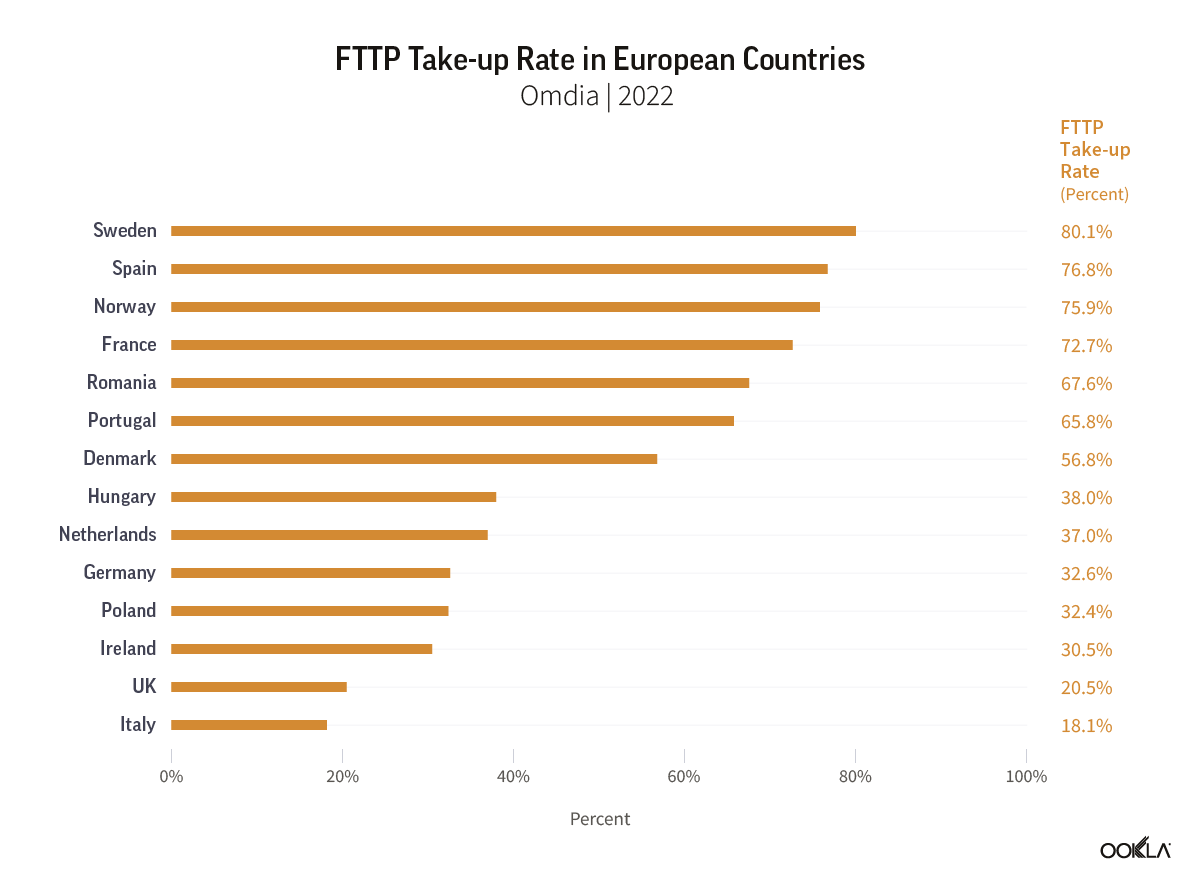
Stephen Wilson, Senior Principal Analyst from Omdia, provided an analyst’s perspective on how the fiber networks’ competitive landscape is evolving for alternative operators and incumbents. He stated that there has been a substantial increase in Fiber-To-The-Premises (FTTP) coverage, and the investment case for fiber has been spurred by the pandemic. Leading countries, including those in Iberia and Eastern Europe, are pushing coverage to 90% of premises or more, driven by a positive business case. While FTTH (Fiber to the Home) subscriber penetration is generally experiencing steady growth, country-level variations exist, with factors like digital literacy, existing broadband penetration, and competition playing crucial roles in the observed trends. Countries such as Spain and Romania have achieved significant FTTH penetration rates, while others like France have outperformed predictions, emphasizing the diverse dynamics influencing fiber adoption across Europe.
Importance of supportive regulatory framework
James Robinson, Senior Analyst from Assembly Research, highlighted three measures the European Commission is taking as it seeks to deliver against the Digital Decade’s connectivity targets: the draft Gigabit Recommendation, the proposed Gigabit Infrastructure Act, and a plan for a Digital Networks Act. Although broad industry support exists for the Gigabit Infrastructure Act (GIA), the draft Gigabit Recommendation has proven to be the most controversial. Both measures are still nevertheless expected to be finalized by the end of the year. The Digital Networks Act (DNA) will take longer to materialize, with a white paper not due until H1 2024. Despite its catchy title, the ‘DNA’ is unlikely to represent the urgent concrete action many operators had hoped to see from the Commission following the launch of the exploratory consultation back in February of this year.
Luc Hindryckx, Director General at ecta, expressed doubt about an investment gap that could endanger the 2030 targets. He suggested that some proposed legislation had been developed to support only a few operators rather than to promote competition. Hindryckx stressed the importance of bringing the Gigabit Infrastructure Act to “a good end” and ensuring the reduction of the timing for obtaining permits to deploy networks. He also pointed out that the GIA is complementary to the European Electronic Communication Code (ECCC), and its key elements include asymmetrical regulation and the Significant Market Power (SMP) regime. Overall, ecta emphasizes the importance of regulatory measures that foster competition, encourage investment, and create a level playing field, ultimately contributing to the successful deployment of gigabit connectivity and the Digital Decade 2030 objectives.
Succeeding in Rural Areas
Marta Wojciechowska, Chief Executive Officer at Fiberhost, has reported that the company has already met its goal of extending its fiber-optic network to over 1.3 million households by the end of the year. The company primarily focuses on underserved areas, where deployment costs tend to be higher and less predictable. While there are uncertainties regarding demand and fiber service uptake, there are unique benefits, including the low risk of overbuilding. However, the investment process varies significantly between urban and rural areas. In cities, one kilometer of infrastructure can connect one hundred to two hundred households, depending on the city’s size. In rural areas, connectivity extends to just seventeen households per kilometer.
Furthermore, up to 19 formal approvals may be required for infrastructure deployment, which extends the time to connect premises in rural areas to an impractical 24 months. The cost of connecting one household in these secluded “white spots” is over five hundred percent higher than in cities. Overcoming these challenges requires expertise, experience, and a collaborative approach, emphasizing the importance of partnerships with multiple stakeholders. These include local governments and subcontractors to achieve common goals in fiber network expansion.
Strategies for Expansion
Icíar Martínez, Markets and Product Director at Onivia, acknowledged they face similar challenges to Fiberhost but noted that their strategies for expanding the FTTH footprint might differ. Spain boasts close to 90% fiber optic coverage, thanks to private initiatives and government support. Their selective deployment focuses on rural and ultra-rural areas, addressing high customer interest. However, the cherry-picking strategy becomes expensive, impacting profitability, especially in densely competitive areas. Onivia aims to maximize capital returns by identifying key players, adopting XGPON technology for speeds up to 10 Gbps, and strategically balancing deployments in large cities and rural regions to optimize network utilization based on market demands.
On the other hand, Howard Jones, Head of Communications at Hyperoptic, noted that the Hyperoptic approach is distinct, focusing on urban areas with densely populated regions. The key lies in a granular business case approach, evaluating each deployment building by building and street by street. Hyperoptic’s philosophy centers on understanding that the network’s value lies in retaining customers, emphasizing a customer-centric business model. With a customer experience-oriented strategy, the ISP addresses challenges in the UK broadband market, historically marked by lower speeds and inadequate competition. By delivering a high-quality network, reliable service, and fair pricing policies, Jones highlighted that the company aims to set new standards in customer experience, achieving a 40% penetration rate within approximately a year of network deployment.
Addressing take-up challenges
Marta shared that Fiberhost’s network would not be deployed in white spot areas without EU funds. Fiberhost is the largest beneficiary of EU-funded grants, but this is just the beginning of the investment process. They need to “earn money, and for that, we need to have a good take-up rate.” She added that they must work hard to encourage people to join the fiber network. Their analysis showed that there is a slowdown in activations after ~40 %. While early adopters (47%) are willing to pay a premium for fiber internet, a substantial portion of potential users remain hesitant, contributing to the overall challenge of achieving a high take-up rate. The remaining 53% of households exhibit characteristics of an older demographic (above fifty-five) with limited internet usage, often for undemanding tasks. Their price sensitivity and lower discretionary income present a formidable barrier to higher adoption rates. As a result, Fiberhost adopts a multifaceted strategy, encompassing high-level engagement with Internet Service Providers (ISPs), targeted sales promotions, and educational initiatives. This strategic flexibility recognizes the absence of a one-size-fits-all solution and emphasizes the need for nuanced approaches tailored to the diverse challenges within each territory.
Iciar echoed this sentiment but also highlighted a need to implement a connectivity plan, not just deploy fiber, but also to digitalize rural areas. Access to a broadband network in rural households is essential, and so is educating people on the benefits of accessing new technologies. Onivia is exploring synergies with other technologies like 5G or satellite to extend broadband connectivity into areas that are difficult to reach. Iciar mentioned that working with local authorities is key to reusing existing infrastructure and avoiding building and disturbing neighborhoods with work.
Demand Aggregation and Competition
Stephen pointed out that the most successful operators are already in the 60-70% take-up rates of premises passed in countries like Norway, which points to demand aggregation being an important factor in getting pre-commitments before you roll out. Howard concluded, “Competition is the key to ensuring that these targets are met because I don’t believe that incumbents alone will do it. They need to be driven, and driven by competition.” He added the introduction of ‘One Touch Switch’ adds another layer of competition into the UK market and presents an opportunity to break the stranglehold of the big retail providers, who still often tend to sell FTTC (Fiber to the Cabinet), by moving a significant number of customers to alternate providers who are more likely to offer FTTP. This initiative is crucial, but what’s more important is the need to retain competition for everyone.
The journey towards Europe’s gigabit revolution is indeed multifaceted and involves various factors such as regulatory landscapes, diverse deployment strategies, financial dependencies, and the imperative of competition. Achieving the Digital Decade 2030 targets demands not just the availability of physical networks but also a concerted effort to address adoption challenges and ensure that the benefits of enhanced connectivity reach all corners of society. A shared commitment to realizing Europe’s digital potential is crucial, and a regulatory framework that fosters competition emerges as a common thread, underlining its pivotal role in driving investment, innovation, and equality. Moving forward, collaboration, adaptability, and a unified approach are essential to achieving Europe’s digital aspirations. From our side, we will continue to report what we see from Ookla® data in terms of users actually experiencing speeds.
See the full webinar recording here.
Ookla retains ownership of this article including all of the intellectual property rights, data, content graphs and analysis. This article may not be quoted, reproduced, distributed or published for any commercial purpose without prior consent. Members of the press and others using the findings in this article for non-commercial purposes are welcome to publicly share and link to report information with attribution to Ookla.


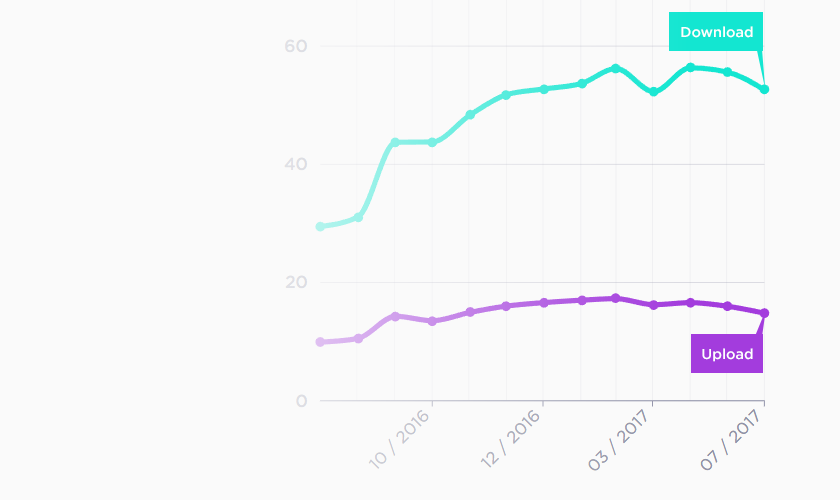


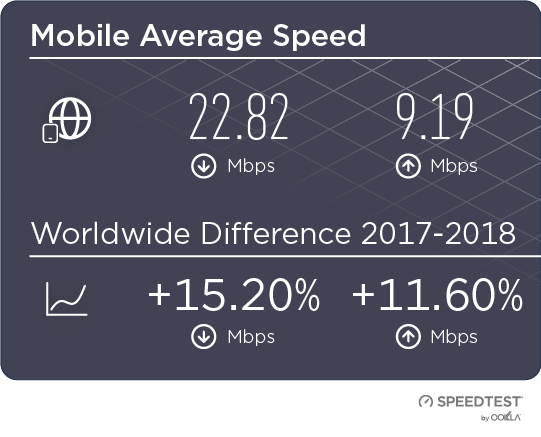
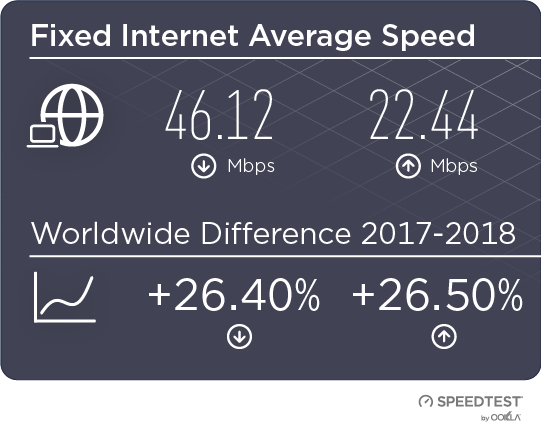
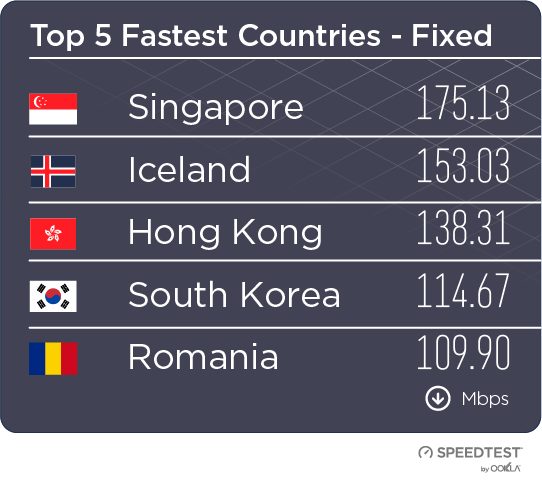
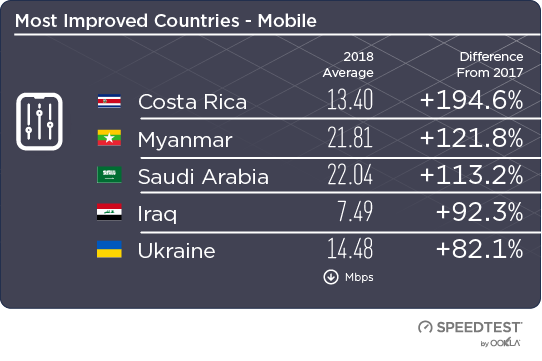
 When it comes to the internet, the news is mostly good for 2018. Download and upload speeds are increasing across the globe on both mobile and fixed broadband. 5G is on the horizon and gigabit service is expanding.