At Ookla we celebrate speed and the individuals and companies that dedicate their lives to being the fastest at whatever they do. That’s why this month’s big race in France is so exciting. To cheer all the worn out tires that go into making a great event, we compared the mobile performance of cyclists’ home countries using the Speedtest Global IndexTM. We also looked at download speed in the race’s start and stop cities to see which has the best internet speed advantage.
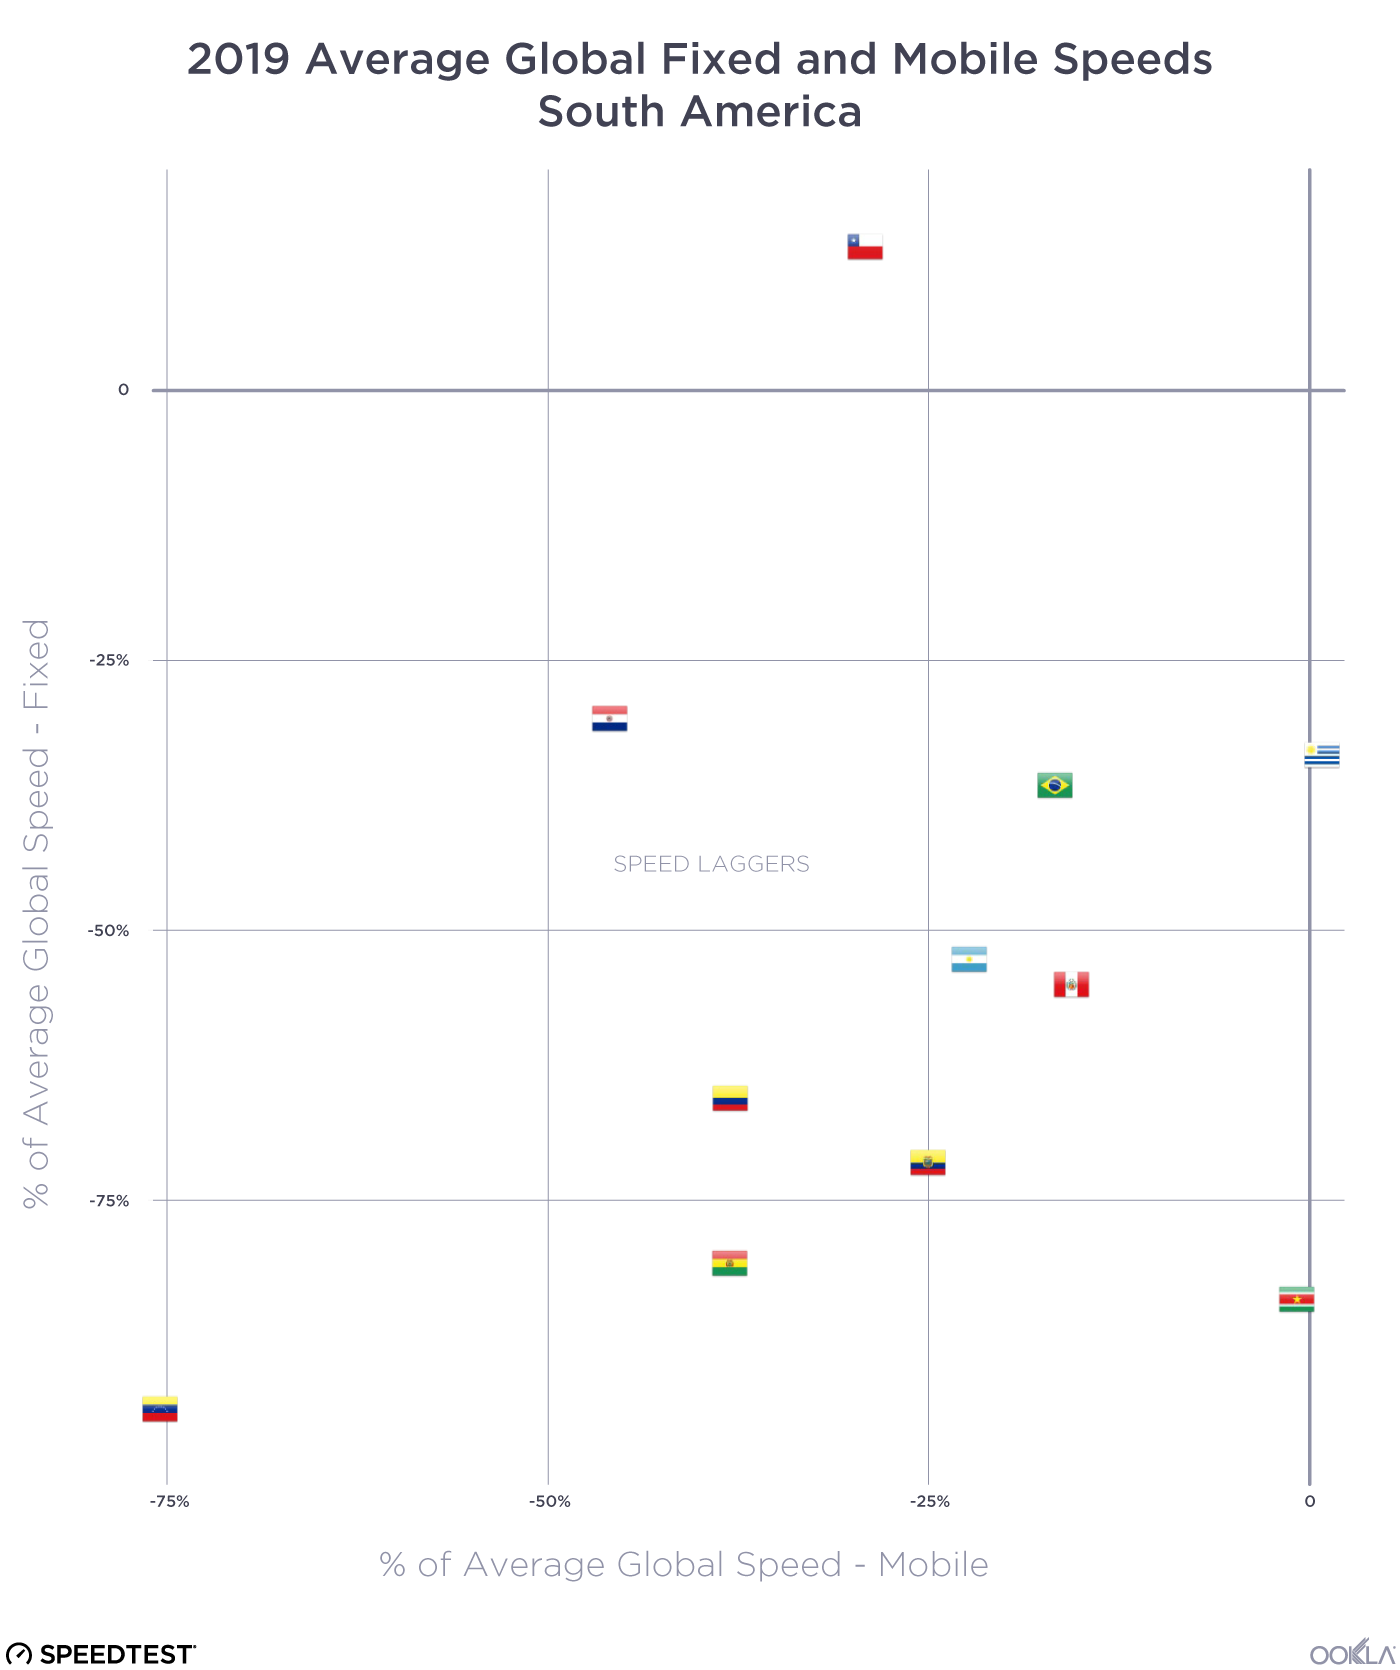
Which countries’ mobile speeds are breaking away from the main group
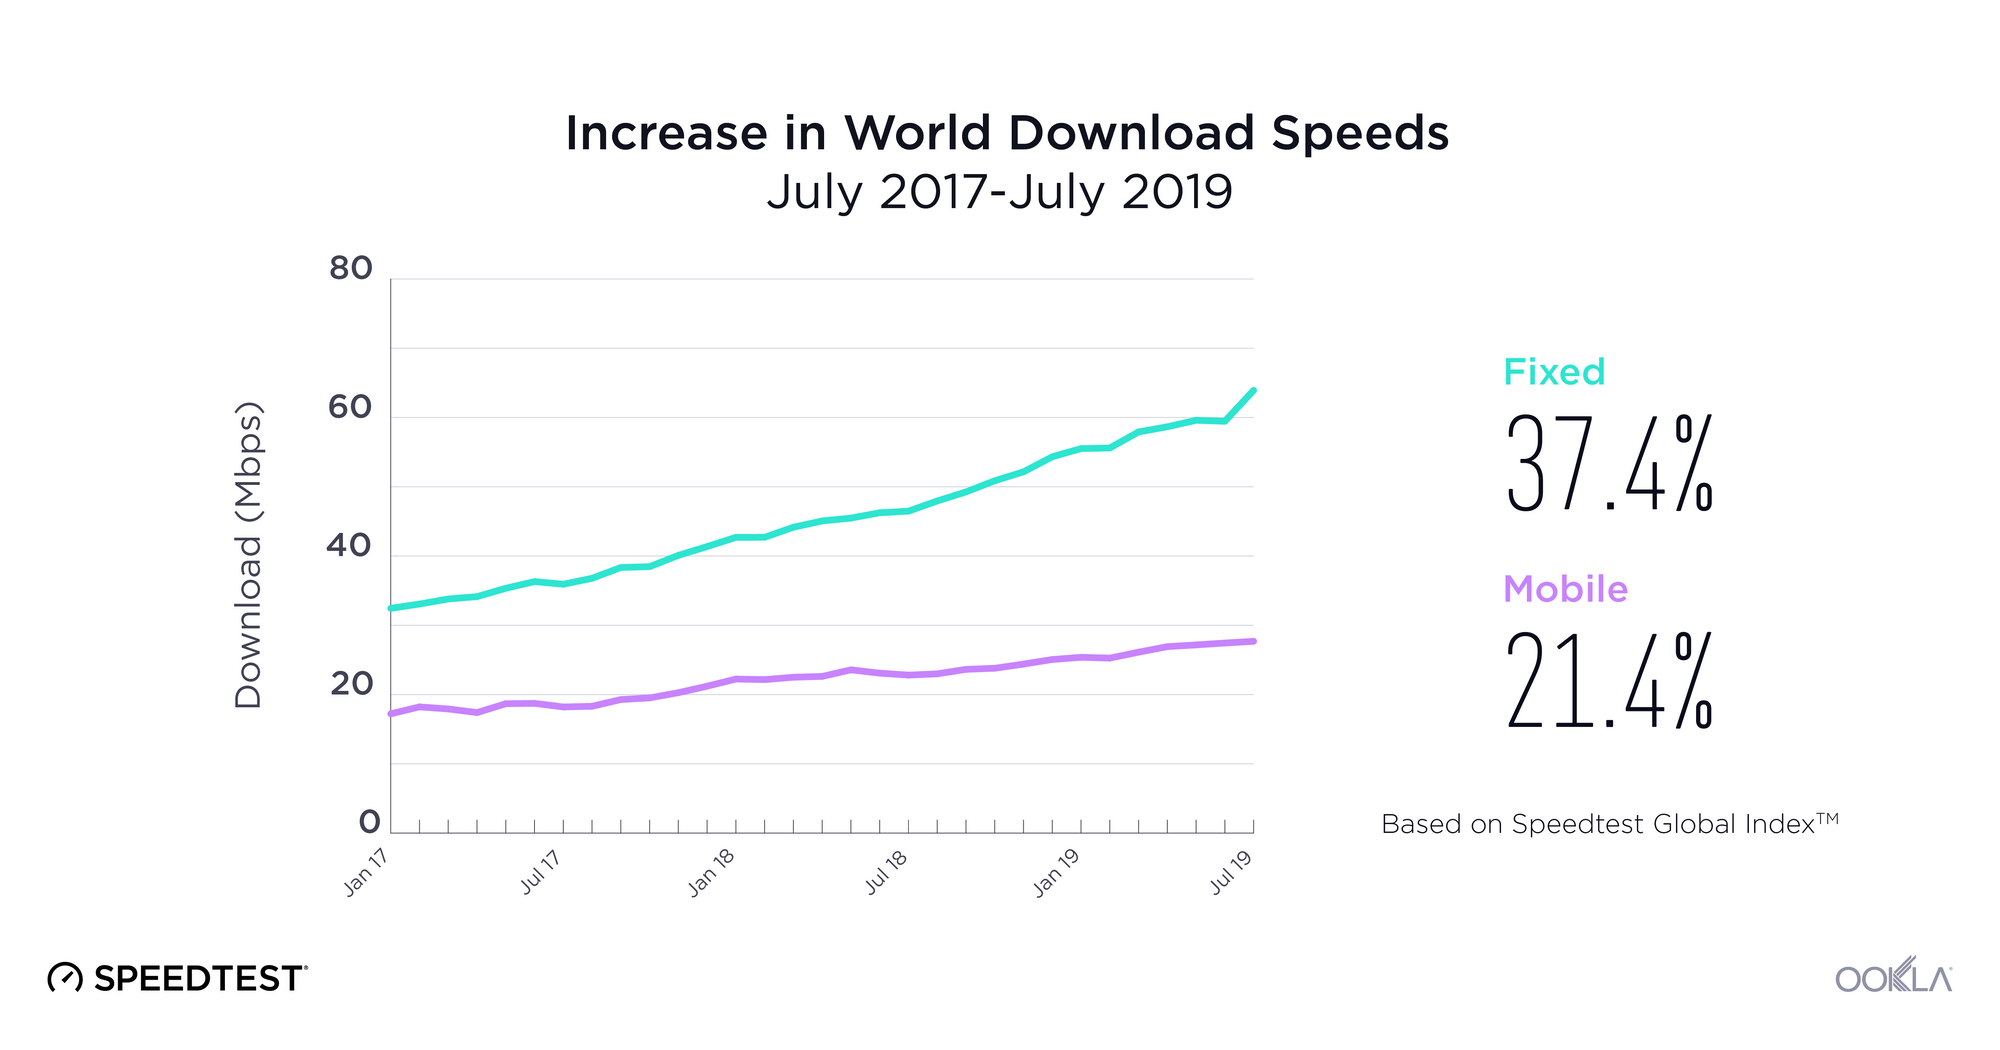
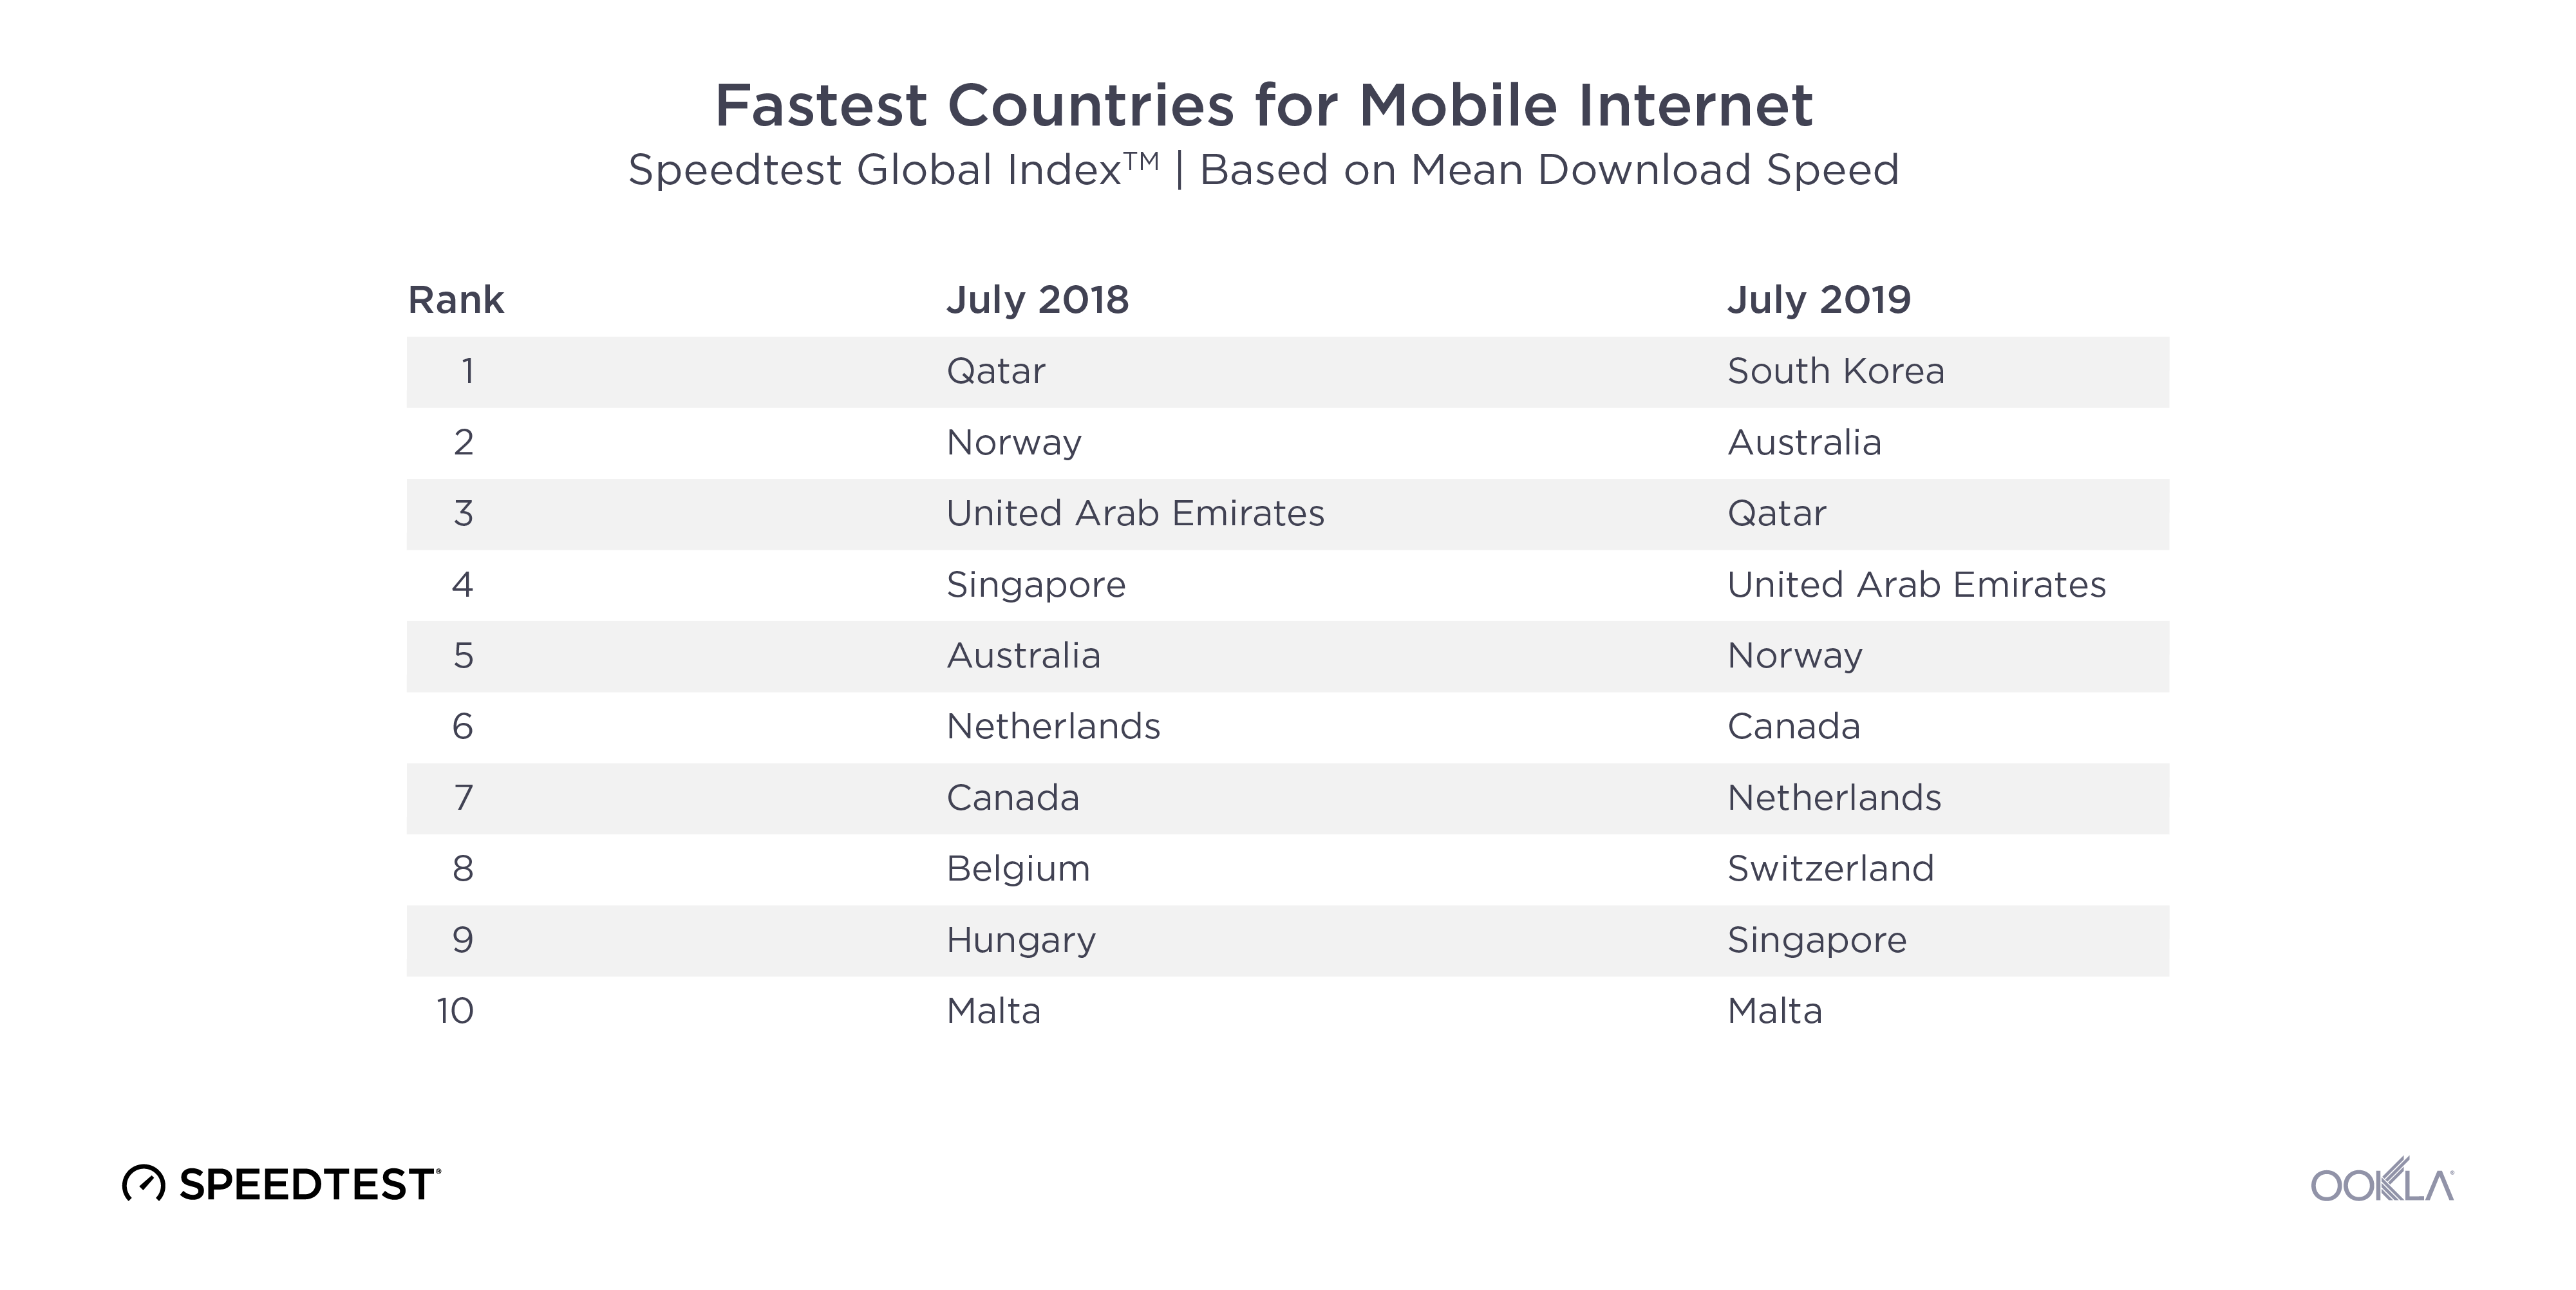
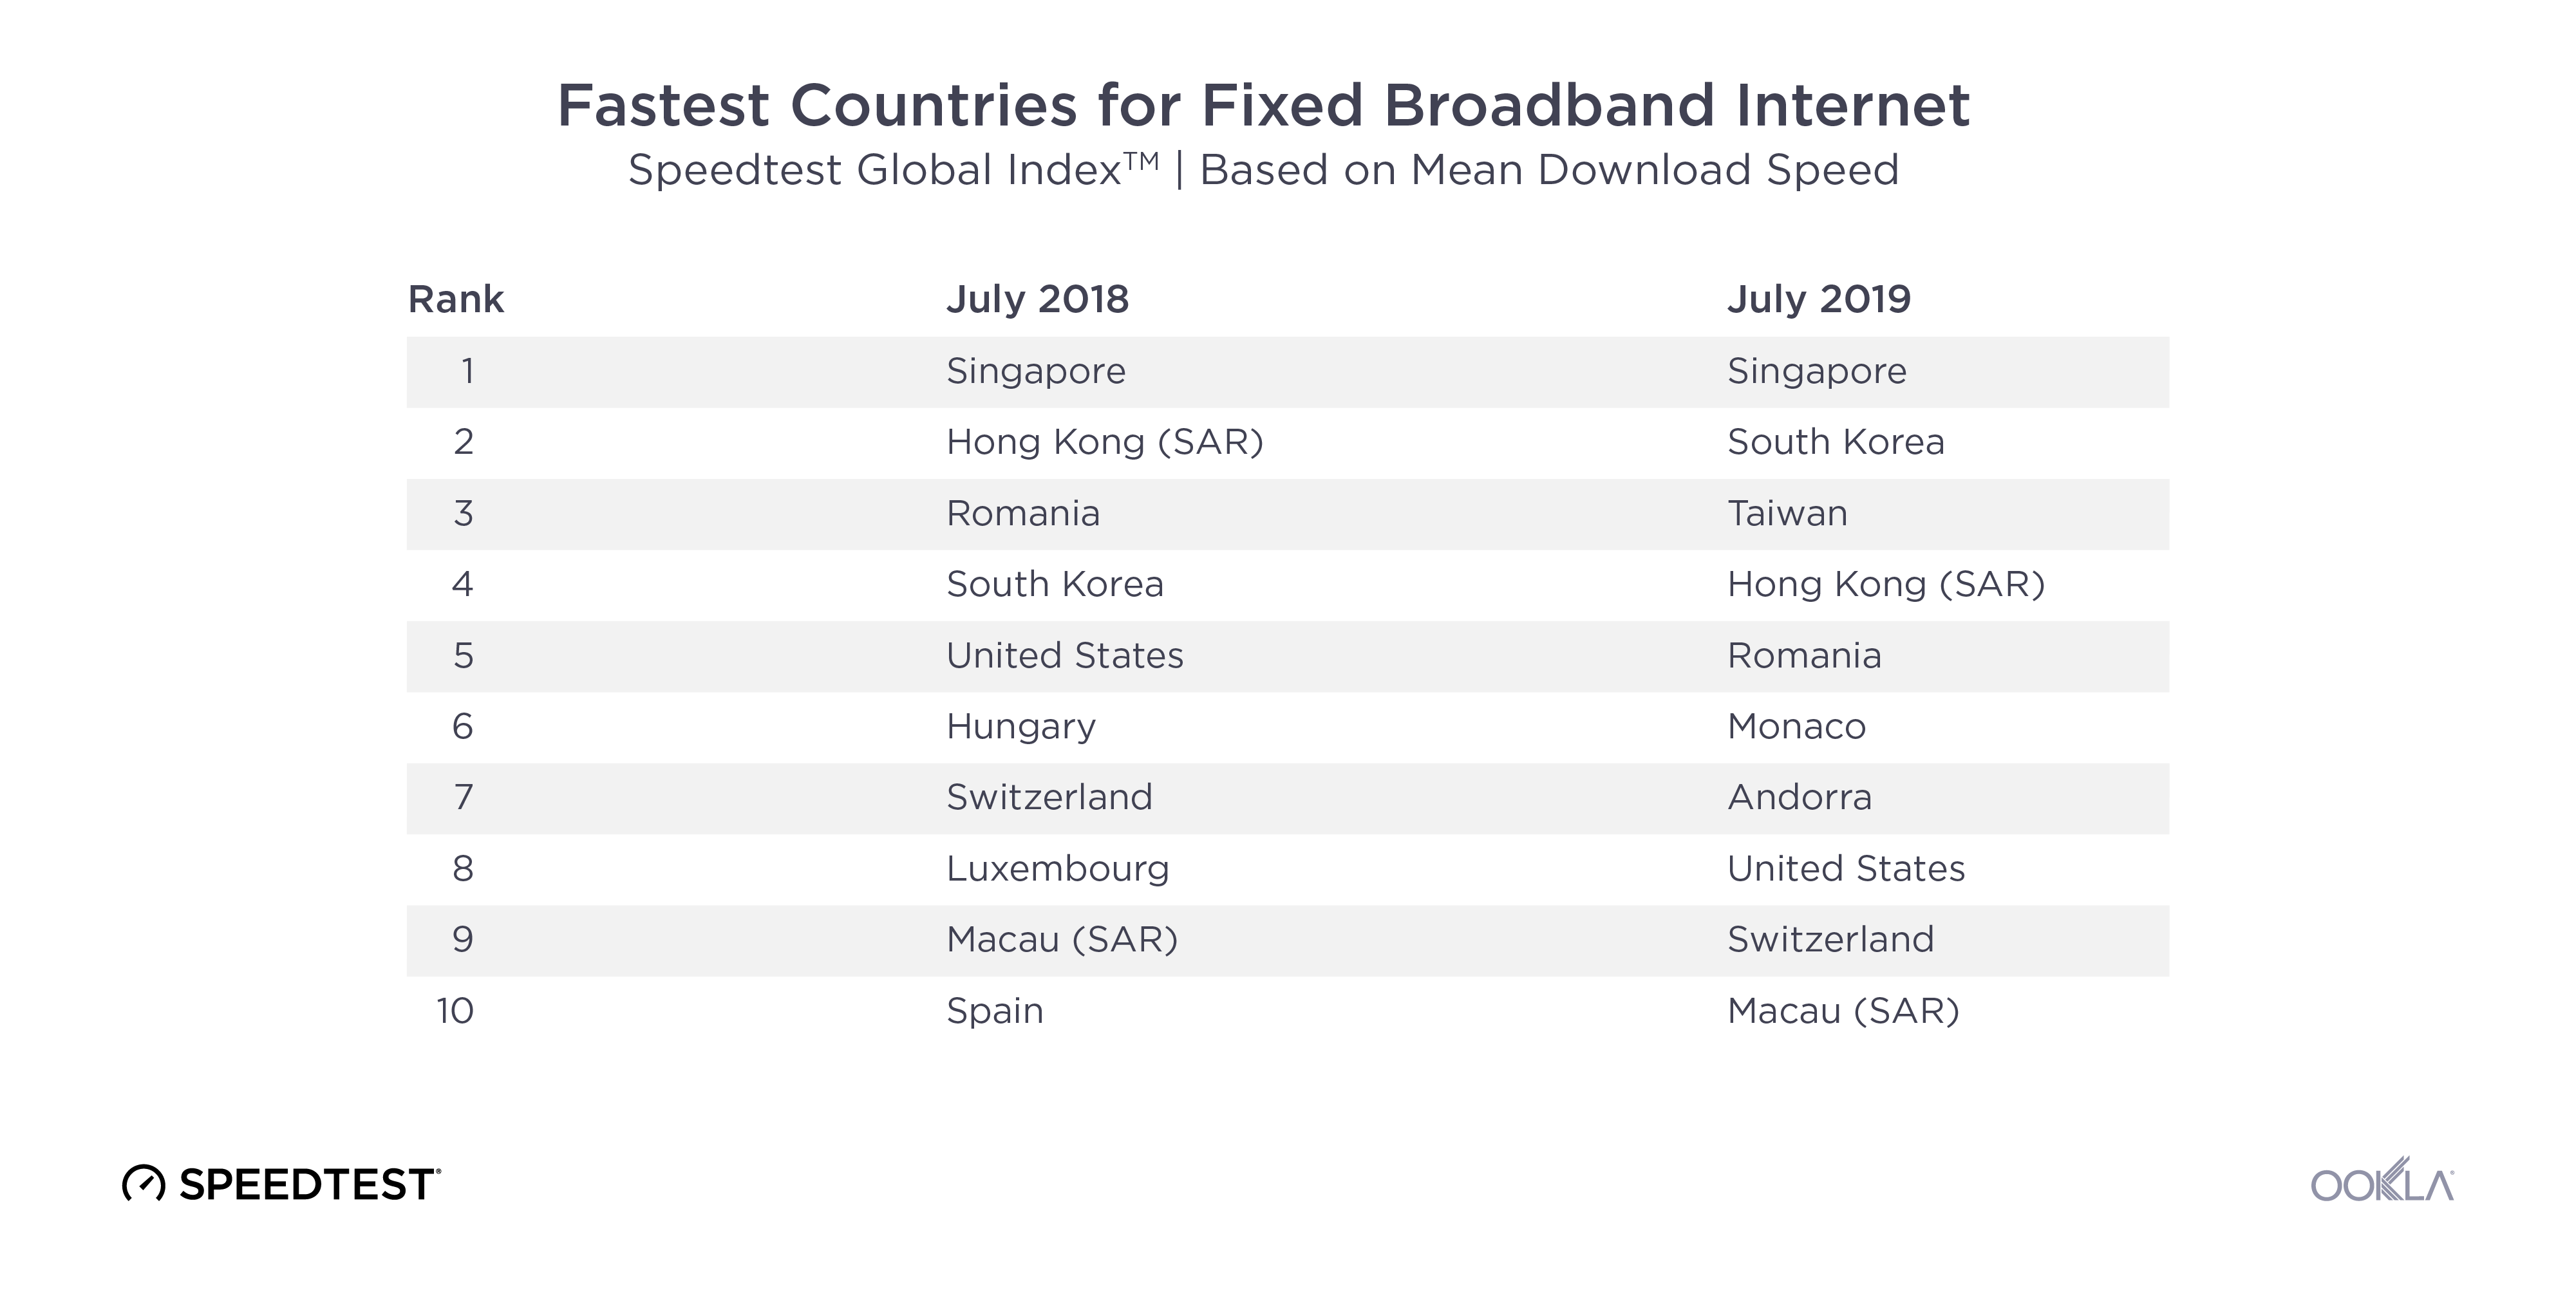
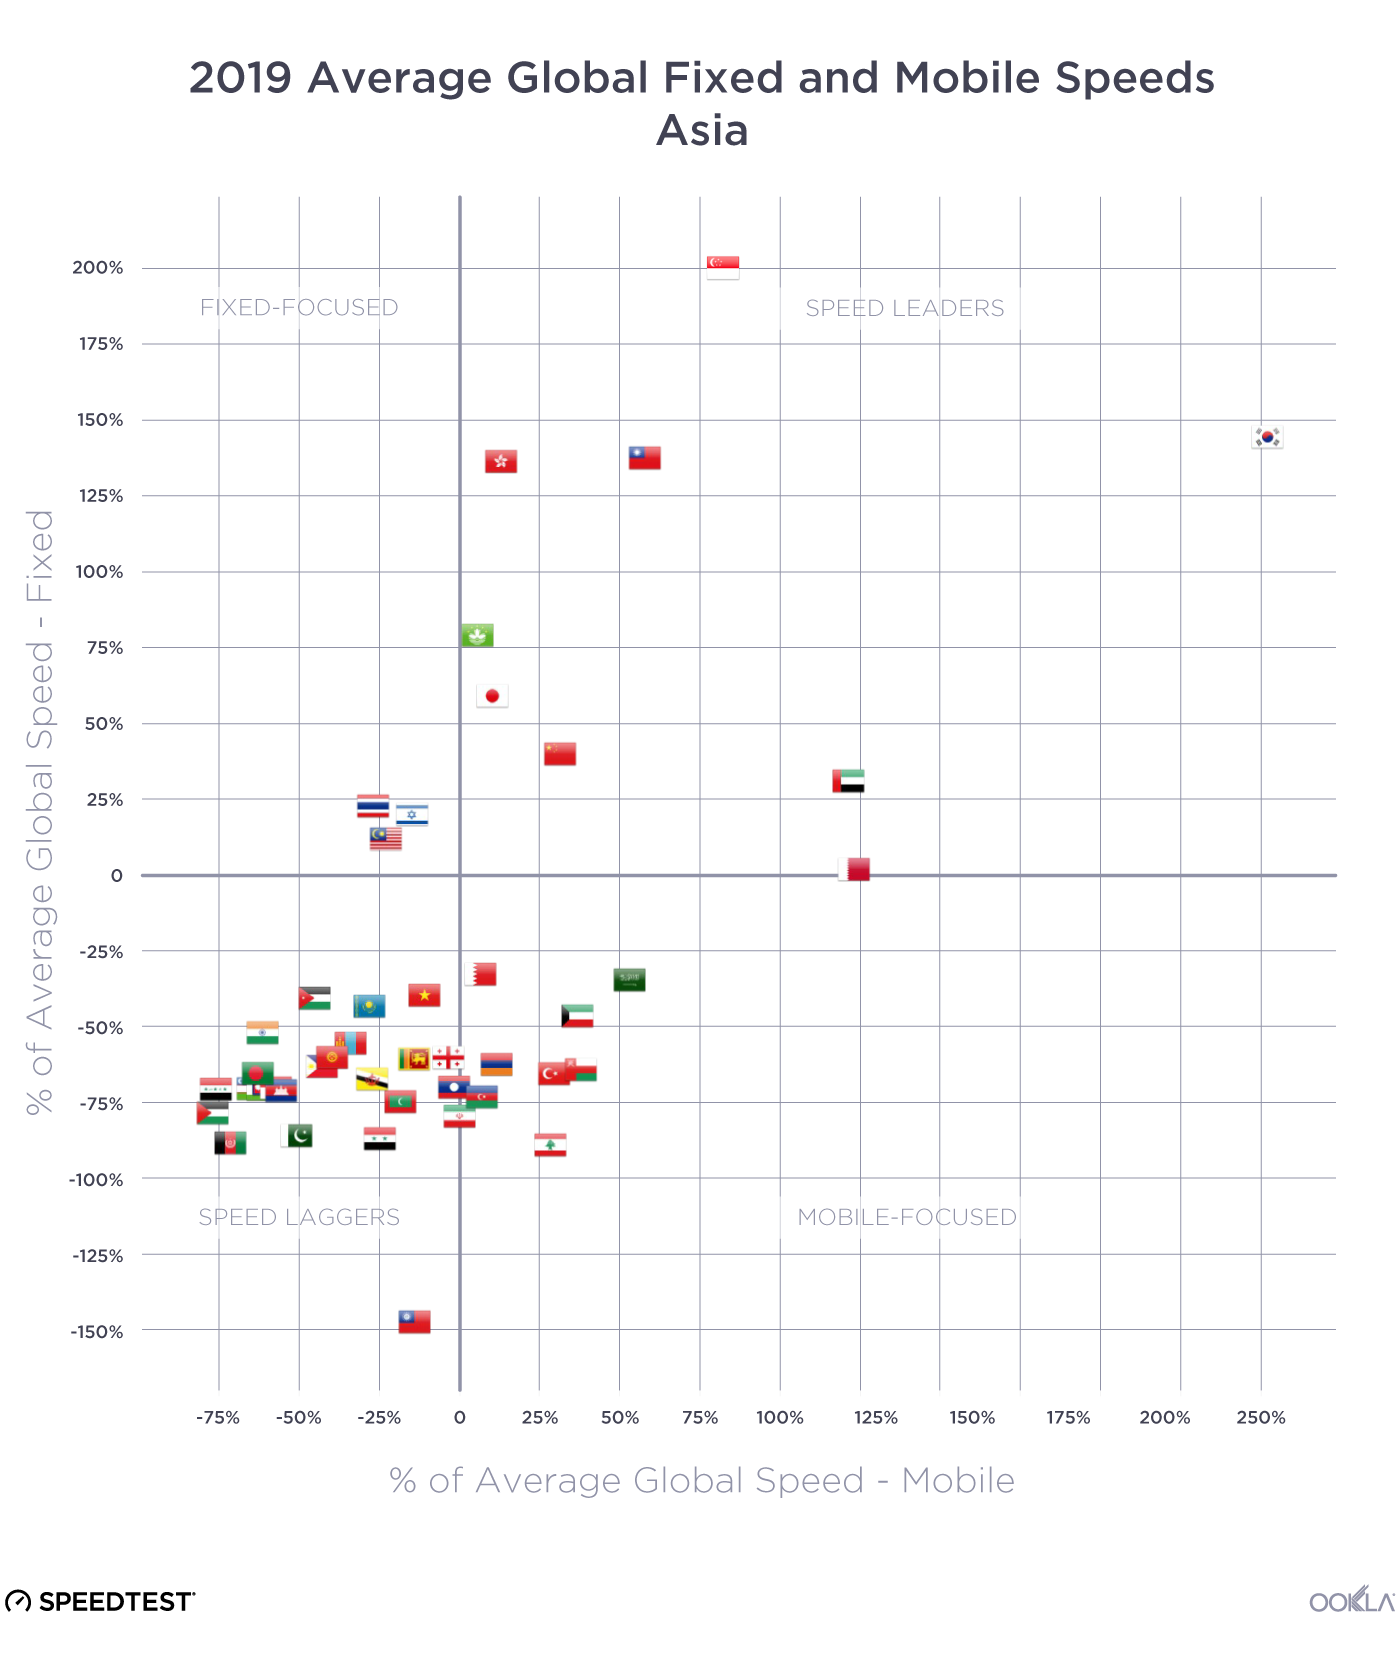
The Speedtest Global Index ranks countries based on their download speeds over mobile and fixed broadband. To honor the big race, we narrowed that field to just the countries competing this year and looked at their mobile performance over the past 12 months. We had to leave Eritrea off the list as there were not sufficient samples in the country during the time period to qualify for the Speedtest Global Index.
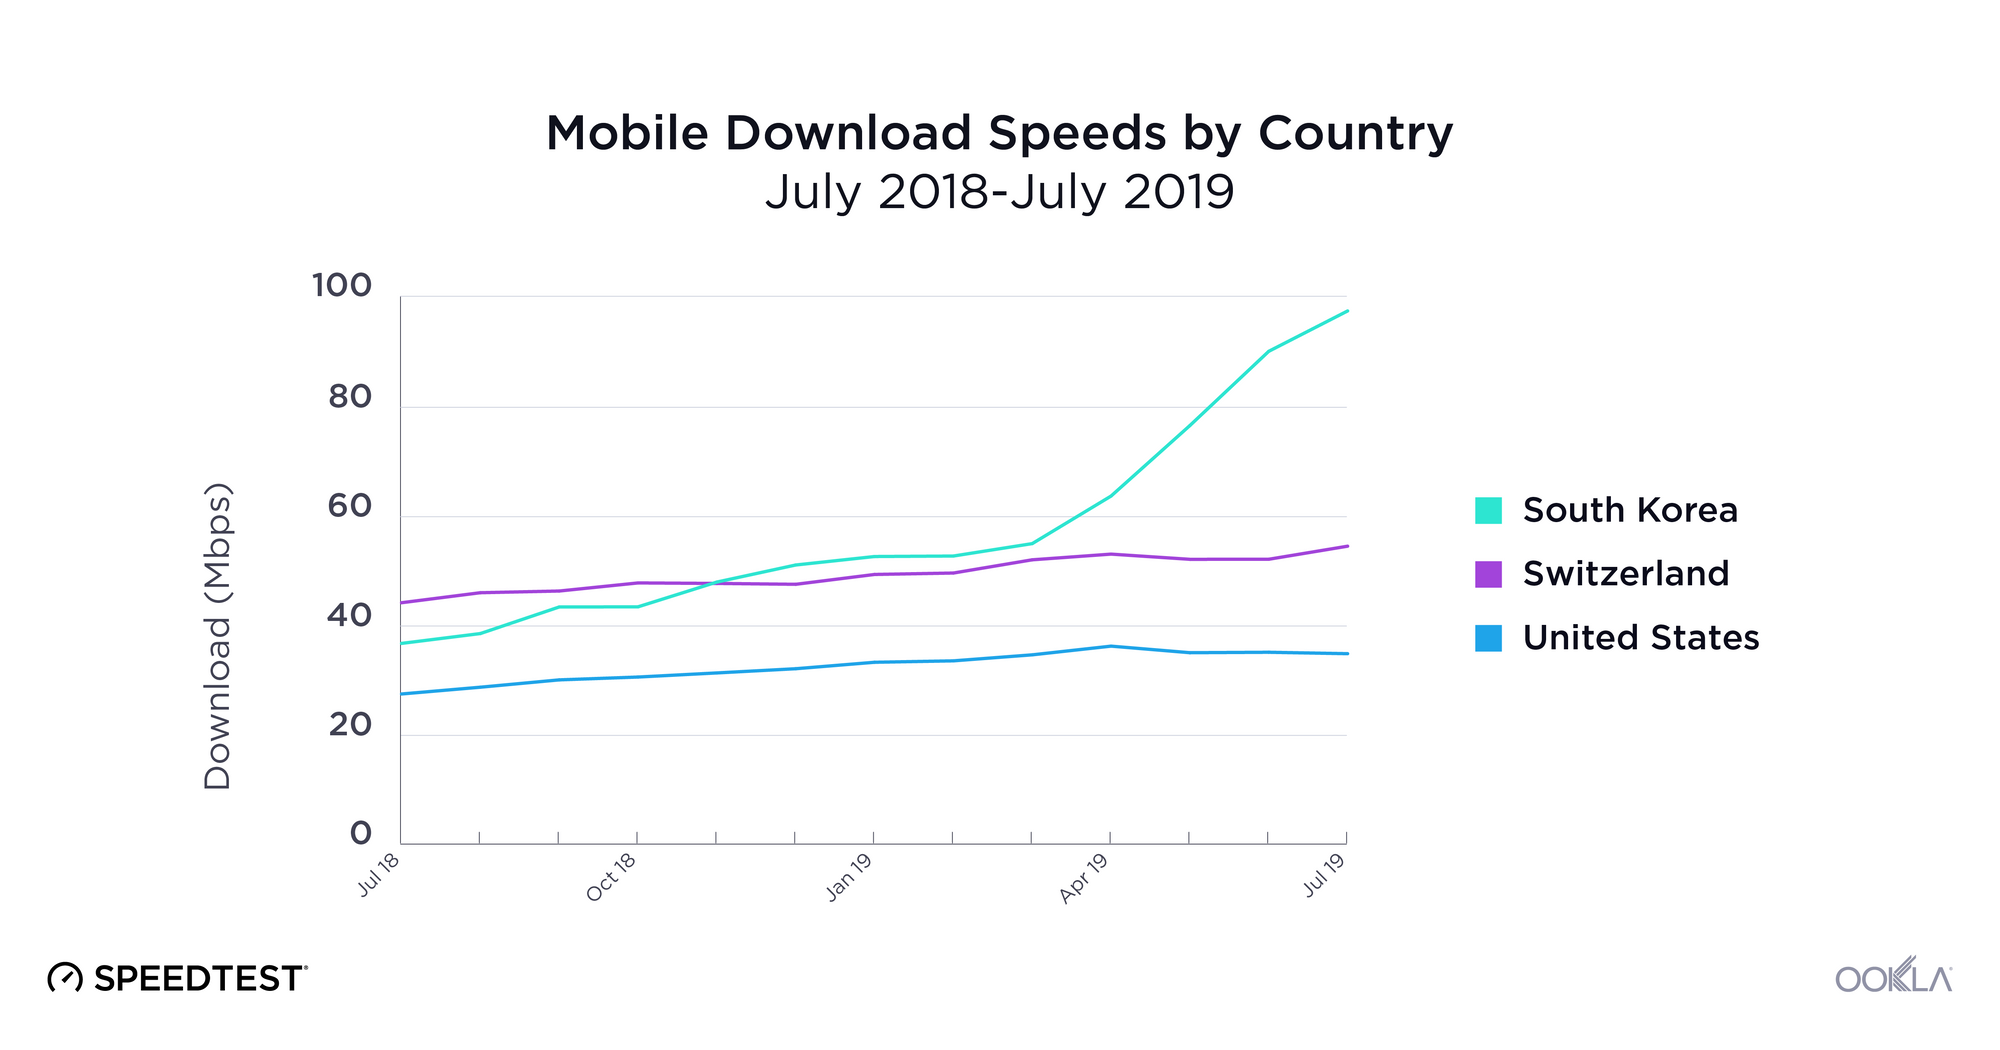
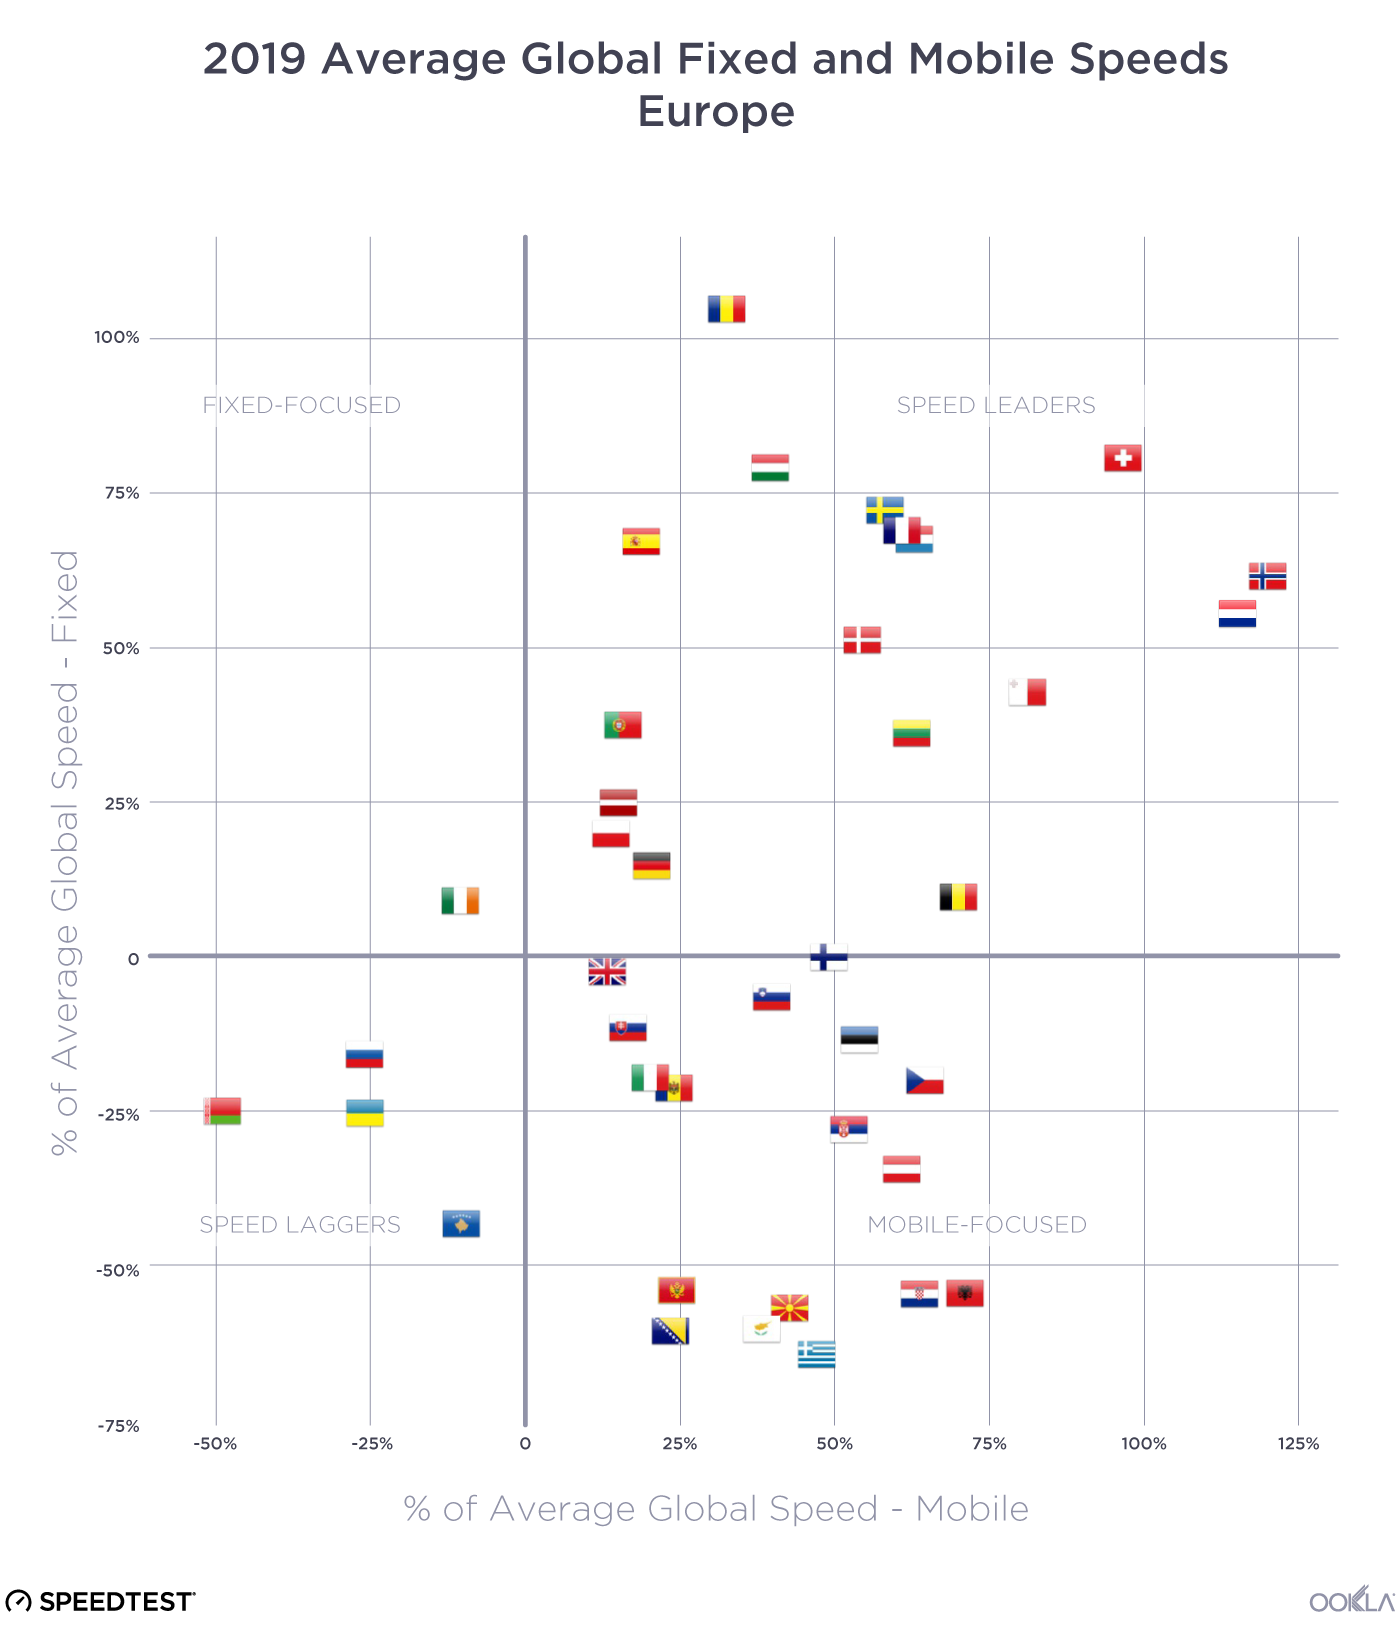
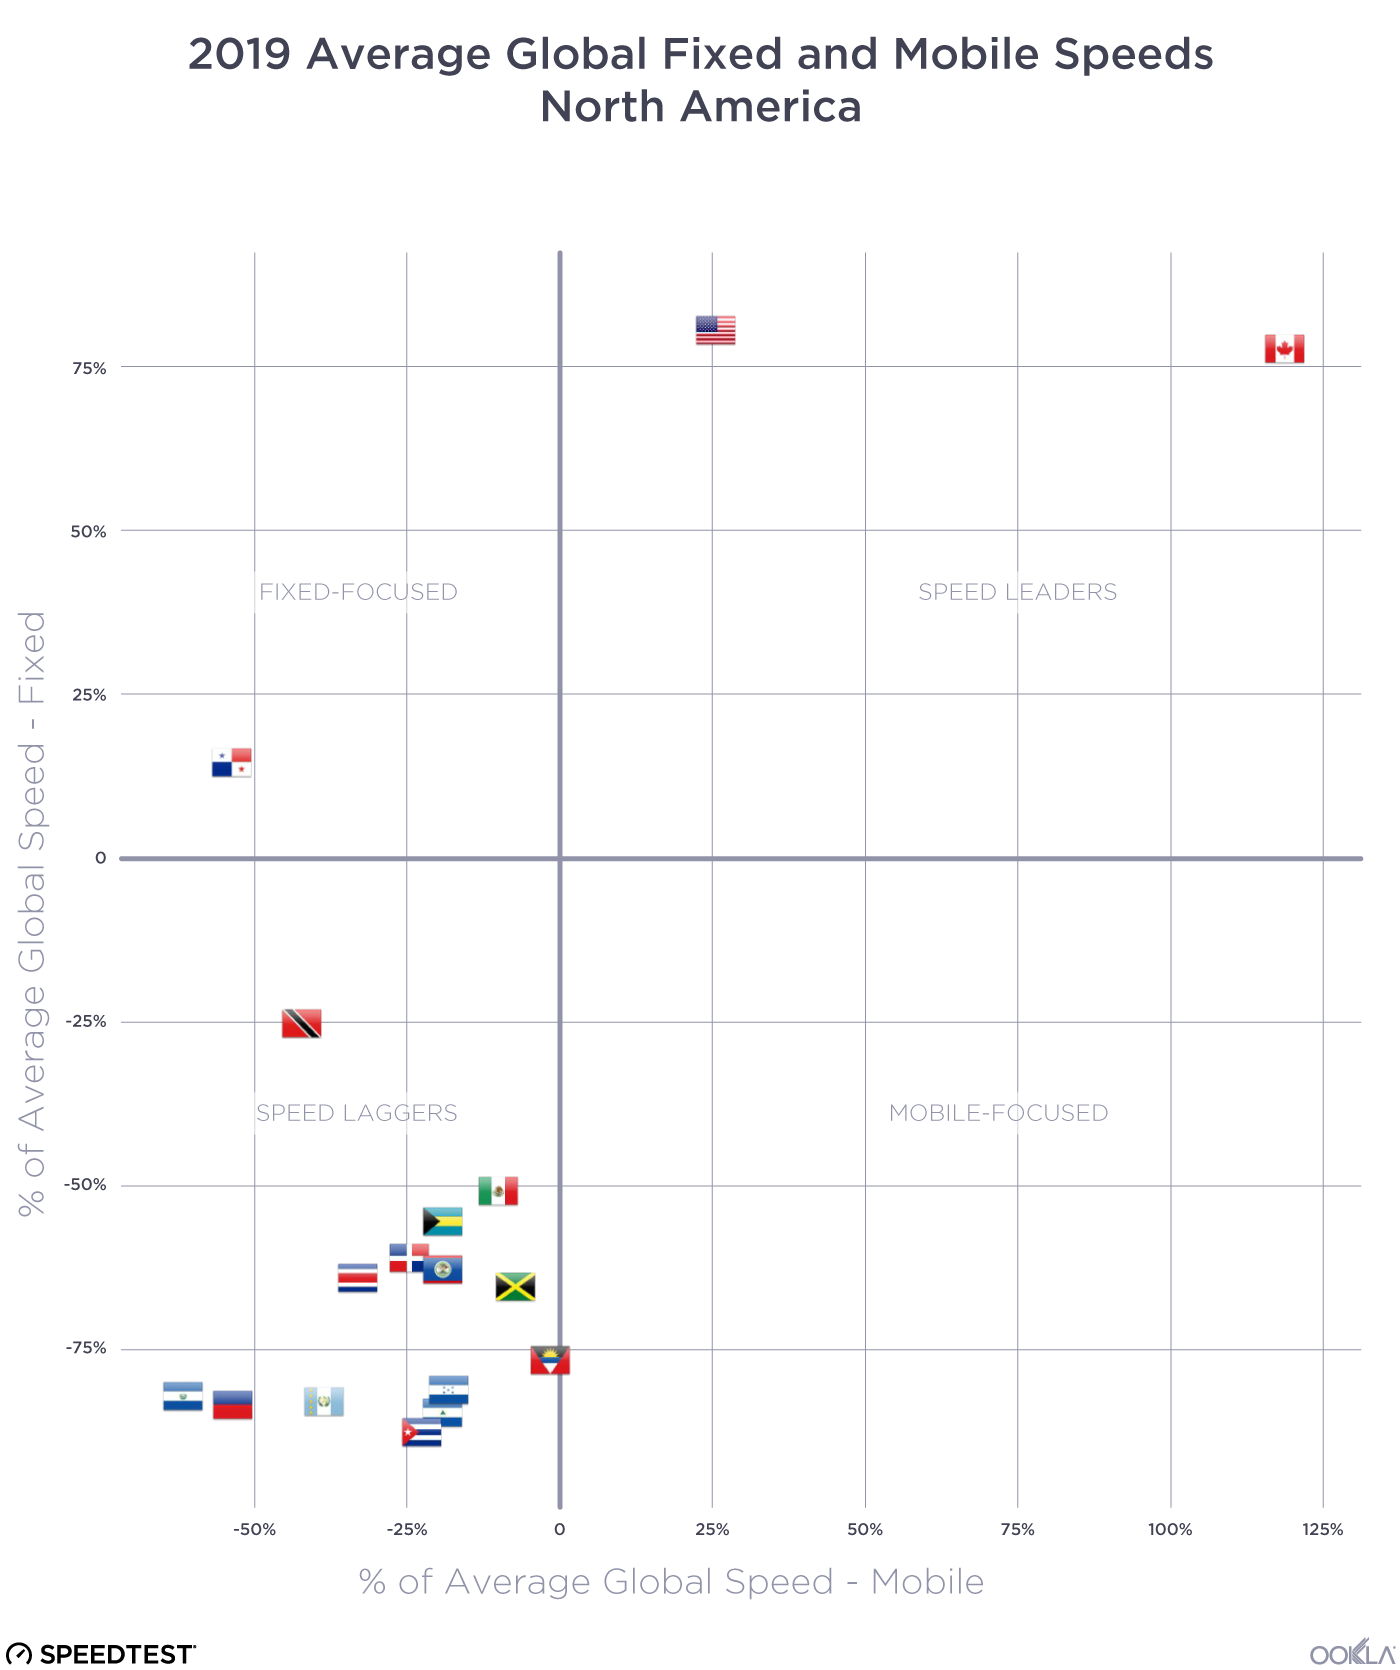
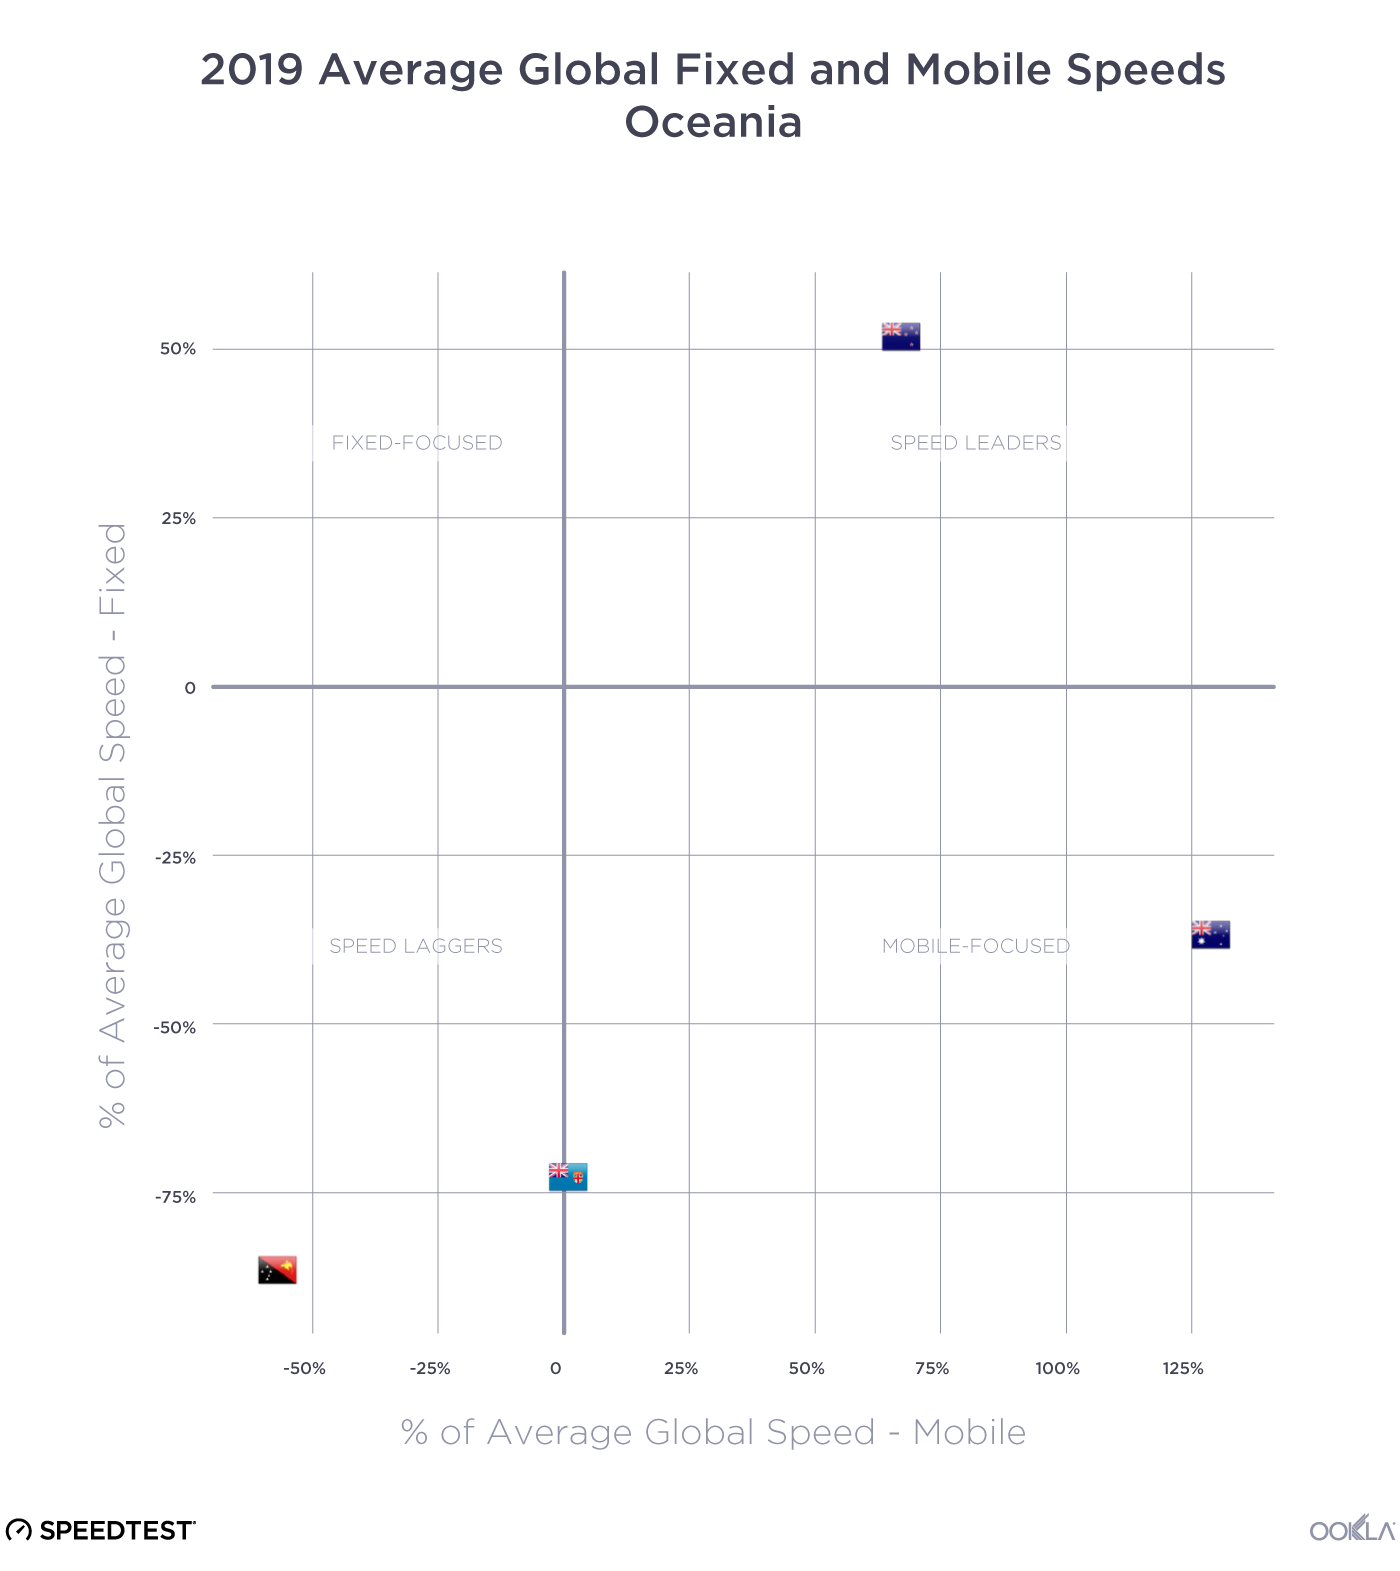
Mobile speeds in Norway have exploded to the point that they’ve led the pack every single month for the past year. Even when Norway slipped to second in the world for mobile, behind South Korea, they still led all the countries currently touring. Canada’s mobile speeds started strong and rallied to surpass Australia and the Netherlands. These four countries were up in front of the pack for the entire year.
Up next in the chasing group, there was a lot more movement. France started a long climb in September 2018 that took them from 29th in the world for mobile download speed to 17th. This also helped France pass New Zealand and Austria. Belgium started strong but then they fell back in the bunch. The Czech Republic regrouped slightly in April to improve their ranking to a career high of 11, but recently they’ve fallen back to just above where they ranked 12 months ago.
All the way back in the broom wagon, Colombia fell behind early and couldn’t find their second wind. Costa Rica’s decline started later but still left them in second to last place.
Mobile performance in Tour cities
Cyclists and fans are visiting many different cities for the different stages of the race. We compared mean download speeds over mobile in some of the start and stop cities during Q2 2019 to see which were in front and which were chasing. Note that according to the Ookla 5G MapTM, no cities in France or Belgium have commercially-available 5G as of this writing.
| City | Mean Download (Mbps) | Mean Upload (Mbps) |
|---|---|---|
| Saint-Étienne, France | 60.99 | 13.08 |
| Reims, France | 59.05 | 13.95 |
| Nancy, France | 58.48 | 14.66 |
| Mulhouse, France | 57.60 | 13.57 |
| Toulouse, France | 55.31 | 12.68 |
| Belfort, France | 53.46 | 13.19 |
| Tarbes, France | 53.26 | 12.92 |
| Pau, France | 52.27 | 13.14 |
| Nîmes, France | 51.10 | 12.84 |
| Rambouillet, France | 51.09 | 12.13 |
| Colmar, France | 50.52 | 13.97 |
| Mâcon, France | 48.57 | 14.42 |
| Paris, France | 46.76 | 11.18 |
| Brussels, Belgium | 45.81 | 16.56 |
| Albi, France | 44.49 | 12.22 |
| Chalon-sur-Saône, France | 42.99 | 12.89 |
| Saint-Dié-des-Vosges, France | 35.44 | 11.93 |
| Gap, France | 27.77 | 8.24 |
Saint-Étienne led a tight pack that included Reims, Nancy and Mulhouse which all showed mobile download speeds above 57 Mbps. Toulouse, Belfort, Tarbes, Pau, Nîmes, Rambouillet and Colmar were chasing with mobile download speeds between 50 and 56 Mbps.
We hope that last-place Gap and second-to-last Saint-Dié-des-Vosges were regrouping rather than taking a rest day as they showed mobile download speeds that were significantly slower than the rest of the cities.
Not all locations had sufficient samples to be included in our list, so if you want to know what mobile speeds are like at the Pont du Gard (or anywhere else), take a Speedtest on Android or iOS.
Chapeau to all the teams! May the rest of the race feel flat and fast.
Embarquez pour le tour des performances mobiles avec le Speedtest Global Index
Chez Ookla, nous vouons une véritable passion à la vitesse. Et alors que la Grande Boucle bat son plein en France, nous comptons bien la célébrer comme il se doit ! En parallèle de la lutte acharnée que se livrent les valeureuses équipes, nous avons comparé les performances mobiles des pays d’origine des coureurs en utilisant le Speedtest Global IndexTM. Nous avons également mesuré la vitesse de téléchargement dans les villes-étapes pour découvrir laquelle peut se vanter de disposer du meilleur débit Internet.
Performances mobiles : quels pays s’échappent du peloton ?
Le Speedtest Global Index classe les pays en fonction de leur vitesse de téléchargement haut débit mobile et fixe. Pour rendre hommage au Tour, nous avons uniquement examiné les performances mobiles des pays en lice au cours des douze derniers mois. L’Érythrée n’est malheureusement pas au rendez-vous en raison d’un nombre d’échantillons de données insuffisant.
Grâce à une vitesse de téléchargement mobile ultrarapide, la Norvège a trusté la première place du classement tout au long de l’année. Si le pays a rétrogradé à la deuxième place mondiale juste derrière la Corée du Sud, il a littéralement survolé les débats dans le cadre de notre compétition. De son côté, le Canada a démarré fort, en parvenant même à dépasser l’Australie et les Pays-Bas. Ces quatre pays ont réussi une formidable échappée tout au long de l’année.
Derrière, le groupe de poursuivants s’est organisé pour réduire l’écart. Grâce à une folle remontée en septembre 2018, la France est passée de la 29e à la 17e place mondiale, coiffant au poteau la Nouvelle-Zélande et l’Autriche. Après un très bon départ, la Belgique s’est malheureusement retrouvée engluée dans le peloton. La République Tchèque a mis un petit coup d’accélérateur en avril pour atteindre la 11e place (une première !). Elle a ensuite connu une baisse de régime qui l’a vu terminer juste au-dessus de son classement de l’année dernière.
En queue de peloton, la Colombie a rapidement été distancée et n’est jamais parvenue à trouver un second souffle. Malgré ses bonnes intentions, le Costa Rica a quant à lui fini avant-dernier.
Performances mobiles dans les villes-étapes
Les coureurs et les fans visitent de nombreuses villes lors des différentes étapes du Tour. Nous avons comparé les vitesses moyennes de téléchargement mobile dans certaines de ces villes au cours du deuxième trimestre 2019 afin d’établir un classement. Notez que selon l’Ookla 5G MapTM, aucune ville de France ou de Belgique ne propose actuellement la 5G.
| Ville | Débit descendant moyen (Mbps) | Débit ascendant moyen (Mbps) |
|---|---|---|
| Saint-Étienne, France | 60,99 | 13,08 |
| Reims, France | 59,05 | 13,95 |
| Nancy, France | 58,48 | 14,66 |
| Mulhouse, France | 57,60 | 13,57 |
| Toulouse, France | 55,31 | 12,68 |
| Belfort, France | 53,46 | 13,19 |
| Tarbes, France | 53,26 | 12,92 |
| Pau, France | 52,27 | 13,14 |
| Nîmes, France | 51,10 | 12,84 |
| Rambouillet, France | 51,09 | 12,13 |
| Colmar, France | 50,52 | 13,97 |
| Mâcon, France | 48,57 | 14,42 |
| Paris, France | 46,76 | 11,18 |
| Bruxelles, Belgique | 45,81 | 16,56 |
| Albi, France | 44,49 | 12,22 |
| Chalon-sur-Saône, France | 42,99 | 12,89 |
| Saint-Dié-des-Vosges, France | 35,44 | 11,93 |
| Gap, France | 27,77 | 8,24 |
Au coude-à-coude avec Reims, Nancy et Mulhouse, Saint-Étienne s’est imposée dans un groupe relevé affichant une vitesse de téléchargement mobile supérieure à 57 Mbps. Dans son sillage, Toulouse, Belfort, Tarbes, Pau, Nîmes, Rambouillet et Colmar ont fait bonne figure avec une vitesse comprise entre 50 et 56 Mps.
Gap et Saint-Dié-des-Vosges, respectivement dernier et avant-dernier, n’ont jamais semblé pouvoir suivre le rythme du peloton, avec une vitesse bien inférieure à celle des autres villes.
Faute d’un nombre d’échantillons de données suffisant, cette liste n’est pas exhaustive. Si vous souhaitez connaître la vitesse de téléchargement mobile de Pont du Gard ou de toute autre ville, effectuez un Speedtest sur Android ou iOS.
Un grand bravo à toutes les équipes ! Nous vous souhaitons bonne chance pour le reste de la course !
Ookla retains ownership of this article including all of the intellectual property rights, data, content graphs and analysis. This article may not be quoted, reproduced, distributed or published for any commercial purpose without prior consent. Members of the press and others using the findings in this article for non-commercial purposes are welcome to publicly share and link to report information with attribution to Ookla.