| February 22, 2021

Revisiting iPhone 12 5G Performance Across the Globe


As we previously covered, the iPhone 12 is finally allowing Apple enthusiasts to connect to 5G. We’re back with fresh data to see how user adoption and new 5G rollouts have affected performance worldwide.

Unique 5G-capable device counts have leveled off

After the launch of various iPhone 12 models, the daily count of unique devices worldwide that are capable of connecting to 5G spiked significantly compared to the year as a whole. The daily trend of unique 5G-capable devices as a percentage of the whole year is dramatically higher than before the iPhone 12 models launched, but has remained relatively steady since December.
Daily-Trend_5G-Capable-Devices_Year_0221

Pro 5G and Pro Max 5G are the most popular iPhone 12 models

We looked again at Speedtest® results from the launch date of each model, this time including data through the end of January, to see which iPhone 12 models are the most popular. This time we added five additional cities for a total of 20 major cities across the globe. We still found that most Speedtest users have opted for the “Pro” models.

The iPhone 12 Pro Max 5G showed the highest number of samples among iPhone models in Bangkok, Kuwait City, Singapore, Abu Dhabi, Dubai, Riyadh, Hong Kong, New York, London, Madrid and Sydney. This was a change for both London and Madrid, which had previously had more samples from the iPhone 12 Pro 5G.

The iPhone 12 Pro 5G showed the most samples in Seoul, Zürich, Berlin, Amsterdam, Warsaw, Helsinki, Rome, Barcelona and Tokyo. While the more affordable models were less popular than the Pro models across all the cities on our list, the iPhone 12 Mini saw the most adoption in Tokyo and the iPhone 12 5G saw the most adoption in Rome and Madrid.
iPhone-12-Model-Popularity_0221

Seoul tops list of iPhone 12 5G speeds

As before, we analyzed Speedtest Intelligence® data for iPhone 12 devices in these 20 cities and found that Seoul had the fastest median speed over 5G, followed by several of the major cities of the Gulf Cooperation Council (GCC), namely Kuwait City, Abu Dhabi, Dubai and Riyadh.

It is also interesting to observe that, in the highly dynamic European market where many different network rollout approaches are possible, 5G download speeds in seven of nine European cities fell between 135-160 Mbps range on the iPhone 12. Helsinki and Warsaw were the exceptions in Europe, with 241.98 and 61.14 Mbps median download speeds, respectively.
iPhone-12-5G-Median-Speeds_0221

Operator breakdown: iPhone 12 performance in select cities

We also expanded our operator analysis to 10 cities. The following charts include median 5G speeds over iPhone 12 models of top operators with sufficient samples.

Operator rankings did not change in the four cities we previously analyzed. LG U+ in Seoul, China Mobile Hong Kong in Hong Kong and KPN Mobile in Amsterdam still had the fastest median 5G download speeds over the iPhone 12 in their local markets.
iPhone-12-5G-Median-Speeds_Seoul_0221-1

iPhone-12-5G-Median-Speeds_Hong-Kong_0221

iPhone-12-5G-Median-Speeds_Amsterdam_0221

iPhone-12-5G-Median-Speeds_Madrid_0221

Barcelona showed similar speeds by operator to those in Madrid. We could not yet determine whether Vodafone or Orange’s 5G networks were fastest for iPhone 12, but both providers had a solid lead over Movistar in both Madrid and Barcelona.
iPhone-12-5G-Median-Speeds_Barcelona_0221

United Arab Emirates was the fastest country for mobile according to the January 2021 Speedtest Global Index. As the capital and the second most populous city in the country, Abu Dhabi contributed to this average with median 5G download speeds of 396.06 Mbps on the iPhone 12 for Etisalat and 211.83 Mbps for du.
iPhone-12-5G-Median-Speeds_Abu-Dhabi_0221

In Bangkok, AIS showed the highest median 5G download speed over the iPhone 12 at 362.68 Mbps. TrueMove H followed at 242.22 Mbps. These two operators also had the highest number of Speedtest results over iPhone 12 among all operators analyzed for this article. Another popular operator in the region, DTAC, is not included in the chart due to limited iPhone 12 5G samples.
iPhone-12-5G-Median-Speeds_Bangkok_0221

Data from Speedtest Intelligence reveals that Sunrise had the fastest median 5G download speed over iPhone 12 by a considerable margin at 328.32 Mbps.
iPhone-12-5G-Median-Speeds_Zurich_0221

Telekom in Berlin comfortably had the fastest median 5G download speed over iPhone 12 at 249.16 Mbps.
iPhone-12-5G-Median-Speeds_Berlin_0221

As mentioned above, median 5G speeds over iPhone 12 lagged in Warsaw when compared with other European cities analyzed. This is likely due to the fact that the auction of 3.4-3.8 GHz bands did not take place as planned in Poland because of the pandemic. As of this analysis, Orange and T-Mobile’s 5G speeds for iPhone 12 devices were faster than Play, which trailed with 42.53 Mbps. We also saw 5G tests from Plus in Speedtest Intelligence, but the operator is not included in the above chart due to lack of iPhone 12 samples compared to other operators.
iPhone-12-5G-Median-Speeds_Warsaw_0221

We will continue to monitor how Apple’s 5G-capable devices impact the global market. Contact us to learn more about how Speedtest Intelligence can help you understand the latest developments in your market.

Ookla retains ownership of this article including all of the intellectual property rights, data, content graphs and analysis. This article may not be quoted, reproduced, distributed or published for any commercial purpose without prior consent. Members of the press and others using the findings in this article for non-commercial purposes are welcome to publicly share and link to report information with attribution to Ookla.

| April 13, 2022

The Mixed Picture for 5G in Europe

Ookla® recently hosted a webinar on “Why is 5G in Europe Falling Behind, and what can we do about it?” We gathered representatives from two of Europe’s leading 5G operators, Three UK and KPN, to talk about their approach to 5G and some of the challenges they have faced. We were also joined by industry experts from the U.K. regulator Ofcom, leading equipment vendor Ericsson, as well as Counterpoint Research. Here is our summary of some of the key takeaways from that webinar.

5G makes headways in Europe … uptake disappoints 

Operators’ lack of interest in 5G cannot be blamed. According to GSMA Intelligence, a majority of European countries (34 out of 50) have already deployed 5G, and just over half of operators in the region (92 out of 173) have launched 5G networks. 

However, looking at 5G uptake measured as the proportion of 5G connections of total connections) Europe performs poorly with only 2.5% as of Q4 2021 according to GSMA intelligence. This places it well behind North America, China, Japan, and South Korea. While adoption will pick up over the next couple of years, Europe will still lag behind other regions. 

Factors driving 5G adoption


The best way to express the key takeaways from the discussion is to think about the factors that affect 5G adoption:

  • Network. This covers spectrum assignments, network roll out, and market structure 
  • Devices. Here this includes consumer devices such as smartphones, but as 5G scales there will be more dedicated industrial 5G devices in the market and other connected consumer devices e.g. AR/VR.
  • Use cases. The fact of the matter is that technology for the technology’s sake won’t sell. Unless there are appealing use cases leveraging the technology the end users will remain unconvinced. These could range from delivering broadband access to rural areas via 5G Fixed Wireless Access (FWA) or private 5G networks for manufacturing plants. 

The many flavors of 5G

The fact that “5G is not one size fits all,” was highlighted throughout the panel. The key to understanding 5G is understanding the spectrum and there are two key considerations to keep in mind: speed performance and geographical coverage.

While mmWave is capable of delivering super-fast speeds — much faster than those that sub-6 GHz spectrum can support — sub-6 GHz signals are able to travel farther than mmWave, cover a greater geographical region, and provide deeper penetration within buildings. 

Operators’ 5G performance depends heavily on their 5G spectrum holdings. In some cases, in the absence of dedicated 5G spectrum or to supplement existing spectrum, operators can use Dynamic Spectrum Sharing (DSS) to use the same spectrum band for different RAN technologies, which are allocated in real time – this in turn impacts 5G performance. 

Market structure and the role of government

The optimal market structure and role of governments in supporting the rollout of 5G remains a heavily debated topic. As Brian Potterill from Ofcom pointed out, governments and regulators are not in the best position to decide on targets, and that investment decisions should be left to the market to decide. As a result, Ofcom pursues a light-tough approach to 5G, working to enable the market to remain competitive. In addition, he downplayed the role of 5G targets, given the different flavors of 5G networks and the fact that unless tied to license obligations, they wouldn’t be binding. Despite this, the EU maintains key targets on 5G rollout for member states, a position we critiqued in our report 5G in Europe: EU Targets Require a Rethink.

For Gabriel Solomon of Ericsson, the main reason why Europe is falling behind on 5G lies in the investment environment, given the weighted average cost of capital remains higher than the return on invested capital in the region. He noted that there are huge sums of public money being made available via the EU’s Recovery and Resilience Facility, some of which is being directed by member states at improving connectivity. Beyond this investment, he outlined three main levers governments have to help spur 5G deployment:

  1. Spectrum. There is a need for a trade off between spectrum fees and incentives for operators to deploy networks more widely.
  1. Removing barriers to deployment. This is clearly an issue, with the EC recently announcing a new Connectivity Infrastructure Act designed to make barriers to passive infrastructure and backhaul much more available and affordable. In the U.K., the Government recently announced new plans to slash red tape from 5G roll out in a bid to help spur deployment. 
  1. Market structure. Half of European markets have four or more mobile operators. There is a clear desire for further mobile network consolidation which operators see as key in helping improve the investment case for 5G deployment. During Three UK’s recent 2021 results announcement, Robert Finnegan, Three UK’s Chief Executive Officer, warned that despite achieving positive results, “the U.K. market with four operators continues to remain dysfunctional and requires a structural change to improve the overall quality of infrastructure that U.K. customers should expect.”

KPN: The tale of 5G Availability

Within Europe, the Netherlands comes top in terms of 5G Availability (the proportion of users of 5G capable devices who spend a majority of their time on 5G networks). Only six European markets had 5G Availability above 20% by Q4 2021. Not surprisingly, the U.S. is in the lead with almost 50% 5G Availability, having started 5G deployment in the 600 MHz (low band) range. 

Erik Brands from KPN explained that they had a good starting point with over 99% nationwide 4G LTE coverage. In 2019, KPN embarked on a nationwide network modernization — a full upgrade of all equipment on every site, installing all available frequencies and making it technology neutral so they refarm frequencies by software. As a result KPN scores well on 5G coverage, partially because they have access to low band 5G spectrum (700 MHz). They have managed to extend 5G coverage to more than 80% of the country, including rural areas. Some of this is driven by the coverage requirement as part of the 700MHz licenses: a minimum speed of 8 Mbps in 98% of the cases in each municipality of the country in 2022.

While KPN scores well on 5G Availability, 5G performance is not yet at gigabit levels. This is mainly caused by the lack of available spectrum in the C-band, which is currently occupied by Inmarsat and local licenses. The Netherlands is very late clearing this band and it still isn’t clear when it is going to be auctioned. In time, KPN will need this spectrum to maintain quality and to enable other applications. KPN currently sees mmWave, which is also not available yet, as addressing more niche use cases that require very high bandwidth.

Three UK: “We can’t run as fast as we want to”

Three UK has a very “data hungry” customer base —  while their subscribers account for around 15% of the UK population, the network is carrying 30% of the traffic. Three UK benefited from having the largest, dedicated 5G spectrum — 140 MHz of frequency across several 5G spectrum bands, including a 100 MHz block of continuous spectrum in the 3.3-3.8 GHz band, which positions it well in terms of median download speeds compared to other U.K. operators — read our latest article to find out more about 5G in The U.K.

In order to fulfill their customers’ demand, the operator has embarked on a network transformation journey, consisting of upgrading all sites over time to 5G. They are also deploying C-band with Massive MIMO on 60% of all sites — targeting all major cities, towns and even villages covering 85-90% of total traffic on their network — Anil Darji, Three UK’s Chief Network Architect, called it “a capacity play.” In the remaining 40% of sites, which are rural and mostly coverage driven, the operator will utilize DSS and potentially refarm some of the 4G spectrum to 5G NR — this is “a coverage play” to get the 5G capabilities like reduced latency out there. 

Both operators pointed to a number of constraints in terms of deployment, including planning, regulation, site landlords, and aging infrastructure. Anil Darji mentioned that even once planning approval has been granted for a new site, some local councils can look to delay deployment through the process of requiring application for road closures. Three UK’s strategy is to upgrade all its sites and to build new macro sites to respond to growing demand. However, recent planning reforms fell short in terms of allowing them to deploy taller sites required for the deployment of all 4G & 5G spectrum, and he called for more government support and reforms to the planning process.

European 5G smartphone sales picked up strongly in 2021 

Jan Stryjak of Counterpoint Research struck a positive note on 5G smartphone sales in Europe, noting that 5G now accounts for a majority of smartphone sales in the region. However, Europe lags behind other advanced markets in smartphone adoption with the latest data for Q4 2021 showing 5G smartphones accounted for 60% of smartphone sales vs. 73% in North America and 79% across China, Japan and South Korea. Within Europe itself there is wide variation, with the U.K. having the highest ratio globally at 83%, while some Eastern European markets come in below 40%. 

5G is also moving down the smartphone price tiers. It is ubiquitous in the premium tiers (wholesale price of over $700) boosted by the iPhone 12 in Q4 2020 and iPhone 13 in Q4 2021, accounts for the majority in the mid tier ($250 – $499) and growing, where it is driven mostly by the Samsung A series. It is even growing fast in the budget tiers too ($100 – $249), thanks to affordable 5G devices from the likes of realme and Xiaomi sub-brand Redmi.

In time, smartphone sales will translate into a larger installed base of 5G devices and share of overall subscriptions. 

The importance of 5G use cases cannot be overlooked  

The vast majority of European 5G networks are Non Standalone (NSA), meaning that they still rely on the 4G LTE core network and therefore don’t offer the full advantage of 5G. So far, only four operators across three countries deployed 5G Standalone (SA), partially because most operators started 5G deployment by utilizing DSS, where 5G SA is less relevant. As operators move to focus more on massive MIMO using mid-band spectrum (which delivers a step change in capacity and throughput) then the functionality of SA becomes more attractive to use. Not surprisingly, the GSA says 46 operators across 27 counties are planning to deploy 5G SA. 5G SA also enables additional 5G capabilities beyond high speed such as  Ultra-Reliable Low-Latency Communication (URLLC)  and virtual network functions such as network slicing, which will in turn, enable new 5G use cases. 5G Fixed Wireless Access (FWA) is also one of key use cases for consumers, in areas with limited fiber rollout across Europe. 

Brian Potterill of Ofcom sees connectivity as enabling economic growth and productivity and in this context more connectivity is good, and 5G plays an important role as it enables higher bandwidth and lower latency. He says that it is important that regulators allow the market to function effectively and also sees regulators and governments playing an important role in helping to understand how customers — both consumers and enterprises — can take advantage of 5G and different use cases, and helping to bridge the information gap.

All in all, there is a clear agreement that “build it and they will come attitude” does not work with 5G, there is a need to educate the customers on the benefits that 5G brings and attract them with innovative use cases to persuade them to upgrade, both their devices and tariffs.

See the full webinar recording here.

Ookla retains ownership of this article including all of the intellectual property rights, data, content graphs and analysis. This article may not be quoted, reproduced, distributed or published for any commercial purpose without prior consent. Members of the press and others using the findings in this article for non-commercial purposes are welcome to publicly share and link to report information with attribution to Ookla.

| July 11, 2022

More Consumers are “Always On” Your Network, Here’s What They Need From You

We know the COVID-19 pandemic changed mobile user behavior, but new research commissioned by Ookla® shows just how much more consumers came to rely on their mobile connections. Ookla conducted a survey of five thousand mobile phone users from a diversity of demographic groups across Switzerland, the United Kingdom, and the United States to learn more about how they use their devices and how they view their mobile operators. Computer Weekly recently shared a look at what this looked like in the U.K. For this article, we’ve paired this information with Speedtest® data on consumer sentiment in all three countries to get a full picture of what consumers expect from their mobile operators today.

Key takeaways:

  • The percentage of consumers who describe themselves as always online grew from 30% to 69%.
  • Fewer than two-thirds of respondents are satisfied with customer service with “always on” customers at least twice as likely to report issues with customer service.
  • “Always on” consumers have different support needs, prioritizing a more well-rounded customer service experience.
  • Nearly half (47.4%) of customers who have had customer service issues in the past 18 months are likely to want to switch to another operator.

Increasing numbers of mobile customers are “always on”

The number of mobile customers who described themselves as always online grew from 30% in November 2019 to 69% in November 2021. Whereas consumers used to put down their phones for a variety of reasons, “always on” users are online for a variety of economic reasons (accessing customers and generating business, traffic information and remote working, social media, and information sharing) and lifestyle reasons (parenting and caregiving, health and fitness, and gaming). It’s no surprise then, that these valuable customers need reliable networks to keep up with the demands of their mobile internet use.

Chart of how more users are "always on" comparing 2019 versus 2021

Between 2019 and 2021 we saw a drop in users who were only “always on” for only economic reasons from 16% to 7%. Meanwhile, users who were “always on” for lifestyle reasons grew from 3% to 32%. The largest increases were in users who were “always on” for economic and lifestyle reasons.

Fewer than two-thirds of respondents satisfied with customer service

The 2020 American Customer Satisfaction Index found the telecom industry lags significantly in customer satisfaction. While customer service could be a key component of improving customer satisfaction, our survey revealed that fewer than two-thirds of respondents were satisfied with the customer service they received. Wait time had the lowest proportion of satisfied respondents (51%) while clarity of communication and multiple options for contact had the highest (62%). In addition, an operator-by-operator analysis showed that between 10% and 25% of customers of each operator had to submit a formal complaint. This obviously leaves significant room for improvement.

Chart of net satisfaction with operator customer service

“Always on” users have different support needs

With more customers categorizing themselves online all the time, it’s increasingly important that their network be available whenever they need it. It is also vital that they get the kind of customer support they need when they encounter a problem.

Chart of top three rated components of customer satisfaction

We asked respondents to rank the top three components of customer satisfaction that make for good customer service. While customers who are not “always on” are looking for well trained staff, a quick resolution, and clear communication, “always on” users are looking for a more well-rounded customer service experience. “Always on” users also prioritize short wait times, clear paths to resolution, multiple methods of communication, and that they feel valued as a customer.

This means operators with a robust support network that customers can comprehend and access in the ways that they prefer to communicate will win the customer service race — and consequently, customer retention. Our clients have seen this already with Spatialbuzz™, which allows mobile operators to identify, prioritize, and diagnose customer dissatisfaction areas in real time with quick, actionable resolutions.

“Always on” customers experience more problems with customer service

Chart of percentage of users who report customer service issues

“Always on” respondents in all three countries were at least twice as likely to report issues with customer service. The difference was especially pronounced in the U.K. where “always on” users were more than three times as likely to report customer service issues than their counterparts. This, plus the growth in the number of “always on” customers, poses a difficulty for mobile operators whose customer support programs have not evolved to meet these changing needs. If operators want to retain these key customers, there is work to be done.

Users who contact customer service are still likely to churn

The fact that customer service is a key factor in customer retention is no surprise, still our survey revealed that nearly half (47.4%) of customers who have had customer service issues in the past 18 months are likely to want to switch to another operator. The data tells us that even when issues are resolved, customers are often not satisfied with how they have been dealt with and still consider switching.

Infographic comparing customer satisfaction and likelihood to churn

Respondents in the U.S. were the most likely to consider switching (24-37%, depending on operator). Customers in the U.K. were open to switching (25%, 29%, 29%, and 32%, depending on operator) and those in Switzerland were slightly less likely to consider switching (25, 27%, and 32%, depending on operator).

As important as adequate customer service is, it’s clear that mobile operators need to meet customers’ needs before they have to resort to customer service. Providing a high level of network performance is important to this as is checking in with consumer sentiment, especially as consumers’ habits shift toward being “always on.”

Solving customer issues is not enough to retain your customer base. Those issues need to be resolved with care through clear communication and expertise in a timely manner. To learn more about Consumer SentimentTM data or how Spatialbuzz could help you connect with in-need customers faster and more efficiently, contact us.

Ookla retains ownership of this article including all of the intellectual property rights, data, content graphs and analysis. This article may not be quoted, reproduced, distributed or published for any commercial purpose without prior consent. Members of the press and others using the findings in this article for non-commercial purposes are welcome to publicly share and link to report information with attribution to Ookla.

| March 30, 2022

5G in The U.K.: Calls for Consolidation Grow

Key Takeaways

  • Operator Three UK led the U.K. market for 5G performance with a median download speed of 258.80 Mbps in Q3-Q4 2021.
  • EE led on 5G Availability at 19.3% during Q3-Q4 2021, but this remains low at a market level.
  • Like other European markets, the requirement to remove network equipment from Chinese vendors has negatively impacted the speed of 5G deployments in the U.K.
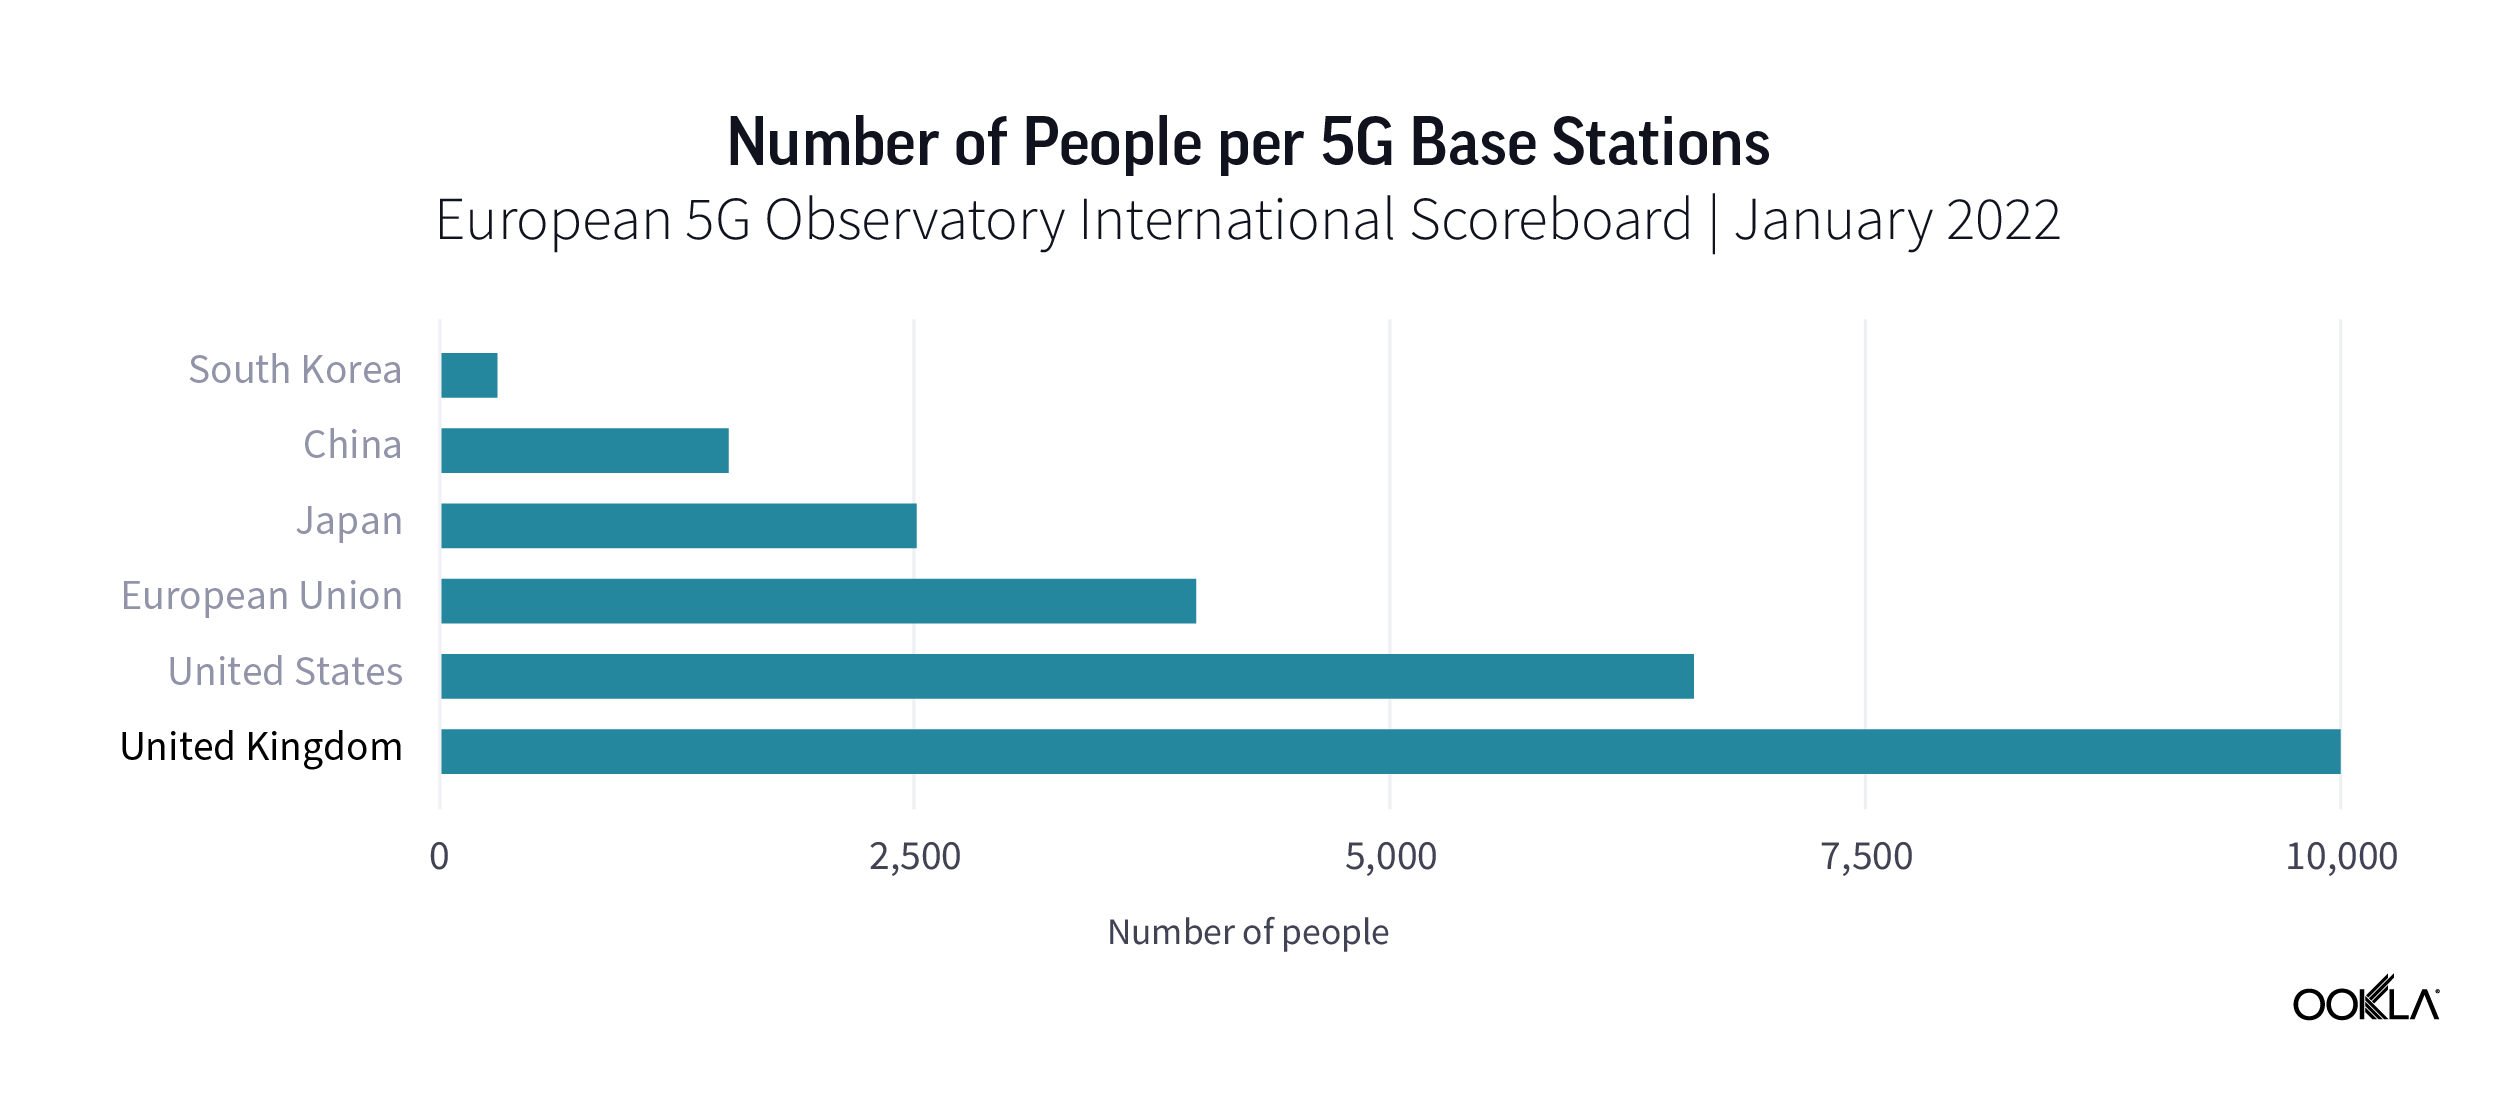
  • Based on the number of people per 5G base station, the U.K. lags behind other 5G pioneer markets, indicating a change in deployment is required.
  • U.K. regulator Ofcom has highlighted the need to drive greater mobile network capacity to meet future demand, with the release of mmWave spectrum and further network densification key levers. However, attention is likely to turn once again to market consolidation to help accelerate network densification — an area where Ofcom has felt the need to clarify its position.

5G network investment accelerating

The United Kingdom (U.K.) was among the first markets to launch 5G globally, with EE launching the 5G in May 2019. Since then, despite U.K. operators ramping up 5G investment, the market has been on par with many other European markets in terms of 5G performance, but the U.K. still lags behind 5G pioneers like South Korea and China as we saw in Q1-Q2 2021.

According to the Ofcom’s Connected Nations 2021 report, 5G network investment in the U.K. is accelerating, hitting £330 million in 2020 — an increase of over £150 million (88%) vs. 2019. Dense urban areas are mostly supported by high capacity C-band spectrum (awarded in 2018 and in 2021), increasingly augmented by hotspot deployments in suburban areas and around main transport corridors. The number of mobile base stations providing 5G services more than doubled last year — from 3,000 sites in 2020 to over 6,500 sites in 2021. Based on the U.K.’s population as of 2020, this would equate to over 10,000 people per 5G base station, placing it well behind South Korea, China, the EU average, and even the U.S. according to the EU 5G Observatory’s International Scoreboard.

In order to reduce costs and optimize network deployment, the U.K.’s mobile network operators already deploy and run a portion of their radio access network (RAN) via network sharing agreements. Mobile Broadband Network Limited (MBNL), is a 50-50 joint venture between EE and Three UK, to manage the design and operation of their shared network. Additionally, Cornerstone Telecommunications Infrastructure Limited (CTIL) is a 50-50 joint venture between O2 and Vodafone that owns and oversees the operators’ passive tower infrastructure. 

O2 and Vodafone announced in 2019 that they would share 5G- active equipment, such as radio antennas, in order to reduce the time to launch and cost effectively deploy 5G. This excludes around 2,700 sites in densely populated areas (in over 20 cities) where the operators will maintain separate active RAN components to give them greater autonomy and enable more flexibility to meet customer requirements. In January 2021, Vodafone transferred its 50% share to Vantage Towers.

Ofcom highlights need for greater network capacity

A recent discussion paper by U.K. regulator Ofcom illuminated its future approach to mobile markets, and while it shied away from further regulation, it did highlight the need to plan for more network capacity to meet future demand. Additionally, Ofcom’s discussion paper highlighted releasing further spectrum, looking to technological advances to improve spectral efficiency, and the need for further network densification. However, the challenge for operators lies in supporting the level of network investment required given the current mobile market structure in the U.K..

There is a clear desire for further mobile network consolidation in the U.K. and elsewhere in Europe, with recent examples including the agreed joint venture between MasMovil and Orange in Spain, and Iliad’s recent bid for Vodafone Italy. The last time the U.K. market saw mobile consolidation was in 2010 with the merger of T-Mobile and Orange to form EE. Since then, subsequent attempts to drive further mobile consolidation — Three UK’s planned merger with O2 in 2016 — have been blocked by Ofcom and the European Commission. During Three UK’s  recent 2021 results announcement, Robert Finnegan, Three UK’s Chief Executive Officer, warned that despite achieving positive results, “the U.K. market with four operators continues to remain dysfunctional and requires a structural change to improve the overall quality of infrastructure that U.K. customers should expect.”

Ofcom’s latest discussion paper alludes to a potential softening in its stance on mobile mergers, indicating that it would be “informed by the specific circumstances of that particular merger, taking into account how markets are evolving.” Given the strong move towards convergence, such as BT’s acquisition of EE and the more recent O2 and Virgin Media merger, further market consolidation cannot be ruled out. 

Freeing up further spectrum for 5G use remains a priority

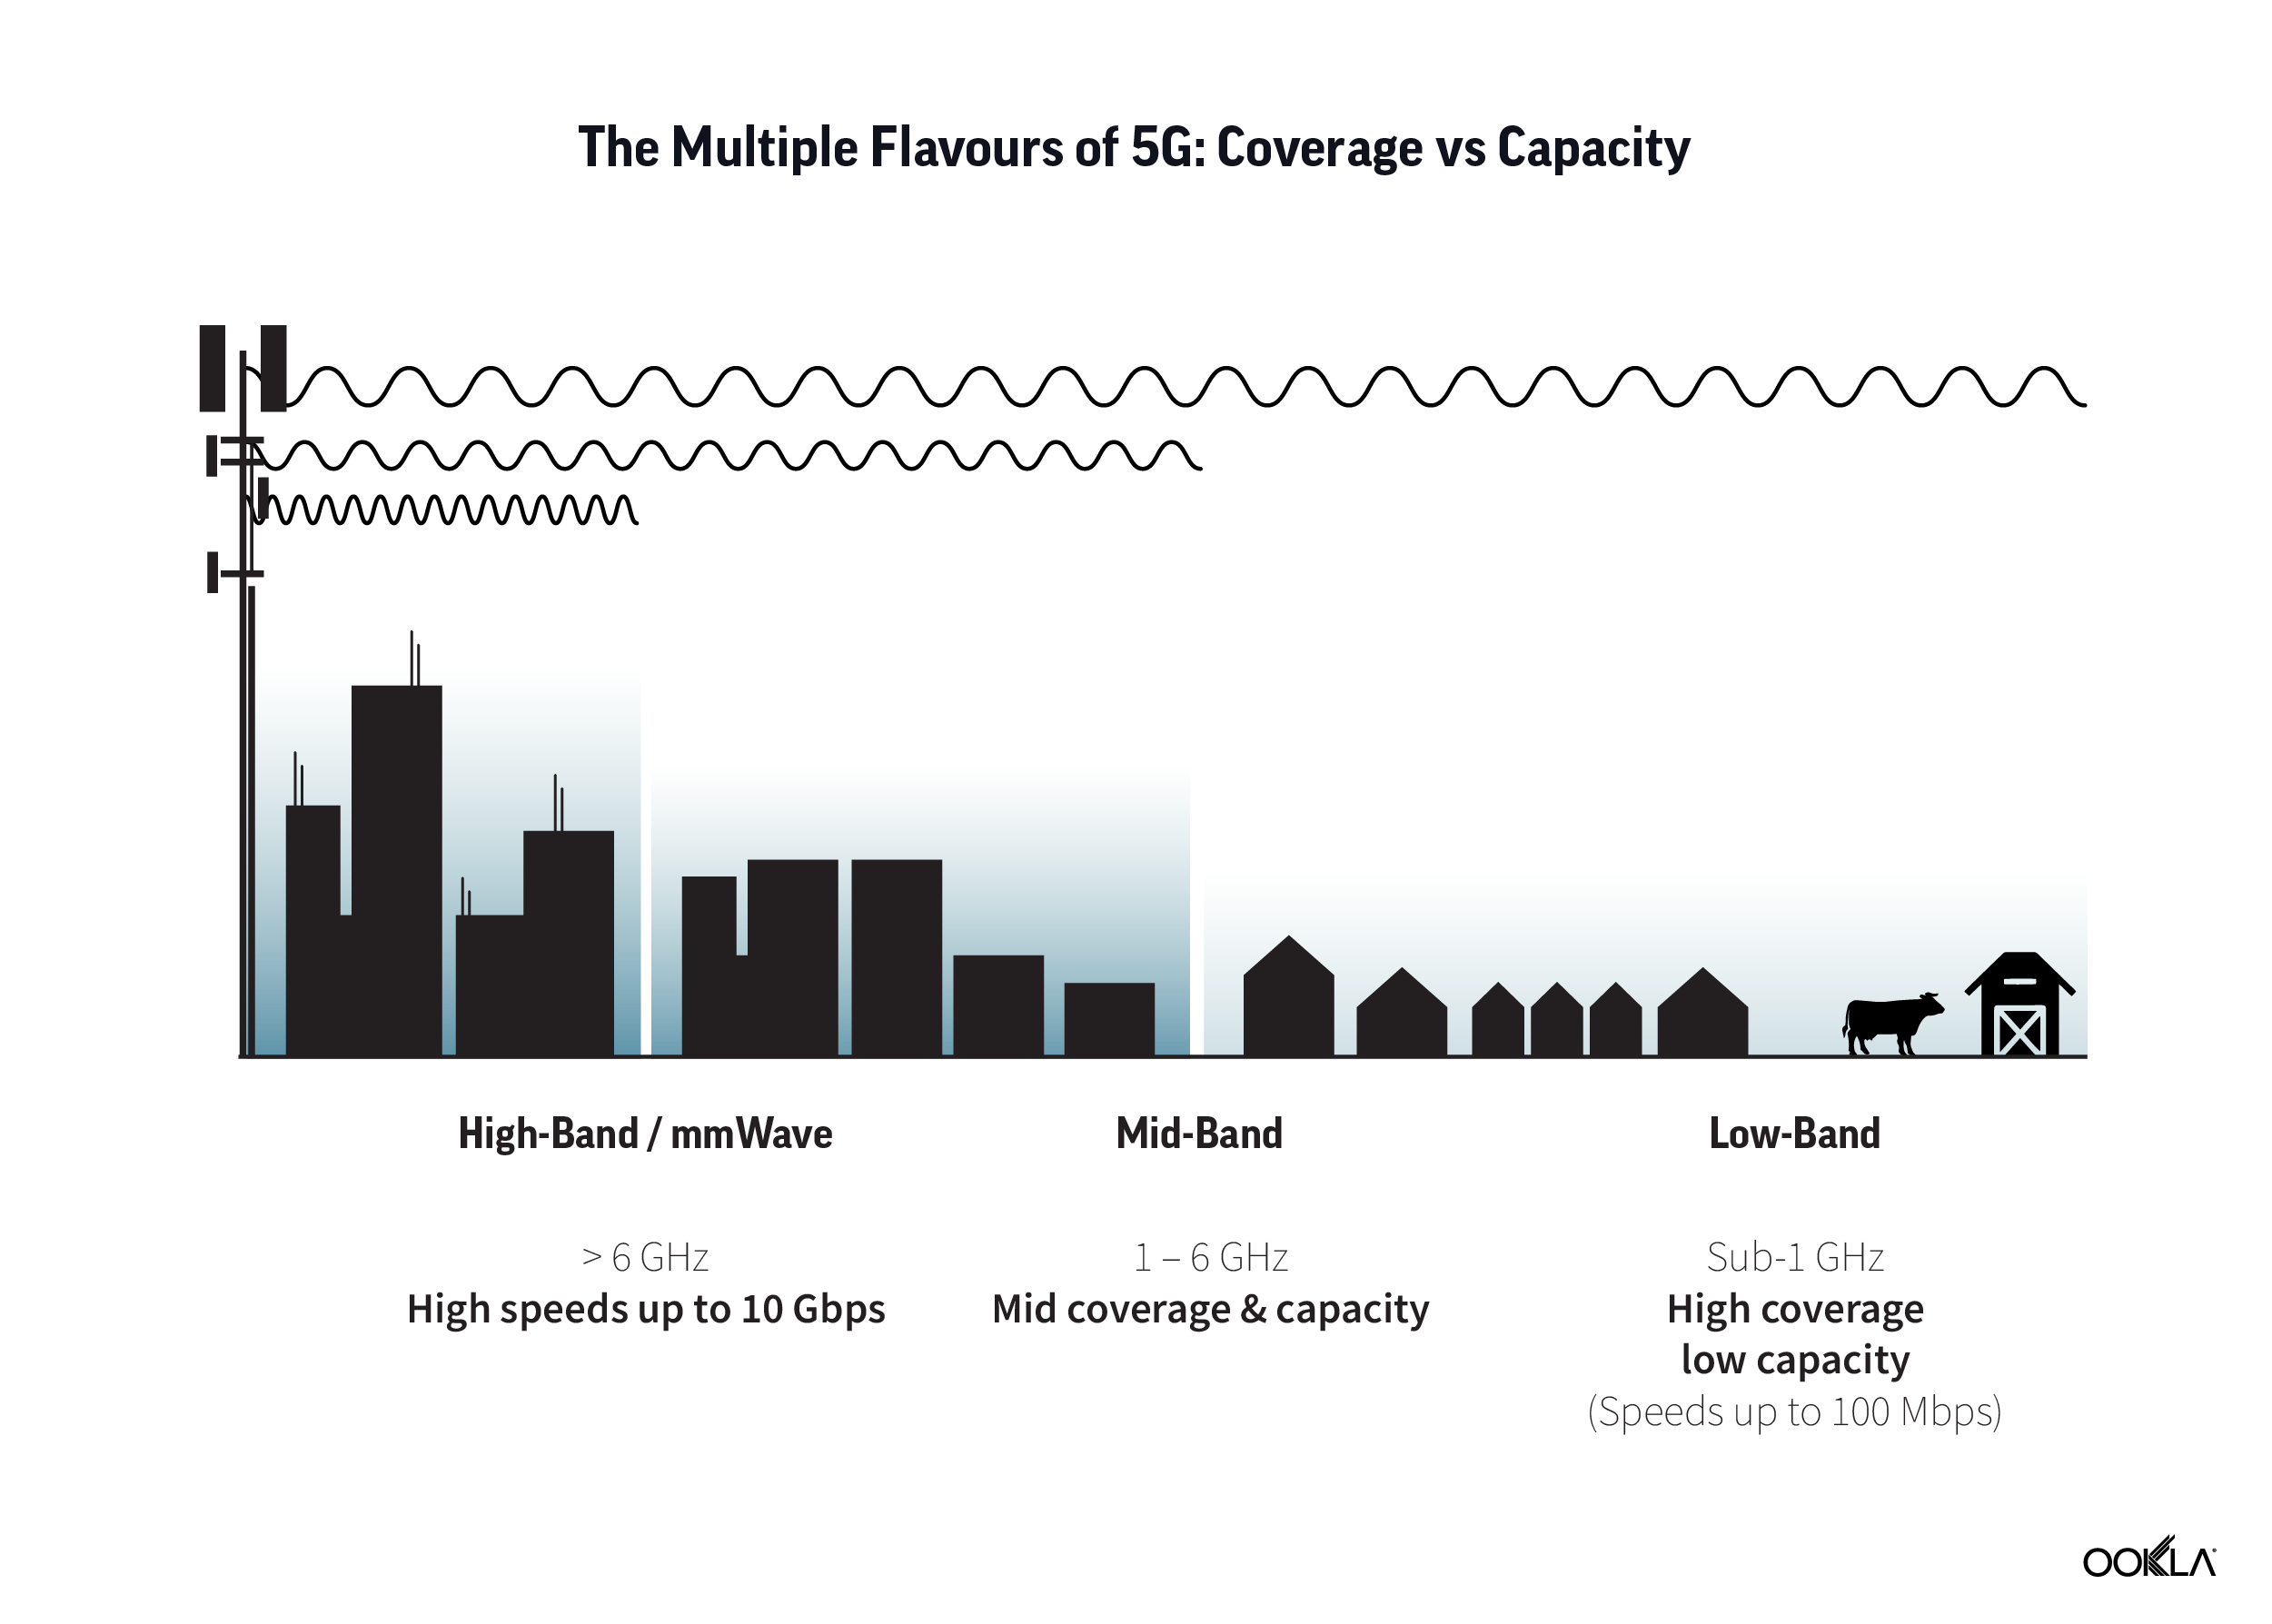
Since early 5G deployments, all four operators in the U.K. have been utilizing mid-band spectrum for 5G, which is considered a spectrum “sweet spot” that offers both fast speeds and broad geographic coverage. In April 2021, every operator boosted their spectrum holdings across the 700 MHz and 3.6-3.8 GHz spectrum bands. O2, for example, has started using low-band spectrum for 5G, and has recently committed to invest at least £10 billion in the U.K., delivering 5G to over 2,000 sites across the country in 2021. The operator’s 5G coverage currently extends to 300 towns and cities and is set to reach 50% of the U.K.’s population with its 5G services in 2023. 

Operators have been also re-farming their legacy 2G and 3G spectrum for 5G and utilizing dynamic spectrum sharing (DSS) to facilitate dynamic use of 4G and 5G in the same bands. In December 2021, the government also announced the goal of switching off 2G and 3G networks by 2033 to free up spectrum for 5G. Ofcom’s recently published discussion paper on mobile networks and spectrum, identifies a large amount of mobile spectrum in the mmWave frequencies, which if allocated, will help boost network capacity. The regulator will consult on proposals to enable mmWave band in Q1 2022/23.

On the road to 5G standalone networks 

5G is currently rolled out in a non-standalone (NSA) mode in the U.K., meaning that it still relies on the 4G LTE core network. We expect all operators to upgrade to 5G standalone (SA) in time, with 5G core networks and 5G RAN, especially as additional 5G capabilities proliferate such as ultra-low latency communication (URLC)  and virtual network functions such as network slicing which will enable new 5G use cases. Operators in the U.K. are already trialing 5G SA:  in June 2021 Vodafone launched a commercial pilot of 5G SA in London, Manchester, and Cardiff, which built on an earlier trial carried out with Coventry University in the summer of 2020. In March 2022, Vodafone and Ericsson completed the U.K.’s first 5G SA network slicing trial. It was a lab demonstration of 5G network slicing with on-demand quality of service control for virtual reality use case in a retail store. The slice guaranteed a download speed of 260 Mbps and latency of 12 milliseconds. It isn’t clear when Vodafone plans to commercially launch 5G SA but Vodafone Germany became the first operator to launch 5G SA in Europe last year.

The recent 5G SA collaboration between EE, the BBC, and Ericsson, “The Green Planet AR Experience,” showcased the unique capabilities of 5G SA and edge computing. Additionally, EE plans to extend 5G coverage to 90% of the U.K. geographical area by 2028, which will be facilitated by the migration to a cloud-based core and the launch of 5G SA by 2023. EE is also planning to sell 5G SA in a way that will resonate with the customers and bring “technology to them in a really human way”. This is a move away from EE advertising the benefits of 5G as being able to get a real-time close shave with a robotic arm. However, Marc Allera, CEO of BT Consumer (EE’s parent company), does not rule out metaverse as a possible proposition blending entertainment, sports broadcasting, gaming, and e-commerce. 

Security worries pave the road to Open RAN 

Huawei kit needs to be removed from a number of European countries, including the U.K. In July 2020, in response to U.S. sanctions against Huawei, the Department for Digital, Culture, Media, and Sport (DCMS) announced that it overturned its earlier decision to exclude Huawei’s access from core and sensitive networks and, instead, completely remove Huawei’s kit from the U.K.’s 5G networks by the end of 2027. The government further pushed Open RAN expectations in December 2021 by setting a goal of having 35% of its telecom network traffic carried over Open RAN by 2030. This target is an aspirational one, rather than a hard mandated quota and is apparently supported by all mobile operators. It does come with a £250 million funding to support and accelerate the development of open and interoperable RAN, which is significantly less than €2 billion the German government has  specifically dedicated for Open RAN as part of €50 billion Package for the Future.

In January 2022, Vodafone switched on the U.K.’s first 5G Open RAN site in Bath, Somerset, which is the first of 2,500 planned sites and marks the beginning of the first scaled Open RAN project in Europe. EE’s parent company, BT Group, is more skeptical about the technology, with Neil McRae, MD of Architecture and Strategy and chief architect at BT Group, reminding the MWC 2022 audiences that there are different paths operators can take to drive down costs and improve performance. Nonetheless, BT is trialing Open RAN in Hull to see how the technology can improve the customer experience of EE’s 5G network. We have discussed the current progress on Open RAN across Europe in our latest article 5G in Europe: Reflecting on the Progress So Far and Mapping the Future and reflected on the discussions on this topic at MWC 2022 here. 

U.K. compared to its European peers 

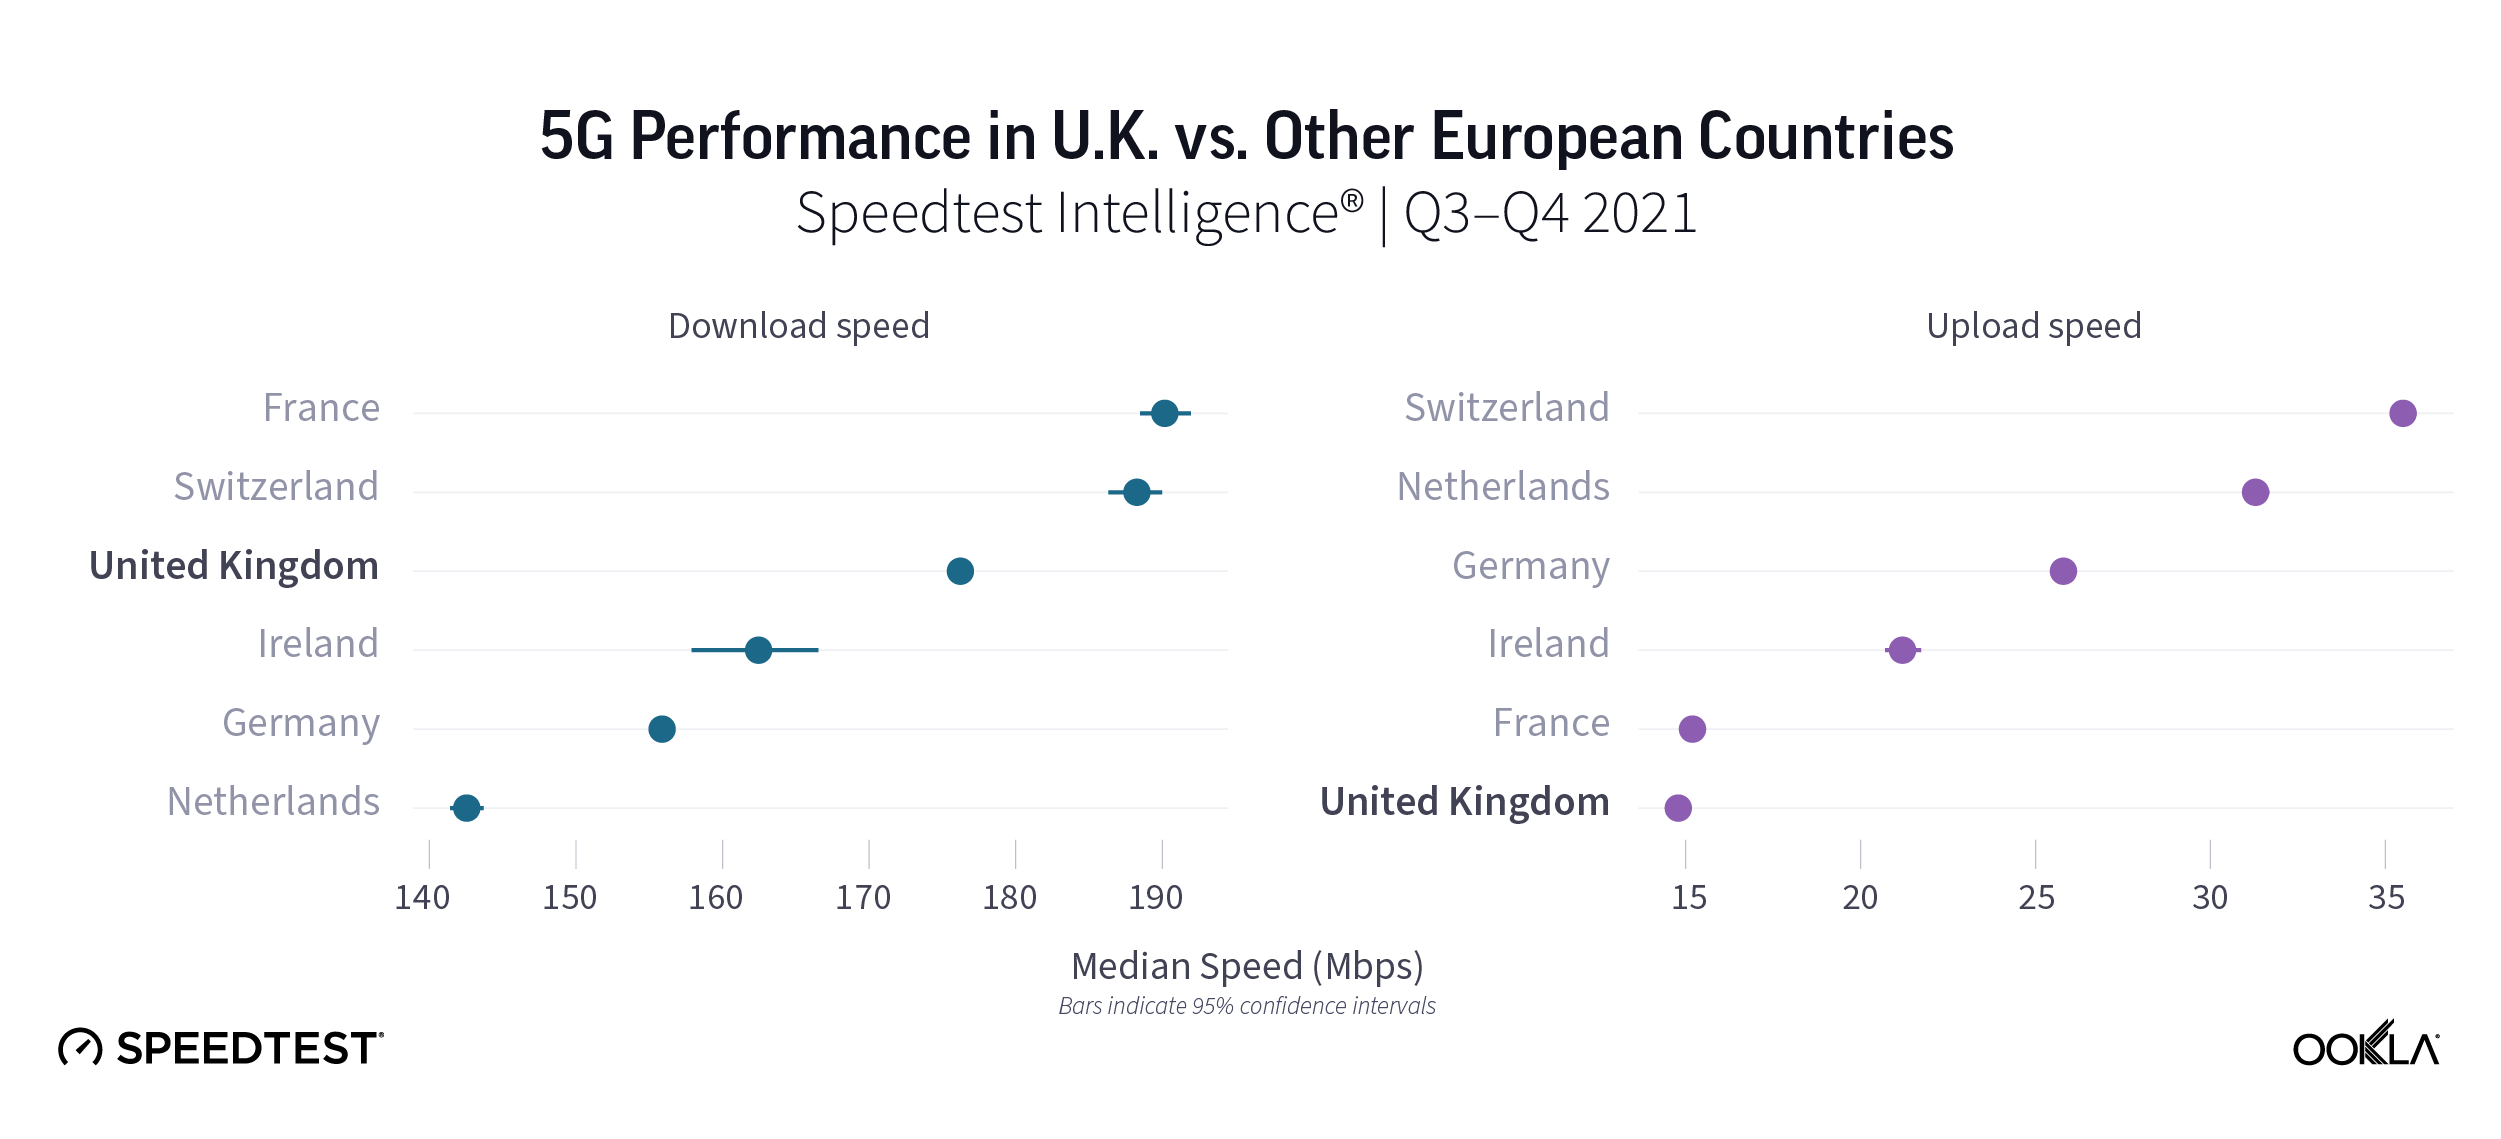
In our recent post “5G in Europe: Reflecting on the Progress So Far and Mapping the Future”, we looked at how different European countries stacked up against each other and international peers. Using Speedtest Intelligence®,  we compared 5G in the U.K. against its peers’ 5G performance.France (190.17 Mbps) and Switzerland (188.27 Mbps) topped our list with the fastest median 5G download speeds  during the second half of 2021, followed by the U.K. (176.22 Mbps), Ireland (162.46 Mbps), Germany (155.87 Mbps), and Netherlands (142.55 Mbps). Interestingly, despite all of the French operators launching 5G service in December 2020, relatively late compared to other analyzed countries, they achieved top median download speeds due to substantial network investments. 

Switzerland, however, had the fastest median upload speed over 5G at 35.51 Mbps during Q3-Q4 2021, followed by the Netherlands (31.29 Mbps), Germany (25.80 Mbps), Ireland (21.20 Mbps), France (15.19 Mbps), and the U.K. (14.79 Mbps). 

The Netherlands had the highest 5G Availability among the U.K’s peers

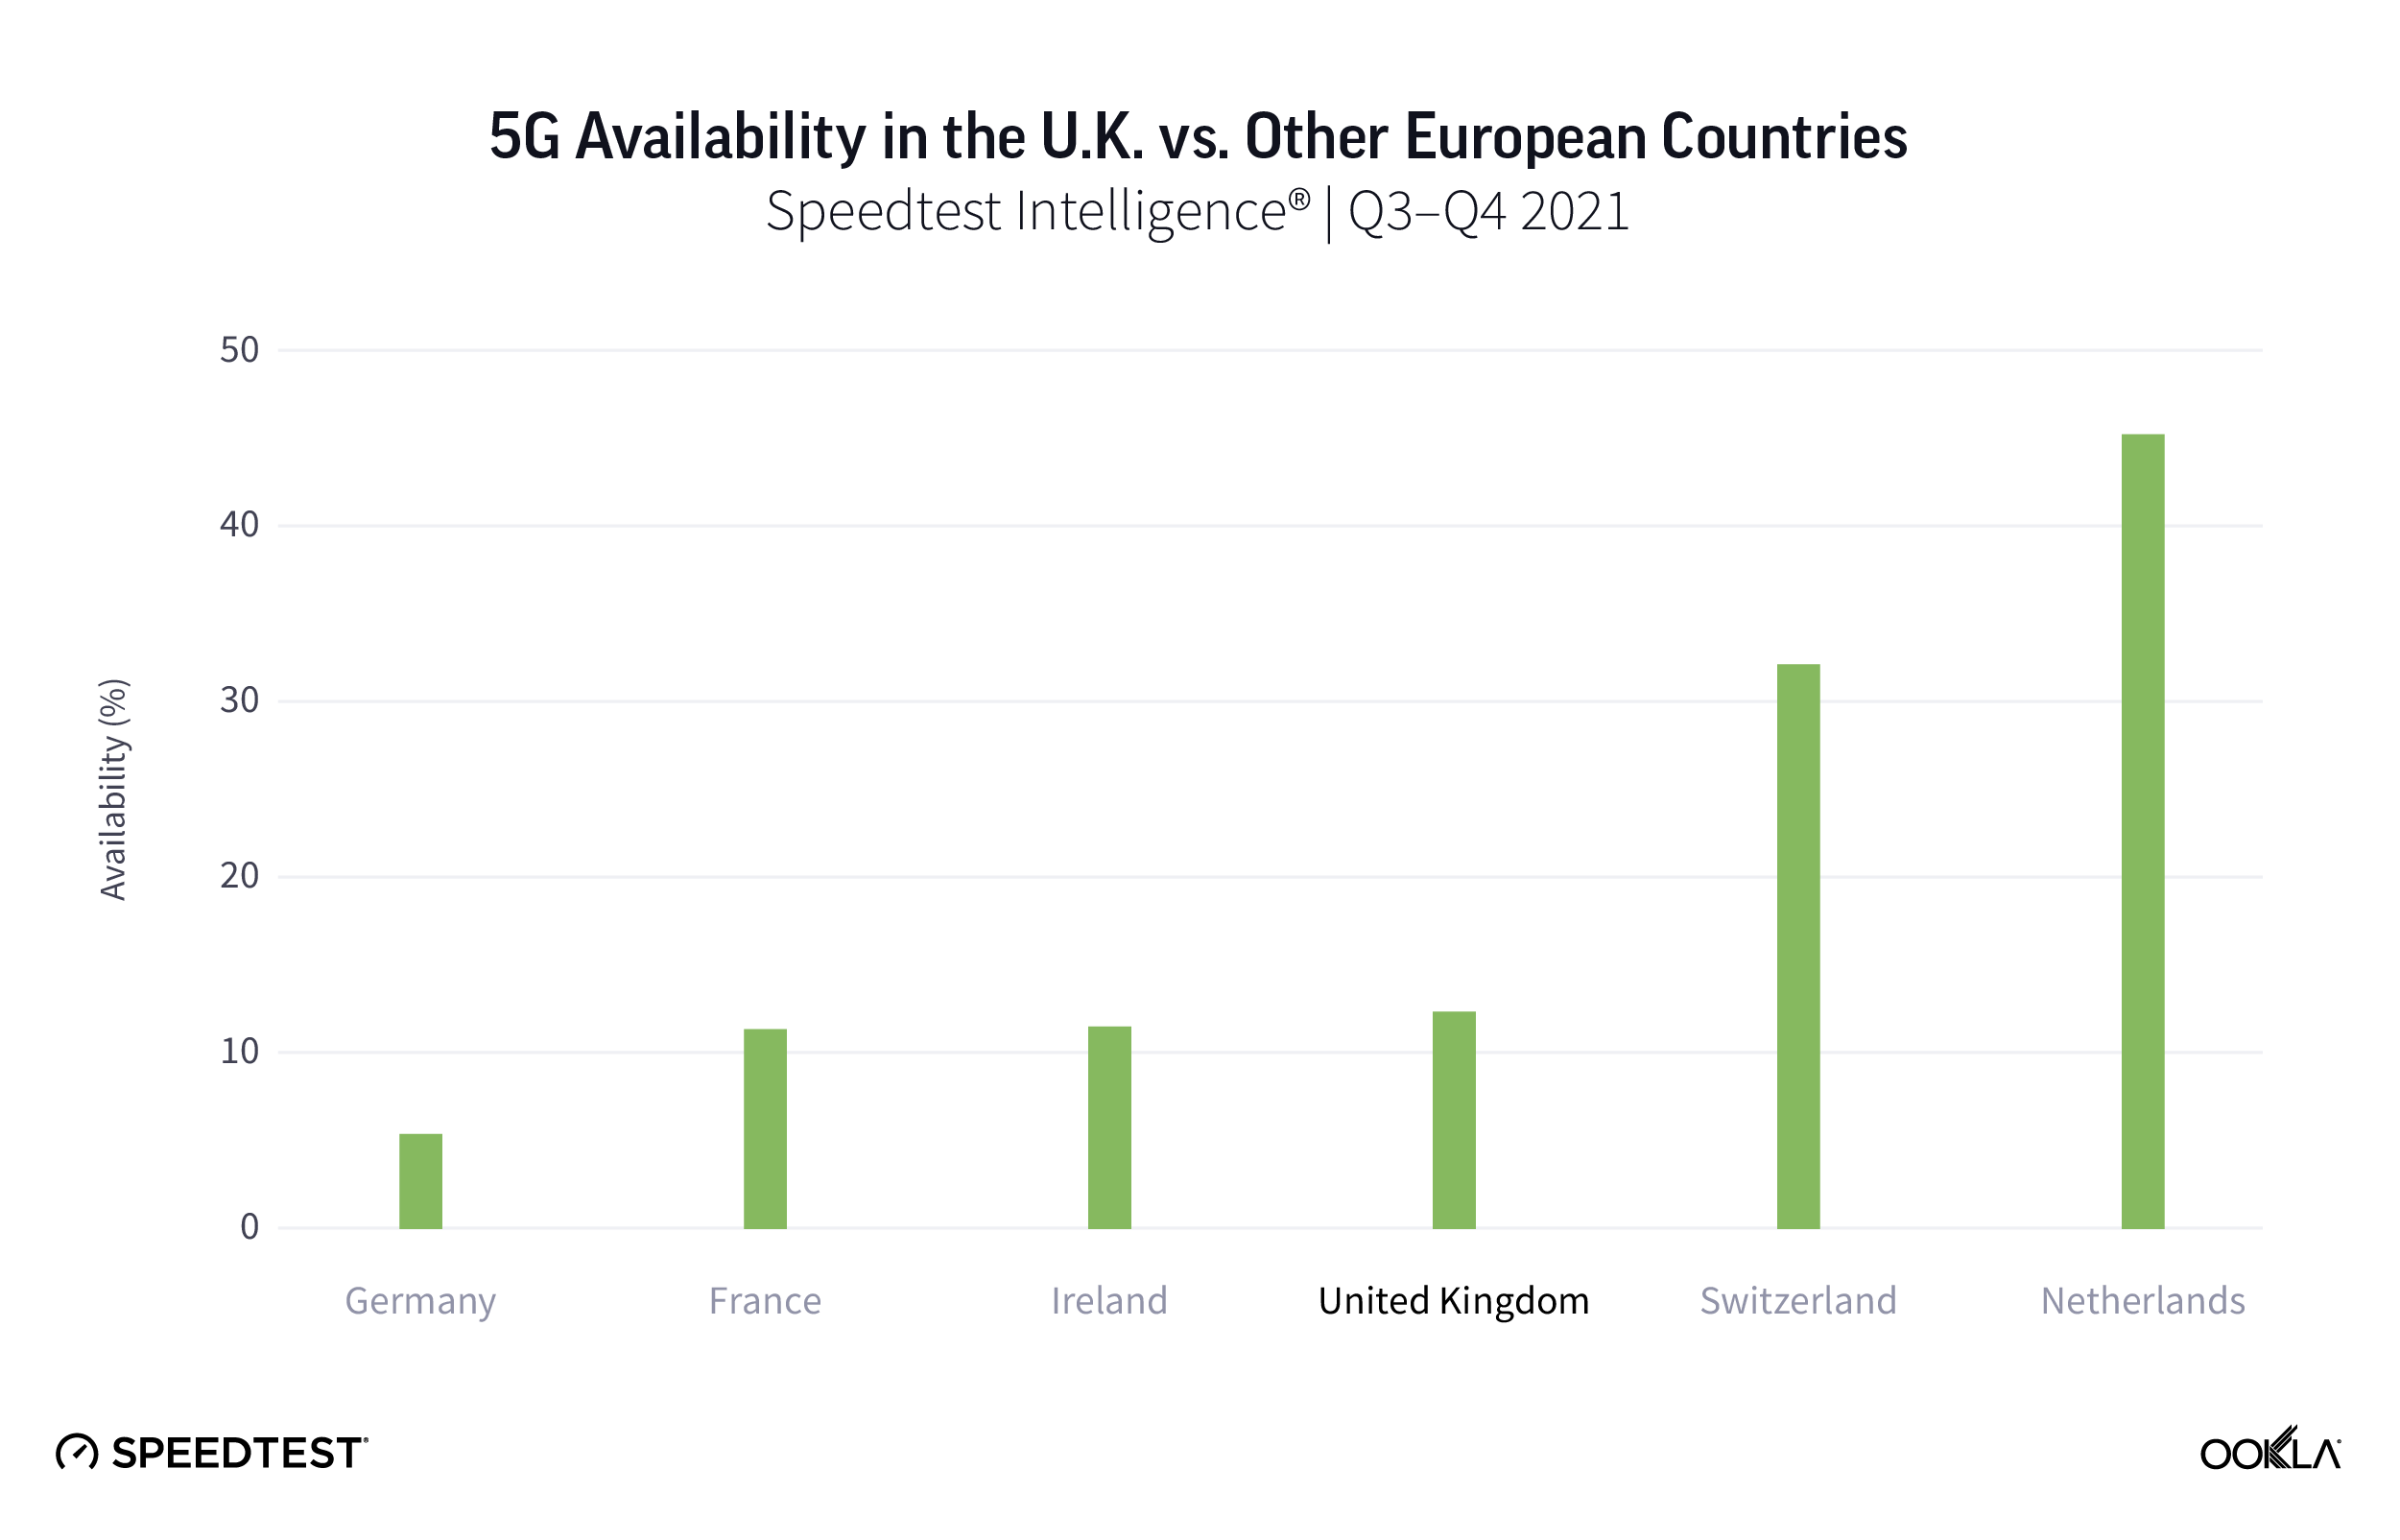
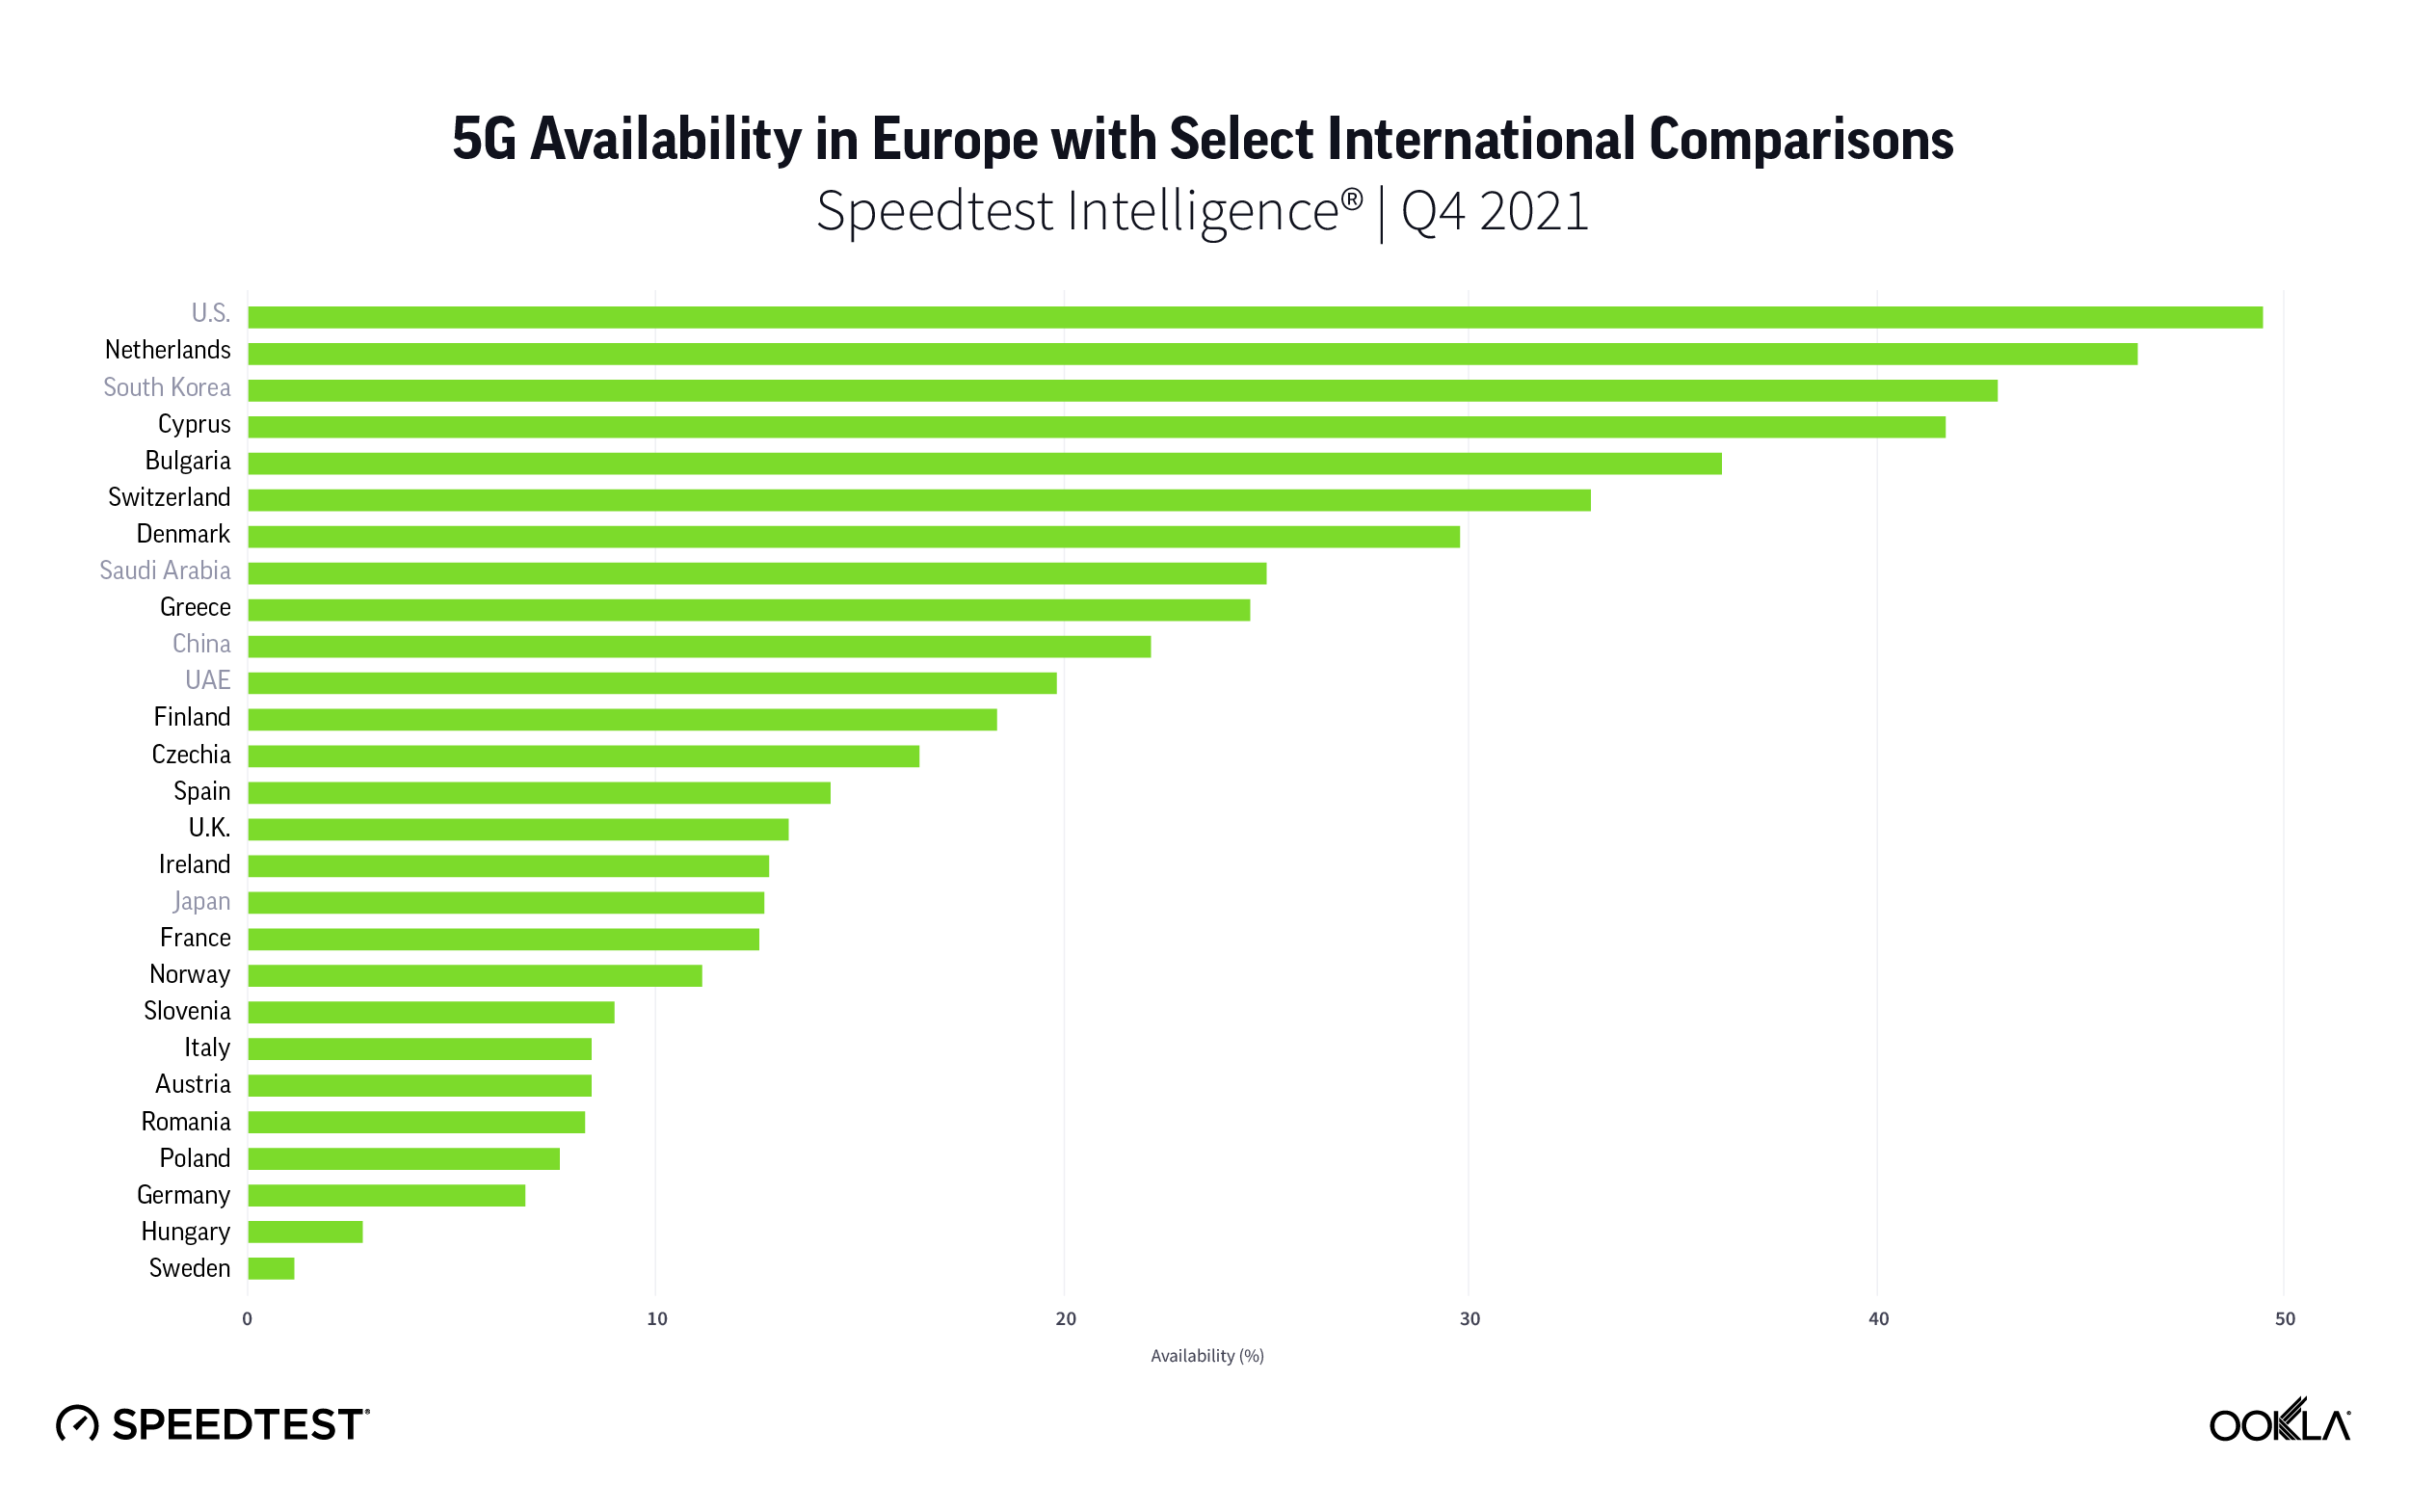
The ranking shifts when it comes to 5G Availability — the percentage of users on 5G-capable devices that spend most of the time with access to 5G networks. The Netherlands had the highest 5G Availability at 45.3%, followed by Switzerland (32.2%), the U.K. (12.4%), Ireland (11.7%), and France (11.5%). 

The telecom regulator Ofcom in its Connected Nations report stated that the uptake of 5G-enabled handsets across the U.K. increased from 800,000 in 2020 to over six million in September 2021, accounting for around 10% of all devices. This is still far behind South Korea, which was the first country to commercialize 5G in 2019 and where the number of smartphone users on the 5G network reached roughly 20.2 million in November 2021, equivalent to 28% of mobile subscriptions.

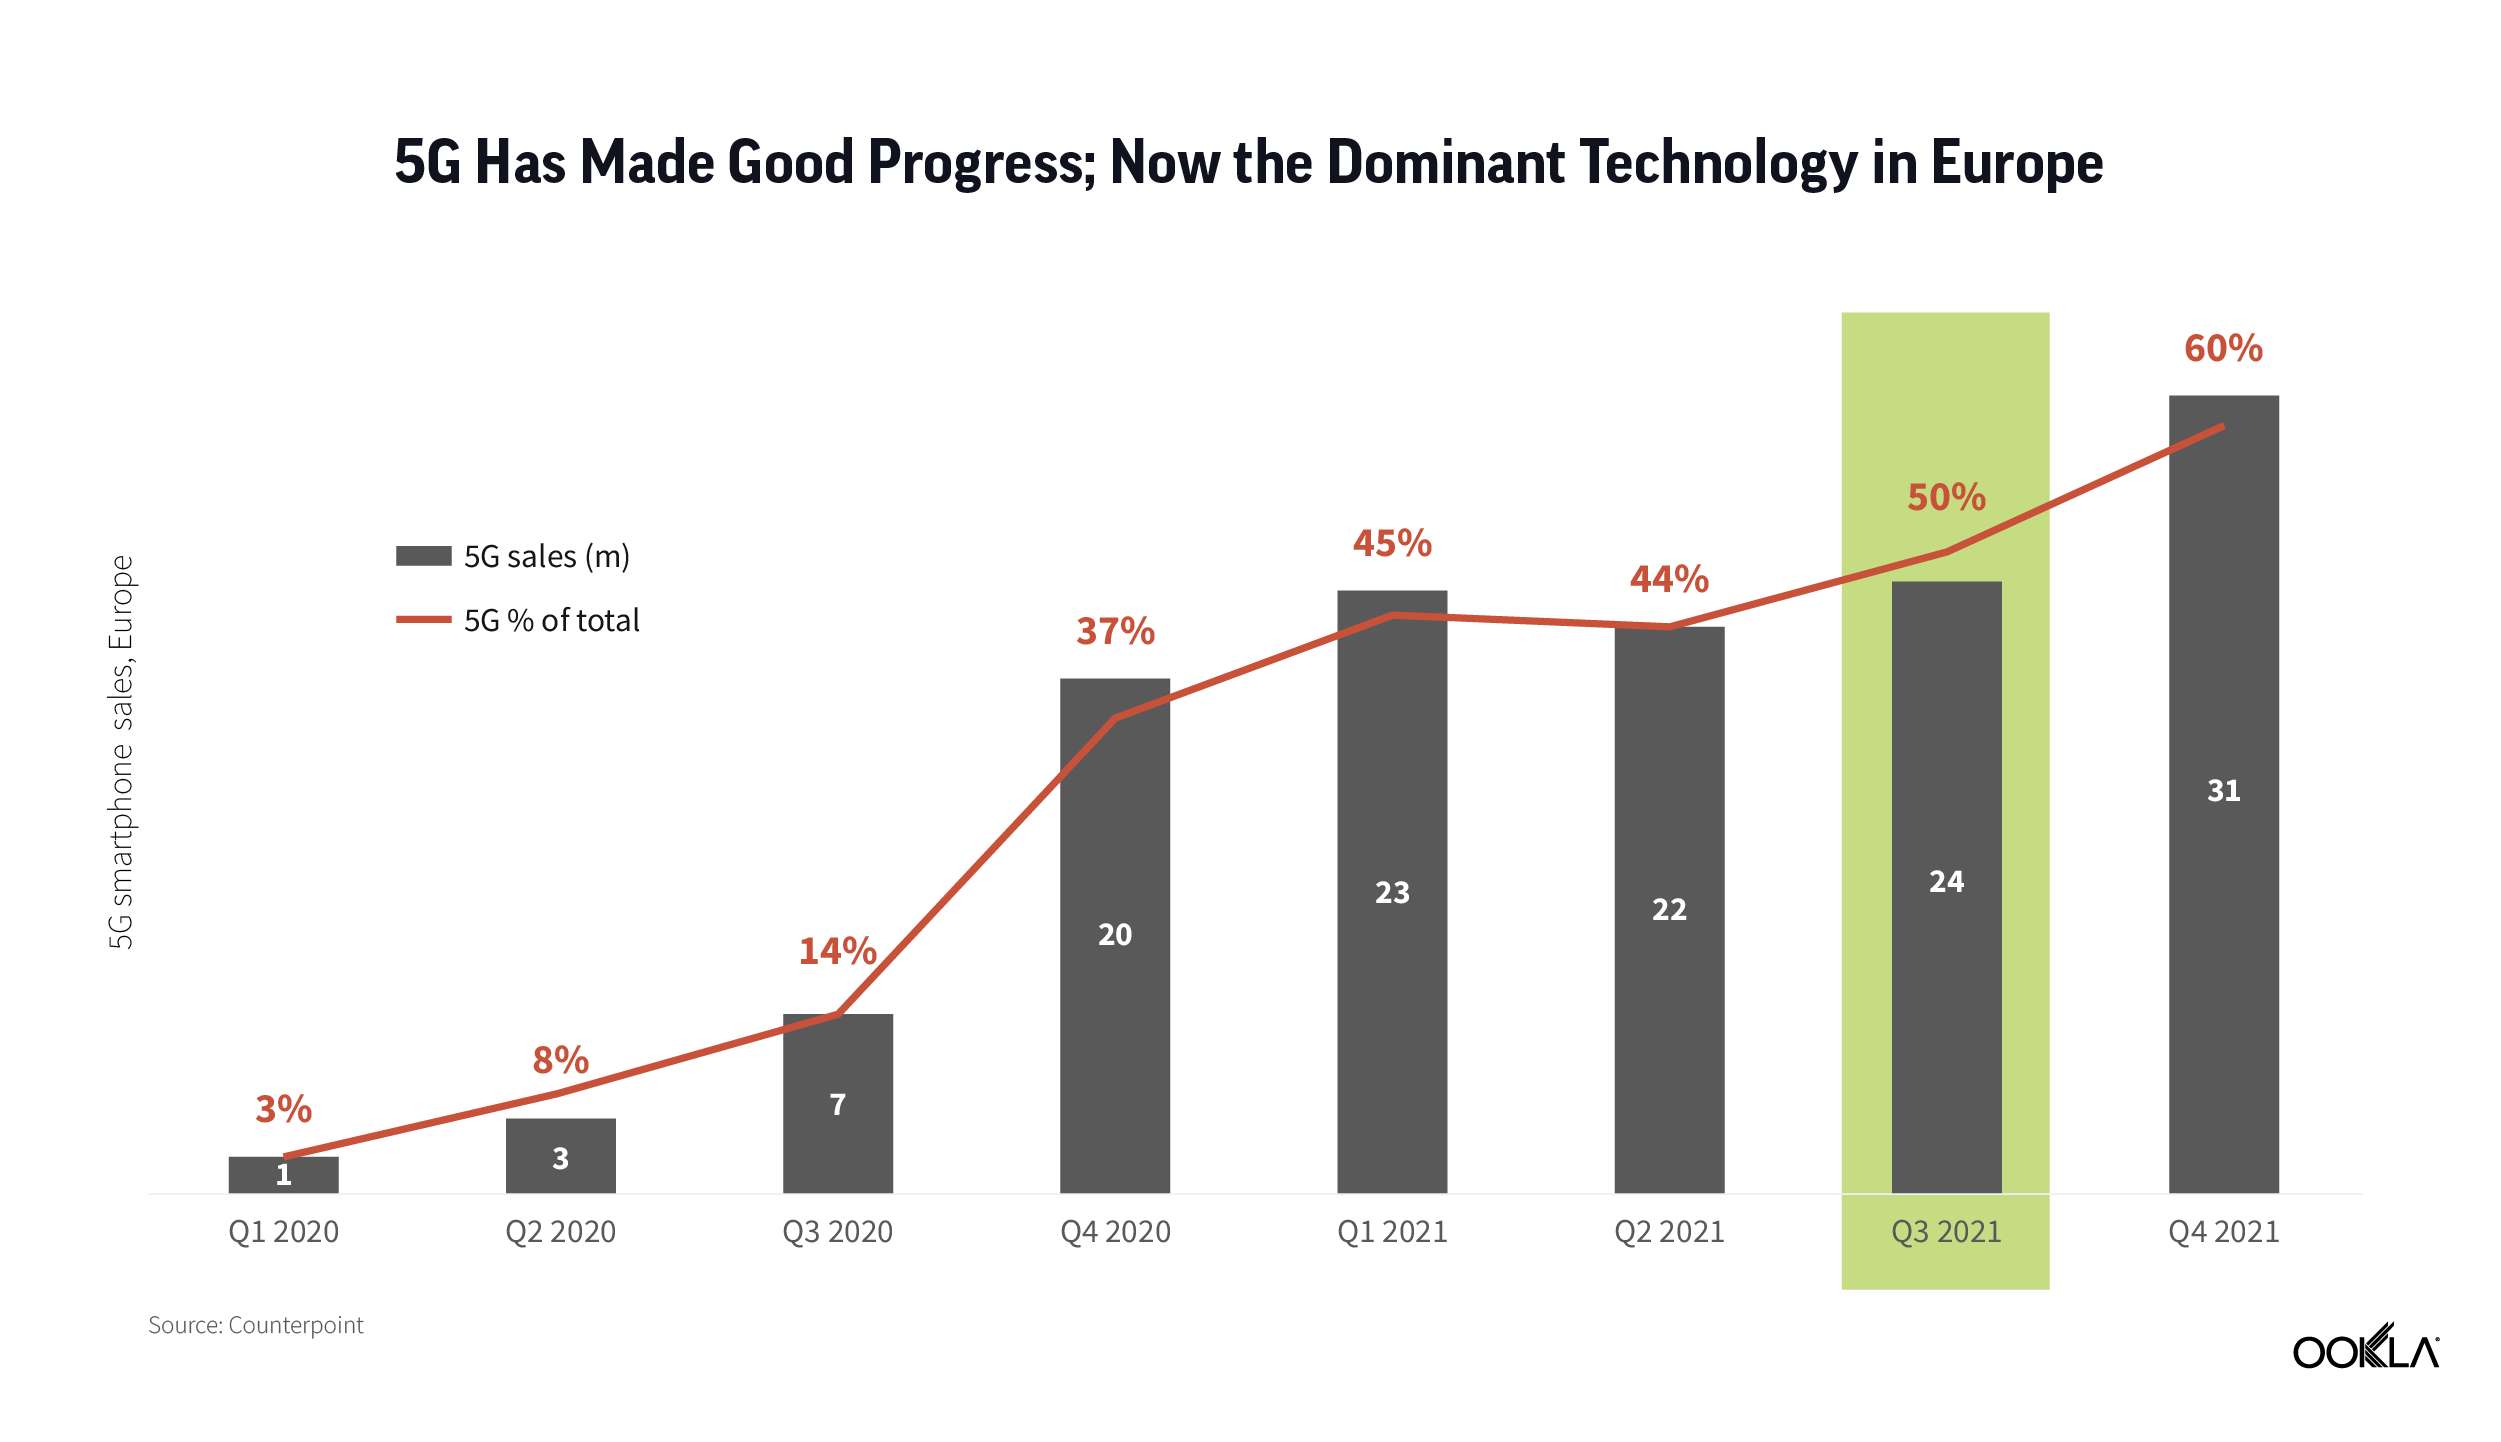
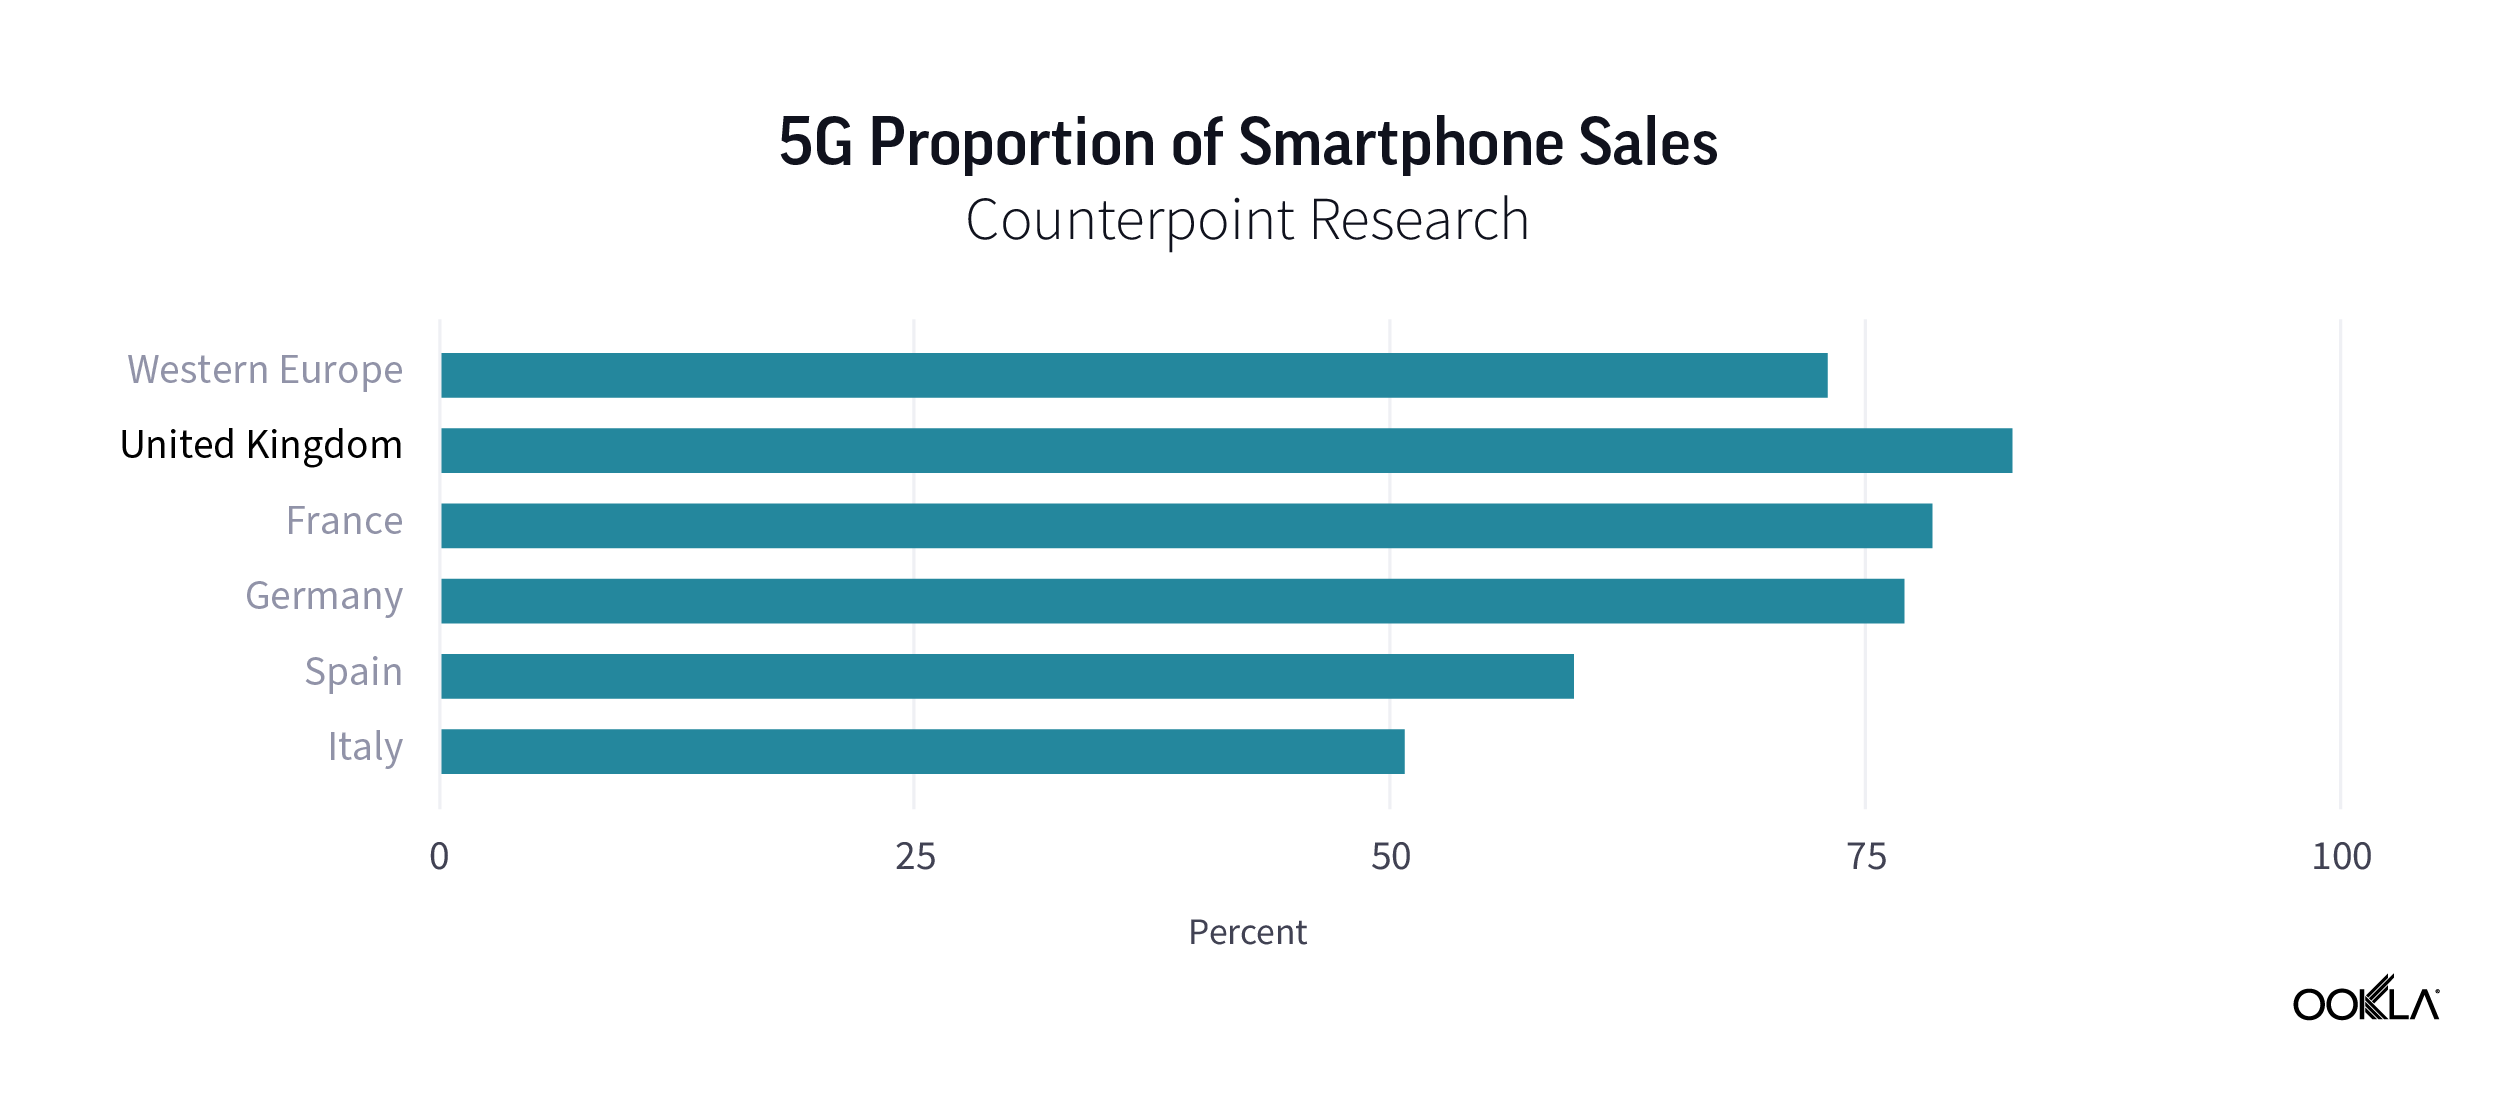
According to Counterpoint Research, the U.K. is the leader in Western Europe in terms of 5G penetration of smartphone sales. In Q4 2021, 83% of smartphones sold in the U.K. were 5G enabled, compared to the regional average of 73%. In time, this will translate into a larger install base of 5G devices and share of overall subscriptions. 

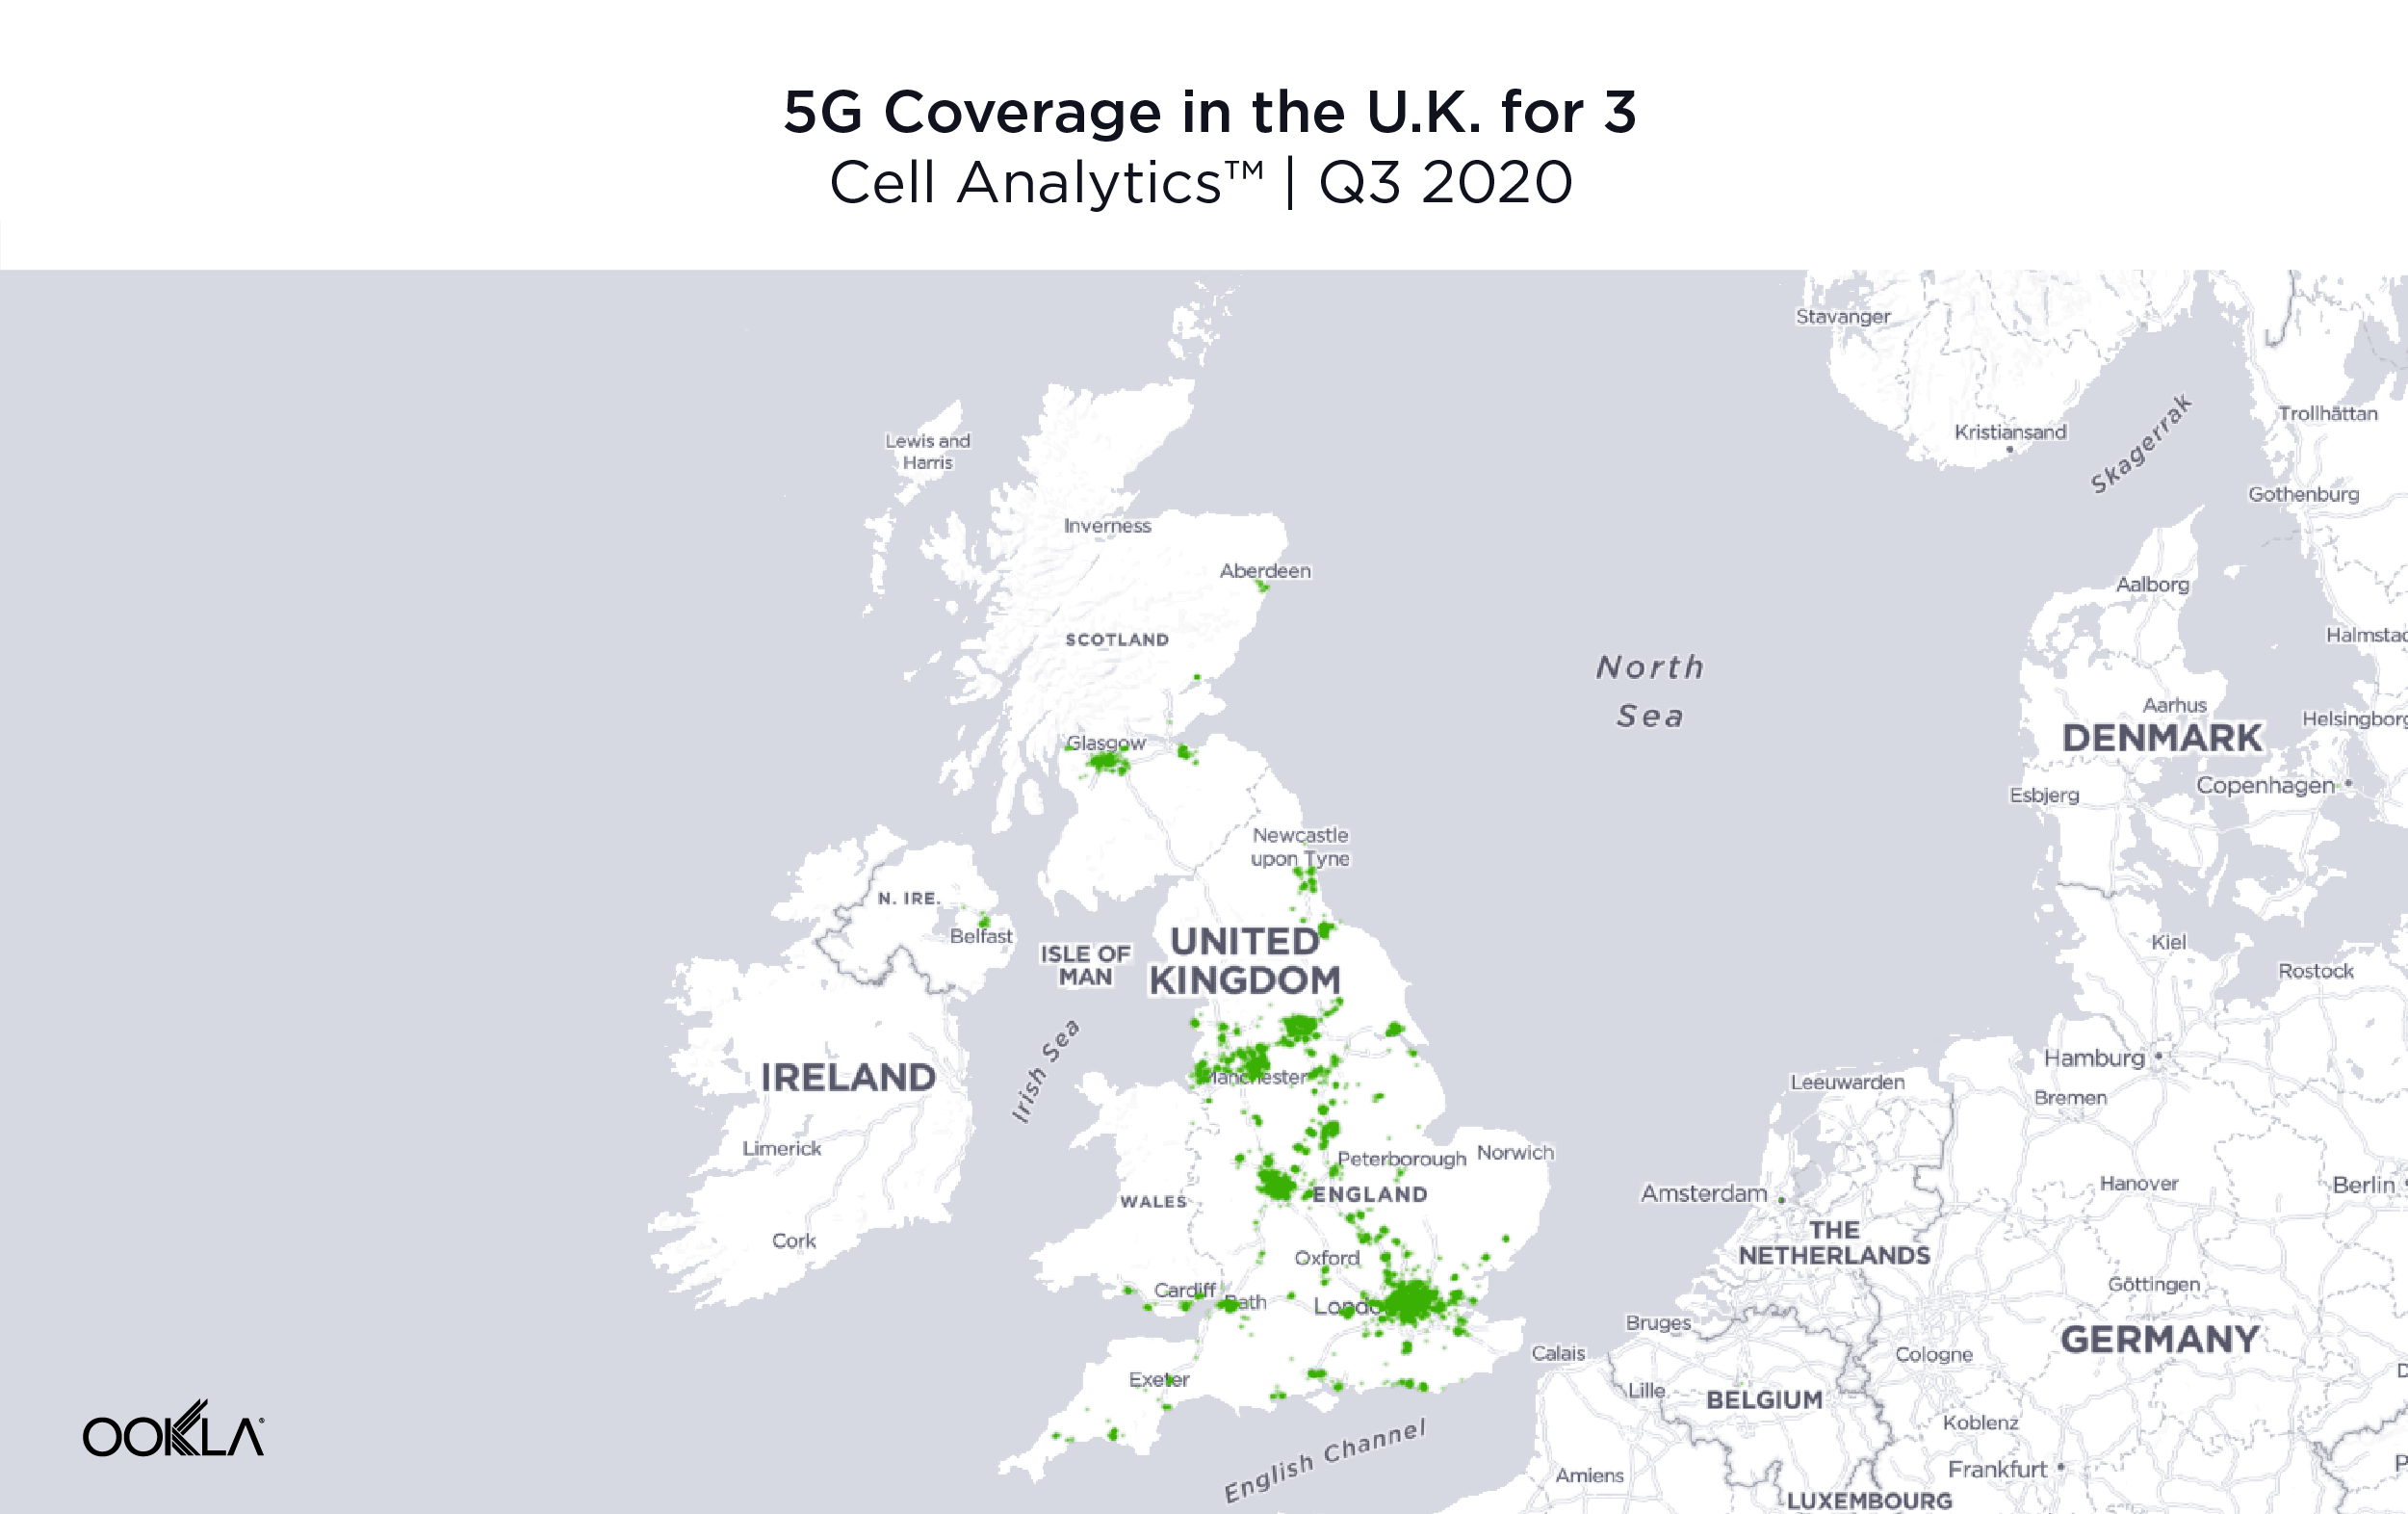
Three UK was the fastest 5G operator in the U.K.

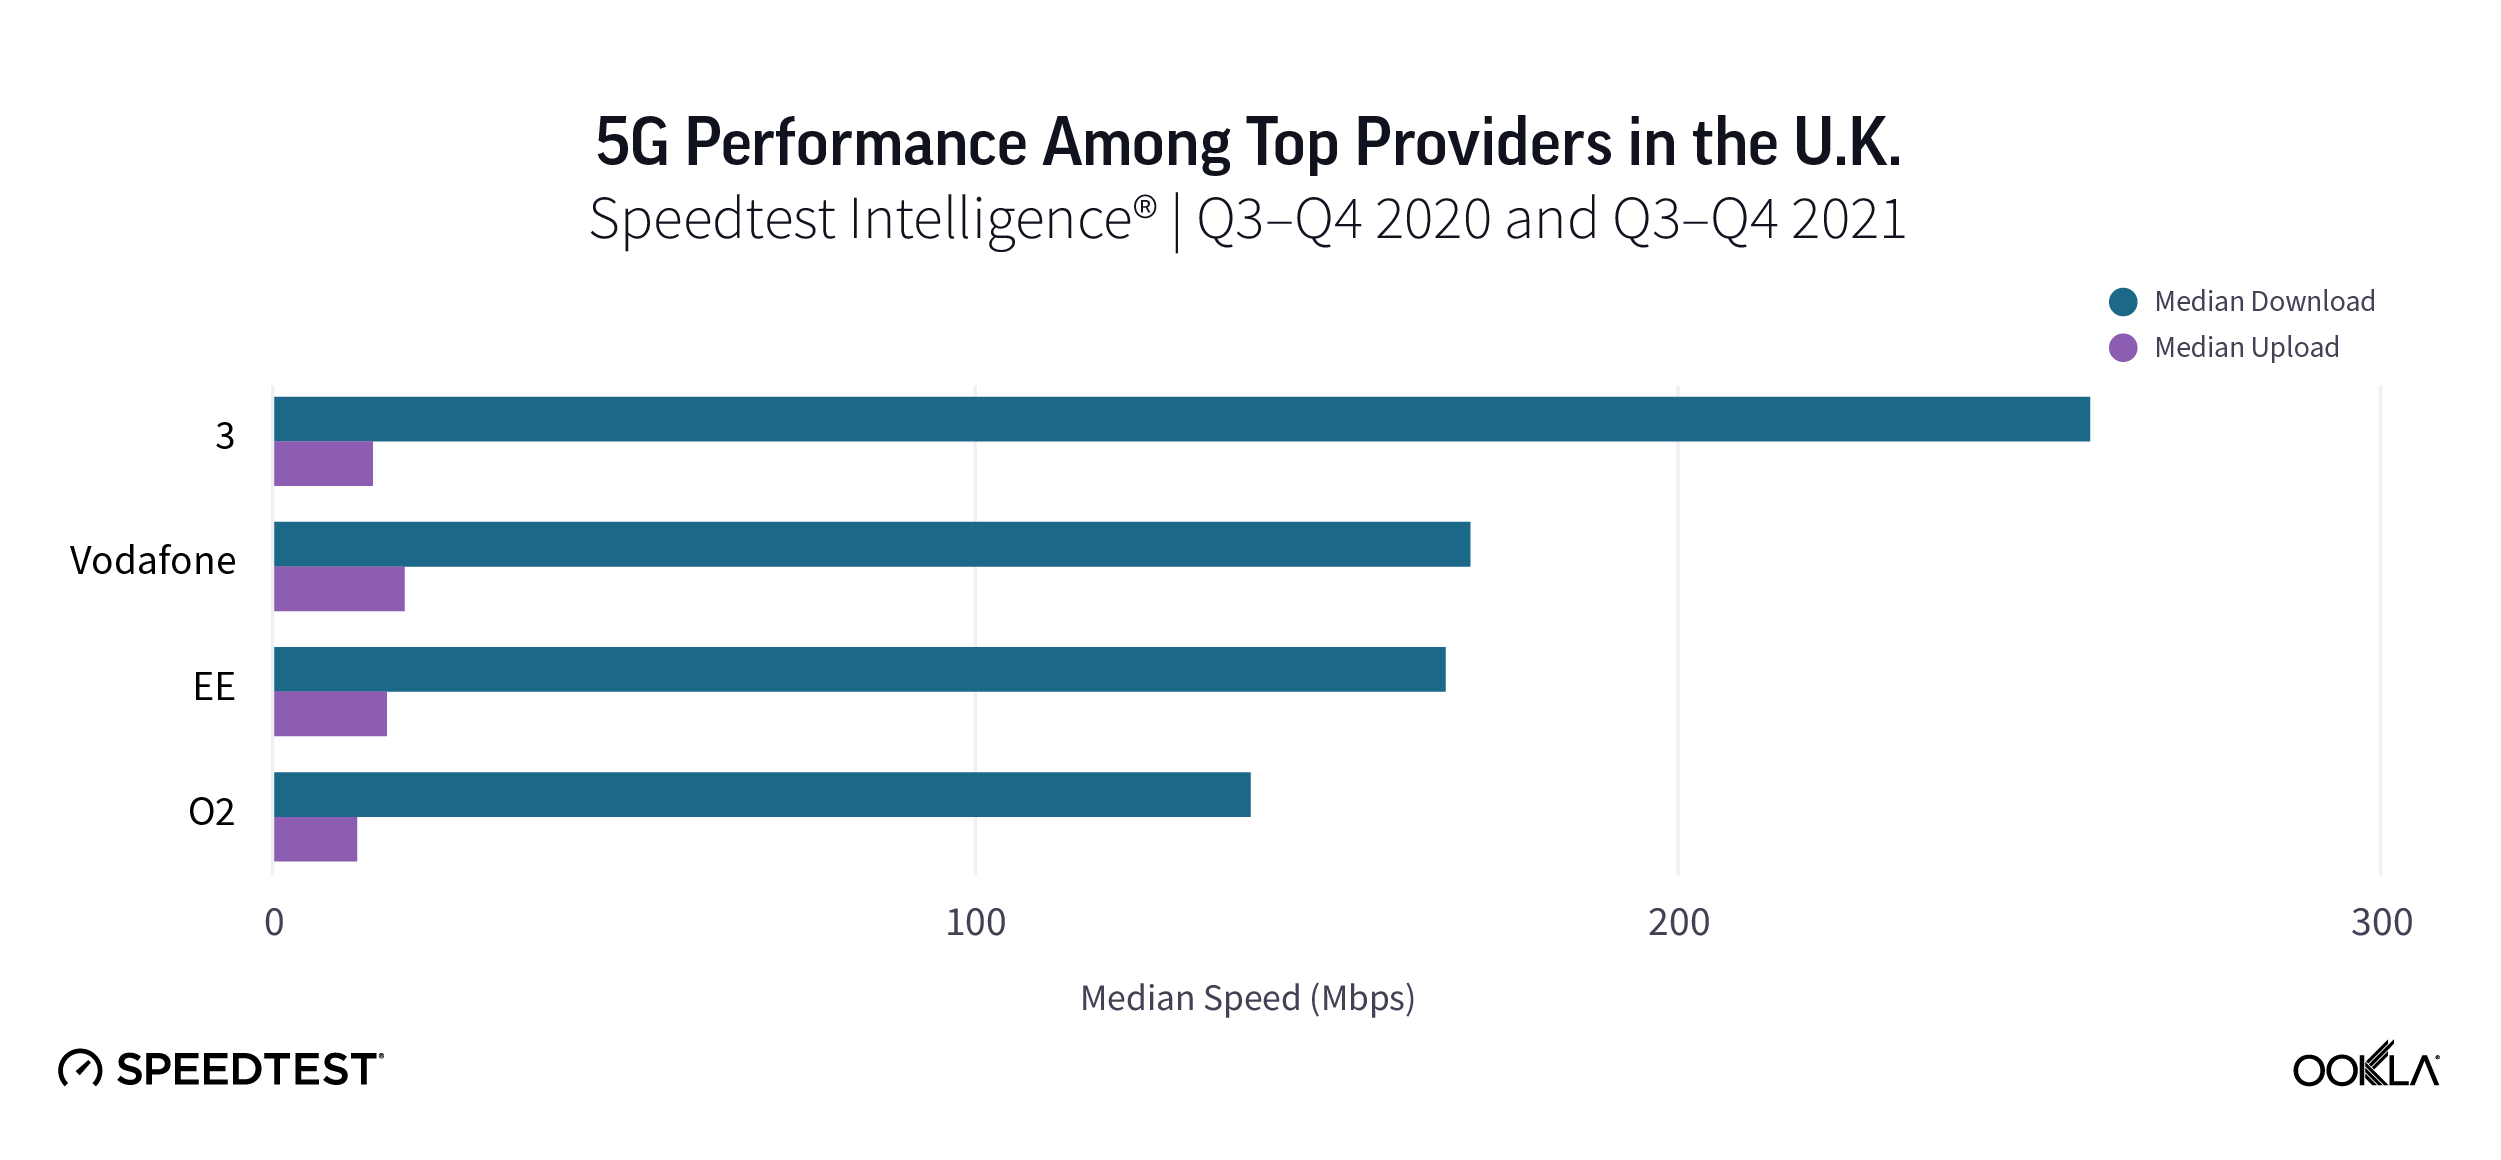
Three UK had the fastest median 5G download speed among top operators, achieving 258.80 Mbps during Q3-Q4 2021, far ahead of Vodafone (170.39 Mbps), EE (166.87 Mbps), and O2 (139.61 Mbps). Median 5G upload speeds across all operators were very similar with Vodafone at 17.86 Mbps, EE at 15.89 Mbps, Three UK at 13.94 Mbps, and O2 at 11.47 Mbps during Q3-Q4 2021. Three UK benefited from having the largest, dedicated 5G spectrum — 140MHz frequency across several 5G spectrum bands, including 100 MH block of continuous spectrum in the 3.3-3.8 GHz band. Three UK’s 5G coverage extended to more than a third of the U.K. population across 370 towns and cities with 2,500 live sites. The operator launched fixed wireless access (FWA) 5G services in August 2019, followed by mobile 5G services in February 2020, which were built upon the 5G-ready, cloud-native core network provided by Nokia in July 2019. Three UK has invested over £2 billion to transform its network and IT infrastructure, as part of a five-year program. 

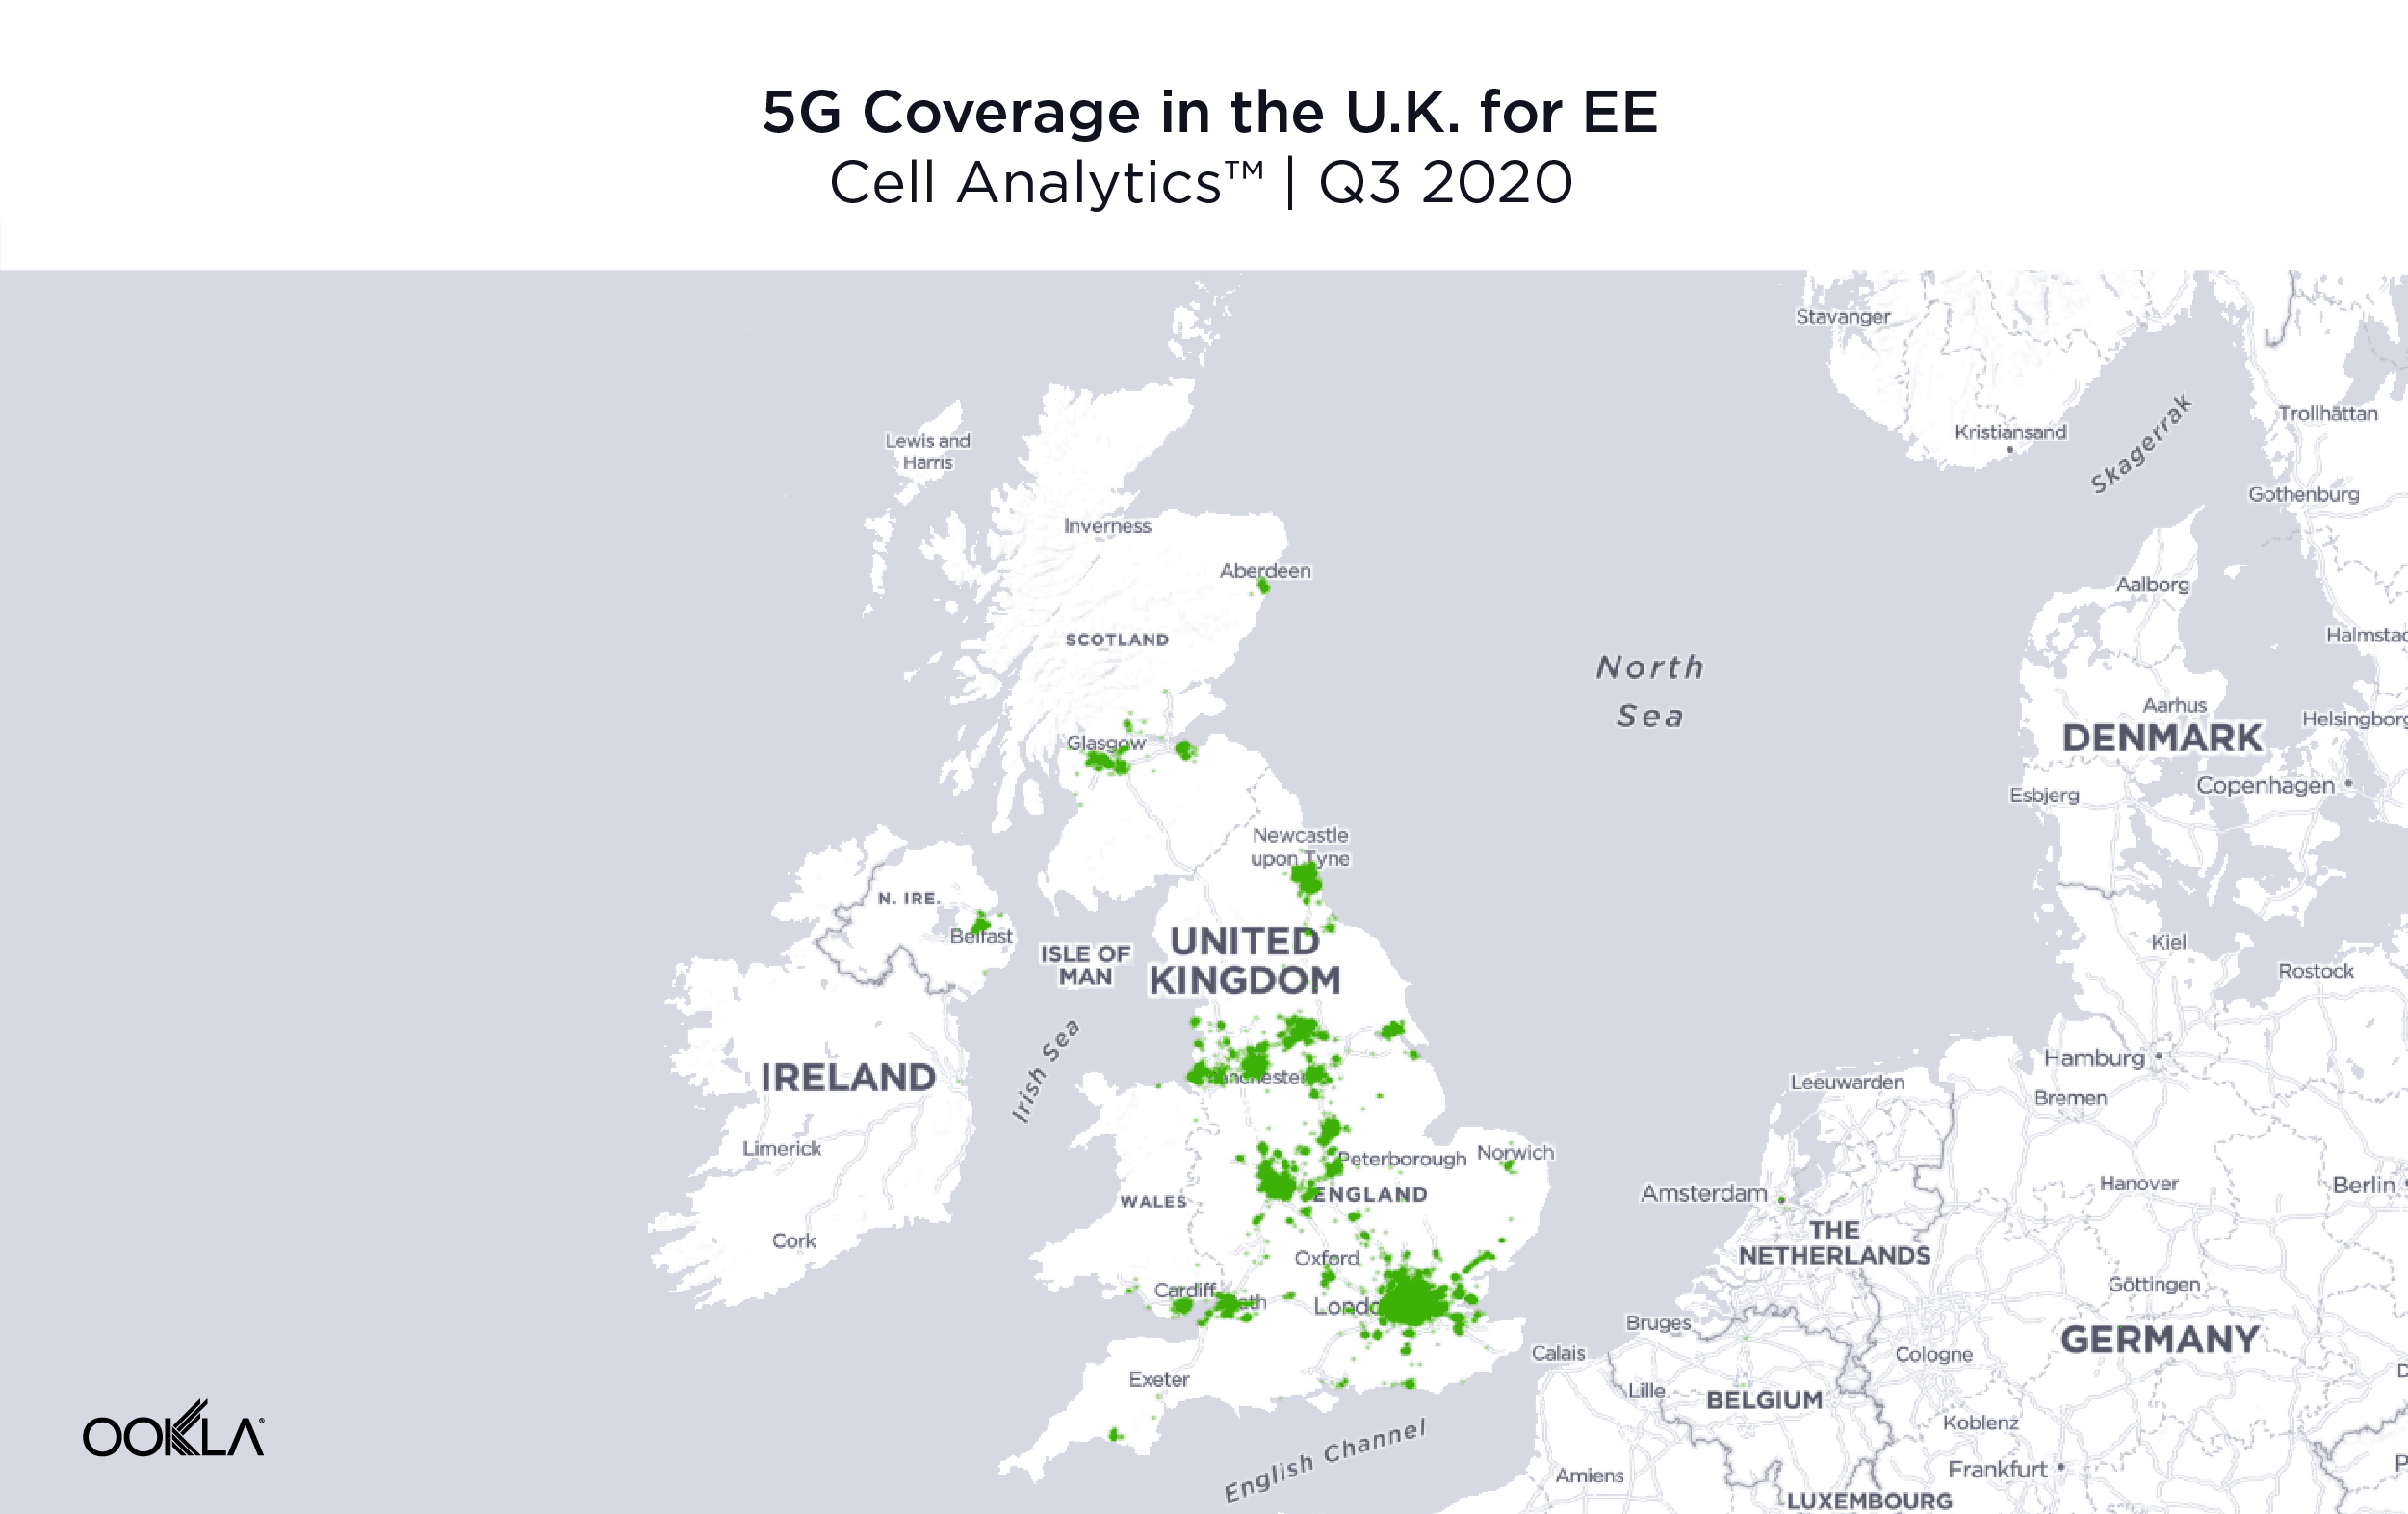
EE leads on 5G Availability 

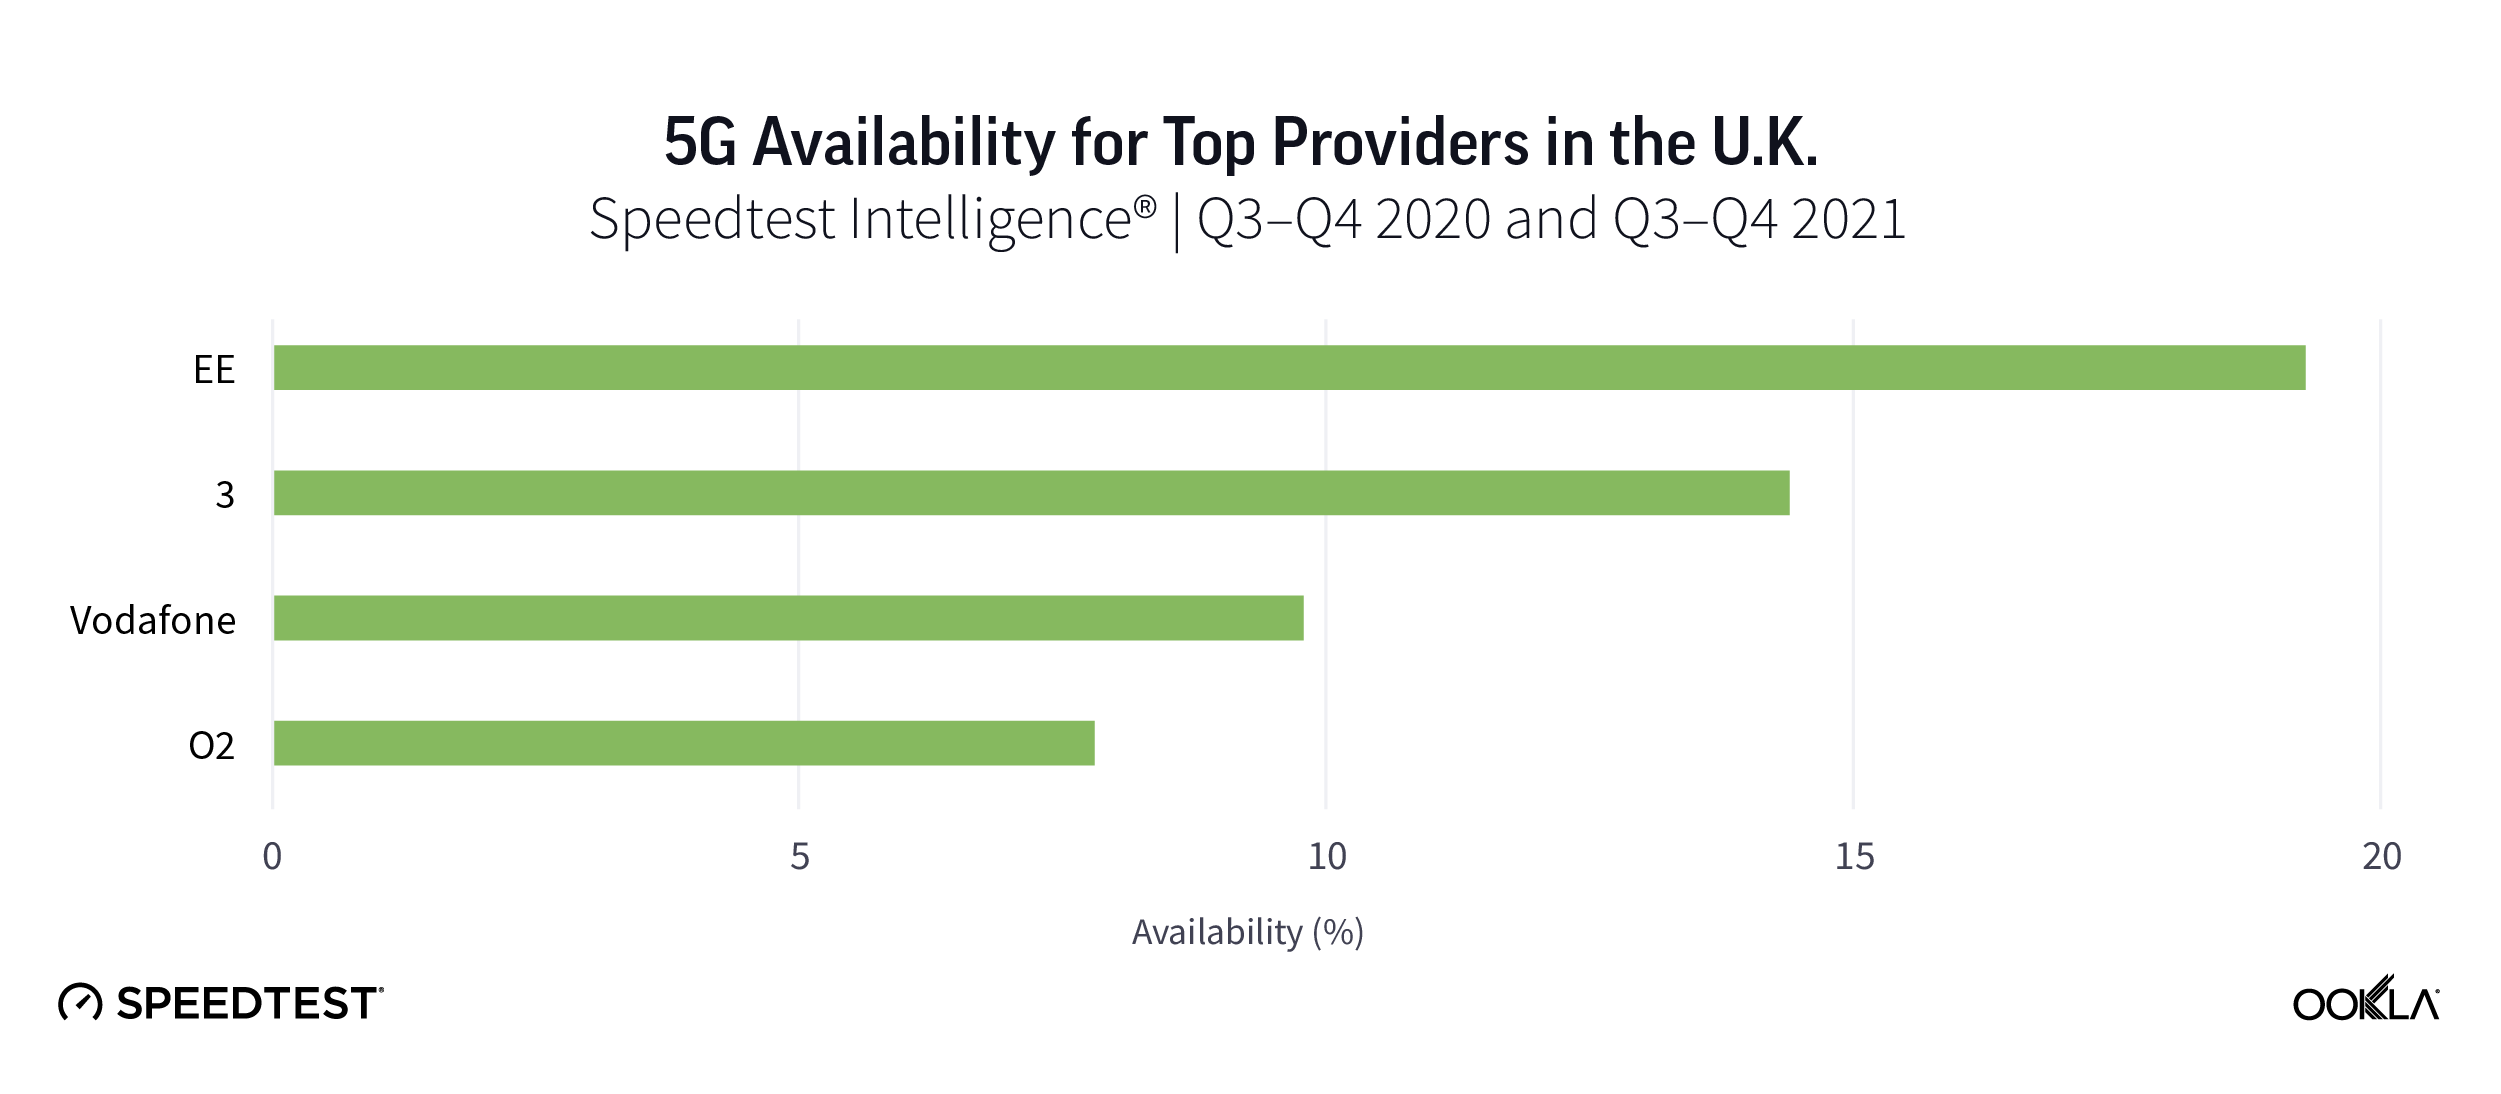
EE had the highest 5G Availability at 19.3% during Q3-Q4 2021, ahead of Three UK (14.4%), Vodafone (9.8%), and O2 (7.8%). In a bid to extend its 4G LTE network coverage, EE has deployed small cells to boost capacity in high-demand areas. Soon, the operator will begin trials to extend the use of small cells to 5G networks by upgrading Nokia’s AirScale portfolio.

5G in the U.K. is rapidly expanding and we’ll be following the market closely

Mobile operators are actively expanding 5G networks and the 5G adoption in the U.K. is growing, stimulated by greater smartphone availability and operators’ innovative services. We’ll be watching 5G performance closely in the U.K. using Speedtest Intelligence. If you want to learn more about how Speedtest Intelligence can help you benchmark your 5G performance against competitors, please inquire here.

Ookla retains ownership of this article including all of the intellectual property rights, data, content graphs and analysis. This article may not be quoted, reproduced, distributed or published for any commercial purpose without prior consent. Members of the press and others using the findings in this article for non-commercial purposes are welcome to publicly share and link to report information with attribution to Ookla.

| February 20, 2019

An Expansive Analysis of European Mobile Roaming Speeds and Behaviors

Last year we took a look at how free roaming was working out for EU citizens in terms of speeds and latency. This year we’ve expanded our analysis to all European countries and included data on Wi-Fi roaming behavior. We’ve also added a little insight into how roaming might affect download speeds for visitors to Mobile World Congress (MWC) in Barcelona from February 25- 28, 2019.

Except where noted, this analysis is based on Speedtest data from Android devices on 4G LTE cellular connections during Q3-Q4 2018. We included data on any country with greater than 30 samples in all categories.

Most Europeans experience slower downloads while roaming

Roaming traffic is subject to deals struck between individual mobile operators on how that traffic will be prioritized, so roaming speeds can depend not only on the country of origin but also the country of destination and the plan a subscriber has selected.

Consider the following table where an Albanian experiences a mean download speed of 54.56 Mbps at home and then 38.47 Mbps while roaming elsewhere in Europe. This is expected as a roamer does not usually have a direct relationship with the mobile operator handling their data and calls abroad.

Mean Mobile Download Speeds in Europe
Speedtest Data | Q3-Q4 2018
Country Local Speed (Mbps) Roaming Speed (Mbps) % Difference
Austria 38.23 35.78 -6.4%
Belarus 16.15 19.49 20.7%
Belgium 52.58 35.42 -32.6%
Bulgaria 47.28 32.35 -31.6%
Croatia 43.83 43.60 -0.5%
Cyprus 37.13 20.58 -44.6%
Czech Republic 44.91 13.43 -70.1%
Denmark 48.83 34.89 -28.6%
Estonia 36.43 38.98 7.0%
Finland 39.33 38.20 -2.9%
France 39.94 34.97 -12.5%
Germany 33.77 28.57 -15.4%
Greece 41.35 38.08 -7.9%
Hungary 49.57 28.19 -43.1%
Iceland 69.27 35.58 -48.6%
Ireland 28.23 31.49 11.6%
Italy 32.18 43.12 34.0%
Kazakhstan 22.93 13.80 -39.8%
Latvia 30.88 33.79 9.4%
Liechtenstein 56.48 36.66 -35.1%
Lithuania 41.49 33.43 -19.4%
Luxembourg 50.91 25.08 -50.7%
Malta 56.34 34.27 -39.2%
Montenegro 45.45 49.97 10.0%
Netherlands 56.06 33.86 -39.6%
Norway 68.49 38.69 -43.5%
Poland 28.74 29.71 3.4%
Portugal 32.06 36.95 15.3%
Romania 36.64 30.74 -16.1%
Russia 20.91 20.47 -2.1%
Serbia 43.41 21.64 -50.1%
Slovakia 33.47 31.80 -5.0%
Slovenia 35.51 36.41 2.5%
Spain 36.07 22.37 -38.0%
Sweden 44.87 34.59 -22.9%
Switzerland 47.59 30.36 -36.2%
Turkey 38.19 28.77 -24.7%
Ukraine 26.07 25.48 -2.3%
United Kingdom 30.84 38.76 25.7%

Residents of the Czech Republic will face massive speed disappointment when roaming through the rest of Europe. Other countries with much better speeds at home than abroad include Luxembourg, Serbia, Iceland and Cyprus.

In ten European countries, citizens experience faster mobile downloads while roaming than they do at home. These include: Italy, the United Kingdom, Belarus, Portugal, Ireland, Montenegro, Latvia, Estonia, Poland and Slovenia. Most of these are among the slowest countries on this list, so it would make sense that their citizens would experience better speeds elsewhere in Europe than they do at home.

Europeans are connected to Wi-Fi most of the time

Customers sometimes try to get better speeds and avoid roaming fees (for those outside the E.U.) and data overages by connecting to Wi-Fi. The following table compares the percentage of time spent on Wi-Fi by a resident of a country with that of a visitor to the country.

Percentage of Time Spent on Wi-Fi in Europe
Speedtest Data | Q3-Q4 2018
Country Local Customers Visitors % Difference
Albania 61.9% 59.8% -3.4%
Andorra 73.6% 69.0% -6.2%
Armenia 61.5% 68.1% 10.7%
Austria 65.6% 36.7% -44.1%
Azerbaijan 67.0% 70.7% 5.5%
Belarus 63.9% 58.3% -8.9%
Belgium 71.1% 32.9% -53.7%
Bosnia and Herzegovina 71.9% 66.0% -8.2%
Bulgaria 65.2% 46.8% -28.2%
Croatia 66.1% 41.0% -38.0%
Cyprus 70.9% 58.4% -17.7%
Czech Republic 75.1% 38.9% -48.1%
Denmark 70.4% 52.9% -24.9%
Estonia 61.2% 45.6% -25.4%
Finland 56.6% 47.1% -16.7%
France 60.2% 43.1% -28.5%
Georgia 61.4% 62.2% 1.3%
Germany 72.2% 42.4% -41.3%
Greece 73.5% 52.2% -28.9%
Hungary 71.9% 35.0% -51.3%
Iceland 65.7% 58.2% -11.4%
Ireland 67.2% 52.4% -22.0%
Italy 64.1% 48.9% -23.7%
Kazakhstan 57.7% 64.7% 12.3%
Latvia 60.9% 43.8% -28.1%
Liechtenstein 71.7% 58.2% -18.9%
Lithuania 66.8% 43.3% -35.1%
Luxembourg 63.6% 26.0% -59.1%
Macedonia 65.3% 52.9% -18.9%
Malta 74.3% 58.0% -22.0%
Moldova 67.2% 67.3% 0.2%
Montenegro 63.6% 65.2% 2.5%
Netherlands 73.0% 42.5% -41.7%
Norway 74.7% 59.7% -20.1%
Poland 62.5% 48.1% -23.1%
Portugal 69.1% 54.7% -20.9%
Romania 62.4% 48.7% -21.9%
Russia 58.8% 65.9% 12.2%
San Marino 66.8% 39.7% -40.6%
Serbia 68.6% 61.2% -10.7%
Slovakia 69.6% 35.1% -49.6%
Slovenia 63.3% 26.4% -58.3%
Spain 70.8% 53.0% -25.2%
Sweden 71.8% 44.9% -37.4%
Switzerland 62.4% 47.2% -24.4%
Turkey 61.7% 73.0% 18.4%
Ukraine 61.5% 62.4% 1.5%
United Kingdom 71.3% 54.0% -24.3%

Finland showed the lowest time spent on Wi-Fi by residents at 56.6%. Kazakhstan was second at 57.7% followed by Russia (58.8%), France (60.2%) and Latvia (60.9%). The Czech Republic showed the highest time spent on Wi-Fi by residents at 75.1%. Norway was second at 74.7% followed by Malta (74.3%), Andorra (73.6%) and Greece (73.5%).

When it comes to time spent on Wi-Fi by visitors, Luxembourg had the lowest percentage at 26.0%. Slovenia was second at 26.4% followed by Belgium (32.9%), Hungary (35.0%) and Slovakia (35.1%). Turkey showed the highest time spent on Wi-Fi by visitors at 73.0%. Azerbaijan was second at 70.7% followed by Andorra (69.0%), Armenia (68.1%) and Moldova (67.3%).

Luxembourg saw the largest difference in time spent on Wi-Fi between residents and visitors with visitors using Wi-Fi 59.1% less than residents. Slovenia was close behind at 58.3%, followed by Belgium (53.7%) and Hungary (51.3%). On the other end of the spectrum, visitors to Turkey were on Wi-Fi 18.4% longer than residents followed by Kazakhstan (12.3%) and Russia (12.2%).

Roaming dramatically increases latency in Europe

Because roaming signals are routed through a user’s home network, latency is always an issue in roaming. Speedtest data shows that latency while roaming is a much larger issue for residents of some countries than it is for others.

Comparing European Latency In-Country and Abroad
Speedtest Data | Q3-Q4 2018
Country Local Latency (ms) Roaming Latency (ms) % Difference
Austria 24 83 245.8%
Belarus 32 75 134.4%
Belgium 24 81 237.5%
Bulgaria 24 126 425.0%
Croatia 32 86 168.8%
Cyprus 20 194 870.0%
Czech Republic 24 86 258.3%
Denmark 24 98 308.3%
Estonia 23 78 239.1%
Finland 26 104 300.0%
France 42 87 107.1%
Germany 33 87 163.6%
Greece 27 137 407.4%
Hungary 22 94 327.3%
Iceland 18 163 805.6%
Ireland 34 114 235.3%
Italy 52 116 123.1%
Kazakhstan 35 164 368.6%
Latvia 24 94 291.7%
Liechtenstein 40 90 125.0%
Lithuania 26 108 315.4%
Luxembourg 23 73 217.4%
Malta 18 141 683.3%
Montenegro 18 42 133.3%
Netherlands 26 81 211.5%
Norway 36 109 202.8%
Poland 33 104 215.2%
Portugal 27 102 277.8%
Romania 26 131 403.8%
Russia 42 161 283.3%
Serbia 22 76 245.5%
Slovakia 30 69 130.0%
Slovenia 21 69 228.6%
Spain 45 118 162.2%
Sweden 30 118 293.3%
Switzerland 26 75 188.5%
Turkey 26 115 342.3%
Ukraine 35 116 231.4%
United Kingdom 37 107 189.2%

Residents of Cyprus saw an average latency of 194 ms while roaming in Europe. The country with the second highest latency for residents roaming abroad was Kazakhstan at 164 ms, followed by Iceland (163 ms). Russia (161 ms) and Malta (141 ms). In contrast, Montenegro had a lower latency for residents roaming abroad than Italy did for residents using their mobile phones locally.

Roaming performance at MWC

MWC, the largest mobile conference in the world, has Barcelona teeming with visitors from across the globe all trying to connect to their home networks. During February 2018 we saw an average download speed of 34.31 Mbps while roaming in Barcelona and a mean latency of 201 ms. Visitors from the U.K. saw an average download speed of 49.00 Mbps and a mean latency of 111 ms, while those from Italy averaged a download of 32.88 Mbps and a latency of 128 ms.

What will the performance look like at this year’s conference? Schedule a meeting or come see us in Hall 2 at Booth 2i25 to learn more about our roaming data.

Ookla retains ownership of this article including all of the intellectual property rights, data, content graphs and analysis. This article may not be quoted, reproduced, distributed or published for any commercial purpose without prior consent. Members of the press and others using the findings in this article for non-commercial purposes are welcome to publicly share and link to report information with attribution to Ookla.

| October 21, 2020

5G Claims Gone Wrong: The Dangers of Bad Data

5G is in the news as competing operators roll out deployments in a race to have the fastest service in the most places. At Ookla®, we’ve observed astonishing 5G speeds that live up to the hype. But 5G headlines can be confusing for consumers who are trying to sift through conflicting claims that are often based on limited (if not deeply flawed) data. 5G as a technology is also rapidly evolving, which makes sound data collection that addresses the nuances of these shifts even more important.

As the industry leader in internet testing, Ookla has over 15 years of experience measuring emerging technologies. We’re here to share some lessons learned about what goes into making an authoritative claim that consumers can rely on. We’ll also look closely at some recent examples from the United Kingdom where a multitude of methodological shortcomings from unseasoned data providers have led to unreliable network claims. While this article is focused on U.K. examples, the same methodology critiques apply to active 5G claims from the same data providers in other markets.

Poor data leads to spurious claims, examples from the U.K.

Operators are eager to use designations like “fastest,” “best coverage” and “most improved” because these messages resonate with customers. But without proper data and careful analysis backing them, these labels are meaningless and potentially misleading. Ookla has a team of data scientists dedicated to ensuring our claims about networks are accurate, representative and fair.

In recent months we’ve seen a series of conflicting claims being made in the U.K. market. These claims are not based on robust, proven data collection and processing practices. As a result, consumers are being misled about which operators are truly providing the best experience.

Poor 5G identification muddles what’s being measured

As 5G is an emerging technology, it needs to reach a certain level of both adoption and maturity before comparative performance claims can be made in new markets. The U.K. is one such hotbed of 5G activity where every operator is racing to be crowned the best. This well-intended desire of operators to show off new capabilities has led to dubious claims being made in the market. Namely, competing operators are making similar claims about their network capabilities, while differing data providers are publishing reports based upon very limited and flawed data. This can lead consumers to make decisions based on questionable reporting — or to purchase services that aren’t even available in their area.

device-identification
Not all 5G-capable devices natively identify 5G when reporting the connection type to applications. That’s why Ookla has directly partnered with device manufacturers worldwide to implement accurate in-app 5G detection in Speedtest®. Data providers who do not couple robust in-app detection with strict filtering criteria are highly likely to mis-identify a wide range of 5G connections and ultimately show speeds that do not accurately reflect the network’s actual 5G service capability.

Failure to measure full throughput undervalues high-speed connections

Modern technologies like 5G are capable of achieving gigabit speeds and beyond. Unless a testing solution is capable of measuring the full throughput of a user’s connection, measured speeds will not reflect the network’s real-world performance. The Ookla Speedtest Methodology uses a distributed network of servers to fully maximize a connection in the foreground, on demand, that can accurately measure speeds up to 10 Gbps. Other data providers like Opensignal, nPerf and umlaut either test to remote CDNs, test in the background or — worse still — hide their tests in third-party apps that are completely unrelated to network diagnostics.

dedicated-measuring-1
The Opensignal methodology allows for a blend of testing methods. However, their public reporting consistently makes no distinction between results derived from these differing methodologies and presents them as a simple national average. This mix of methodologies introduces the possibility that any reported differences in download speed among operators may be due to differences in testing and not due to differences in the actual services that they provide.

Opensignal’s test methodology also tends to seriously undervalue the full capability of networks. Because a significant amount of demand must be generated on the network before 5G carrier aggregation can even take effect, shorter-duration and background tests are incapable of ensuring that the network assigns a sufficient number of component carriers to the user equipment (UE) to trigger a 5G connection. Data providers that only pass along a small file do not fully saturate a network connection and often cannot place enough demand on the network to trigger a 5G connection, leaving devices — and speeds — stuck registering 4G.

For example, Opensignal recently reported that the average 5G download speed in the U.K. was 130.1 Mbps. Ookla’s data for that same time period, on the other hand, reported a dramatically higher mean download speed of 187.49 Mbps (95%CI [185.57, 189.42]). This range of 185.57-189.42 Mbps is a 95% confidence interval, which represents the range of values in which the true value is likely to be. Ookla’s large sample sizes combined with rigorous statistical testing ensure that all claims that we make stand on solid ground. To their credit, Opensignal also includes uncertainty in their reported speeds, but because it is unclear — though important — what their confidence intervals represent, we cannot compare them directly.

If networks wish to demonstrate that they truly are the fastest, they must employ methodologies that test using the full capacity of the connection, rather than a small file passed to a distant server. This is especially true when considering the high speeds achieved with 5G.

Inadequate sample sizes falsely represent reality

Data providers with small test volumes from a limited number of locations do not have the statistical power needed to draw sound conclusions about network performance.

sample-volume

As the industry’s most trusted source for consumer throughput testing, Speedtest users performed over 19.4 million tests daily during Q3 2020. We see real-time results on almost every mobile and fixed broadband network in the world — including just about every device make and model — which provides an unmatched view of how the internet is currently performing at a global scale.

For example, nPerf published a U.K. report which was based on less than 36,000 test samples taken over a 12-month period. For comparison, Ookla collects over 15,000 tests every day in the U.K. It took Ookla less than three days to collect the same amount of data that nPerf collected in a year. Generally speaking, lower sample counts tend to produce results with much less statistical certainty. This particular report from nPerf showed wildly different results than all others released in the market — unsurprisingly, given their limited sample size. This put Vodafone on the defensive as rivals ran TV ads to debunk nPerf’s claim, which was meant to bolster Vodafone’s network offerings.

ookla-vs-nPerf-1

Drive testing misses areas where users are most likely to connect

Driving pre-configured test equipment on pre-configured routes in static, lab-like conditions has been a staple of network reporting for a long time. While drive testing removes several potentially confounding variables, this data is not representative of real users’ experiences. Using drive testing as a proxy measurement of user experience always proved troublesome, given the optimized nature of the pre-selected routes and equipment involved. When you take into consideration that 5G is an emerging technology — with limited network coverage and limited device penetration — using drive testing as a tool to back claims about how a customer may experience a 5G network is disingenuous, at best.

5G speeds are only important to measure where customers actually have access to that service. Both umlaut and Rootmetrics have reported on 5G performance in London based on drive testing results. Only the Rootmetrics report included an availability metric, which showed that while Vodafone was slightly faster in London, their 5G signal was only available on 5% of the route driven — compared to 28% for EE. Narrow measurements taken from a small number of devices, in cars, in a test environment, on a small number of routes over a small time period do not provide a sufficient sample to underpin the claim of “fastest 5G” in one of the world’s foremost cities.

drive-test-map-2

Each time a user takes a Speedtest, a snapshot of the internet is captured for that specific time, place, device and network. Because these tests are initiated by consumers when and where they need performance data, Speedtest gives users accurate information about internet speeds at the times and locations that are important to them. When aggregated, these measurements describe the network’s real-world, round-the-clock performance and its ability to meet the needs of its users. Our volume of data allows us to accurately describe and compare performance, including how much time consumers spend connected to 5G. For example, we can look at results across all devices to quantify the performance that the average user is experiencing or narrow our focus to 5G-capable devices, which allows us to fully assess the high-end capabilities offered in modern deployments.

Poor data science causes untrustworthy results

Other telecommunications data providers each have their own indices that they use when awarding “winners.” Unfortunately, most of these are based upon unclear and, at times, unsound ranking systems. From nPoints to Rootscores, compound scores hide an operator’s actual performance from consumers who simply want to know what performance they can expect. Arbitrary data periods seem altered to suit the highest bidder among network operators, device definitions are unclear, and data samples are minuscule. This produces the desirable commercial outcome for the data providers, but it does not give consumers transparent information about which operator will actually serve them best.

Basing claims on flawed data confuses consumers. Worse still, conflicting or misleading claims can substantially degrade a customer’s perception and trust in their network operator. Basing regulatory policy on this flawed data can lead to devastating consequences, such as poorly allocating government funding and deepening the digital divide for underserved populations, particularly in a world where we are all relying on connectivity more than ever before.

Good data makes for justifiable claims

As we found in our recent U.K. market analysis, the 3 network has by far the fastest median download speed over 5G in the U.K. This analysis is based on over 60,000 Speedtest results taken over 5G by more than 16,000 devices in the U.K. during Q3 2020. In all, there were over 500,000 samples of Speedtest results in the U.K during Q3 2020. EE shows the highest Time Spent on 5G by 5G-capable devices at 10.9%, with 3 coming in at a distant second and Vodafone third.

5g-median-uk-1

Squandering marketing budgets to promote claims based on unsound data or unsound methodologies helps no one — not the customer, the operator or even the company providing the unsound claim. When Ookla stands behind a claim of “fastest” or “best” network in a country, we do so only when a strict set of conditions has been met. Being a trusted source of consumer information was our first function and it remains the driver behind our mission.

Ookla retains ownership of this article including all of the intellectual property rights, data, content graphs and analysis. This article may not be quoted, reproduced, distributed or published for any commercial purpose without prior consent. Members of the press and others using the findings in this article for non-commercial purposes are welcome to publicly share and link to report information with attribution to Ookla.

| November 23, 2020

5G Advances Across the U.K., but Access Varies Widely by Country

The United Kingdom has seen considerable advances in 5G during the past year, but access to this emerging technology continues to be uneven across countries of the U.K. Looking at Q3 2020, data from Speedtest Intelligence® and Ookla Cell Analytics™ reveals how 5G affected overall mobile speeds, which country had the fastest 5G and where access was lacking. We also shed light on which operator had the fastest 5G in the U.K. as a whole and in London, specifically.

5G is 518% faster than 4G in the U.K.

5G speeds in the U.K. far exceeded those on 4G during Q3 2020 with the mean download speed over 5G coming in 517.8% faster than median download speed over 4G. The U.K’s mean upload speed over 5G was 121.5% faster than that over 4G.

Mean Mobile Speeds in the United Kingdom
Speedtest Intelligence® | Q3 2020
5G Download (Mbps) 5G Upload (Mbps) 4G Download (Mbps) 4G Upload (Mbps)
United Kingdom 186.97 21.38 30.26 9.65

Scotland had the fastest 5G download speed

Scotland brought up the national average for 5G speeds in the U.K. during Q3 2020 with a 6.1% faster mean download speed than we saw in the U.K. as a whole. England was the second fastest country in the U.K. for mean download speed over 5G and Wales was third. While 5G download speeds were promising in Northern Ireland, the volume of data did not meet our rigorous sampling guidelines. We’ll be interested to see how speeds there develop as more users access the networks.

Mean Mobile Speeds in the United Kingdom
Speedtest Intelligence® | Q3 2020
5G Download (Mbps) 5G Upload (Mbps) 4G Download (Mbps) 4G Upload (Mbps)
England 184.48 21.49 31.05 9.69
Scotland 198.39 22.05 28.60 9.87
Wales 171.12 21.49 26.26 9.02

Three was the fastest operator for 5G in the U.K.

As we’ve previously reported, 3 was the fastest mobile operator over 5G in the U.K during Q3 2020 with a median download speed of 201.12 Mbps. EE had the highest percentage of 5G Time Spent (when subscribers’ 5G-capable devices are connected to 5G).

How operators in the U.K. are using spectrum for 4G

The distribution of low, mid and high spectrum bands is evenly spread across all mobile operators in the U.K. All four operators hold licenses in the 800 MHz frequency band, while Vodafone and O2 hold additional 900 MHz licenses — some of which are still used to support the legacy 2G and 3G services. Three and Vodafone hold 20 MHz each of the 1500 MHz supplemental downlink band 32, and all four operators hold 1800 MHz and 2100 MHz licenses. It’s worth noting that EE holds a massive 40 MHz contiguous slice in the 1800 MHz band and 20 MHz in the 2100 MHz band.

O2 holds an additional 40 MHz contiguous spectrum block in the 2300 MHz (TDD) band. In the 2600 MHz capacity band, O2 holds a single 20 MHz block, Vodafone holds two 20 MHz blocks, while EE operates on a whopping 50 MHz slice of spectrum.

Given the spectrum distribution in the mid- and high-capacity bands, and the increased proliferation of devices with modern chipsets capable of aggregating multiple LTE component carriers, it’s fairly easy to see why EE has been able to consistently deliver the fastest LTE speeds in recent years.

5G-specific spectrum allocation in the U.K.

When it comes to 5G, all operators have deployed 5G non-standalone networks in the 3.5GHz to 3.6GHz band (n78). EE and O2 operate their 5G networks using 40 MHz slices, Vodafone holds a 50 MHz license, while 3 was able to secure a 100 MHz license during the 5G auction — the largest possible channel width defined for FR1 networks. Given the massive advantage over its 5G competitors, 3 is able to consistently deliver the fastest 5G speeds.

The upcoming Ofcom spectrum auction in early 2021 should offer additional capacity in the 3.6-3.8 GHz range as well as the 700 MHz band, which should enable much wider 5G coverage across the U.K. Devices capable of aggregating low and mid 5G spectrum bands are also expected in the first half of 2021, which should allow operators to efficiently roll out standalone 5G and deliver broader 5G coverage with even faster speeds and ultra low latency.

England has the majority of 5G deployments in the U.K.

The Ookla 5G MapTM showed 5G deployments in 199 cities or towns in the U.K. as of November 4, 2020. 5G was commercially available in 176 English cities, and there were 14 5G cities or towns in Scotland, five in Wales and four in Northern Ireland.

This compares with 29 5G cities in the whole U.K. at this time last year: 22 in England, three each for Scotland and Wales and one in Northern Ireland.

Ookla_UK_5G_Deployment_Map_1120

5G coverage varies by operator

Not all operators are deploying 5G cell sites in the same areas. Data from Cell Analytics measures where customers of each operator are accessing 5G and how strong that 5G signal is in each area. The following maps show 5G signal strength greater than -110 dBm for each operator.

Ookla_UK_Coverage_3_1120

Ookla_UK_Coverage_EE_1120-3

Ookla_UK_Coverage_O2_1120-3

Ookla_UK_Coverage_Vodafone_1120-3

Three and EE show larger areas of measured coverage in most parts of the U.K., especially in and around Belfast, Birmingham and London. Vodafone shows a larger area of coverage around Glasgow and Newcastle upon Tyne. O2 shows a much smaller coverage area with clusters in and around Belfast, Leeds and London.

London’s 5G download speed was slower than the national average

London saw a mean download speed over 5G of 167.06 Mbps in Q3 2020, 10.6% slower than that in the U.K. as a whole. London’s median 5G upload speed of 22.92 Mbps was 7.2% faster than that in the U.K as a whole.

Mean 5G Performance in London
Speedtest Intelligence® | Q3 2020
Download (Mbps) Upload (Mbps)
London 167.06 22.92

We’d like to be able to report which country’s capital city had the fastest 5G, but this technology is still emerging and there were not enough samples to responsibly determine a winner outside of London. We will be watching these markets carefully and will report back when there is additional information.

Three was the fastest operator in London

Three showed the fastest mean download speed over 5G among mobile operators in London during Q3 2020. O2 was second, an important distinction as many other data providers do not have sufficient samples to include O2 in their analyses. Vodafone was third and EE fourth.

5G Performance by Operator in London
Speedtest Intelligence® | Q3 2020
Operator Mean Download (Mbps) Mean Upload (Mbps) Top 10% Download (Mbps) Top 10% Upload (Mbps)
3 196.02 18.93 362.46 43.74
O2 181.19 15.55 289.65 24.35
Vodafone 166.77 25.50 288.17 41.42
EE 142.86 26.83 245.73 52.21

We also analyzed the fastest 10% of Speedtest results over 5G for each operator to evaluate what speeds each network is capable of reaching at this time. Three had the fastest download speed in this category by far and EE led for upload speed.

England showed the highest time spent on 5G

Ookla_UK_5G_Time-Spent_Map_1120-3

We calculated the proportion of time that users with 5G-capable devices spent on 5G in the United Kingdom and found that England had the highest 5G Time Spent during Q3 2020 at 5.6%. This was higher than the average 5G Time Spent for the U.K. of 5.3%. Scotland had the second highest 5G Time Spent in the U.K. at 3.0% and Wales was third. As above, we have not included data for Northern Ireland because samples were too few. 5G Time Spent includes time spent on both 5G and 5G roaming.

While the rapid spread of 5G across the U.K. is exciting and speeds are promising, the benefits of 5G are spread unevenly across the nation — and time spent on 5G is still very low. We’ll be excited to see this technology expand and to analyze how 5G improves mobile performance across the U.K.

Ookla retains ownership of this article including all of the intellectual property rights, data, content graphs and analysis. This article may not be quoted, reproduced, distributed or published for any commercial purpose without prior consent. Members of the press and others using the findings in this article for non-commercial purposes are welcome to publicly share and link to report information with attribution to Ookla.

| December 20, 2021

Growing and Slowing: The State of 5G Worldwide in 2021


5G continues to offer new and exciting ways of rethinking everything from streaming video to performing remote surgery. However, not everyone shares equally in these possibilities as many countries do not have access to 5G and even those that do, do not experience the same level of performance from their 5G connections. We examined Speedtest Intelligence® data from Q3 2021 Speedtest® results to see how 5G speeds have changed, where download speeds are the fastest at the country and capital level, where 5G deployments have increased and what worldwide 5G Availability looked like in Q3 2021. We also looked at countries that don’t yet have 5G to understand where consumers are seeing improvements in 4G access.

5G slowed down at the global level

Median-Speeds-Worldwide_1221-01

It’s common to see new mobile access technologies slow down as adoption scales, particularly early on in the tech cycle. Over the past year from Q3 2020 to Q3 2021, the median global 5G download speed fell to 166.13 Mbps, down from 206.22 Mbps in Q3 2020. Median upload speed over 5G also slowed to 21.08 Mbps (from 29.52 Mbps) during the same period.

More users are logging on to existing 5G networks, and we’re also at the stage in the evolution of 5G where countries that have historically had slower speeds are starting to offer 5G. In addition, the widespread use of dynamic spectrum sharing that has been used to boost early 5G coverage weighs on 5G download speeds. While the dip in speeds looks like a letdown, it’s more of a compromise to enable broader access. With additional spectrum and further deployments slated for 2022, we anticipate speeds will begin to pick up again.

South Korea had the fastest 5G in the world

ookla_5g-download_performance_countries_1221-01-1

South Korea had the fastest median download speed over 5G during Q3 2021, leading a top 10 list that included Norway, United Arab Emirates, Saudi Arabia, Qatar, Kuwait, Sweden, China, Taiwan and New Zealand. Sweden, China, Taiwan and New Zealand were new to the top 10 in 2021 while South Africa (whose 5G was brand new last year), Spain and Hungary fell out of the top 10.

5G expanded to 13 additional countries

ookla_5G-map_1221-01

According to the Ookla® 5G Map, there were 5G deployments in 112 countries as of November 30, 2021. That’s up from 99 countries on the same date a year ago. The total number of deployments increased dramatically during the same time period with 85,602 deployments on November 30, 2021 compared to 17,428 on November 30, 2020, highlighting the degree to which 5G networks scaled during the year. Note that there are often multiple deployments in a given city.

Seoul and Oslo lead world capitals for 5G

ookla_5g-download_performance_capitals_1221-01

Speedtest Intelligence data from Q3 2021 shows a wide range of median 5G speeds among global capitals. Seoul, South Korea and Oslo, Norway were in the lead with 530.83 Mbps and 513.08 Mbps, respectively; Abu Dhabi, United Arab Emirates; Riyadh, Saudi Arabia and Doha Qatar followed. Brasilia, Brazil had the slowest median download speed over 5G on our list, followed by Warsaw, Poland; Cape Town, South Africa and Rome, Italy. Stockholm, Sweden and Oslo, Norway had some of the the fastest median upload speeds over 5G at 56.26 Mbps and 49.95 Mbps, respectively, while Cape Town had the slowest at 14.53 Mbps.

The U.S. had the highest 5G Availability

The presence of 5G is only one indicator in a market, because even in markets where 5G has launched, coverage and adoption can be pretty low. We analyzed 5G Availability to see what percent of users on 5G-capable devices spent the majority of their time on 5G, both roaming and on-network during Q3 2021.

ookla_5g-availability_countries_1221-01

The United States had the highest 5G Availability at 49.2%, followed by the Netherlands (45.1%), South Korea (43.8%), Kuwait (35.5%) and Qatar (34.8%). Brazil had the lowest 5G Availability on our list at 0.8%, followed by Sweden (1.5%), South Africa (2.7%), New Zealand (2.9%) and Hungary (3.6%).

Not all 5G networks are created equal

Ookla Speedtest Intelligence data shows a growing disparity in the performance of 5G networks worldwide, even among the pioneer markets who were among the first to launch the new technology. We see leading markets such as South Korea, Norway, the UAE and China pulling well ahead of key European markets, the U.S. and Japan on 5G download speeds, creating what increasingly looks like two tiers of 5G markets.

ookla_5g-download_performance_1221-01

Part of the reason for this divergence is access to key 5G spectrum bands, with Verizon and AT&T in the U.S. for example, soon to deploy their C-band spectrum holdings for 5G use. However, what really seems to separate these markets is the level of 5G network densification. The number of people per 5G base station ranges from 319 in South Korea and 1,531 in China, to 4,224 in the EU and 6,590 in the US, according to the European 5G Observatory’s International Scoreboard during October 2021.

Despite the noise around 6G, 5G still has a long way to run

Median 5G mobile download speeds across these markets are respectable relative to the International Telecommunication Union’s (ITU) IMT-2020 target of 100 Mbps for user experienced download data rates. However, 5G Speedtest® results in each market demonstrate significant variability, with the bottom 10th percentile only recording speeds in excess of the IMT-2020 target in South Korea and Norway, and falling significantly short in many other markets, with Spain, Italy and the U.S. below 20 Mbps.

The story gets worse for upload speeds, where no market’s median speed broke the IMT-2020 recommended 50 Mbps, and where the bottom 10th percentile lay in single digits across the board. Operators are clearly prioritizing download speeds over upload, which makes sense given the asymmetric nature of demand, with most consumer applications requiring higher download speeds. However, as operators increasingly look to target the enterprise market with 5G connectivity and consumer demand for services such as video calling and mobile gaming continues to rise, operators will need to boost upload speeds.

ookla_5g-upload_performance_1221-01-1

Demand for mobile internet bandwidth continues to grow, up 43% year-on-year in Q3 2021 according to Ericsson’s latest mobility report. Looking ahead to 2022, operators will need to increase the capacity of their 5G networks to tackle this growing demand while driving network speeds to new heights. We’ve seen the impact the deployment of new spectrum can have on congested networks during 2021, with Reliance Jio witnessing a bump in 4G LTE performance and consumer sentiment following its acquisition of additional spectrum in India.

Where 5G still fails to reach

Speedtest Intelligence showed 70 countries in the world where more than 20% of samples were from 2G and 3G connections (combined) during Q3 2021 and met our statistical threshold to be included. These are mostly countries where 5G is still aspirational for a majority of the population. As excited as we are about the expansion of 5G, we do not want to see these countries left behind. Not only are 2G and 3G decades old, they are only sufficient for basic voice and texting, social media and navigation apps. To deliver rich media experiences or video calling, users need access to 4G or higher. Having so many consumers on 2G and 3G also prevents mobile operators from refarming that spectrum to make 4G and 5G networks more efficient.

Countries That Still Rely Heavily on 2G and 3G Connections
Speedtest IntelligenceⓇ | Q3 2021
Country 2G & 3G Samples
Central African Republic 89.9%
Palestine 84.7%
Yemen 72.4%
Turkmenistan 71.8%
Micronesia 56.3%
Madagascar 55.0%
Belarus 53.2%
Rwanda 51.7%
Kiribati 48.4%
Equatorial Guinea 47.6%
Afghanistan 44.4%
South Sudan 43.4%
Guyana 42.3%
Guinea 37.0%
Angola 36.8%
Cape Verde 35.9%
Tajikistan 35.6%
Zimbabwe 34.7%
Benin 34.4%
Togo 33.8%
Ghana 33.0%
Sierra Leone 31.7%
Antigua and Barbuda 30.2%
Vanuatu 30.1%
Lesotho 30.0%
Syria 29.6%
Moldova 29.4%
Saint Kitts and Nevis 28.9%
Mozambique 28.8%
Sudan 28.4%
Palau 28.3%
Grenada 28.1%
Tanzania 27.6%
Uganda 27.5%
Niger 27.5%
Gabon 27.5%
Haiti 27.4%
Suriname 27.4%
Tonga 27.3%
Liberia 27.0%
Namibia 26.7%
Swaziland 26.5%
The Gambia 26.3%
Saint Vincent and the Grenadines 26.3%
Dominica 26.3%
Somalia 26.1%
Cook Islands 26.0%
Zambia 25.9%
Barbados 25.7%
Armenia 25.5%
Algeria 25.4%
Papua New Guinea 25.2%
Jamaica 24.5%
Venezuela 24.2%
Ethiopia 24.1%
Uzbekistan 24.0%
El Salvador 23.5%
Honduras 23.1%
Nigeria 23.0%
Solomon Islands 22.8%
Caribbean Netherlands 22.7%
Botswana 22.3%
Anguilla 21.7%
Mauritania 20.6%
Saint Lucia 20.5%
Bosnia and Herzegovina 20.3%
Burundi 20.3%
Ecuador 20.2%
Ukraine 20.1%
Trinidad and Tobago 20.0%

We were pleased to see the following countries come off the list from last year, having dropped below the 20% threshold: Azerbaijan, Bangladesh, Belize, Burkina Faso, Cameroon, Costa Rica, Côte d’Ivoire, DR Congo, Iraq, Kenya, Laos, Libya, Maldives, Mali, Mauritius, Mongolia, Nicaragua, Paraguay and Tunisia. While countries like Palestine, Suriname, Ethiopia, Haiti and Antigua and Barbuda are still on this list, they have improved the percentage of their samples on these outmoded technologies when compared to last year (dropping 10-15 points, respectively), 2G and 3G samples in Belarus increased 6.7 points when comparing Q3 2021 to Q3 2020.

We’re excited to see how performance levels will normalize as 5G expands to more and more countries and access improves. Keep track of how well your country is performing on Ookla’s Speedtest Global Index.

Ookla retains ownership of this article including all of the intellectual property rights, data, content graphs and analysis. This article may not be quoted, reproduced, distributed or published for any commercial purpose without prior consent. Members of the press and others using the findings in this article for non-commercial purposes are welcome to publicly share and link to report information with attribution to Ookla.

| June 3, 2020

Efficiently Design and Optimize Your Network with Crowdsourced Data (Webinar)

Mobile network operators are currently faced with a double challenge. With much of the globe still under stay-at-home orders, consumers are increasingly reliant on the quality and availability of their networks — and worldwide, operators are facing both budget cutbacks and logistical limitations on traditional data collection methods like walk-testing and drive-testing. Now more than ever, network planners and engineers must prioritize their decisions to have the maximum impact on customer experience with the minimum associated cost.

In Ookla’s upcoming webinar, we’ll show three real-world use cases where European operators can make low-cost or no-cost changes to their existing networks — without drive testing. By identifying competitors’ cell site locations and finding areas of high density and usage where competitor networks perform better, operators can use the crowdsourced data in Cell Analytics™ to prioritize improvements to their networks.

Read on to discover three ways operators can make smarter design and optimization decisions, and don’t miss the webinar on Wednesday, June 17, 2020 at 7am PDT / 10am EDT / 4pm CEST.


1. Identify populated areas where competitor networks outperform yours

Powered by hundreds of millions of signal measurements collected daily by Speedtest®, Cell Analytics provides intelligence about wireless service quality, RF measurements, data usage, user density (both indoors and outdoors), cell site locations and much more. By looking at areas with the highest user density and data usage, you can identify areas where people need a strong connection — and see where competitors provide better wireless service.

webinar-screenshot_LTE_RSRQ_Barcelona

In the above example, we can see signal quality for a given operator both in and around one of Barcelona’s most popular locations, La Sagrada Familia cathedral. By looking at real-world measurements, you can discover the highest-priority places to invest in capacity expansion or relatively simple fixes like antenna downtilt or network parameter changes.

2. Identify competitor cell sites and monitor new cell site deployments

Without visibility into your competitors’ network performance, quality and availability, it can be difficult to benchmark your own network metrics. Crowdsourced data provides actionable intelligence to assess your network performance inside and outside of buildings and to compare your network to competitors’. Use the Cell Site Finder tool in Cell Analytics to discover the location of competitor cell sites, analyze your performance vs. competing networks and identify opportunities for potential collocation or new deployments.

webinar-screenshot_LTE_RSRP_London

In the above example, we have cross-referenced the location of various network operators’ cell sites with RSRP in two busy shopping locations near London’s Wembley Stadium. From this, we can see the location of all cell sites in the area and a precise view of the service they are delivering. By viewing the coverage of individual competitor sites, you can avoid costly errors that result from relying on RF prediction tools alone during new cell site design.

3. Identify ways to make low-cost improvements to your existing network

Once you’ve prioritized the areas where improvements are most needed, dig into our data to see why users might be experiencing poor network performance and low data quality. To troubleshoot the underlying issues, you can analyze serving cells and band usage in high resolution and then look at the relation between RF conditions and service indicators like throughput, latency and jitter.

webinar-screenshot_LTE_RSRQ_Dublin

By comparing one operator’s RSRQ with downlink throughput in Dublin’s busiest railway station, we can pinpoint the exact sites that need adjustment to increase the quality of service for this operator. This type of data shows you where a relatively easy fix like antenna azimuth or downtilt changes might help.

To see in-depth recommendations for the operators in the above scenarios, don’t miss the webinar on June 17. If you cannot make the presentation, you can register to receive a video recording after the live event. We look forward to showing you how to leverage real-world data to make better network decisions and answering any questions you may have. Register now.

Ookla retains ownership of this article including all of the intellectual property rights, data, content graphs and analysis. This article may not be quoted, reproduced, distributed or published for any commercial purpose without prior consent. Members of the press and others using the findings in this article for non-commercial purposes are welcome to publicly share and link to report information with attribution to Ookla.

| December 10, 2020

Massive Expansions and Huge Improvements in Speed: The Worldwide Growth of 5G in 2020

The rapid expansion of 5G in countries across the globe was a bright spot in a year that needed one. But just how great is the news? We examined Speedtest Intelligence® data from over 60.5 million Speedtest® results during Q3 2020 to see how much speeds have improved, where download speeds are the fastest at the country and capital level, where 5G deployments have increased and what worldwide 5G coverage looks like now. We also looked at countries where 5G doesn’t yet reach to understand where good news might be on the horizon.

We have only included countries with commercially available 5G on these lists in order to provide a more accurate view of the performance consumers can reasonably expect. While our data shows results for many countries where 5G is not yet commercially available, these tests are likely results from engineers testing their own networks. In addition, we’re only providing analysis for countries with more than 200 samples during Q3 2020. The bars shown in our charts are 95% confidence intervals, which represent the range of values in which the true value is likely to be. Countries marked in tables with an asterisk first launched 5G commercially in 2020.

5G downloads were 954% faster than 4G at the global level

The worldwide median download speed over 5G was 954% faster than that over 4G during Q3 2020. Median upload speed over 5G was 311% faster than that over 4G. Consumers are eagerly adopting the new technology and many have wanted to measure the full throughput capacity of their network connection. In Q3 2020 alone, there were 4,324,788 Speedtest results over 5G.
Median-Speeds-Worldwide_1220-1

United Arab Emirates had the fastest 5G

United Arab Emirates topped the list of countries with the fastest top 10% 5G download speed in Q3 2020. Top 10% (or 90th percentile) measures the speeds seen by the fastest 10% of users and is a way to gauge what each country’s networks are capable of. Saudi Arabia was second for top 10% 5G download speed, Norway third, Spain fourth and Japan fifth.
Fastest-Countries-Top-5G-Download-Speed_1220-2

Another way to measure 5G performance is to look at median 5G download speed, which is a better predictor of the kind of performance most 5G customers can expect. Norway was the country with the fastest median download speed over 5G during Q3 2020. U.A.E. was second in this category, South Africa third, Saudi Arabia fourth and Spain fifth.
Fastest-Countries-Median-5G-Download-Speed_1220-2

It’s notable that Japan was on the list of 10 countries with the fastest top 10% 5G download speed but not on the list of 10 countries with the fastest median download speed over 5G. No matter how fast a country’s mobile infrastructure is, many other factors go into median 5G speeds, including device adoption and spectrum allocation.

Abu Dhabi tops list of 5G speeds in world capitals

Our examination of 5G performance for 18 world capital cities with 5G during Q3 2020 found that Abu Dhabi had the fastest median download speed over 5G at 546.81 Mbps. Riyadh was second, Madrid third, Seoul fourth and Kuwait City fifth. As we saw at the country level, median upload speed was much lower than download speed.
Median-5G-Performance-Capitals_1220-2

How 5G performance and time spent compare within regions

We looked more closely at 5G performance across several intergovernmental organizations and trade blocs to get a better sense of how countries are performing in comparison to their neighbors and trade partners. We also calculated Time Spent on 5G, the proportion of time that users with 5G-capable devices spent on 5G, for each country.

Italy had the fastest 5G among G7 countries, U.S. the slowest

Italy had the fastest median download speed over 5G of all the G7 countries. Japan was second, Canada third, the U.K. fourth and Germany fifth. The U.S. had the highest Time Spent on 5G, followed by Canada. For a deeper analysis of 5G in the U.K., read our previous coverage. Because France launched commercially available 5G only within the last couple of weeks, we have not included it on this table.
5G-Performance-G7-Countries_1220

South Africa was the only country in the African Union with sufficient 5G to rate

As we saw above, South Africa’s impressive median download speed over 5G ranked the country third in the world during Q3 2020. South Africa was only one of two countries in the African Union to have commercially available 5G during Q3 2020. The other, Madagascar, did not have sufficient samples to properly analyze. Time Spent on 5G in South Africa was very low, an indication that 5G is not yet widely available there.
5G-Performance-Africa_1220

South Korea had the fastest 5G in APEC countries, U.S. the slowest

A median download speed over 5G of 411.11 Mbps put South Korea comfortably at the top of Asia-Pacific Economic Cooperation (APEC) countries with the fastest 5G during Q3 2020. Thailand was second, Australia third, China fourth and Taiwan fifth. 5G speeds represented the largest improvement over 4G in the Philippines where the median download speed over 4G during Q3 2020 (9.36 Mbps) was substantially lower than that of other countries on this list.

South Korea and the U.S. tied for highest Time Spent on 5G among APEC countries during Q3 2020, followed by Hong Kong and Taiwan.
5G-Performance-APEC_1220

Spain had the fastest 5G in the E.U., Poland the slowest

Spain showed the fastest median download speed over 5G among the 11 European Union (E.U.) countries with sufficient 5G samples to rank during Q3 2020. Hungary was second, Finland third, Romania fourth and Ireland fifth. Spain’s median download speed over 5G also represented the largest gain over 4G among all of these countries, partially because Spain had the second slowest median download speed over 4G. France is not included on this list because 5G did not become commercially available in the country until after Q3 2020.

The Netherlands had the highest Time Spent on 5G among E.U. countries during Q3 2020, indicating that customers with 5G phones are able to spend far more time on 5G there than in other E.U. countries. Denmark was second for Time Spent on 5G among EU countries in Q3 2020 and Finland third.
5G-Performance-EU_1220

U.A.E had the fastest 5G in Gulf Cooperation Council Countries

With the second fastest median download speed over 5G in the world, U.A.E. was also the Gulf Cooperation Council (GCC) country with the fastest 5G during Q3 2020. Saudi Arabia was second and Qatar third. While Oman does have commercially available 5G, there were insufficient samples in the country during Q3 2020 to properly analyze performance.

5G represented the largest improvement over 4G in Kuwait and Bahrain, countries that had slower median download speeds over 4G than their neighbors.

Time Spent on 5G was relatively high in all the GCC countries on this list, except Bahrain, when compared to other countries in the world during Q3 2020. Qatar showed the highest Time Spent on 5G among GCC countries in Q3 2020 at 16.0%. U.A.E. was second and Saudi Arabia third.
5G-Performance-GCC_1220

Brazil was the only MERCOSUR country with sufficient 5G to rate

Brazil’s median download speed over 5G of 84.60 Mbps during Q3 2020 may not seem fast for 5G, but it still puts Brazil well ahead of other countries in the Southern Common Market (MERCOSUR), most of which do not yet have 5G at all. We did see 5G results in Colombia, but there were insufficient samples to properly compare.

Time Spent on 5G in Brazil during Q3 2020 was not quite one percent, indicating that customers do not have much access to 5G yet.
5G-Performance-MERCOSUR_1220

The U.S., Europe and Asia see widespread 5G coverage

Data from Cell Analytics™ shows a global view of 5G coverage in Q3 2020. This map, based on 5G connectivity data for opted-in Speedtest users, shows that 5G is spreading rapidly across the U.S., Europe, the Arabian Peninsula and Asia. In other regions, 5G is primarily available in larger cities, if at all.
Global-5G-Coverage_1220

99 countries worldwide had 5G, in 14,643 total cities

The number of countries with 5G deployments increased 62.3% between Q3 2019 and Q3 2020, with 99 countries having 5G deployments at the end of Q3 2020, according to the Ookla 5G Map™. There were 14,643 cities worldwide with 5G deployments at the end of Q3 2020, a 1,671% increase over Q3 2019. The total number of deployments worldwide was 17,046. The counts here and throughout this section include commercially available 5G as well as 5G networks with limited availability and those in pre-release.

Countries with the Most 5G Cities
Ookla 5G Map™ | Q3 2020
Country Numbers of Cities with 5G
United States 7,583
Germany 2,312
Austria 1,104
Netherlands* 1,009
Switzerland 554
Thailand* 325
Ireland 214
Puerto Rico 187
United Kingdom 169
Kuwait 97

The U.S. had the most cities with 5G deployments at the end of Q3 2020 with 7,583. Germany was second, Austria third, the Netherlands fourth and Switzerland fifth. A deployment is when a provider has some level of 5G presence in a city. A city can have multiple deployments when more than one provider is present.

Countries with the Largest Growth in Number of Deployments
Ookla 5G Map™ | Q3 2020
Country 5G Deployments as of Q3 2020 % Change Q3 2020 vs Q3 2019
Netherlands* 1,071 50,350%
Thailand* 451 32,401%
United States 7,808 21,566%
Germany 2,417 11,460%
Canada* 93 7,600%
Austria 1,173 4,918%
Ireland 236 4,180%
Poland 81 3,150%
Japan* 75 2,050%
Oman 50 2,000%

The Netherlands showed the largest percentage change in the number of 5G deployments between Q3 2019 and Q3 2020 with a 50,350% jump from two deployments in Q3 2019 to 1,071 in Q3 2020. Thailand saw the second largest percentage increase, the U.S. third, Germany fourth and Canada fifth.

Most early trials and commercial deployments of 5G spectrum allocations around the world have been centered around fallow swaths of the mid-band (3.3 GHz – 4.2 GHz) spectrum. With the recent commercialization of Dynamic Spectrum Sharing (DSS) across all major 5G infrastructure vendors, there is now increasing demand for 5G support on many existing 4G frequencies, ranging from 600 MHz to 2.5 GHz. In unique 5G markets like Japan, there is an additional need for the 4.5 GHz band as well as the millimeter wave (FR2).

In the United States, early deployments leveraged millimeter wave frequency bands in the 28 GHz and the 39 GHz, which delivered impressive speeds in a very constrained footprint. The rapid 5G deployment in the 600 MHz band has added a substantial nationwide 5G footprint — and with that, much wider 5G availability for many more Americans. With the recent merger between T-Mobile and Sprint, the deployment of 2.5 GHz spectrum has been significantly accelerated, which should improve both network efficiency and user experience on T-Mobile’s network. Additionally, next year’s availability of 5G Carrier Aggregation will allow T-Mobile to combine 600 MHz with 2.5 GHz to deliver improved 5G speeds on top of the existing nationwide footprint. In addition, DSS has recently been deployed by AT&T and Verizon, which allows operators to choose from existing low-band spectrum assets (850 MHz) and deliver both LTE and 5G at the same time. This feature alone doesn’t add a significant boost in perceived user experience, but will certainly improve the 5G footprint.

China showed the highest percentage of 5G test samples

Another way to measure 5G adoption is to look at the proportion of samples taken over 5G relative to the total number of samples on all technologies. Speedtest Intelligence is uniquely positioned to measure global growth in 5G because of the worldwide adoption of Speedtest apps. China had the highest percentage of 5G Speedtest results compared to other mobile technology types in Q3 2020 at 18.9%. South Korea was second, Hong Kong third, Puerto Rico fourth and Qatar fifth.

Countries with the Most 5G
Speedtest Intelligence® | Q3 2020
Country 5G Samples as a % of Total
China 18.9%
South Korea 15.8%
Hong Kong (S.A.R.)* 7.9%
Puerto Rico 6.7%
Qatar 5.7%
United States 5.5%
Netherlands* 4.9%
United Arab Emirates 4.6%
Kuwait 4.6%
Australia 4.2%

What 5G will look like in 2021

With recently announced device chipset advancements expected in 2021, including 5G Carrier Aggregation, operators will be able to combine two 5G frequency bands in the sub-6GHz (FR1) range, allowing not only faster speeds, but also greater coverage. More importantly, the ability to combine Frequency Division Duplexing (FDD) and Time Division Duplexing (TDD) FR1 channels will enable operators to leverage low-band frequencies (sub-1GHz) for uplink transmissions (user device to cell site), while combining the low-band with the mid-band (2.5 GHz, 3.5 GHz) on the downlink. This should significantly expand the availability of fast 5G download speeds across larger geographies.

Similarly, DSS — which is a stepping stone to standalone 5G and allows for the simultaneous delivery of 4G and 5G technology on the same spectrum slice — will enable operators to combine already-deployed FDD spectrum with dedicated mid-band spectrum for an enhanced standalone 5G experience. This will unlock the full potential of 5G networks, such as ultra low latency and network slicing, while delivering an improved mobile experience to users.

Where 5G fails to reach

During Q3 2020 Speedtest Intelligence showed 55 countries in the world (with more than 200 samples) where more than 20% of samples were from 2G and 3G connections (combined). These are countries where, in many cases, 5G is still aspirational. As excited as we are about the expansion of 5G, we do not want to see these countries left behind.

Countries That Still Rely Heavily on 2G and 3G Connections
Speedtest Intelligence® | Q3 2020
Country 2G & 3G Samples 4G Samples
Turkmenistan 74.9% 25.1%
Rwanda 52.3% 47.7%
Iraq 49.4% 50.6%
Belarus 46.5% 53.5%
Afghanistan 46.0% 54.0%
Antigua and Barbuda 40.2% 59.8%
Tajikistan 40.2% 59.8%
Suriname 39.7% 60.3%
Haiti 37.7% 62.3%
Syria 37.5% 62.5%
Ghana 36.0% 64.0%
Ethiopia 35.0% 65.0%
Mozambique 34.7% 65.3%
Benin 34.3% 65.7%
Angola 34.1% 65.9%
El Salvador 32.5% 67.5%
Moldova 31.8% 68.2%
Venezuela 30.3% 69.7%
Tanzania 30.0% 70.0%
Papua New Guinea 29.5% 70.5%
Jamaica 29.4% 70.6%
Sudan 29.2% 70.8%
Algeria 29.0% 71.0%
Namibia 28.5% 71.5%
Zimbabwe 28.5% 71.5%
Somalia 28.4% 71.6%
Nicaragua 28.1% 71.9%
Armenia 28.1% 71.9%
Bosnia and Herzegovina 28.1% 71.9%
Uzbekistan 27.8% 72.2%
Cameroon 27.5% 72.5%
Zambia 27.4% 72.6%
Uganda 26.6% 73.4%
Trinidad and Tobago 26.6% 73.4%
Honduras 26.5% 73.5%
Bangladesh 26.3% 73.7%
Burkina Faso 26.0% 74.0%
Ukraine 25.8% 74.2%
Nigeria 25.7% 74.3%
DR Congo 24.6% 75.4%
Costa Rica 24.3% 75.7%
Botswana 24.1% 75.9%
Libya 22.9% 77.1%
Azerbaijan 22.9% 77.1%
Ecuador 22.8% 77.2%
Mali 22.4% 77.6%
Mongolia 21.8% 78.2%
Maldives 21.6% 78.4%
Mauritius 21.3% 78.7%
Tunisia 21.0% 79.0%
Belize 20.7% 79.3%
Laos 20.5% 79.5%
Kenya 20.3% 79.7%
Paraguay 20.1% 79.9%
Côte d’Ivoire 20.0% 80.0%

In markets where 4G layers haven’t been deployed or substantially covered, end users fall back to the circuit-switched network (2G, 3G). These decades-old network technologies should be sufficient for basic voice and texting, social media, and navigation apps, but cannot deliver rich media experiences or video calling. Unfortunately, many countries on this list are places where consumers rely primarily on mobile phones for their internet connectivity.

5G is radically changing the speeds and capabilities of mobile networks around the world. If the current growth rate continues, it won’t be long before most nations have access to 5G. But there are nations and subsets of subscribers who may not see the benefits of 5G for years to come. We will continue reporting on 5G achievements across the globe and watching speeds in general on the Speedtest Global Index™.

Ookla retains ownership of this article including all of the intellectual property rights, data, content graphs and analysis. This article may not be quoted, reproduced, distributed or published for any commercial purpose without prior consent. Members of the press and others using the findings in this article for non-commercial purposes are welcome to publicly share and link to report information with attribution to Ookla.