| April 14, 2020

Can’t Connect? The Most Significant Online Service Outages in Q1 2020

“We’re experiencing problems at the moment” became an all-too-familiar phrase during the first three months of 2020. As we continue with our series of most significant outages across the globe, this article examines major web and online service outages from Q1 2020 using Downdetector® data. Outages came under increased scrutiny as COVID-19 spread and more people began working or studying from home, gaming, video conferencing and using more online services than ever before. However, we saw significant outages both before and after this time. The six categories of outages we’re highlighting here are: collaboration platforms, gaming, telecom operators, streaming services, social media and financial institutions.

Collaboration platforms

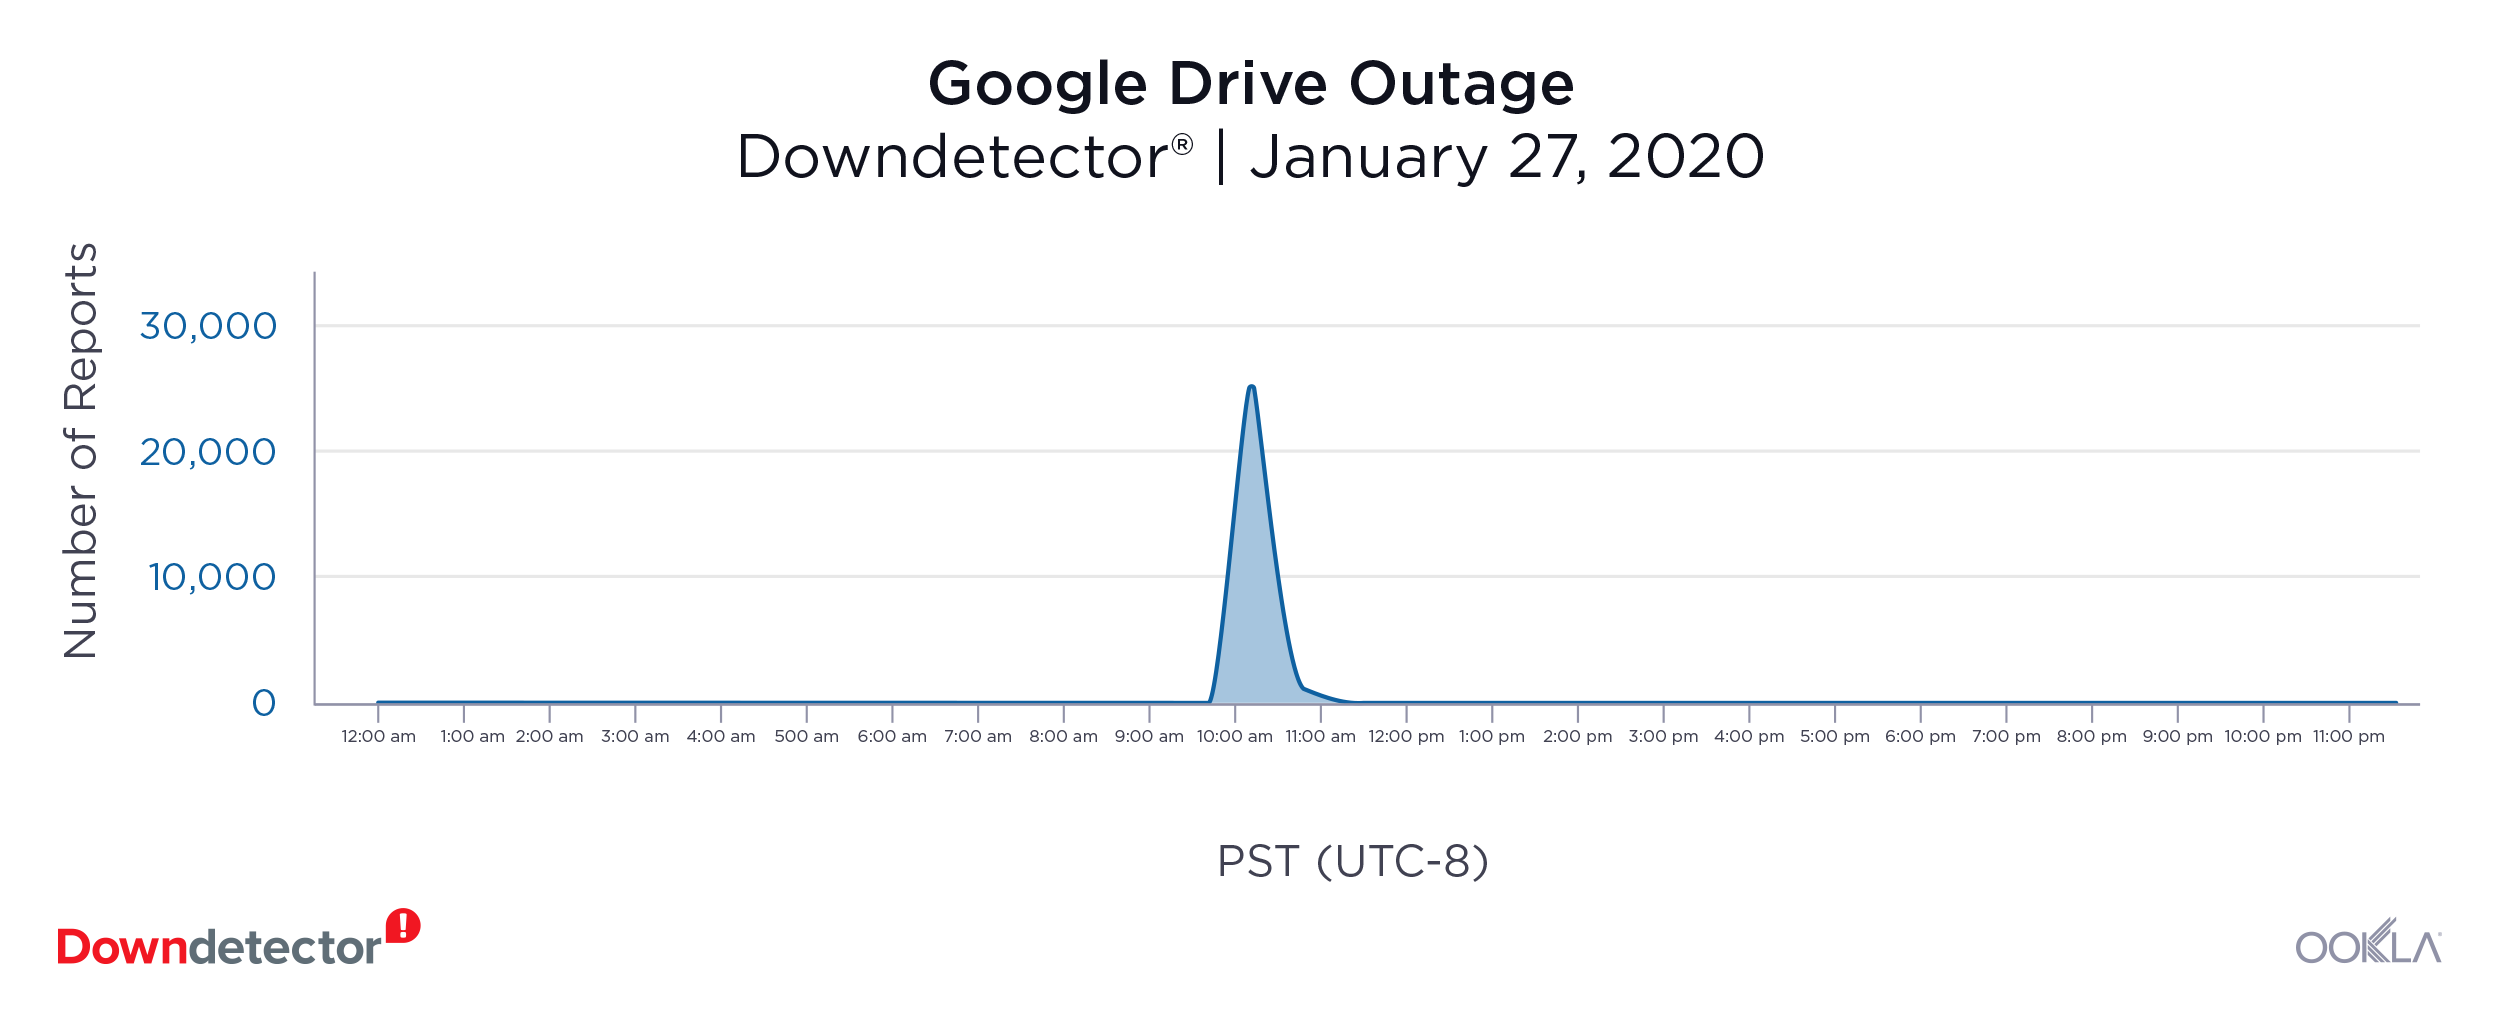
Google Drive (January 27, 2020): 24,558 outage reports at peak

1-Google-Drive-1
Users of Google’s popular file storage and synchronization service rushed to Downdetector when receiving the following error message: “Google Docs encountered an error. Please try reloading this page, or coming back to it in a few minutes.” on January 27. The outage reportedly lasted an hour and Downdetector received 24,558 reports during the peak fifteen minutes of the outage. Most reports originated from the US, but users also reported problems in Germany, Japan, Mexico, the Netherlands and the UK.

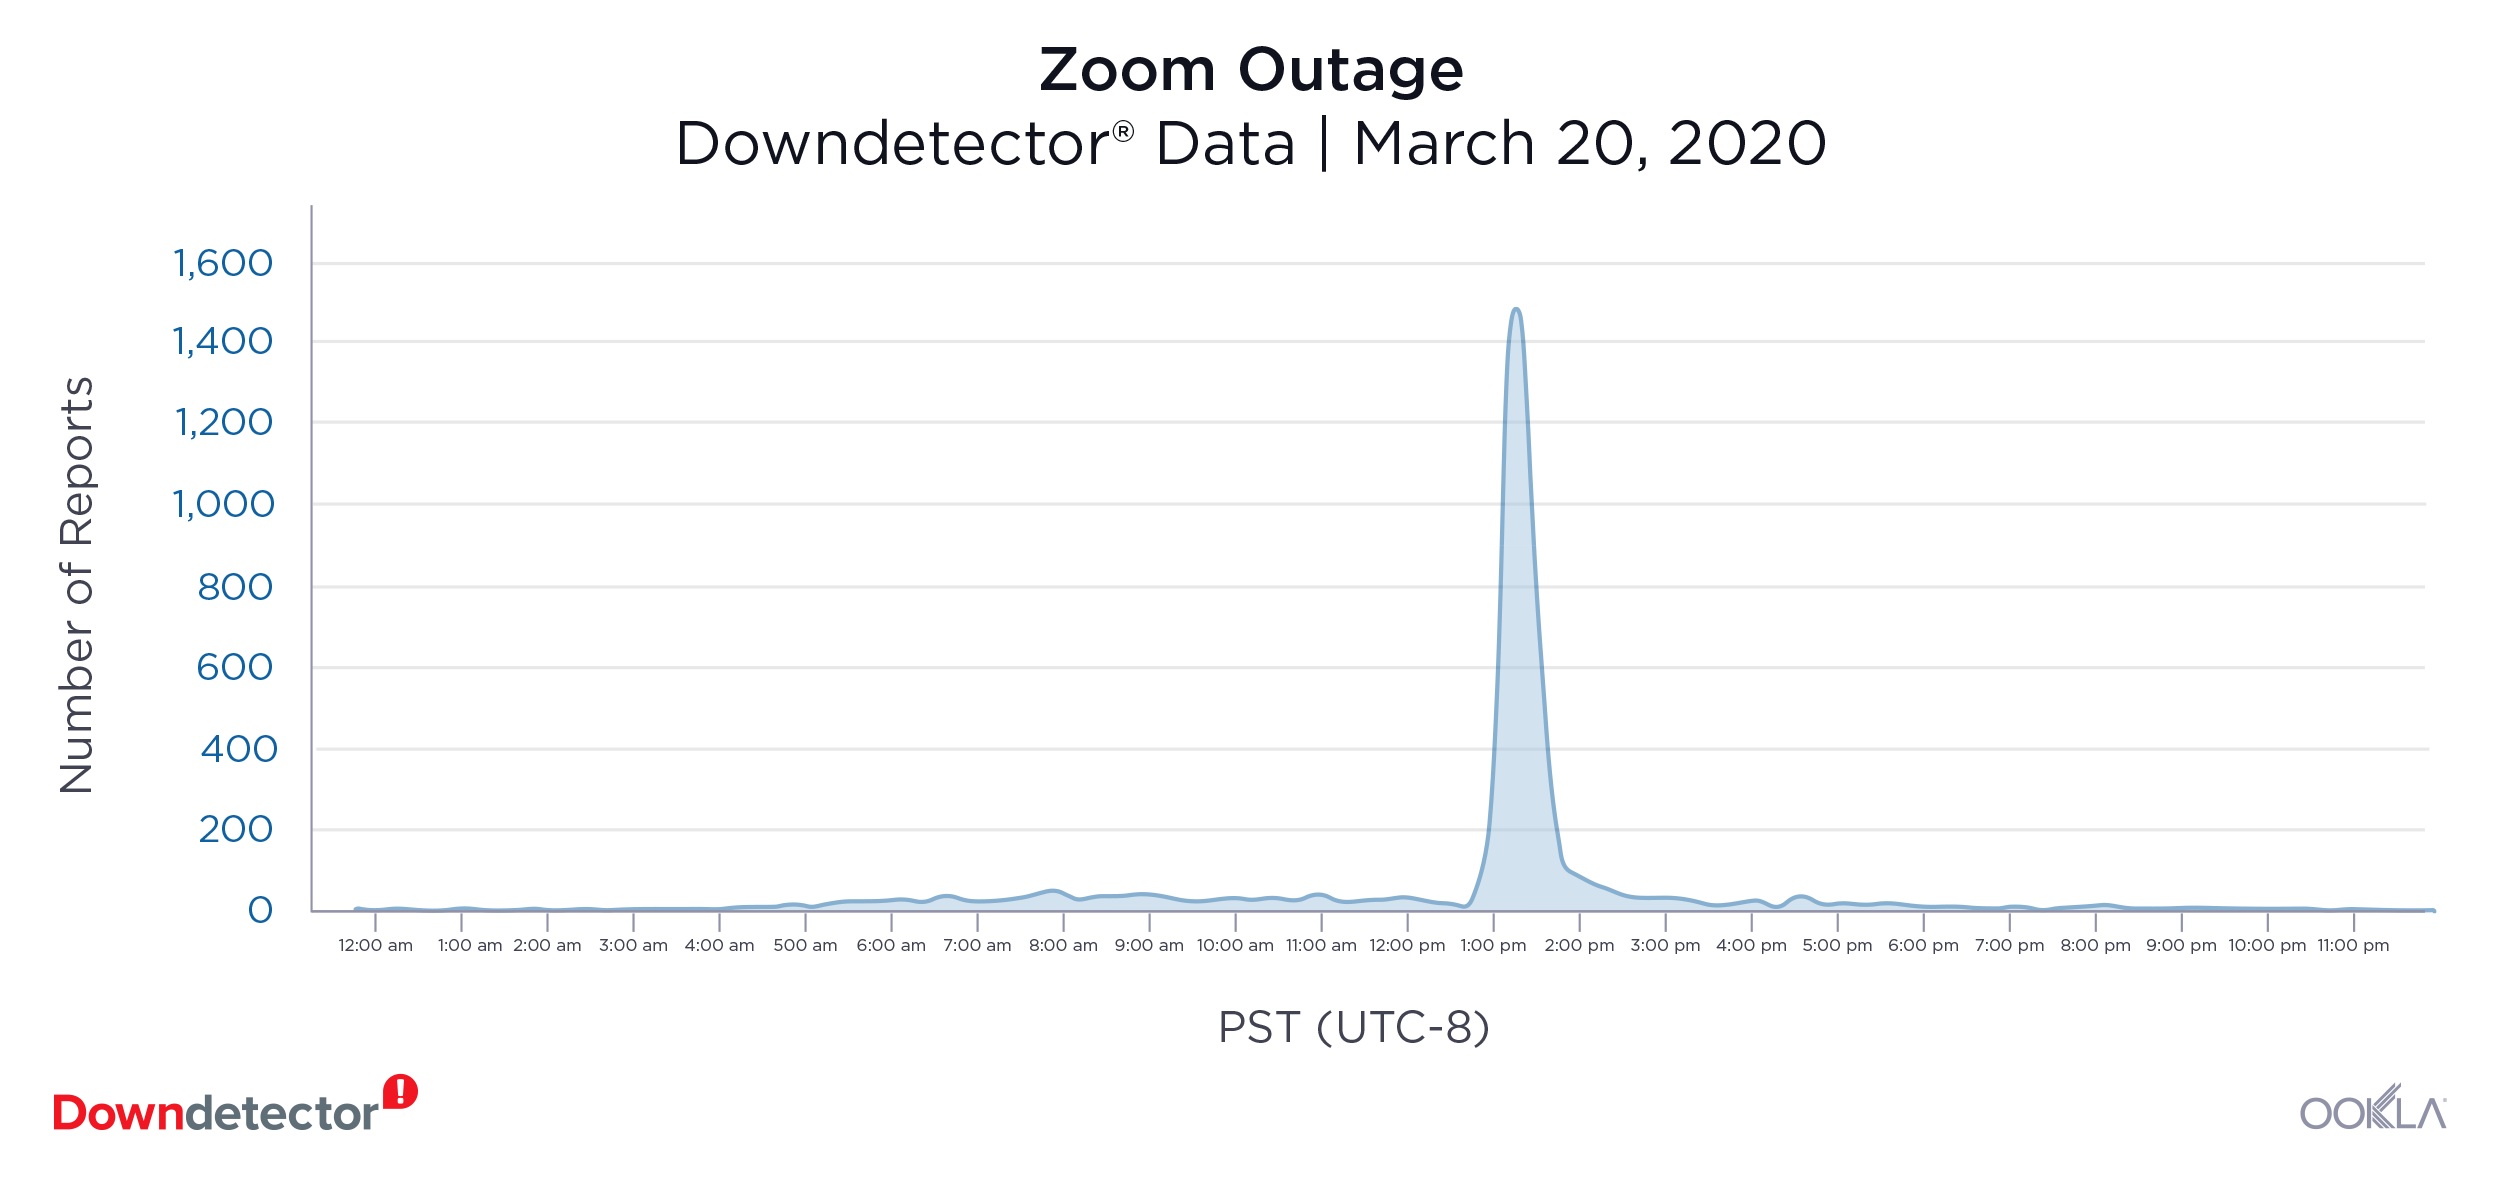
Zoom (March 20, 2020): 1,483 reports at peak

2-Zoom-1
Video conferencing software like Zoom has become an important tool to communicate. Amid an increase in volume, Zoom users, mostly in the U.S., reported an outage on March 20 that left people unable to access the service or make calls. The service also experienced a smaller outage on March 5 with 586 reports at the peak. Both outages lasted approximately two hours.

Microsoft Teams (March 16): Multiple outages

3-Teams
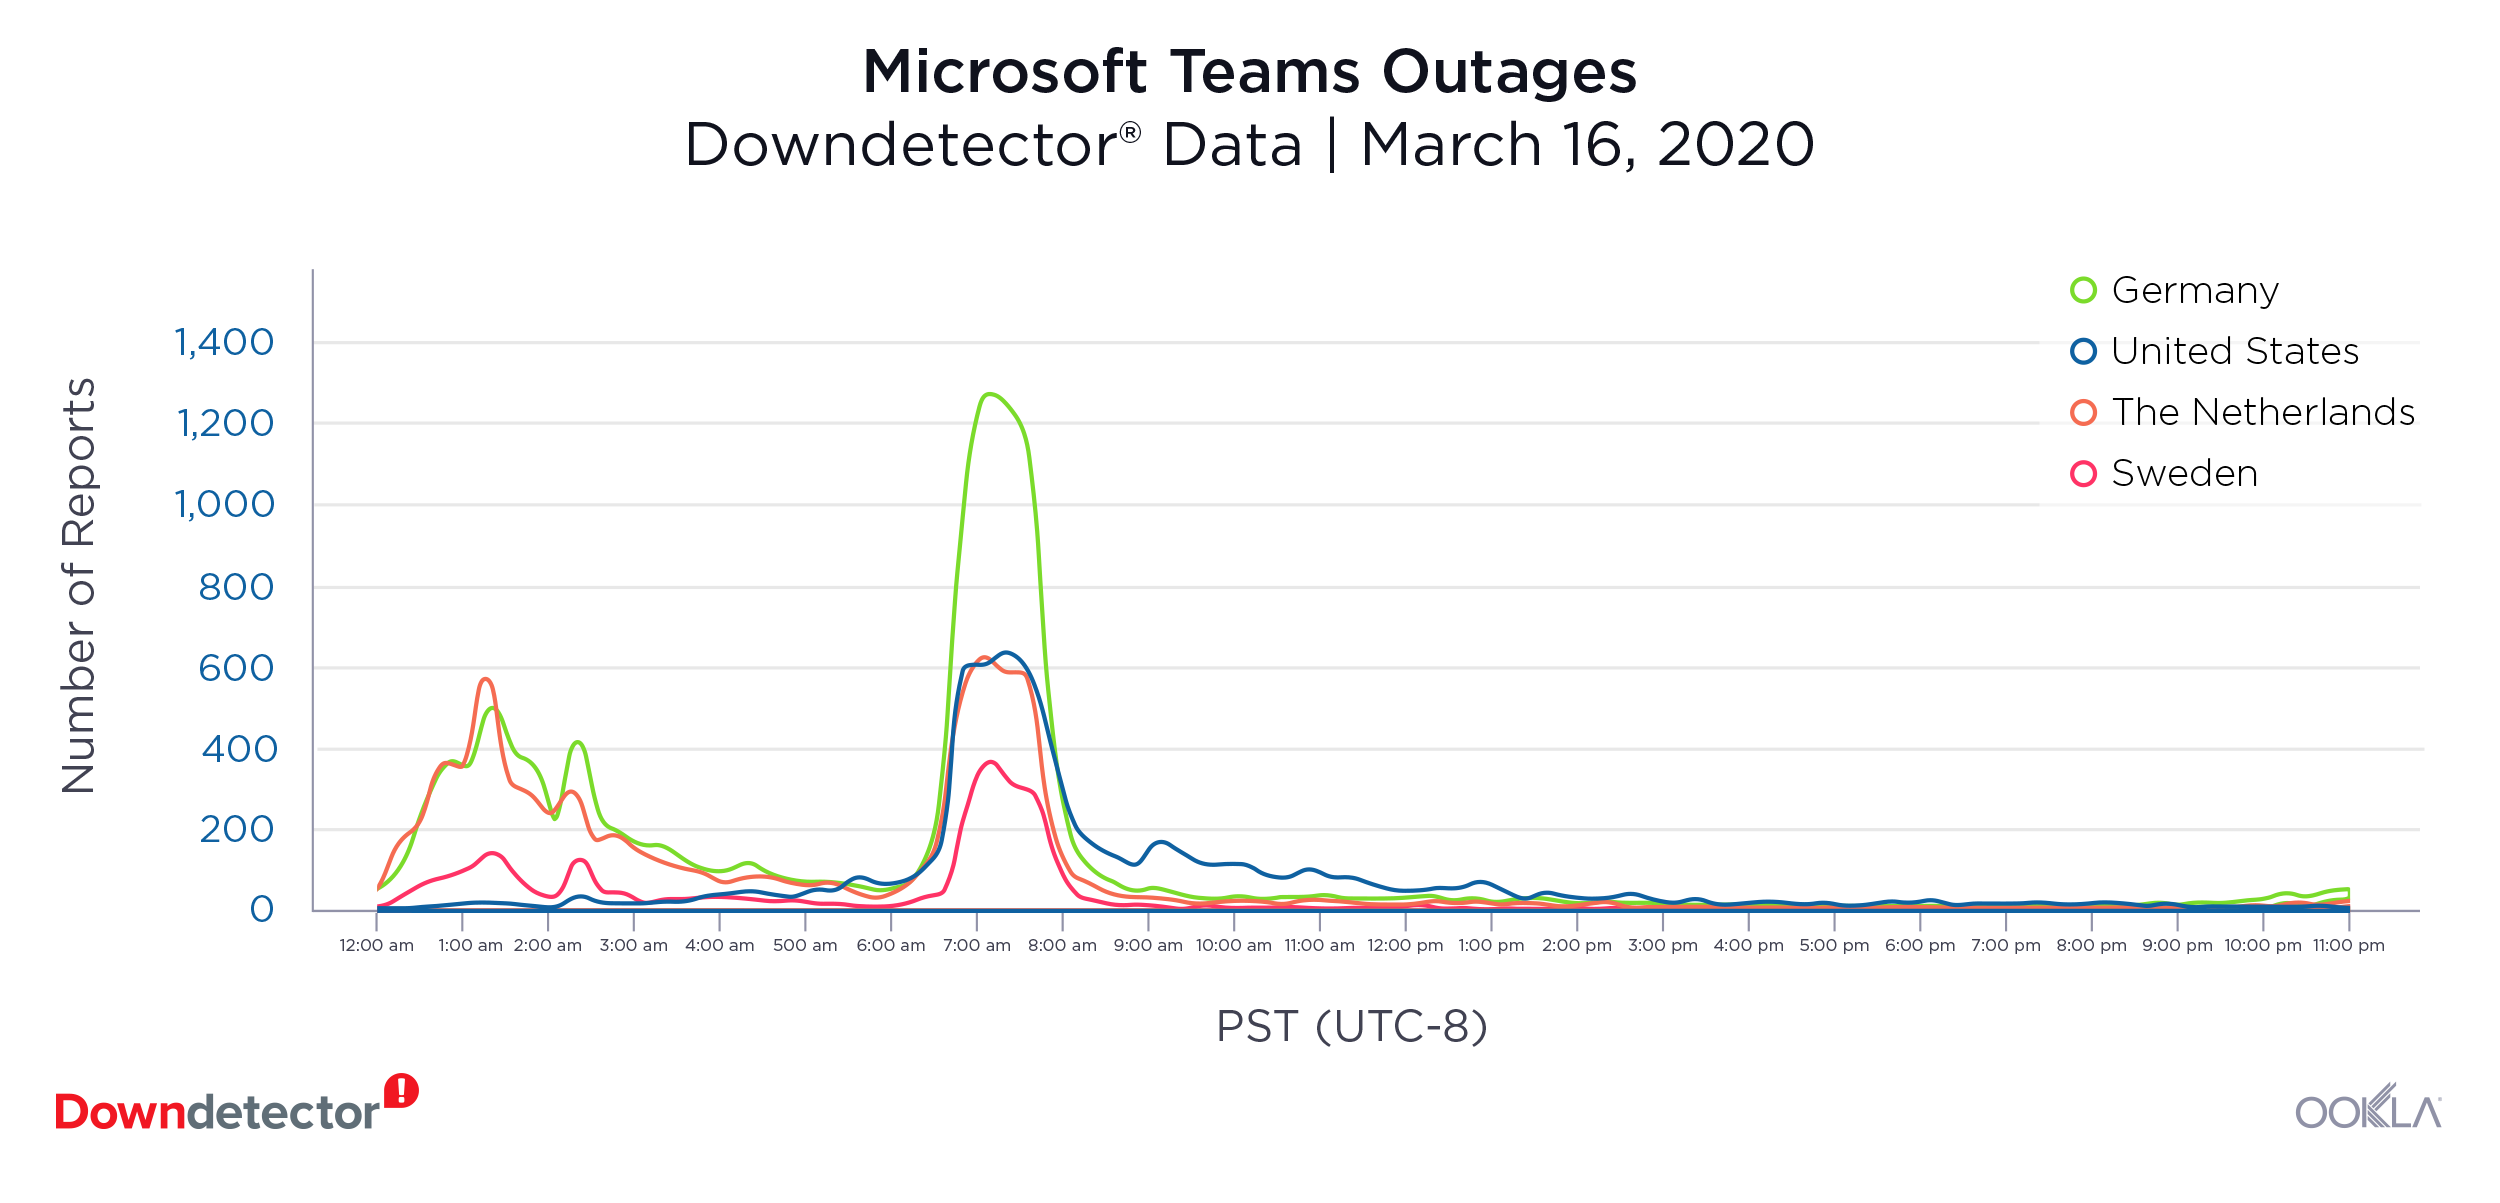
Microsoft Teams experienced a worldwide outage on March 16. The collaboration platform that streamlines communication in an organization was reportedly down for users in Germany, the Netherlands, Sweden and the U.S. The duration of the outage varied by country, but lasted more than six hours in most and recurred in the Netherlands for a period on March 17. Teams also experienced a significant outage over the span of five hours on February 2 when 9,386 users in the U.S. reported problems at the peak.

Gaming

Steam (multiple outages)

Steam-Bar-Outage-1
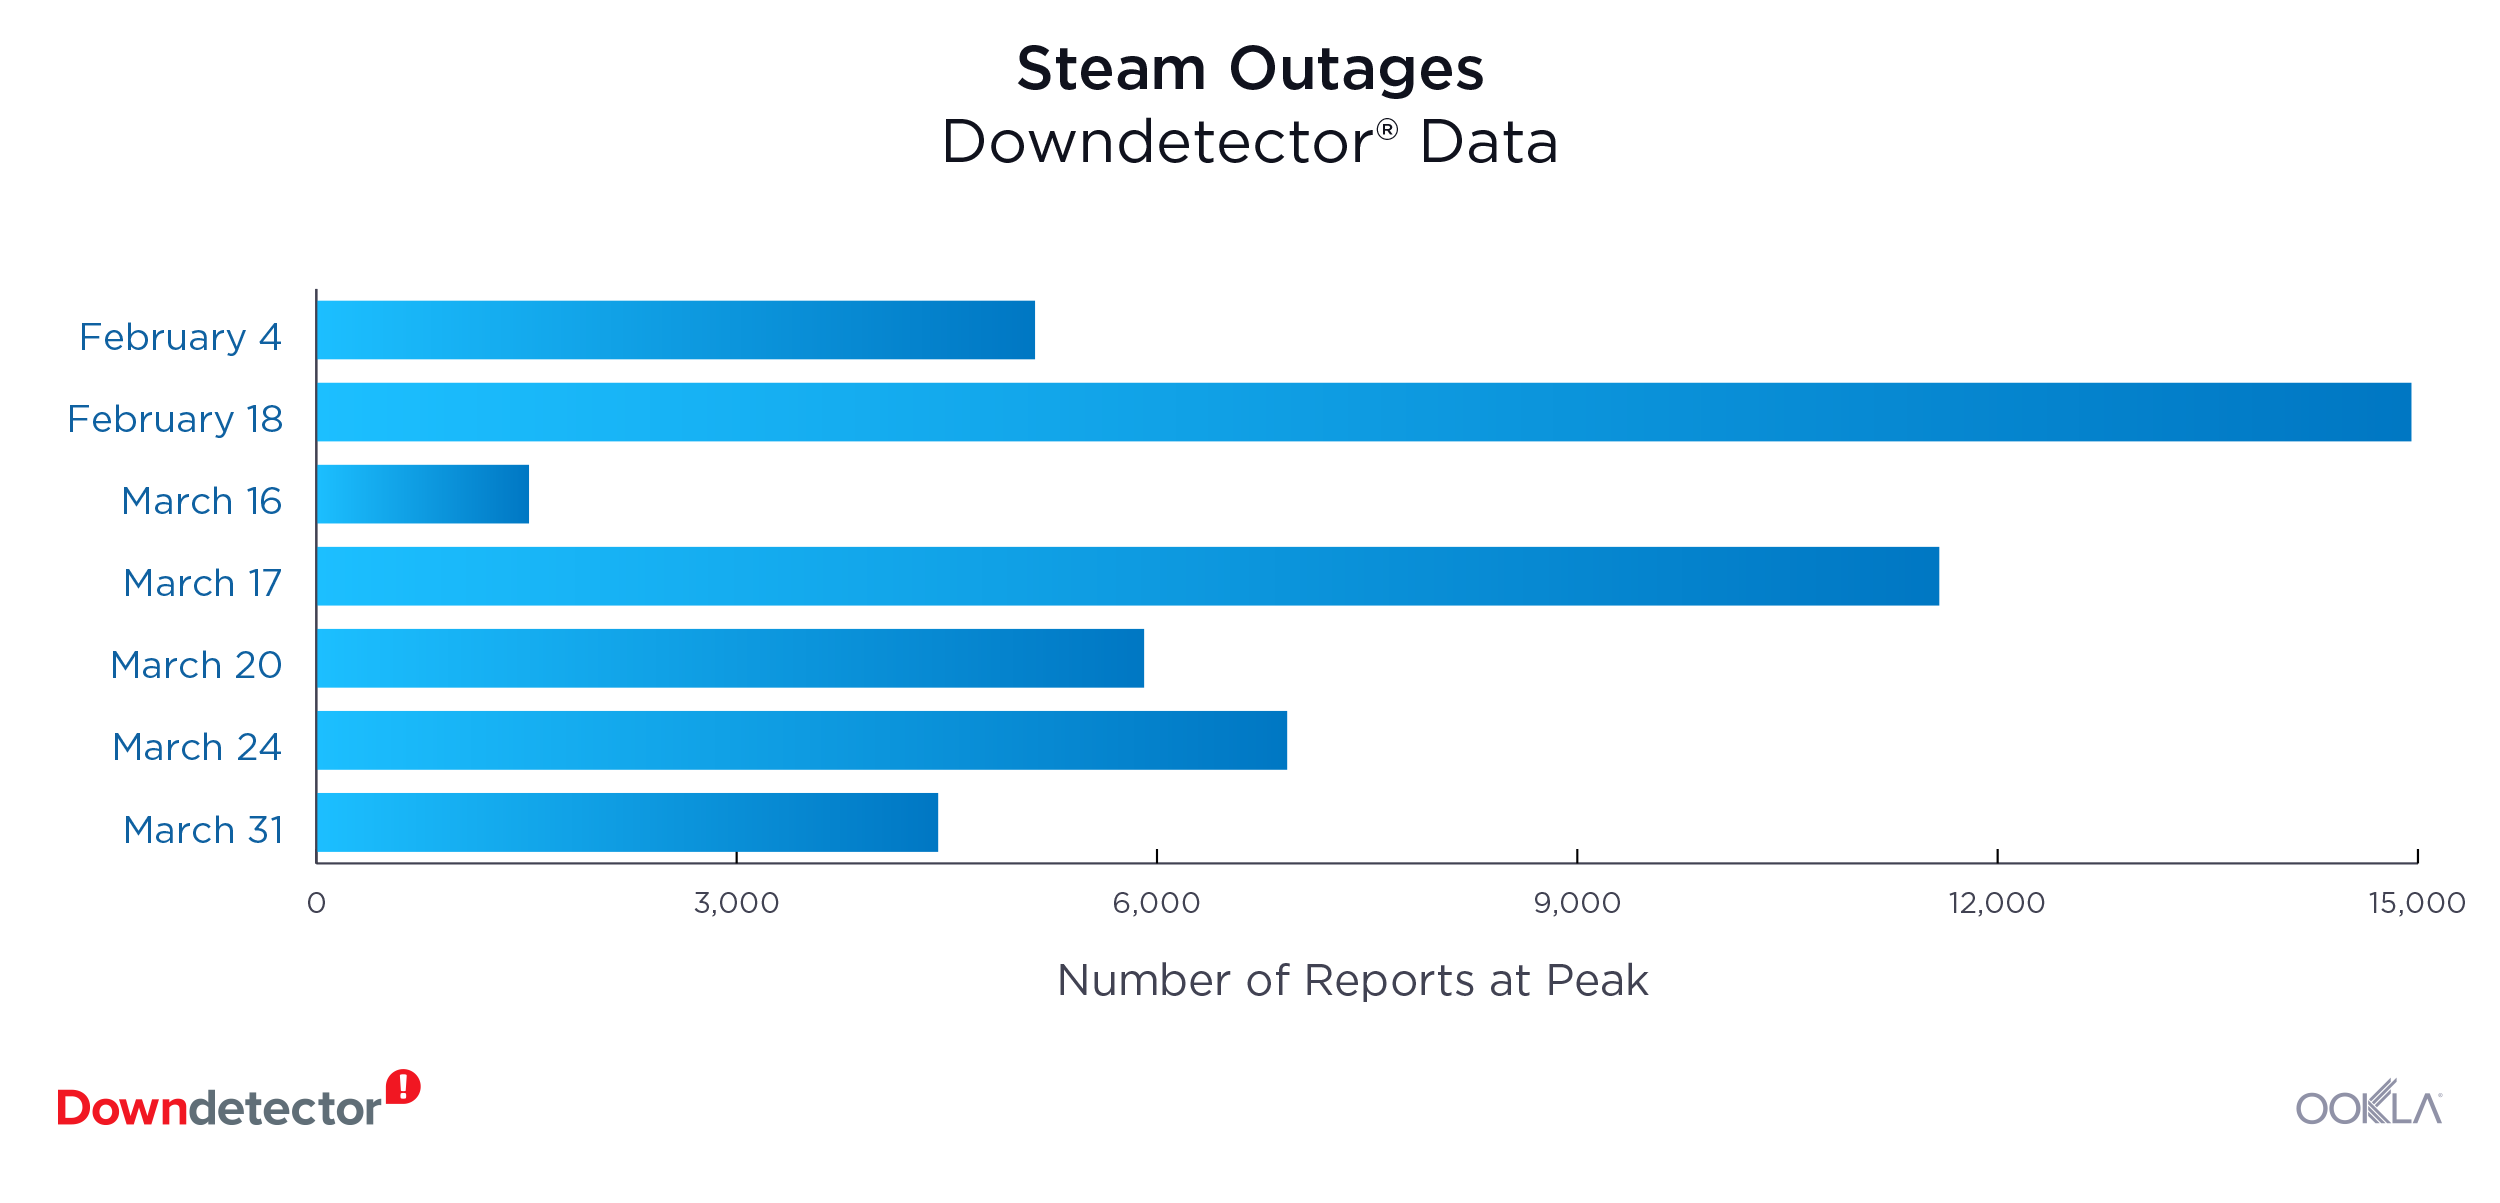
Steam suffered nine major outages during Q1 2020 (seven of which are pictured above), according to reports from users in Germany, the U.K. and the U.S. The largest outage took place on February 18 when the gaming platform was down for about three hours and 14,955 users reported issues at the peak of the outage. Steam users rushed to Downdetector again on March 17, which was Steam’s second largest outage with 11,585 reports at the peak of the outage. The two subsequent Tuesdays also proved problematic for Steam with 6,931 outages during the peak on March 24 and 4,440 outages during the March 31 peak.

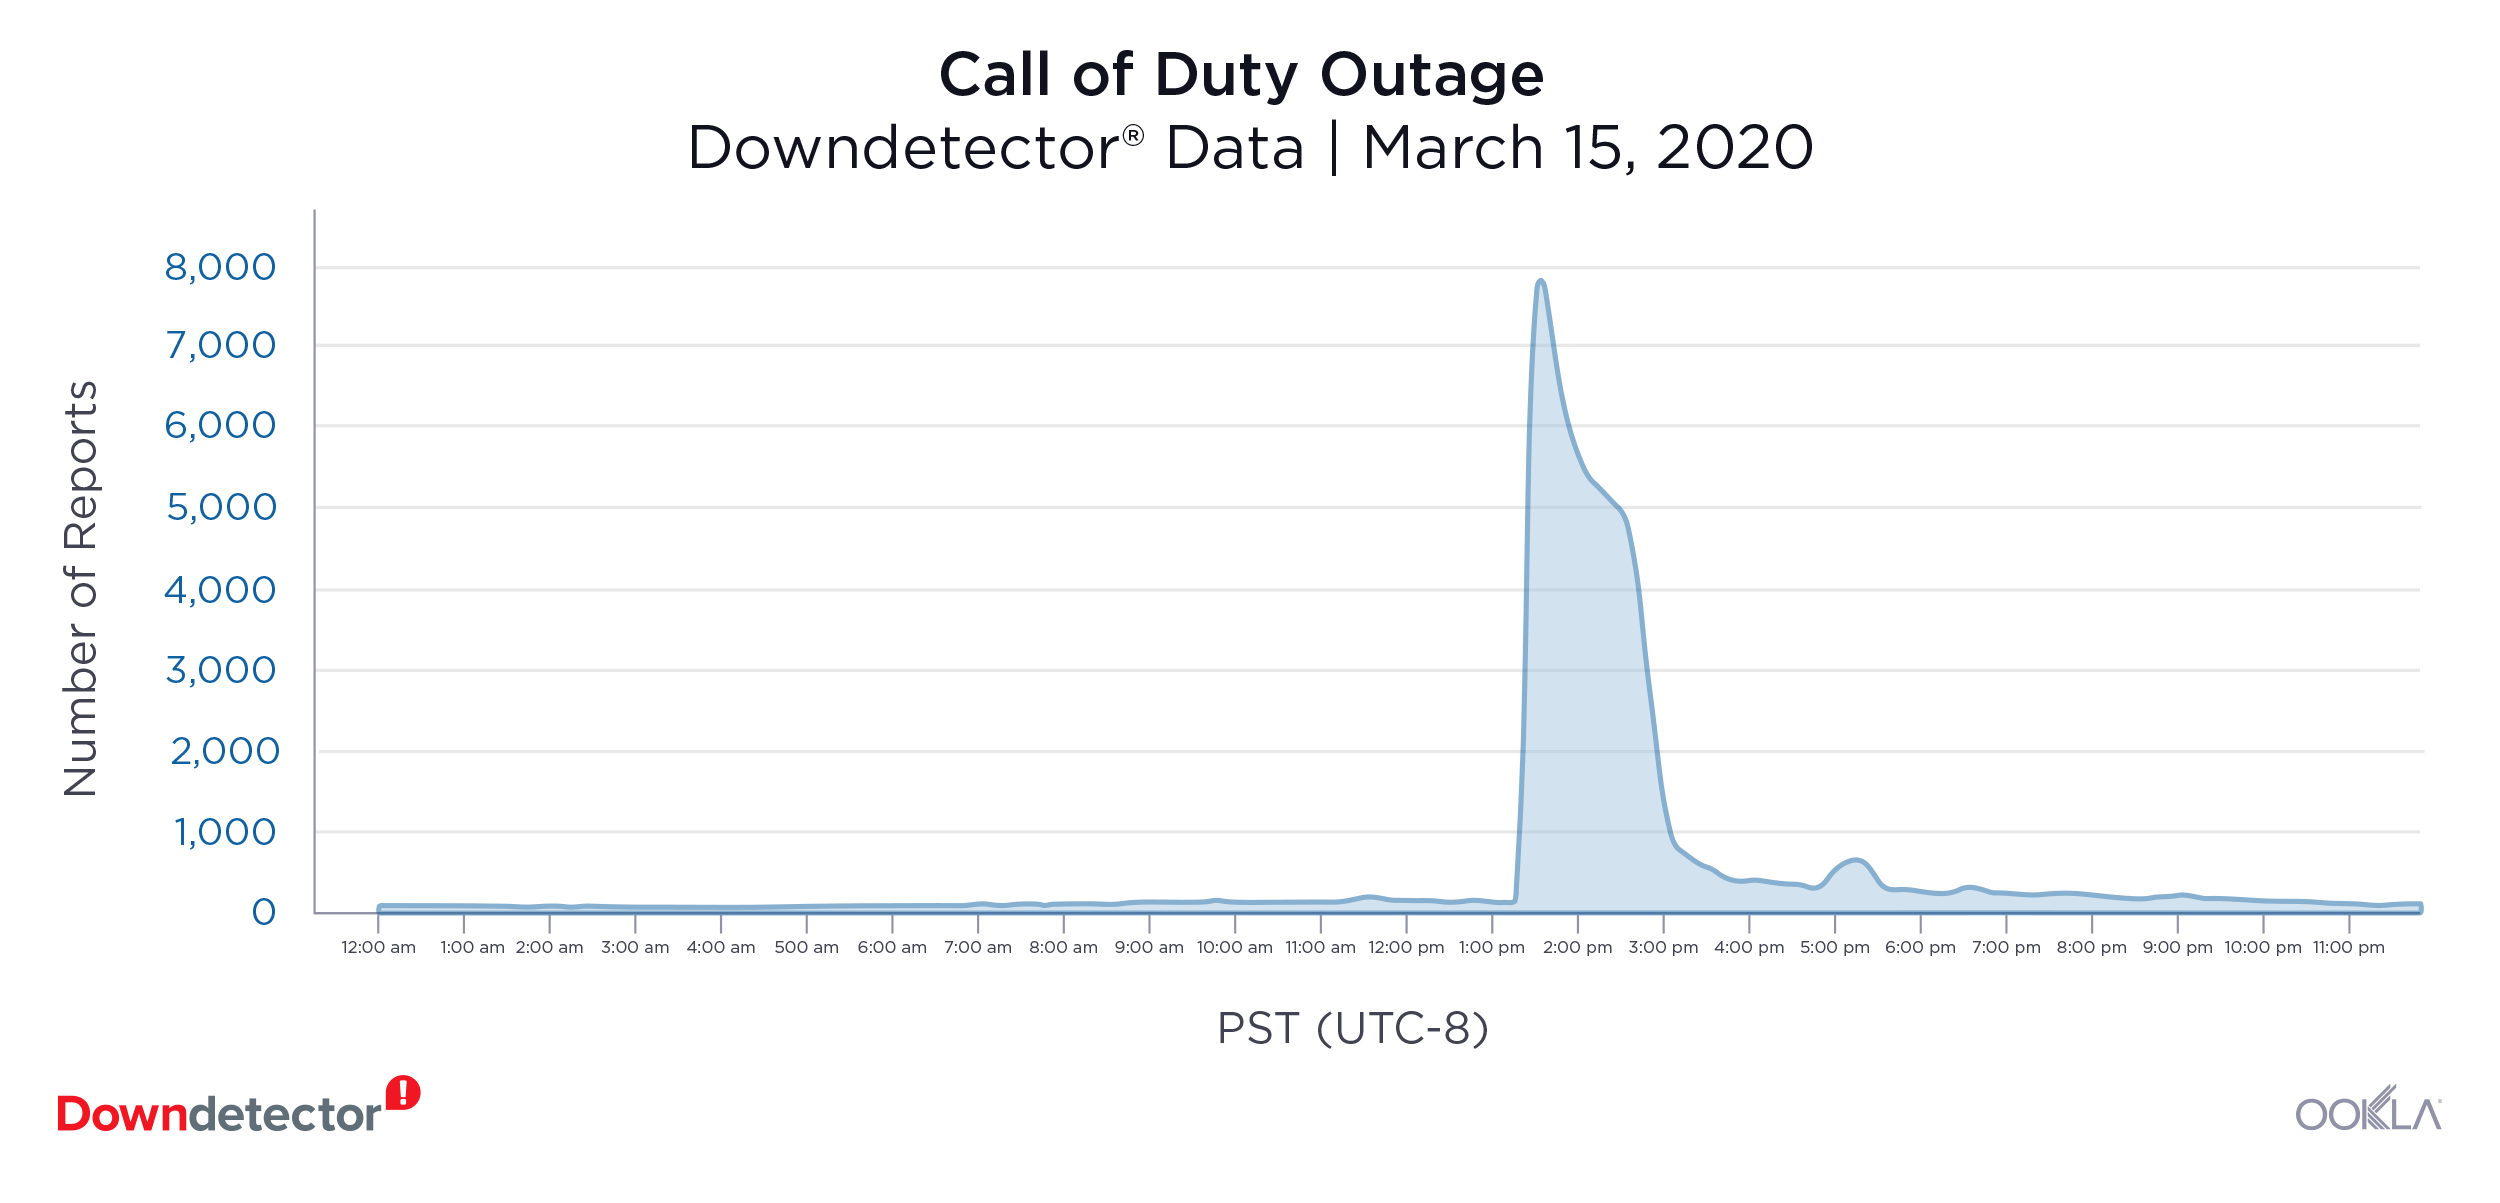
Call of Duty (March 15): 7,761 outages at peak

4-Call-of-Duty
Users in the U.S. reported multiple Call of Duty outages during Q1 2020. The largest outage took place on March 15, with 7,761 reports at the peak of an outage that primarily affected the server connection of the gaming platform. Gamers were unable to play with friends for about four hours that day. On March 17, Call of Duty had a smaller outage with 3,549 reports at peak.

Fortnite (March 17): 3,998 reports at peak

5-Fortnite

On March 17, Fornite tweeted “We’re currently investigating issues with logins, matchmaking, the Item Shop, and other Fortnight services. We’ll provide an update when these are resolved,” after users reported having problems with the gaming platform. Users were unable to access Fornite for about four hours that day. Most of the reports came from France, Germany, Japan, the Netherlands, Spain, the U.K. and the U.S.

Telecom providers

Italy

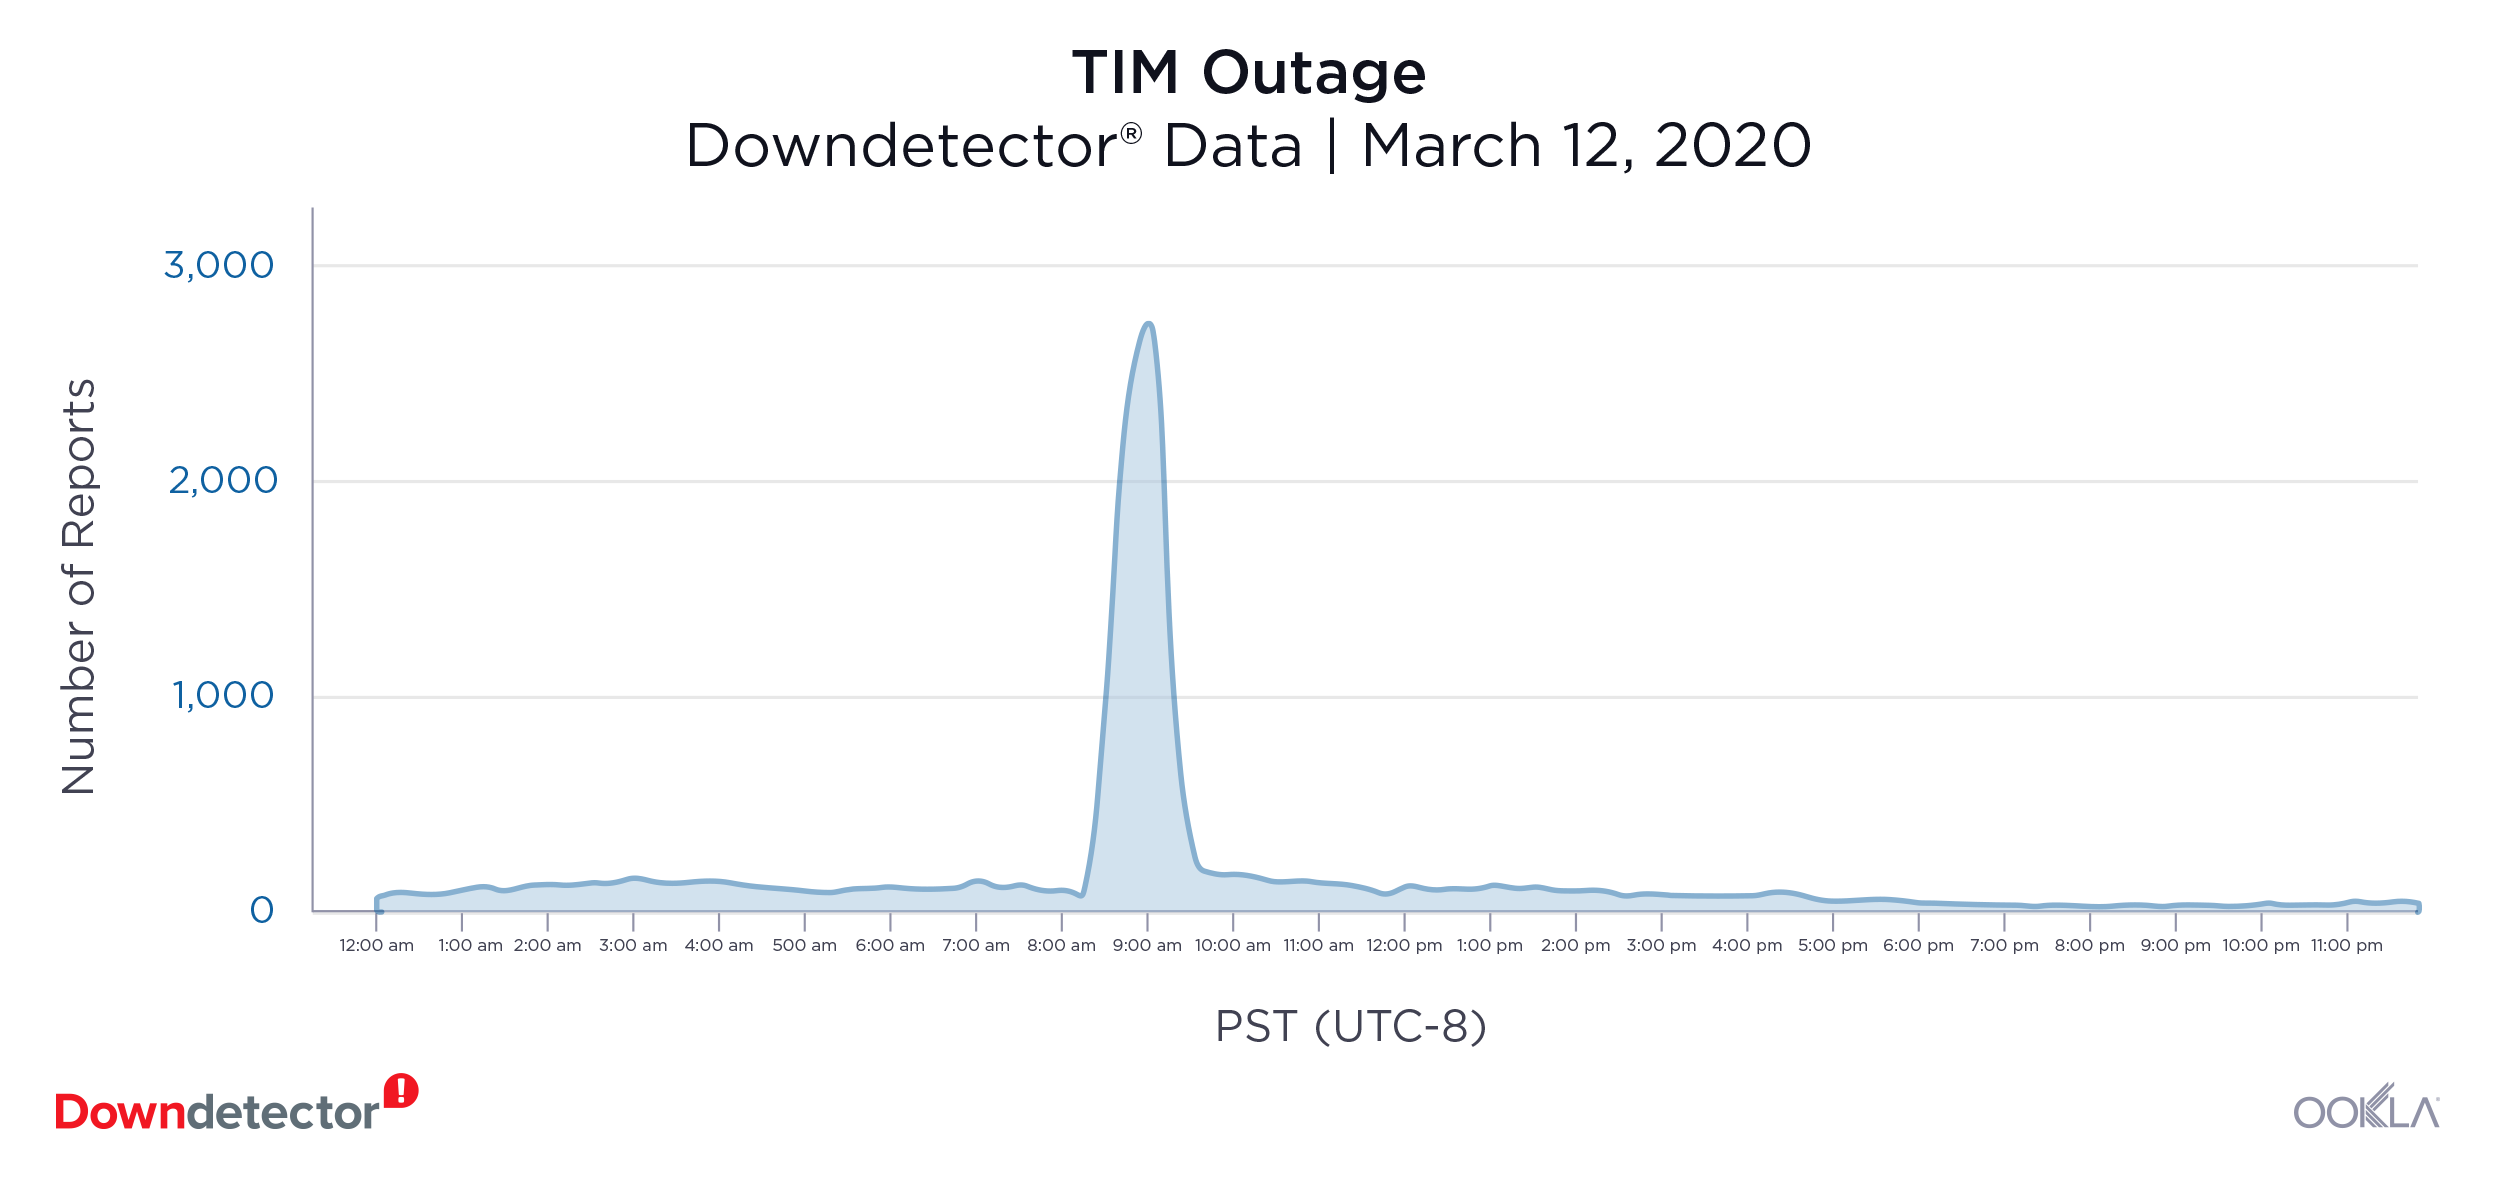
TIM Italy (March 12): 2,667 reports at peak

6-TIM
Users throughout Italy flooded Downdetector with reports of problems with their mobile internet connections on March 12. The outage lasted close to an hour and showed 2,667 reports at the peak of the outage. TIM had a smaller outage the day before with 1,337 reports at the peak of the outage.

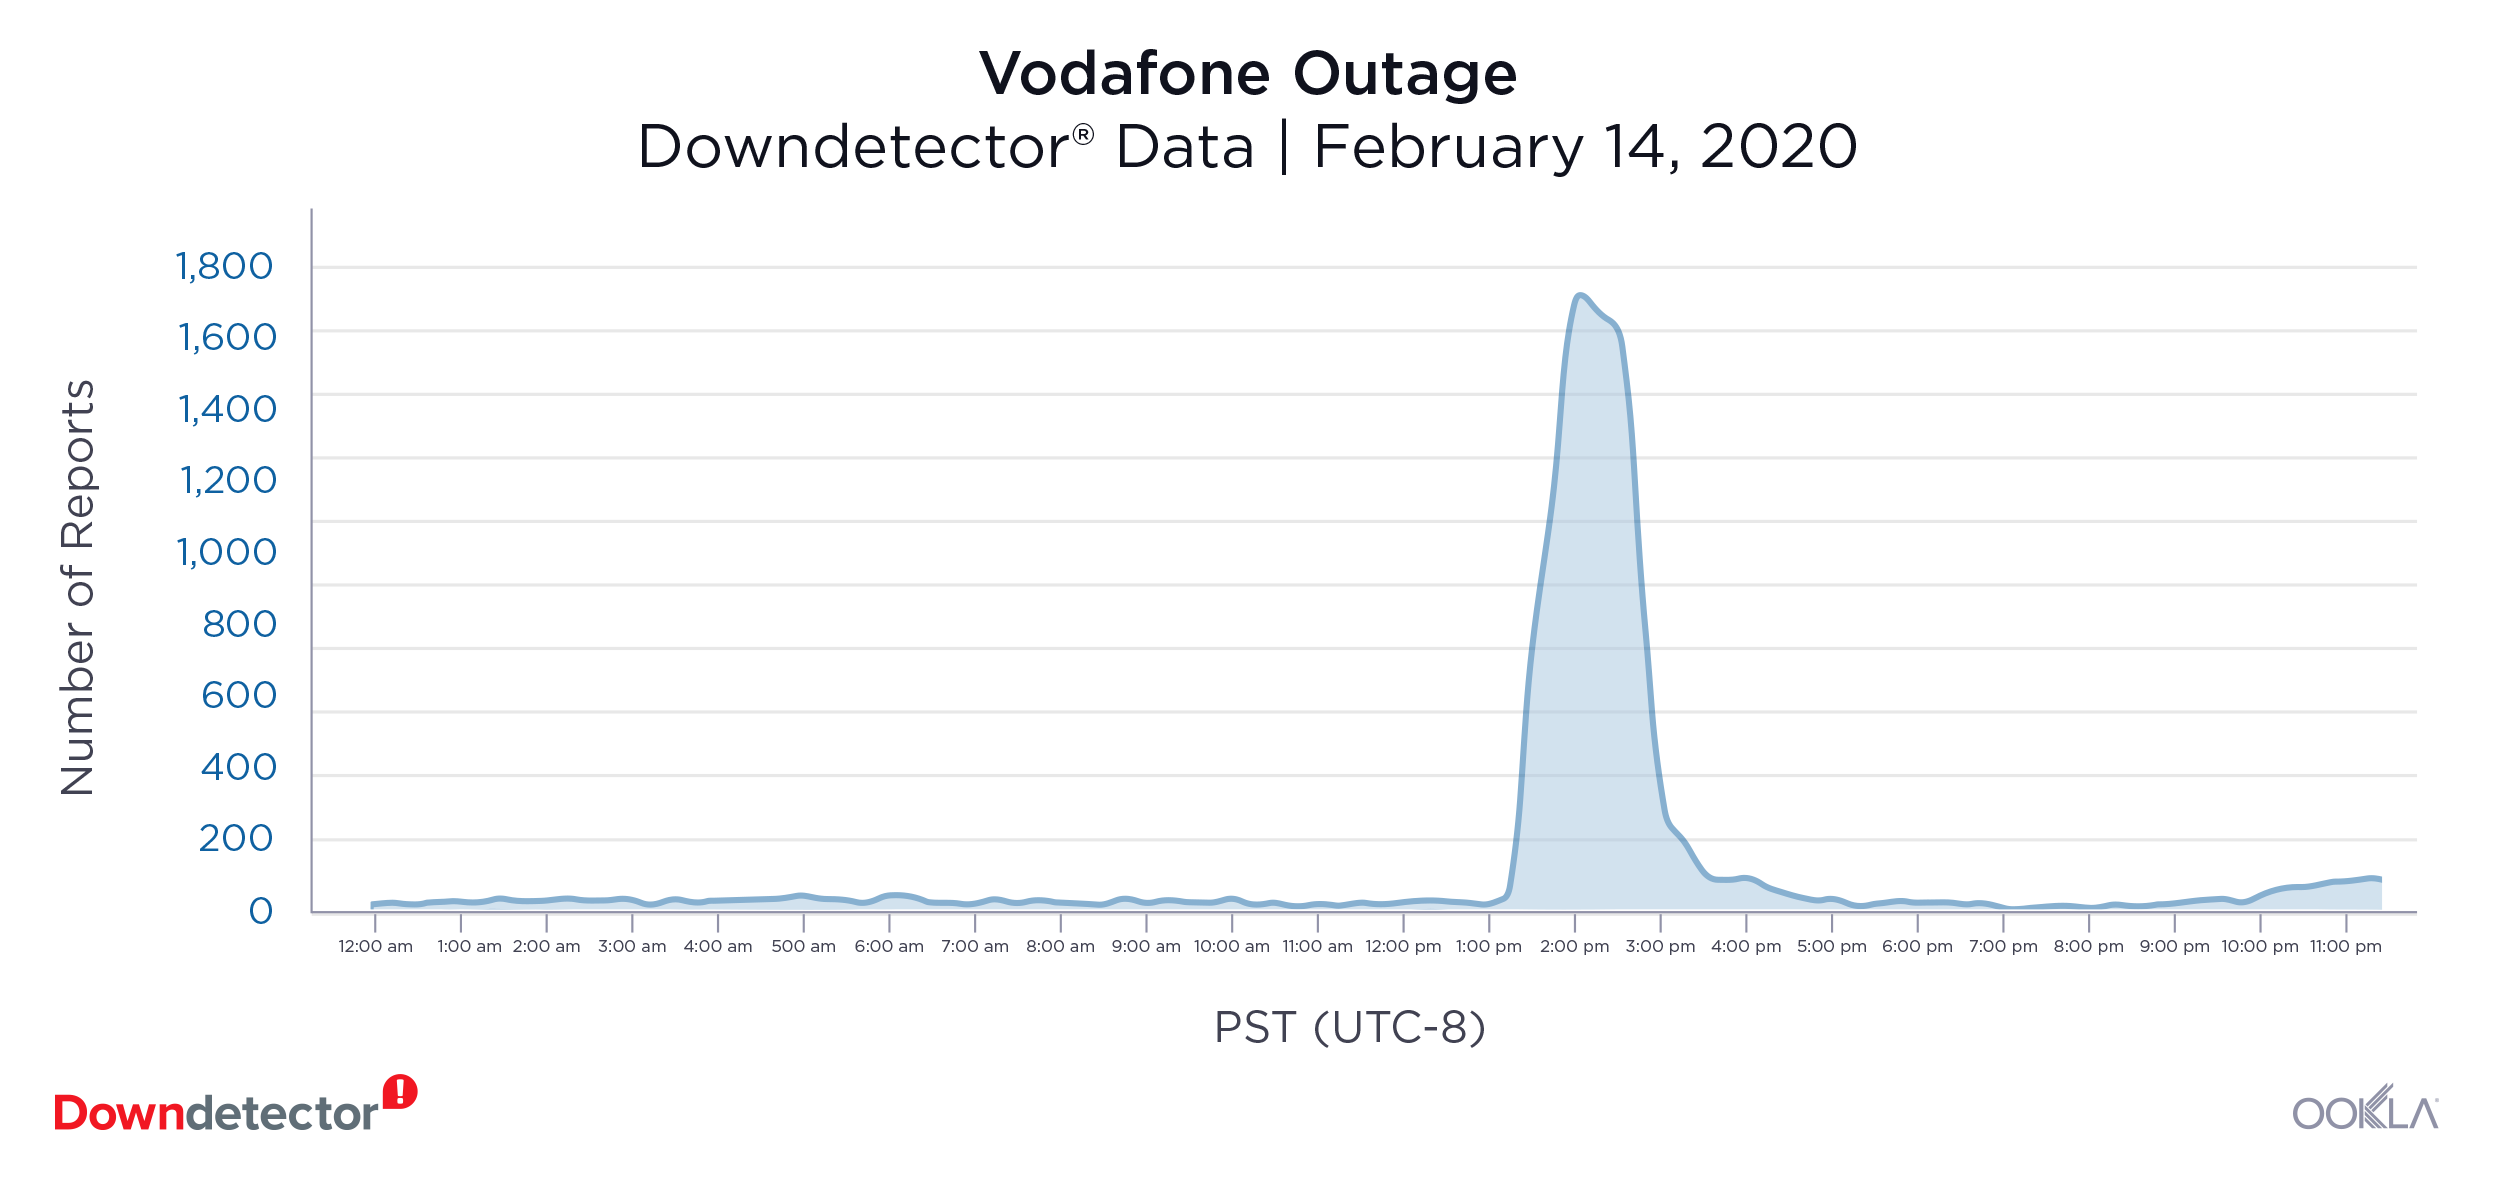
Vodafone Italy (February 14th): 1,733 reports at peak

7-Vodafone
Vodafone users in Italy reported having problems with their mobile service on February 14. The outage lasted four hours and peaked at 1,733 reports. Users also reported problems with their mobile internet connection.

United States

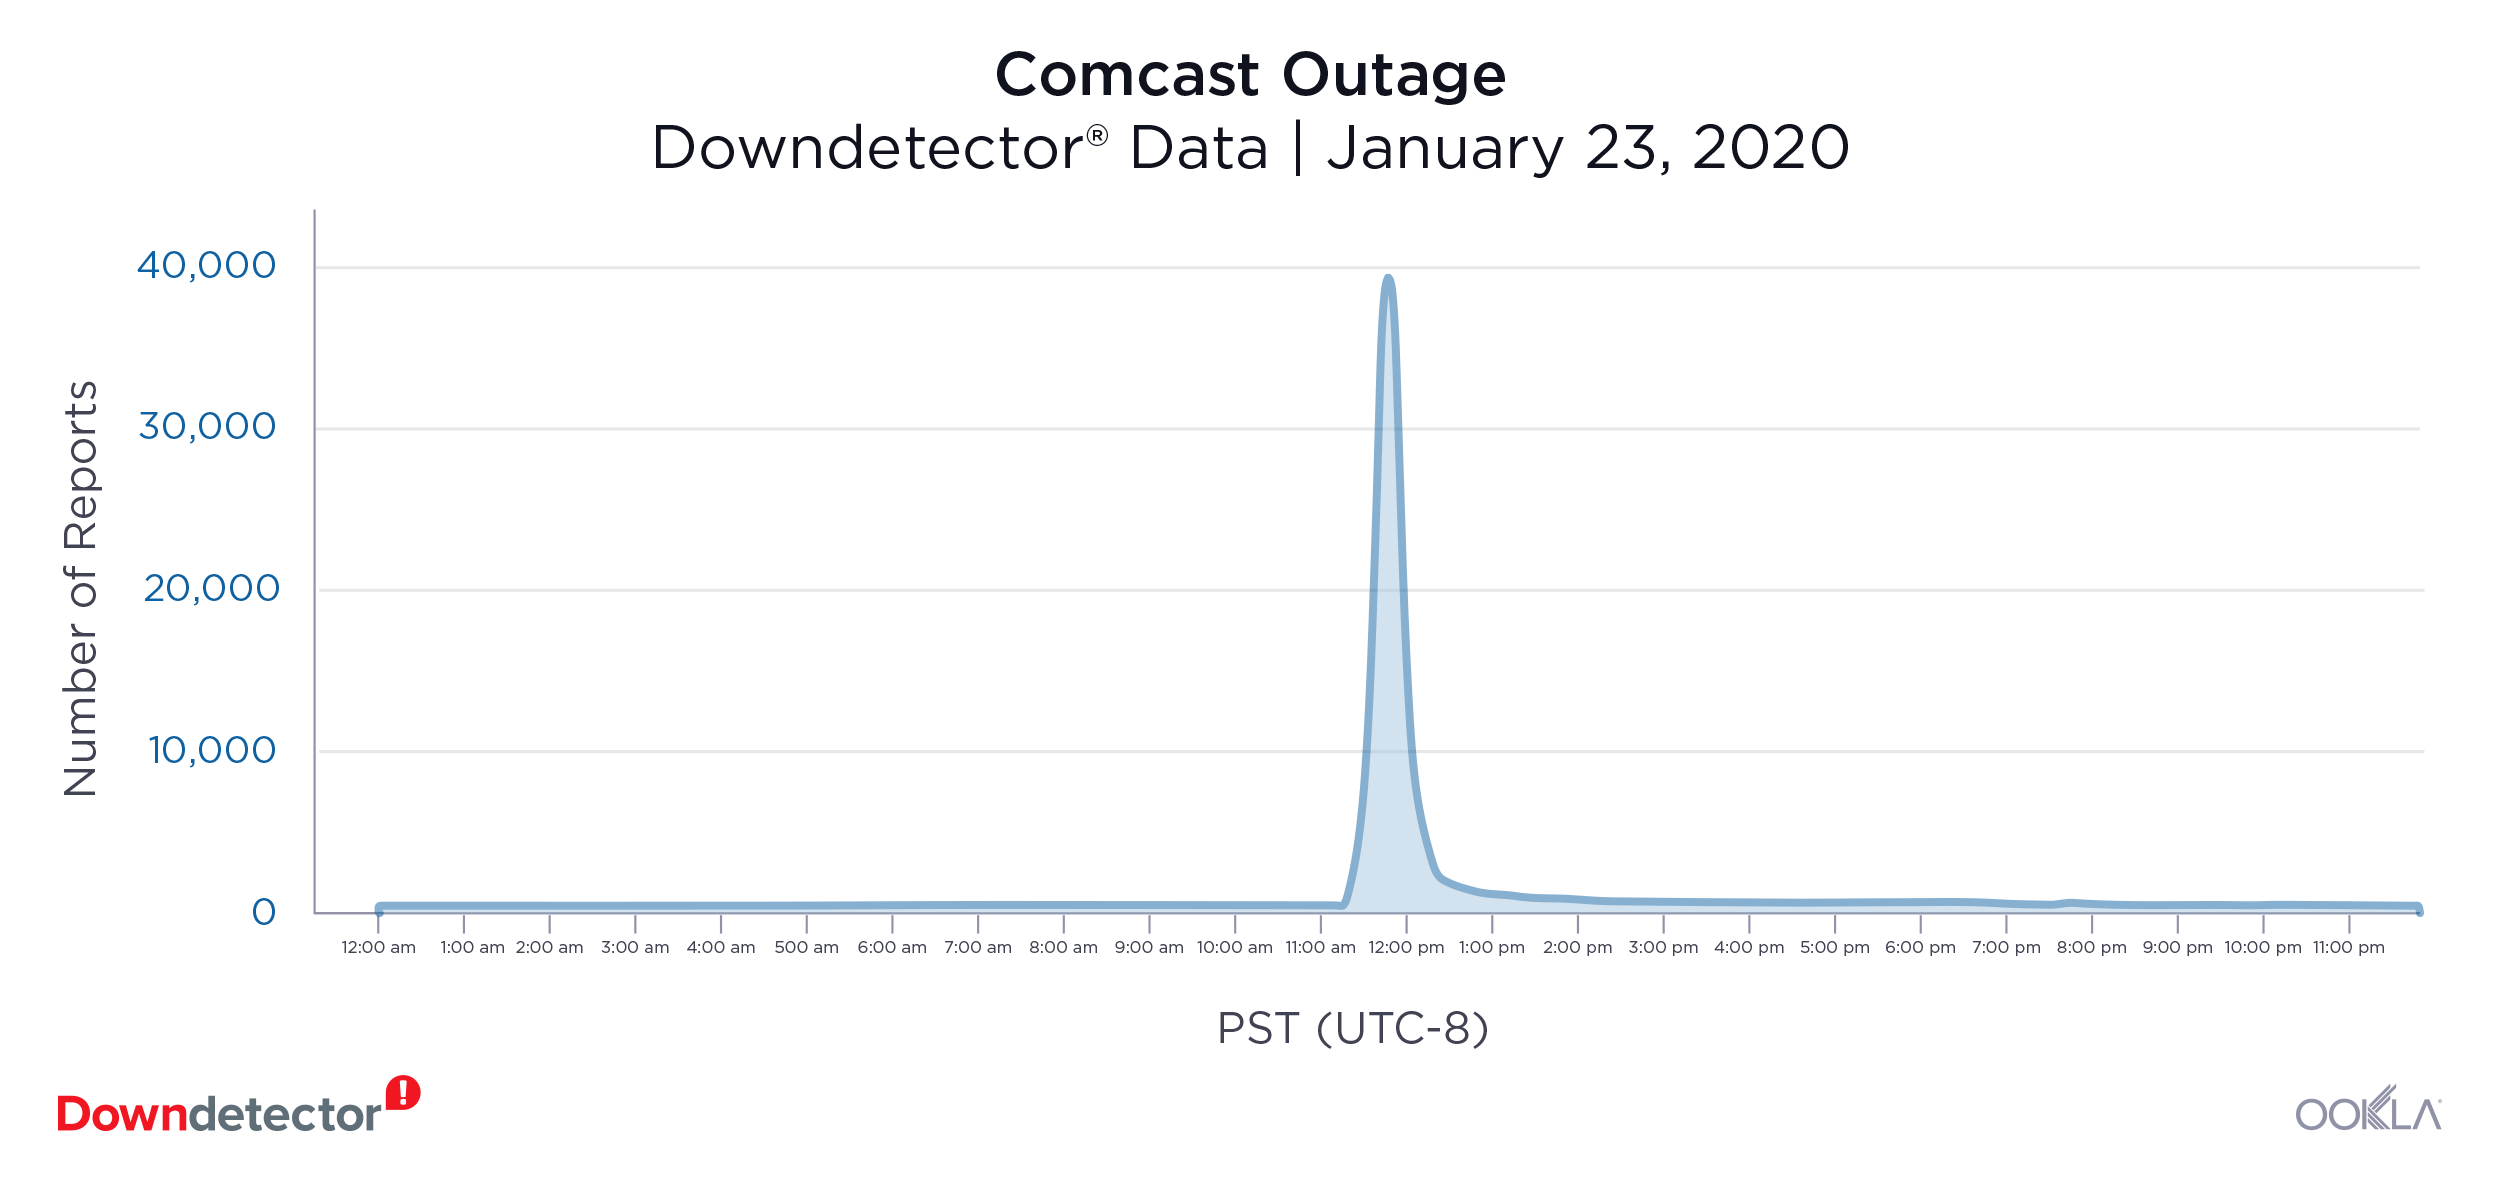
Comcast (January 23): 39,638 reports at peak

8-Comcast
The U.S. internet service provider experienced a major outage on January 23. The outage lasted for two hours with 39,638 reports at the peak of the outage. Weeks later, the service experienced a smaller outage on March 3 with 1,124 reports during the peak.

United Kingdom

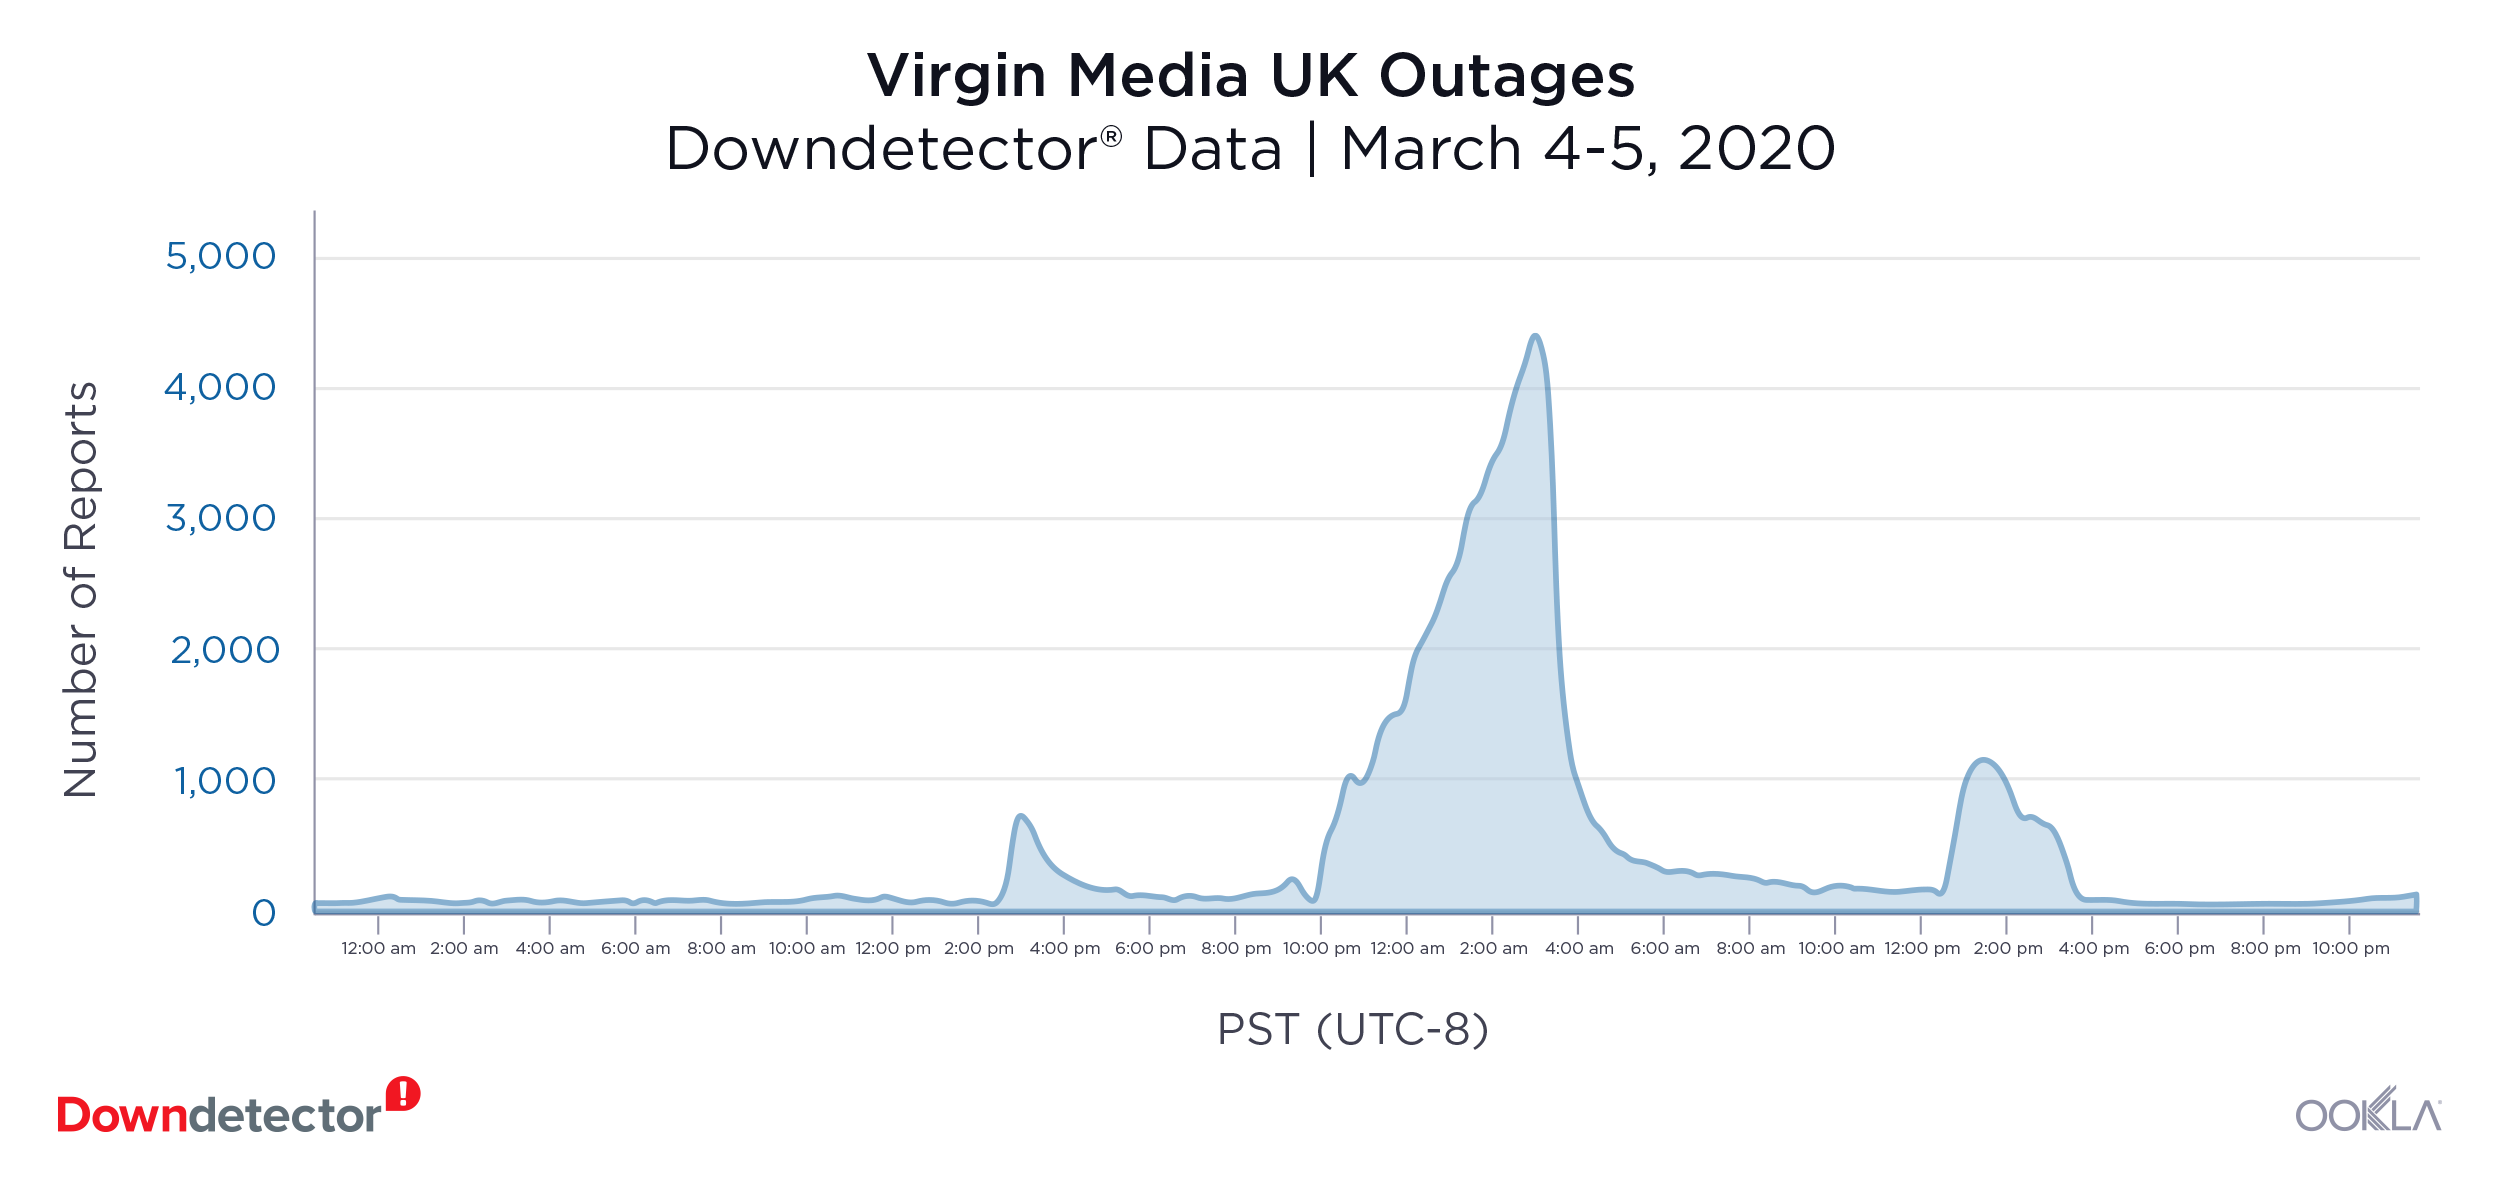
Virgin Media (March 4-5): 4,348 reports at peak

9-Virgin-UK
Users in the U.K. reported their internet service was not working during Virgin Media’s outage starting on March 4 and continuing through March 5. The outage peaked on March 5 when 4,348 users reported issues.

Social Media

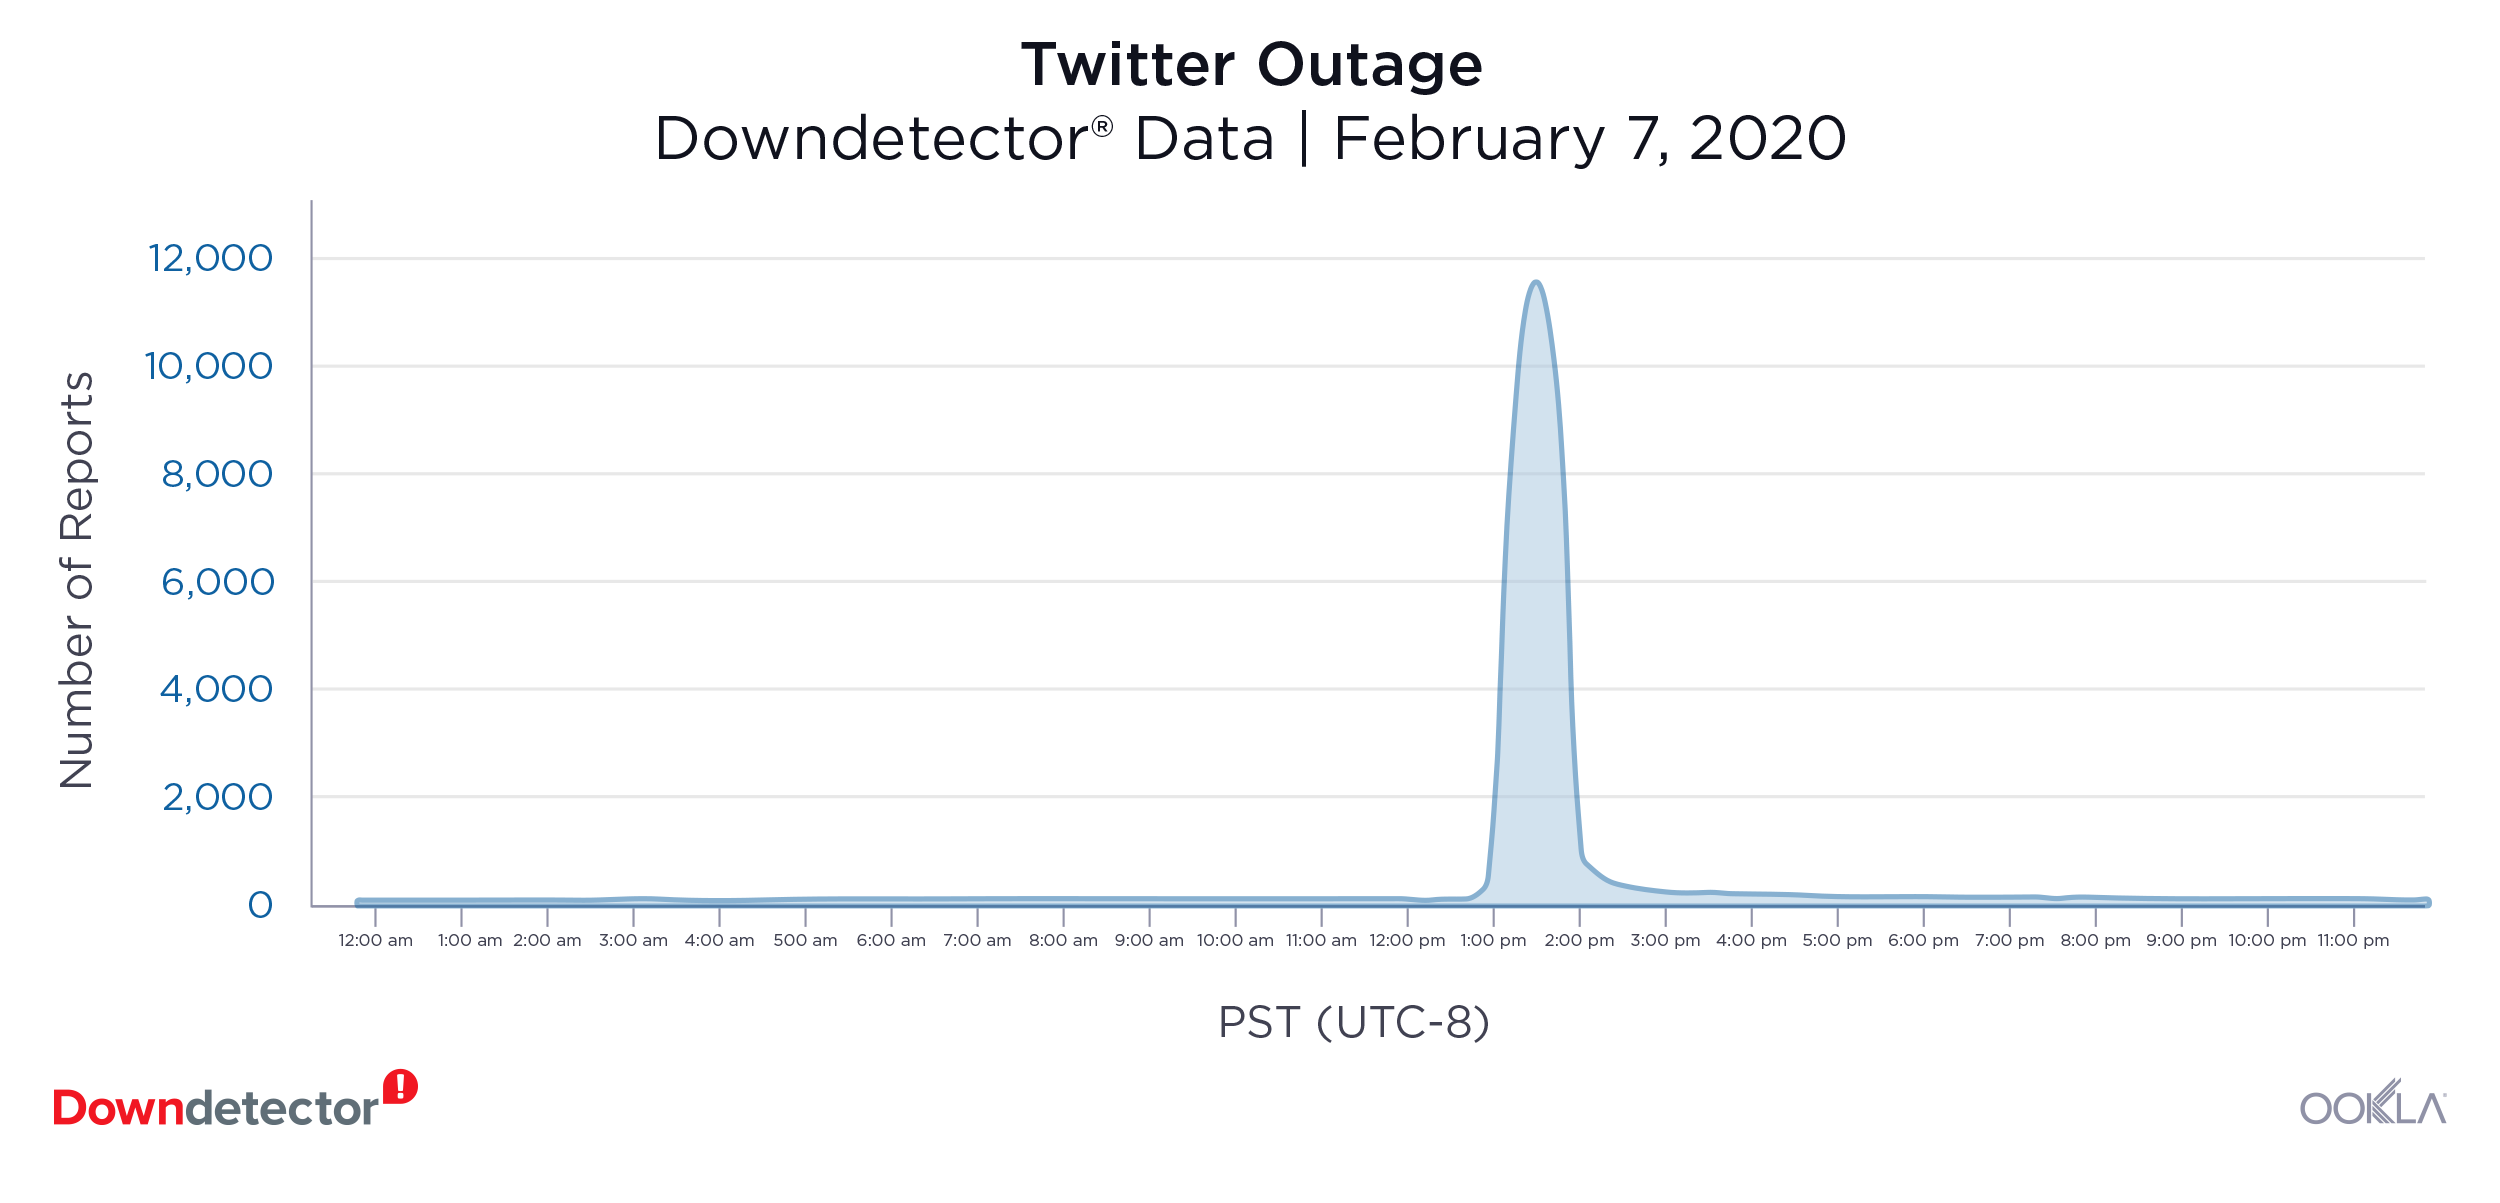
Twitter (February 7): 11,542 reports at peak

10-Twitter-1
The largest social media outage in Q1 2020 belonged to Twitter. On February 7, users in the Twitterverse were unable to tweet, retweet or like tweets for about two hours. Over 11,500 U.S. users reported problems during the peak of the outage. Users in Germany, Japan and the U.K. also reported problems with the platform.

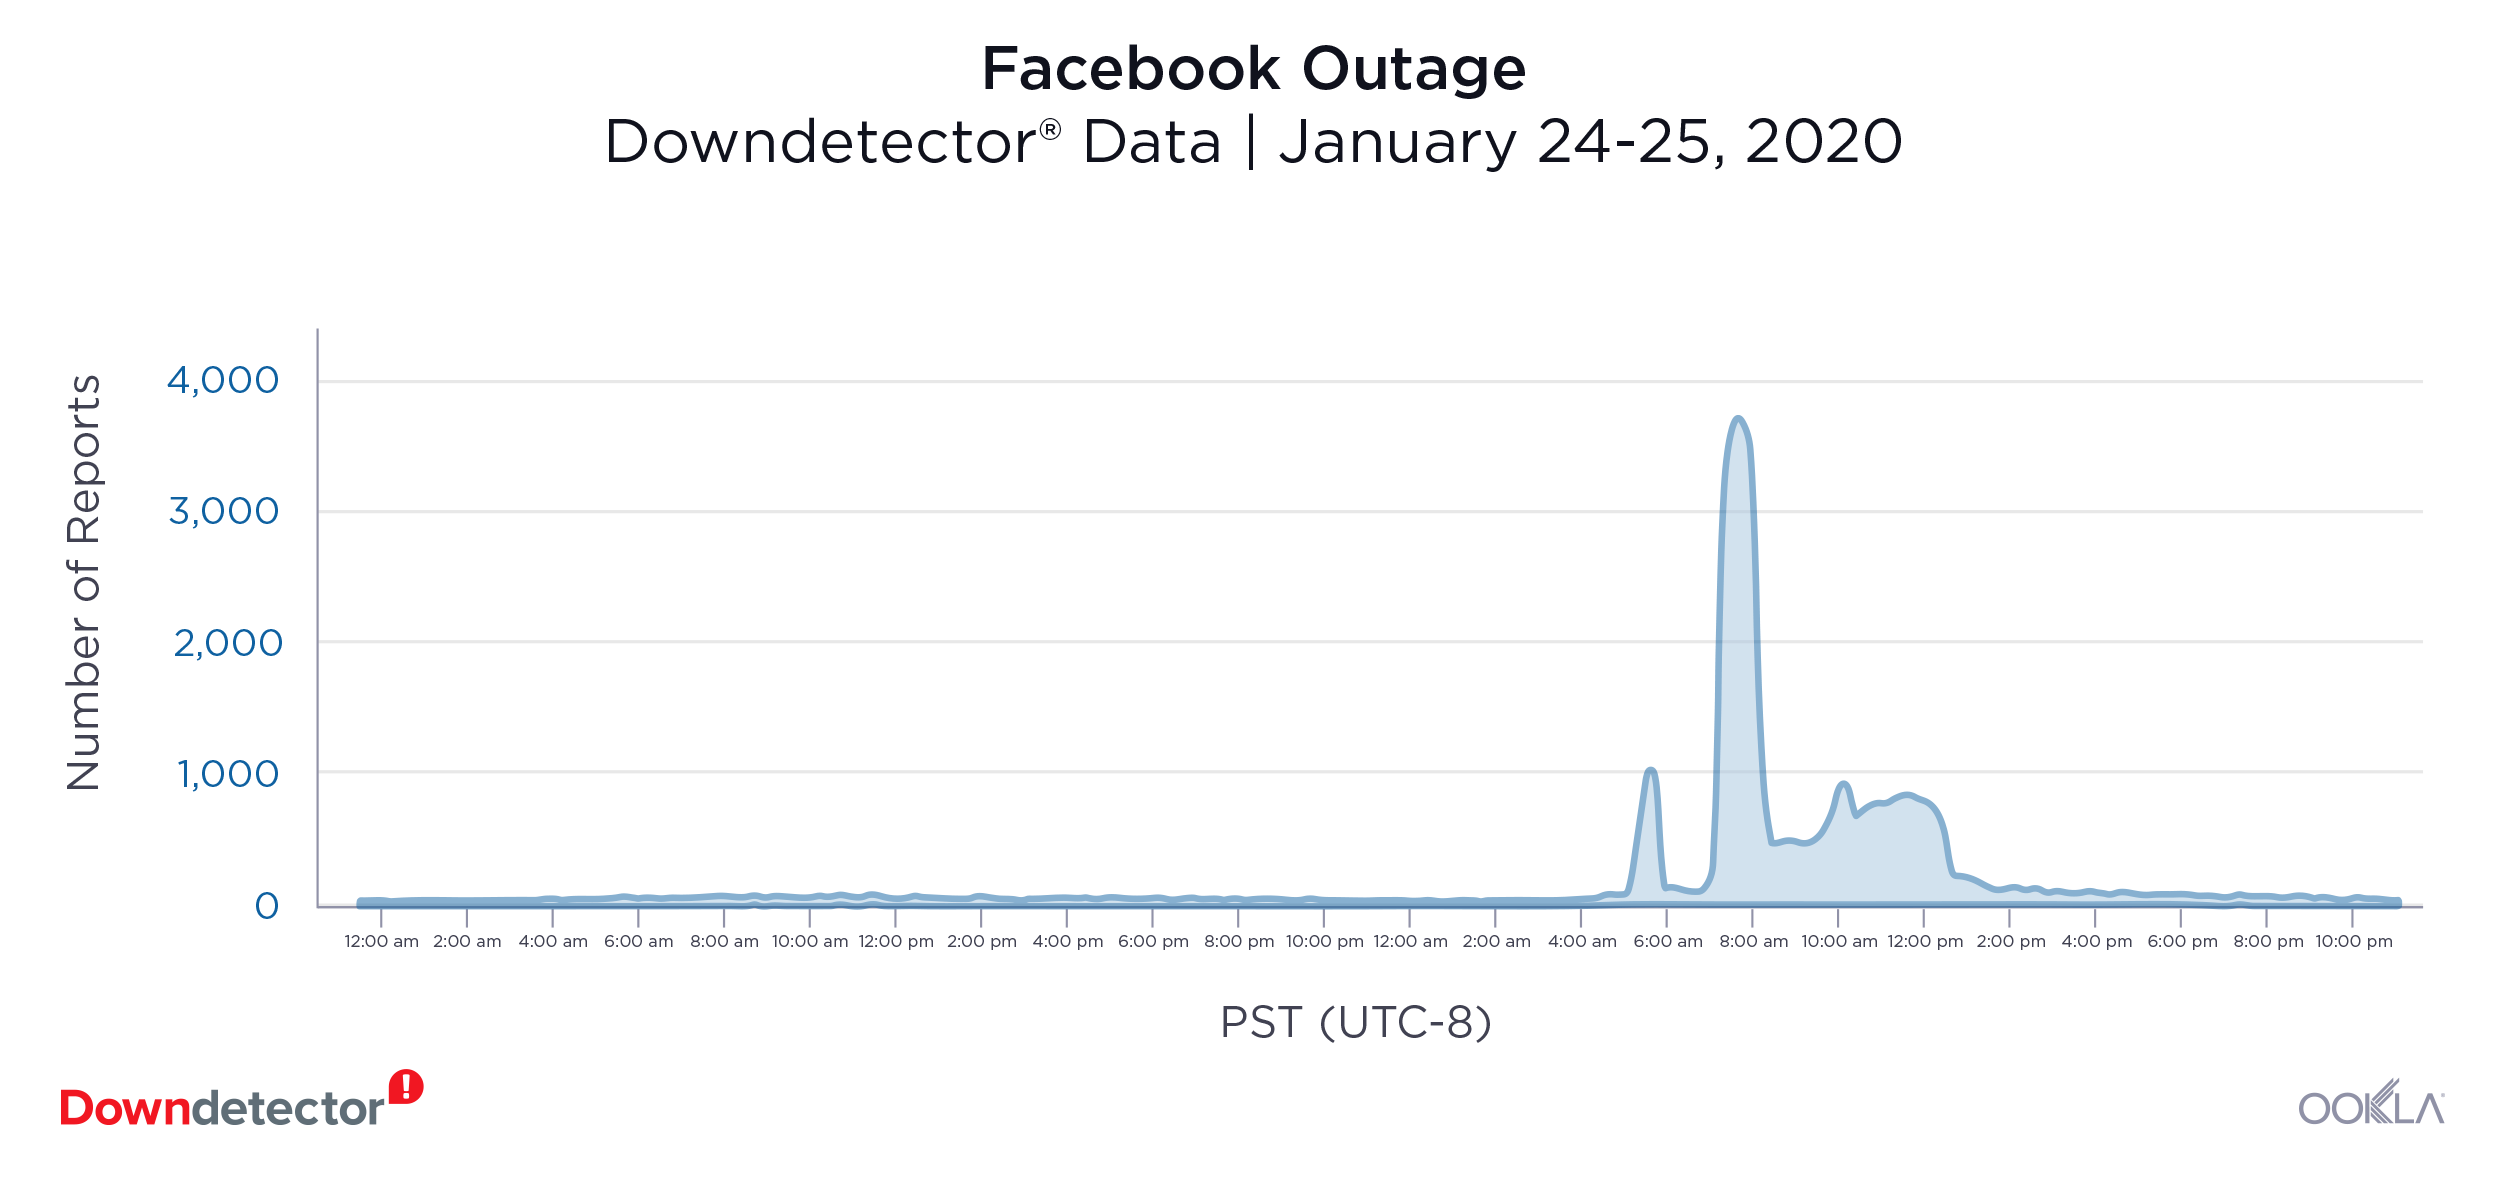
Facebook (January 24-25): 3,718 reports at peak

11-Facebook
Facebook users reported problems with the site on Downdetector starting on January 24. Most users reported problems with their newsfeed or the inability to log in to the social media platform. At the peak of the outage, there were 3,718 reports from users in the U.S. Users in Germany and the U.K. also reported problems that day. Users were still experiencing issues through January 25.

Streaming Services

Streaming-bar-outages

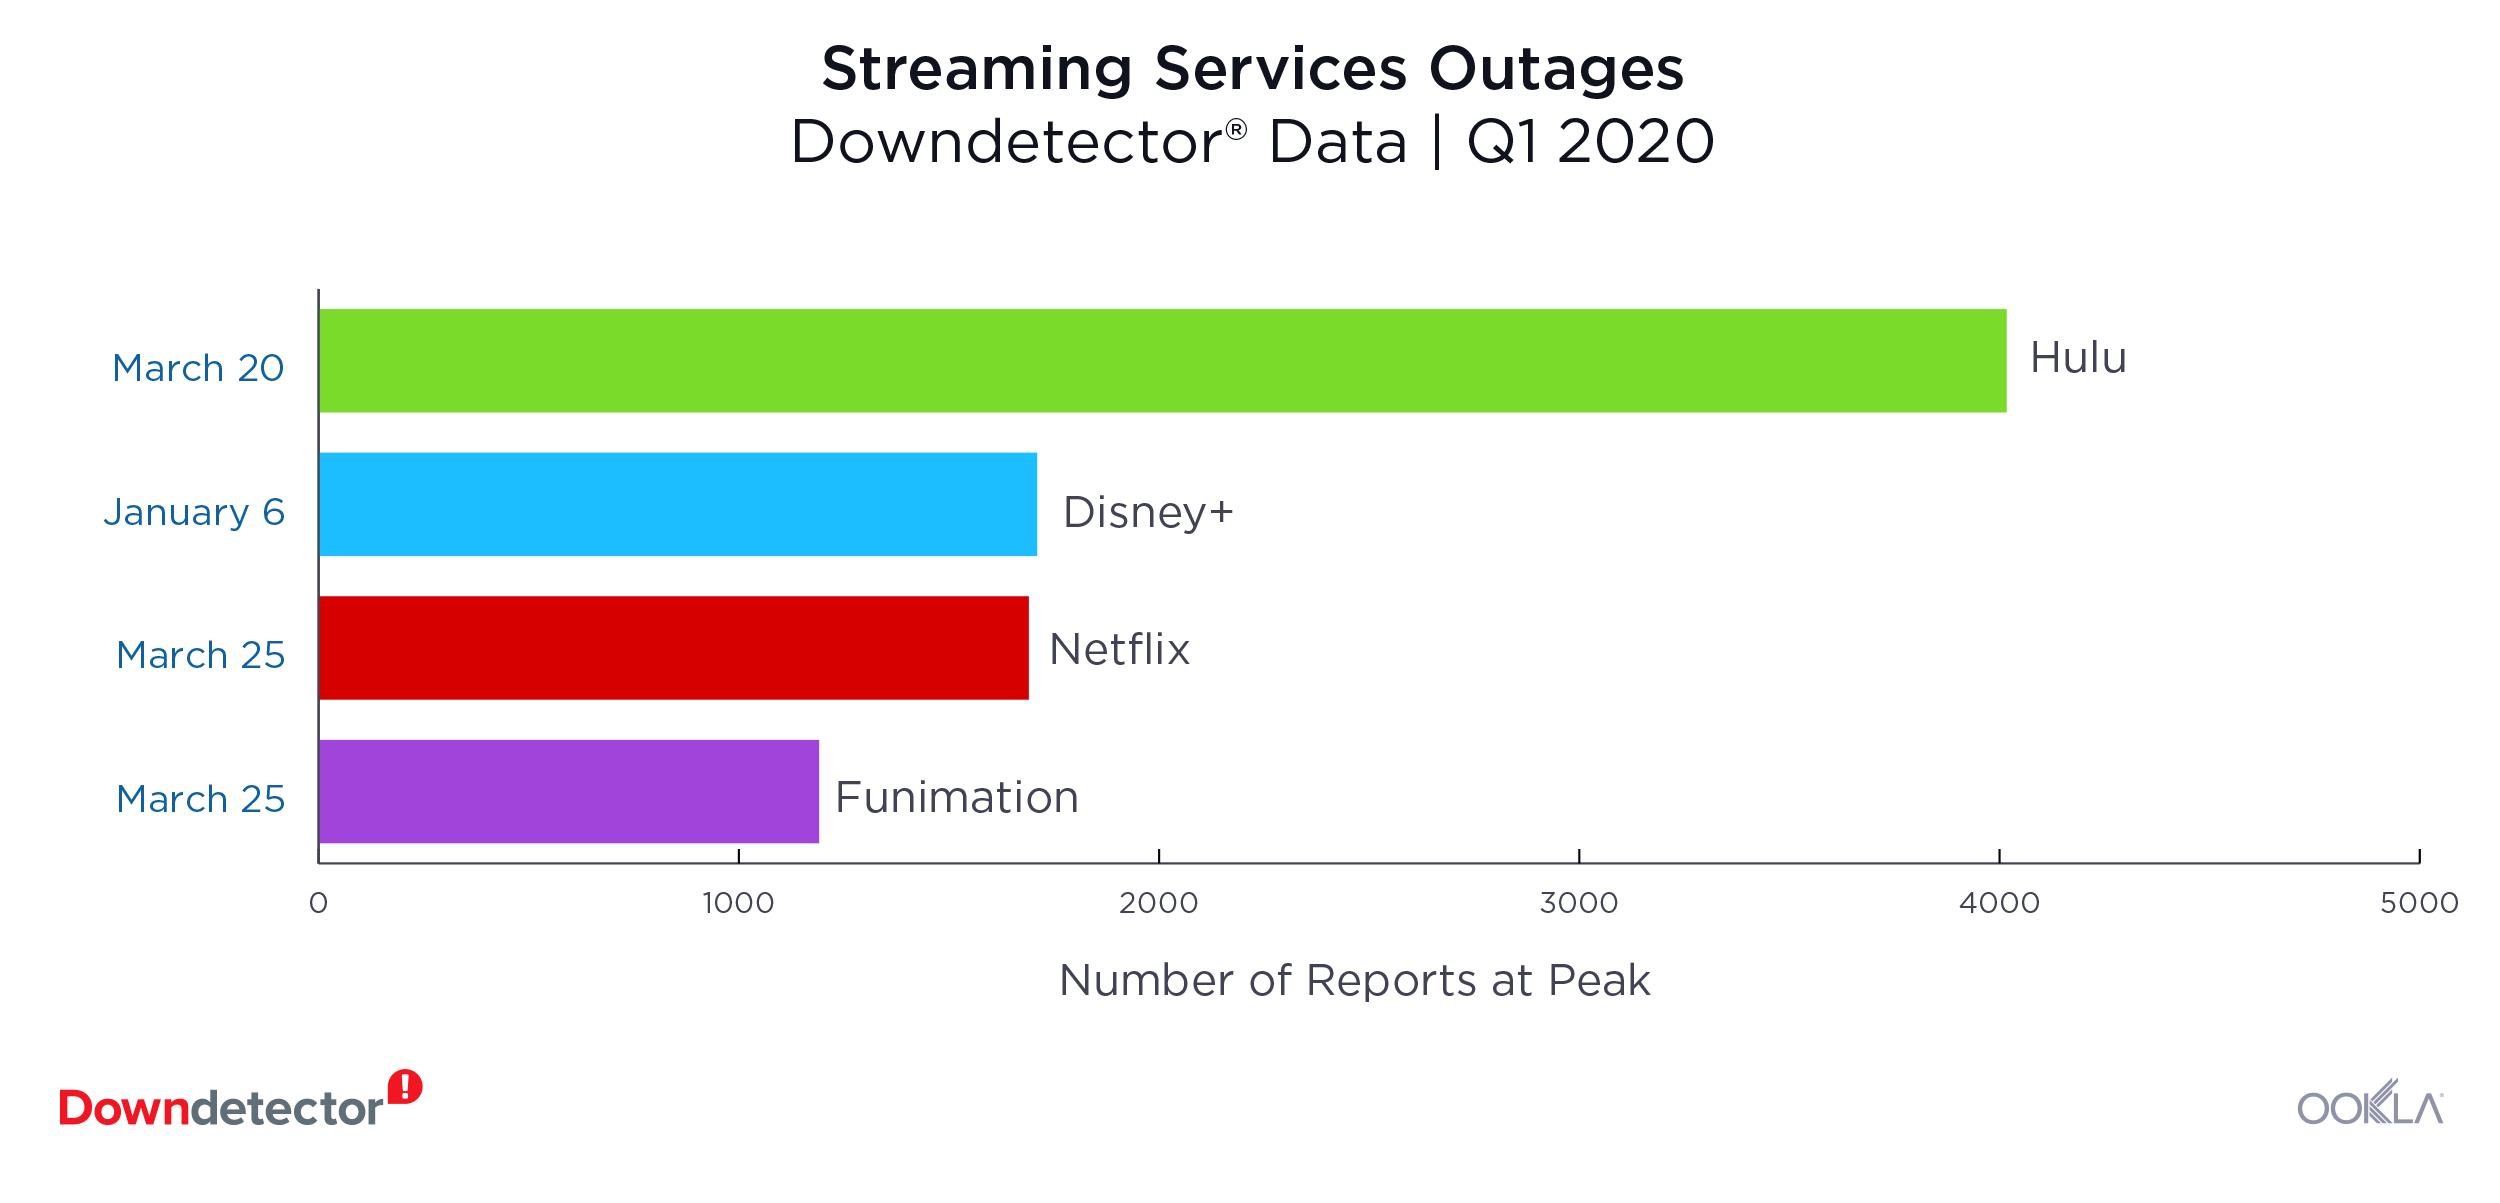
Hulu (March 20): 4,017 reports at peak

People hoping to binge-watch their favorite shows while in quarantine were disappointed to find Hulu was down on March 20. Users complaints on Downdetector included not being able to log in or of the player not working properly. The outage lasted approximately two hours.

Disney+ (January 6): 1,710 reports at peak

Disney + experienced an outage at the beginning of Q1 2020 that reached 1,710 reports at the peak. For an hour, users in the U.S. reported they were unable to log in to the platform.

Netflix (March 25): 1,690 reports at peak

For two hours on March 25, thousands of Netflix users were unable to stream their favorite shows. At the peak of Nexflix’s biggest outage in Q1 2020, 1,690 users reported problems in the U.S.

Funimation (March 25): 1,191 reports at peak

Anime lovers in the US reported problems with Funimation towards the end of Q1 2020. Most users complained of not being able to log in to the service for about an hour that day. There were 1,191 reports at the peak of the outage.

Financial Services

Robinhood (multiple outages)

robinhood-barchart

Robinhood had multiple fumbles during Q1 2020, leaving users frustrated with the financial service. The most significant outage took place on March 2 with 14,429 reports at the peak of the outage. Robin Hood experienced additional outages on March 3 and March 9 with 3,538 and 3,119 reports during the respective peaks.

Is an outage disrupting your day? You’re not alone. Find out if there’s an outage and bond with other frustrated users on Downdetector and read about other significant outages here.

Editor’s note: This article was updated on April 14 to clarify the Steam section and related graphic.

Ookla retains ownership of this article including all of the intellectual property rights, data, content graphs and analysis. This article may not be quoted, reproduced, distributed or published for any commercial purpose without prior consent. Members of the press and others using the findings in this article for non-commercial purposes are welcome to publicly share and link to report information with attribution to Ookla.

| July 14, 2020

The Most Significant Online Service Outages in Q2 2020

“Try again later” was a phrase that frustrated users all over the world during the multiple online service outages in Q2 2020. This article is the third installment in our quarterly series tracking the most significant web and online service outages. Analyzing Downdetector® data from Q2 2020, we focused on user-reported service disruptions in five categories: social media, communications service providers, collaboration platforms, gaming and financial institutions.

Social media

Downdetector_Snapchat_Outage_0720-1

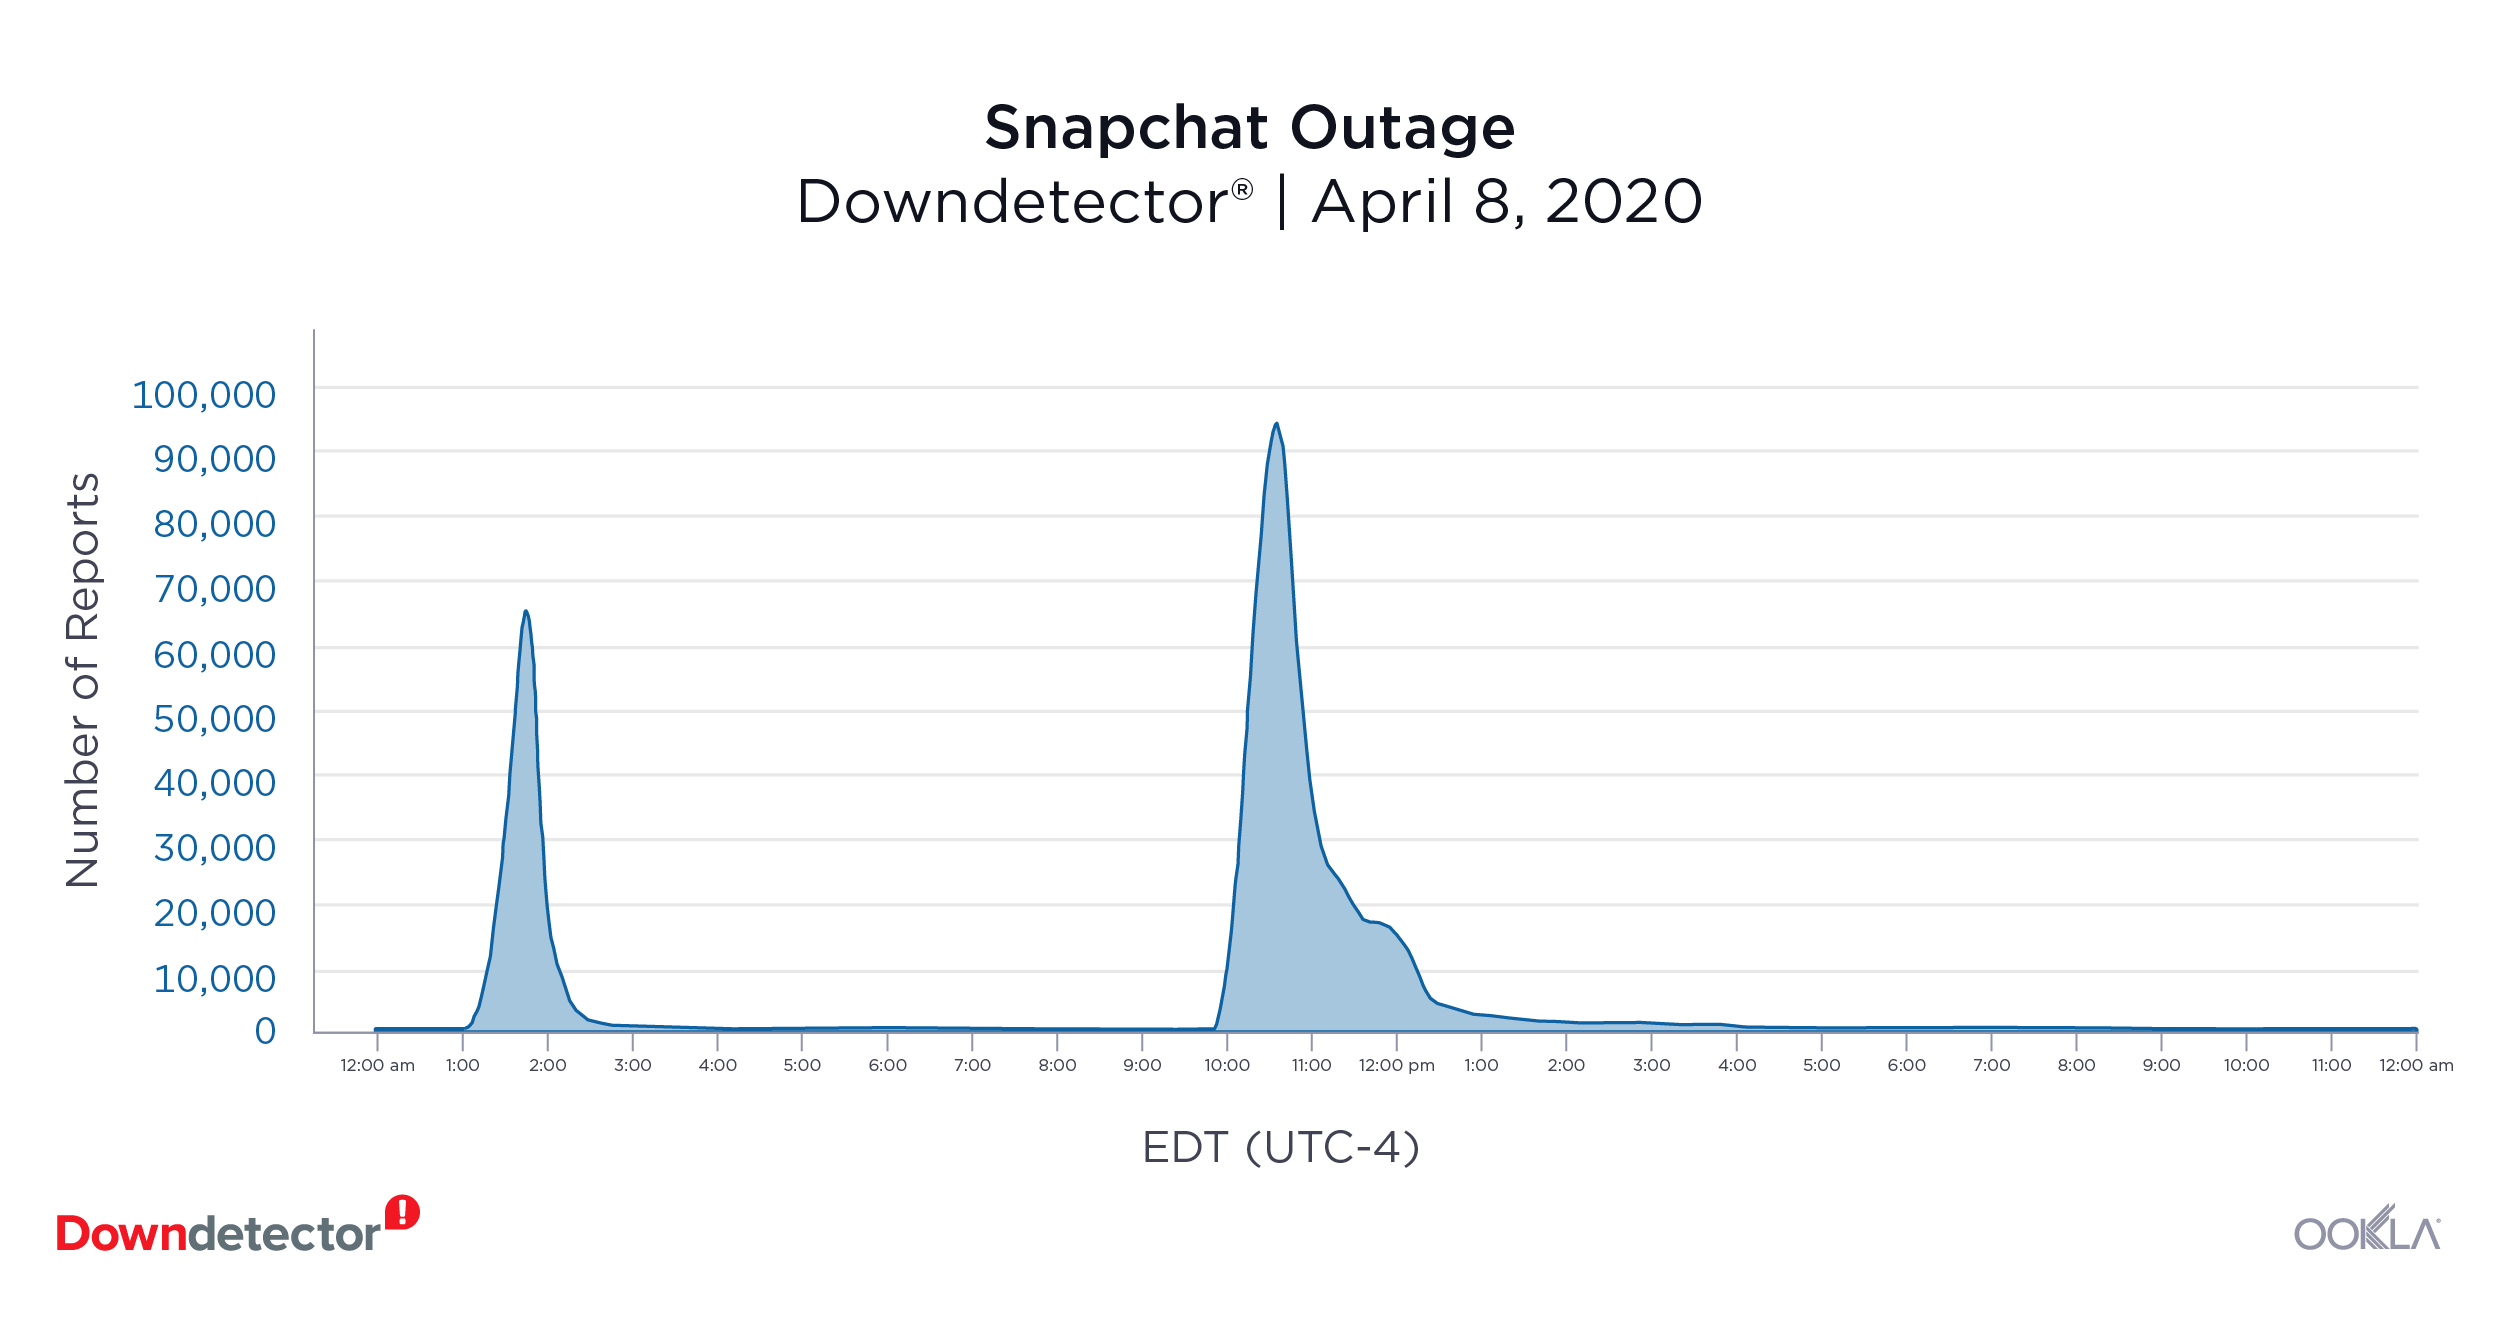
Snapchat (April 8, 2020): 93,671 reports at peak

Snapchat users began to report problems with the mobile app early on April 8. At the peak of outage reports, there were 93,671 reported issues in the U.S in one 15-minute period. User reports rolled in over a total period of approximately two hours. Users in the United Kingdom and the Netherlands also reported problems with Snapchat during the same time period.

TikTok (May 6, 2020): 49,701 reports at peak

Many U.S. and U.K. users of the popular video-based social media platform struggled to log into their accounts on May 6. Over 49,000 users in the U.S. reported problems logging in, viewing and uploading videos to TikTok that evening.

Tinder (June 12, 2020): 6,967 reports at peak

Users of the mobile dating app Tinder rushed to Downdetector when they encountered problems logging in, sending and receiving messages on the morning of June 12. Almost 7,000 users from the U.S. reported problems with the app, and issues were also reported in the U.K. and Germany.

Communications service providers

Downdetector_T-Mobile_Outage_0720-1

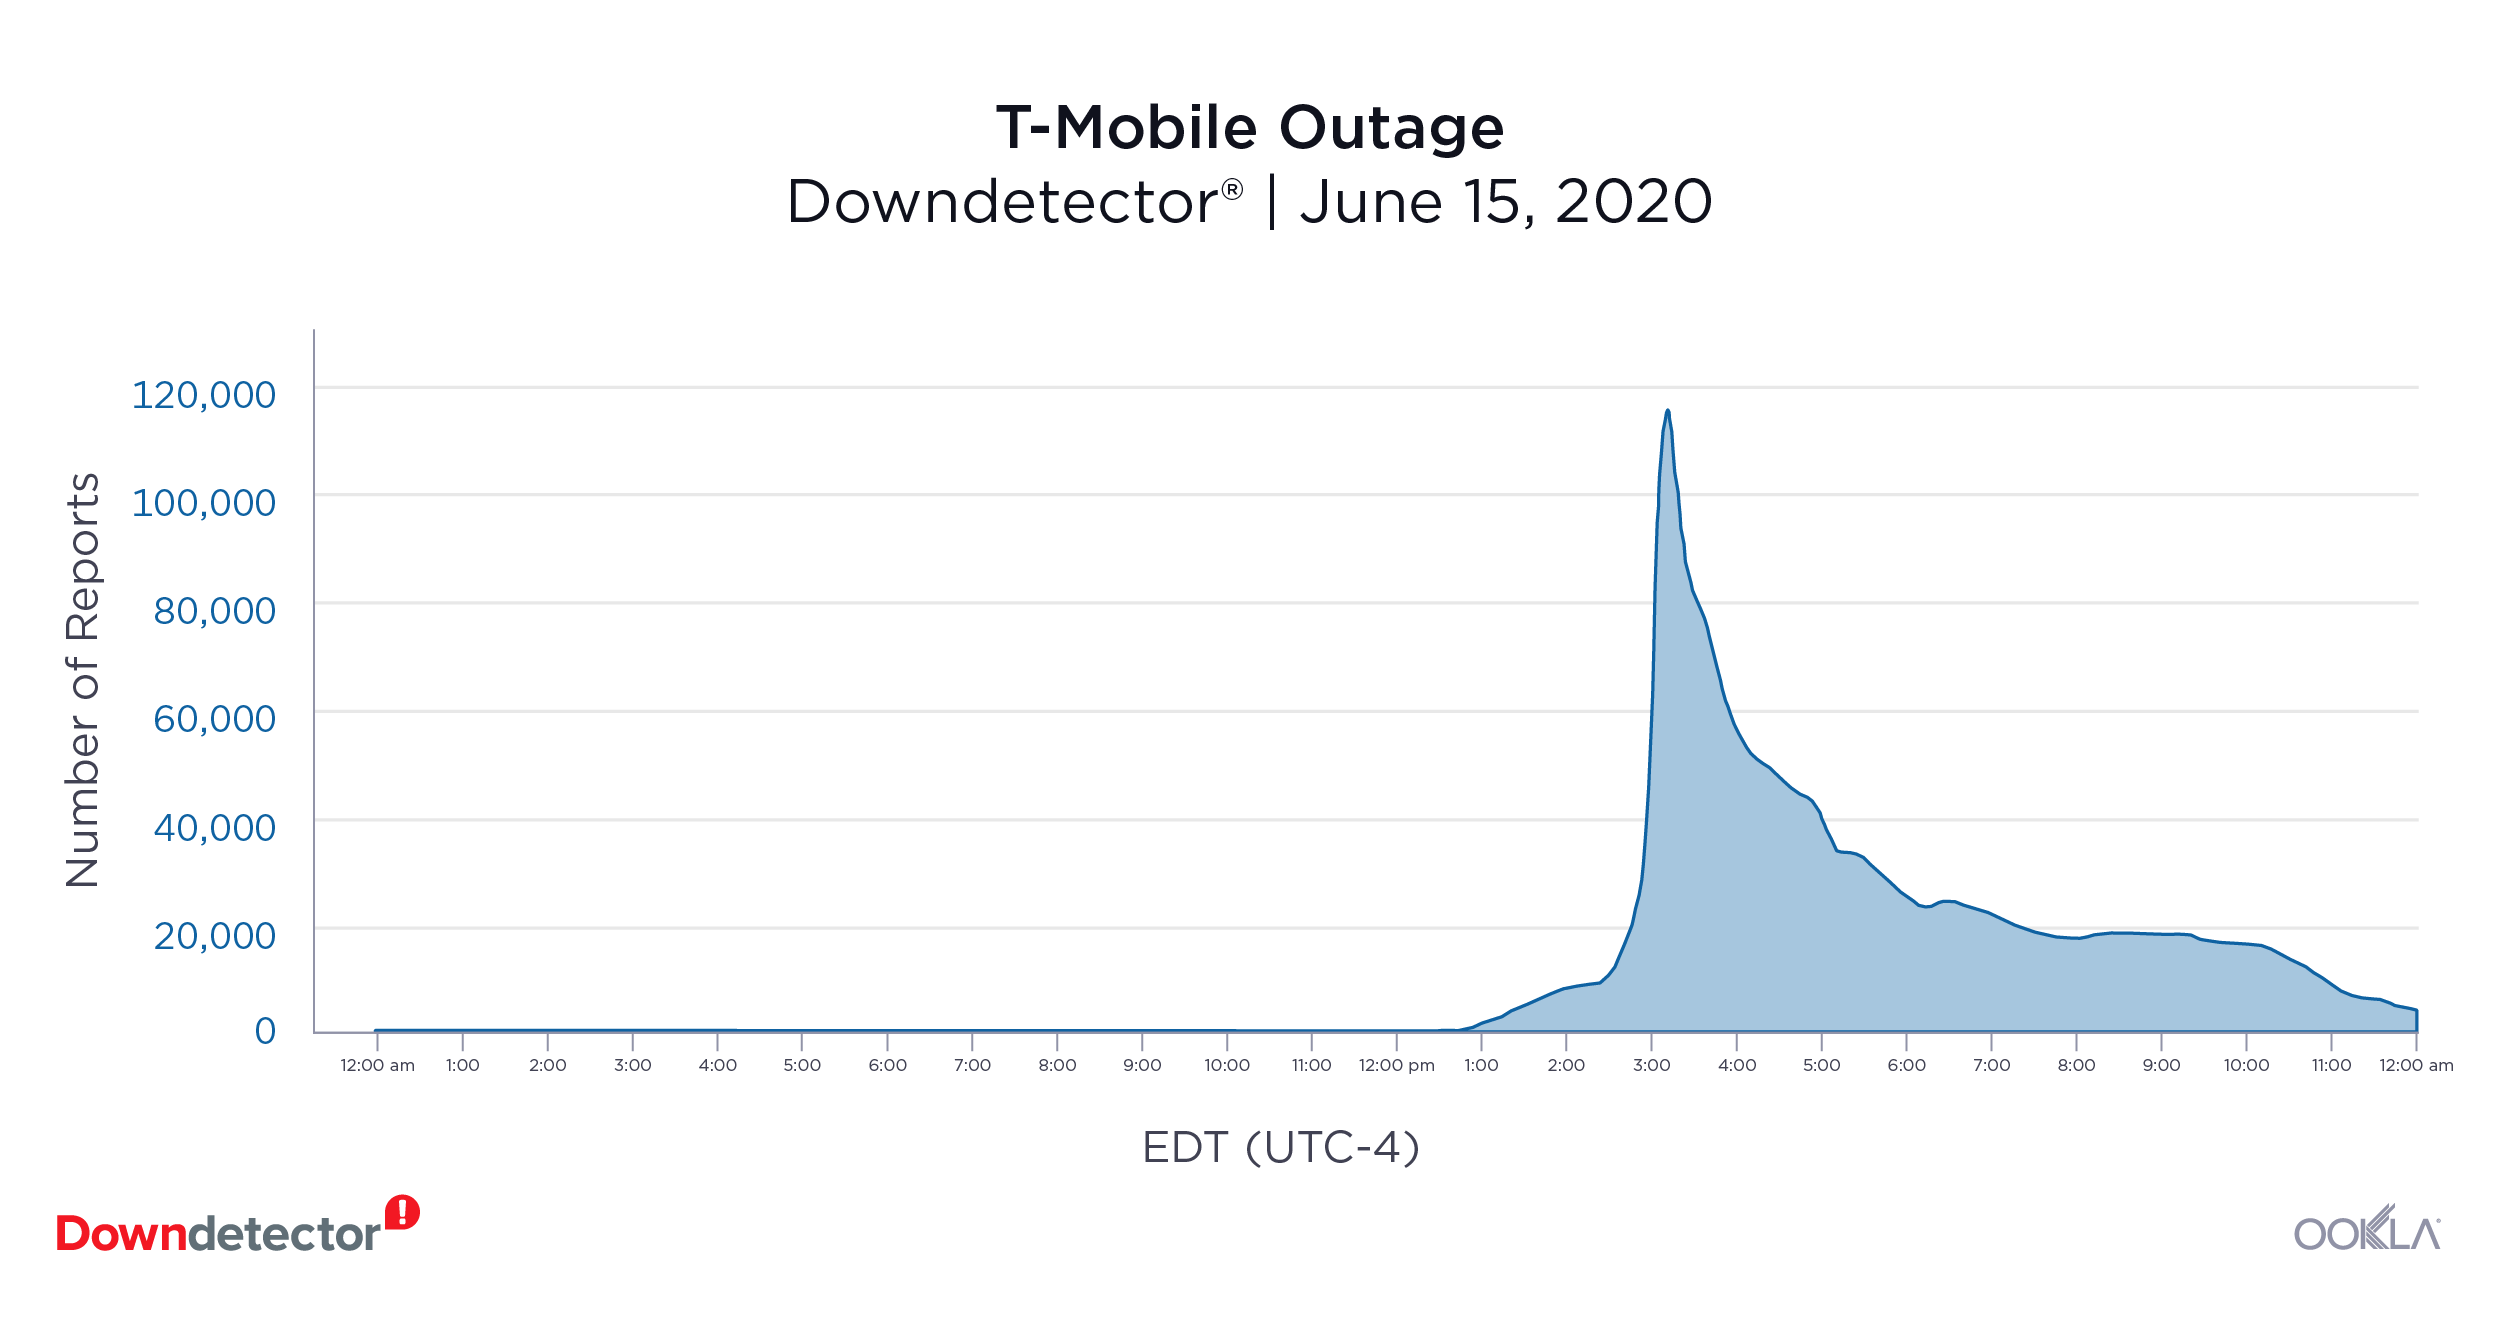
T-Mobile (June 15, 2020): 113,980 reports at peak

U.S. mobile operator T-Mobile suffered a major outage on June 15. Customers reported problems with their mobile phone service, mobile internet connection and their ability to text friends and family. Reports came in over a period of almost ten hours that evening, peaking with 113,980 reports in one 15-minute period. Other mobile network operators also received a significant volume of problem reports that day as their own customers were unable to reach T-Mobile customers, leading to perceived service issues.

U.K. Mobile Operators: Virgin Media (April 27), TalkTalk (May 29) and Vodafone (June 9)

U.K. telecom providers Virgin Media, TalkTalk and Vodafone each struggled with outages in Q2 2020. Virgin Media UK customers rushed to Downdetector on April 27 when they started having problems with their service. Users reported problems throughout the day over a period of about six hours. About 77% of Downdetector reports cited a problem with their cable internet service. The outage had multiple peaks during the day, with 40,397 reports during the highest peak.

TalkTalk users reported problems with their internet connection on May 29, with a peak of 31,942 user reports. According to Downdetector data, the majority of reports came from Manchester, London, Glasgow and Birmingham.

On June 9, Vodafone UK experienced a smaller, but not insignificant outage. During the outage, 94% of Downdetector problem reports cited issues with the mobile network service. At the peak of reported issues, 9,686 Downdetector users reported problems with the network.

Telcel (May 27, 2020): 5,091 reports at peak

Customers of Mexican operator Telcel reported problems with their network on May 27. Over 5,000 reports were recorded during the peak of problem reporting, 95% of which were about Telcel’s mobile network. Most reports came from Mexico City.

Collaboration platforms

Downdetector_Zoom_Outage_0720-1

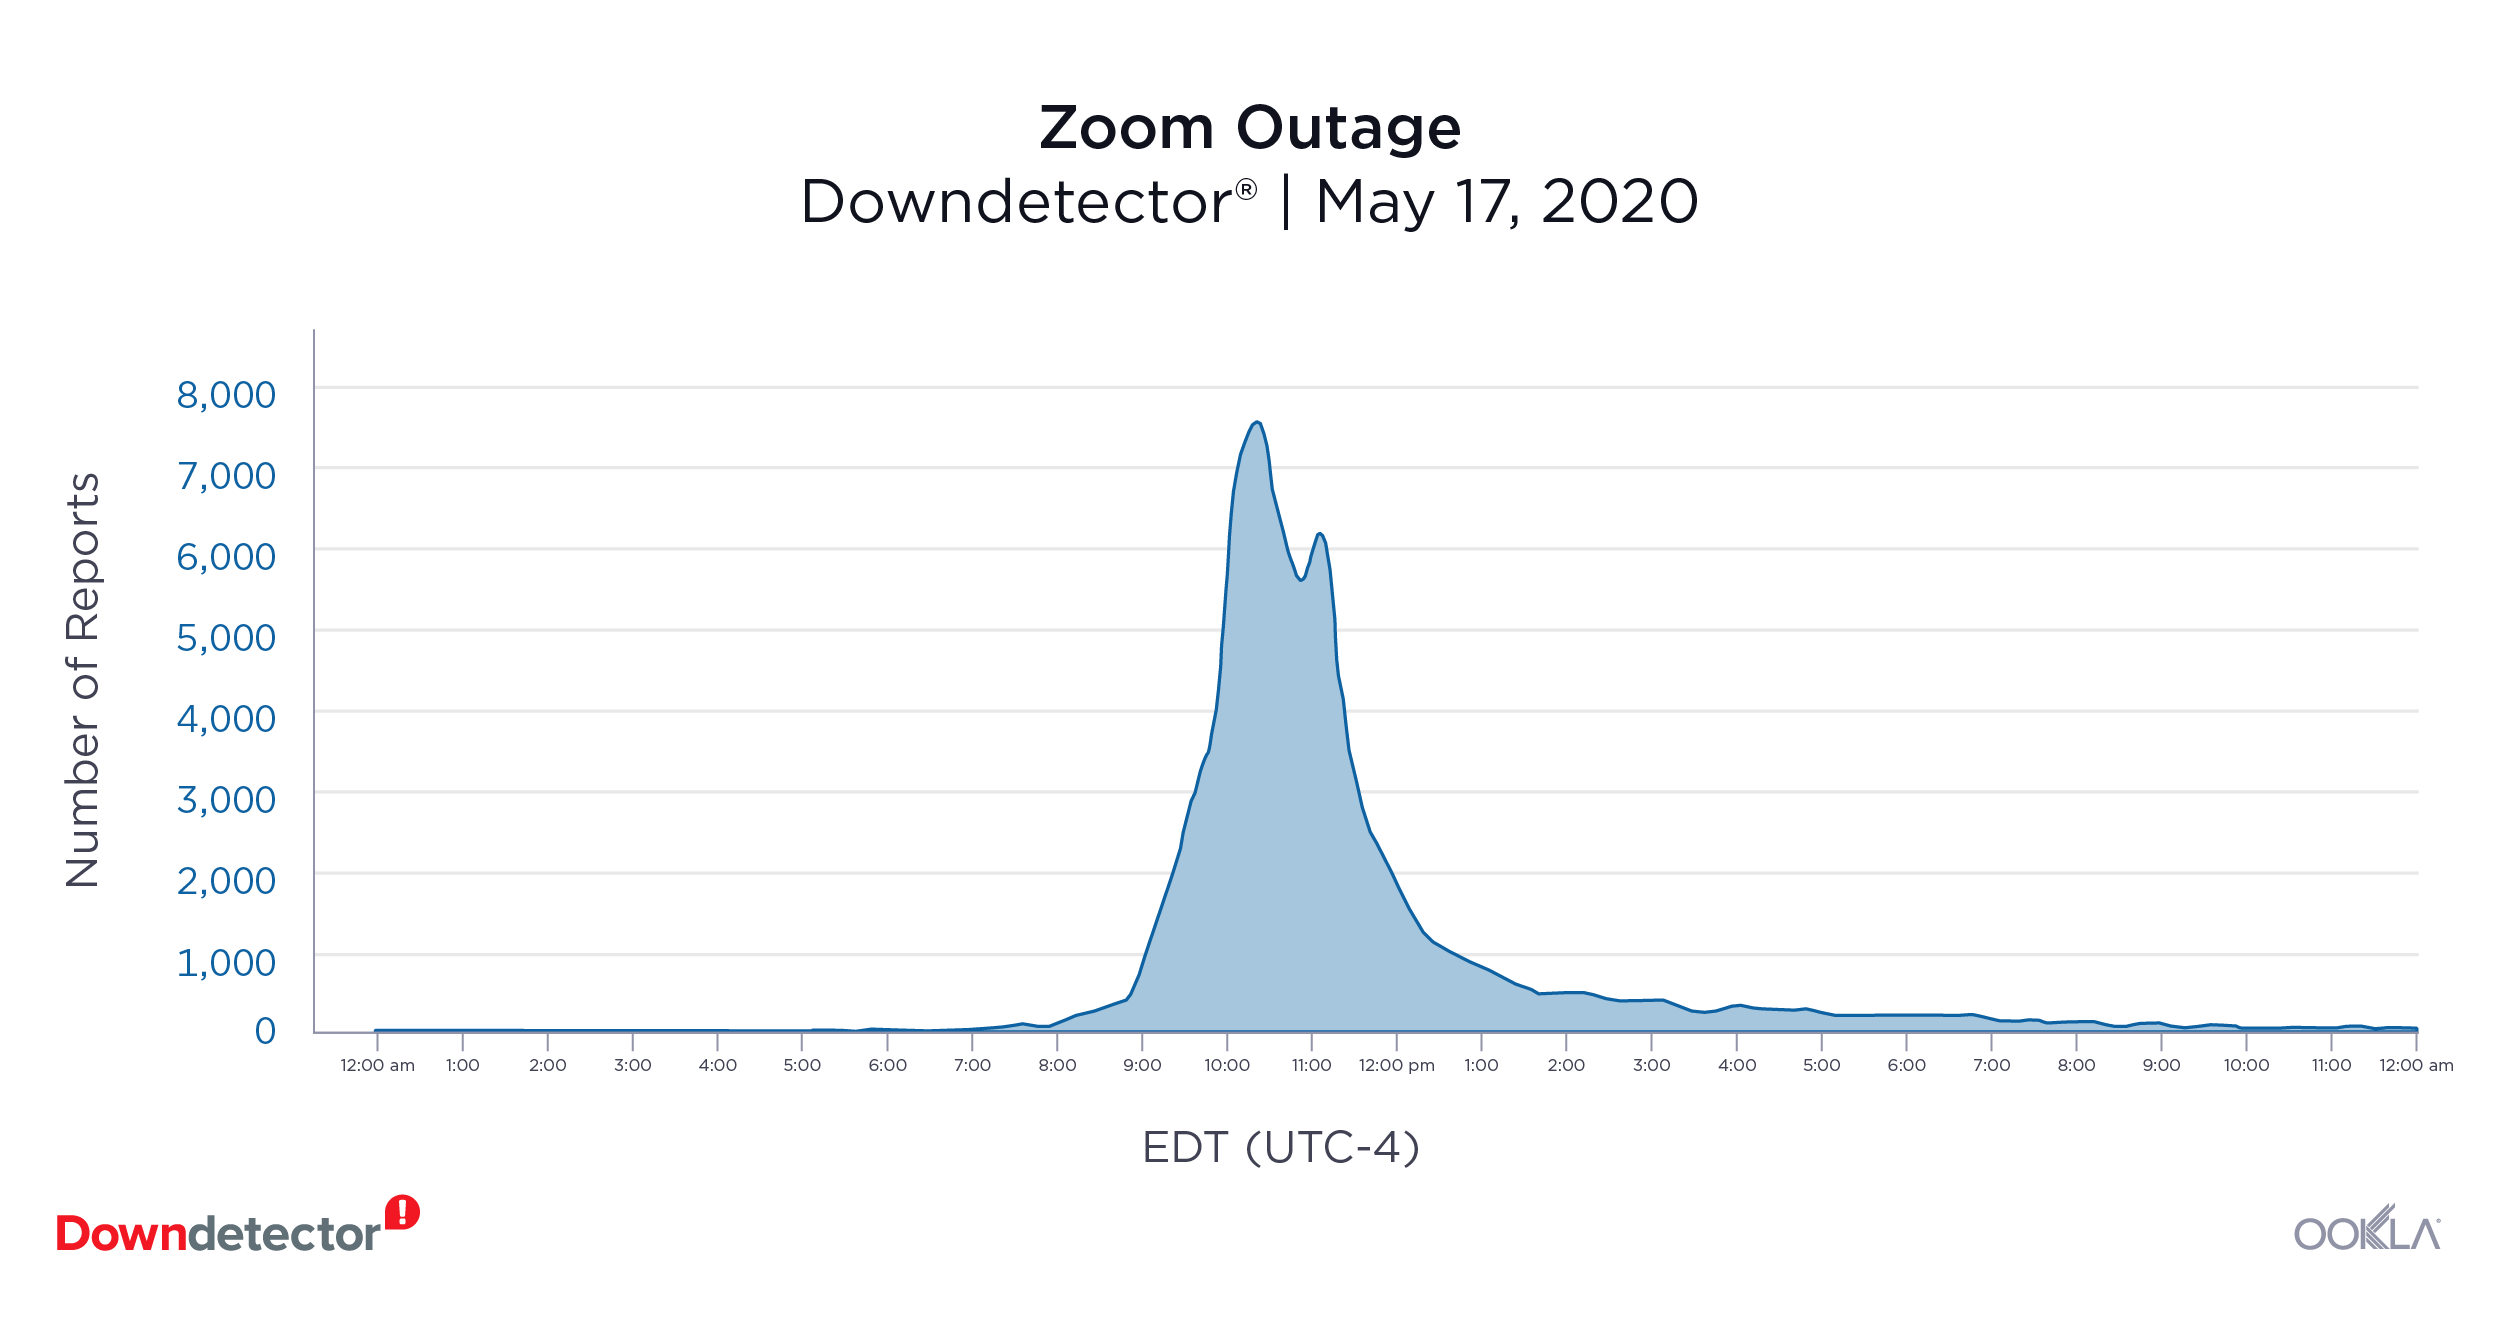
Zoom (May 17, 2020): 7,523 reports at peak

Video conferences and virtual dates were interrupted on May 17 when Zoom experienced problems in multiple countries. Downdetector measured a peak of 7,523 user-reported issues in one 15-minute period in the U.S., but the outage was also felt in Europe. Most users reported problems with the video conferencing feature of the online service.

Slack (May 12, 2020): 4,163 reports at peak

The popular business communication provider Slack experienced a disruption in their service on May 12, with a peak of 4,163 user-reported issues in 15 minutes. Most users who reported problems on Downdetector were located in San Francisco, Los Angeles, San Jose, and Seattle. Most reports pointed to problems connecting to the online service.

Office 365 (June 14, 2020): 2,056 reports at peak

On June 14, Australian users of Microsoft’s subscription service Office 365 reported issues, with a peak of 2,056 over 15 minutes. Users were unable to log into any of the Office 365 apps and experienced problems connecting to the server. Users in New Zealand also reported issues that day.

Gaming

Downdetector_CallofDuty_Outage_0720-2

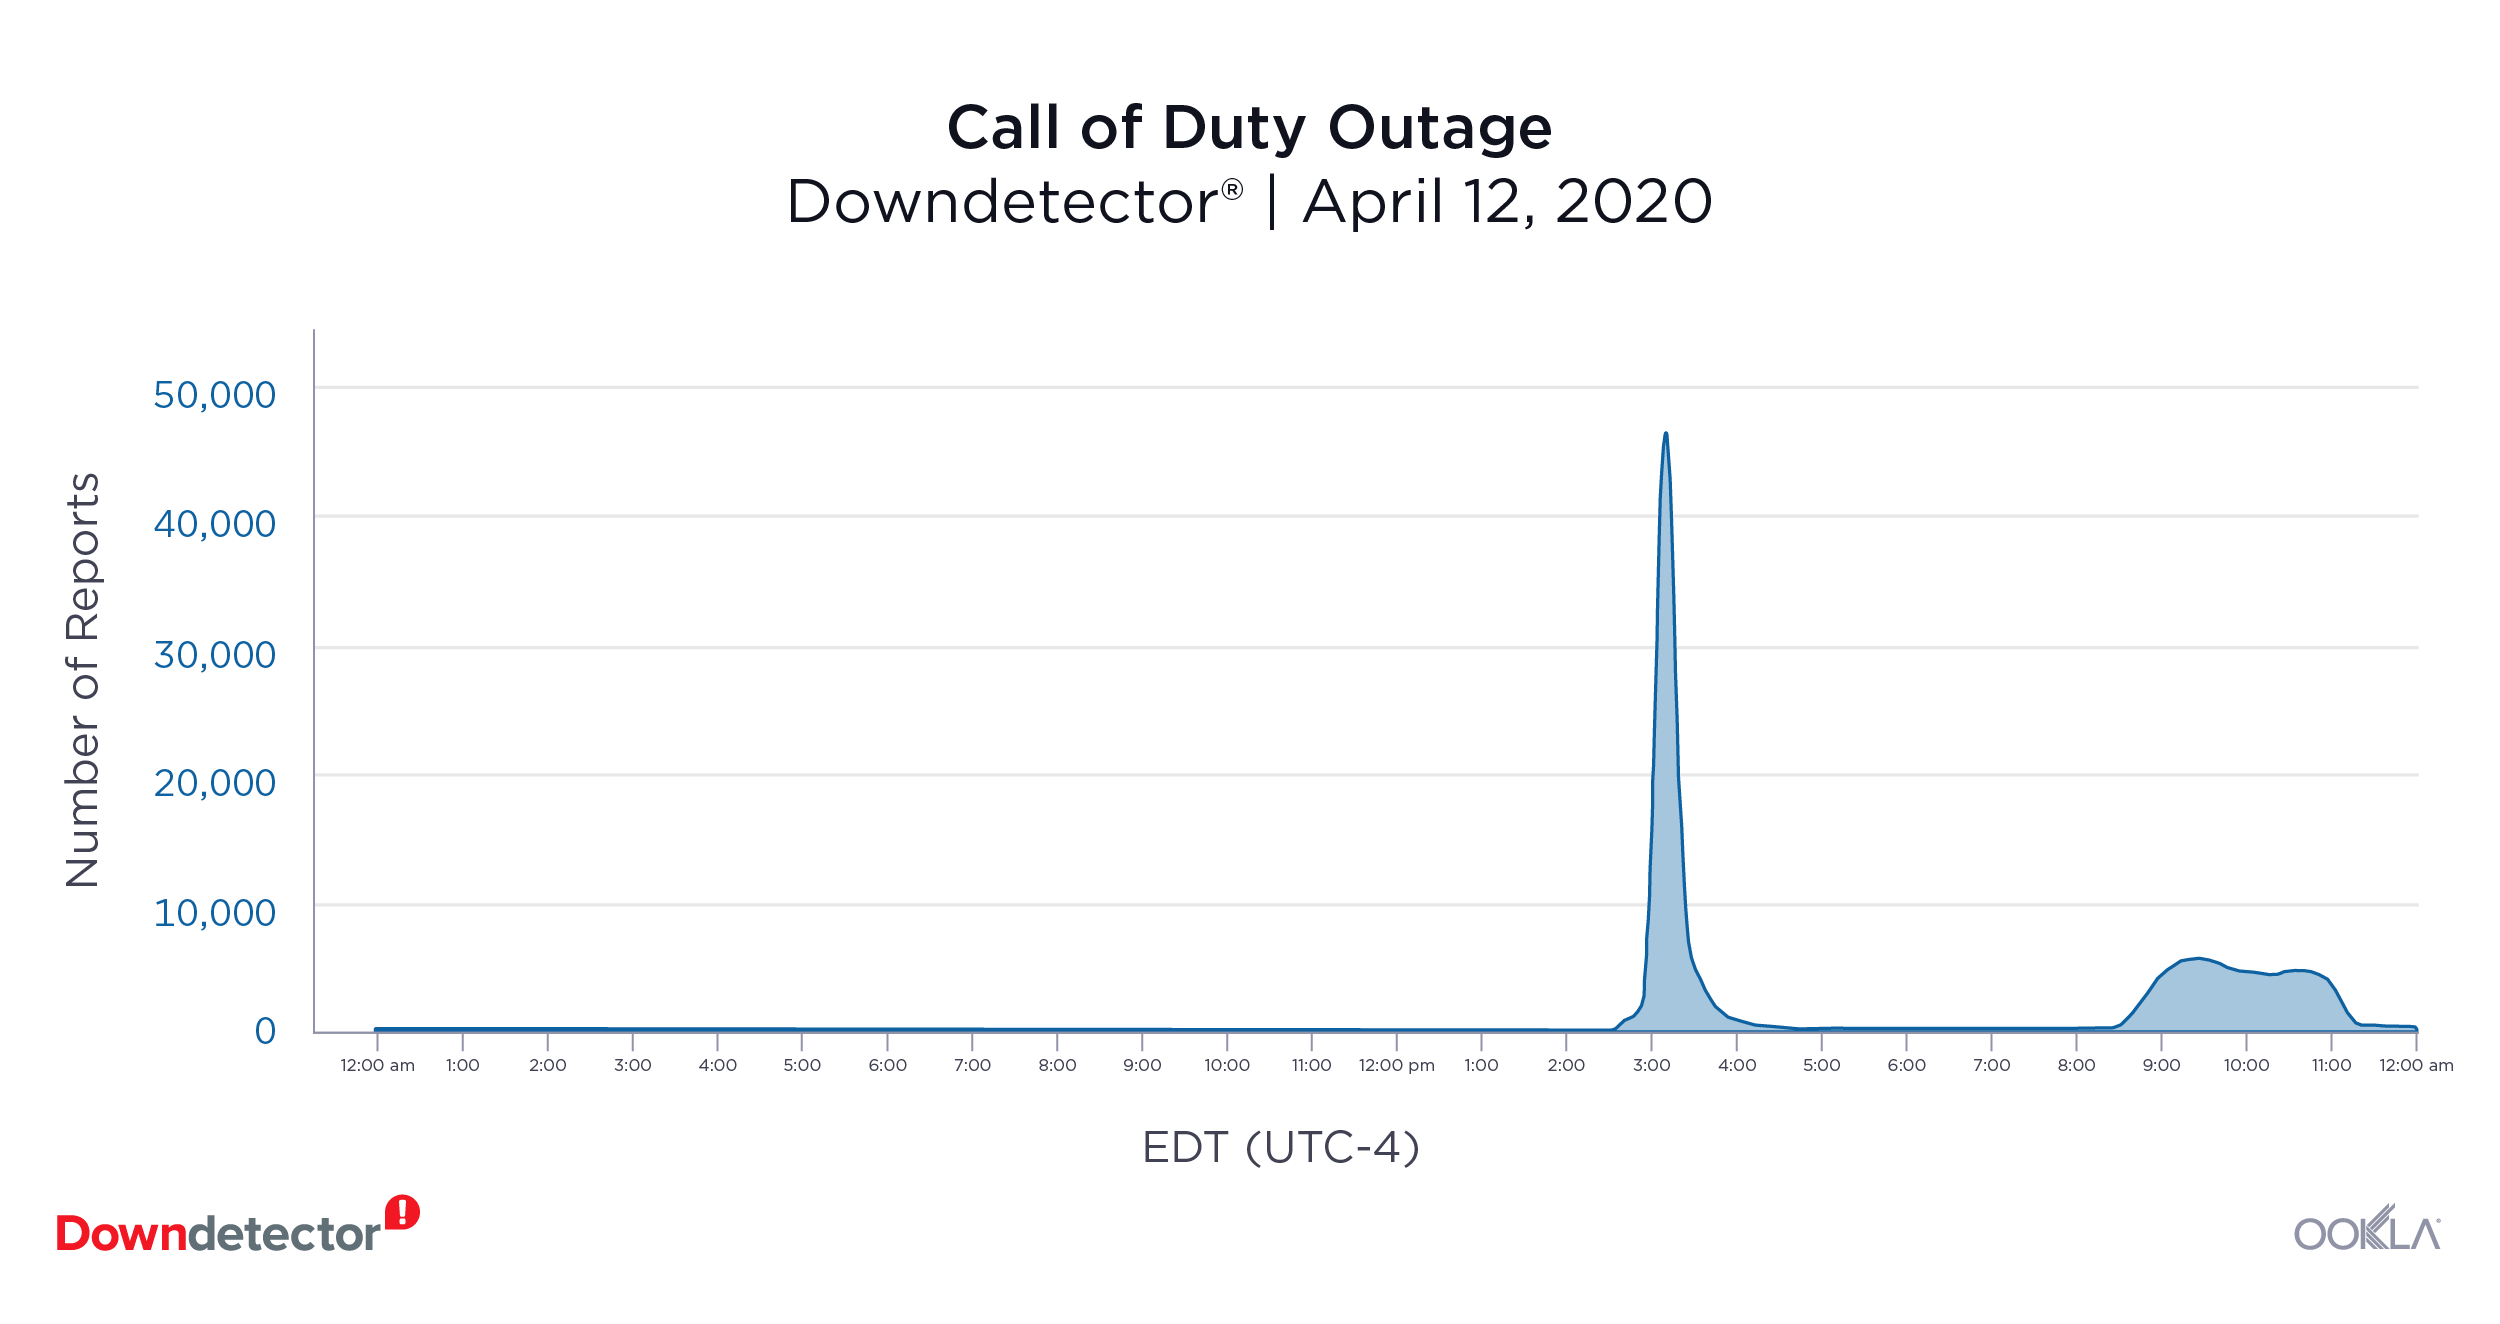
Call of Duty (April 12, 2020): 46,278 reports at peak

U.S. players of Call of Duty were unable to connect to the game’s servers on April 12. Users from Dallas, Chicago, Houston, Philadelphia and New York City flooded Downdetector with reports when they encountered problems with the game. At the peak of Downdetector reports, more than 46,000 users reported issues.

Financial institutions

Downdetector_BBVA_Outage_0720-1

BBVA Bancomer (June 10, 2020): 1,198 reports at peak

On June 10, customers of BBVA Bancomer in Mexico reported issues with their online banking service. More than 1,000 reports were recorded at the peak of reporting, with many users unable to log in or use the app over a period of approximately four hours The majority of reported issues came from Mexico City, Guadalajara and Monterrey.

Want to know when an online service is down? Keep up with outages by visiting Downdetector.

Ookla retains ownership of this article including all of the intellectual property rights, data, content graphs and analysis. This article may not be quoted, reproduced, distributed or published for any commercial purpose without prior consent. Members of the press and others using the findings in this article for non-commercial purposes are welcome to publicly share and link to report information with attribution to Ookla.

| June 16, 2021

How COVID-19 Affected Roaming for Mobile Speeds in Europe

Roaming might seem like an unusual topic in a time when inter-country travel has been largely prohibited, but we wanted to build on our previous analysis to see how roaming performance and behaviors evolved over the past year. This analysis examines Speedtest data from Android devices in the European Union (E.U.) and the United Kingdom (U.K.) from Q1 2020 through Q1 2021. We’ve included the U.K. to maintain continuity with pre-Brexit reports.

Roaming speeds were slower in most European countries in Q1 2021

Speedtest Intelligence® again showed that consumers who are roaming outside their home countries often experience slower speeds. During Q1 2021, 19 out of the 26 European countries with statistically viable roaming sample sizes experienced slower median roaming download speeds than median local download speeds. Cyprus and Malta had too few roaming samples to be included in this year’s analysis for Q1 2021.

For the seven countries that saw increased speeds, Latvians experienced the largest increase in median download speed when roaming elsewhere in Europe at 23.4%, which was followed closely by Estonia (22.8%) and Ireland (19.5%). Greece, Romania and Slovenia saw increases of more than 5%. The U.K. saw about the same speeds roaming and locally with an increase of only 0.5% when roaming. Hungary also saw comparable roaming download speeds to local speeds with a decrease of only 0.5% when roaming.

Median Local vs. Roaming Download Speeds in Europe
Speedtest Intelligence® | Q1 2021
Country Local Download (Mbps) Roaming Download (Mbps) % Change
Austria 36.19 26.13 -27.8%
Belgium 43.90 27.52 -37.3%
Bulgaria 61.76 29.74 -51.8%
Croatia 48.23 31.3 -35.1%
Czechia 31.35 19.74 -37.0%
Denmark 50.11 22.18 -55.7%
Estonia 34.34 42.16 22.8%
Finland 43.02 31.68 -26.4%
France 34.68 29.62 -14.6%
Germany 27.56 20.14 -26.9%
Greece 32.38 35.51 9.7%
Hungary 28.66 28.51 -0.5%
Ireland 14.99 17.91 19.5%
Italy 25.24 21.66 -14.2%
Latvia 22.69 28.00 23.4%
Lithuania 33.66 30.80 -8.5%
Luxembourg 40.65 26.31 -35.3%
Netherlands 77.52 26.48 -65.8%
Poland 26.51 23.13 -12.7%
Portugal 26.16 23.74 -9.3%
Romania 25.12 26.80 6.7%
Slovakia 23.79 20.94 -12.0%
Slovenia 27.63 29.58 7.1%
Spain 23.78 18.21 -23.4%
Sweden 38.26 23.16 -39.5%
United Kingdom 27.96 28.09 0.5%

Every other country on our list saw decreases in median download speeds of 8.5% or more while roaming, with customers from the Netherlands experiencing the largest drop (65.8%) from a local speed of 77.52 Mbps to 26.48 Mbps while roaming. Customers from Denmark and Bulgaria experienced roaming speeds less than half of what they’re accustomed to at home with decreases of 55.7% and 51.8%, respectively.

Roaming decreased during the pandemic while speeds increased

The COVID-19 pandemic has upended countless lives with multiple lockdowns throughout 2020 and 2021 and severe limits to movement across borders. Data from Speedtest Intelligence reflects this decrease in roaming with roaming samples markedly down when comparing Q1 2021 to Q1 2020. We saw the most roaming samples during Q3 2020 and Q1 2020, which corresponds to increased lockdowns and movement restrictions in Q2 and Q4 2020 in response to the first and second waves of the pandemic.

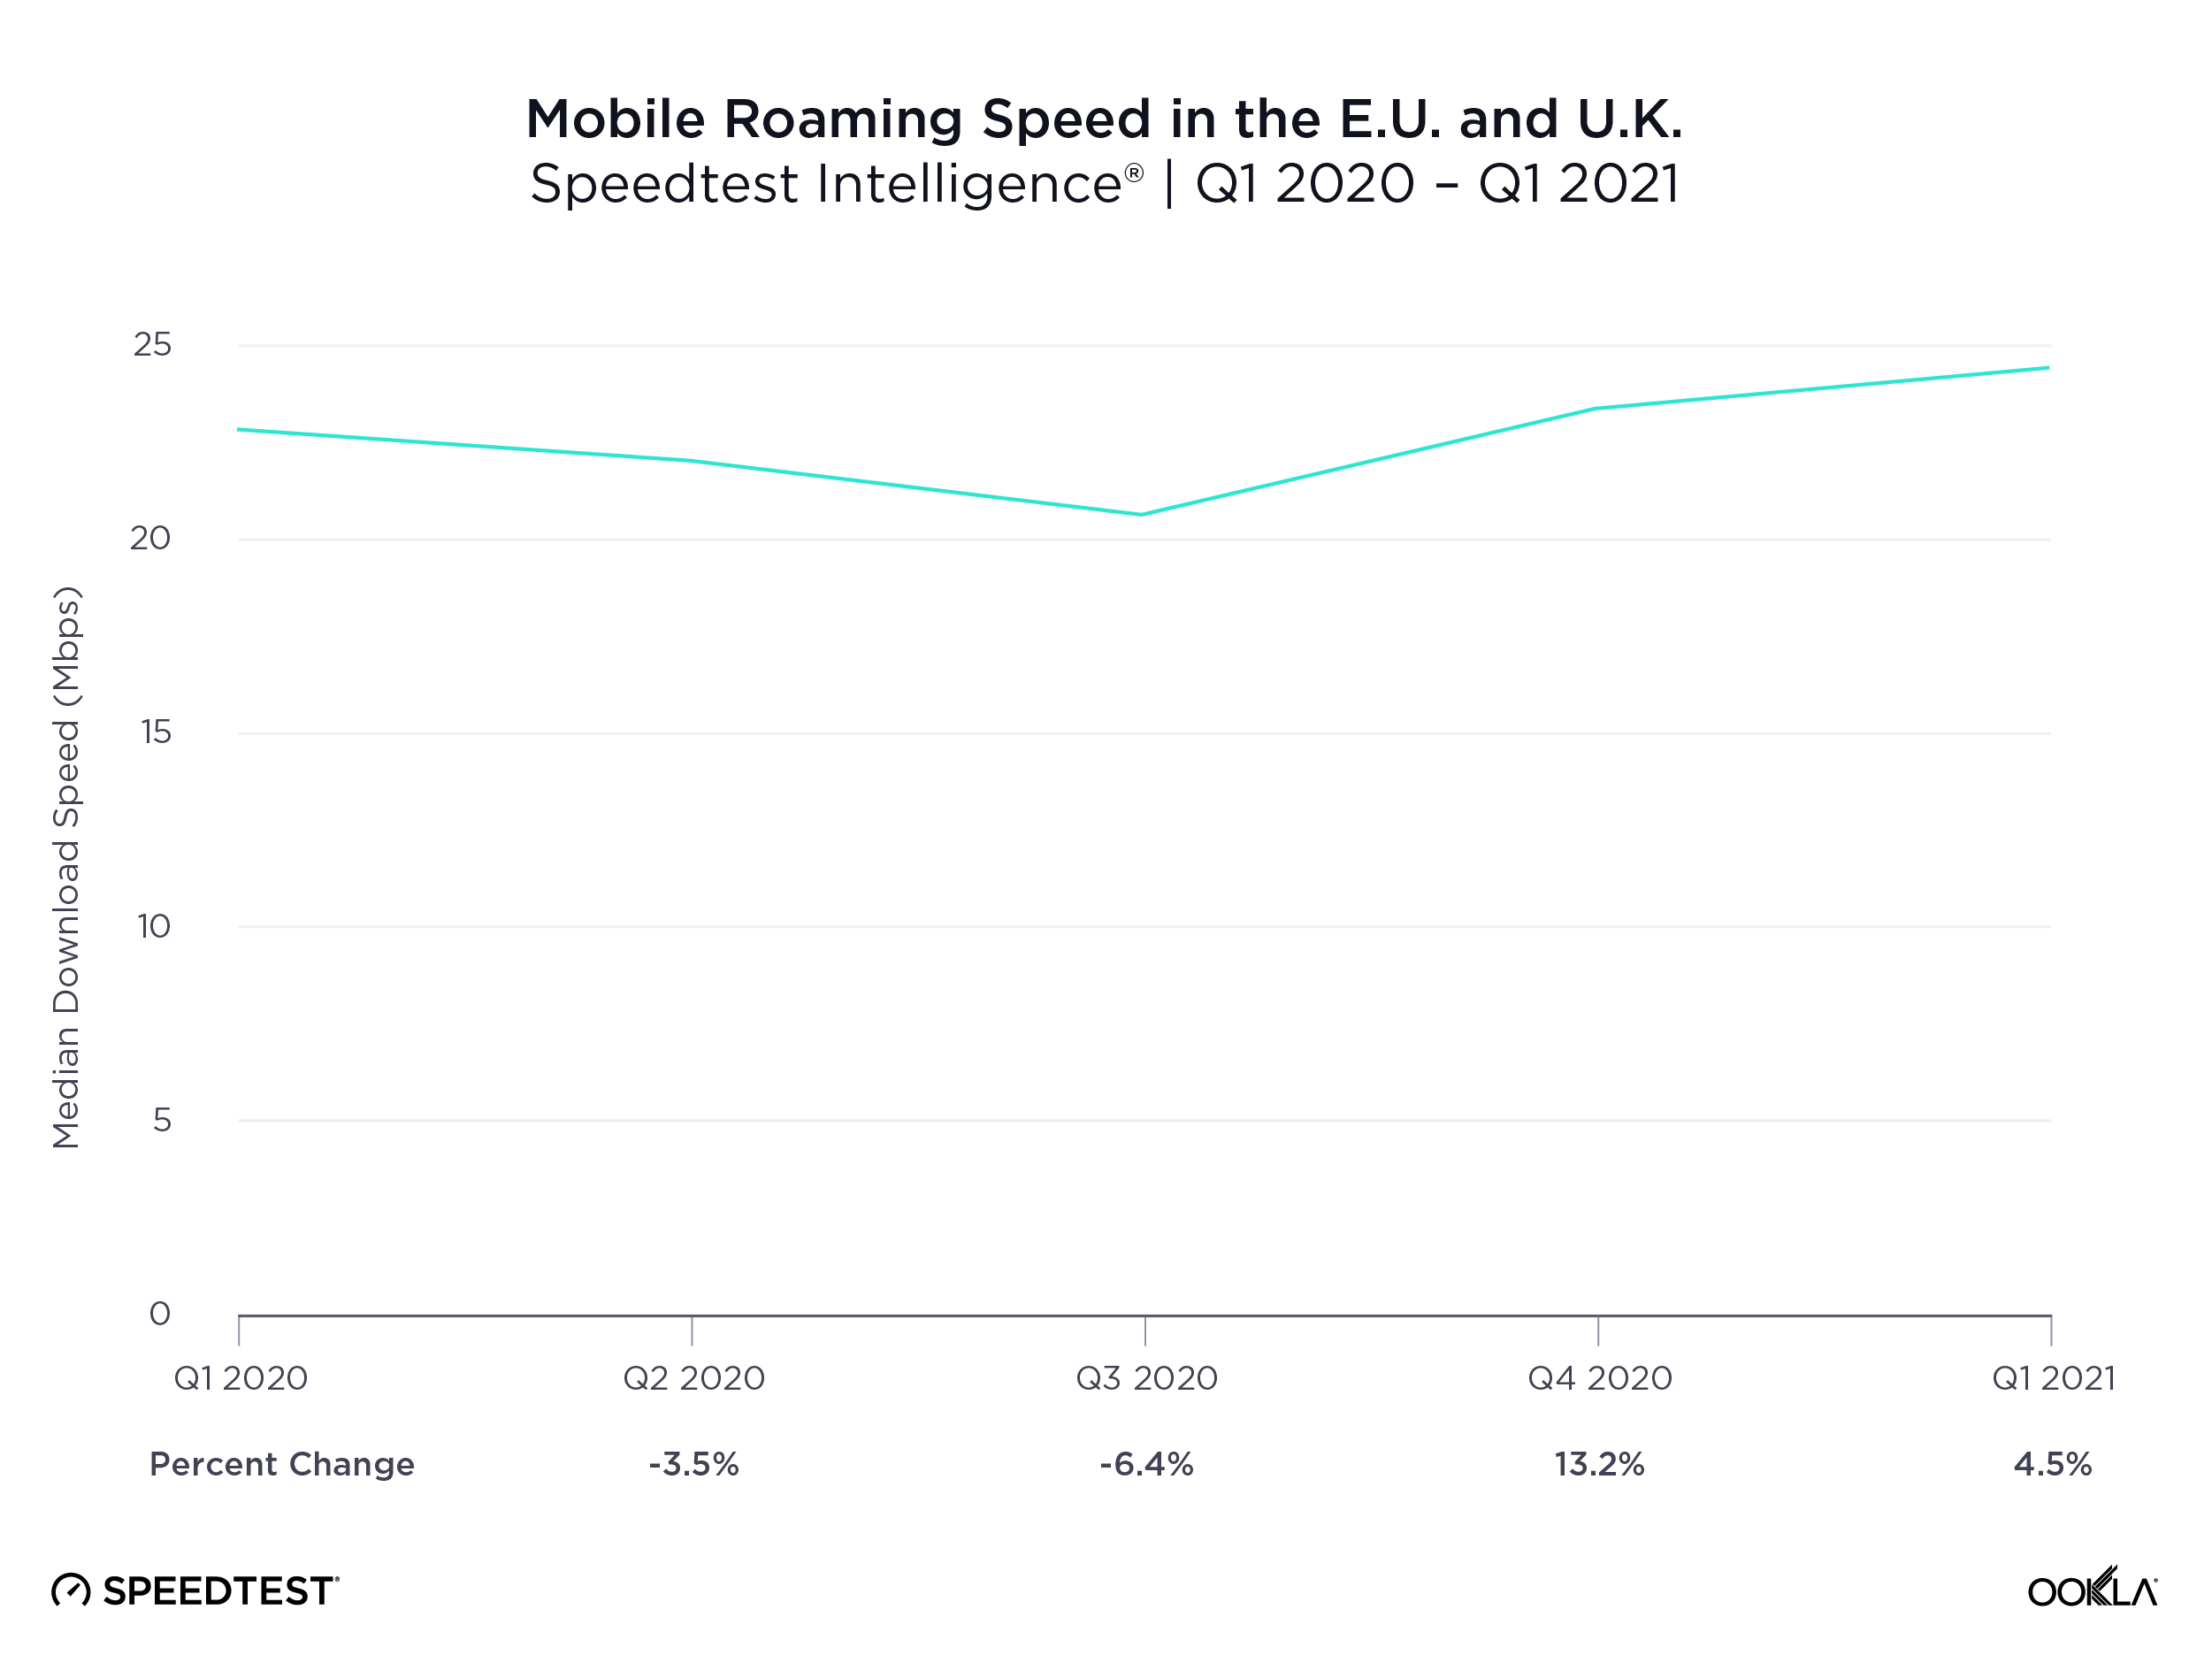
Roaming speeds for all European countries combined increased 6.9% between Q1 2020 and Q1 2021, though the increase was not linear. Median download speed while roaming decreased from 22.89 Mbps in Q1 2020 to 22.09 in Q2 2020 and slipped down to 20.68 Mbps in Q3 2020. Roaming speeds began to increase in Q4 2020 with the median download speed rising to 23.42 Mbps, and Q1 2021 saw a further increase to 24.47 Mbps.

ookla_roaming_quarter_change_eu_0621-1

Estonia saw the biggest year-over-year increase in median roaming download speed, Slovakia and Italy saw the largest decrease

Median European Roaming Download Speeds
Speedtest Intelligence® | Q1 2020 – Q1 2021
Country Q1 2020 Download (Mbps) Q1 2021 Download (Mbps) % Change
Europe (All Countries Combined) 22.89 24.47 6.9%
Austria 24.39 26.13 7.1%
Belgium 23.78 27.52 15.7%
Bulgaria 22.81 29.74 30.4%
Croatia 29.28 31.30 6.9%
Czechia 20.23 19.74 -2.4%
Denmark 21.38 22.18 3.7%
Estonia 27.82 42.16 51.5%
Finland 32.18 31.68 -1.6%
France 24.57 29.62 20.6%
Germany 20.74 20.14 -2.9%
Greece 41.07 35.51 -13.5%
Hungary 25.10 28.51 13.6%
Ireland 22.08 17.91 -18.9%
Italy 26.98 21.66 -19.7%
Latvia 26.38 28.00 6.1%
Lithuania 22.60 30.80 36.3%
Luxembourg 18.82 26.31 39.8%
Netherlands 18.39 26.48 44.0%
Poland 17.01 23.13 36.0%
Portugal 23.78 23.74 -0.2%
Romania 23.64 26.80 13.4%
Slovakia 26.16 20.94 -20.0%
Slovenia 25.30 29.58 16.9%
Spain 15.05 18.21 21.0%
Sweden 21.36 23.16 8.4%
United Kingdom 29.48 28.09 -4.7%

2020 also posed many challenges for telecom operators around the world as customers shifted use patterns. Despite these challenges, many Europeans saw increases in median roaming speeds year-over-year. In fact, customers in 17 out of the 26 countries analyzed saw faster download speeds while roaming elsewhere in Europe when comparing Q1 2020 to Q1 2021. Estonians saw the largest increase at 51.5% (from 27.82 Mbps to 42.16 Mbps), the Netherlands was next with a 44.0% jump (from 18.39 Mbps to 26.48 Mbps) and Luxembourg saw a 39.8% increase in download speed (from 18.82 Mbps to 26.31 Mbps).

Countries whose customers experienced year-over-year decreases in median downloads speed while roaming include Slovakia (20.0% decrease), Italy (19.7%), Ireland (18.9%), Greece (13.5%), the U.K. (4.7%), Germany (2.9%), Czechia (2.4%), Finland (1.6%) and Portugal (0.2%).

While the year-over-year change is an interesting baseline metric, it’s also important to note only Denmark, Germany, Poland and Spain had consistently slower median roaming download speeds than the European average during every quarter from Q1 2020 to Q1 2021. Every other country had at least one quarter where speeds were faster than the European average.

Outbound roaming speeds varied drastically from country to country from Q1 2020 to Q1 2021

Roaming speeds are heavily dependent on agreements between individual operators, which means they can vary dramatically by country and by operator. We looked closely at outbound roaming for individual countries to see how different countries’ networks performed during COVID-19 lockdowns.

Customers from the Netherlands roaming in France saw the fastest median roaming download speed in all of Europe during Q1 2021 at 70.46 Mbps. Customers from Germany roaming in Portugal experienced the slowest median roaming download speed during Q3 2020 at 0.42 Mbps.

Here were some of the fastest roaming speeds from select countries to other countries within Europe between Q1 2020 and Q1 2021:

  • Netherlands to France (70.46 Mbps in Q1 2021)
  • Bulgaria to the U.K. (58.21 Mbps in Q4 2020)
  • Netherlands to Poland (55.77 Mbps in Q1 2021)
  • Denmark to Sweden (40.46 Mbps in Q4 2020)
  • Finland to Estonia (48.41 Mbps in Q1 2020)

Here were some of the slowest roaming speeds between Q1 2020 and Q1 2021:

  • Germany to Portugal (0.42 Mbps in Q3 2020)
  • Czechia to France (4.98 Mbps in Q3 2020)
  • France to Portugal (5.54 Mbps in Q3 2020)
  • Hungary to France (5.95 Mbps in Q3 2020)
  • Poland to Belgium (7.59 Mbps in Q1 2020)

We’ll continue to watch roaming speeds over the next year to see how roaming changes as more countries reopen and travel picks up again. If you’re interested in learning more about roaming speeds for your business or country, please click here.

Ookla retains ownership of this article including all of the intellectual property rights, data, content graphs and analysis. This article may not be quoted, reproduced, distributed or published for any commercial purpose without prior consent. Members of the press and others using the findings in this article for non-commercial purposes are welcome to publicly share and link to report information with attribution to Ookla.

| July 27, 2021

Oslo Tops the List of World Capitals with the Fastest 5G in Q1-Q2 2021

Mobile operators are rapidly expanding 5G deployments across the globe, with 16,410 new 5G deployments across 109 countries added to the Ookla 5G Map in June 2021 alone. Huge investments in 5G are being made to increase performance, especially in major cities. We used Speedtest Intelligence® to see which world capitals have the best 5G speeds and availability, based on locations with commercially available 5G during Q1-Q2 2021.

Oslo, Norway was the fastest world capital for 5G during Q1-Q2 2021

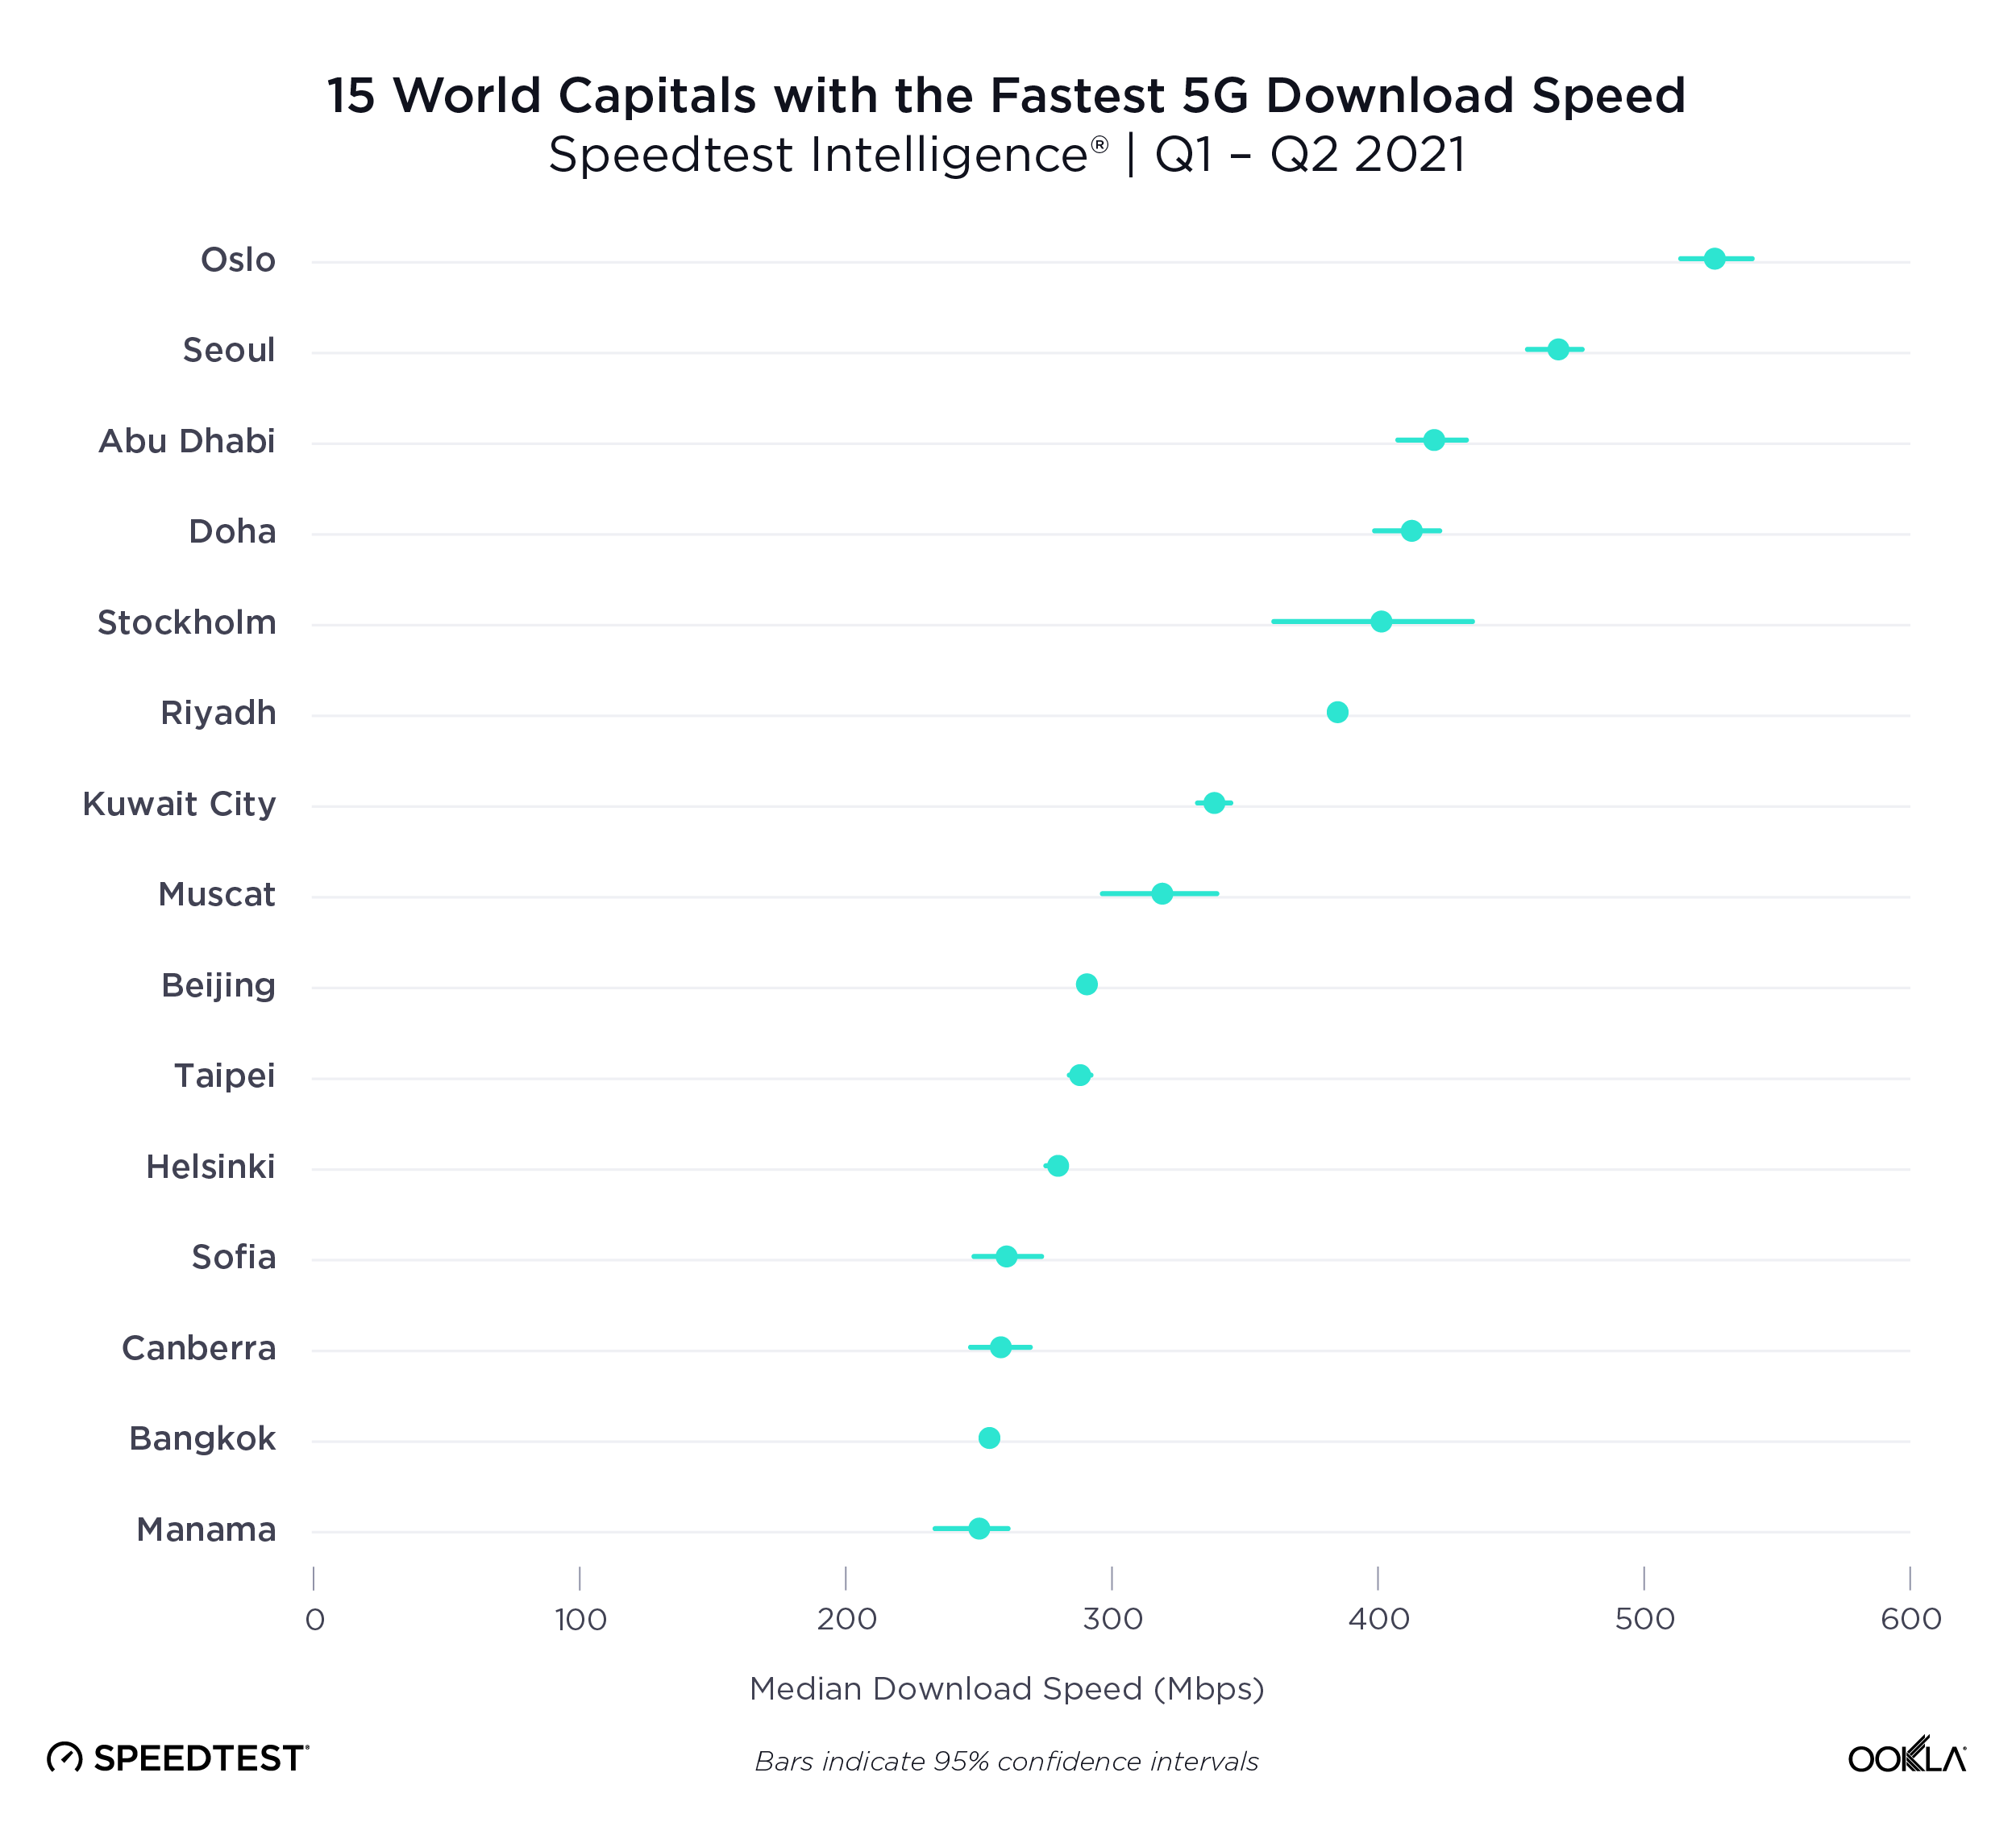
ookla_fastest_5g_download_speed_world_capitals_0721

The race for fastest 5G performance among world capitals was extremely competitive during Q1-Q2 2021. Oslo, Norway had the fastest 5G of any world capital, clocking in with a median download speed of 526.74 Mbps. Seoul, South Korea had the second fastest median download speed over 5G at 467.84 Mbps; Abu Dhabi, United Arab Emirates was third (421.26 Mbps); Doha, Qatar fourth (413.40 Mbps) and Stockholm, Sweden fifth (401.30 Mbps). Riyadh, Saudi Arabia (384.66 Mbps); Kuwait City, Kuwait (338.97 Mbps), Muscat, Oman (318.95 Mbps); Beijing, China (291.19 Mbps); and Taipei, Taiwan (287.86 Mbps); rounded out the top 10. Helsinki, Finland showed a median 5G download speed of 279.59 Mbps; Sofia, Bulgaria 260.55 Mbps; Canberra, Australia 258.39 Mbps; Bangkok, Thailand 253.73 Mbps; Manama, Bahrain 249.71; Dublin, Ireland 223.01; Luxembourg City, Luxembourg 209.98 Mbps; Paris, France 208.48 Mbps and Bucharest, Romania 203.44 Mbps.

We saw median 5G download speeds between 150 Mbps and 200 Mbps in the following world capitals during Q1-Q2 2021: Ottawa, Canada (196.11 Mbps); Hanoi, Vietnam (195.99 Mbps); Bratislava, Slovakia (188.23 Mbps); Madrid, Spain (183.37 Mbps); Bern, Switzerland (175.69 Mbps); Rome, Italy (171.79 Mbps); London, United Kingdom (167.50 Mbps); Tokyo, Japan (167.02 Mbps); Athens, Greece (164.95 Mbps); Copenhagen, Denmark (162.75 Mbps); Ljubljana, Slovenia (158.50 Mbps); Hong Kong (153.78) and Washington, D.C., United States (151.80 Mbps).

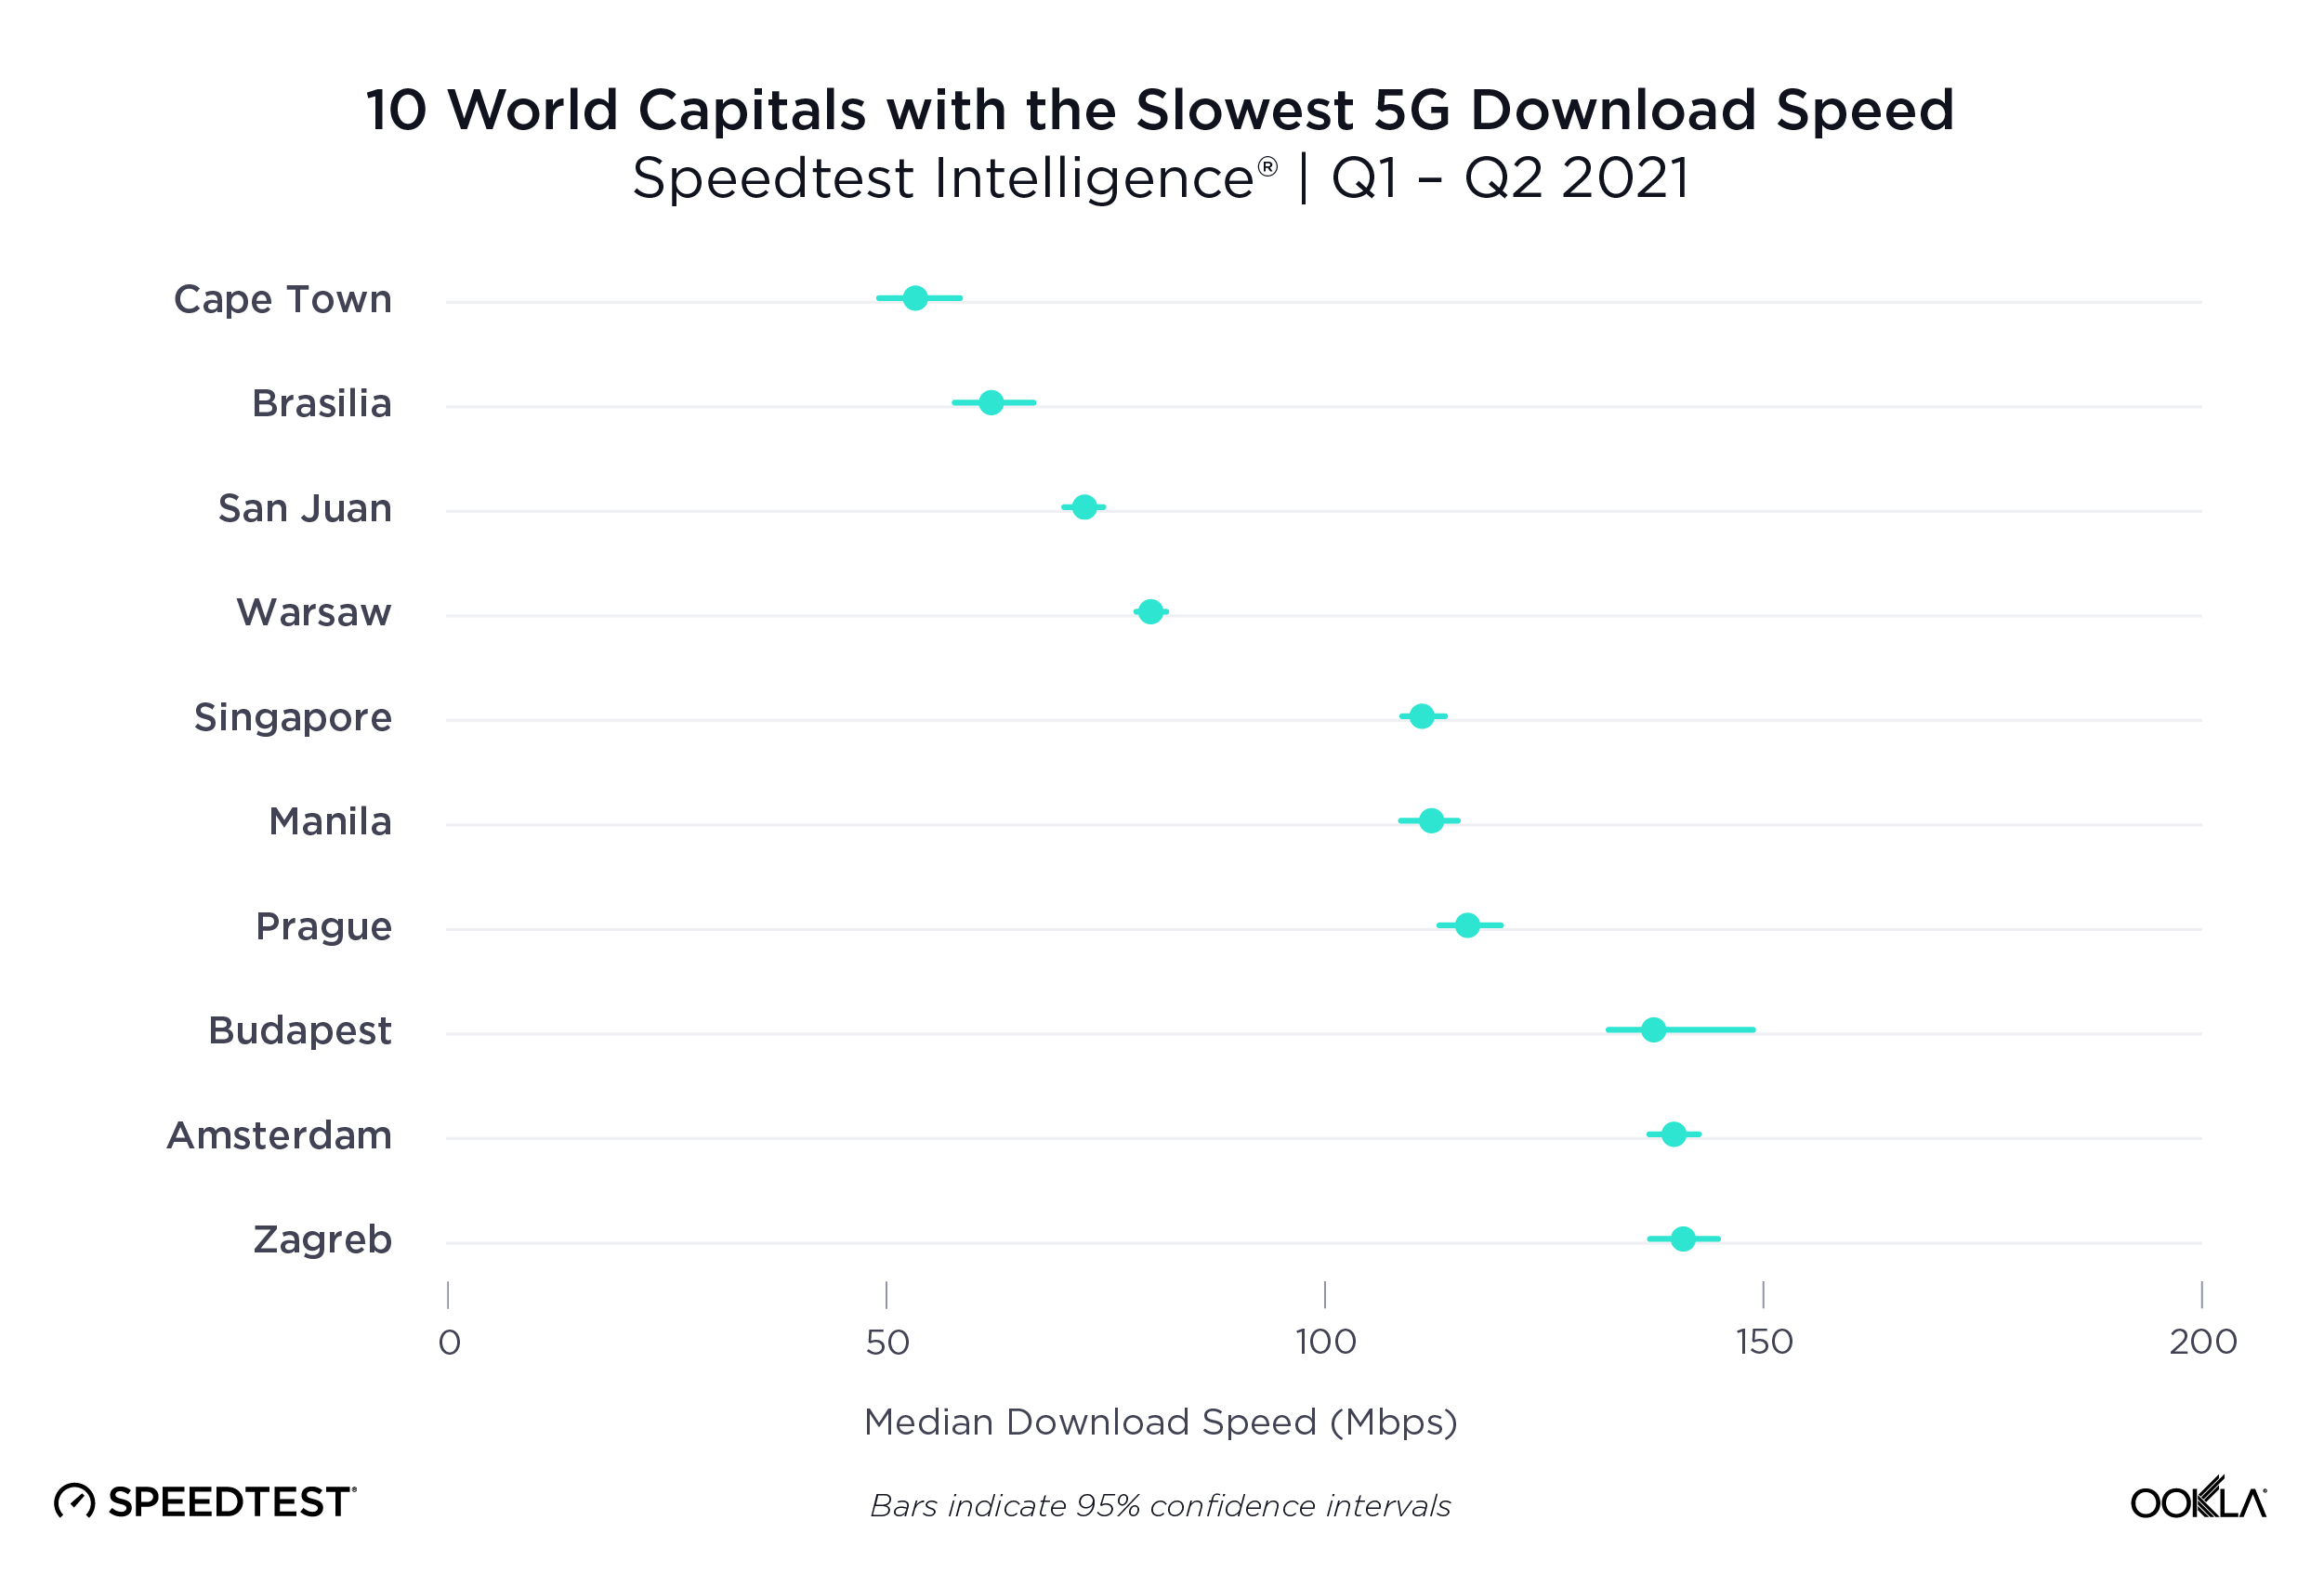
Cape Town, South Africa was the slowest world capital for 5G in Q1-Q2 2021

ookla_slowest_5g_download_speed_world_capitals_0721

Speedtest Intelligence shows Capetown, South Africa had the slowest median download speed over 5G during Q1-Q2 2021 at 53.33 Mbps. Other world capitals with slower median 5G download speeds included: Brasilia, Brazil (62.18 Mbps); San Juan, Puerto Rico (72.59 Mbps); Warsaw, Poland (80.18 Mbps); Singapore (111.20 Mbps); Manila, Philippines (112.23 Mbps); Prague, Czechia (116.30 Mbps); Budapest, Hungary (137.54 Mbps); Amsterdam, Netherlands (139.75 Mbps); Zagreb, Croatia (140.92 Mbps); Vienna, Austria (144.93 Mbps); Jerusalem, Israel (145.17 Mbps); and Berlin, Germany (148.16 Mbps).

Capitals not mentioned on either of these lists did not have sufficient 5G samples during Q1-Q2 2021 to be included in this report.

The fastest 5G speeds are yet to come

5G is rapidly improving across the world and we’re eager to see how countries, cities and operators continue to perform during Q3 2021 and beyond. If you want to see how your 5G network performs against these benchmarks, please download the Android or iOS app, and take a Speedtest®. Learn more about 5G provider performance in select cities here, and visit the Ookla 5G MapTM to see which providers are offering 5G in your area.

Editor’s note: This article was updated on July 28 to reorganize the content for clarity.

Ookla retains ownership of this article including all of the intellectual property rights, data, content graphs and analysis. This article may not be quoted, reproduced, distributed or published for any commercial purpose without prior consent. Members of the press and others using the findings in this article for non-commercial purposes are welcome to publicly share and link to report information with attribution to Ookla.

| December 8, 2021

Belgium Falls Behind EU Peers, Faces 5G Regulatory Challenges


Lees in het Vlaams | Lire en français

Belgium represents an important cornerstone to the European community and is home to the Council of the European Union, the European Commission, European Parliament and the European Council. However, Belgium is behind the curve among its regional partners in terms of promoting 5G competition with only one 5G provider during the majority of 2021. In this article, we used Ookla® Speedtest Intelligence® to examine Belgium’s fixed and mobile internet performance speeds, as well as regional and provincial performance during Q3 2021. We also examined the European Quarter in Brussels using Ookla Cell Analytics to determine which mobile operators had the best signal level and quality.

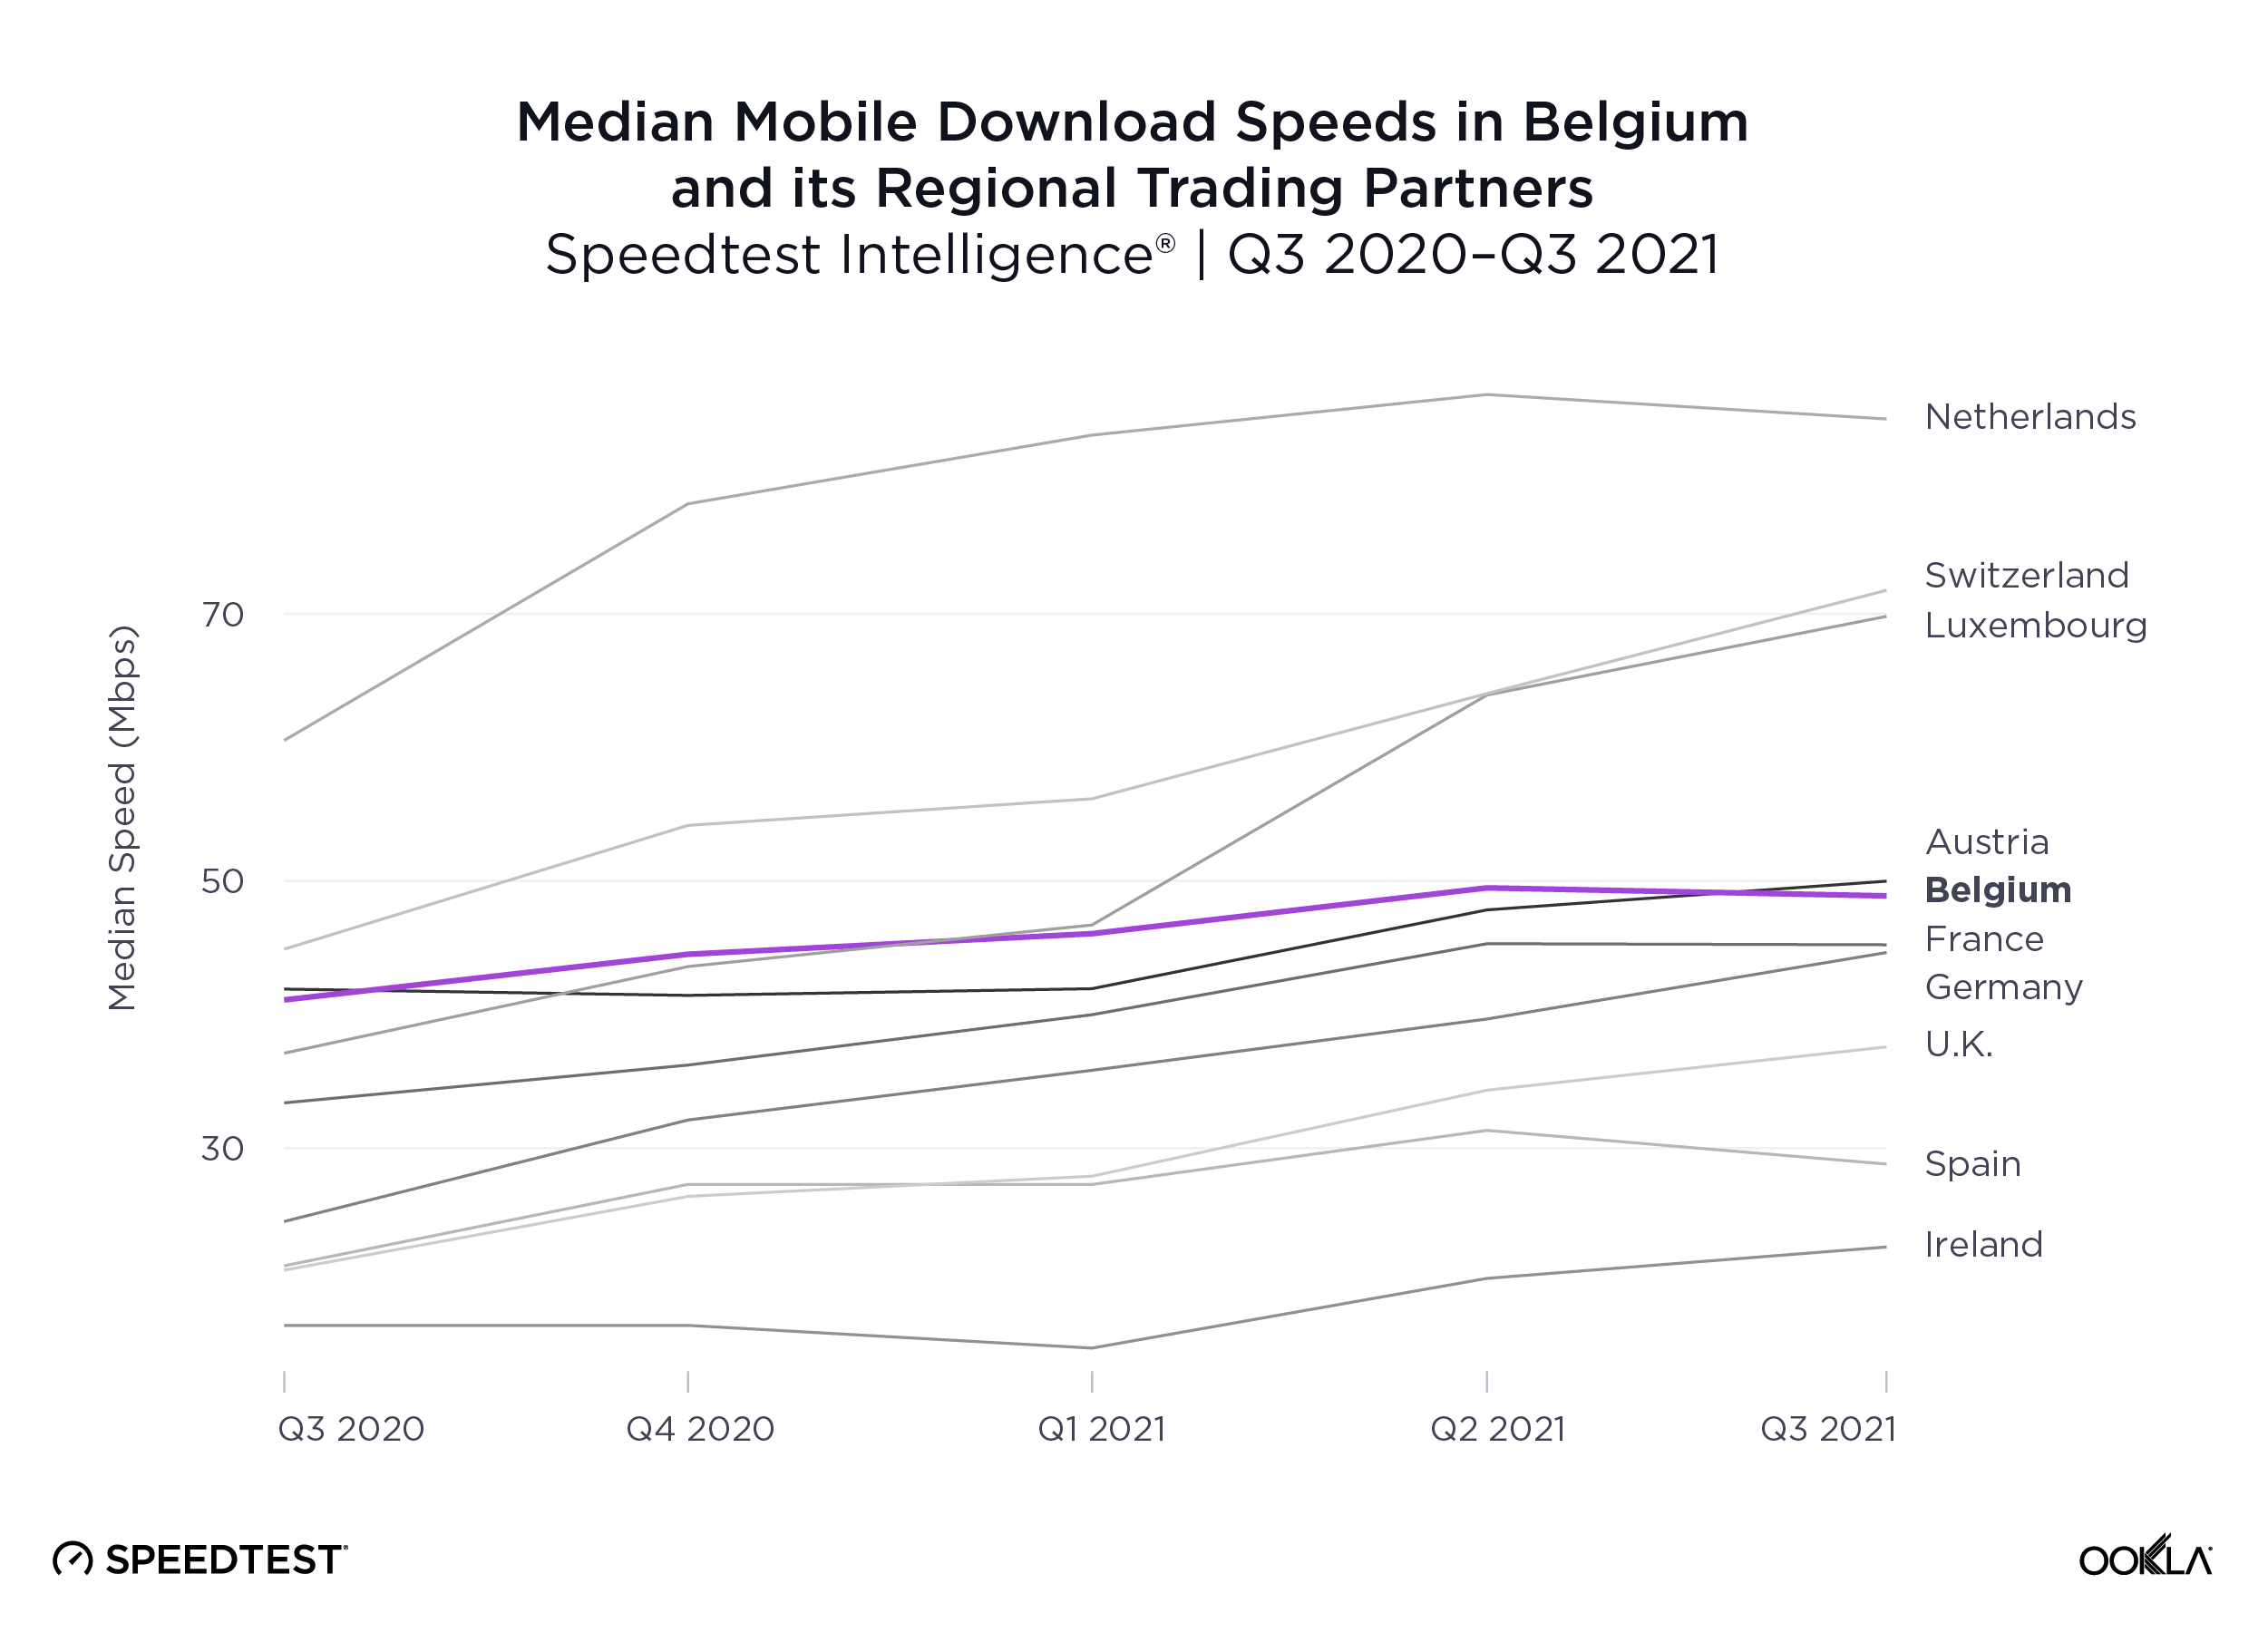
The Netherlands leads among Belgium’s regional trading partners for fastest mobile
ookla_mobile-download-comparison_belgium_1121-01

Speedtest Intelligence reveals that the Netherlands had the fastest median mobile download speed among Belgium’s closest regional trade partners at 84.59 Mbps during Q3 2021. Switzerland and Luxembourg followed at 71.76 Mbps and 69.81 Mbps, respectively. Austria was next at 49.98 Mbps, followed by Belgium at 48.88 Mbps.

Switzerland and Spain set the European standard with fixed broadband speeds over 100.00 Mbps
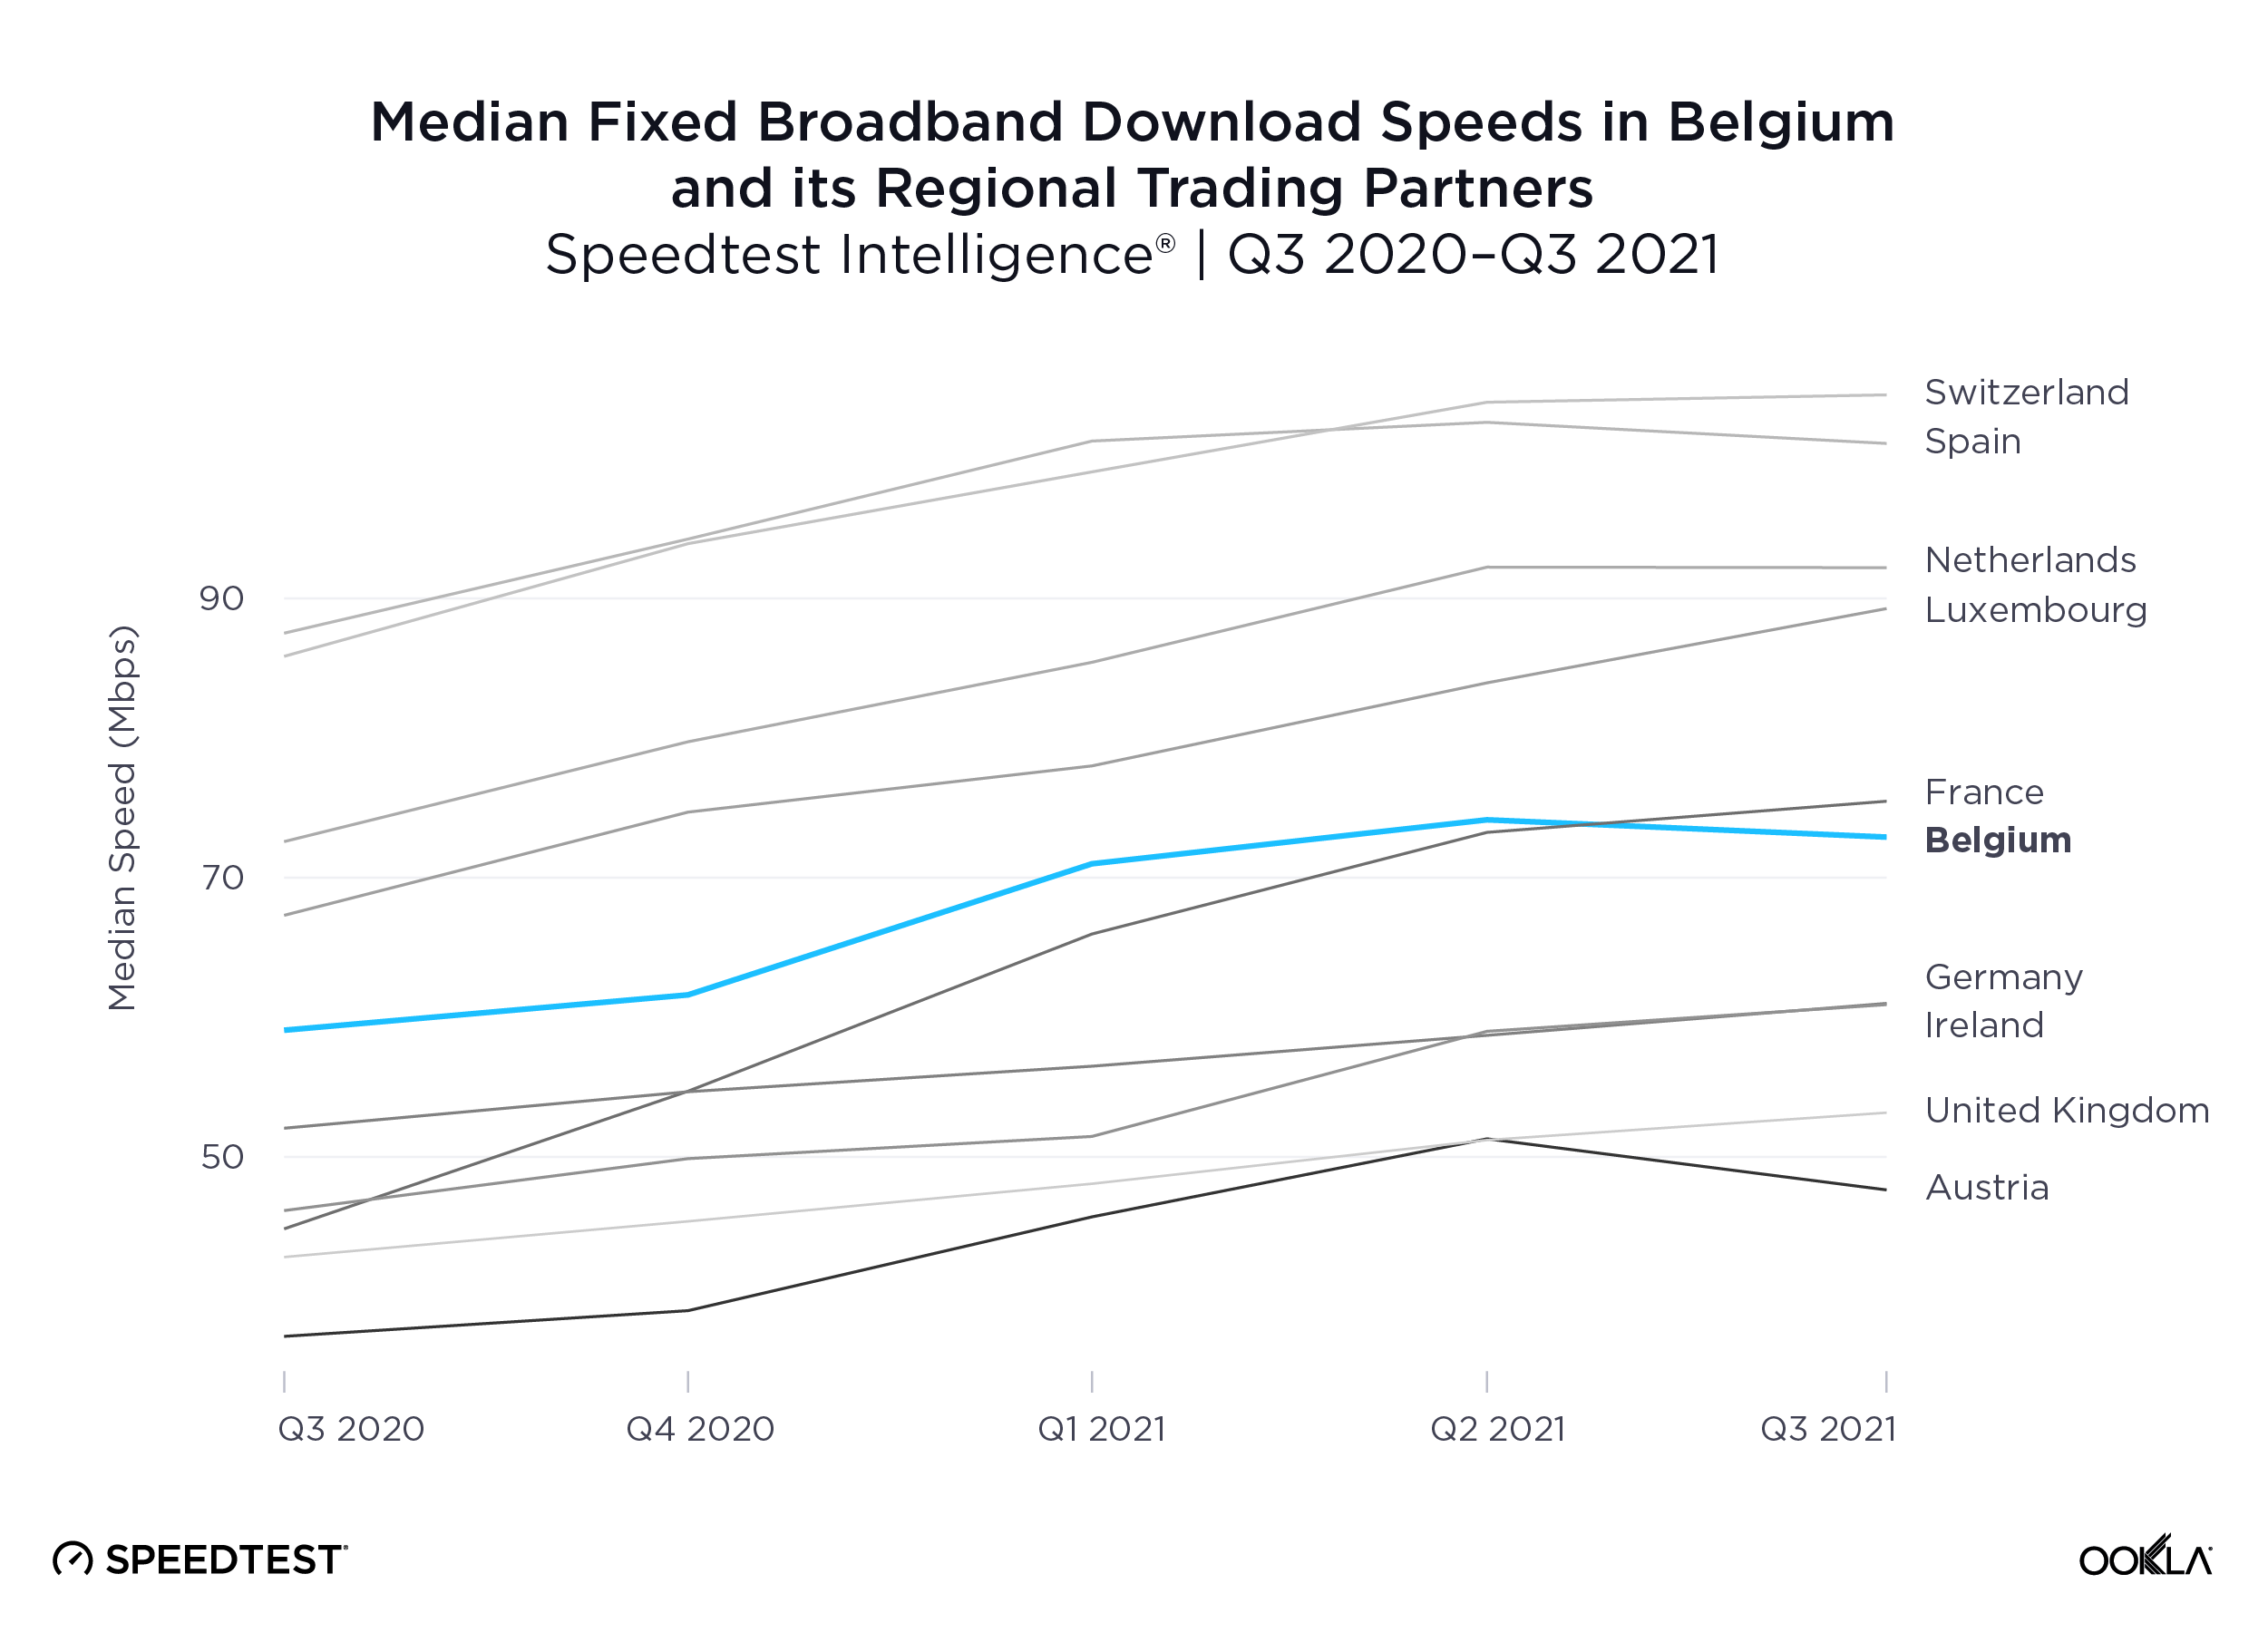
ookla_fixed-download-comparison_belgium_1121-01

According to Speedtest Intelligence, Switzerland had the fastest median fixed broadband speed among Belgium and its regional trading partners at 104.58 Mbps during Q3 2021, edging out Spain’s 101.10 Mbps. The Netherlands and Luxembourg followed at 92.20 Mbps and 89.27 Mbps, respectively. Belgium’s median fixed broadband download speed of 72.90 Mbps was just slower than France’s at 75.47 Mbps.
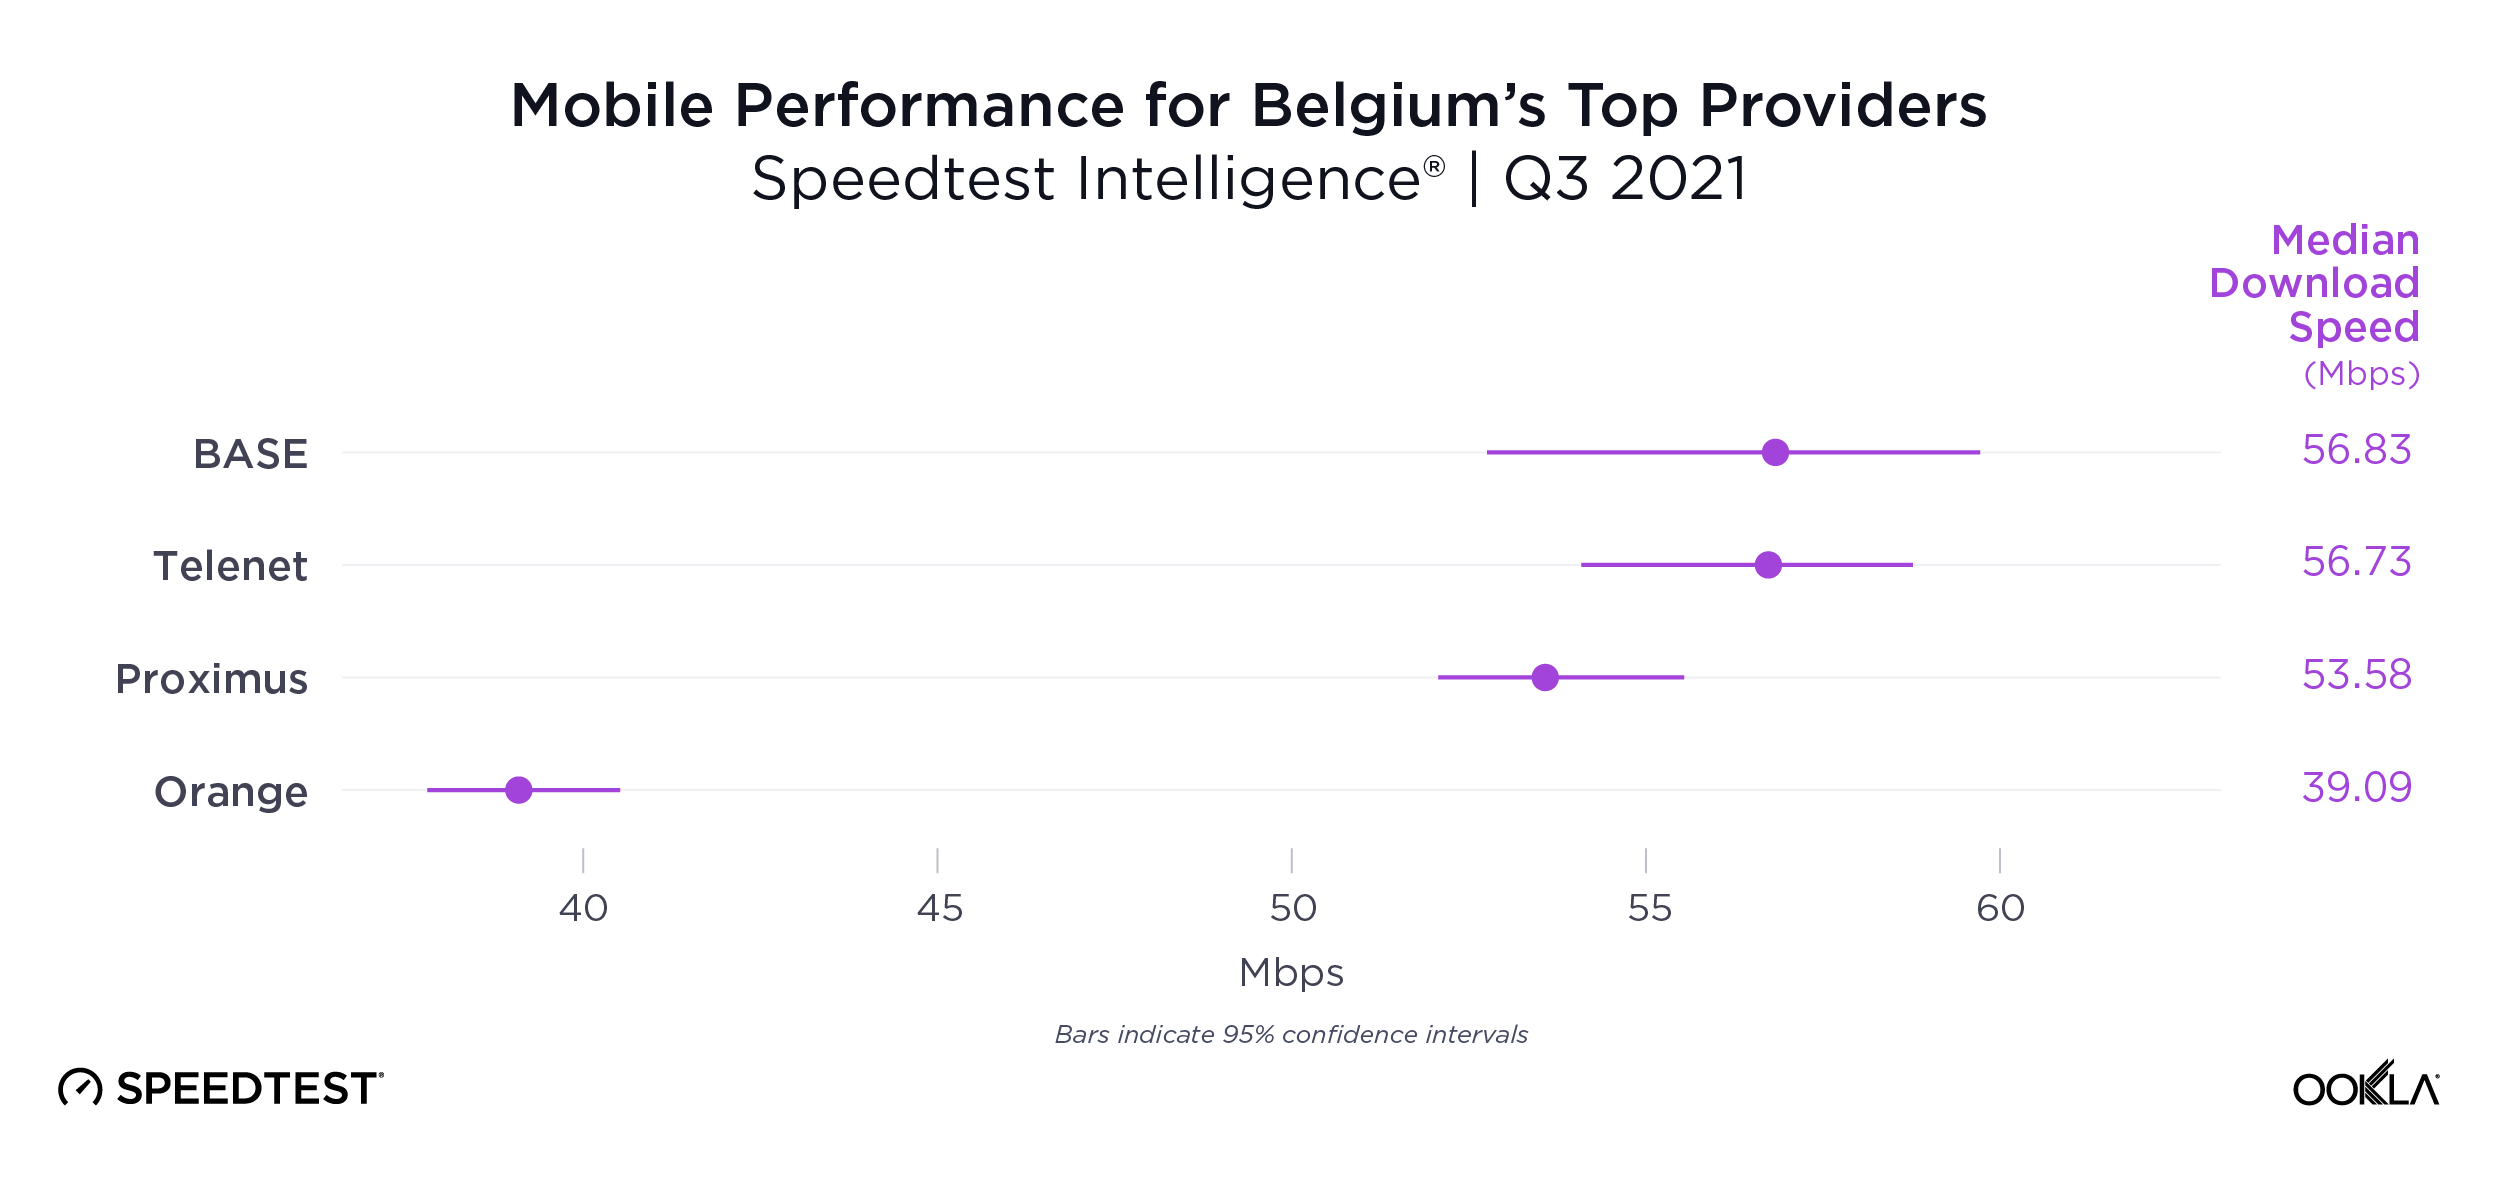
BASE, Telenet and Proximus outpaced Orange for mobile

ookla_mobile-top-provders_belgium_1121-01

Belgium’s fastest mobile provider was too close to call during Q3 2021 with BASE (56.83 Mbps), Telenet (56.73 Mbps) and Proximus (53.58 Mbps) leading the way. Orange was fourth at 39.09 Mbps. It also must be noted Telenet owns the BASE brand.

Telenet had the fastest fixed broadband speed
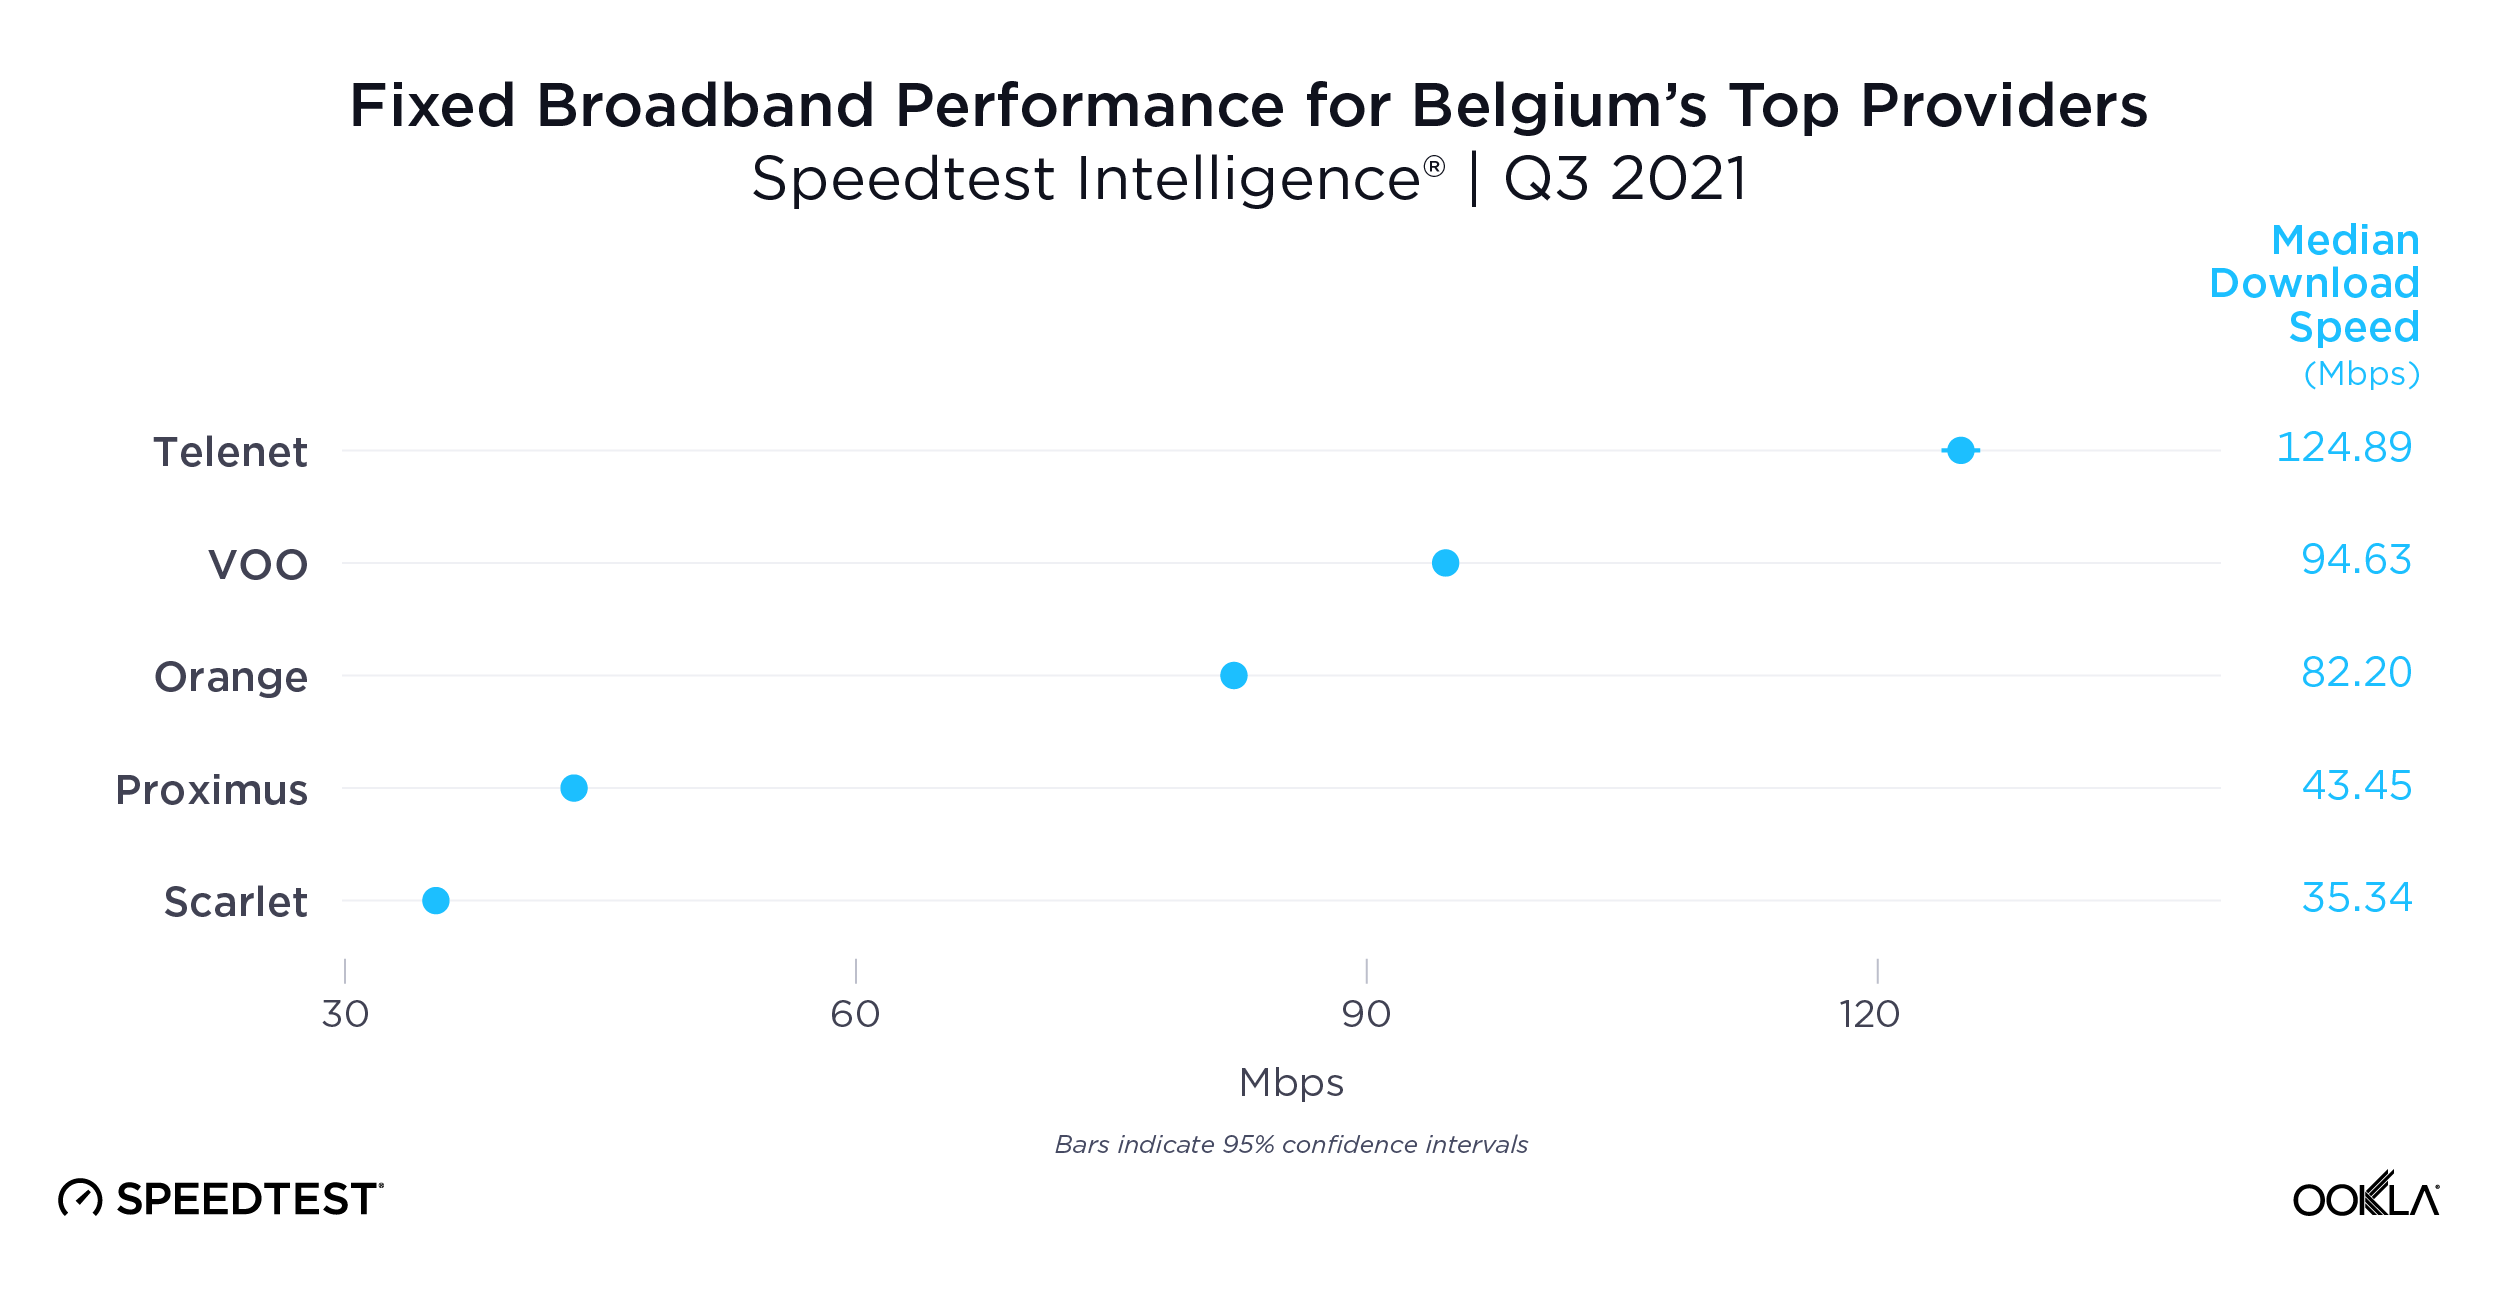
ookla_fixed-top-provders_belgium_1121-01

Telenet had the fastest download speed over fixed broadband at 124.89 Mbps. This far outpaced VOO, which followed at 94.63 Mbps. Orange was next on the list at 82.20 Mbps, followed by Proximus (43.45 Mbps) and Scarlet (35.34 Mbps).

Flanders had faster mobile download speeds than Brussels and the Walloon region
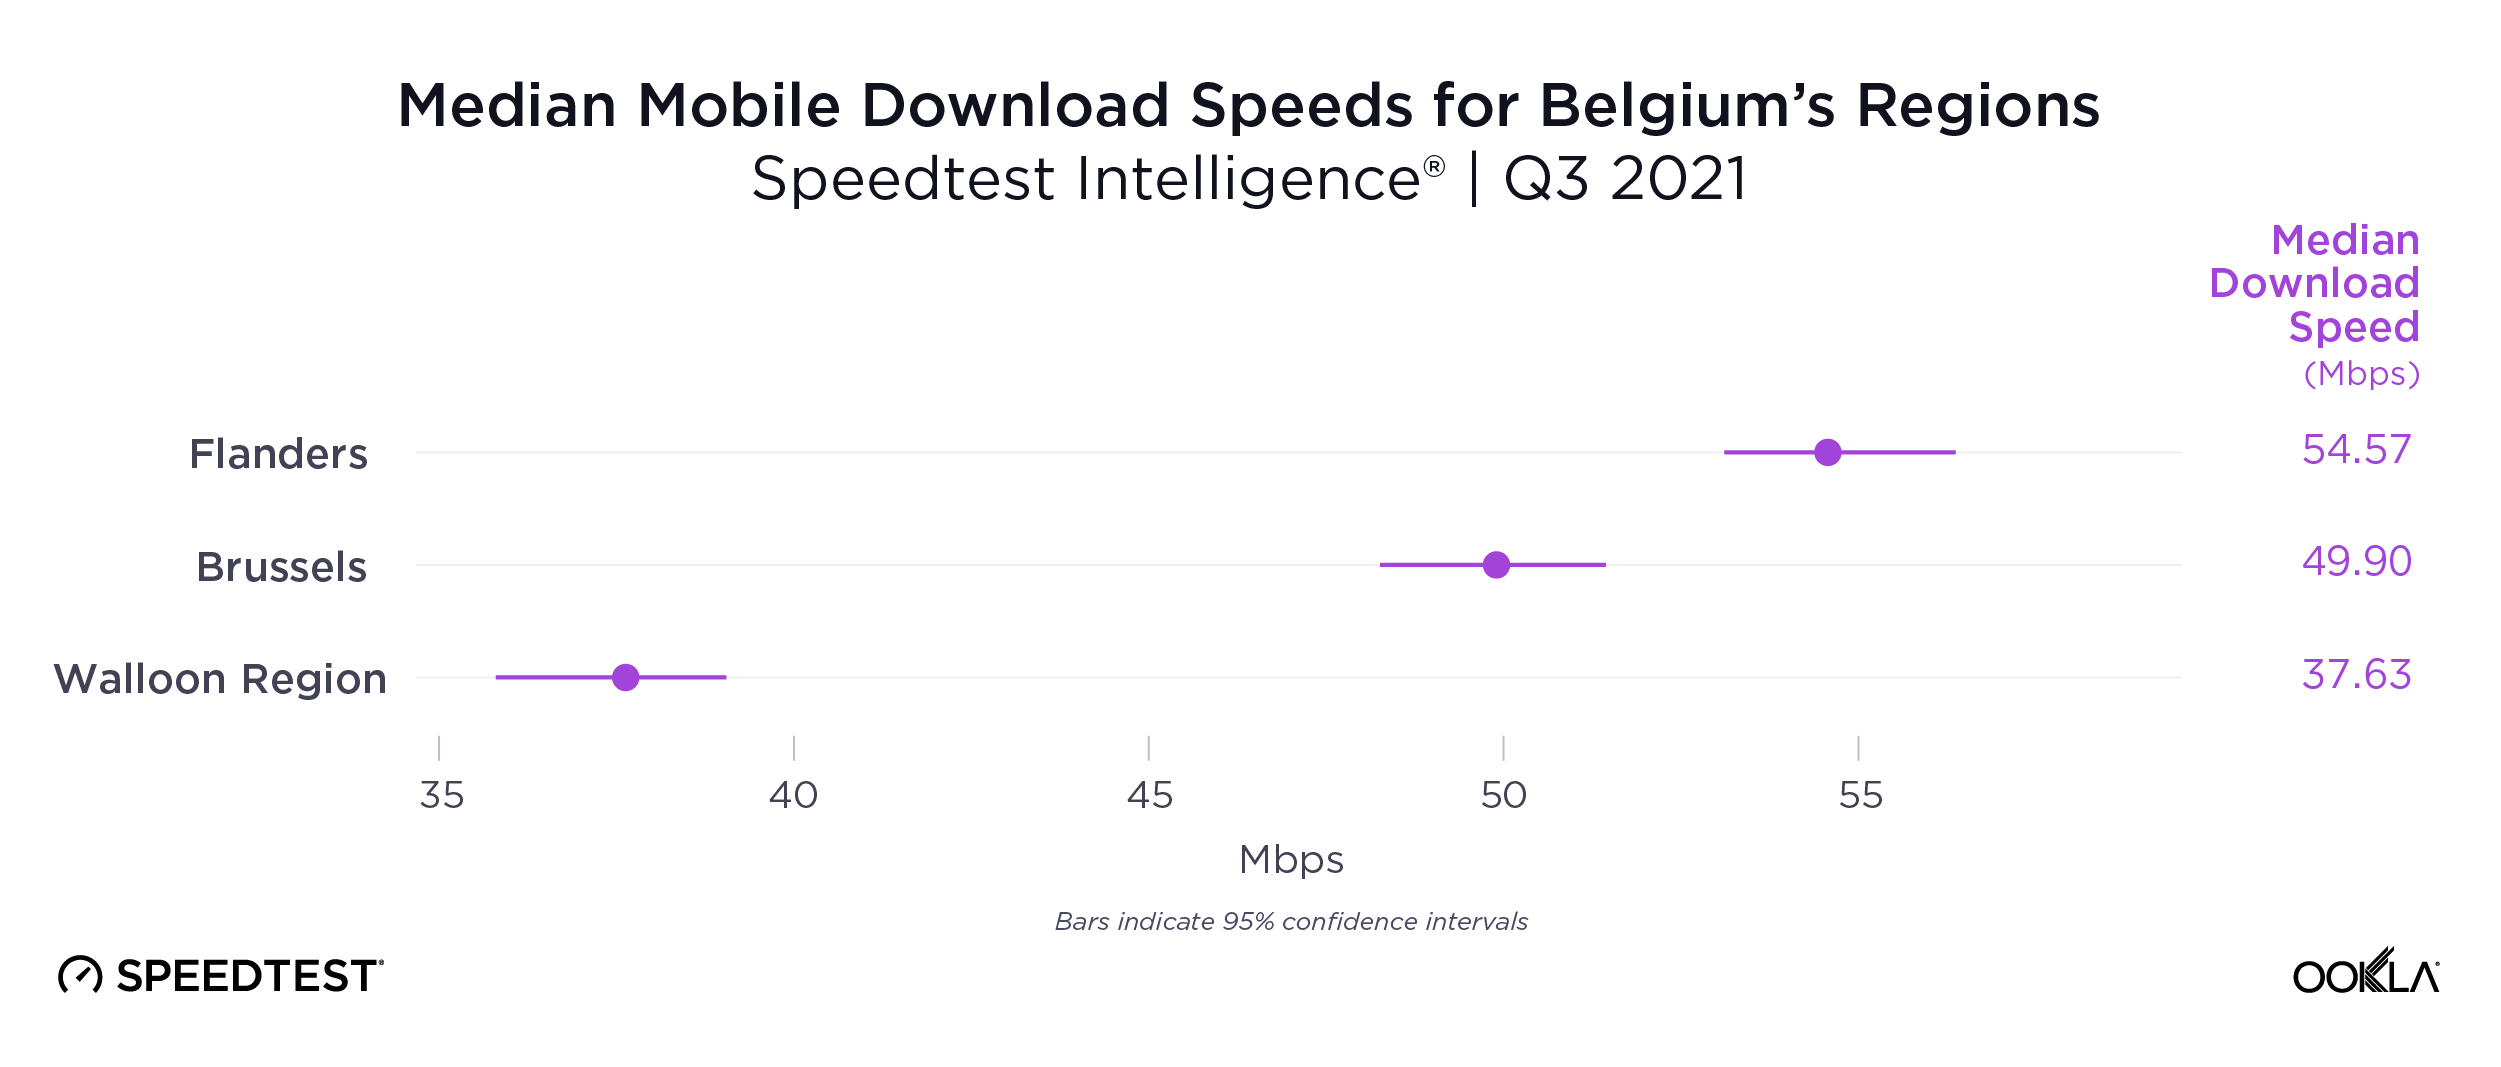
ookla_mobile-download-performance_belgium-regions_1121-01

Speedtest Intelligence data uncovered a wide divide between Belgium’s more populous northern Flemish region and the less populous southern Walloon region on mobile performance during Q3 2021. Flanders had a median mobile download speed at 54.57 Mbps to Walloon’s 37.63 Mbps. The Capital Region of Brussels was squarely in the middle on mobile at 49.90 Mbps. This digital divide extended into province-level data, with almost every Flemish province achieving faster median download speeds than Walloon provinces.

Four Flemish provinces had mobile download speeds over 50 Mbps
ookla_mobile-performance_belgium_map_1121-01

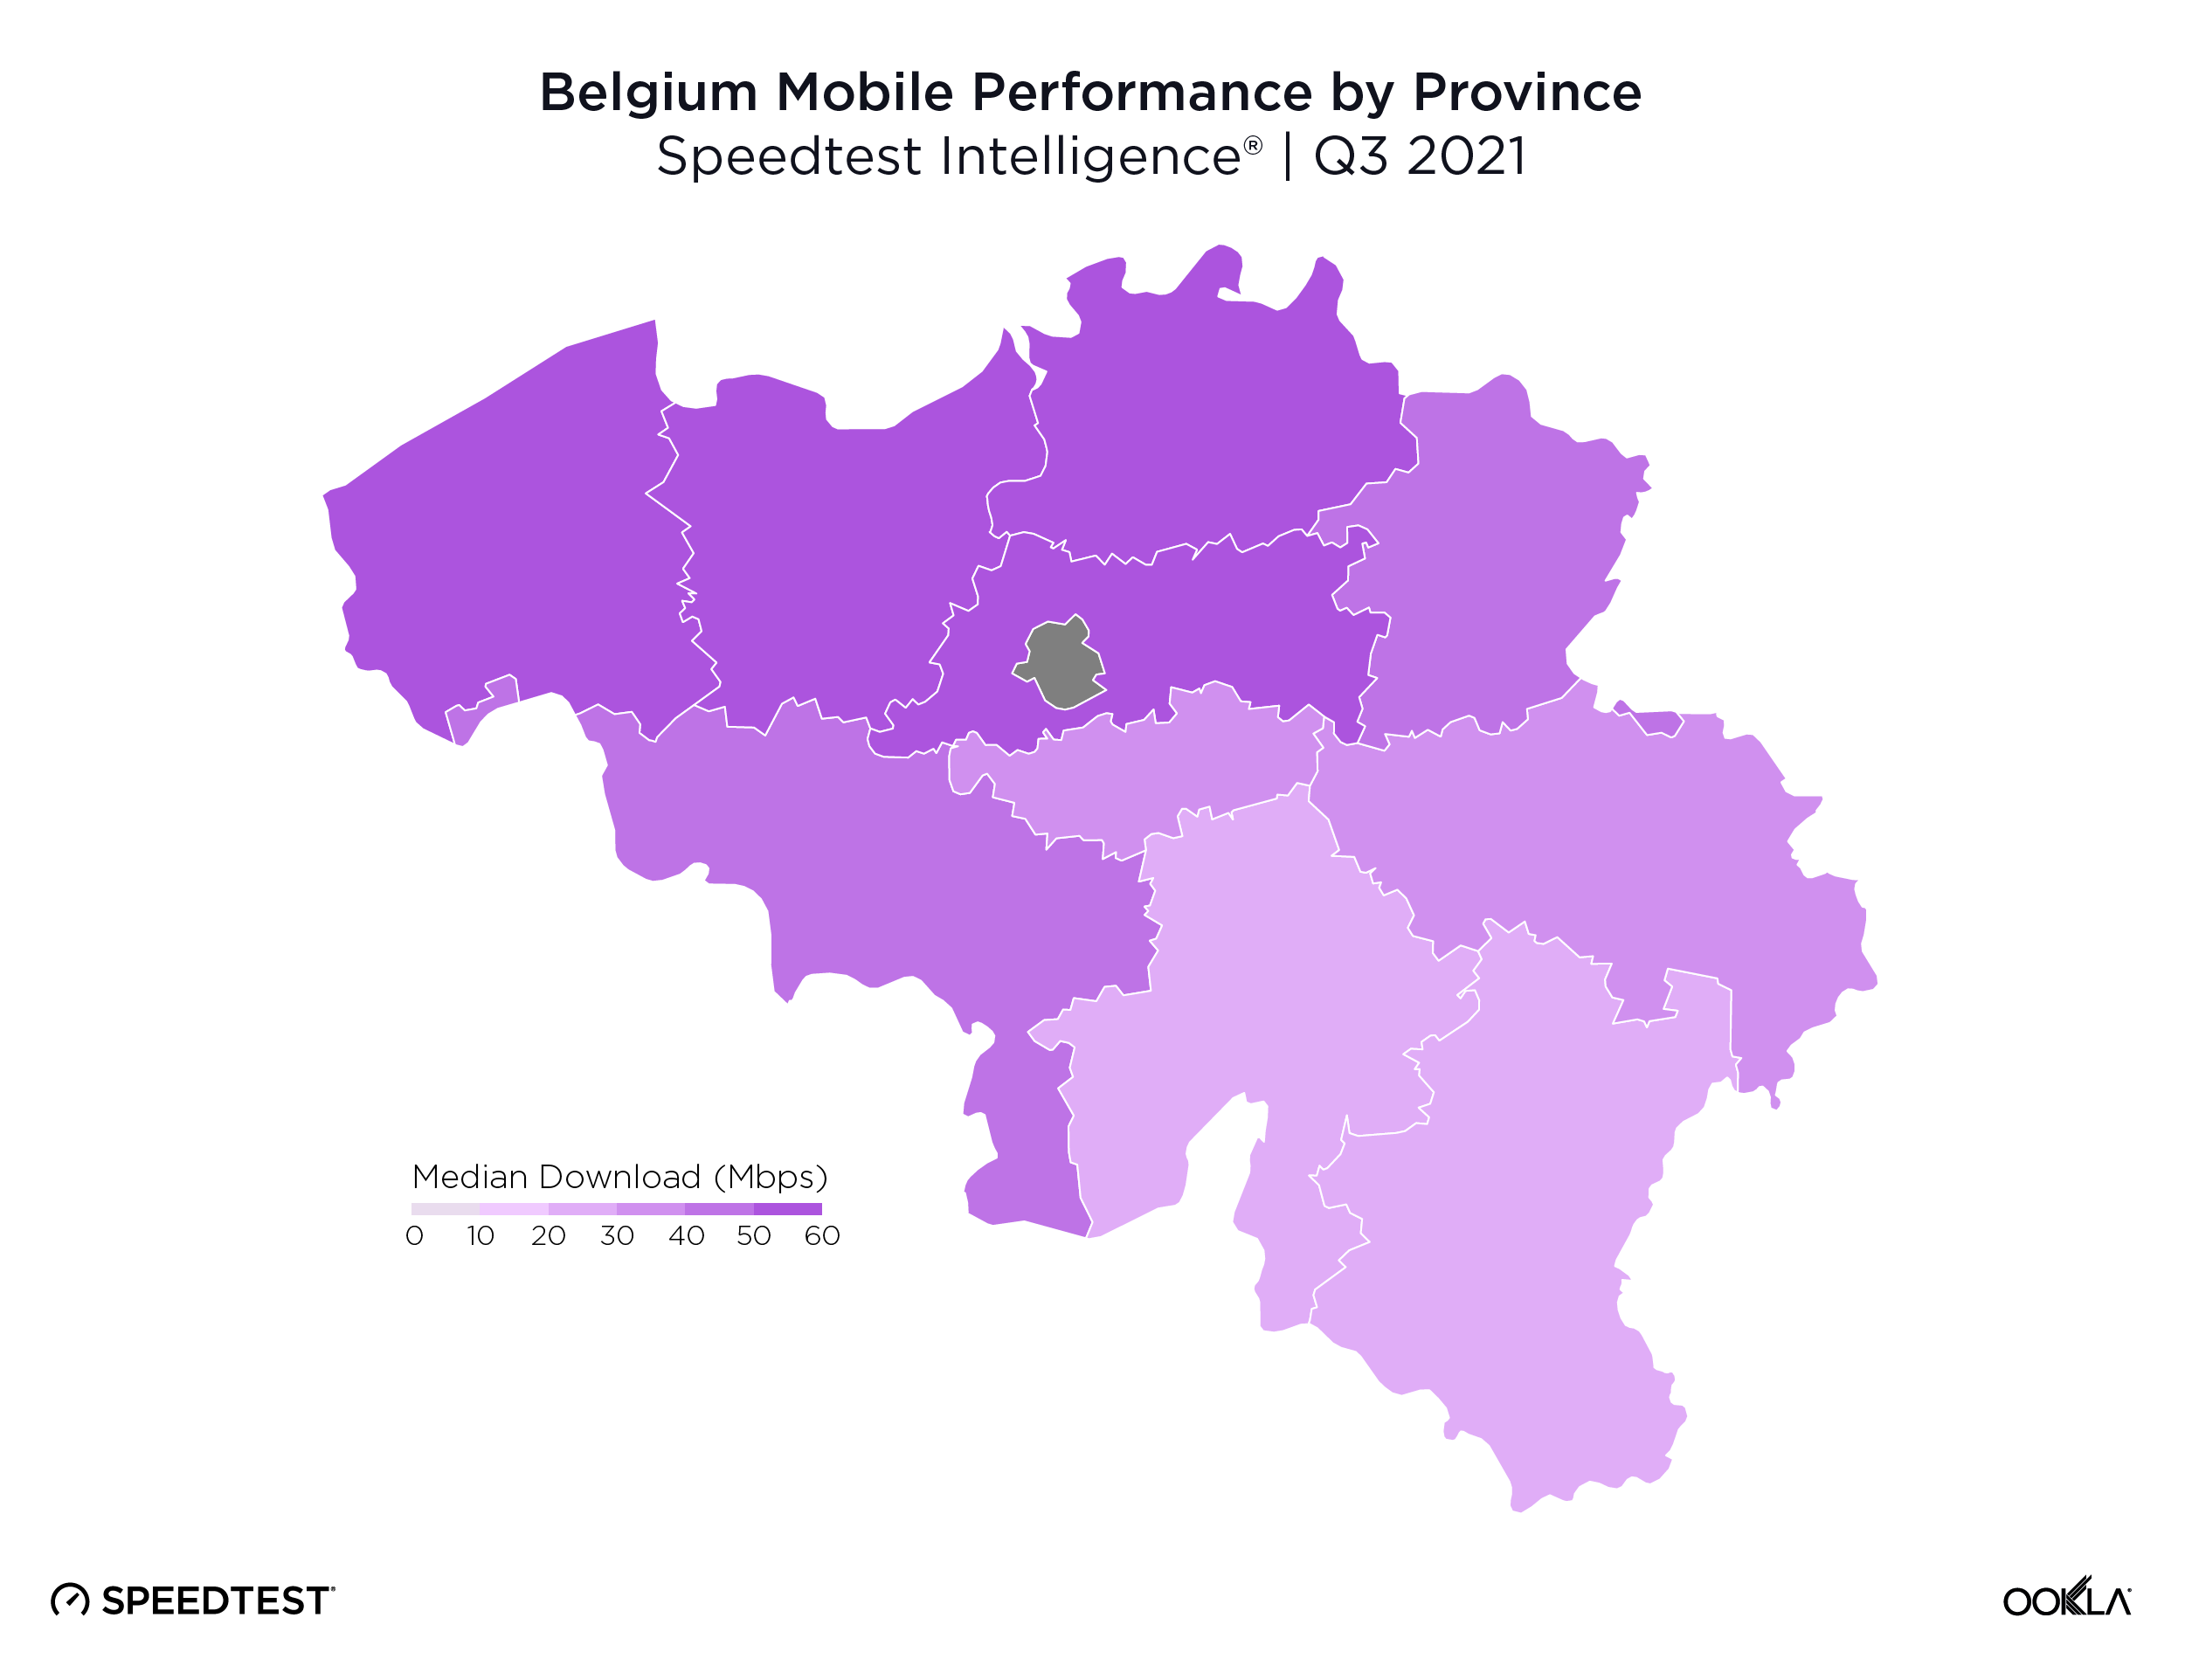
There was no statistically fastest mobile download speed among Belgium’s provinces, though Flemish Brabant (57.47 Mbps), Antwerp (57.30 Mbps), West Flanders (54.95 Mbps) and East Flanders (52.19 Mbps) all notched download speeds above 50.00 Mbps. The Luxembourg province (28.40 Mbps) and Province of Namur (28.71 Mbps) were the only Belgian provinces that fell short of reaching a median mobile download speed of 30.00 Mbps.

There was a wide divide between Flanders and the Walloon region on fixed broadband

ookla_fixed-download-performance_belgium-regions_1121-01

Speedtest Intelligence data revealed the digital divide among Belgium’s regions was even more distant on fixed broadband during Q3 2021. Flanders had a median fixed broadband download speed at 87.02 Mbps to the Walloon’s 55.66 Mbps. The Capital Region of Brussels was again in the middle at 60.40 Mbps.

Limburg was fastest province for fixed broadband
ookla_fixed-performance_belgium_map_1121-01

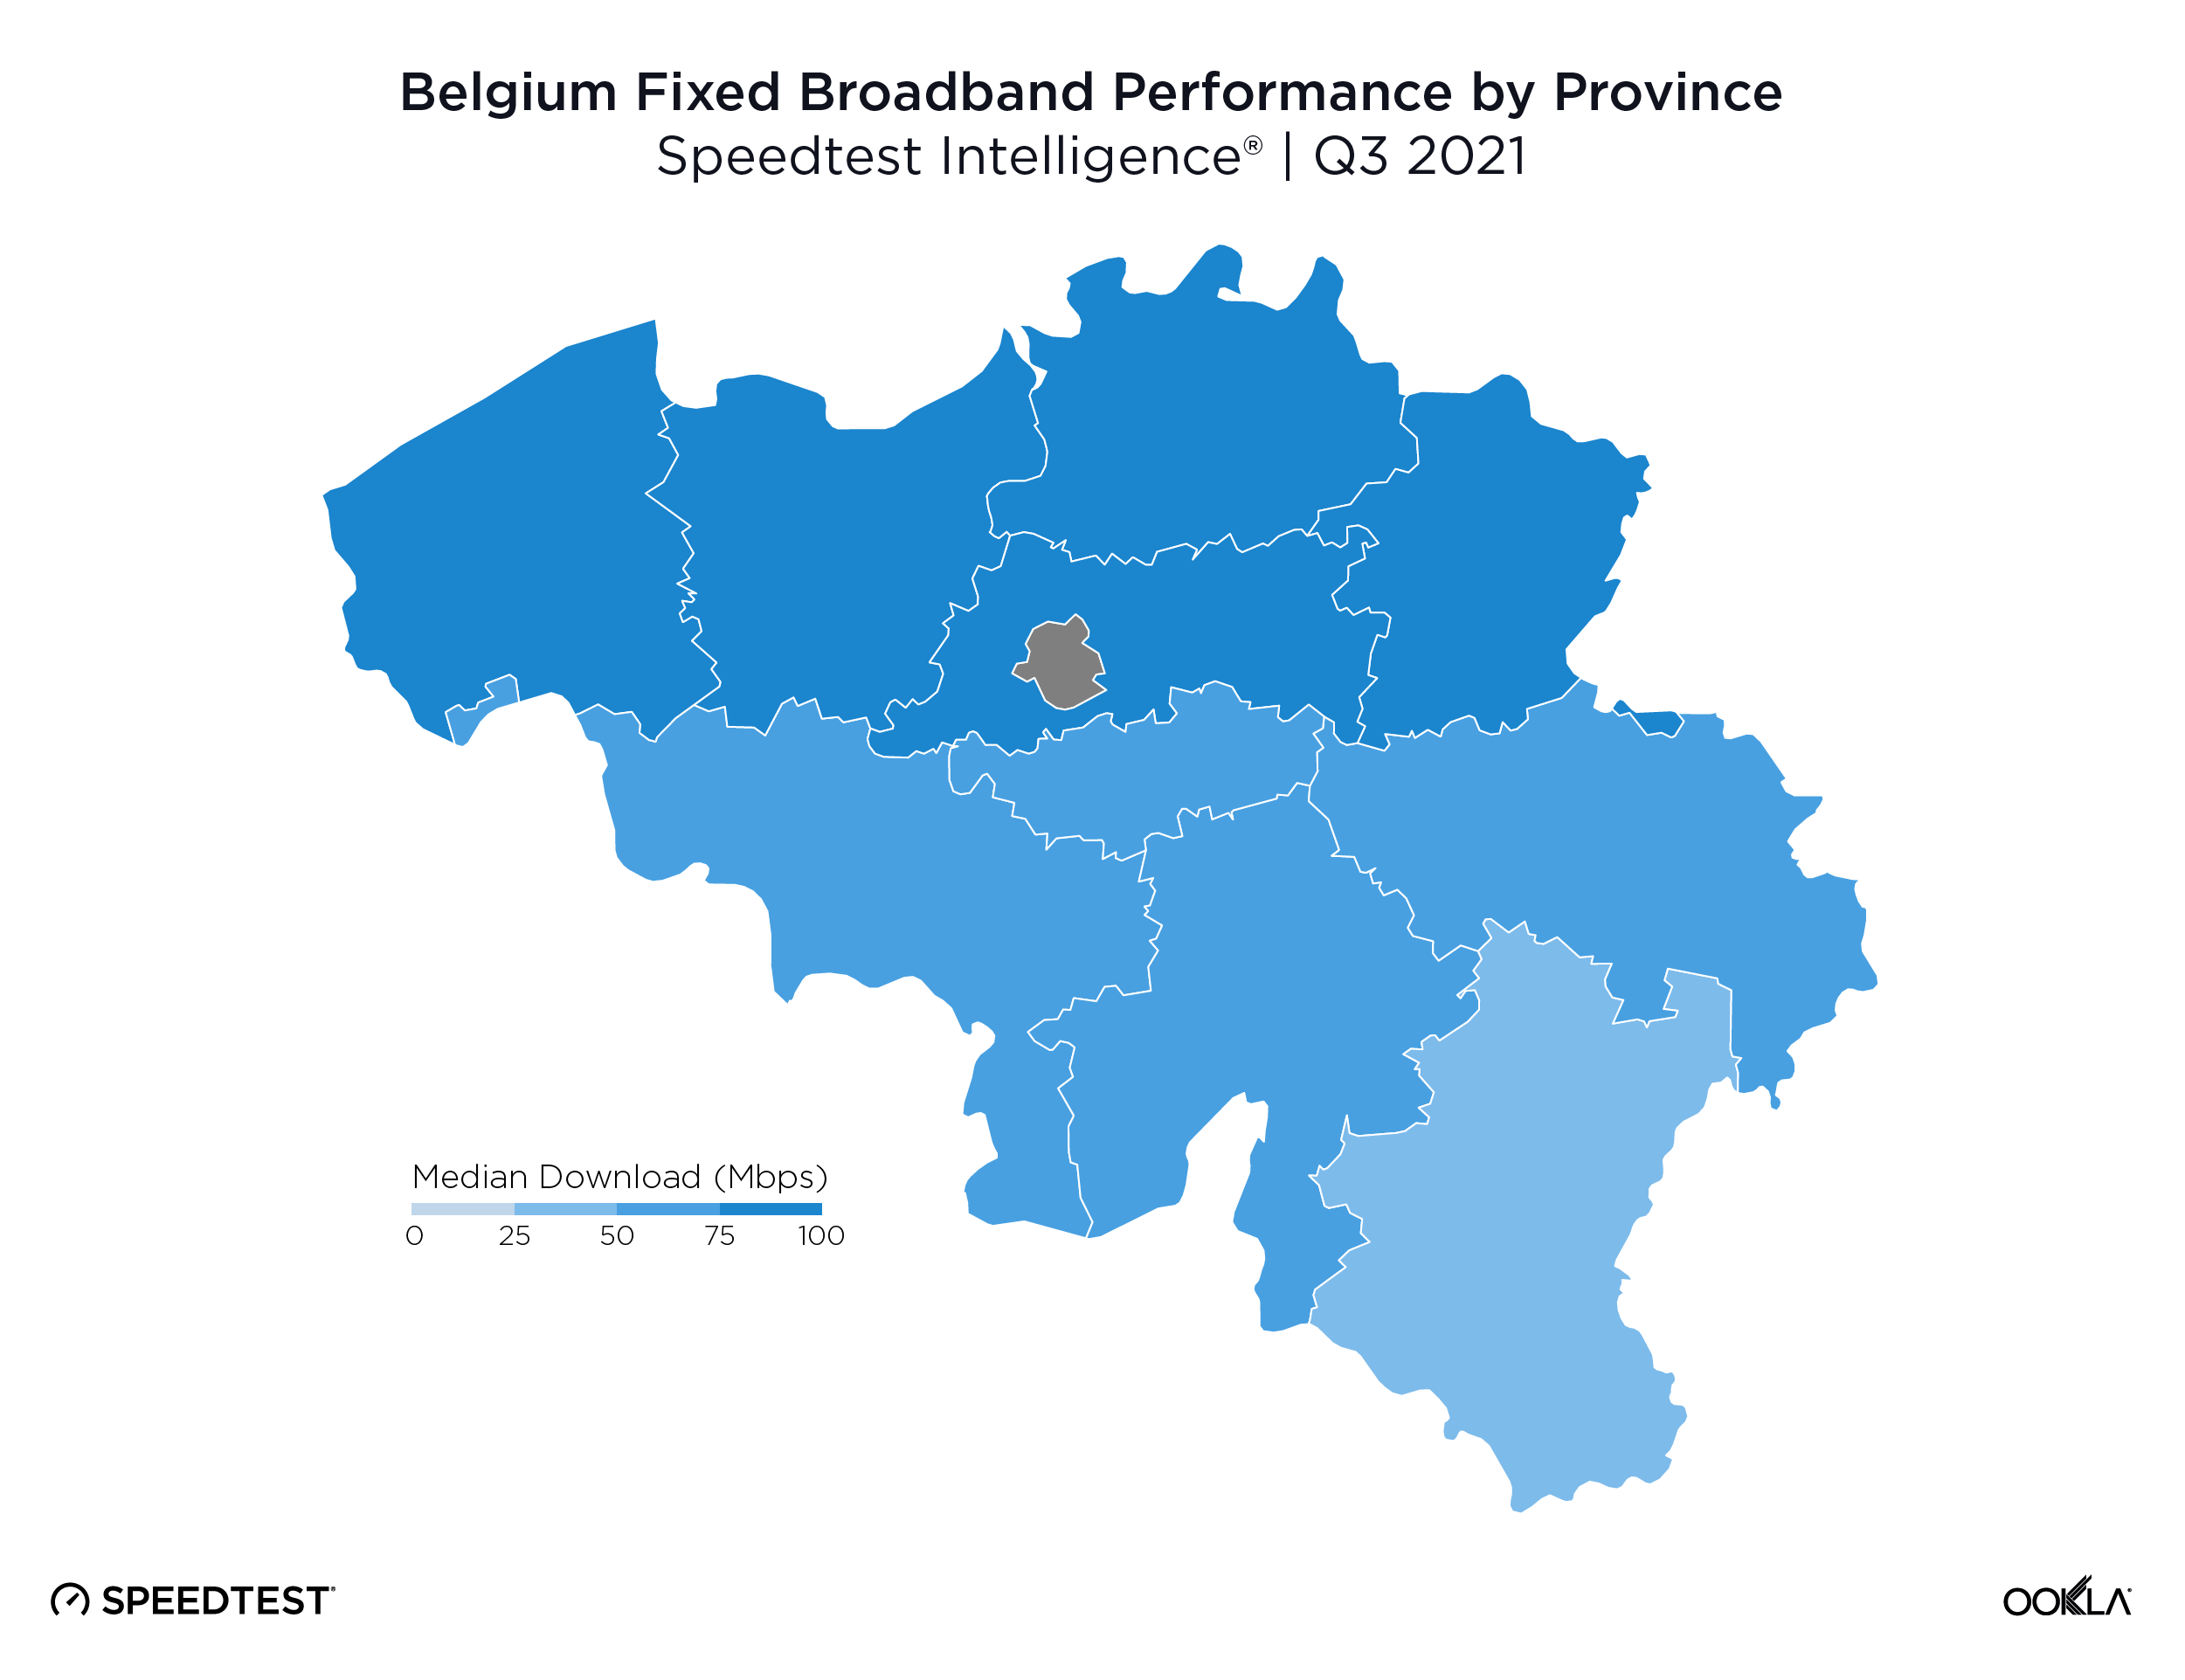
Limburg had the fastest median download speed over fixed broadband at 90.07 Mbps, followed by East Flanders (86.68 Mbps), West Flanders (86.45 Mbps), Antwerp (85.23 Mbps) and Flemish Brabant (84.50 Mbps). There was no fastest province in Wallonia, though Walloon Brabant and the Province of Namur had the fastest median download speeds at 60.15 Mbps and 58.90, respectively.

4G LTE Signal Level and Quality varied by provider near the European Quarter in Brussels

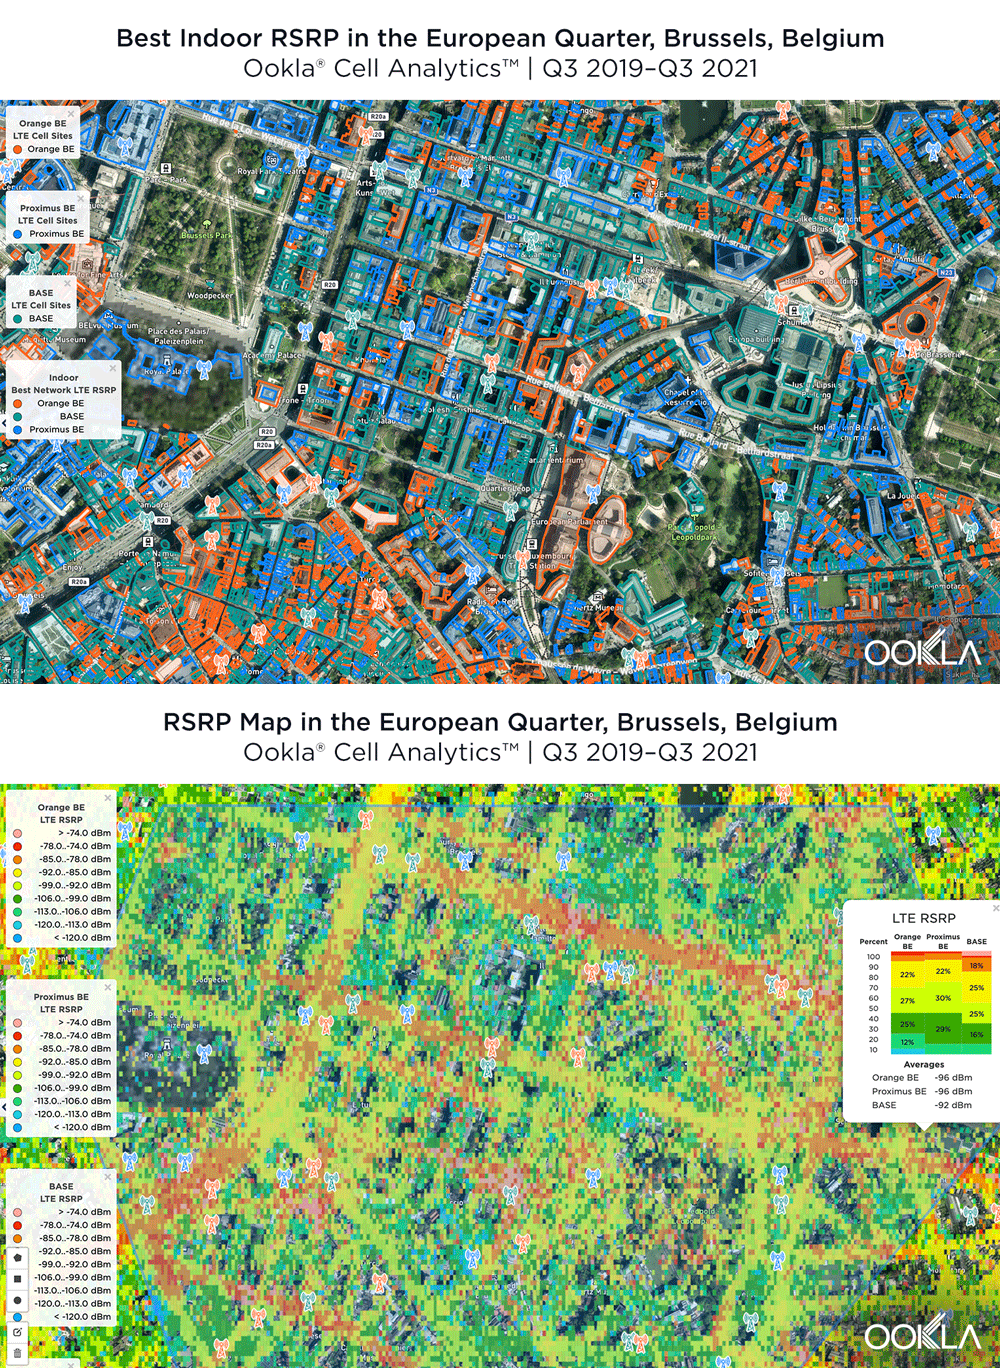
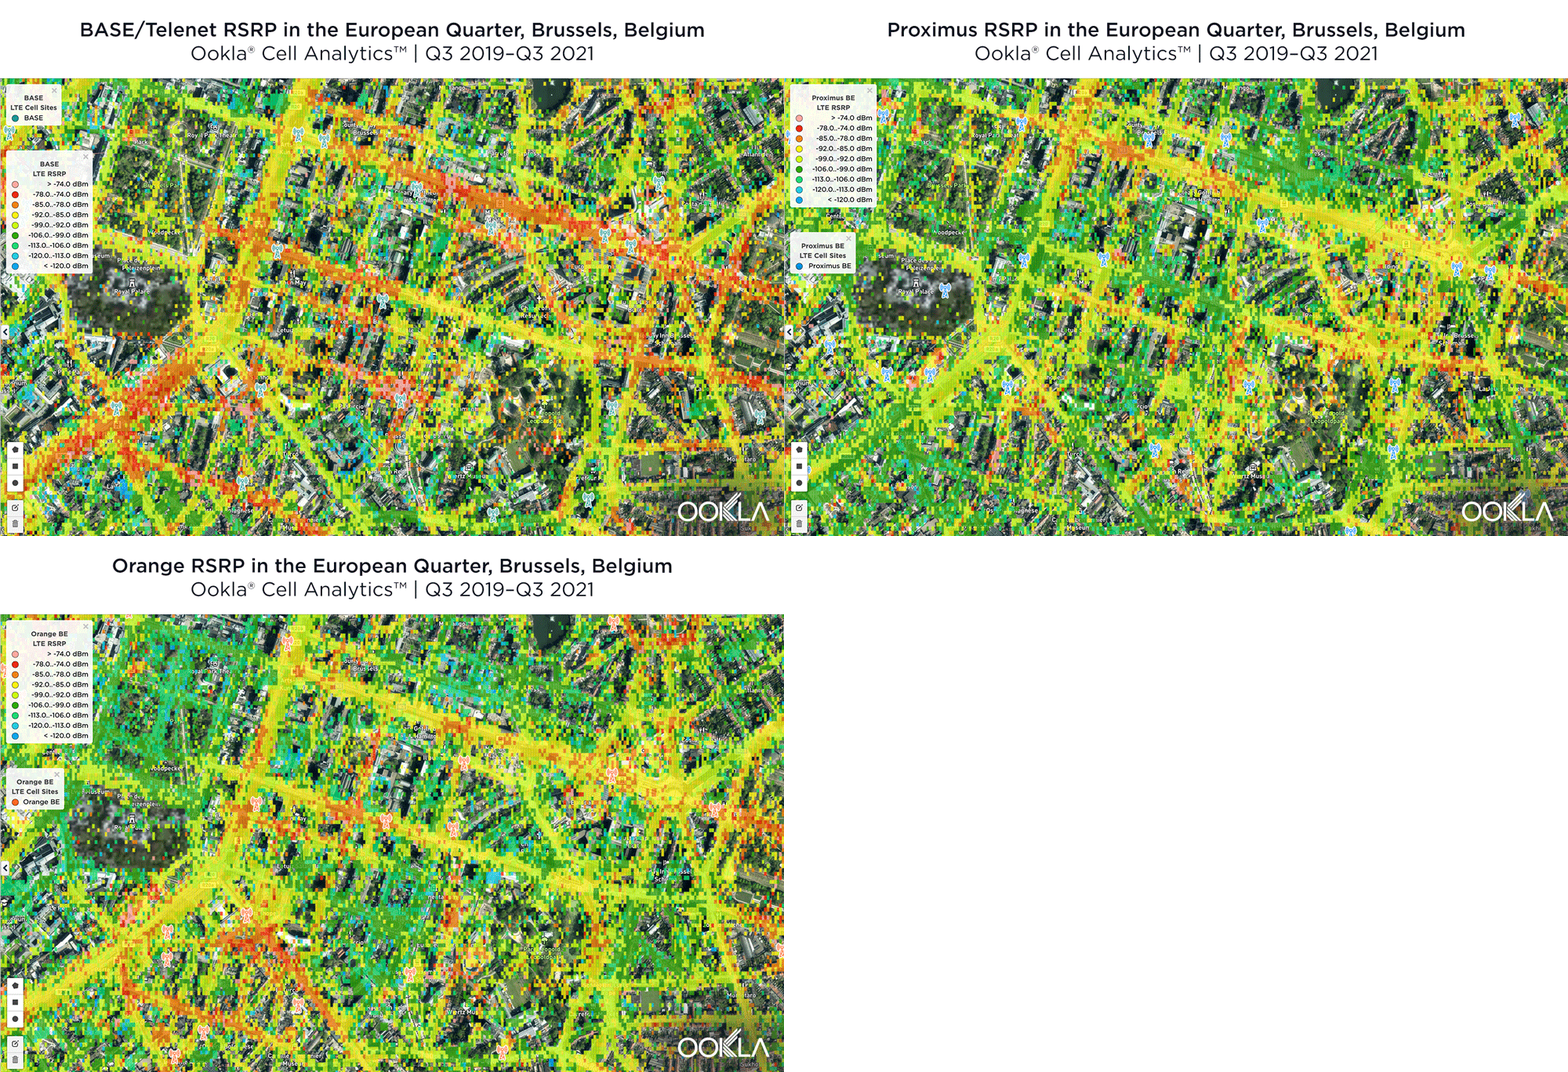
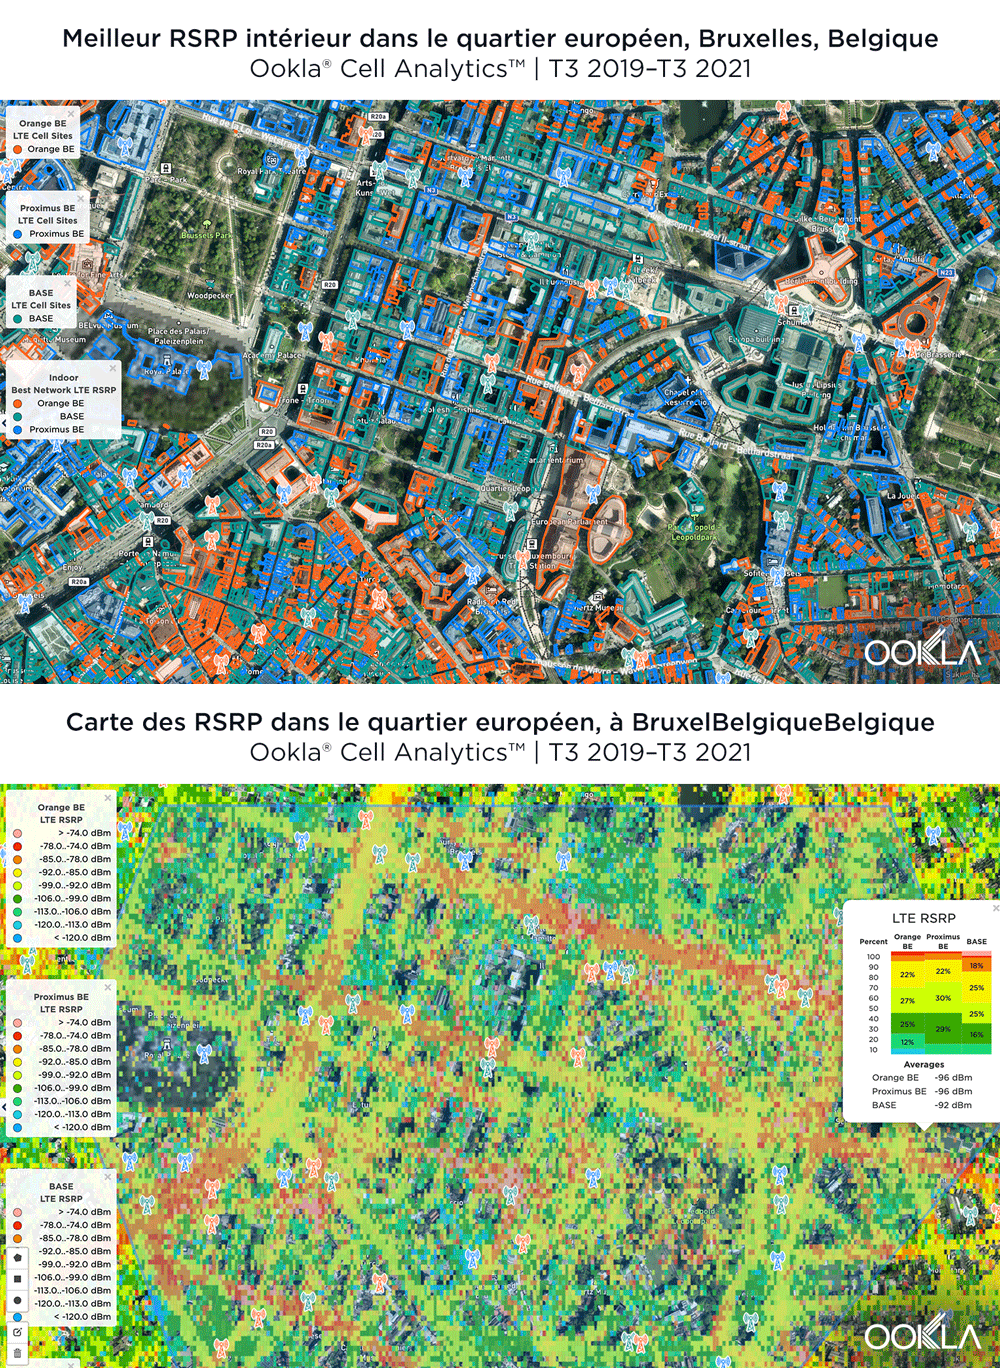
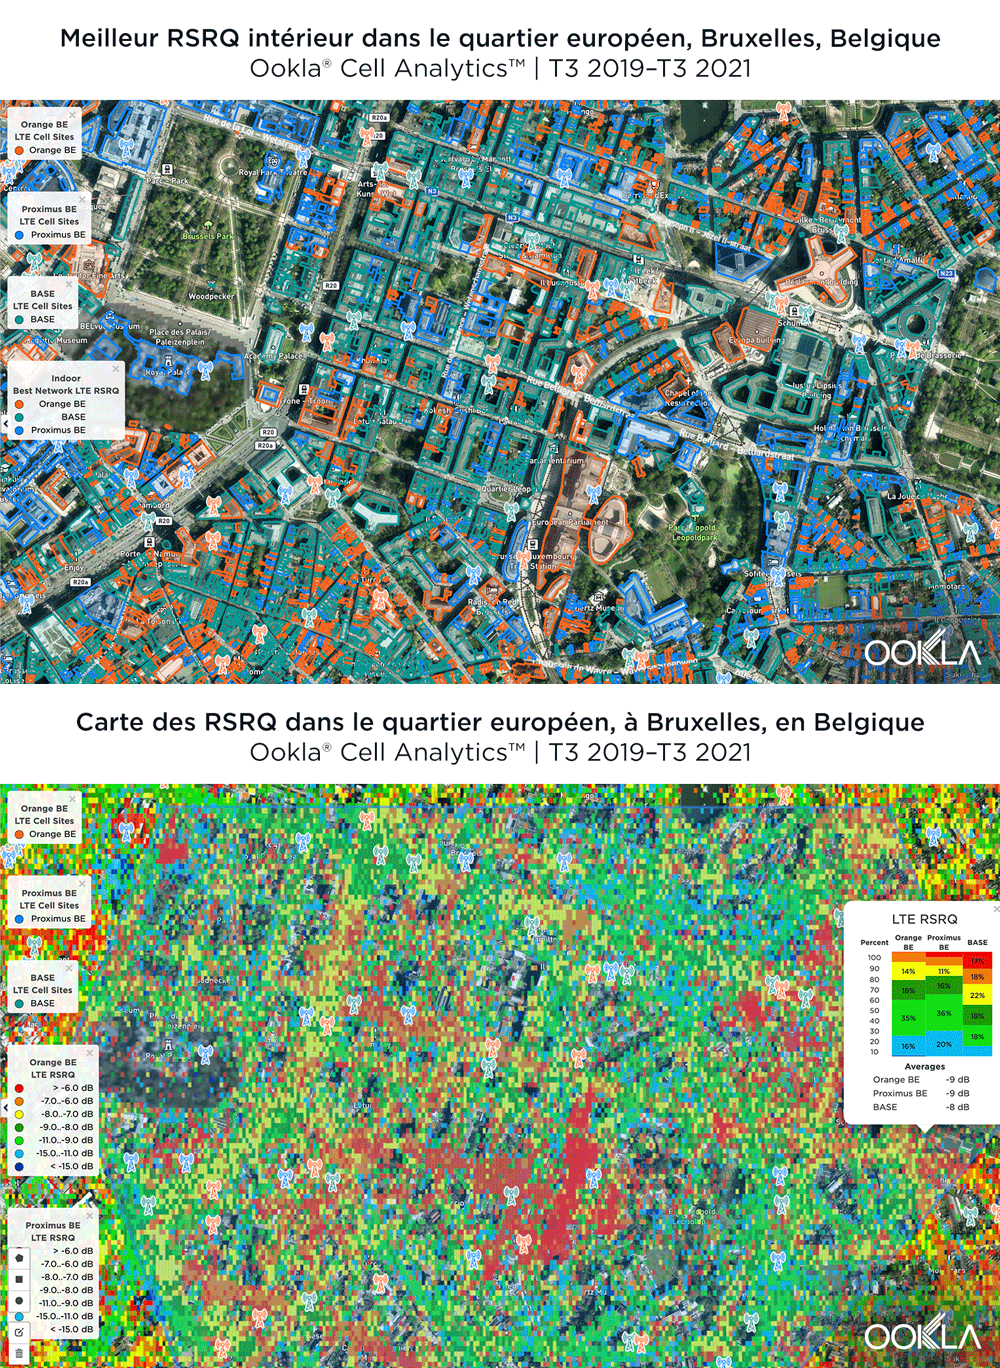
We examined mobile performance in the European Quarter in Brussels using Cell Analytics data from the past 24 months. Each of these maps shows the strongest 4G Signal Level (RSRP) and Signal Quality (RSRQ) signals in this key area, which can assist mobile operators in improving their networks. Cell Analytics identifies the strongest RSRP and RSRQ by mobile network operator for a given area or building when there is a statistically significant winner and color codes that plot bin to the provider’s corresponding color. RSRP provider-level maps show the strength of a signal from individual providers for a given area, with pink and red showing a strong signal and blue indicating a weak signal. Since users can experience poor quality even with a strong signal level, resulting in audio interruptions or slow data speeds, RSRQ provider-level maps show the quality of an operator’s signal for a given area, with red showing a high-quality signal and blue indicating a lower-quality signal. We’ve also included the approximate locations of cell towers in the area.

Tight competition for best 4G LTE RSRP in Brussels

The image below shows where a provider had the strongest 4G LTE RSRP signal strength during the past 24 months. As you can see, BASE/Telenet had a strong presence in the center of the map, achieving the highest RSRP in our polygon area. Proximus and Orange had strong signals around the edges of the map, and Orange had the strongest RSRP in some of the key EU institutions, including the European Commission headquarters and the European Parliament.
cell-analytics_rsrp_brussels-1_1121_en

The maps below show where each top provider has high and low signal strength data in the European Quarter. BASE/Telenet showed very strong RSRP near the center of the map, particularly around the major EU buildings, Rue de la Loi and near Av. Marnix, though there were a few weaker areas just southwest of the European Parliament building. Orange showed areas of strong localized RSRP through the map, particularly in the southwest, with a weaker RSRP in blue in the northwest and in the center of the map. Proximus had some areas of strength along Rue de la Loi, and near the core of the European Quarter, though had weaker signals throughout.
cell-analytics_rsrp_brussels-2_1121_en

BASE/Telenet had the best RSRQ in Brussels’ European Quarter

According to Cell Analytics, BASE/Telenet had the highest RSRQ in the polygon area of the European Quarter we surveyed. The maps below show where each provider had the best RSRQ over the past 24 months, for both indoor and outdoor areas. The image below shows BASE/Telenet had areas near the center of the map of the best RSRQ, while Orange had the best RSRQ near the south of the map — particularly on Av. de la Couronne — and the outskirts of the map toward the east. Proximus had the best RSRQ in some areas of the European Quarter, particularly in the northwest around the Royal Palace of Brussels and Parc Léopold. Indoor RSRQ showed a similar story, with strong competition throughout the map, though Orange showed a stronger showing in the southwest of the map, as well as in some key EU buildings.
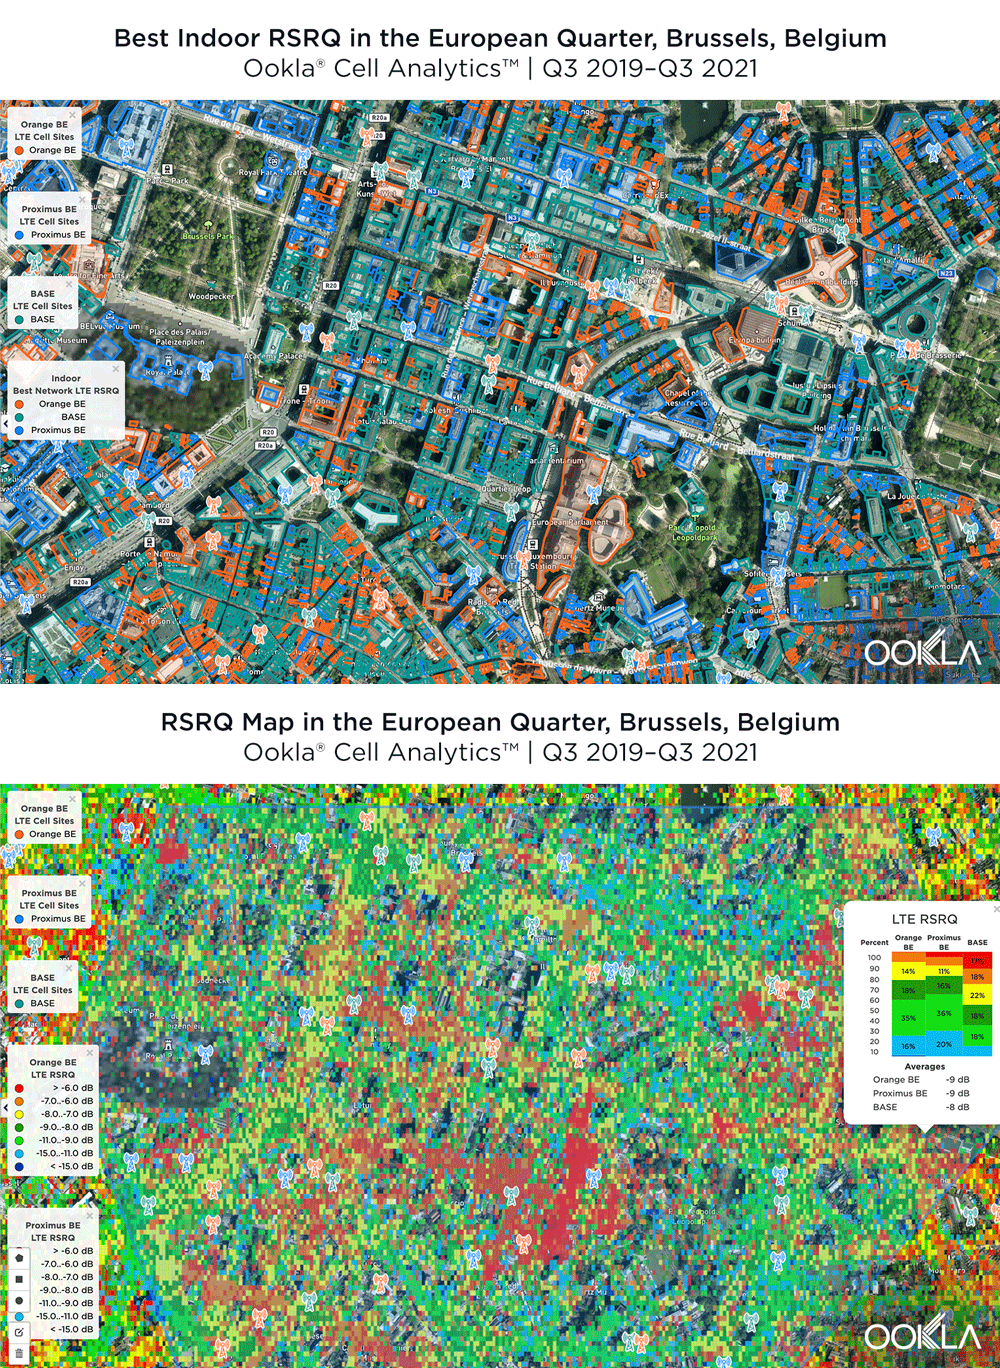
cell-analytics_rsrq_brussels-1_1121_en

The maps below show where each top provider had high and low quality RSRQ signal strength. BASE/Telenet showed very strong areas near the center of the map, particularly around the European Parliament, Square Frère-Orban Park and Parc du Cinquantenaire, though there were a few areas of lower quality just south of the European Parliament building. Orange showed areas of strong localized RSRQ, particularly in the near key EU buildings, though had lower RSRQ areas in blue in the northwest, center and southwest of the map. Proximus had a somewhat similar map to Orange, with areas of higher RSRQ in the east of the map and near the important EU buildings like the Council of the European Union, but generally had lower RSRQ throughout the center of the map, particularly along major throughways like Rue de la Loi.
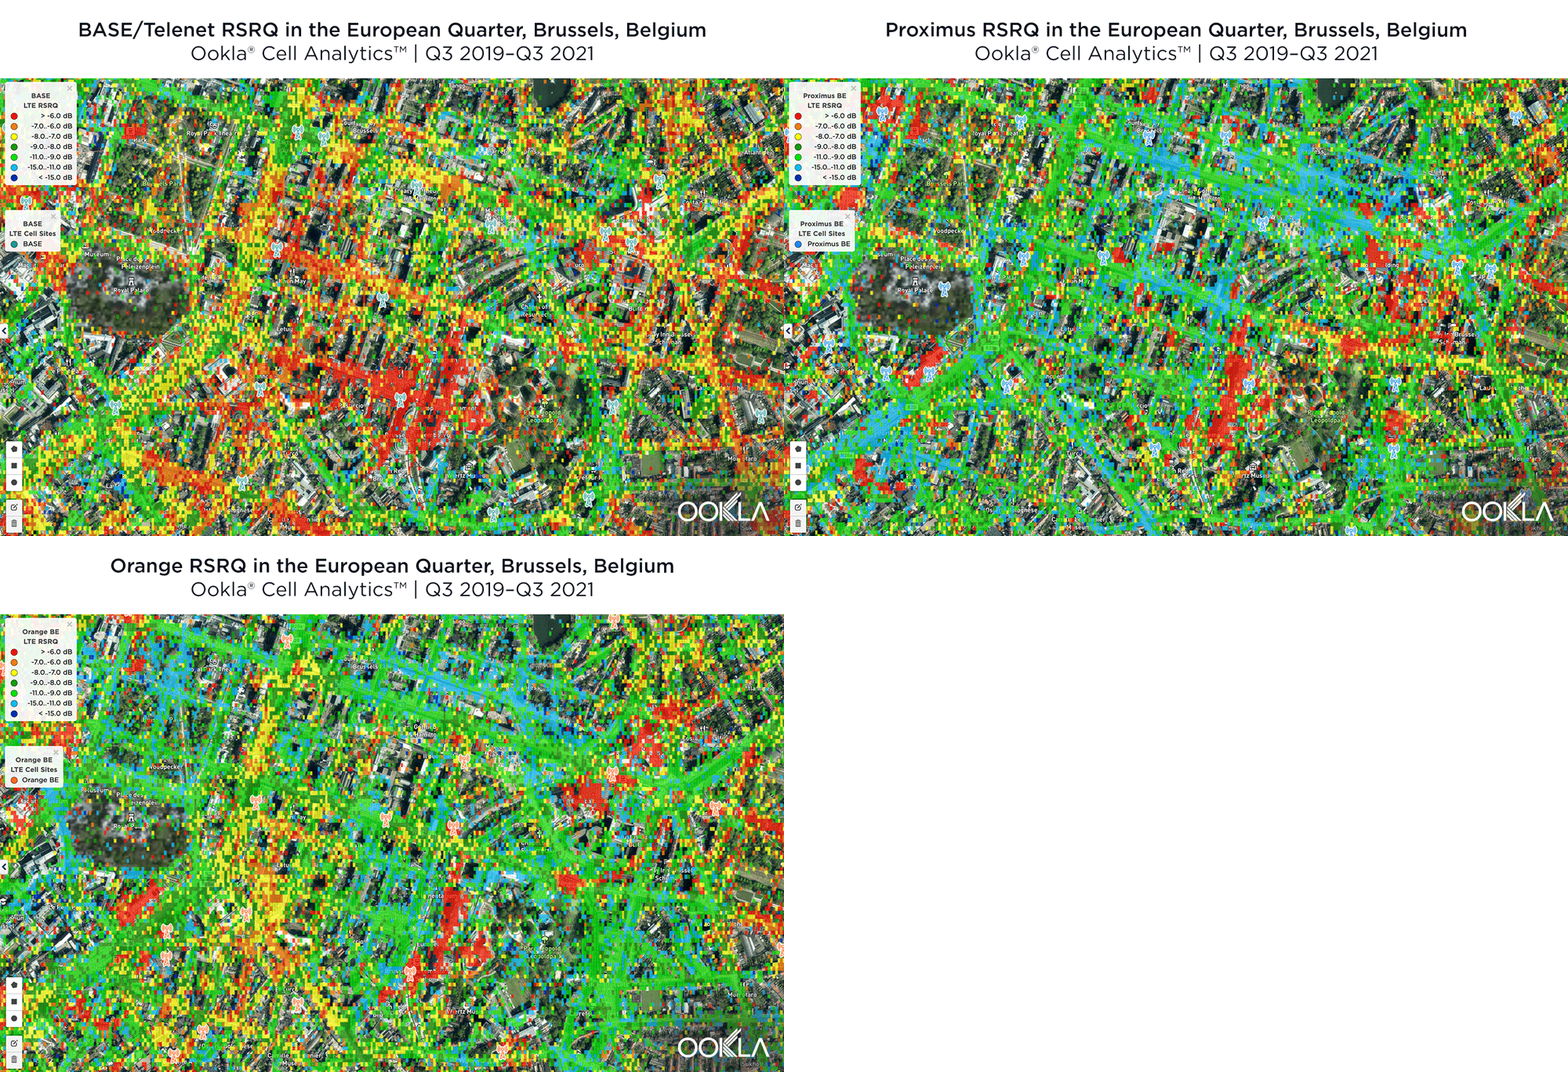
cell-analytics_rsrq_brussels-2_1121_en

Belgium has opportunities for fast 5G, but consumers won’t benefit until operators and regulators make 5G easier to implement

Belgium faces a challenging 5G outlook. The Secretary of State for the Brussels Region, Pascal Smet, has indicated a desire to make “Brussels the technology capital of Europe” and a recently commissioned report for the Belgian regulator estimates 5G’s impact on Belgian society as delivering an additional EUR 4-6 billion to GDP annually by 2030, and a further 40,000-80,000 new jobs. However, the auction of key 5G bands has been repeatedly delayed, and as they stand, strict non-ionizing radiation (NIR) limits will ultimately limit the scale of 5G deployment in the market.

Belgium’s plans for a multi-band spectrum auction — including new frequencies for 5G and the renewal of existing licenses — have been on hold for years as a result of disagreements between regional and federal governments, particularly over how the proceeds should be distributed. The country lags behind many of its regional peers in terms of 5G deployment and adoption, and the continued delay led the Belgian regulator, the Belgian Institute for Postal Services and Telecommunications (BIPT) to grant temporary 5G licenses during 2020. Recent proposals, which include holding the proceeds in escrow until agreement can be reached, appear to have broken the deadlock, and the auction is now expected to take place in Q2 2022.

Belgium also has to contend with some very stringent NIR limits, particularly in the Brussels region, which will serve to limit 5G deployment. The Regional Government adopted a “5G roadmap” in mid-July 2021 and is organizing working groups to draft a city-wide rollout plan, and make legislative changes. It has already moved to more than double the NIR limit, but despite this it remains lower than other Belgian regions — still well below EU proposals.

Under the draft legislation of the auction, operators would be required to cover 70% of the Belgian population with 5G within one year, increasing to 99.5% after two years. BIPT also plans to set aside spectrum for a potential fourth mobile network operator, as it seeks to reduce prices in the market. However, a consultation it commissioned in early 2021 on the impact of 5G and a fourth mobile network operator estimated that the entry of a new player would have a negligible impact on employment and investment and an uncertain impact on revenues (+/- 5%, versus flat). As a result, the amount of spectrum reserved for a new entrant has been reduced, to allow B2B operators to bid for some of the remaining frequencies. Proximus, which launched its 5G network during Q3 2020, saw median 5G download and upload speeds at 201.59 Mbps and 20.33 Mbps, respectively, during Q3 2021. With Orange and Telenet making huge investments to expand their 5G network within Belgium — and Telenet launching commercial 5G this week, we’re excited to see what the future holds.

Belgium has the opportunity to improve mobile and fixed broadband speeds for consumers, and we’ll be watching closely to see what happens in the future with our Global Index Market Analyses. Learn more about Ookla Speedtest Intelligence or Cell Analytics by inquiring here.


België loopt achter op EU-collega’s en wordt geconfronteerd met uitdagingen inzake 5G-regelgeving

België vormt een belangrijke hoeksteen van de Europese gemeenschap en is de thuisbasis van de Raad van de Europese Unie, de Europese Commissie, het Europees Parlement en de Europese Raad. België loopt echter achter op zijn regionale partners wat de ondersteuning van 5G-mededinging betreft, met slechts één 5G-provider gedurende het grootste deel van 2021. In dit artikel maakten we gebruik van Ookla® Speedtest Intelligence® com de prestaties van vast en mobiel internet in België te onderzoeken, alsook de regionale en provinciale prestaties tijdens het derde kwartaal van 2021. We hebben ook de Europese wijk in Brussel onderzocht met Ookla Cell Analytics om te bepalen welke mobiele operatoren het beste signaalniveau en de beste signaalkwaliteit hadden.

Nederland is koploper onder de regionale handelspartners van België voor snelste mobiel netwerk
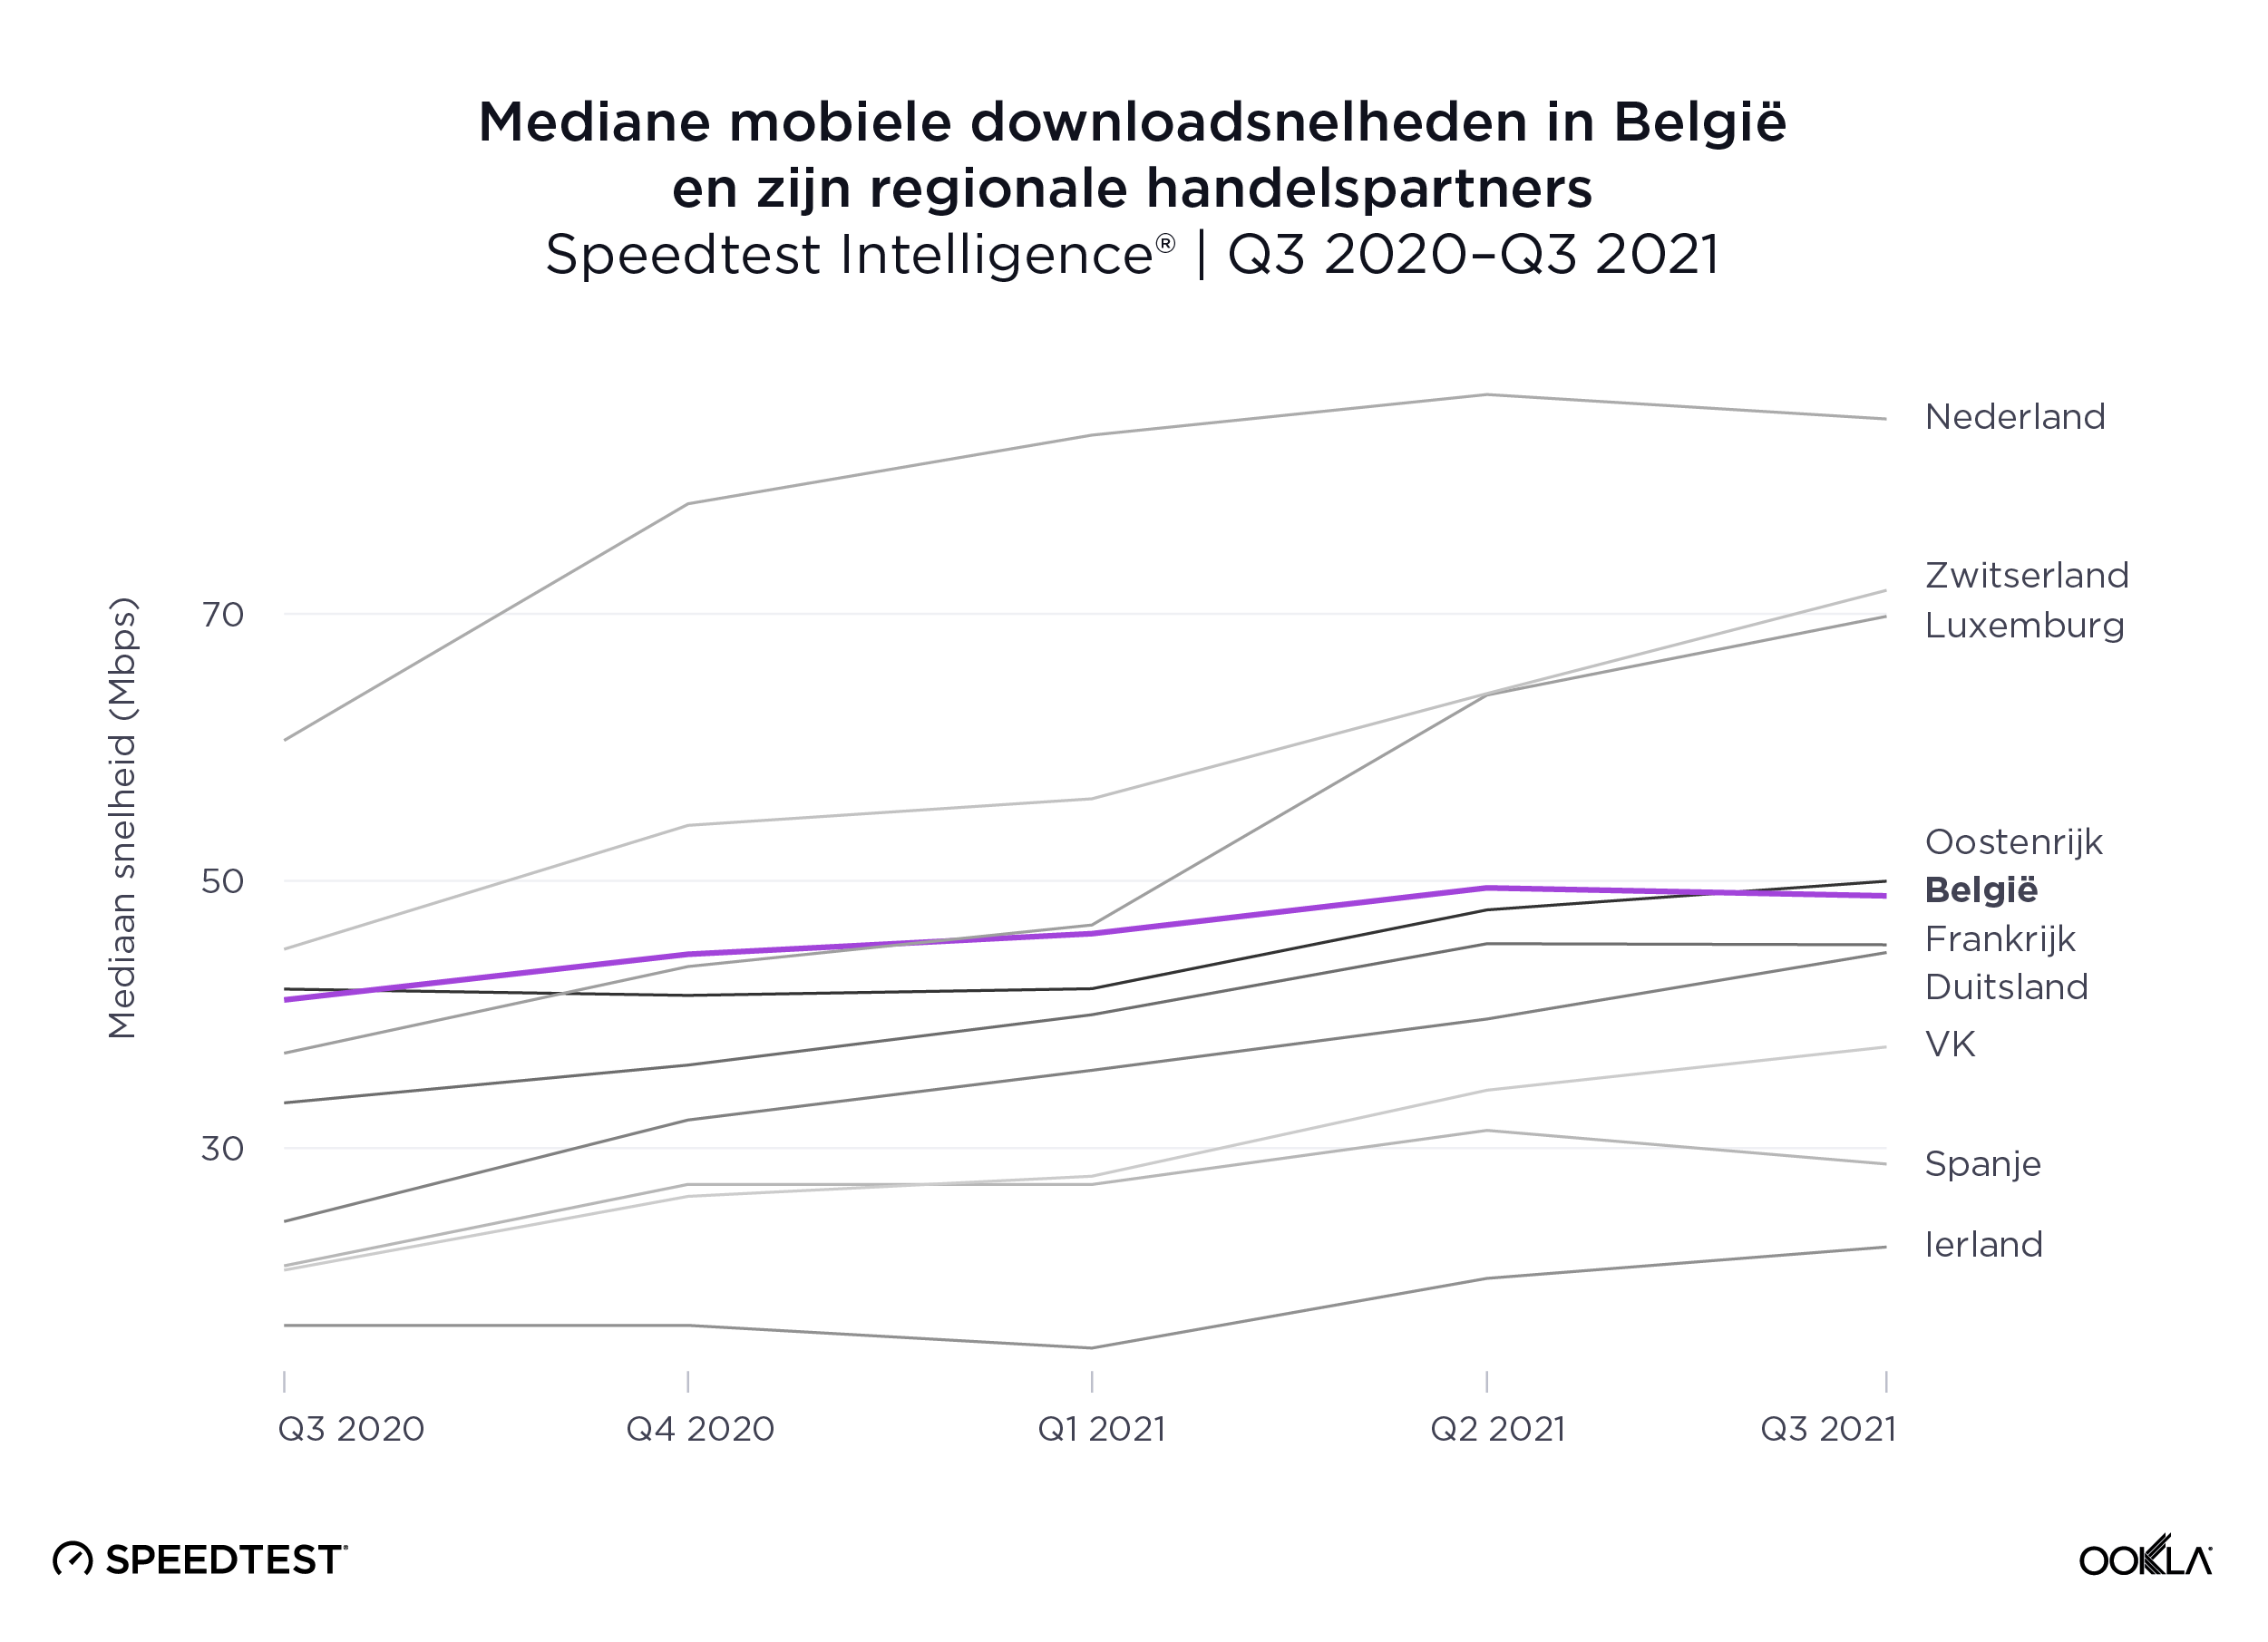
ookla_mobile-download-comparison_belgium_1121_be-01

Speedtest Intelligence toont aan dat Nederland de snelste mediane mobiele downloadsnelheid had van België’s dichtstbijzijnde regionale handelspartners met 84,59 Mbps tijdens Q3 2021. Zwitserland en Luxemburg volgden met respectievelijk 71,76 Mbps en 69,81 Mbps. Oostenrijk was de volgende met 49,98 Mbps, gevolgd door België met 48,88 Mbps.

Zwitserland en Spanje zetten de Europese standaard met vaste breedbandsnelheden van meer dan 100,00 Mbps
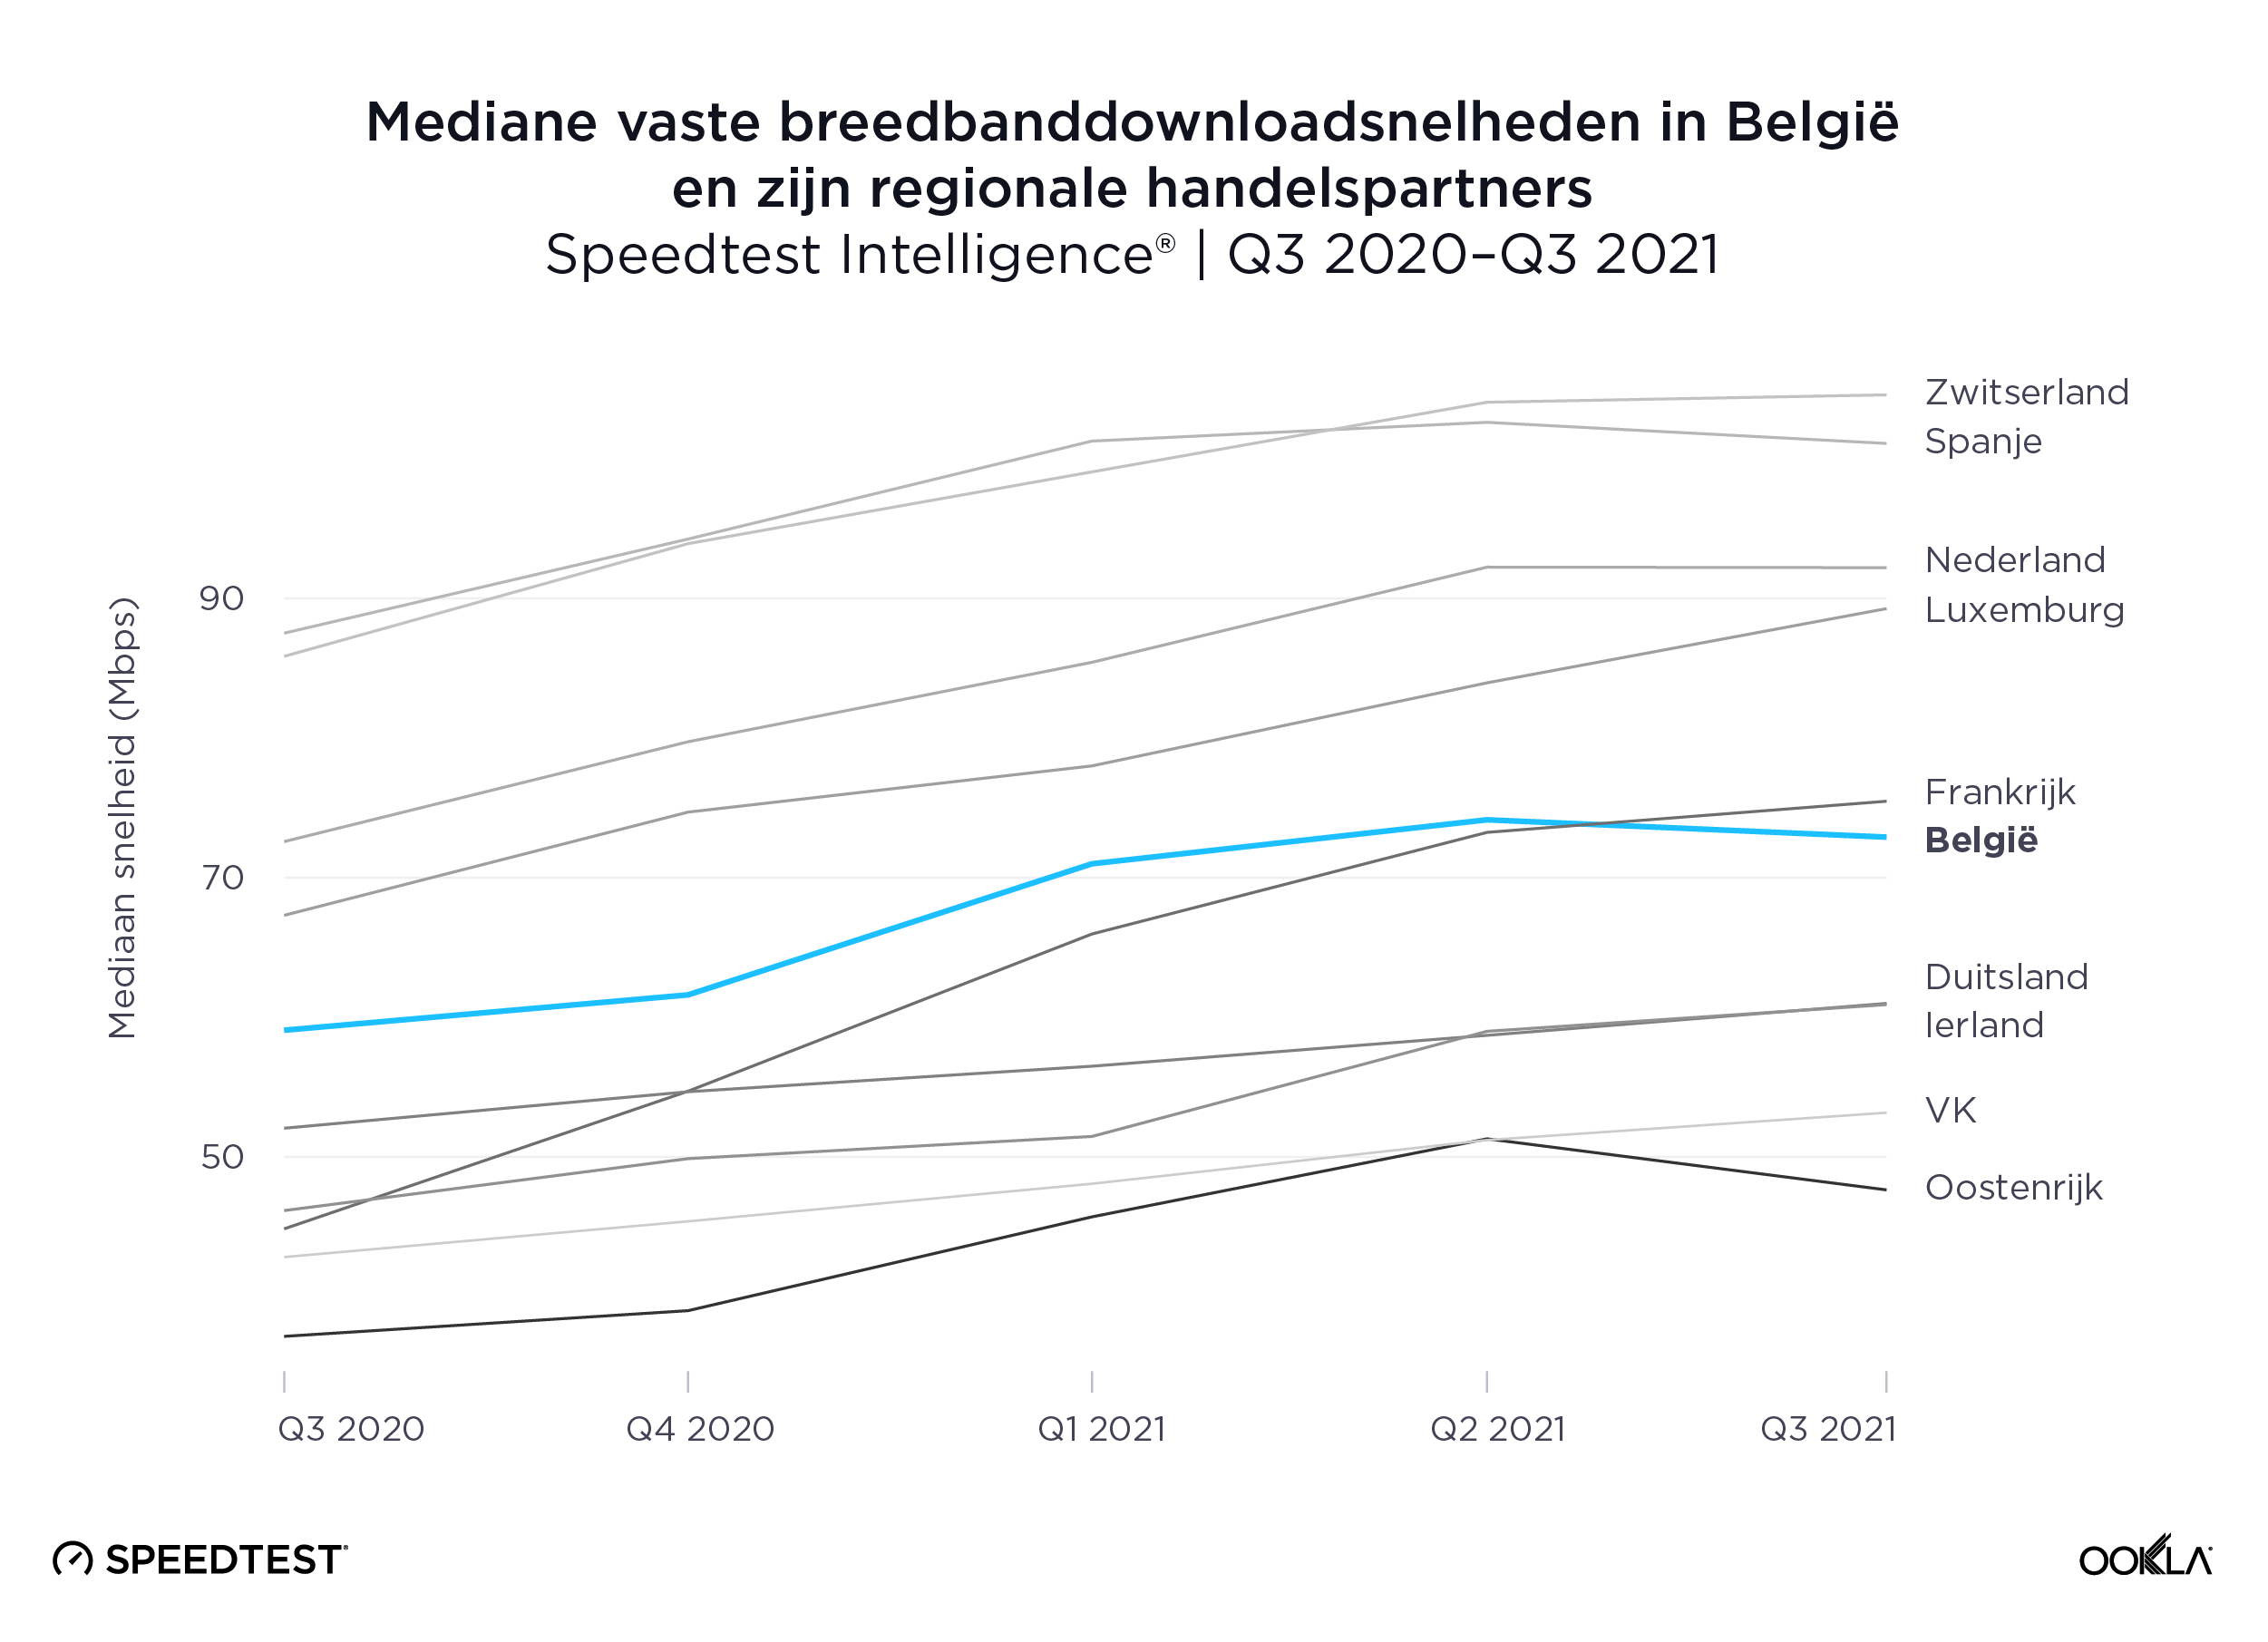
ookla_fixed-download-comparison_belgium_1121_be-01

Volgens Speedtest Intelligence had Zwitserland de snelste mediane vaste breedbandsnelheid van België en zijn regionale handelspartners, namelijk 104,58 Mbps tijdens het derde kwartaal van 2021, waarmee het Spanje met zijn 101,10 Mbps voorbleef. Nederland en Luxemburg volgden met respectievelijk 92,20 Mbps en 89,27 Mbps. België’s mediane vaste breedband downloadsnelheid van 72,90 Mbps was net iets trager dan die van Frankrijk met 75,47 Mbps.

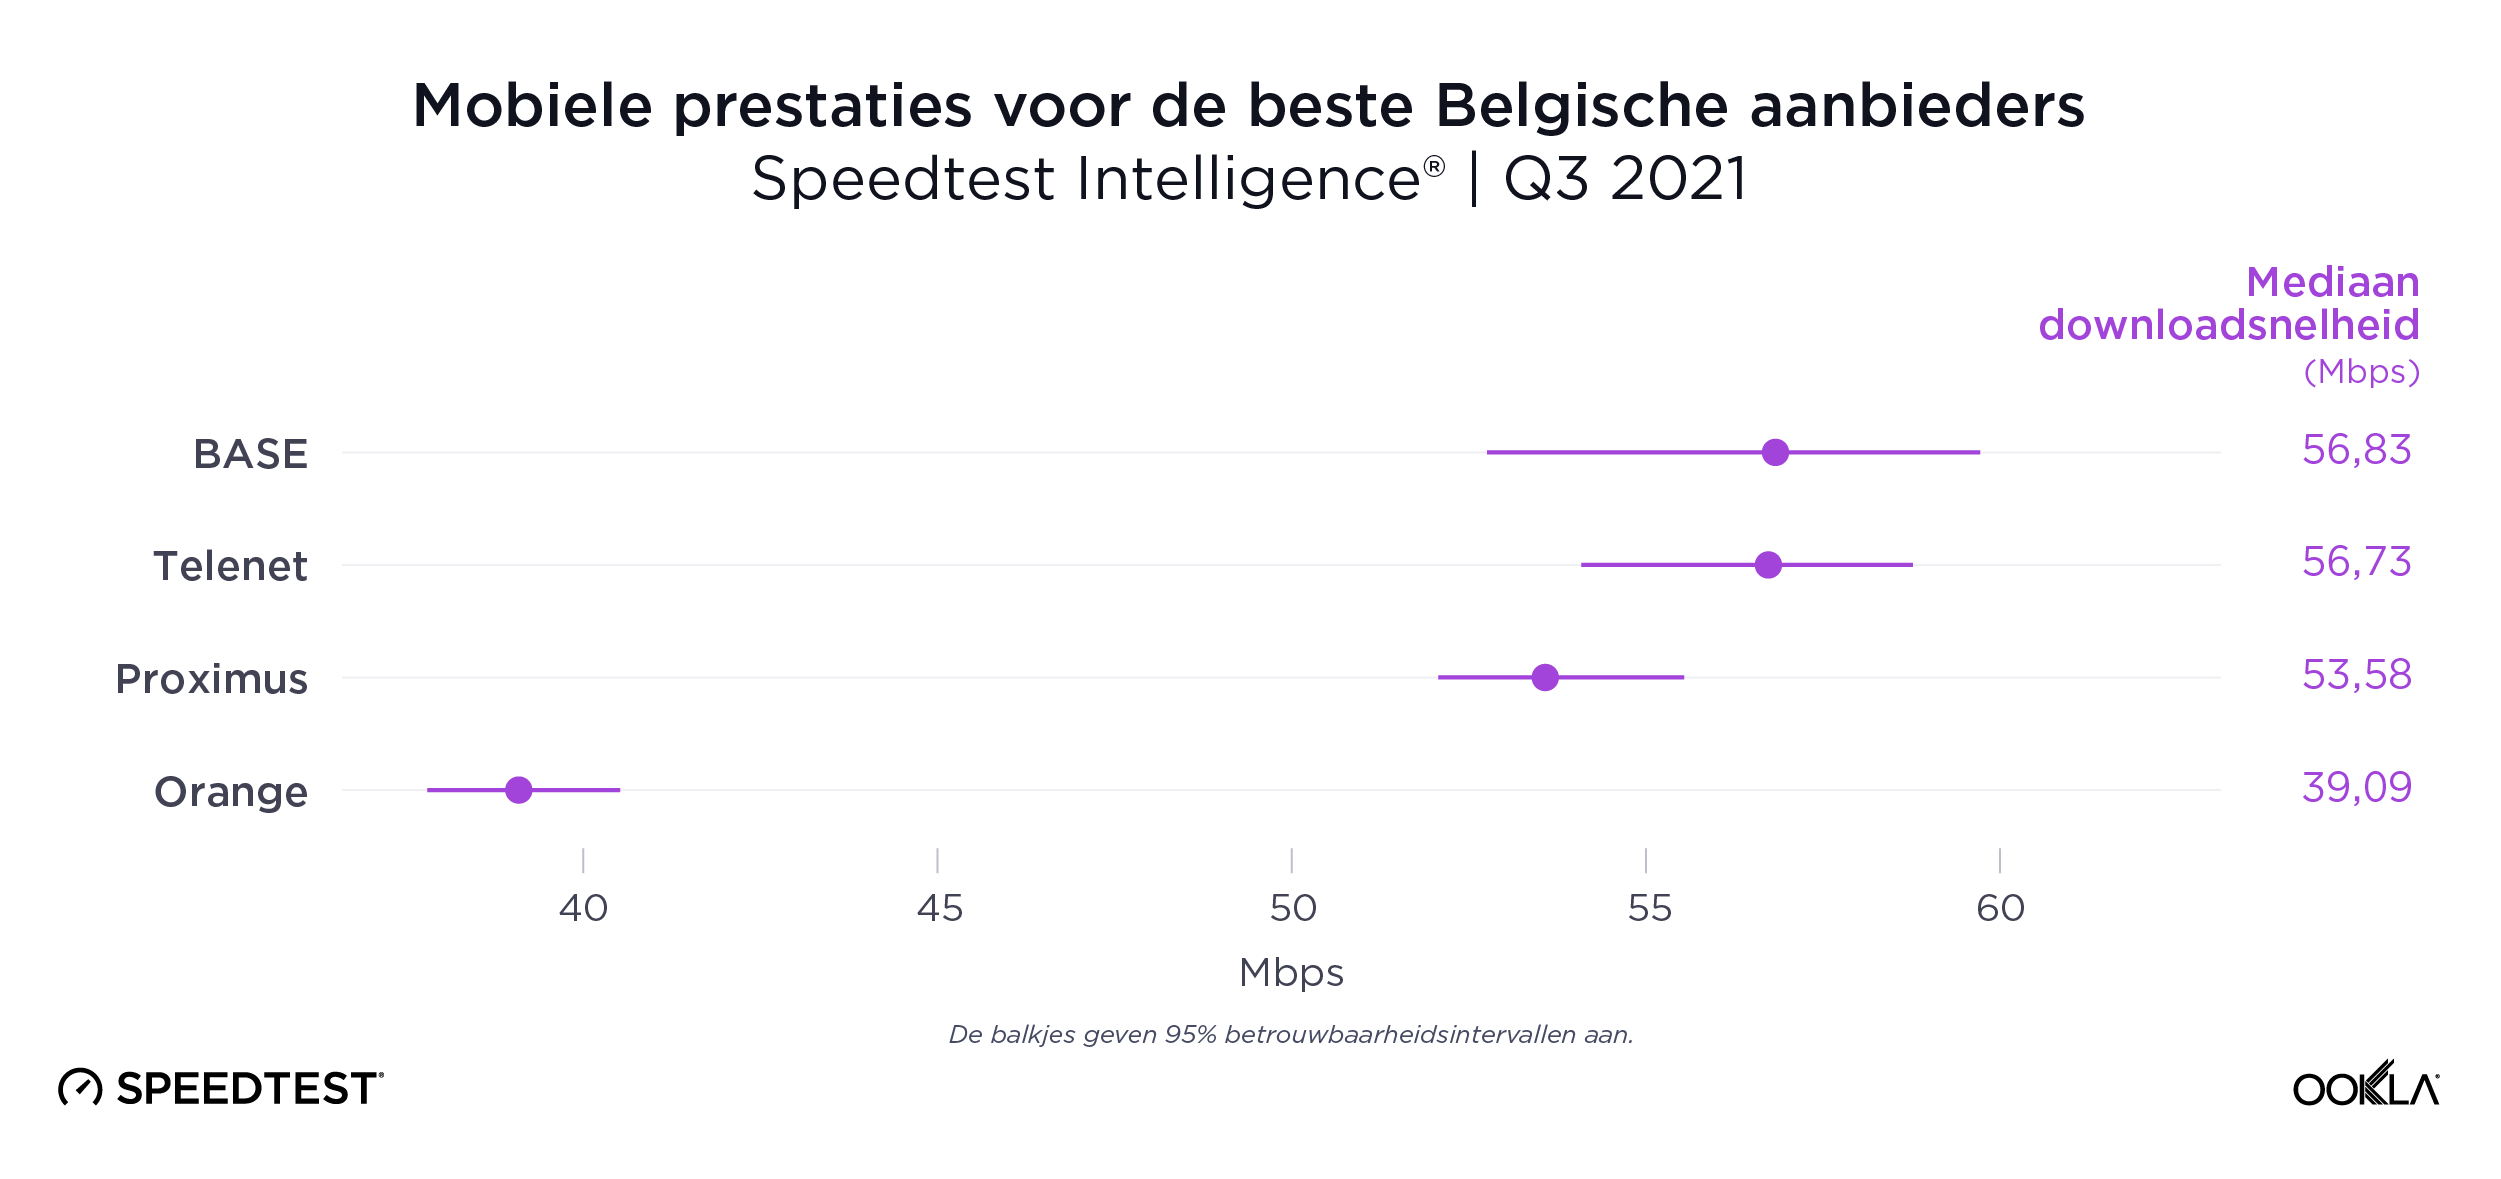
BASE, Telenet en Proximus overtroffen Orange voor mobiel
ookla_mobile-top-provders_belgium_1121_be-01

Het verschil tussen de snelste mobiele aanbieders van België was in het derde kwartaal van 2021 zeer klein: BASE (56,83 Mbps), Telenet (56,73 Mbps) en Proximus (53,58 Mbps) gingen aan kop. Orange was vierde met 39,09 Mbps. Er moet ook worden opgemerkt dat Telenet eigenaar is van het merk BASE.

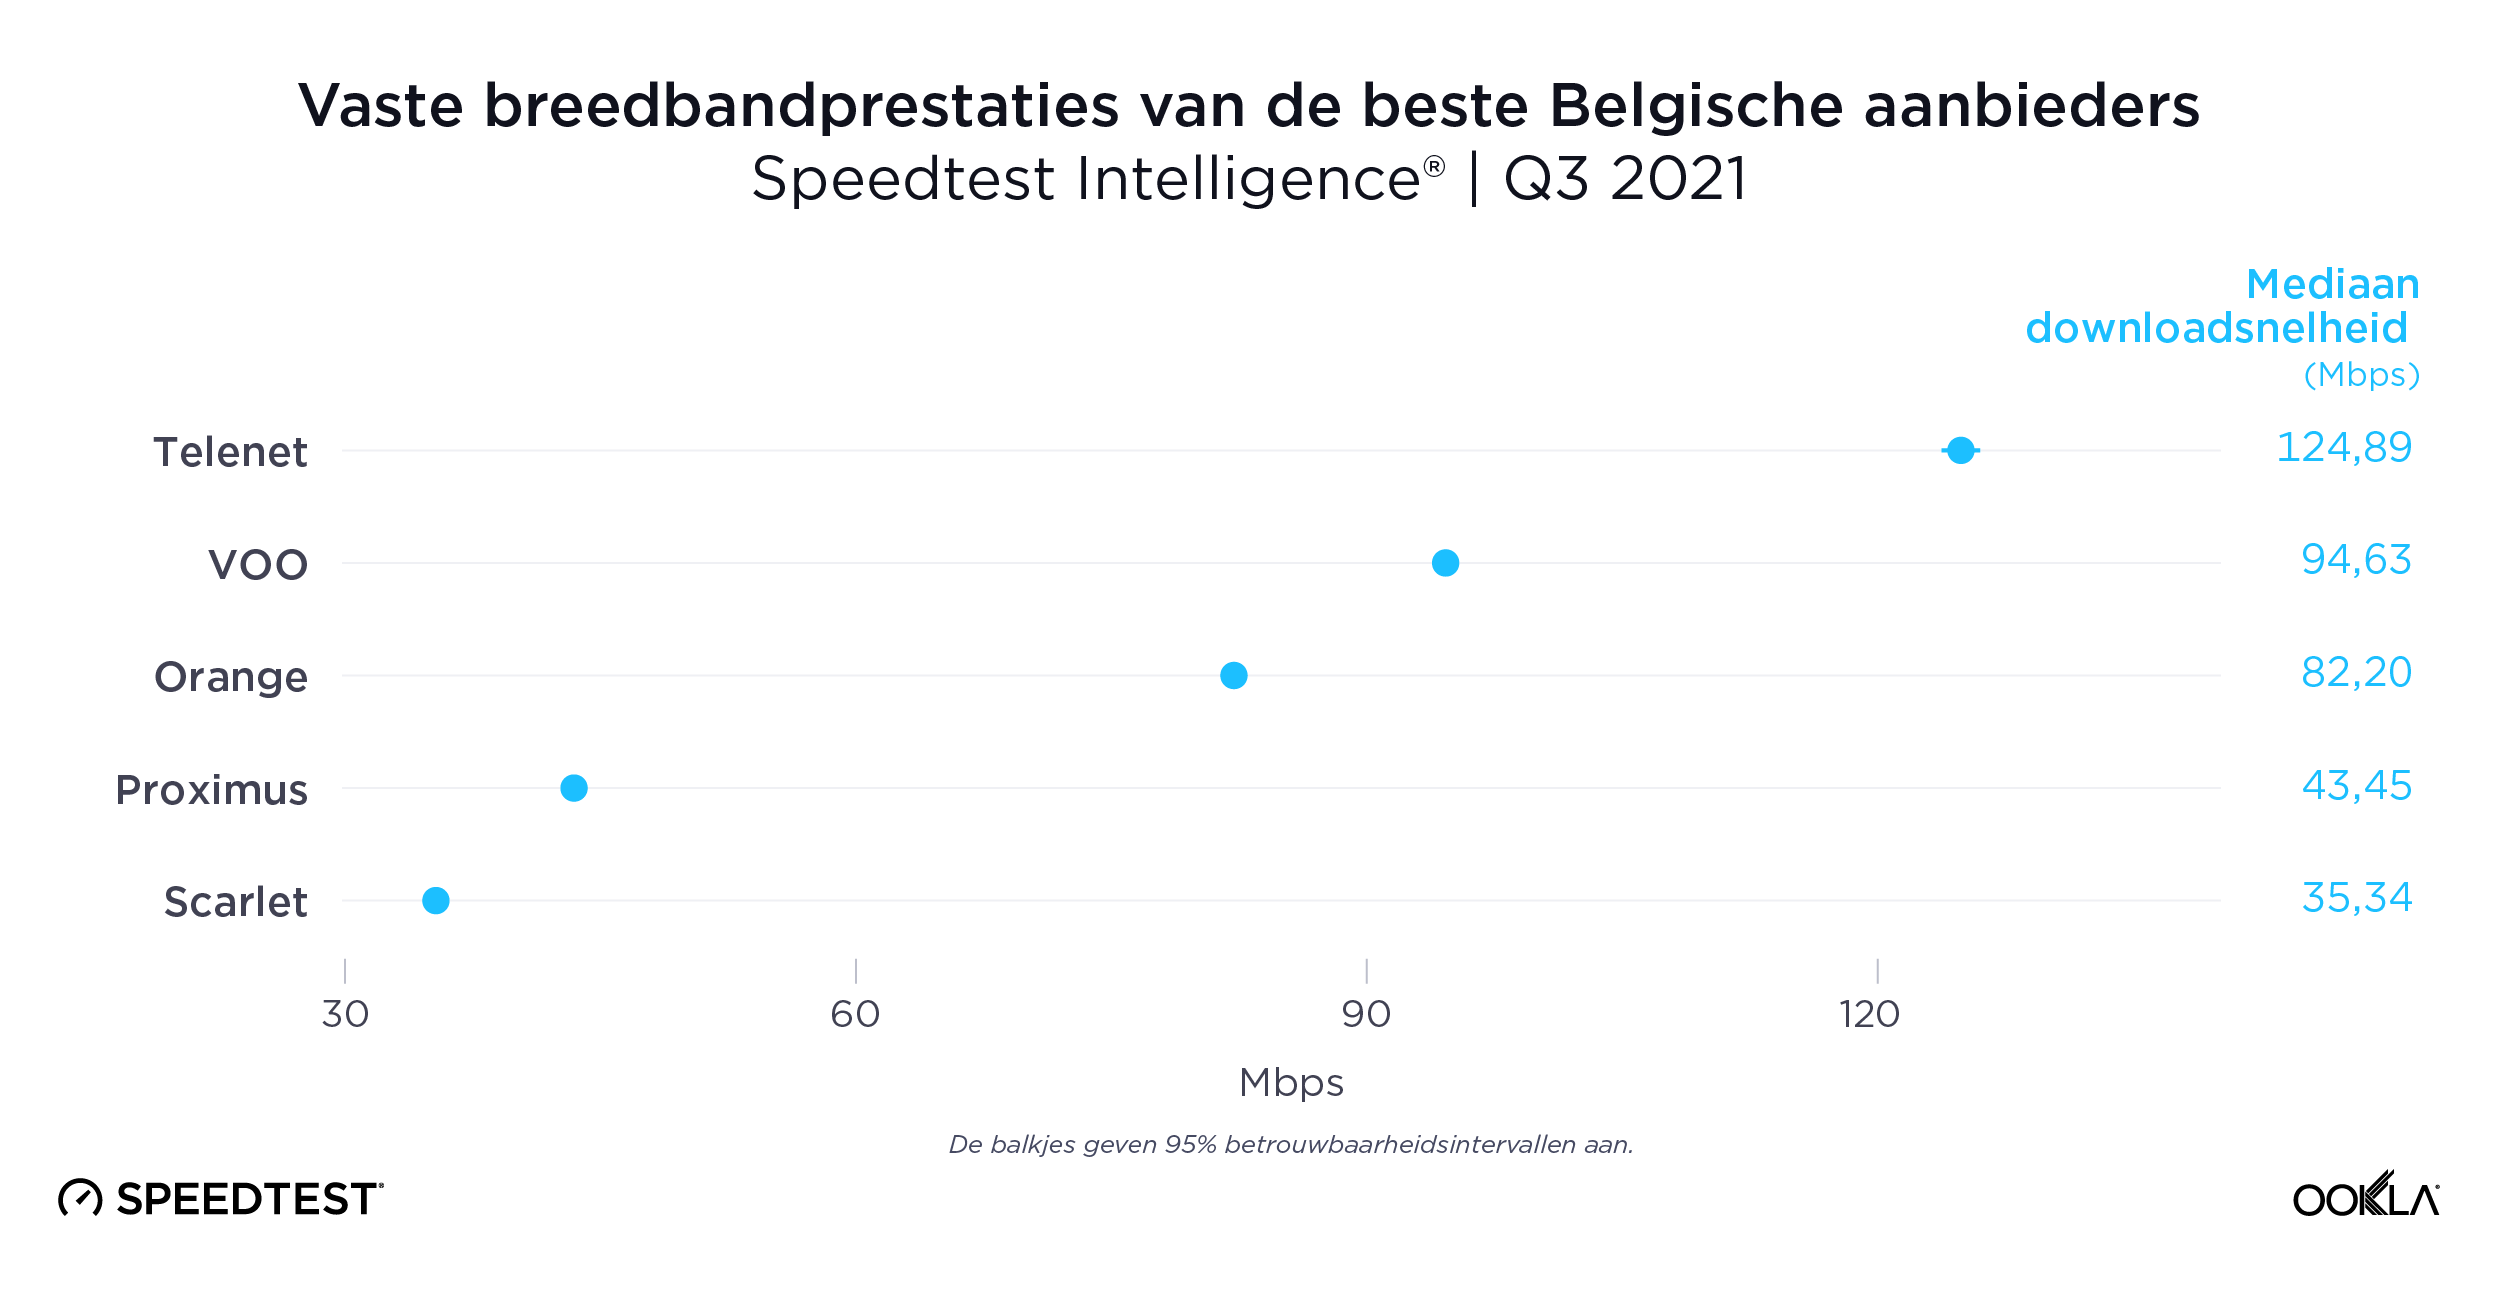
Telenet had de snelste vaste breedbandsnelheid
ookla_fixed-top-provders_belgium_1121_be-01

Telenet had de snelste downloadsnelheid via vaste breedband met 124,89 Mbps. Dit was veel beter dan VOO, dat volgde met 94,63 Mbps. Orange was de volgende op de lijst met 82,20 Mbps, gevolgd door Proximus (43,45 Mbps) en Scarlet (35,34 Mbps).

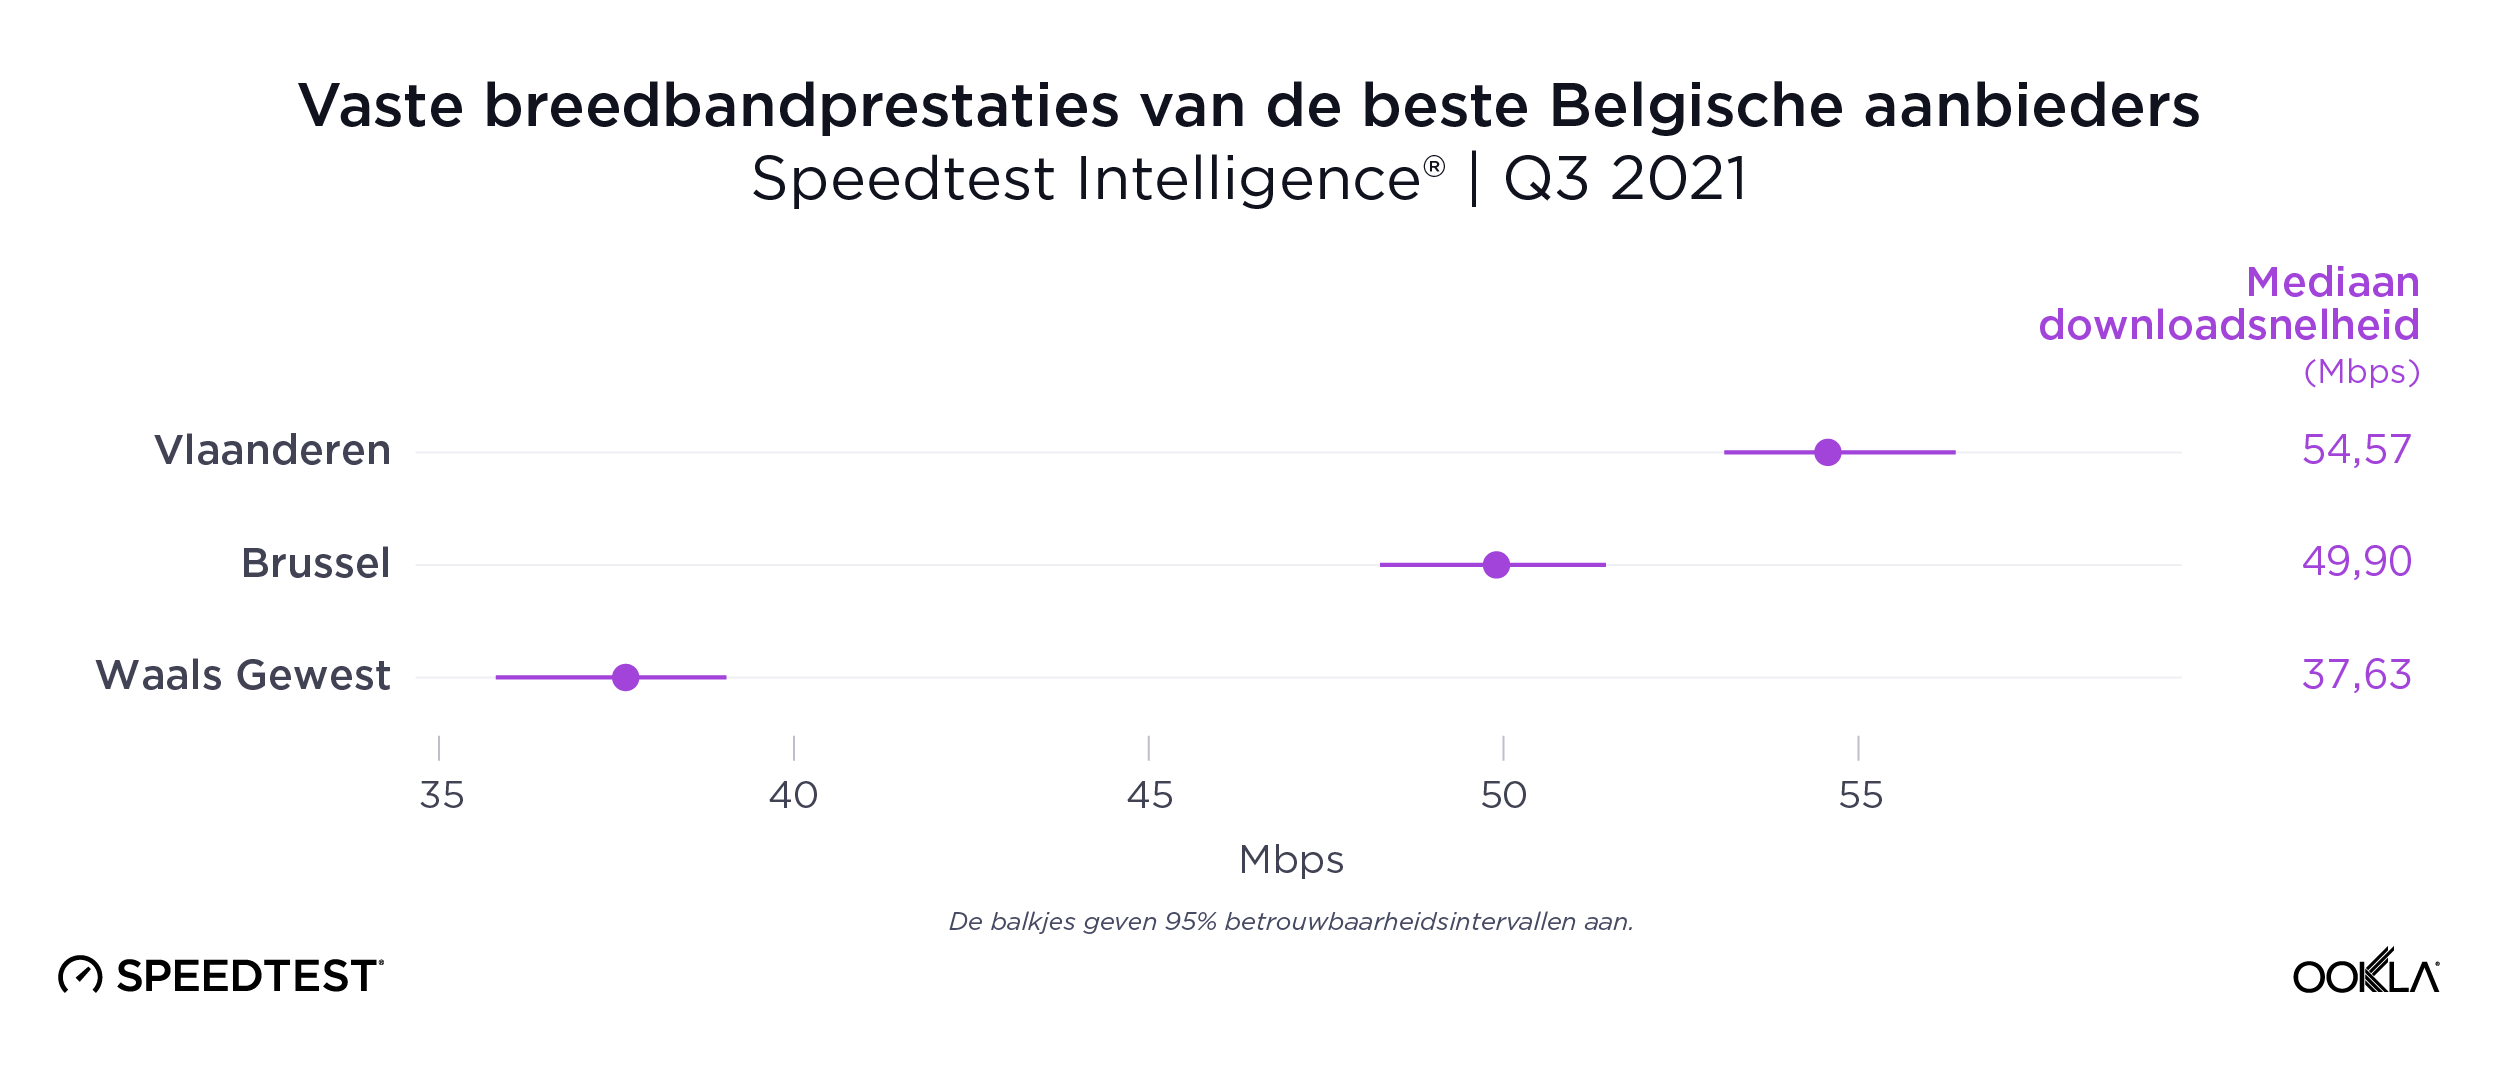
Vlaanderen had hogere mobiele downloadsnelheden dan Brussel en het Waalse Gewest
ookla_mobile-download-performance_belgium-regions_1121_be-01

Gegevens van Speedtest Intelligence brachten tijdens het derde kwartaal van 2021 een grote kloof aan het licht tussen de meer bevolkte noordelijke Vlaamse regio van België en de minder bevolkte zuidelijke Waalse regio wat mobiele prestaties betreft. Vlaanderen had een mediane mobiele downloadsnelheid van 54,57 Mbps tegenover 37,63 Mbps in Wallonië. Het Brussels Hoofdstedelijk Gewest zat opnieuw in het midden met mobiel op 49,90 Mbps. Deze digitale kloof breidde zich uit tot de gegevens op provincieniveau, waarbij bijna elke Vlaamse provincie hogere mediane downloadsnelheden haalde dan de Waalse provincies.

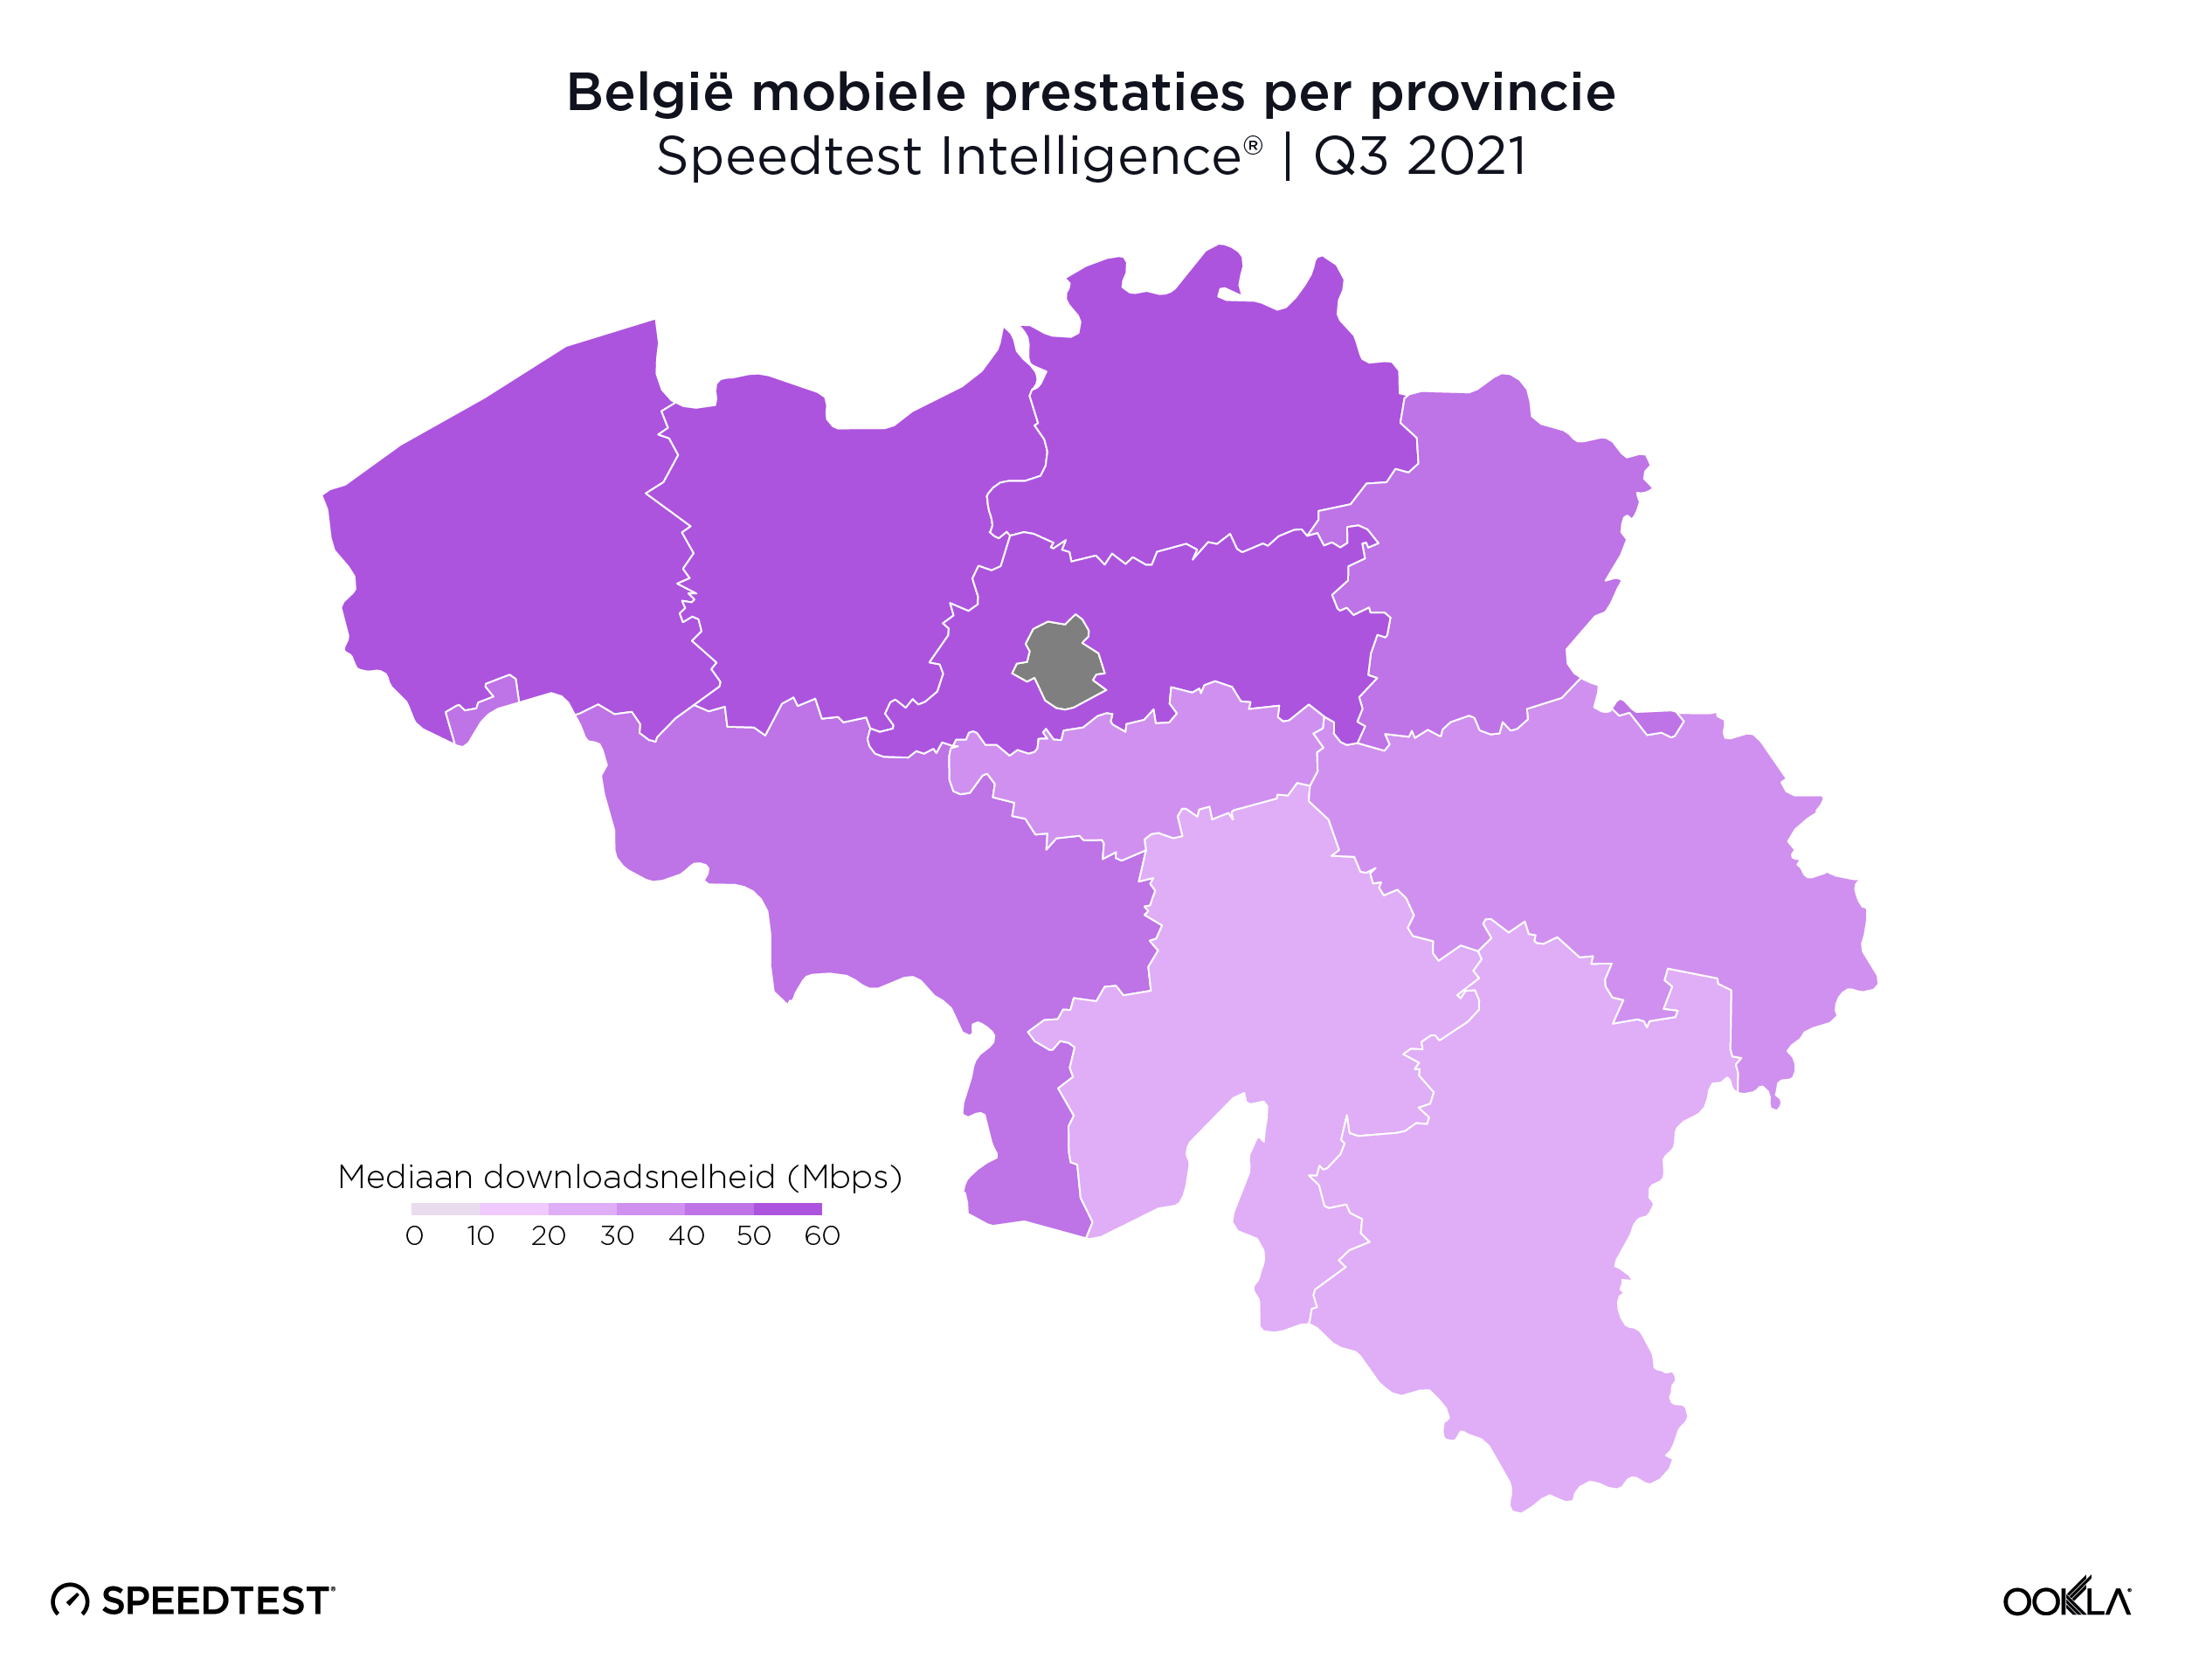
Vier Vlaamse provincies hadden mobiele downloadsnelheden van meer dan 50 Mbps
ookla_mobile-performance_belgium_map_1121_be-01

Er was geen statistisch snelste mobiele downloadsnelheid onder de Belgische provincies, hoewel Vlaams-Brabant (57,47 Mbps), Antwerpen (57,30 Mbps), West-Vlaanderen (54,95 Mbps) en Oost-Vlaanderen (52,19 Mbps) allemaal downloadsnelheden boven de 50,00 Mbps noteerden. De provincie Luxemburg (28,40 Mbps) en de provincie Namen (28,71 Mbps) waren de enige Belgische provincies die een mediane mobiele downloadsnelheid van 30,00 Mbps niet haalden.

Er was een grote kloof tussen Vlaanderen en Wallonië wat vaste breedband betreft
ookla_fixed-download-performance_belgium-regions_1121_be-01

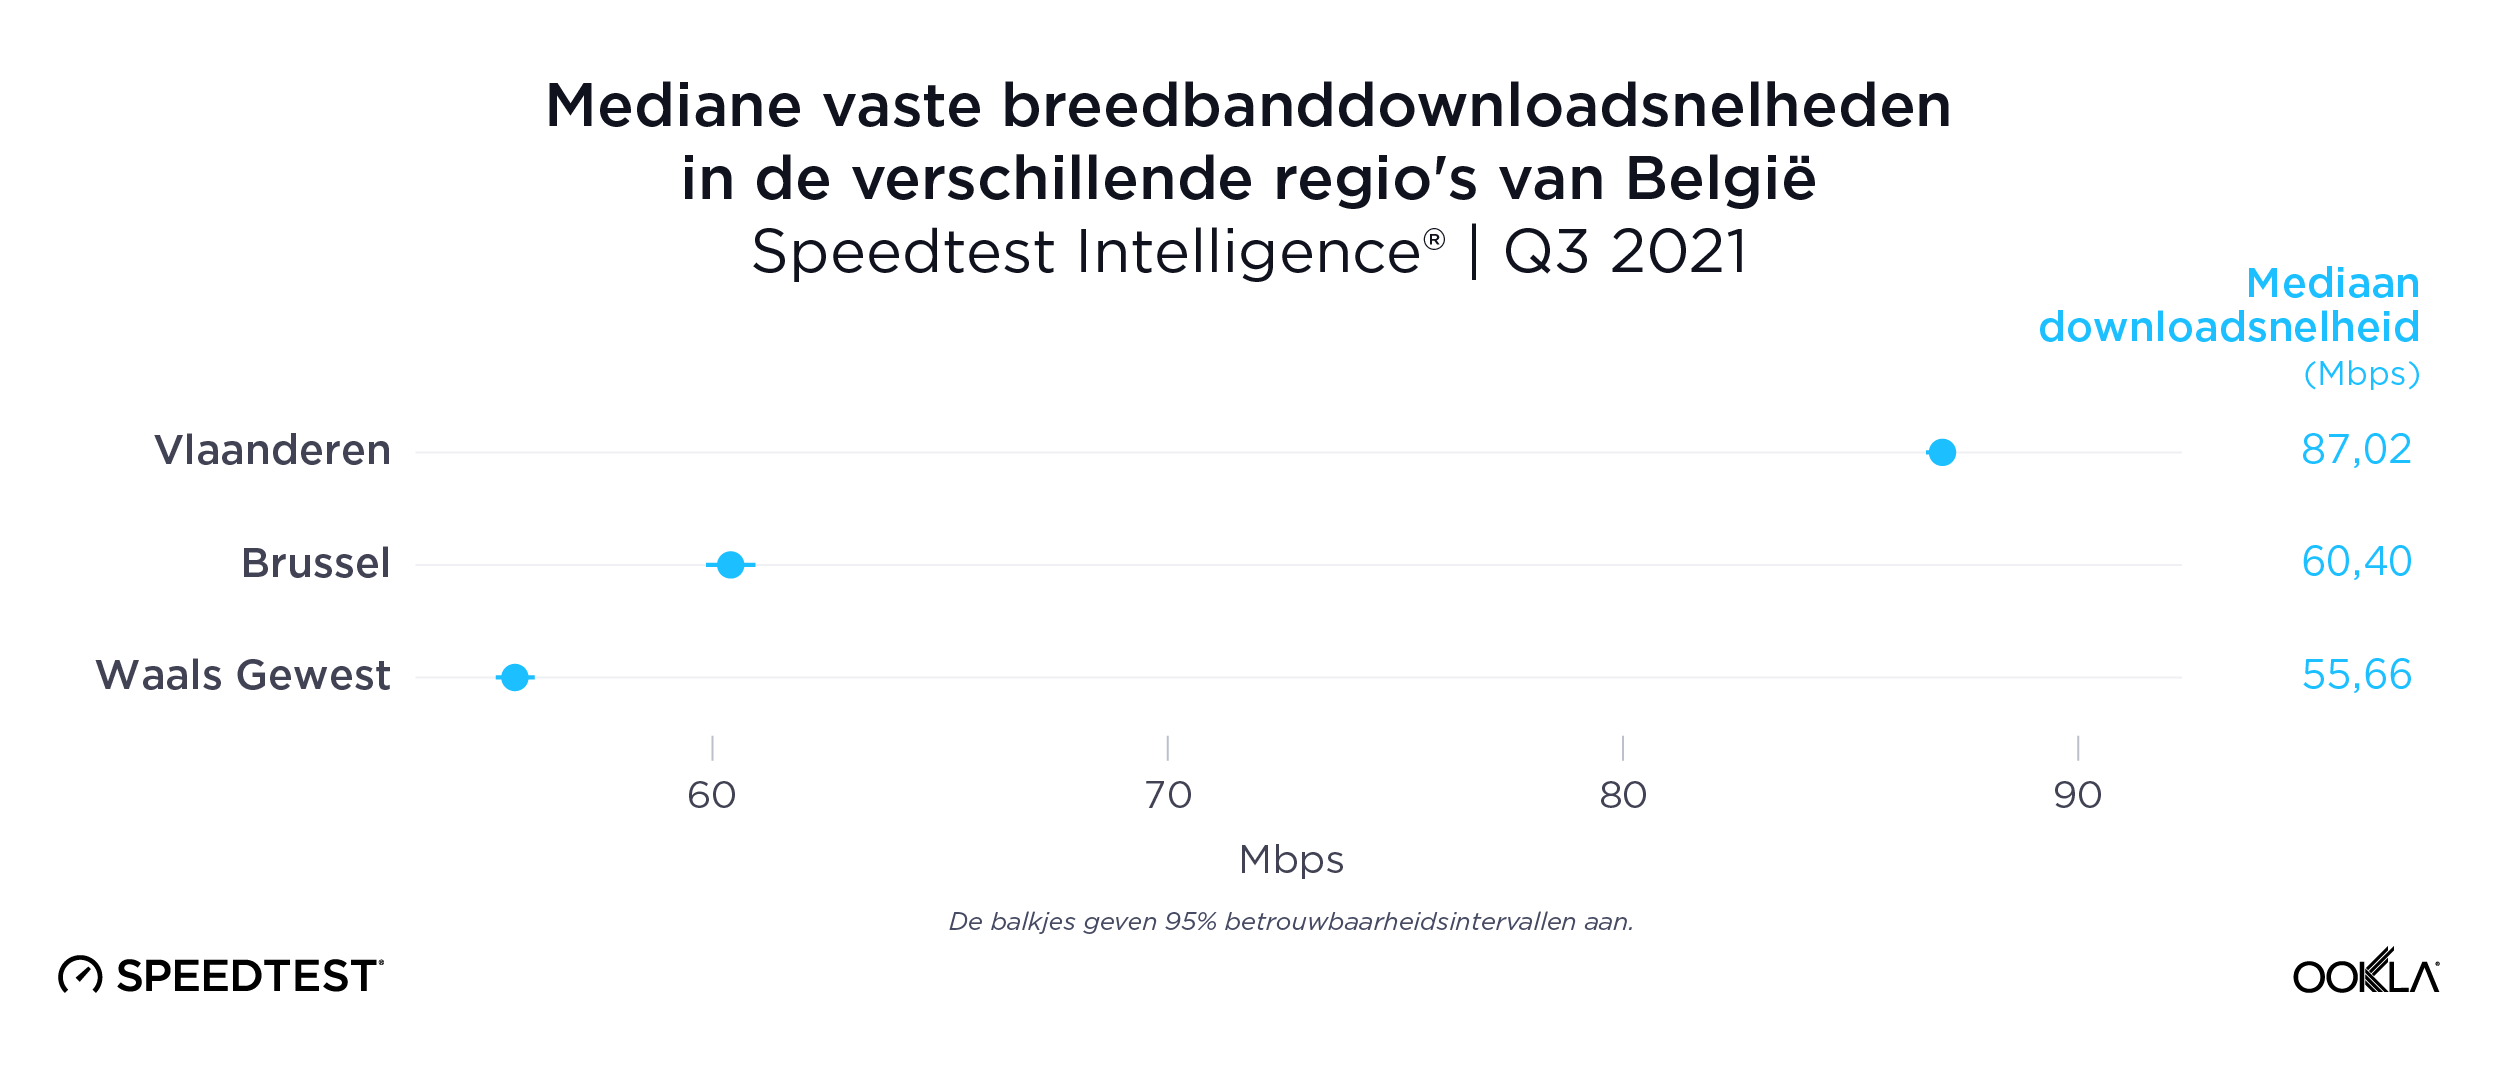
Uit gegevens van Speedtest Intelligence blijkt dat de digitale kloof tussen de Belgische regio’s in het derde kwartaal van 2021 nog groter was op het gebied van vaste breedband. Vlaanderen had een mediane vaste breedband downloadsnelheid van 87,02 Mbps tegenover 55,66 Mbps in Wallonië. Het Brussels Hoofdstedelijk Gewest zat opnieuw in het midden met 60,40 Mbps.

Limburg was snelste provincie voor vaste breedband

ookla_fixed-performance_belgium_map_1121_be-01

Limburg had de snelste mediane downloadsnelheid via vaste breedband met 90,07 Mbps, gevolgd door Oost-Vlaanderen (86,68 Mbps), West-Vlaanderen (86,45 Mbps), Antwerpen (85,23 Mbps) en Vlaams-Brabant (84,50 Mbps). Er was geen snelste provincie in Wallonië, hoewel Waals-Brabant en de provincie Namen de snelste mediane downloadsnelheden hadden met respectievelijk 60,15 Mbps en 58,90 Mbps.

4G LTE-signaalniveau en -kwaliteit per aanbieder in de buurt van de Europese wijk in Brussel

We onderzochten de mobiele prestaties in de Europese wijk in Brussel met behulp van Cell Analytics-gegevens van de afgelopen 24 maanden. Elk van deze kaarten toont het sterkste 4G-signaalniveau (RSRP) en de signaalkwaliteit (RSRQ) in dit belangrijke gebied, wat mobiele operatoren kan helpen bij het verbeteren van hun netwerken. Cell Analytics identificeert de sterkste RSRP en RSRQ per mobiele-netwerkexploitant voor een bepaald gebied of gebouw wanneer er een statistisch significante winnaar is en kleurt die plotbin de overeenkomstige kleur van de aanbieder. De kaarten op RSRP-aanbiederniveau tonen de sterkte van een signaal van individuele aanbieders voor een bepaald gebied, waarbij roze en rood een sterk signaal aangeven en blauw een zwak signaal. Aangezien gebruikers zelfs met een sterk signaal een slechte kwaliteit kunnen ervaren, met onderbrekingen van het geluid of trage datasnelheden tot gevolg, geven kaarten op aanbiederniveau van RSRQ de kwaliteit van het signaal van een operator voor een bepaald gebied aan, waarbij rood staat voor een signaal van hoge kwaliteit en blauw voor een signaal van lagere kwaliteit. We hebben ook de locaties van gsm-masten in het gebied bij benadering opgenomen.

Scherpe concurrentie voor beste 4G LTE RSRP in Brussel

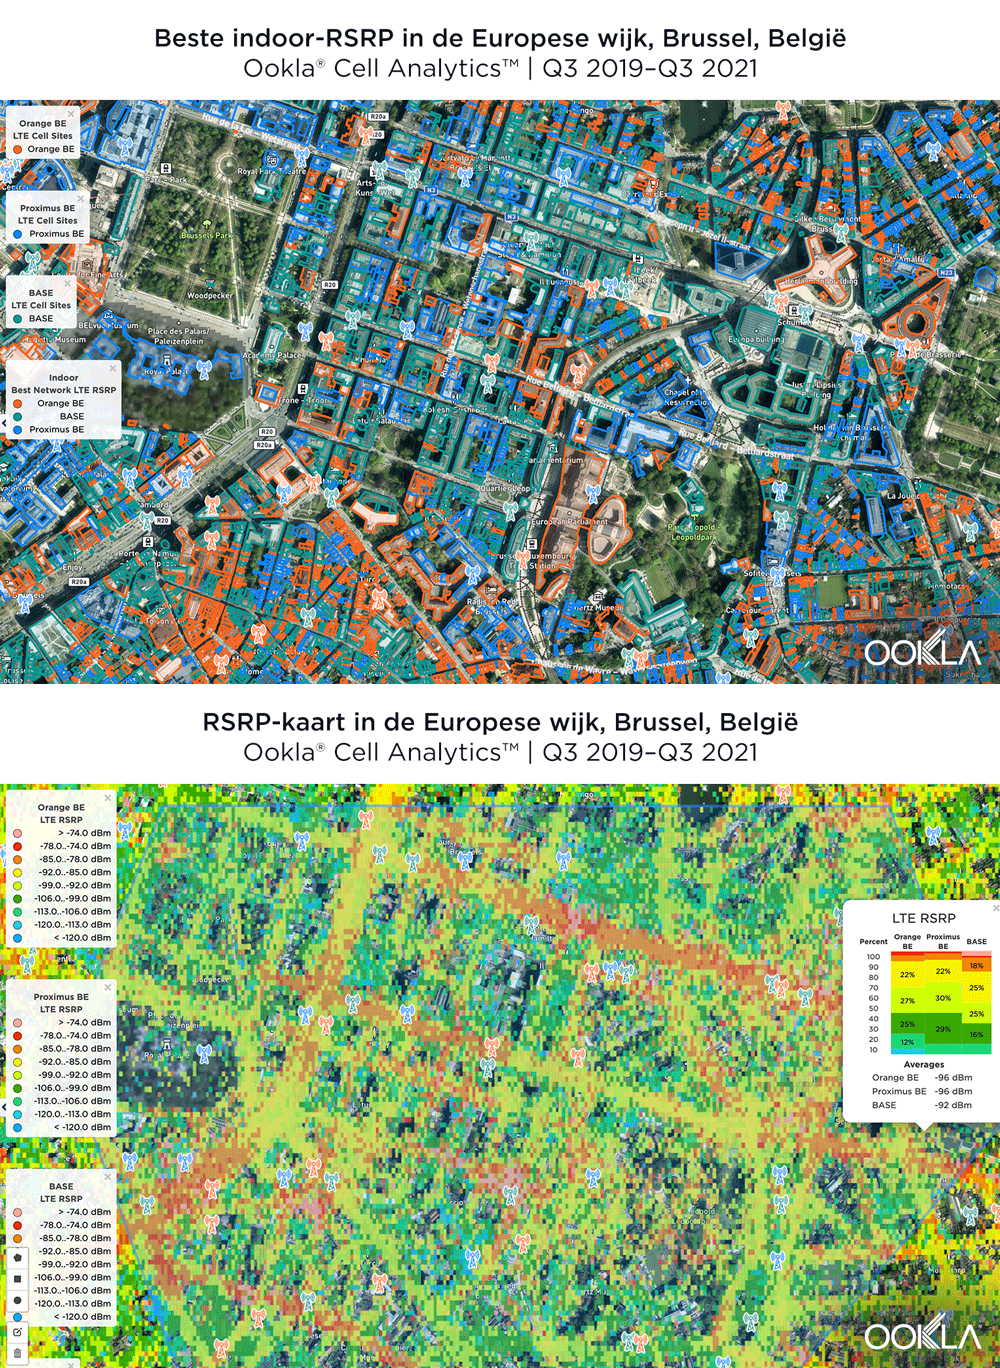
De onderstaande afbeelding toont waar een aanbieder de afgelopen 24 maanden de sterkste 4G LTE RSRP-signaalsterkte had. Zoals u kunt zien, was BASE/Telenet sterk aanwezig in het midden van de kaart, met de hoogste RSRP in ons polygoongebied. Proximus en Orange hadden sterke signalen rond de randen van de kaart, en Orange had de sterkste RSRP in enkele van de belangrijkste EU-instellingen, waaronder het hoofdkwartier van de Europese Commissie en het Europees Parlement.
cell-analytics_rsrp_brussels-1_1121_be

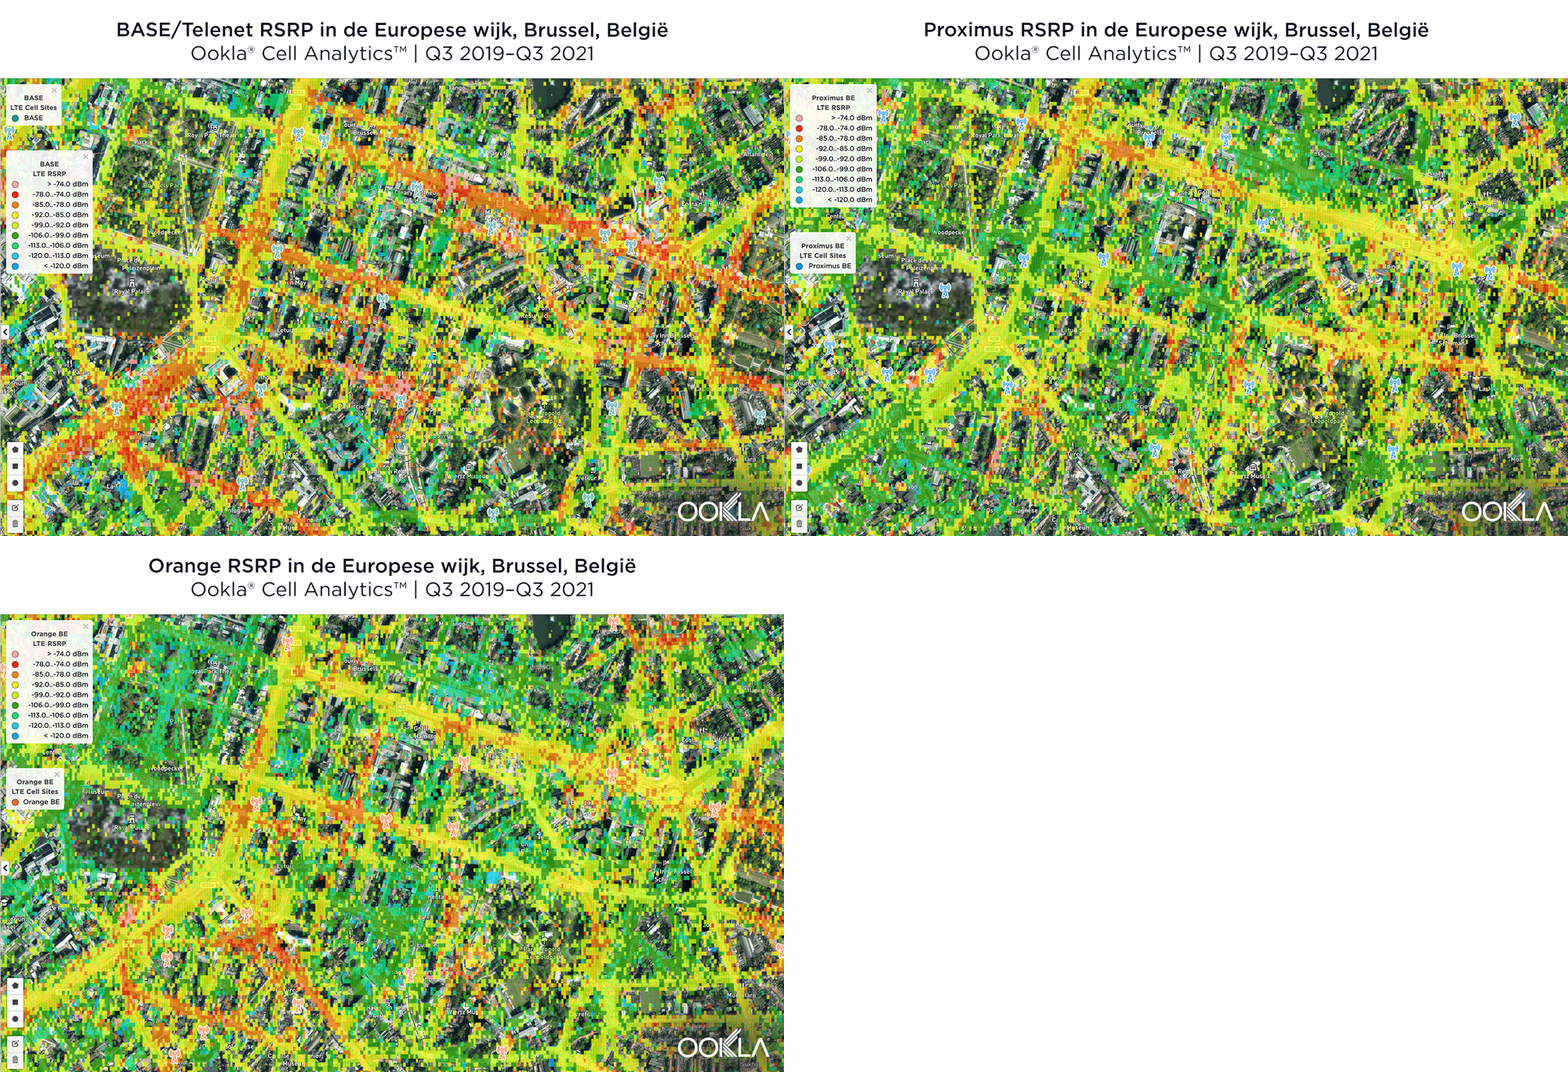
De onderstaande kaarten laten zien waar elke topaanbieder een hoge en een lage signaalsterkte heeft in de Europese wijk. BASE/Telenet liet zeer sterke RSRP zien in het centrum van de kaart, met name rond de grote EU-gebouwen, de Wetstraat en bij de Marnixlaan, hoewel er een paar zwakkere gebieden waren net ten zuidwesten van het gebouw van het Europees Parlement. Orange toonde gebieden van sterke gelokaliseerde RSRP door de kaart, vooral in het zuidwesten, met een zwakkere RSRP in blauw in het noordwesten en in het centrum van de kaart. Proximus had enkele sterke zones in de Wetstraat en in het hart van de Europese wijk, maar had overal zwakkere signalen.
cell-analytics_rsrp_brussels-2_1121_be

BASE/Telenet had de beste RSRQ in de Brusselse Europese Wijk

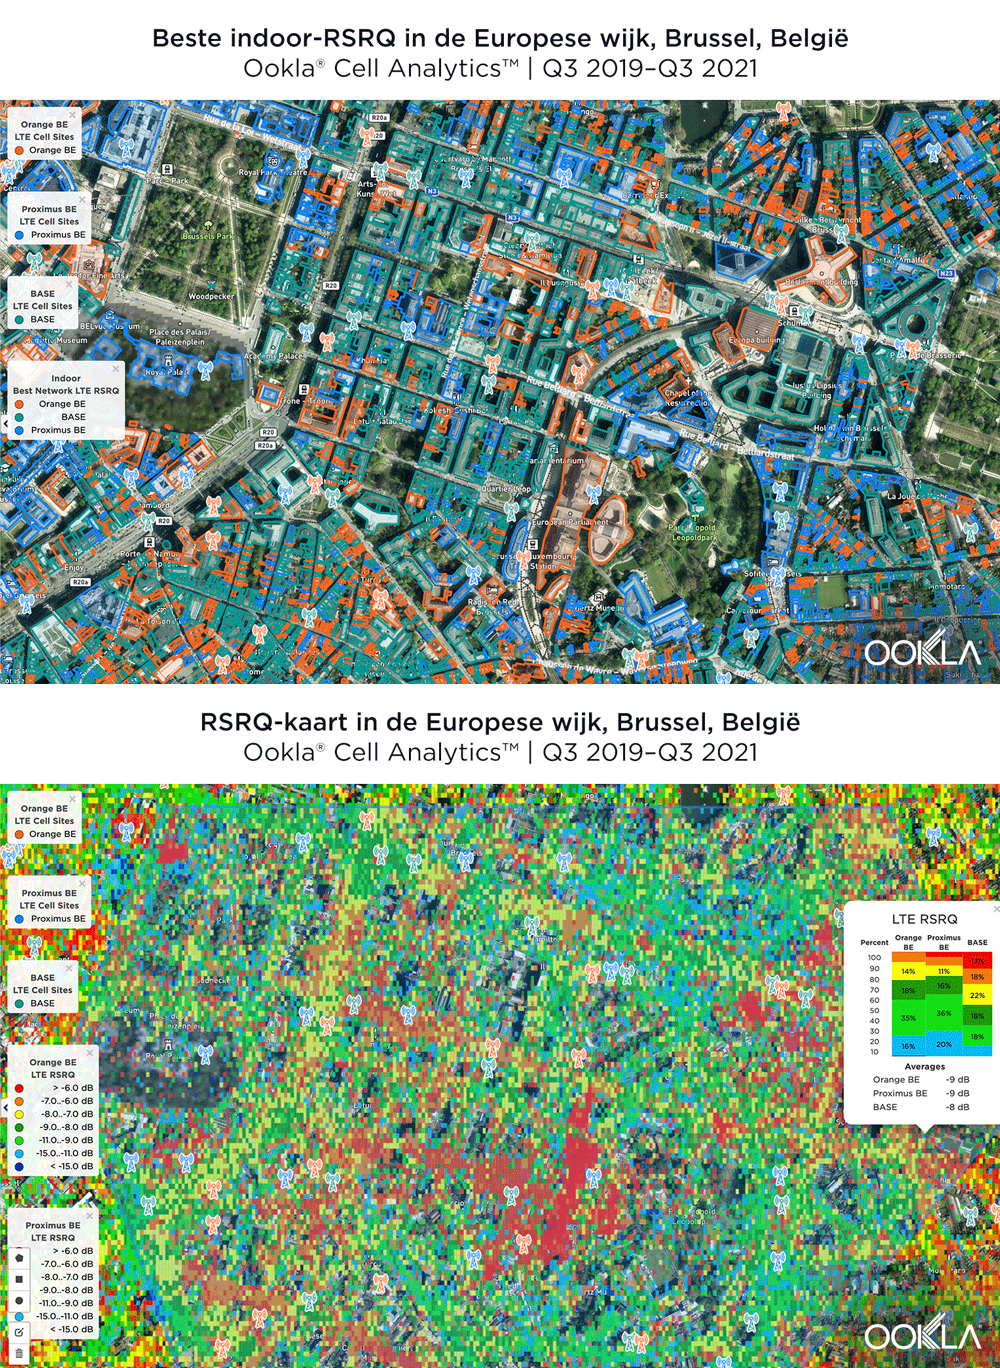
Volgens Cell Analytics had BASE/Telenet de hoogste RSRQ in het door ons onderzochte polygoongebied van de Europese Wijk. De onderstaande kaarten laten zien waar elke aanbieder de afgelopen 24 maanden de beste RSRQ had, zowel voor binnen- als buitengebieden. De afbeelding hieronder toont dat BASE/Telenet gebieden in het centrum van de kaart had met de beste RSRQ, terwijl Orange de beste RSRQ had in het zuiden van de kaart – met name op Kroonlaan – en aan de rand van de kaart in oostelijke richting. Proximus had het beste RSRQ in sommige delen van de Europese wijk, met name in het noordwesten rond het Koninklijk Paleis van Brussel en het Leopoldpark. Indoor RSRQ kende een gelijkaardig verhaal, met een sterke concurrentie op de hele kaart, hoewel Orange sterker was in het zuidwesten van de kaart, alsook in enkele belangrijke EU-gebouwen.
cell-analytics_rsrq_brussels-1_1121_be

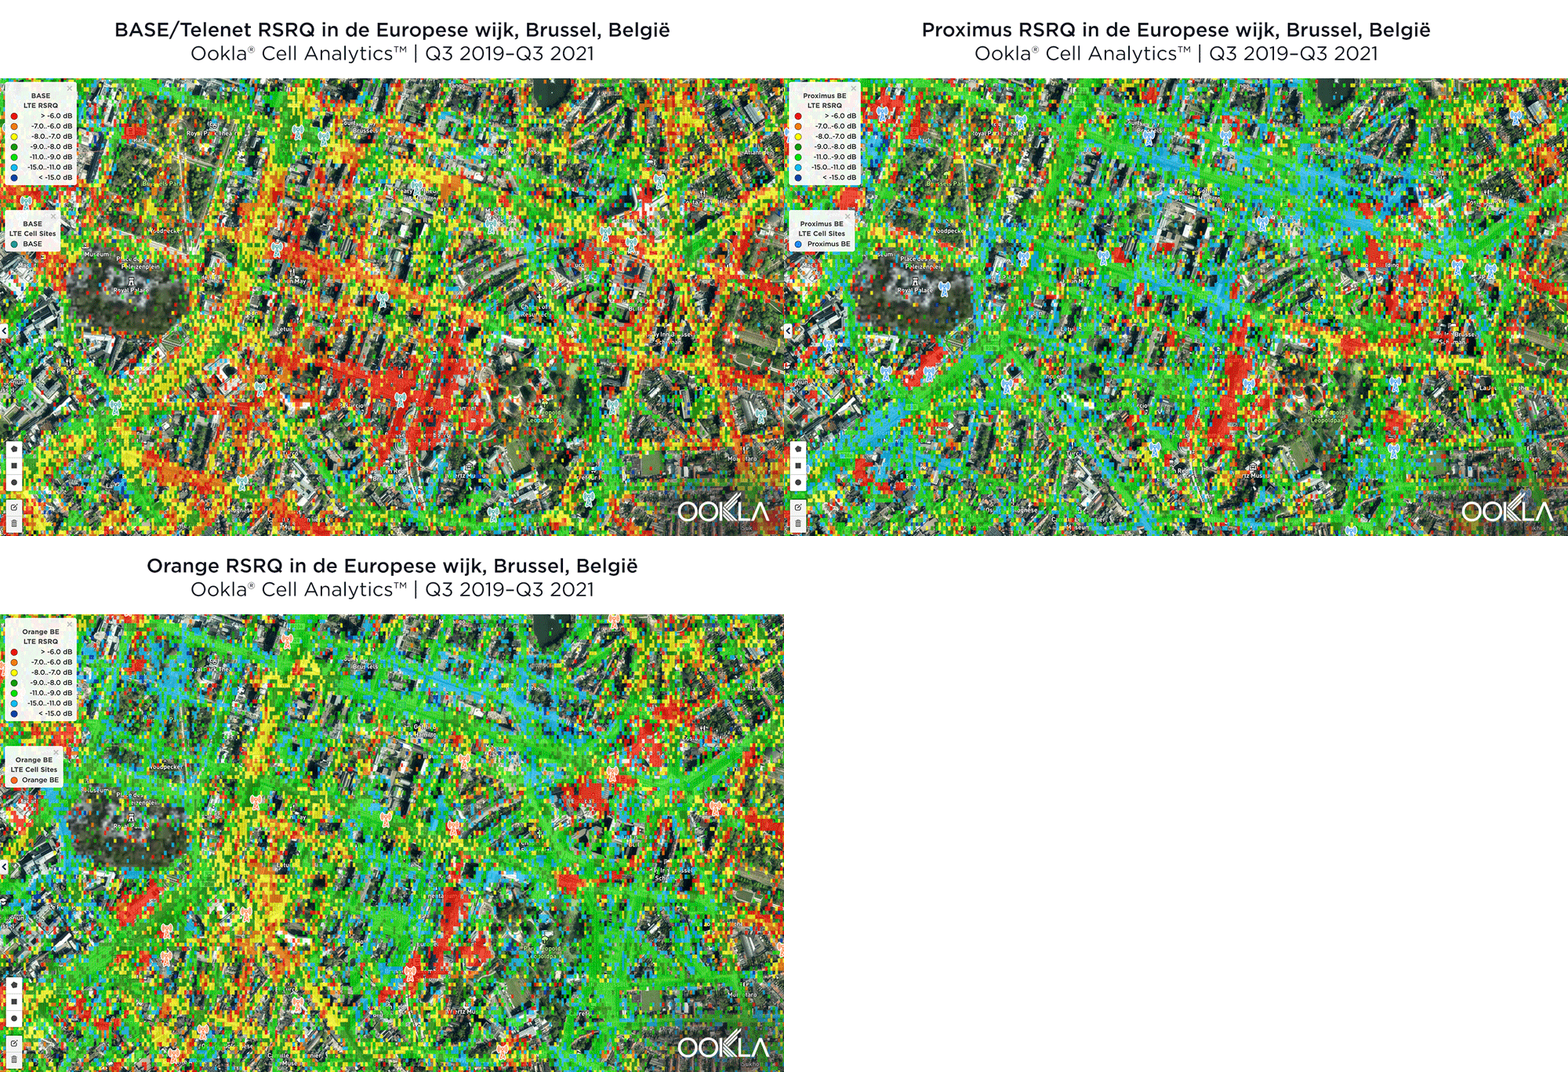
De onderstaande kaarten laten zien waar elke topaanbieder een hoge en een lage kwaliteit van het RSRQ-signaal had. BASE/Telenet liet zeer sterke gebieden zien in het centrum van de kaart, met name rond het Europees Parlement, het Square Frère-Orban Park en het Jubelpark, hoewel er een paar gebieden van mindere kwaliteit waren net ten zuiden van het gebouw van het Europees Parlement. Orange vertoonde gebieden met een sterke gelokaliseerde RSRQ, vooral in de buurt van belangrijke EU-gebouwen, maar had lagere RSRQ-gebieden in blauw in het noordwesten, midden en zuidwesten van de kaart. Proximus had een kaart die enigszins vergelijkbaar was met die van Orange, met gebieden met een hoger RSRQ in het oosten van de kaart en in de buurt van belangrijke EU-gebouwen zoals de Raad van de Europese Unie, maar met over het algemeen een lager RSRQ in het hele centrum van de kaart, met name langs belangrijke doorgangswegen zoals de Wetstraat.
cell-analytics_rsrq_brussels-2_1121_be

België heeft kansen voor snelle 5G, maar consumenten zullen er niet van profiteren zolang operatoren en regulatoren 5G niet gemakkelijker om te implementeren maken

België staat voor moeilijke vooruitzichten wat 5G betreft. De staatssecretaris voor het Brussels Gewest, Pascal Smet, heeft de wens geuit om van "Brussel de technologiehoofdstad van Europa" te maken en in een onlangs in opdracht van de Belgische regelgever opgesteld rapport wordt de impact van 5G op de Belgische samenleving geraamd op een extra 4 à 6 miljard euro per jaar voor het BBP tegen 2030, en op nog eens 40 à 80 duizend nieuwe banen. De veiling van belangrijke 5G-banden is echter herhaaldelijk uitgesteld en in de huidige vorm zullen strikte limieten voor niet-ioniserende straling (NIR) uiteindelijk de schaal van de invoering van 5G op de markt beperken.

De Belgische plannen voor een multiband spectrumveiling – inclusief nieuwe frequenties voor 5G en de vernieuwing van bestaande licenties – liggen al jaren stil door onenigheid tussen de regionale en federale regeringen, met name over hoe de opbrengsten moeten worden verdeeld. Het land loopt achter op veel van zijn collega’s in de regio wat betreft de uitrol en de invoering van 5G, en de aanhoudende vertraging heeft de Belgische toezichthouder, het Belgisch Instituut voor Postdiensten en Telecommunicatie (BIPT), ertoe gebracht tijdelijke 5G-vergunningen te verlenen in de loop van 2020. Recente voorstellen, waaronder het in bewaring houden van de opbrengst totdat overeenstemming kan worden bereikt, lijken de impasse te hebben doorbroken, en de veiling zal nu naar verwachting in het tweede kwartaal van 2022 plaatsvinden.

België heeft ook te kampen met een aantal zeer strenge NIR-grenswaarden, met name in de Brusselse regio, die de uitrol van 5G zullen beperken. De regionale regering heeft medio juli 2021 een "5G-routekaart" goedgekeurd en organiseert werkgroepen om een plan voor de uitrol in de hele stad op te stellen en de wetgeving aan te passen. Ze is al overgegaan op meer dan het dubbele van de NIR-grens, maar desondanks blijft het lager dan andere Belgische regio’s – nog steeds ver onder de EU-voorstellen.

Volgens de ontwerpwetgeving van de veiling moeten de exploitanten binnen een jaar 70% van de Belgische bevolking met 5G bereiken, wat na twee jaar moet oplopen tot 99,5%. Het BIPT is ook van plan spectrum te reserveren voor een potentiële vierde mobiele netwerkoperator, omdat het de prijzen op de markt wil verlagen. In een consultatieronde die zij begin 2021 liet uitvoeren over de gevolgen van 5G en een vierde mobiele netwerkoperator werd echter geraamd dat de toetreding van een nieuwe speler een verwaarloosbaar effect zou hebben op de werkgelegenheid en de investeringen en een onzeker effect op de inkomsten (+/- 5%, tegenover vlak). Als gevolg daarvan is de hoeveelheid spectrum die voor een nieuwkomer is gereserveerd, verminderd om B2B-exploitanten in staat te stellen een bod uit te brengen op een deel van de resterende frequenties. Proximus, dat zijn 5G-netwerk lanceerde tijdens Q3 2020, zag mediane 5G-download- en -uploadsnelheden van respectievelijk 201,59 Mbps en 20,33 Mbps tijdens Q3 2021. Nu Orange en Telenet enorme investeringen doen om hun 5G-netwerk in België uit te breiden – en Telenet die deze week commerciële 5G lanceert, zijn we benieuwd naar wat de toekomst brengt.

België heeft de kans om de mobiele en vaste breedbandsnelheden voor consumenten te verbeteren, en wij zullen nauwlettend in de gaten houden wat er in de toekomst gebeurt met onze Global Index Market Analyses. Leer meer over Ookla Speedtest Intelligence of Cell Analytics door hier informeren.


La Belgique a du retard par rapport à ses pairs de l’UE et doit faire face à des défis réglementaires en matière de 5G

La Belgique représente un pilier important pour la communauté européenne et abrite le Conseil de l’Union européenne, la Commission européenne, le Parlement européen et le Conseil européen. Cependant, la Belgique a du retard vis-à-vis de ses partenaires régionaux en termes de promotion de la concurrence pour la 5G avec un seul fournisseur 5G pendant la majeure partie de 2021. Dans cet article, nous avons utilisé Ookla® Speedtest Intelligence® pour examiner les vitesses de performance de l’internet fixe et mobile en Belgique, les performances régionales et provinciales au cours du troisième trimestre 2021. Nous avons également examiné le quartier européen de Bruxelles en utilisant Ookla Cell Analytics pour déterminer quels opérateurs mobiles avaient le meilleur niveau et la meilleure qualité de réseau.

Les Pays-Bas sont en tête des partenaires commerciaux régionaux de la Belgique pour la téléphonie mobile la plus rapide
ookla_mobile-download-comparison_belgium_1121_fr-01

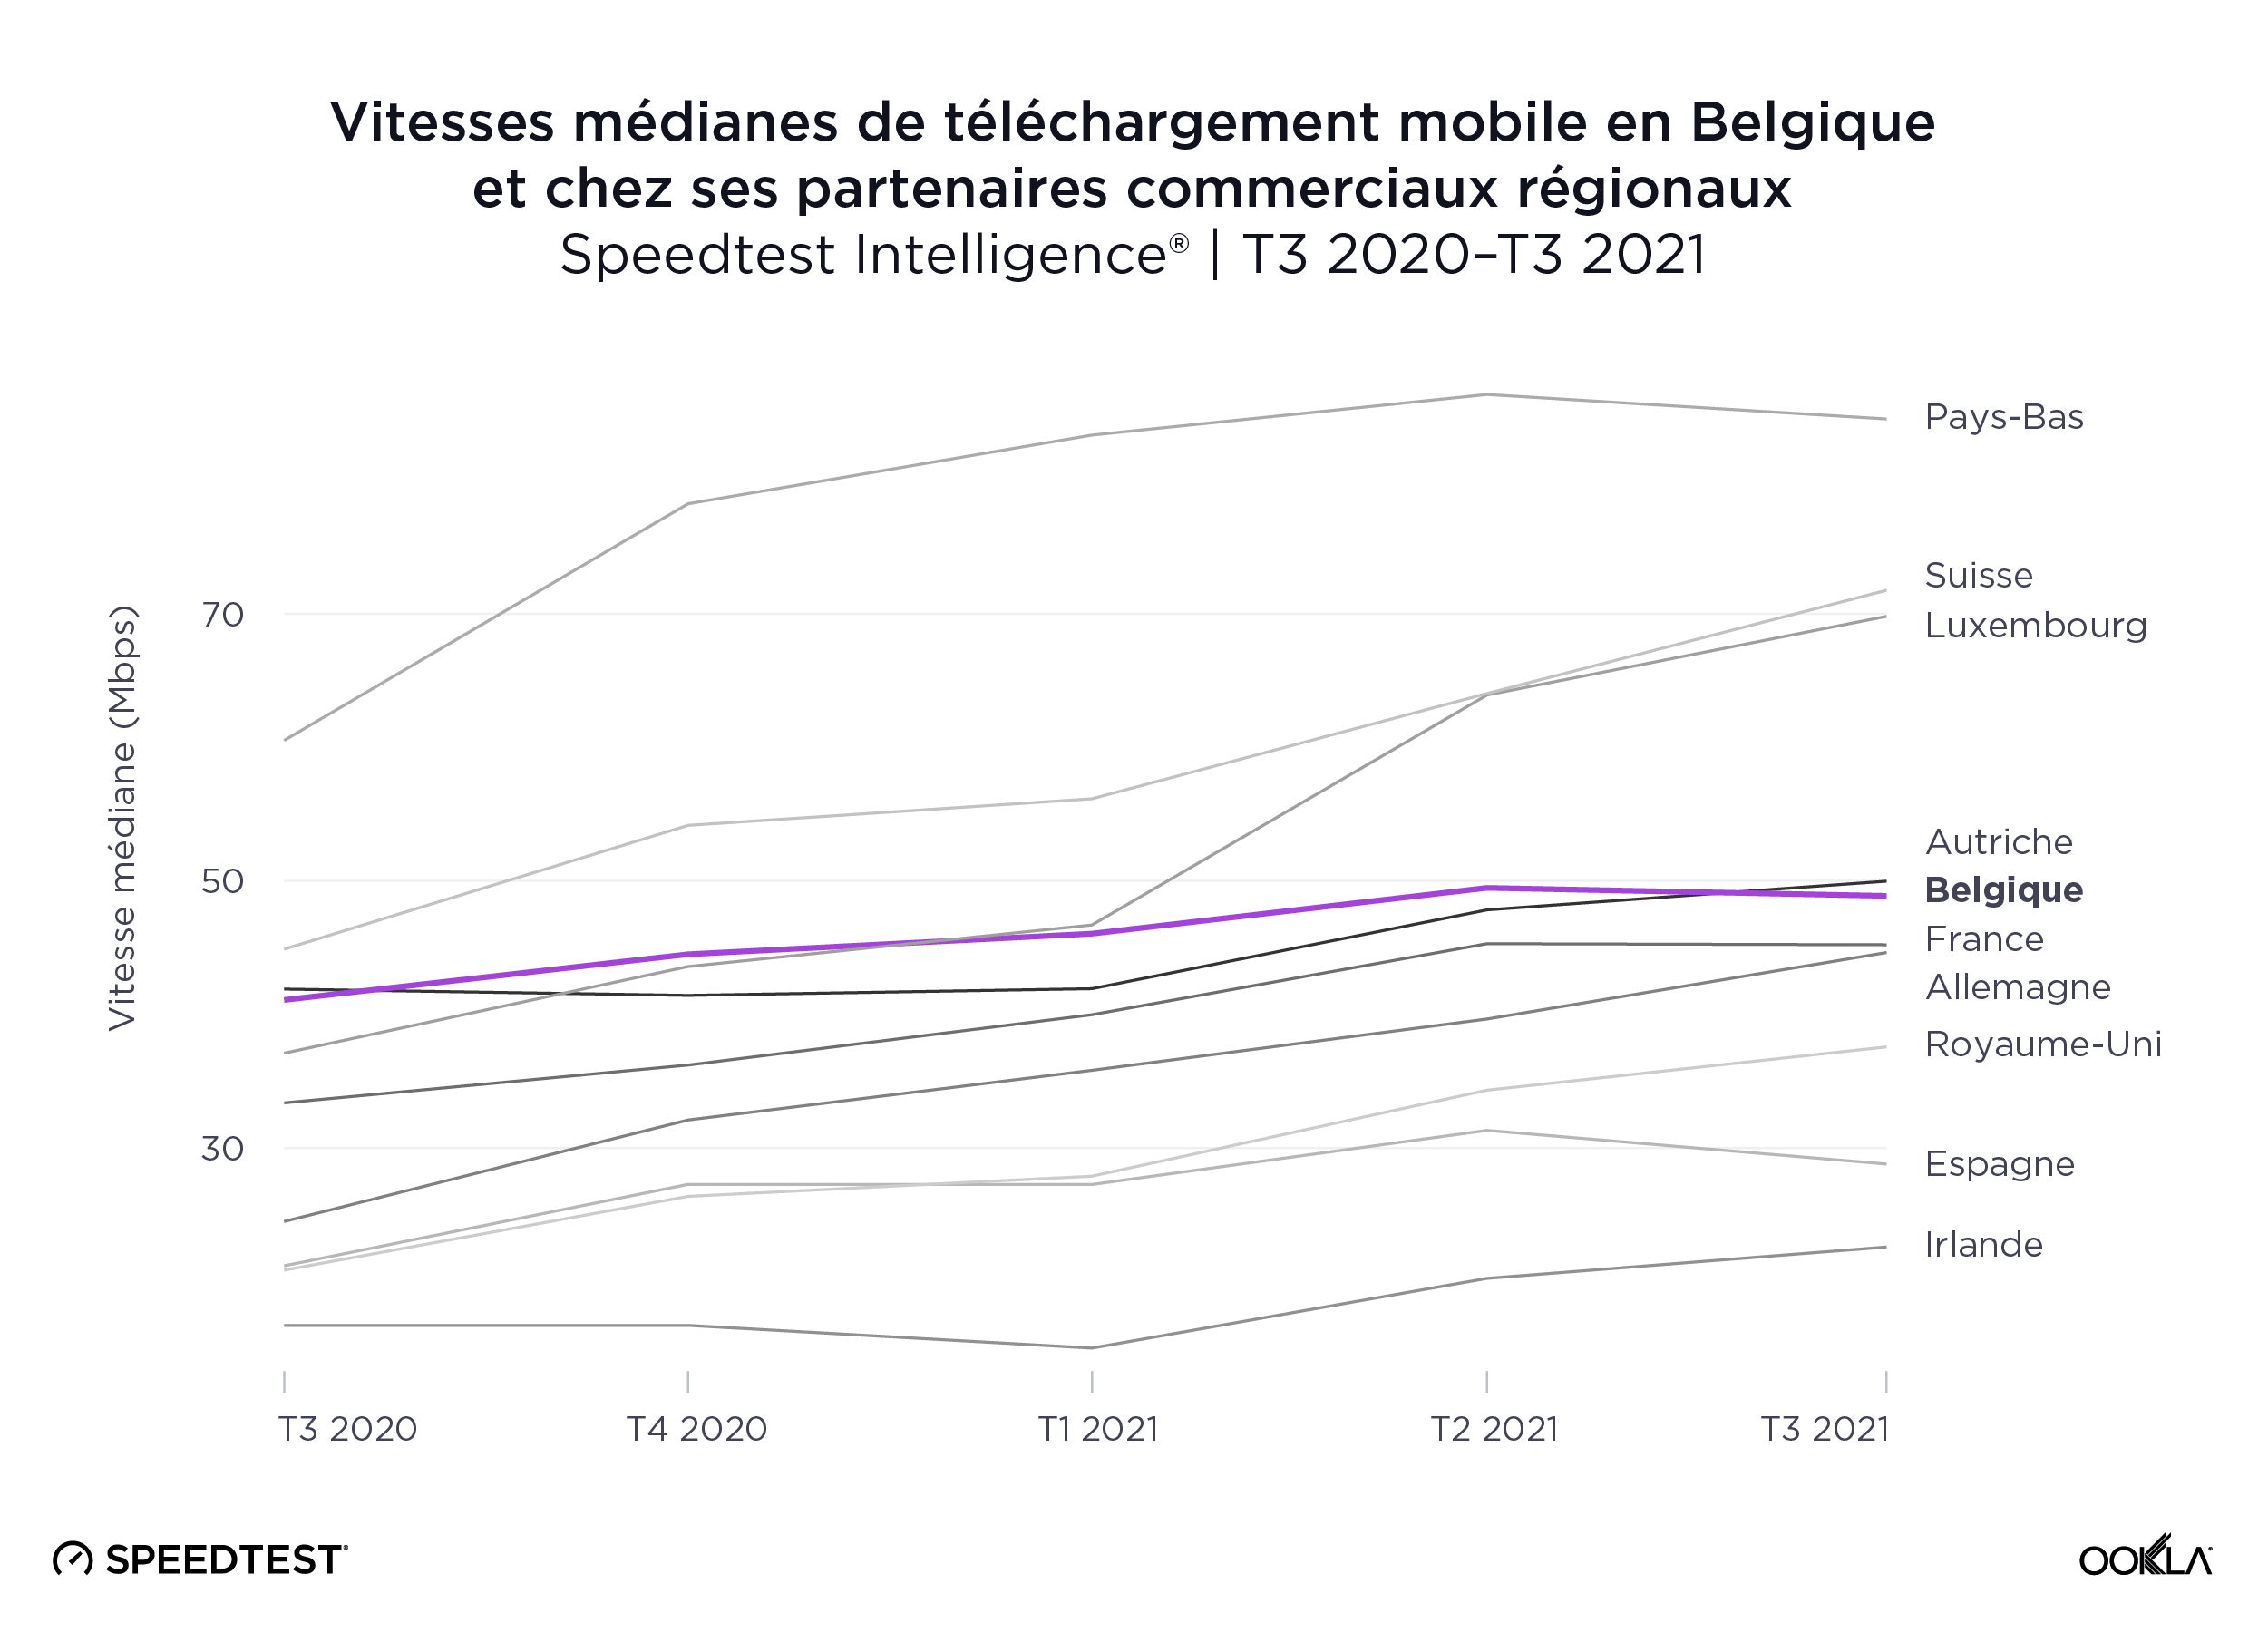
Speedtest Intelligence révèle que les Pays-Bas avaient la vitesse médiane de téléchargement mobile la plus rapide parmi les partenaires commerciaux régionaux les plus proches de la Belgique, à 84,59 Mbps au cours du troisième trimestre 2021. La Suisse et le Luxembourg suivaient avec respectivement. 71,76 Mbps et 69,81 Mbps. Vient ensuite l’Autriche, avec 49,98 Mbps, puis la Belgique, avec 48,88 Mbps.

La Suisse et l’Espagne établissent la norme européenne avec des vitesses de haut débit fixe supérieures à 100,00 Mbps!
ookla_fixed-download-comparison_belgium_1121_fr-01-1

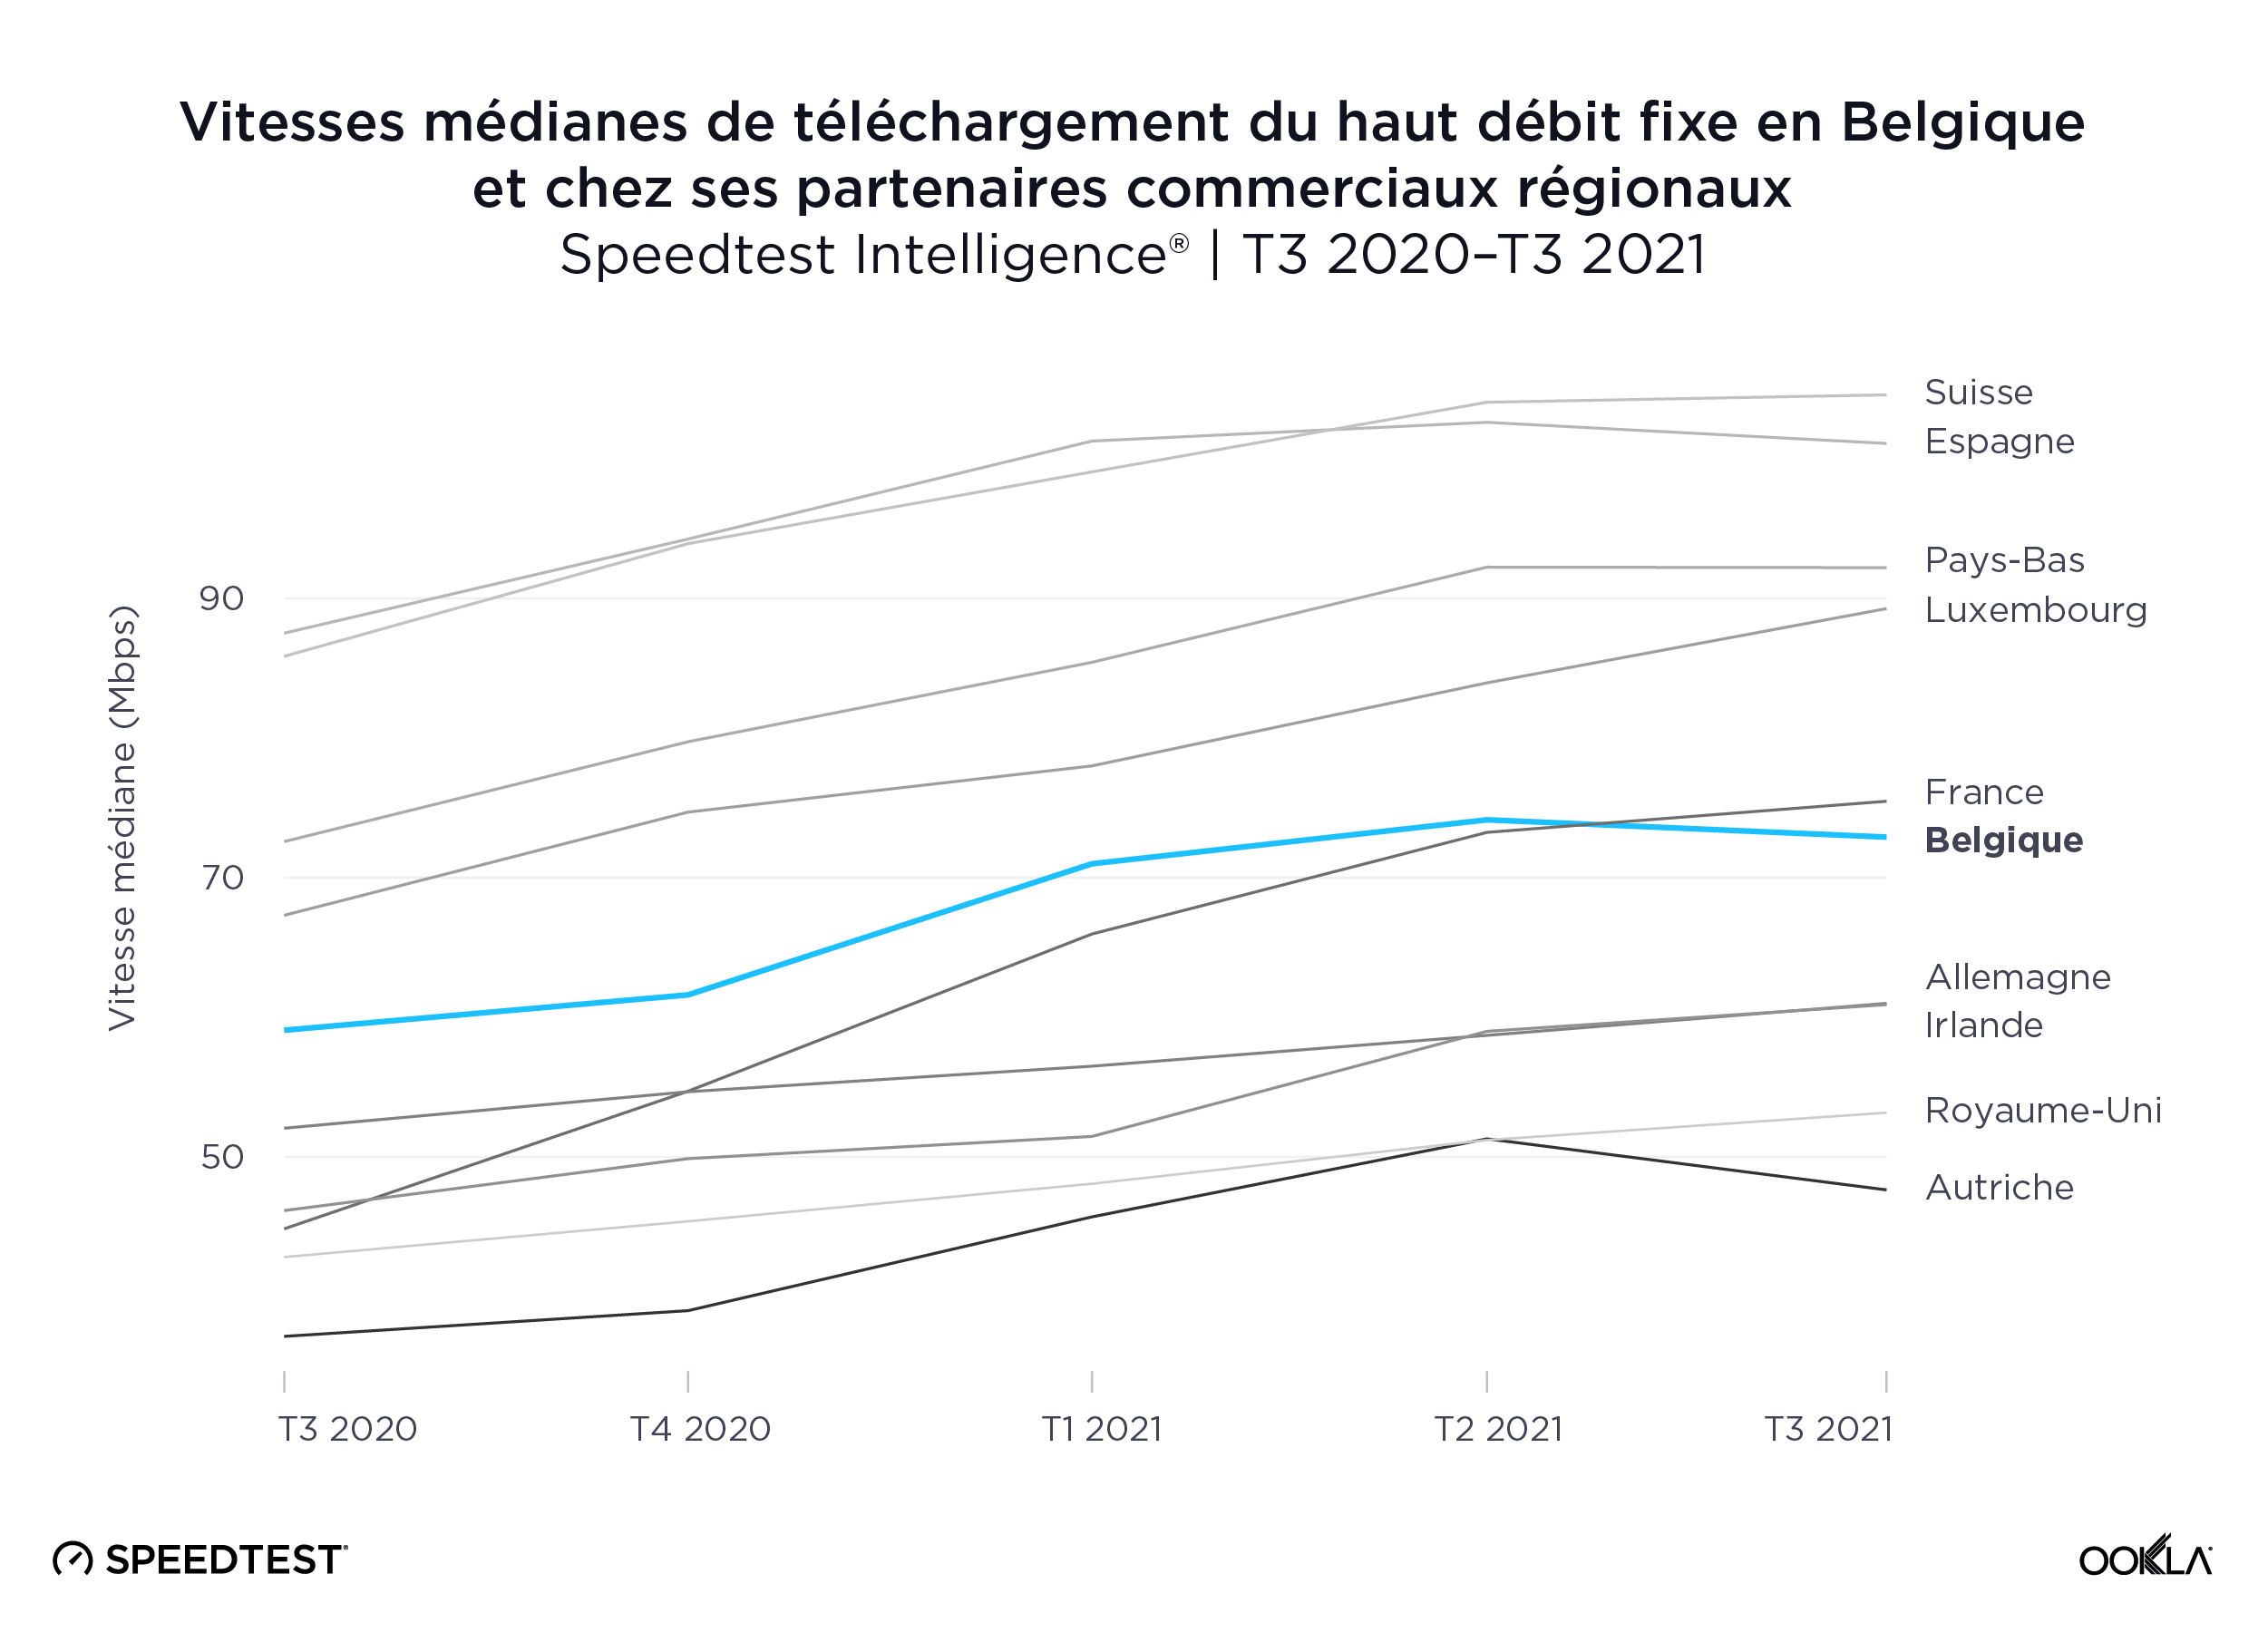
Selon Speedtest Intelligence, la Suisse a enregistré la vitesse médiane la plus rapide en matière de haut débit fixe par rapport à la Belgique et ses partenaires commerciaux régionaux, soit 104,58 Mbps au troisième trimestre 2021, devant l’Espagne (101,10 Mbps). Les Pays-Bas et le Luxembourg suivent avec respectivement 92,20 Mbps et 89,27 Mbps. La vitesse médiane de téléchargement du haut débit fixe en Belgique, 72,90 Mbps, était juste inférieure à celle de la France, 75,47 Mbps.

BASE, Telenet et Proximus dépassent Orange pour le mobile
ookla_mobile-top-provders_belgium_1121_fr-01

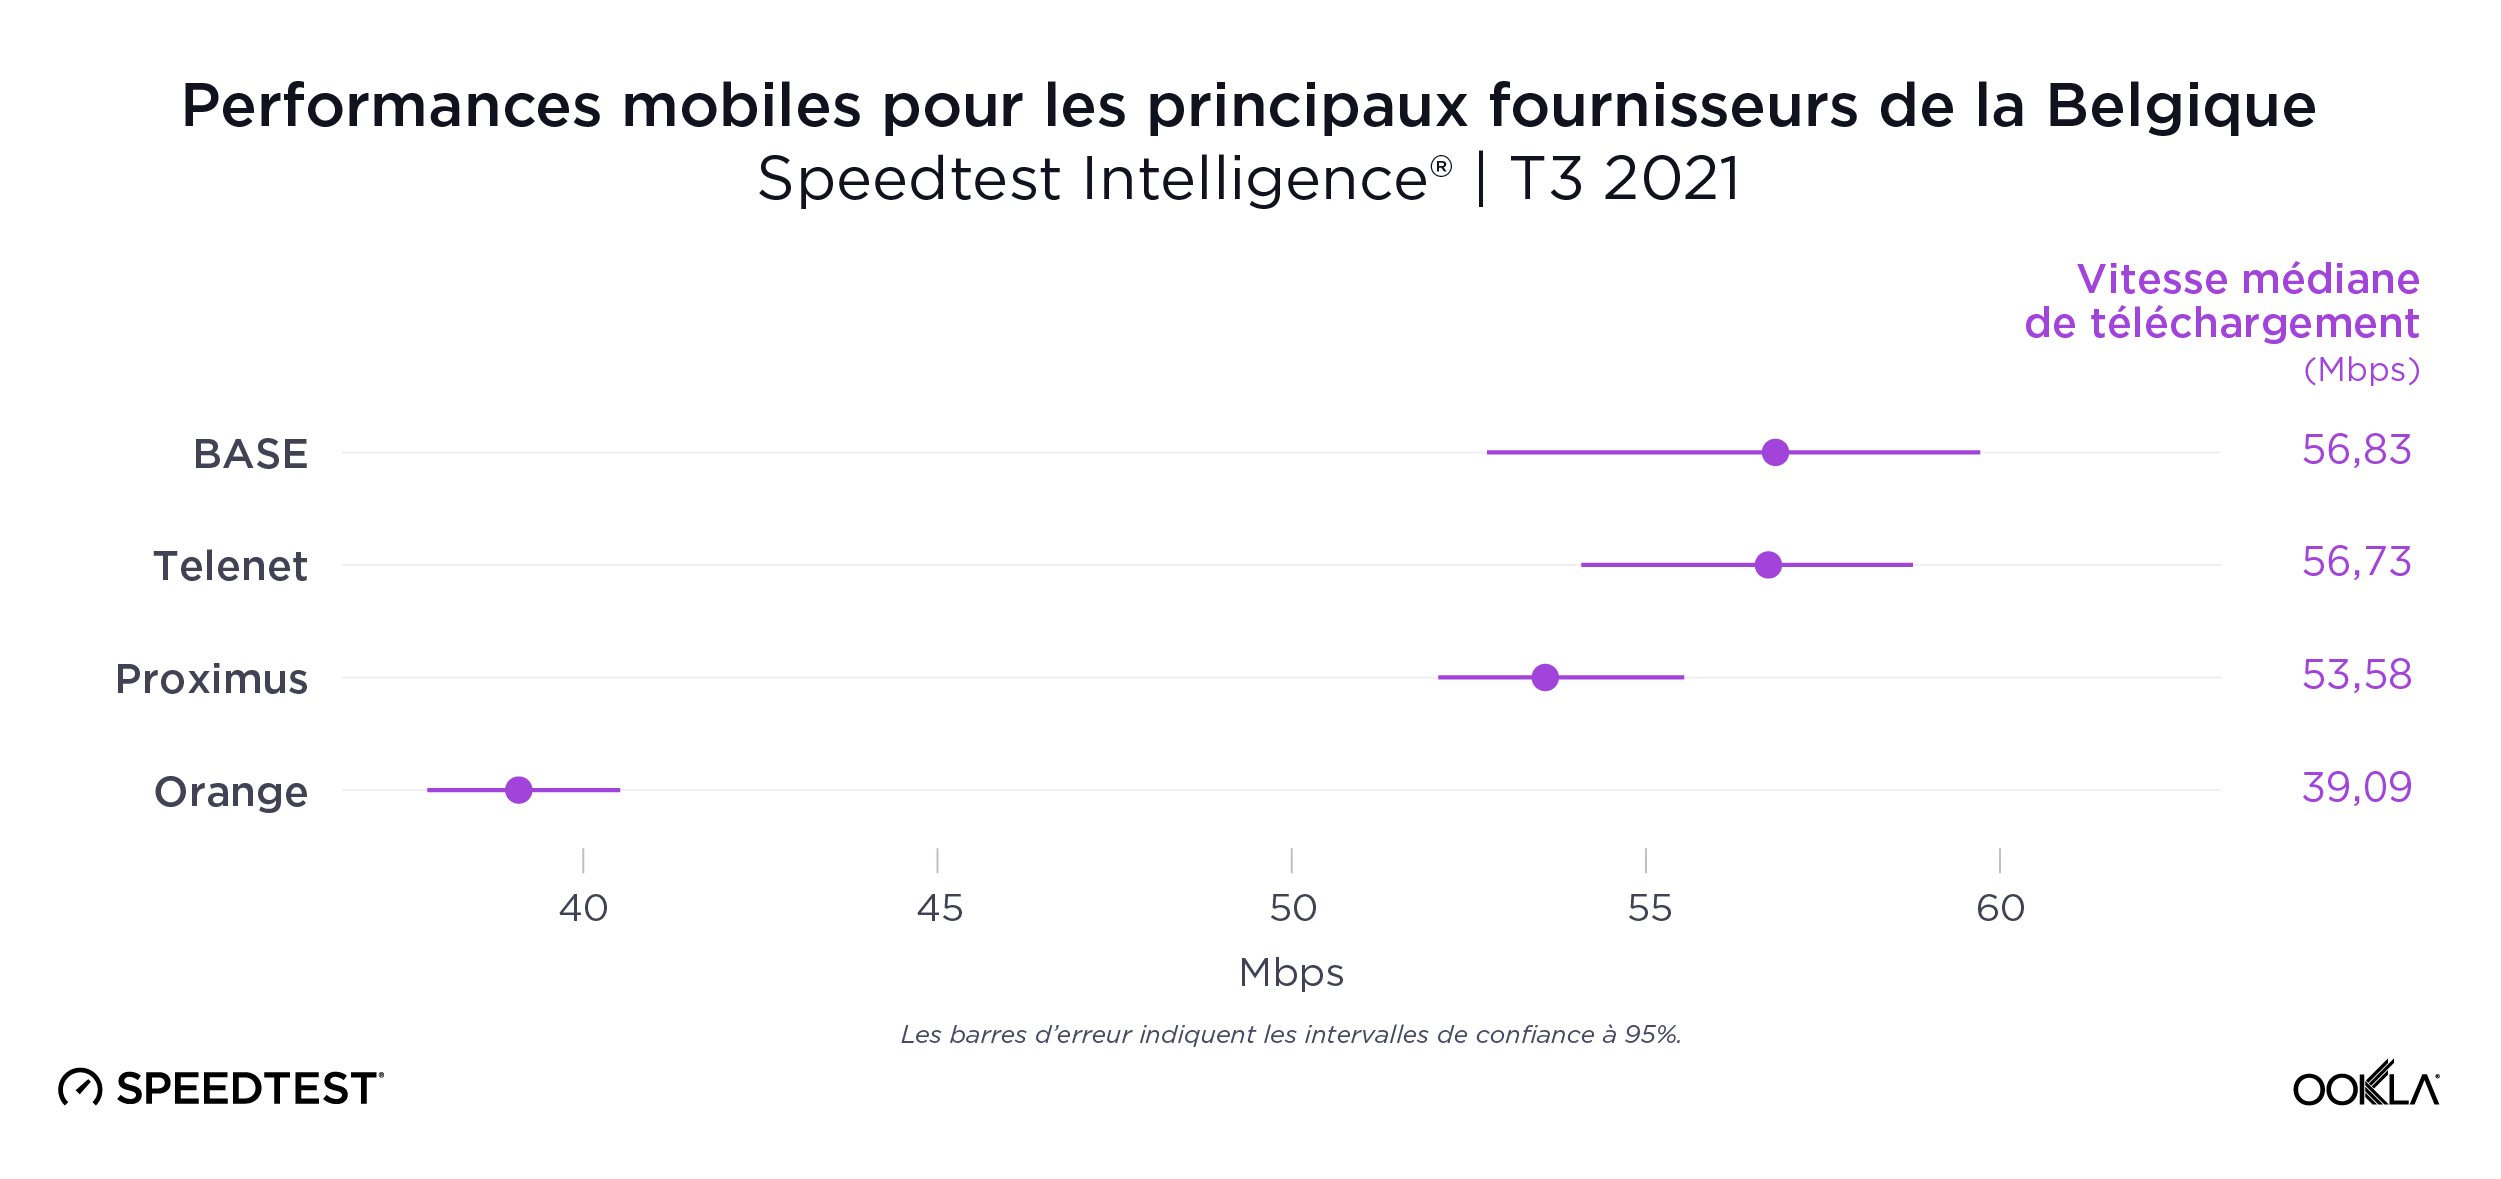
Le classement du fournisseur de téléphonie mobile le plus rapide de Belgique était très serré au cours du troisième trimestre 2021, avec BASE (56,83 Mbps), Telenet (56,73 Mbps) et Proximus (53,58 Mbps) en tête. Orange est quatrième avec 39,09 Mbps. Il faut également noter que Telenet est propriétaire de la marque BASE.

Telenet a le haut débit fixe le plus rapide

ookla_fixed-top-provders_belgium_1121_fr-01

Telenet avait la vitesse de téléchargement la plus rapide sur le haut débit fixe, avec 124,89 Mbps. Ce chiffre dépasse de loin celui de VOO, qui suit avec 94,63 Mbps. Orange était le suivant sur la liste avec 82,20 Mbps, suivi de Proximus (43,45 Mbps) et Scarlet (35,34 Mbps).

Les vitesses de téléchargement mobile sont plus rapides en Flandre qu’à Bruxelles et en Wallonie
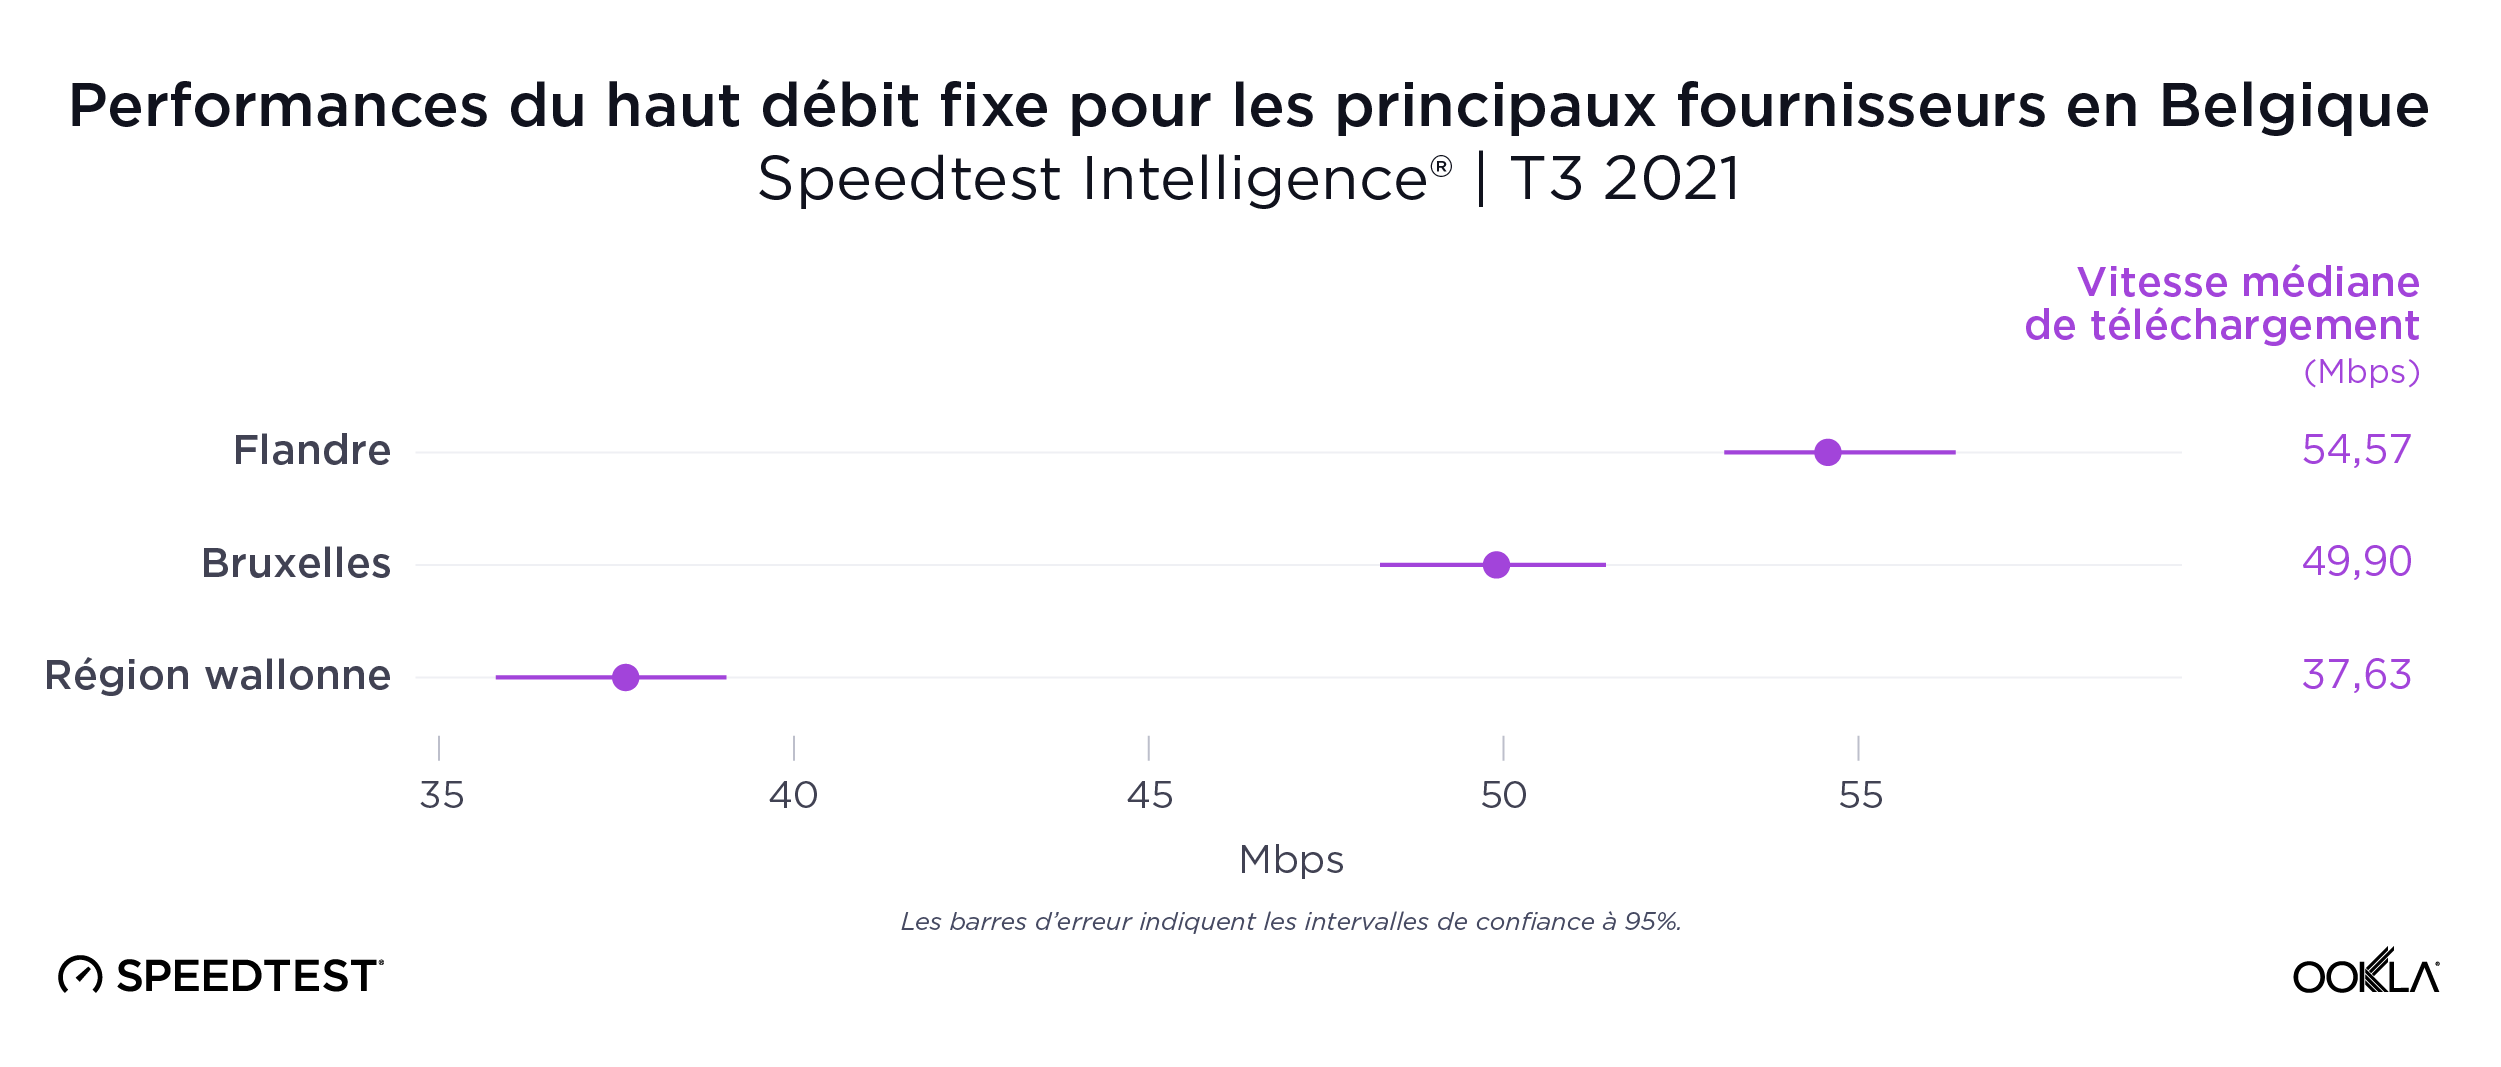
ookla_mobile-download-performance_belgium-regions_1121_fr-01

Les données de Speedtest Intelligence ont révélé un large fossé entre le nord de la région flamande, plus peuplée, et le sud de la région wallonne, moins peuplée, en matière de performances mobiles au cours du troisième trimestre 2021. La Flandre avait une vitesse de téléchargement mobile médiane de 54,57 Mbps, contre 37,63 Mbps pour la Wallonie. La région de Bruxelles-Capitale se situait au milieu du classement en matière de téléphonie mobile, avec 49,90 Mbps. Cette fracture numérique s’est étendue aux données au niveau des provinces. Presque toutes les provinces flamandes ont atteint des vitesses de téléchargement médianes plus rapides que les provinces wallonnes.

Quatre provinces flamandes affichent des vitesses de téléchargement mobile supérieures à 50 Mbps
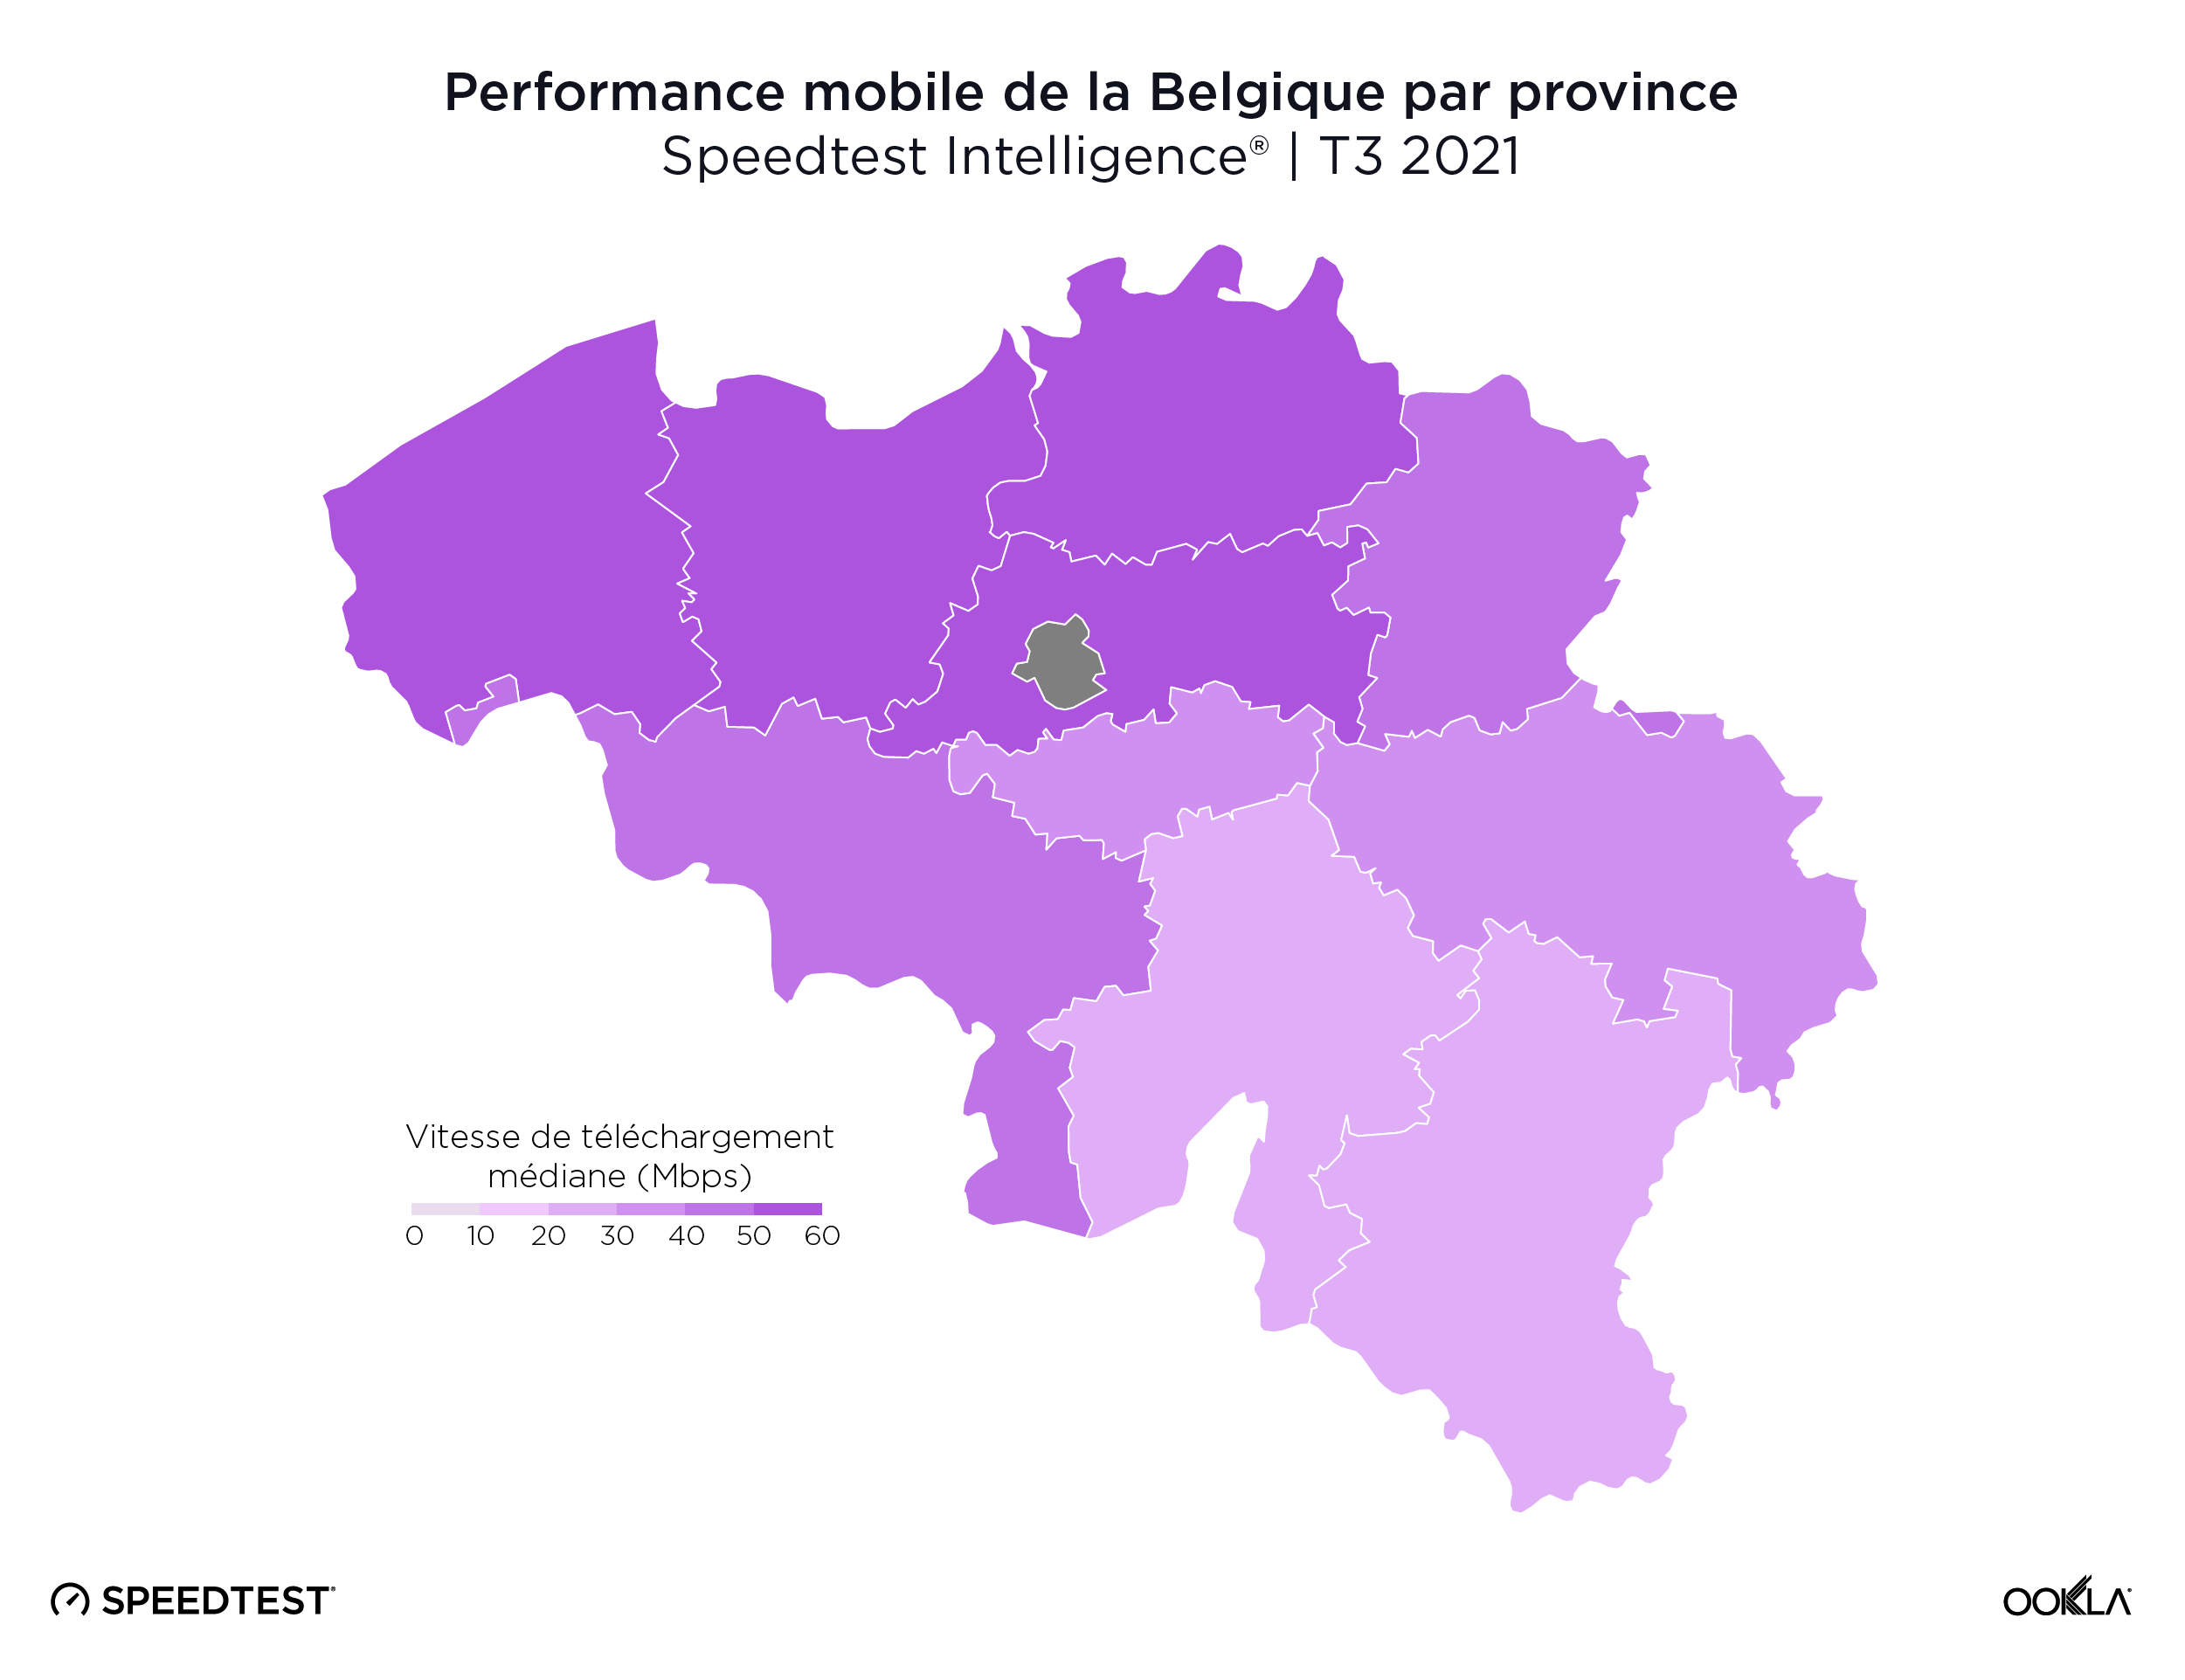
ookla_mobile-performance_belgium_map_1121_fr-01

Il n’y a pas eu de vitesse de téléchargement mobile statistiquement la plus rapide parmi les provinces belges, bien que le Brabant flamand (57,47 Mbps), Anvers (57,30 Mbps), la Flandre occidentale (54,95 Mbps) et la Flandre orientale (52,19 Mbps) aient toutes atteint des vitesses de téléchargement supérieures à 50,00 Mbps. La province du Luxembourg (28,40 Mbps) et la province de Namur (28,71 Mbps) sont les seules provinces belges à ne pas avoir atteint une vitesse de téléchargement mobile médiane de 30,00 Mbps.

Un large fossé sépare la Flandre de la région wallonne en matière de haut débit fixe
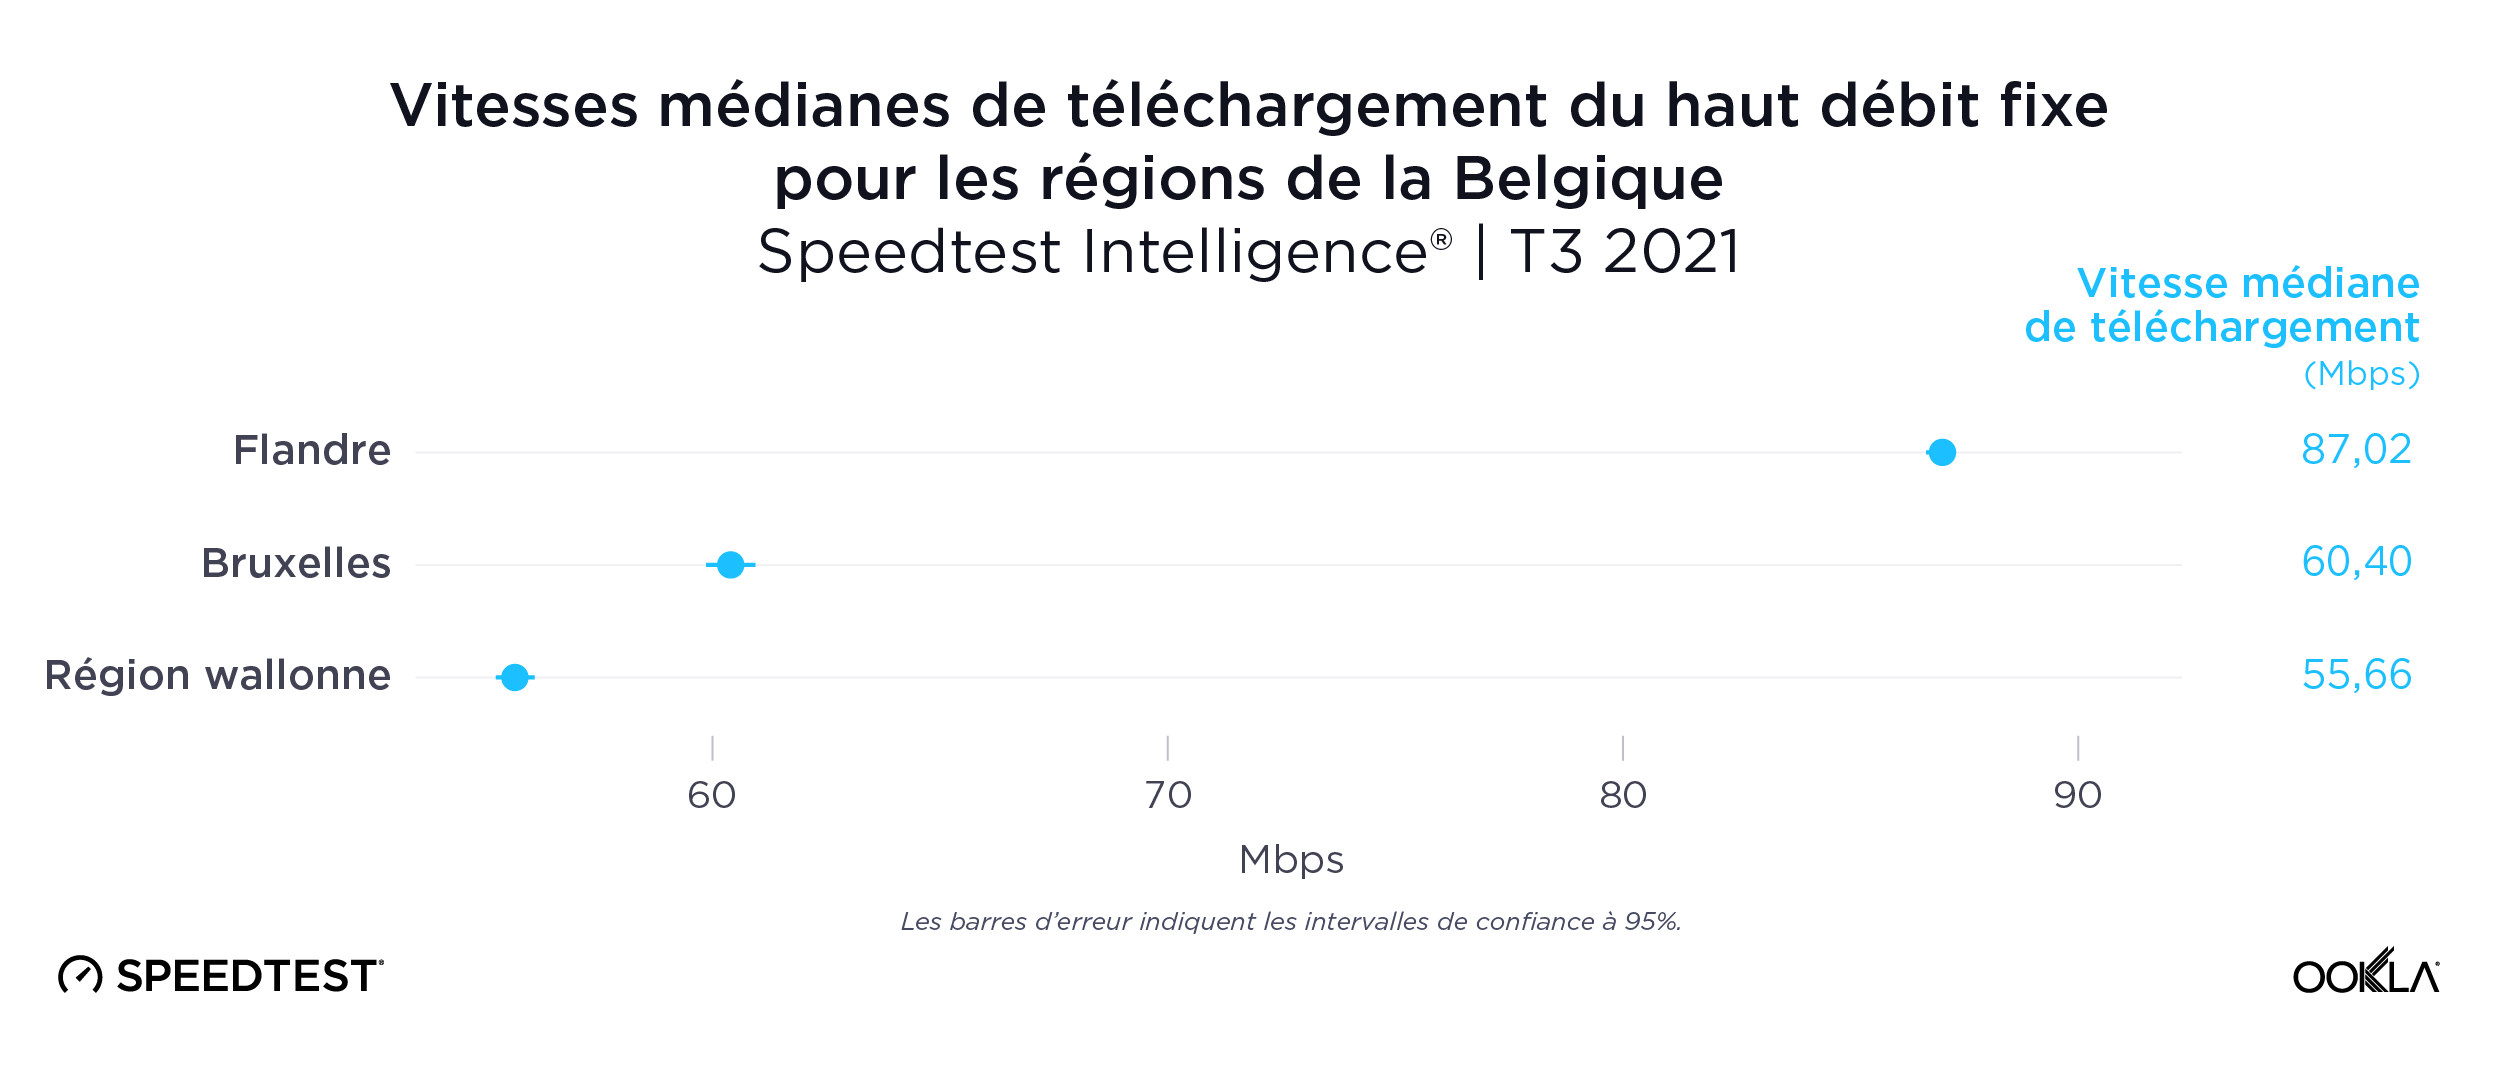
ookla_fixed-download-performance_belgium-regions_1121_fr-01

Les données de Speedtest Intelligence ont révélé que la fracture numérique entre les régions de Belgique était encore plus éloignée sur le haut débit fixe au cours du troisième trimestre 2021. La Flandre avait une vitesse médiane de téléchargement à large bande fixe de 87,02 Mbps contre 55,66 Mbps pour la Wallonie. La région de Bruxelles-Capitale se situait à nouveau dans la médiane avec 60,40 Mbps.

Le Limbourg est la province la plus rapide pour le haut débit fixe
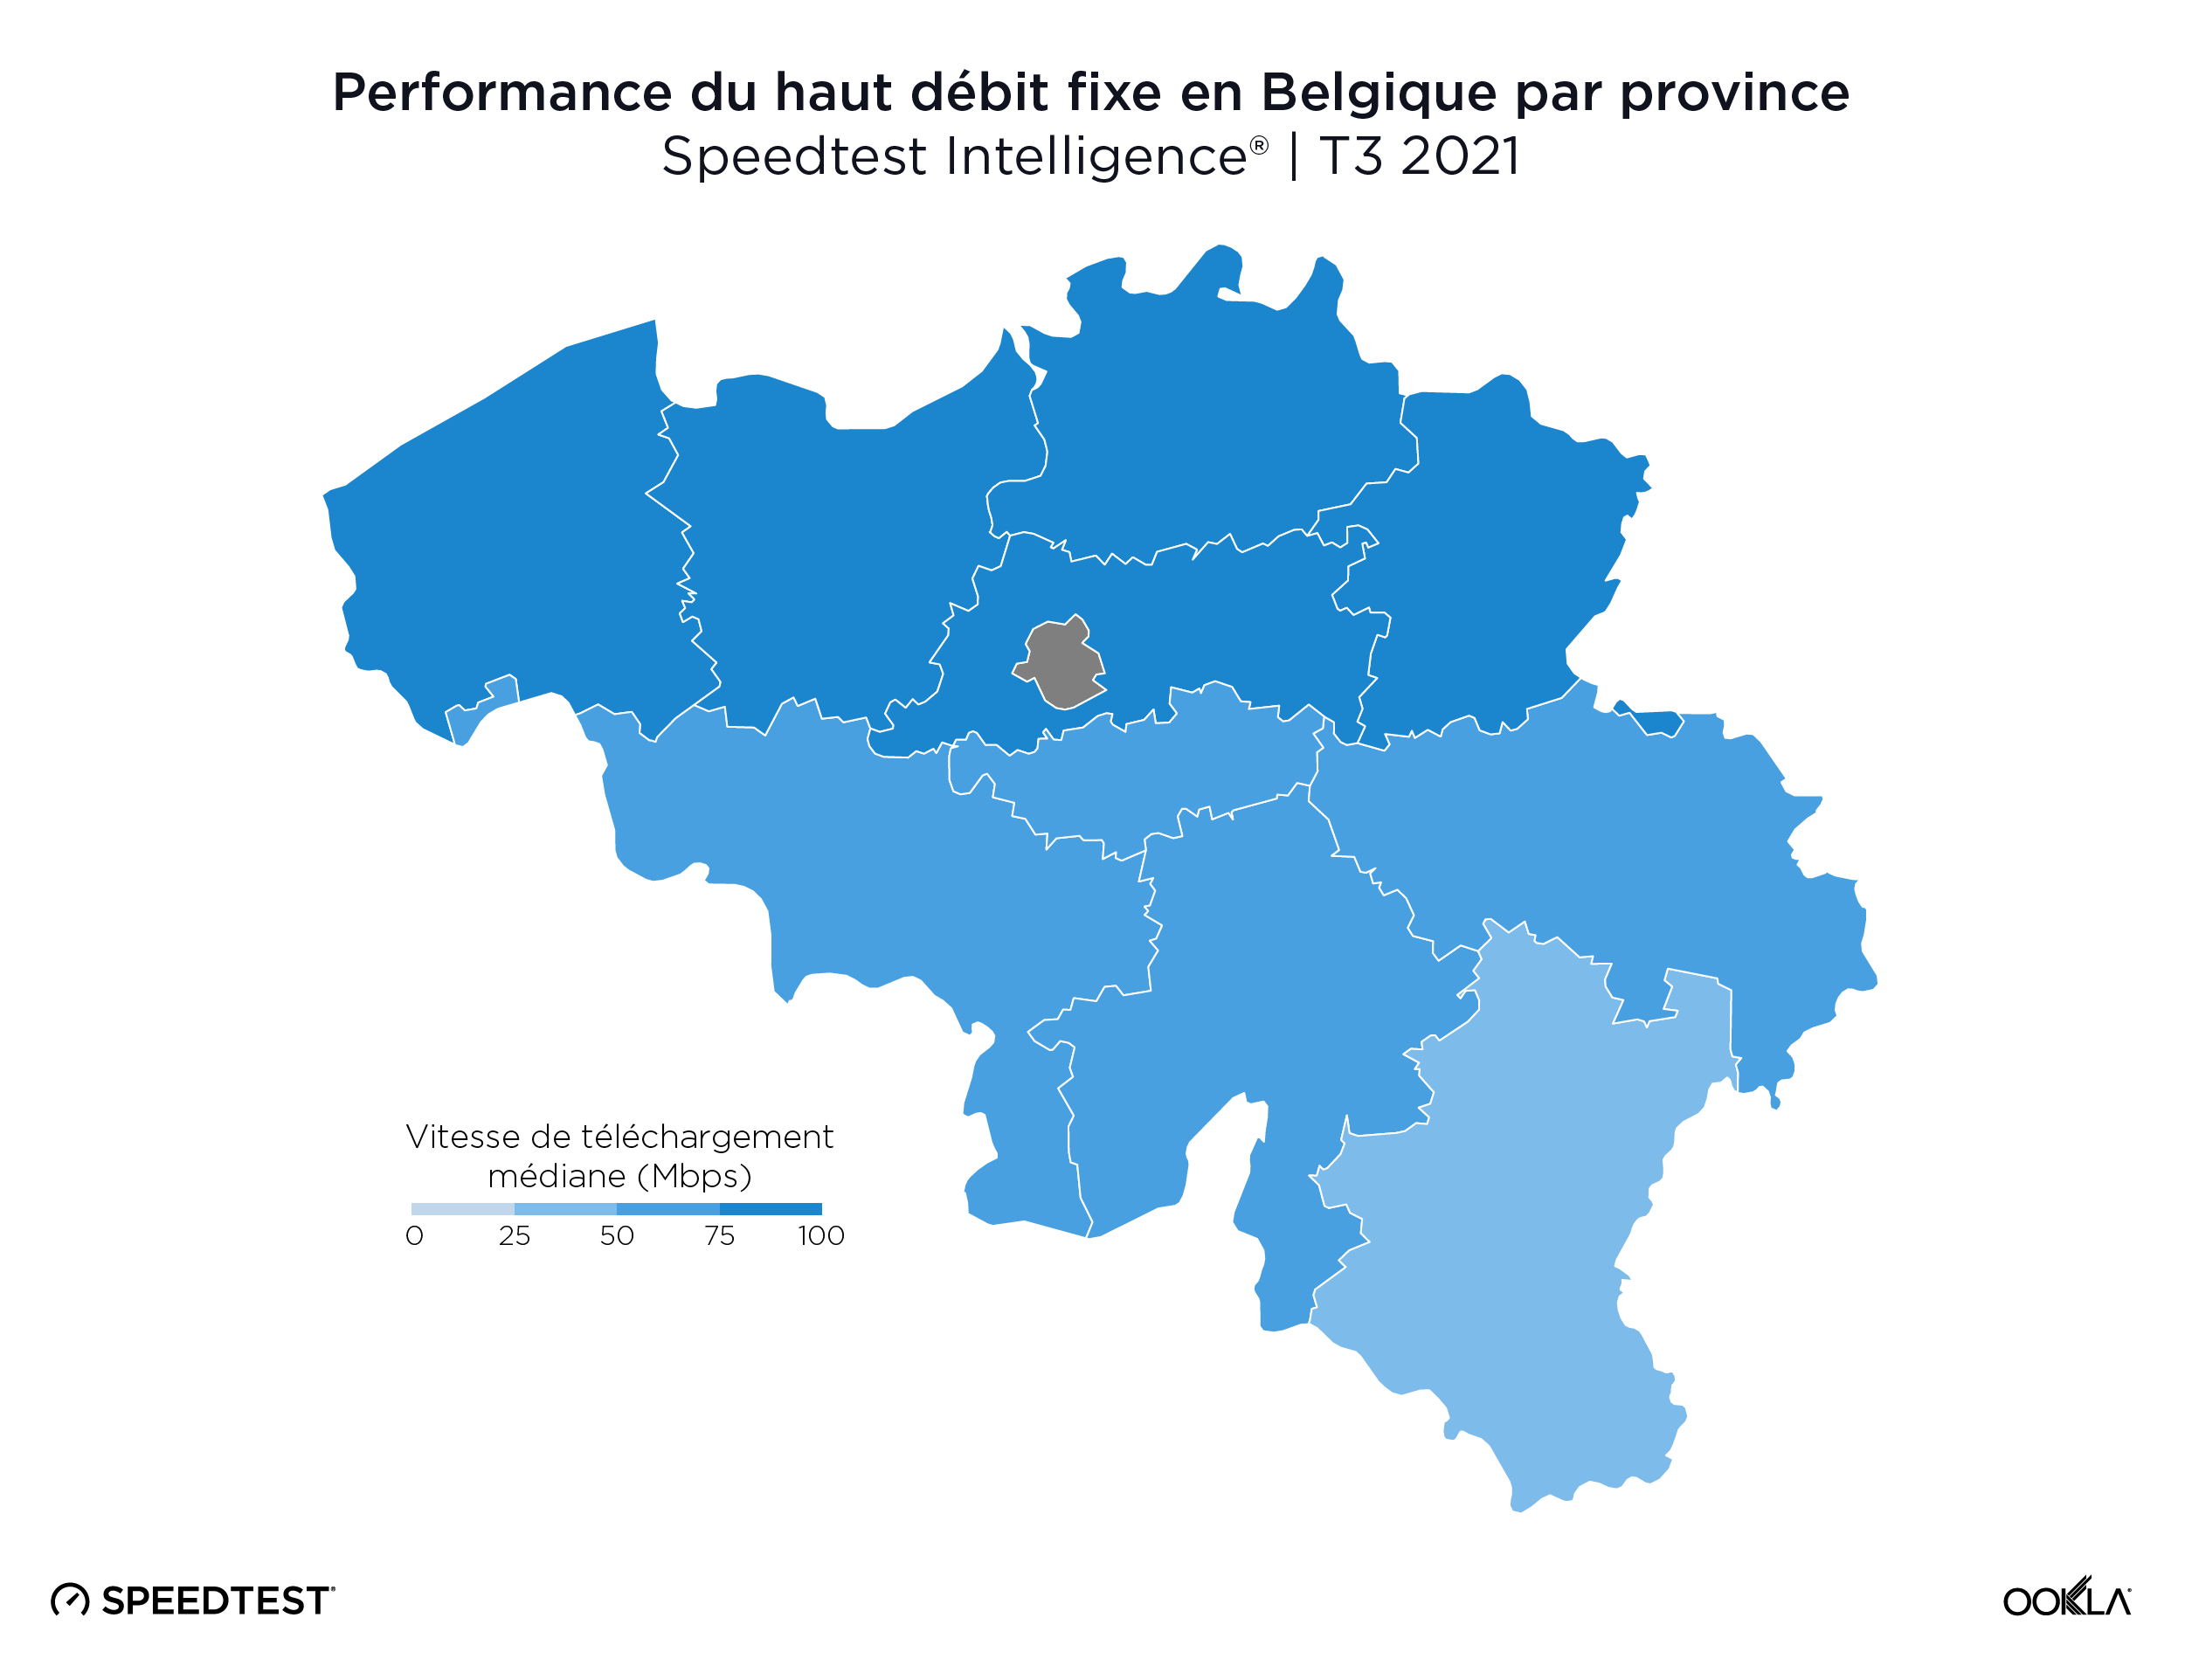
ookla_fixed-performance_belgium_map_1121_fr-01

Le Limbourg avait la vitesse de téléchargement médiane la plus rapide sur le haut débit fixe, avec 90,07 Mbps, suivi par la Flandre orientale (86,68 Mbps), la Flandre occidentale (86,45 Mbps), Anvers (85,23 Mbps) et le Brabant flamand (84,50 Mbps). Il n’y a pas de province plus rapide en Wallonie, bien que le Brabant wallon et la province de Namur aient eu les vitesses de téléchargement médianes les plus rapides, avec respectivement 60,15 et 58,90 Mbps.

Niveau et qualité du signal 4G LTE selon le fournisseur près du quartier européen de Bruxelles

Nous avons examiné les performances mobiles dans le quartier européen de Bruxelles en utilisant les données de Cell Analytics des 24 derniers mois. Chacune de ces cartes montre les signaux 4G de niveau de signal (RSRP) et de qualité de signal (RSRQ) les plus forts dans cette zone clé, ce qui peut aider les opérateurs mobiles à améliorer leurs réseaux. Cell Analytics identifie le RSRP et le RSRQ les plus forts par opérateur de réseau mobile pour une zone ou un bâtiment donné lorsqu’il y a un gagnant statistiquement significatif et attribue un code couleur à la couleur correspondante du fournisseur. Les cartes RSRP au niveau du fournisseur montrent la force du signal des différents fournisseurs pour une zone donnée, le rose et le rouge indiquant un signal fort et le bleu un signal faible. Les utilisateurs peuvent cependant être confrontés à une qualité médiocre même avec un niveau de signal élevé, ce qui se traduit par des interruptions audios ou des vitesses de données lentes. Les cartes RSRQ au niveau du fournisseur montrent la qualité du signal d’un opérateur pour une zone donnée, le rouge indiquant un signal de haute qualité et le bleu un signal de qualité inférieure. Nous avons également inclus les emplacements approximatifs des tours de téléphonie mobile dans la région.

Une concurrence serrée pour le meilleur RSRP 4G LTE à Bruxelles

L’image ci-dessous montre où un fournisseur a eu la plus forte intensité de signal 4G LTE RSRP au cours des 24 derniers mois. Comme vous pouvez le voir, BASE/Telenet a une forte présence au centre de la carte, obtenant le RSRP le plus élevé dans la zone de notre polygone. Proximus et Orange avaient des signaux forts sur les bords de la carte, et Orange avait le RSRP le plus fort dans certaines des institutions clés de l’UE, y compris le siège de la Commission européenne et le Parlement européen.
cell-analytics_rsrp_brussels-1_1121_fr

Les cartes ci-dessous montrent où chaque fournisseur principal a des données de puissance de signal élevée et faible dans le quartier européen. BASE/Telenet a montré un RSRP très fort près du centre de la carte, en particulier autour des principau’ bâtiments de l’UE, rue de la ’oi et près de l’Av.’Marnix, bien qu’il y ait eu quelques zones plus faibles juste au sud-ouest du bâtiment du Parlement européen. Orange a montré des zones de forte RSRP localisée à travers la carte, en particulier dans le sud-ouest, avec une RSRP plus faible en bleu dans le nord-ouest et au centre de la carte. Proximus avait quelques zones de force le long de la rue de la Loi, et près du cœur du quartier européen, mais avait des signaux plus faibles partout.

cell-analytics_rsrp_brussels-2_1121_fr

BASE/Telenet avait le meilleur RSRQ dans le quartier européen de Bruxelles

Selon Cell Analytics, BASE/Telenet avait le RSRQ le plus élevé dans la zone du polygone du quartier européen que nous avons étudié. Les cartes ci-dessous montrent où chaque fournisseur a eu le meilleur RSRQ au cours des 24 derniers mois, pour les zones intérieures et extérieures. L’image ci-dessous montre que BASE/Telenet avait des zones près du centre de la carte avec le meilleur RSRQ, tandis qu’Orange avait le meilleur RSRQ près du sud de la carte – en particulier sur l’avenue de la Couronne – et la périphérie de la carte vers l’est. Proximus avait le meilleur RSRQ dans certaines zones du quartier européen, notamment au nord-ouest autour du Palais Royal de Bruxelles et du Parc Léopold. Le RSRQ en intérieur a montré un phénomène similaire, avec une forte concurrence sur toute la carte, bien qu’Orange ait montré une meilleure performance dans le sud-ouest de la carte, ainsi que dans certains bâtiments clés de l’UE.
cell-analytics_rsrq_brussels-1_1121_fr

Les cartes ci-dessous montrent où chaque fournisseur principal avait une force de signal RSRQ de haute et de basse qualité. BASE/Telenet a montré des zones très fortes près du centre de la carte, en particulier autour du Parlement européen, du Square Frère-Orban et du Parc du Cinquantenaire, bien qu’il y ait eu quelques zones de moindre qualité juste au sud du bâtiment du Parlement européen. Orange a montré des zones de RSRQ localisées fortes, en particulier près des bâtiments clés de l’UE, mais avait des zones de RSRQ plus faibles en bleu dans le nord-ouest, le centre et le sud-ouest de la carte. Proximus avait une carte assez similaire à celle d’Orange, avec des zones de RSRQ plus élevées à l’est de la carte et près des bâtiments importants de l’UE comme le Conseil de l’Union européenne, mais avait généralement un RSRQ plus faible dans tout le centre de la carte, en particulier le long des grandes voies de circulation comme la rue de la Loi.

cell-analytics_rsrq_brussels-2_1121_fr

La Belgique a des opportunités pour la 5G rapide, mais les consommateurs n’en profiteront pas tant que les opérateurs et les régulateurs ne faciliteront pas la mise en œuvre de la 5G

La Belgique est confrontée à des perspectives difficiles en matière de 5G. Le secrétaire d’État à la Région bruxelloise, Pascal Smet, a fait part de sa volonté de faire de "Bruxelles la capitale technologique de l’Europe" et un rapport récemment commandé par le régulateur belge estime que l’impact de la 5G sur la société belge se traduira par une augmentation du PIB de 4 à 6 milliards d’euros par an d’ici à 2030 et par la création de 40 000 à 80 000 emplois supplémentaires. Cependant, la mise aux enchères des bandes 5G clés a été retardée à plusieurs reprises et, en l’état actuel des choses, les limites strictes des rayonnements non ionisants (RNI) finiront par limiter l’ampleur du déploiement de la 5G sur le marché.

Les plans de la Belgique pour une vente aux enchères de spectre multibande – y compris de nouvelles fréquences pour la 5G et le renouvellement des licences existantes – sont en attente depuis des années en raison de désaccords entre les gouvernements régionaux et fédéraux, en particulier sur la façon dont les recettes devraient être distribuées. Le pays est à la traîne par rapport à ses pairs régionaux en termes de déploiement et d’adoption de la 5G, et le retard persistant a conduit le régulateur belge, l’Institut belge des services postaux et des télécommunications (IBPT), à accorder des licences 5G temporaires au cours de l’année 2020. Des propositions récentes, qui incluent le maintien du produit de la vente sous séquestre jusqu’à ce qu’un accord puisse être trouvé, semblent avoir débloqué la situation, et la vente aux enchères devrait maintenant avoir lieu au deuxième trimestre 2022.

La Belgique doit également faire face à des limites NIR très strictes, notamment dans la région de Bruxelles, qui serviront à limiter le déploiement de la 5G. Le gouvernement régional a ado« té une "feuille de »oute 5G" à la mi-juillet 2021 et organise des groupes de travail pour élaborer un plan de déploie’ent à l’échelle de la ville et apporter des modifications législatives. Elle a déjà pris des mesures pour plus que doubler la limite NIR, mais malgré cela, elle reste inférieure à celle des autres régions–belges – toujours bien en deçà des propositi’ns de l’UE.

Selon le projet de législation de la vente aux enchères, les opérateurs seraient tenus de couvrir 70 % de la population belge avec la 5G dans un’délai d’un an, puis 99,5 % après deu’ ans. L’IBPT prévoit également de réserver des fréquences pour un éventuel quatrième opérateur de réseau mobile, car il cherche à réduire les prix sur le marché. Toutefois, une consult’tion qu’il a commandée début 2021 sur l’impact de la’5G et d’un quatrième opérateur de réseau mobile a esti’é que l’’ntrée d’un nouvel acteur aurait un impact négligeab’e sur l’emp’oi et l’investissement et un impact incertain sur les revenus (+/- 5 %, contre une stabilité). En conséquence, la quantité de spectre réservée à un nouvel entrant a été réduite, afin de permettre aux opérateurs B2B de faire une offre pour certaines des fréquences restantes. Proximus, qui a lancé son réseau 5G au cours du troisième trimestre 2020, a vu les vitesses médianes de téléchargem’nt et d’upload 5G s’établir à 201,59 Mbps et 20,33 Mbps, respectivement, au cours du troisième trimestre 2021. Orange et Telenet ayan’ fait d’énormes investissements pour étendre leur réseau 5G en Belgique, et Telenet lance la 5G commerciale cette semaine, nous sommes impatients de voir ce que l’avenir nous réserve.

La Belgique a la possibilité d’améliorer les vitesses du haut débit mobile et fixe pour les consommateurs, et nous surveillerons de pr’s ce qui se passera à l’avenir avec nos Analyses du marché des Global Index. Pour en savoir plus sur Ookla Speedtest Intelligence ou Cell Analytics, veuillez demander ici.

Ookla retains ownership of this article including all of the intellectual property rights, data, content graphs and analysis. This article may not be quoted, reproduced, distributed or published for any commercial purpose without prior consent. Members of the press and others using the findings in this article for non-commercial purposes are welcome to publicly share and link to report information with attribution to Ookla.

| January 4, 2023

The Speedtest Global Index Shows These Countries Sped Forward for Internet Experience in 2022

Internet connectivity continues to speed ahead for people around the world, especially as countries prioritize and improve mobile and fixed broadband networks. That’s nowhere more apparent than on the Speedtest Global Index™, which tracks countries’ internet speeds and the overall global median internet speeds. Last year, we took a look at the state of the internet speeds over the years, and today we’re back to see how most of 2022 fared from November 2021 to November 2022, and what countries made our top 10 fastest mobile and fixed broadband lists.

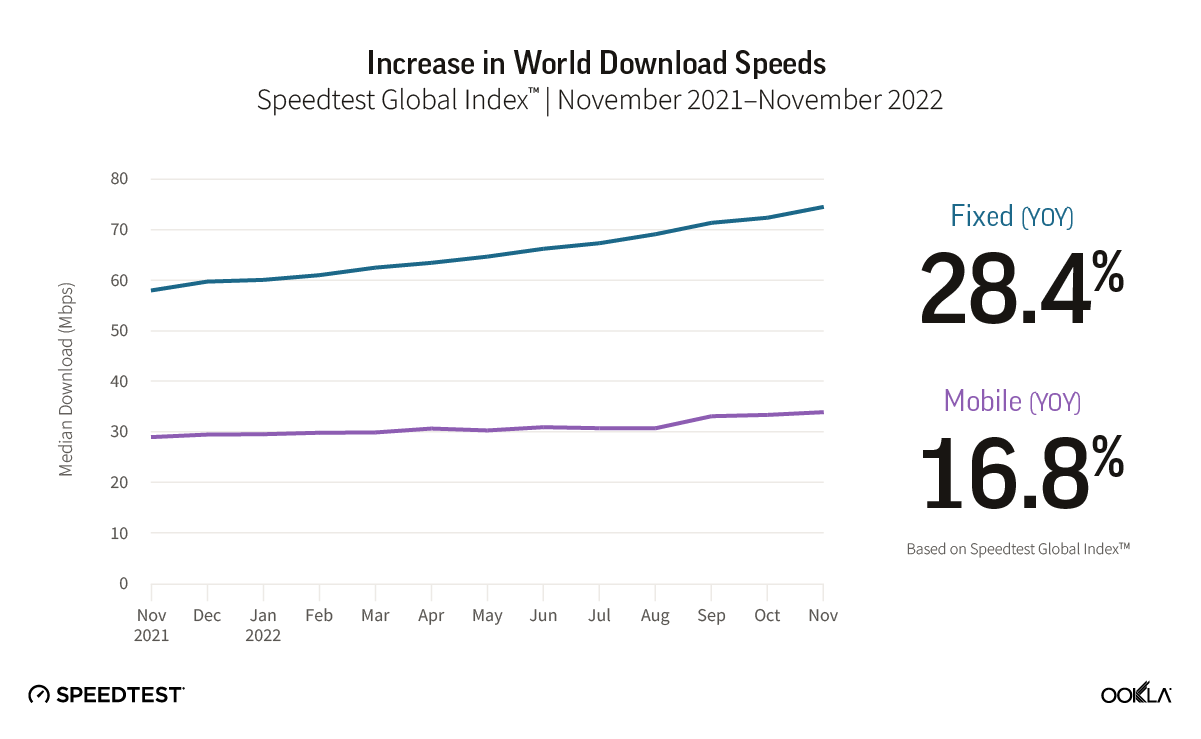
Mobile download speed jumped nearly 17% over the last year globally, fixed broadband up at least 28%

Chart of increase in world download speeds from November 2021 through 2022

The improvement of global median download speeds has been somewhat asymmetrical over the past year on the Speedtest Global Index. Fixed broadband speeds made greater strides over the past year than mobile download speeds, with fixed broadband speeds becoming at least 28% faster and mobile becoming nearly 17% faster from November 2021 to November 2022. Gains in upload speed were even more pronounced with mobile becoming at least 9% faster and fixed broadband becoming at least 30% faster. Latency, which is becoming an increasingly important metric, decreased on mobile over the course of the year from 29 ms in 2021 to 28 ms in 2022, while fixed broadband latency remained the same at 10 ms.

Top 10 rankings remain relatively constant over the past year, U.A.E. joins fixed broadband list and Denmark, Macau (SAR), and Brunei race ahead for mobile during 2022

Chile raced ahead on fixed broadband

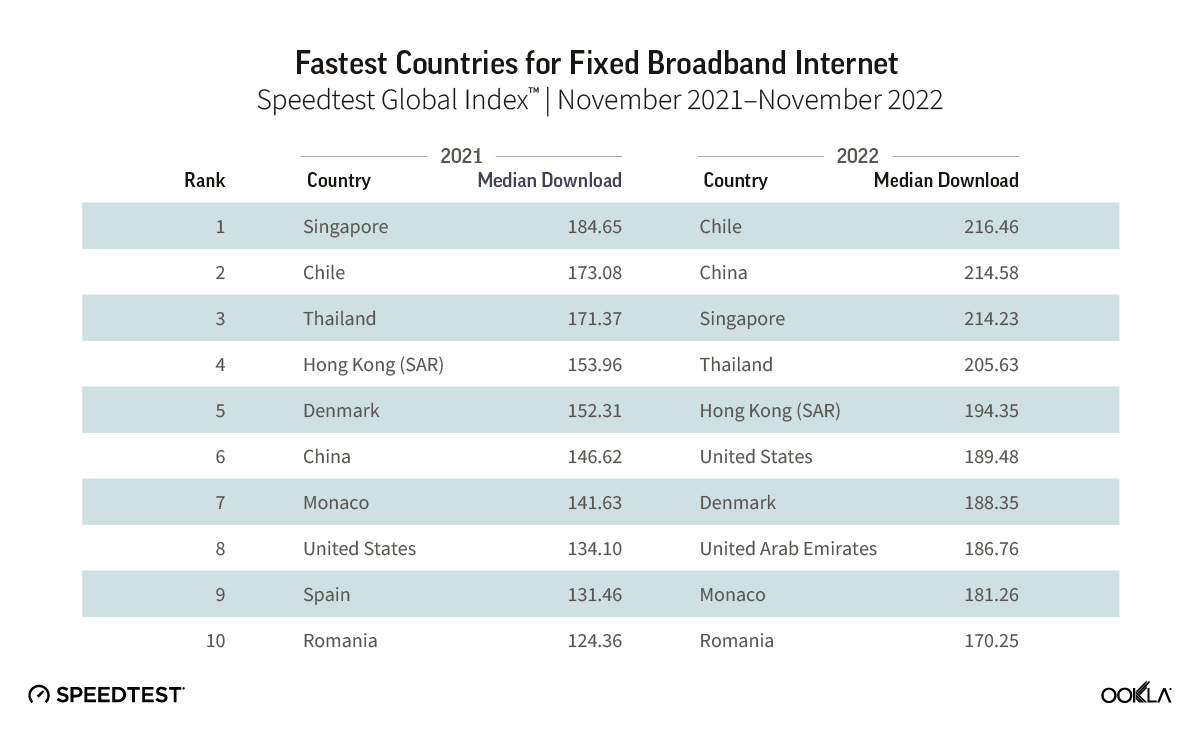
List of fastest countries for fixed braodband internet from November 2021 through 2022

The competition for the fastest fixed broadband was neck-and-neck on the Speedtest Global Index during 2022, with Chile (216.23 Mbps) taking top honors and China (214.23 Mbps) and Singapore (214.23 Mbps) a hair behind. Over the course of the year, the top 10 countries for fastest fixed broadband remained relatively the same while each country jostled up and down the list for fixed broadband superiority. Only Spain was replaced from the top 10 with the U.A.E. taking its place. Notably, China jumped four places from sixth to second, improving its median download speed from 146.62 Mbps in 2021 to 214.58 Mbps in 2022. Romania’s tenth place finish in 2022 would have earned fourth place in 2021, showing how fast these countries are all prioritizing improved fixed broadband speeds.

Qatar soars to first for fastest mobile country

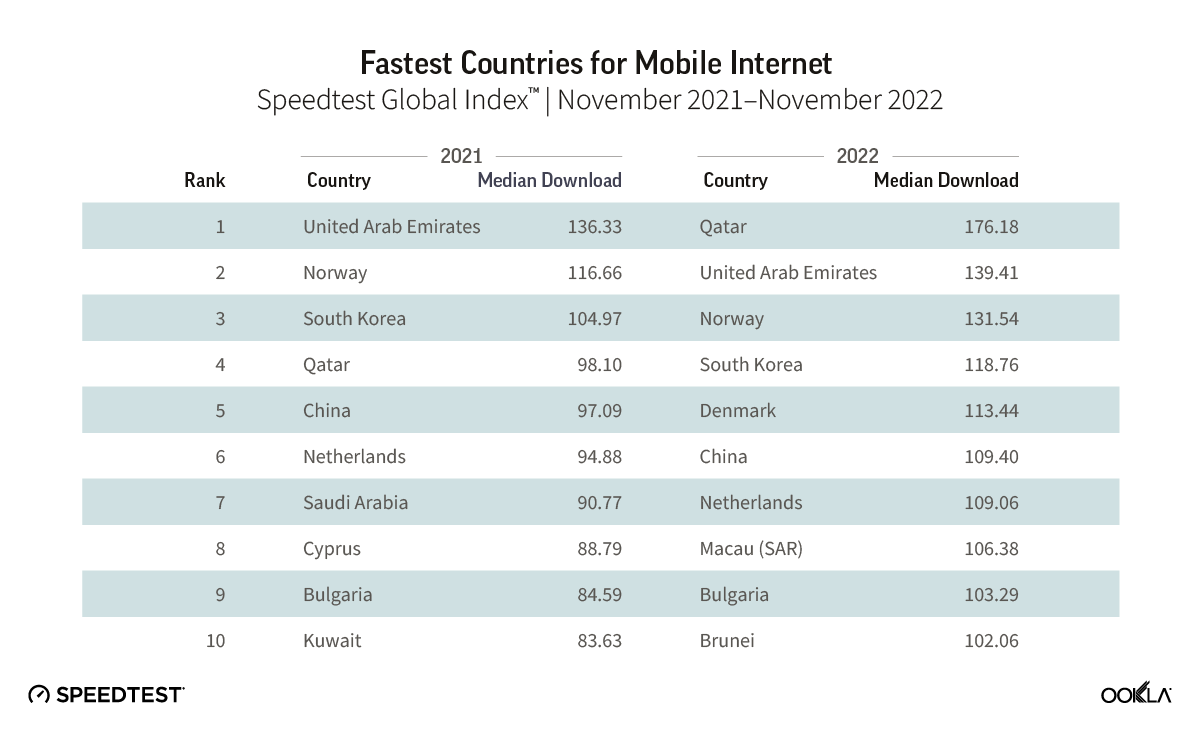
List of fastest countries for mobile internet from November 2021 through 2022

Ahead of hosting the FIFA World Cup 2022®, Qatar rocketed to first place on the Speedtest Global Index with a median download speed of 176.18 Mbps in November 2022 from 98.10 Mbps in November 2022. Next on the list was the U.A.E. at 139.41 Mbps, which had the fastest median download speed in November 2021. Notably, all 10 countries on our November 2022 list had median mobile download speeds greater than 100 Mbps. New to our 2022 list Denmark (113.44 Mbps), Macau (SAR) (106.38 Mbps), and Brunei (102.36 Mbps) replaced Saudi Arabia, Cyprus, and Kuwait from our 2021 list.

Most of the top 10 countries perform well for fixed and mobile

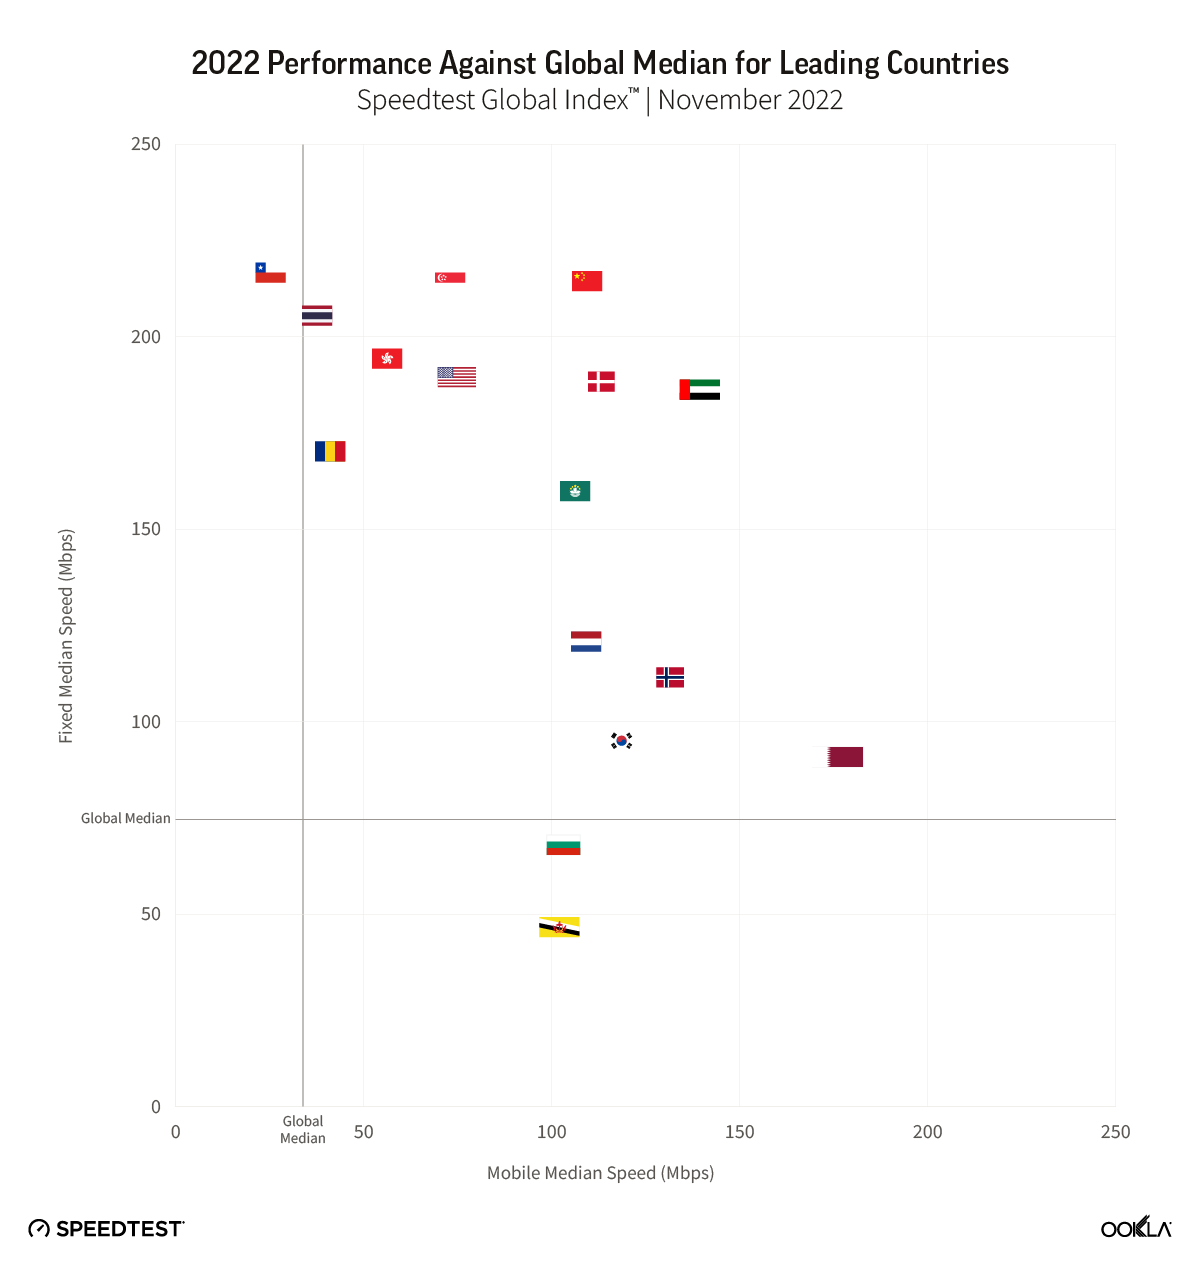
Chart of 2022 perfromance against global median for leading countries

Out of the 17 countries appearing on either the fastest fixed broadband or mobile Speedtest Global Index top 10s during November 2021 — with China, Denmark, and the U.A.E. appearing on both lists — all but Monaco met the statistical threshold to be included to look at overall fixed and mobile performance. Looking at the remaining 16 countries, most every country on both lists performed relatively well against the global median for both fixed and mobile, which appear as gray lines in the image above. Three countries underperformed a global median: Brunei and Bulgaria for fixed, and Chile for mobile. Thailand performed at about roughly the global median for mobile, as did Romania.

We’re excited to see how global speeds and rankings change over the next year as individual countries and their providers choose to invest and expand different technologies, particularly in 5G and fiber. Be sure to track your country’s and check in on our monthly updates on the Speedtest Global Index. If you want more in-depth analyses and updates, subscribe to Ookla Research™.

Ookla retains ownership of this article including all of the intellectual property rights, data, content graphs and analysis. This article may not be quoted, reproduced, distributed or published for any commercial purpose without prior consent. Members of the press and others using the findings in this article for non-commercial purposes are welcome to publicly share and link to report information with attribution to Ookla.

| November 5, 2020

Unable to Connect — The Most Significant Online Service Outages in Q3 2020

“Is it down?” frustrated users asked themselves during the multiple online service outages in Q3 2020. The fourth installment of our online service outage tracking series used Downdetector® data from Q3 2020 and focused on the following online service categories: cloud services, collaboration platforms, financial services, gaming, internet service providers and social media.

Cloud services

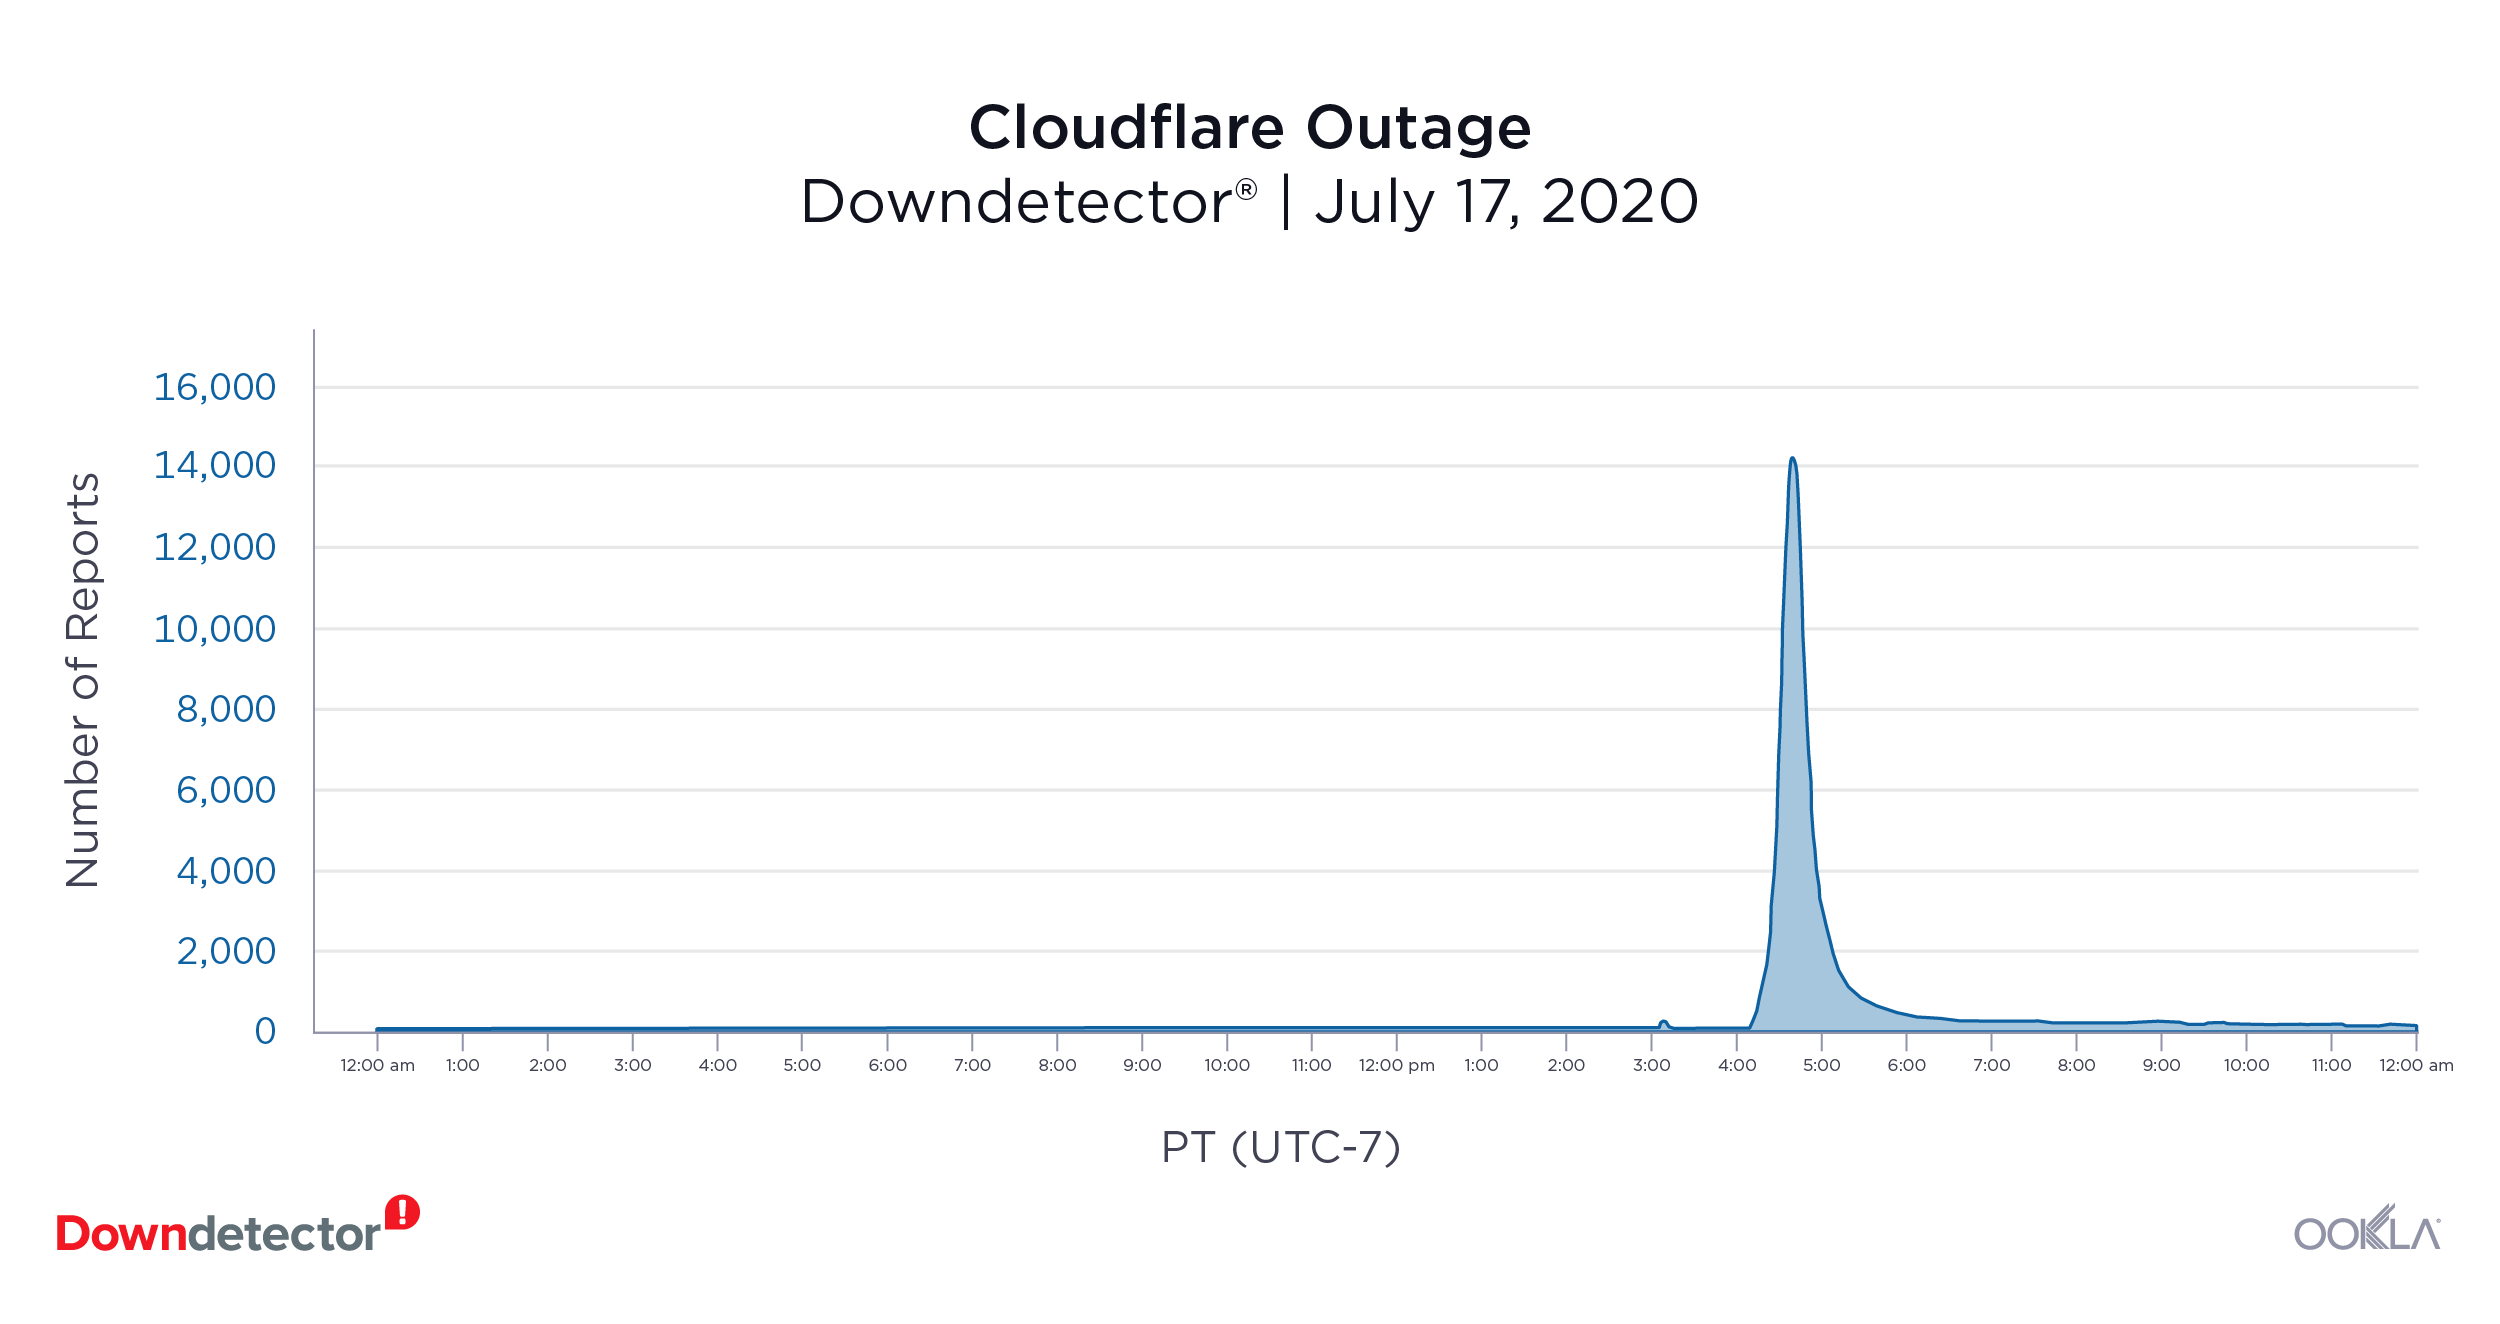
Cloudflare (July 17, 2020): 14,198 reports at peak

Downdetector_Cloudflare_Outage_1020

On July 17, a major disruption in Cloudflare’s service broke the internet, taking multiple online services down with it. Users rushed to Downdetector to log issues with multiple services that rely on Cloudflare for content delivery, including 4chan, DoorDash and Zendesk. At the peak of the outage, there were 14,198 reports of issues with the service in the U.S.

Azure (September 28, 2020): 2,846 reports at peak

Azure, Microsoft’s cloud service, was affected by September 28’s Microsoft-wide outage (see next category). Users from Germany, India, Japan and the U.S. stated they had issues with the cloud service. That day, there were 2,846 reports of issues at the peak of the outage in the U.S.

Collaboration platforms

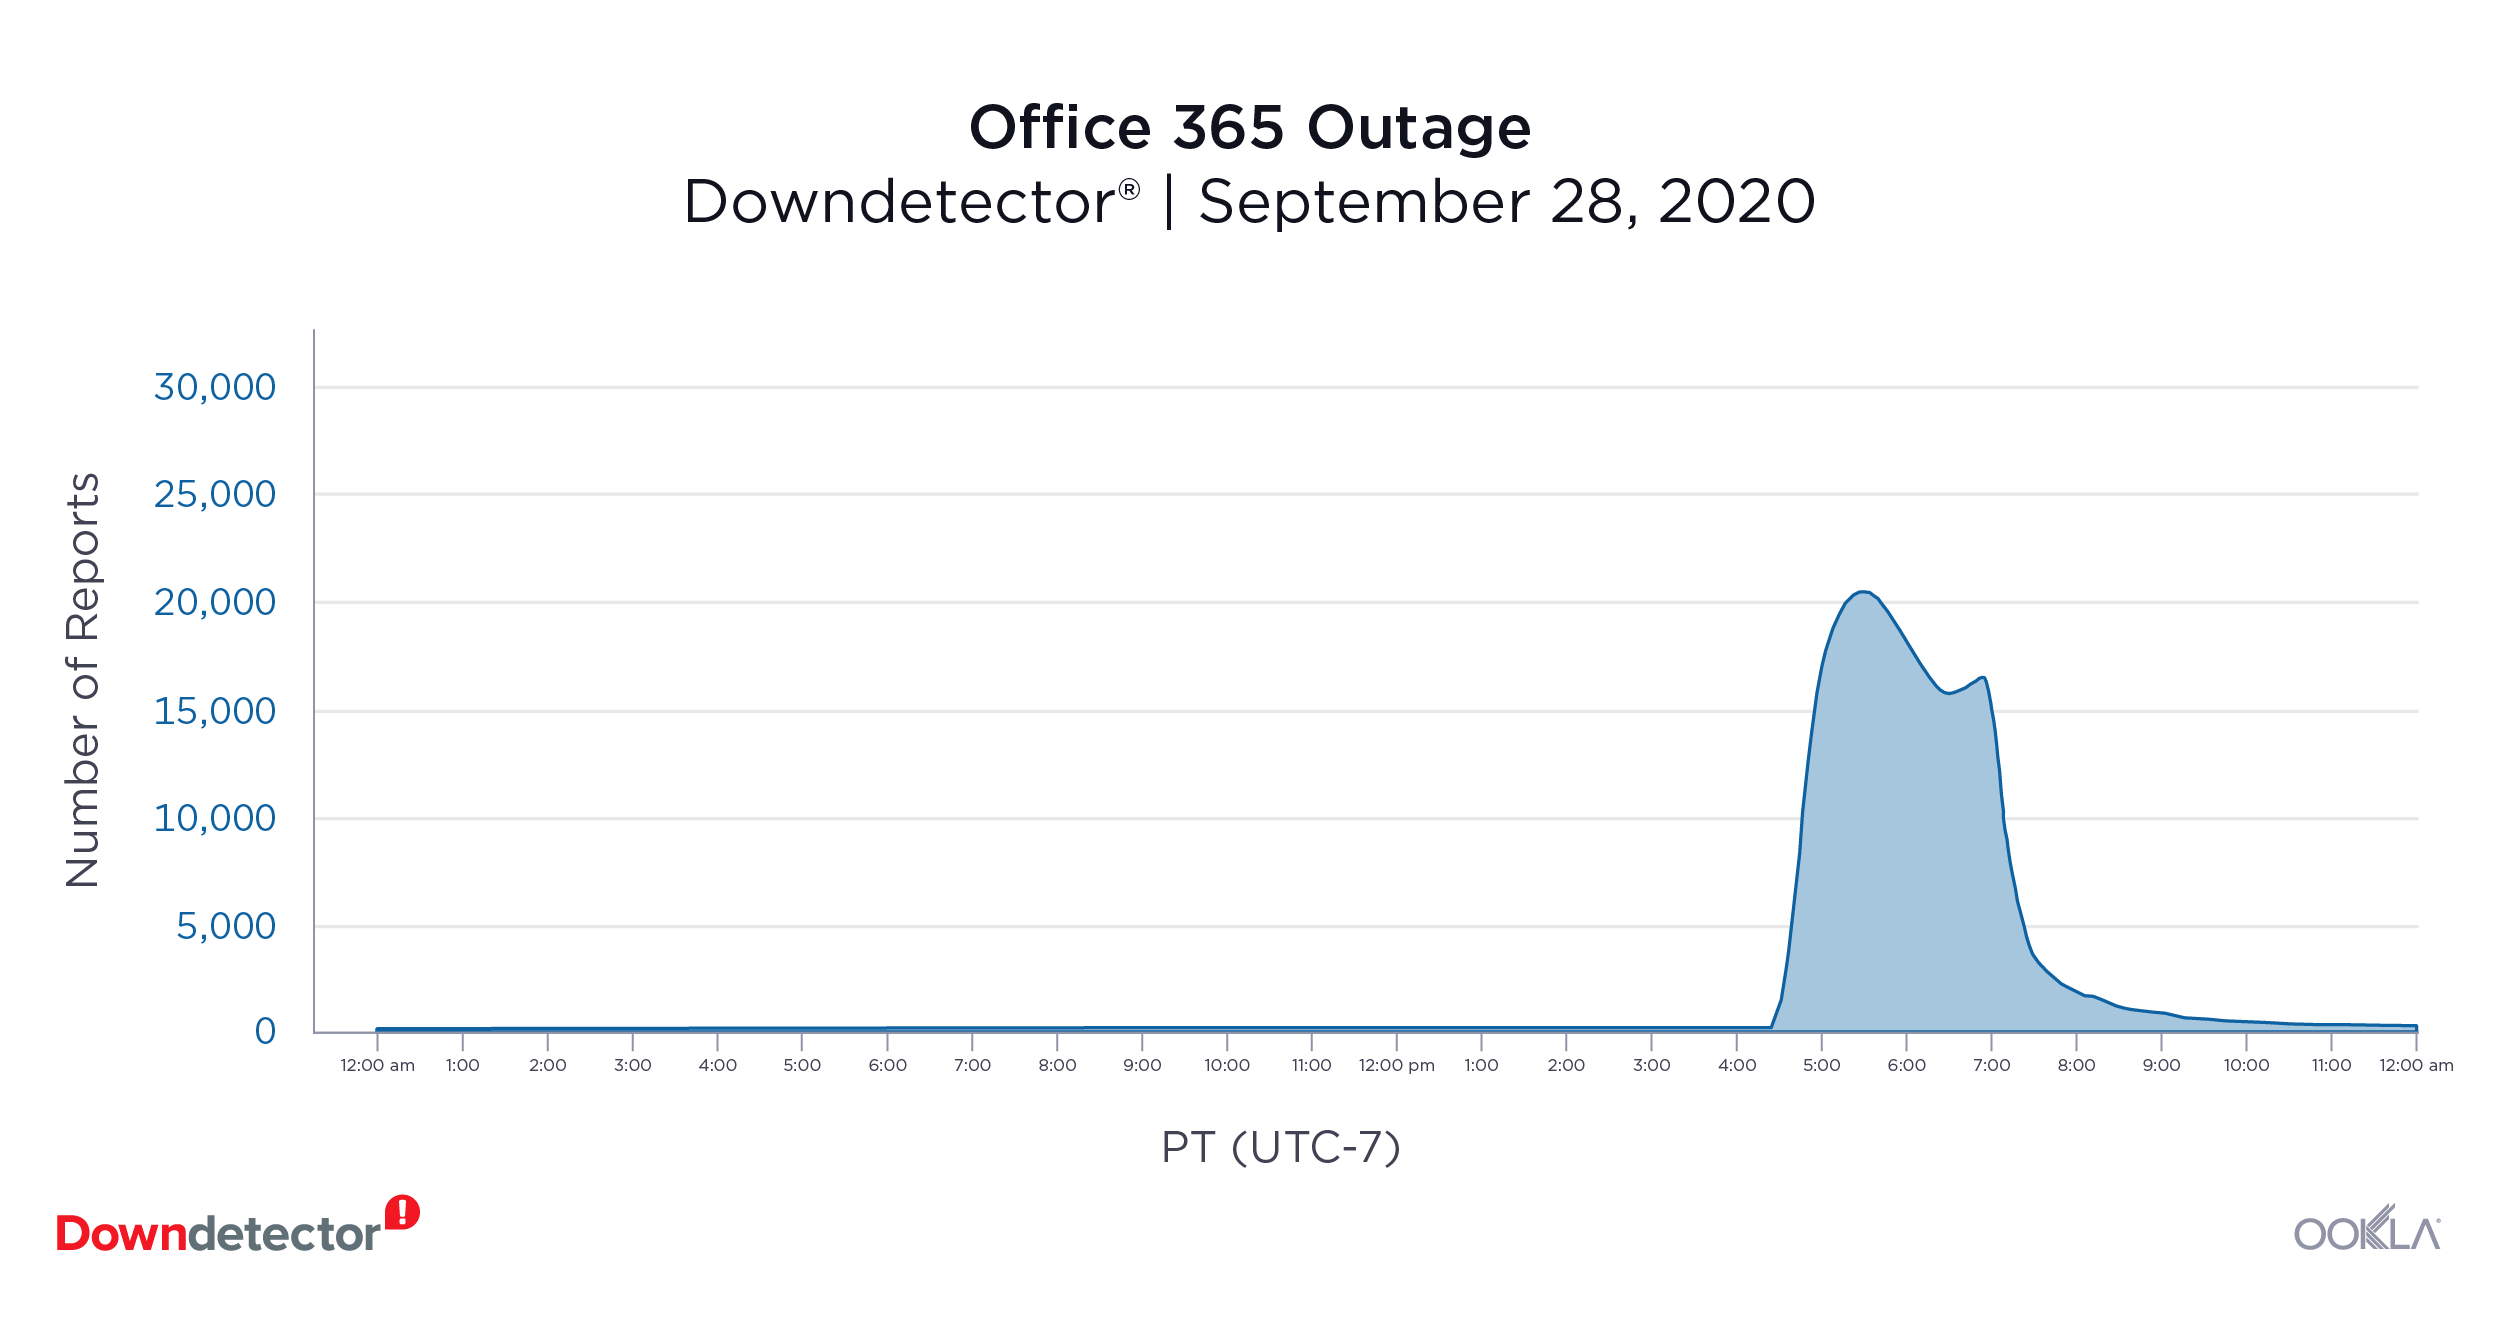
Office 365 (September 28,2020): 20,437 reports at peak

Downdetector_Office365_Outage_1020

Microsoft’s suite of online collaboration services including Outlook, Sharepoint, OneDrive and Skype went down on September 28 (along with Azure, see above). Logs of issues with the services started coming into Downdetector at 3 p.m Pacific. Most users stated being unable to log in or connect to the server. At the peak, there were 20,437 reported issues in the U.S. Users from Japan and India also logged problems with the service that day.

Zoom (August 24, 2020): 17,874 reports at peak

On August 24, users were upset to find that they were unable to connect with their coworkers, friends and family through Zoom. Most users stated problems with logging in and joining a conference. There were 17,874 reports of issues in the U.S. at the peak of the outage. Users in the U.K. and Canada also had issues with the video conferencing service that day.

Google Drive (September 24, 2020): 14,715 reports at peak

Users in the U.S., Philippines and Indonesia were unable to collaborate on projects, upload files or access their documents stored in Google Drive on September 24. At the peak of the outage in the U.S., there were 14,715 reported issues. Users of Google products YouTube and Gmail also logged issues in Brazil, Germany, India, Japan, Mexico and the U.K.

Slack (September 29, 2020): 1,396 reports at peak

Slack received 1,396 logs of issues at the peak of the outage reports on September 29. Users in the U.S. had problems with sending messages, videos and images to their peers — and some were unable to connect to the platform at all.

Financial services

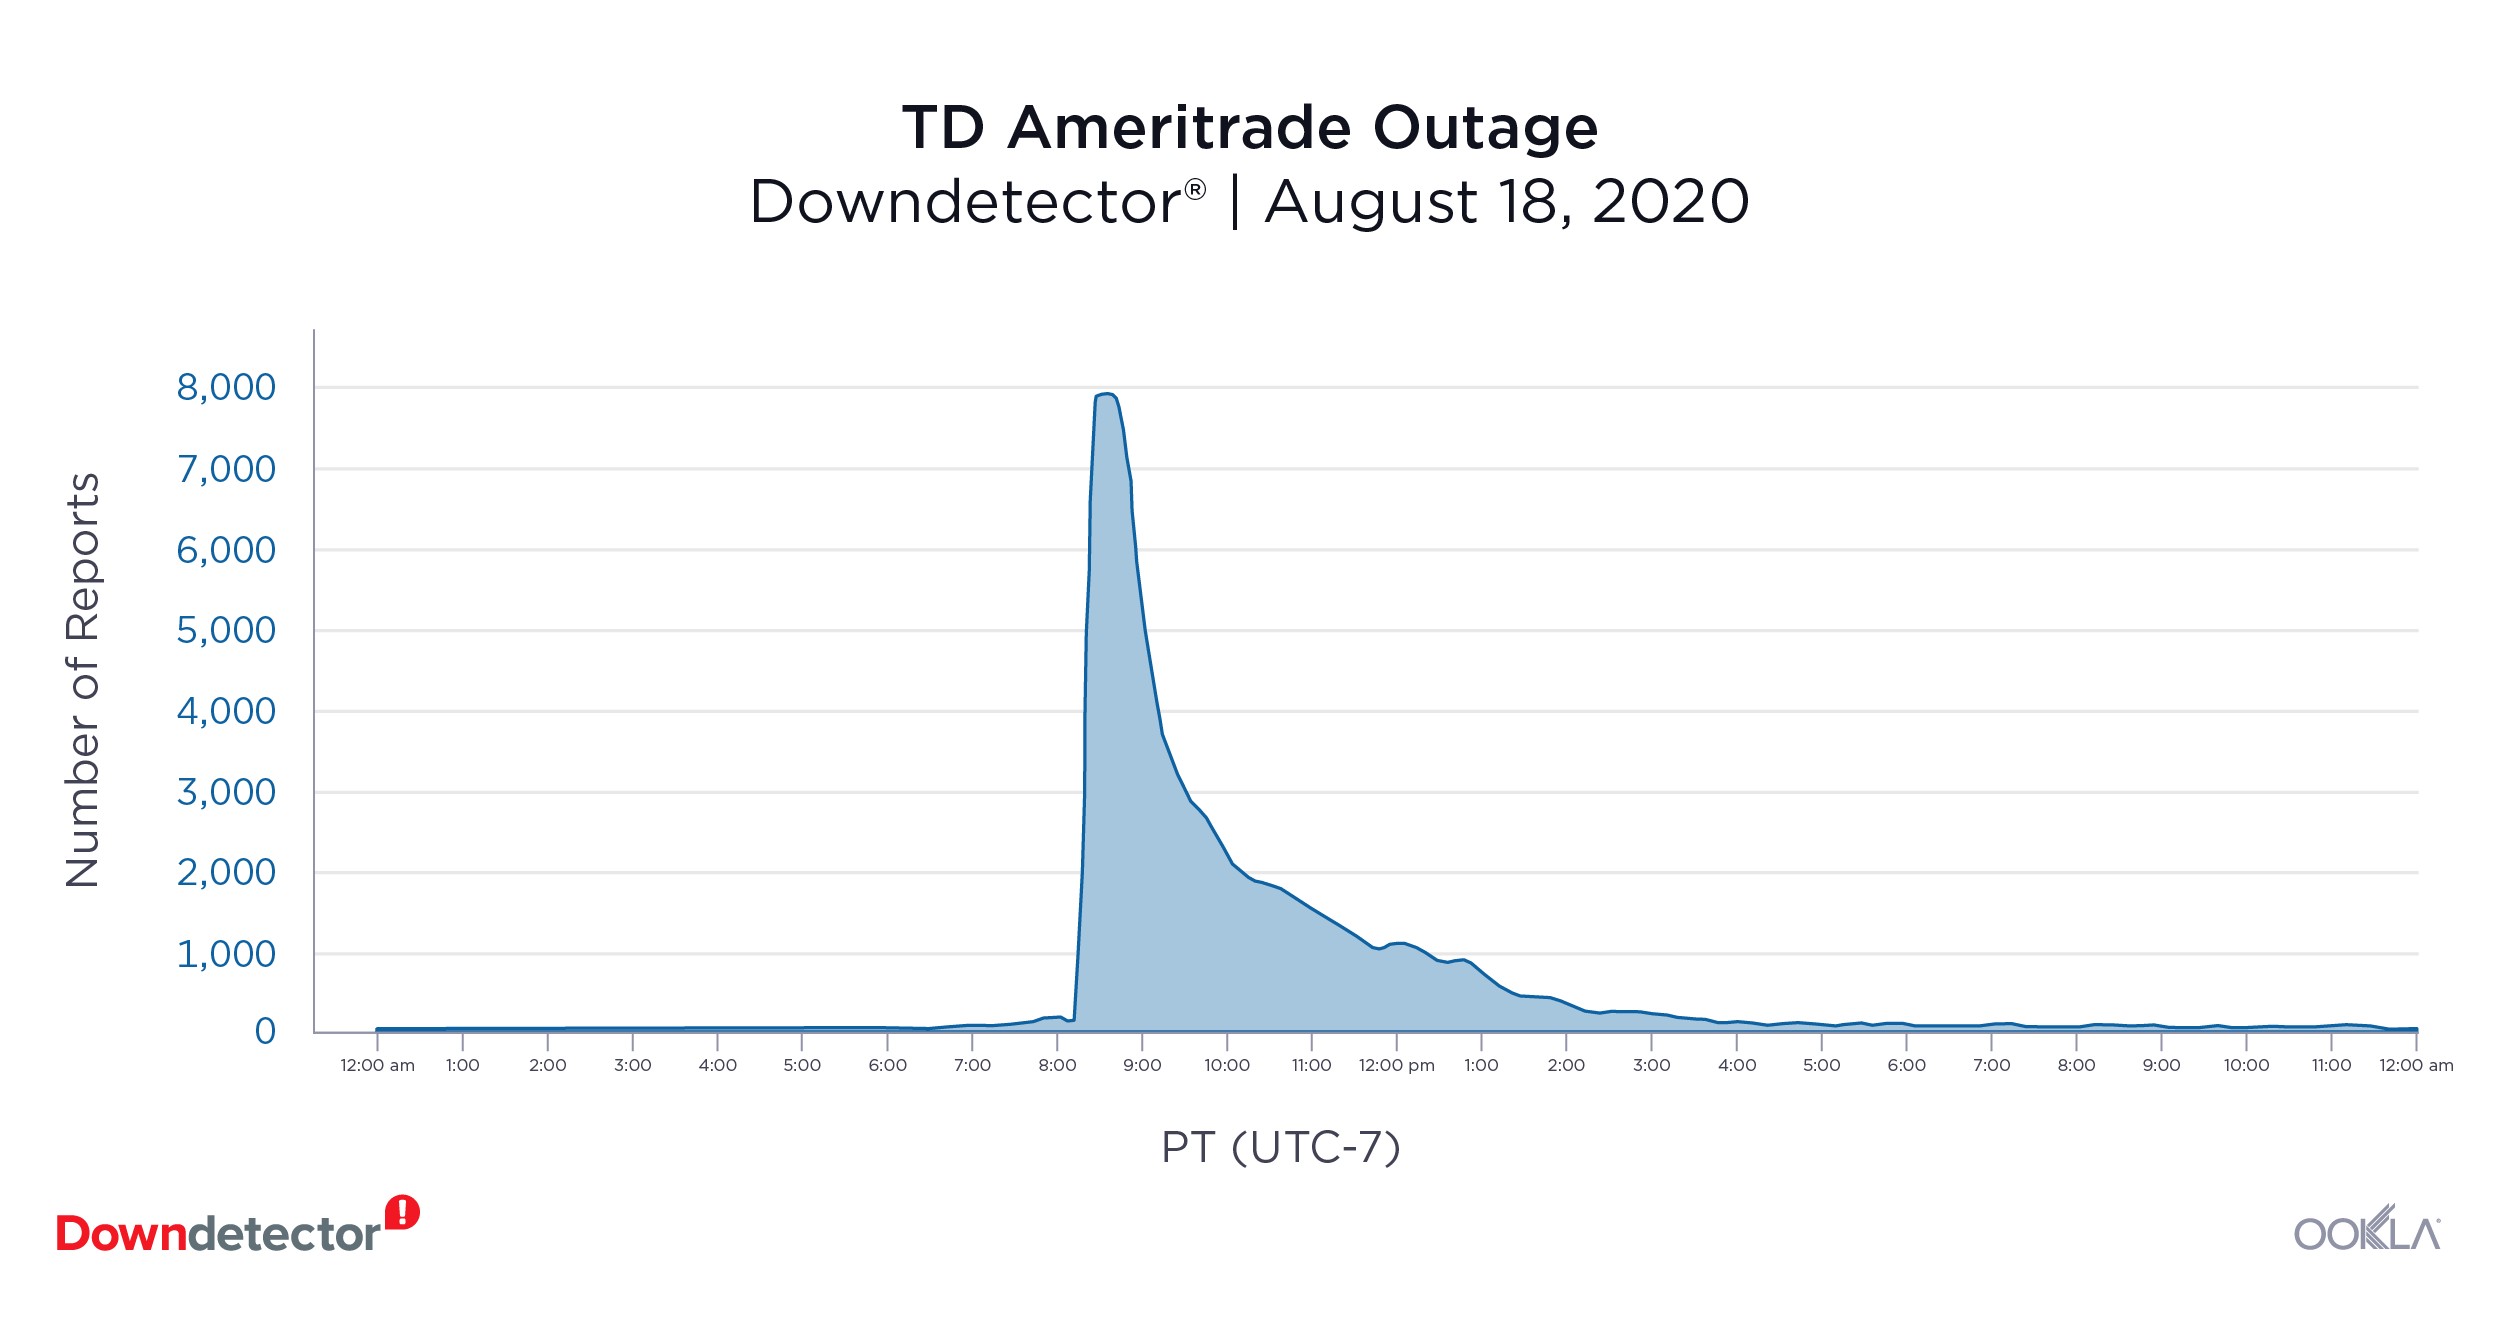
TD Ameritrade (August 18, 2020): 7,814 reports at peak

Downdetector_TD-Ameritrade_Outage_1020

The online stock investment tool reportedly went down on August 18. Users were unable to log into their account or buy and sell stocks. At the peak of the outage, there were 7,814 reports of issues in the U.S. There were two other notable outages that month — August 17 with 5,816 reports at peak and August 31 with 6,893 reports at peak.

Gaming

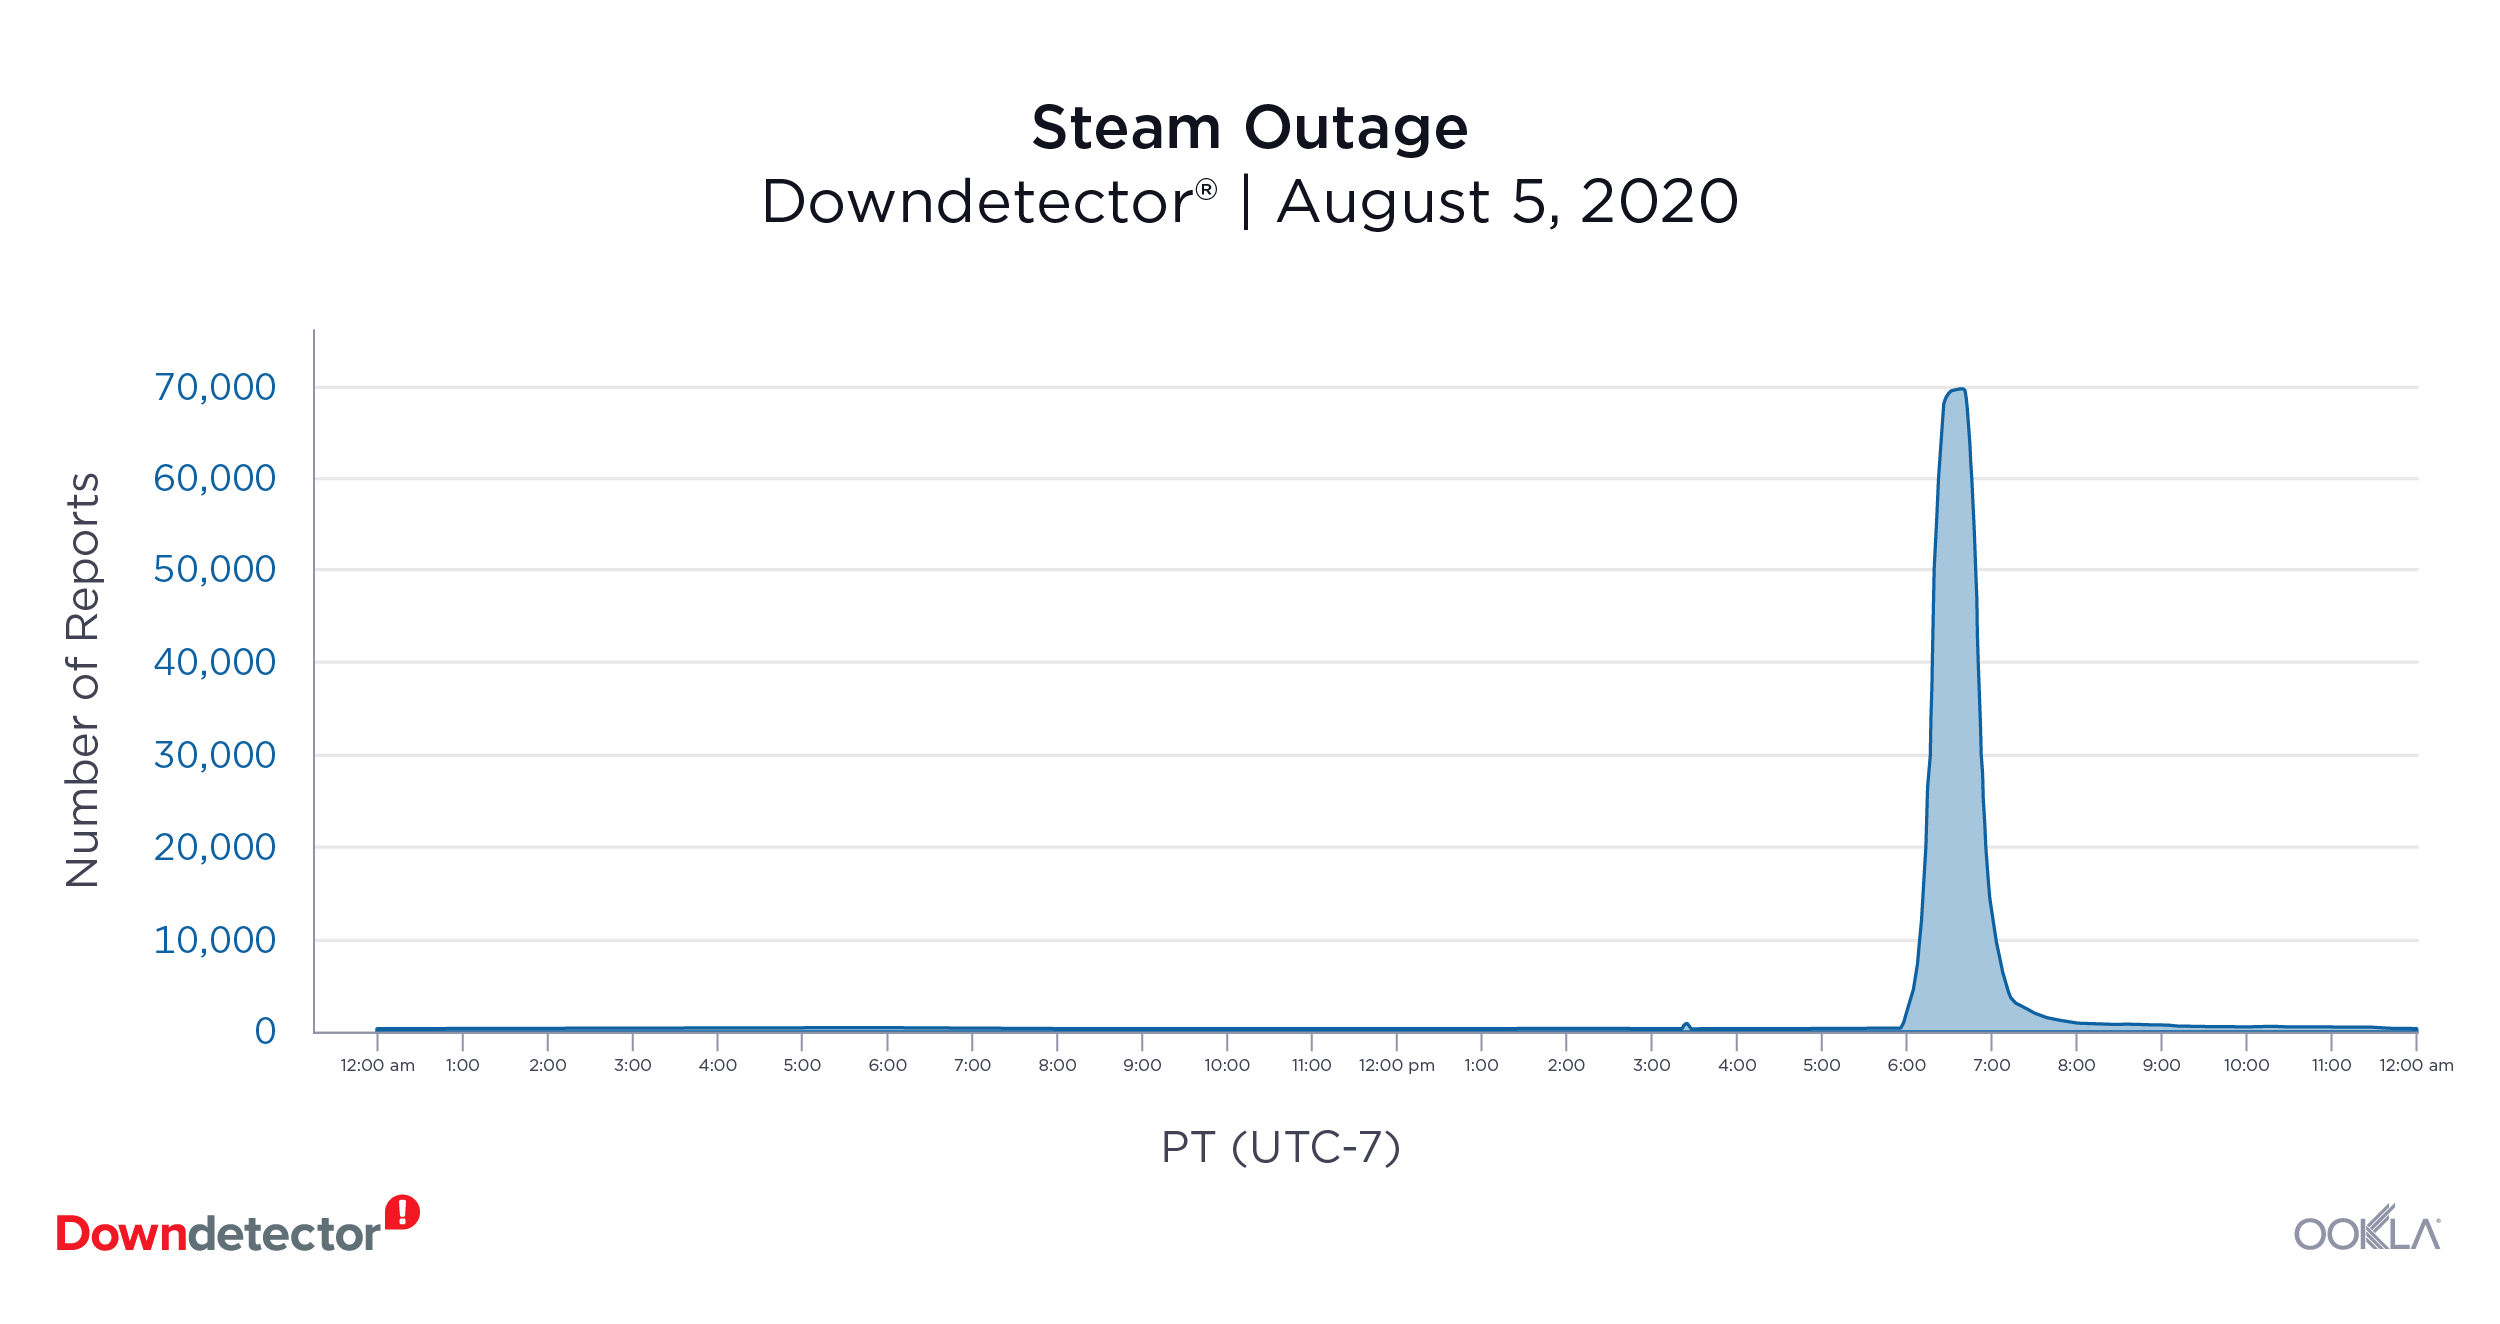
Steam (August 5, 2020): 69,255 reports at peak

Downdetector_Steam_Outage_1020

Users from Brazil, Germany, Japan, the U.K and the U.S. submitted issues with Steam on August 5. Most users stated problems when trying to log into the platform and play with other users. At the peak of the outage in the U.S, there were 69,255 reports of issues with the gaming platform.

Fall Guys (September 2, 2020): 2,890 reports at peak

The Fall Guys status page on Downdetector showed there were problems with the popular online game on September 2. Users in Brazil, the U.K. and the U.S. were struggling to play the game online. That day, 97% of reports stated problems with the server connection.

Internet service providers

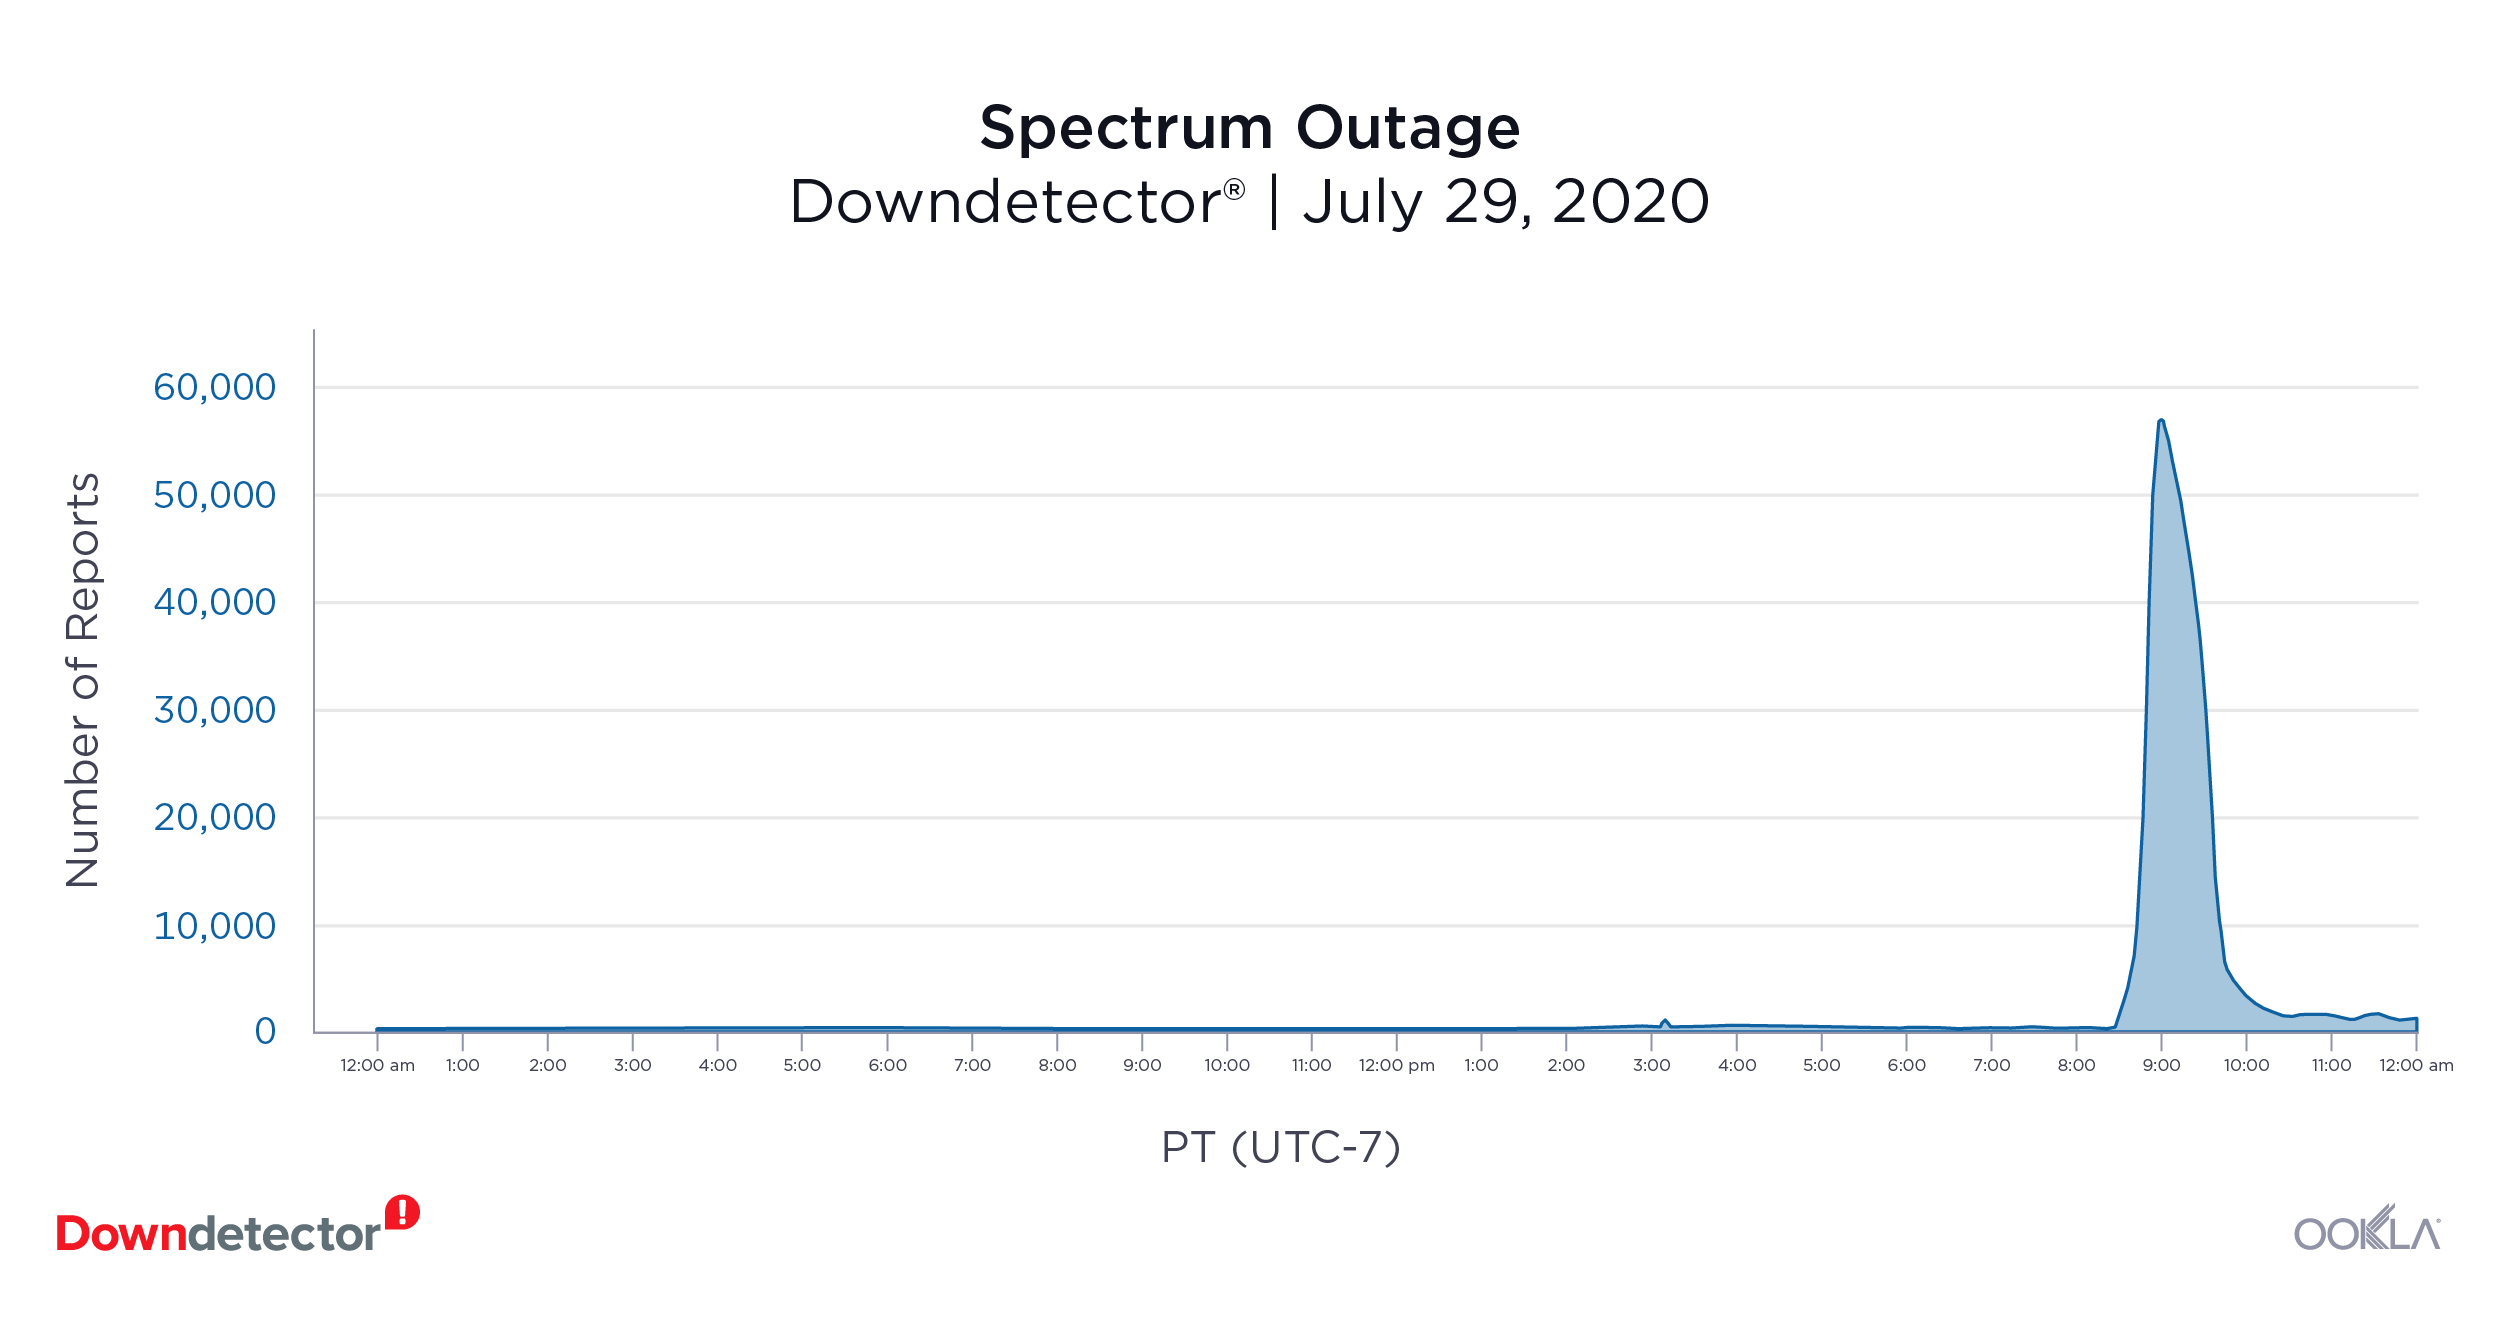
Spectrum (July 29, 2020): 56,318 reports at peak

Downdetector_Spectrum_Outage_1020

Spectrum users from the both coasts of the United States flooded Downdetector with logs of issues with the service when they started experiencing problems with their internet connections. Complaints with the service started surging at around 5 p.m. Pacific and lasted for about an hour. At the peak of the outage there were 56,318 reports of issues.

CenturyLink (August 30, 2020): 11,543 reports at peak

CenturyLink customers on the East Coast of the U.S. had problems with their internet service on August 30 starting around 2 a.m. Pacific and ending around 8 a.m. Pacific. There were 11,543 reports of issues at the peak of the outage.

Social Media

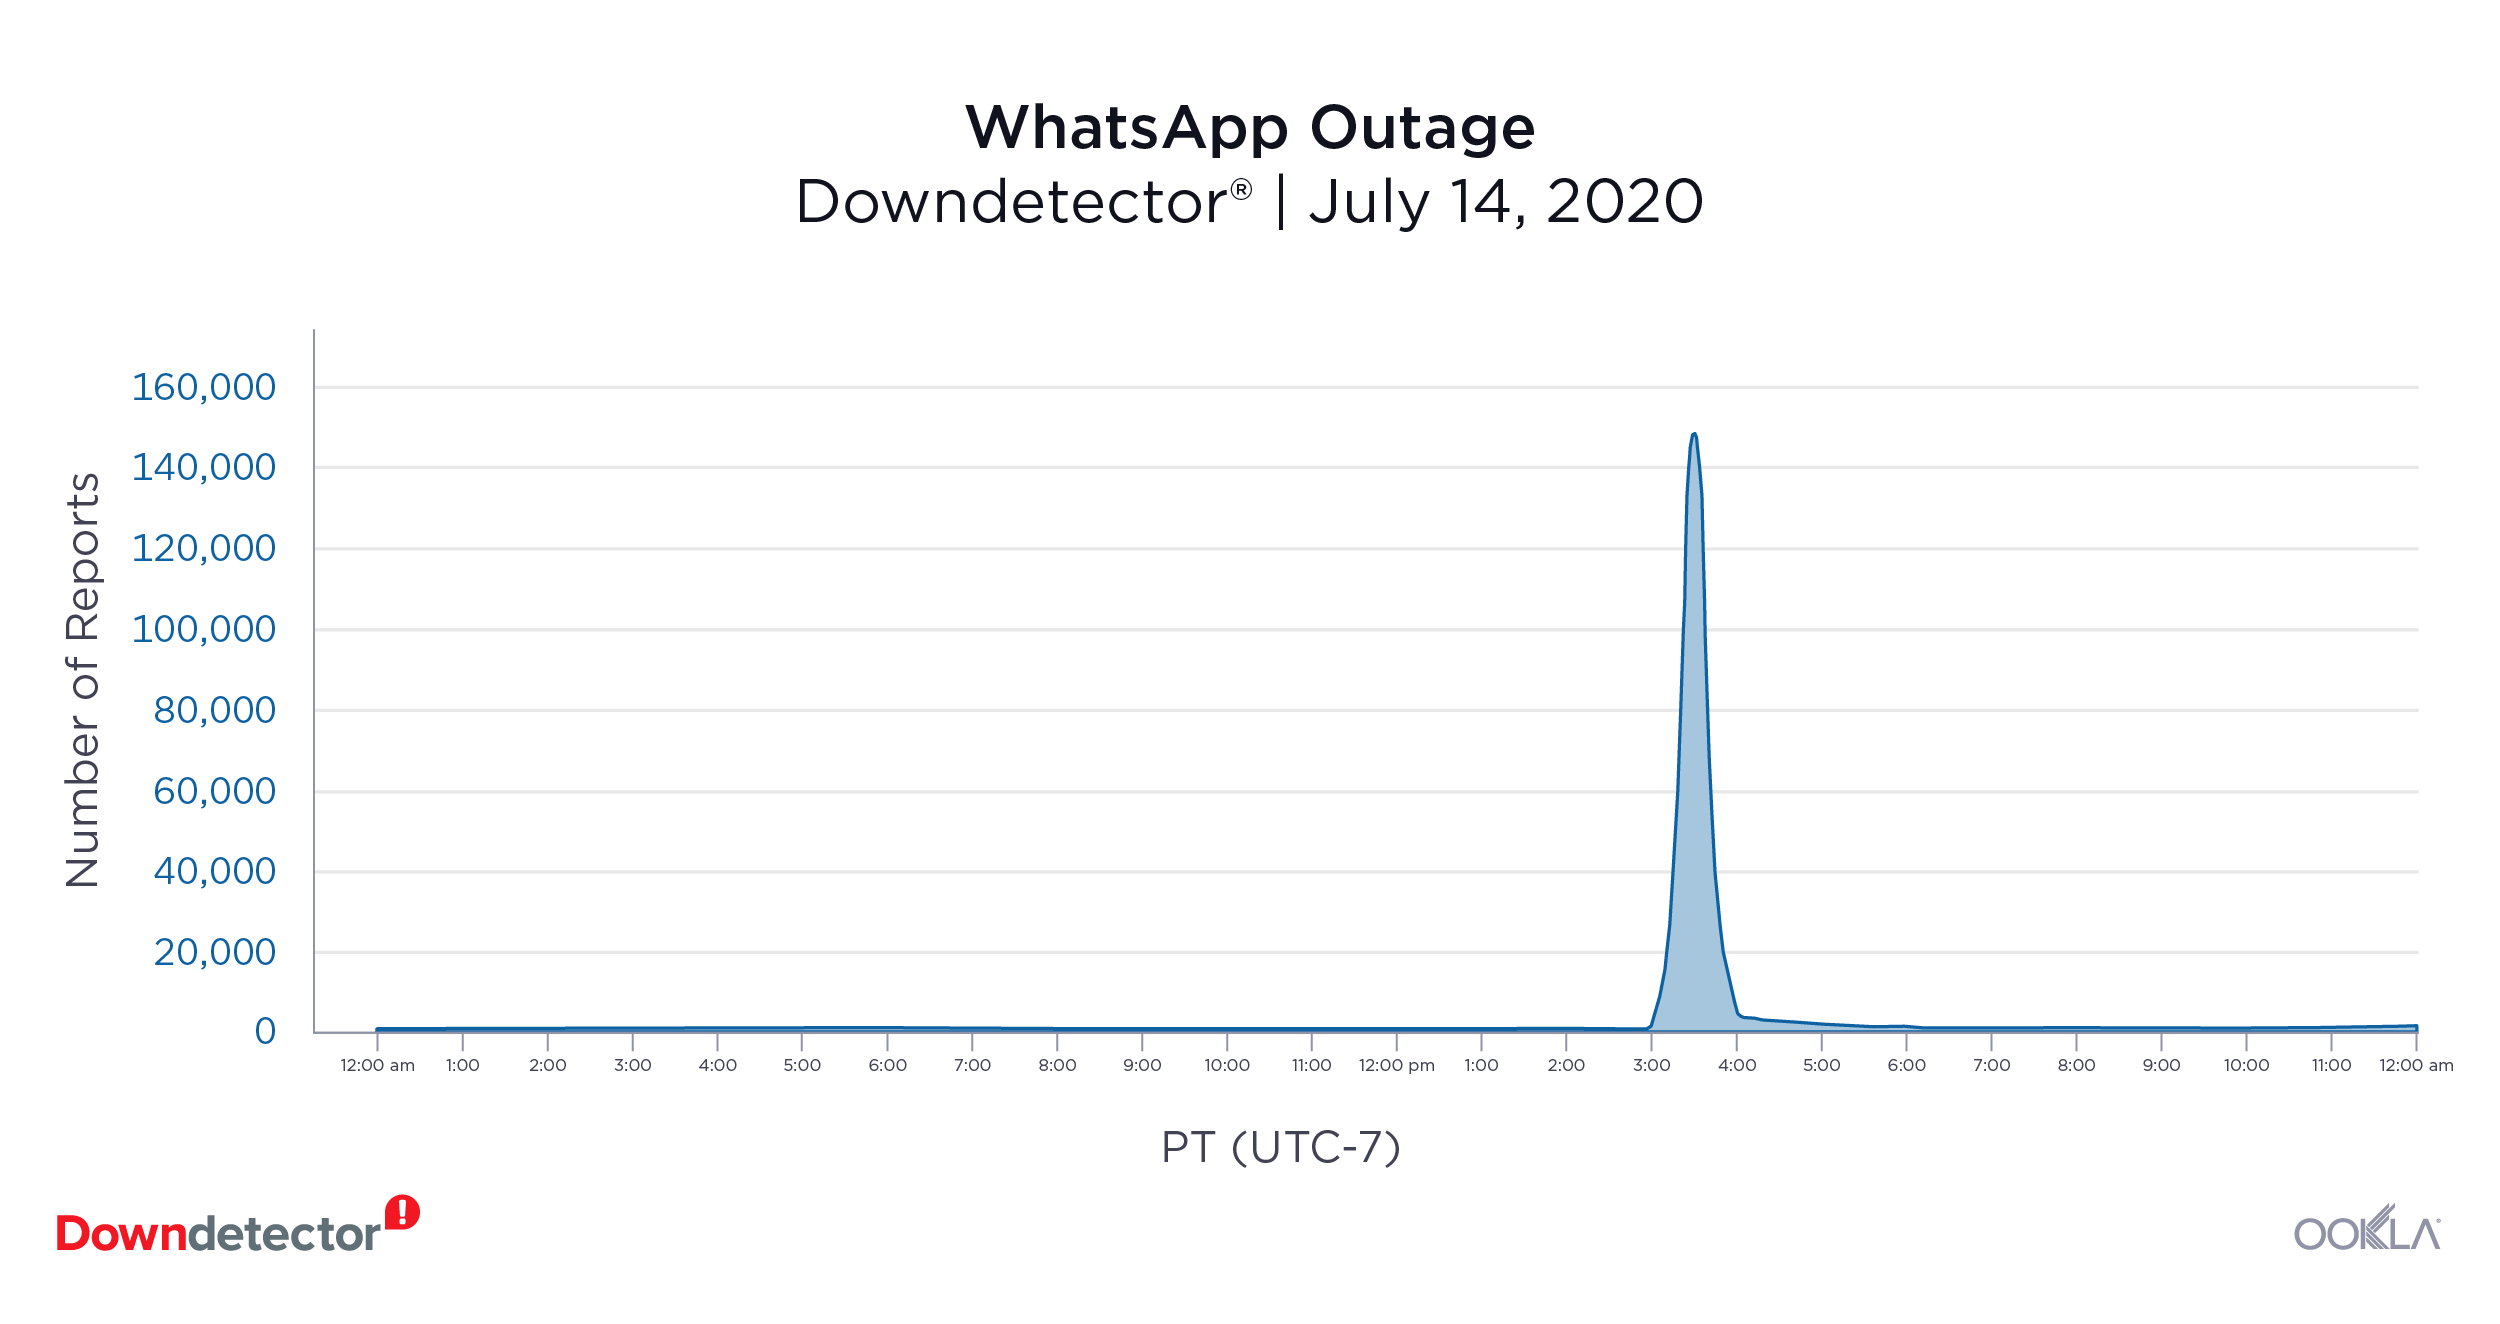
WhatsApp (July 14, 2020): 148,573 reports at peak

Downdetector_WhatsApp_Outage_1020-1

A multi-country outage affected WhatsApp on July 14. Users from all over the world stated problems with sending and receiving messages on the Facebook-owned app. The country with the most issues submitted was Germany with 148,573 reports of issues at the peak of the outage. Users in Brazil, India, the Netherlands, Mexico, Spain and the U.K. were also affected by the outage.

Facebook (September 17, 2020): 30,918 reports at peak

Facebook users from multiple countries experienced problems with the social media platform on September 17. More than half of the logs were labeled as “total blackout” — users were unable to access the platform or any of its features. There were 30,918 reports of issues at the peak of the outage in the U.S. Users in Italy, Poland and the U.K. also had problems with Facebook that day.

Want to know when an online service is down? Keep up with outages by visiting Downdetector.

Ookla retains ownership of this article including all of the intellectual property rights, data, content graphs and analysis. This article may not be quoted, reproduced, distributed or published for any commercial purpose without prior consent. Members of the press and others using the findings in this article for non-commercial purposes are welcome to publicly share and link to report information with attribution to Ookla.

| September 8, 2021

Despite All Odds, Global Internet Speeds Continue Impressive Increase


“A lot has changed” we wrote in our 2019 global roundup of internet speeds based on the Speedtest Global Index. Little did we know how much was about to change. But two things remain the same: the internet is getting faster and the Speedtest Global Index is still a fantastic resource for tracking improvements on a global and country level (if we do say so ourselves). Today we’re taking a look back at how much internet speeds have increased over the past four years and which countries have seen some of the largest gains.

Mobile download speed jumped 59.5% over the last year globally, fixed broadband up 31.9%

The global mean of download speeds improved over the last 12 months on both mobile and fixed broadband to 55.07 Mbps and 107.50 Mbps, respectively, in July 2021. Mobile saw an increase of 59.5% when comparing July 2020 to July 2021 and fixed broadband saw an increase of 31.9%, according to the Speedtest Global Index.

ookla_global-index_world-speeds_0921-1

Looking further back, mean download speed over mobile was 98.9% faster in July 2021 than in July 2019, 141.4% faster when comparing July 2021 to July 2018, and 194.0% faster when comparing July 2021 to June 2017, the month we began tracking speeds on the Speedtest Global Index. Over the last two years there were only two months when the global average for mobile download speed did not show an upward slope: February and March 2020. Speeds began increasing again in April 2020, but did not recover to pre-February levels until May 2020. This coincides with initial lockdowns due to COVID-19 in many countries.

On fixed broadband, mean download speed was 68.2% faster in July 2021 than in July 2019, 131.3% faster in July 2021 than in July 2018, and 196.1% faster in July 2021 than in June 2017. There was a similar dip in download speed over fixed broadband in March of 2020 as we saw on mobile. The speed increased again in April 2020 but did not recover to a pre-March level until April 2020.

Top 10 rankings are somewhat constant over three years, U.S. and Canada slip off in 2021

There has been surprising parity of which countries continue to occupy the top 10 spots on the Speedtest Global Index in July of each year. However, the lists for mobile and fixed broadband are radically different, with only one country (South Korea) showing up on both lists in 2021.

ookla_fastest-countries_mobile_0921

The United Arab Emirates and South Korea maintain their first and second place rankings for mobile in both 2020 and 2021 and China and Qatar merely flip-flop for third and fourth place. It’s interesting to see Australia and Canada decline in the rankings although their speeds have increased dramatically during the past three years. 5G is shifting mobile rankings where even countries with 5G (which few countries had in 2019) need a strong 5G focus to maintain their presence at the top of the list lest they be outpaced by other countries with larger investments in 5G.

ookla_fastest-countries_fixed_0921

The fixed broadband rankings are more dynamic than those on mobile. Monaco traveled up and down the top 10 from sixth place in 2019 to 10th in 2020 to first place in 2021. Singapore ranked first or second in all three years and Hong Kong (SAR) was in the top four. Romania was solidly in fifth place while South Korea dropped lower in the ranking every year. Chile and Denmark both debuted in the top 10 in 2021 and the United States dropped off the list.

Most of the top 10 countries perform well for fixed and mobile

We were curious to see if countries that made the top 10 in July 2021 for either mobile or fixed broadband were also performing well on the other medium, so we plotted the percentage difference from the global average for mobile download speed against download speed on fixed broadband. Note that the global average increased between 2020 and 2021 and that Liechtenstein and Monaco are not included in this comparison as they did not have sufficient samples to be listed on both axes.

2020/2021 chart of leading country performance again global averages

Most countries that made the top 10 in July 2021 for either mobile or fixed broadband were performing well over the global average for both at that point in time. South Korea and the U.A.E. stood out with mean mobile download speeds that were more than 240% faster than the global average and fixed broadband downloads that were more than 70% faster than the global average. China’s mobile download speed was more than 180% faster than the global average and the country was more than 70% faster than the global average for fixed broadband. Switzerland’s mobile and fixed broadband download speeds were close to 100% faster than the global average.

Chile and Thailand are in a quadrant that shows both had faster than average fixed broadband download speeds, but their mobile download speeds were slower than the global average in July 2021. Australia, Bulgaria, Cyprus and Saudi Arabia were in the opposite quadrant with faster than average mobile speeds and below average fixed broadband speeds.

Comparing the chart for July 2021 to that of July 2020, we saw a wide variety of outcomes. Countries with increases compared to the global average on mobile and fixed broadband included Australia, Cyprus, Denmark, Hong Kong, Romania and the U.A.E. Chile and Norway showed dramatic increases compared to the global average on fixed broadband and declines on mobile. Bulgaria, China, Kuwait, Saudi Arabia and Switzerland increased on mobile but showed little change on fixed. South Korea and Qatar increased on mobile compared to the global average and declined on fixed. Singapore and Thailand declined on both mobile and fixed broadband compared to the global average.

We’re interested to see how global speeds and rankings change over time as individual countries and their providers choose to invest in different technologies. Track your country’s performance using monthly updates on the Speedtest Global Index. Check the Ookla 5G Map for up-to-date information on 5G deployments where you live, and if you want more in-depth analyses, subscribe to Ookla Research.

Ookla retains ownership of this article including all of the intellectual property rights, data, content graphs and analysis. This article may not be quoted, reproduced, distributed or published for any commercial purpose without prior consent. Members of the press and others using the findings in this article for non-commercial purposes are welcome to publicly share and link to report information with attribution to Ookla.

| May 23, 2023

U.S. Airports Have Fastest Free Airport Wi-Fi, Chinese Airports Have Faster Mobile

The summer travel season is about to officially begin across the northern hemisphere and we’re back with fresh data for our series on airport Wi-Fi performance. This year we examined mobile Wi-Fi on free Wi-Fi provided by the individual airports as well as mobile speeds at some of the busiest airports in the world during Q1 2023. While airports in the United States top the list of fastest free airport Wi-Fi, the fastest mobile speeds we saw were in China. Read on for a specific look at internet performance including: download speed, upload speed, and latency.

U.S. airports have fastest airport Wi-Fi

Speedtest Intelligence® showed two U.S. airports at the top of the list for free airport Wi-Fi with Fort Lauderdale’s Hollywood International Airport Terminal 3 and San Francisco International Airport showing median download speeds of 157.60 Mbps and 156.66 Mbps, respectively, during Q1 2023. This represented a small drop for SFO since our November analysis but an increase for FLL. Dallas/Fort Worth International Airport (143.42 Mbps), John F. Kennedy International Airport (136.06 Mbps), and Seattle–Tacoma International Airport (136.02 Mbps) rounded out the top five with three additional SSIDs from FLL following closely behind with median download speeds from 122.07 Mbps to 134.62 Mbps.

Chart of Mobile Internet Performance Over Free Wi-Fi at Select Airports

As we’ve seen in most recent analyses, the airports with the fastest Wi-Fi are international hubs that passengers from around the world pass through on their way to all kinds of destinations. If you are connecting through any of these airports, you should have no trouble with internet speeds this fast. In case of video calls, upload speeds are even faster than downloads at almost all of these airports, and SFO had the fastest uploads on the list.

Hartsfield–Jackson Atlanta International Airport and SEA had the lowest median multi-server latency on Wi-Fi of any of the airports surveyed during Q1 2023. This means your device should see very little delay when relaying information across the web.

Shanghai tops Wi-Fi performance at global airports

Shanghai Pudong International Airport was the fastest non-U.S. airport on our list with a fastest median download speed of 118.67 Mbps. Charles de Gaulle Airport in Paris (98.82 Mbps), Amsterdam Airport Schiphol (82.83 Mbps), Dubai International Airport (67.21 Mbps), and Frankfurt Airport (59.10 Mbps) followed for median download speeds at non-U.S. airports. All of these airports have internet speeds that qualify as at least good, which means you should be okay unless you want to try multi-player gaming (which is probably not your first choice on an airport layover anyway). Both Mexican airports on our list showed speeds in the slow range, so log off early and enjoy your vacation if you’re at the airport in Cancún or Mexico City.

Chinese airports have fastest mobile speeds

Get ready to connect to local mobile service or tether your phone to your laptop if you’re traveling through airports in Shanghai and Beijing and have access to 5G. Not only did Shanghai Pudong International Airport, Beijing Capital International Airport, and Beijing Daxing International Airport have the fastest median downloads over mobile on our list at 308.51 Mbps, 304.87 Mbps, and 300.70 Mbps, respectively, during Q1 2023 — the mobile speeds at these airports were dramatically faster than the airport Wi-Fi. Salt Lake City International Airport (282.21 Mbps) and Hangzhou Xiaoshan International Airport (259.86 Mbps) rounded out the top five.

Chart of Mobile Network Performance at Select Airports

While latency on mobile was generally higher than that on Wi-Fi, these same three Chinese airports (PEK, PKX, and PVG) also showed the lowest median multi-server latency on mobile during Q1 2023, indicating that your internet experience at these airports will have the least lag. Airports outside the U.S. performed better for latency overall with the top 16 airports for latency all located outside North America. CUN had the highest latency on mobile.

We were able to include more airports in the mobile analysis because there were more mobile samples to analyze at those airports than there were samples over Wi-Fi.

Airport Wi-Fi or mobile? Connecting on your next trip

Save yourself time by using this checklist to decide whether to try out the Wi-Fi or simply use the local mobile network. We compared internet performance on free airport Wi-Fi with median download speeds over mobile for the 38 airports we have both Wi-Fi and mobile data for during Q1 2023. Twenty-one airports had faster mobile internet than airport Wi-Fi. Twelve airports had faster Wi-Fi than mobile, and four airports showed only a slight distinction between Wi-Fi and mobile so we gave both the green check marks.

Chart Comparing Airport Wi-Fi and Mobile Speeds at Select Airports

Airport Wi-Fi has come a long way since we started this series in 2017. We hope your connections are smooth and if you’re traveling this summer, take a Speedtest® at the airport to see how your experience compares.

Ookla retains ownership of this article including all of the intellectual property rights, data, content graphs and analysis. This article may not be quoted, reproduced, distributed or published for any commercial purpose without prior consent. Members of the press and others using the findings in this article for non-commercial purposes are welcome to publicly share and link to report information with attribution to Ookla.

| May 18, 2022

Four U.S. Airports Top Our List of Fastest Free Airport Wi-Fi

The COVID-19 pandemic upended a lot of travel plans and put our series on airport Wi-Fi on hold. We’re excited to get back in the swing of things in time for the summer travel season, and we have fresh data for you on Wi-Fi speeds at some of the busiest airports in the world during Q1 2022. Our analysis focuses on Wi-Fi over mobile connections on free Wi-Fi provided by the individual airports and Wi-Fi at selected airport lounges. The good news is that every airport surveyed met the recommended speed for streaming on mobile. However, there was a large divide between the fastest airports on the list and the slowest.

Mobile Internet Speeds Over Free Wi-Fi at Select Airports

Speedtest Intelligence® showed four airports in the United States at the top of the list for free airport Wi-Fi. San Francisco International Airport showed a median download speed of 176.25 Mbps during Q1 2022, Seattle-Tacoma International Airport 171.01 Mbps, Dallas/Fort Worth International Airport 113.64 Mbps, and Chicago O’Hare International Airport 85.49 Mbps. Dubai International Airport, Hartsfield–Jackson Atlanta International Airport, Amsterdam Airport Schiphol, and Los Angeles International Airport followed. All of these airports are international hubs that passengers from around the world pass through on their way to all kinds of destinations. Flyers waiting for connecting planes at these airports should have no trouble with internet speeds. In case of video calls, upload speeds are even faster than downloads at all of these airports, and San Francisco and SeaTac had the fastest uploads on the list. There is a wide gap in median speeds between the free airport Wi-Fi at Los Angeles International Airport and the rest of the airports on our list.

Denver International has their Wi-Fi split between two SSIDs that serve different spectrum bands, both of which showed median download speeds between 44 and 46 Mbps. Connecting to the 5 GHz “- DEN Airport Free WiFi” will get you a faster median upload speed than “DEN Airport Free WiFi 2.4.” Charles de Gaulle also has two different SSIDs for their free airport Wi-Fi though travelers can select either, “*WIFI-AIRPORT” had slightly faster median speeds than “WIFI-AIRPORT-STANDARD.”

Turkey’s Istanbul Airport was next on the list with a median download speed of 31.08 Mbps and a median upload speed of 23.80 Mbps. Spain’s Madrid Barajas Airport was the top of the bottom of our list with a median download speed of 19.76 Mbps over free airport Wi-Fi.

Four of the bottom five airports on our list were in China. Shanghai Hongqiao International Airport was faster than the other Chinese airports on the list with a median download speed of 14.69 Mbps. Shenzhen Bao’an International Airport and Beijing Capital International Airport were next on our list and showed nearly identical median download and upload speeds over free airport Wi-Fi. Chengdu Shuangliu International Airport showed slightly slower download and upload speeds than both. Mexico City International Airport in Mexico had the slowest median download and upload speeds over free airport Wi-Fi of any airport on this list.

Wi-Fi in airport lounges is often faster than free airport Wi-Fi

Free Wi-Fi is very nice to have for catching up on your life back home or reliving the glory of your vacation pics as you upload them to your social media accounts, but if you’re looking for the fastest Wi-Fi in an airport, you may want to look into other options. In many cases we found that airport lounges had faster Wi-Fi, like the United Club in Chicago and San Francisco which boasted median download speeds of 246.17 Mbps and 244.37 Mbps, respectively, during Q1 2022. The fastest club Wi-Fi download speed at LAX was at the Alaska Lounge (238.59 Mbps).

Outside the U.S., Wi-Fi speeds at airport lounges ranged dramatically. The following lounges all showed faster median download speeds than the free Wi-Fi at their respective airports during Q1 2022: the Plaza Premium Lounge in Dubai (148.96 Mbps), the Grand Lounge Elite in Mexico City (125.12 Mbps), Privium at Amsterdam’s Schiphol (121.05 Mbps), the Emirates Lounge at Paris’ Charles de Gaulle (93.31 Mbps), and the Sala VIP Puerta de Alcalá in Madrid (50.28 Mbps).

This stronger performance at airport lounges should be expected because it’s much easier to configure Wi-Fi over a small area like a single airport lounge than it is to serve an entire airport with multiple terminals. Patrons of airport lounges are also paying for the privilege, whether by the day or the year, so their expectations are higher. We did not always find this to be the case, however, so take a Speedtest® if you feel like you are not getting what you are paying for.

We were glad to see that travelers at all these airports have fast enough Wi-Fi to stream video on mobile and that there are other options available for those who need faster internet. Airports have had a lot to focus on in the last couple of years and Wi-Fi was not at the top of the list. We hope that will change as passenger volumes return to normal. If you’re traveling this summer, take a Speedtest at the airport to see how your experience compares.

Ookla retains ownership of this article including all of the intellectual property rights, data, content graphs and analysis. This article may not be quoted, reproduced, distributed or published for any commercial purpose without prior consent. Members of the press and others using the findings in this article for non-commercial purposes are welcome to publicly share and link to report information with attribution to Ookla.