 Speedtest Global IndexTM Market Analyses from Ookla® identify key data about internet performance in countries across the world. This quarter we’ve provided updated analyses for 37 markets that includes details on fastest mobile and fixed broadband providers, performance of most popular devices and chipsets and internet speeds in cities. Click a country on the list below to see highlights or scroll through the article to learn what Speedtest Intelligence® revealed in all 37 markets:
Africa and the Middle East
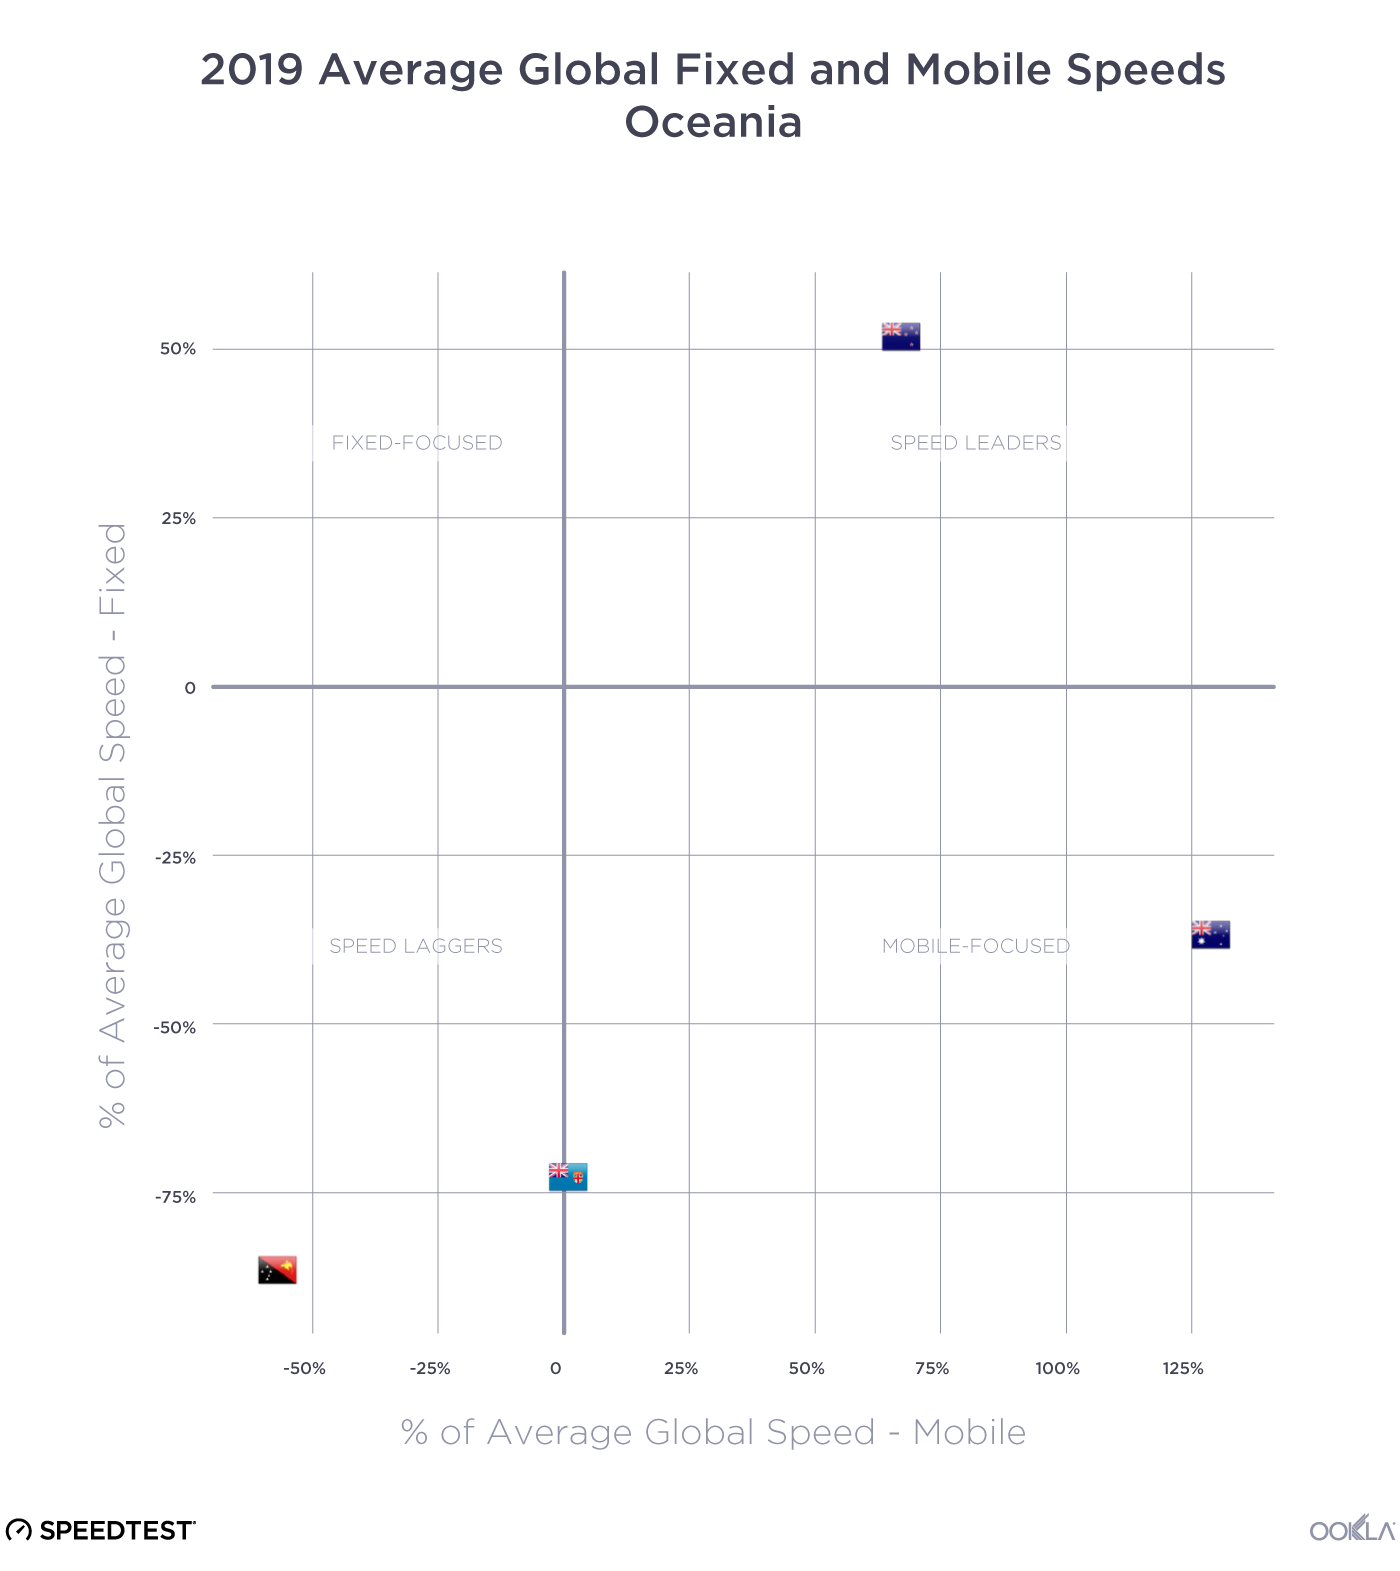
Asia and Oceania
Europe
North and South America
Africa and the Middle East
Algeria
- For the second quarter in a row, mobile provider Ooredoo had the highest Speed Score™ (24.27) and Consistency Score™ (84.5%) in Algeria during Q2 2021.
- Apple devices achieved a mean download speed of 26.37 Mbps during Q2 2021, 26.4% faster than Apple’s speeds in Q1 2021 (20.86 Mbps).
- The Apple iPhone 12 Pro Max 5G was the fastest popular device in Algeria with a mean download speed of 38.15 Mbps.
Jordan
- Fixed broadband provider Orange had the highest Speed Score (70.99) and Consistency Score (72.6%) in Jordan during Q2 2021.
- Umniah achieved the fastest mobile Speed Score at 34.28 and best Consistency Score at 93.4%.
- Amman had the fastest median fixed broadband download and upload speeds among the most populous cities in Jordan at 43.27 Mbps and 40.29 Mbps, respectively.
- Among popular mobile devices, Apple’s iPhone 12 Pro Max 5G narrowly beat out the iPhone 12 Pro 5G for fastest median download and upload speeds at 36.06 Mbps and 17.90 Mbps.
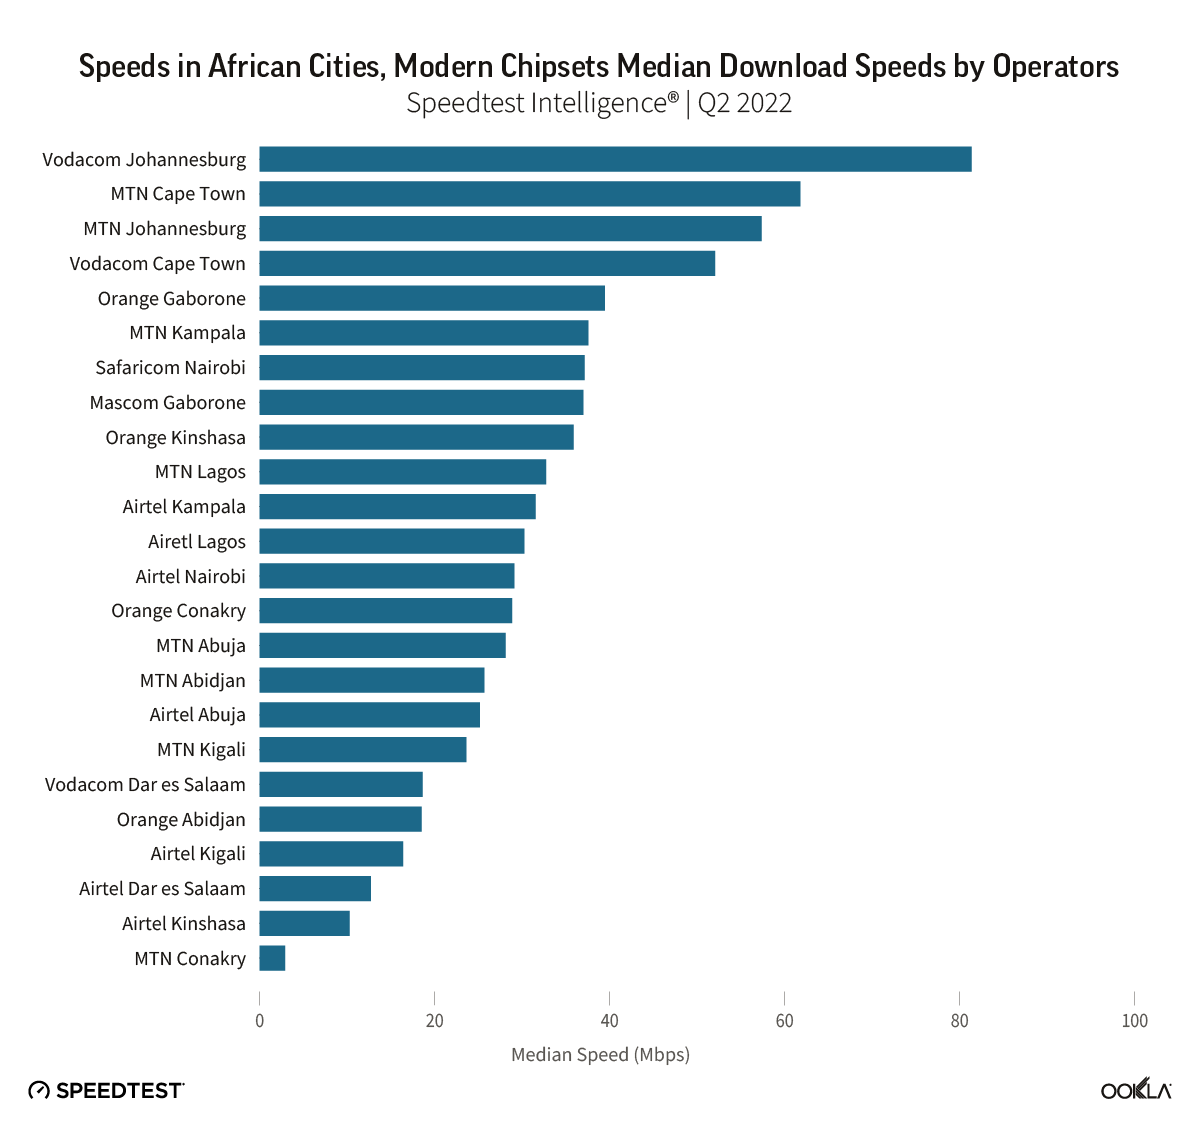
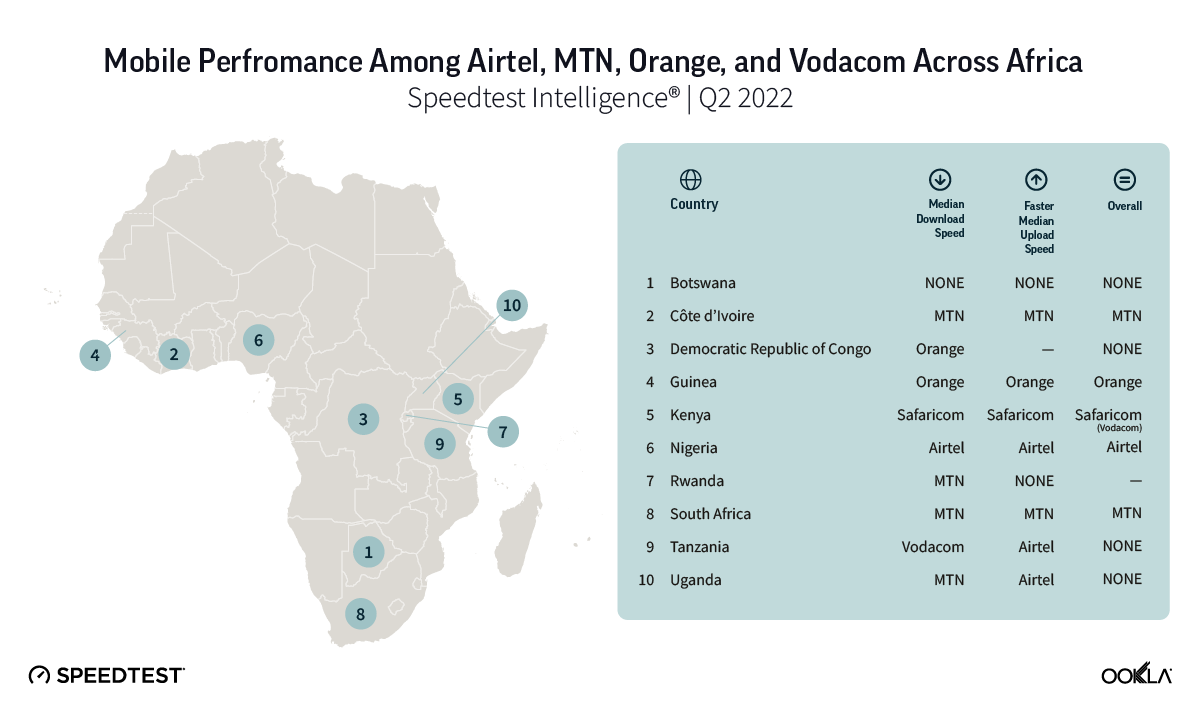
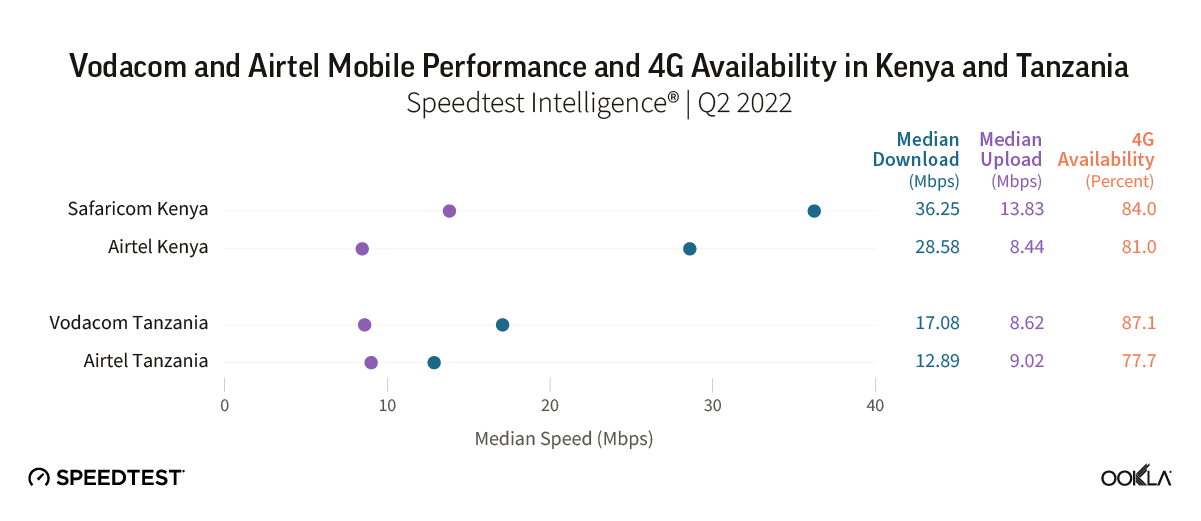
Kenya
- Mobile provider Safaricom had the highest Speed Score (27.54) and Consistency Score (84.0%) in Kenya during Q2 2021, though both these scores were slightly lower than in Q1 2021.
- For fixed broadband, Faiba was the provider that had the best Speed Score (23.19) and Consistency Score (43.9%) in Kenya during Q2 2021.
- Mombasa had the fastest mean mobile download and upload speeds in Kenya’s most populous cities at 32.12 Mbps and 17.13 Mbps, respectively.
- Eldoret had the fastest mean fixed broadband download speed in Kenya during Q2 2021 at 23.68 Mbps. Nairobi dropped three places from the fastest city for mean fixed broadband download speed during Q1 2021.
Morocco
- Fixed broadband provider Orange beat out Q1 2021 winner Maroc Telecom for fastest provider in Morocco with a Speed Score of 19.27, a 35.0% increase from Q1 2021.
- For fixed broadband, Maroc Telecom continued to have the best Consistency Score at 32.4% during Q2 2021.
- On mobile, Maroc Telecom achieved the best Speed Score (59.24) and Consistency Score (92.6%) during Q2 2021.
- Salé surpassed Marrakesh as the fastest city among Morocco’s most populous cities with the fastest mobile download and upload speeds at 40.78 Mbps and 13.80 Mbps, respectively.
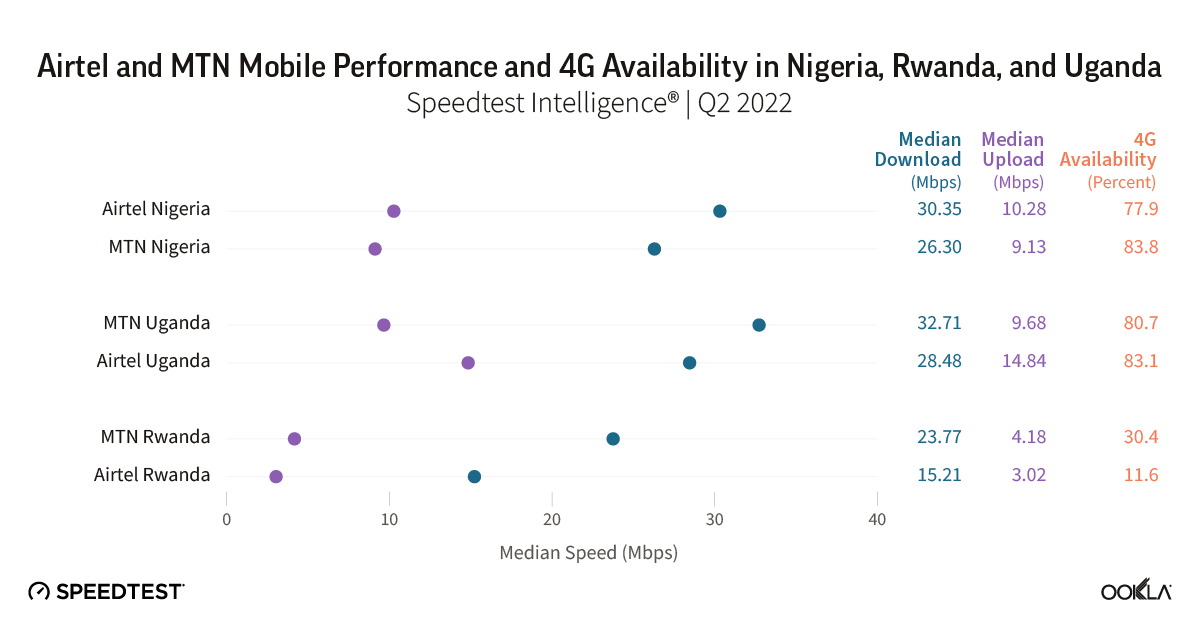
Nigeria
- For the second quarter in a row, mobile provider Airtel had the fastest Speed Score in Nigeria at 28.82 during Q2 2021. While MTN was second, it improved its Speed Score 37.9% quarter over quarter, 18.70 to 25.78.
- MTN edged out Airtel’s Q1 2021 top spot for best Consistency Score on mobile during Q2 2021, 83.4% to Airtel’s 82.5%.
- Fixed broadband provider ipNX continued to have the best Speed Score (19.25) and Consistency Score (39.6%) in Nigeria during Q2 2021.
- Port Harcourt continued to have the best mobile mean download speeds of any Nigerian city at 26.34 Mbps, but Kano made huge strides forward, improving its download speed by 61.8% over Q1 2021.
Qatar
- Ooredoo had the best mobile and fixed broadband Speed Scores in Qatar during Q2 2021 at 149.01 and 69.45, respectively.
- 5G performance was extremely competitive with Ooredoo achieving the fastest median 5G download speed at 393.89 Mbps, while Vodafone achieved 354.27 Mbps.
- Ooredoo also had the best fixed broadband Consistency Score at 81.5%.
- Vodafone had the best mobile Consistency Score at 93.7%, edging out Ooredoo’s 92.9%.
- Umm Salal Muhammed had the fastest median mobile and fixed broadband download speeds in Qatar at 147.65 Mbps and 80.57 Mbps, respectively.
- Speedtest Intelligence reveals that among popular devices, Samsung’s Galaxy S21 Ultra 5G achieved the fastest median mobile download speed at 284.32 Mbps, edging out Apple’s iPhone 12 Pro Max 5G (278.42 Mbps).
South Africa
- Speedtest Intelligence shows Cool Ideas had the fastest fixed broadband Speed Score (45.76) and Consistency Score (65.4%) during Q2 2021. That was an increase in Speed Score of 21.1% from Q1 2021.
- Among mobile providers, MTN had the fastest Speed Score (60.44) and best Consistency Score (90.5%).
- Apple devices had the fastest combined mean download speed at 52.59 Mbps and fastest mean upload speed at 12.22 Mbps during Q2 2021. The iPhone 12 Pro Max 5G took top honors as the fastest popular device, achieving a mean download speed of 93.36 Mbps.
- Johannesburg had the fastest mean fixed broadband and mobile download speeds during Q2 2021 at 61.85 Mbps and 58.06 Mbps, respectively.
Tunisia
- During Q2 2021, Ooredoo achieved the highest mobile Speed Score in Tunisia at 46.47.
- Tunisie Telecom edged out Ooredoo for the highest fixed broadband Speed Score with 9.07 and 8.28, respectively.
- Apple’s iPhone 12 Pro Max 5G had the fastest mean download speed in Tunisia among popular devices during Q2 2021 at 73.21 Mbps.
- Among popular chipsets, Qualcomm’s Snapdragon X55 5G had the fastest mean download speed at 70.43 Mbps.
- Sfax had the fastest mean mobile download speed in Tunisia during Q2 2021 at 45.53 Mbps.
Turkey
- Speedtest Intelligence revealed mobile provider Turkcell had the highest Speed Score and Consistency Score in Turkey during Q2 2021 at 61.39 and 93.2%, respectively.
- For fixed broadband, Turksat Kablo had the highest Speed Score (35.67).
- During Q2 2021, Turknet had the highest Consistency Score for fixed broadband at 66.6%.
- Istanbul had the fastest mean fixed broadband and mobile download speed at 40.16 Mbps and 50.21 Mbps, respectively.
- Among top device manufacturers, Apple beat out Samsung for fastest mean download speed at 51.62 Mbps to 41.69 Mbps.
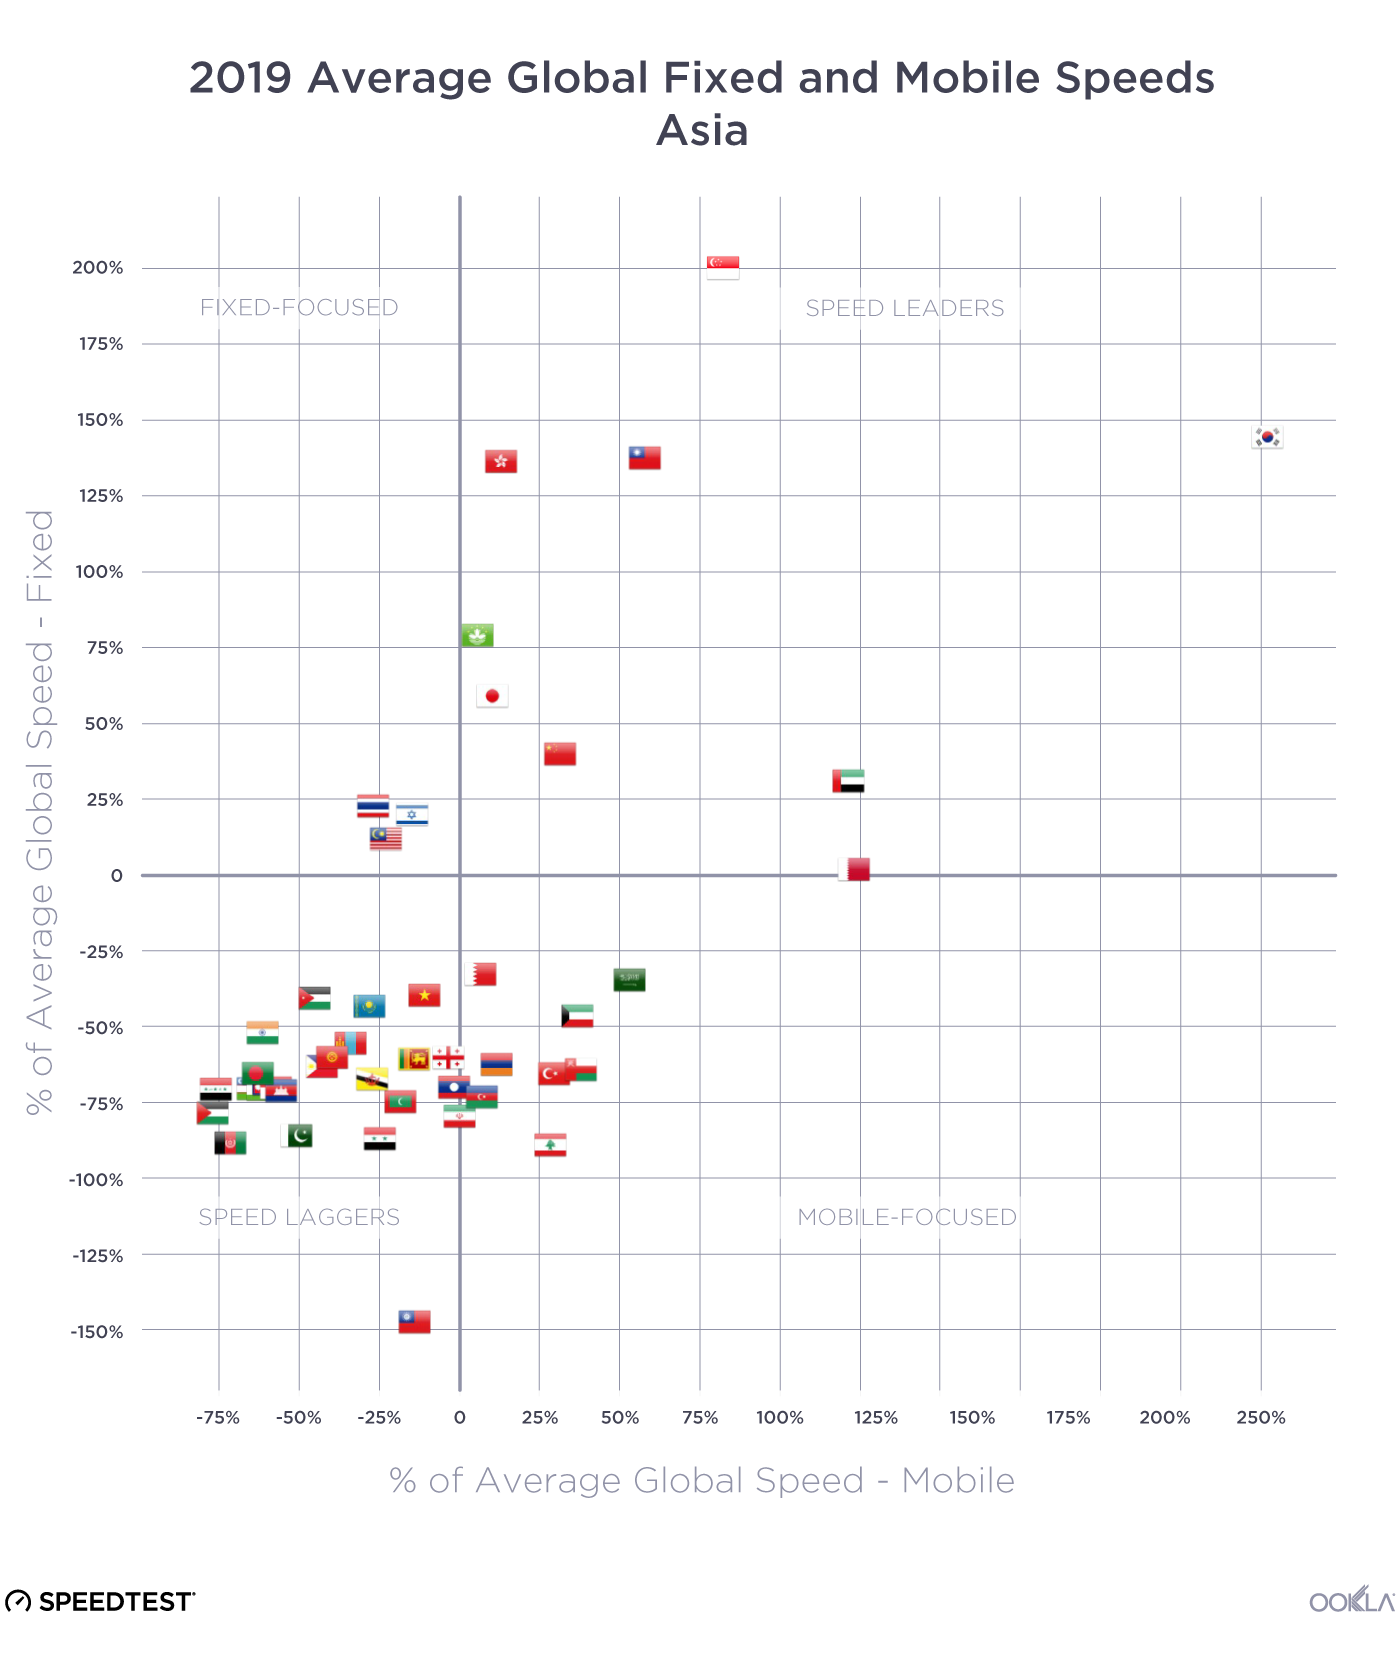
Asia and Oceania
China
- According to Speedtest Intelligence, China Telecom was the fastest fixed broadband provider in China during Q2 2021 with a Speed Score of 117.02, 9.3% higher than Q1 2021.
- However, China Mobile continued to have the highest Consistency Score in China for fixed broadband during Q2 2021 at 90.0%, edging out China Telecom’s 86.8% and China Unicom’s 86.5%.
- China Mobile achieved the highest Speed Score (113.06) and Consistency Score (92.1%) among China’s top mobile providers during Q2 2021.
- During Q2 2021, China Telecom achieved a median 5G download speed of 304.55 Mbps, edging out China Mobile’s 303.44 Mbps. China Unicom was third at 292.04 Mbps.
- Among top device manufacturers, Huawei had the fastest median download speed at 86.33 Mbps in China during Q2 2021. Vivo followed at 56.68 Mbps, then Xiaomi (56.48 Mbps), Oppo (55.35 Mbps) and Apple (49.65 Mbps).
- Among popular devices, Huawei also dominated. The Huawei P40 Pro 5G had the fastest median download speed in China during Q2 2021 at 287.18 Mbps.
- During Q2 2021, Huawei’s Kirin 9000 5G was the fastest chipset in China, achieving a median download speed of 284.74 Mbps.
- Tianjin had the fastest median fixed broadband download speed among China’s most populous cities at 199.91 Mbps, 10.7% faster than its first place Q1 2021 results.
- Hangzhou had the fastest median mobile download speed among China’s most populous cities at 72.97 Mbps, followed closely by Shenzhen at 70.74 Mbps and Nanjing at 69.22 Mbps.
Hong Kong (SAR)
- For the second quarter in a row, China Mobile Hong Kong was the fastest mobile operator in Hong Kong, earning a Speed Score of 72.21 in Q2 2021, 10.8% higher than Q1 2021.
- China Mobile Hong Kong also blazed ahead of the competition for the fastest 5G download speed, achieving a median speed of 218.60 Mbps during Q2 2021, 7.2% faster than its Q1 2021 results. Mobile provider 3 followed at 165.35 Mbps, csl at 134.75 Mbps and SmarTone at 124.31 Mbps.
- Among top manufacturers during Q2 2021, Samsung had the fastest median download speed at 44.68 Mbps.
- Samsung devices also took the top four spots for fastest popular devices in Hong Kong during Q2 2021 with the Galaxy S20 Ultra 5G achieving the top spot at 124.25 Mbps, edging out the Galaxy S21 Ultra 5G’s 123.28 Mbps.
- During Q2 2021, Qualcomm’s Snapdragon 888 5G achieved the fastest median download speed among modern chipsets at 111.91 Mbps.
Indonesia
- According to Speedtest Intelligence, Biznet was Indonesia’s fastest fixed broadband provider during Q2 2021, earning a Speed Score of 40.66. MyRepublic was second at 35.63.
- Biznet also had the highest Consistency Score in Indonesia during Q2 2021, edging out MyRepublic 66.6% to 63.5%.
- Telkomsel was the fastest major mobile provider in Indonesia during Q2 2021, earning a Speed Score of 28.02. Telkomsel also achieved the top Consistency Score at 84.1%, beating out IM3 Ooredoo’s 83.5%.
- Jakarta had the fastest mean fixed broadband download speed of Indonesia’s most populous cities at 32.86 Mbps, while Tangerang achieved the fastest mean mobile download speed at 24.69 Mbps.
Malaysia
- During Q2 2021, Speedtest Intelligence reveals that TIME was the fastest fixed broadband provider in Malaysia, earning a Speed Score of 116.36. TIME also achieved the highest Consistency Score (86.7%).
- On mobile, Digi edged out Maxis for the fastest mobile provider, earning a Speed Score of 30.20 to Maxis’ 29.92. U Mobile was third at 27.40.
- Apple earned the top spot as Malaysia’s fastest device manufacturer during Q2 2021, with Apple devices achieving a mean download speed of 34.22 Mbps. Samsung was second at 28.77 Mbps and Huawei third at 27.68 Mbps.
- Among Malaysia’s most populous cities, Nusajaya had the fastest mean fixed broadband speed during Q2 2021, achieving 125.88 Mbps download and 81.29 Mbps upload. Petaling Jaya was second, achieving 122.91 Mbps download and 82.56 Mbps upload.
- Nusajaya also had the fastest mean mobile download speed at 38.51 Mbps during Q2 2021.
Singapore
- Speedtest Intelligence shows ViewQuest was the fastest fixed broadband provider in Singapore in Q2 2021, achieving a Speed Score of 268.70.
- During Q2 2021, Singtel was the fastest mobile provider in Singapore, achieving a Speed Score of 83.83.
- Singtel also blew the competition away for fastest median 5G download speed at 189.55 Mbps during Q2 2021. M1 was second at 110.43 Mbps.
- Apple edged out Samsung for fastest device manufacturer during Q2 2021, with Apple devices achieving a mean download speed of 87.66 Mbps to Samsung’s 85.48 Mbps. Oppo followed in third with 82.10 Mbps.
Taiwan
- Speedtest Intelligence® reveals Chunghwa Telecom was the fastest mobile operator among top providers in Taiwan in Q2 2021 with a Speed Score of 66.47 on modern chipsets — edging out FarEasTone’s 64.46.
- During Q2 2021, Chunghwa Telecom surpassed FarEasTone as the fastest 5G provider in Taiwan. Chunghwa Telecom achieved a blazing median download speed of 471.73 Mbps — 42.2% faster than its Q1 2021 median download speed.
- FarEasTone had the highest Consistency Score in Taiwan during Q2 2021 at 92.1%. Chunghwa Telecom followed at 89.4% and Taiwan Mobile was third at 87.5%.
- Among top device manufacturers during Q2 2021, Apple devices achieved the fastest mean download speed at 79.30 Mbps, edging out Oppo (77.53 Mbps) and Samsung (74.23 Mbps).
- The Sony Xperia 1 II 5G had the fastest mean download speed at 235.44 Mbps during Q2 2021.
Vietnam
- Viettel once again claimed the top spot as Vietnam’s fastest mobile and fixed broadband provider during Q2 2021, earning a mobile Speed Score of 44.16 and fixed broadband Speed Score of 66.77.
- Viettel also achieved the best fixed broadband Consistency Score at 80.9%, tightly edging out FPT Telecom’s 80.0% and Vinaphone’s 79.6% for the fastest mean fixed broadband download speed
- Vinaphone had the highest mobile Consistency Score at 94.1%.
- Apple’s iPhone 12 Pro 5G had the fastest mean download speed at 99.43 Mbps.
- Ho Chi Minh City overtook the top spot for the fastest mean fixed broadband download speed among Vietnam’s most populous cities with 77.14 Mbps (69.92 Mbps upload).
- Hanoi edged out Ho Chi Minh City (43.70 Mbps) and Da Nang (43.22 Mbps) for fastest mean mobile download speed at 43.83 Mbps.
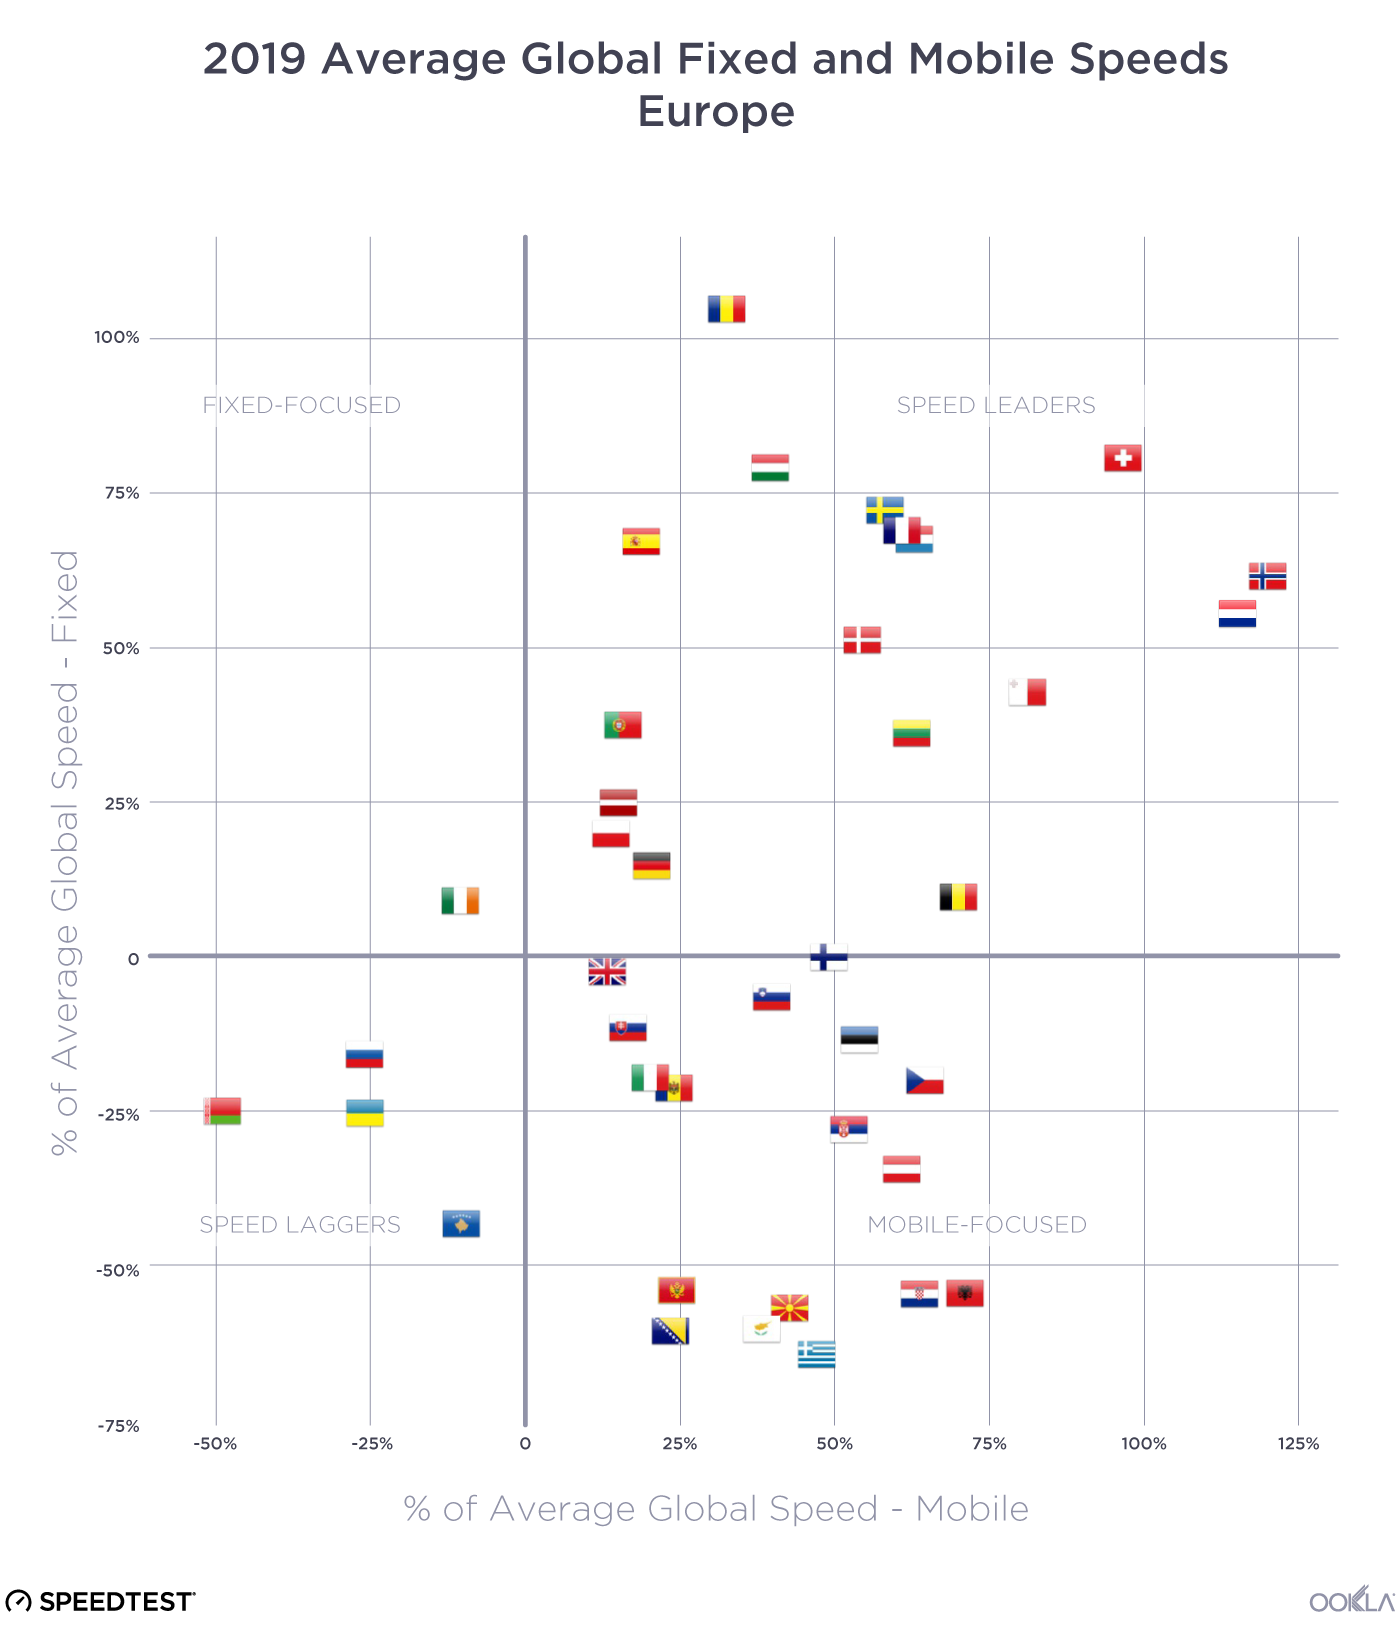
Europe
Austria
- Magenta retained its top spot as Austria’s fastest fixed broadband provider, increasing its Speed Score 28.8% from Q1 2021 from 123.45 to 158.94 in Q2 2021.
- Magenta also had the highest Consistency Score at 88.8% for fixed broadband in Q2 2021.
- A1 was the fastest mobile provider in Austria during Q2 2021, achieving a Speed Score of 72.64. yesss! followed at 62.49.
- For the second quarter in a row, yesss! narrowly edged out A1 for the highest mobile Consistency Score in Austria with yesss! achieving 93.7% and A1 achieving 93.4%. Magenta Telekom ad 3 followed at 90.5%.
Belgium
- During Q2 2021 — much like Q1 2021 — Telenet and VOO had a fierce competition for Belgium’s fastest fixed broadband provider. However, Telenet earned the top spot again, achieving a Speed Score of 104.24 to VOO’s 102.64.
- VOO also challenged Telenet for the highest Consistency Score for fixed broadband providers, but Telenet edged VOO out for the top place, 87.8% to 86.8%.
- Among mobile providers, Telenet fended off competition from BASE as the fastest mobile provider, earning a mobile Speed Score of 72.34 to BASE’s 68.50.
- Antwerp overtook Ghent for the fastest median fixed broadband download speed 81.31 Mbps to Ghent’s 80.13 Mbps.
- However, Ghent retained its top place for fastest median mobile download speed among Belgium’s most populous cities achieving a median speed of 72.56 Mbps during Q2 2021.
Czechia
- Speedtest Intelligence reveals T-Mobile was Czechia’s fastest mobile provider during Q2 2021, earning a Speed Score of 60.73.
- However, Vodafone claimed the best mobile Consistency Score during Q2 2021, earning 94.6% to O2’s 91.1%.
- There was no statistical winner for fastest median 5G download speed in Czechia during Q2 2021, though O2 achieved a median download speed of 128.01 Mbps and T-Mobile achieved 124.69 Mbps.
- Vodafone dominated as Czechia’s fastest fixed broadband provider during Q2 2021. Vodafone achieved a Speed Score of 100.26.
- Vodafone also had the best Consistency Score for fixed broadband during Q2 2021 at 79.4%.
- Pilsen had the fastest mean fixed broadband speeds among Czechia’s most populous cities, achieving a mean download of 111.01 Mbps and a mean upload of 82.82 Mbps.
Denmark
- During Q2 2021 in Denmark, Fastspeed was the fastest fixed broadband provider, earning a Speed Score of 303.16 — an increase of 47.7% from Q1 2021. Hiper was second at 231.14 and Fibia third at 164.80.
- YouSee once again earned the top spot as Denmark’s fastest mobile provider during Q2 2021, achieving a Speed Score of 91.19.
- An analysis of performance on some of the most popular phones in Denmark revealed the iPhone 12 Pro Max 5G had the fastest median download speed during Q2 2021 at 111.80 Mbps. The iPhone Pro 5G was second at 109.79 Mbps, edging out the iPhone 12 5G at 109.63 Mbps.
Finland
- According to Speedtest Intelligence, DNA retained its top spot as Finland’s fastest mobile provider in Q2 2021, earning a Speed Score of 68.20. DNA also edged out Telia for the highest Consistency Score, achieving 90.9% to Telia’s 90.0%.
- Telia overtook DNA in Q2 2021 as Finland’s fastest 5G provider, achieving a median download speed of 304.22 Mbps to DNA’s 276.20 Mbps.
- Telia retained its top spot as the fastest fixed broadband provider during Q2 2021, increasing its Speed Score 11.2% from Q1 2021. Telia was also the most consistent, achieving a Consistency Score of 82.7%.
- Among popular device manufacturers, OnePlus had the fastest median download speed in Finland during Q2 2021 at 67.23 Mbps. However, the Samsung Galaxy S21 Ultra 5G had the fastest median download speeds among major devices at 121.57 Mbps.
France
- Speedtest Intelligence revealed a fierce competition for France’s fastest fixed broadband provider during Q2 2021, though Orange narrowly edged out Free with a Speed Score of 117.15 to 115.89.
- SFR achieved the highest Consistency Score at 68.2%.
- Orange earned the top spot as France’s fastest and most consistent mobile provider, earning a mobile Speed Score of 81.00 and a Consistency Score of 89.9%.
- Orange also blew away the competition as France’s fastest 5G provider by achieving a median 5G download speed of 345.10 Mbps. SFR was next fastest at 204.98 Mbps.
- Lyon achieved the fastest median fixed broadband download and upload speeds at 127.51 Mbps and 93.46 Mbps, respectively. Nice had the fastest median mobile download speed at 64.63 Mbps.
Germany
- According to Speedtest Intelligence, Vodafone was Germany’s fastest fixed broadband provider during Q2 2021, earning a Speed Score of 120.68.
- 1&1 edged out Vodafone for the highest Consistency Score, 80.4% to Vodafone’s 79.3%.
- For mobile providers, Telekom achieved the highest Speed Score (76.79) and Consistency Score (91.7%) during Q2 2021.
- O2 was the fastest 5G provider during Q2 2021 earning the fastest median 5G download speed at 172.24 Mbps. Telekom followed at 154.30.
- The iPhone 12 Pro 5G had the fastest median download speed among popular devices in Germany during Q2 2021, edging out the iPhone 12 Pro Max 5G 92.25 Mbps to 91.94 Mbps.
Hungary
- Vodafone overtook DIGI as Hungary’s fastest fixed broadband provider in Q2 2021, achieving an 8.6% increase in Speed Score from 137.06 in Q1 2021 to 148.79. Vodafone retained the top spot for highest Consistency Score at 87.2% during Q2 2021.
- Magyar Telekom retained its top spot as Hungary’s fastest and most consistent mobile provider during Q2 2021, earning a Speed Score of 52.59 and Consistency Score of 90.9%.
- OnePlus overtook Apple during Q2 2021 as the fastest device manufacturer, with OnePlus devices achieving a combined median download speed of 47.29 Mbps to Apple’s 41.81 Mbps.
- However, Apple’s iPhone 12 Pro Max 5G achieved the fastest median download speed among popular devices during Q2 2021, with an increase in download speed of 17.3% from 70.12 Mbps in Q1 2021 to 82.22 Mbps in Q2 2021.
Latvia
- Speedtest Intelligence revealed that Balticom was the fastest and most consistent fixed broadband provider in Latvia during Q2 2021 achieving a Speed Score of 171.56 and Consistency Score of 90.5%.
- LMT was the fastest provider in Latvia during Q2 2021 with a Speed Score of 41.13.
- Tele2 narrowly edged out BITE and LMT as Latvia’s most consistent provider, earning a Consistency Score of 86.0% to BITE’s 85.1% and LMT’s 83.3%.
- Olaine had the fastest median fixed broadband download and upload speeds, 94.16 Mbps and 94.51 Mbps, respectively.
Luxembourg
- Tango retained its top spot as Luxembourg’s fastest fixed broadband provider during Q2 2021 by achieving a Speed Score of 125.73, an increase of 4.5% over Q1 2021.
- Tango and Eltrona tied for the highest Consistency Score during Q2 2021 at 86.3%.
- POST again was the fastest mobile provider in Luxembourg during Q2 2021, achieving an 18.3% increase in Speed Score from 86.31 in Q1 2021 to 102.09 in Q2 2021. POST also remained the most consistent provider with a Consistency Score of 96.3%.
- Among Luxembourg’s most populous cities, Differdange achieved the fastest median fixed broadband download and upload speeds at 131.26 Mbps and 93.32 Mbps, respectively.
- Ettelbruck had the fastest median mobile download and upload speeds at 117.76 Mbps and 21.64 Mbps, respectively.
Malta
- Melita retained its top spot as Malta’s fastest and most consistent fixed broadband provider during Q2 2021, earning a Speed Score of 113.64 and Consistency Score of 83.9%.
- GO was Malta’s fastest and most consistent mobile provider during Q2 2021, achieving a Speed Score of 56.36 and Consistency Score of 92.8%.
- Among popular devices, Apple’s iPhone 12 Pro Max 5G achieved the fastest mean download speed at 75.81 Mbps.
Serbia
- SBB retained its top spot as Serbia’s fastest and most consistent fixed broadband provider during Q2 2021 with a Speed Score of 81.09 and Consistency Score of 81.8%.
- A1 knocked Telenor out of the top place during Q2 2021 as Serbia’s fastest mobile provider, achieving a Speed Score of 54.26 to Telenor’s 49.99.
- A1 and Telenor tied for the most consistent provider by earning a Consistency Score of 92.5%. mts trailed at 91.0%
- The fastest chipset in Serbia during Q2 2021 was Qualcomm’s Snapdragon X55 5G, which had a median download speed of 74.21 Mbps. Samsung’s Exynos 2100 was second at 57.97 Mbps and Hisilicon’s Kirin 990 at 57.49 Mbps.
Slovakia
- Telekom knocked Orange out of first place as Slovakia’s fastest mobile operator during Q2 2021 with a Speed Score of 58.17 to Orange’s 56.22. Telekom increased its Speed Score 18.5% from Q1 2021 to Q2 2021.
- UPC retained its top spot as Slovakia’s fastest and most consistent fixed broadband provider with a Speed Score of 139.35 — an increase of 23.1% from Q1 2021 — and a Consistency Score of 87.2%.
- The Apple iPhone 12 Pro Max 5G had the fastest median download speed among popular devices at 86.11 Mbps during Q2 2021, an increase of 33.3% over Q1 2021.
Spain
- DIGI sped ahead of the competition, earning its place as fastest and most consistent fixed broadband provider in Q2 2021 with a Speed Score of 259.90 and Consistency Score of 91.5%. Orange was second at 154.03, Movistar third (139.65) and Yoigo fourth (134.71).
- Movistar provided the fastest and most consistent mobile experience among Spanish mobile providers with a Speed Score of 58.47 and Consistency Score of 90.8%.
- Vodafone more than doubled its closest competitor as Spain’s fastest 5G provider by achieving a median download speed of 322.81 Mbps.
- Madrid had the fastest median fixed broadband download and upload speeds at 142.97 Mbps and 111.48, respectively, as well as the fastest median mobile download speed at 41.66 Mbps. Barcelona trailed closely behind for fixed broadband at 134.73 Mbps download and 104.54 Mbps upload, as well as for mobile download at 40.10 Mbps.
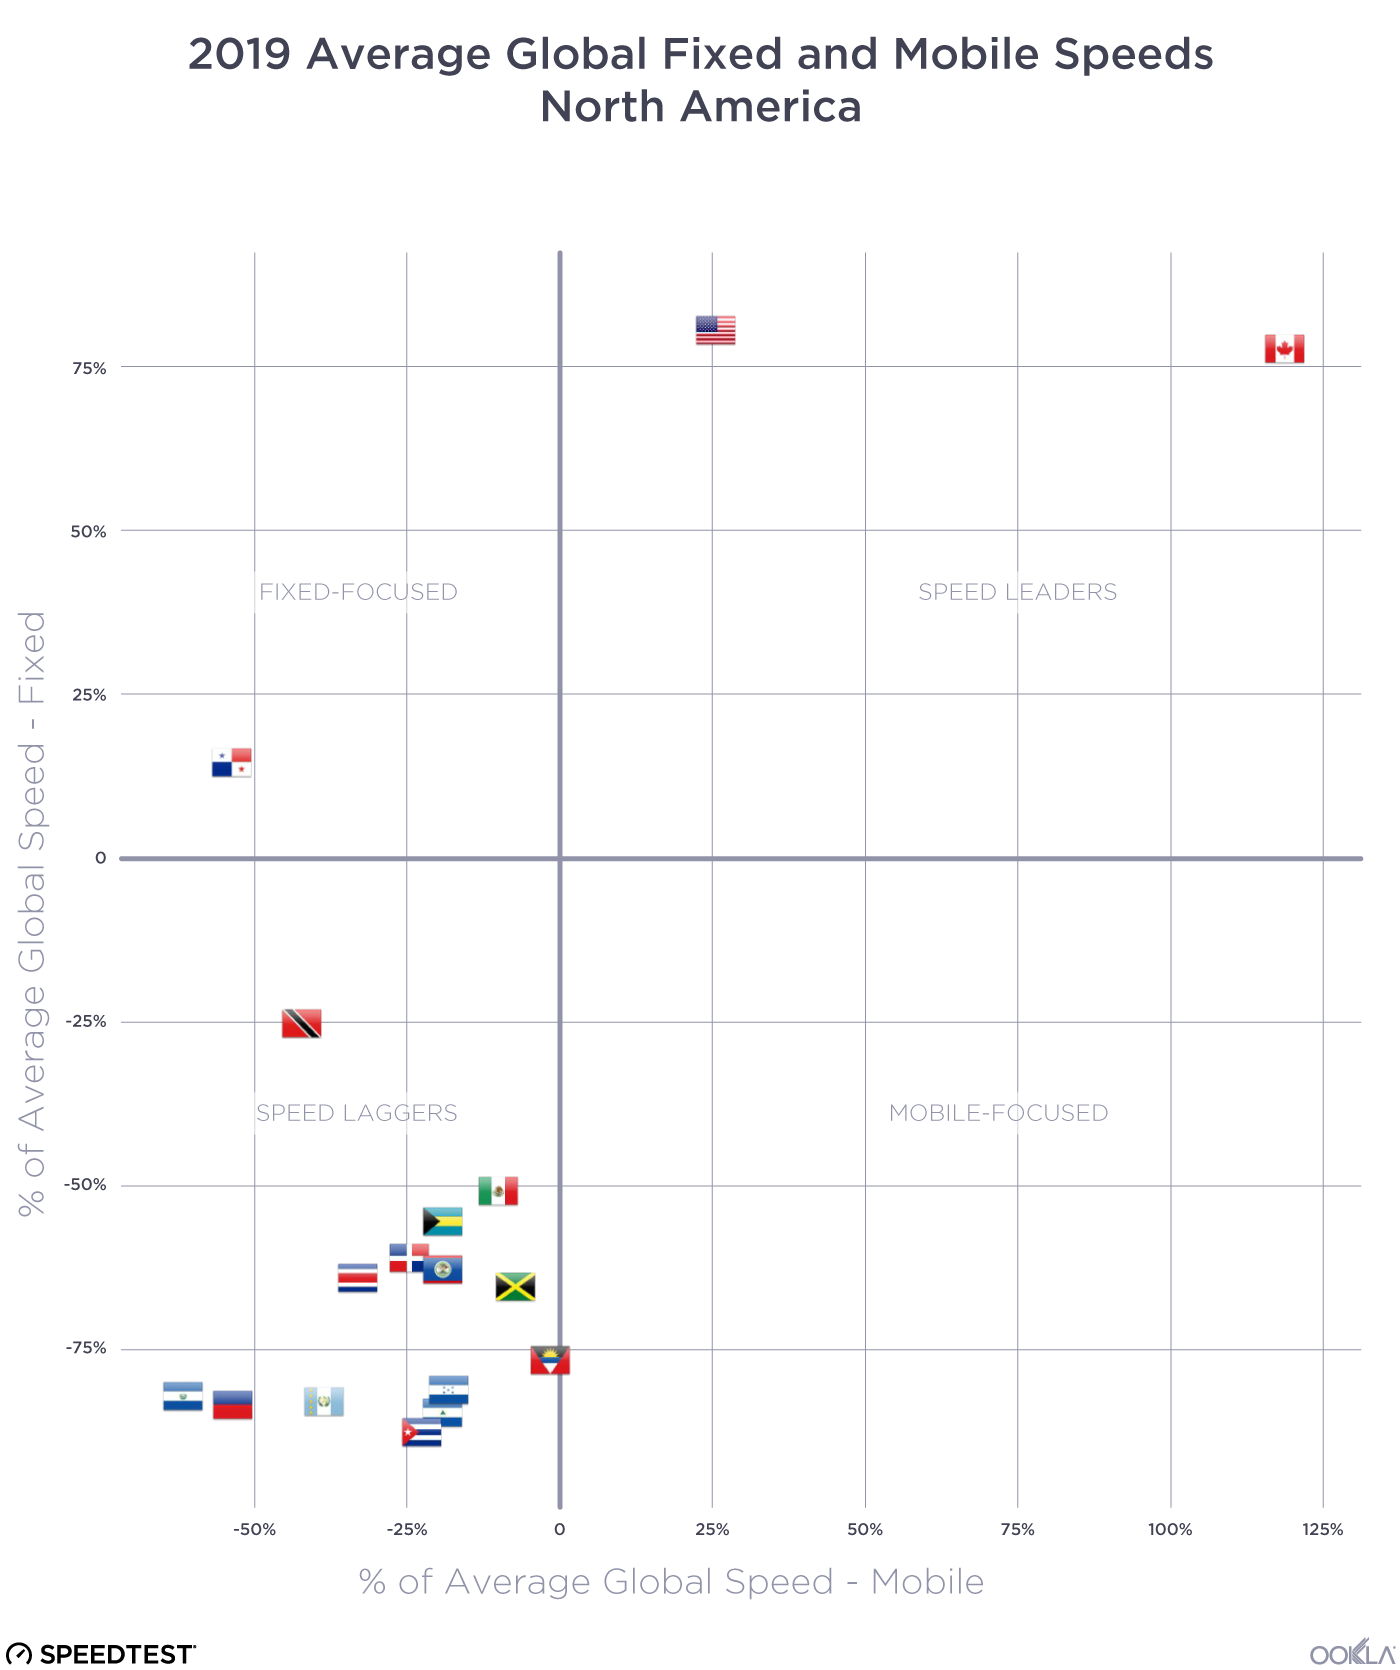
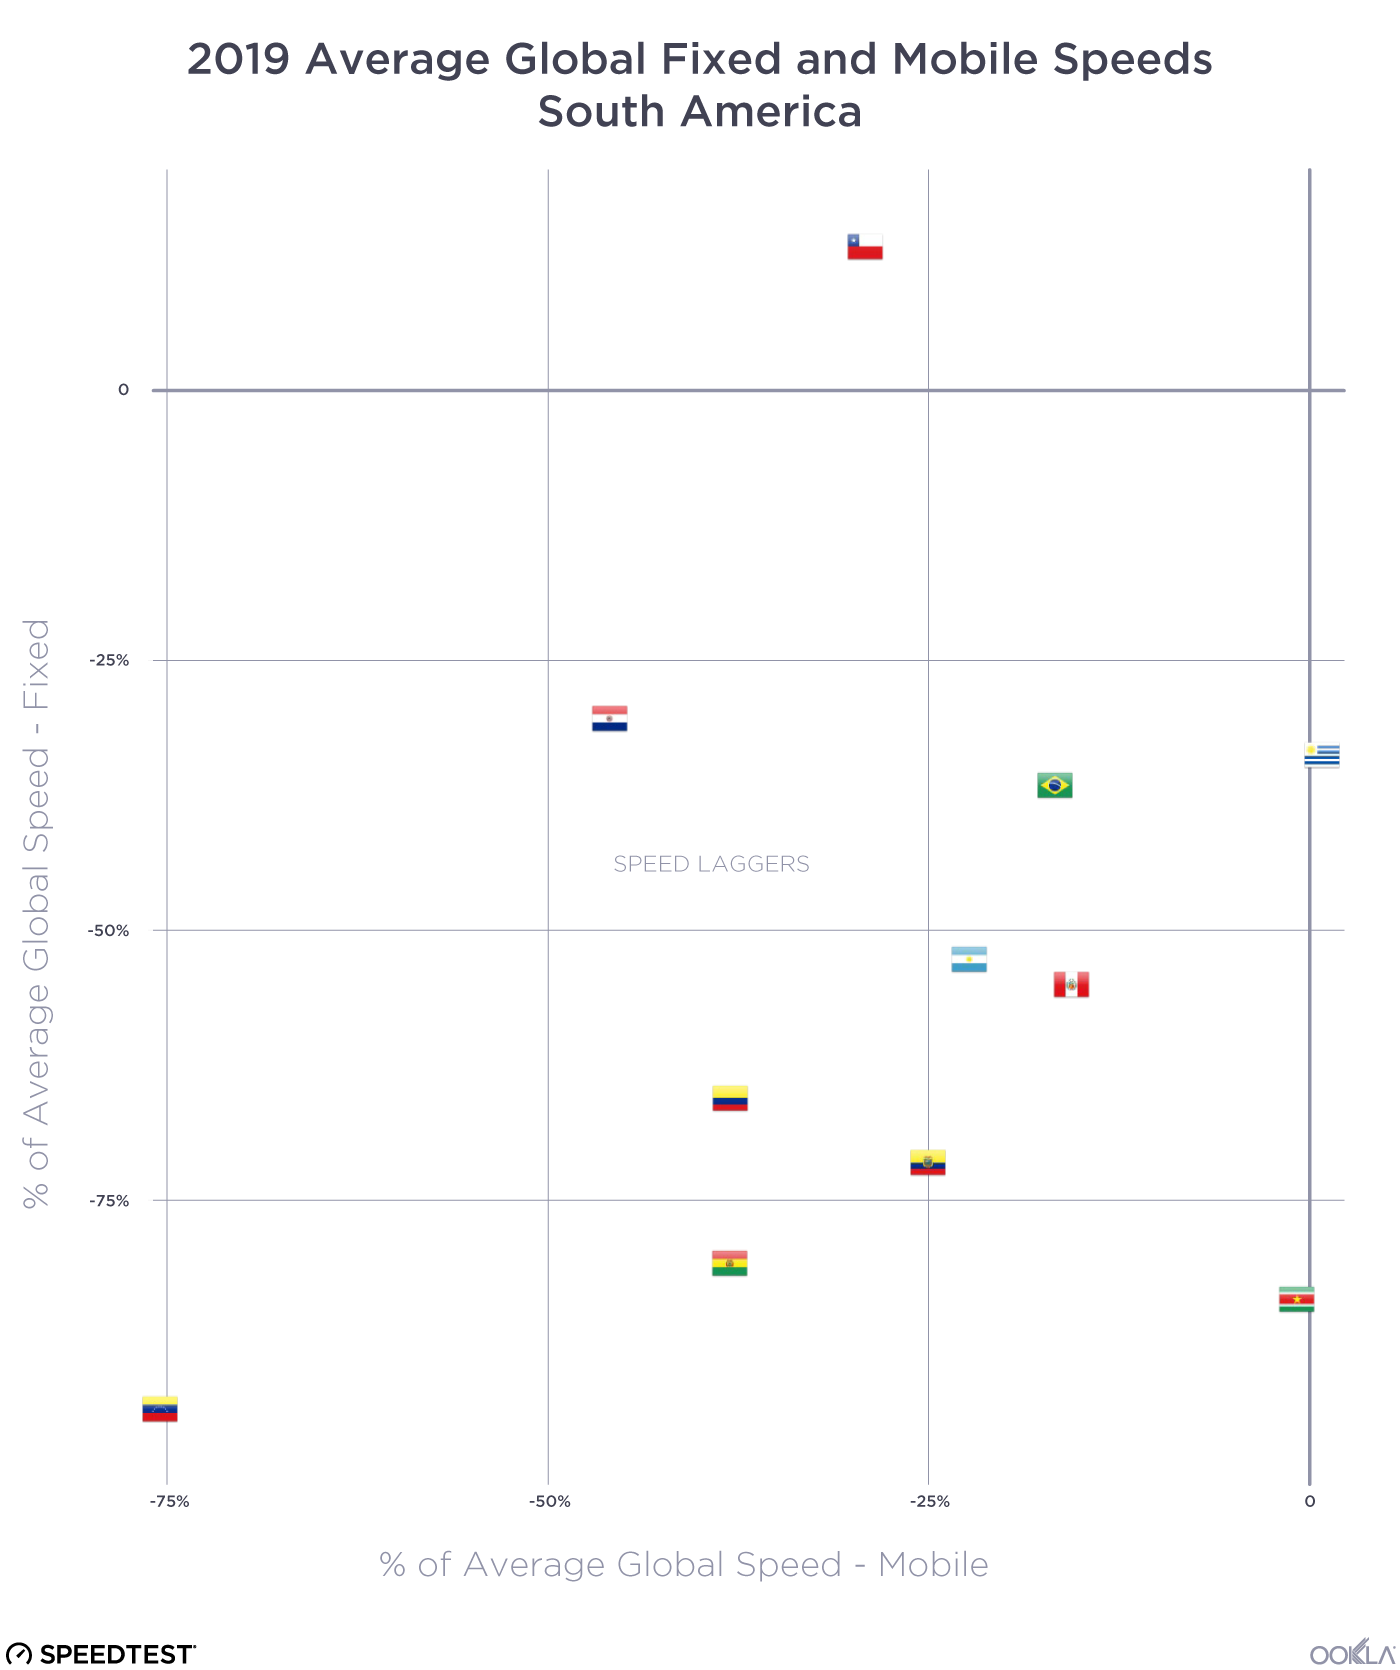
North and South America
Argentina
- Telecentro achieved the highest fixed broadband Speed Score (57.16) in Argentina during Q2 2021.
- Speedtest Intelligence revealed Personal was the fastest mobile operator in Argentina during Q2 2021 with a Speed Score of 38.49.
- Buenos Aires achieved the fastest mean fixed broadband download speed among Argentina’s most populous cities, recording a download speed of 77.79 Mbps.
- For mobile download speeds, La Plata recorded the fastest mean mobile download speed in Argentina at 40.28 Mbps during Q2 2021.
Brazil
- Speedtest Intelligence reveals Claro was the fastest and most consistent mobile operator in Brazil among top providers during Q2 2021, achieving the highest Speed Score of 42.61 and Consistency Score of 87.8%.
- Vivo was the fastest fixed broadband provider among top providers in Brazil in Q2 2021 with a Speed Score of 93.23.
- Among Brazil’s most populous cities, seven cities achieved mean fixed broadband download speeds of over 100 Mbps, with Goiânia having the fastest download and upload speeds at 130.15 Mbps and 76.98 Mbps, respectively.
- Brasilia had the fastest mean mobile download speed at 43.74 Mbps.
Canada
- Shaw and Rogers blazed above the competition for Canada’s fastest fixed broadband providers in Q2 2021, earning Speed Scores of 181.66 and 179.95, respectively.
- Rogers edged out Shaw for the highest Consistency Score in Canada during Q2 2021 by earning 89.0% to Shaw’s 87.0%.
- TELUS retained its top spot as the fastest mobile operator in Canada during Q2 2021, achieving a Speed Score of 82.93.
- Videotron also retained its top spot during Q2 2021 as Canada’s most consistent mobile operator, achieving a Consistency Score of 89.6%.
- Competition for the fastest median 5G download speed was competitive with no statistical winner during Q2 2021. Bell achieved a median download speed of 191.26 Mbps and TELUS achieved 184.45 Mbps.
- Rogers achieved the highest 5G Availability in Canada during Q2 2021.
- Newfoundland and Labrador retained its top spot as Canada’s fastest region for fixed broadband during Q2 2021, achieving a median download speed of 119.77 Mbps.
- Calgary also retained its top spot among the most populous cities with the fastest median fixed broadband download speed at 129.60 Mbps. Winnipeg retained its top spot for mobile download speed by edging out Edmonton 93.12 Mbps to 91.25 Mbps.
- Samsung devices had the fastest combined performance, achieving a median download speed of 70.72 Mbps. The Samsung Galaxy S21+ 5G edged out the Samsung Galaxy S21 Ultra 5G for the fastest popular device median download speed 141.44 Mbps to 137.97 Mbps.
Ecuador
- According to Speedtest Intelligence, Netlife was Ecuador’s fastest and most consistent fixed broadband provider during Q2 2021, achieving a Speed Score of 38.72 and Consistency Score of 69.6%.
- CNT was the fastest and most consistent mobile operator in Ecuador during Q2 2021, achieving a Speed Score of 38.11 and Consistency Score of 86.9%.
Mexico
- Speedtest Intelligence reveals Telcel was Mexico’s fastest mobile operator during Q2 2021, earning a Speed Score of 47.80.
- Telcel was also Mexico’s most consistent mobile operator, achieving a Consistency Score of 89.2%.
- Veracruz showed the fastest mean mobile download and upload speeds among Mexico’s most populous cities during Q2 2021, recording a mean download speed of 46.24 Mbps and mean upload speed of 19.36 Mbps.
- Apple devices had the five fastest mean download speeds in Mexico. The iPhone 12 Pro 5G narrowly beat out the iPhone 12 Pro Max 5G and iPhone 12 5G for the fastest popular device during Q2 2021, achieving respective speeds of 74.65 Mbps, 72.63 Mbps and 72.37 Mbps.
Peru
- Among Peru’s top providers, Claro was the fastest mobile provider during Q2 2021, achieving a Speed Score of 36.91.
- Apple devices achieved the highest mean download speeds among top device manufacturers during Q2 2021, recording a mean download speed of 40.32 Mbps.
- Among popular mobile devices, the Apple iPhone 12 Pro 5G had the fastest mean download speed at 80.30 Mbps. The Apple iPhone 12 Pro Max 5G was second at 77.02 Mbps and the Apple iPhone 12 5G third at 75.63 Mbps.
United States
- Speedtest Intelligence reveals Verizon was the fastest fixed broadband provider in the United States during Q2 2021, earning a Speed Score of 170.22 — 6.3% increase over Q1 2021.
- Speedtest Intelligence also reveals that T-Mobile was the fastest and most consistent mobile operator in the United States during Q2 2021, achieving a median download speed of 54.13 Mbps and a Consistency Score of 84.8%.
- After looking at tests taken only on 5G, T-Mobile achieved the fastest median 5G download speed during Q2 2021 at 99.84 Mbps, a 21.2% increase over Q1 2021.
- During Q2 2021, T-Mobile had the best 5G Availability of 69.0%.
- Mobile download speeds blazed ahead in the most populous U.S. cities during Q2 2021 with Tampa, Florida supplanting St. Paul, Minnesota as the fastest city for median mobile download speed during Q2 2021 at 79.75 Mbps, an increase of 14.6% over St. Paul’s fastest median speed during Q1 2021.
- San Antonio, Texas knocked Gilbert, Arizona out of first place as the fastest city for fixed broadband among the United State’s most populous cities, edging out Raleigh, North Carolina with a median download speed of 183.60 Mbps to Raleigh’s 183.04 Mbps.
Read the full market analyses and follow monthly ranking updates on the Speedtest Global Index. Want to see how your internet speeds compare? Take a Speedtest® now.
Ookla retains ownership of this article including all of the intellectual property rights, data, content graphs and analysis. This article may not be quoted, reproduced, distributed or published for any commercial purpose without prior consent. Members of the press and others using the findings in this article for non-commercial purposes are welcome to publicly share and link to report information with attribution to Ookla.