| June 6, 2022

Analyzing Time of Day Internet Usage During Ramadan

Arabic | Français | Bahasa Indonesia | Bahasa Malaysia

Muslims across the world recently observed the month of Ramadan. During this sacred time, observing Muslims abstain from eating and drinking sunrise to sunset, acts of charity are encouraged, and work hours are often shortened. People often gather with friends and family during the evening meal, iftar, and new entertainment programming is often released for people to enjoy together. We were curious how this observance affected internet usage, so we analyzed Speedtest Intelligence® data from a variety of Muslim-majority countries around the world. We looked specifically at test volume during local fast times and iftar (when the fast is broken) and how those numbers compared to test volume during the month prior. 

Only some countries showed fewer tests during fast times

We analyzed Speedtest Intelligence data from Algeria, Bangladesh, Egypt, Indonesia, Malaysia, Morocco, Pakistan, Saudi Arabia, Somalia, Sudan, Tunisia, and Turkey during Ramadan to see how the distribution of Speedtest results between fast and iftar times varied by country. It should be noted that while all of the countries we surveyed have a majority Muslim population, the percentage of the population that is Muslim (and therefore likely to observe Ramadan) varies from Somalia (99.8%) to Malaysia (61.3%). 

Internet usage patterns changed during Ramadan 

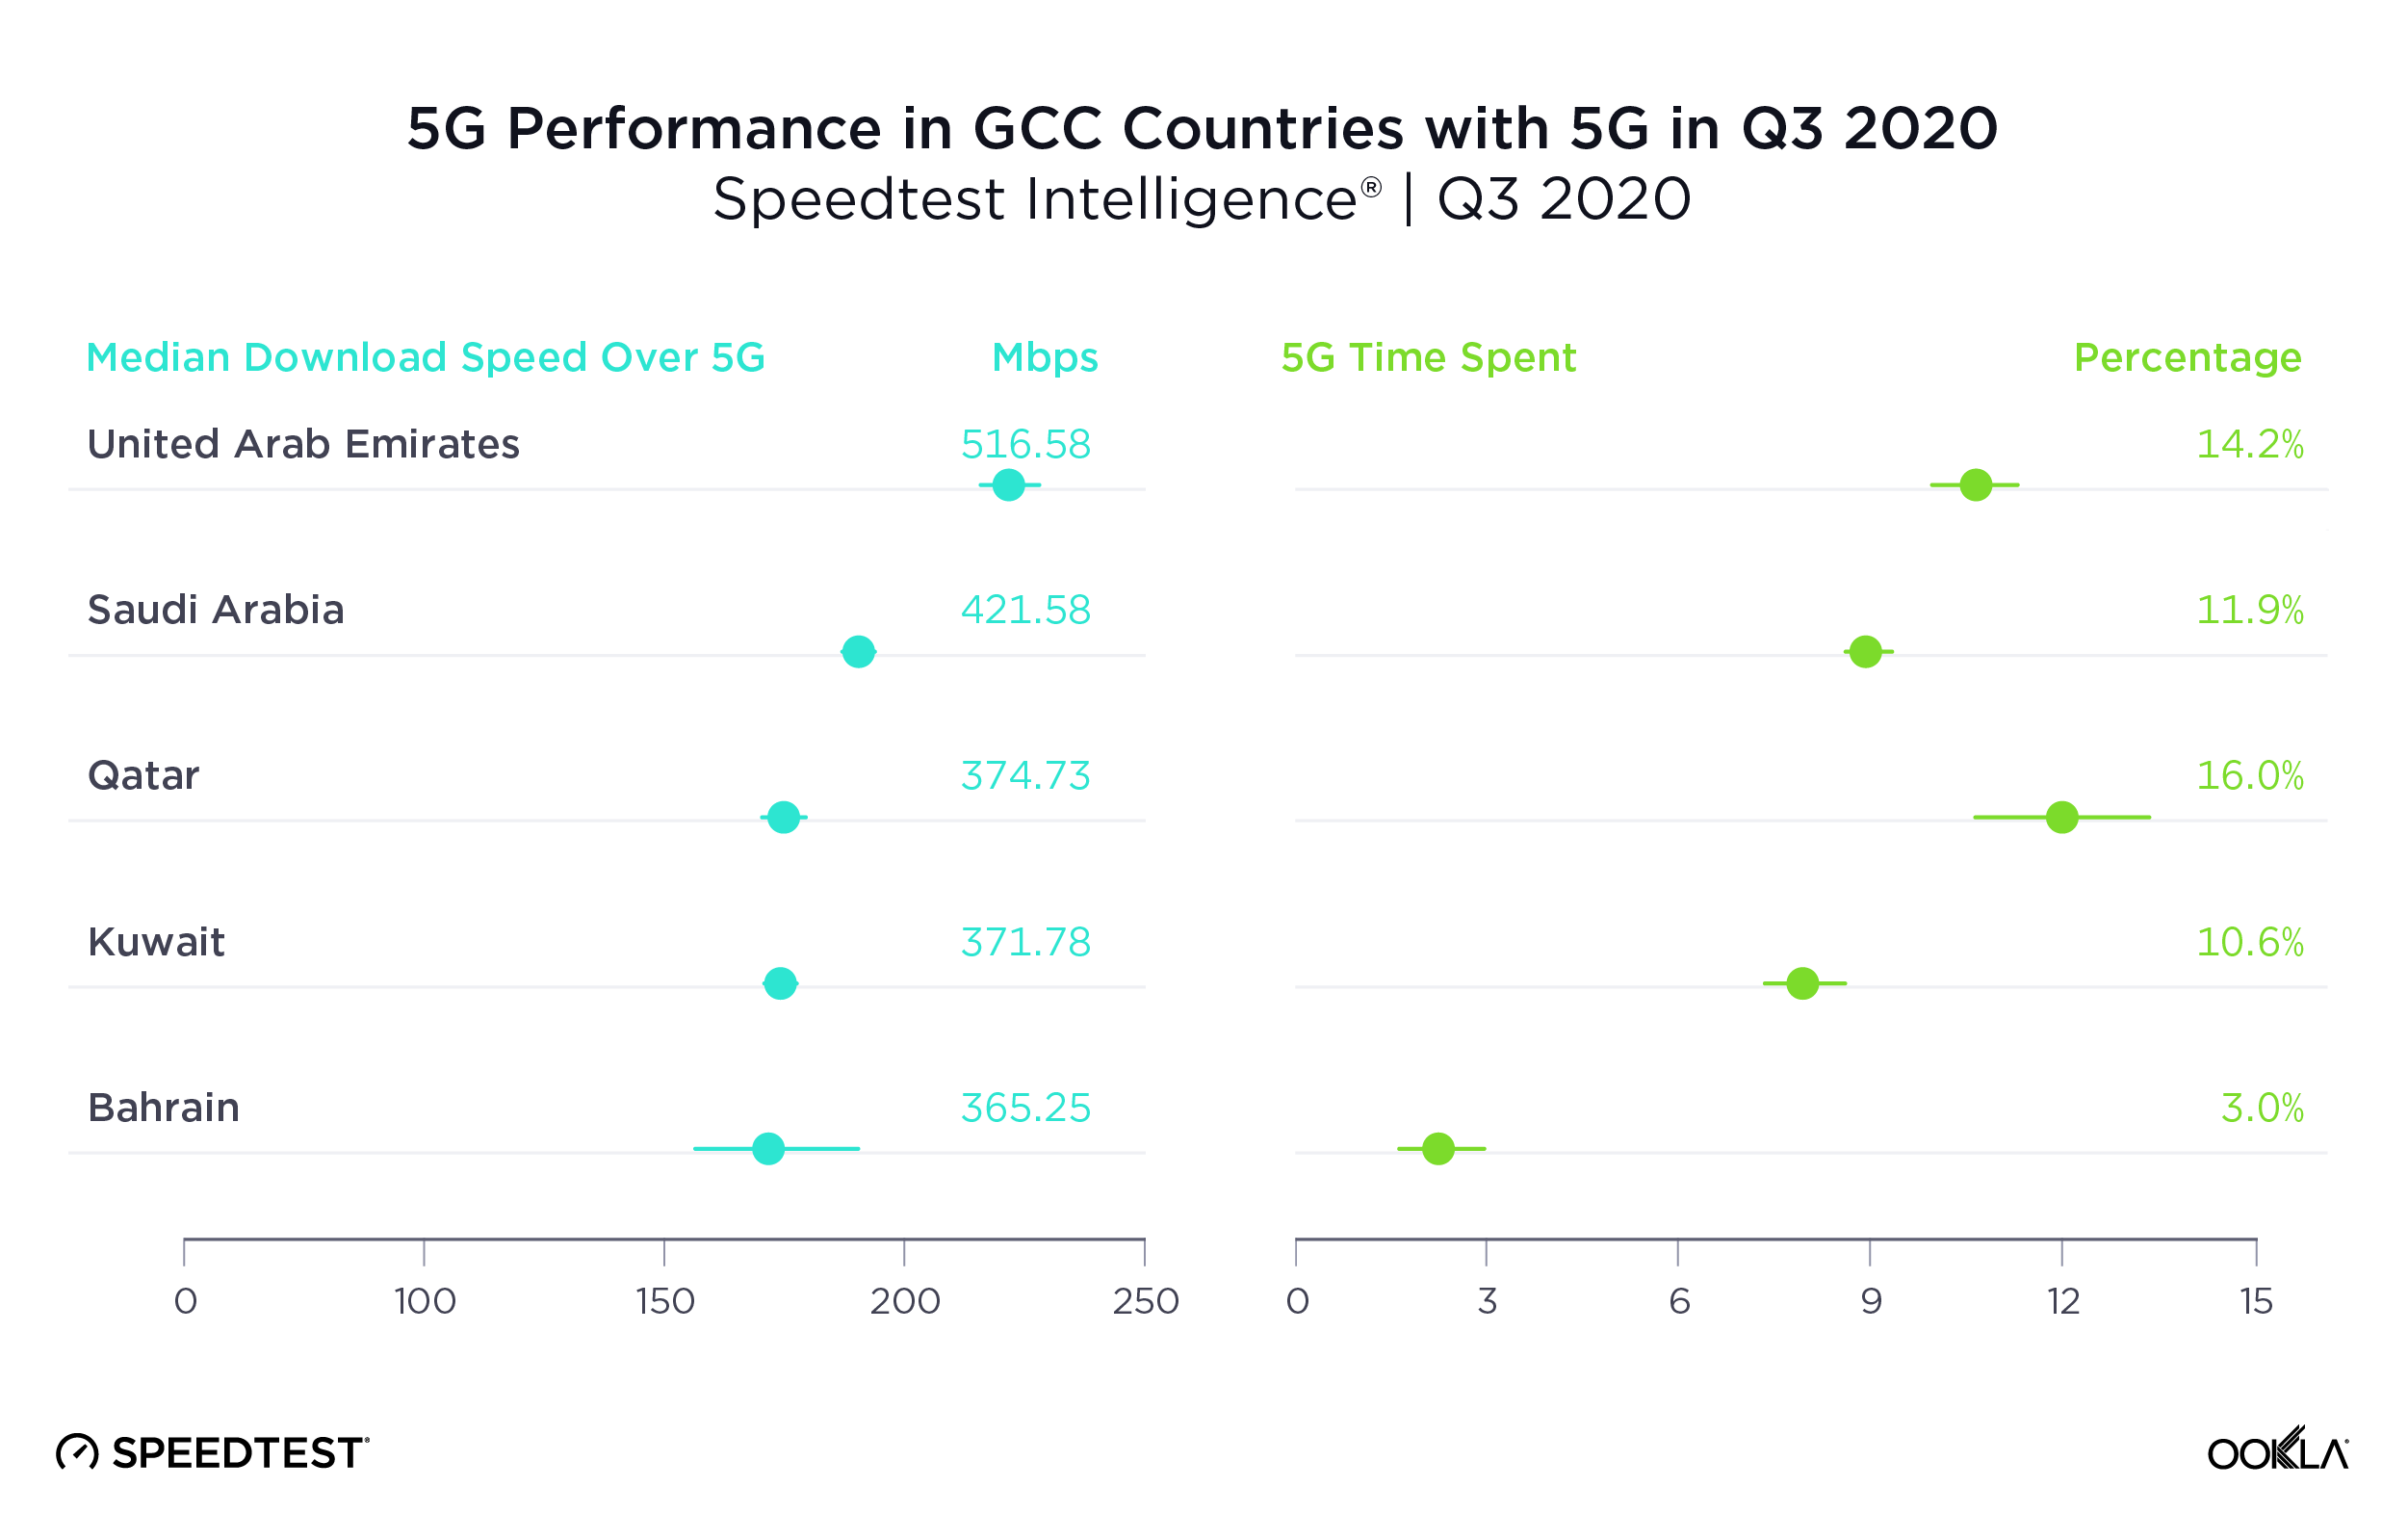
Speedtest Intelligence showed that testing behavior changed during Ramadan when compared with the month prior. There was a decrease in the percentage of tests completed in the daytime between Ramadan and the month prior in all of the countries we surveyed. Somalia, Algeria, Saudi Arabia, and Tunisia showed the highest change in trends of daytime Speedtest results when comparing the fasting part of the day during Ramadan to daytime during the month prior. Malaysia, Bangladesh, Turkey, Indonesia, and Pakistan showed the smallest difference between the two periods. 

There was also an increase in the percentage of Speedtest results from iftar when comparing Ramadan to the month prior. Somalia and Algeria saw the largest increase when compared with the month prior. Malaysia, Bangladesh, Turkey, and Pakistan saw the smallest increases. This corresponds with the idea that people shift their online activity to iftar during Ramadan, connecting with friends and family, donating to charity, and enjoying the variety of new shows that networks release to coincide with the holiday.

This is a good reminder that every country has special events that their network operators need to prepare in advance for as we saw recently with Expo 2020 Dubai. If you’re interested in coverage of major network events from around the world, subscribe to Ookla® InsightsTM.


Analyse de l’utilisation d’internet en journée durant le Ramadan

Les Musulmans du monde entier ont récemment observé le mois du Ramadan. Pendant ce temps sacré, les Musulmans pratiquants ne mangent pas et ne boivent pas de l’aube au coucher du soleil, les actes de charité sont encouragés et les heures de travail sont souvent réduites. Les gens se retrouvent fréquemment entre amis et en famille pour le repas du soir, l’iftar, et de nouveaux programmes de divertissement sont souvent diffusés pour que les gens puissent en profiter ensemble. Nous étions curieux de savoir comment cette observance affectait l’utilisation d’Internet. Nous avons donc analysé les données de Speedtest Intelligence® provenant de divers pays à majorité musulmane dans le monde. Nous avons particulièrement examiné le volume des tests pendant les heures de jeûne locales et l’iftar (lorsque le jeûne est rompu), puis nous avons comparé ces chiffres au volume des tests du mois précédent.

Seuls quelques pays témoignent d’une réduction de tests pendant les périodes de jeûne

Nous avons analysé les données de Speedtest Intelligence provenant d’Algérie, du Bangladesh, d’Égypte, d’Indonésie, de Malaisie, du Maroc, du Pakistan, d’Arabie Saoudite, de Somalie, du Soudan, de Tunisie et de Turquie pendant le Ramadan pour voir comment la répartition des résultats de Speedtest entre les heures de jeûne et l’iftar variait selon les pays. Il convient de noter que si tous les pays étudiés ont une population majoritairement Musulmane, le pourcentage de la population Musulmane (et donc susceptible d’observer le ramadan) varie de la Somalie (99,8 %) à la Malaisie (61,3 %).

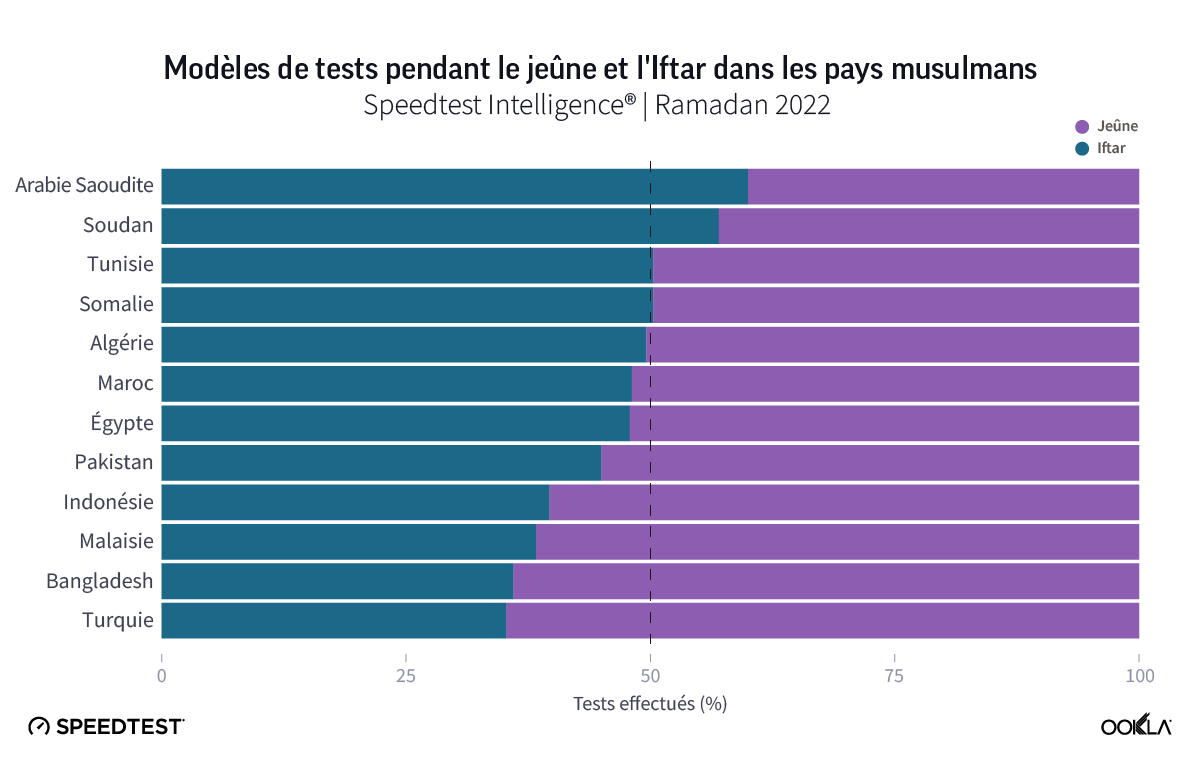
La Turquie, le Bangladesh, la Malaisie, l’Indonésie et le Pakistan ont montré un pourcentage plus élevé de résultats Speedtest pendant le jeûne que pendant l’iftar tout au long du Ramadan 2022. Les pourcentages de tests pendant le jeûne et l’iftar étaient presque équivalents au Maroc, en Égypte, en Algérie, en Tunisie et en Somalie. L’Arabie Saoudite et le Soudan avaient plus de résultats Speedtest pendant l’iftar que pendant le jeûne.

Les habitudes d’utilisation d’internet ont changé pendant le Ramadan

Speedtest Intelligence a montré que le comportement de test a changé pendant le Ramadan par rapport au mois précédent. Il y a eu une diminution du pourcentage de tests effectués dans la journée entre le Ramadan et le mois précédent dans tous les pays que nous avons étudiés. La Somalie, l’Algérie, l’Arabie Saoudite et la Tunisie ont enregistré la plus forte baisse du pourcentage de résultats de Speedtest effectués dans la journée lors de la comparaison entre la journée de jeûne au cours du Ramadan à la journée du mois précédent. La Malaisie, le Bangladesh, la Turquie, l’Indonésie et le Pakistan ont montré la plus petite différence entre les deux périodes.

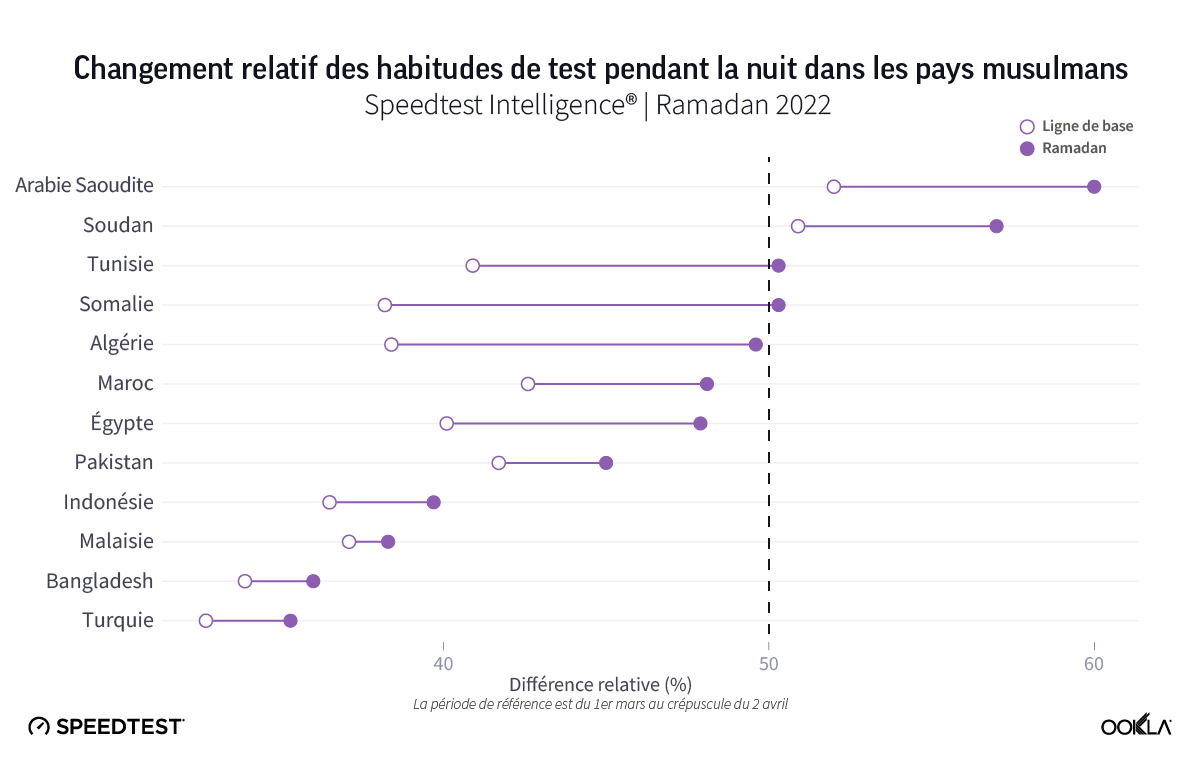
Une augmentation du pourcentage de résultats Speedtest a été observée lors de l’iftar en comparant le Ramadan au mois précédent. La Somalie et l’Algérie ont connu la plus forte augmentation par rapport au mois précédent. La Malaisie, le Bangladesh, la Turquie et le Pakistan ont connu les plus faibles augmentations. Ces résultats correspondent à l’idée que les gens reportent leur activité en ligne à l’iftar pendant le Ramadan, pour passer du temps avec leurs amis et leur famille, faire des dons à des œuvres de charité et profiter de la variété des nouveaux programmes que les réseaux diffusent pour coïncider avec la période des fêtes.

Cette étude est un bon rappel que chaque pays a des événements spéciaux auxquels ses opérateurs de réseau doivent se préparer à l’avance, comme nous l’avons vu récemment avec l’Expo 2020 Dubaï. Si vous êtes intéressé par la couverture des grands événements réseau du monde entier, abonnez-vous à Ookla® Insights™.


Analisis Waktu Penggunaan Internet Selama Ramadan

Umat Islam di seluruh dunia baru-baru ini merayakan bulan Ramadan. Selama bulan suci ini, umat Islam menjalani ibadah puasa sejak matahari terbit hingga terbenam, banyak beramal, dan sering kali mengurangi jam kerja. Orang-orang berkumpul dengan teman dan keluarga saat makam malam, berbuka puasa, dan program hiburan baru seringkali dirilis untuk dinikmati bersama. Kami penasaran bagaimana kepatuhan ini memengaruhi penggunaan internet, jadi kami pun menganalisis data Speedtest Intelligence® dari berbagai negara mayoritas Muslim di seluruh dunia. Kami secara khusus mencermati volume tes pada waktu puasa dan berbuka (saat puasa dihentikan) setempat dan bagaimana perbandingan angka-angka tersebut dengan volume tes di bulan sebelumnya.

Hanya beberapa negara yang menunjukkan tes yang lebih sedikit di waktu puasa

Kami menganalisis data Speedtest Intelligence dari Aljazair, Bangladesh, Mesir, Indonesia, Malaysia, Maroko, Pakistan, Arab Saudi, Somalia, Sudan, Tunisia, dan Turki selama Ramadan untuk mencari tahu bagaimana distribusi hasil Speedtest antara waktu puasa dan waktu berbuka puasa bervariasi antarnegara. Perlu dicatat bahwa meskipun semua negara yang kami survei berpenduduk mayoritas Muslim, persentase penduduk yang beragama Islam (dan, karena itu, mungkin merayakan Ramadan) itu bervariasi, dari Somalia (99,8%) hingga Malaysia (61,3%).

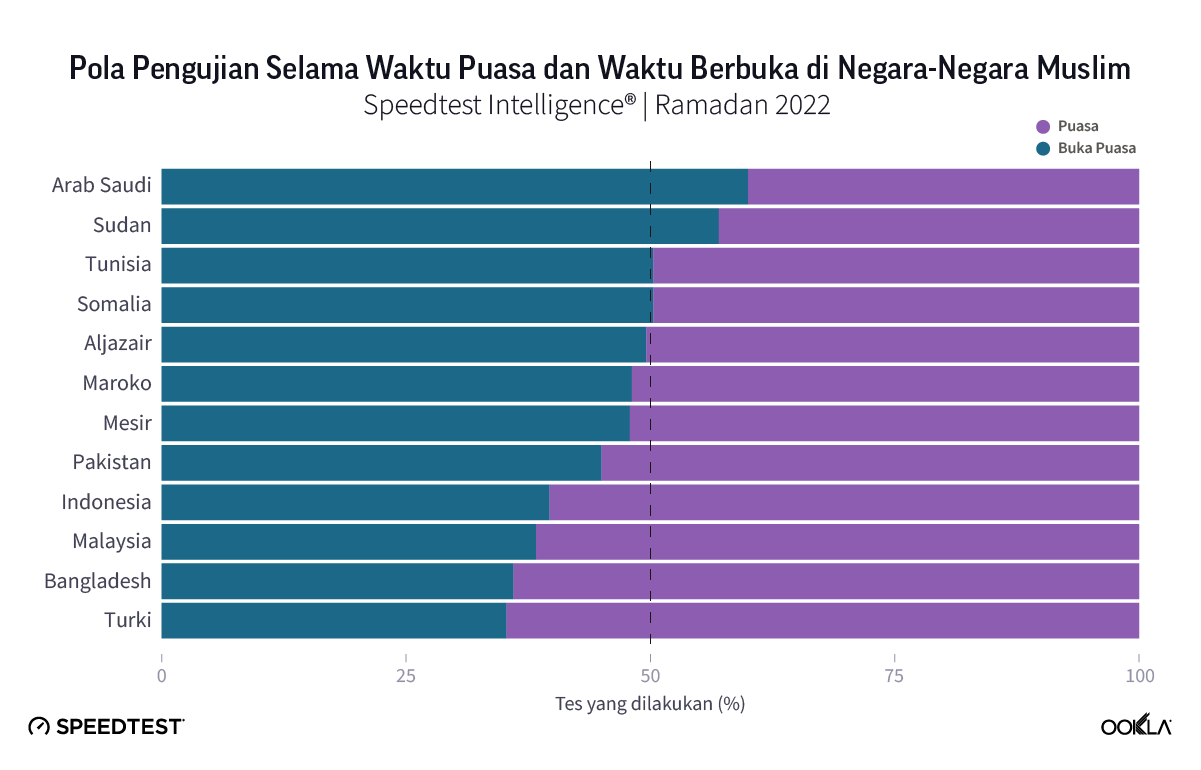
Data dari Turki, Bangladesh, Malaysia, Indonesia, dan Pakistan menunjukkan persentase hasil Speedtest yang lebih tinggi selama waktu puasa dibandingkan waktu berbuka selama Ramadan 2022. Adapun menurut data dari Maroko, Mesir, Aljazair, Tunisia dan Somalia, persentase tes waktu puasa dan berbukanya kurang lebih sama. Sementara Arab Saudi dan Sudan hasil Speedtest-nya selama waktu berbuka lebih banyak daripada waktu puasa.

Pola penggunaan internet berubah selama Ramadan

Speedtest Intelligence menunjukkan bahwa perilaku pengujian berubah selama Ramadan jika dibandingkan dengan bulan sebelumnya. Terjadi penurunan persentase tes yang dilaksanakan pada siang hari antara bulan Ramadan dan bulan sebelumnya di semua negara yang kami survei. Somalia, Aljazair, Arab Saudi, dan Tunisia menunjukkan penurunan persentase hasil Speedtest terbesar di siang hari bulan Ramadan dibandingkan siang hari di bulan sebelumnya. Data dari Malaysia, Bangladesh, Turki, Indonesia, dan Pakistan menunjukkan selisih terkecil di antara kedua periode tersebut.

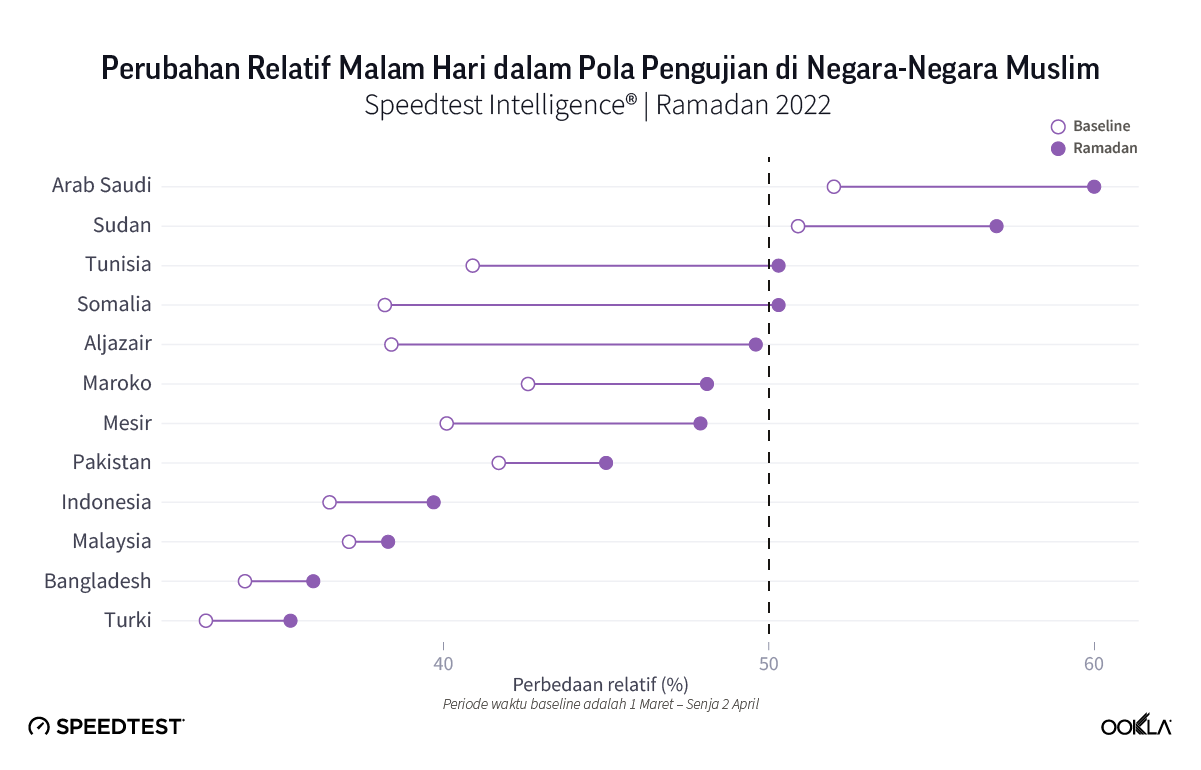
Juga terjadi peningkatan persentase hasil Speedtest mulai waktu berbuka puasa di bulan Ramadan dengan bulan sebelumnya. Somalia dan Aljazair mengalami peningkatan terbesar jika dibandingkan dengan bulan sebelumnya. Malaysia, Bangladesh, Turki, dan Pakistan mengalami peningkatan terkecil. Ini selaras dengan asumsi bahwa orang-orang mengalihkan aktivitas online mereka ke waktu berbuka selama Ramadan, berbaur dengan teman dan keluarga, bederma, dan menikmati berbagai acara baru yang dirilis oleh jaringan bertepatan dengan hari raya.​​

Ini adalah pengingat yang bagus bahwa setiap negara memiliki acara-acara khusus yang perlu dipersiapkan terlebih dulu oleh para operator jaringan seperti yang kita lihat baru-baru ini pada Expo 2020 Dubai. Jika Anda tertarik dengan liputan acara-acara jaringan utama dari seluruh dunia, silakan berlangganan Ookla® Insights™.


Menganalisis Masa Penggunaan Internet Semasa Bulan Ramadan

Orang islam di seluruh dunia baru-baru ini telah menyambut bulan Ramadan. Semasa bulan suci ini, mereka menahan diri dari makan dan minum bermula dari waktu matahari terbit hingga matahari terbenam, aktiviti kebajikan digalakkan, dan waktu bekerja kebiasaannya dipendekkan. Orang ramai biasanya akan berkumpul bersama-sama rakan dan keluarga semasa waktu berbuka puasa, iftar, dan rancangan hiburan baru sering disiarkan untuk ditonton dan dinikmati bersama-sama.

Kami ingin tahu bagaimana sambutan bulan Ramadan ini memberi kesan terhadap penggunaan internet, jadi kami telah menganalisis data Speedtest Intelligence® dari pelbagai negara dengan majoriti Muslim di seluruh dunia. Kami melihat secara khusus jumlah ujian semasa waktu berpuasa dan iftar (waktu berbuka puasa) tempatan dan membandingkan nilai tersebut dengan jumlah ujian semasa bulan sebelumnya.

Hanya beberapa negara yang menunjukkan bilangan ujian lebih rendah semasa waktu berpuasa

Kami telah menganalisis data Speedtest Intelligence dari Algeria, Bangladesh, Mesir, Indonesia, Malaysia, Maghribi, Pakistan, Arab Saudi, Somalia, Sudan, Tunisia, dan Turki semasa bulan Ramadan untuk melihat pengagihan keputusan Speedtest di antara waktu berpuasa dan iftar yang berbeza mengikut negara. Perlu dinyatakan bahawa, walaupun semua negara yang diselidik mempunyai penduduk majoriti Muslim, peratusan penduduk yang beragama Islam (dan oleh itu lebih berkemungkinan menyambut Ramadan) berbeza-beza dari Somalia (99.8%) ke Malaysia (61.3%).

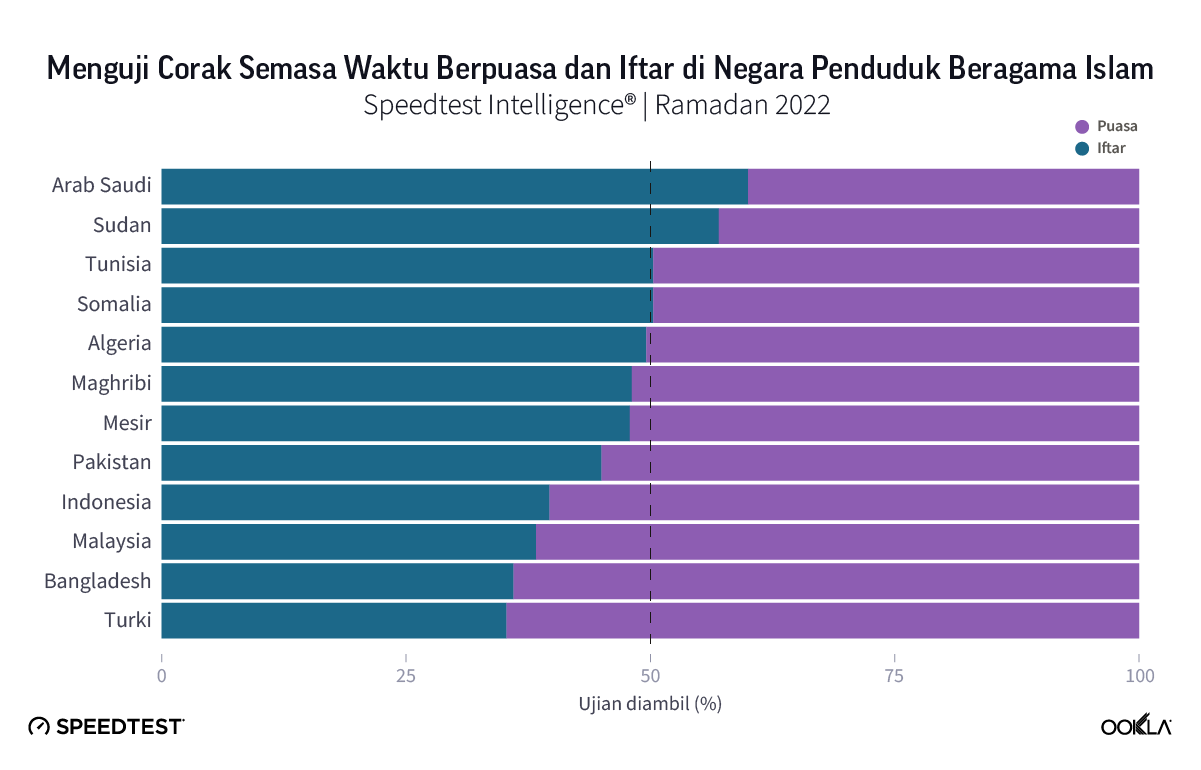
Turki, Bangladesh, Malaysia, Indonesia, dan Pakistan menunjukkan peratusan keputusan Speedtest yang lebih tinggi semasa waktu berpuasa berbanding waktu berbuka semasa bulan Ramadan 2022. Peratusan ujian waktu berpuasa dan iftar adalah agak sama dengan Morocco, Mesir, Algeria, Tunisia dan Somalia. Saudi Arabia dan Sudan mempunyai keputusan Speedtest yang lebih tinggi semasa waktu berbuka berbanding waktu berpuasa.

Corak penggunaan Internet berubah semasa bulan Ramadan

Speedtest Intelligence menunjukkan bahawa tingkah laku ujian berubah semasa bulan Ramadan apabila dibandingkan dengan bulan sebelumnya. Terdapat penurunan dalam peratusan ujian yang dilengkapkan semasa waktu siang antara bulan Ramadan dan bulan sebelumnya dalam semua negara yang dikaji selidik. Somalia, Algeria, Saudi Arabia, dan Tunisia menunjukkan penurunan terbesar dalam peratusan keputusan waktu siang Speedtest apabila dibandingkan dengan waktu berpuasa semasa bulan Ramadan dengan waktu siang bulan sebelumnya. Malaysia, Bangladesh, Turki, Indonesia, dan Pakistan menunjukkan perbezaan terkecil di antara dua tempoh ini.

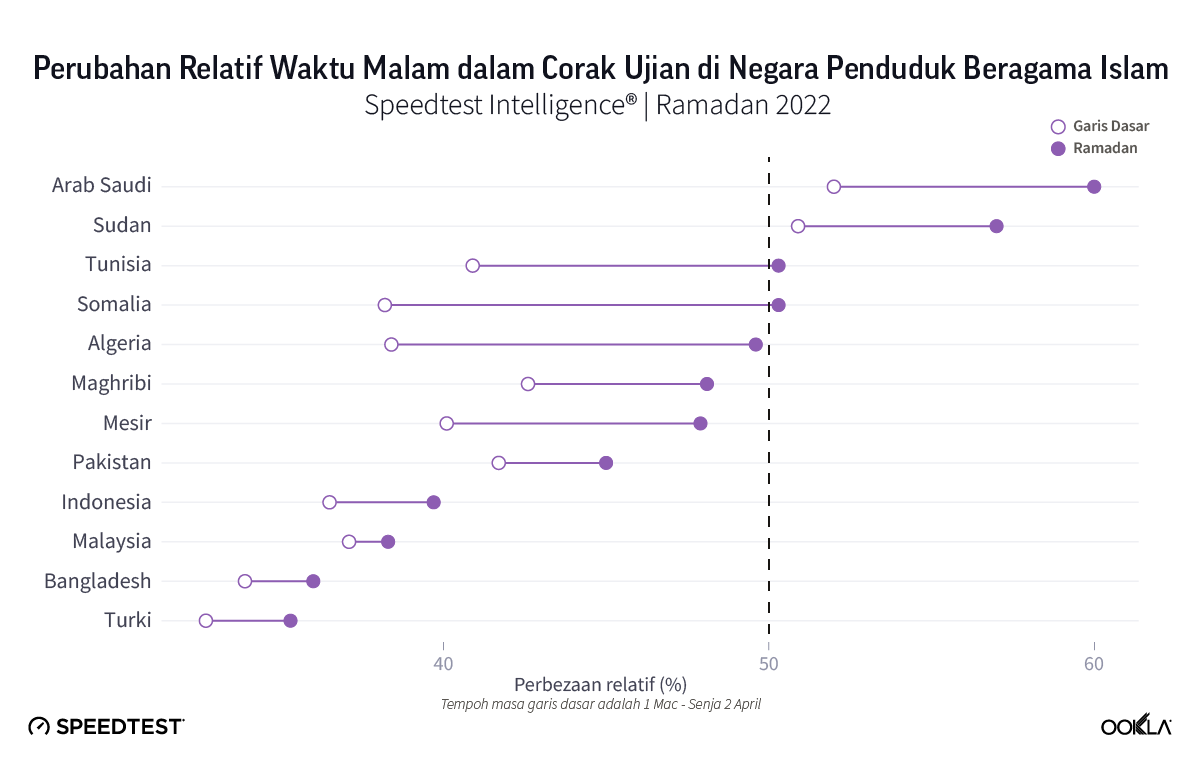
Terdapat juga peningkatan dalam peratusan keputusan Speedtest dari waktu iftar apabila membandingkan bulan Ramadan kepada bulan sebelumnya. Somalia dan Algeria mempunyai peningkatan terbesar apabila dibandingkan dengan bulan sebelumnya. Malaysia, Bangladesh, Turki, dan Pakistan mempunyai peningkatan terkecil. Ini selari dengan pendapat bahawa ramai yang menukar aktiviti dalam talian mereka kepada iftar semasa bulan Ramadan, berhubung dengan rakan dan keluarga, menderma kepada badan kebajikan, dan menikmati pelbagai rancangan baru yang disiarkan oleh rangkaian yang bersesuaian dengan sambutan ini.

Ini adalah satu peringatan yang baik bahawa setiap negara mempunyai peristiwa istimewa yang pengendali rangkaian perlu sediakan lebih awal seperti yang kita lihat baru-baru ini di Expo 2020 Dubai. Jika anda berminat dengan liputan acara rangkaian besar dari seluruh dunia, langganlah  Ookla® Insights™.

Ookla retains ownership of this article including all of the intellectual property rights, data, content graphs and analysis. This article may not be quoted, reproduced, distributed or published for any commercial purpose without prior consent. Members of the press and others using the findings in this article for non-commercial purposes are welcome to publicly share and link to report information with attribution to Ookla.

| December 3, 2019

An Analysis of Internet Speeds and 4G in North Africa

Lire en français read in arabic

Mobile and fixed broadband speeds in North Africa currently lag behind much of the world, though that may soon change. To better understand the current and future states of the internet in North Africa, we examined Speedtest® data from Q2-Q3 2019 in Algeria, Egypt, Libya, Morocco and Tunisia. Our analysis includes data on download speeds, 4G Availability and Time Spent on various mobile technologies. We’ve also included data on internet speeds in some of the largest cities in the region.

Internet-Speeds-in-North-Africa-ENG-1

Morocco leads fixed broadband download speeds, Egypt most improved

As of October 2019, countries in North Africa ranked no higher than 123rd in the world for fixed broadband speeds on the Speedtest Global IndexTM. Morocco had the fastest mean download speed over fixed broadband in North Africa during Q2-Q3 2019 at 15.38 Mbps, 69.0% faster than second-place Egypt’s 9.10 Mbps. Libya was third fastest at 8.92 Mbps, Tunisia fourth at 8.64 Mbps and Algeria fifth at 4.55 Mbps.

However, Egypt saw the most improvement in fixed broadband download speed with a remarkable 55.5% increase during Q2-Q3 2019. All four of the major ISPs in Egypt saw increased speeds during this period with mean download speeds rising 59.2% for WE Internet, 55.4% for Orange, 21.7% for Etisalat and 17.1% for Vodafone.

Libya showed the second highest improvement in fixed broadband download speed in North Africa during this period with a 29.9% gain. Morocco’s download speed went up 27.2% and Tunisia 10.8%. Mean download speed over fixed broadband declined 6.2% during Q2-Q3 2019 in Algeria.

Morocco has the fastest mean download speed on mobile and it’s improving rapidly

North Africa’s fastest country, Morocco, ranked 54th on the Speedtest Global Index in October 2019. Morocco’s mean download speed over mobile during Q2-Q3 2019 was 27.01 Mbps. Tunisia was second at 24.50 Mbps, Egypt third at 16.86 Mbps, and Algeria and Libya virtually tied at 9.63 Mbps and 9.62 Mbps, respectively.

Morocco showed the greatest improvement in mean mobile download speed among countries in North Africa during Q2-Q3 2019 with a 24.5% increase. All three of the major providers saw advances in speed during this period with Maroc Telecom seeing a 40.1% rise in mean download speed, inwi gained 11.9% and Orange 5.5%. Algeria had the second highest gain in mean download speed at 20.5%, Tunisia third at 12.1% and Libya fourth at 8.6%. Mean download speed over mobile decreased 3.4% in Egypt during Q2-Q3 2019.

4G Availability varies widely among countries in North Africa

4G Availability in North Africa
Speedtest® Data | Q2-Q3 2019
Country 4G Availability
Morocco 83.3%
Tunisia 64.4%
Egypt 60.9%
Algeria 45.5%
Libya 15.6%

Morocco had the highest 4G Availability in North Africa during Q2-Q3 2019, with consumers able to access 4G LTE in 83.3% of surveyed locations. Tunisia had the second highest 4G Availability at 64.4%, Egypt third at 60.9%, Algeria fourth at 45.5% and Libya fifth at 15.6%.

Only two countries show majority of Time Spent on 4G

Time-Spent-Per-Mobile-Technology-in-North-Africa-ENG

We used Speedtest data on Time Spent to measure how often, on average, consumers were able to connect to various technologies in North Africa during Q2-Q3 2019. Morocco had the highest Time Spent on 4G at 59.7%, followed by Tunisia (53.4%), Egypt (41.1%), Algeria (39.8%) and Libya (13.3%). Libya had the highest Time Spent on 3G at 40.2%, followed by Algeria (35.5%), Egypt (27.0%), Tunisia (26.1%) and Morocco (21.1%). Libya had the highest Time Spent on 2G at 25.1%, distantly followed by Algeria (8.8%), Egypt (6.0%), Tunisia (4.3%) and Morocco (3.7%).

Libya had the highest Time Spent with no coverage at 17.6%, followed closely by Egypt (17.5%), Morocco (13.9%), Tunisia (13.5%) and Algeria (13.2%).

Rabat shows fastest mean fixed broadband and mobile download speeds

-revised-2--Ookla_North-Africa_Internet-Speeds_1219_en

Looking at some of the largest cities in North Africa we found that the Moroccan cities of Rabat and Casablanca had the fastest mean download speeds over fixed broadband during Q2-Q3 2019. Tripoli, Libya was third. On the other end of the spectrum, Oran, Algeria had the slowest mean download over fixed broadband during Q2-Q3 2019. Data for the province of Algiers, Algeria revealed that to be the second slowest location on the list for download speed over fixed broadband. Sfax, Tunisia was the third slowest.

On the mobile side, Rabat and Casablanca again ranked first and second for mean download speed during Q2-Q3 2019. Sfax was third. Oran and Algiers showed the slowest and second slowest, respectively, mean download speeds over mobile during Q2-Q3 2019 of all the locations on this list. Tripoli was the third slowest.

The rollouts of fiber and 5G have the potential to radically improve internet speeds and availability across North Africa. The gains in speeds we saw in many North African countries during Q2-Q3 2019 could revolutionize consumers’ internet experience if they continue. If you’re an internet provider or mobile operator who would like more information on how our data can help you improve your network, contact us.


Analyse des débits Internet et de la 4G en Afrique du Nord

Actuellement, la vitesse des connexions haut débit fixes et mobiles en Afrique du Nord est bien en deçà de celle enregistrée dans une grande partie du monde, même si cela devrait bientôt changer. Pour mieux comprendre la situation actuelle et future d’Internet en Afrique du Nord, nous avons étudié les données Speedtest® entre le 2e et le 3e trimestre 2019 en Algérie, en Égypte, en Libye, au Maroc et en Tunisie. Notre analyse inclut des informations sur les vitesses de téléchargement, la disponibilité de la 4G et le temps passé sur diverses technologies mobiles. Nous avons également ajouté des données sur les débits Internet de quelques-unes des plus grandes villes de la région.

Internet-Speeds-in-North-Africa-FR

Le Maroc est premier en matière de vitesse de téléchargement haut débit fixe, et l’Égypte enregistre la plus importante progression

En octobre 2019, les pays d’Afrique du Nord atteignaient seulement la 123e place mondiale du classement Speedtest Global IndexTM s’intéressant aux vitesses de téléchargement haut débit fixe. Dans la région Afrique du Nord et entre le 2e et le 3e trimestre 2019, c’est le Maroc qui affichait la vitesse de téléchargement moyenne la plus rapide pour le haut débit fixe avec une valeur de 15,38 Mbits/s. L’Internet du pays est donc 69,0 % plus rapide qu’en Égypte, qui occupait la 2e place avec une vitesse de 9,10 Mbits/s. La Libye se classait 3e avec une vitesse de 8,92 Mbits/s, suivie par la Tunisie et l’Algérie avec une vitesse de 8,64 Mbits/s et 4,55 Mbits/s, respectivement.

Toutefois, c’est l’Égypte qui a le plus progressé en matière de vitesse de téléchargement haut débit fixe avec une augmentation incroyable de 55,5 % entre le 2e et le 3e trimestre 2019. Les quatre principaux fournisseurs d’accès à Internet en Égypte ont enregistré des débits plus élevés au cours de cette période avec des vitesses de téléchargement moyennes augmentant de 59,2 % pour WE Internet, 55,4 % pour Orange, 21,7 % pour Etisalat et 17,1 % pour Vodafone.

La Libye est le deuxième pays en Afrique du Nord dont la vitesse de téléchargement haut débit fixe s’est nettement améliorée avec une hausse de 29,9 %. La vitesse de téléchargement a augmenté de 27,2 % pour le Maroc et de 10,8 % pour la Tunisie. Pour le 2e et le 3e trimestre 2019, la vitesse de téléchargement moyenne pour le haut débit fixe a diminué de 6,2 % en Algérie.

Le Maroc affiche la vitesse de téléchargement moyenne sur mobile la plus rapide et progresse vite

Le Maroc, pays avec le débit Internet le plus rapide d’Afrique du Nord, était classé 54e du Speedtest Global Index en octobre 2019. La vitesse de téléchargement moyenne sur mobile du Maroc entre le 2e et le 3e trimestre 2019 était de 27,01 Mbits/s. Après le Maroc, la Tunisie était 2e avec une vitesse de 24,50 Mbits/s, l’Égypte 3e avec une vitesse de 16,86 Mbits/s, tandis que l’Algérie et la Libye étaient pratiquement ex aequo avec une vitesse de 9,63 Mbits/s et 9,62 Mbits/s respectivement.

Entre le 2e et le 3e trimestre 2019, le Maroc a enregistré la progression la plus importante en termes de vitesse de téléchargement moyenne sur mobile par rapport aux autres pays d’Afrique du Nord, avec une hausse de 24,5 %. Les trois principaux fournisseurs ont constaté des progrès en termes de vitesse pendant cette période : Maroc Telecom a rapporté une augmentation de 40,1 % pour la vitesse de téléchargement moyenne, tandis qu’inwi et Orange ont fait part d’une hausse de 11,9 % et 5,5 %, respectivement. La deuxième augmentation la plus importante en matière de vitesse de téléchargement moyenne a été enregistrée en Algérie avec une valeur de 20,5 %, suivie par la Tunisie (12,1 %) et la Libye (8,6 %). La vitesse de téléchargement moyenne sur mobile a diminué de 3,4 % en Égypte au cours de la même période.

La disponibilité de la 4G est très variable entre les pays d’Afrique du Nord

Disponibilité de la 4G en Afrique du Nord
Données Speedtest® | 2e et 3e trimestres 2019
Pays Disponibilité de la 4G
Maroc 83,3%
Tunisie 64,4%
Égypte 60,9%
Algérie 45,5%
Libye 15,6%

Entre le 2e et le 3e trimestre 2019, c’est au Maroc que la 4G était la plus disponible : les utilisateurs pouvaient accéder à la 4G LTE dans 83,3 % des emplacements étudiés. La Tunisie se classait 2e avec une disponibilité de la 4G égale à 64,4 %, l’Égypte était 3e avec 60,9 %, l’Algérie 4e avec 45,5 % et la Libye 5e avec 15,6 %.

Seuls deux pays affichent une majorité de temps passé sur la 4G

Time-Spent-Per-Mobile-Technology-in-North-Africa-FR

Nous avons exploité les données Speedtest relatives au temps passé pour mesurer la fréquence moyenne à laquelle les utilisateurs pouvaient se connecter à diverses technologies en Afrique du Nord entre le 2e et le 3e trimestre 2019. Le temps passé sur la 4G était plus important au Maroc avec 59,7 %, suivi par la Tunisie (53,4 %), l’Égypte (41,1 %), l’Algérie (39,8 %) et la Libye (13,3 %). Le temps passé sur la 3G était plus important en Libye avec 40,2 %, suivie par l’Algérie (35,5 %), l’Égypte (27,0 %), la Tunisie (26,1 %) et le Maroc (21,1 %). Le temps passé sur la 2G était plus important en Libye avec 25,1 %, suivie de très loin par l’Algérie (8,8 %), l’Égypte (6,0 %), la Tunisie (4,3 %) et le Maroc (3,7 %).

Le temps passé sans couverture était plus important en Libye avec 17,6 %, suivie par l’Égypte (17,5 %), le Maroc (13,9 %), la Tunisie (13,5 %) et l’Algérie (13,2 %).

Rabat enregistre les vitesses de téléchargement haut débit fixe et mobile moyennes les plus rapides

-revised-2--Ookla_North-Africa_Internet-Speeds_1219_fr

En étudiant certaines des plus grandes villes d’Afrique du Nord, nous avons constaté que Rabat et Casablanca (Maroc) présentaient les vitesses de téléchargement haut débit fixe moyennes les plus rapides entre le 2e et le 3e trimestre 2019. Tripoli (Libye) arrivait en 3e place. Si l’on s’intéresse aux autres extrêmes, c’est Oran (Algérie) qui présentait la vitesse de téléchargement haut débit fixe moyenne la plus lente pour la même période. Les données de la province d’Alger (Algérie) ont révélé que celle-ci était la deuxième ville avec la vitesse de téléchargement haut débit fixe la plus lente. Sfax (Tunisie) était la 3e ville avec la vitesse la plus lente.

Côté mobile, les villes de Rabat et de Casablanca se classaient encore 1re et 2e, respectivement, pour la vitesse de téléchargement moyenne la plus rapide entre le 2e et 3e trimestre 2019. Sfax atteignait la 3e place. Oran et Alger occupaient respectivement la 1re et la 2e place de la liste en matière de vitesses de téléchargement sur mobile moyennes les plus lentes pendant cette période. Tripoli était la 3e ville avec la vitesse la plus lente.

Les déploiements de la fibre et de la 5G ont le potentiel d’améliorer de façon notable la disponibilité et les débits Internet dans toute l’Afrique du Nord. Les augmentations de débits que nous avons constatées dans de nombreux pays de cette région entre le 2e et le 3e trimestre 2019 peuvent, si elles continuent, révolutionner l’expérience Internet des utilisateurs. Si vous êtes un fournisseur d’accès à Internet ou un opérateur mobile et que vous souhaitez plus d’informations sur comment nos données peuvent améliorer votre réseau, contactez-nous.

Ookla retains ownership of this article including all of the intellectual property rights, data, content graphs and analysis. This article may not be quoted, reproduced, distributed or published for any commercial purpose without prior consent. Members of the press and others using the findings in this article for non-commercial purposes are welcome to publicly share and link to report information with attribution to Ookla.

| December 12, 2017

The World’s Internet Speeds Increased More than 30% in 2017. Are You Keeping Up?

In a world where business and life are increasingly fast and global, you want to know if your country’s internet is up to speed. In August, we launched Speedtest Global IndexTM to provide you that objective look at internet performance around the world. Knowing what your speeds are and how they compare to your neighbors’ makes for a good story, but what was missing was a benchmark. To provide you that worldwide context, we’re introducing Global Speed, the average internet speed of the world, to the top of the Speedtest Global Index.

You can still use the Speedtest Global Index to see download and upload speeds by country and rank who’s fastest and slowest. Here we’ve paired data about those individual country speeds over the past year with the new global averages call out which countries have improved most over the past year, who’s shown the least improvement and what speeds are like in the world’s most populous countries. Read on to see who’s winning the internet speed race and who has a lot of catching up to do.

The comparisons here are based on Speedtest data from November 2016-November 2017. We used the same monthly threshold for this article that we do for inclusion in the Speedtest Global Index: to be ranked in each category, countries must have at least 670 Speedtest results from unique users on mobile and at least 3,333 for fixed broadband. Although we use the word “country” throughout, you will notice some regions like Hong Kong and Puerto Rico that are large or autonomous enough to call out as separate entities, even though they are not separate countries. Global speeds are a weighted average of all samples from around the world.

Global download speeds are up more than 30% across the board

With a mean global speed of 20.28 Mbps, mobile downloads increased 30.1% over the last 12 months and mobile uploads increased 38.9%. A global average of 40.11 Mbps makes fixed broadband downloads 97.8% faster than mobile and this speed increased 31.6% during the same period. Uploads over fixed broadband showed the smallest increase of 25.9%.

Global Internet Speeds
November 2016 – November 2017
Download: November 2017 Average (Mbps) Download: Year Over Year Increase Upload: November 2017 Average (Mbps) Upload: Year Over Year Increase
Mobile 20.28 30.1% 8.65 38.9%
Fixed 40.11 31.6% 19.96 25.9%

In November 2017, 119 countries boasted a faster mobile download speed than the global average while 134 were slower. On the fixed broadband side, 71 countries and regions beat the global average download speed and 185 were slower. As we reported last week, gigabit Speedtest results are rolling in from across the planet, but their distribution across continents is wildly uneven.

Most improved countries

It was a good year for Laotian mobile speeds. With a 249.5% jump in mobile download speeds, Laos showed the largest improvement in the world. Vietnam came in second with an increase of 188.7% and Trinidad and Tobago was third at 133.1%. All of the countries listed on the table below are to be commended for making mobile internet faster.

Countries with the Largest Improvement
Mobile Download Speed

November 2016 – November 2017
Year Over Year Increase November 2017 Speed (Mbps)
Laos 249.5% 13.77
Vietnam 188.7% 19.54
Trinidad and Tobago 133.1% 11.68
Hong Kong (SAR) 102.6% 35.64
Lebanon 92.3% 24.50
Cyprus 90.2% 26.14
Republic of the Union of Myanmar 81.0% 11.72
Costa Rica 80.9% 7.89
Cambodia 70.5% 14.97
Sudan 68.9% 9.85

The tiny island of Reunion, a region of France off the coast of Africa, saw the largest improvement in download speed over fixed broadband in the world with a gain of 141.5%. Guatemala was second at 116.7% and Ghana third at 82.1%.

Countries with the Largest Improvement
Fixed Broadband Download Speed

November 2016 – November 2017
Year Over Year Increase November 2017 Speed (Mbps)
Reunion 141.5% 62.64
Guatemala 116.7% 12.04
Ghana 82.1% 18.96
Peru 80.1% 16.48
India 76.9% 18.82
Panama 76.6% 28.62
Italy 72.1% 31.58
Libya 67.6% 3.84
Argentina 62.2% 15.49
Kenya 60.9% 15.59

In some countries, notably Libya, a small gain in megabits per second (Mbps) can result in a large percentage increase. Although the actual performance improvement is small, we’re glad to see speeds moving in the right direction.

Speeds in some countries declined

On the flip side, there were far too many countries and regions where internet speeds decreased. The devastation of Puerto Rico’s mobile infrastructure by Hurricane Maria surely contributed to the island’s 39.8% drop in mobile download speed during the past twelve months. Uzbekistan saw a decline of 31.8% and Côte d’Ivoire 26.1%.

Countries with the Smallest Improvement
Mobile Download Speed

November 2016 – November 2017
Year Over Year Change November 2017 Speed (Mbps)
Puerto Rico -39.8% 8.53
Uzbekistan -31.8% 6.47
Côte d’Ivoire -26.1% 10.95
Brunei -23.4% 9.83
Thailand -19.7% 13.38
Iraq -16.8% 3.12
Algeria -10.8% 7.19
Nigeria -8.4% 9.90
Bangladesh -7.4% 4.97
Morocco -6.3% 15.03

Algeria saw the largest decrease in download speed over fixed broadband speed in the world at 23.9%. Dips of 9.1% in Ecuador and 6.5% in Latvia were less troubling but still moving in the wrong direction.

Countries with the Smallest Improvement
Fixed Broadband Download Speed

November 2016 – November 2017
Year Over Year Change November 2017 Speed (Mbps)
Algeria -23.9% 3.76
Ecuador -9.1% 10.40
Latvia -6.5% 47.25
Tunisia -3.2% 6.90
Iraq -1.1% 7.87
Syria -0.3% 7.12
Taiwan 0.5% 42.32
Maldives 1.0% 12.04
Namibia 1.2% 9.74
Jamaica 1.5% 19.11

Performance in the world’s most populous countries

With 57% of the world’s population, any internet performance improvements seen in the world’s ten most populous countries have a wide reach. Pakistan came out on top of the world’s largest countries with a 56.2% jump in mobile download speed during the past 12 months. India came in second in this category at 42.4% and Brazil third at 27.6% .

World’s Most Populous Countries
Improvement in Mobile Downloads

November 2016 – November 2017
Year Over Year Change November 2017 Speed (Mbps)
Pakistan 56.2% 13.08
India 42.4% 8.80
Brazil 27.6% 16.25
Japan 23.5% 21.67
United States 22.0% 26.32
Russia 19.2% 15.80
Indonesia 18.1% 9.73
China 3.3% 31.22
Bangladesh -7.4% 4.97
Nigeria -8.4% 9.90

At the other end of the spectrum, Nigeria’s mobile download speed actually dropped 8.4% and Bangladesh’s dipped 7.4%. China showed only a modest 3.3% increase in mobile download speed in 2017.

On the fixed broadband side, India came out on top of the world’s most populous countries for improvements to download speed during the past 12 months with an increase of 76.9%, beating China’s second place 42.3% increase and a 37.3% gain in the U.S.

World’s Most Populous Countries
Improvement in Fixed Broadband Downloads

November 2016 – November 2017
Year Over Year Change November 2017 Speed (Mbps)
India 76.9% 18.82
China 42.3% 61.24
United States 37.3% 75.94
Japan 20.7% 73.51
Indonesia 18.9% 13.38
Brazil 18.5% 17.80
Pakistan 15.5% 6.13
Russia 14.6% 36.90
Bangladesh 13.7% 16.14
Nigeria 3.8% 9.53

Nigeria again came out at the bottom of the world’s largest countries, this time with a 3.8% increase in download speed over fixed broadband.

We’ll revisit global internet speeds periodically here on our blog, but you can keep up to date on the latest trends in worldwide internet speeds by visiting the Speedtest Global Index. It’s updated every month with individual country data and, now, global averages. Keep track of your country’s performance and see how you rank against the world.

Ookla retains ownership of this article including all of the intellectual property rights, data, content graphs and analysis. This article may not be quoted, reproduced, distributed or published for any commercial purpose without prior consent. Members of the press and others using the findings in this article for non-commercial purposes are welcome to publicly share and link to report information with attribution to Ookla.

| March 2, 2021

World Bank Uses Speedtest Data to Analyze Internet Performance in Africa


Early last year, Ookla® joined the World Bank’s Development Data Partnership platform as part of our Ookla for Good initiative. Working with such talented, data-driven people focused on the public good is exciting and we have been thrilled to see proposed ideas quickly develop into full research projects. Niccolò Comini, a Consultant in the Chief Economist’s Office of the Infrastructure Vice Presidency at the World Bank, recently published one such project, “The Effect of COVID-19 Lockdown Measures on Internet Speed: An Empirical Analysis of 18 Countries in Africa.”

Taking into consideration the digital divide challenges faced by so many, the report highlights the importance of reliable internet access for all — not only during COVID-19, but also moving forward in a world increasingly reliant on internet connectivity for learning and economic success. The supporting research leveraged fixed and mobile broadband data from Speedtest Intelligence® for a period of 12 weeks, across the peak of the pandemic and implementation of “shelter in place” policies.

Key findings

  • Increase in internet usage – The COVID-19 pandemic and related lockdown measures have increased the amount of internet traffic around the world. Countries in Africa reflect this global trend, reporting higher data traffic during the months in which “stay at home” orders were established. However, this increase in traffic was not temporary; countries continue to reflect a surge in traffic compared to the pre-lockdown weeks.
  • Public and private sector reaction – As a consequence of higher internet usage, public and private stakeholders have promoted a wide range of measures to facilitate access to the internet. For instance, some regulators have enabled temporary spectrum bands to meet the increase in demand while private operators have offered more affordable data plans.
  • Internet speed is slow – On average, the data recorded by Ookla Speedtest® reported low mobile and fixed internet speeds across the 18 African countries surveyed. Speed was below 10 Mbps, considered the lower bound for a good quality broadband service, even before the onset of the pandemic. In contrast to what might be expected in OECD countries, mobile internet generally provides faster service than fixed.
  • Effect of the lockdown on internet speed was modest and temporary – Findings from the sample of 18 African countries indicate a negative effect of the lockdown on mobile (-17%) and fixed internet speeds (-5%), particularly in the first week of lockdown. Some countries also experienced a decline before the stay at home orders, suggesting that some activities shifted to remote connectivity before the official lockdown mandates. However, networks across the continent reacted well.
  • Public and private sector partnerships and cooperation was and remains critical for ensuring network resilience – The findings of this study demonstrate the resiliency of digital infrastructure in Africa and also highlight and reflect the benefits of partnership between public and private stakeholders to manage traffic surges. The development community should encourage and leverage these partnerships to achieve the ambitious objective of universal access to the internet.

Read the full World Bank report.

We are glad to work with organizations like the World Bank to provide data that can help improve the state of internet performance around the world. Learn more about Ookla for Good.

Ookla retains ownership of this article including all of the intellectual property rights, data, content graphs and analysis. This article may not be quoted, reproduced, distributed or published for any commercial purpose without prior consent. Members of the press and others using the findings in this article for non-commercial purposes are welcome to publicly share and link to report information with attribution to Ookla.

| December 10, 2020

Massive Expansions and Huge Improvements in Speed: The Worldwide Growth of 5G in 2020

The rapid expansion of 5G in countries across the globe was a bright spot in a year that needed one. But just how great is the news? We examined Speedtest Intelligence® data from over 60.5 million Speedtest® results during Q3 2020 to see how much speeds have improved, where download speeds are the fastest at the country and capital level, where 5G deployments have increased and what worldwide 5G coverage looks like now. We also looked at countries where 5G doesn’t yet reach to understand where good news might be on the horizon.

We have only included countries with commercially available 5G on these lists in order to provide a more accurate view of the performance consumers can reasonably expect. While our data shows results for many countries where 5G is not yet commercially available, these tests are likely results from engineers testing their own networks. In addition, we’re only providing analysis for countries with more than 200 samples during Q3 2020. The bars shown in our charts are 95% confidence intervals, which represent the range of values in which the true value is likely to be. Countries marked in tables with an asterisk first launched 5G commercially in 2020.

5G downloads were 954% faster than 4G at the global level

The worldwide median download speed over 5G was 954% faster than that over 4G during Q3 2020. Median upload speed over 5G was 311% faster than that over 4G. Consumers are eagerly adopting the new technology and many have wanted to measure the full throughput capacity of their network connection. In Q3 2020 alone, there were 4,324,788 Speedtest results over 5G.
Median-Speeds-Worldwide_1220-1

United Arab Emirates had the fastest 5G

United Arab Emirates topped the list of countries with the fastest top 10% 5G download speed in Q3 2020. Top 10% (or 90th percentile) measures the speeds seen by the fastest 10% of users and is a way to gauge what each country’s networks are capable of. Saudi Arabia was second for top 10% 5G download speed, Norway third, Spain fourth and Japan fifth.
Fastest-Countries-Top-5G-Download-Speed_1220-2

Another way to measure 5G performance is to look at median 5G download speed, which is a better predictor of the kind of performance most 5G customers can expect. Norway was the country with the fastest median download speed over 5G during Q3 2020. U.A.E. was second in this category, South Africa third, Saudi Arabia fourth and Spain fifth.
Fastest-Countries-Median-5G-Download-Speed_1220-2

It’s notable that Japan was on the list of 10 countries with the fastest top 10% 5G download speed but not on the list of 10 countries with the fastest median download speed over 5G. No matter how fast a country’s mobile infrastructure is, many other factors go into median 5G speeds, including device adoption and spectrum allocation.

Abu Dhabi tops list of 5G speeds in world capitals

Our examination of 5G performance for 18 world capital cities with 5G during Q3 2020 found that Abu Dhabi had the fastest median download speed over 5G at 546.81 Mbps. Riyadh was second, Madrid third, Seoul fourth and Kuwait City fifth. As we saw at the country level, median upload speed was much lower than download speed.
Median-5G-Performance-Capitals_1220-2

How 5G performance and time spent compare within regions

We looked more closely at 5G performance across several intergovernmental organizations and trade blocs to get a better sense of how countries are performing in comparison to their neighbors and trade partners. We also calculated Time Spent on 5G, the proportion of time that users with 5G-capable devices spent on 5G, for each country.

Italy had the fastest 5G among G7 countries, U.S. the slowest

Italy had the fastest median download speed over 5G of all the G7 countries. Japan was second, Canada third, the U.K. fourth and Germany fifth. The U.S. had the highest Time Spent on 5G, followed by Canada. For a deeper analysis of 5G in the U.K., read our previous coverage. Because France launched commercially available 5G only within the last couple of weeks, we have not included it on this table.
5G-Performance-G7-Countries_1220

South Africa was the only country in the African Union with sufficient 5G to rate

As we saw above, South Africa’s impressive median download speed over 5G ranked the country third in the world during Q3 2020. South Africa was only one of two countries in the African Union to have commercially available 5G during Q3 2020. The other, Madagascar, did not have sufficient samples to properly analyze. Time Spent on 5G in South Africa was very low, an indication that 5G is not yet widely available there.
5G-Performance-Africa_1220

South Korea had the fastest 5G in APEC countries, U.S. the slowest

A median download speed over 5G of 411.11 Mbps put South Korea comfortably at the top of Asia-Pacific Economic Cooperation (APEC) countries with the fastest 5G during Q3 2020. Thailand was second, Australia third, China fourth and Taiwan fifth. 5G speeds represented the largest improvement over 4G in the Philippines where the median download speed over 4G during Q3 2020 (9.36 Mbps) was substantially lower than that of other countries on this list.

South Korea and the U.S. tied for highest Time Spent on 5G among APEC countries during Q3 2020, followed by Hong Kong and Taiwan.
5G-Performance-APEC_1220

Spain had the fastest 5G in the E.U., Poland the slowest

Spain showed the fastest median download speed over 5G among the 11 European Union (E.U.) countries with sufficient 5G samples to rank during Q3 2020. Hungary was second, Finland third, Romania fourth and Ireland fifth. Spain’s median download speed over 5G also represented the largest gain over 4G among all of these countries, partially because Spain had the second slowest median download speed over 4G. France is not included on this list because 5G did not become commercially available in the country until after Q3 2020.

The Netherlands had the highest Time Spent on 5G among E.U. countries during Q3 2020, indicating that customers with 5G phones are able to spend far more time on 5G there than in other E.U. countries. Denmark was second for Time Spent on 5G among EU countries in Q3 2020 and Finland third.
5G-Performance-EU_1220

U.A.E had the fastest 5G in Gulf Cooperation Council Countries

With the second fastest median download speed over 5G in the world, U.A.E. was also the Gulf Cooperation Council (GCC) country with the fastest 5G during Q3 2020. Saudi Arabia was second and Qatar third. While Oman does have commercially available 5G, there were insufficient samples in the country during Q3 2020 to properly analyze performance.

5G represented the largest improvement over 4G in Kuwait and Bahrain, countries that had slower median download speeds over 4G than their neighbors.

Time Spent on 5G was relatively high in all the GCC countries on this list, except Bahrain, when compared to other countries in the world during Q3 2020. Qatar showed the highest Time Spent on 5G among GCC countries in Q3 2020 at 16.0%. U.A.E. was second and Saudi Arabia third.
5G-Performance-GCC_1220

Brazil was the only MERCOSUR country with sufficient 5G to rate

Brazil’s median download speed over 5G of 84.60 Mbps during Q3 2020 may not seem fast for 5G, but it still puts Brazil well ahead of other countries in the Southern Common Market (MERCOSUR), most of which do not yet have 5G at all. We did see 5G results in Colombia, but there were insufficient samples to properly compare.

Time Spent on 5G in Brazil during Q3 2020 was not quite one percent, indicating that customers do not have much access to 5G yet.
5G-Performance-MERCOSUR_1220

The U.S., Europe and Asia see widespread 5G coverage

Data from Cell Analytics™ shows a global view of 5G coverage in Q3 2020. This map, based on 5G connectivity data for opted-in Speedtest users, shows that 5G is spreading rapidly across the U.S., Europe, the Arabian Peninsula and Asia. In other regions, 5G is primarily available in larger cities, if at all.
Global-5G-Coverage_1220

99 countries worldwide had 5G, in 14,643 total cities

The number of countries with 5G deployments increased 62.3% between Q3 2019 and Q3 2020, with 99 countries having 5G deployments at the end of Q3 2020, according to the Ookla 5G Map™. There were 14,643 cities worldwide with 5G deployments at the end of Q3 2020, a 1,671% increase over Q3 2019. The total number of deployments worldwide was 17,046. The counts here and throughout this section include commercially available 5G as well as 5G networks with limited availability and those in pre-release.

Countries with the Most 5G Cities
Ookla 5G Map™ | Q3 2020
Country Numbers of Cities with 5G
United States 7,583
Germany 2,312
Austria 1,104
Netherlands* 1,009
Switzerland 554
Thailand* 325
Ireland 214
Puerto Rico 187
United Kingdom 169
Kuwait 97

The U.S. had the most cities with 5G deployments at the end of Q3 2020 with 7,583. Germany was second, Austria third, the Netherlands fourth and Switzerland fifth. A deployment is when a provider has some level of 5G presence in a city. A city can have multiple deployments when more than one provider is present.

Countries with the Largest Growth in Number of Deployments
Ookla 5G Map™ | Q3 2020
Country 5G Deployments as of Q3 2020 % Change Q3 2020 vs Q3 2019
Netherlands* 1,071 50,350%
Thailand* 451 32,401%
United States 7,808 21,566%
Germany 2,417 11,460%
Canada* 93 7,600%
Austria 1,173 4,918%
Ireland 236 4,180%
Poland 81 3,150%
Japan* 75 2,050%
Oman 50 2,000%

The Netherlands showed the largest percentage change in the number of 5G deployments between Q3 2019 and Q3 2020 with a 50,350% jump from two deployments in Q3 2019 to 1,071 in Q3 2020. Thailand saw the second largest percentage increase, the U.S. third, Germany fourth and Canada fifth.

Most early trials and commercial deployments of 5G spectrum allocations around the world have been centered around fallow swaths of the mid-band (3.3 GHz – 4.2 GHz) spectrum. With the recent commercialization of Dynamic Spectrum Sharing (DSS) across all major 5G infrastructure vendors, there is now increasing demand for 5G support on many existing 4G frequencies, ranging from 600 MHz to 2.5 GHz. In unique 5G markets like Japan, there is an additional need for the 4.5 GHz band as well as the millimeter wave (FR2).

In the United States, early deployments leveraged millimeter wave frequency bands in the 28 GHz and the 39 GHz, which delivered impressive speeds in a very constrained footprint. The rapid 5G deployment in the 600 MHz band has added a substantial nationwide 5G footprint — and with that, much wider 5G availability for many more Americans. With the recent merger between T-Mobile and Sprint, the deployment of 2.5 GHz spectrum has been significantly accelerated, which should improve both network efficiency and user experience on T-Mobile’s network. Additionally, next year’s availability of 5G Carrier Aggregation will allow T-Mobile to combine 600 MHz with 2.5 GHz to deliver improved 5G speeds on top of the existing nationwide footprint. In addition, DSS has recently been deployed by AT&T and Verizon, which allows operators to choose from existing low-band spectrum assets (850 MHz) and deliver both LTE and 5G at the same time. This feature alone doesn’t add a significant boost in perceived user experience, but will certainly improve the 5G footprint.

China showed the highest percentage of 5G test samples

Another way to measure 5G adoption is to look at the proportion of samples taken over 5G relative to the total number of samples on all technologies. Speedtest Intelligence is uniquely positioned to measure global growth in 5G because of the worldwide adoption of Speedtest apps. China had the highest percentage of 5G Speedtest results compared to other mobile technology types in Q3 2020 at 18.9%. South Korea was second, Hong Kong third, Puerto Rico fourth and Qatar fifth.

Countries with the Most 5G
Speedtest Intelligence® | Q3 2020
Country 5G Samples as a % of Total
China 18.9%
South Korea 15.8%
Hong Kong (S.A.R.)* 7.9%
Puerto Rico 6.7%
Qatar 5.7%
United States 5.5%
Netherlands* 4.9%
United Arab Emirates 4.6%
Kuwait 4.6%
Australia 4.2%

What 5G will look like in 2021

With recently announced device chipset advancements expected in 2021, including 5G Carrier Aggregation, operators will be able to combine two 5G frequency bands in the sub-6GHz (FR1) range, allowing not only faster speeds, but also greater coverage. More importantly, the ability to combine Frequency Division Duplexing (FDD) and Time Division Duplexing (TDD) FR1 channels will enable operators to leverage low-band frequencies (sub-1GHz) for uplink transmissions (user device to cell site), while combining the low-band with the mid-band (2.5 GHz, 3.5 GHz) on the downlink. This should significantly expand the availability of fast 5G download speeds across larger geographies.

Similarly, DSS — which is a stepping stone to standalone 5G and allows for the simultaneous delivery of 4G and 5G technology on the same spectrum slice — will enable operators to combine already-deployed FDD spectrum with dedicated mid-band spectrum for an enhanced standalone 5G experience. This will unlock the full potential of 5G networks, such as ultra low latency and network slicing, while delivering an improved mobile experience to users.

Where 5G fails to reach

During Q3 2020 Speedtest Intelligence showed 55 countries in the world (with more than 200 samples) where more than 20% of samples were from 2G and 3G connections (combined). These are countries where, in many cases, 5G is still aspirational. As excited as we are about the expansion of 5G, we do not want to see these countries left behind.

Countries That Still Rely Heavily on 2G and 3G Connections
Speedtest Intelligence® | Q3 2020
Country 2G & 3G Samples 4G Samples
Turkmenistan 74.9% 25.1%
Rwanda 52.3% 47.7%
Iraq 49.4% 50.6%
Belarus 46.5% 53.5%
Afghanistan 46.0% 54.0%
Antigua and Barbuda 40.2% 59.8%
Tajikistan 40.2% 59.8%
Suriname 39.7% 60.3%
Haiti 37.7% 62.3%
Syria 37.5% 62.5%
Ghana 36.0% 64.0%
Ethiopia 35.0% 65.0%
Mozambique 34.7% 65.3%
Benin 34.3% 65.7%
Angola 34.1% 65.9%
El Salvador 32.5% 67.5%
Moldova 31.8% 68.2%
Venezuela 30.3% 69.7%
Tanzania 30.0% 70.0%
Papua New Guinea 29.5% 70.5%
Jamaica 29.4% 70.6%
Sudan 29.2% 70.8%
Algeria 29.0% 71.0%
Namibia 28.5% 71.5%
Zimbabwe 28.5% 71.5%
Somalia 28.4% 71.6%
Nicaragua 28.1% 71.9%
Armenia 28.1% 71.9%
Bosnia and Herzegovina 28.1% 71.9%
Uzbekistan 27.8% 72.2%
Cameroon 27.5% 72.5%
Zambia 27.4% 72.6%
Uganda 26.6% 73.4%
Trinidad and Tobago 26.6% 73.4%
Honduras 26.5% 73.5%
Bangladesh 26.3% 73.7%
Burkina Faso 26.0% 74.0%
Ukraine 25.8% 74.2%
Nigeria 25.7% 74.3%
DR Congo 24.6% 75.4%
Costa Rica 24.3% 75.7%
Botswana 24.1% 75.9%
Libya 22.9% 77.1%
Azerbaijan 22.9% 77.1%
Ecuador 22.8% 77.2%
Mali 22.4% 77.6%
Mongolia 21.8% 78.2%
Maldives 21.6% 78.4%
Mauritius 21.3% 78.7%
Tunisia 21.0% 79.0%
Belize 20.7% 79.3%
Laos 20.5% 79.5%
Kenya 20.3% 79.7%
Paraguay 20.1% 79.9%
Côte d’Ivoire 20.0% 80.0%

In markets where 4G layers haven’t been deployed or substantially covered, end users fall back to the circuit-switched network (2G, 3G). These decades-old network technologies should be sufficient for basic voice and texting, social media, and navigation apps, but cannot deliver rich media experiences or video calling. Unfortunately, many countries on this list are places where consumers rely primarily on mobile phones for their internet connectivity.

5G is radically changing the speeds and capabilities of mobile networks around the world. If the current growth rate continues, it won’t be long before most nations have access to 5G. But there are nations and subsets of subscribers who may not see the benefits of 5G for years to come. We will continue reporting on 5G achievements across the globe and watching speeds in general on the Speedtest Global Index™.

Ookla retains ownership of this article including all of the intellectual property rights, data, content graphs and analysis. This article may not be quoted, reproduced, distributed or published for any commercial purpose without prior consent. Members of the press and others using the findings in this article for non-commercial purposes are welcome to publicly share and link to report information with attribution to Ookla.