| August 2, 2022

Find Out Which 50 Top European Vacation Destinations Have the Fastest Mobile Internet Speeds

Vacation season is upon us with millions of tourists already flocking to Europe’s top summer destinations despite the heat. Whether you’re a European looking for the best “staycation” or an American taking advantage of the exchange rates, our analysis of mobile internet performance in 50 popular destinations across the continent should help you see how well you will be able to connect (or disconnect, should you so choose) on vacation this summer.

We divided these towns and cities into four categories that might appeal to different types of travelers: big cities, beach life, cultural havens, and forest getaways. Then we compared Speedtest Intelligence® data for median download speeds and multi-server latency across each category. Of course many of the best vacation destinations belong in multiple categories, so be sure to check each list to find your favorite locale, and you’ll want to remember that your experience may vary based on your carrier’s roaming agreement.

“Big cities” with internet performance as exciting as the lifestyle

Oslo, Norway topped our list of 15 European vacation destinations full of big city excitement with the fastest mobile internet with a median download speed of 156.99 Mbps during Q2 2022. Perfect if you’re planning to do live updates from the Øya Festival. Two other Nordic cities rounded out the top three with Stockholm, Sweden showing a median download speed of 136.74 Mbps and Copenhagen, Denmark coming in at 133.16 Mbps. With speeds like these you should be able to host as many “see how glorious my vacation is?” video calls as you want.

There was a large gap between these three cities and the next fastest group, led by Lisbon, Portugal at 86.49 Mbps. Istanbul, Turkey and Rome, Italy had the lowest median download speeds on this list. These are still adequate mobile speeds, especially if you want to lean into the vacation experience and report back on it later (if ever).

Nicosia, Cyprus had the lowest median multi-server latency on our “big city” list at 17 ms during Q2 2022. This metric measures how quickly your device gets a response after you’ve sent out a request during three stages so you can understand if you’ll run into unnecessary lags in your connection. We’ve previously reported how latency in Europe increased while roaming, and higher latency could mean that you encounter glitches in video calls or even have to shut down apps to get your phone to respond in a timely fashion. Rome had the highest latency on this list.

Where internet speeds are fit for “beach life”

Nothing says summer like relaxing on the beach. If your beach vacation needs fast internet access, surf the web in Biarritz, France and Korčula, Croatia. These two locales had the fastest median download speeds on our beach life list during Q2 2022 at 155.65 Mbps and 133.67 Mbps, respectively, though this is not a statistically significant difference. Varna, Bulgaria and Faro, Portugal rounded out the top four at 104.00 Mbps and 101.74 Mbps, respectively.

Amalfi, Italy and Cefalù, Italy are good beach destinations if you’re looking for encouragement to log off. With median download speeds of 31.40 Mbps and 38.18 Mbps, respectively, during Q2 2022, your internet connection should be adequate (though less inspiring than the Tyrrhenian Sea).

Piran, Slovenia had the lowest median multi-server latency (20 ms) on this list while Cefalù had the highest (56 ms).

“Cultural havens” with research-ready internet speeds

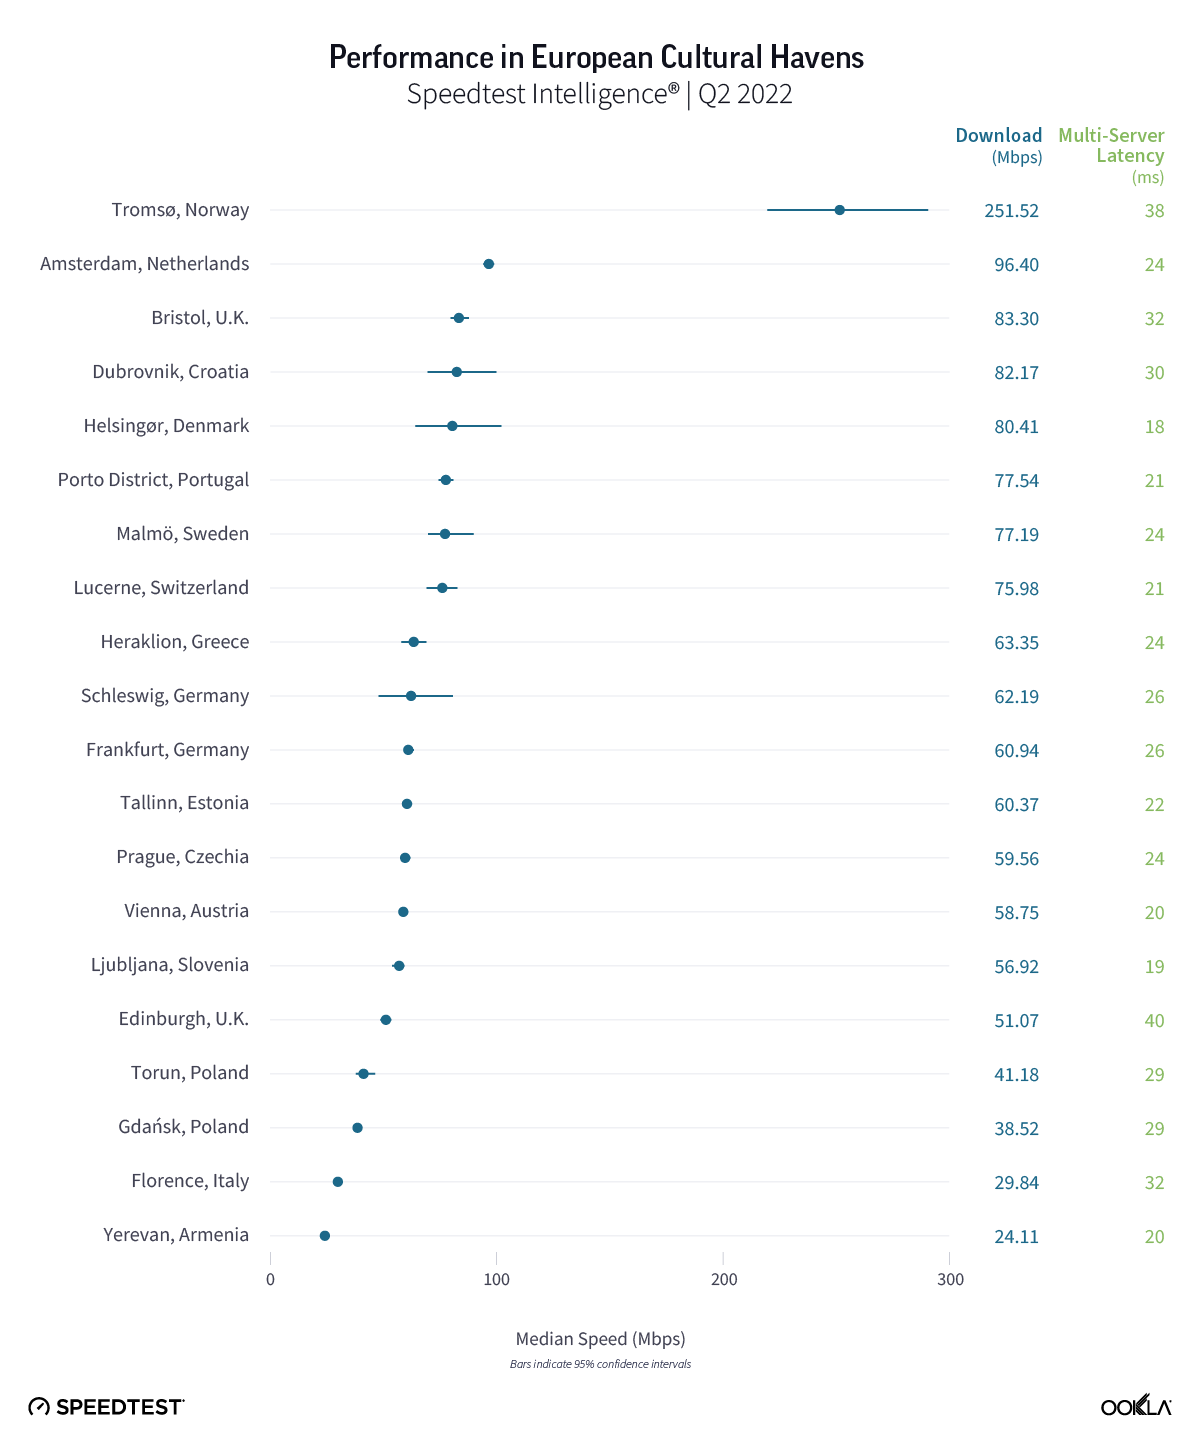
Travelers looking for maximum culture and fast internet speeds can do no better than Tromsø, Norway, which had a median download speed on mobile of 251.52 Mbps during Q2 2022, almost 2.3x faster than runner-up Amsterdam, Netherlands. Whether you’ve traveled to the northernmost bit of Norway for the wooden houses, one of the many summer festivals, or just to escape the heat, you’ll have fast enough internet to thoroughly research all the places you can go if you extend your vacation.

At the other end of the spectrum, if you’re traveling to Yerevan, Armenia or Florence, Italy to enjoy the museums and other cultural highlights of either, you might want to take pictures instead. With median download speeds of 24.11 Mbps and 29.84 Mbps, respectively, these cities were the slowest on this list. All the more reason to immerse yourself in the sights and wait to connect to Wi-Fi before uploading your photos.

Helsingør, Denmark had the lowest median multi-server latency, while Edinburgh, Scotland, United Kingdom had the highest. High latency can impede the performance of your phone even when you’re in an area with great speeds — something to keep in mind if you’re relying on your phone to locate the next Fringe venue.

Navigate internet speeds in “forest getaways”

Some people swear by the forest for the best vacations, especially in the heat of summer. The Alpine cities of Innsbruck, Austria and Digne-les-Bains, France had the fastest median download speeds over mobile on our list of forest getaways during Q2 2022 at 87.34 Mbps and 67.30 Mbps, respectively, though there was no statistical winner between the two. There was also no statistically significant difference between the median download speeds in Zakopane, Poland (43.52 Mbps); Killarney, Ireland (35.90 Mbps); and Sighișoara, Romania (30.48 Mbps). While you may prefer to be offline in the woods, having a strong and fast internet connection available can help you navigate with GPS, check out the names of all the flora you’re encountering, or reach help in case of emergency.

Sighișoara and Killarney had the lowest median multi-server latency on this list at 24 ms and 25 ms, respectively. Digne had the highest latency at 36 ms.

Regardless of where you travel, mobile internet performance will affect your trip. We hope this list prepares you for the getaway you want. If we missed your favorite European vacation destination, take a Speedtest® on Android or iOS to show off your speeds and tweet us your suggestions for next year’s list or share your ideas via this Google form.

Ookla retains ownership of this article including all of the intellectual property rights, data, content graphs and analysis. This article may not be quoted, reproduced, distributed or published for any commercial purpose without prior consent. Members of the press and others using the findings in this article for non-commercial purposes are welcome to publicly share and link to report information with attribution to Ookla.

| August 1, 2023

European Vacation: Your Guide to Roam Like at Home Performance this Summer

Summer is here and with it the August vacation season that most of Europe has been waiting for. We’re here with fresh data from Speedtest Intelligence® to help you know in advance if your phone will be a help or a hindrance on your travels. We’ve examined results from Android devices in the European Union (EU) and the United Kingdom (U.K.) during Q2 2023 and included data on 5G performance to see if “Roam Like at Home” is living up to its promise.

5G boosts European roaming speeds but latency varies 

Speed and latency are two important indicators of online performance. Speed will have a greater effect on streaming content while latency will affect gaming and video chatting. Both come into play while browsing online maps for that hot new gelato place your friends told you about. 

While the EU extended “Roam Like at Home” regulations until 2032, our previous analyses demonstrated that mobile speeds are usually slower when roaming than when exploring your home country. The actual speeds vary dramatically based on roaming agreements between mobile operators, something you can’t really control unless you’re prepared to do the research then shop for a whole new plan before your trip. What you can control is whether you spring for 5G before your big trip. The data below represents the local speeds and multi-server latency for each country as well as those experienced by residents of the named country while roaming in the EU or the U.K. during Q2 2023.

Roaming speeds can’t live up to local performance

Median Mobile Roaming Performance in Europe
Speedtest Intelligence | Q2 2023
Country Local Download (Mbps) Roaming Download (Mbps) Local 5G Download (Mbps) Roaming 5G Download (Mbps)
Austria 59.28 42.77 161.00 80.51
Belgium 48.00 59.86 157.23 124.64
Bulgaria 78.27 48.97 252.75 93.24
Croatia 73.65 47.86 184.29 124.38
Cyprus 56.93 40.83 197.22 64.24
Czechia 46.50 31.96 104.36 72.26
Denmark 118.48 51.74 206.95 115.82
Estonia 64.99 77.51 * *
Finland 78.00 53.43 217.13 106.54
France 61.64 43.46 187.42 95.56
Germany 46.30 39.54 114.07 84.27
Greece 57.41 66.17 143.26 153.28
Hungary 40.44 48.28 85.12 132.98
Ireland 34.49 36.10 98.70 85.38
Italy 36.97 37.68 130.85 99.38
Latvia 59.73 65.13 220.51 146.15
Lithuania 64.70 53.04 * *
Luxembourg 74.86 46.88 * *
Malta 44.56 48.11 109.97 110.80
Netherlands 96.77 37.61 128.04 87.84
Poland 42.14 34.23 78.82 99.51
Portugal 57.86 39.91 212.95 79.88
Romania 43.34 59.59 153.35 99.84
Slovakia 43.16 41.53 139.53 85.16
Slovenia 52.73 49.86 145.83 95.50
Spain 32.33 35.77 85.75 116.48
Sweden 84.00 51.24 160.93 129.43
United Kingdom 40.74 48.06 108.74 98.92

Although EU residents can roam call, text, and surf without additional charges, a drop in speed is an issue while roaming according to Q2 2023 data. Residents from 17 countries showed faster local download speeds than roaming speeds when considering results over all technologies during Q2 2023. The 11 exceptions were Romania (which was much faster roaming), Belgium, Hungary, Estonia, the U.K, Greece, and Spain, which all showed faster roaming speeds, and Latvia, Malta, Ireland, and Italy which showed only slightly improved speeds.  

While roaming speeds varied widely based on country of origin, every country on this list saw much higher median download speeds when roaming on 5G than roaming on all technologies. Despite this uplift, 20 countries showed faster local 5G download speeds than roaming 5G speeds during Q2 2023. The exceptions were Hungary, Spain, and Poland, which all saw faster 5G roaming than locally, while Greece had marginally better 5G roaming than at home, and people from Malta didn’t really see any major difference. Estonia, Lithuania, and Luxembourg did not have enough 5G samples to qualify for analysis.

Latency suffers awfully when roaming

Median Mobile Roaming Latency in Europe
Speedtest Intelligence | Q2 2023
Country Local Multi-server Latency (ms) Roaming Multi-server Latency (ms) Local 5G Multi-server Latency (ms) 5G Multi-server Latency (ms)
Austria 32.19 91.24 30.96 111.08
Belgium 36.51 84.96 31.89 67.61
Bulgaria 31.72 125.60 26.41 124.63
Croatia 39.03 85.25 35.96 80.37
Cyprus 27.90 200.18 23.52 184.68
Czechia 34.72 80.18 30.77 78.72
Denmark 29.47 94.77 28.08 81.85
Estonia 33.10 87.00 * *
Finland 33.67 102.84 32.16 99.14
France 46.97 92.61 44.39 87.49
Germany 41.78 87.19 39.07 77.57
Greece 38.16 137.29 34.63 132.91
Hungary 36.27 85.39 35.06 77.26
Ireland 36.21 116.62 31.70 118.47
Italy 50.87 100.20 49.96 93.87
Latvia 29.88 101.91 26.28 94.70
Lithuania 34.03 107.79 * *
Luxembourg 33.45 67.70 * *
Malta 47.44 146.57 38.69 135.43
Netherlands 33.24 83.25 31.17 79.81
Poland 42.41 108.69 40.25 100.36
Portugal 35.98 123.05 31.62 126.54
Romania 40.65 122.91 34.22 121.21
Slovakia 30.47 80.28 26.39 70.96
Slovenia 30.61 76.68 27.70 75.27
Spain 51.53 112.81 47.11 102.94
Sweden 37.52 114.69 32.97 99.48
United Kingdom 50.45 111.01 46.04 107.59

Residents of every country surveyed had a much higher multi-server latency when roaming during Q2 2023. This is because roaming signals are routed through a user’s home network, making latency a significant issue for Europeans when traveling. The difference was smallest in Italy and France where locals had about a 97% higher latency when roaming compared to at home. On the other end of the scale, residents of Cyprus saw over a 615% higher latency while roaming compared to at home. A high latency means a long response time for any request you send over the internet, perhaps adding more frustration to your vacation than you would want.

The results were similar over 5G with Italy showing the smallest difference between latency while roaming and at home (about 88% greater) and Cyprus having the largest difference (about 685%). Surprisingly, 5G did not reliably improve multi-server latency. 

What this data tells you is that it’s worth upgrading to 5G before a trip if speed is your main concern. Whether 5G will help you with your latency will depend heavily on which country you are traveling from. Regardless, you should expect a high latency while roaming. Plan ahead accordingly.

Outbound roaming speeds vary dramatically

As discussed above, roaming speeds depend heavily on where you are traveling from, where you are traveling to, and what agreements your home mobile operator has with operators in the country you’re visiting. That said, it’s fun to look at what’s possible, so we looked at the very best and very worst roaming speeds in Europe during Q2 2023.

Fastest roaming speeds in Europe

Customers from Italy roaming in Portugal saw one of the fastest median roaming download speeds over 5G in all of Europe during Q2 2023 at 317.94 Mbps. Estonians roaming in Finland saw a 278.69 Mbps median 5G download speed, and Finns in Sweden experienced a median 5G download of 252.57 Mbps. 

Looking at the highest results from all technologies combined, Latvians roaming in Finland experienced a median download speed of 137.49 Mbps, while Greeks saw median download speeds of 129.75 while roaming in Bulgaria and 125.83 Mbps while roaming in Austria.

Slowest roaming speeds in Europe

On the other end of the scale, Slovakian visitors to Poland had one of the slowest median download speeds over all technology while roaming during the same time period at 10.82 Mbps. Polish roamers saw a median download speed of 13.27 Mbps in the U.K. and 14.78 Mbps in Romania. Ten of the 20 slowest roaming speeds on our country-by-country list for all technologies were for Europeans roaming in the U.K. This means that travelers going to the U.K are not only seeing poorer performance, they could also be paying more for the privilege as they do not benefit from “Roam Like at Home” regulations.

Germans in Italy had the slowest median 5G download speed on our list during Q2 2023 at 33.64 Mbps. Austrians in the U.K. saw a median download speed over 5G of 41.57 Mbps, and Portuguese roamers in Spain experienced a median download speed over 5G of 44.18 Mbps.

Whether you choose to roam, pick up a local SIM or eSIM, or simply spend less time online, we hope this information helps you make the most of your vacation. If you have an extra minute between activities, take a Speedtest® to see how your performance compares. 

Ookla retains ownership of this article including all of the intellectual property rights, data, content graphs and analysis. This article may not be quoted, reproduced, distributed or published for any commercial purpose without prior consent. Members of the press and others using the findings in this article for non-commercial purposes are welcome to publicly share and link to report information with attribution to Ookla.

| May 1, 2023

Three Grows from Challenger to 5G Market Leader in the U.K., Ireland, and Austria

In our recent analysis of 5G performance across Europe, we noted that challenger mobile operators often outperform incumbents — strong results from Three across its footprint are proof of that. This article examines the secret sauce behind Three’s performance across three European countries — the United Kingdom, Ireland, and Austria. 

Key takeaways

  • Dedicated 5G spectrum matters. Three’s approach to spectrum is similar across the board — it uses dedicated 5G spectral resources, and it has access to at least 100 MHz contiguous spectrum in C-band, which is the ITU’s minimum technical requirement to meet 5G performance requirements. 
  • Network investment pays off. Three continues to focus on 5G network investment, which in turn helped to drive 5G performance. 
  • Sustainability futureproofs networks. Three looks at several energy efficiency initiatives, including smart network “sleeping mode” and retiring legacy technologies to create a network that’s ready for tomorrow’s demands. 

Three leads on speeds

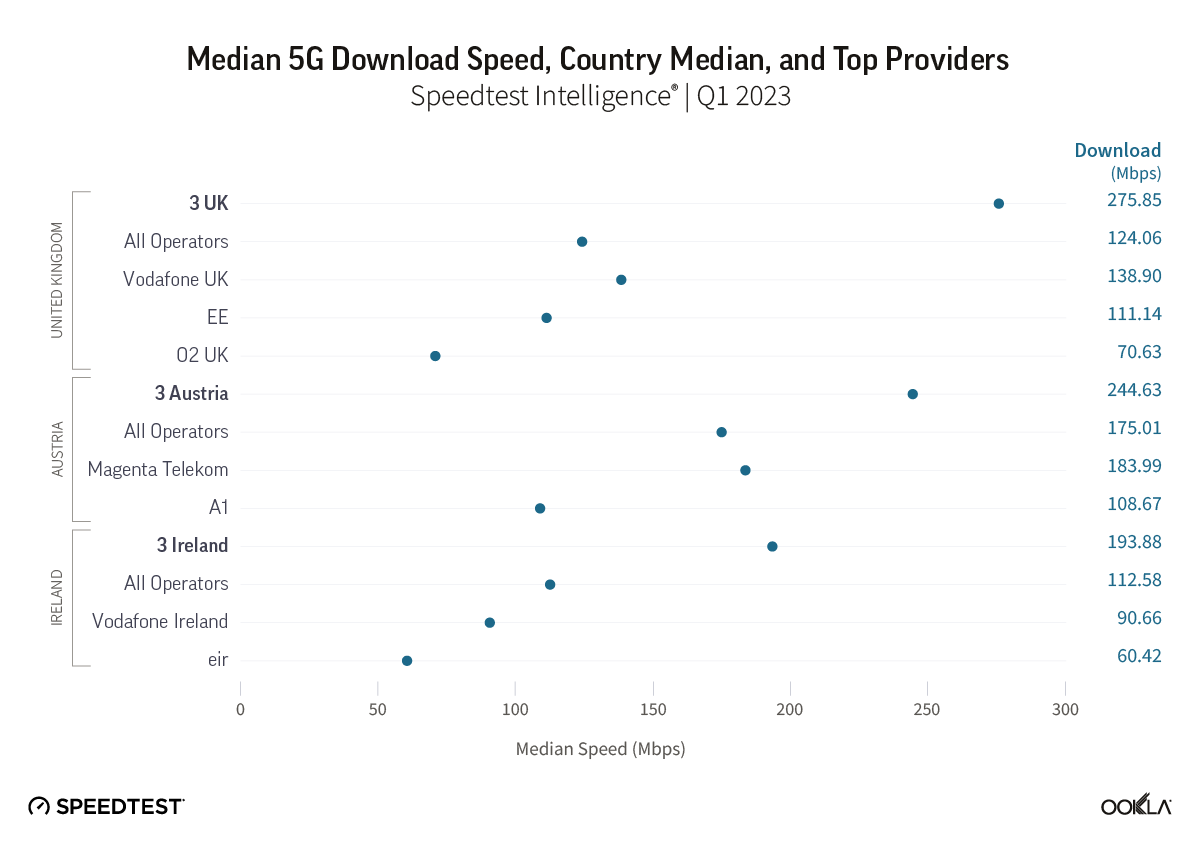
Chart of Median 5G Download Speed, Country Median, and Top Providers

Austria, Ireland, and the U.K. belong to the 5G High Performers cluster, which means that they share many of the characteristics of 5G leaders — markets with median 5G download speeds typically greater than 300 Mbps — having made an adequate spectrum allocation for 5G use and fostered competition between operators, which has helped spur network investment. However, they lag behind 5G Leaders based on their level of network densification. Using Speedtest Intelligence® data, we analyzed 5G performance in Q1 2023 across Austria, Ireland, and the U.K. Three was a leading operator in each of these countries for median 5G download speed. 

3UK was 2.2 times faster than the median 5G speed for the U.K., 3 Austria surpassed the country-level performance by 1.36 times, while Three Ireland was 64% faster than the median country-level 5G download speed. Three was a late entrant into the telecom scene — having launched 20 years ago in March 2003 — often skipping 2G network rollout and being the first company to introduce “All you Can Eat” plans. 

Three’s approach to spectrum pays off

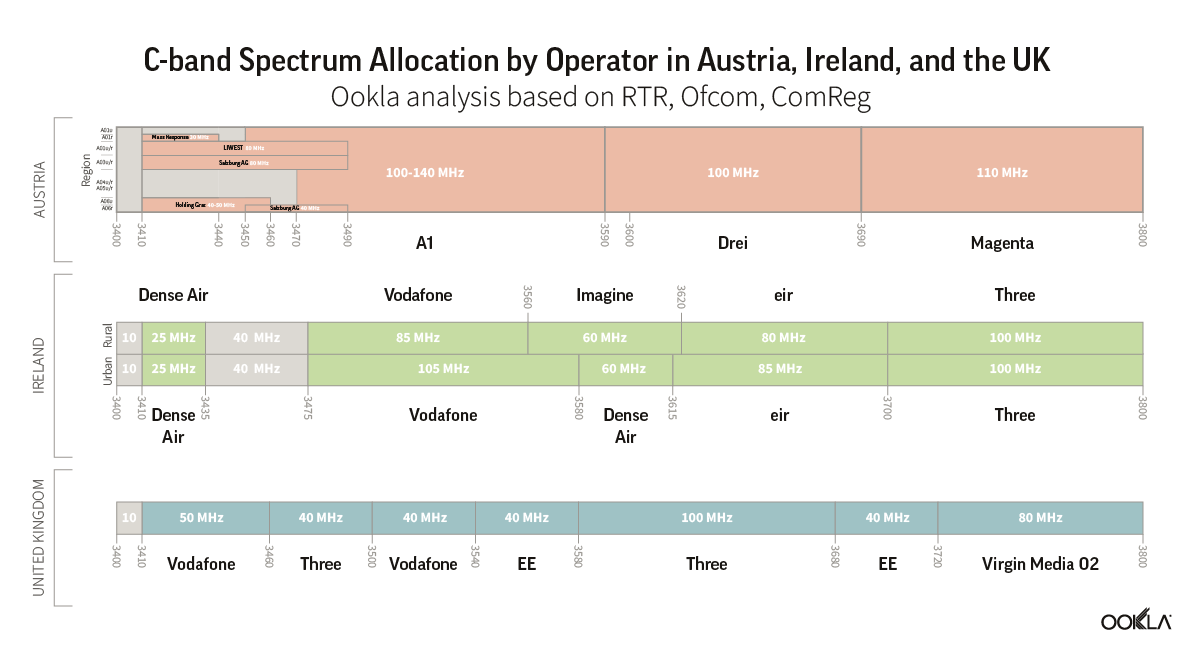
As our previous analysis shows, access to a dedicated 5G C-band spectrum enabled faster download speeds, especially if such spectrum is contiguous. The ITU minimum technical requirements to meet 5G performance requirements identify at least 100 MHz channels per operator. All Austrian operators have access to just that: 3 Austria 100 MHz spectrum and Magenta 110MHz, nationally. A1 has access to a block of 100-140 MHz in C-band, depending on the region. 

Chart of C-band Spectrum Allocation by Operator in Austria, Ireland, and the UK

Three Ireland was the only operator to receive a continuous block of 100 MHz spectrum nationally, both in urban and rural areas. Vodafone and eir have different spectrum holdings: Vodafone has 105 MHz in urban areas and 85 MHz in rural areas, eir 85 MHz (urban) and 80 MHz (rural). Imagine — a wireless broadband provider — holds 60 MHz spectrum in rural areas, Dense Air, 60 MHz in urban and 25 MHz in rural. Furthermore, Three uses a dedicated 5G spectrum instead of Dynamic Spectrum Sharing (DSS), which explains its superior performance compared to other operators. 

In the U.K., Three also holds an advantageous position regarding spectrum ownership — it has a block of 140MHz frequency across several 5G spectrum bands, including a 100 MHz block of continuous spectrum in the C-band. In addition, the operator has been working on adding 10 Gbps backhaul to its sites everywhere to boost the 5G experience. 

5G Availability on the rise

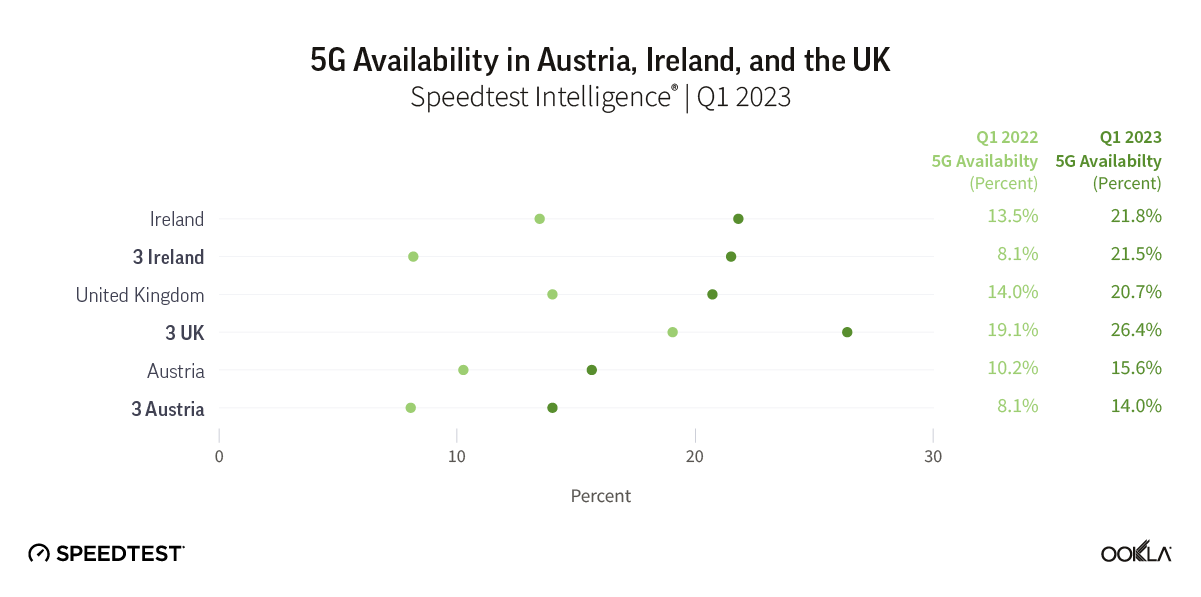
Chart of 5G Availability in Austria, Ireland, and the UK

Our research shows that access to low band spectrum in part impacts the operator’s 5G Availability but affordability and availability of 5G-capable smartphones are essential too. Ireland had top 5G Availability in Q1 2023 at 21.6%, increasing by 8.1 ppts year-on-year. 

The number of 5G subscriptions has been on the rise in Ireland; ComReg reported a total of 988,164 5G mobile subscriptions in Q4 2022 — a 152% year-on-year increase — accounting for 11.1% of all subscriptions in Ireland. Three Ireland’s 5G network covers 85% of the Irish population. To expand the pool of 5G users, in January 2023, Three Ireland, as the first Irish mobile operator, offered 5G to all customers as standard at no additional fee, initially to new customers. Customers need a 5G-enabled device to access the 5G network and be within 5G network reach. Elaine Carey, Chief Commercial Officer (CCO) for 3 Ireland and 3 UK, said offering free 5G across all its mobile plans would provide customers with a “better-connected life.” Currently, Vodafone and Eir only offer 5G to customers with 5G-enabled plans. Our data shows that during Q1 2023, Three’s 5G Availability increased by 5.5 ppt while the country average increased only by 1.9 ppt, proving that the strategy paid off. 

In the U.K., 5G Availability increased by 6.7 ppt, driven by the growing adoption of 5G smartphones and coverage. According to the Ofcom Connected Nations 2022 report, the pool of 5G capable devices increased from around 10% in 2021 to 20% in 2022, while data traffic carried over 5G tripled — from 3% of all traffic in 2021 to over 9% in 2022. In April 2023, as part of the new Wireless Infrastructure Strategy, the government set out its ambitions for all populated areas to be covered by “standalone” 5G by 2030, increasing from 77% of the population already having access to 5G from one provider using 5G NSA. 

In Austria, 5G Availability passed the 15% mark in Q1 2023, up from 10% a year prior. Despite coverage obligations related to network deployment set out by the Federal Ministry for Digital and Economic Affairs (BMDW) in November 2019 as part of the operators’ 5G license, the 5G adoption is lackluster compared to other countries. For example, Drei Austria had to provide 5G coverage to at least 15% of the population in all provincial cities with more than 50,000 inhabitants by the end of 2020 and 40% by the end of 2023. Furthermore, Drei wants to increase its 5G coverage to three-quarters of all households and companies by the end of 2023 and provide 222 previously underserved communities with mobile broadband internet by using additional frequencies in the 700 and 1500 MHz bands for 5G. In September 2022, Drei Austria announced the launch of 5G SA, dubbed 5G+, making it available to 1.3 million homes and businesses. The company also offers mobile internet with a residential bandwidth guarantee, which it claims is the world’s first. 

Network investment continues

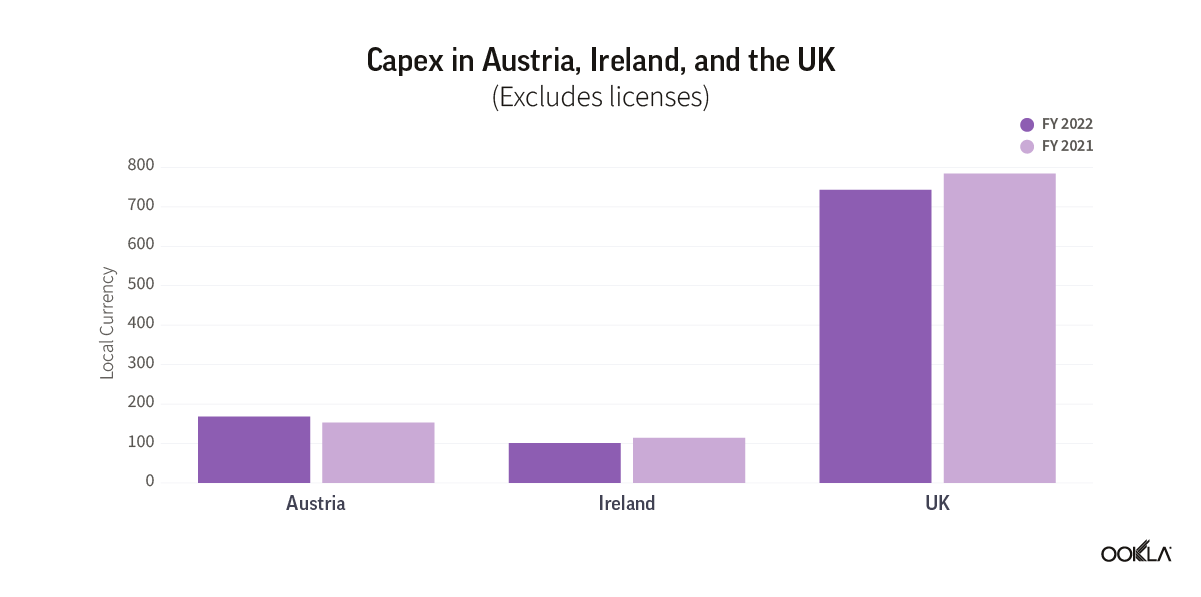
Chart of Capex in Austria, Ireland, and the UK

In Ireland, Three worked on an ongoing network transformation program investing over €2 billion, including an €820 million investment in upgrading and expanding the network into Three’s digital transformation. 

In March 2023, Drei announced a total investment program for 5G in Austria of €1.2 billion beyond 2025.”Our largest network offensive in the company’s history, which we announced last year, has got underway. We are investing 1.2 billion Euros in the nationwide expansion of our new 5G network beyond 2025,” said Drei CTO Matthias Baldermann during the 2022 results announcement. In Austria, Drei utilized new spectrum to the full extent, leading-edge equipment, and installed powerful massive MIMO antennas on each site — a new range with the new antenna. As a result, improvement in terms of performance and capacity for customers can be measured in improved consumer satisfaction. 

Three UK has invested over £2 billion to transform its network and IT infrastructure as part of a five-year program. Over the past five years, Three has undergone an immense transformation — it was the first operator to deploy cloud core. There are 19 data centers across the U.K. — compared to the previous three core data centers. With 19 data centers, there is a good balance between what goes in each and what needs to serve the customer more quickly. The edge data center, collocated with other providers, deals with straight internet access and peering to get traffic from the networks to the source. It also comes with additional efficiency in terms of Capex and Opex — the cost of 19 data centers is the same as the three legacy ones.

From tower owners to tenants 

Following the path of a general industry direction, Three has outsourced the management of its network assets. In November 2022, Spanish mobile tower operator – Cellnex Telecom – completed the acquisition of the U.K. telecoms tower assets of Three UK. This was the last one of the multi-country deals signed by CK Hutchinson and Cellnex in November 2020, whereby Cellnex acquired a total of 24,600 towers across the U.K., Italy, Ireland, Austria, Sweden, and Denmark for approximately €10 billion ($10.35 billion). 

Not only performance but energy efficiency is also top of mind 

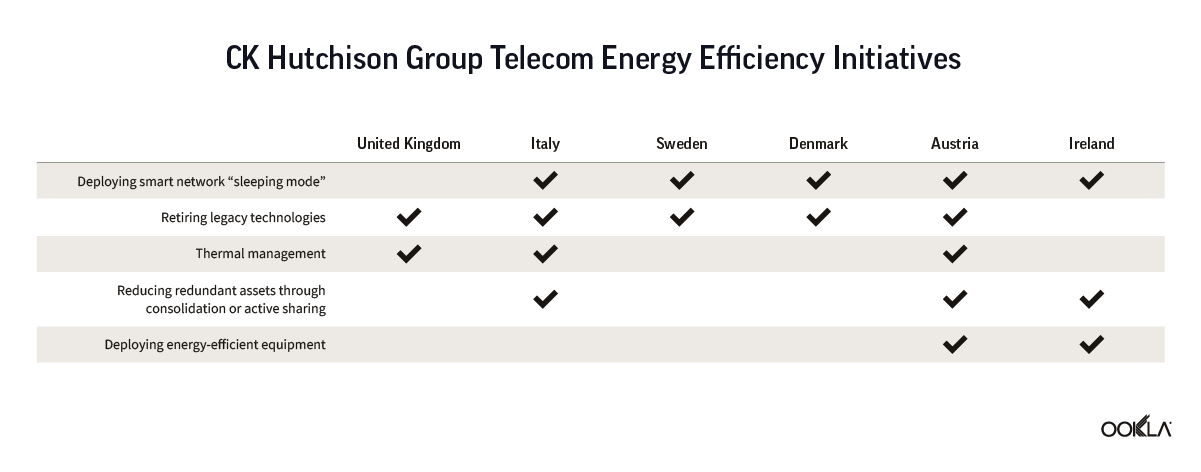
In Ookla’s Take on Telco Trends in 2023, we have predicted that the quest for Net Zero becomes more urgent as cost-cutting and optimizing operations are top-of-mind for telcos in 2023 as energy prices and broader inflation remain high. We are already seeing operators look to sustainable solutions, such as wind and solar farmers, to supply sites with green energy instead of commercial electricity, partially to reduce costs. CK Hutchison Group Telecom 2022 Annual Results showcased a wider range of energy efficiency initiatives deployed across its European footprint.

Chart of CK Hutchison Group Telecom Energy Efficiency Initiatives

Robert Finnegan, Chief Executive of Three Ireland and Three UK, said the company was satisfied with its 2022 financial performance despite the additional impacts of inflation and soaring energy costs. “As part of our sustainability strategy, we continued to invest in energy-saving initiatives across the network infrastructure in 2022, which helped mitigate against energy inflation.” Furthermore, across its footprint, Three has deployed various strategies such as smart network “sleeping mode” and energy efficiency equipment, the retirement of legacy technology, and the reduction of redundant assets through consolidation and active sharing, and thermal management. Three Ireland implemented “proof of concept” for on-site solar generation on mast sites as solar panels are more energy efficient and greener. 

During the Connectivity Insights session at MWC 2023, Iain Milligan, Chief Network Officer of Three UK, shared that the operator is currently undergoing some trials with network vendors to address energy efficiency via a mix of features. From a hardware perspective — they deploy the most recent hardware, which brings efficiency; feature rollout in the radio also brings gains in multiple aspects. Lastly, analytics play an essential role, too, helping to identify peak usage times compared to quieter periods. All of these can bring 60% improvements. 

We will continue to monitor 5G performance progress closely using Speedtest Intelligence. If you want to learn more about how Speedtest Intelligence can help you benchmark your 5G performance against competitors, please inquire here.

Ookla retains ownership of this article including all of the intellectual property rights, data, content graphs and analysis. This article may not be quoted, reproduced, distributed or published for any commercial purpose without prior consent. Members of the press and others using the findings in this article for non-commercial purposes are welcome to publicly share and link to report information with attribution to Ookla.

| March 23, 2022

Ireland Puts 5G in the Fast Lane

The Irish government has recently launched a new national digital strategy, “Harnessing Digital – The Digital Ireland Framework,” to drive and enable digital transformation of the Irish economy and society. The government committed to enhance digital infrastructure by making connectivity available to everyone, including bringing 5G to all populated areas by 2030. We analyzed Speedtest Intelligence® data from Q3-Q4 2021 to see how Irish 5G speeds compared to those of Ireland’s regional peers and examined how Irish operators’ 5G networks performed across the country and against each other. 

Ireland has already awarded mid-band 5G spectrum 

Ireland was one of the first countries to assign spectrum in the 3.4 GHz – 4.2 GHz band, C-band spectrum, which is considered a sweet spot for 5G as it strikes a good balance between capacity and coverage. In June 2017, the Irish regulator, ComReg, granted new 3.6 GHz licenses to five operators for a total of €78m, consisting of €60.5m in upfront fees and around €17.7m in spectrum usage fees. The following companies purchased a total of 350 MHz of TDD spectrum, which has been assigned at a regional basis: 

  1. Vodafone Ireland received 85 MHz in rural regions and 105 MHz in the cities. The operator launched 5G services across five Irish cities in August 2019. 
  2. Eir Ireland obtained 80MHz in the rural regions and 85 MHz in the cities, and went live with 5G in December 2019.
  3. Three Ireland was the only operator to receive a nationwide spectrum — 100 MHz nationally — and switched on its 5G network in September 2020. 
  4. Imagine Communications Ireland (Imagine), a fixed wireless operator, won 60 MHz in each of Ireland’s rural provinces. This will offer fixed wireless broadband to homes that are outside of the high speed broadband coverage and within the National Broadband Plan intervention area. 
  5. Airspan Spectrum Holdings (Airspan), a new entrant to the Irish market focused on smart utilities, transportation, and public safety, obtained 25 MHz in rural regions and 60 MHz in cities. It has since been rebranded to Dense Air Limited. 

Provisional spectrum assignment in the 700 MHz band 

A decision has been made at the European level to allow operators to use the 694-790 MHz frequency band (the 700 MHz frequency band) across Europe. In Ireland, RTÉ has been utilizing this band to broadcast national digital terrestrial television (DTT) but that license expired in March 2020. In order to free up the 700 MHz spectrum bands, services had to vacate these frequencies. 

New regulation under the Wireless Telegraphy Act introduced in April 2020, allowed for the temporary assignment of licenses in the 700 MHz band to “help alleviate congestion on the telecommunications networks during the exceptional and extraordinary situation raised by the Covid-19 situation.” Initially, awarded for the period of three months, the temporary licenses have been extended to an indeterminate date when a spectrum auction will take place. Awarding a permanent 700 MHz license is critical, as low-band spectrum has very good propagation characteristics, which enable a wider geographic coverage footprint. This will be key to achieving the goal of covering populated areas with 5G by 2030.

Ireland 5G performance compared to its European peers 

In our recent post “5G in Europe: Reflecting on the Progress So Far and Mapping the Future”, we looked at how different European countries stacked up versus each other and international peers. Here we compare 5G in Ireland against its peers’ 5G. During the second half of 2021, France (190.17 Mbps) and Switzerland (188.27 Mbps) topped our list with the fastest median 5G download speed, followed by the United Kingdom (176.22 Mbps), Ireland (162.46 Mbps), Germany (155.87 Mbps), and Netherlands (142.55 Mbps). Interestingly, despite all of the French operators launching 5G service in December 2020, relatively late compared to other analyzed countries, they achieved top median download speeds due to substantial network investments. 

Switzerland, however, had the fastest median upload speed over 5G at 35.51 Mbps during Q3-Q4 2021, followed by the Netherlands (31.29 Mbps), Germany (25.80 Mbps), Ireland (21.20 Mbps), France (15.19 Mbps), and the U.K. (14.79 Mbps). 

The Irish regulator, ComReg published the number of mobile 5G subscribers for the first time in Q3 2021. 5G mobile voice and mobile broadband (MBB) subscriptions increased 31.4% quarter over quarter from 298,479 in Q3 2021 to 392,082 in Q4 2021, accounting for 3.9% and 5.0% of subscriptions at the same time. However, operators are still looking for ways to stimulate market adoption. For instance, in order to increase 5G market adoption, eir has announced that as of November 1, 2021, 5G was enabled on all market mobile plans at no additional cost

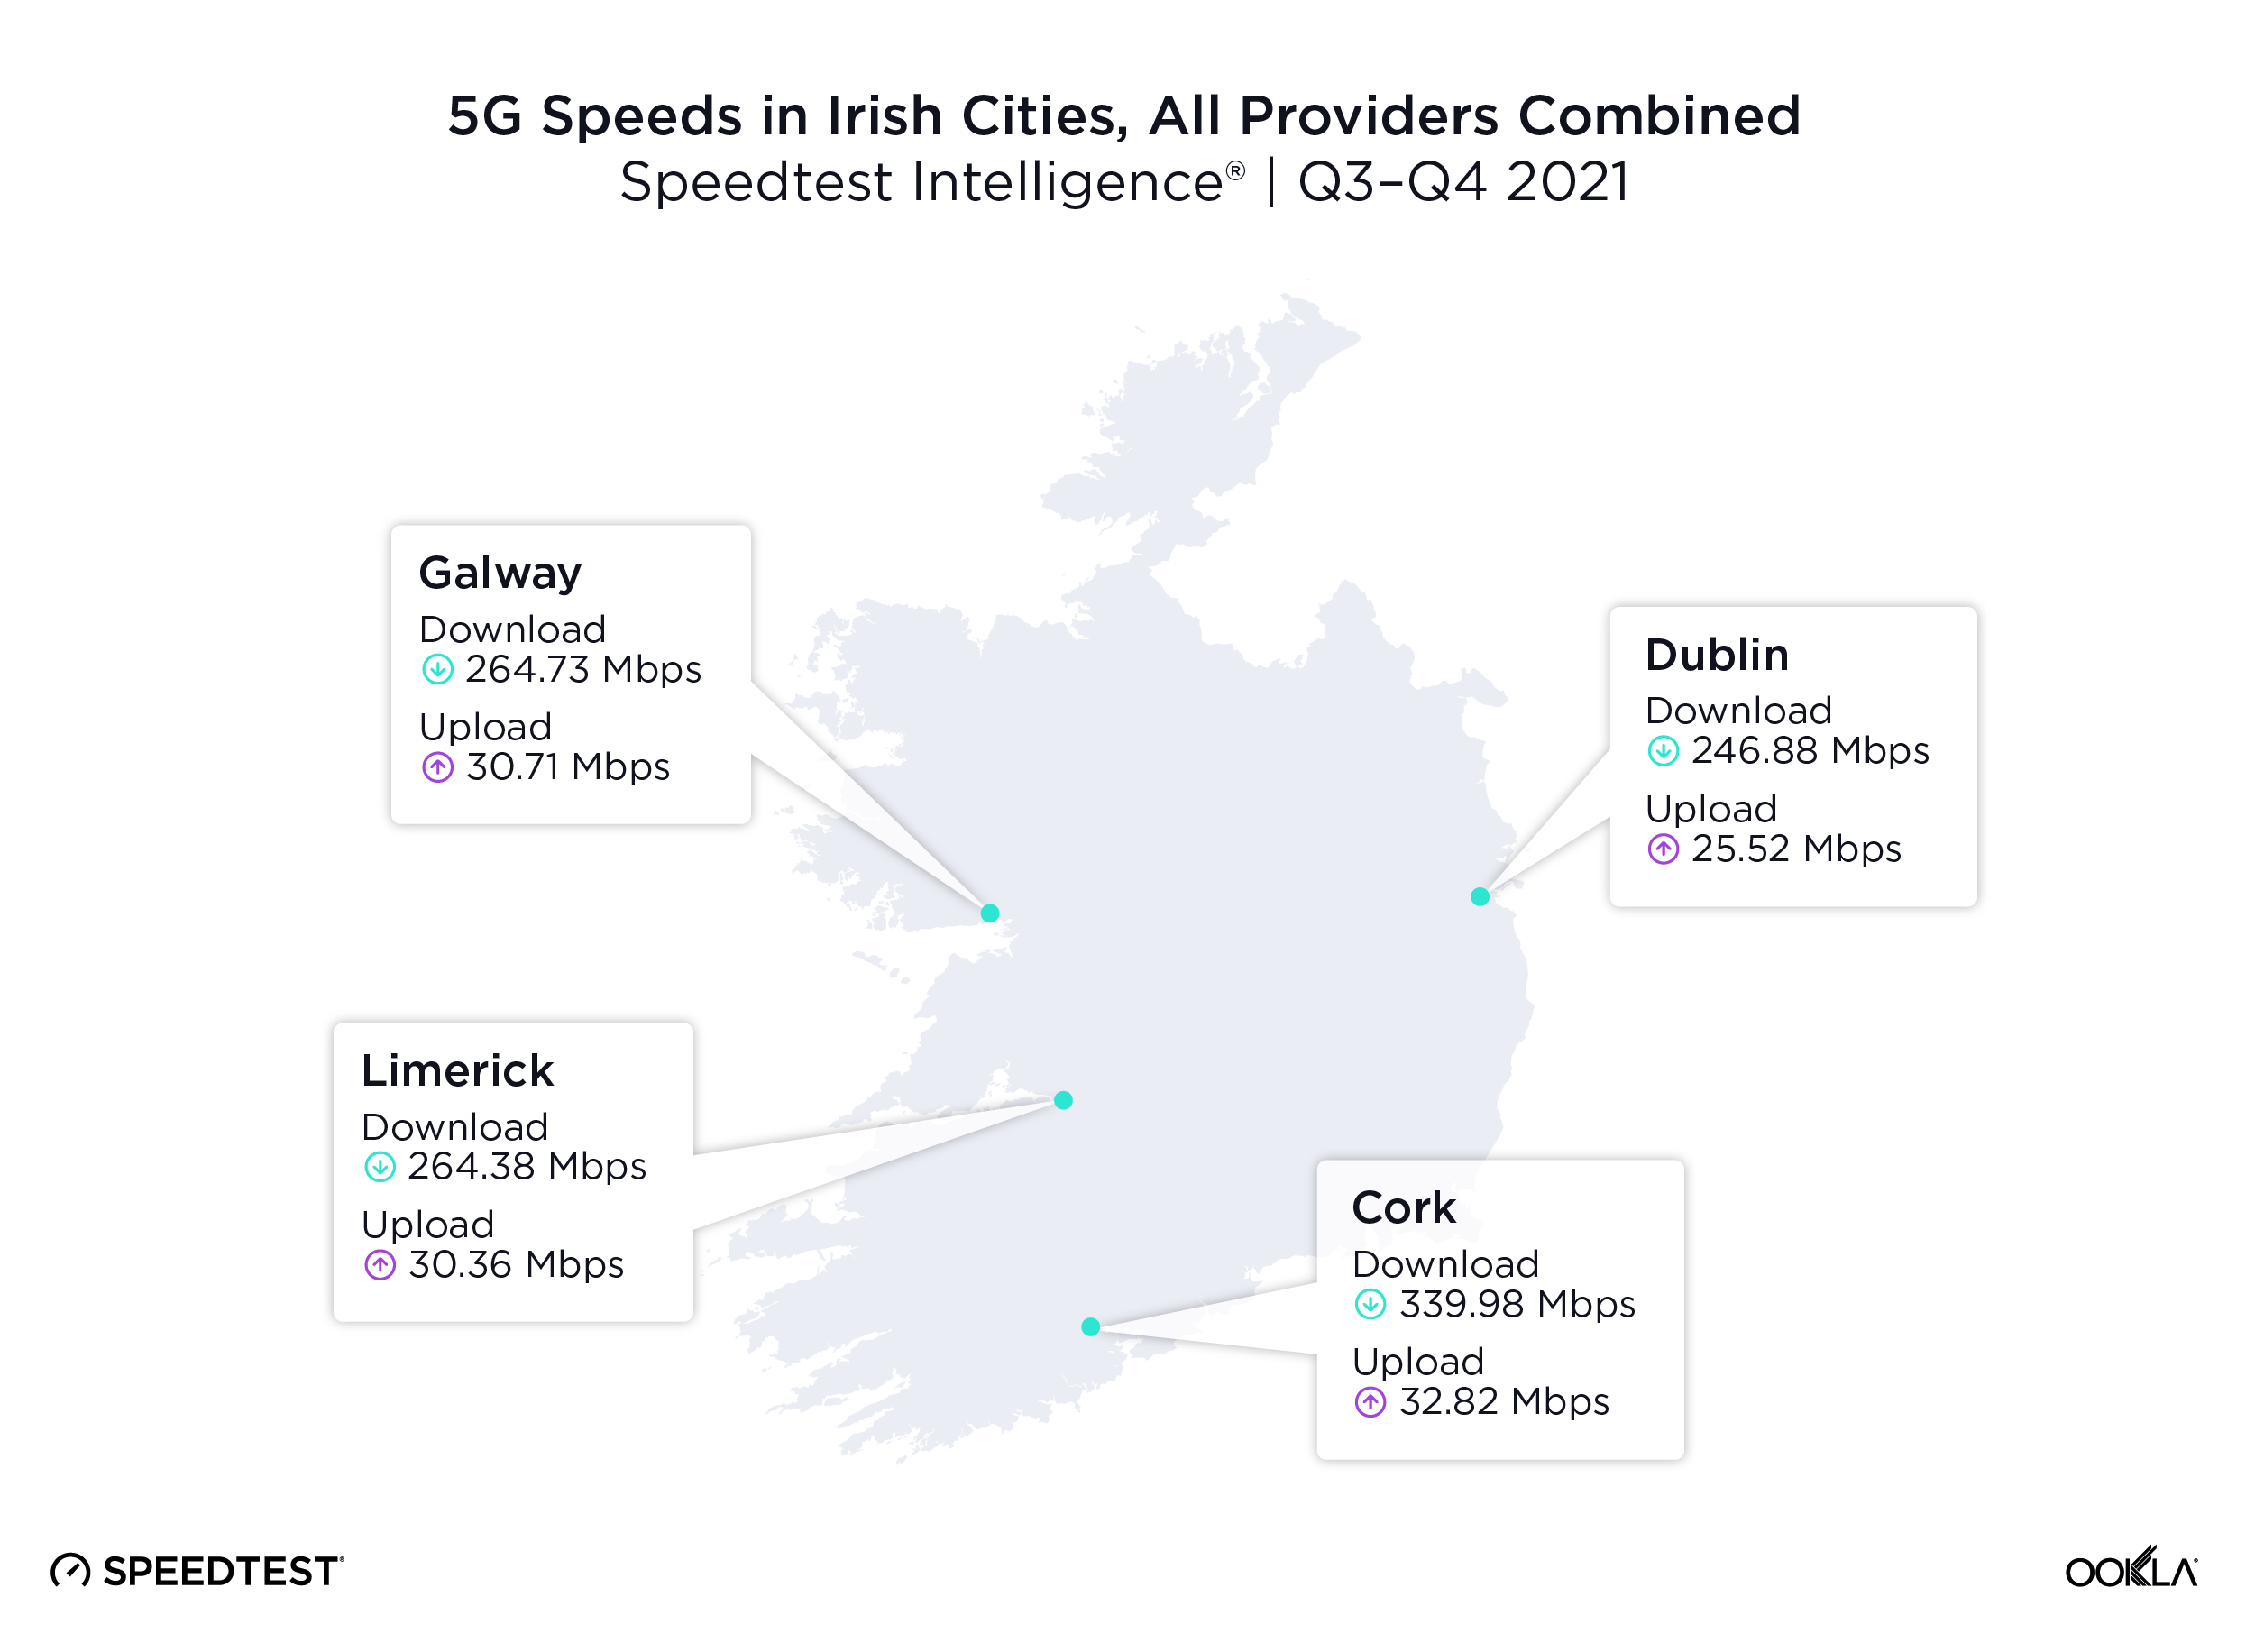
Cork had the fastest 5G download and upload speeds in Ireland 

Cork was the clear winner for 5G speeds across Irish cities, with a median 5G download speed of 339.98 Mbps during Q3-Q4 2021, a 14% year-over-year increase for all operators combined. Cork also had a median 5G upload speed of 32.82 Mbps. Three Ireland’s 5G network in Cork reached a median download speed of 508.96 Mbps. Cork was ahead of the rest of the cities, which partially can be explained by being home to pharmaceutical and IT companies such as Apple, Amazon, and IBM. Cork also benefited from connectivity with the EXA Express undersea cable.

Three Ireland was the fastest 5G operator in Ireland 

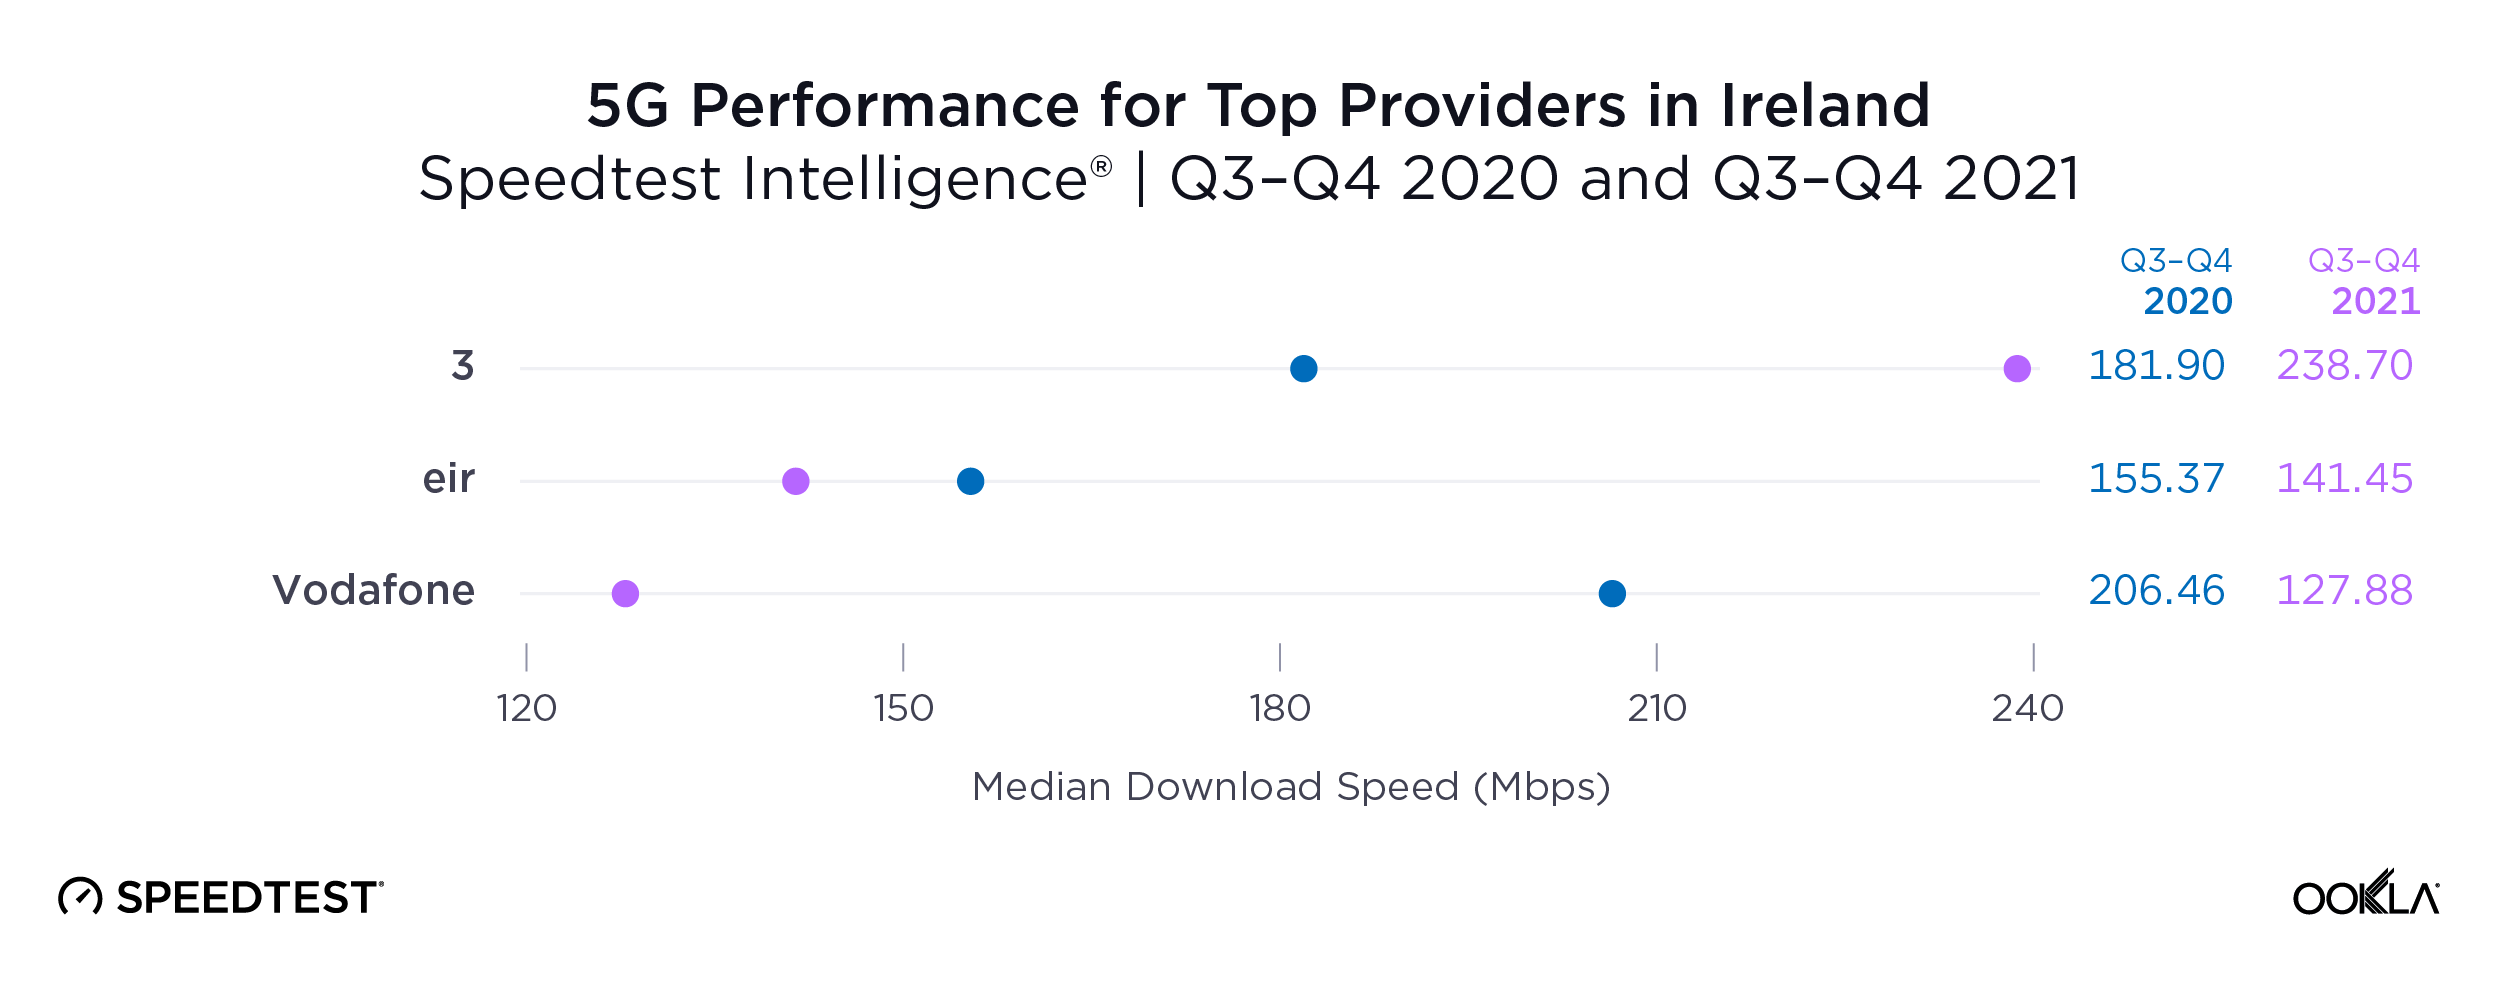
Despite being the last operator to jump on the 5G bandwagon in September 2020, Three Ireland has raced to the top in terms of median 5G download speed — achieving 238.70 Mbps in the Q3-Q4 2021, a 20% year-over-year increase. The median 5G upload speeds across all operators were very similar at 19.89 Mbps (Vodafone) and 22.35 Mbps for 3, and 22.24 Mbps for eir during Q3-Q4 2021. However, 3 Ireland has been hard at work with Ericsson to transform its Radio Access Network (RAN), rebuilding over 1,000 deployments. 3 Ireland also has the advantage of being able to use some of its excess capacity in the 1.8 GHz band to deploy 5G in rural villages and towns, a strategy that can take advantage of favorable propagation relative to 3.6 GHz. 

Ericsson has been the partner of choice for Three, not only in terms of network roll out but also in terms of looking for new ways to monetize 5G. As such, in May 2021, Three Ireland joined Ericsson’s global Startup 5G program as the first communication provider. The goal of the program is to leverage 5G as a platform for innovation and thus stimulate 5G commercialization and monetization by introducing operators to startups in the area of immersive learning, augmented reality (AR), and virtual reality (VR) among other emerging technologies. 

In July 2021, Ericsson and Three Ireland extended their collaboration to the field of Industry 4.0. They launched a strategic partnership with Glanbia Ireland to install an indoor 5G network to increase manufacturing efficiency of the Glanbia’s cheese plant in Ballyragget, County Kilkenny. However, this isn’t the first 5G private network in Ireland. In March 2021, Vodafone in partnership with Irish Manufacturing Research (IMR) rolled out a private 5G Standalone (SA) network utilizing Ericsson’s equipment. IMR, a not-for-profit manufacturing and energy research organization, plans to test smart manufacturing 5G use cases such as automated production lines, predictive maintenance, mobile robots, cobots, and AR and VR. These demonstrations of 5G capabilities in the manufacturing context are important to showcase the value digital transformation can bring to the sector by deploying private networks and creating bespoke use cases that enable greater latency and security.

eir tops the charts for 5G Availability 

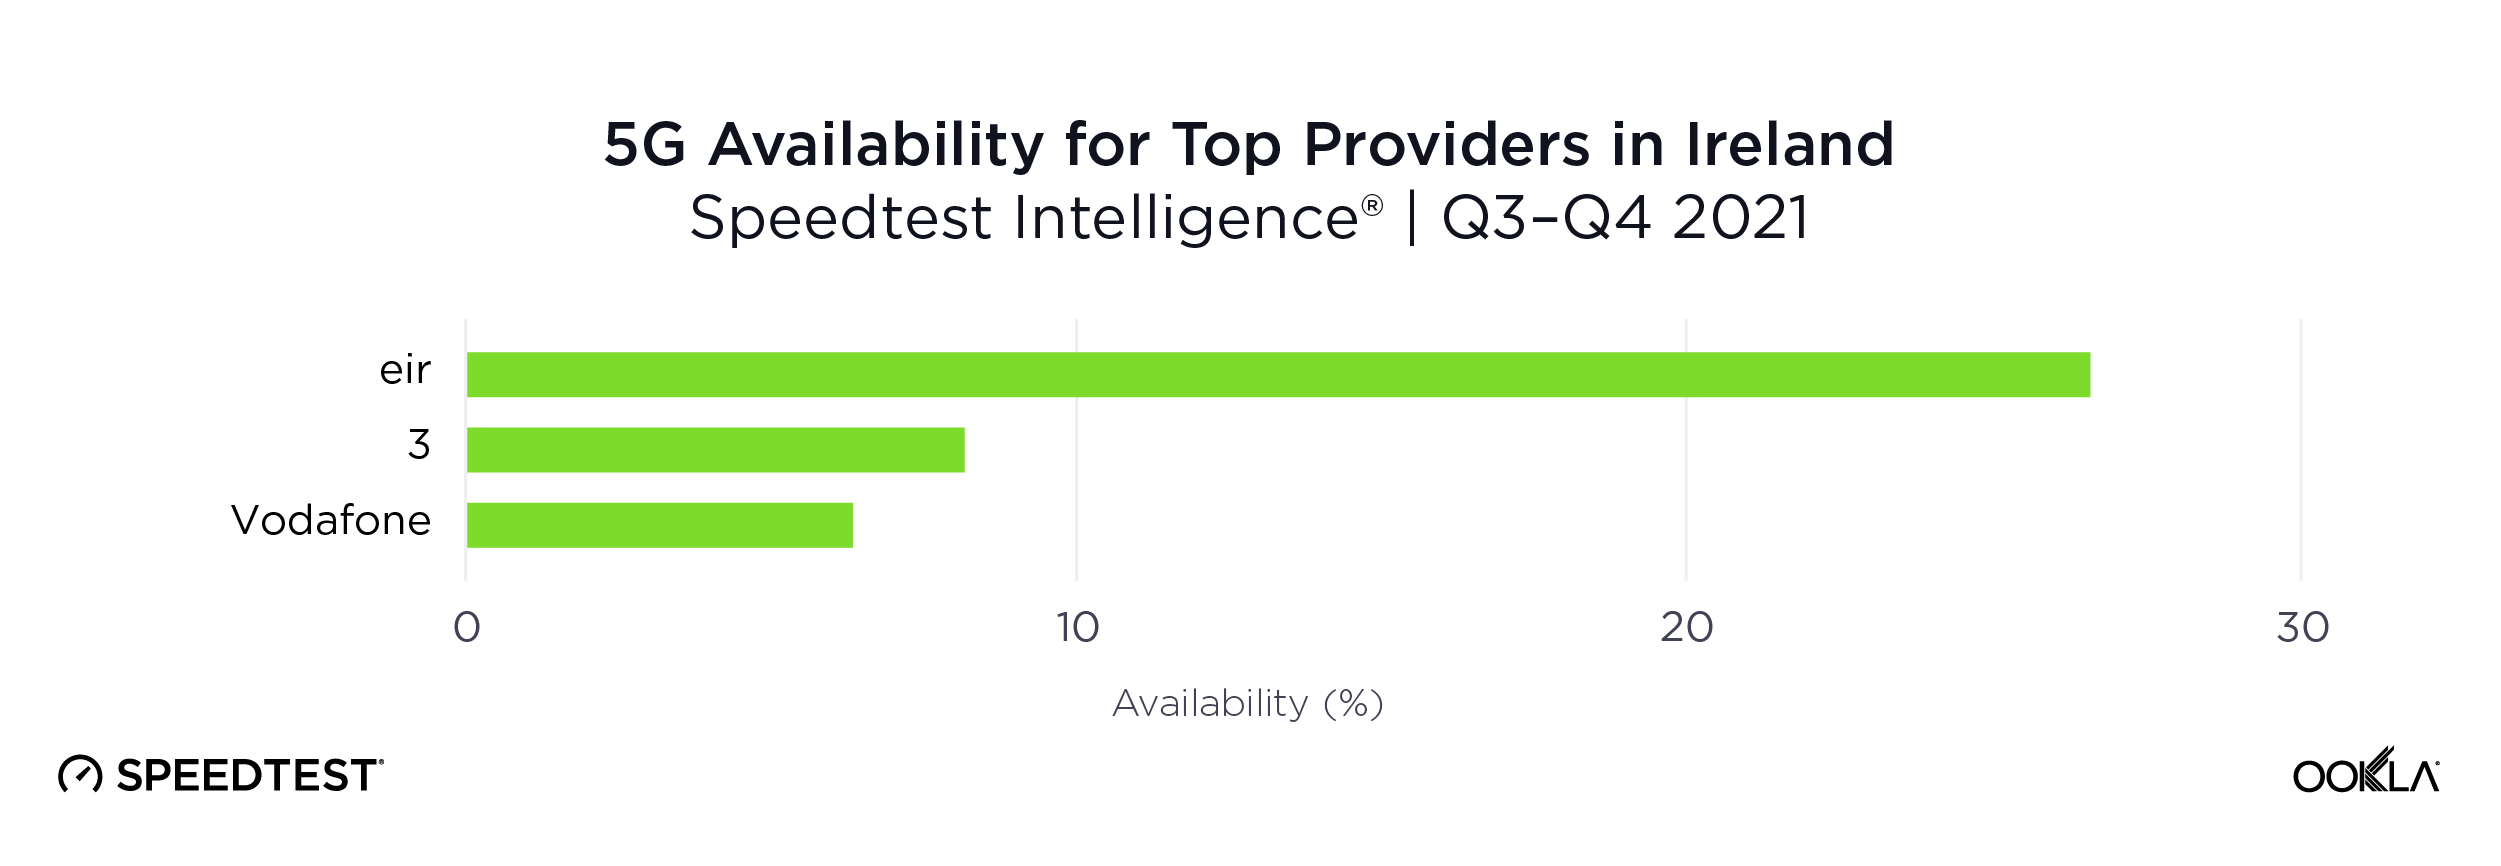
The picture is slightly different when it comes to 5G Availability — the percentage of users on 5G-capable devices that spend most of the time with access to 5G networks. 5G Availability across Ireland was 11.7% in Q3-Q4 2021. eir is a clear winner with 26.6%, ahead of 3 (8.2%) and Vodafone (6.4%). 

eir’s €1 billion national investment programme includes roll outs for fiber broadband and 5G networks, as well as the expansion of 4G LTE networks. The operator has expanded the 5G Availability of its 5G NSA (Non-Standalone) network by using spectrum in the 1800 MHz and 3.5 GHz. In October 2021, eir announced that its 5G network was available to more than 70% of the Irish population (across 336 towns and cities), and increased this to 430 towns and cities during Q4 2021. 

Vodafone, has also expanded 5G to its prepaid customer base and introduced a 5G broadband option in 2021, utilizing Dynamic Spectrum Sharing (DSS) in the 2.1 GHz band in partnership with Ericsson. 

The Irish Government looks to 5G to help it to realize its digital transformation ambitions, and to position Ireland as a prime destination for international businesses. While it’s still early days in terms of 5G adoption in the market, the Irish mobile operators are actively expanding 5G network speeds and coverage. Learn more about how Speedtest Intelligence can help you benchmark your 5G performance against competitors.

Ookla retains ownership of this article including all of the intellectual property rights, data, content graphs and analysis. This article may not be quoted, reproduced, distributed or published for any commercial purpose without prior consent. Members of the press and others using the findings in this article for non-commercial purposes are welcome to publicly share and link to report information with attribution to Ookla.

| February 20, 2019

An Expansive Analysis of European Mobile Roaming Speeds and Behaviors

Last year we took a look at how free roaming was working out for EU citizens in terms of speeds and latency. This year we’ve expanded our analysis to all European countries and included data on Wi-Fi roaming behavior. We’ve also added a little insight into how roaming might affect download speeds for visitors to Mobile World Congress (MWC) in Barcelona from February 25- 28, 2019.

Except where noted, this analysis is based on Speedtest data from Android devices on 4G LTE cellular connections during Q3-Q4 2018. We included data on any country with greater than 30 samples in all categories.

Most Europeans experience slower downloads while roaming

Roaming traffic is subject to deals struck between individual mobile operators on how that traffic will be prioritized, so roaming speeds can depend not only on the country of origin but also the country of destination and the plan a subscriber has selected.

Consider the following table where an Albanian experiences a mean download speed of 54.56 Mbps at home and then 38.47 Mbps while roaming elsewhere in Europe. This is expected as a roamer does not usually have a direct relationship with the mobile operator handling their data and calls abroad.

Mean Mobile Download Speeds in Europe
Speedtest Data | Q3-Q4 2018
Country Local Speed (Mbps) Roaming Speed (Mbps) % Difference
Austria 38.23 35.78 -6.4%
Belarus 16.15 19.49 20.7%
Belgium 52.58 35.42 -32.6%
Bulgaria 47.28 32.35 -31.6%
Croatia 43.83 43.60 -0.5%
Cyprus 37.13 20.58 -44.6%
Czech Republic 44.91 13.43 -70.1%
Denmark 48.83 34.89 -28.6%
Estonia 36.43 38.98 7.0%
Finland 39.33 38.20 -2.9%
France 39.94 34.97 -12.5%
Germany 33.77 28.57 -15.4%
Greece 41.35 38.08 -7.9%
Hungary 49.57 28.19 -43.1%
Iceland 69.27 35.58 -48.6%
Ireland 28.23 31.49 11.6%
Italy 32.18 43.12 34.0%
Kazakhstan 22.93 13.80 -39.8%
Latvia 30.88 33.79 9.4%
Liechtenstein 56.48 36.66 -35.1%
Lithuania 41.49 33.43 -19.4%
Luxembourg 50.91 25.08 -50.7%
Malta 56.34 34.27 -39.2%
Montenegro 45.45 49.97 10.0%
Netherlands 56.06 33.86 -39.6%
Norway 68.49 38.69 -43.5%
Poland 28.74 29.71 3.4%
Portugal 32.06 36.95 15.3%
Romania 36.64 30.74 -16.1%
Russia 20.91 20.47 -2.1%
Serbia 43.41 21.64 -50.1%
Slovakia 33.47 31.80 -5.0%
Slovenia 35.51 36.41 2.5%
Spain 36.07 22.37 -38.0%
Sweden 44.87 34.59 -22.9%
Switzerland 47.59 30.36 -36.2%
Turkey 38.19 28.77 -24.7%
Ukraine 26.07 25.48 -2.3%
United Kingdom 30.84 38.76 25.7%

Residents of the Czech Republic will face massive speed disappointment when roaming through the rest of Europe. Other countries with much better speeds at home than abroad include Luxembourg, Serbia, Iceland and Cyprus.

In ten European countries, citizens experience faster mobile downloads while roaming than they do at home. These include: Italy, the United Kingdom, Belarus, Portugal, Ireland, Montenegro, Latvia, Estonia, Poland and Slovenia. Most of these are among the slowest countries on this list, so it would make sense that their citizens would experience better speeds elsewhere in Europe than they do at home.

Europeans are connected to Wi-Fi most of the time

Customers sometimes try to get better speeds and avoid roaming fees (for those outside the E.U.) and data overages by connecting to Wi-Fi. The following table compares the percentage of time spent on Wi-Fi by a resident of a country with that of a visitor to the country.

Percentage of Time Spent on Wi-Fi in Europe
Speedtest Data | Q3-Q4 2018
Country Local Customers Visitors % Difference
Albania 61.9% 59.8% -3.4%
Andorra 73.6% 69.0% -6.2%
Armenia 61.5% 68.1% 10.7%
Austria 65.6% 36.7% -44.1%
Azerbaijan 67.0% 70.7% 5.5%
Belarus 63.9% 58.3% -8.9%
Belgium 71.1% 32.9% -53.7%
Bosnia and Herzegovina 71.9% 66.0% -8.2%
Bulgaria 65.2% 46.8% -28.2%
Croatia 66.1% 41.0% -38.0%
Cyprus 70.9% 58.4% -17.7%
Czech Republic 75.1% 38.9% -48.1%
Denmark 70.4% 52.9% -24.9%
Estonia 61.2% 45.6% -25.4%
Finland 56.6% 47.1% -16.7%
France 60.2% 43.1% -28.5%
Georgia 61.4% 62.2% 1.3%
Germany 72.2% 42.4% -41.3%
Greece 73.5% 52.2% -28.9%
Hungary 71.9% 35.0% -51.3%
Iceland 65.7% 58.2% -11.4%
Ireland 67.2% 52.4% -22.0%
Italy 64.1% 48.9% -23.7%
Kazakhstan 57.7% 64.7% 12.3%
Latvia 60.9% 43.8% -28.1%
Liechtenstein 71.7% 58.2% -18.9%
Lithuania 66.8% 43.3% -35.1%
Luxembourg 63.6% 26.0% -59.1%
Macedonia 65.3% 52.9% -18.9%
Malta 74.3% 58.0% -22.0%
Moldova 67.2% 67.3% 0.2%
Montenegro 63.6% 65.2% 2.5%
Netherlands 73.0% 42.5% -41.7%
Norway 74.7% 59.7% -20.1%
Poland 62.5% 48.1% -23.1%
Portugal 69.1% 54.7% -20.9%
Romania 62.4% 48.7% -21.9%
Russia 58.8% 65.9% 12.2%
San Marino 66.8% 39.7% -40.6%
Serbia 68.6% 61.2% -10.7%
Slovakia 69.6% 35.1% -49.6%
Slovenia 63.3% 26.4% -58.3%
Spain 70.8% 53.0% -25.2%
Sweden 71.8% 44.9% -37.4%
Switzerland 62.4% 47.2% -24.4%
Turkey 61.7% 73.0% 18.4%
Ukraine 61.5% 62.4% 1.5%
United Kingdom 71.3% 54.0% -24.3%

Finland showed the lowest time spent on Wi-Fi by residents at 56.6%. Kazakhstan was second at 57.7% followed by Russia (58.8%), France (60.2%) and Latvia (60.9%). The Czech Republic showed the highest time spent on Wi-Fi by residents at 75.1%. Norway was second at 74.7% followed by Malta (74.3%), Andorra (73.6%) and Greece (73.5%).

When it comes to time spent on Wi-Fi by visitors, Luxembourg had the lowest percentage at 26.0%. Slovenia was second at 26.4% followed by Belgium (32.9%), Hungary (35.0%) and Slovakia (35.1%). Turkey showed the highest time spent on Wi-Fi by visitors at 73.0%. Azerbaijan was second at 70.7% followed by Andorra (69.0%), Armenia (68.1%) and Moldova (67.3%).

Luxembourg saw the largest difference in time spent on Wi-Fi between residents and visitors with visitors using Wi-Fi 59.1% less than residents. Slovenia was close behind at 58.3%, followed by Belgium (53.7%) and Hungary (51.3%). On the other end of the spectrum, visitors to Turkey were on Wi-Fi 18.4% longer than residents followed by Kazakhstan (12.3%) and Russia (12.2%).

Roaming dramatically increases latency in Europe

Because roaming signals are routed through a user’s home network, latency is always an issue in roaming. Speedtest data shows that latency while roaming is a much larger issue for residents of some countries than it is for others.

Comparing European Latency In-Country and Abroad
Speedtest Data | Q3-Q4 2018
Country Local Latency (ms) Roaming Latency (ms) % Difference
Austria 24 83 245.8%
Belarus 32 75 134.4%
Belgium 24 81 237.5%
Bulgaria 24 126 425.0%
Croatia 32 86 168.8%
Cyprus 20 194 870.0%
Czech Republic 24 86 258.3%
Denmark 24 98 308.3%
Estonia 23 78 239.1%
Finland 26 104 300.0%
France 42 87 107.1%
Germany 33 87 163.6%
Greece 27 137 407.4%
Hungary 22 94 327.3%
Iceland 18 163 805.6%
Ireland 34 114 235.3%
Italy 52 116 123.1%
Kazakhstan 35 164 368.6%
Latvia 24 94 291.7%
Liechtenstein 40 90 125.0%
Lithuania 26 108 315.4%
Luxembourg 23 73 217.4%
Malta 18 141 683.3%
Montenegro 18 42 133.3%
Netherlands 26 81 211.5%
Norway 36 109 202.8%
Poland 33 104 215.2%
Portugal 27 102 277.8%
Romania 26 131 403.8%
Russia 42 161 283.3%
Serbia 22 76 245.5%
Slovakia 30 69 130.0%
Slovenia 21 69 228.6%
Spain 45 118 162.2%
Sweden 30 118 293.3%
Switzerland 26 75 188.5%
Turkey 26 115 342.3%
Ukraine 35 116 231.4%
United Kingdom 37 107 189.2%

Residents of Cyprus saw an average latency of 194 ms while roaming in Europe. The country with the second highest latency for residents roaming abroad was Kazakhstan at 164 ms, followed by Iceland (163 ms). Russia (161 ms) and Malta (141 ms). In contrast, Montenegro had a lower latency for residents roaming abroad than Italy did for residents using their mobile phones locally.

Roaming performance at MWC

MWC, the largest mobile conference in the world, has Barcelona teeming with visitors from across the globe all trying to connect to their home networks. During February 2018 we saw an average download speed of 34.31 Mbps while roaming in Barcelona and a mean latency of 201 ms. Visitors from the U.K. saw an average download speed of 49.00 Mbps and a mean latency of 111 ms, while those from Italy averaged a download of 32.88 Mbps and a latency of 128 ms.

What will the performance look like at this year’s conference? Schedule a meeting or come see us in Hall 2 at Booth 2i25 to learn more about our roaming data.

Ookla retains ownership of this article including all of the intellectual property rights, data, content graphs and analysis. This article may not be quoted, reproduced, distributed or published for any commercial purpose without prior consent. Members of the press and others using the findings in this article for non-commercial purposes are welcome to publicly share and link to report information with attribution to Ookla.

| November 30, 2021

5G in Europe: EU Targets Require a Rethink

Monitoring progress of the EU’s Digital Decade

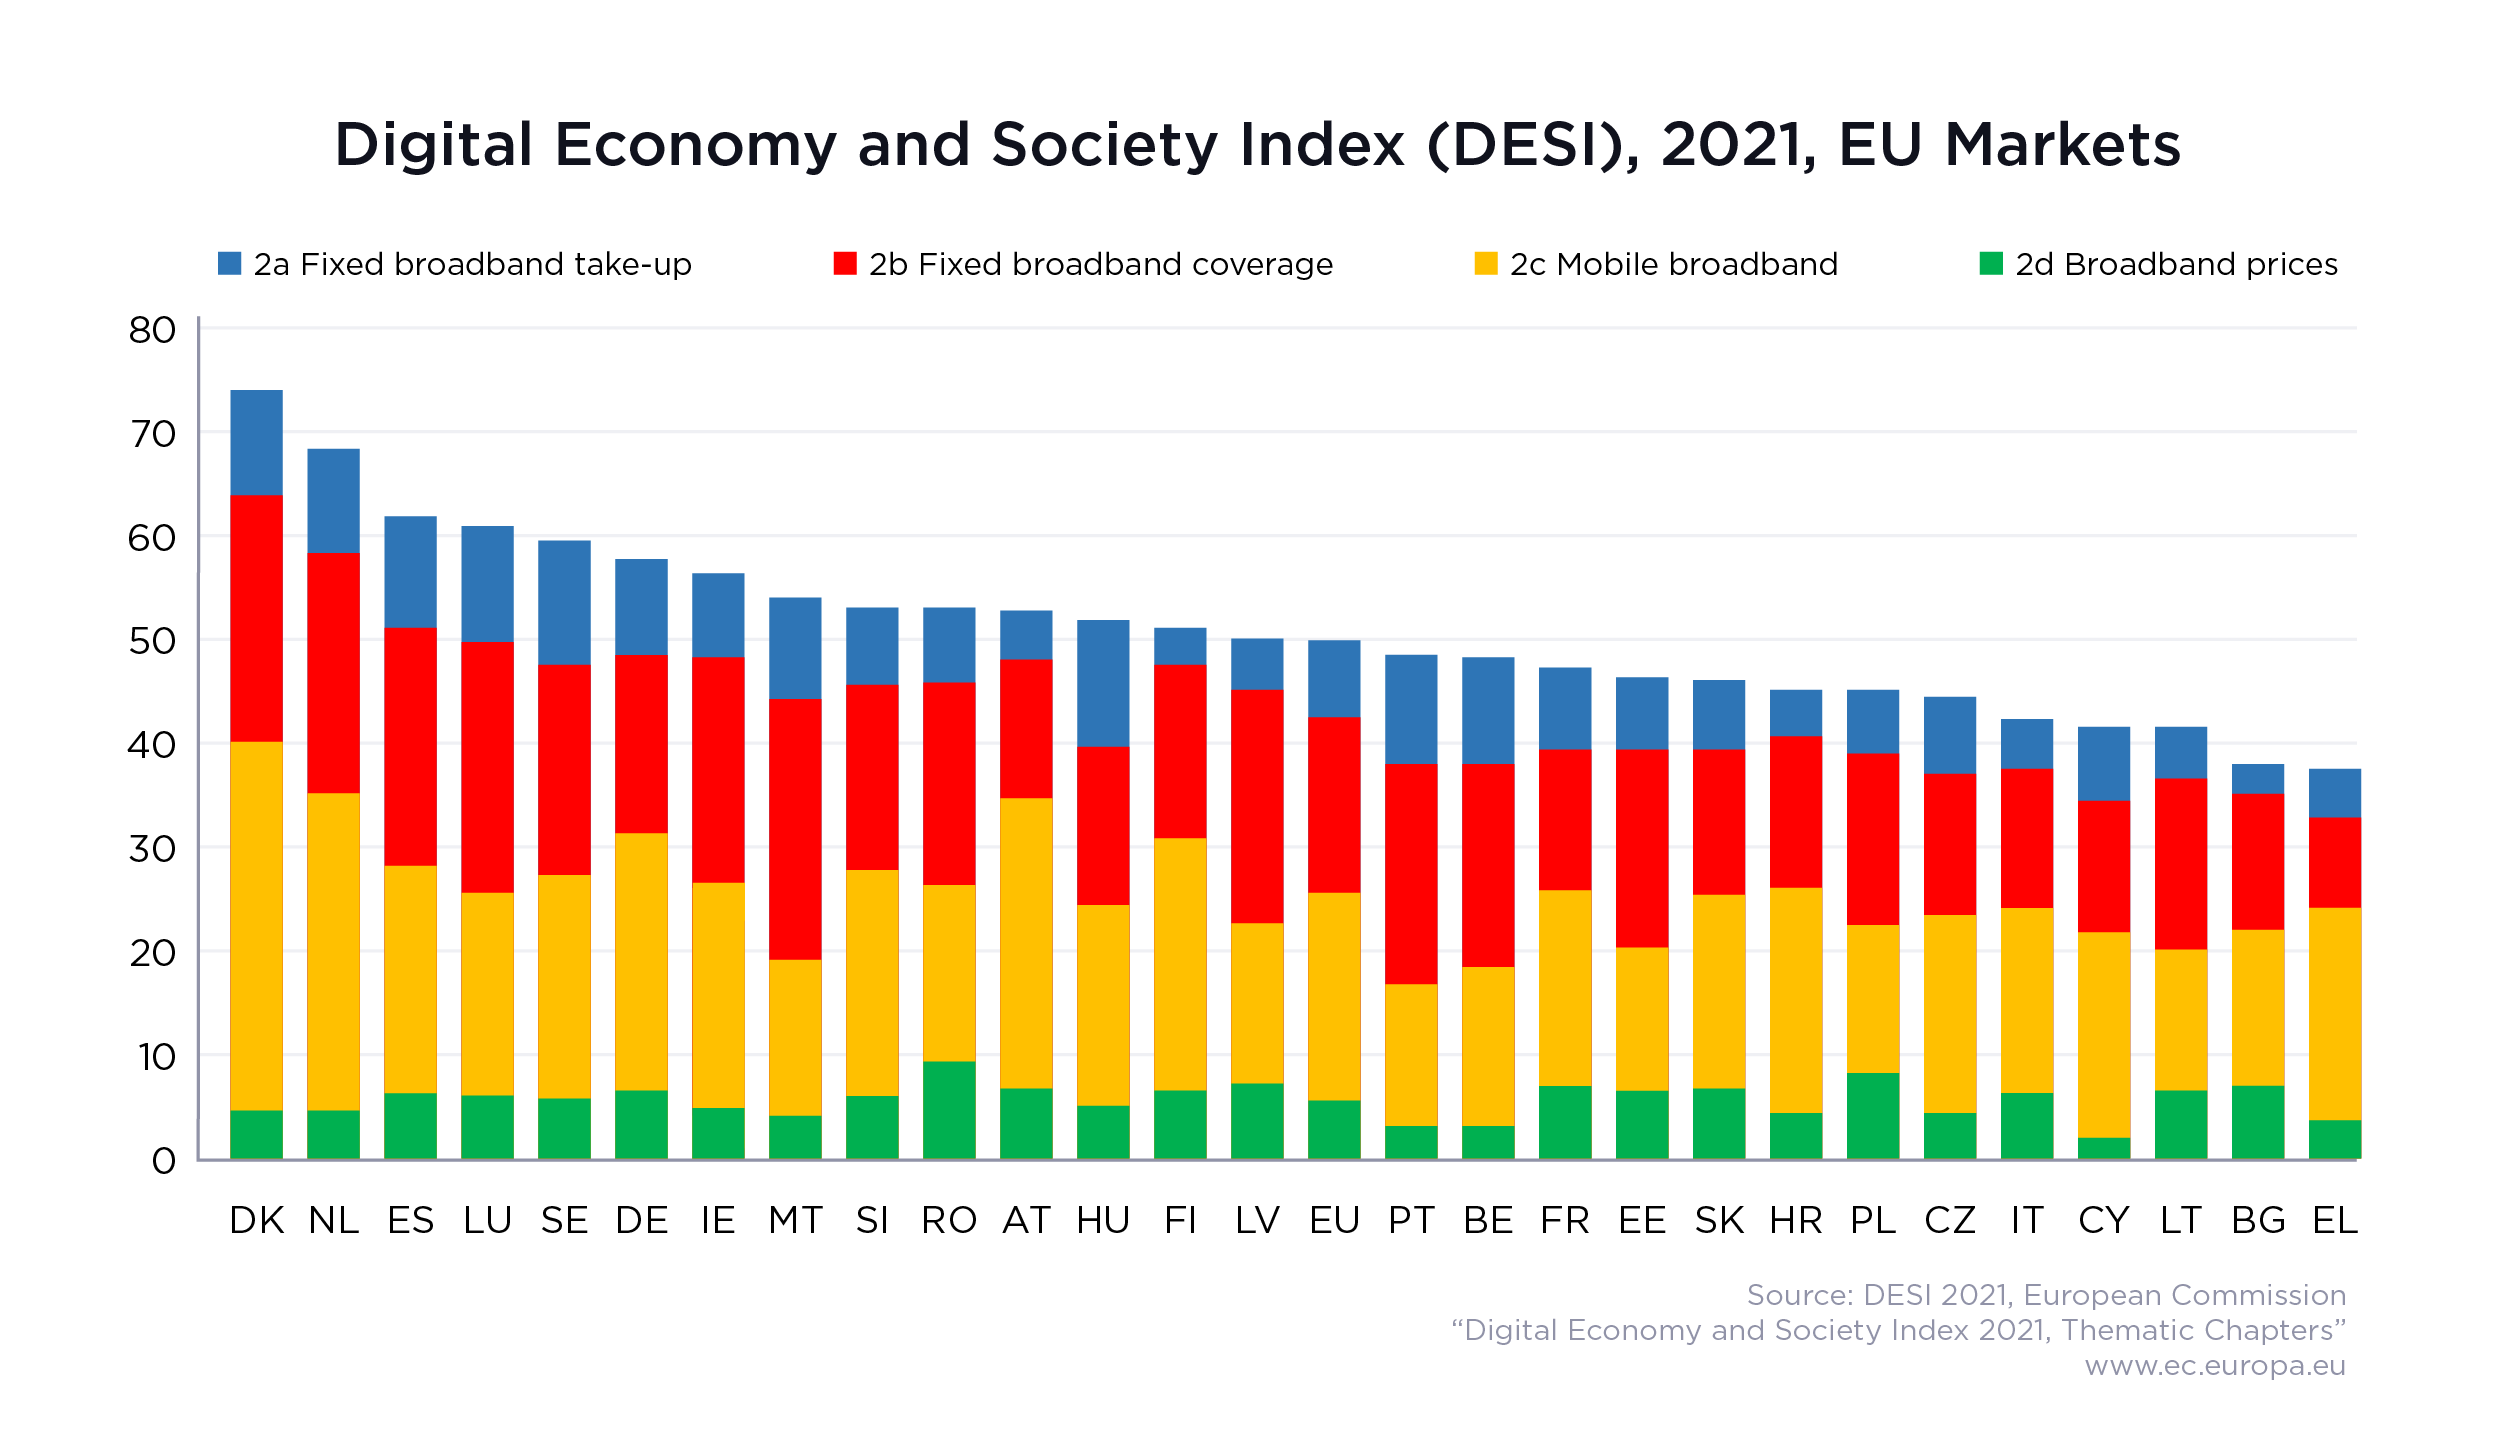
We recently attended the European 5G Observatory’s workshop, “5G in the Digital Decade,” which provided an overview of progress towards the EU’s 5G Action Plan targets and also looked ahead to the new targets as set out in the EU Digital Decade. The European Commission presented its vision of the region’s Digital Decade in March 2021, providing targets (the Digital Compass) for the digital transformation of Member States by 2030. Progress towards these targets is measured through the existing Digital Economy and Society Index (DESI), a key component of which focuses on connectivity. The relevant 2030 goals here are to provide Gigabit access to all EU households and 5G coverage in all populated areas.

The connectivity component of DESI is made up of a mix of demand and supply-side factors, including fixed and mobile broadband coverage and take-up, 5G spectrum availability and broadband pricing. The latest iteration was published in November using 2020 data, with Denmark, the Netherlands and Spain securing the top three spots for connectivity, and Greece and Bulgaria the bottom two.

ookla_desi_eu_markets_1121-01

As 5G evolves, so should the Commission’s 5G targets

The Commission’s DESI has evolved from its inception in 2014 to now track the Digital Compass’ targets. However, 5G is a rapidly evolving technology, and it was clear from the discussion during the Observatory’s workshop that there will be a need to review the actual targets and by implication the measurement criteria. The key concern lies in the “5G everywhere” target, both from a coverage and a performance perspective. As the end goal is the digital transformation of Member States, 5G coverage should be extended beyond the current target of all populated areas, to provide greater geographical coverage — in particular to support emerging vertical industry needs, for example in agriculture or logistics.

In terms of 5G performance, the ITU’s IMT-2020 requirements are for a user-experienced data rate of 100 Mbps download and 50 Mbps upload. However, not all 5G networks are created equally. The increasing use of dynamic spectrum sharing (DSS) means that operators can boost 5G coverage and capacity by using existing spectrum formerly dedicated to other generations of mobile technology. As a result, network performance will vary widely based on the bands used. There are also differences in 5G rollout, with initial 5G radio equipment tending to be deployed on existing tower infrastructure, and the coverage of higher capacity C-band spectrum will be limited relative to that of lower frequency bands as result.

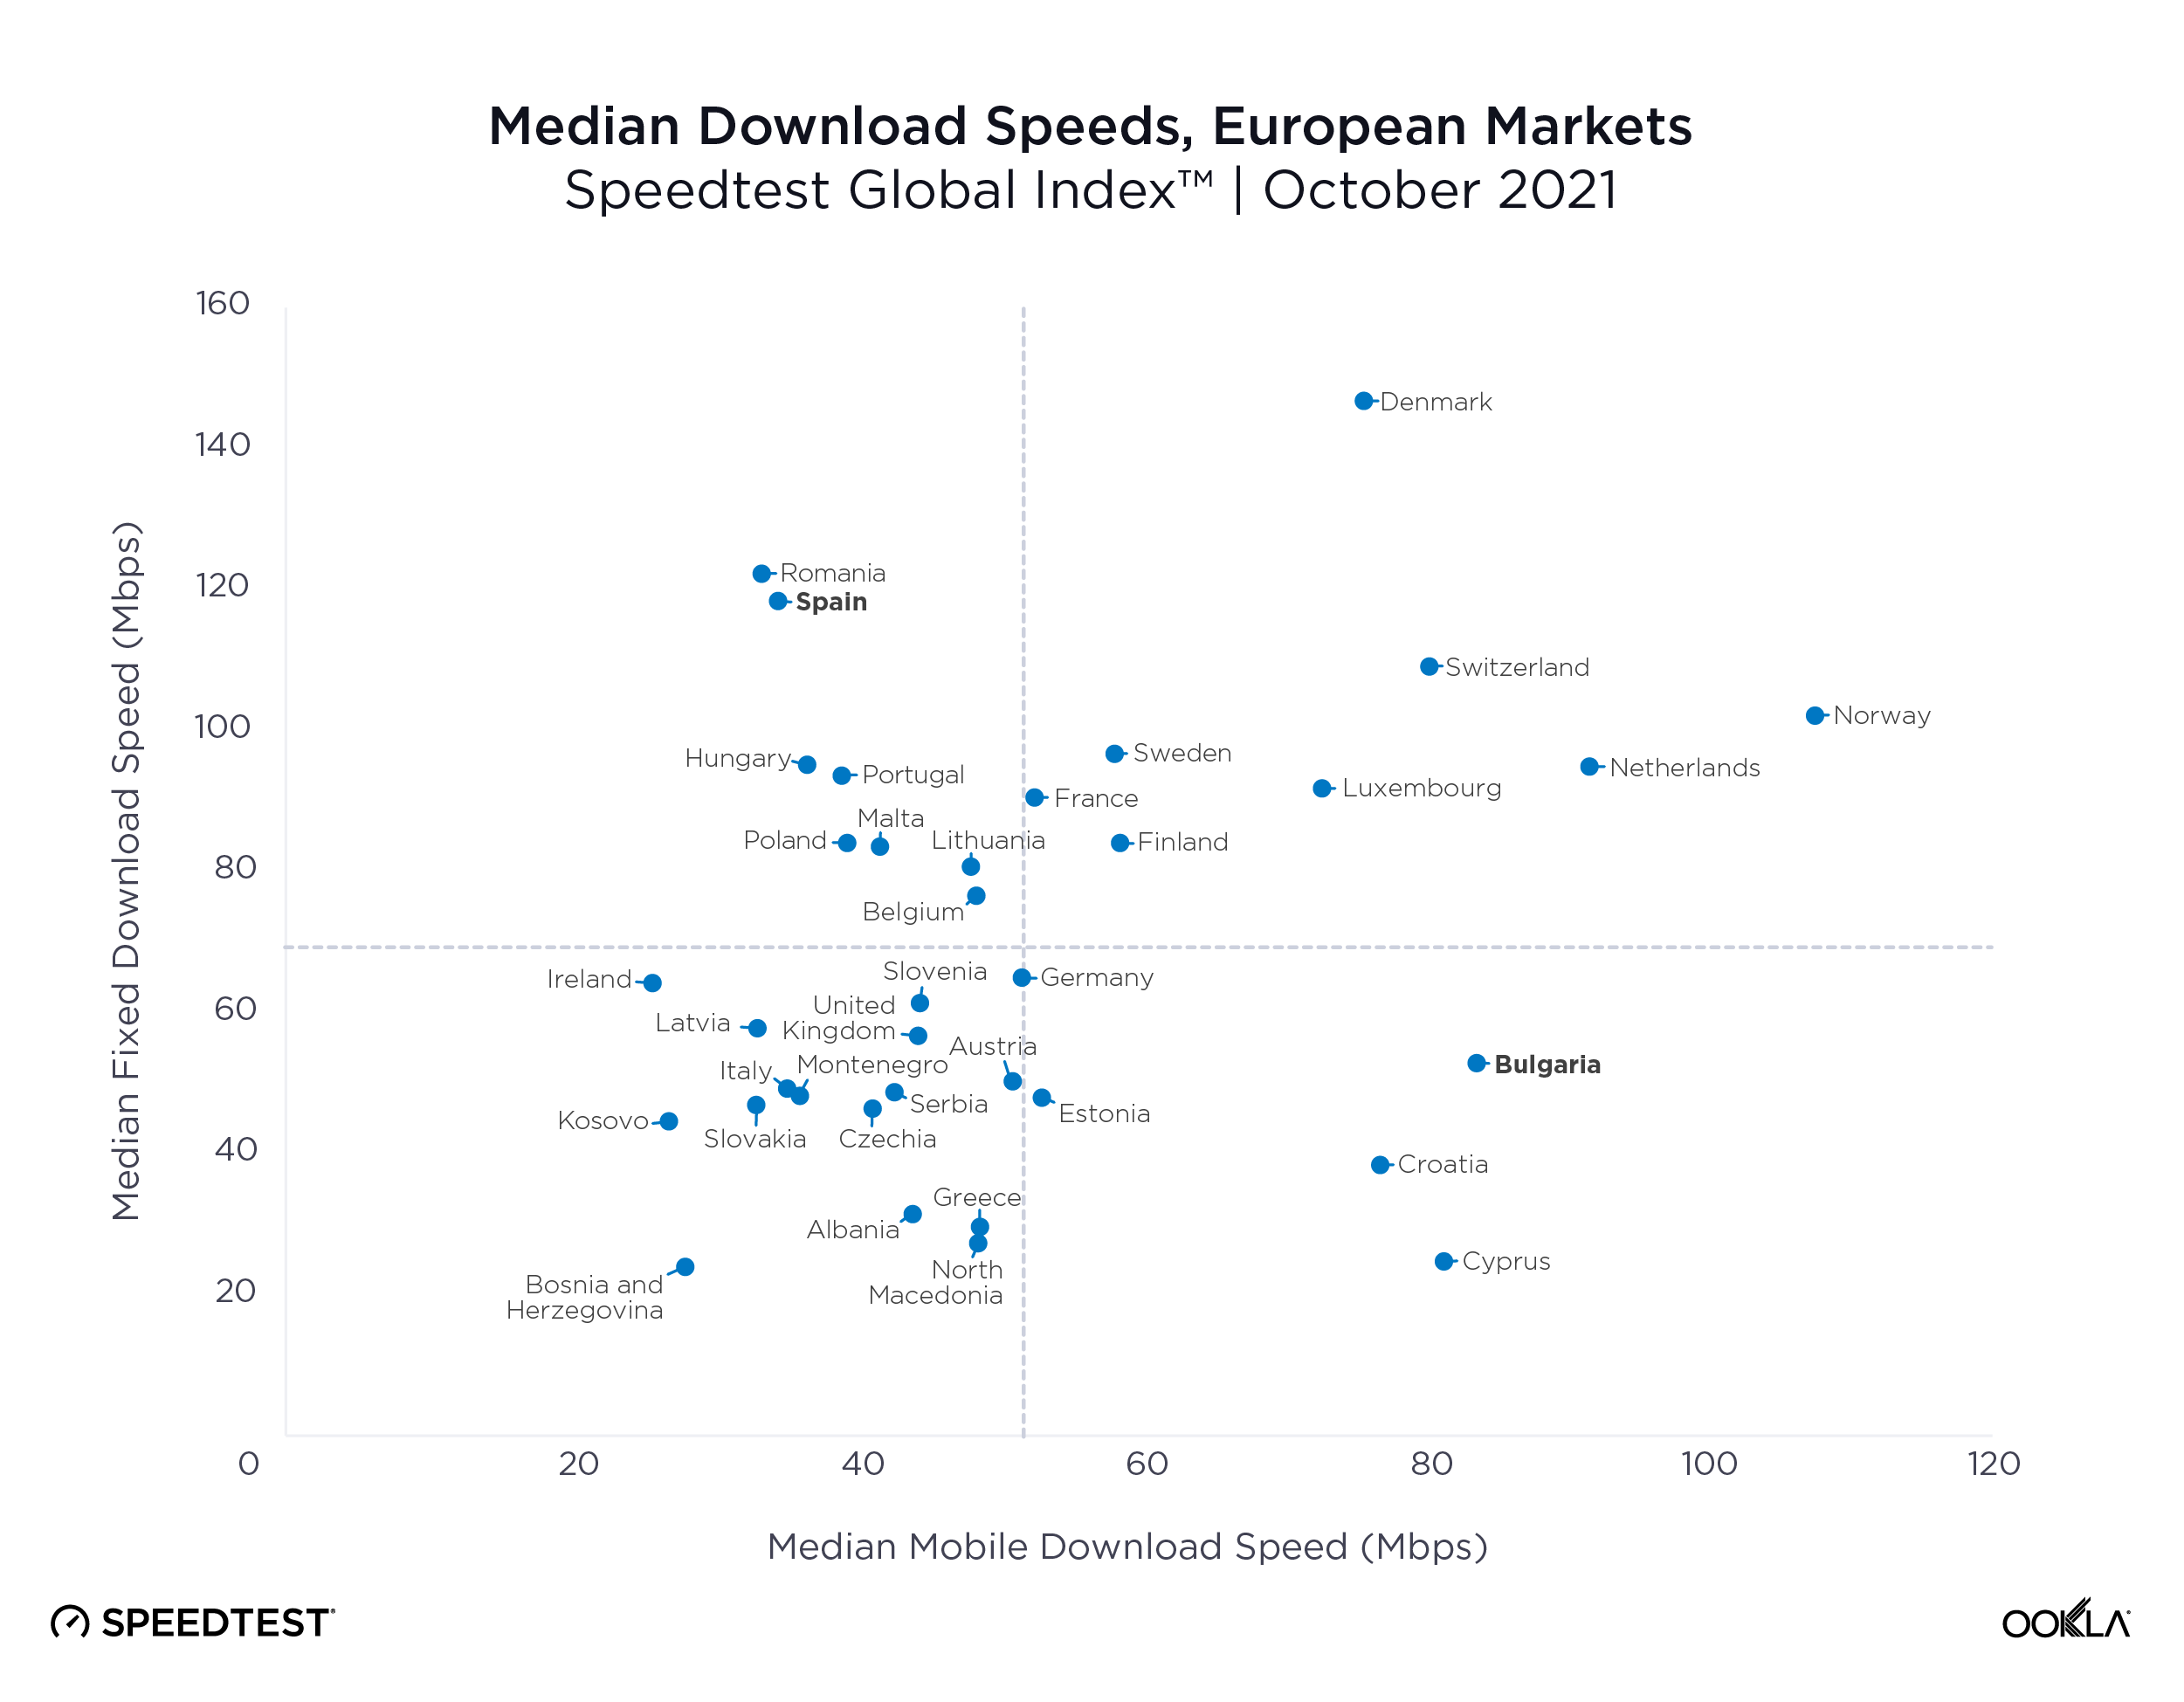
ookla_median-download-speeds_europe_1121-01

Divergence between the DESI and end-user internet speed

What’s also interesting are the outliers and how their performance differs from their position within the DESI. Bulgaria (which came second to last in the connectivity portion of the DESI), does lag behind the European average on fixed broadband speeds, but is significantly faster on mobile speeds. Bulgaria’s median mobile download speed of 83.71 Mbps makes it the seventh fastest market globally. The reverse is true for Spain, which came third in the DESI, and where median fixed download speeds of 118.25 Mbps are well above the European average, putting it in 11th place globally, but where mobile speeds of 34.63 Mbps lag well behind the European average, and place it 51st globally. Other examples of divergence between the DESI and actual internet speeds on the ground include markets such as Belgium, Cyprus, Estonia and Lithuania.

To support Member States, the Commission has proposed a “Path to the Digital Decade”, a governance framework which in addition to the development of roadmaps at a Member State level and regular reporting on progress, will also include a framework to address progress shortfalls and support for multi-country projects. Member States have been encouraged to make use of the Recovery and Resilience Facility, an EU-wide fund of EUR 723.8 billion designed to mitigate the impact of the COVID-19 pandemic, from which they are required to devote at least 20% of their allocation to digital projects. As of October 2021, digital investment plans totalled 26% of the fund, of which 11% is dedicated to connectivity. With such significant public funds directed at improving connectivity, and the digital services that it underpins, the Commission must ensure that its targets and measurement methodology keep pace with the evolution of network technologies.

Ookla retains ownership of this article including all of the intellectual property rights, data, content graphs and analysis. This article may not be quoted, reproduced, distributed or published for any commercial purpose without prior consent. Members of the press and others using the findings in this article for non-commercial purposes are welcome to publicly share and link to report information with attribution to Ookla.

| June 3, 2020

Efficiently Design and Optimize Your Network with Crowdsourced Data (Webinar)

Mobile network operators are currently faced with a double challenge. With much of the globe still under stay-at-home orders, consumers are increasingly reliant on the quality and availability of their networks — and worldwide, operators are facing both budget cutbacks and logistical limitations on traditional data collection methods like walk-testing and drive-testing. Now more than ever, network planners and engineers must prioritize their decisions to have the maximum impact on customer experience with the minimum associated cost.

In Ookla’s upcoming webinar, we’ll show three real-world use cases where European operators can make low-cost or no-cost changes to their existing networks — without drive testing. By identifying competitors’ cell site locations and finding areas of high density and usage where competitor networks perform better, operators can use the crowdsourced data in Cell Analytics™ to prioritize improvements to their networks.

Read on to discover three ways operators can make smarter design and optimization decisions, and don’t miss the webinar on Wednesday, June 17, 2020 at 7am PDT / 10am EDT / 4pm CEST.


1. Identify populated areas where competitor networks outperform yours

Powered by hundreds of millions of signal measurements collected daily by Speedtest®, Cell Analytics provides intelligence about wireless service quality, RF measurements, data usage, user density (both indoors and outdoors), cell site locations and much more. By looking at areas with the highest user density and data usage, you can identify areas where people need a strong connection — and see where competitors provide better wireless service.

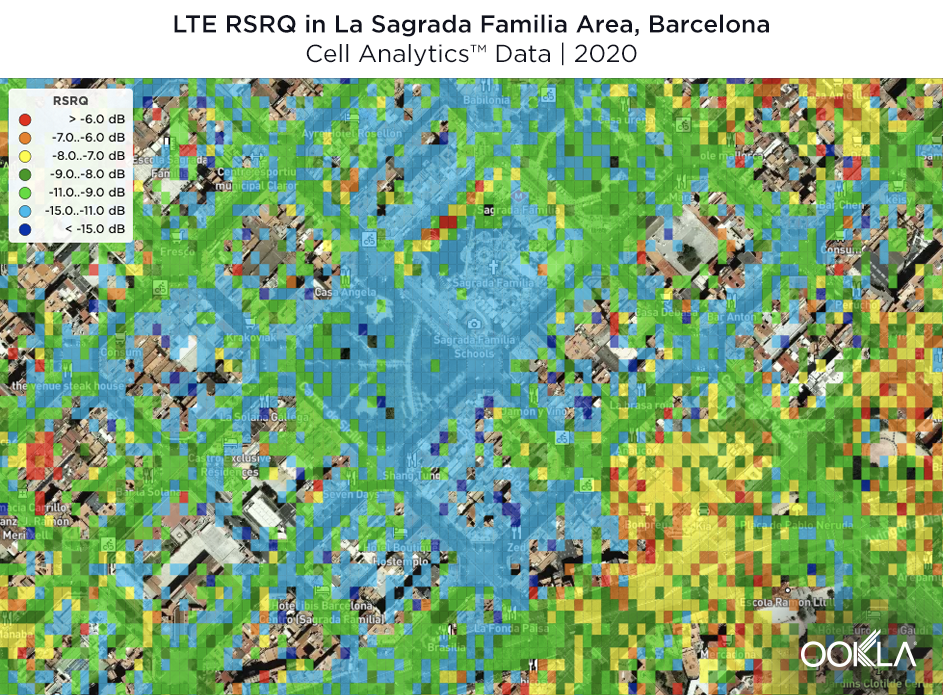
webinar-screenshot_LTE_RSRQ_Barcelona

In the above example, we can see signal quality for a given operator both in and around one of Barcelona’s most popular locations, La Sagrada Familia cathedral. By looking at real-world measurements, you can discover the highest-priority places to invest in capacity expansion or relatively simple fixes like antenna downtilt or network parameter changes.

2. Identify competitor cell sites and monitor new cell site deployments

Without visibility into your competitors’ network performance, quality and availability, it can be difficult to benchmark your own network metrics. Crowdsourced data provides actionable intelligence to assess your network performance inside and outside of buildings and to compare your network to competitors’. Use the Cell Site Finder tool in Cell Analytics to discover the location of competitor cell sites, analyze your performance vs. competing networks and identify opportunities for potential collocation or new deployments.

webinar-screenshot_LTE_RSRP_London

In the above example, we have cross-referenced the location of various network operators’ cell sites with RSRP in two busy shopping locations near London’s Wembley Stadium. From this, we can see the location of all cell sites in the area and a precise view of the service they are delivering. By viewing the coverage of individual competitor sites, you can avoid costly errors that result from relying on RF prediction tools alone during new cell site design.

3. Identify ways to make low-cost improvements to your existing network

Once you’ve prioritized the areas where improvements are most needed, dig into our data to see why users might be experiencing poor network performance and low data quality. To troubleshoot the underlying issues, you can analyze serving cells and band usage in high resolution and then look at the relation between RF conditions and service indicators like throughput, latency and jitter.

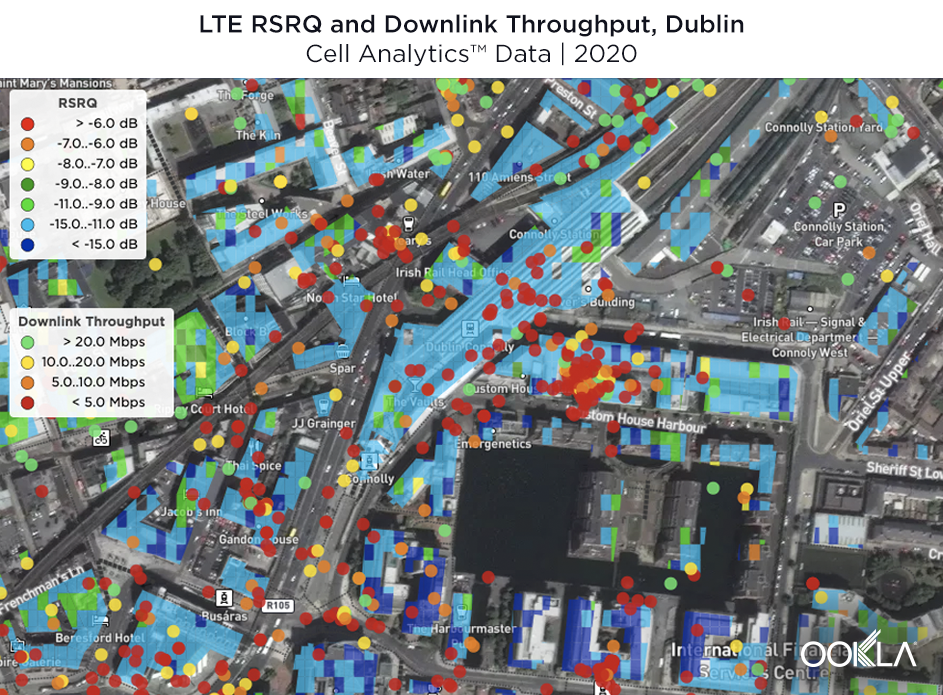
webinar-screenshot_LTE_RSRQ_Dublin

By comparing one operator’s RSRQ with downlink throughput in Dublin’s busiest railway station, we can pinpoint the exact sites that need adjustment to increase the quality of service for this operator. This type of data shows you where a relatively easy fix like antenna azimuth or downtilt changes might help.

To see in-depth recommendations for the operators in the above scenarios, don’t miss the webinar on June 17. If you cannot make the presentation, you can register to receive a video recording after the live event. We look forward to showing you how to leverage real-world data to make better network decisions and answering any questions you may have. Register now.

Ookla retains ownership of this article including all of the intellectual property rights, data, content graphs and analysis. This article may not be quoted, reproduced, distributed or published for any commercial purpose without prior consent. Members of the press and others using the findings in this article for non-commercial purposes are welcome to publicly share and link to report information with attribution to Ookla.

| December 10, 2020

Massive Expansions and Huge Improvements in Speed: The Worldwide Growth of 5G in 2020

The rapid expansion of 5G in countries across the globe was a bright spot in a year that needed one. But just how great is the news? We examined Speedtest Intelligence® data from over 60.5 million Speedtest® results during Q3 2020 to see how much speeds have improved, where download speeds are the fastest at the country and capital level, where 5G deployments have increased and what worldwide 5G coverage looks like now. We also looked at countries where 5G doesn’t yet reach to understand where good news might be on the horizon.

We have only included countries with commercially available 5G on these lists in order to provide a more accurate view of the performance consumers can reasonably expect. While our data shows results for many countries where 5G is not yet commercially available, these tests are likely results from engineers testing their own networks. In addition, we’re only providing analysis for countries with more than 200 samples during Q3 2020. The bars shown in our charts are 95% confidence intervals, which represent the range of values in which the true value is likely to be. Countries marked in tables with an asterisk first launched 5G commercially in 2020.

5G downloads were 954% faster than 4G at the global level

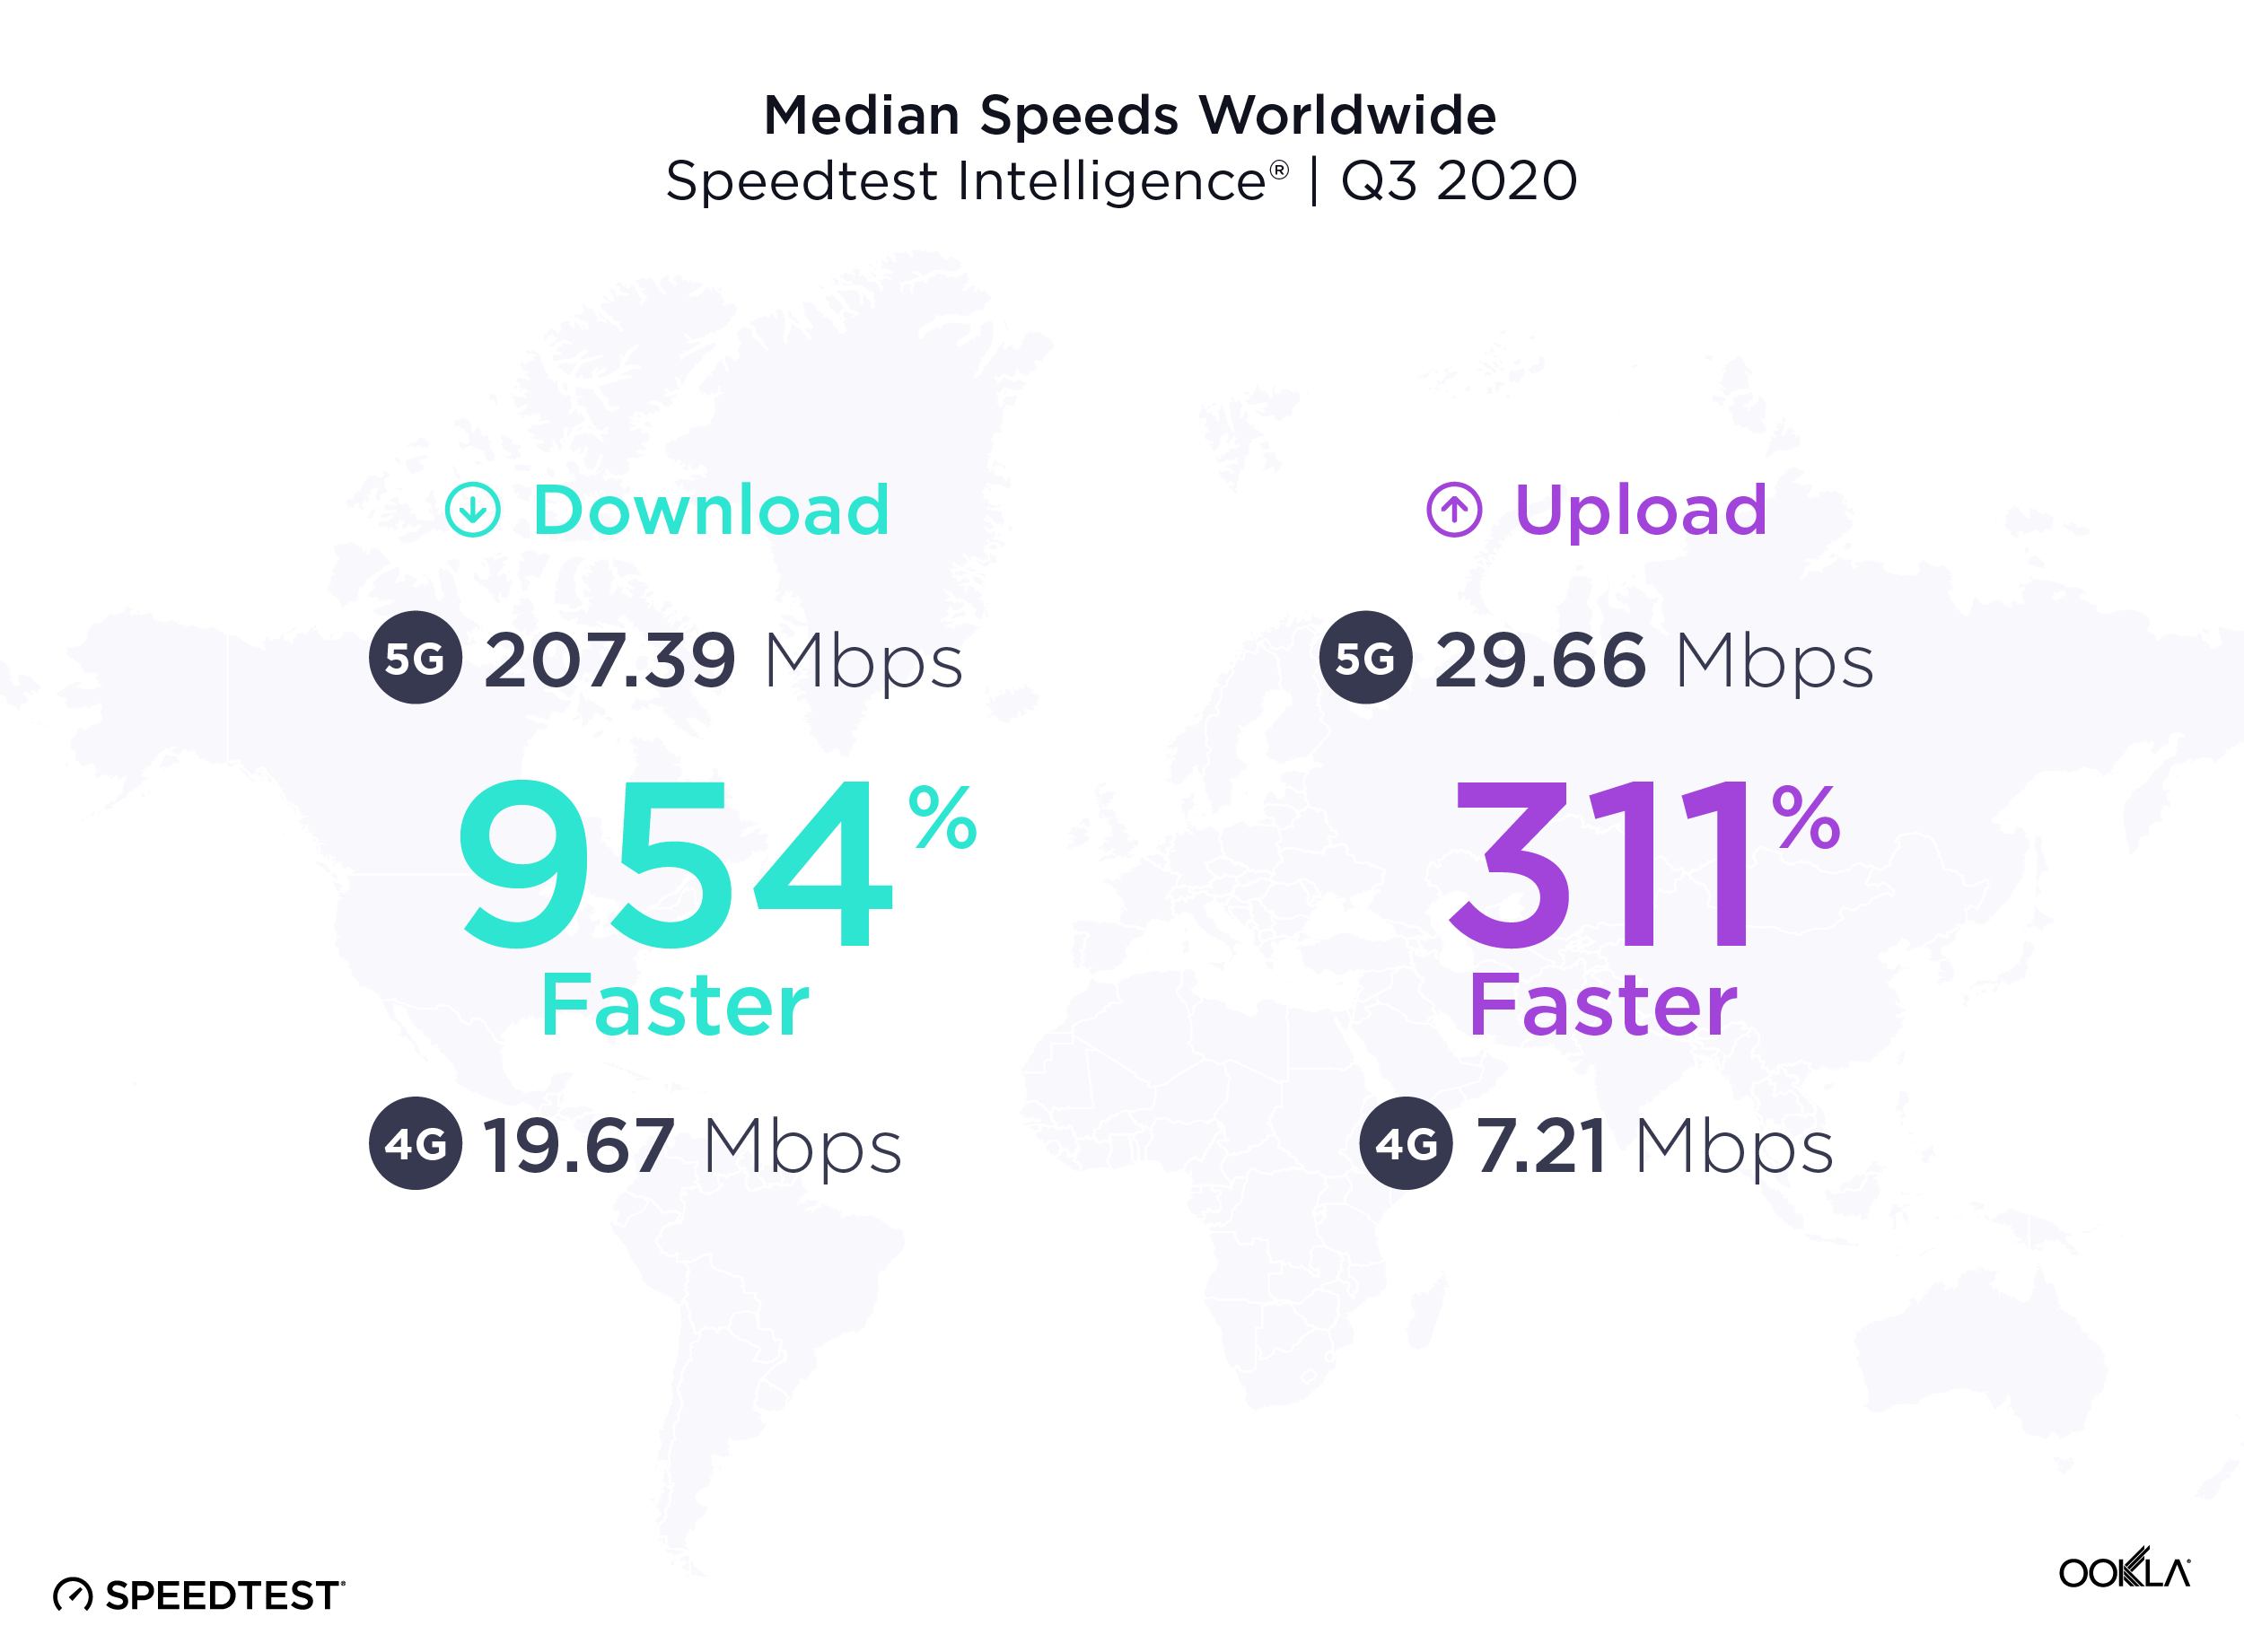
The worldwide median download speed over 5G was 954% faster than that over 4G during Q3 2020. Median upload speed over 5G was 311% faster than that over 4G. Consumers are eagerly adopting the new technology and many have wanted to measure the full throughput capacity of their network connection. In Q3 2020 alone, there were 4,324,788 Speedtest results over 5G.
Median-Speeds-Worldwide_1220-1

United Arab Emirates had the fastest 5G

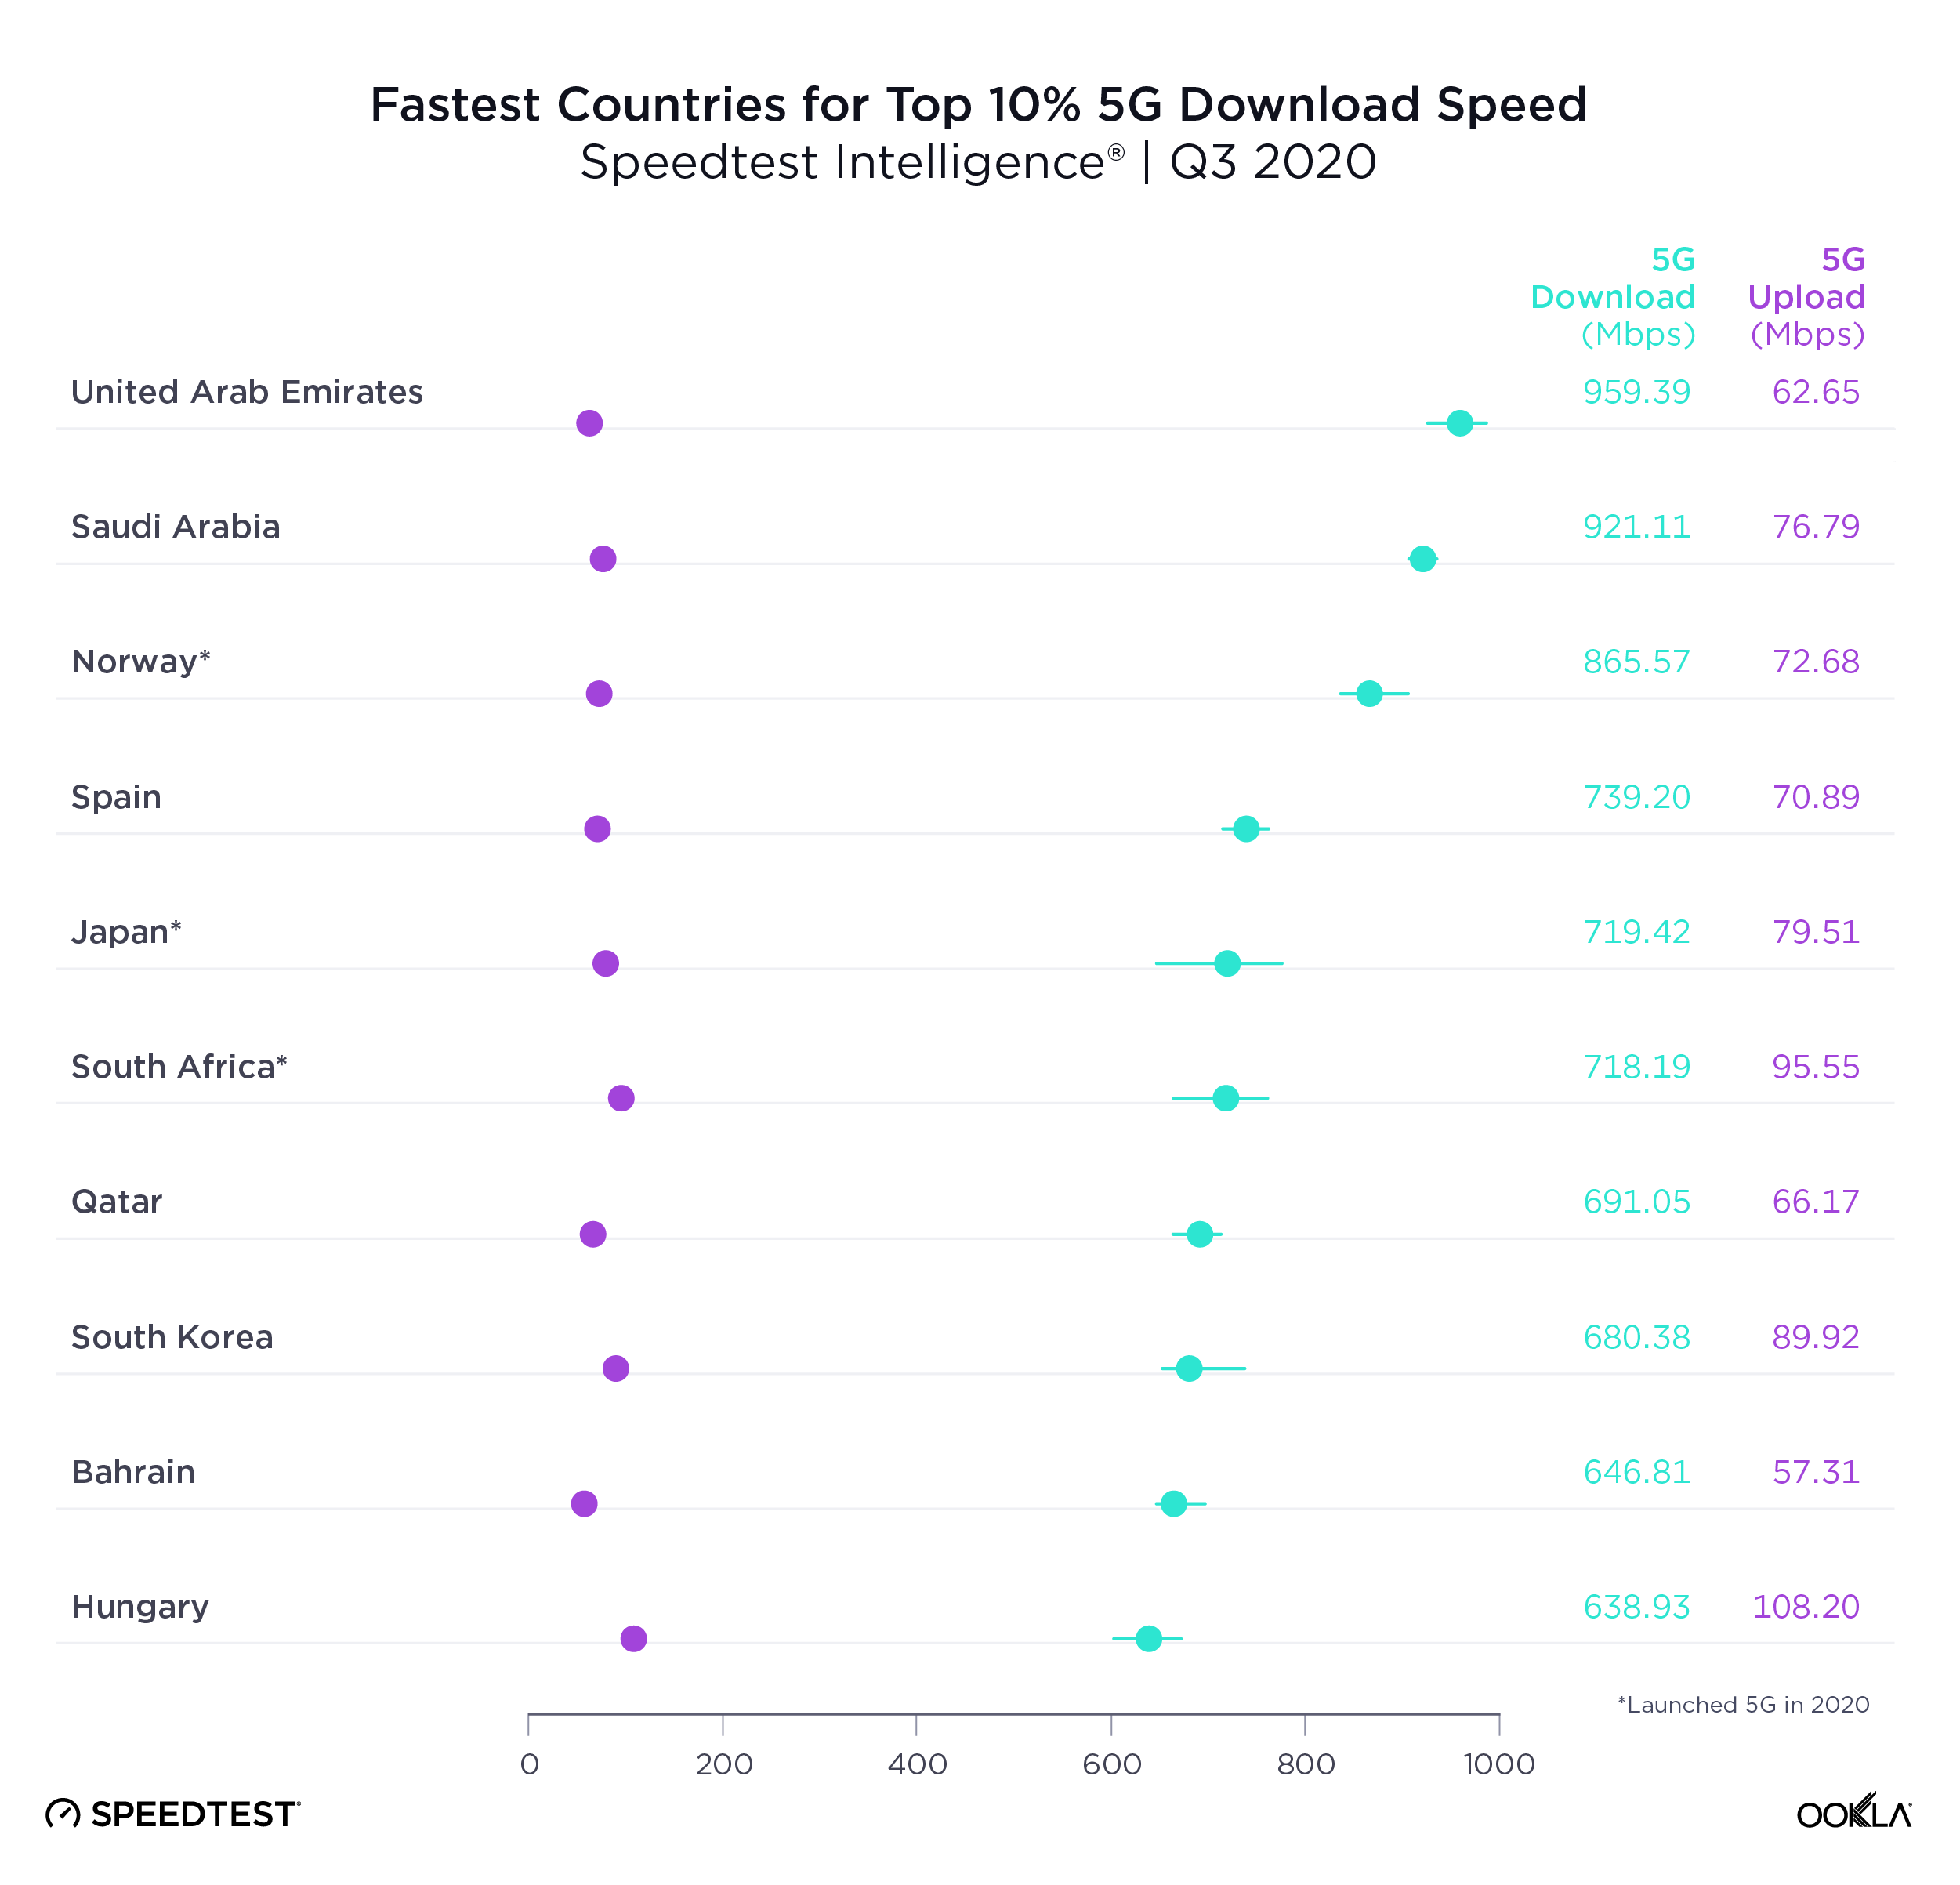
United Arab Emirates topped the list of countries with the fastest top 10% 5G download speed in Q3 2020. Top 10% (or 90th percentile) measures the speeds seen by the fastest 10% of users and is a way to gauge what each country’s networks are capable of. Saudi Arabia was second for top 10% 5G download speed, Norway third, Spain fourth and Japan fifth.
Fastest-Countries-Top-5G-Download-Speed_1220-2

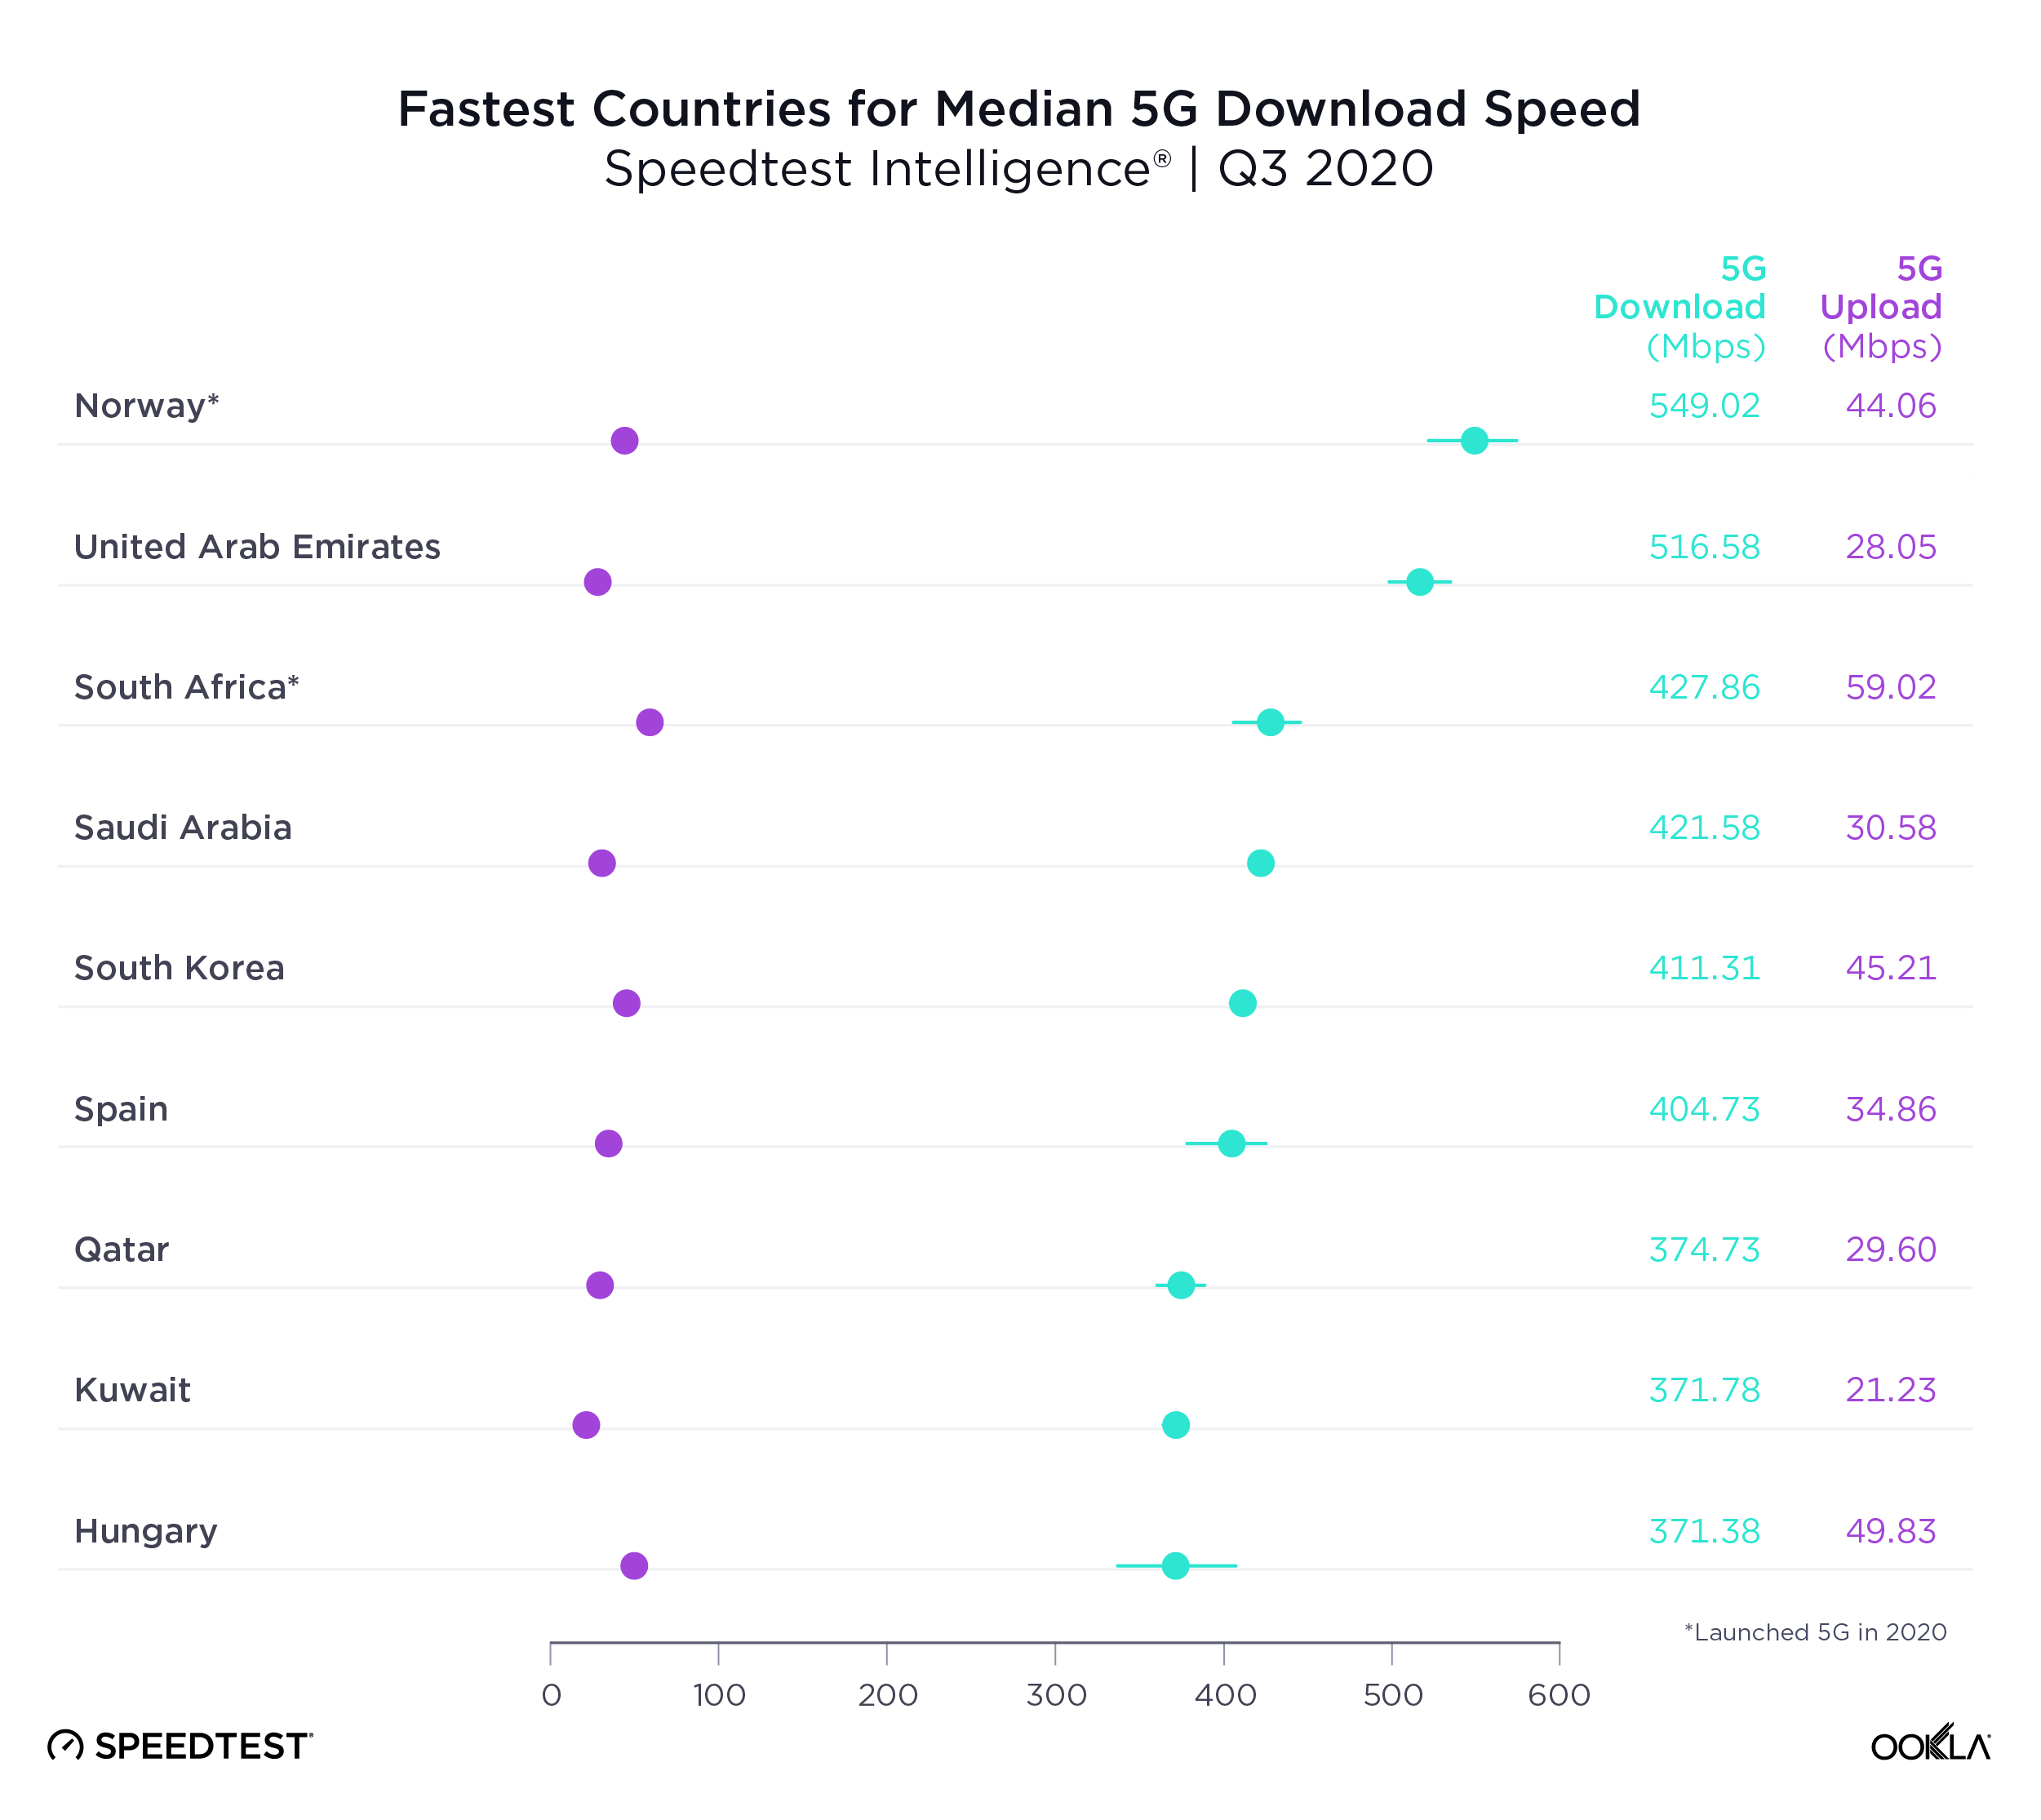
Another way to measure 5G performance is to look at median 5G download speed, which is a better predictor of the kind of performance most 5G customers can expect. Norway was the country with the fastest median download speed over 5G during Q3 2020. U.A.E. was second in this category, South Africa third, Saudi Arabia fourth and Spain fifth.
Fastest-Countries-Median-5G-Download-Speed_1220-2

It’s notable that Japan was on the list of 10 countries with the fastest top 10% 5G download speed but not on the list of 10 countries with the fastest median download speed over 5G. No matter how fast a country’s mobile infrastructure is, many other factors go into median 5G speeds, including device adoption and spectrum allocation.

Abu Dhabi tops list of 5G speeds in world capitals

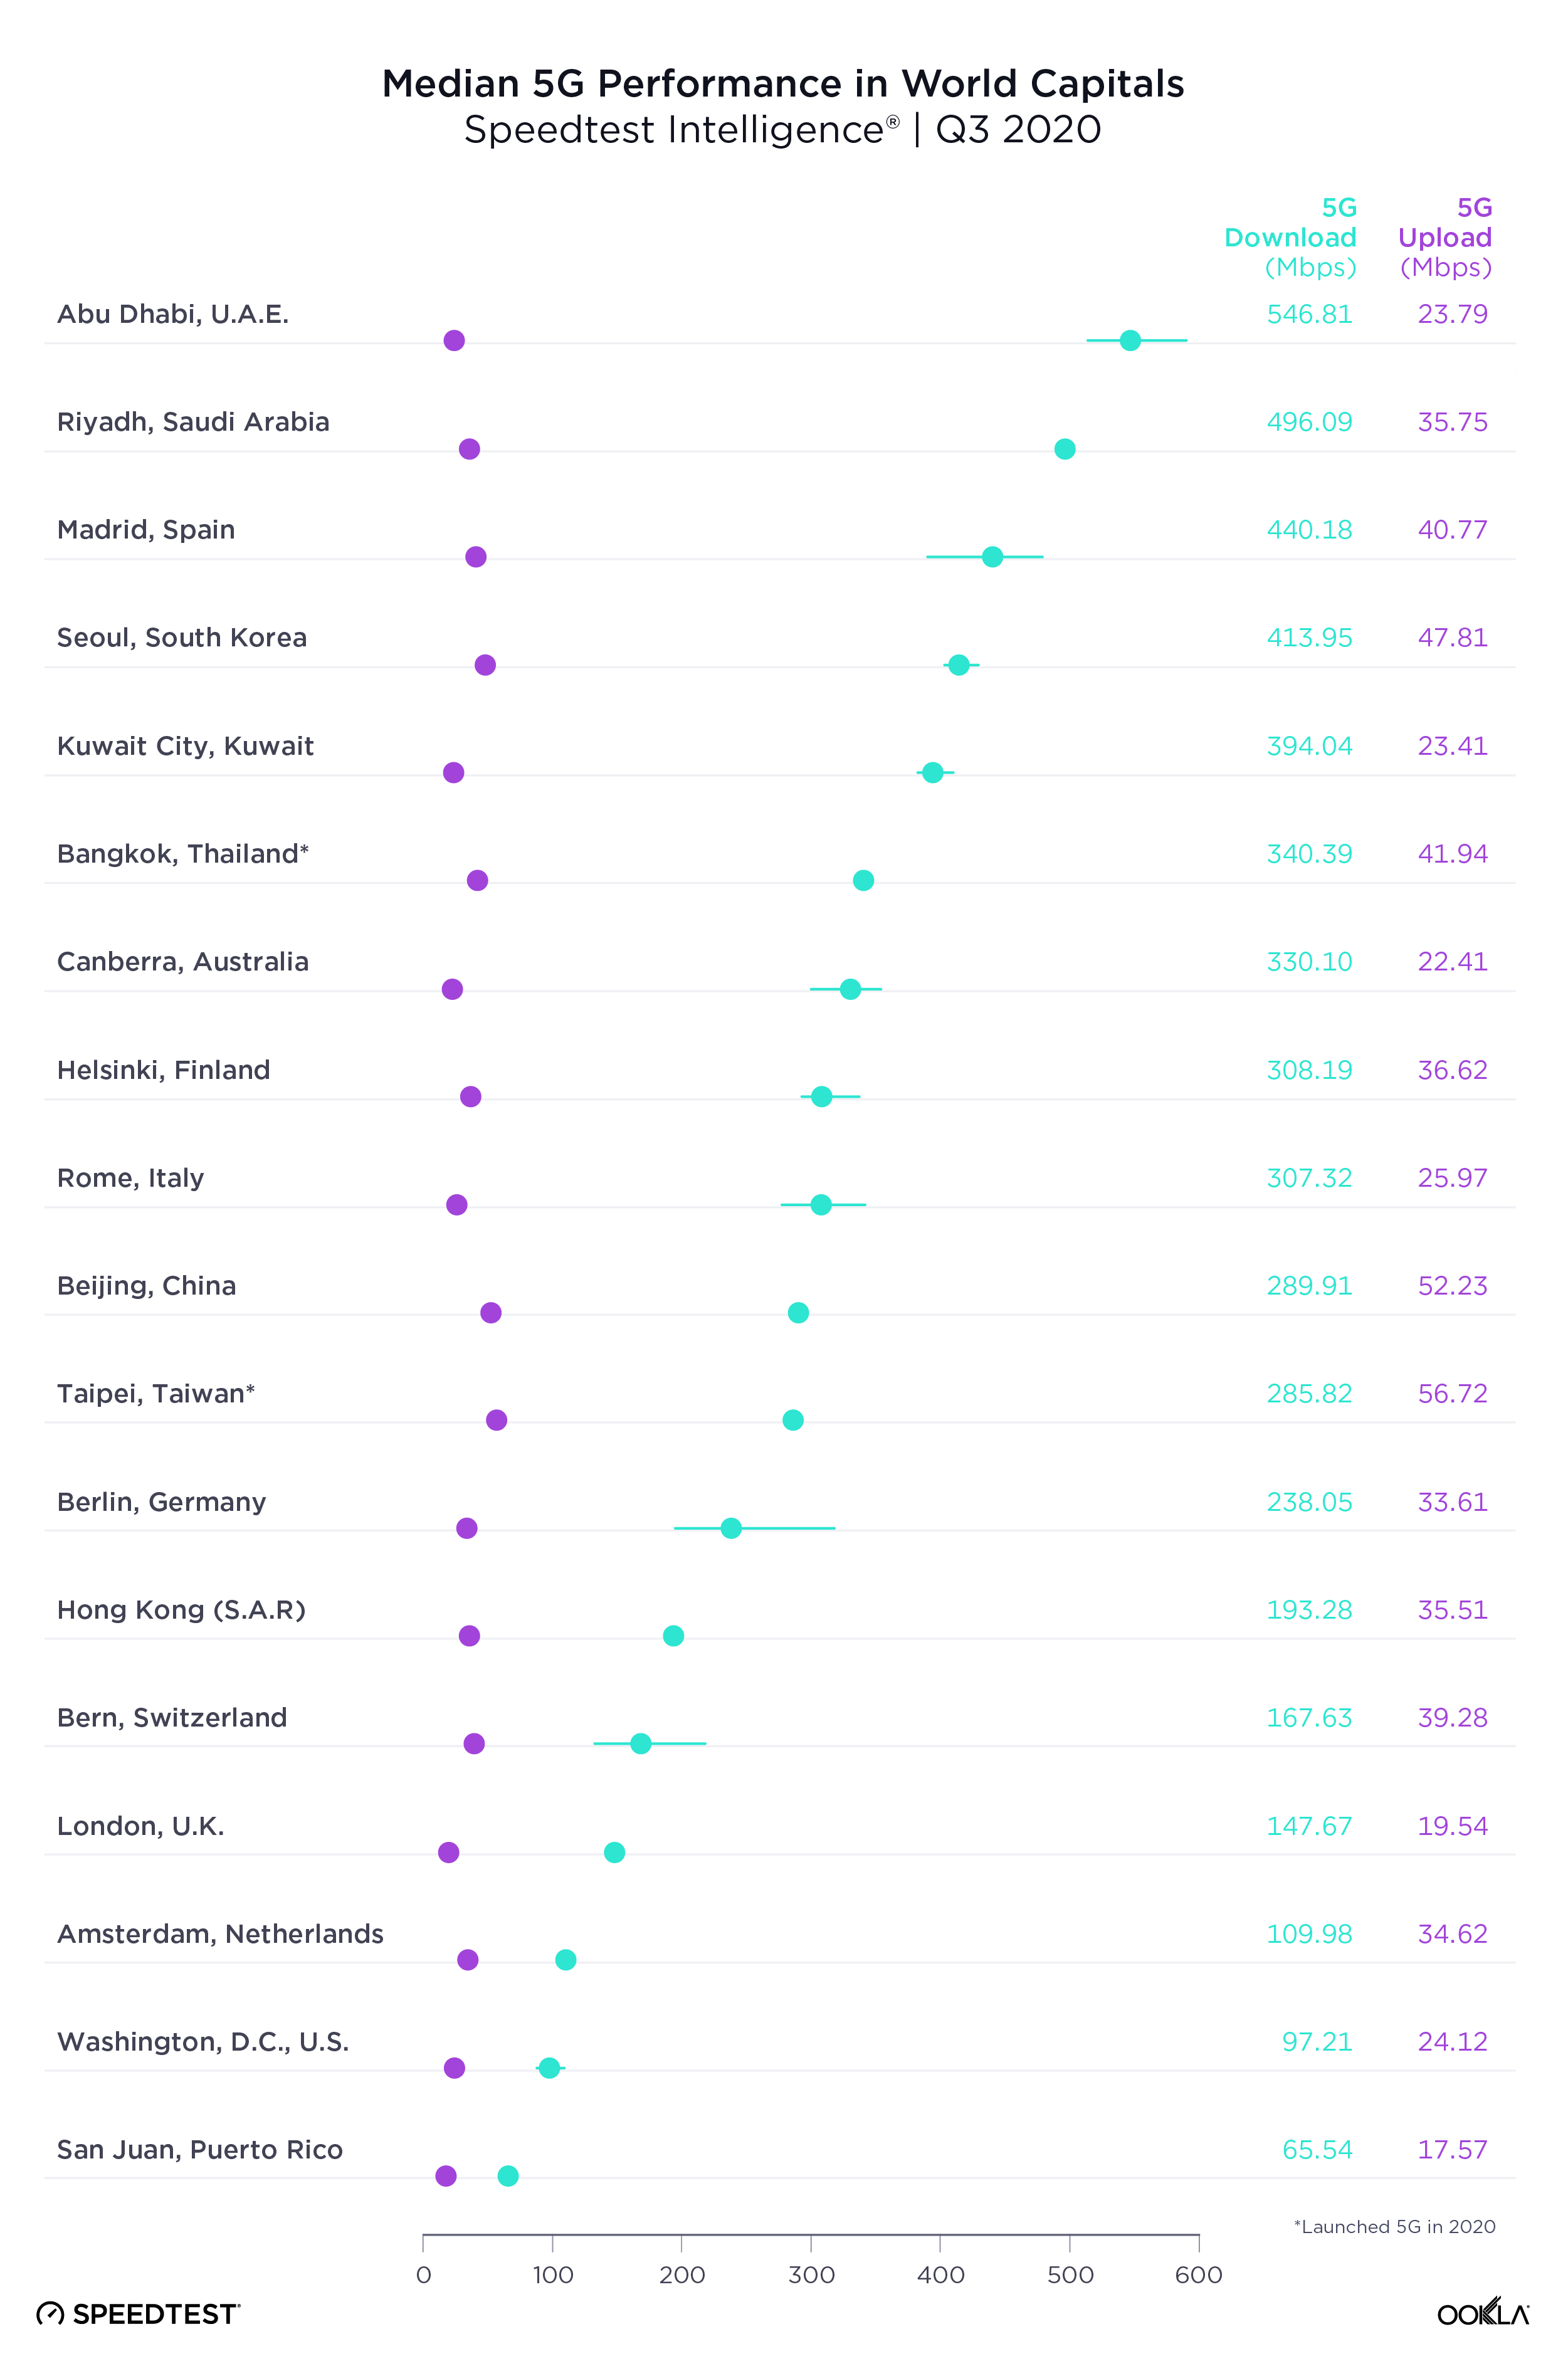
Our examination of 5G performance for 18 world capital cities with 5G during Q3 2020 found that Abu Dhabi had the fastest median download speed over 5G at 546.81 Mbps. Riyadh was second, Madrid third, Seoul fourth and Kuwait City fifth. As we saw at the country level, median upload speed was much lower than download speed.
Median-5G-Performance-Capitals_1220-2

How 5G performance and time spent compare within regions

We looked more closely at 5G performance across several intergovernmental organizations and trade blocs to get a better sense of how countries are performing in comparison to their neighbors and trade partners. We also calculated Time Spent on 5G, the proportion of time that users with 5G-capable devices spent on 5G, for each country.

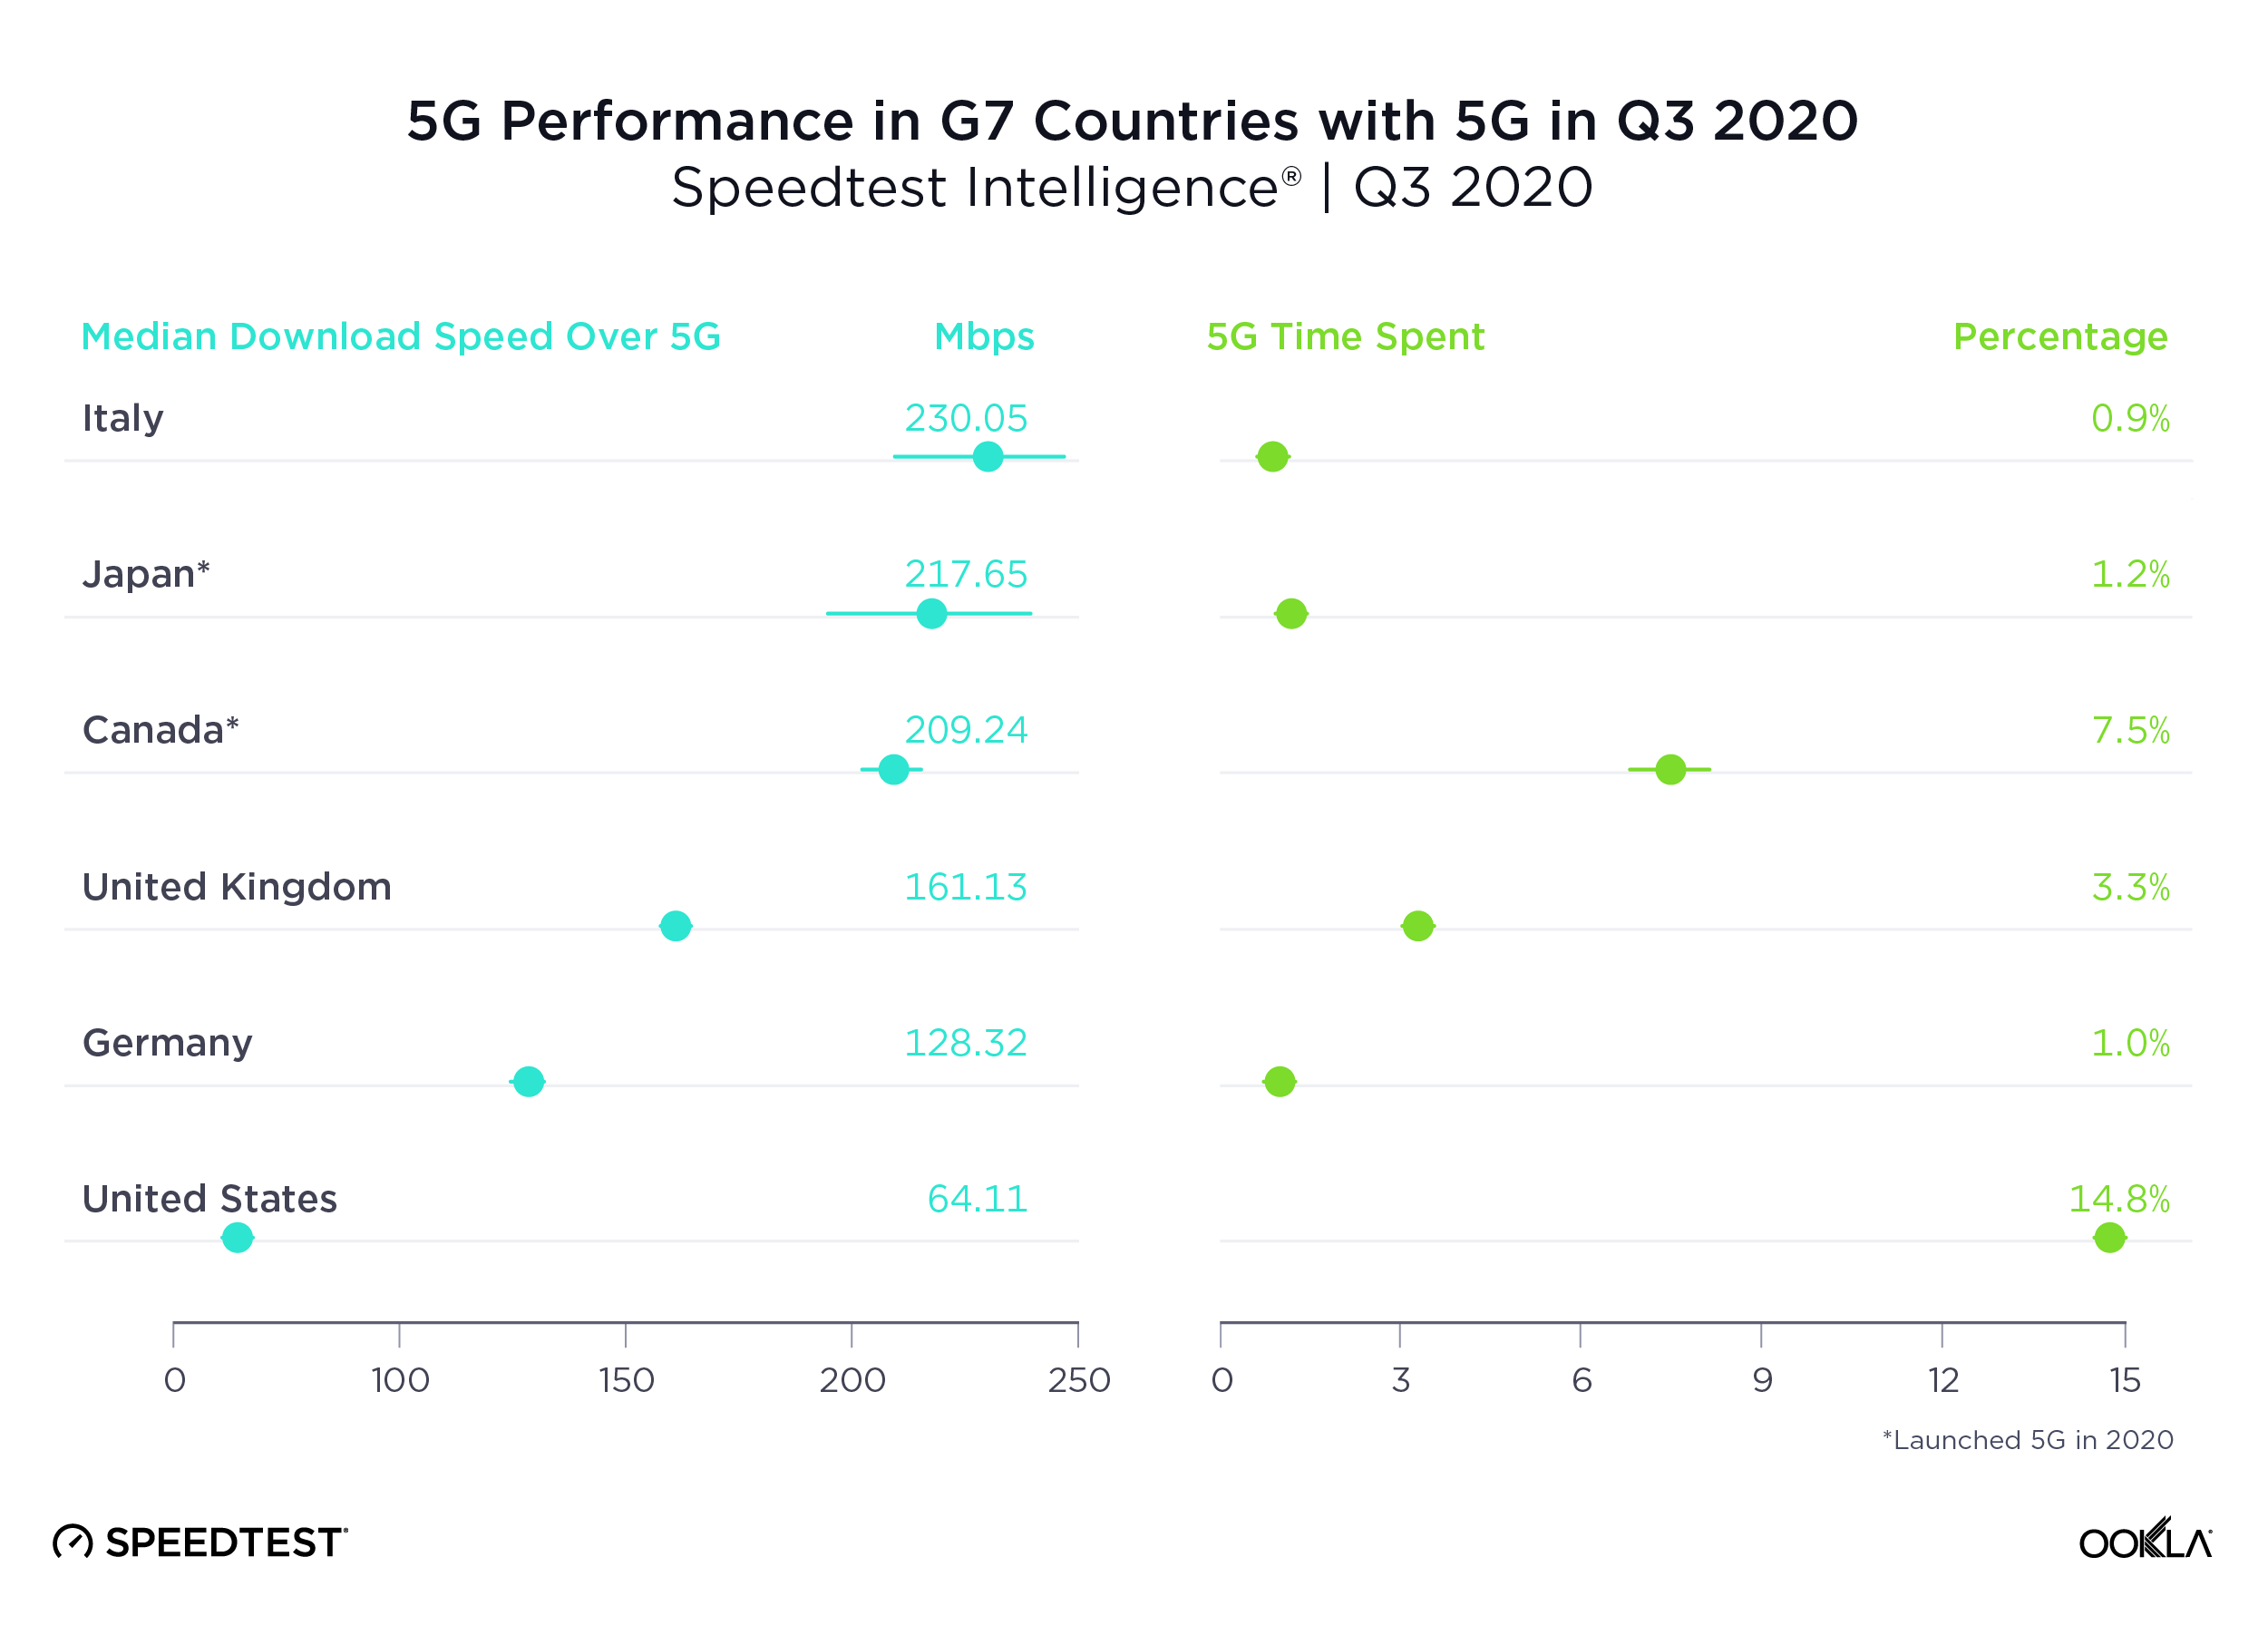
Italy had the fastest 5G among G7 countries, U.S. the slowest

Italy had the fastest median download speed over 5G of all the G7 countries. Japan was second, Canada third, the U.K. fourth and Germany fifth. The U.S. had the highest Time Spent on 5G, followed by Canada. For a deeper analysis of 5G in the U.K., read our previous coverage. Because France launched commercially available 5G only within the last couple of weeks, we have not included it on this table.
5G-Performance-G7-Countries_1220

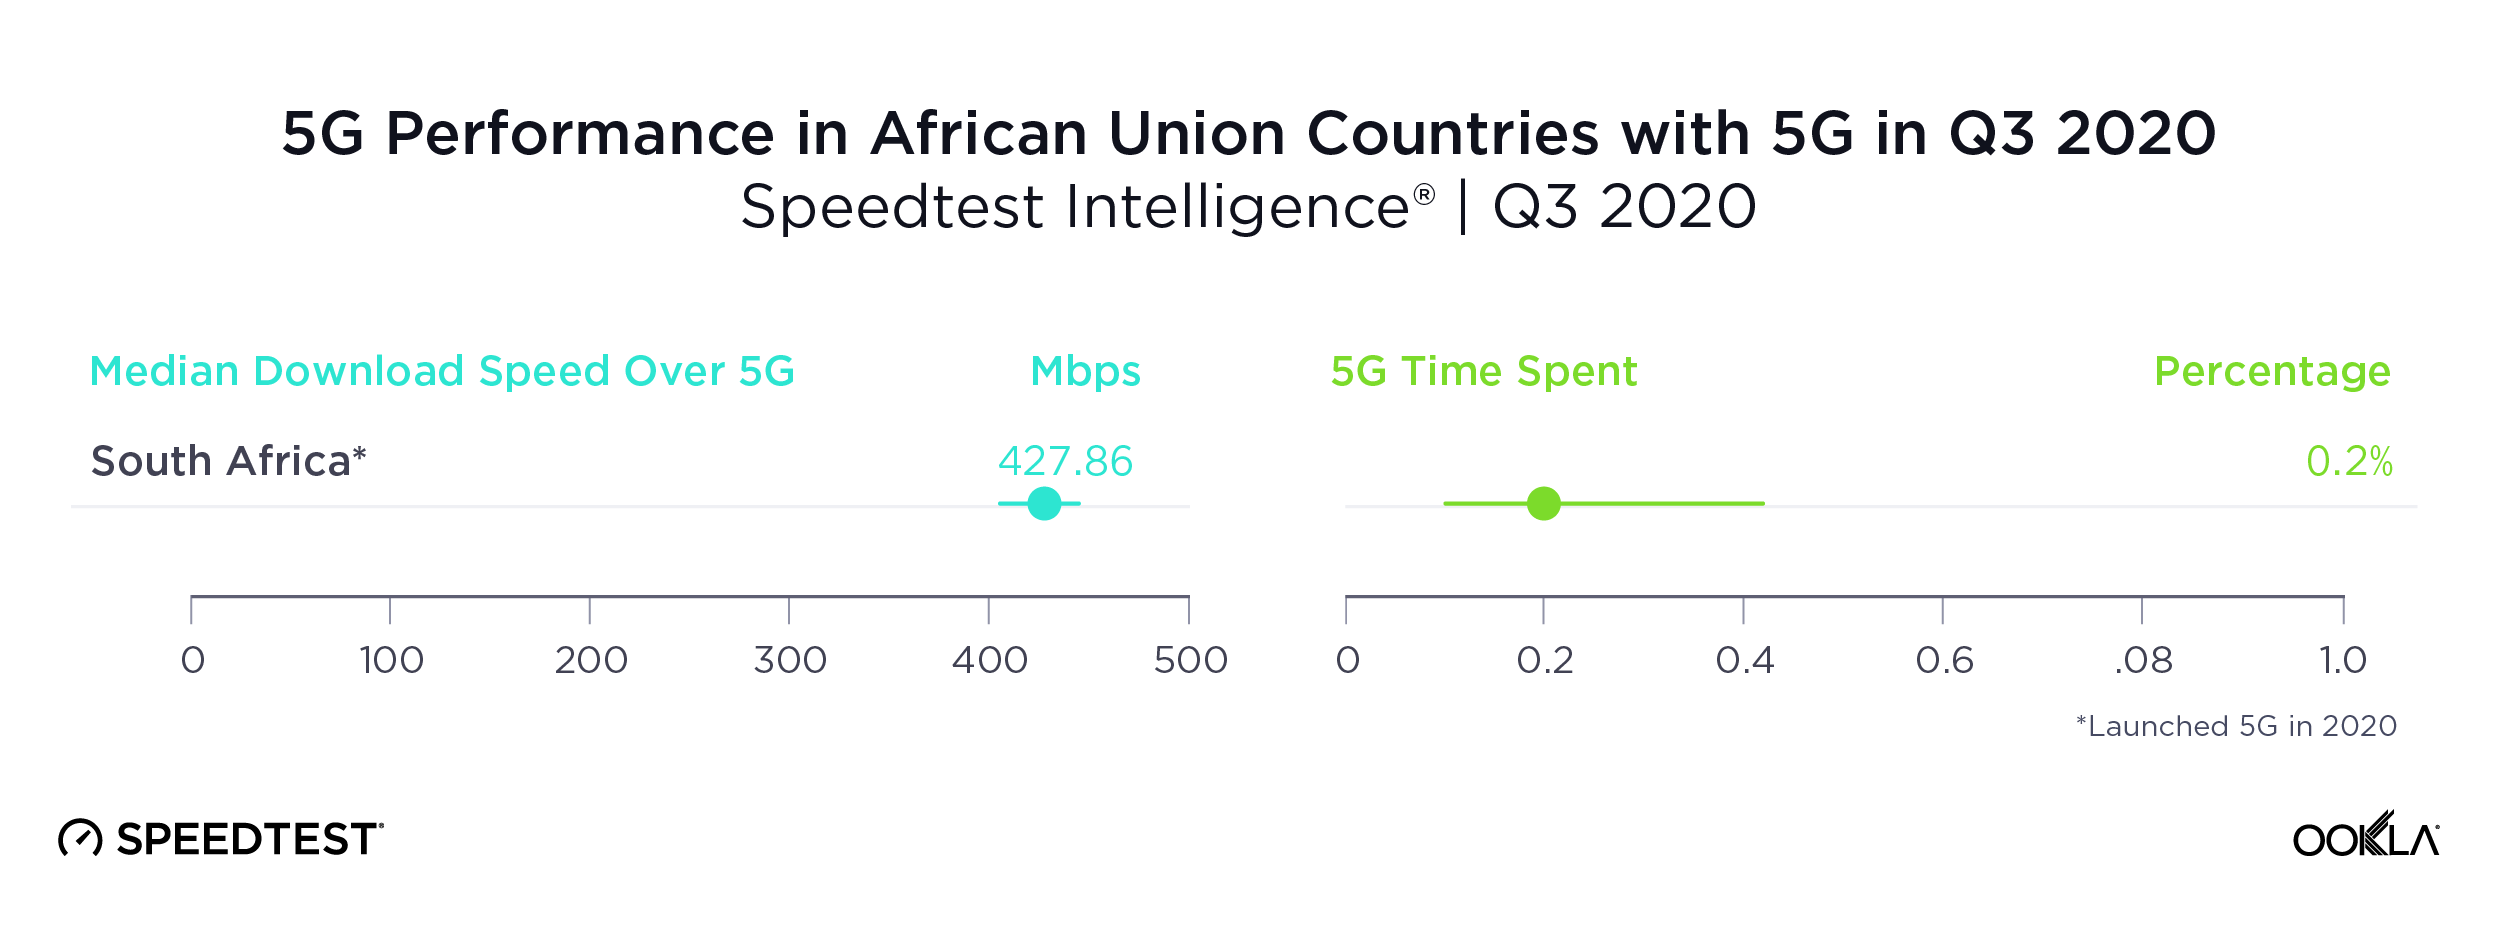
South Africa was the only country in the African Union with sufficient 5G to rate

As we saw above, South Africa’s impressive median download speed over 5G ranked the country third in the world during Q3 2020. South Africa was only one of two countries in the African Union to have commercially available 5G during Q3 2020. The other, Madagascar, did not have sufficient samples to properly analyze. Time Spent on 5G in South Africa was very low, an indication that 5G is not yet widely available there.
5G-Performance-Africa_1220

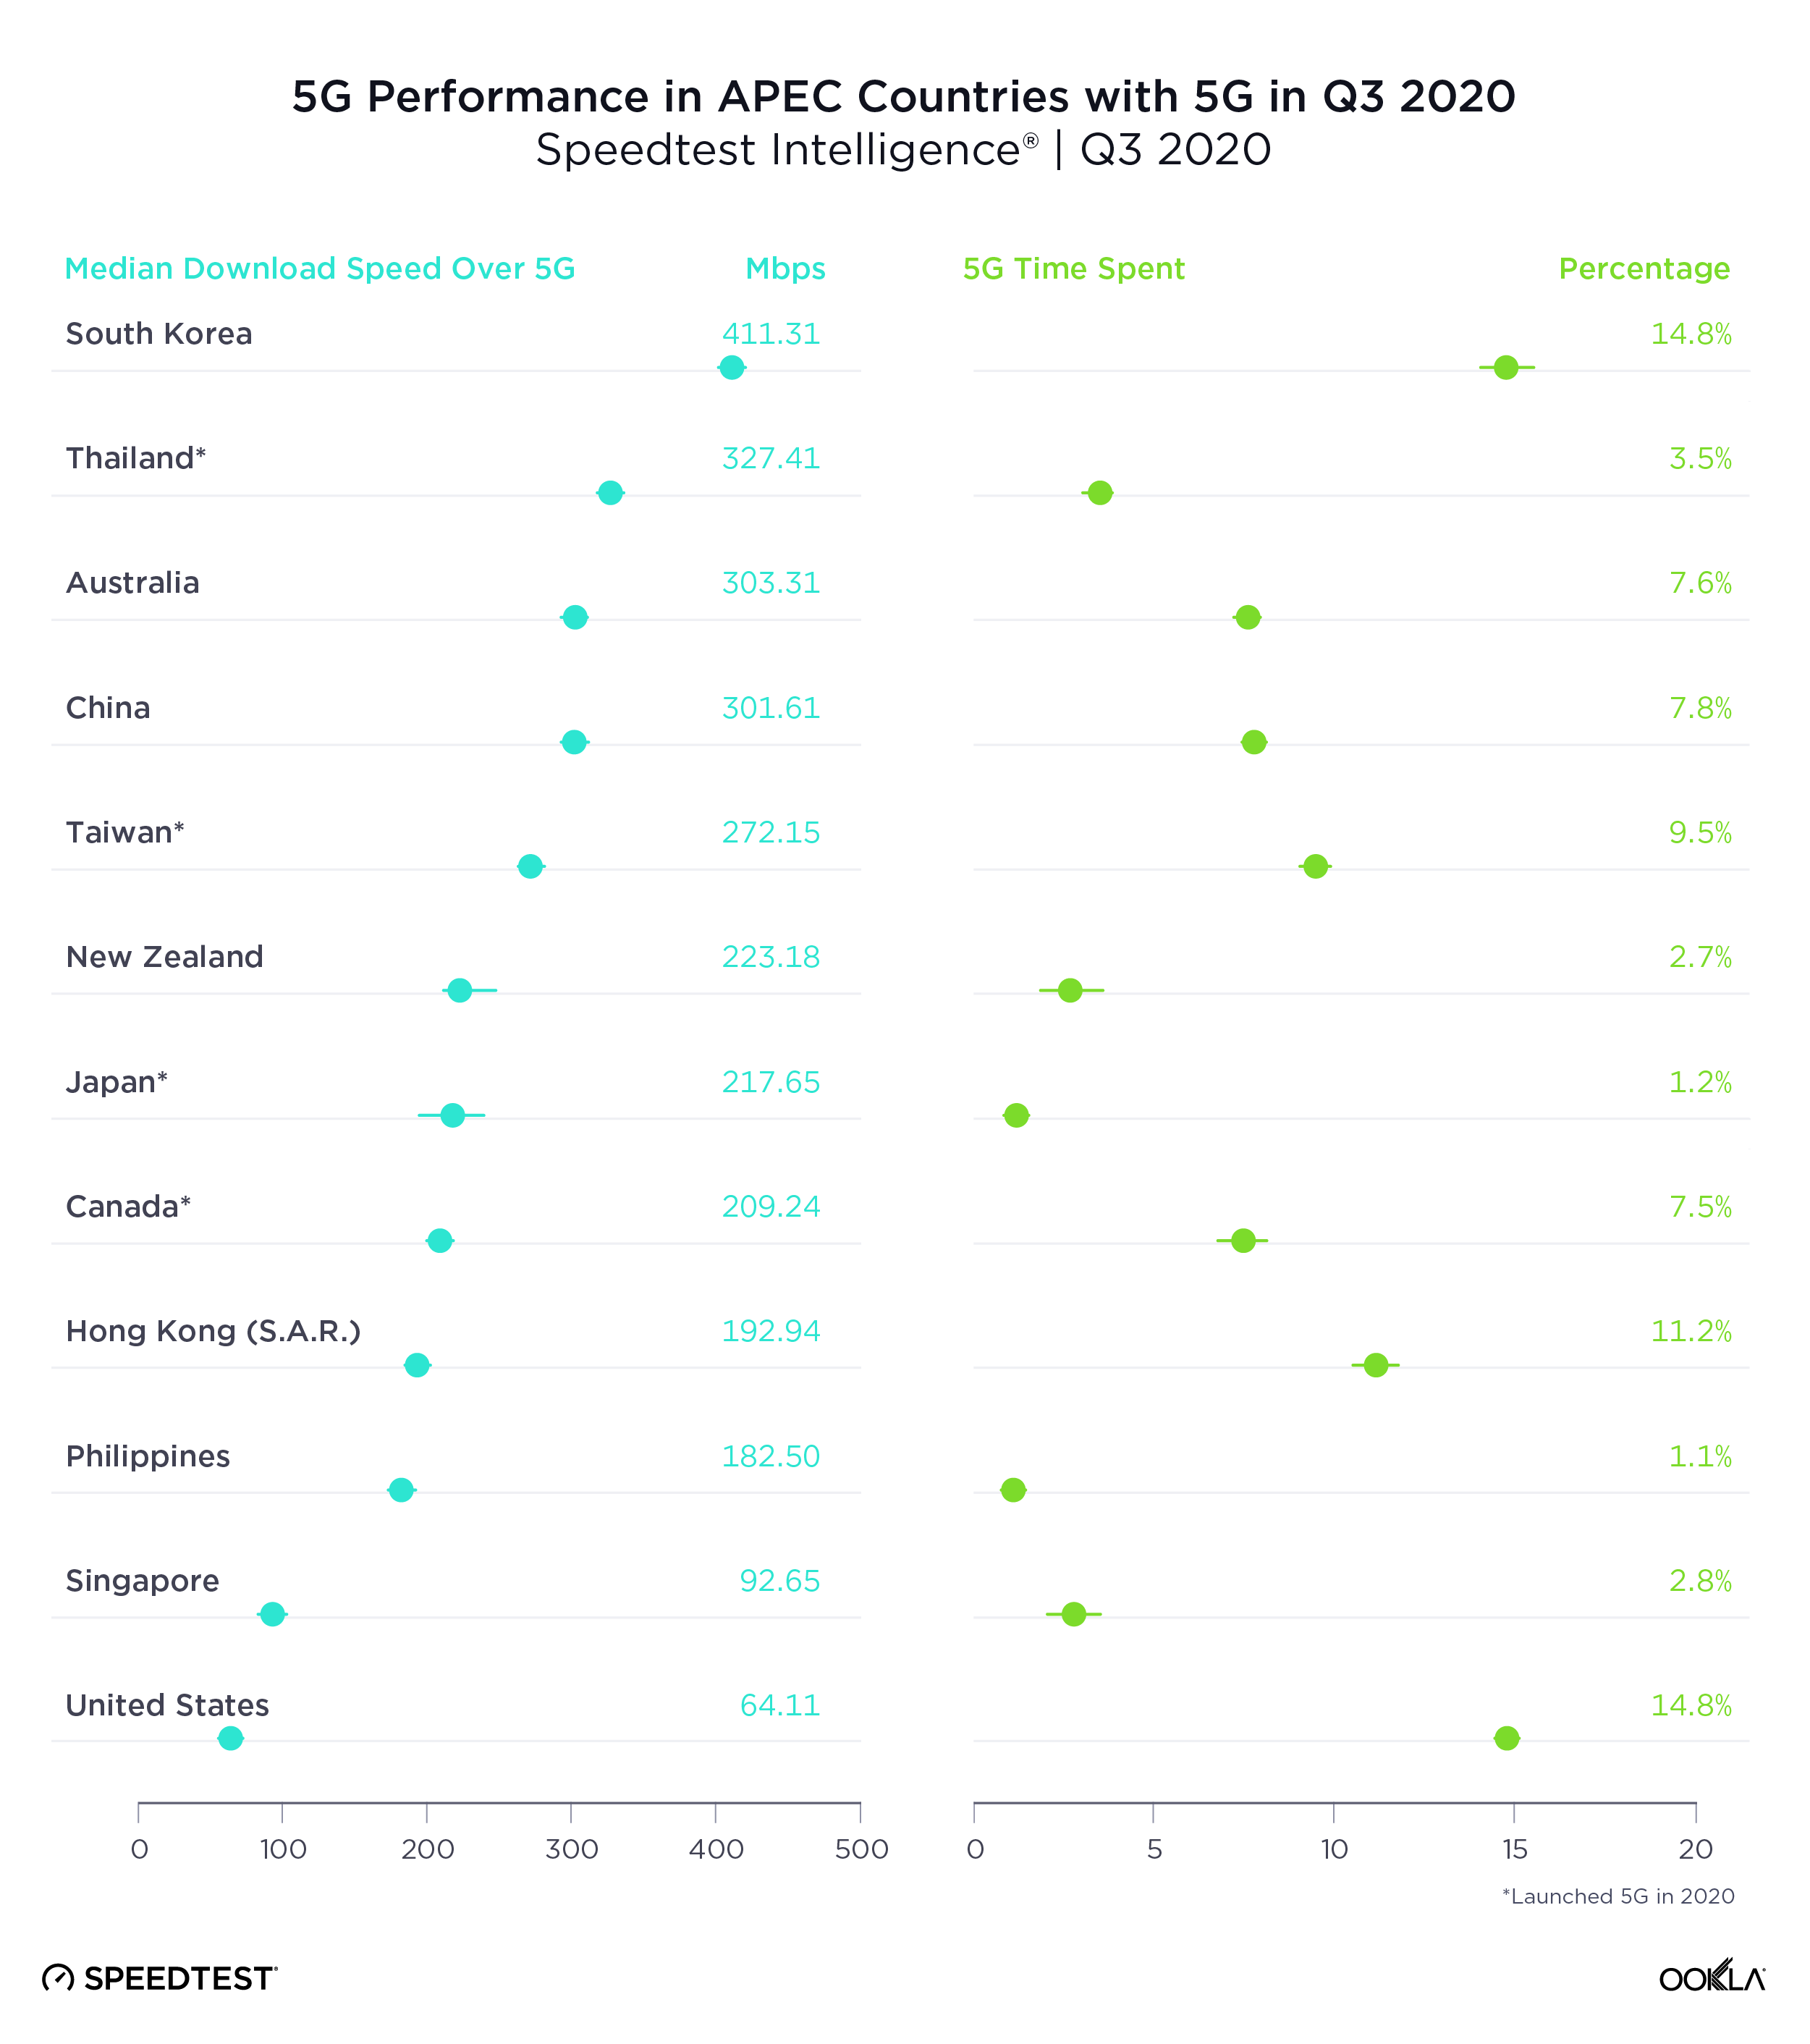
South Korea had the fastest 5G in APEC countries, U.S. the slowest

A median download speed over 5G of 411.11 Mbps put South Korea comfortably at the top of Asia-Pacific Economic Cooperation (APEC) countries with the fastest 5G during Q3 2020. Thailand was second, Australia third, China fourth and Taiwan fifth. 5G speeds represented the largest improvement over 4G in the Philippines where the median download speed over 4G during Q3 2020 (9.36 Mbps) was substantially lower than that of other countries on this list.

South Korea and the U.S. tied for highest Time Spent on 5G among APEC countries during Q3 2020, followed by Hong Kong and Taiwan.
5G-Performance-APEC_1220

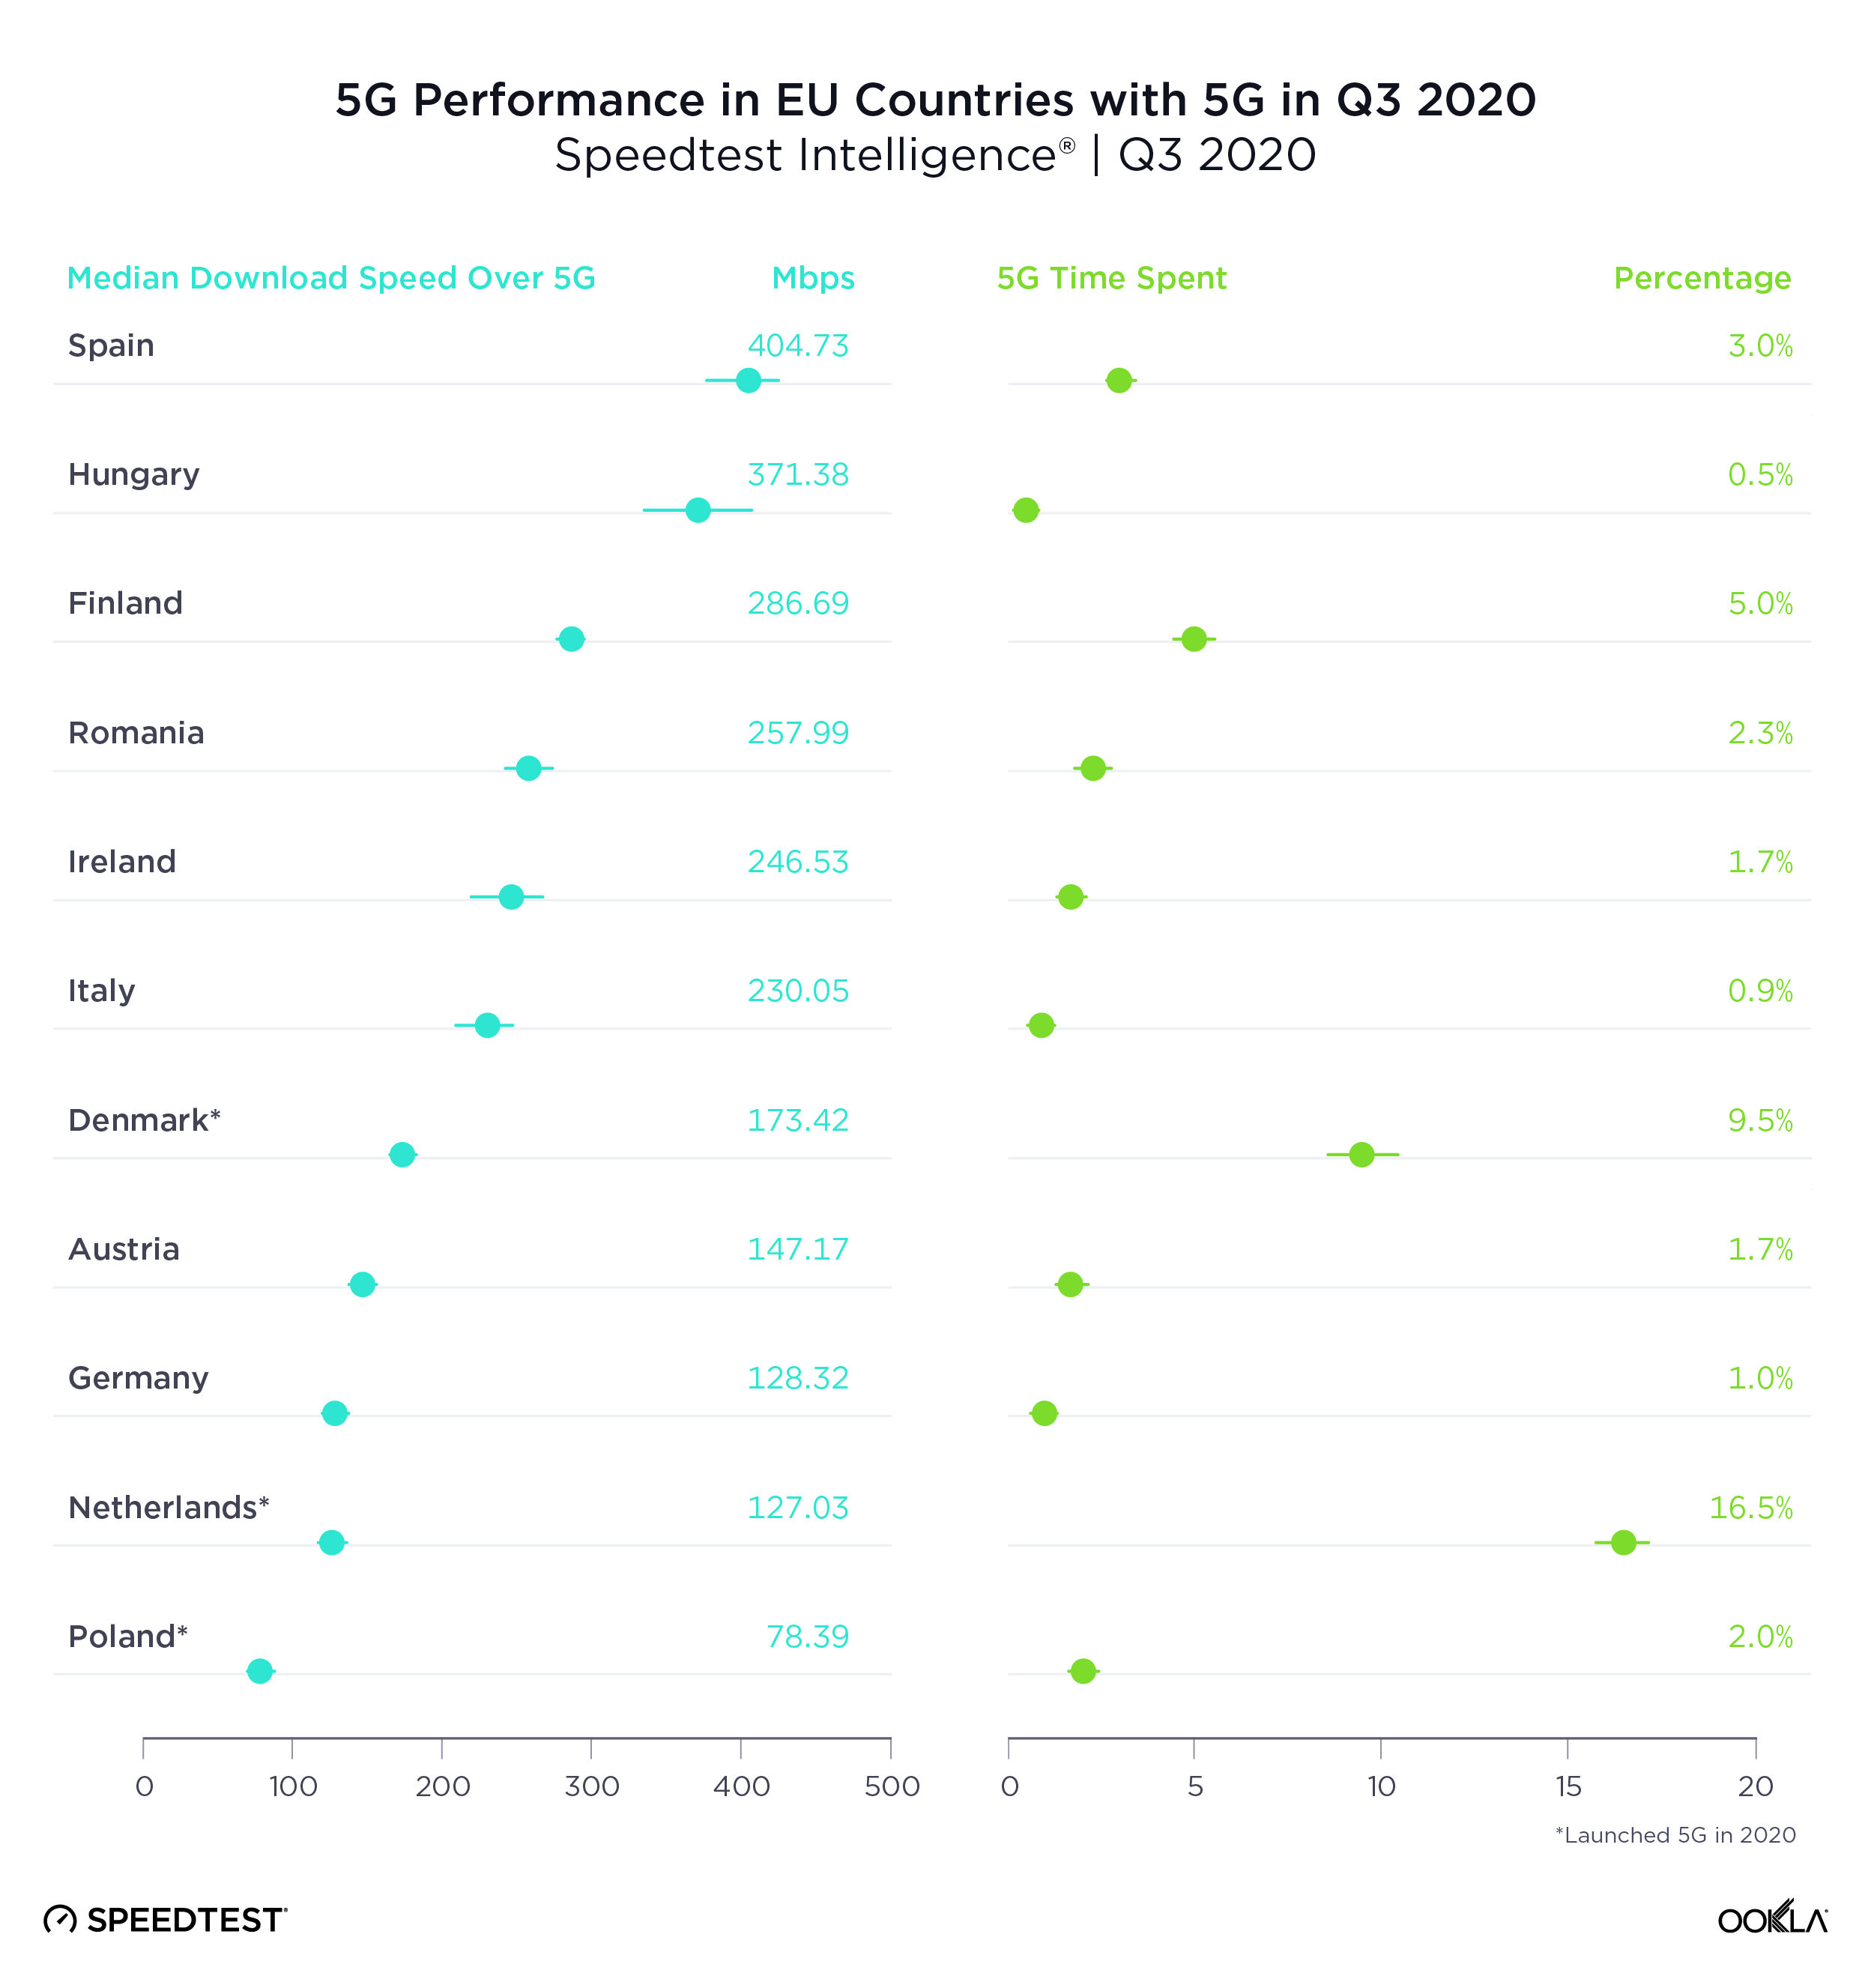
Spain had the fastest 5G in the E.U., Poland the slowest

Spain showed the fastest median download speed over 5G among the 11 European Union (E.U.) countries with sufficient 5G samples to rank during Q3 2020. Hungary was second, Finland third, Romania fourth and Ireland fifth. Spain’s median download speed over 5G also represented the largest gain over 4G among all of these countries, partially because Spain had the second slowest median download speed over 4G. France is not included on this list because 5G did not become commercially available in the country until after Q3 2020.

The Netherlands had the highest Time Spent on 5G among E.U. countries during Q3 2020, indicating that customers with 5G phones are able to spend far more time on 5G there than in other E.U. countries. Denmark was second for Time Spent on 5G among EU countries in Q3 2020 and Finland third.
5G-Performance-EU_1220

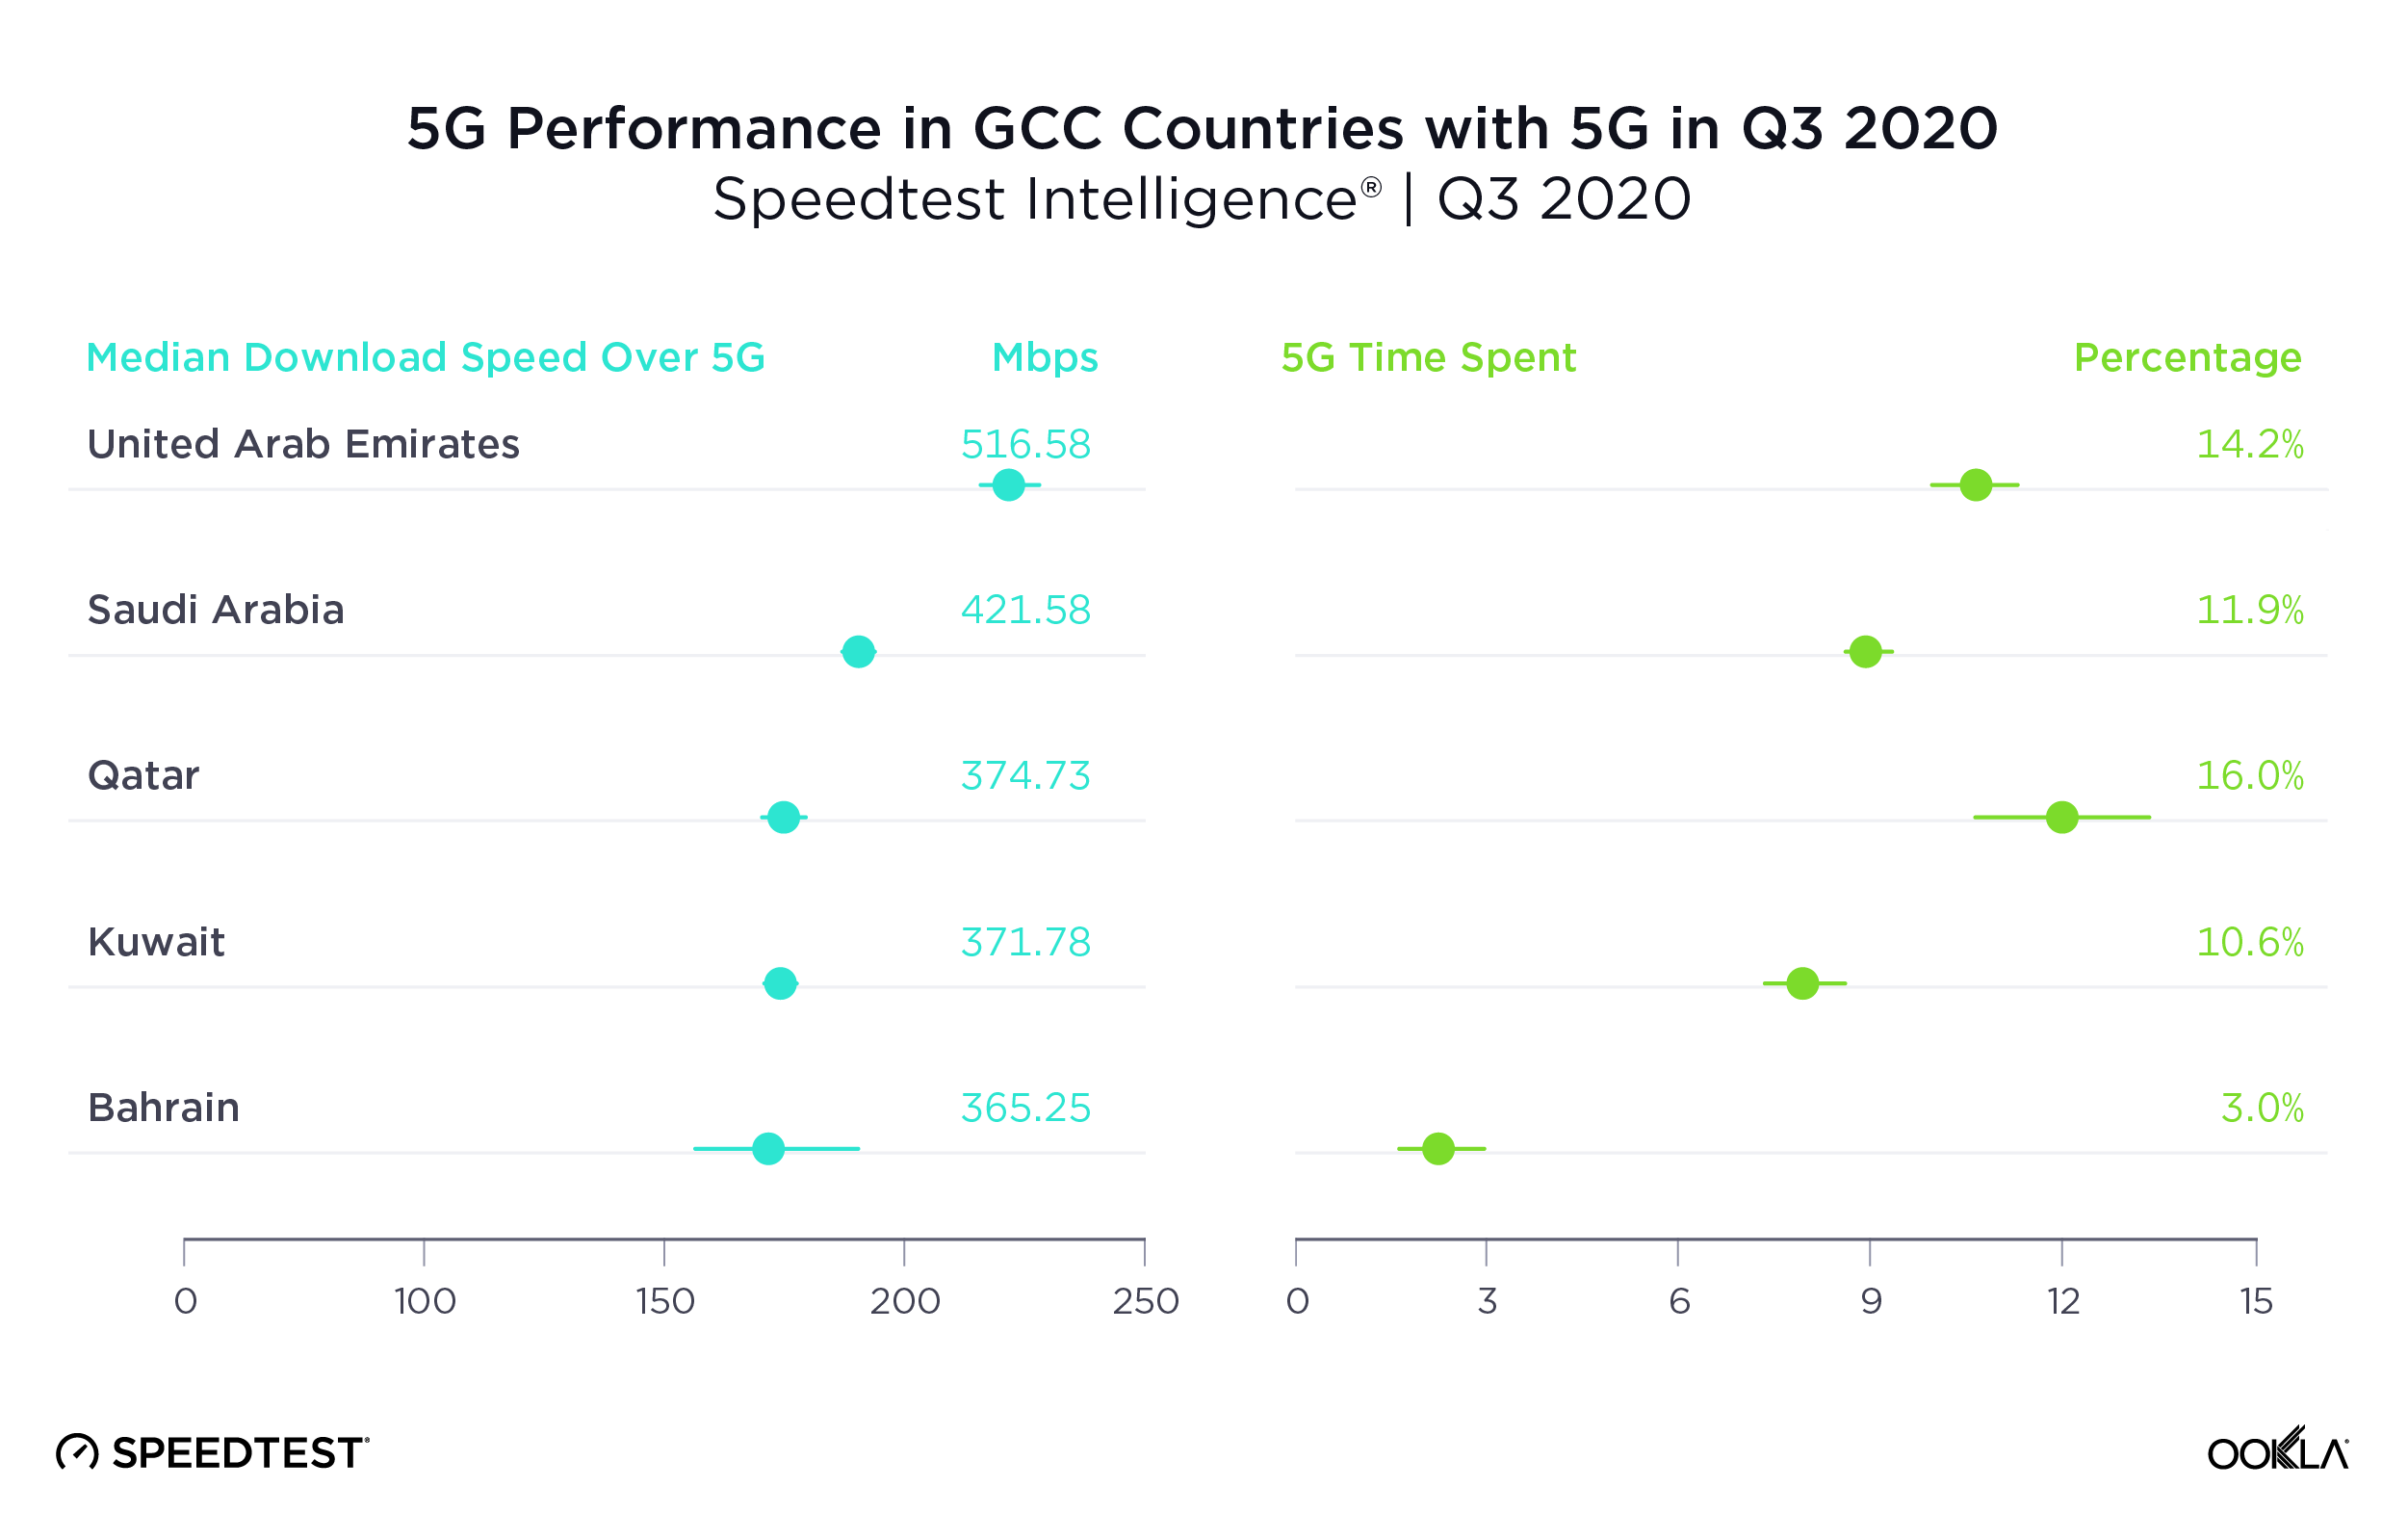
U.A.E had the fastest 5G in Gulf Cooperation Council Countries

With the second fastest median download speed over 5G in the world, U.A.E. was also the Gulf Cooperation Council (GCC) country with the fastest 5G during Q3 2020. Saudi Arabia was second and Qatar third. While Oman does have commercially available 5G, there were insufficient samples in the country during Q3 2020 to properly analyze performance.

5G represented the largest improvement over 4G in Kuwait and Bahrain, countries that had slower median download speeds over 4G than their neighbors.

Time Spent on 5G was relatively high in all the GCC countries on this list, except Bahrain, when compared to other countries in the world during Q3 2020. Qatar showed the highest Time Spent on 5G among GCC countries in Q3 2020 at 16.0%. U.A.E. was second and Saudi Arabia third.
5G-Performance-GCC_1220

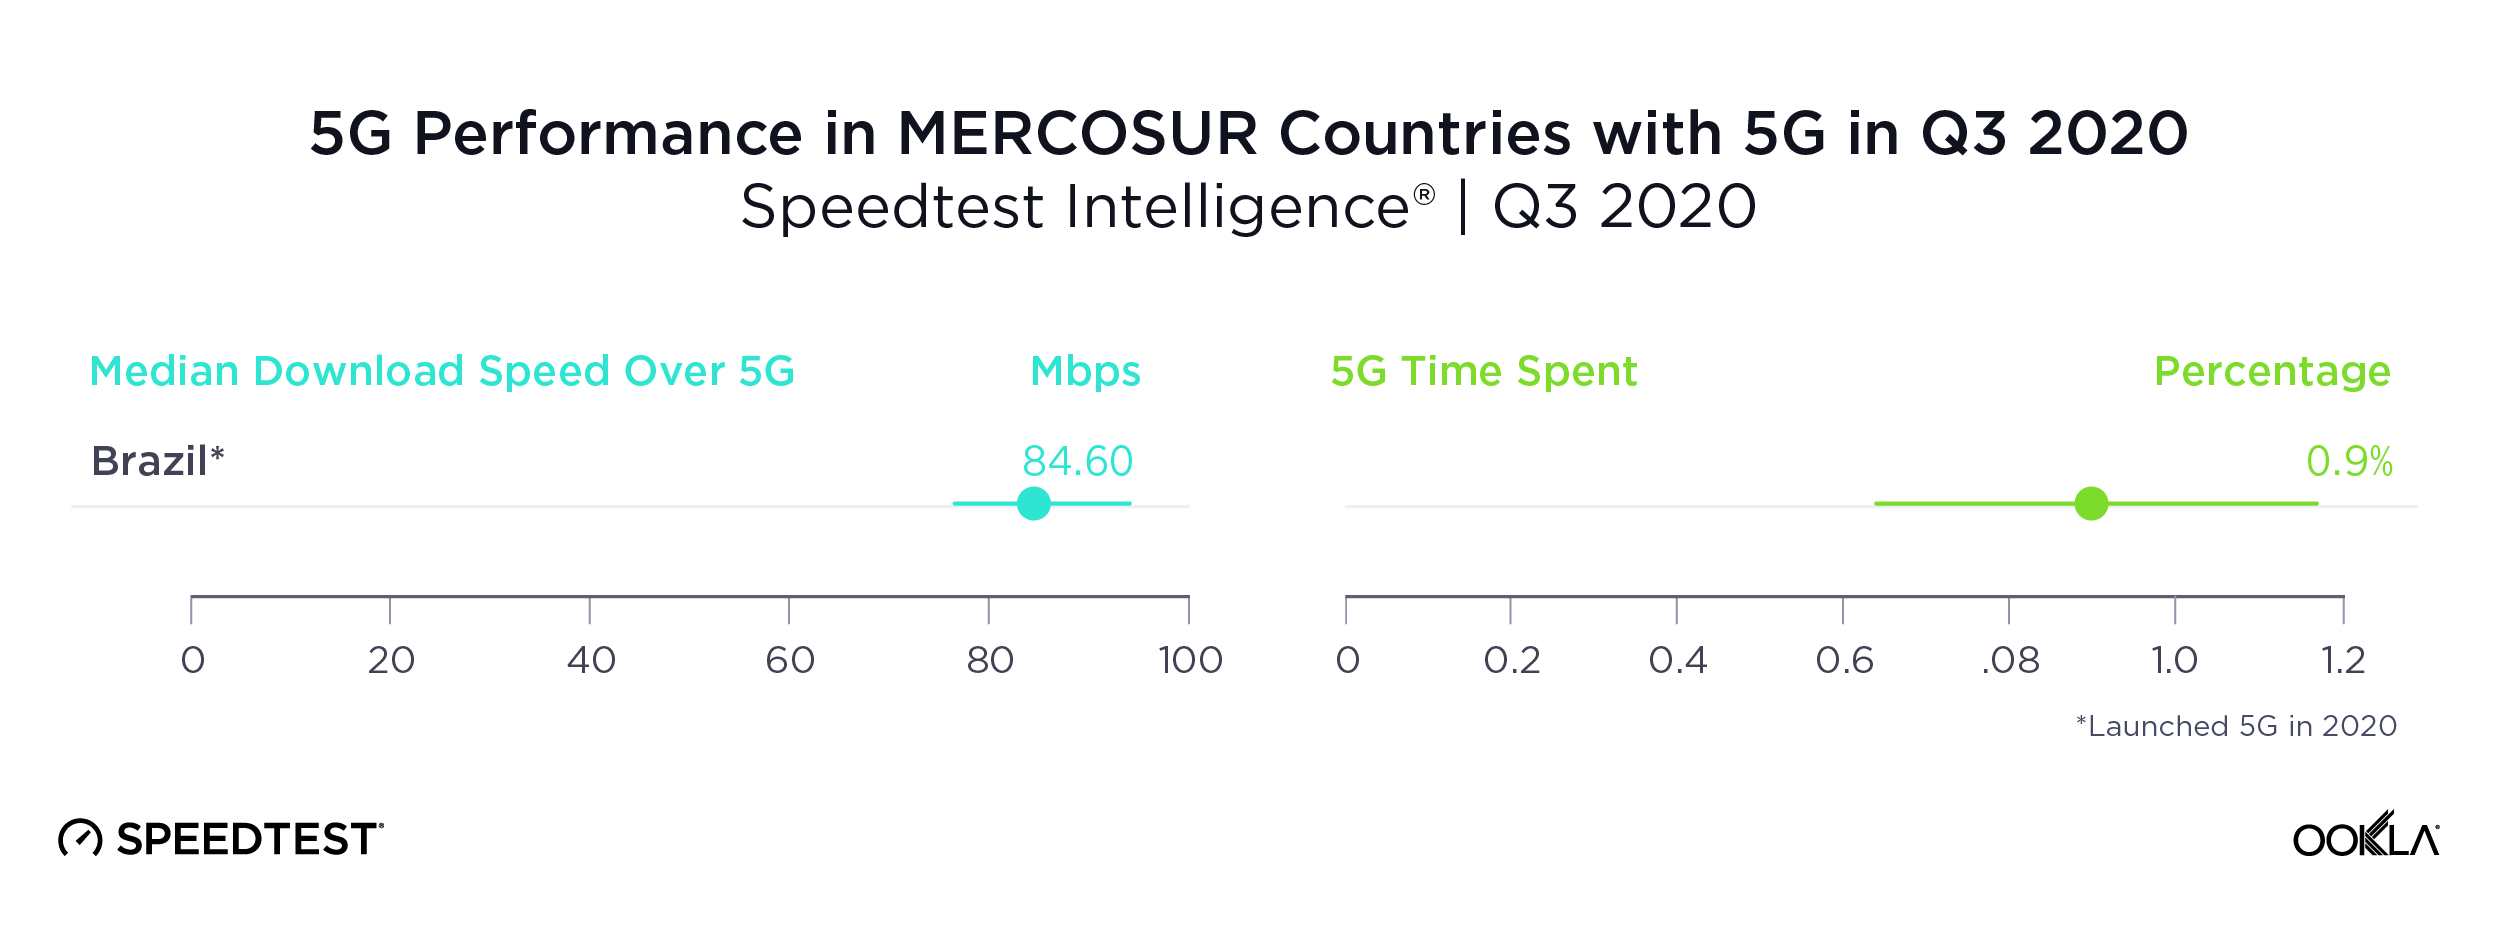
Brazil was the only MERCOSUR country with sufficient 5G to rate

Brazil’s median download speed over 5G of 84.60 Mbps during Q3 2020 may not seem fast for 5G, but it still puts Brazil well ahead of other countries in the Southern Common Market (MERCOSUR), most of which do not yet have 5G at all. We did see 5G results in Colombia, but there were insufficient samples to properly compare.

Time Spent on 5G in Brazil during Q3 2020 was not quite one percent, indicating that customers do not have much access to 5G yet.
5G-Performance-MERCOSUR_1220

The U.S., Europe and Asia see widespread 5G coverage

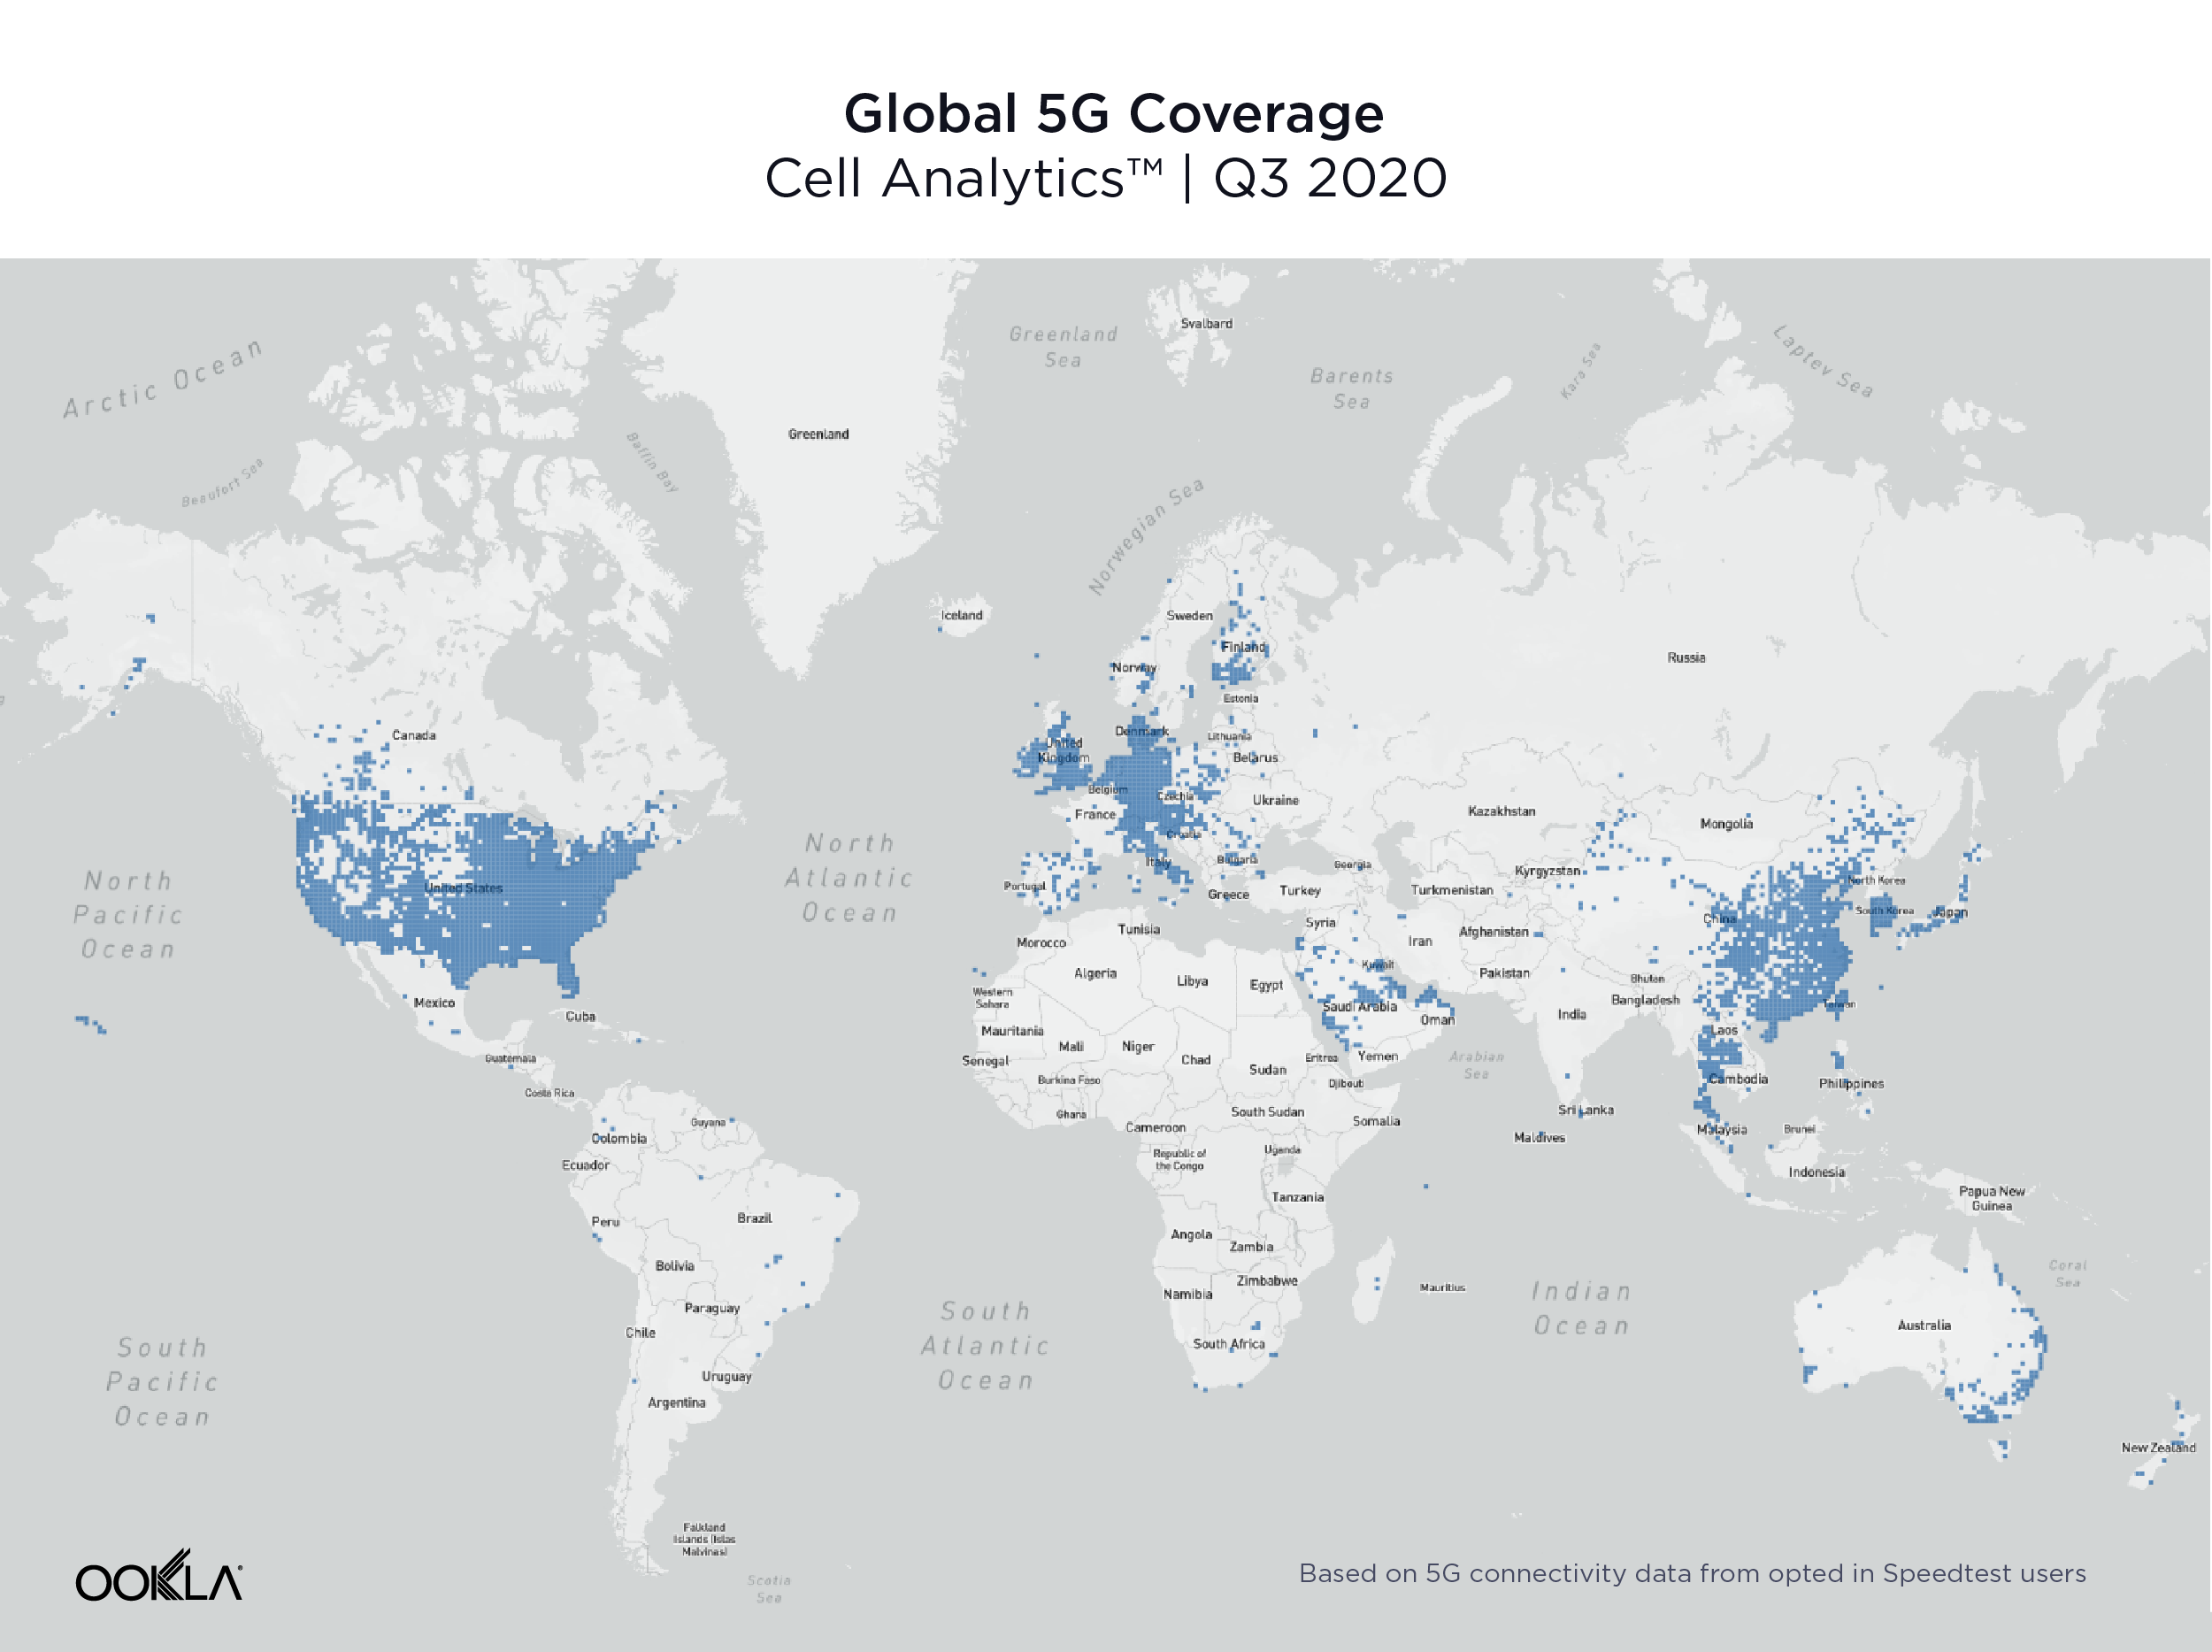
Data from Cell Analytics™ shows a global view of 5G coverage in Q3 2020. This map, based on 5G connectivity data for opted-in Speedtest users, shows that 5G is spreading rapidly across the U.S., Europe, the Arabian Peninsula and Asia. In other regions, 5G is primarily available in larger cities, if at all.
Global-5G-Coverage_1220

99 countries worldwide had 5G, in 14,643 total cities

The number of countries with 5G deployments increased 62.3% between Q3 2019 and Q3 2020, with 99 countries having 5G deployments at the end of Q3 2020, according to the Ookla 5G Map™. There were 14,643 cities worldwide with 5G deployments at the end of Q3 2020, a 1,671% increase over Q3 2019. The total number of deployments worldwide was 17,046. The counts here and throughout this section include commercially available 5G as well as 5G networks with limited availability and those in pre-release.

Countries with the Most 5G Cities
Ookla 5G Map™ | Q3 2020
Country Numbers of Cities with 5G
United States 7,583
Germany 2,312
Austria 1,104
Netherlands* 1,009
Switzerland 554
Thailand* 325
Ireland 214
Puerto Rico 187
United Kingdom 169
Kuwait 97

The U.S. had the most cities with 5G deployments at the end of Q3 2020 with 7,583. Germany was second, Austria third, the Netherlands fourth and Switzerland fifth. A deployment is when a provider has some level of 5G presence in a city. A city can have multiple deployments when more than one provider is present.

Countries with the Largest Growth in Number of Deployments
Ookla 5G Map™ | Q3 2020
Country 5G Deployments as of Q3 2020 % Change Q3 2020 vs Q3 2019
Netherlands* 1,071 50,350%
Thailand* 451 32,401%
United States 7,808 21,566%
Germany 2,417 11,460%
Canada* 93 7,600%
Austria 1,173 4,918%
Ireland 236 4,180%
Poland 81 3,150%
Japan* 75 2,050%
Oman 50 2,000%

The Netherlands showed the largest percentage change in the number of 5G deployments between Q3 2019 and Q3 2020 with a 50,350% jump from two deployments in Q3 2019 to 1,071 in Q3 2020. Thailand saw the second largest percentage increase, the U.S. third, Germany fourth and Canada fifth.

Most early trials and commercial deployments of 5G spectrum allocations around the world have been centered around fallow swaths of the mid-band (3.3 GHz – 4.2 GHz) spectrum. With the recent commercialization of Dynamic Spectrum Sharing (DSS) across all major 5G infrastructure vendors, there is now increasing demand for 5G support on many existing 4G frequencies, ranging from 600 MHz to 2.5 GHz. In unique 5G markets like Japan, there is an additional need for the 4.5 GHz band as well as the millimeter wave (FR2).

In the United States, early deployments leveraged millimeter wave frequency bands in the 28 GHz and the 39 GHz, which delivered impressive speeds in a very constrained footprint. The rapid 5G deployment in the 600 MHz band has added a substantial nationwide 5G footprint — and with that, much wider 5G availability for many more Americans. With the recent merger between T-Mobile and Sprint, the deployment of 2.5 GHz spectrum has been significantly accelerated, which should improve both network efficiency and user experience on T-Mobile’s network. Additionally, next year’s availability of 5G Carrier Aggregation will allow T-Mobile to combine 600 MHz with 2.5 GHz to deliver improved 5G speeds on top of the existing nationwide footprint. In addition, DSS has recently been deployed by AT&T and Verizon, which allows operators to choose from existing low-band spectrum assets (850 MHz) and deliver both LTE and 5G at the same time. This feature alone doesn’t add a significant boost in perceived user experience, but will certainly improve the 5G footprint.

China showed the highest percentage of 5G test samples

Another way to measure 5G adoption is to look at the proportion of samples taken over 5G relative to the total number of samples on all technologies. Speedtest Intelligence is uniquely positioned to measure global growth in 5G because of the worldwide adoption of Speedtest apps. China had the highest percentage of 5G Speedtest results compared to other mobile technology types in Q3 2020 at 18.9%. South Korea was second, Hong Kong third, Puerto Rico fourth and Qatar fifth.

Countries with the Most 5G
Speedtest Intelligence® | Q3 2020
Country 5G Samples as a % of Total
China 18.9%
South Korea 15.8%
Hong Kong (S.A.R.)* 7.9%
Puerto Rico 6.7%
Qatar 5.7%
United States 5.5%
Netherlands* 4.9%
United Arab Emirates 4.6%
Kuwait 4.6%
Australia 4.2%

What 5G will look like in 2021

With recently announced device chipset advancements expected in 2021, including 5G Carrier Aggregation, operators will be able to combine two 5G frequency bands in the sub-6GHz (FR1) range, allowing not only faster speeds, but also greater coverage. More importantly, the ability to combine Frequency Division Duplexing (FDD) and Time Division Duplexing (TDD) FR1 channels will enable operators to leverage low-band frequencies (sub-1GHz) for uplink transmissions (user device to cell site), while combining the low-band with the mid-band (2.5 GHz, 3.5 GHz) on the downlink. This should significantly expand the availability of fast 5G download speeds across larger geographies.

Similarly, DSS — which is a stepping stone to standalone 5G and allows for the simultaneous delivery of 4G and 5G technology on the same spectrum slice — will enable operators to combine already-deployed FDD spectrum with dedicated mid-band spectrum for an enhanced standalone 5G experience. This will unlock the full potential of 5G networks, such as ultra low latency and network slicing, while delivering an improved mobile experience to users.

Where 5G fails to reach

During Q3 2020 Speedtest Intelligence showed 55 countries in the world (with more than 200 samples) where more than 20% of samples were from 2G and 3G connections (combined). These are countries where, in many cases, 5G is still aspirational. As excited as we are about the expansion of 5G, we do not want to see these countries left behind.

Countries That Still Rely Heavily on 2G and 3G Connections
Speedtest Intelligence® | Q3 2020
Country 2G & 3G Samples 4G Samples
Turkmenistan 74.9% 25.1%
Rwanda 52.3% 47.7%
Iraq 49.4% 50.6%
Belarus 46.5% 53.5%
Afghanistan 46.0% 54.0%
Antigua and Barbuda 40.2% 59.8%
Tajikistan 40.2% 59.8%
Suriname 39.7% 60.3%
Haiti 37.7% 62.3%
Syria 37.5% 62.5%
Ghana 36.0% 64.0%
Ethiopia 35.0% 65.0%
Mozambique 34.7% 65.3%
Benin 34.3% 65.7%
Angola 34.1% 65.9%
El Salvador 32.5% 67.5%
Moldova 31.8% 68.2%
Venezuela 30.3% 69.7%
Tanzania 30.0% 70.0%
Papua New Guinea 29.5% 70.5%
Jamaica 29.4% 70.6%
Sudan 29.2% 70.8%
Algeria 29.0% 71.0%
Namibia 28.5% 71.5%
Zimbabwe 28.5% 71.5%
Somalia 28.4% 71.6%
Nicaragua 28.1% 71.9%
Armenia 28.1% 71.9%
Bosnia and Herzegovina 28.1% 71.9%
Uzbekistan 27.8% 72.2%
Cameroon 27.5% 72.5%
Zambia 27.4% 72.6%
Uganda 26.6% 73.4%
Trinidad and Tobago 26.6% 73.4%
Honduras 26.5% 73.5%
Bangladesh 26.3% 73.7%
Burkina Faso 26.0% 74.0%
Ukraine 25.8% 74.2%
Nigeria 25.7% 74.3%
DR Congo 24.6% 75.4%
Costa Rica 24.3% 75.7%
Botswana 24.1% 75.9%
Libya 22.9% 77.1%
Azerbaijan 22.9% 77.1%
Ecuador 22.8% 77.2%
Mali 22.4% 77.6%
Mongolia 21.8% 78.2%
Maldives 21.6% 78.4%
Mauritius 21.3% 78.7%
Tunisia 21.0% 79.0%
Belize 20.7% 79.3%
Laos 20.5% 79.5%
Kenya 20.3% 79.7%
Paraguay 20.1% 79.9%
Côte d’Ivoire 20.0% 80.0%

In markets where 4G layers haven’t been deployed or substantially covered, end users fall back to the circuit-switched network (2G, 3G). These decades-old network technologies should be sufficient for basic voice and texting, social media, and navigation apps, but cannot deliver rich media experiences or video calling. Unfortunately, many countries on this list are places where consumers rely primarily on mobile phones for their internet connectivity.

5G is radically changing the speeds and capabilities of mobile networks around the world. If the current growth rate continues, it won’t be long before most nations have access to 5G. But there are nations and subsets of subscribers who may not see the benefits of 5G for years to come. We will continue reporting on 5G achievements across the globe and watching speeds in general on the Speedtest Global Index™.

Ookla retains ownership of this article including all of the intellectual property rights, data, content graphs and analysis. This article may not be quoted, reproduced, distributed or published for any commercial purpose without prior consent. Members of the press and others using the findings in this article for non-commercial purposes are welcome to publicly share and link to report information with attribution to Ookla.

| May 22, 2019

Measuring the Success of Government Broadband Efforts in Saudi Arabia, Australia and Ireland

At Ookla, we well know that as internet speeds are getting faster, end users’ speed expectations are rising and the volume of data consumed by those users is growing exponentially. Ensuring that the rollout of digital services is fair and balanced to populations regardless of location poses a regulatory and commercial dilemma. So far, providing internet services, and in particular high-speed broadband, in rural areas has proven difficult in numerous countries.

Fixed broadband infrastructure is complex and expensive enough that governments in some countries have helped by creating regulatory environments which encourage (and in some cases subsidize) internet providers rolling out high-speed internet. Here at Ookla we are often lucky enough to be in the front seat viewing how different countries and regulators approach this tricky subject. We’ve evaluated the outcomes of government-involved fiber rollouts in Saudi Arabia and Australia using Speedtest data. Based on lessons learned in both, we make predictions about the likely successes and pain points in the coming effort in Ireland.

Incentivizing world-class speeds in Saudi Arabia

Since 2018 Ookla has been providing the Ministry of Communications and Information Technology (MCIT) in the Kingdom of Saudi Arabia with data to benchmark national internet speeds as part of a project to drive those speeds up. The Saudi Arabian Vision 2030 project is designed to transform the Kingdom of Saudi Arabia across all facets of commercial life and propel the economy forward. One of the key strategies is to ensure that the telecommunications and internet infrastructure is not just adequate but is one of the best in the world.

Unlike in other markets where governments engage in long and costly procurement processes to eventually choose a partner for infrastructural projects, the Saudi government has set about working directly with the incumbent operators to try and improve all underlying technologies. This includes setting ambitious speed and technology targets to be met by operators. Should the operators meet these targets, they can unlock financial incentives and grants.

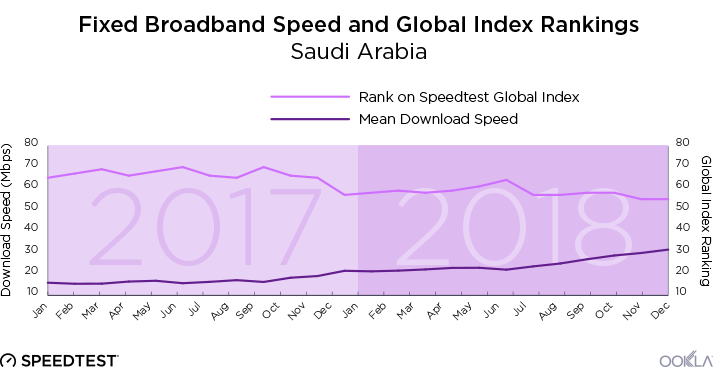
This strategy has connected 1,000,000 homes to fiber-to-the-home (FTTH) services and resulted in a gigantic improvement in both fixed internet and mobile internet speeds in Saudi Arabia. Using data from Speedtest IntelligenceTM, we’ve seen Saudi Arabia’s mean download speed over fixed broadband increase 97.2% between January 2017 and December 2018. The country’s ranking on the Speedtest Global Index® also improved significantly, showing that Saudi Arabia’s fixed broadband speed was rising at a faster rate than several other countries during that time period.

Saudi-mean-speed-line-graphs-1

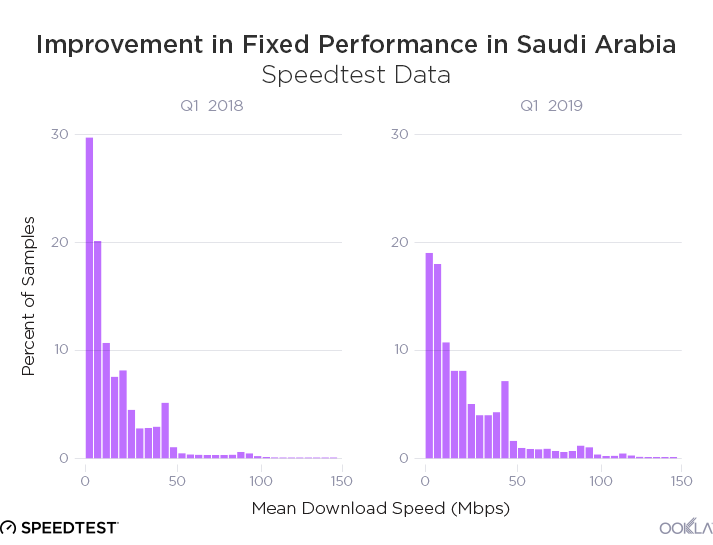
The histograms below show how widespread those improvements are. Whereas 29.0% of fixed broadband samples in Saudi Arabia during Q1 2018 showed mean download speeds of 5 Mbps or less, in Q1 2019 that number was down to 18.3%. We can also see that mean download speeds over 50 Mbps make up an increasing percentage of results. Each sample represents the cumulative test results for each unique device/user per location, per calendar day.

Ookla_Improvement_Mobile_Performance_Saudi_Arabia

What we see in the Kingdom of Saudi Arabia is what can be achieved when a regulator, government and operators all follow a direct course of action. In the context of global plans of this nature, the rate of improvement in Saudi Arabia is quicker than what we see in other markets.

Constructing a National Broadband Network in Australia

Australia took a much different approach than Saudi Arabia to try and solve a similar problem. In 2009, the NBN Co, an Australia Government Business Enterprise, set out to bridge the digital divide by supplying Australian residents fast and affordable broadband access regardless of their location. The intent was to construct an open-access broadband network under a wholesale approach where consumers purchase plans through any Internet Service Provider (ISP) utilizing the NBN network. A decade later, nearly 75% of Australian homes and businesses have access to this service and the expected completion date is currently slated for 2020.

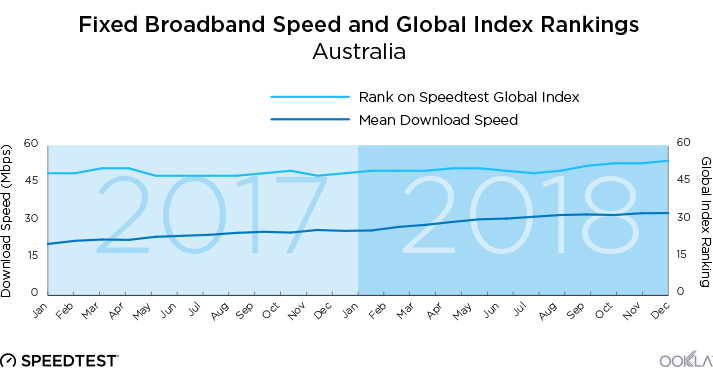
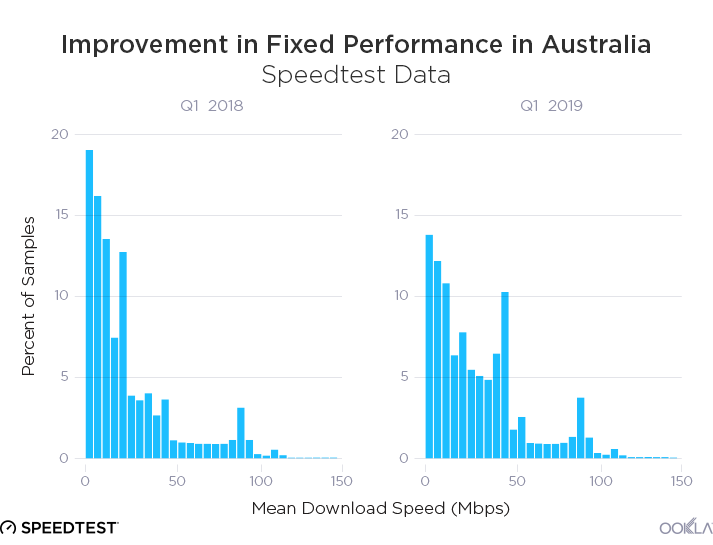
According to Speedtest Intelligence, the average broadband download speed in Australia has seen a steady rise over the past year and a 60.1% increase from January 2017 to December 2018. However, more aggressive competition and speed increases by other countries have left Australia with a declining rank on the Speedtest Global Index.

Aus-mean-speed-line-graphs-1

Looking at the distribution of speeds, Australians saw a decline in the percentage of samples achieving download speeds of 25 Mbps or slower between Q1 2018 and Q1 2019. Whereas 66.0% of fixed broadband samples had a mean download speed of 25 Mbps or slower in Q1 2018, that number fell 24.8% to 49.6% in Q1 2019. Correspondingly, there was an increase in results in the 25-50 Mbps range during the same period, rising 62.0% from 20.5% of samples to 33.2%. Looking at samples at the highest end of the scale in Australia, the percentage of samples achieving speeds of 50 Mbps or more increased 26.7% from 13.5% of samples to 17.1%.

Ookla_Improvement_Mobile_Performance_Australia

Many Australian consumers are unhappy with the quality and type of service they are receiving on the NBN network. One major struggle is due to the Multi-Technology Mix (MTM) approach used by NBN Co from the beginning. Over the past ten years, the network has adapted three separate approaches at different times in different locations: fiber-to-the-premises (FTTP), fiber-to-the-node (FTTN) and fiber-to-the-curb (FTTC), each having vastly different capabilities. As such, quality of service for consumers depends significantly on location. Maintenance costs will also be an issue in years to come because of the mix of technologies and the continued use of degrading copper wires.

Leading up to the Australian federal elections held on May 18th, the Labor party proposed a solution to these current NBN complications through an economic review of the project and plans to upgrade technologies. The party pressed the need for improvement to FTTN households and a financially responsible future for the NBN. Because of the contentious nature of the NBN, many speculated that Labor might win the election. Surprisingly, the Liberal party won out. It remains to be seen what this says for the NBN going forward. The Liberal party has emphasized a shift away from FTTP to a multi-technology approach to connect more homes more quickly and for less money, but FTTC and FTTN offer slower internet speeds than FTTP and could result in further expense to maintain copper wiring down the line.

As of March 2019, only three states and territories are likely to achieve the intended speed capabilities (50 Mbps) once the project completes in 2020: New South Wales, Victoria and the Northern Territory. Other regions in Australia do not expect to see more than 85% of premises reaching the 50 Mbps range which causes consumers continued doubt whether they will strike the lottery in terms of broadband speed.

Ireland’s newest effort to improve rural speeds

As large countries with a predominantly urban populace but rural communities that need internet access, Saudi Arabia and Australia have a lot in common with Ireland. In fact, Ireland has been through numerous iterations of national broadband schemes over the past 15 years. Despite Ireland’s small size it has a large broadband divide, with over 540,000 homes unable to access a reasonable fixed line broadband service. Many use mobile or wireless alternatives outside of urban areas. These alternatives often mean lower speeds at increased prices.

Ireland-mean-speed-line-graphs-1

Although an 80.1% increase in mean download speed over fixed broadband from January 2017 to December 2018 and an improving Irish rank on the Speedtest Global Index look healthy for a country of its size, the large number of homes that have no credible access makes the average an incomplete way to look at Ireland’s issues. In Q1 2018, 75.3% of samples in Ireland were receiving speeds of 50 Mbps or slower. In Q1 2019, that number had only decreased 5.8% to 70.9% of samples. The percentage of samples with mean download speeds between 50 and 100 Mbps increased 10.8% from 14.8% to 16.4%. Samples above 100 Mbps increased 28.3% from 9.9% in Q1 2018 to 12.7% in Q1 2019.

Ookla_Improvement_Mobile_Performance_Ireland

Recently the Irish state appointed a preferred bidder after a procurement process to subsidize a fiber network to 540,000 homes. This project is to be rolled out over the next 7 years. Oddly the process saw all but one of the prospective bidders pull out before its conclusion, which raised numerous questions as to the viability of the underlying plan. The current estimated cost to the Irish taxpayer is €2.1 billion. However, unlike in the Saudi Arabian and Australian markets, the resulting network will be owned and controlled not by the state or one of the current consumer telecoms firms but by the preferred bidder. Regardless, it is planned that the network will operate as an underlying wholesale network, similar to NBN in Australia.

The timing of the announcement of the preferred bidder, the probable costs and the ownership structure (weeks in advance of local and European elections) has led to speculation that there was a political motive to the announcement and that Ireland is still some time away from solving its internet black spots.

Speedtest Intelligence is a resource for many governments as they work to improve access and speeds for their citizens. Learn more about our global performance metrics.

Ookla retains ownership of this article including all of the intellectual property rights, data, content graphs and analysis. This article may not be quoted, reproduced, distributed or published for any commercial purpose without prior consent. Members of the press and others using the findings in this article for non-commercial purposes are welcome to publicly share and link to report information with attribution to Ookla.