Ookla® Market Reports™ identify key data about internet performance in countries across the world. This quarter we’ve provided updated analyses for 47 markets using Speedtest Intelligence® and summarized a few top takeaways below. Click through to the market report to see more details and charts about the countries you’re interested in, including the fastest fixed broadband providers and mobile operators, who had the most consistent service, and 5G and device performance in select countries during Q1 2023. Jump forward to a continent using these links:
Africa | Americas | Asia | Europe | Oceania
Africa
- Cameroon: Speedtest Intelligence reveals that MTN had the fastest median mobile download speed in Cameroon at 14.46 Mbps during Q1 2023. blue had the lowest median mobile multi-server latency at 184 ms.
- Ethiopia: Safaricom had the fastest median mobile download speed at 32.81 Mbps during Q1 2023. Ethio Telecom had the lowest median mobile multi-server latency at 55 ms.
- Tanzania: There were no winners over fastest fixed broadband and mobile in Tanzania during Q1 2023. Dar es Salaam had the fastest median mobile download speed among Tanzania’s most populous cities at 28.73 Mbps during Q1 2023.
Americas
- Argentina: Personal had the fastest median download speed over mobile (32.62 Mbps) and Movistar was fastest for fixed broadband (94.26 Mbps). Movistar had the lowest median multi-server latency over fixed broadband at 12 ms.
- Belize: NEXGEN had the fastest median download over fixed broadband in Belize at 47.35 Mbps. Digi had the fastest median mobile download speed at 18.39 Mbps.
- Canada: Bell was the fastest mobile operator in Canada with a median download speed of 111.11 Mbps at Q1 2023. Bell also had the fastest median 5G download speed at 183.29 Mbps. Bell pure fibre was fastest for fixed broadband (281.94 Mbps).
- Colombia: Movistar was fastest for fixed broadband with a median download speed of 151.74 Mbps. ETB had the lowest median multi-server latency over fixed broadband at 8 ms.
- Dominican Republic: Claro had the fastest median download speed among mobile operators at 32.01 Mbps. Viva had the lowest mobile multi-server latency at 43 ms. SpaceX’s Starlink was fastest for fixed broadband at 45.65 Mbps.
- Ecuador: The fastest mobile operator was CNT with a median download speed of 30.82 Mbps. Netlife was fastest for fixed broadband (71.82 Mbps). Fibramax had the lowest multi-server latency over fixed broadband at 9 ms.
- El Salvador: Claro had the fastest median download speed over mobile in El Salvador at 39.09 Mbps.
- Guatemala: Claro was the fastest mobile operator in Guatemala with a median download speed of 33.13 Mbps. Claro also had the highest Consistency with 84.5% of results showing at least a 5 Mbps minimum download speed and 1 Mbps minimum upload speed.
- Guyana: ENet was the fastest fixed broadband provider (60.27 Mbps), while Digicel was the fastest mobile operator (35.60 Mbps). ENet also had the lowest median multi-server latency over fixed broadband at 120 ms.
- Haiti: Digicel was the fastest mobile operator in Haiti with a median mobile download speed of 11.12 Mbps. SpaceX Starlink had the fastest fixed broadband internet at 46.76 Mbps. Natcom had the lowest median mobile multi-server latency at 62 ms.
- Jamaica: Flow was the fastest fixed broadband provider in Jamaica with a median download speed of 50.50 Mbps. Flow also had the lowest median multi-server latency at 36 ms.
- Mexico: Telcel had the fastest median download speed over mobile at 45.54 Mbps. Totalplay was fastest for fixed broadband (78.94 Mbps) and had the lowest median multi-server latency at 26 ms.
- Peru: Claro was the fastest mobile operator with a median download speed of 22.39 Mbps. Apple devices had the fastest median download speed among top device manufacturers at 29.68 Mbps.
- Suriname: Telesur had the fastest median download speed over mobile at 51.18 Mbps. There was no winner over fixed broadband, but Digicel+ had the lowest median multi-server latency at 57 ms.
- Trinidad and Tobago: Digicel had the fastest median download speed over mobile at 37.56 Mbps. Digicel+ had the fastest median fixed broadband download speed at 94.27 Mbps and the lowest median multi-server latency at 7 ms.
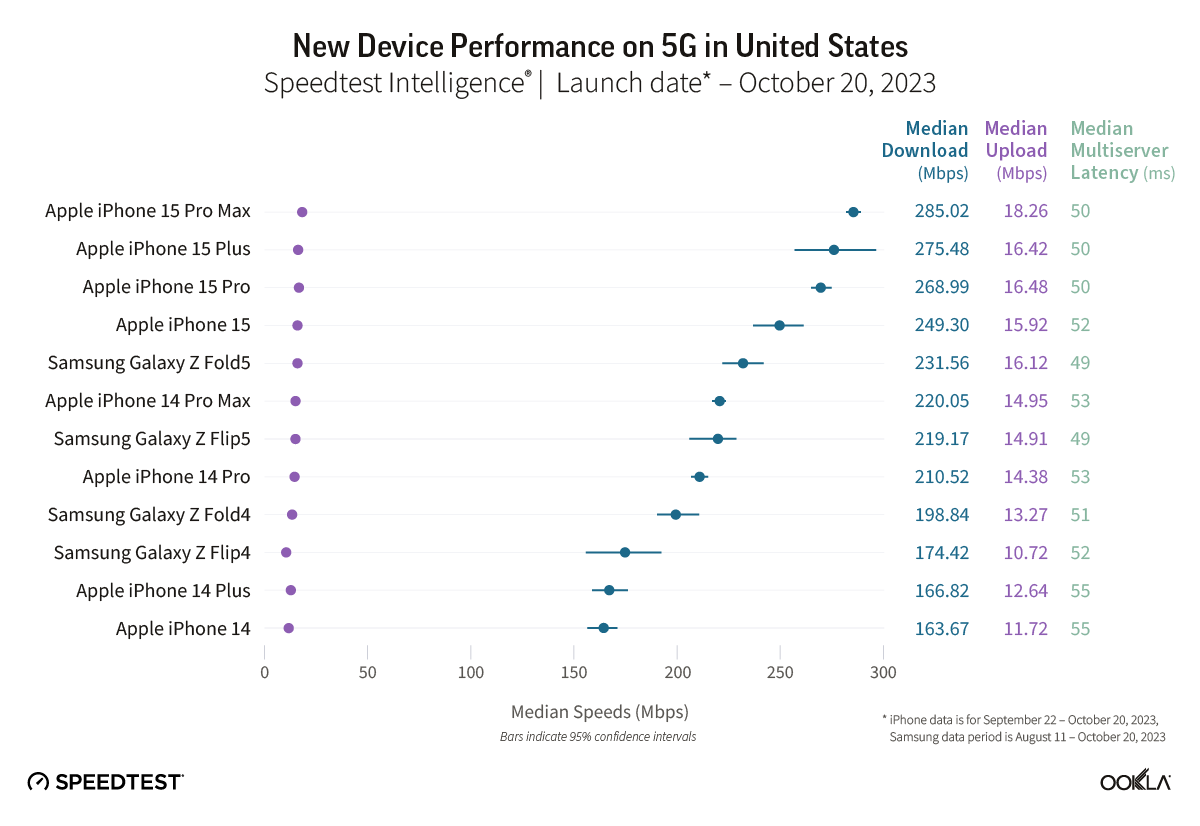
- United States: T-Mobile was the fastest mobile operator with a median download speed of 165.22 Mbps. T-Mobile also had the fastest median 5G download speed at 220.70 Mbps. Spectrum edged out XFINITY as the fastest fixed broadband provider with a median download speed of 234.80 Mbps. Verizon had the lowest median multi-server latency on fixed broadband at 15 ms.
Asia
- Afghanistan: The fastest mobile operator in Afghanistan was Afghan Wireless (5.92 Mbps), which also had the lowest median multi-server latency at 84 ms.
- Bangladesh: Banglalink was the fastest mobile operator in Bangladesh with a median download speed of 21.94 Mbps. DOT Internet was fastest over fixed broadband at 89.50 Mbps and had the lowest median multi-server latency at 5 ms.
- Bhutan: There was no fastest mobile operator in Bhutan during Q1 2023, but BT had the lowest median multi-server latency at 66 ms.
- Brunei: There was no statistical winner on mobile during Q1 2023, but Apple devices had the fastest median download speed at 113.48 Mbps.
- Cambodia: SINET had the fastest median download speed over fixed broadband (42.00 Mbps). Cellcard was fastest over mobile at 32.05 Mbps.
- China: China Mobile was the fastest mobile operator with a median download speed of 138.95 Mbps. China Mobile also had the fastest median mobile 5G download speed at 291.24 Mbps. China Unicom was fastest for fixed broadband at 221.07 Mbps.
- Georgia: MagtiCom had the fastest median fixed broadband speed in Georgia at 27.65 Mbps during Q1 2023. MagtiCom also had the lowest median multi-server latency at 11 ms. Geocell was fastest over mobile at 40.81 Mbps.
- Indonesia: Telkomsel was the fastest Indonesian mobile operator with a median download speed of 24.48 Mbps. Telkomsel also had the lowest median mobile multi-server latency at 45 ms.
- Japan: NTT DoCoMo was the fastest mobile operator with a median download speed of 48.86 Mbps during Q1 2023. So-net had the fastest fixed broadband speed at 282.13 Mbps, as well as the lowest median multi-server latency at 9 ms.
- Malaysia: TIME was the fastest fixed broadband provider in Malaysia (107.56 Mbps) and had the lowest multi-server latency at 9 ms.
- Pakistan: Transworld had the fastest median fixed broadband download speed in Pakistan at 16.23 Mbps. Jazz was fastest over mobile at 21.93 Mbps. Zong had the lowest median mobile multi-server latency at 46 ms.
- Philippines: Smart delivered the fastest mobile download speed in the Philippines (33.39 Mbps).
- Singapore: Singtel had the fastest median download speed over mobile at 119.66 Mbps. StarHub had the lowest median mobile multi-server latency at 26 ms. SingTel had the fastest fixed broadband speed (263.13 Mbps).
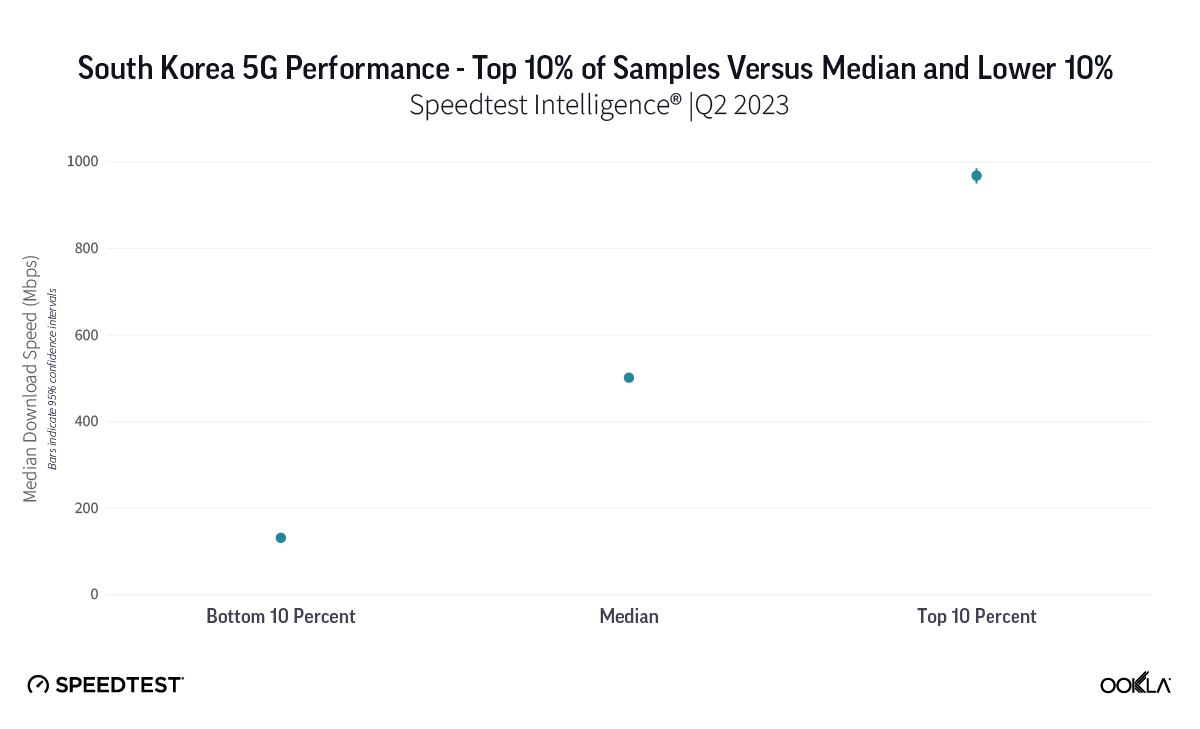
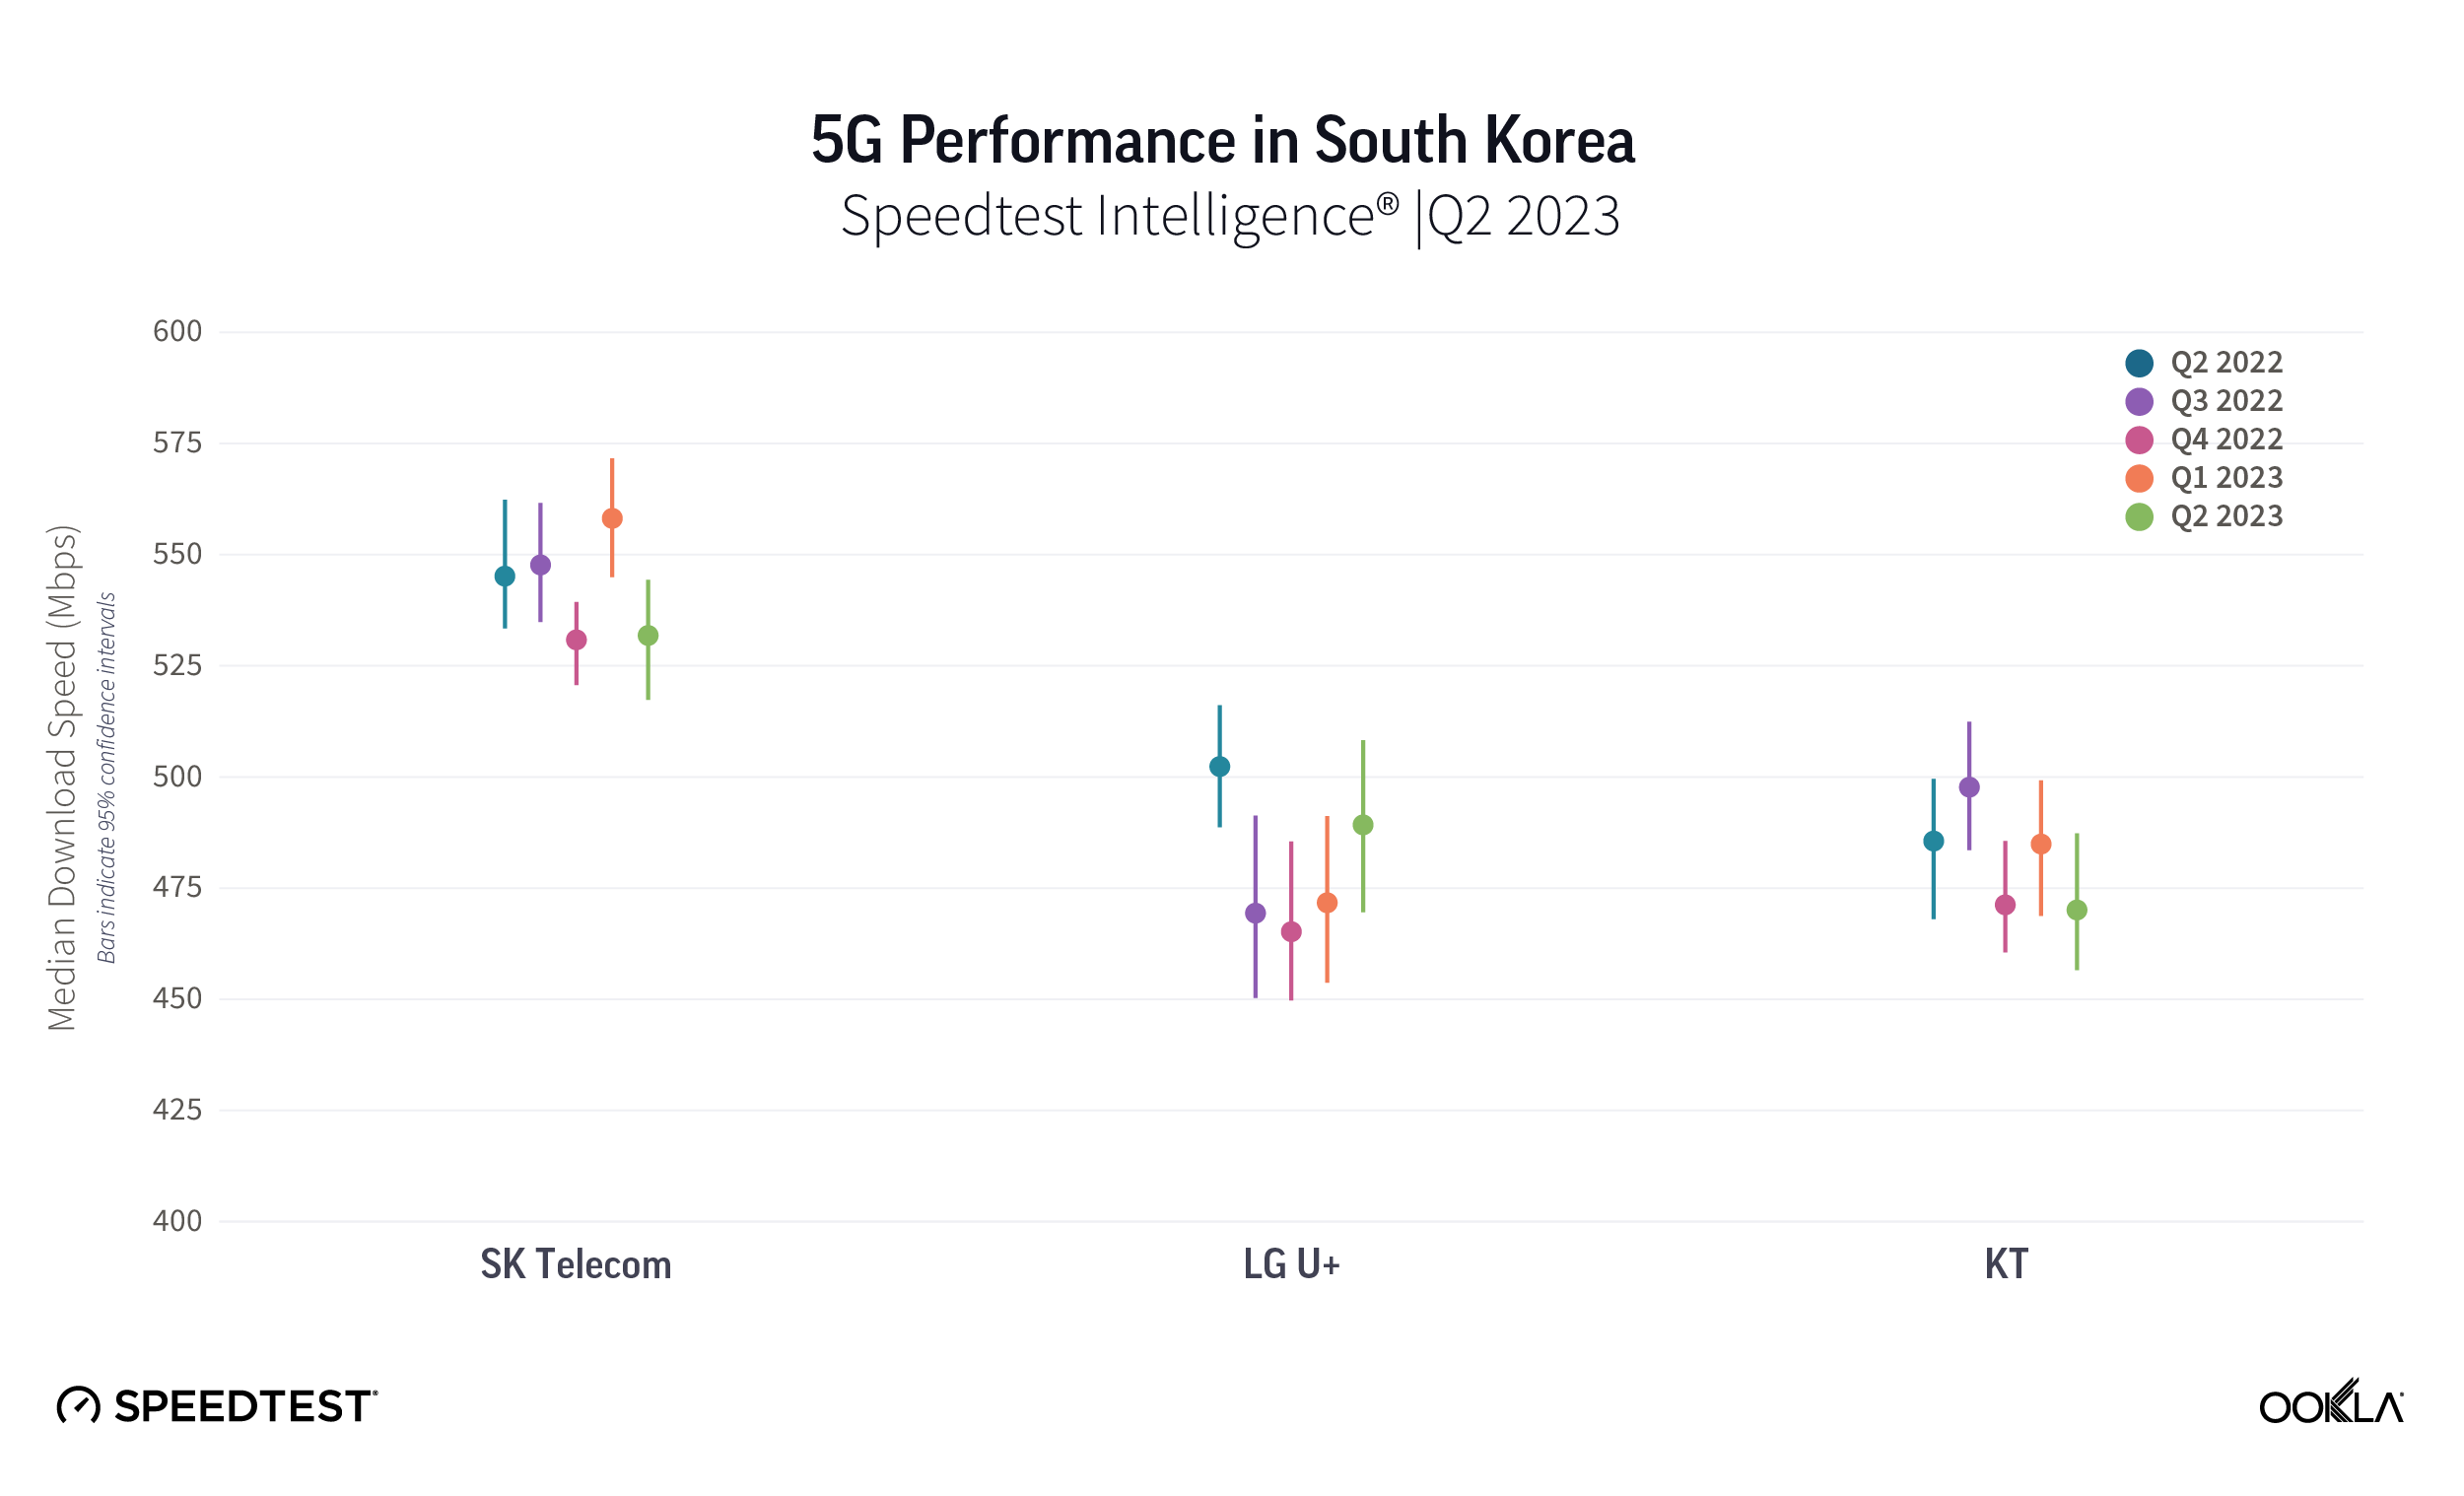
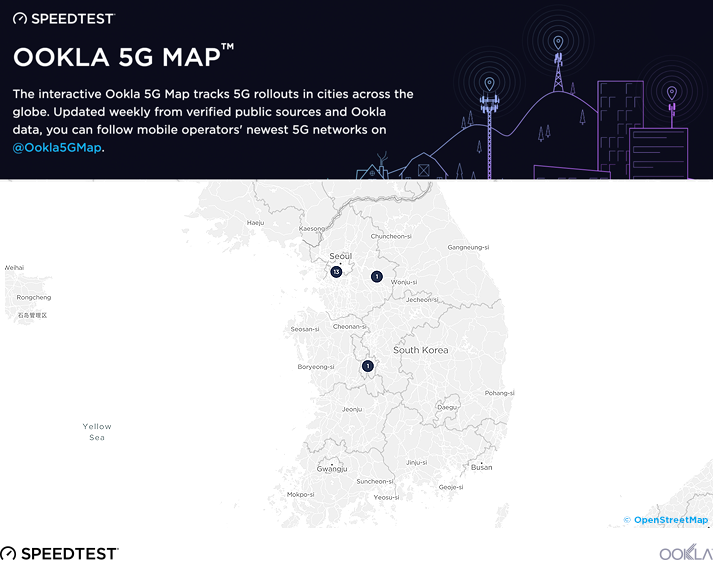
- South Korea: KT delivered the fastest median download speed over fixed broadband in South Korea at 145.28 Mbps. SK Telecom had the fastest mobile speed at 194.41 Mbps.
- Sri Lanka: SLT-Mobitel delivered the fastest mobile and fixed broadband speeds in Sri Lanka at 20.62 Mbps and 44.76 Mbps, respectively. Dialog had the lowest median mobile multi-server latency at 36 ms.
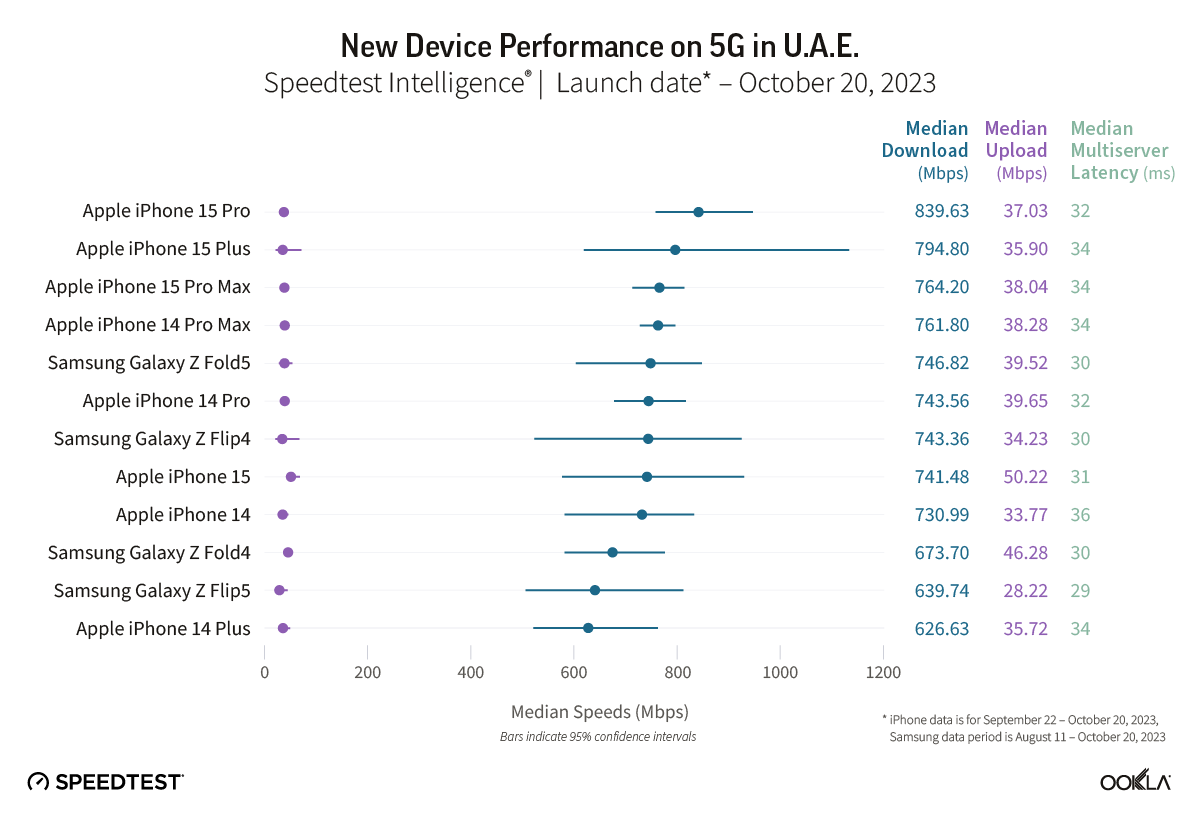
- United Arab Emirates: Etisalat had the fastest median fixed download speed (255.01 Mbps) and median mobile download speed (184.58 Mbps) in the UAE during Q1 2023. Etisalat also had the fastest median 5G download speed at 672.04 Mbps and lowest median multi-server latency at 35 ms.
Europe
- Albania: ONE overtook Vodafone as the fastest mobile operator in Albania with a median download speed of 48.44 Mbps during Q1 2023. ONE also had the lowest median mobile multi-server latency at 34 ms. Digicom was fastest for fixed broadband (87.71 Mbps).
- Belgium: Telenet had the fastest median download speed over fixed broadband at 135.65 Mbps, while Telenet/BASE had the fastest median download speed over mobile at 69.48 Mbps.
- Denmark: YouSee was the fastest mobile operator in Denmark with a median download speed of 137.28 Mbps. Hiper was fastest for fixed broadband at 258.41 Mbps.
- Estonia: The fastest mobile operator in Estonia was Telia with a median download speed of 91.34 Mbps. Telia had the lowest median multi-server latency on mobile at 30 ms. Elisa was fastest over fixed broadband at 92.20 Mbps.
- Finland: DNA had the fastest median download speed over mobile at 101.59 Mbps. Lounea was fastest for fixed broadband at 107.84 Mbps and had the lowest median multi-server latency at 11 ms.
- Germany: Telekom was the fastest mobile operator in Germany with a median download speed of 96.61 Mbps. Deutsche Glasfaser overtook Vodafone as the fastest fixed broadband provider at 183.20 Mbps. Deutsche Glasfaser also had the lowest median multi-server latency at 14 ms.
- Latvia: While there was no fastest mobile operator in Latvia during Q1 2023, Balticom was fastest for fixed broadband with a median download speed of 238.41 Mbps. Balticom also had the lowest median fixed broadband multi-server latency at 4 ms.
- Lithuania: The mobile operator with the fastest median download speed was Telia at 109.53 Mbps. Cgates was fastest for fixed broadband at 151.33 Mbps.
- Poland: UPC was the fastest provider for fixed broadband with a median download speed of 214.34 Mbps. There was no statistical winner over mobile during Q1 2023.
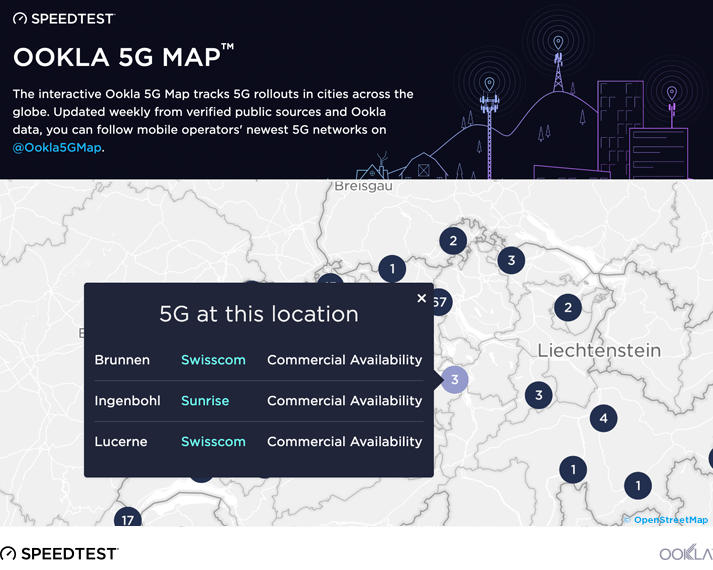
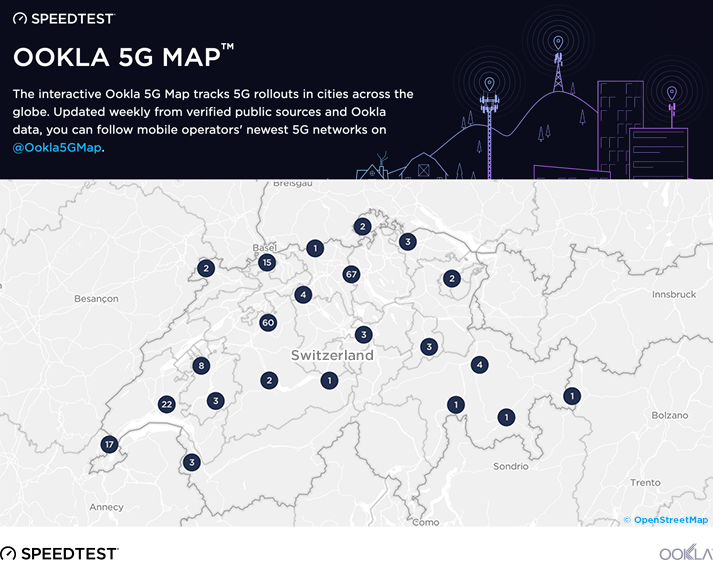
- Switzerland: Salt blazed ahead for the fastest fixed broadband with a median download speed of 367.36 Mbps. Salt also had the lowest median multi-server latency over fixed broadband at 8 ms.
- Turkey: Turkcell was the fastest mobile operator in Turkey with a median download speed of 51.76 Mbps. Türk Telekom had the lowest median mobile multi-server latency at 38 ms. TurkNet was fastest for fixed broadband at 58.85 Mbps.
Oceania
- New Zealand: MyRepublic had the fastest median download speed over fixed broadband in New Zealand at 287.90 Mbps. There were no statistical winners among top mobile operators.
The Speedtest Global Index is your resource to understand how internet connectivity compares around the world and how it’s changing. Check back next month for updated data on country and city rankings, and look for updated Ookla Market Reports with Q2 2023 data in July.
Editor’s note: This article was updated on April 18 to exclude data from Vietnam while we continue to investigate anomalies in the market.
Ookla retains ownership of this article including all of the intellectual property rights, data, content graphs and analysis. This article may not be quoted, reproduced, distributed or published for any commercial purpose without prior consent. Members of the press and others using the findings in this article for non-commercial purposes are welcome to publicly share and link to report information with attribution to Ookla.