| May 2, 2018

The American Globetrotter's Guide to Roaming Speeds

Mobile roaming has come a long way from the days when I spent most of my tour of China touring hotel lobbies desperately hoping to connect my U.S. flip phone to the Wi-Fi. Not only can you actually get a signal in most countries these days, some carriers offer special packages for the jet set so you don’t have to pay extra for roaming calls and data.

But how are the speeds?

Using Q1 2018 Speedtest® data, we’re here to report on mobile roaming speeds for U.S. consumers in 15 popular destinations, including which carriers are fastest where. For overall speeds we look at data from all devices and when we analyze carriers we look only at data for modern (LTE-capable) devices.

Where roaming speeds will (and will not) let you down

Get thee to Canada! Our analysis of roaming Speedtest results found that U.S. customers in Canada saw a mean download speed of 42.03 Mbps during Q1 2018. That’s not quite as fast as the 45.28 Mbps Canadians receive on their home mobile networks, but it beats the 27.08 Mbps average in the U.S.

Roaming Speeds for U.S. Customers Abroad
Q1 2018
Country Download (Mbps) Upload (Mbps)
Canada 42.03 13.50
South Korea 21.81 8.60
Mexico 18.02 10.18
Spain 13.23 7.09
Italy 12.70 6.38
France 12.48 5.45
Australia 11.84 6.96
Japan 10.91 4.79
United Kingdom 10.40 5.68
Germany 9.02 4.03
Costa Rica 7.72 4.11
China 7.05 3.91
Dominican Republic 5.75 3.58
India 2.96 1.96
The Bahamas 1.70 2.99

Second place South Korea showed roaming speeds for U.S. travelers about half as fast as those in Canada. Mexico was third fastest. The middle tier of the roaming speed ranking is taken up mostly by western European countries (with Japan and Australia to break up the pack).

At the bottom of the spectrum, Bahamian roaming speeds are painfully slow. They aren’t much better in India or the Dominican Republic.

A lot of factors go into the roaming speeds you’ll experience abroad, including how carriers prioritize out of country traffic, something that’s decided between each individual carrier in each individual country.

How does your carrier stack up?

Your roaming experience on your next trip is going to depend a lot on which carrier you have, so we broke our roaming speed analysis of Speedtest results on modern devices down to the carrier level.

US Carrier Speeds While Roaming Abroad
Q1 2018 | Mean Download (Mbps)
Country AT&T Sprint T-Mobile Verizon Wireless
Australia 21.24 N/A 2.14 22.14
Canada 26.53 27.65 53.56 43.22
China 17.23 4.77 1.15 13.15
Costa Rica 13.67 N/A 0.70 14.86
Dominican Republic 11.00 N/A 0.57 7.68
France 22.72 N/A 1.96 26.30
Germany 20.55 N/A 1.86 20.58
India 4.92 1.70 0.79 7.13
Italy 24.05 N/A 1.99 25.19
Japan 18.22 24.79 1.40 11.46
Mexico 19.95 9.66 17.22 22.35
South Korea 27.97 17.49 21.67 N/A
Spain 29.27 N/A 1.18 24.82
The Bahamas 1.79 N/A 0.25 3.53
United Kingdom 19.87 9.07 1.74 16.61

From the above, it looks like there’s no one right answer for the fastest roaming carrier. And there are other things to consider when roaming, too, like does your carrier offer a special plan that includes free roaming or are you paying through the nose.

It’s important to remember that roaming comes at a cost to carriers, which means that if your carrier includes free or low-cost roaming on almost all types of plans, the trade-off might be that you get slower speeds than you would with another carrier.

So if speed is your primary criterion, there are two standouts on this list. Verizon wins eight of the 15 countries we analyzed and AT&T wins six. T-Mobile and Sprint each win one country. We excluded Sprint from the running in eight countries because of a low number of test results.

Are you roaming (for business or pleasure) this summer? Take a Speedtest on Android or iOS to show us how fast (or slow) your connection is.

Ookla retains ownership of this article including all of the intellectual property rights, data, content graphs and analysis. This article may not be quoted, reproduced, distributed or published for any commercial purpose without prior consent. Members of the press and others using the findings in this article for non-commercial purposes are welcome to publicly share and link to report information with attribution to Ookla.

| December 10, 2018

The World’s Internet in 2018: Faster, Modernizing and Always On

When it comes to the internet, the news is mostly good for 2018. Download and upload speeds are increasing across the globe on both mobile and fixed broadband. 5G is on the horizon and gigabit service is expanding.

We looked at data from Speedtest IntelligenceTM, Ookla’s flagship data platform, from December 2017 through November 2018, to analyze everything from global internet speeds to the world’s fastest countries to when people are online. We also investigated which parts of the world are seeing the most benefit from high speed LTE on mobile and gigabit speeds on fixed broadband.

Mobile speeds increased more than 15% in 2018

Graphic-Tables-Final-v2_mobile-average-speed-3

The world’s average mobile download speed of 22.82 Mbps increased 15.2% over the past year, while mobile upload speed increased 11.6% to reach 9.19 Mbps.

Graphic-Tables-Final-v2_android-vs-ios-1

With a mean download speed of 27.84 Mbps and a mean upload of 10.61 Mbps, worldwide speeds on iOS devices were faster than those on Android (21.35 Mbps download, 8.73 Mbps upload) in 2018. This is likely due to market factors as Android devices are more popular in emerging markets where internet speeds tend to be slower.

However, download speed on Android devices increased 19.0% and upload speed increased 15.1%, more than those on iOS (18.0% increase for download and 11.1% increase for upload), which is good news for those emerging markets.

Fixed broadband speeds increased more than 26% in 2018

Graphic-Tables-Final-v2_fixed-average

On a global level, fixed broadband speeds were nearly twice as fast as those on mobile in 2018. The world’s average download speed on fixed broadband was 46.12 Mbps, 26.4% faster than last year. Upload speed increased 26.5% to 22.44 Mbps.

All said, though, both mobile and fixed broadband speeds increased at a slower rate in 2018 than they did in 2017.

Countries with the fastest internet in 2018

Graphic-Tables-Final-v2_top-5-mobile

The countries with the fastest mean download speeds over mobile in the past 12 months were: Norway (63.19 Mbps), Iceland (58.68 Mbps), Qatar (55.17 Mbps), Singapore (54.71 Mbps) and the Netherlands (53.42 Mbps).

Graphic-Tables-Final-v2_top-5-fixed

Singapore showed the world’s fastest mean download speeds over fixed broadband during the past twelve months at 175.13 Mbps. Next fastest were Iceland (153.03 Mbps), Hong Kong (138.31 Mbps), South Korea (114.67 Mbps) and Romania (109.90 Mbps).

To keep up with month-to-month internet speeds at a global level, visit the Speedtest Global Index.

Most improved countries for 2018 internet speeds

Graphic-Tables-Final-v2_most-improved-mobile

Costa Rica saw the largest increase in mobile download speed over the past year at 194.6%. Myanmar was second with 121.8%, Saudi Arabia third (113.2%), Iraq fourth (92.3%) and the Ukraine fifth (82.1%).

The countries with the largest improvements in upload speeds were Bangladesh (179.2%), the Ukraine (172.5%), Costa Rica (163.4%), Myanmar (146.9%) and Iraq (126.7%).

Graphic-Tables-Final-v2_most-improved-fixed

Paraguay saw the biggest increase in mean download speed over fixed broadband in the world over the past year at 268.6%. Guyana was second with 113.5%, Libya third (108.0%), Malaysia fourth (89.5%) and Laos fifth (76.2%).

Libya showed the most improvement in mean upload speed over fixed broadband during the past twelve months at 176.4%. Guyana was second with 116.1%, Malaysia third (95.2%), Belize fourth (88.9%) and Iraq fifth (76.8%).

4G is increasing mobile speeds

2017-2018-LTE-growth

When we looked specifically at Speedtest results on 4G, we saw that mean download speeds increased in most countries. Costa Rica was most improved for 4G download speed as was the case with overall download speed on mobile increasing 184.3% year over year. Saudi Arabia was second at 110.2% and Myanmar third at 78.0%.

Most encouragingly, we saw the number of Speedtest results over 4G increase in all but 15 countries. This could indicate that 4G availability is expanding. Tanzania saw the greatest increase with 355.0% more tests over 4G in 2018 than in 2017. Malta was second at 267.2% and Algeria third at 143.7%. We can see this expansion on the map above as 4G results fill in areas of the globe that were previously blank.

Gigabit coverage is expanding globally

gigabit-fade-1

Gigabit is in the news as ISPs across the globe expand their high-speed networks. We looked at Speedtest results on fixed broadband in excess of 750 Mbps to see which cities are benefitting most. Comparing locations with 100 or more gigabit-speed results in 2017 with those in 2018, that expansion becomes obvious. In 2017, 60 countries met our gigabit test threshold. In 2018, 16 additional countries joined our gigabit list. We’re also seeing that more cities around the world now have access to gigabit speeds.

Also exciting is that cities which already had gigabit in 2017 saw increases in the number of gigabit-speed results in 2018 as ISPs continue to build out infrastructure across cities. Many cities saw their first real gigabit expansion in 2018. For example, we saw the number of gigabit tests in New Delhi increase from 119 gigabit speed results in 2017 to 20,239 in 2018, that’s a mind-boggling 16,908% increase. Chennai, India saw a 7,481% increase (from 763 to 57,840) and Cormeilles-en-Parisis, France jumped 6,480%. Huge leaps in the number of gigabit-speed results were also seen in Gdańsk, Poland (6,338%); Rome, Italy (4,909%); Lancashire, United Kingdom (3,962%); Ota, Japan (3,240%); São Paulo, Brazil (2,947%); Hangzhou, China (2,669%) and Turda, Romania (2,636%).

When people are online

point-3-sec-final-1

The internet is always on, but we were surprised to see how consistently and steeply usage fell off on both mobile and fixed broadband after 9 pm local time. Normalizing the time of day for Speedtest results from around the globe, we found that usage bottoms out at 4 am and then climbs steeply again until 10 am. From there, the internet gets gradually busier until that night time drop off.

Internet in the world’s largest countries

The world’s five most populous countries are notably absent from the lists of fastest and most improved countries on mobile and fixed broadband. China, India, the U.S., Indonesia and Brazil represent about 46% of the world’s population, which makes their internet speeds worth noting nonetheless.

Internet Speeds in the World’s Largest Countries
Speedtest Data | December 2017-November 2018
Country Mean Mobile Download Speed (Mbps) % Improvement in Mobile Speed Mean Fixed Download Speed (Mbps) % Improvement in Fixed Speed
China 30.96 -5.8% 76.03 42.5%
India 9.11 15.2% 23.00 50.4%
United States 28.50 22.3% 92.77 37.3%
Indonesia 10.39 5.3% 14.89 18.3%
Brazil 18.65 29.3% 22.95 39.4%

Mobile internet speeds in the world’s largest countries

China had the fastest average mobile download speed among the world’s most populous countries in the past twelve months. However, China’s mobile download speed decreased during that time. The United States is fast catching up with China on mobile download speed.

Brazil occupied a middle ground for mobile download speed among the world’s most populous countries and showed the fastest rate of increase. India and Indonesia were at the bottom of this list. While the two nations show similar mobile download speeds to each other, India’s mobile download speed is improving much more quickly than Indonesia’s.

Fixed broadband speeds in the largest countries in the world

The United States showed the fastest fixed broadband download speed among the world’s most populous countries over the past year. China was second, India and Brazil nearly tie for third and Indonesia follows.

India showed the largest improvement in mean download speed over fixed broadband of the world’s five largest countries. China was second, Brazil third, the U.S. fourth and Indonesia fifth.

We’ll be back throughout 2019 to report on the state of the world’s internet as it evolves. Until then, take a Speedtest to find out how your network compares.

Ookla retains ownership of this article including all of the intellectual property rights, data, content graphs and analysis. This article may not be quoted, reproduced, distributed or published for any commercial purpose without prior consent. Members of the press and others using the findings in this article for non-commercial purposes are welcome to publicly share and link to report information with attribution to Ookla.

| September 4, 2019

In-Depth Analysis of Changes in World Internet Performance Using the Speedtest Global Index

A lot has changed in the two years since 2017 when we first began ranking mobile and fixed broadband speeds of countries around the world with the Speedtest Global IndexTM. 5G is being deployed around the world and fiber continues to make gigabit speeds a reality in more and more countries. We’ve been tracking it all and are here to report on how much speeds have increased, which countries are leading internet performance and which are falling behind, and what trends we see across continents.

World mobile speed increased 21.4% with fixed broadband up 37.4%

World-Download-Speeds-2019-OG2

Looking just at the last year, the world’s mean download speed over mobile increased 21.4% from 22.81 Mbps in July 2018 to 27.69 Mbps in July 2019. Mean upload speed over mobile increased 18.1% from 9.13 Mbps to 10.78 Mbps. The world average for download speed over fixed broadband increased 37.4% from 46.48 Mbps in July 2018 to 63.85 Mbps in July 2019. Mean upload speed over fixed broadband increased 48.9% from 22.52 Mbps to 33.53 Mbps.

Shake-ups in the country rankings for internet performance

Fastest-Countries-Mobile-2018-2019

Mobile speeds in the fastest countries have skyrocketed in the past year which has dramatically shifted the rankings. South Korea, which was not even in the top ten a year ago, saw a 165.9% increase in mean download speed over mobile during the past 12 months, in large part due to 5G. Switzerland’s mean download speed increased 23.5%. Canada’s was up 22.2%, Australia 21.2%, the Netherlands 17.3%, UAE 11.1%, Malta 10.3% and Norway 5.8%. Qatar remained in the top ten, although the country’s mean download speed over mobile actually dropped 1.4% from July 2018 to July 2019.

Individual mobile operators can make a huge difference in a country’s speeds. In 2017 we were excited to see Telenor uncap their mobile speeds, which drove Norway to the top of the Speedtest Global Index. A big part of South Korea’s mobile success in the past year is the way KT, LG U+ and SK Telecom banded together to release 5G at the same time. Switzerland has also benefited from 5G and Sunrise leads the country with 262 5G deployments across the country while Swisscomm has 52.

Fastest-Countries-Fixed-2018-2019

Fixed broadband rankings on the Speedtest Global Index have not changed as dramatically during the past 12 months as those on mobile. Singapore remains the fastest country with an increase in mean download speed over fixed broadband of 5.6%. Taiwan had the largest jump in speeds among the top 10 with a 166.5% improvement in fixed download speed between July 2018 and July 2019. Mean download speed over fixed broadband increased 52.4% in South Korea, 26.4% in Macau, 21.7% in Romania, 21.0% in Switzerland, 19.3% in the United States and 3.5% in Hong Kong.

Monaco and Andorra did not have enough tests to qualify for the Speedtest Global Index one year ago, but massive fixed broadband improvements in both countries inspired us to lower our test count threshold for inclusion and also share these smaller countries’ success stories.

Technologies paving the way: 5G and gigabit

The presence of 5G is not enough to change a market

As discussed above, 5G has the potential to rocket a country to the top of the mobile rankings on the Speedtest Global Index. In practice, we’ve seen 5G speeds that were over 1000% faster than those on LTE.

Mobile-Download-Speeds-by-Country

In reality, though, unless 5G is commercially available widely across a country and from all mobile operators (as was the case in South Korea), the change in speeds at the country level is not that significant. Though commercial 5G was launched widely across Switzerland by Sunrise and Swisscom in April 2019, the country’s mean download speed only increased 2.8% in the three months since. The average mobile download speed in the U.S. has actually declined slightly since 5G was initially deployed. This is because 5G is still only available in a very limited number of markets to consumers with 5G-capable devices.

Visit the Ookla 5G Map for the latest on 5G deployments across the globe.

Gigabit is a game-changer, if you can get it

Unlike 5G, fiber connections have been rolling out since 2007, opening up the possibility of gigabit-speed fixed broadband. That said, it’s costly and time-intensive to lay miles and miles of fiber so progress has varied widely across the globe.

Gigabit-Test---Performance_Singapore-1

Geographically small countries like Singapore have the advantage when it comes to fiber, because It’s easier and cheaper to lay fiber optic cable across the country’s small footprint. Singaporean internet service providers (ISPs) have used this advantage to go beyond mere gigabit and offer connections as fast as 10 Gbps. This is reflected both in Singapore’s dominance of the fixed rankings on the Speedtest Global Index and in the fact that 2.87% of their total Speedtest results over fixed broadband are gigabit-speed (800 Mbps or higher).

Gigabit-Test---Performance_Brazil-1

Brazil offers a good contrast for how difficult it can be for gigabit to reach the masses. While the first Brazilian ISP to offer fiber-to-the-premises (FTTP) initially did so in 2007, easy access to gigabit speeds was slow to follow. However, that may be starting to change. Between June and July 2019 we saw a large uptick in gigabit-speed results in Brazil, where the proportion of gigabit speed tests increased from 0.02% of total fixed broadband tests to 0.17%. This corresponded with a large increase in mean download speed at the country level.

Comparing world mobile and fixed broadband at a glance

We were curious to see just how different internet performance experiences were around the world, so we plotted average mobile download speed against average download speed on fixed broadband. All of the graphs below use a percentage difference from the global average, a number that changed between 2018 and 2019.

fade-Performance-vs-Global---Quadrant-All

Speed Leaders

There was not much change in the list of countries that showed above-average download speeds on both mobile and fixed broadband between July 2018 and July 2019, the “Speed Leaders.” What did change was that fixed broadband speeds increased significantly enough among the group to bring the whole pack closer to Singapore and Hong Kong. On the mobile axis, South Korea’s major increase in download speed made that country more of an outlier, pushing the boundaries of what great performance can look like.

Fixed-Focused countries

Between July 2018 and July 2019 we saw the number of countries considered to be “Fixed-Focused” (having faster download speeds over fixed broadband than the world average while their average mobile download speeds were slower than average) increase. Ireland was the only country that solidly fit this category in 2018. Thailand and Chile started near the midline for fixed speeds and below-average for mobile speeds in 2018. 2019 found both countries squarely in the Fixed-Focused category. Israel also edged into this category as their mobile download speed fell between July 2018 and 2019.

Mobile-Focused countries

The “Mobile-Focused” category saw the most movement between July 2018 and July 2019 as some countries (the UAE and Qatar) increased their fixed speeds sufficiently to join the Speed Leaders. Meanwhile, Bosnia and Herzegovina’s mobile download speed increased year-over-year to move them into the Mobile-Focused quadrant. Georgia’s mobile download speed decreased enough to move them from Mobile-Focused to Speed Laggers.

It will be interesting to see how many of these Mobile-Focused countries double down on their mobile investments and explore 5G alternatives to fixed broadband.

Speed Laggers

No country wants to be in the position of having slower than average mobile and fixed broadband speeds. We saw 57 countries in this “Speed Laggers” quadrant in July 2018 and 78 in July 2019. This increase is mostly due to our expansion of the number of countries we consider for the Speedtest Global Index based on test count. There were enough countries in this category that we’ve considered them separately by continent below.

Regional views of mobile and fixed broadband performance

Mobile-and-Fixed-Broadband-Improvement-by-Continent-02

We aggregated Speedtest results by continent to analyze mobile and fixed broadband performance by continent.

Mobile-and-Fixed-Performance-by-Continent-01

Asia had the highest percentage increase in mobile download speed followed by North America, Oceania, South America, Africa and Europe. Oceania had the fastest mean download speed in July 2019. North America placed second, Europe third, Asia fourth, South America fifth and Africa sixth.

On the fixed broadband side, South America saw the highest percentage increase in download speed. Asia came in second, Europe third, Africa fourth, North America fifth and Oceania sixth. North America had the fastest mean download speed in July 2019. Europe was second, Asia third, and Oceania fourth. As we saw with mobile, South America and Africa again ranked fifth and sixth, respectively.

A zoomed-in view of the speed quadrants separated by continent offers a more detailed view of each country’s role in these rankings.

Africa mostly lags in internet speeds

2019-Performance-vs-Global---Africa

In July 2019, all but two African countries in the Speedtest Global Index fell into the Speed Laggers category, having mobile and fixed broadband speeds that were below global averages. The exceptions were South Africa and Guinea, which both had fast enough mobile speeds to place them in the mobile-focused quadrant.

Asian markets show a wide breadth of internet performance

2019-Performance-vs-Global---Asia

Asia was the most diverse continent we examined in terms of internet performance. We saw a plurality of countries in each of the four quadrants in July 2019. Most of the Speed Leaders were in East Asia: China, Hong Kong (SAR), Japan, Macau (SAR), South Korea, and Taiwan. If we include Singapore, another Speed Leader, these are among the wealthiest nations in Asia (using GDP per capita). Two of Asia’s Fixed-Focused countries are in Southeast Asia (Malaysia and Thailand) and one is in the Middle East (Israel).

The Speed Laggers category contained countries from South Asia (including Afghanistan, India and Pakistan), Southeast Asia (Brunei, Cambodia, the Philippines and Vietnam) and the Middle East (Jordan). Mobile-Focused countries in Asia were mostly Middle Eastern, including Kuwait, Lebanon, Oman, Saudi Arabia and Turkey.

European mobile performance is mostly strong, fixed varies

2019-Performance-vs-Global---Europe

With the exception of Ireland, the European countries on the Speedtest Global Index fell into the Speed Leaders, Mobile-Focused, and Speed Laggers categories. All of the Speed Laggers (Belarus, Kazakhstan, Russia and the Ukraine) were from Eastern Europe. Countries from Southeast Europe (including Albania, Bosnia and Herzegovina, Croatia, Greece, Montenegro, Moldova, Serbia and Slovenia) and Central Europe (Austria and the Czech Republic) made up the bulk of the Mobile-Focused category.

Speed Leaders included countries from the Baltics (Estonia, Latvia and Lithuania), the Nordics (Denmark, Norway and Sweden), Central Europe (Poland and Romania), and Western Europe (including Belgium, France, Germany, the Netherlands, and Spain).

North American internet performance is sharply divided

2019-Performance-vs-Global---North-America

Canada and the U.S. are the only two North American countries in the Speed Leaders category. Panama is the only North American country under Fixed-Focused. Mexico and all of the Central American countries fall into the Speed Laggers category. There are no North American countries that are Mobile-Focused.

Each country in Oceania has a very different internet story

2019-Performance-vs-Global---Ocean

Oceania is represented in three of the four quadrants: Speed Leaders (New Zealand), Mobile-Focused (Australia) and Speed Laggers (Papua New Guinea) with Fiji straddling the divide between Speed Laggers and Mobile-Focused.

South America mostly lags in mobile and fixed internet speeds

2019-Performance-vs-Global---South-America

Most of the South American countries represented on the Speedtest Global Index are in the Speed Laggers quadrant (Argentina, Bolivia, Brazil, Colombia, Ecuador, Paraguay, Peru, Suriname and Venezuela). Chile is an exception, being part of the Fixed-Focused group, as is Uruguay which sits in Mobile-Focused.

Global internet speeds are improving on average and 5G and gigabit are compounding those advances where available. However, not all countries are benefitting equally. We’ll be interested to see how 5G continues to push mobile speeds in the next year and also whether 5G Wi-Fi becomes a game changer for fixed broadband. Remember to check the Speedtest Global Index on a monthly basis for updated country rankings. And take a Speedtest to make sure your experience is represented in your country’s averages.

Editor’s Note: This article was edited on September 10, 2019 to correct an error in the labeling on the first image. The colors in a later image were updated for consistency.

Ookla retains ownership of this article including all of the intellectual property rights, data, content graphs and analysis. This article may not be quoted, reproduced, distributed or published for any commercial purpose without prior consent. Members of the press and others using the findings in this article for non-commercial purposes are welcome to publicly share and link to report information with attribution to Ookla.

| January 12, 2021

2020 Recap: How the Internet Held Up During a Global Pandemic


There was major concern last year that the internet might fail under the pressure of increased use as COVID-19 drove unparalleled waves of remote work and schooling. We watched internet performance carefully using data from Speedtest Intelligence® as conditions changed in different areas of the world. Now we’re back to assess what happened during the year as a whole.

A note on the methodology: 5G launches drove up mean internet speeds on mobile in many countries. For this reason we’ve simplified our view to include only median speeds, which are less subject to being skewed by especially fast 5G tests.

Mobile speeds dipped in many G20 countries in the spring of 2020

Mobile-Broadband-Speeds-in-G20-Countries_0121

Median download speeds over mobile in many G20 countries dropped at some point during 2020. Countries that saw month-to-month declines during the spring include: Australia, Canada, France, India, Italy, Saudi Arabia, South Korea, Spain and Turkey. China saw a decline in mobile speed in February while Japan suffered a drop in June and July. Argentina, Brazil, Indonesia, Russia and the United Kingdom showed only very minor decreases, while speeds in Germany, Mexico, South Africa and the United States remained unchanged or increased.

Despite the drops, almost all G20 countries saw higher median download speeds over mobile in December 2020 than they had in January 2020. Median download speed over mobile increased 76.3% in China during that time. Germany saw a 62.8% increase, the United States 56.9%, South Korea 55.5% and Saudi Arabia 48%. Turkey saw a 0.7% decrease in median download speed over mobile during the same period.

Despite interim dips, fixed broadband improved in all G20 countries during 2020

Fixed-Broadband-Speeds-in-G20-Countries_0121

There were notable dips in median download speeds over fixed broadband in many countries during the spring of 2020. G20 countries that saw these declines on a monthly basis include: Argentina, Canada, France, India, Indonesia, Italy, Japan, South Korea, Spain, Turkey and the United States. Brazil, China, Germany and Russia notably showed only increases in month-to-month median download speed over fixed broadband during this time. Other countries showed only very minor decreases.

Perhaps most important, all G20 countries saw higher median download speeds over fixed broadband in December 2020 than they had in January 2020. Median download speed over fixed broadband increased 51.9% in Brazil during that time. France saw a 48.3% increase, Japan 46.5%, Saudi Arabia 43.7% and South Africa 40%. South Korea saw the smallest increase in median download speed over fixed broadband over the same period at 8.1%.

We are impressed, on the whole, with how well the internet held up to the massive scale of increased use during the past year. Of course, month-by-month, country-level views are averages that might not reveal problems with specific mobile operators or internet service providers on individual days. If you want to assess how your internet connection is performing right now, take a Speedtest®. And if you are unable to connect to a specific service on the internet, check Downdetector® to see the status of that service.

Ookla retains ownership of this article including all of the intellectual property rights, data, content graphs and analysis. This article may not be quoted, reproduced, distributed or published for any commercial purpose without prior consent. Members of the press and others using the findings in this article for non-commercial purposes are welcome to publicly share and link to report information with attribution to Ookla.

| December 14, 2021

Find Out if 5G is Worth the Upgrade: A Multi-Country Analysis

The holidays are nearly here and with them the desire to treat yourself or a loved one to an upgraded phone, just because. The first question you’re likely to ask yourself as you browse new models is “To 5G or not to 5G?” Once you check the Ookla 5G Map to see if your operator has deployed 5G in your area, you’ll probably want to know if the 5G speeds are worth the extra cost. We’ve analyzed Speedtest Intelligence® data from the most popular Android and iPhone devices around the world during Q3 2021 to help you see if it’s worth the upgrade. Click a country from the list to jump down to the related analysis.

Australia | Bahrain | Canada | China
France | Japan | Saudi Arabia | South Africa
South Korea | United Arab Emirates | United Kingdom | United States
Our analysis includes data on the five 4G Android devices in each country with the largest number of results during Q3 2021 as well as the five most popular 5G-capable Android devices. We have also compared the iPhone 13 to the iPhone 11. Even the fastest device can only perform at the level of the network it’s on. For that reason, speeds for the same device vary widely from country to country in the data below. Remember that speeds can also vary within a country and the performance you see will depend on the infrastructure in your area.

Australia

5G Samsung devices more than twice as fast as most popular 4G devices in Australia

Although only a year separates the release of the Samsung Galaxy S10 series and the S20 series devices, the latter were definitely faster in Australia during Q3 2021. Even the slowest 5G-capable device on this list, the Galaxy S20+ 5G was much faster than the fastest 4G phone, the Galaxy S10+.

ookla_android_performance_australia_1121-01

iPhone 13 wallops iPhone 11 for speed in Australia

Australians who recently upgraded their iPhone 11 for an iPhone 13 would have seen a more than 4X increase in median download speed during Q3 2021. If speed is your number one concern, this upgrade is necessary.

ookla_iphone_performance_australia_1121-01

Bahrain

5G Samsung variants live up to the hype in Bahrain

Fewer 5G-capable phones made our list in Bahrain during Q3 2021 due to sample counts, but those that did roundly outperformed the most popular 4G devices. The median download speed of 5G-capable devices on this list was more than two times faster than the median for 4G devices on this list.

ookla_android_performance_bahrain_1121-01

iPhone 12 85% faster than iPhone 11 in Bahrain

There weren’t sufficient samples to analyze performance of the brand new iPhone 13 in Bahrain during Q3 2021, but median download speed on the iPhone 12 was 85.0% faster than that on the iPhone 11.

ookla_iphone_performance_bahrain_1121-01

Canada

Not all 5G Android devices offer a massive improvement in Canada

Q3 2021 data from Canada shows that 5G isn’t the only way to get a fast connection. While the fastest 5G-capable device among the top five most popular (the Samsung Galaxy S21 Ultra 5G) offered very fast median download speeds, two 4G devices (the Note10+ and the S10+) were nearly as fast as the slowest 5G-capable device on this list (the S20 Fan Edition 5G). To upgrade or not is definitely a question here of which device you are upgrading from and which you plan to upgrade to.

ookla_android_performance_canada_1121-01

iPhone 13 more than three times as fast as the iPhone 11 in Canada

Canadians looking for fast mobile performance on Apple devices will enjoy an upgrade to the iPhone 13 whose median download speed in Q3 2021 was more than three times as fast as that on the iPhone 11.

ookla_iphone_performance_canada_1121-01

China

5G offers major advantages on Android in China

There is no question as to whether consumers with one of the five most popular 4G Android devices would see faster speeds with one of the five most popular 5G Android devices. The 4G devices on this list saw median download speeds in the 22.00 to 34.00 Mbps range during Q3 2021 while the 5G-capable devices showed median download speeds between 155.87 Mbps (Xiaomi Mi 10 5G) and 280.22 Mbps (Huawei Mate 40 Pro 5G).

ookla_android_performance_china_1121-01

iPhone 13 more than ten times faster than iPhone 11 in China

China was home to the largest performance increase when comparing the iPhone 11 to the iPhone 13. Median download speed on the iPhone 13 was more than ten times faster during Q3 2021 than on the iPhone 11. Some of this difference may reflect market conditions where users in more rural areas have older phones and poorer infrastructure, but it’s still an impressive difference.

ookla_iphone_performance_china_1121-01

France

French 5G offers a decent speed boost on Android

The most popular 4G devices in France showed median download speeds between 37.67 Mbps (Samsung Galaxy S8) and 51.36 Mbps (S20 Fan Edition) during Q3 2021. These were easily topped by the 5G-capable devices which showed median download speeds of 73.73 Mbps (Xiaomi Mi 10T Pro 5G) to 92.10 Mbps (Xiaomi Mi 11 5G).

ookla_android_performance_france_1121-01

iPhone 13 more than three times faster than iPhone 11 in France

French consumers who upgraded from the iPhone 11 to the iPhone 13 during Q3 2021 would have tripled their median download speed potential on the 5G-capable iPhone 13.

ookla_iphone_performance_france_1121-01

Japan

Android 5G devices are faster in Japan, but not always fast

The most popular 4G devices in Japan during Q3 2021 were much slower than the most popular 5G-capable devices. Speedtest Intelligence showed median download speeds on 4G devices ranging from 19.75 Mbps (Xiaomi Redmi Note 9S) to 26.57 Mbps (Oppo Reno A). Even the slowest 5G-capable device on this list, the Xiaomi Mi 11 Lite 5G at 43.63 Mbps, was 56% faster than the fastest 4G devices. However, the fastest 5G-capable device on this list, the Sony Xperia 1 II 5G, was twice as fast as that at 94.85 Mbps.

ookla_android_performance_japan_1121-01

iPhone 13 more than twice as fast as iPhone 11 in Japan

In Japan, the median download speed of the iPhone 13 was more than twice as fast as that over the iPhone 11 during Q3 2021. This was one of the smallest differences in performance between the iPhone 11 and 13 that we saw in our analysis.

ookla_iphone_performance_japan_1121-01

Saudi Arabia

5G Android devices are much faster than 4G in Saudi Arabia

Median download speeds on the most popular 5G-capable devices were fast in Saudi Arabia compared to most other markets. 5G-capable speeds ranged from 174.43 Mbps for the Samsung Galaxy S20 Ultra 5G to 261.21 Mbps for the S21 Ultra 5G. 5G is definitely worth the upgrade in Saudi Arabia.

ookla_android_performance_saudi-arabia_1121-2-01

iPhone 13 was more than five times faster than the iPhone 11 in Saudi Arabia

Not only did Saudi Arabia show the second fastest median download speed over iPhone 13 during Q3 2021, the iPhone 13 was also more than five times faster than the iPhone 11.

ookla_iphone_performance_saudi-arabia_1121-01

South Africa

5G shows a small improvement over 4G on Android in South Africa

The most popular 4G devices in South Africa showed a wide range of median download speeds during Q3 2021, from 18.00 Mbps (Huawei P20 Lite) to 40.69 Mbps (Samsung Galaxy Note10+). South Africa’s median download speeds on the most popular 5G devices were among the lowest we saw, from 43.09 Mbps on the Samsung Galaxy Note20 5G to 67.09 Mbps on the S21 Ultra 5G.

ookla_android_performance_south-africa_1121-01

iPhone 12 was almost twice as fast as the iPhone 11 in South Africa

There weren’t sufficient samples in South Africa to analyze the iPhone 13, so we compared the iPhone 12 to the iPhone 11. The median download speed on the iPhone 12 was almost twice as fast as that on the iPhone 11 during Q3 2021.

ookla_iphone_performance_south-africa_1121-01

South Korea

4G Android devices in South Korea are fast, 5G even faster

The median download speeds we saw on the most popular 4G devices in South Korea during Q3 2021 rivaled the 5G speeds in South Africa with speeds ranging from 53.74 Mbps on the Samsung Galaxy Note8 to 60.41 Mbps on the S9+. However, median performance on 5G-capable devices was even faster. There was a wide variety in speeds among the most popular 5G-capable with the S10 5G showing a median download speed of 102.61 Mbps and the S21 Ultra 5G coming in at 221.18 Mbps. 5G is worth the upgrade in South Korea and consumers have a variety of high-performing devices to choose from.

ookla_android_performance_south-korea_1121-01

iPhone 12 more than three times faster than iPhone 11 in South Korea

South Korea did not have enough samples from the new iPhone 13, so we compared the iPhone 12 to the iPhone 11. Not only was the iPhone 12 more than three times faster for median download speed than the iPhone 11 during Q3 2021, South Korea’s iPhone 12 download speed beat iPhone 13 download speed in five of the countries we analyzed: Canada, France, Japan, U.K. and the U.S.

ookla_iphone_performance_south-korea_1121-01

United Arab Emirates

U.A.E. had the fastest speeds on Android 5G devices

While the median download speeds across 4G devices in the U.A.E. during Q3 2021 handily beat those of all the other countries in this analysis, the country’s 5G download speeds were even faster. We can see from this data that some of the 4G devices can perform much better when on a faster network. Even the slowest 4G device on this list, the Huawei P30 Pro, had a median download speed of 68.26 Mbps in U.A.E. compared to 30.20 Mbps in the U.K. on the same device.

ookla_android_performance_uae_1121-2-01-1

A similar story can be told for 5G devices where the U.A.E. was competing only with Saudi Arabia and South Korea for the fastest median performance on devices listed during Q3 2021. The Samsung Galaxy S21 5G showed a median download speed of 285.39 Mbps in the U.A.E. compared to 215.10 Mbps in South Korea while the Galaxy S21 Ultra 5G showed a median download speed of 269.09 Mbps in the U.A.E. and 261.21 Mbps in Saudi Arabia.

iPhone 13 more than four times faster than iPhone 11 in U.A.E.

Not only did the U.A.E. have the fastest median download speed over iPhone 13 that we saw in this analysis, the 485.59 Mbps download speed was faster than any phone in any country that we analyzed in Q3 2021. The iPhone 13 capitalized on fast 5G in the U.A.E. to have a median download speed that was more than four times faster than that of the iPhone 11.

ookla_iphone_performance_uae_1121-01

United Kingdom

5G represents a solid improvement over 4G on Android devices in the U.K.

Consumers upgrading from one of the most popular 4G devices in the United Kingdom to one of the most popular 5G-capable devices would have seen a 2-3X increase in median download speed during Q3 2021. This is in part because the 4G devices on this list were slower in the U.K. than elsewhere in the world during Q3 2021 as 4G speeds have stagnated in the U.K. For example, the Samsung Galaxy S8 showed a median download speed of 24.20 Mbps in the U.K., 37.67 Mbps in France and 46.31 Mbps in Canada. All five of the 5G-capable devices that we analyzed in both the U.S. and the U.K. were faster in the U.K. during Q3 2021.

ookla_android_performance_uk_1121-01

iPhone 13 more than five times faster than the iPhone 11 in the U.K.

Our analysis of Speedtest Intelligence data from Q3 2021 showed that the iPhone 13 had a median download speed that was more than five times faster than that on the iPhone 11. This makes the iPhone 13 very much worth the upgrade if speed is your main concern.

ookla_iphone_performance_uk_1121-01

United States

5G Android devices were twice as fast as 4G in the U.S.

The most popular 4G devices in the U.S. were about half as fast for median download speed as the most popular 5G-capable devices during Q3 2021. The Samsung Galaxy S21 Ultra 5G showed the highest median download speed among these devices at 69.78 Mbps, compared to the fastest 4G device surveyed, the Note10+ at 35.98 Mbps. That said, 5G-capable devices in the U.S. underperformed when compared to other countries, except Japan and South Africa.

ookla_android_performance_us_1121-01

iPhone 13 nearly three times as fast as the iPhone 11 in the U.S.

Data from Speedtest Intelligence reveals that median download speed on the iPhone 13 was nearly three times as fast as that on the iPhone 11 in the U.S. during Q3 2021.

ookla_iphone_performance_us_1121-01

Our analysis shows that increased speed is one of the benefits of upgrading your 4G phone to a 5G-capable one, regardless of where you live but not all countries see the same speed increases. Customers in Saudi Arabia, the U.A.E, China and South Korea will see especially good performance if upgrading an Android phone. The U.A.E., Saudi Arabia, China and Australia have especially good speeds on the iPhone 13. Whatever choice you make for your next phone, take a Speedtest® on Android or iOS to make sure your mobile operator is delivering the speeds you want to see.

Ookla retains ownership of this article including all of the intellectual property rights, data, content graphs and analysis. This article may not be quoted, reproduced, distributed or published for any commercial purpose without prior consent. Members of the press and others using the findings in this article for non-commercial purposes are welcome to publicly share and link to report information with attribution to Ookla.

| February 21, 2023

European 5G Performance Trails its International Peers

The European Union’s Digital Decade target is rather ambitious. It wants gigabit connectivity for everyone and ubiquitous 5G coverage by the end of 2030 to assist with digital transformation. When we reflected on 5G progress last year, we concluded that Europe had fallen behind its international peers. In this article, we will assess 5G progress across Europe.  

  • Europe trails others’ performance. Although more spectrum has been awarded over the past year, European 5G performance trailed the likes of the UAE and South Korea. 
  • 5G Availability is on the up. Whilst still behind its international peers, 5G adoption has increased during 2022. This, combined with the greater availability of 5G smartphones and the rollout of 5G networks using low-band spectrum, resulted in higher 5G Availability across most European countries. 
  • A tale of two Europes. In the Nordics and some Eastern European markets (Bulgaria and Cyprus) 5G outperformed the big 5 European economies (U.K., Germany, France, Spain, and Italy). Operators call for more consolidation and regulatory intervention to facilitate 5G investment. 
  • A hotbed for private networks. European governments and regulators are keen supporters of enterprise digitization efforts, and 5G is heralded as a key enabler to assist with that. Over 40% of all private networks worldwide are in Europe, a growing proportion of which are utilizing 5G. 

Mid-band is most assigned spectrum across Europe

As per the European Commission’s 2016 5G Action Plan, EU countries are meant to make low-band (700 MHz) spectrum available for use by June 30, 2020, and mid- (3.6 GHz) and high-band/mmWave (26 GHz) spectrum by December 31, 2020. At the EU level, there are the so-called 5G pioneer bands. These are the changes compared to when we last reviewed 5G spectrum assignments across Europe: 

  • Four countries still needed to assign spectrum last year. Now, Poland is the only one without dedicated 5G spectrum. 
  • Over the course of last year, three more countries awarded spectrum across all of the 5G pioneer bands, making a grand total of eight countries. 
  • Four more countries awarded spectrum across both low- and mid-band spectrum, tallying up the count to 17.
  • Mid-band spectrum is the most popular spectrum band, with 28 countries already awarded mid-band spectrum — an additional five to when we last took stock. The remaining countries, Poland and Netherlands, will finally auction the 3.5 GHz spectrum in the summer of 2023.
  • 26 countries auctioned spectrum in the 700 MHz bands, compared to 21 a year ago.
  • Eight countries have awarded mmWave spectrum thus far. Spain is the only addition in 2022, raising €36 million. 

map of european spectrum award in 5g pinoeer bands


Legacy networks give way to 4G LTE and 5G 

5G pioneer bands are not the only frequencies that operators use to deploy 5G. As operators shut down legacy networks, they can refarm sub-3GHz frequencies for 4G LTE or 5G. European operators tend to support 2G in the short term, phasing out 3G networks instead. MNOs also look to optimize their network operations, and the upkeep of legacy networks comes with additional cost and complexity.

The rate of network shutdowns is increasing. So far, across Europe, 21 operators across 11 countries have retired 3G networks compared to only two 2G network shutdowns. 2G is still needed to support M2M/IoT use cases, e.g. ongoing long-term enterprise contracts with utility providers. In contrast, operators see less traffic carried over 3G networks hence the desire to retire them. For example, Magyar Telekom noted 2.3% and 0.84% of total voice and data traffic on the 3G network. Proximus stated that 2% of its data traffic uses 3G, while Telenet/Base shared that 3G devices account for just 1% of its network. Looking ahead, 43 operators across 26 countries announced their plans to switch off 2G networks, and 37 operators in 21 countries will pull the plug on 3G.

5G adoption lags, 5G performance doesn’t impress either 

Most European countries have commercial 5G networks in place. However, 5G adoption across Europe lags behind its global peers. According to GSMA Intelligence, in Q4 2022, 5G uptake in Europe accounted for 7.4 % of total mobile connections, a substantial increase over the Q4 2021 level of 2.5%. Across European countries, 5G adoption is at most 21% (Switzerland), compared to 43.1% in the United States, 42.4% in South Korea, China (36.3%), Australia (30.1%), and Japan (28.5%).

chart of 5g performance in europe with select international comparisons


Our recent article identified four broad clusters of 5G performance based on Speedtest Intelligence® data. Most European countries achieved median 5G download speeds under 200 Mbps, placing them within the 5G Improvers category. Bulgaria was the only country that made it into the 5G Leaders category, which includes the likes of the UAE, South Korea, Singapore, and Qatar, with a median 5G download speed of 342.71 Mbps, a slight decrease compared to last year (374.90 Mbps in Q4 2021). Five countries made it into the High Performers cluster, achieving a median 5G download speed exceeding 200 Mbps: Sweden, Cyprus, Finland, Denmark, and Norway. Interestingly enough, the big five European economies (U.K., Germany, France, Spain, and Italy) were outperformed by the Nordics and two Southern Eastern European markets (Bulgaria and Cyprus). The Nordics have always played a leading role in European telecoms, but the 5G performance gap between them and the big five points to challenges in those markets. 

Across most of Europe, median 5G speeds have actually decreased. This isn’t surprising, as increased adoption leads to higher network congestion, but other factors are at play. Operators feel the pressure of the economic crisis, higher energy costs, and reduced consumers’ spending power. Europe also suffers from fragmentation, low ARPU levels brought about by intense competition, and Capex levels that are half that of the U.S. and Canada. A report by the European Court of Auditors estimates the deployment cost of 5G across all EU member states at around €400 billion. Operators are yet to see additional revenue coming from 5G that can support that level of investment. The optimal market structure and role of governments in supporting the rollout of 5G remains a heavily debated topic as operators’ M&A activities heat up.

chart of top 5g performing providers in europe


Operators’ performance tells an interesting story as there are vast differences between countries and even within a country. The Nordics operators’ 5G performance tends to rank highly compared to other European countries thanks to having access to dedicated 5G spectrum and supportive regulatory environment. Denmark and Sweden have a greater level of network sharing as two operators share Multi-Operator Core Networks (MOCNs) and spectrum. In some countries, operators have to adhere to conditions stipulated by the 5G license, either in terms of network coverage or the number of 5G sites. For example, in France, each operator had to deploy 3,000 5G sites by the end of 2022. Challenger mobile operators often outperform incumbents — strong results from Three in the chart above are proof of that. 

5G Availability shows improvement

chart of 5g availablity in europe with select international comparisons


Given the growth in 5G adoption, not surprisingly, 5G Availability (the percentage of users on 5G-capable devices that spend most of the time with access to 5G networks) has been on the rise too. 5G Availability is a function of 5G network coverage, and 5G tariff and 5G-capable device adoption. At 56%, the U.S. continues to have the highest level of 5G Availability, having started 5G deployment in the 600 MHz (low band) range and with a large pool of customers owning 5G capable devices. The 600 MHz frequency band has further reach compared to 700 MHz and even the LTE mid-band. Within Europe, 5G Availability exceeds 40% in three countries: Cyprus, Switzerland, and Denmark, but the range is broad across those countries. Cyta Cyprus has reached 67.1% 5G Availability in Q4 2022, thanks to extending 5G coverage to 100% of Cypriots. Swisscom ranks highly too, with 61% Availability in Q4 2022. Its 2022 Annual Report notes that the operator covers 99% of the Swiss population with a basic version of 5G (using Dynamic Spectrum Sharing, which borrows capacity from its LTE spectrum) and 74% with 5G + (delivered using mid-band spectrum). 

One critical component driving 5G Availability is the affordability and availability of 5G-capable smartphones. According to Counterpoint Research, in Q4 2022, 5G smartphone sales across Europe totaled 26.8 million, equivalent to 67% of total smartphone sales, compared to 84% in North America and 87% across China, Japan, and South Korea. Europe still needs to catch up to other advanced markets in smartphone adoption. Within Europe, there is also wide variation, with Germany at 90%, Sweden at 88%, the UK at 86%, and Eastern European markets at 49%. Over time, smartphone sales will translate into a more extensive installed base of 5G devices and share of overall subscriptions.charts of 5g sales across select eupropean markets and 5g smartphones as proportional of total smartphone sales

A glimmer of hope for 5G investments

As per the EU Commission’s 5G Action plan, operators should extend 5G networks to all urban areas and major roads and railways by 2025 and populated areas by 2030. For Europe to catch up with its peers and to achieve its digital ambitions, it needs more investment. Operators frequently call for a more supportive policy and regulatory ecosystem to stimulate Capex. During Ookla’s Southeast Europe Regulatory Summit, Professor Konstantinos Masselos, President of Hellenic Telecommunications and Post Commission and BEREC Chair 2023, recognized that Europe is still behind the rest of the world, there is a need to fill the gap for investments, and Europe needs to solve demand issues and cost-effectiveness while not forgetting sustainability.

According to Assembly Research, an issue that came to the fore during 2022 was ‘fair share’ – i.e. the idea that tech companies should contribute to telecoms network costs. Many large telcos believe that deploying Europe’s digital infrastructure should be more evenly distributed among those generating traffic (and costs). However, some smaller operators and access seekers, such as MVNOs, are concerned by the possible implications of fair share, arguing that it could create a competitive distortion that puts them at a disadvantage. In addition, an October 2022 report by BEREC found little evidence that large content and application providers should contribute towards the cost of building telecom networks, considering that this model could risk harming Europe’s internet ecosystem.

Nevertheless, the European Commission is considering potential changes to how networks are funded. Commissioner Thierry Breton is poised to launch the EC’s fair share consultation at MWC23, which will reportedly outline proposals on Big Tech’s contribution towards telecoms network costs. Whether the European telcos’ lobbying campaign will bear fruit, only time will tell. But this will also depend on how well telcos outline what ‘fair share’ should look like. In Assembly’s view, the next step is to develop a practical means of implementing fair share, one which telcos have yet to set out in detail. In response to the EC’s forthcoming consultation, the onus is on operators to present compelling, justifiable policy actions, including how contributions to network costs should be calculated and applied.

European regulators support enterprise digitization efforts 

Digitization of different sectors of the economy is key to supporting sustainable development and climate goals. However, enterprise requirements differ. Some prefer to retain control over their networks, isolating them from the public network. Private mobile networks play an important role in broader digital transformation and addressing Industry 4.0 objectives. According to GSA, there were 954 private networks globally, of which almost half were in Europe (405). In terms of the number of private networks, the U.S. ranked first internationally, Germany was second, and the U.K. came fourth, followed by Japan, Finland, France, and Sweden. All of these countries embarked on digitization strategies to strengthen their position as manufacturing hubs, and it is no coincidence that these are also the markets where enterprises can purchase dedicated spectrum.

chart of top 15 countries by number of private networks

Historically, Wi-Fi has been the connectivity choice for private networks. However, mobile technologies such as 4G LTE and 5G are better suited to Operational Technologies’ network requirements of high volume, high reliability, mobility, and always-on operations. In Europe, almost half of the private networks run on 4G LTE (44%), 21% use a mix of 4G and 5G, with 5G accounting for close to 30% of deployments. As we have noted before, the introduction of industrial chipsets, based on Release 16, scheduled to come to market in 2023, will stimulate the private 5G networks market too.

Furthermore, regulators are creating an encouraging environment for enterprises to deploy their own networks to support their digital transformation targets. A dedicated spectrum for private mobile networks has already been allocated to industry players in France, the U.S., Germany, Japan, and the U.K., among others. Recently, Norwegian regulator Nkom opened up a 3.8 – 4.2 GHz band for interested parties to apply for a license to offer private 5G networks. Germany spearheads the Industry 4.0 movement, with some of the country’s biggest industrial players awarded their own 5G spectrum and experimenting with private 5G networks to address their particular needs. Other countries that look to support their national manufacturers standing in the global marketplace look to follow, as we have discussed the case for private networks in India.

Ookla will be at MWC Barcelona 2023 — visit us at our Stand 2i28 in Hall 2 to talk with us about telco trends and to learn about Ekahau’s private 5G offering. If you are interested in what are the new and exciting use cases as we enter the 5G Advance era, join us at the 5G Futures Summit. In the meantime, please contact us if you’re interested in discovering more about Ookla Speedtest Intelligence and its wealth of fixed and mobile consumer-initiated data and insights.


Ookla retains ownership of this article including all of the intellectual property rights, data, content graphs and analysis. This article may not be quoted, reproduced, distributed or published for any commercial purpose without prior consent. Members of the press and others using the findings in this article for non-commercial purposes are welcome to publicly share and link to report information with attribution to Ookla.

| December 18, 2019

A Global Look at Mobile Modem Market Share and Device Performance

Analysts discuss the latest devices all the time, but rarely is enough attention paid to the phone’s real powerhouse — the modem. We were interested to see how market share for modem manufacturers divides up on a global level, so we investigated device data from Speedtest IntelligenceTM during Q3 2019. We also looked at how popular phones performed in different markets, including a look at 5G phones in 5G countries.

Global modem market share

Ookla_Global-Modem-Market-Share_1219-2

Speedtest data showed Qualcomm was the most common modem manufacturer in 133 countries during Q3 2019 — the highest market share was in Hong Kong with 73.6% of the devices analyzed showing Qualcomm modems. Qualcomm’s slimmest majority was in Botswana with 25.6% of devices analyzed showing Qualcomm modems.

This is not surprising as Qualcomm chipsets power many flagship devices sold around the world. In the U.S., virtually all Android OEMs use Qualcomm-powered chipsets. The latest Qualcomm Snapdragon 855+ mobile platform with Snapdragon X24 integrated LTE modem (up to 2Gbps) powers popular devices from Samsung, LG and OnePlus. It’s worth noting that Qualcomm has multi-year licensing deals with multiple OEMs based in China, namely Vivo, OPPO, Lenovo, Xiaomi and OnePlus, providing their complete modem-to-antenna solutions for optimal RF performance. This includes valuable RF Front End (RFFE) components such as power amplifiers, envelope trackers, RF switches, filters and antenna tuners.

These OEMs also have access to Qualcomm’s first and second generation 5G modems. As of right now, Qualcomm is also the only chipset manufacturer providing modem-to-antenna solutions for 5G millimeter wave (mmWave) deployments, providing all-in-one mmWave antenna modules that contain radio transceiver, RFFE and phased array antenna.

Intel was the most common modem manufacturer in 32 counties during Q3 2019. The highest percentage of devices with Intel modems was seen in Greenland at 55.6%. Intel’s slimmest majority was in South Africa with 28.6% of devices analyzed showing Intel modems. Intel’s main customer in the smartphone space is Apple. Starting in 2016, Apple began powering some iPhone devices with Intel’s flagship LTE chipsets, and since 2018, all iPhones have Intel’s cellular chipsets.

Samsung was the most common modem manufacturer in 16 countries during Q3 2019. South Korea had the highest percentage of devices with Samsung modems at 53.8%. Samsung’s slimmest majority was in Mozambique with 29.1% of devices analyzed powered by Samsung modems. Samsung’s Exynos LTE modem is seen in variants of Samsung’s Galaxy S and Note devices. Except in the Americas and China, most of Samsung’s flagship S10 and Note 10 devices around the world are powered by Samsung’s own Exynos 982x SoC (system on a chip), with an integrated LTE Category 20 modem capable of download speeds of up to 2 Gbps.

Speedtest data showed HiSilicon as the most common modem manufacturer in two countries during Q3 2019. In Costa Rica, 32.4% of devices analyzed showed HiSilicon modems, and in Namibia that number was 27.6%. HiSilicon is a semiconductor company based in Shenzhen and fully owned by Huawei. Huawei integrates its own flagship modem into its flagship P and Mate series devices. These devices have a large user base in Europe, the Middle East and Asia.

Device performance is affected by market factors

A phone’s performance is always going to depend on the conditions within its specific market. Factors affecting network performance can include: geography, cell site and population density, the amount of wireless spectrum deployed and the overall capabilities of user equipment seeded to market. Multiple factors can impact the performance of a device, including: varying degrees of RF transparency in the materials used for device chassis, variations in RF front-end and antenna design complexity and whether the baseband processor is more or less capable of handling network tasks. We used Speedtest data to analyze how three popular phones — the Apple iPhone Xs, the Huawei Mate 20 Pro and the Samsung Galaxy S10 — performed in specific markets around the world during Q3 2019. We excluded data from devices with fewer than 100 samples in a market during the period.

Mean-DL-Speeds-on-Flagship-Phones

The Samsung Galaxy S10 was the fastest of these three devices in all but five markets during Q3 2019. However, the mean download speed on the Galaxy S10 varied between 18.06 Mbps in India and 95.91 Mbps in Canada. The Huawei Mate 20 Pro showed the fastest mean download speed of these three devices in France and the U.K. during Q3 2019 and often placed second in the remaining markets on the list. Mean download speed on the Mate 20 Pro during Q3 2019 ranged from 14.57 Mbps in India to 93.66 Mbps in Canada.

Apple’s iPhone Xs was at a slight disadvantage in this comparison, as it came out in 2018 where the other devices debuted in 2019. Because the iPhone 11 was not fully seeded to markets in Q3 2019, we considered its predecessor, the iPhone Xs, in this analysis. The iPhone Xs showed the fastest mean download speed in Germany, Japan and Nigeria during Q3 2019. Mean download speeds on the iPhone Xs varied from 15.92 Mbps in India to 71.72 Mbps in Canada.

Device performance in 5G markets

5G currently offers the pinnacle of mobile performance. We looked at 5G-capable devices in markets where 5G exists to see how download speeds compare. These results include Speedtest results on all technologies, not just 5G, which means averages also reflect consumers using 5G phones with a 4G connection.

Mean-DL-Speeds-on-5G-Phones

Both the Samsung Galaxy S10 5G and the Huawei Mate 20 X 5G showed mean download speeds in excess of 200 Mbps in some markets during Q3 2019. However, there’s clearly some difference in which devices are supported by which operators, as not all operators in 5G markets are offering 5G equally (if at all). Related, the Samsung Galaxy S10 5G models sold in the U.S. and China are powered by Qualcomm’s first-generation Snapdragon X50 5G modem, while other 5G markets receive the variant powered by Samsung’s in-house Exynos 5100 5G modem.

Mobile operators continue to incentivize consumers to upgrade to newer and more capable devices to ensure a more efficient use of spectrum assets for network operators. This leads to an improved utilization of shared resources, faster overall speeds and better quality of experience.

We’re looking forward to updating these analyses as more markets adopt 5G and as newer and even faster phones are released. For more information about how our device data can help you, contact us.

Ookla retains ownership of this article including all of the intellectual property rights, data, content graphs and analysis. This article may not be quoted, reproduced, distributed or published for any commercial purpose without prior consent. Members of the press and others using the findings in this article for non-commercial purposes are welcome to publicly share and link to report information with attribution to Ookla.

| January 14, 2021

Apple has 5G! But How Fast is the iPhone 12?


Apple’s 5G-capable iPhone 12 is the latest step in the continuous cycle of new technical specifications, new network components, new (or refarmed) radio spectrums and compatible user equipment that aim to deliver enhanced 5G user experience. At Ookla®, we are fortunate to have a front-row seat to observe these advances and we were thrilled when Apple announced its first 5G devices on October 13, 2020. Given the popularity of Apple’s devices, this release marks a major milestone on the way to 5G becoming mainstream.

iPhone 12 launch drives spikes in 5G testing

The daily count of unique devices worldwide that are capable of connecting to 5G jumped dramatically when each new iPhone 12 variant launched. We saw a 138.3% increase when comparing the day the iPhone 12 5G and iPhone 12 Pro 5G were released to the mean of the previous week. On the day the iPhone 12 Mini 5G and iPhone 12 Pro Max 5G launched, there was a further 44.3% increase over that one-day spike.

Daily-Trend_5G-Capable-Devices_Year_0121-1

Pro 5G and Pro Max 5G are the most popular iPhone 12 models

We examined Speedtest® results from the launch date of each model through the end of the year to see which iPhone 12 models are the most popular in 15 major cities across the globe. We found that most Speedtest users have opted for the “Pro” models. The iPhone 12 Pro Max 5G showed the highest number of samples among iPhone models in Singapore, Dubai, Hong Kong, New York, Riyadh and Sydney. The iPhone 12 Pro 5G showed the most samples in London, Madrid, Rome, Helsinki, Zürich, Berlin, Amsterdam, Seoul and Tokyo. While the more affordable models were less popular than the Pro models across all the cities on our list, the iPhone 12 Mini saw the most adoption in Tokyo and the iPhone 12 5G saw the most adoption in Rome.

iPhone-12-Model-Popularity_0121

Seoul tops list of iPhone 12 5G speeds

We analyzed Speedtest Intelligence® data for iPhone 12 devices in the same 15 cities and found that Seoul had the fastest median speed over 5G, followed by Dubai and Riyadh. Seoul also had the fastest upload speed by a considerable margin. This is not a surprise given reports that there are more than 100K 5G base stations in South Korea. It is interesting to note that European cities are relatively close to each other in terms of median download and upload speeds. That is good news for the 5G action plan of the European Commission and their target of having uninterrupted 5G coverage on major terrestrial transport paths by 2025.

iPhone-12-5G-Median-Speeds_0121

Each of these markets utilizes its own unique approach to 5G. Today, the United States is the only market where iPhone 12 models support 5G high-bands, namely n260 and n261. This is to support existing commercial 5G deployments in the mmWave spectrum across all three Tier 1 operators.

Elsewhere on the globe mid-band (specifically the 3300-3800 MHz range in most countries) is the most common frequency range for initial 5G roll-outs. There are several reasons for this, ranging from principles of electromagnetic wave propagation to marketing strategies. High-band frequency ranges (above 24 GHz with 400-800 MHz contiguous bandwidth) can do wonders in terms of download speeds, but due to limited propagation characteristics, it can be challenging to provide a mmWave coverage layer across entire markets. In order to mitigate this well-known challenge, operators tend to rely on the lower frequency bands for coverage and selectively deploy mmWave applications in targeted areas (such as high-traffic locations).

Depending on market dynamics and spectrum availability, most providers choose non-standalone (NSA) 5G configuration with an LTE anchor. Operators with limited amounts of FR1 spectrum tend to use dynamic spectrum sharing (DSS), a feature which allows both LTE and New Radio (NR) operation on the same slice of spectrum at the same time. This feature enables a relatively easy deployment of 5G coverage layers, and is a stepping stone to standalone 5G (5G SA). In addition to these commonly observed strategies, a few operators are considering pushing the limits of digital convergence with open radio access networks (RAN).

No matter which strategy an operator chooses, one important fact about 5G does not change: access to a trio of low, mid and high bands and a strategy for rolling out 5G SA is critical. Deployment of the 5G SA core unlocks the potential of enhanced mobile broadband (eMBB), ultra-reliable low latency communication (uRLLC) and massive machine type communications (mMTC).

Operator breakdown: iPhone 12 performance in select cities

5G deployments vary greatly from country to country, depending on spectrum allocated and the particular channel bandwidths each operator has deployed. This makes comparisons between countries difficult, as these factors directly impact the peak 5G speeds achievable in that market. However, looking at four major cities, we can see that performance by operator also varies.

iPhone-12-5G-Median-Speeds_Seoul_0121

In Seoul, the fastest city for 5G on the list above, the 3.5 GHz (Band n78) is used with 80 to 100 MHz channels per operator, and B2C mmWave (which would add a whopping 800 MHz channels per operator) is on the horizon. Here, LG U+ showed the fastest median download speed over 5G on the iPhone 12 in Seoul at 625.03 Mbps. SK Telecom was second and KT third.

iPhone-12-5G-Median-Speeds_Hong-Kong_0121

The three Hong Kong mobile operators that launched commercial 5G networks on April 1, 2020 ranked fastest for iPhone 12 5G median download speed rankings in Hong Kong. China Mobile HK, the only 5G network provider in Hong Kong that has acquired 3.3 GHz (3380-3400 MHz) and 3.5 GHz (3400-3460 MHz) continuous bandwidth spectrum was the fastest of these three at 212.77 Mbps. CSL and 3 Hong Kong were a close second and third, respectively. SmarTone, which launched its 5G network a month later, was fourth.

iPhone-12-5G-Median-Speeds_Amsterdam0121

The 3.5 GHz band is not yet available in the Netherlands, but this did not slow down Dutch operators in launching their commercial 5G networks in 2020. According to Speedtest Intelligence data, KPN Mobile was comfortably at the top, with a median download speed of 211.80 Mbps over 5G using the iPhone 12 in Amsterdam during Q4 2020. T-Mobile was second and Vodafone third.

iPhone-12-5G-Median-Speeds_Madrid_0121

While Spanish operators currently benefit from the n78 band, the next step is expected to be the delayed addition of low bands (700 MHz). In Madrid, Vodafone showed the fastest median download speed over 5G using the iPhone 12 during Q4 2020 at 232.51. Orange was second fastest, Yoigo third and Movistar at fourth.

We will continue to monitor how Apple’s 5G-capable devices impact the global market. Contact us to learn more about how Speedtest Intelligence can help you understand the latest developments in your market.

Ookla retains ownership of this article including all of the intellectual property rights, data, content graphs and analysis. This article may not be quoted, reproduced, distributed or published for any commercial purpose without prior consent. Members of the press and others using the findings in this article for non-commercial purposes are welcome to publicly share and link to report information with attribution to Ookla.

| December 10, 2020

Massive Expansions and Huge Improvements in Speed: The Worldwide Growth of 5G in 2020

The rapid expansion of 5G in countries across the globe was a bright spot in a year that needed one. But just how great is the news? We examined Speedtest Intelligence® data from over 60.5 million Speedtest® results during Q3 2020 to see how much speeds have improved, where download speeds are the fastest at the country and capital level, where 5G deployments have increased and what worldwide 5G coverage looks like now. We also looked at countries where 5G doesn’t yet reach to understand where good news might be on the horizon.

We have only included countries with commercially available 5G on these lists in order to provide a more accurate view of the performance consumers can reasonably expect. While our data shows results for many countries where 5G is not yet commercially available, these tests are likely results from engineers testing their own networks. In addition, we’re only providing analysis for countries with more than 200 samples during Q3 2020. The bars shown in our charts are 95% confidence intervals, which represent the range of values in which the true value is likely to be. Countries marked in tables with an asterisk first launched 5G commercially in 2020.

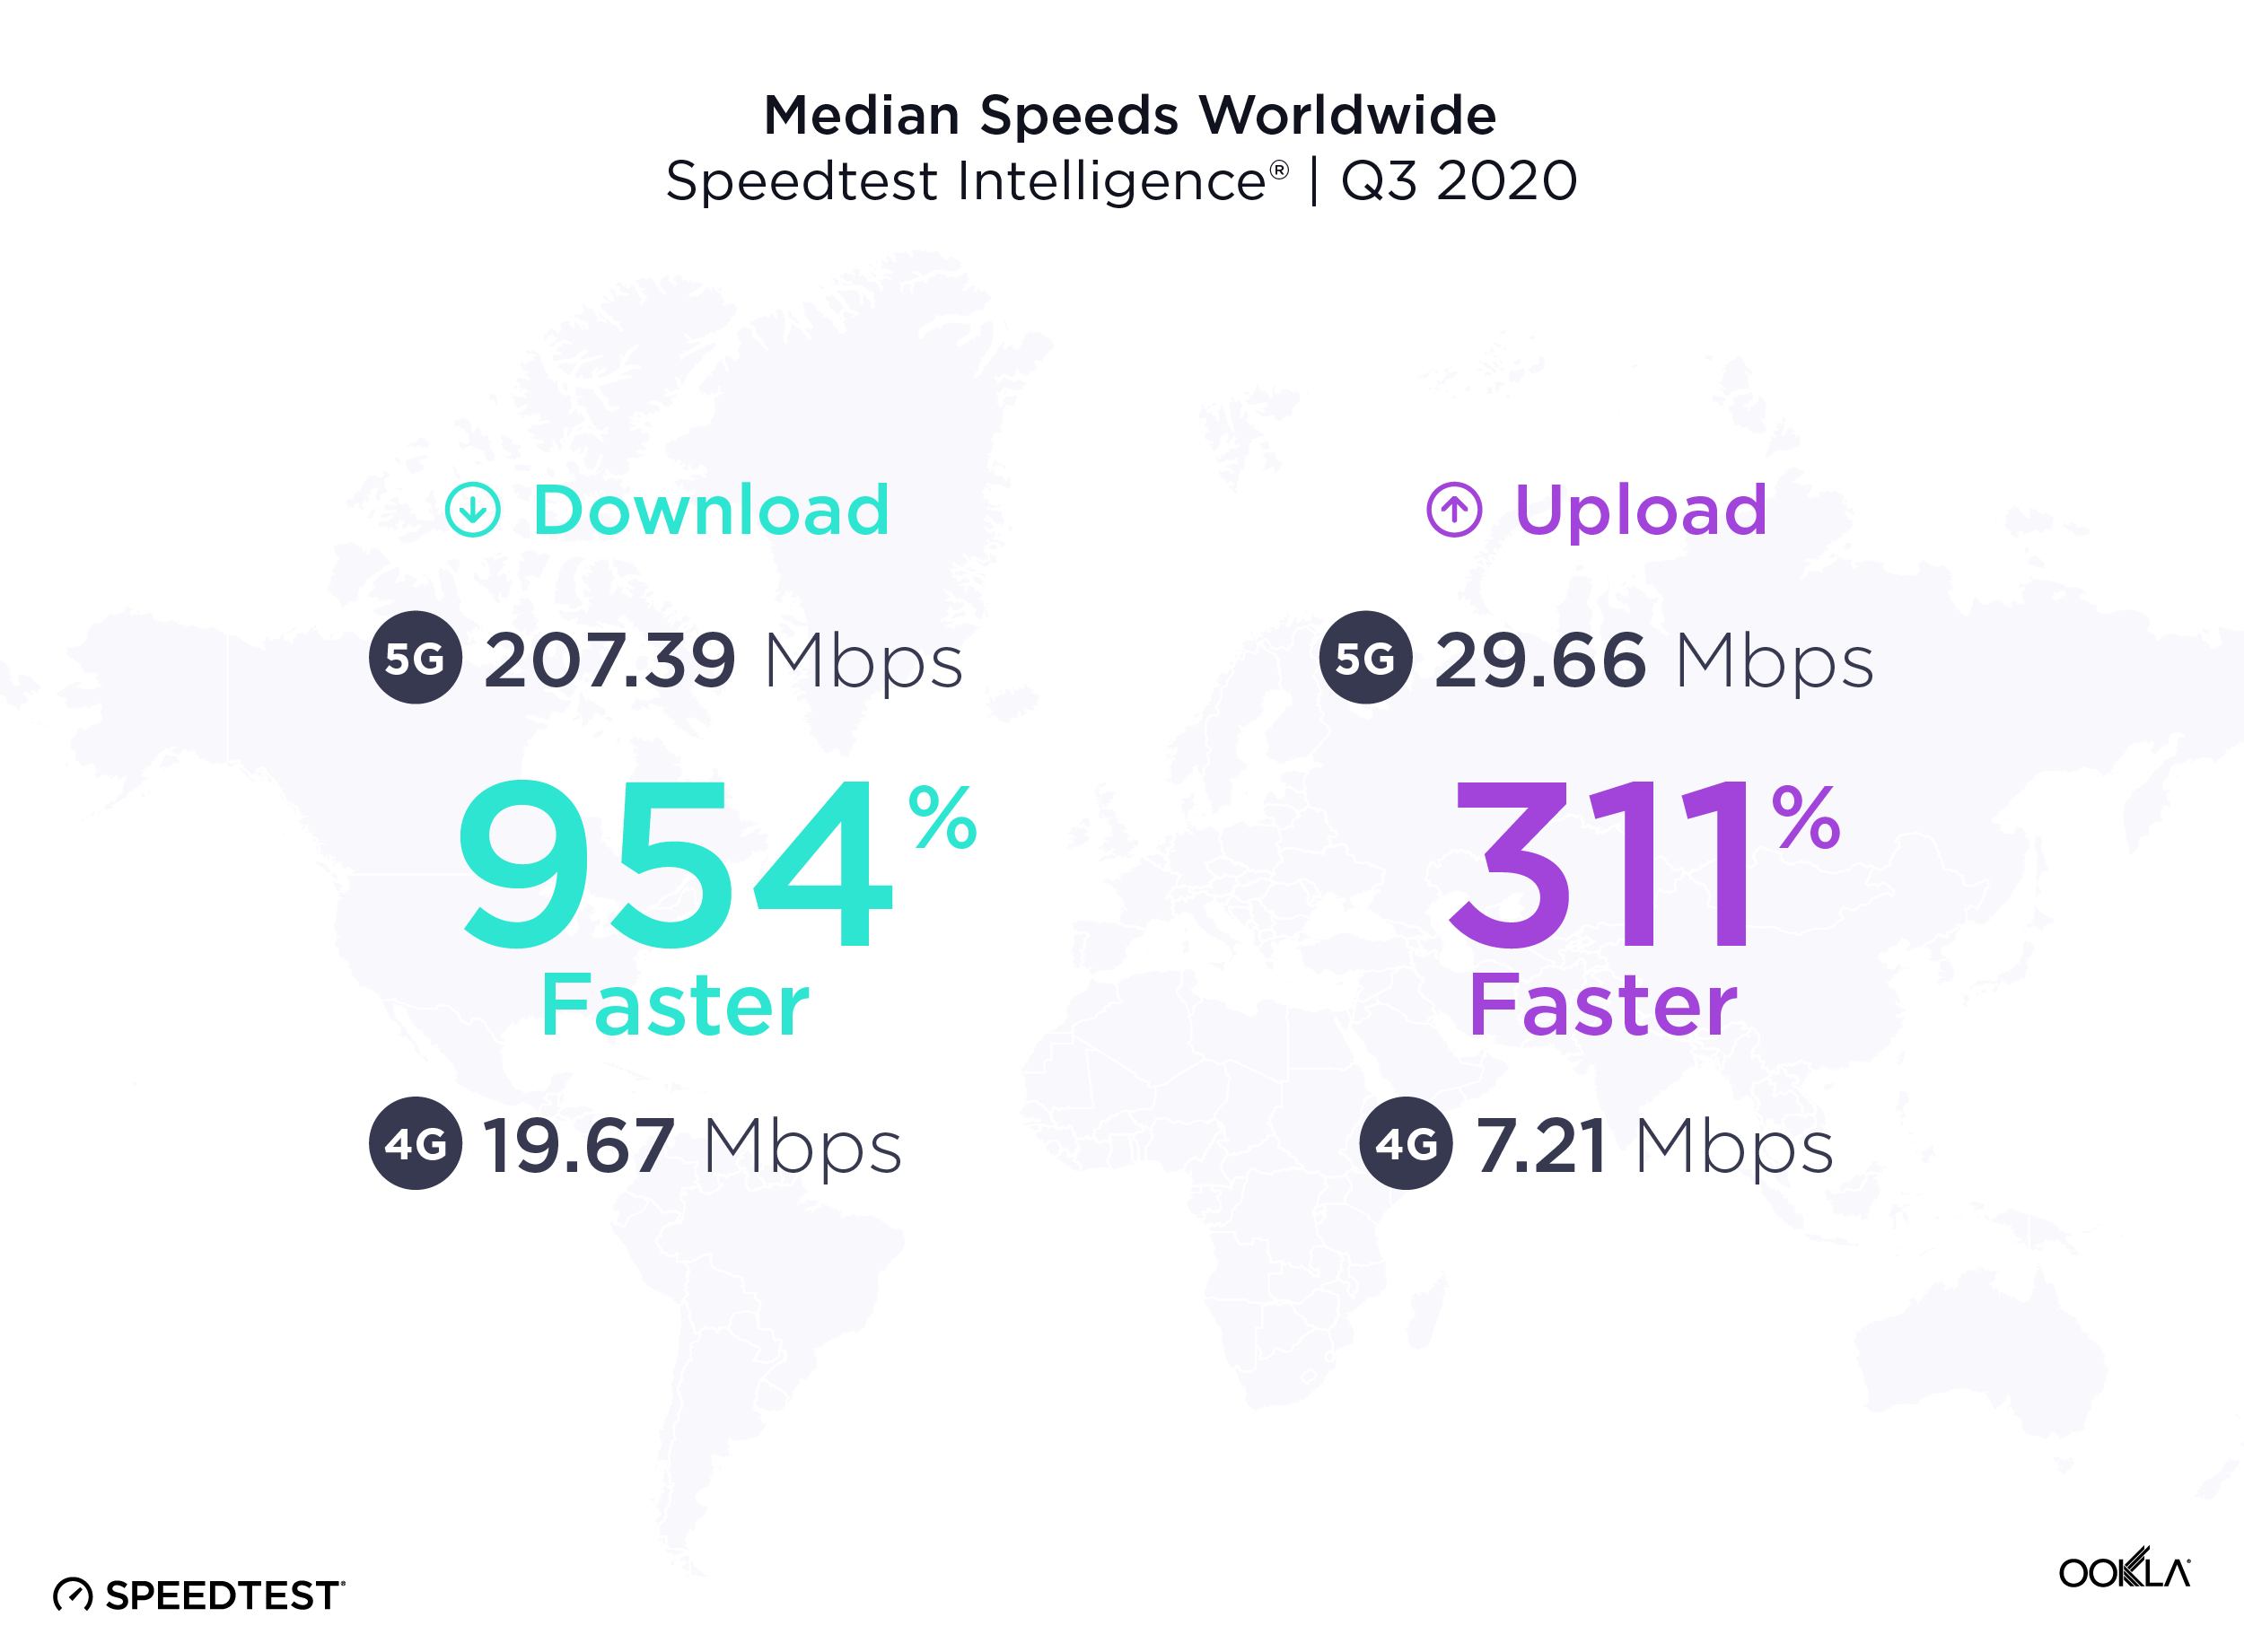
5G downloads were 954% faster than 4G at the global level

The worldwide median download speed over 5G was 954% faster than that over 4G during Q3 2020. Median upload speed over 5G was 311% faster than that over 4G. Consumers are eagerly adopting the new technology and many have wanted to measure the full throughput capacity of their network connection. In Q3 2020 alone, there were 4,324,788 Speedtest results over 5G.
Median-Speeds-Worldwide_1220-1

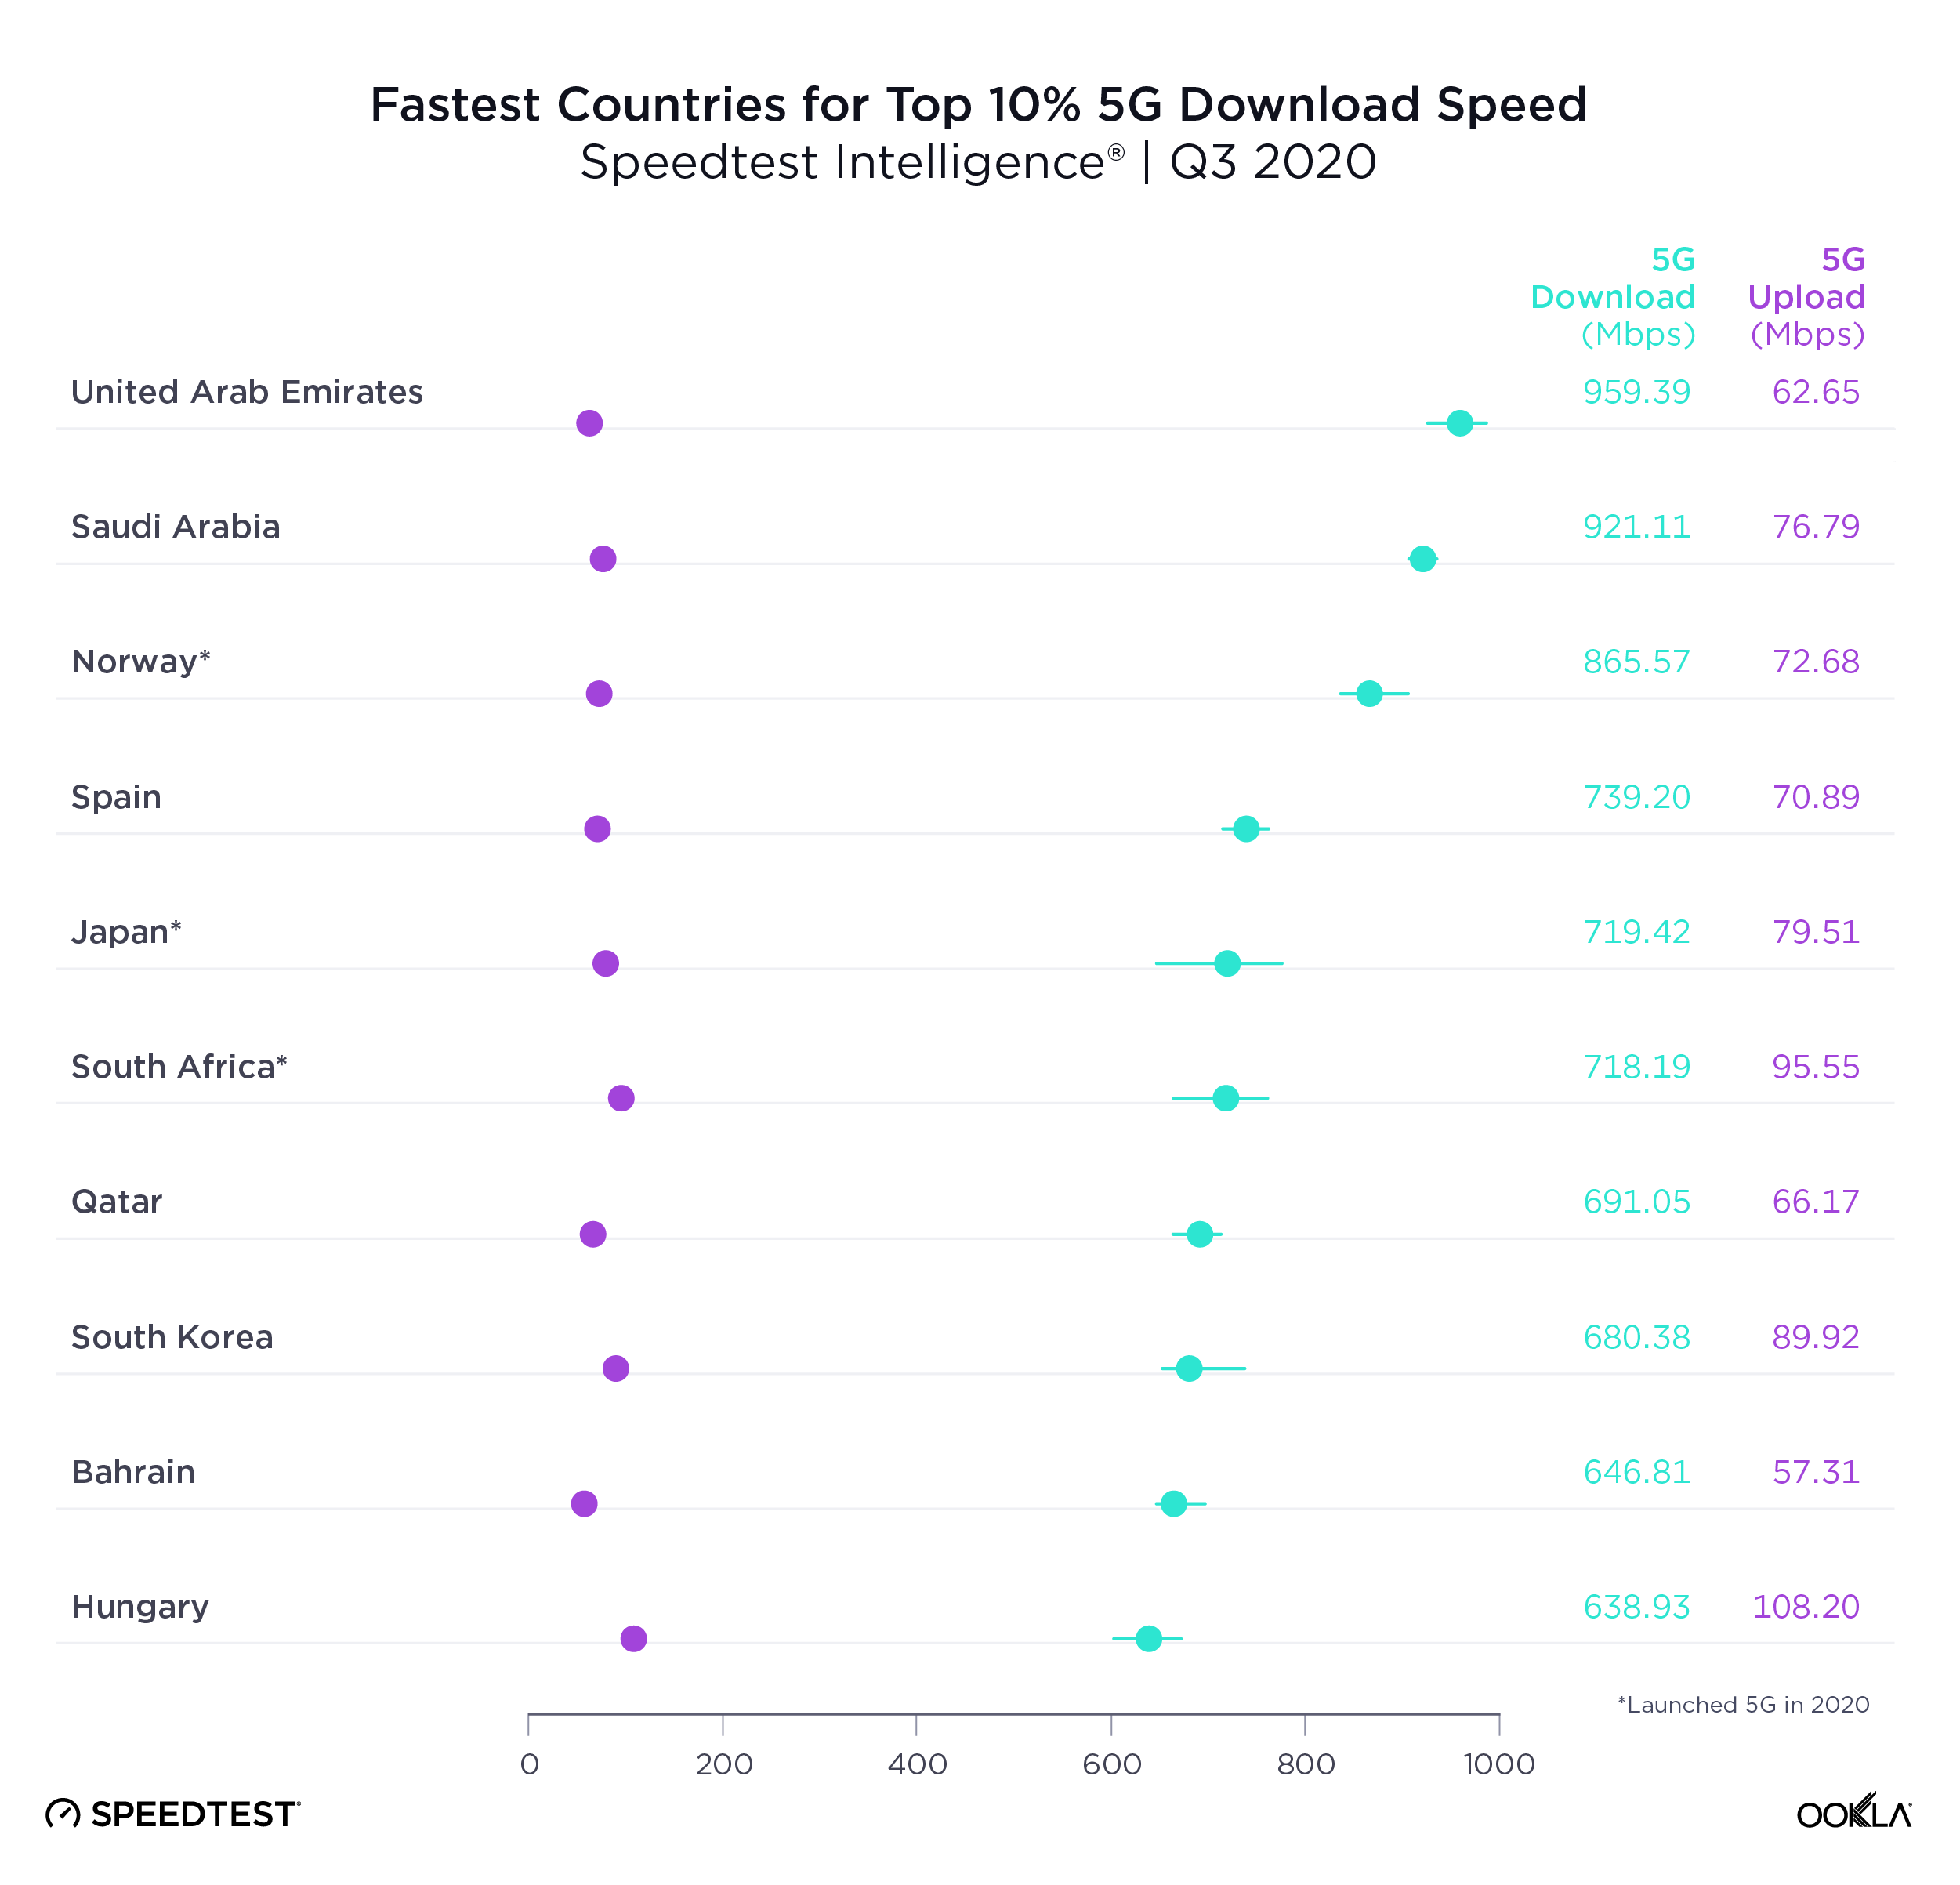
United Arab Emirates had the fastest 5G

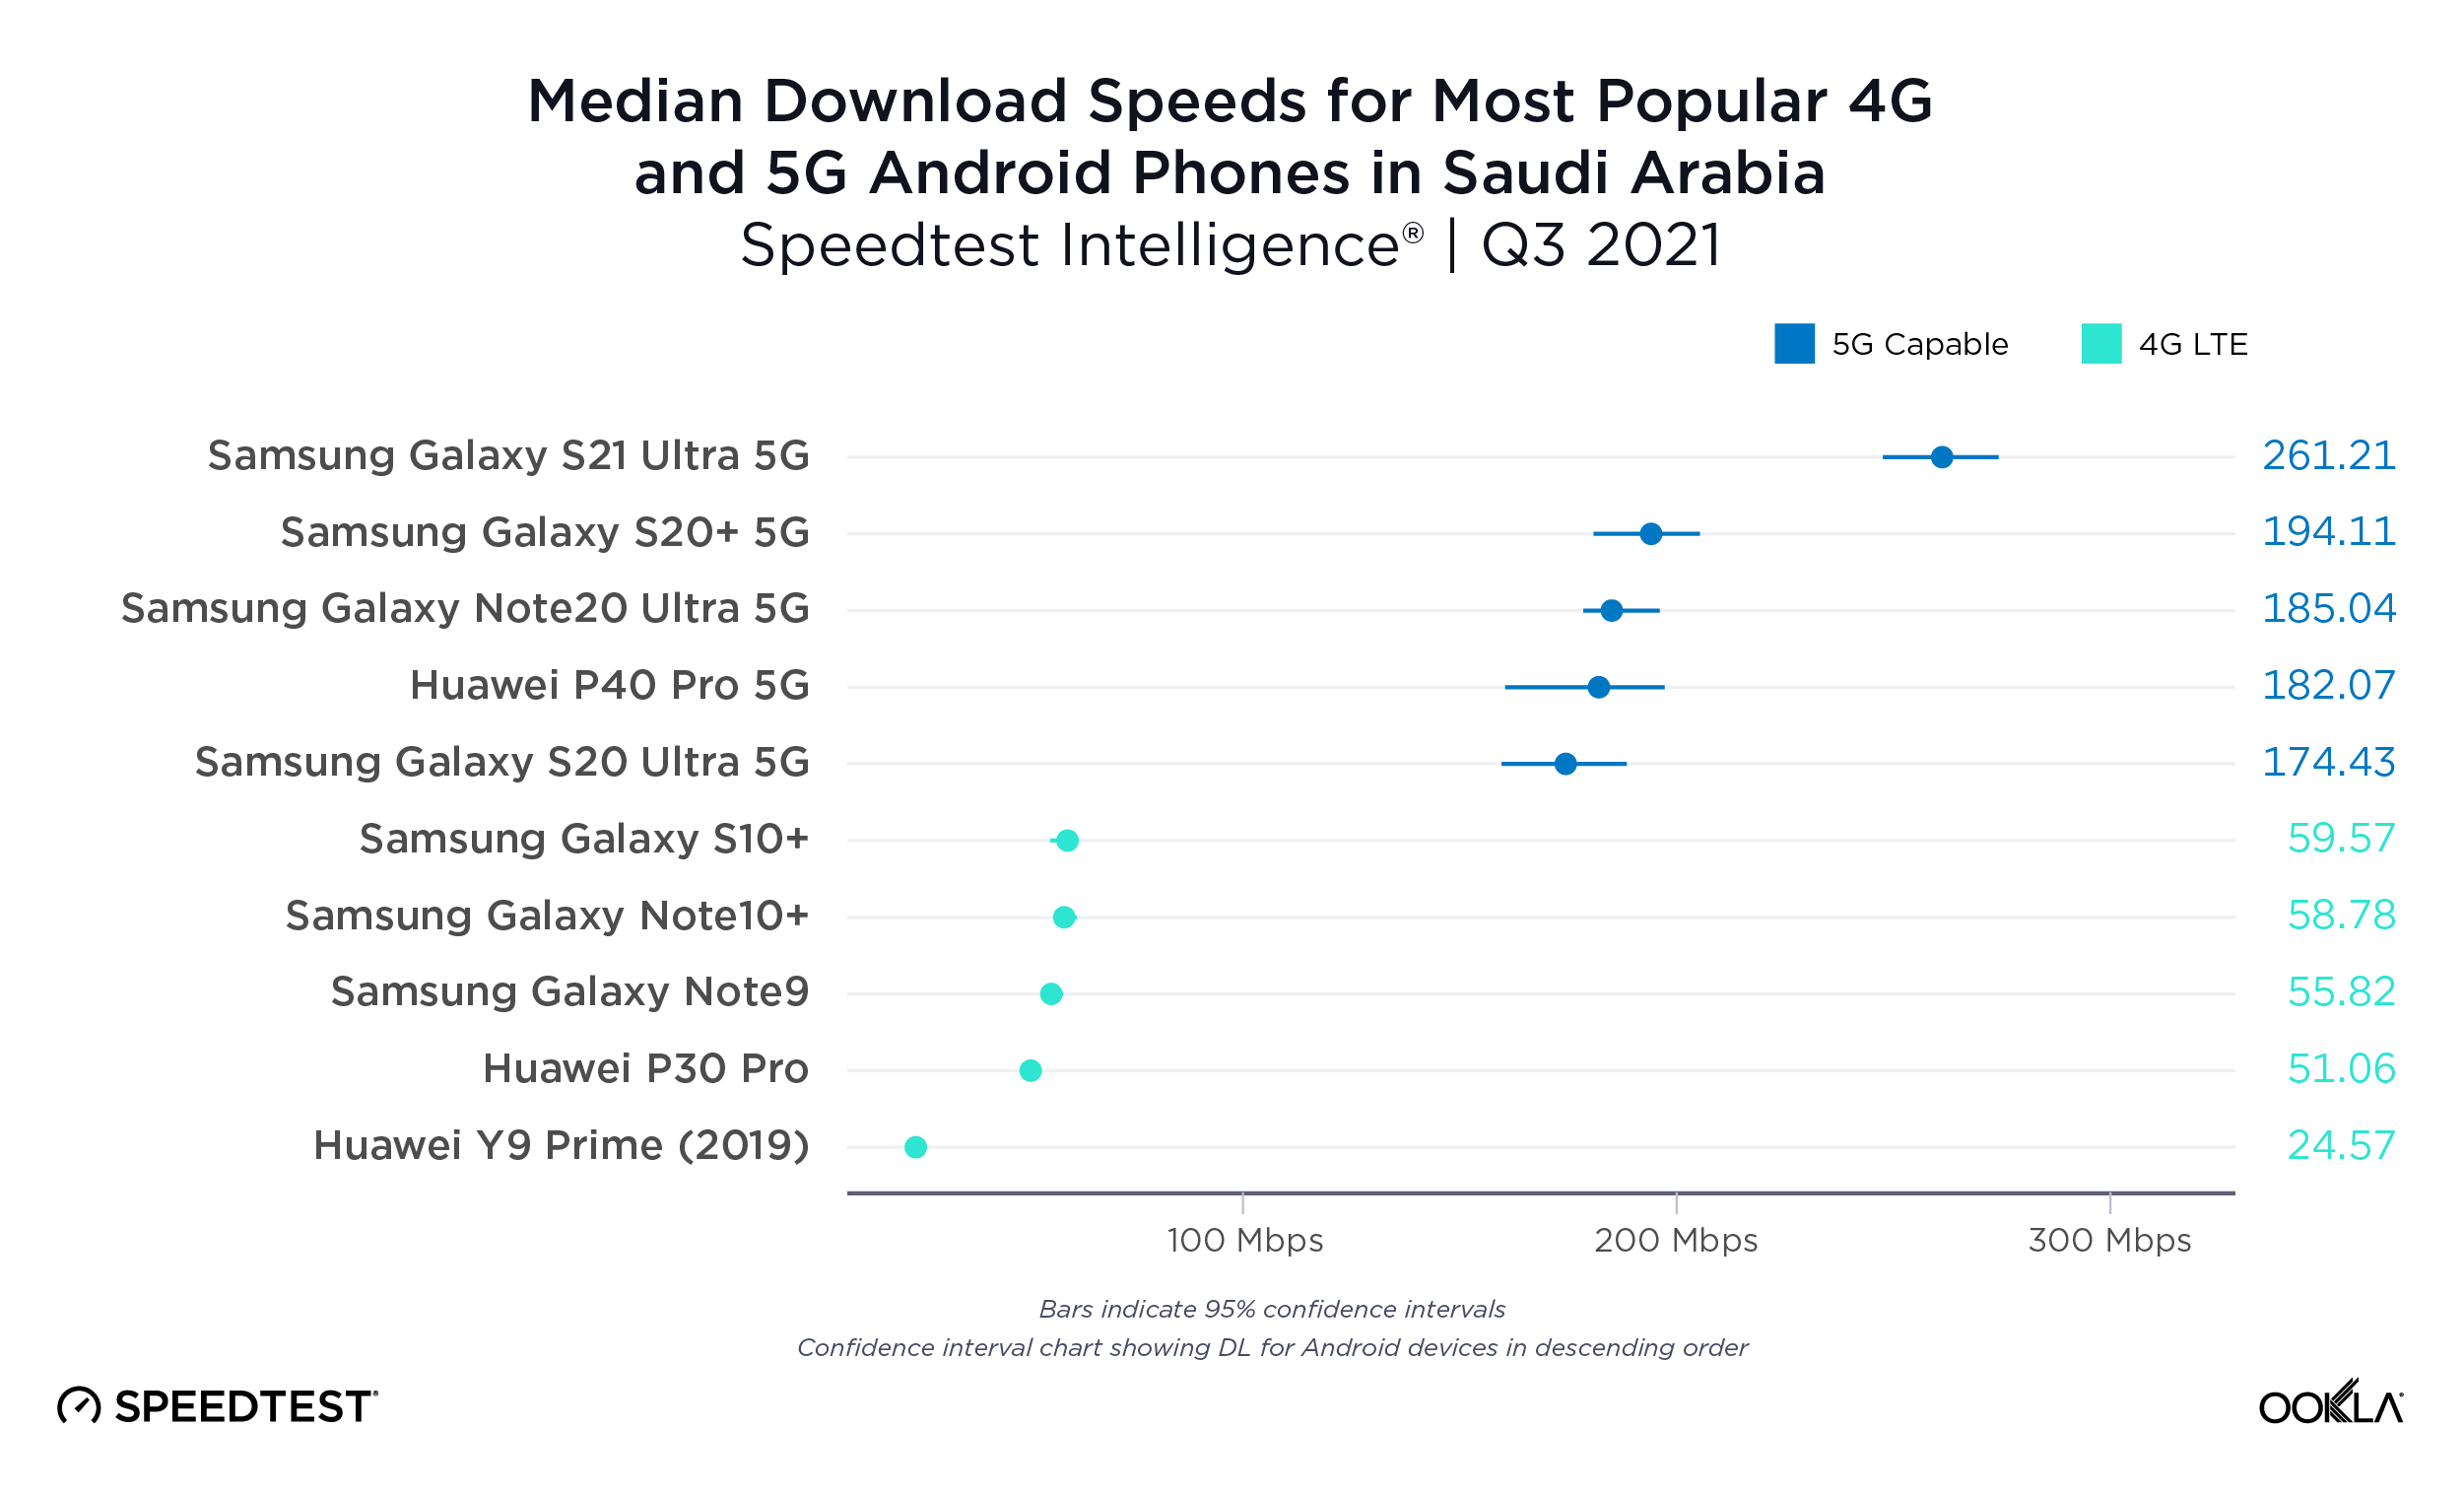
United Arab Emirates topped the list of countries with the fastest top 10% 5G download speed in Q3 2020. Top 10% (or 90th percentile) measures the speeds seen by the fastest 10% of users and is a way to gauge what each country’s networks are capable of. Saudi Arabia was second for top 10% 5G download speed, Norway third, Spain fourth and Japan fifth.
Fastest-Countries-Top-5G-Download-Speed_1220-2

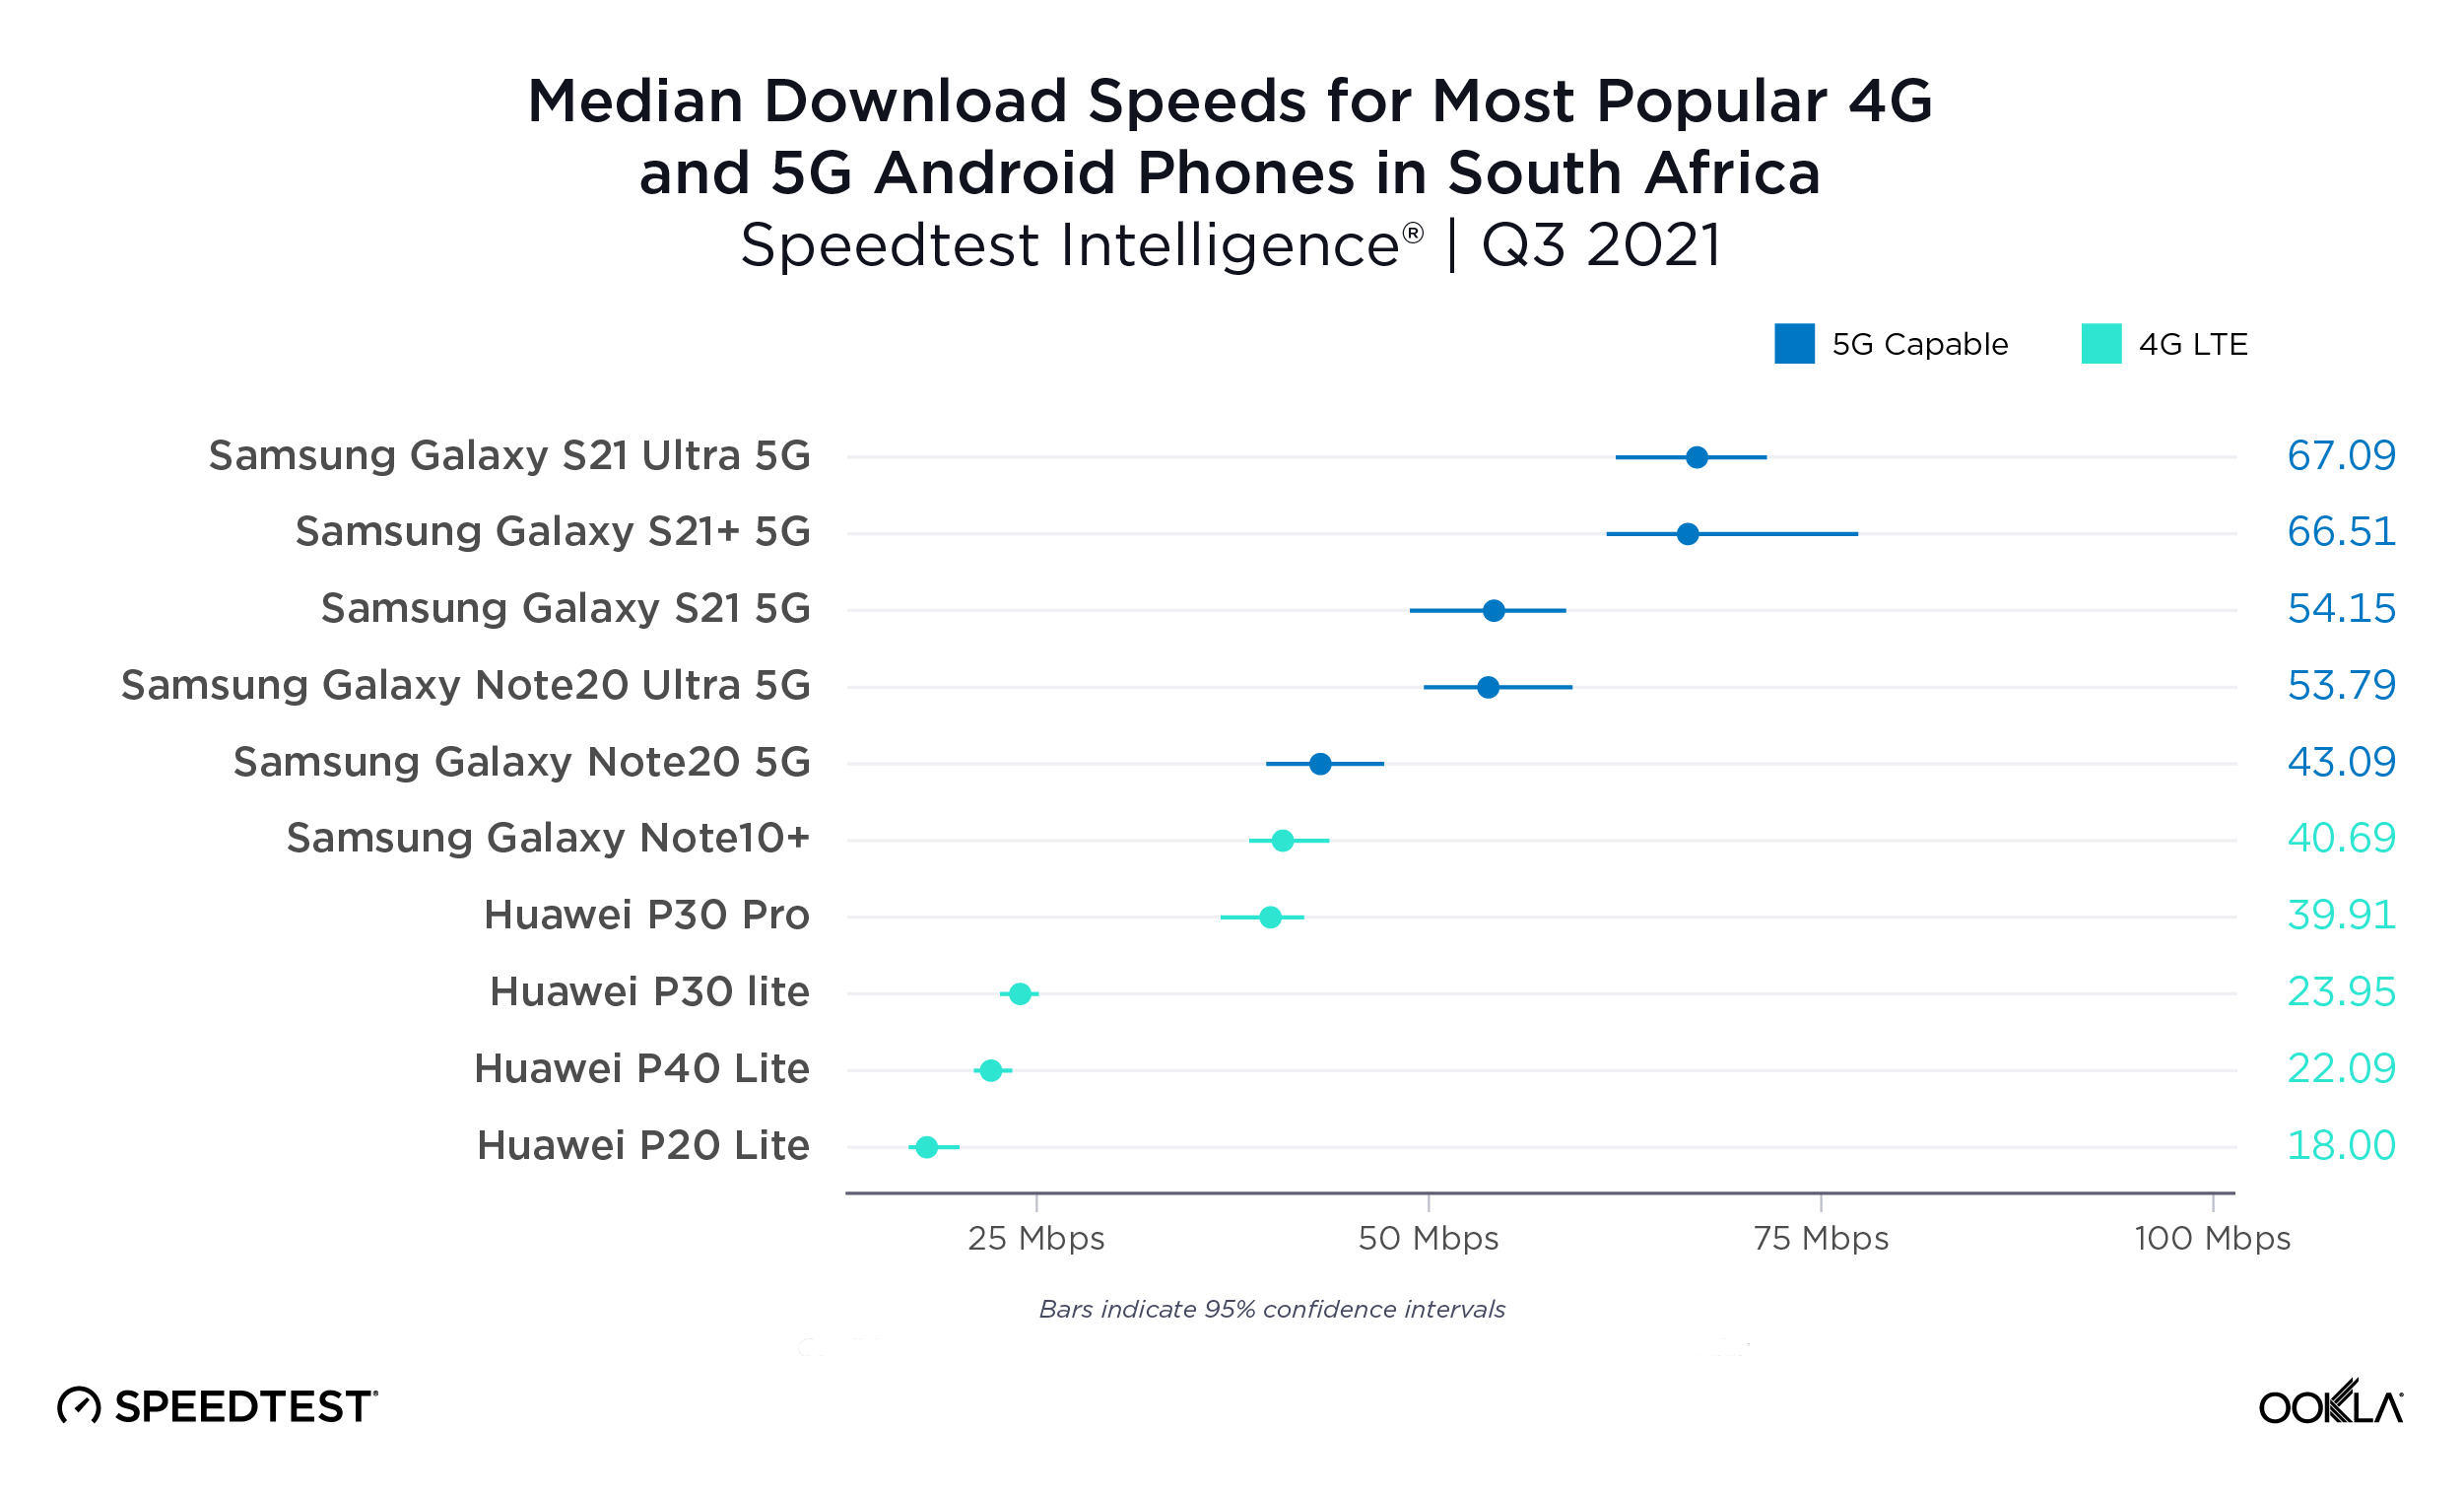
Another way to measure 5G performance is to look at median 5G download speed, which is a better predictor of the kind of performance most 5G customers can expect. Norway was the country with the fastest median download speed over 5G during Q3 2020. U.A.E. was second in this category, South Africa third, Saudi Arabia fourth and Spain fifth.
Fastest-Countries-Median-5G-Download-Speed_1220-2

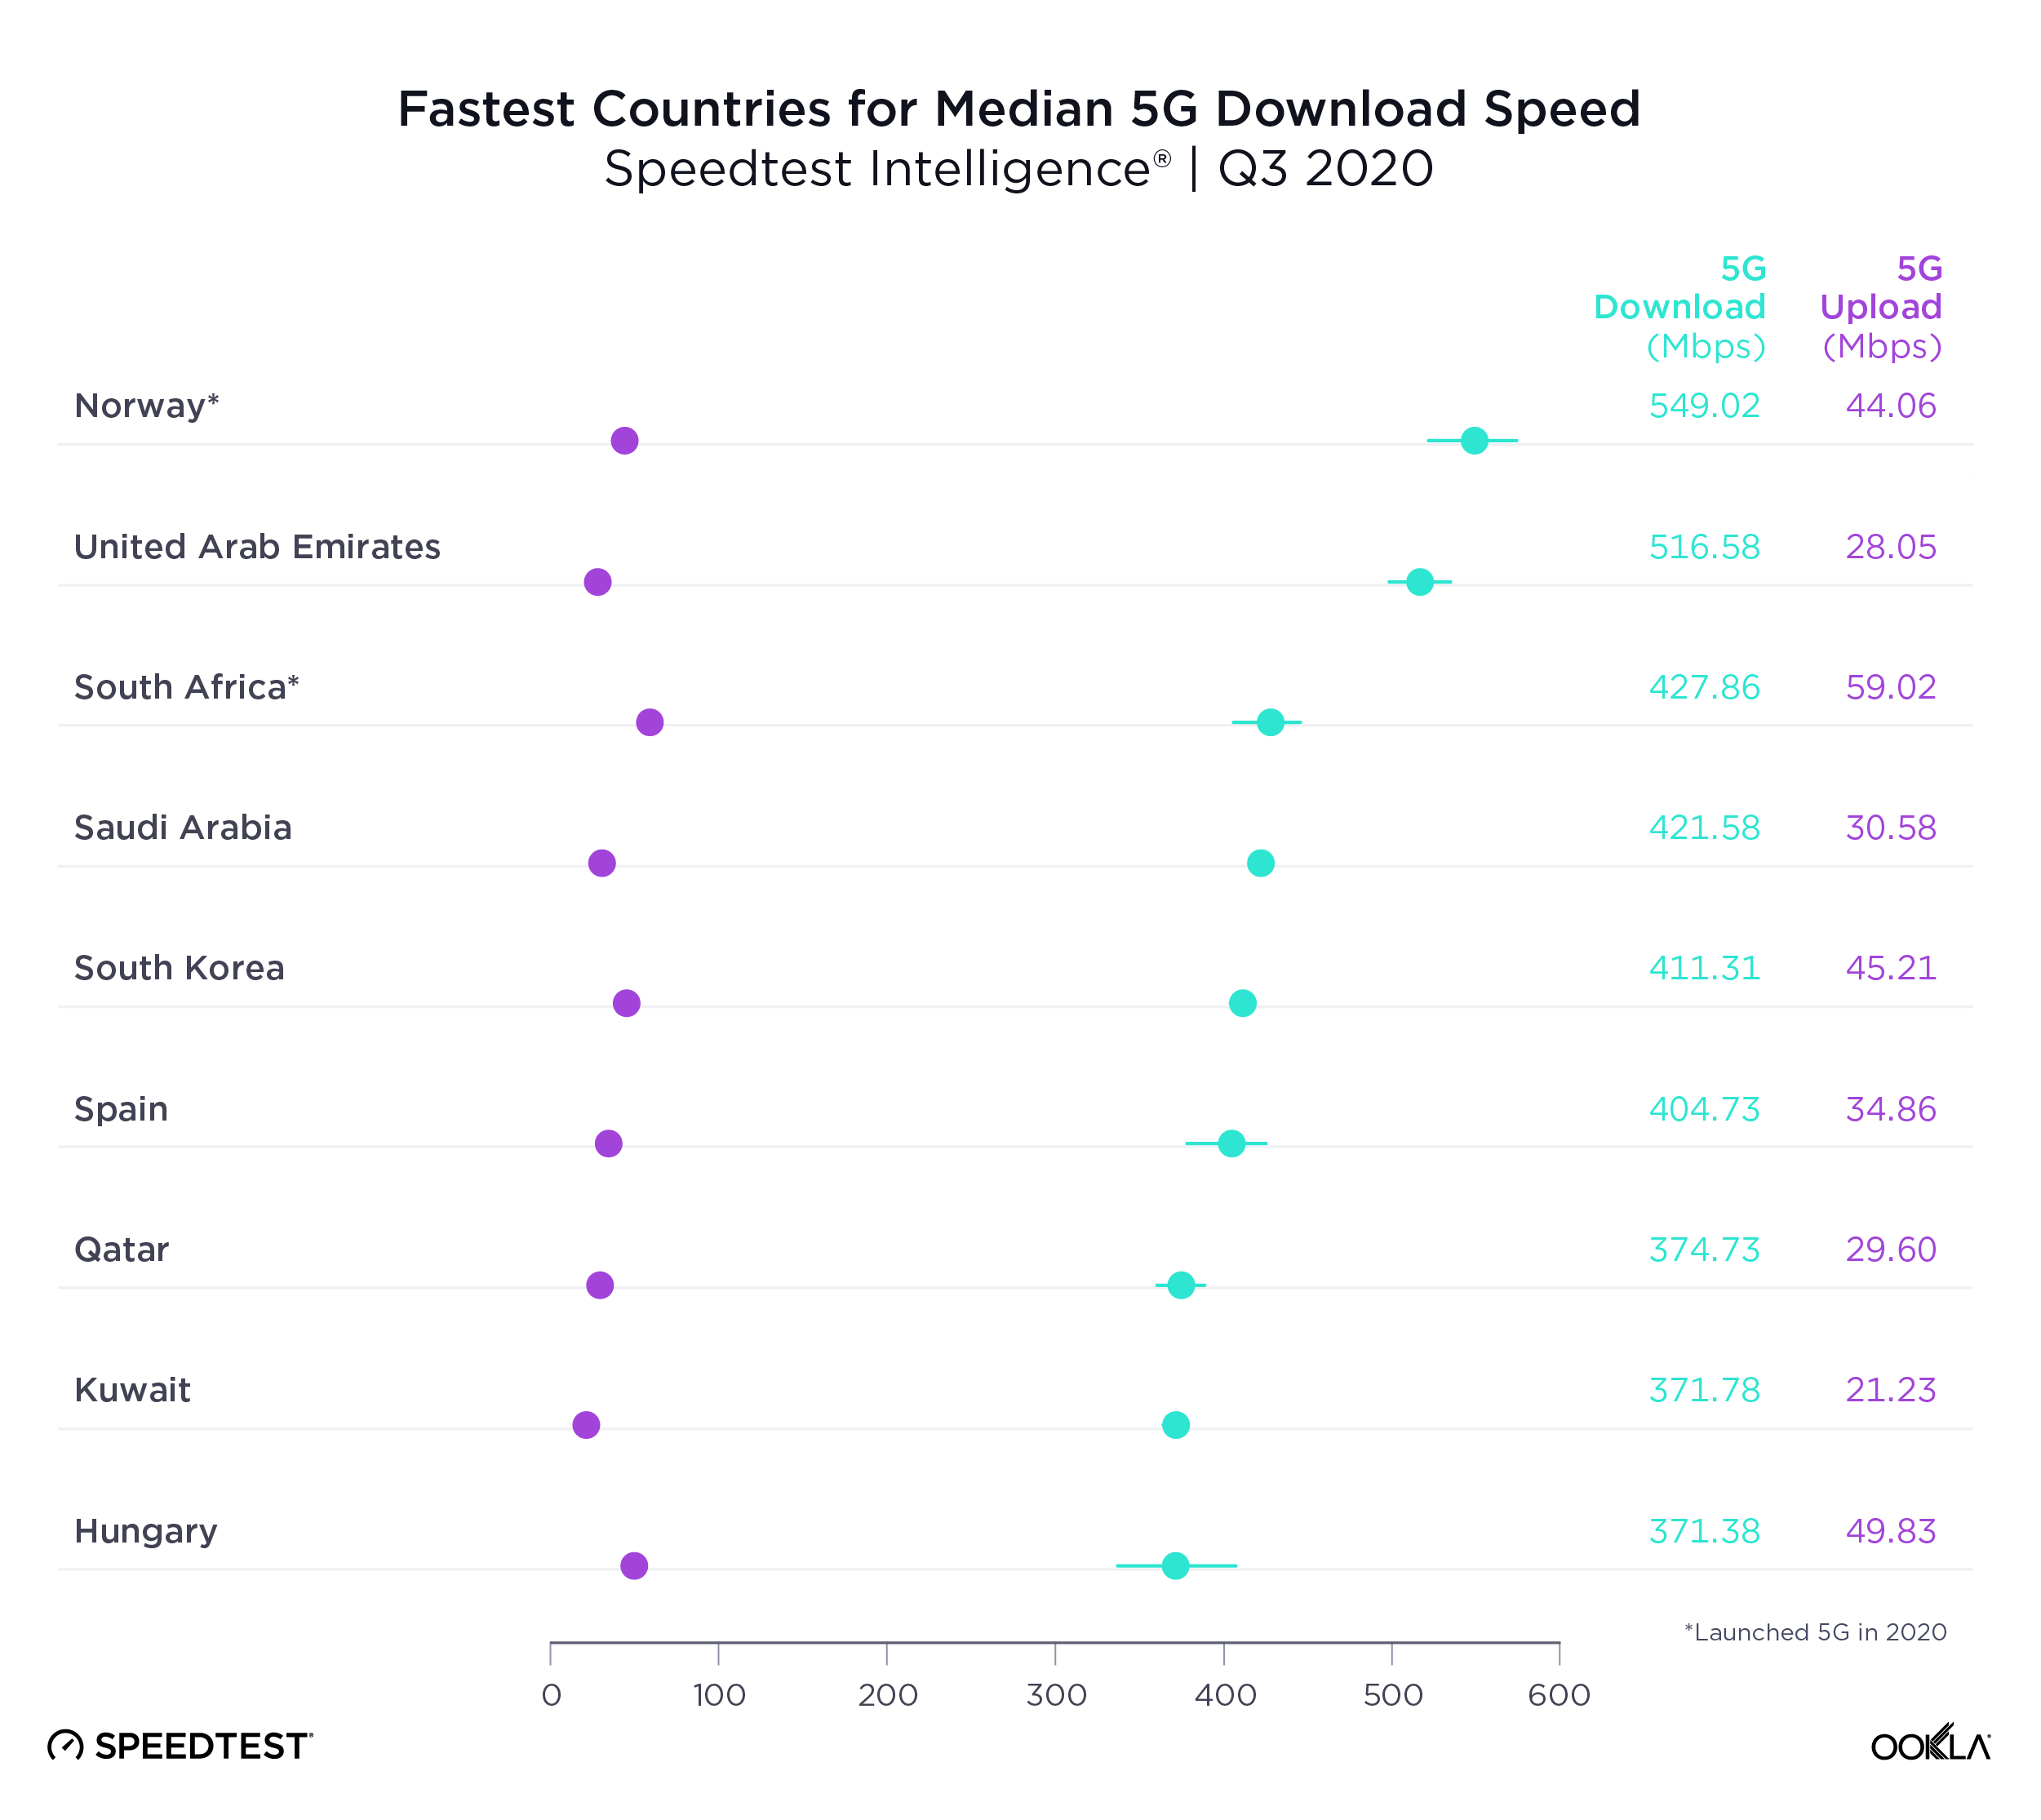
It’s notable that Japan was on the list of 10 countries with the fastest top 10% 5G download speed but not on the list of 10 countries with the fastest median download speed over 5G. No matter how fast a country’s mobile infrastructure is, many other factors go into median 5G speeds, including device adoption and spectrum allocation.

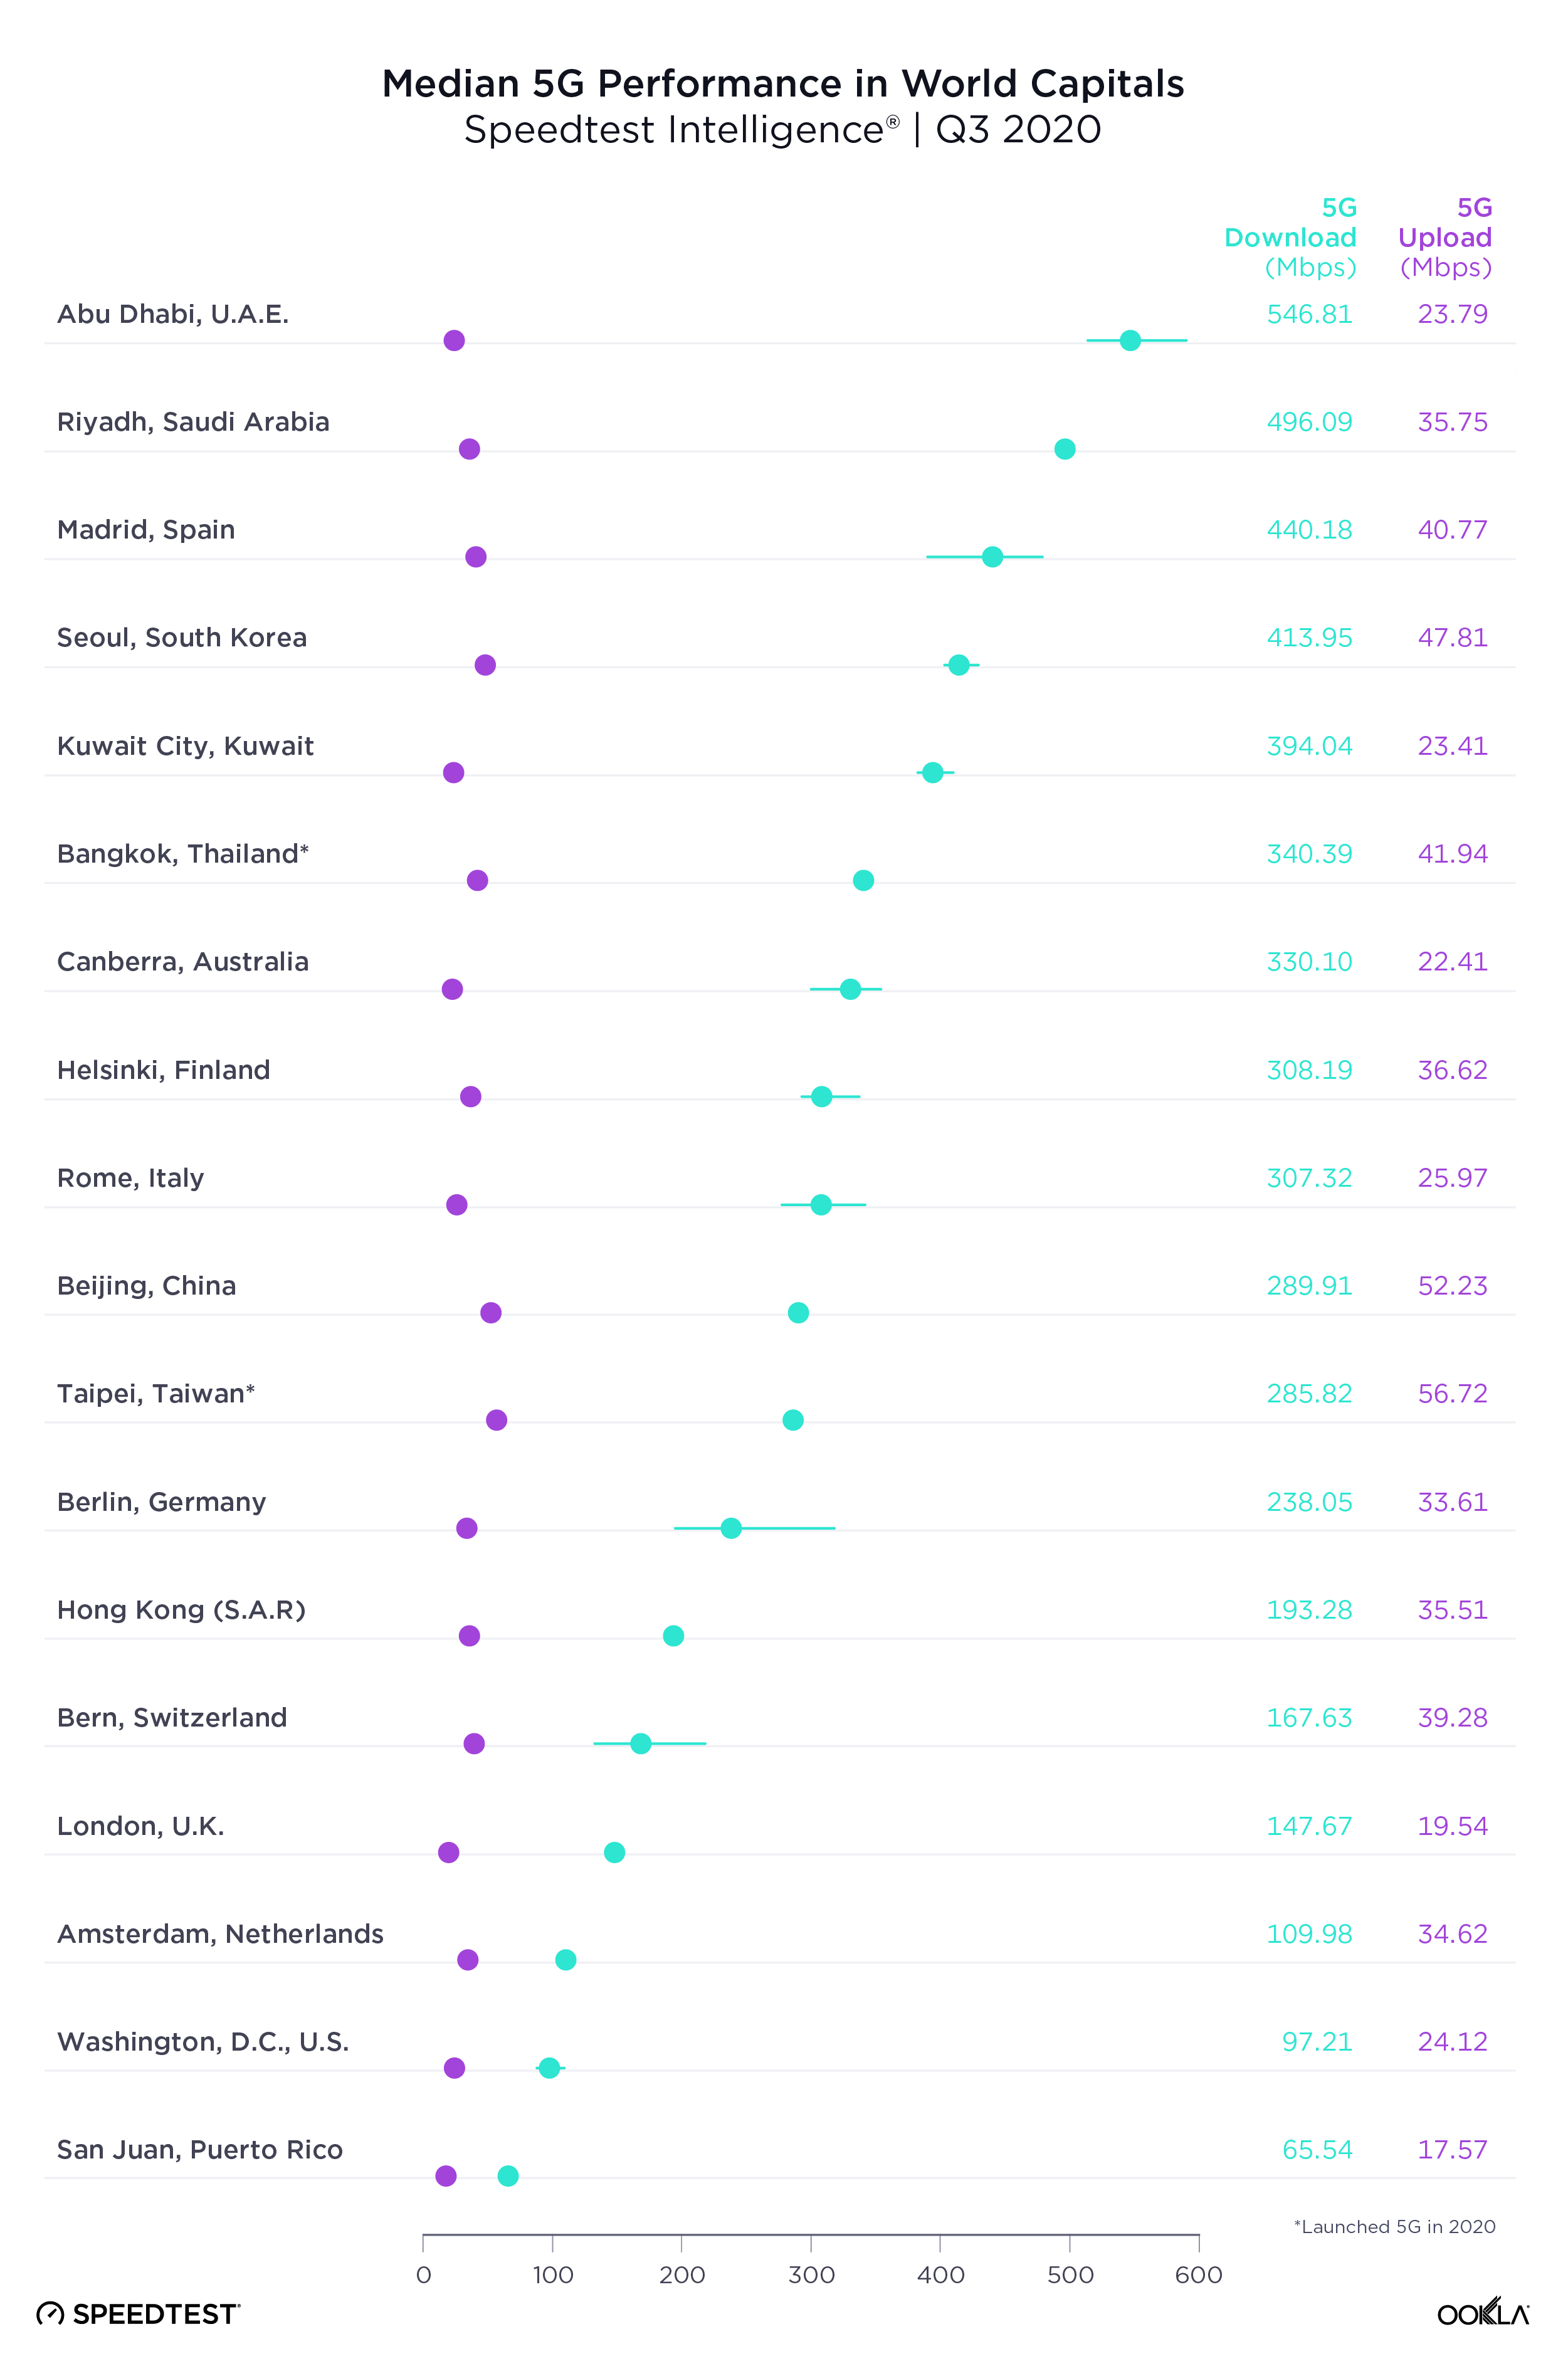
Abu Dhabi tops list of 5G speeds in world capitals

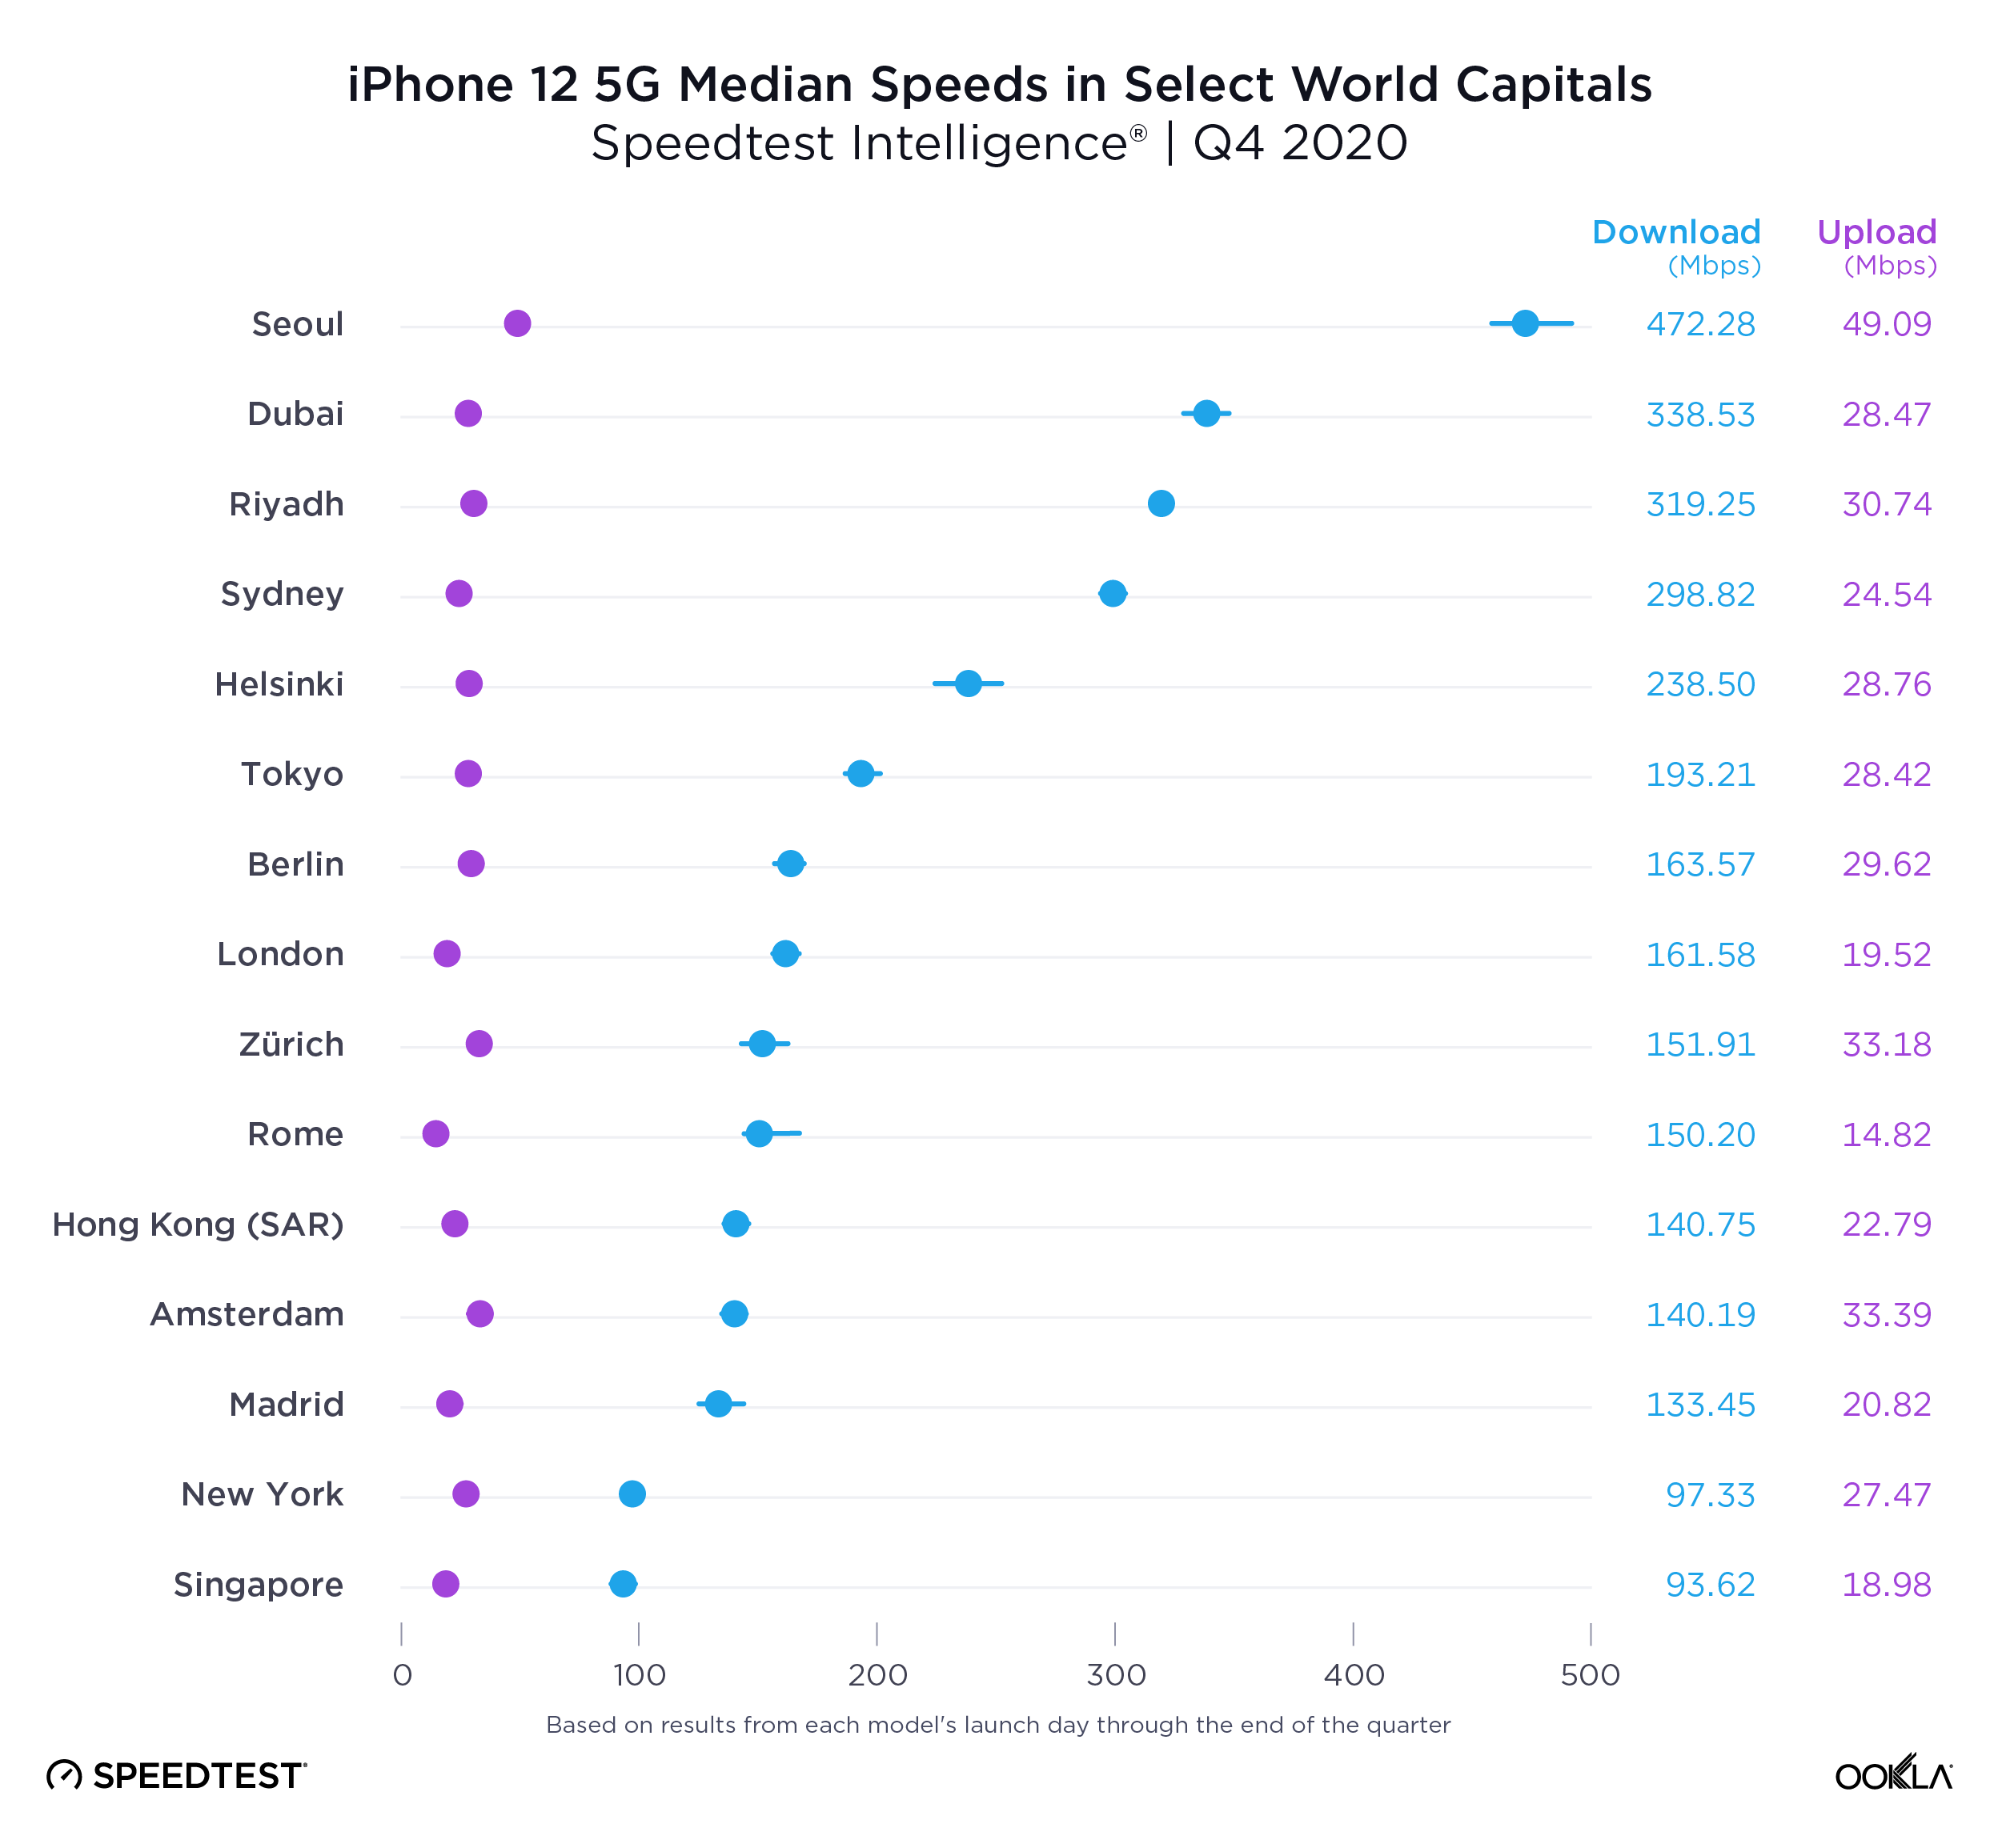
Our examination of 5G performance for 18 world capital cities with 5G during Q3 2020 found that Abu Dhabi had the fastest median download speed over 5G at 546.81 Mbps. Riyadh was second, Madrid third, Seoul fourth and Kuwait City fifth. As we saw at the country level, median upload speed was much lower than download speed.
Median-5G-Performance-Capitals_1220-2

How 5G performance and time spent compare within regions

We looked more closely at 5G performance across several intergovernmental organizations and trade blocs to get a better sense of how countries are performing in comparison to their neighbors and trade partners. We also calculated Time Spent on 5G, the proportion of time that users with 5G-capable devices spent on 5G, for each country.

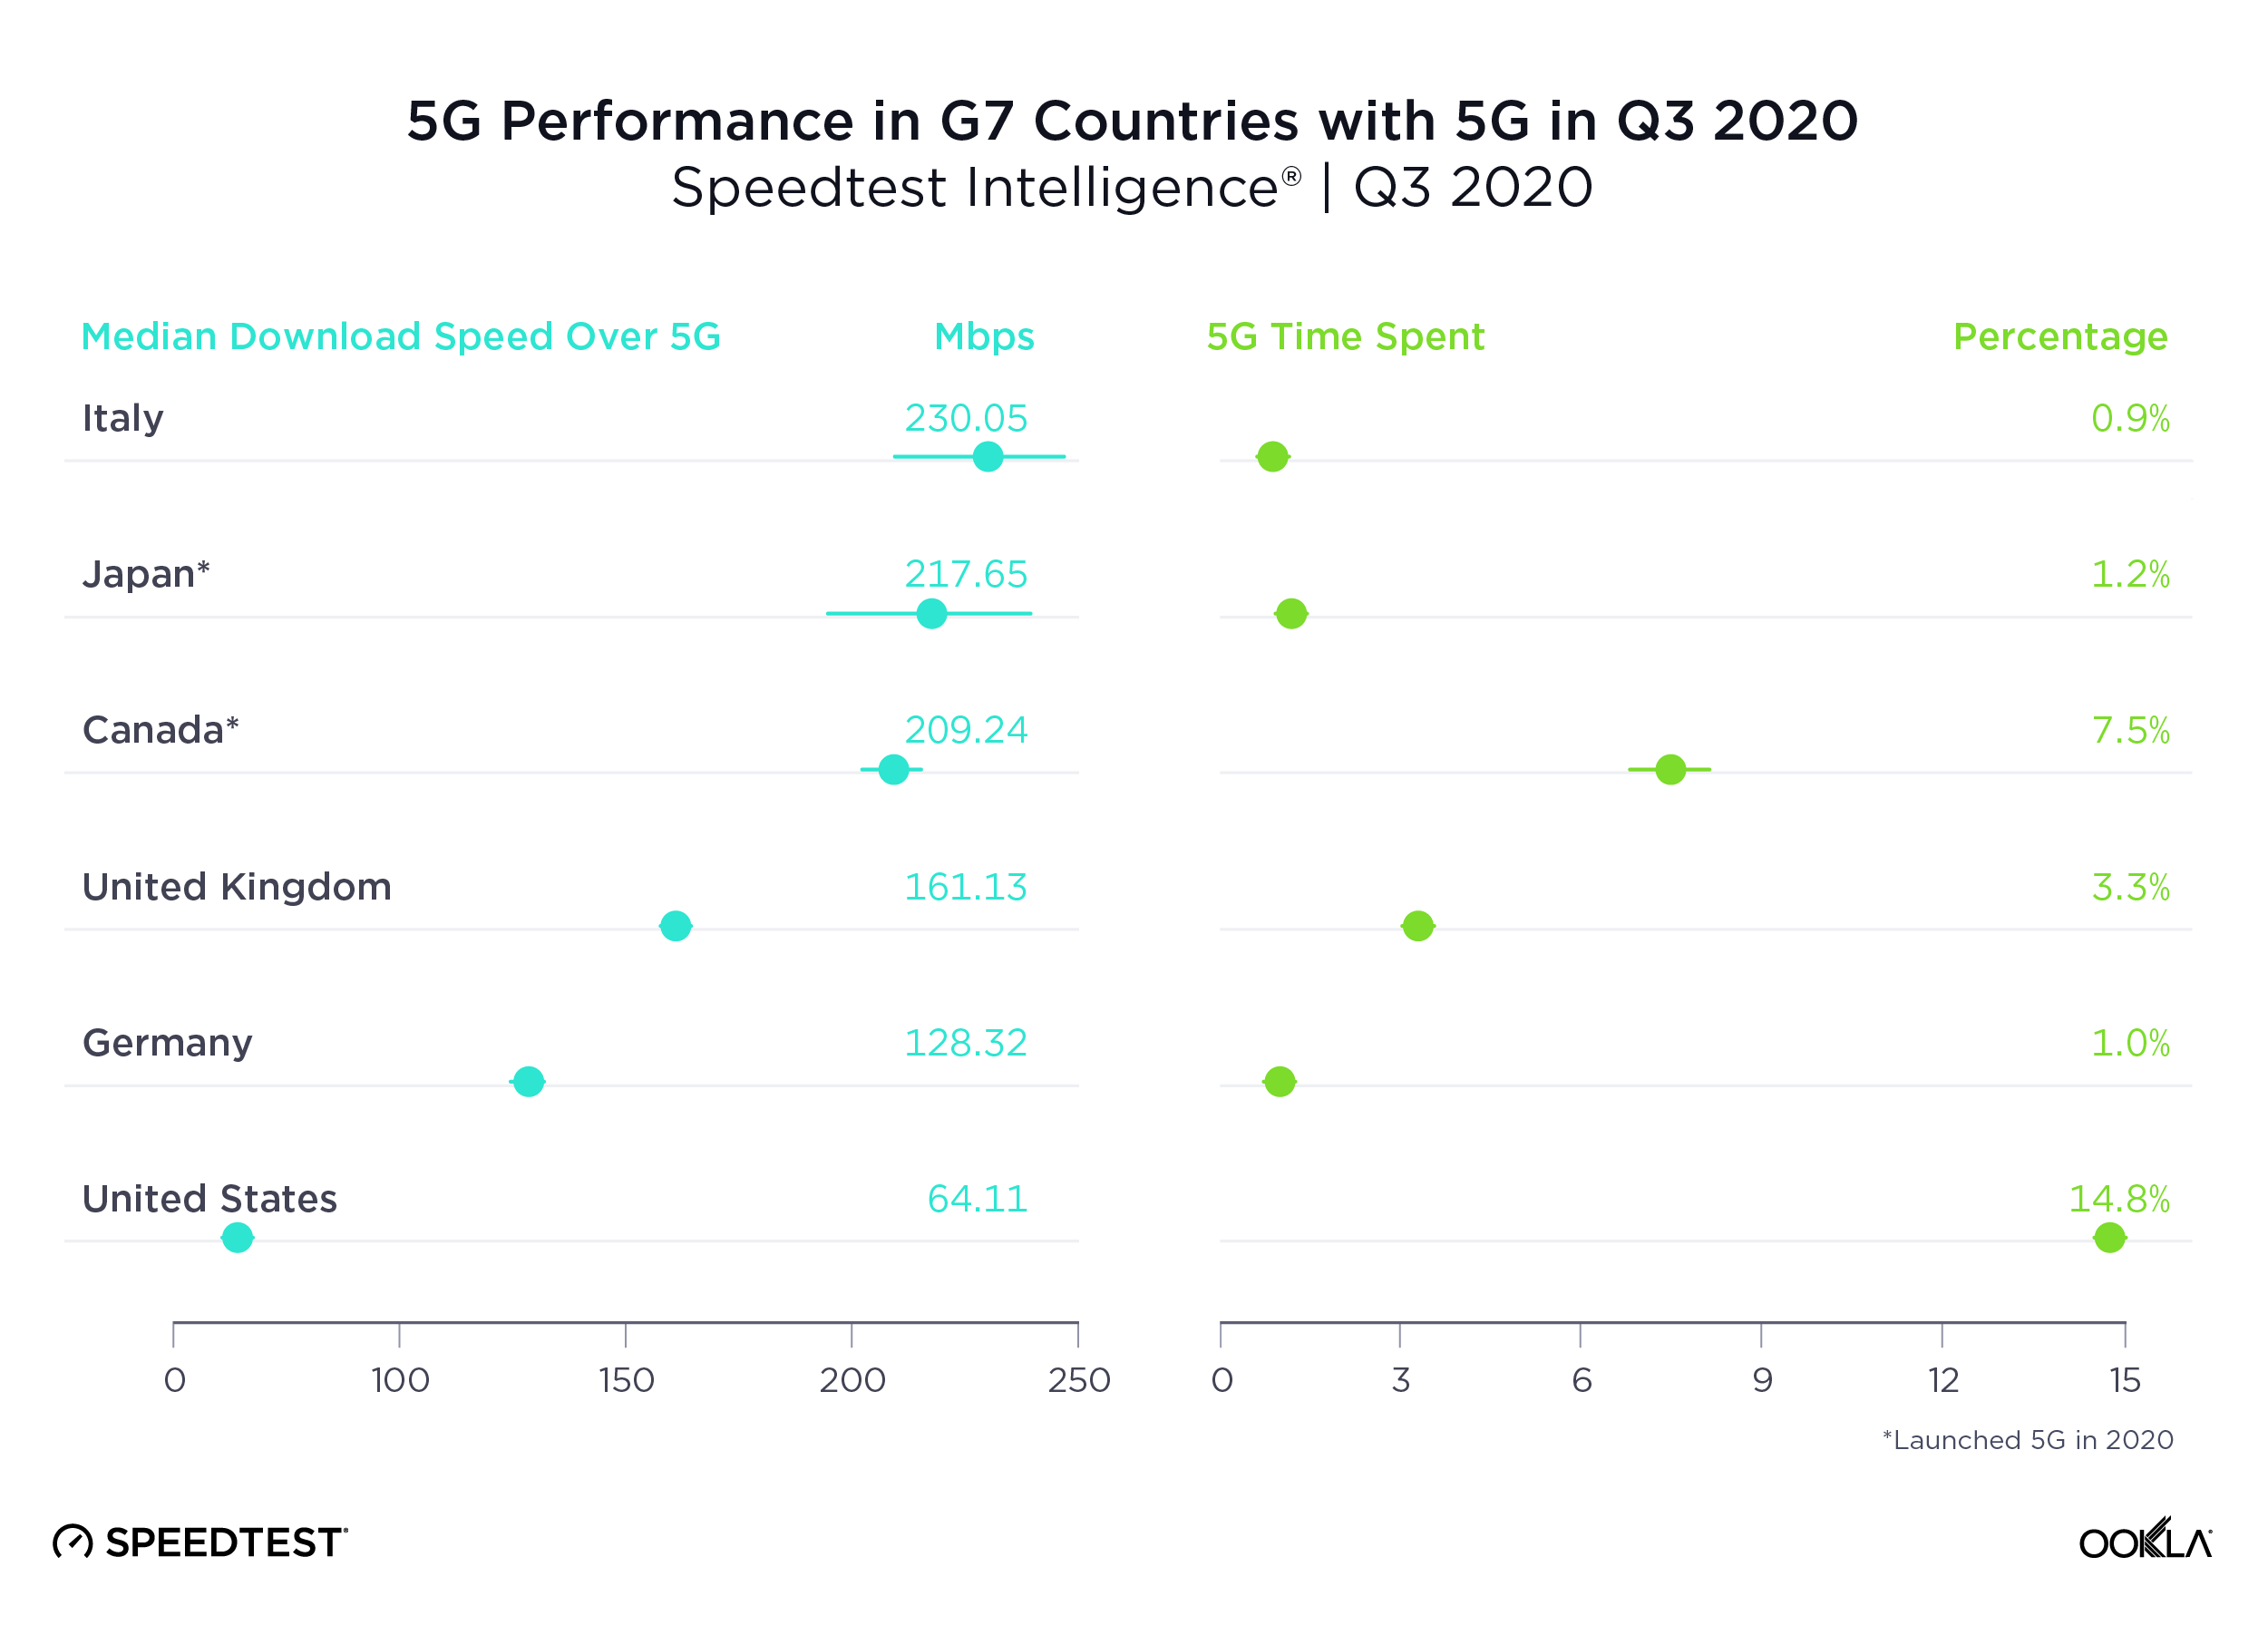
Italy had the fastest 5G among G7 countries, U.S. the slowest

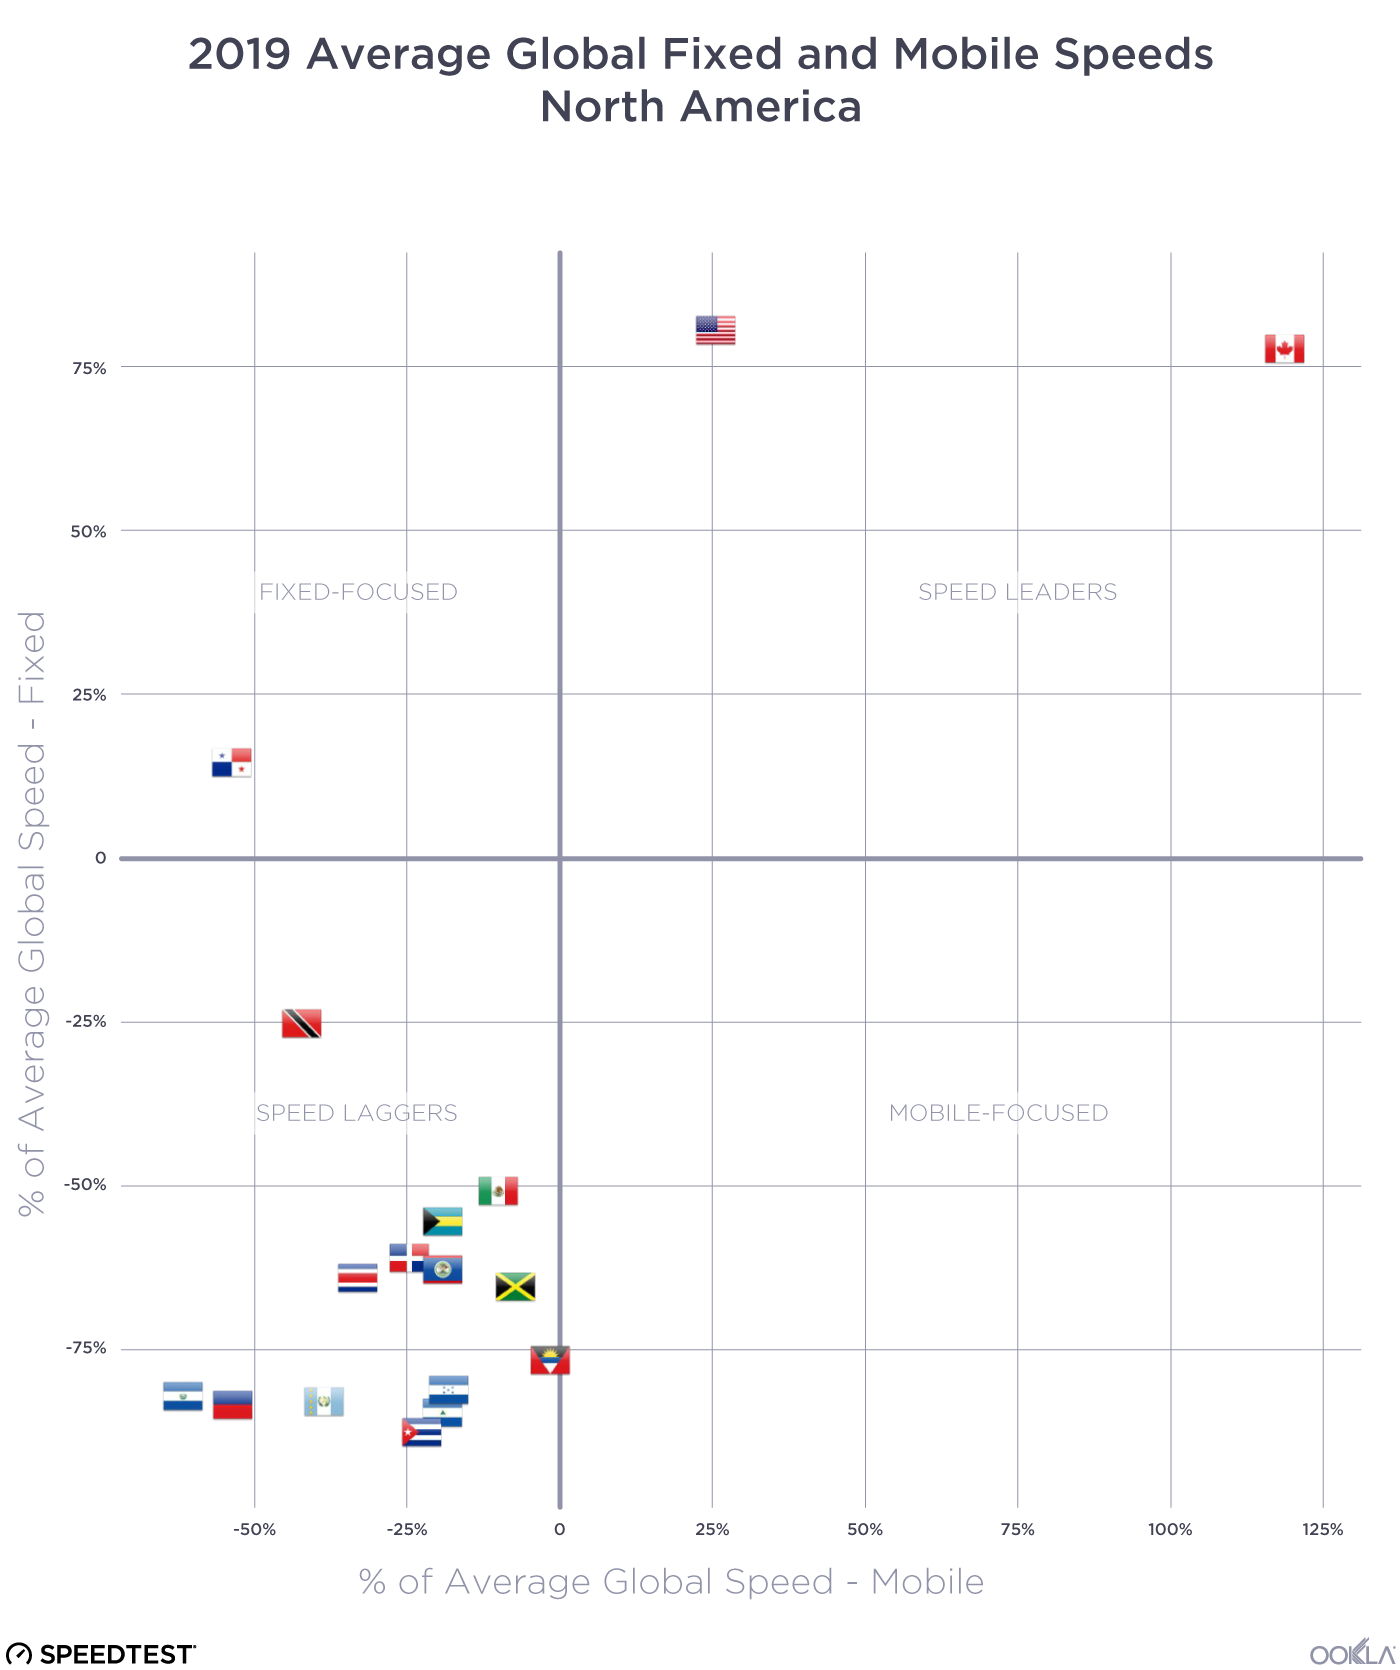
Italy had the fastest median download speed over 5G of all the G7 countries. Japan was second, Canada third, the U.K. fourth and Germany fifth. The U.S. had the highest Time Spent on 5G, followed by Canada. For a deeper analysis of 5G in the U.K., read our previous coverage. Because France launched commercially available 5G only within the last couple of weeks, we have not included it on this table.
5G-Performance-G7-Countries_1220

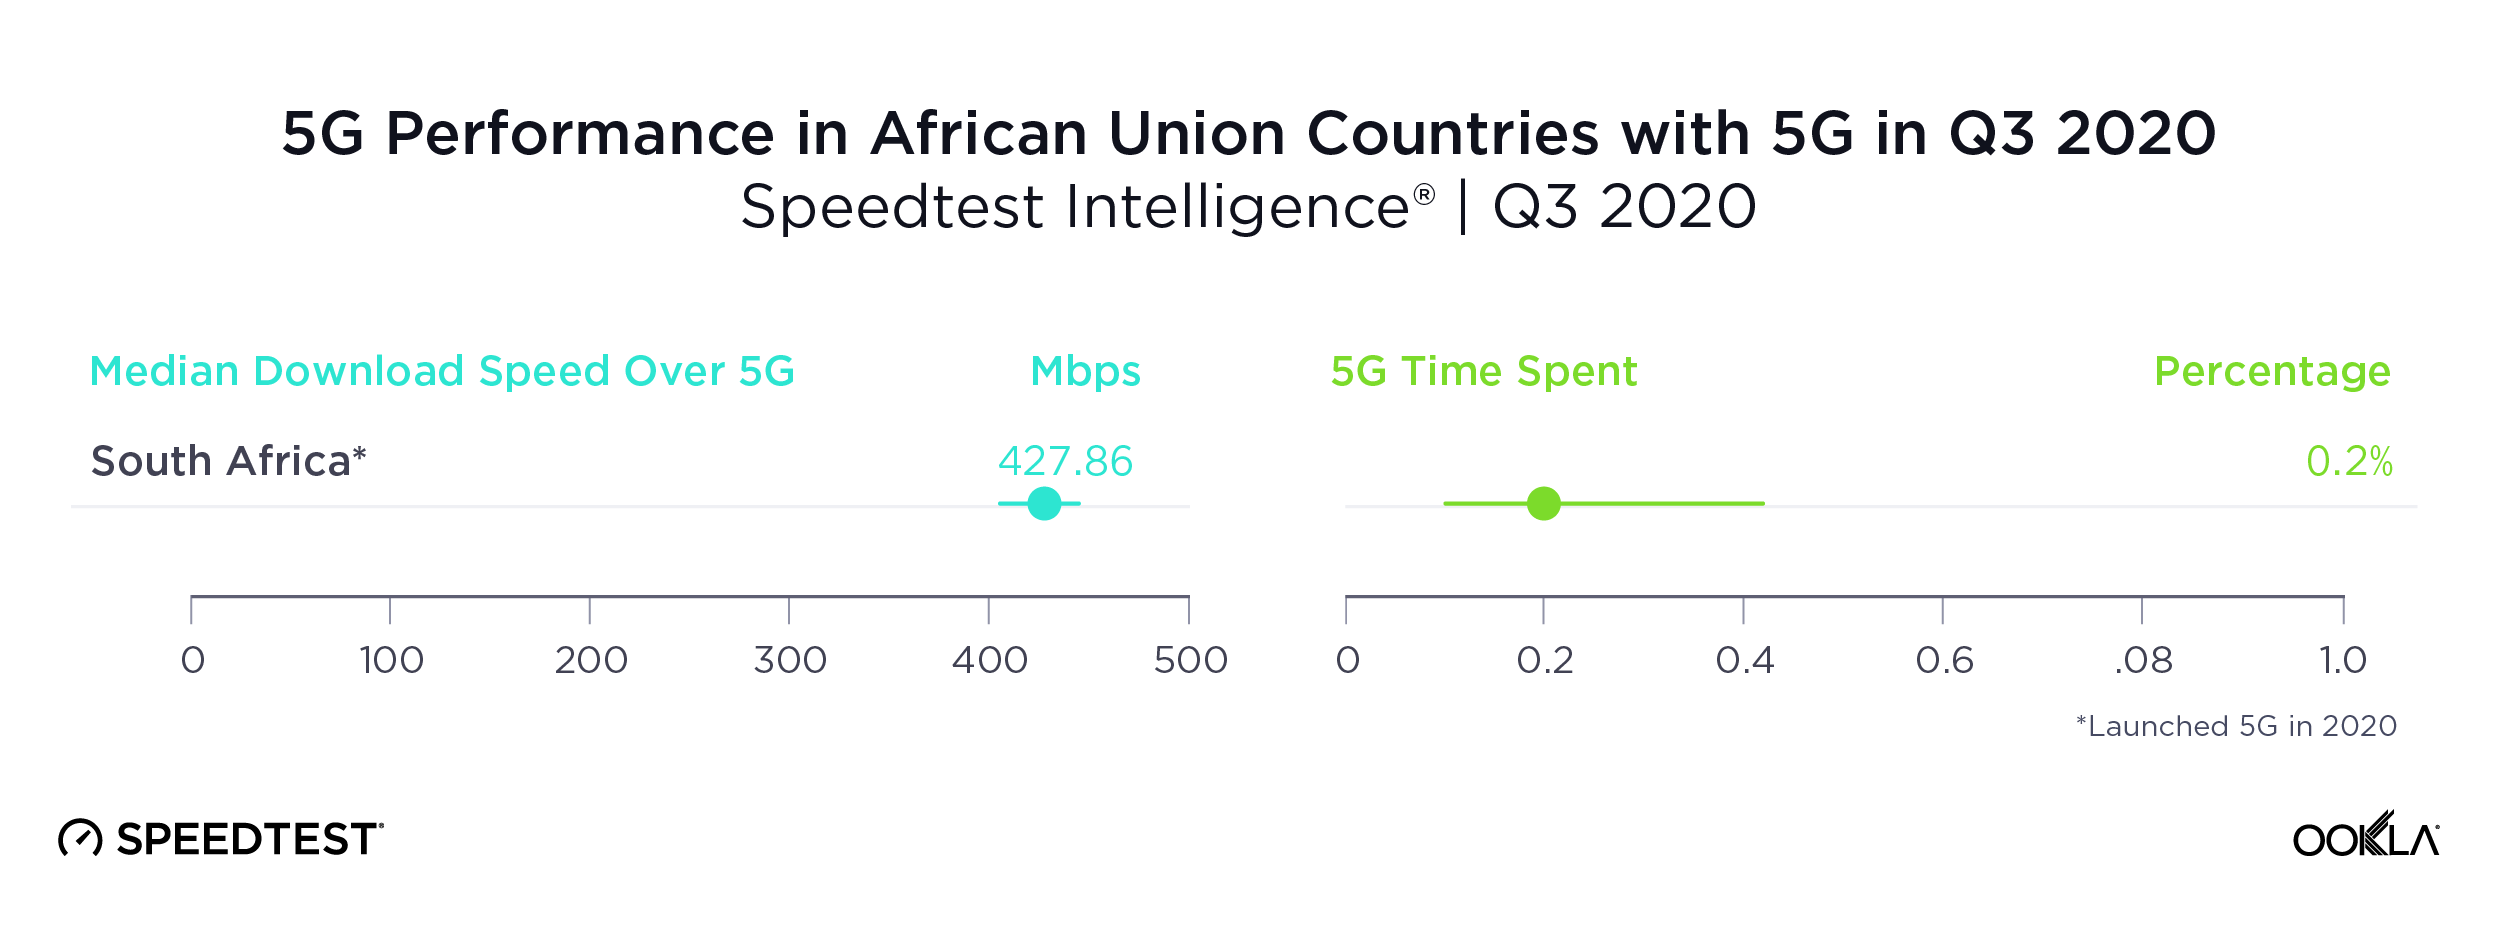
South Africa was the only country in the African Union with sufficient 5G to rate

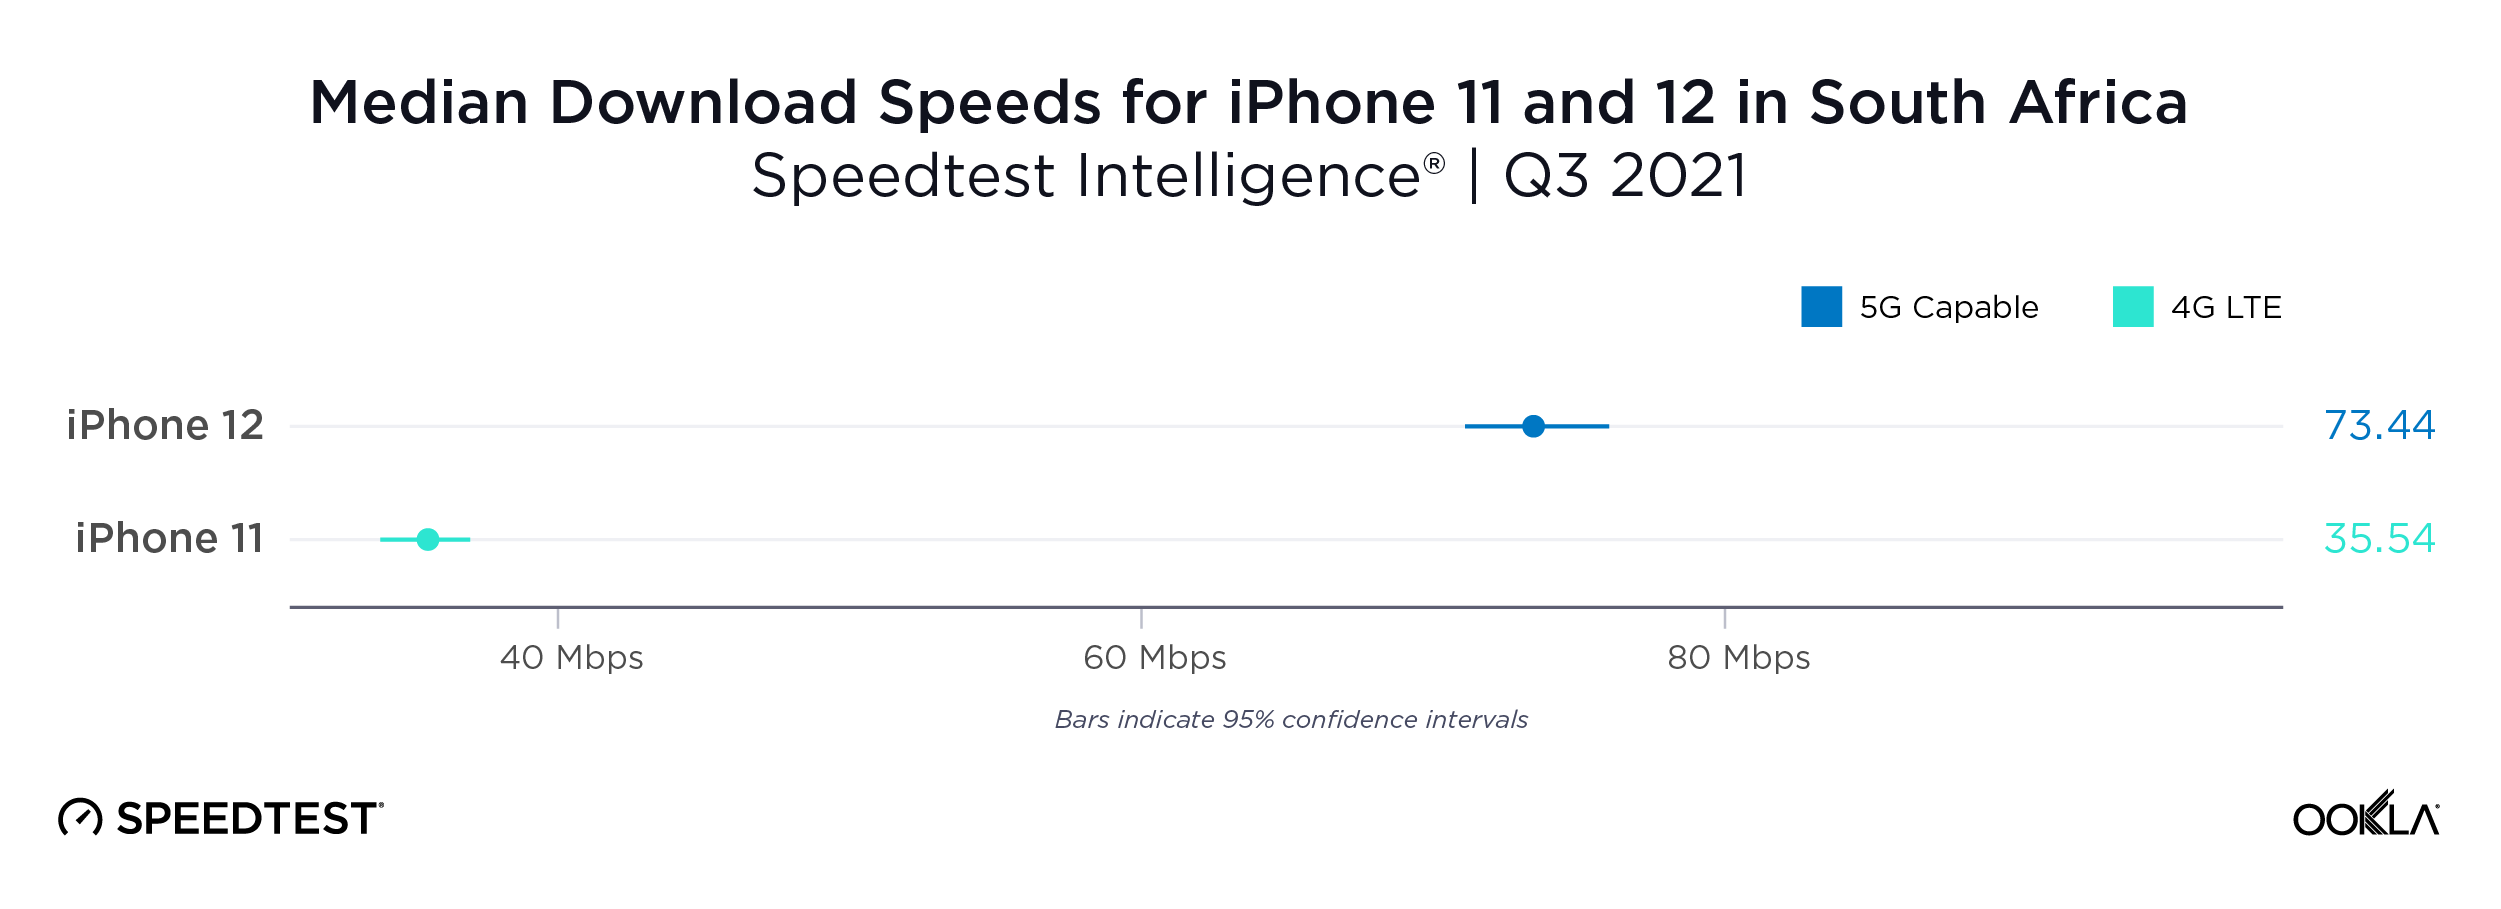
As we saw above, South Africa’s impressive median download speed over 5G ranked the country third in the world during Q3 2020. South Africa was only one of two countries in the African Union to have commercially available 5G during Q3 2020. The other, Madagascar, did not have sufficient samples to properly analyze. Time Spent on 5G in South Africa was very low, an indication that 5G is not yet widely available there.
5G-Performance-Africa_1220

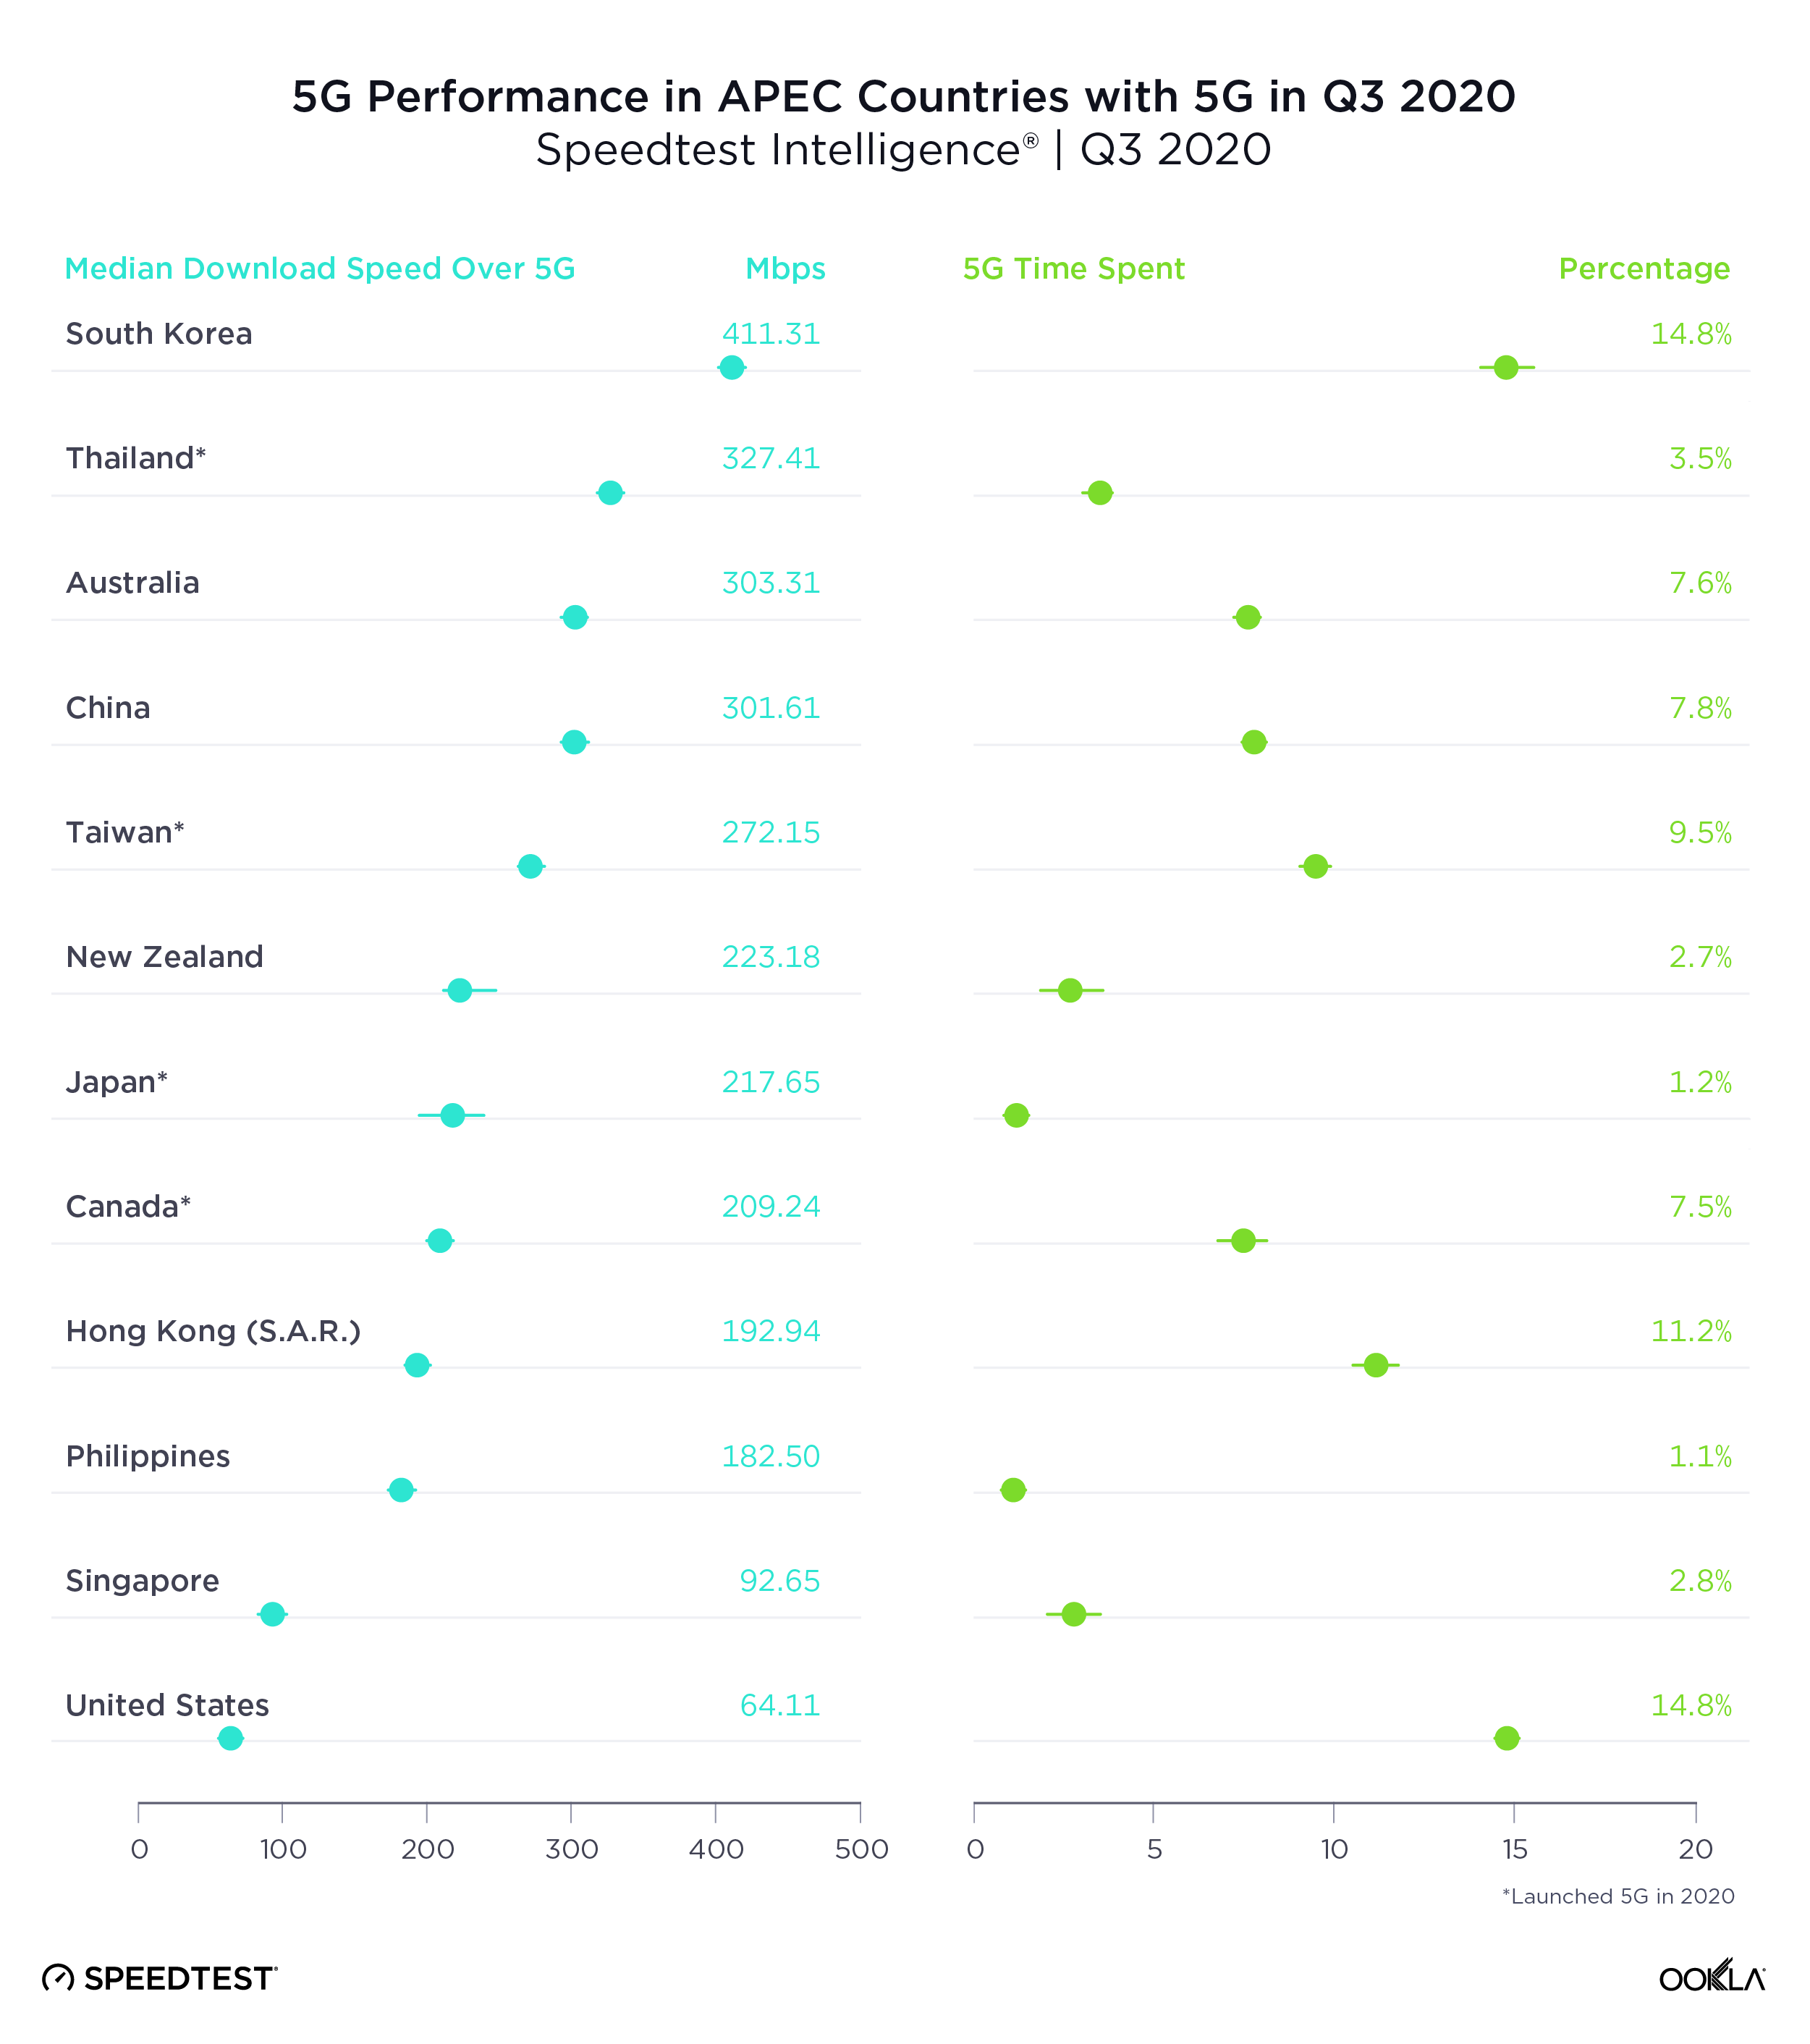
South Korea had the fastest 5G in APEC countries, U.S. the slowest

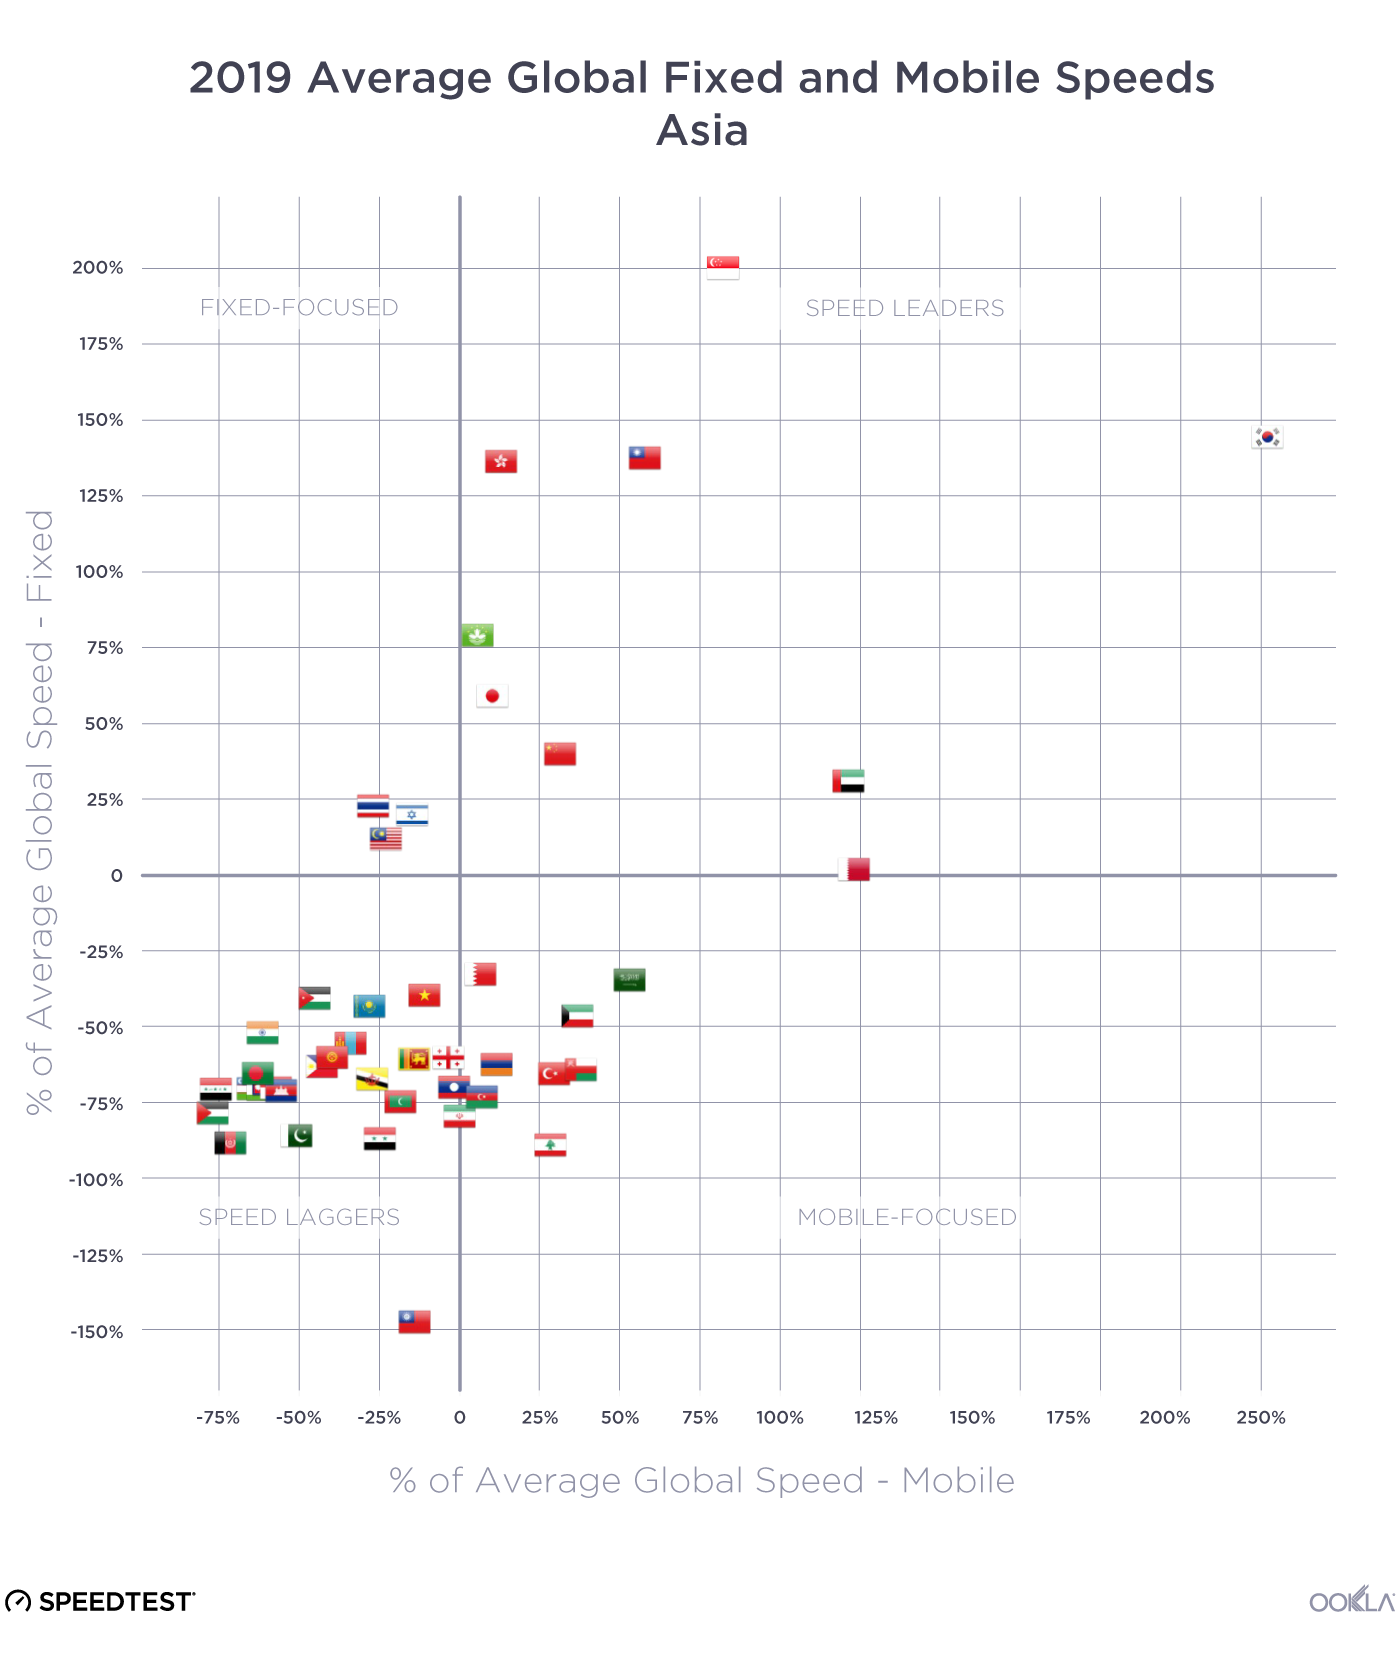
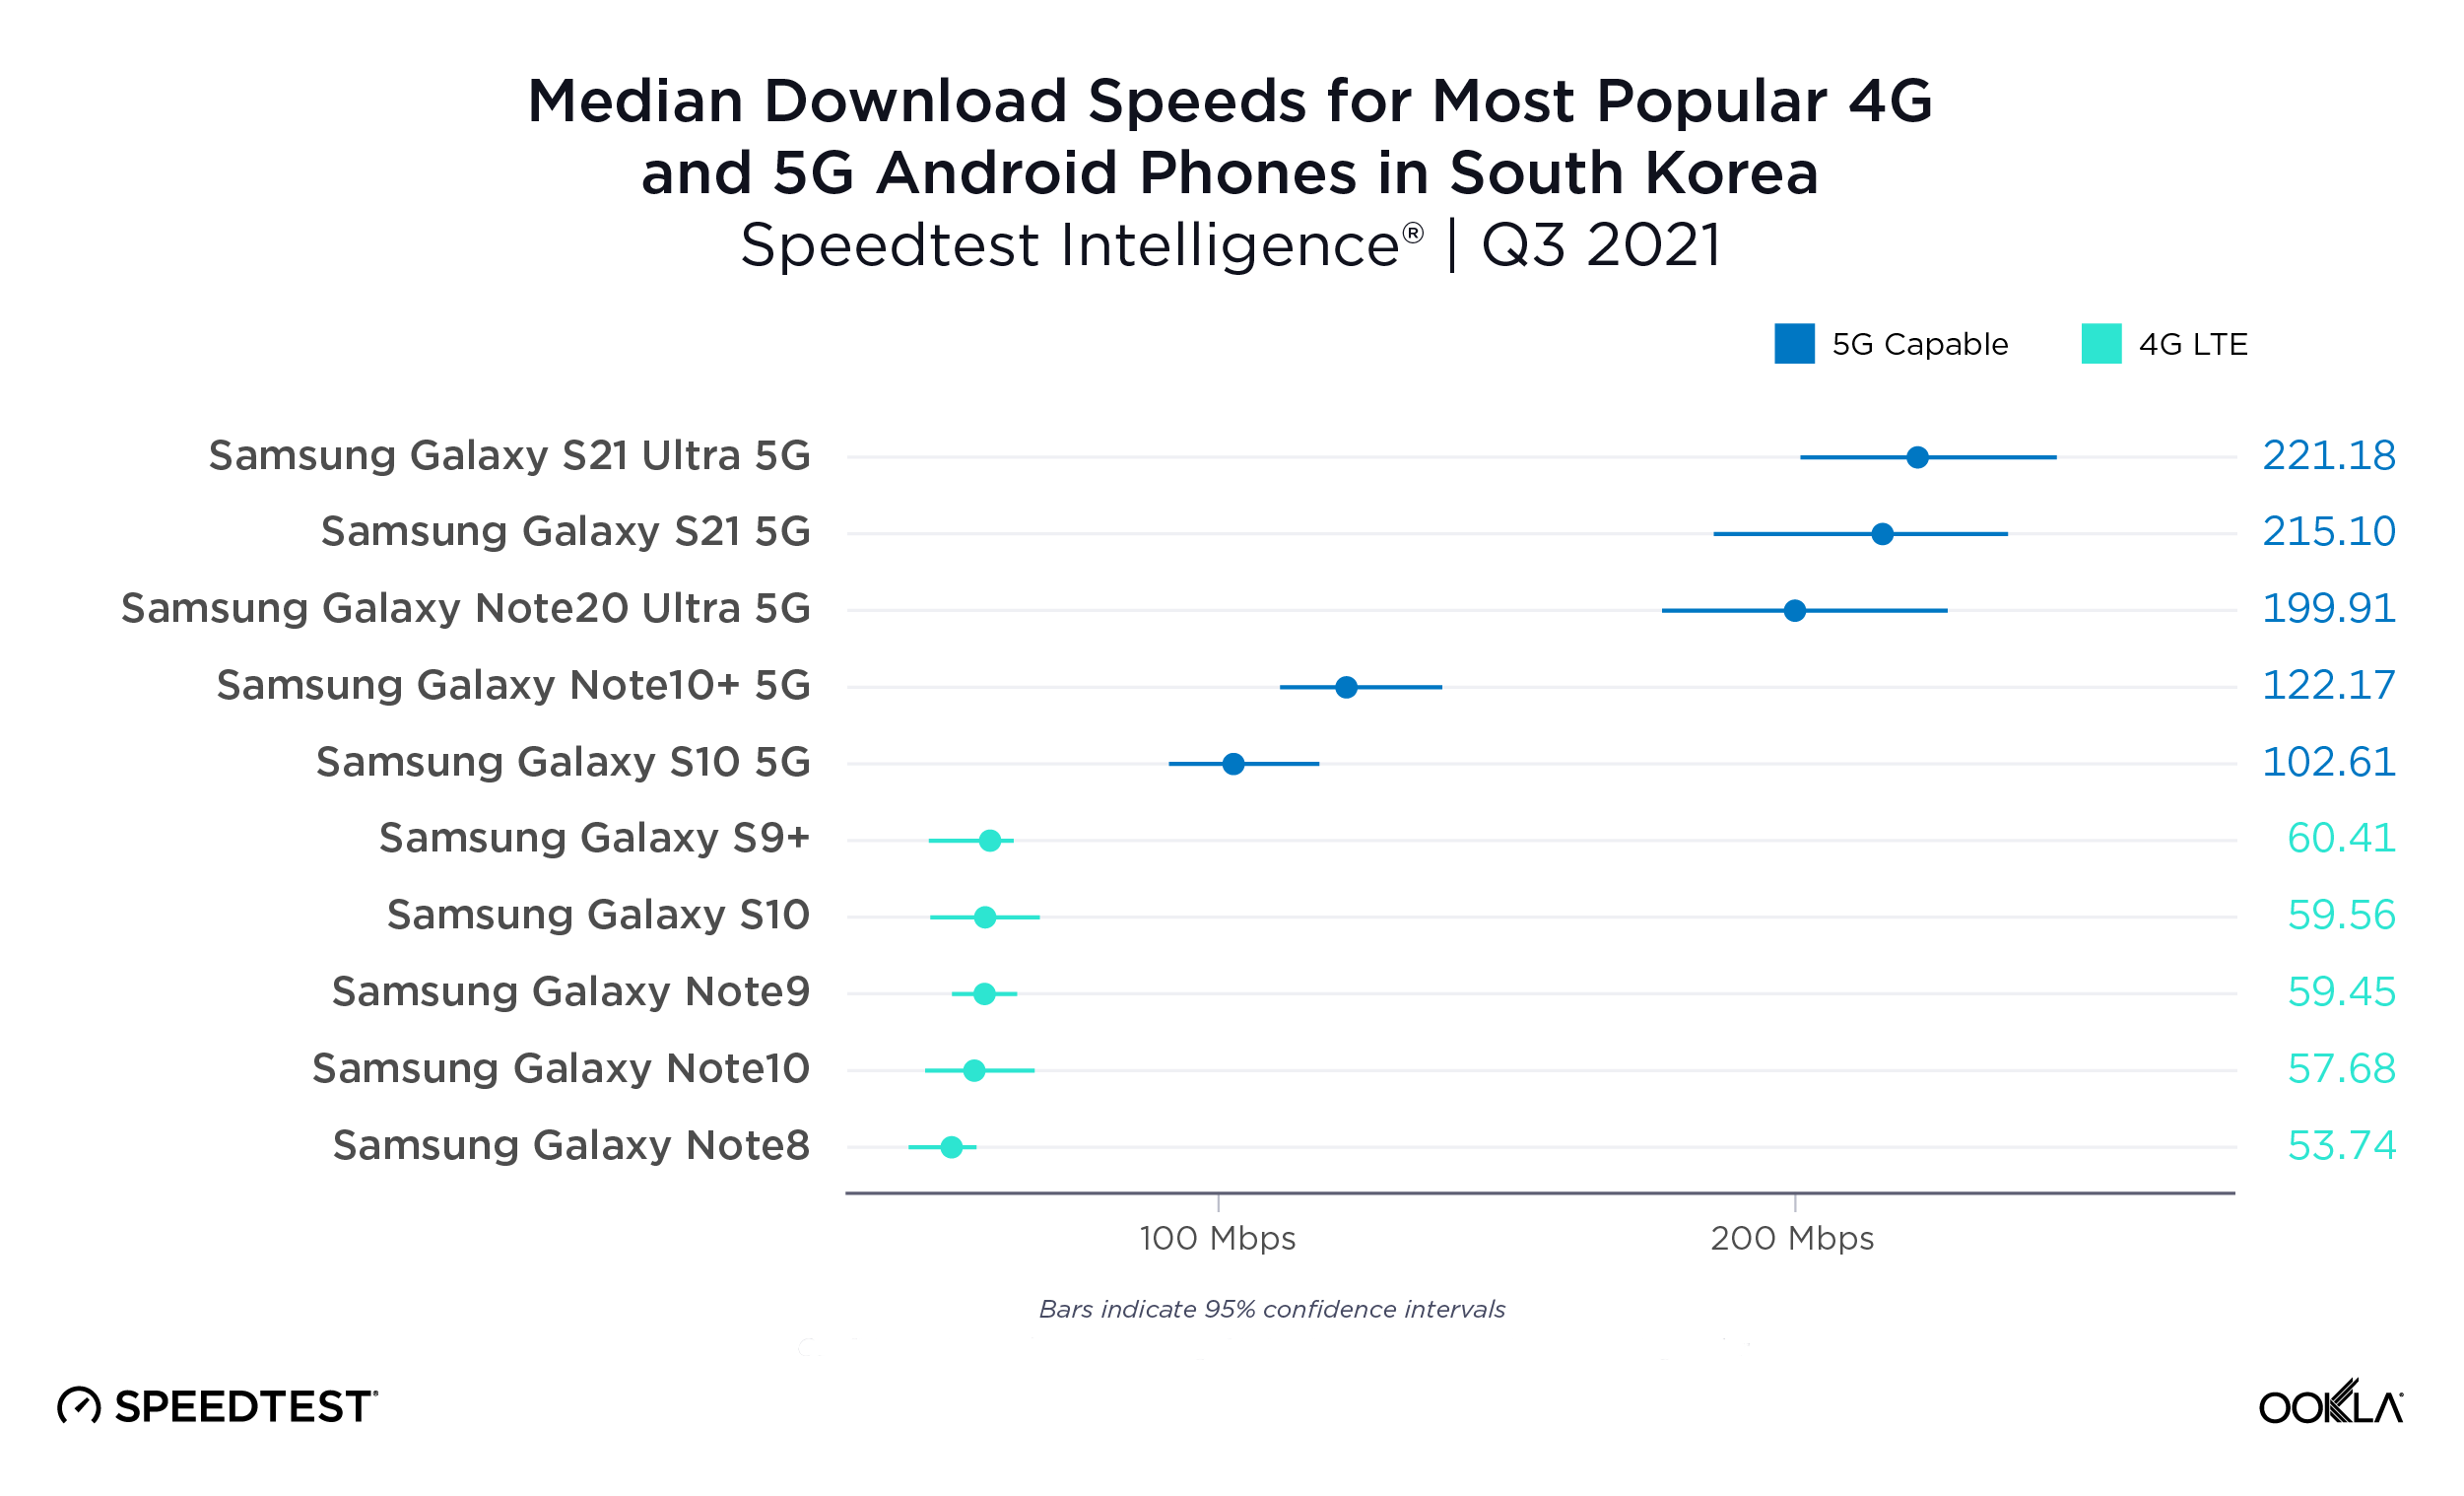
A median download speed over 5G of 411.11 Mbps put South Korea comfortably at the top of Asia-Pacific Economic Cooperation (APEC) countries with the fastest 5G during Q3 2020. Thailand was second, Australia third, China fourth and Taiwan fifth. 5G speeds represented the largest improvement over 4G in the Philippines where the median download speed over 4G during Q3 2020 (9.36 Mbps) was substantially lower than that of other countries on this list.

South Korea and the U.S. tied for highest Time Spent on 5G among APEC countries during Q3 2020, followed by Hong Kong and Taiwan.
5G-Performance-APEC_1220

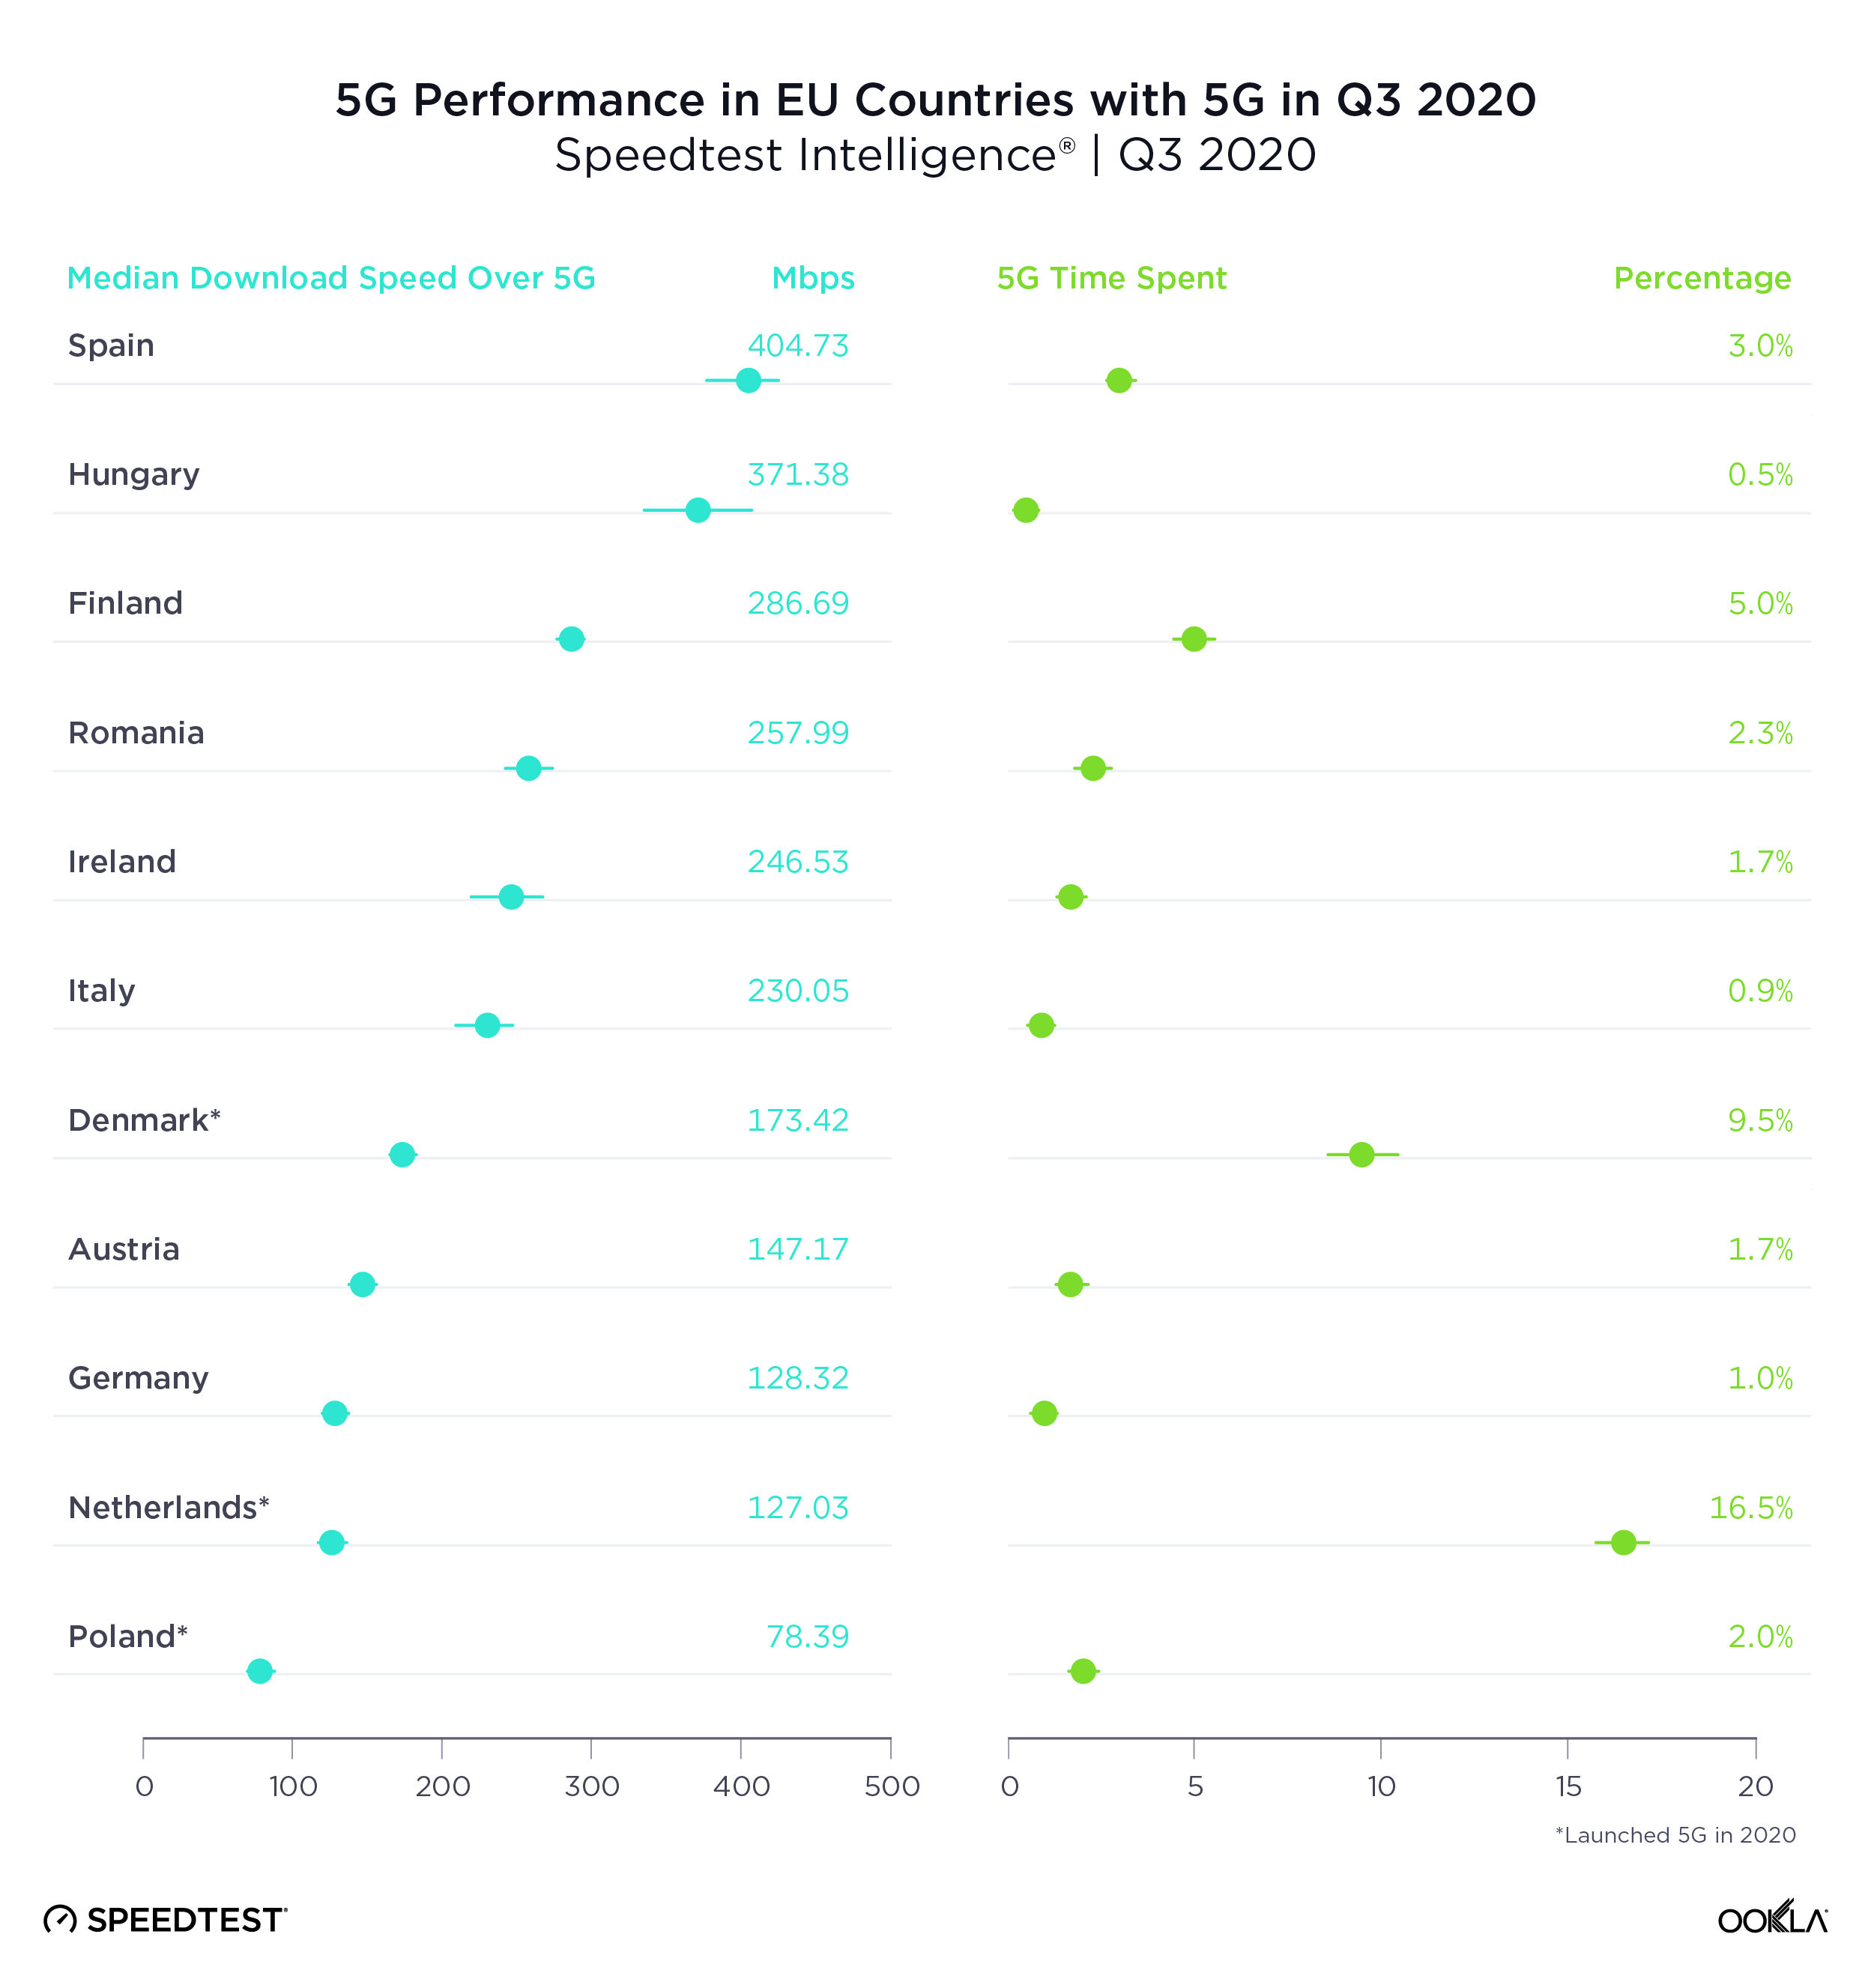
Spain had the fastest 5G in the E.U., Poland the slowest

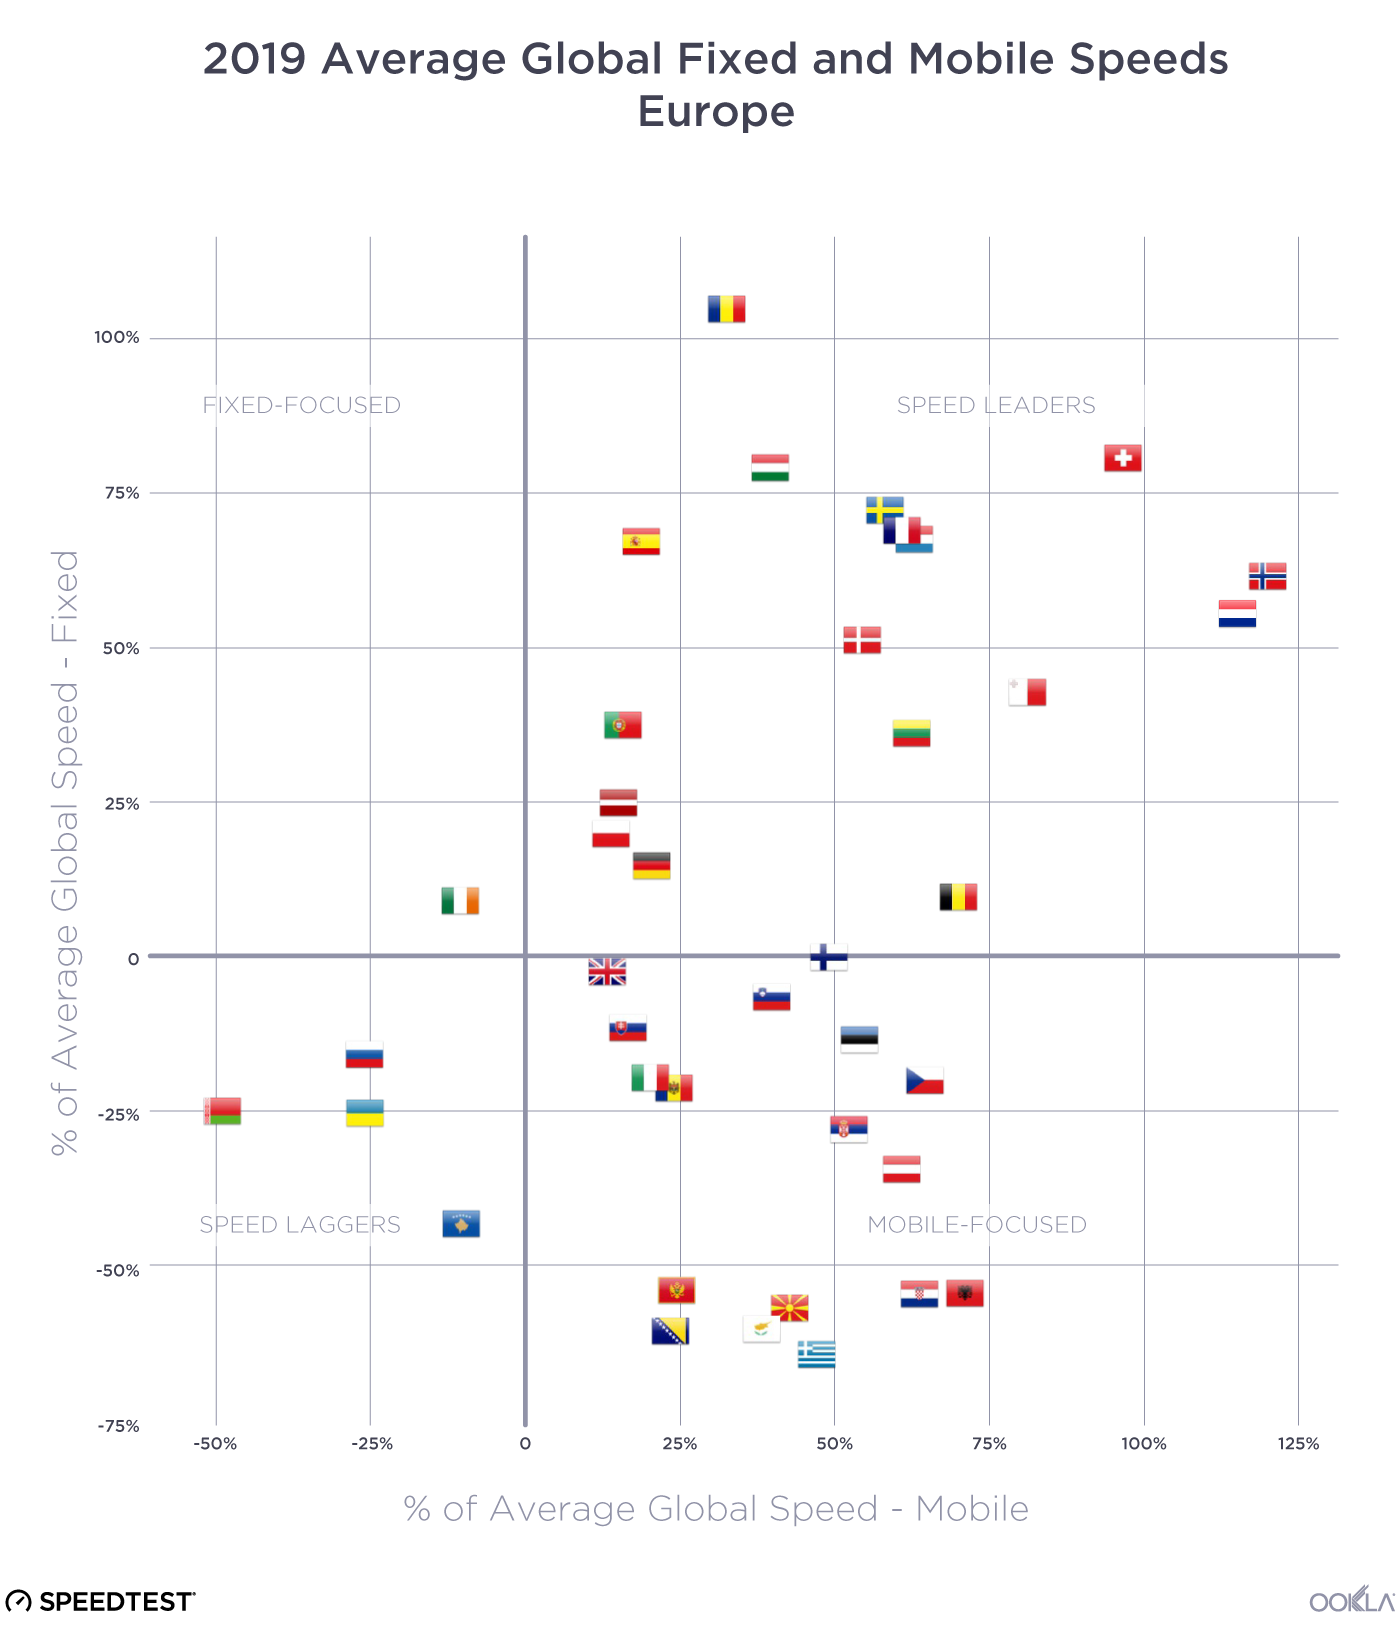
Spain showed the fastest median download speed over 5G among the 11 European Union (E.U.) countries with sufficient 5G samples to rank during Q3 2020. Hungary was second, Finland third, Romania fourth and Ireland fifth. Spain’s median download speed over 5G also represented the largest gain over 4G among all of these countries, partially because Spain had the second slowest median download speed over 4G. France is not included on this list because 5G did not become commercially available in the country until after Q3 2020.

The Netherlands had the highest Time Spent on 5G among E.U. countries during Q3 2020, indicating that customers with 5G phones are able to spend far more time on 5G there than in other E.U. countries. Denmark was second for Time Spent on 5G among EU countries in Q3 2020 and Finland third.
5G-Performance-EU_1220

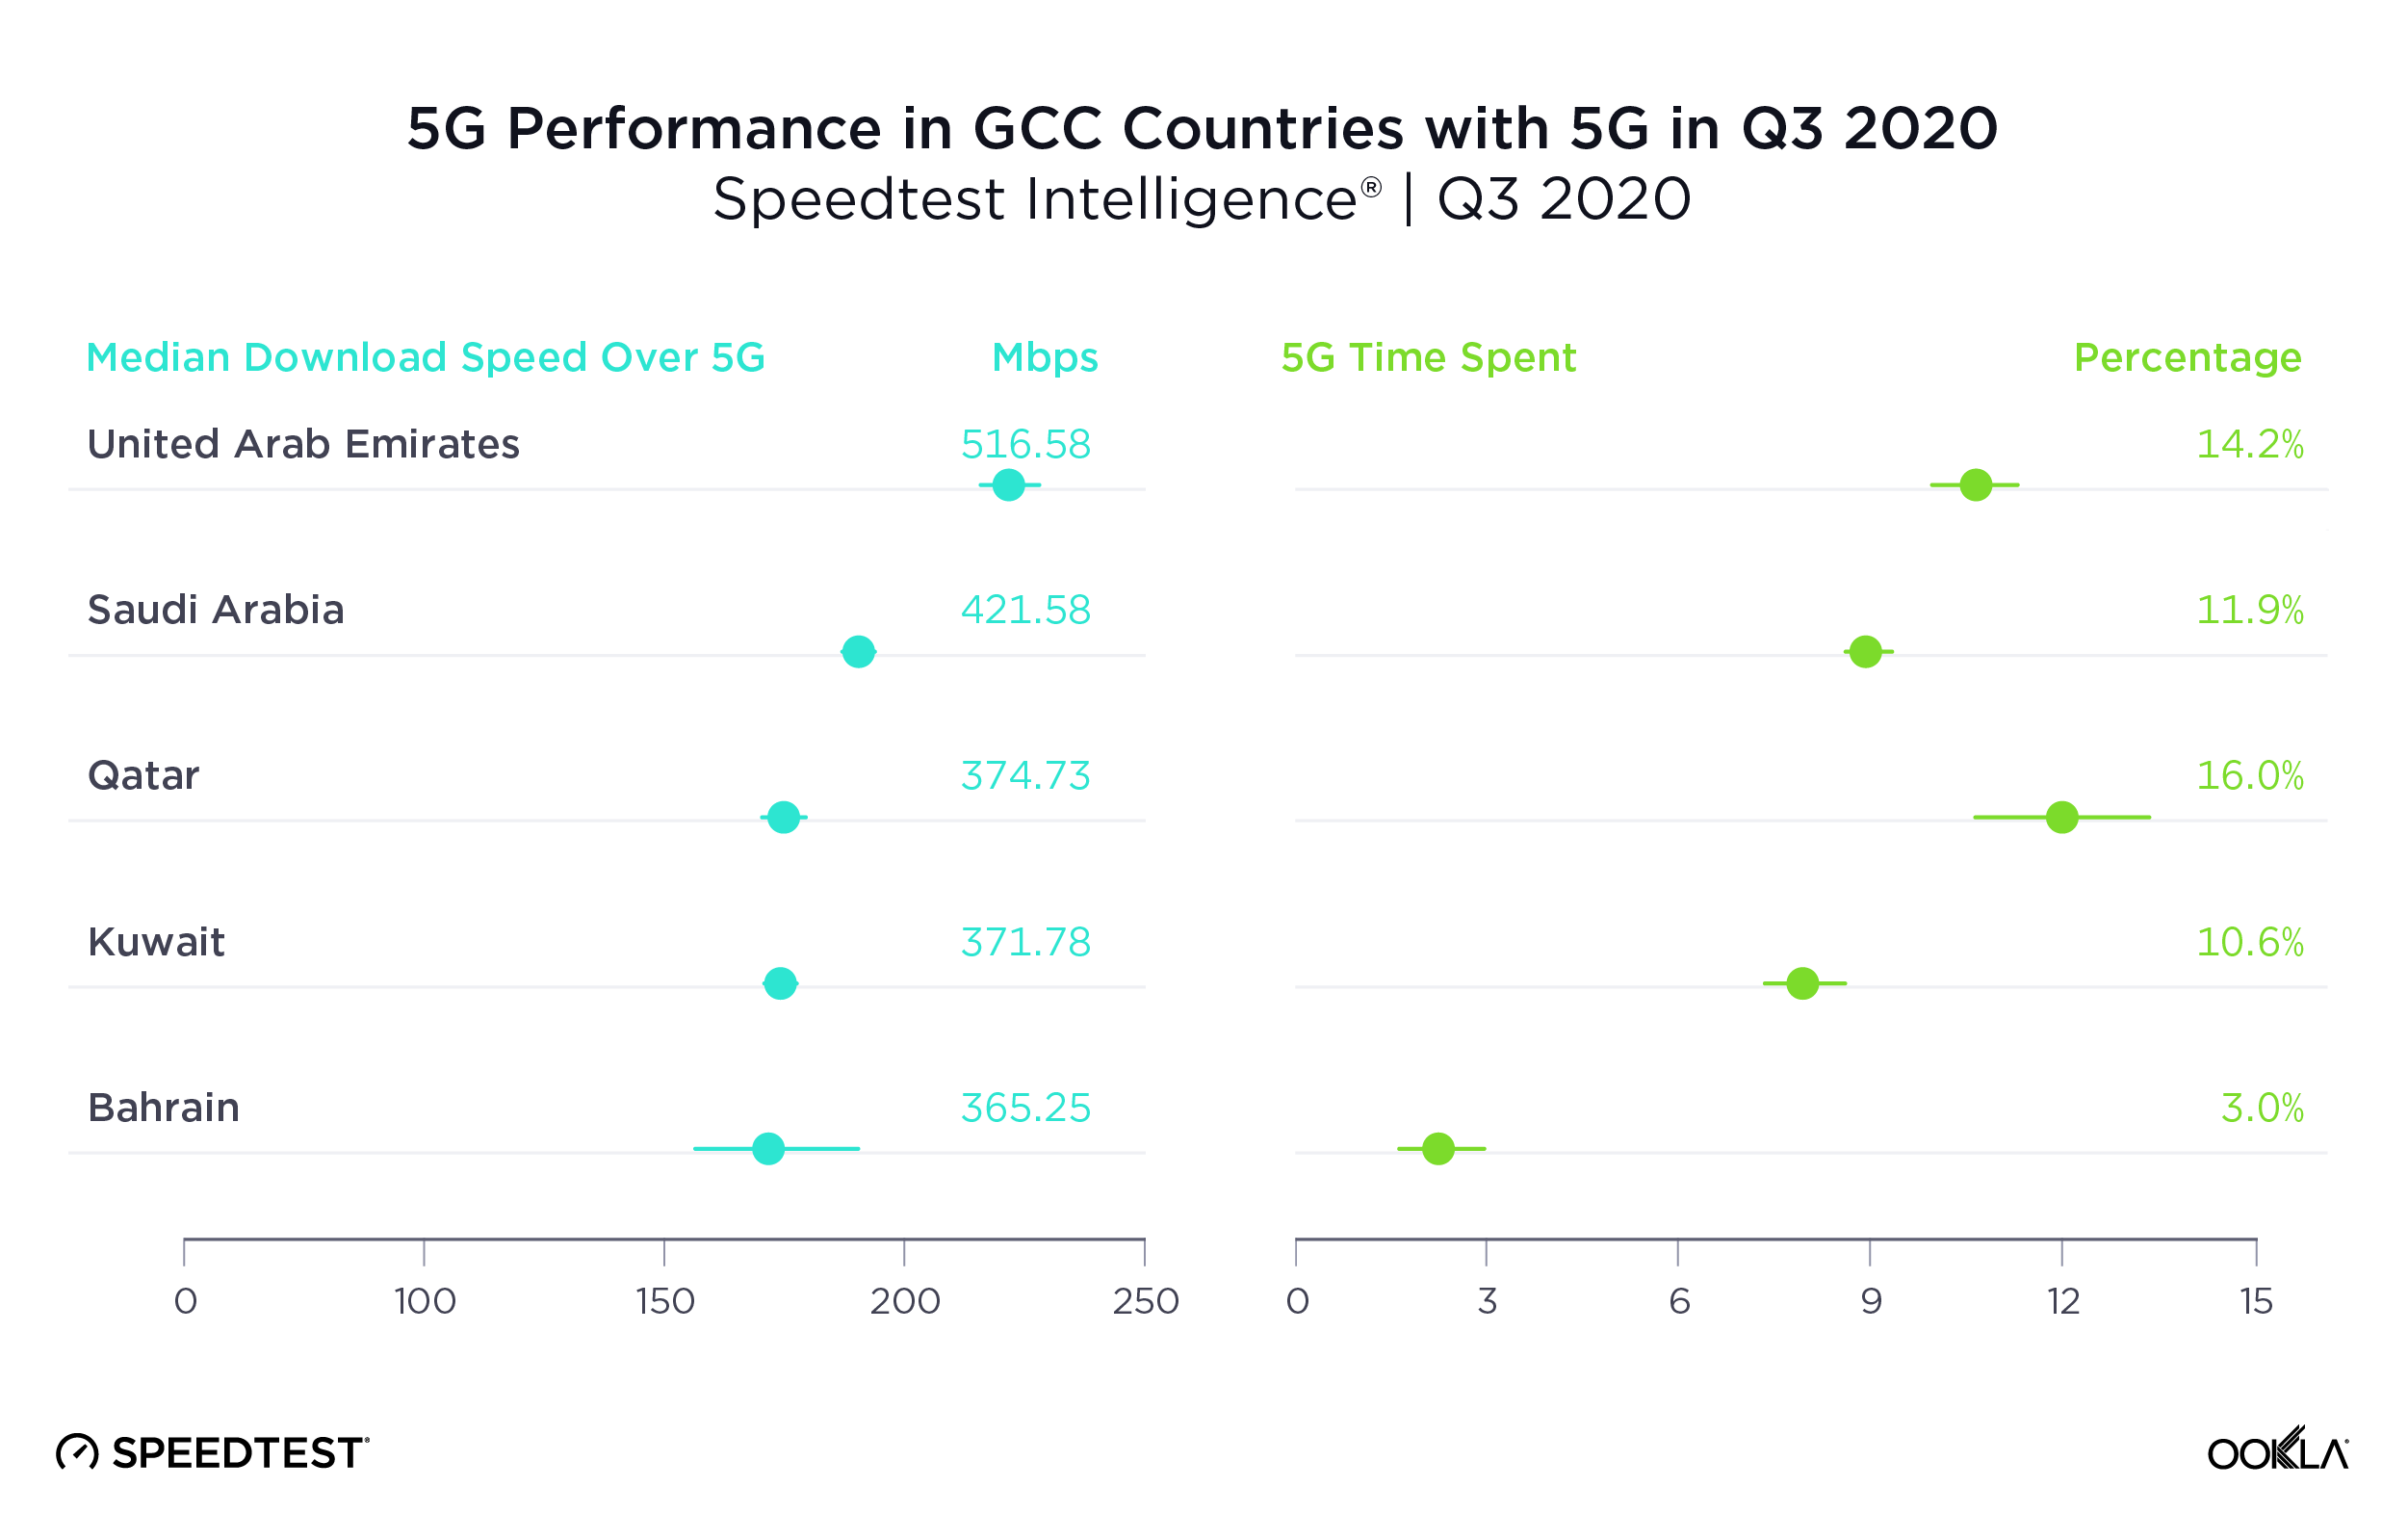
U.A.E had the fastest 5G in Gulf Cooperation Council Countries

With the second fastest median download speed over 5G in the world, U.A.E. was also the Gulf Cooperation Council (GCC) country with the fastest 5G during Q3 2020. Saudi Arabia was second and Qatar third. While Oman does have commercially available 5G, there were insufficient samples in the country during Q3 2020 to properly analyze performance.

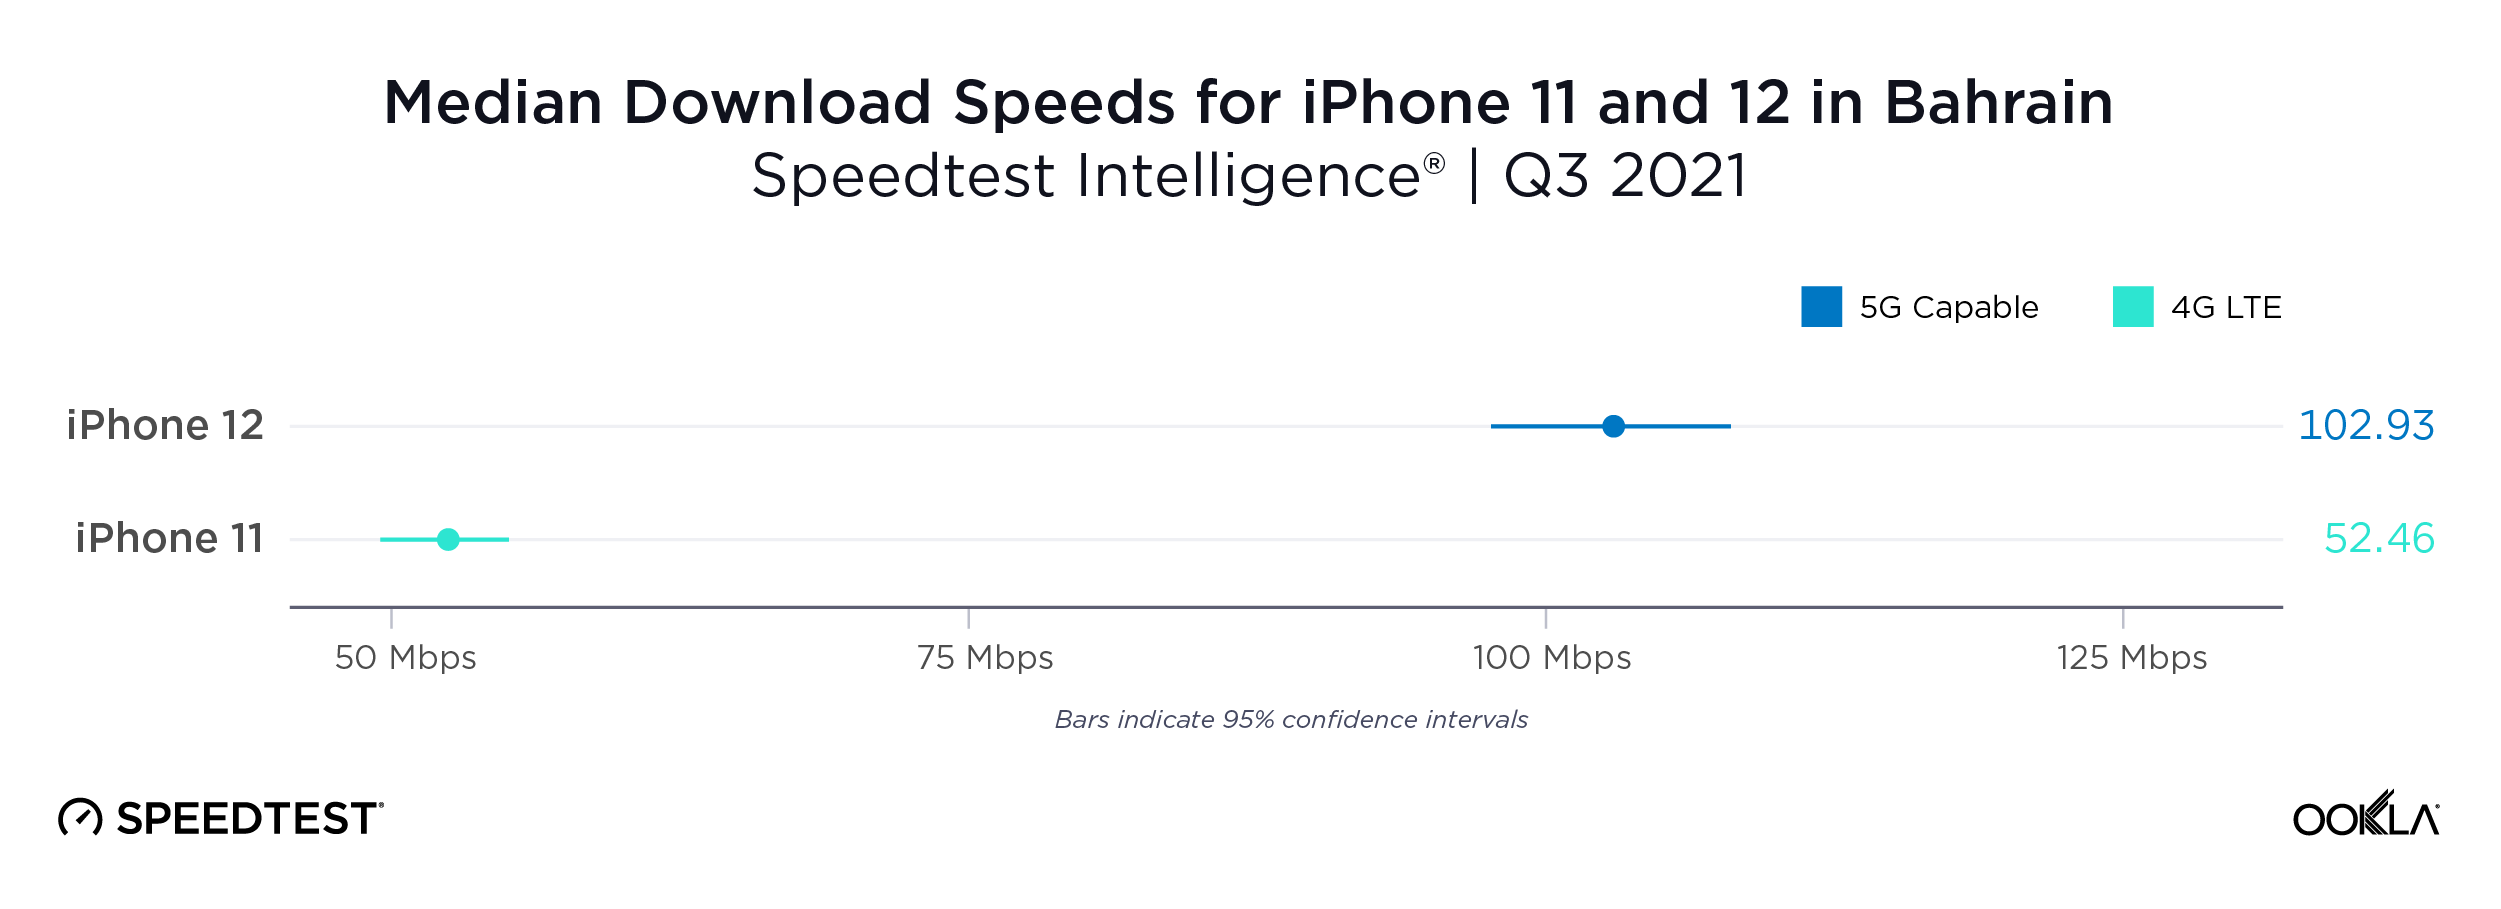
5G represented the largest improvement over 4G in Kuwait and Bahrain, countries that had slower median download speeds over 4G than their neighbors.

Time Spent on 5G was relatively high in all the GCC countries on this list, except Bahrain, when compared to other countries in the world during Q3 2020. Qatar showed the highest Time Spent on 5G among GCC countries in Q3 2020 at 16.0%. U.A.E. was second and Saudi Arabia third.
5G-Performance-GCC_1220

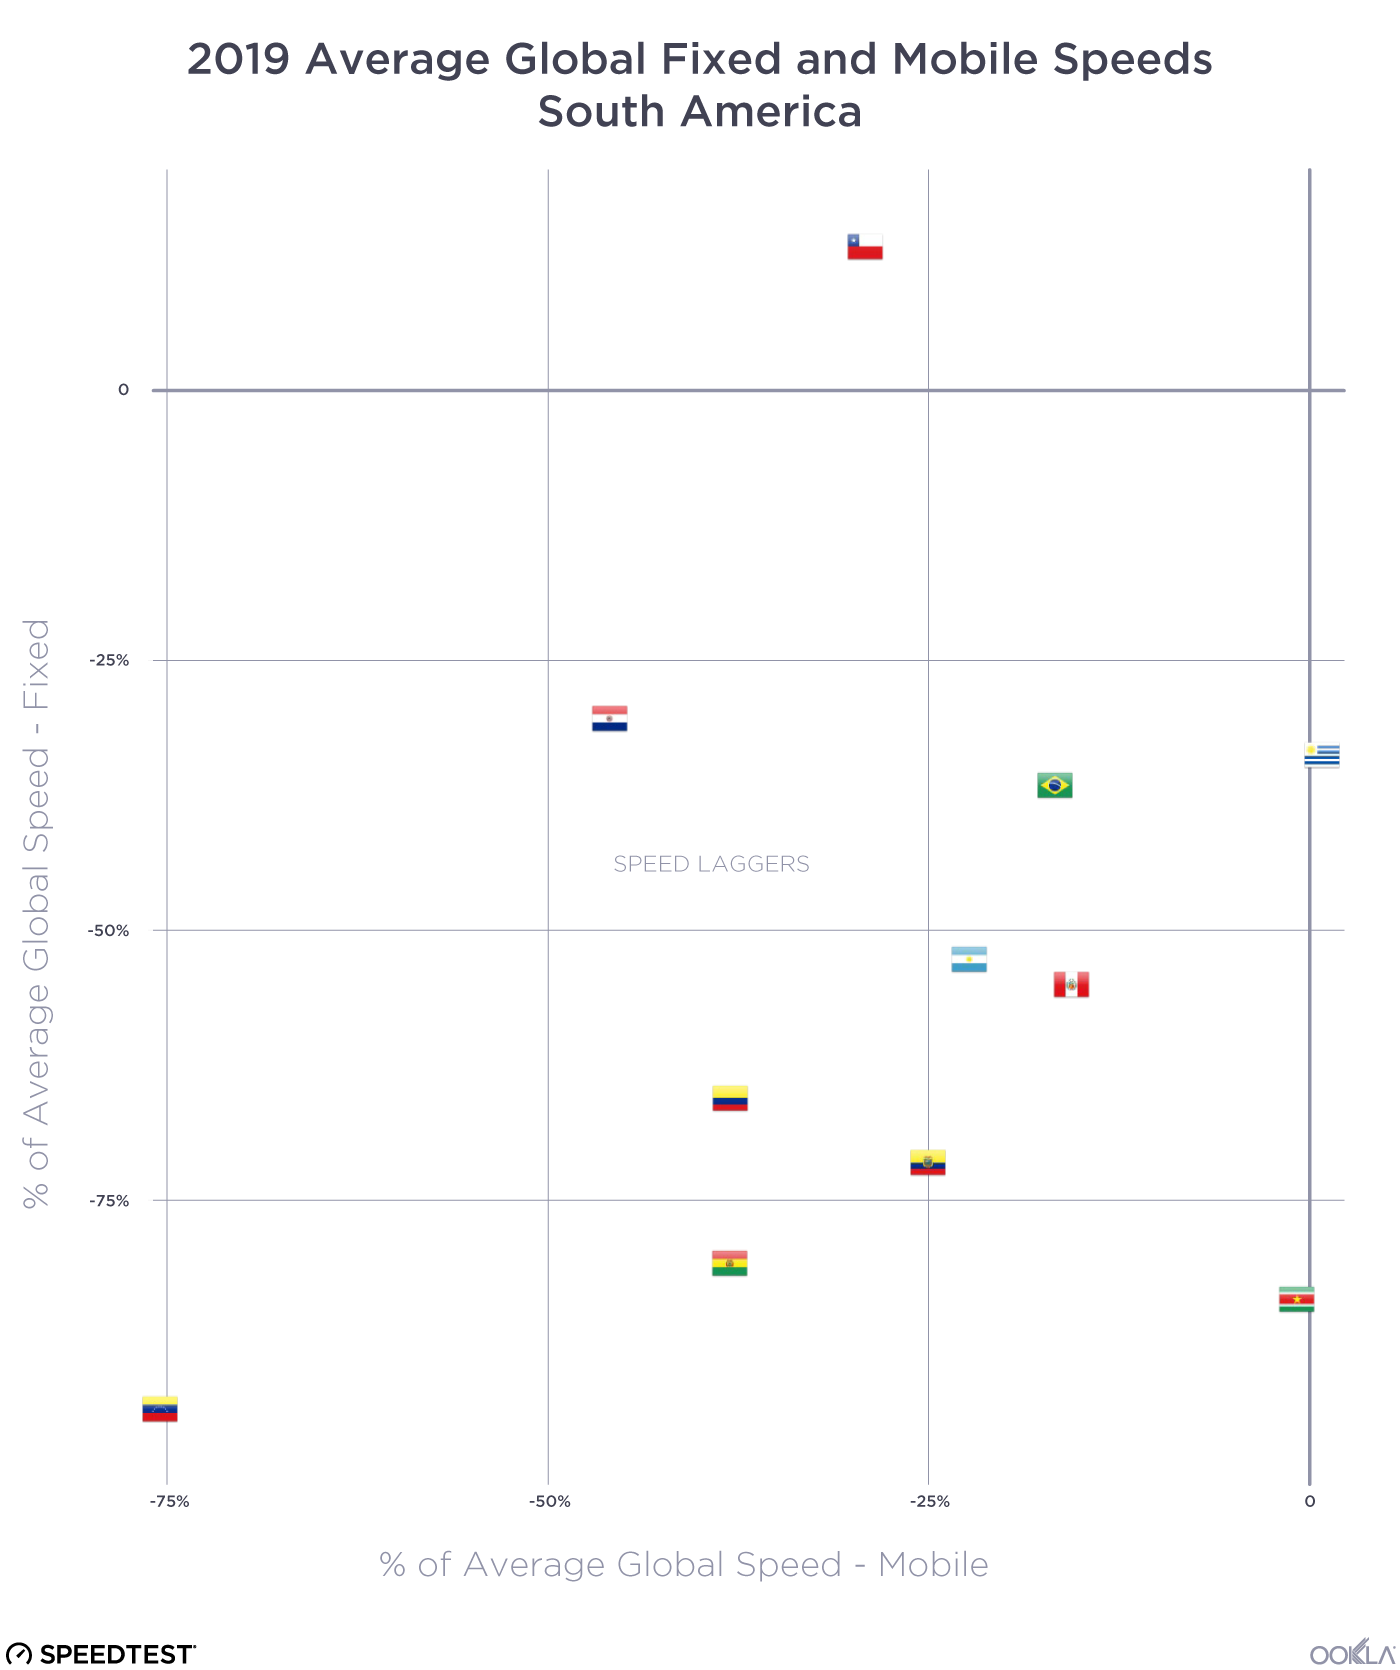
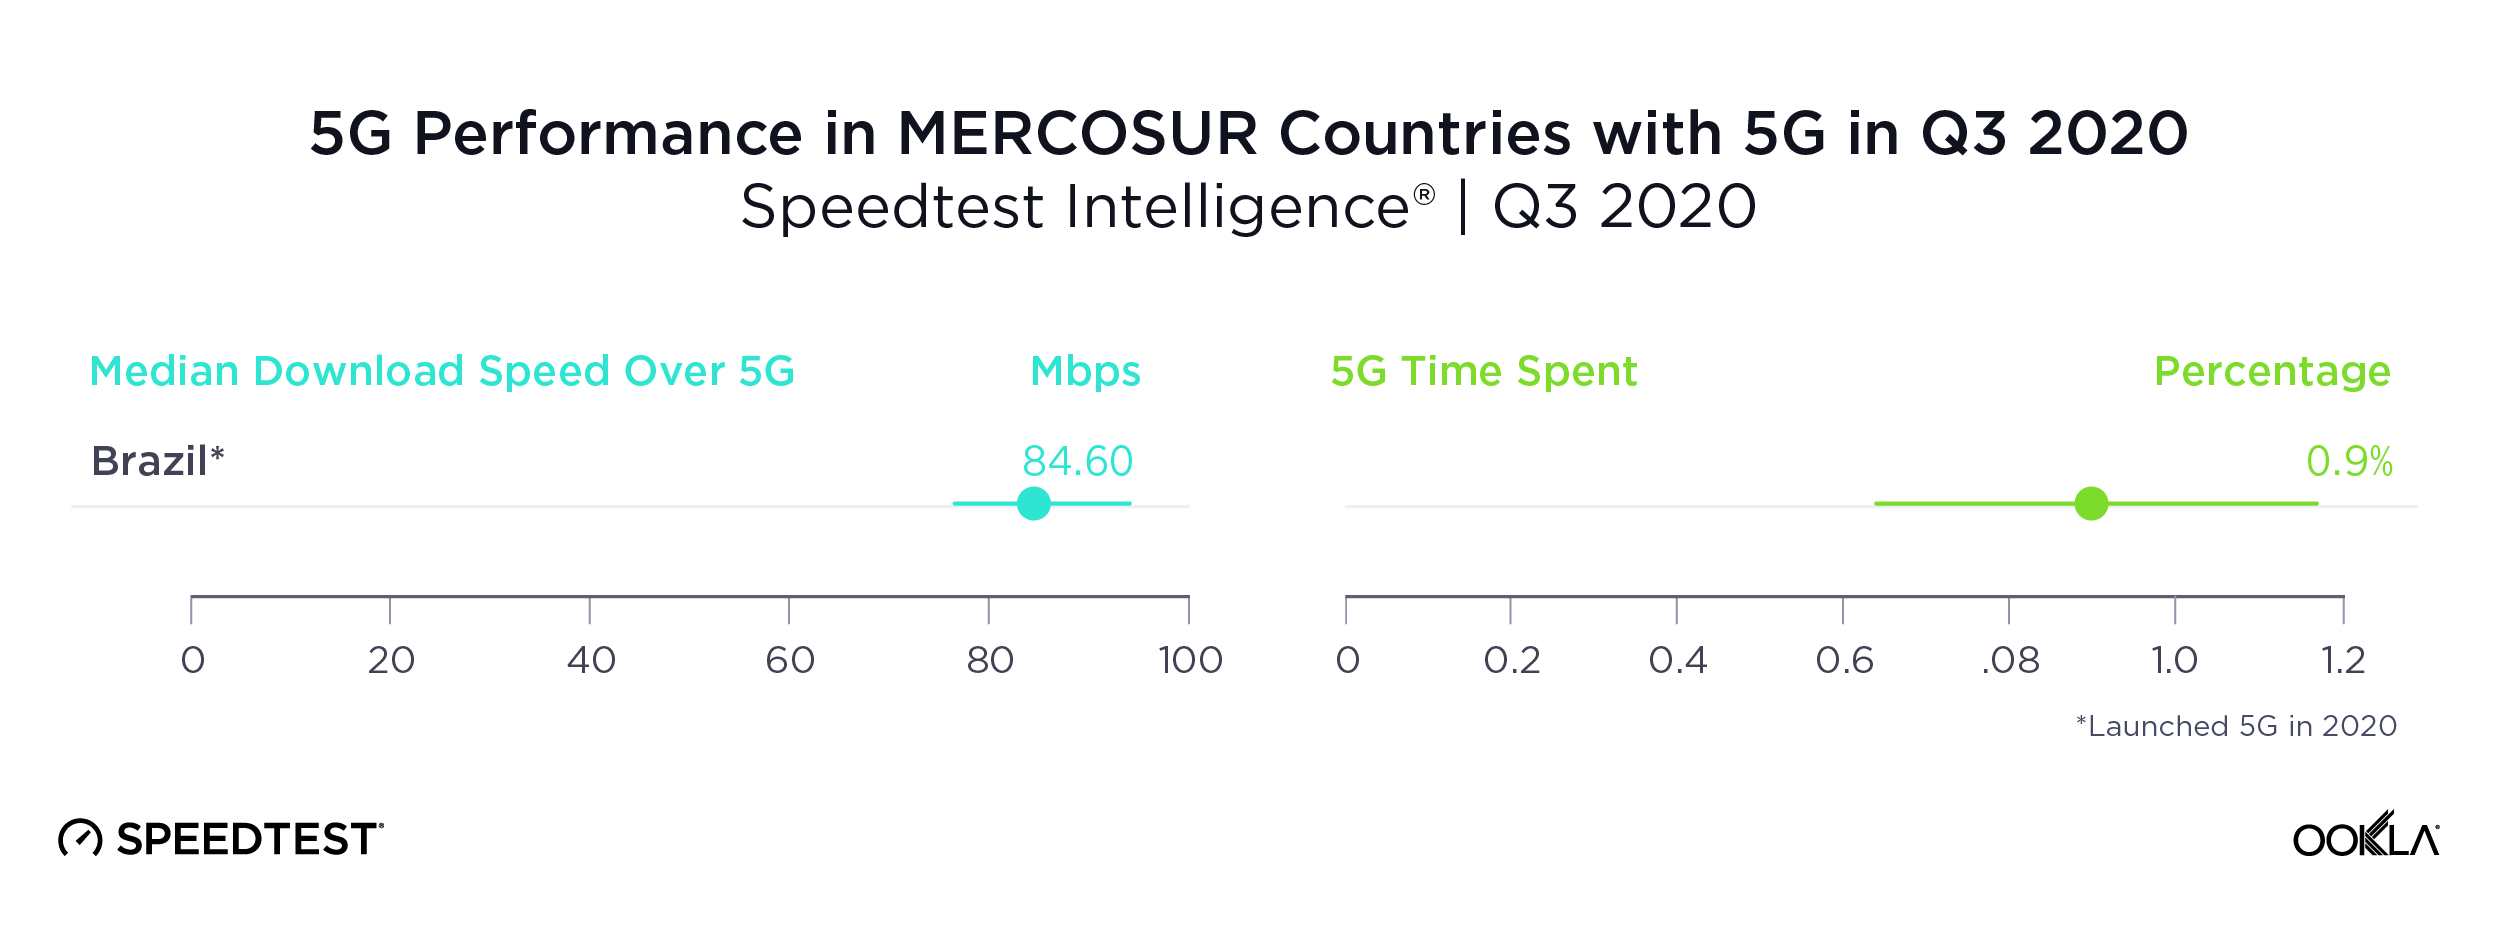
Brazil was the only MERCOSUR country with sufficient 5G to rate

Brazil’s median download speed over 5G of 84.60 Mbps during Q3 2020 may not seem fast for 5G, but it still puts Brazil well ahead of other countries in the Southern Common Market (MERCOSUR), most of which do not yet have 5G at all. We did see 5G results in Colombia, but there were insufficient samples to properly compare.

Time Spent on 5G in Brazil during Q3 2020 was not quite one percent, indicating that customers do not have much access to 5G yet.
5G-Performance-MERCOSUR_1220

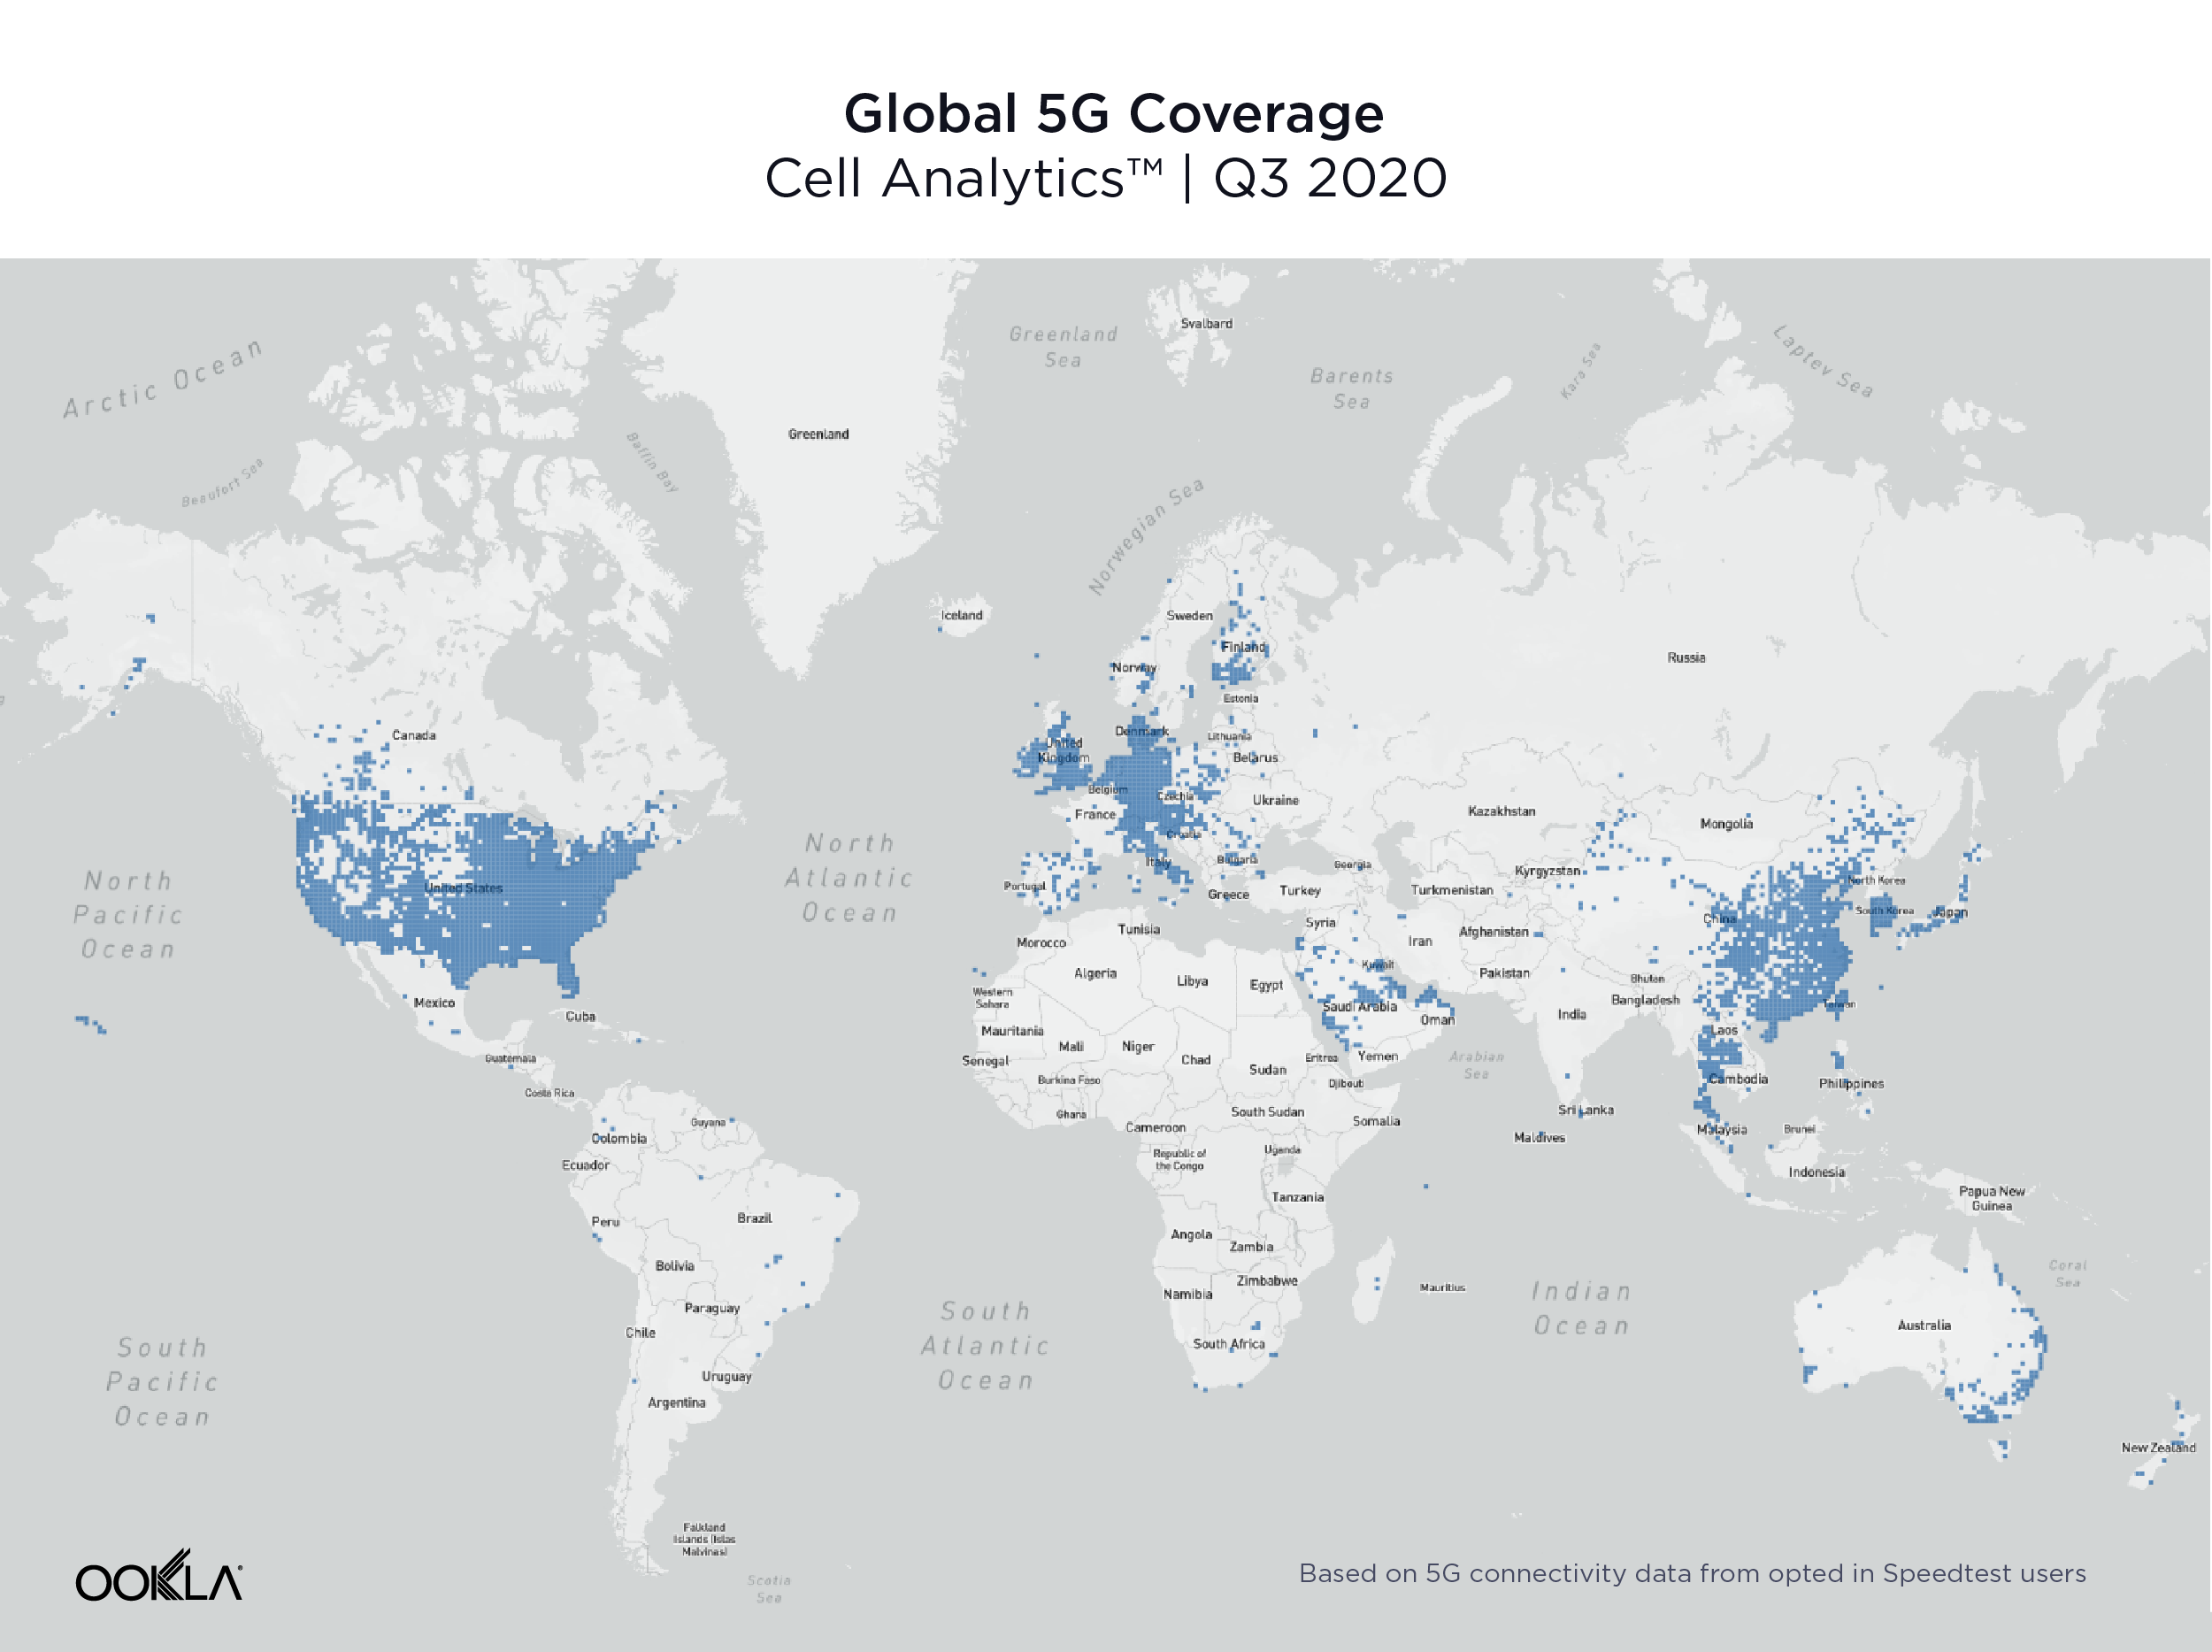
The U.S., Europe and Asia see widespread 5G coverage

Data from Cell Analytics™ shows a global view of 5G coverage in Q3 2020. This map, based on 5G connectivity data for opted-in Speedtest users, shows that 5G is spreading rapidly across the U.S., Europe, the Arabian Peninsula and Asia. In other regions, 5G is primarily available in larger cities, if at all.
Global-5G-Coverage_1220

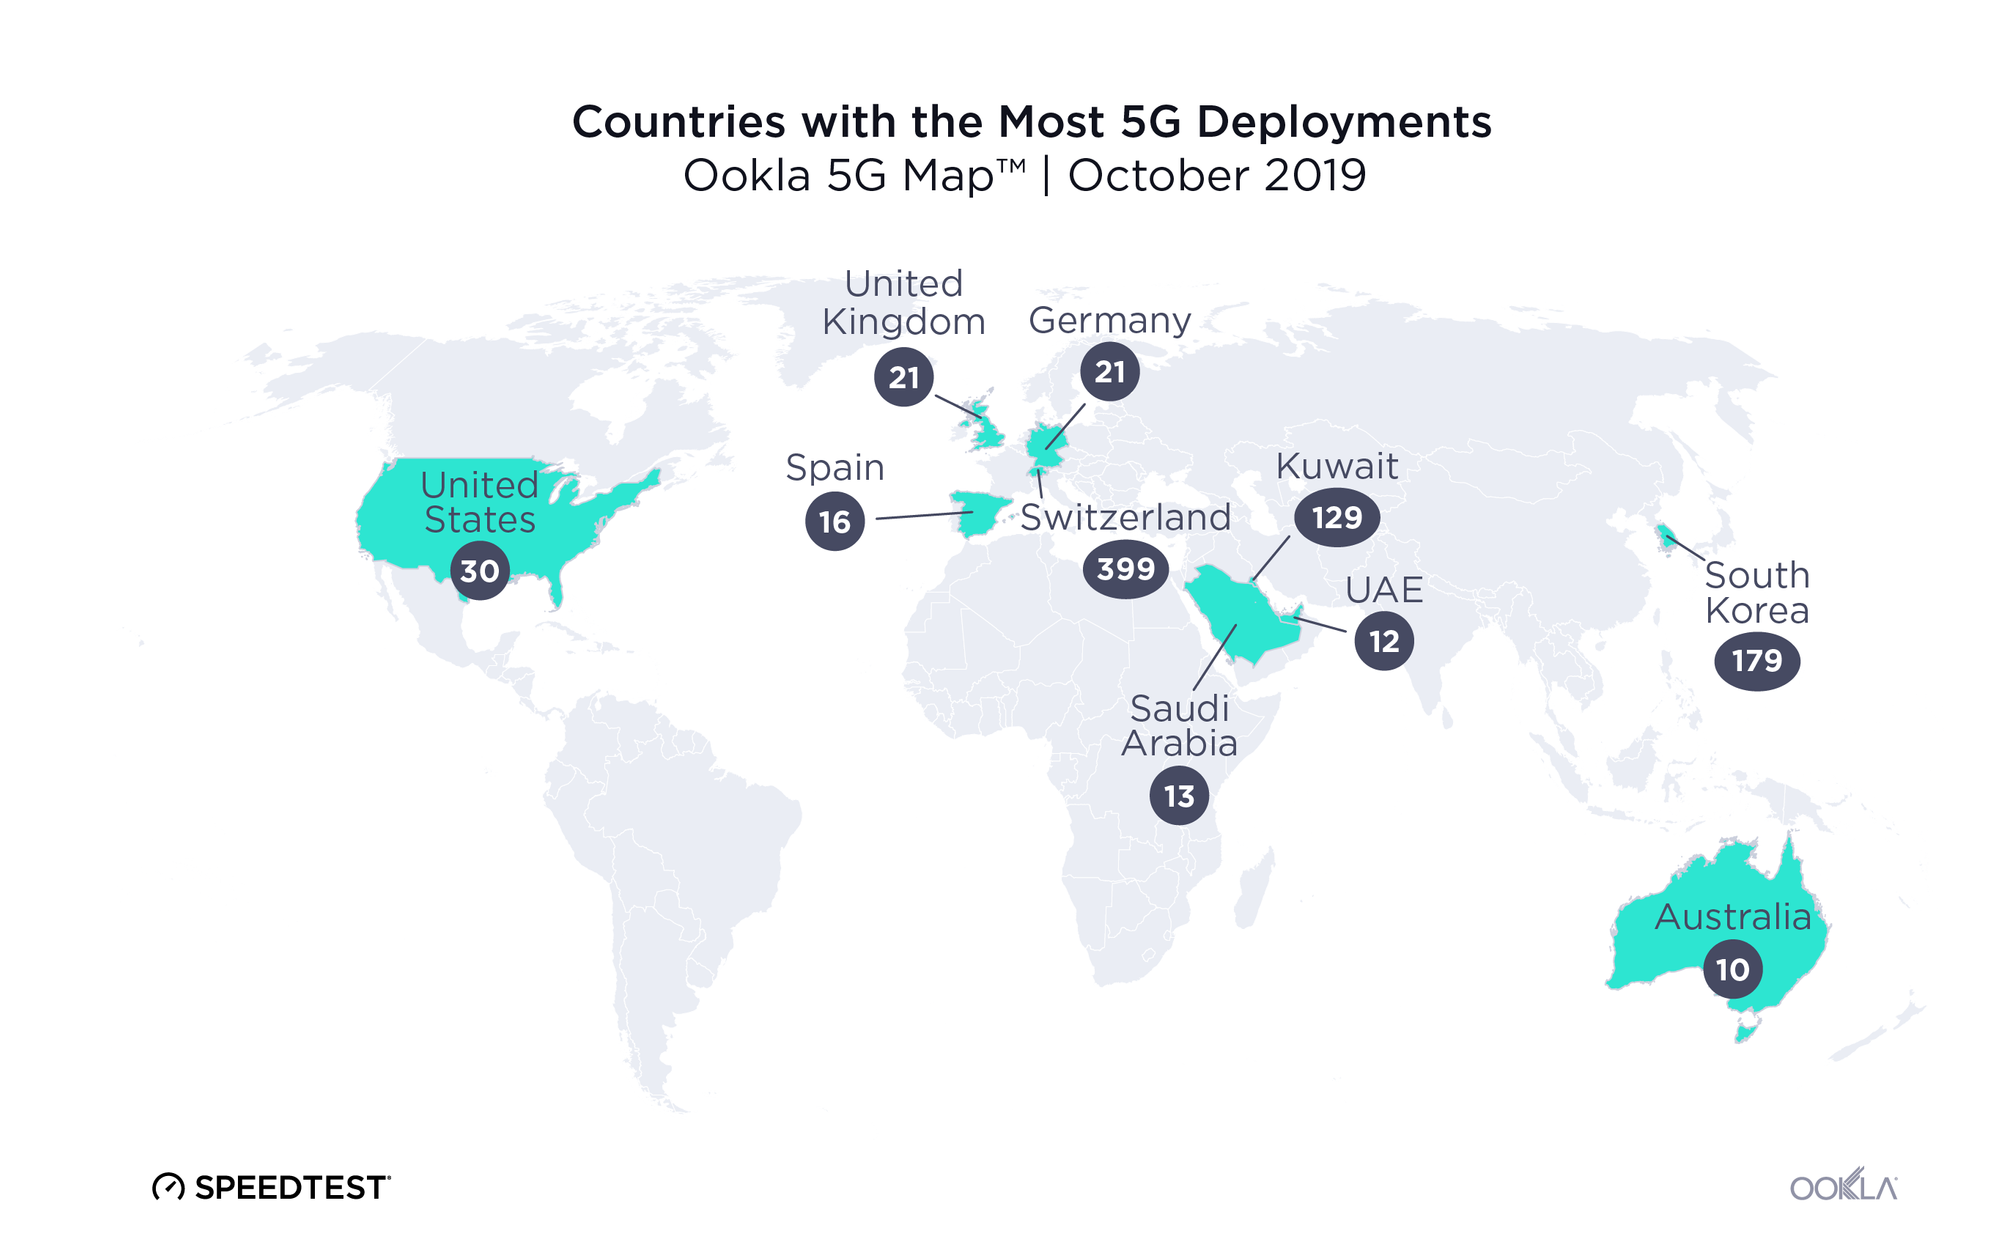
99 countries worldwide had 5G, in 14,643 total cities

The number of countries with 5G deployments increased 62.3% between Q3 2019 and Q3 2020, with 99 countries having 5G deployments at the end of Q3 2020, according to the Ookla 5G Map™. There were 14,643 cities worldwide with 5G deployments at the end of Q3 2020, a 1,671% increase over Q3 2019. The total number of deployments worldwide was 17,046. The counts here and throughout this section include commercially available 5G as well as 5G networks with limited availability and those in pre-release.

Countries with the Most 5G Cities
Ookla 5G Map™ | Q3 2020
Country Numbers of Cities with 5G
United States 7,583
Germany 2,312
Austria 1,104
Netherlands* 1,009
Switzerland 554
Thailand* 325
Ireland 214
Puerto Rico 187
United Kingdom 169
Kuwait 97

The U.S. had the most cities with 5G deployments at the end of Q3 2020 with 7,583. Germany was second, Austria third, the Netherlands fourth and Switzerland fifth. A deployment is when a provider has some level of 5G presence in a city. A city can have multiple deployments when more than one provider is present.

Countries with the Largest Growth in Number of Deployments
Ookla 5G Map™ | Q3 2020
Country 5G Deployments as of Q3 2020 % Change Q3 2020 vs Q3 2019
Netherlands* 1,071 50,350%
Thailand* 451 32,401%
United States 7,808 21,566%
Germany 2,417 11,460%
Canada* 93 7,600%
Austria 1,173 4,918%
Ireland 236 4,180%
Poland 81 3,150%
Japan* 75 2,050%
Oman 50 2,000%

The Netherlands showed the largest percentage change in the number of 5G deployments between Q3 2019 and Q3 2020 with a 50,350% jump from two deployments in Q3 2019 to 1,071 in Q3 2020. Thailand saw the second largest percentage increase, the U.S. third, Germany fourth and Canada fifth.

Most early trials and commercial deployments of 5G spectrum allocations around the world have been centered around fallow swaths of the mid-band (3.3 GHz – 4.2 GHz) spectrum. With the recent commercialization of Dynamic Spectrum Sharing (DSS) across all major 5G infrastructure vendors, there is now increasing demand for 5G support on many existing 4G frequencies, ranging from 600 MHz to 2.5 GHz. In unique 5G markets like Japan, there is an additional need for the 4.5 GHz band as well as the millimeter wave (FR2).

In the United States, early deployments leveraged millimeter wave frequency bands in the 28 GHz and the 39 GHz, which delivered impressive speeds in a very constrained footprint. The rapid 5G deployment in the 600 MHz band has added a substantial nationwide 5G footprint — and with that, much wider 5G availability for many more Americans. With the recent merger between T-Mobile and Sprint, the deployment of 2.5 GHz spectrum has been significantly accelerated, which should improve both network efficiency and user experience on T-Mobile’s network. Additionally, next year’s availability of 5G Carrier Aggregation will allow T-Mobile to combine 600 MHz with 2.5 GHz to deliver improved 5G speeds on top of the existing nationwide footprint. In addition, DSS has recently been deployed by AT&T and Verizon, which allows operators to choose from existing low-band spectrum assets (850 MHz) and deliver both LTE and 5G at the same time. This feature alone doesn’t add a significant boost in perceived user experience, but will certainly improve the 5G footprint.

China showed the highest percentage of 5G test samples

Another way to measure 5G adoption is to look at the proportion of samples taken over 5G relative to the total number of samples on all technologies. Speedtest Intelligence is uniquely positioned to measure global growth in 5G because of the worldwide adoption of Speedtest apps. China had the highest percentage of 5G Speedtest results compared to other mobile technology types in Q3 2020 at 18.9%. South Korea was second, Hong Kong third, Puerto Rico fourth and Qatar fifth.

Countries with the Most 5G
Speedtest Intelligence® | Q3 2020
Country 5G Samples as a % of Total
China 18.9%
South Korea 15.8%
Hong Kong (S.A.R.)* 7.9%
Puerto Rico 6.7%
Qatar 5.7%
United States 5.5%
Netherlands* 4.9%
United Arab Emirates 4.6%
Kuwait 4.6%
Australia 4.2%

What 5G will look like in 2021

With recently announced device chipset advancements expected in 2021, including 5G Carrier Aggregation, operators will be able to combine two 5G frequency bands in the sub-6GHz (FR1) range, allowing not only faster speeds, but also greater coverage. More importantly, the ability to combine Frequency Division Duplexing (FDD) and Time Division Duplexing (TDD) FR1 channels will enable operators to leverage low-band frequencies (sub-1GHz) for uplink transmissions (user device to cell site), while combining the low-band with the mid-band (2.5 GHz, 3.5 GHz) on the downlink. This should significantly expand the availability of fast 5G download speeds across larger geographies.

Similarly, DSS — which is a stepping stone to standalone 5G and allows for the simultaneous delivery of 4G and 5G technology on the same spectrum slice — will enable operators to combine already-deployed FDD spectrum with dedicated mid-band spectrum for an enhanced standalone 5G experience. This will unlock the full potential of 5G networks, such as ultra low latency and network slicing, while delivering an improved mobile experience to users.

Where 5G fails to reach

During Q3 2020 Speedtest Intelligence showed 55 countries in the world (with more than 200 samples) where more than 20% of samples were from 2G and 3G connections (combined). These are countries where, in many cases, 5G is still aspirational. As excited as we are about the expansion of 5G, we do not want to see these countries left behind.

Countries That Still Rely Heavily on 2G and 3G Connections
Speedtest Intelligence® | Q3 2020
Country 2G & 3G Samples 4G Samples
Turkmenistan 74.9% 25.1%
Rwanda 52.3% 47.7%
Iraq 49.4% 50.6%
Belarus 46.5% 53.5%
Afghanistan 46.0% 54.0%
Antigua and Barbuda 40.2% 59.8%
Tajikistan 40.2% 59.8%
Suriname 39.7% 60.3%
Haiti 37.7% 62.3%
Syria 37.5% 62.5%
Ghana 36.0% 64.0%
Ethiopia 35.0% 65.0%
Mozambique 34.7% 65.3%
Benin 34.3% 65.7%
Angola 34.1% 65.9%
El Salvador 32.5% 67.5%
Moldova 31.8% 68.2%
Venezuela 30.3% 69.7%
Tanzania 30.0% 70.0%
Papua New Guinea 29.5% 70.5%
Jamaica 29.4% 70.6%
Sudan 29.2% 70.8%
Algeria 29.0% 71.0%
Namibia 28.5% 71.5%
Zimbabwe 28.5% 71.5%
Somalia 28.4% 71.6%
Nicaragua 28.1% 71.9%
Armenia 28.1% 71.9%
Bosnia and Herzegovina 28.1% 71.9%
Uzbekistan 27.8% 72.2%
Cameroon 27.5% 72.5%
Zambia 27.4% 72.6%
Uganda 26.6% 73.4%
Trinidad and Tobago 26.6% 73.4%
Honduras 26.5% 73.5%
Bangladesh 26.3% 73.7%
Burkina Faso 26.0% 74.0%
Ukraine 25.8% 74.2%
Nigeria 25.7% 74.3%
DR Congo 24.6% 75.4%
Costa Rica 24.3% 75.7%
Botswana 24.1% 75.9%
Libya 22.9% 77.1%
Azerbaijan 22.9% 77.1%
Ecuador 22.8% 77.2%
Mali 22.4% 77.6%
Mongolia 21.8% 78.2%
Maldives 21.6% 78.4%
Mauritius 21.3% 78.7%
Tunisia 21.0% 79.0%
Belize 20.7% 79.3%
Laos 20.5% 79.5%
Kenya 20.3% 79.7%
Paraguay 20.1% 79.9%
Côte d’Ivoire 20.0% 80.0%

In markets where 4G layers haven’t been deployed or substantially covered, end users fall back to the circuit-switched network (2G, 3G). These decades-old network technologies should be sufficient for basic voice and texting, social media, and navigation apps, but cannot deliver rich media experiences or video calling. Unfortunately, many countries on this list are places where consumers rely primarily on mobile phones for their internet connectivity.

5G is radically changing the speeds and capabilities of mobile networks around the world. If the current growth rate continues, it won’t be long before most nations have access to 5G. But there are nations and subsets of subscribers who may not see the benefits of 5G for years to come. We will continue reporting on 5G achievements across the globe and watching speeds in general on the Speedtest Global Index™.
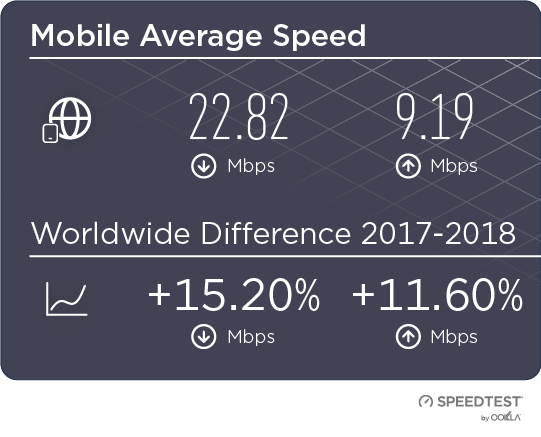
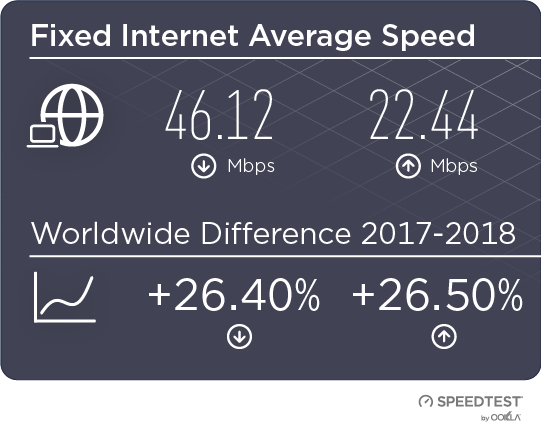
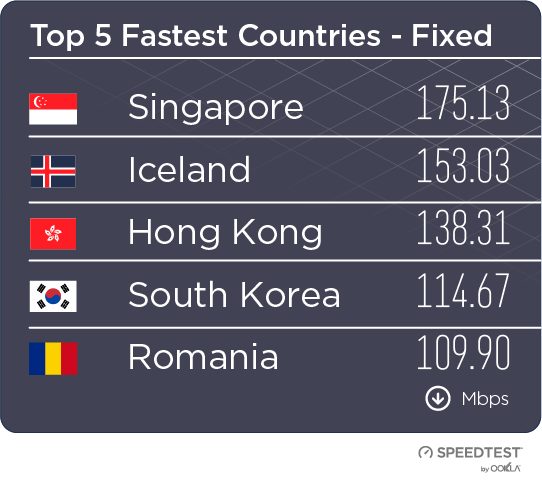
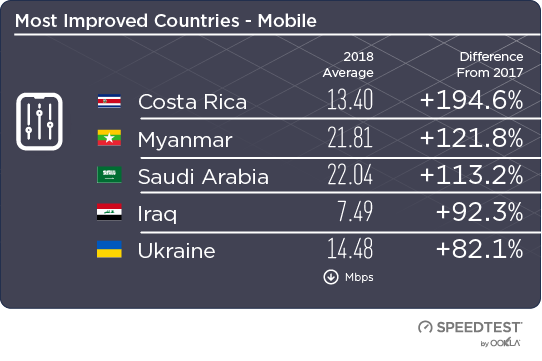
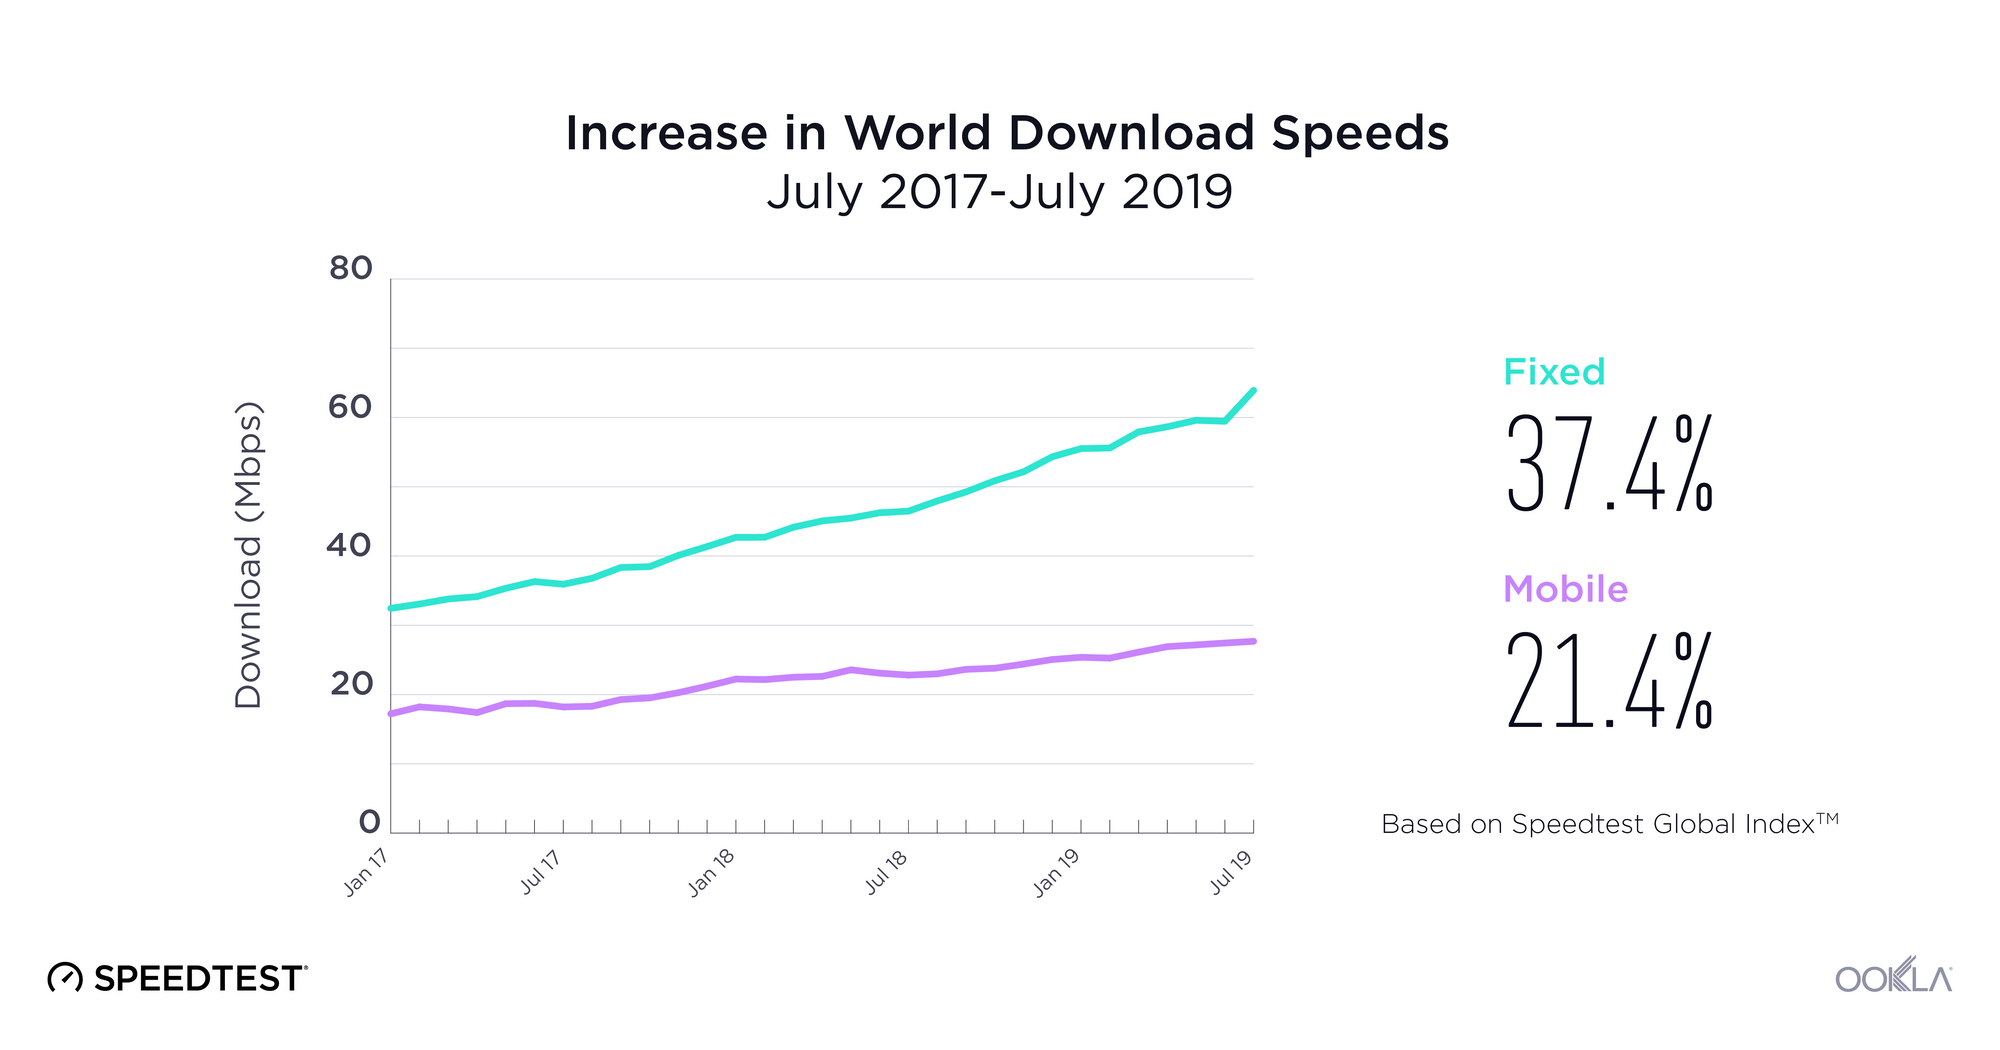
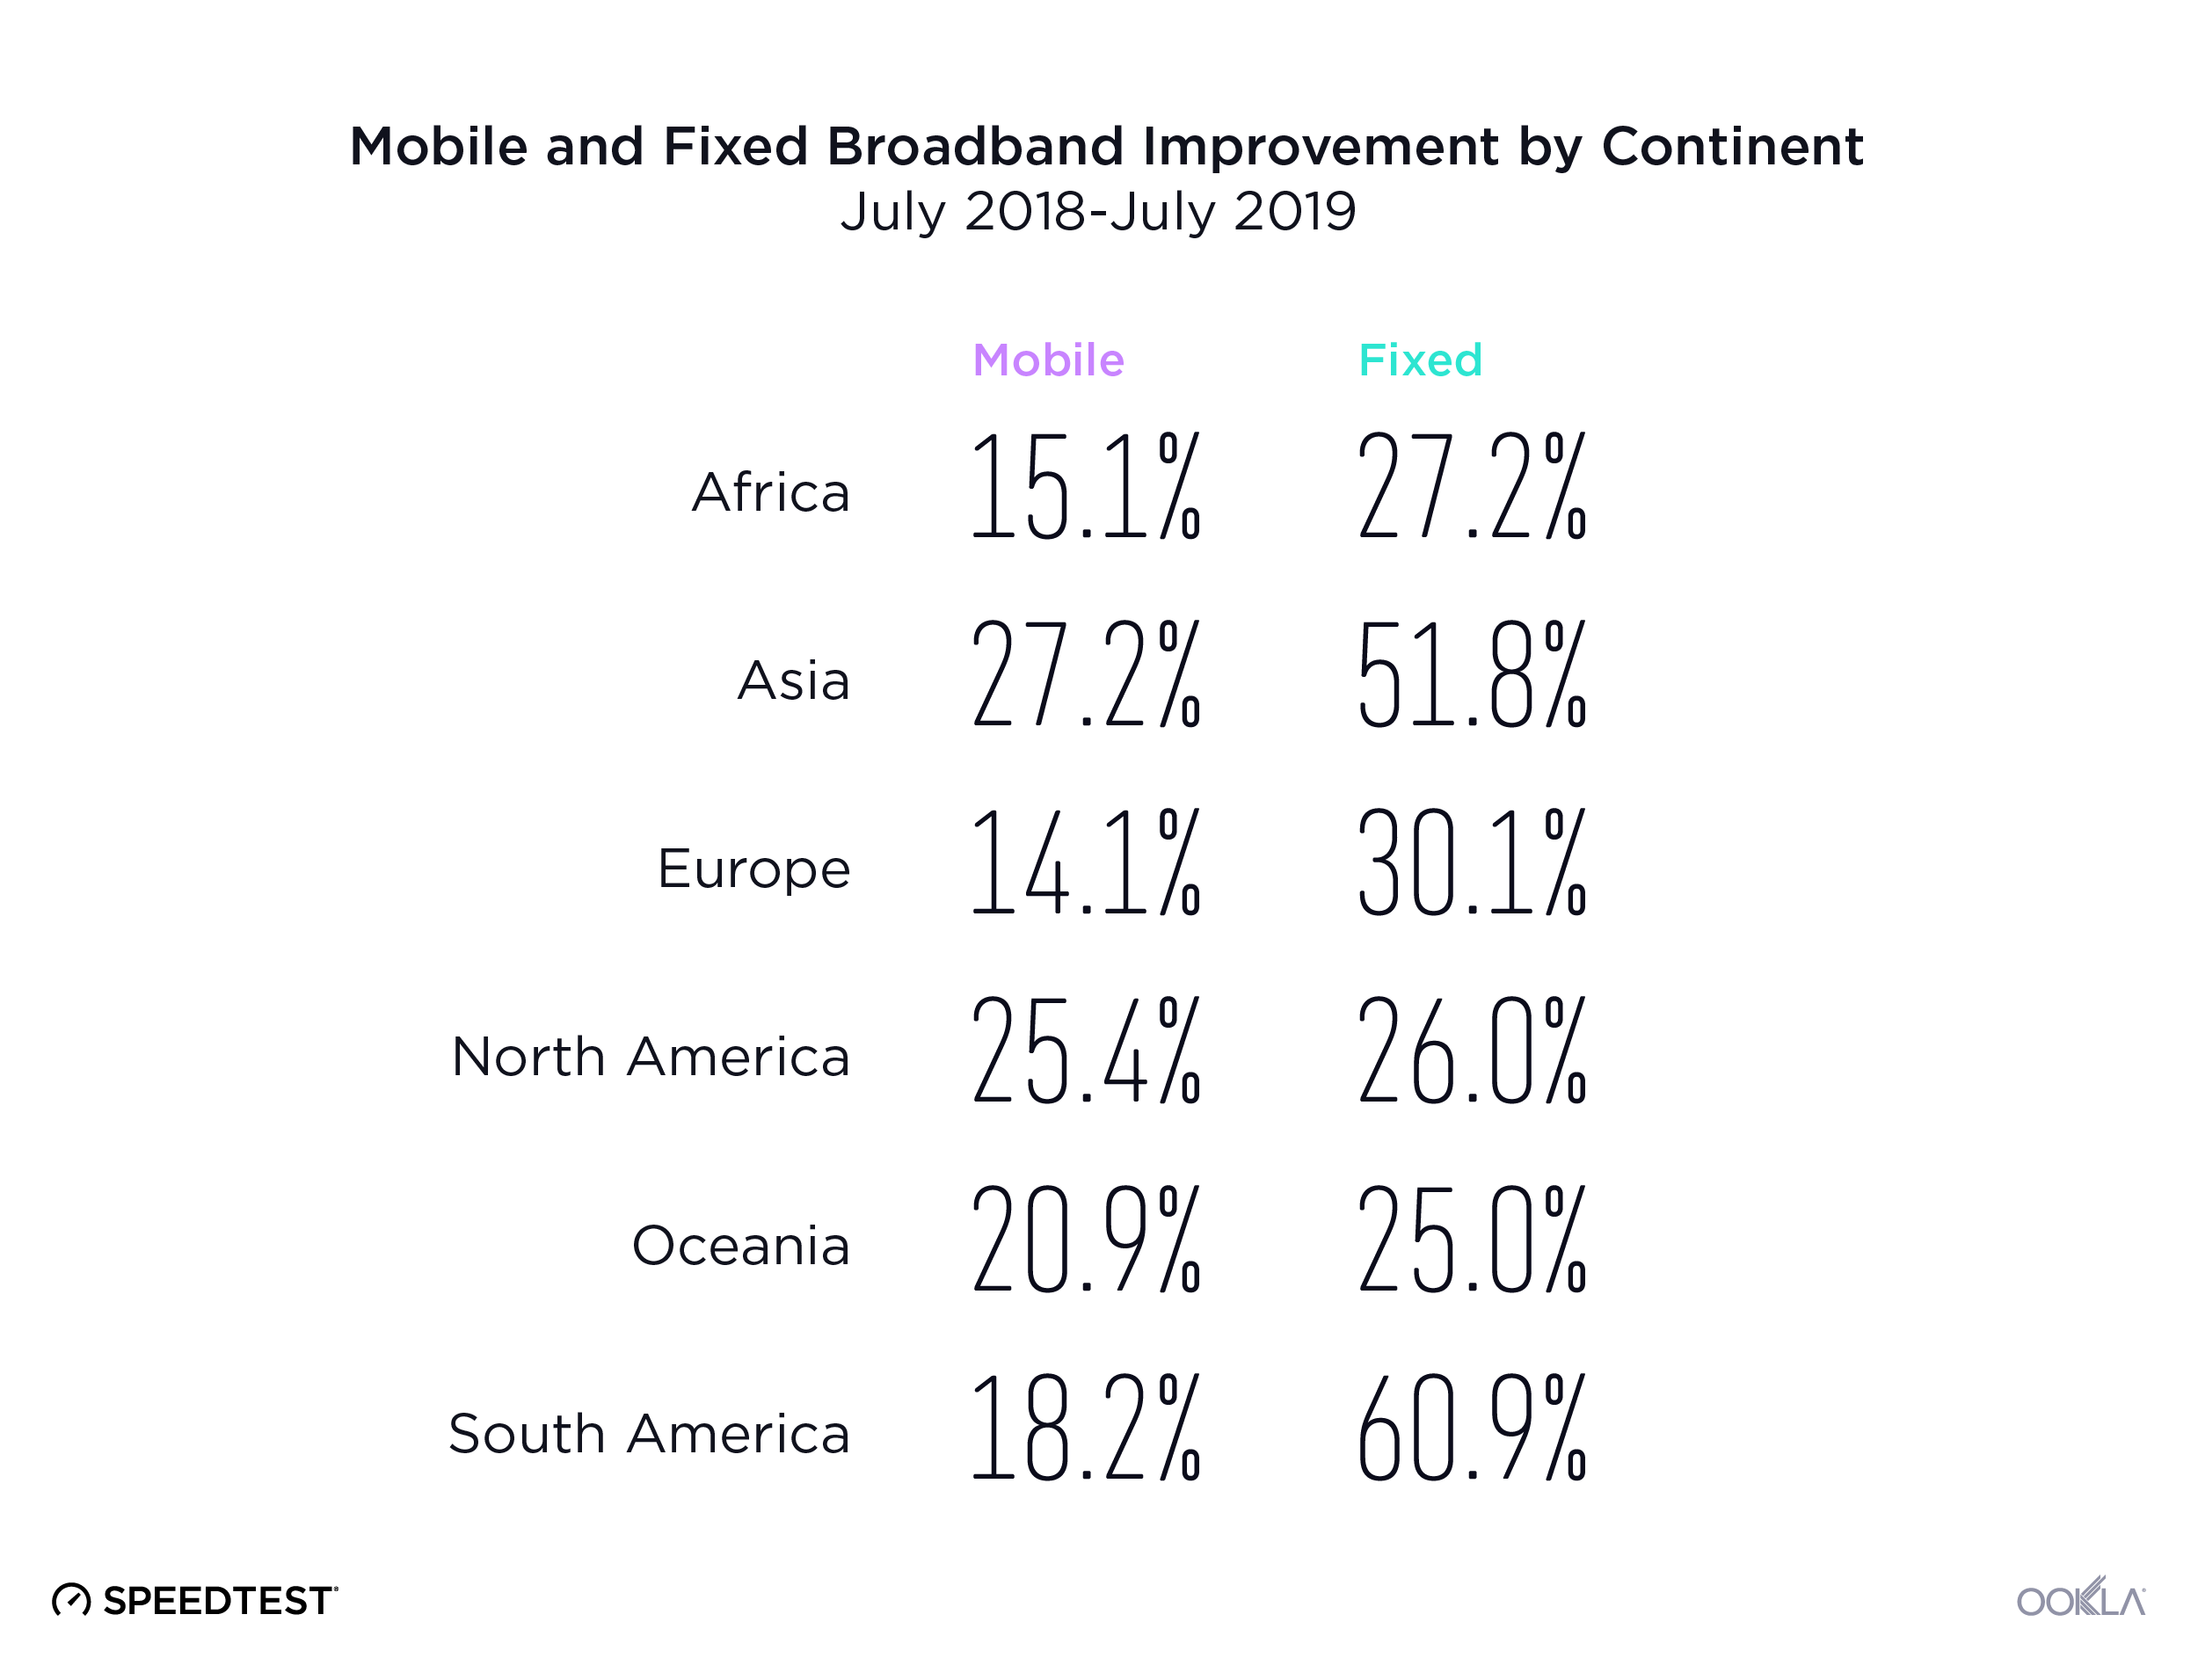
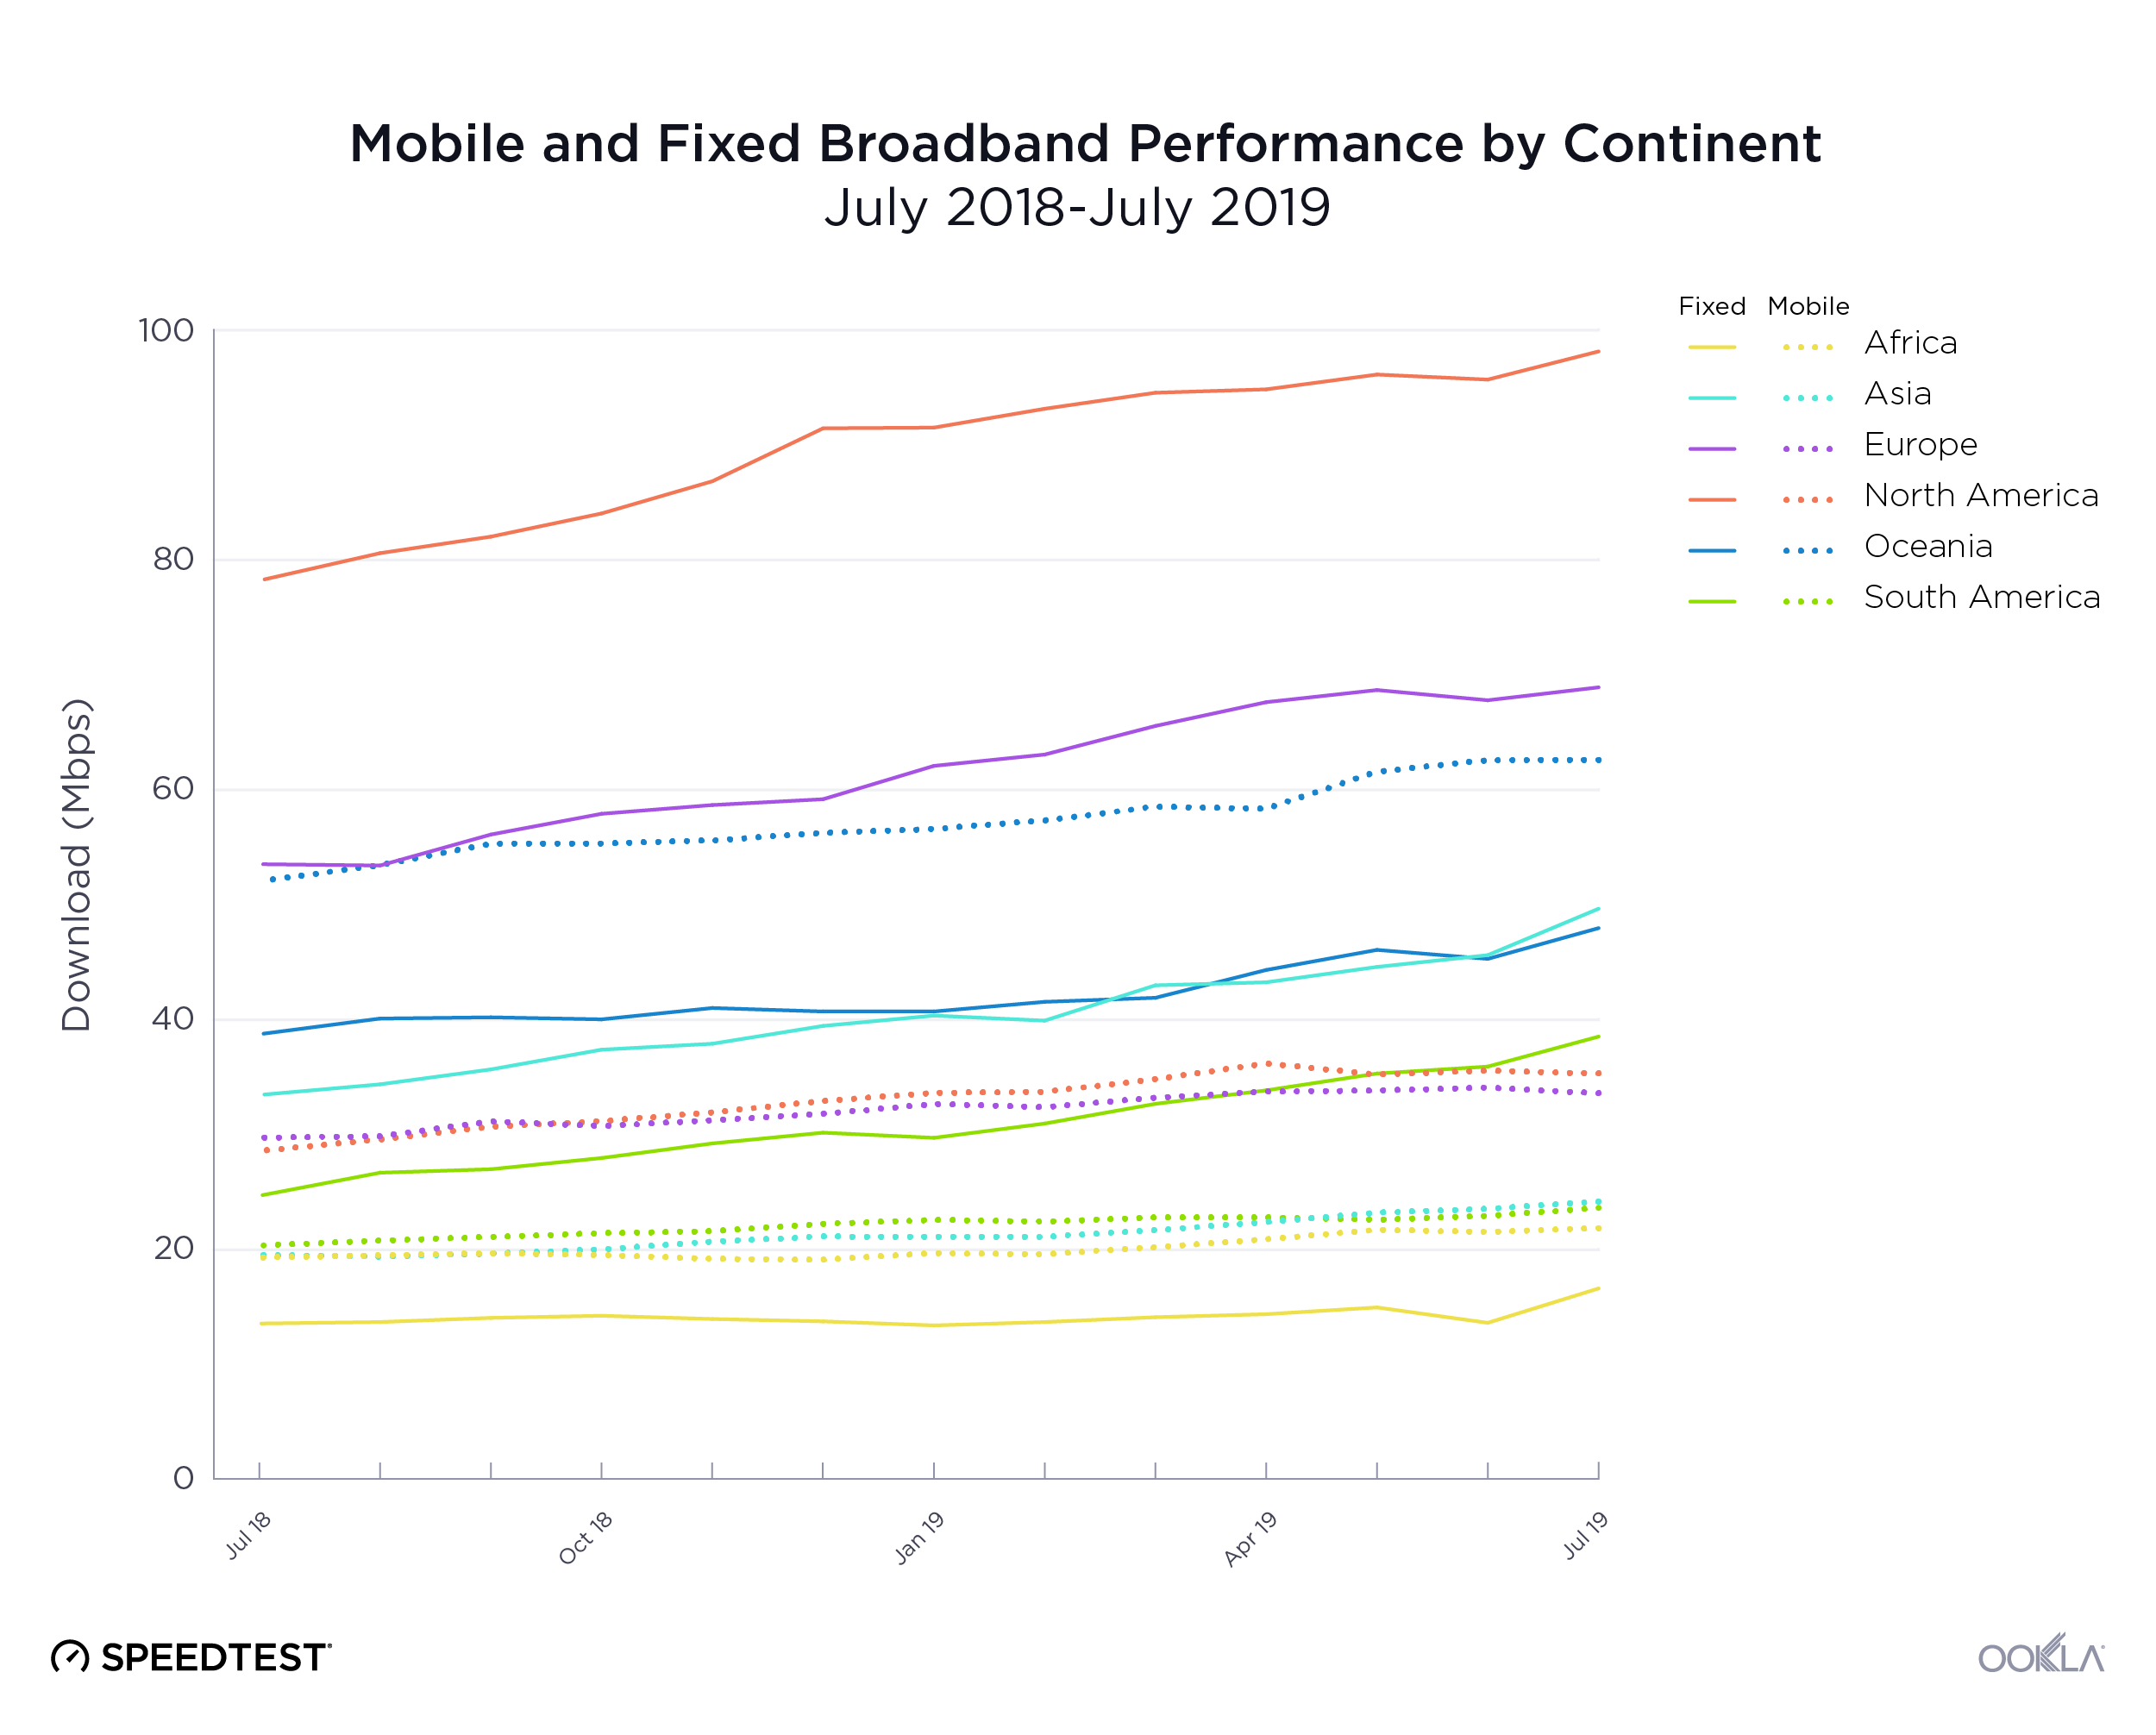
Ookla retains ownership of this article including all of the intellectual property rights, data, content graphs and analysis. This article may not be quoted, reproduced, distributed or published for any commercial purpose without prior consent. Members of the press and others using the findings in this article for non-commercial purposes are welcome to publicly share and link to report information with attribution to Ookla.

| October 1, 2019

How 5G is Changing the Global Mobile Landscape

Five months ago, we started using the Ookla 5G MapTM to track 5G across the world. In the months since, 5G deployments have increased exponentially — where we saw 294 around the world in May, today there are more than that in Switzerland alone. Today we’re exploring where 5G is gaining the most traction, including an analysis of how much faster 5G is than 4G in various markets.

Countries with the most 5G deployments

The Ookla 5G Map reveals that Switzerland is winning the race of 5G expansion with more than twice as many commercially available deployments as second-place South Korea. Kuwait has the third largest number of 5G deployments in the world.

Ookla_Countries-with-the-most-5G-deployments-2

It’s interesting to note that of the world’s six largest economies, three do not have commercially available 5G at all (China, Japan and India). China does have 29 locations where 5G is in pre-release (with 5G network hardware in place but not yet accessible to consumers). Japan is expected to launch 5G in 2020 and 5G will likely be available in India in 2021.

The other three largest economies (the U.S., Germany and the U.K.) do feature among the 10 countries with the most commercially available 5G deployments, although they individually have many fewer deployments than Switzerland, South Korea and Kuwait.

5G downloads are at least 300% faster than 4G

In theory, 5G could eventually offer download speeds about 1300% faster than those on 4G. Real-world factors affect those numbers, though, so we examined data from Speedtest IntelligenceTM to see what consumers actually experienced in several key markets between June and August 2019.

Comparing Mean Speeds on 5G and 4G
Speedtest Results | June-August 2019
Country 4G Download (Mbps) 4G Upload (Mbps) 5G Download (Mbps) 5G Upload (Mbps) % Difference Download
Australia 60.59 16.37 258.18 33.25 326.1%
Bahrain 28.80 13.43 311.41 29.43 981.3%
Kuwait 34.02 18.36 352.93 23.24 937.4%
Qatar 62.27 17.57 303.57 36.78 387.5%
Saudi Arabia 42.11 16.50 395.04 33.75 838.1%
South Korea 64.79 14.66 393.07 30.33 506.7%
Switzerland 50.65 20.10 362.75 43.12 616.2%
United Arab Emirates 59.23 20.12 334.27 32.07 464.4%
United Kingdom 31.03 11.47 181.87 18.34 486.1%
United States 34.33 9.98 477.42 21.93 1290.7%

The mean download speed over 5G was fastest in the U.S. and also showed the largest percent difference when compared with mean download speed over 4G. Saudi Arabia had the second fastest mean download speed over 5G with South Korea coming in a close third. On the other end of the spectrum, the U.K. had the slowest mean download speed over 5G. Australia was the second slowest and Bahrain third slowest. Bahrain showed the second highest percent improvement when comparing 4G and 5G download speeds, though, and Kuwait was third. Australia showed the lowest percent increase between 4G and 5G download speeds and Qatar had the second lowest.

Mean upload speeds over 5G are less remarkable, though in almost every country we analyzed they represent a 50-120% improvement over those available on 4G. Kuwait was the exception, with only a 26.6% improvement in mean upload speed when using 5G rather than 4G. The U.S. and Bahrain were nearly tied for most improved with increases of 119.7% and 119.1%, respectively, when comparing mean upload speed on 5G to that on 4G. Switzerland had the fastest mean upload speed over 5G, Qatar was second and Saudi Arabia third. Mean upload speed over 5G was the slowest in the U.K., second slowest in the U.S. and third slowest in Kuwait.

5G Share of 4G/5G Speedtest Samples
June-August 2019
Country % 5G
South Korea 12.72%
Australia 1.31%
United Arab Emirates 0.65%
Kuwait 0.64%
Switzerland 0.59%
Qatar 0.43%
United Kingdom 0.30%
United States 0.20%
Bahrain 0.09%
Saudi Arabia 0.03%

The 5G share of the tests taken on either 4G or 5G differs widely among the countries on our list. South Korea was clearly on top with 5G accounting for nearly 13% of Speedtest 4G/5G samples. This is not surprising given that one South Korean mobile operator already has 1 million 5G subscribers. Australia had the second largest percentage of 5G tests and the U.A.E. third. Saudi Arabia had the smallest percentage of 5G results.

Ookla is your go-to resource for ongoing 5G analysis

Ookla will continue to analyze 5G speeds as operators across the globe make this significant improvement in their networks. We’re uniquely capable of measuring 5G speeds because Speedtest uses a client and server testing engine capable of measuring high-speed connections (up to 10 Gbps) that dynamically scales the number of connections to the server in order to saturate and accurately measure the client-side connection. This allows us to measure the full extent of real-world performance and overcome the effects of network bottlenecks such as TCP slow start and means we are unique in our ability to measure 5G.

In addition, Ookla has partnered with operators and device manufacturers all over the world to implement accurate in-app 5G detection — even as Android Pie, which powers the current generation of 5G devices, does not natively identify 5G connection types. Through this approach, we’re able to properly configure the parameters of a Speedtest and measure 5G tests.

Keep watching this space for future analyses or contact us to learn more about how our data can help you.

To get a broader understanding of how 5G is changing the mobile landscape, read our previous coverage here:

Ookla retains ownership of this article including all of the intellectual property rights, data, content graphs and analysis. This article may not be quoted, reproduced, distributed or published for any commercial purpose without prior consent. Members of the press and others using the findings in this article for non-commercial purposes are welcome to publicly share and link to report information with attribution to Ookla.