| October 23, 2023

A Reality Check on the Progress toward a Gigabit Society

The European Commission has set forth an ambitious goal of achieving a Digital Decade 2030 strategy, also known as the Digital Compass. The aim is to expedite the digital transformation of Member States by 2030. One of the primary objectives of this strategy is to improve digital connectivity, which will be measured through specific targets such as 100 Mbps services by 2025 and gigabit coverage to all EU households by 2030. In this article, we will discuss the progress made so far, the disparities in user experience, and the challenges that need to be addressed to achieve Europe’s connectivity goals.

Key messages 

  • Digital Decade Ambition: The ambitious goals of the EU’s Digital Decade strategy are indeed lofty. Broadband services might promise speeds in excess of 1 Gbps, but the reality is that users rarely experience that level of speed. However, while the gap between advertised speeds and actual speeds for gigabit services is wide, speeds approaching 100 Mbps are far more common. 
  • Median Download Speeds and Infrastructure Development: Several European countries are making substantial progress in offering high-speed broadband. Denmark, Spain, France, and Romania have notably fast median download speeds, primarily due to their fiber-to-the-home (FTTH) infrastructure investments. The type of broadband technology used in those countries (and others) significantly influences the gap between download and upload speeds, with fiber-based networks showing more balanced speeds.
  • AltNets Drive Fiber Adoption: Alternative network providers (AltNets) play a vital role in accelerating fiber adoption and addressing challenges mainstream ISPs face. Their role varies across countries and regions.
  • Take-up rates remain a challenge: With the completion of fiber rollout in several countries, the focus has now shifted towards promoting fiber subscriptions. However, there are challenges that persist, such as consumer reluctance and the need for incentives. A survey conducted in rural France revealed that 42% of the respondents found their current internet sufficient, while 37% said that they would be encouraged to upgrade if offered incentives.

You can also register for our November 8 webinar, where a panel of industry experts will discuss how Europe can accelerate the expansion of gigabit-capable infrastructure. Register now

On the road to 100 Mbps

Chart of Percentage of Households Subscribing to Fixed Broadband of at Least 1 Mbps and Proportion of Users that Achieved 100 Mbps

The European Commission aims to ensure that all European households, businesses, and public institutions should have access to “high internet speeds” of at least 100 Mbps by year-end 2025. The EU is showing progress in terms of achieving that target. According to Broadband Coverage in Europe 2022, 86.6% of EU households were within 100 Mbps + coverage, meaning they had access to broadband services capable of providing at least 100 Mbps download speeds. 

While having networks available does not automatically equate to real penetration or adoption rates, it is an important prerequisite. Physical accessibility to network services is a vital first step before actual usage, which is influenced by factors such as affordability, awareness, and the perceived need for the service.

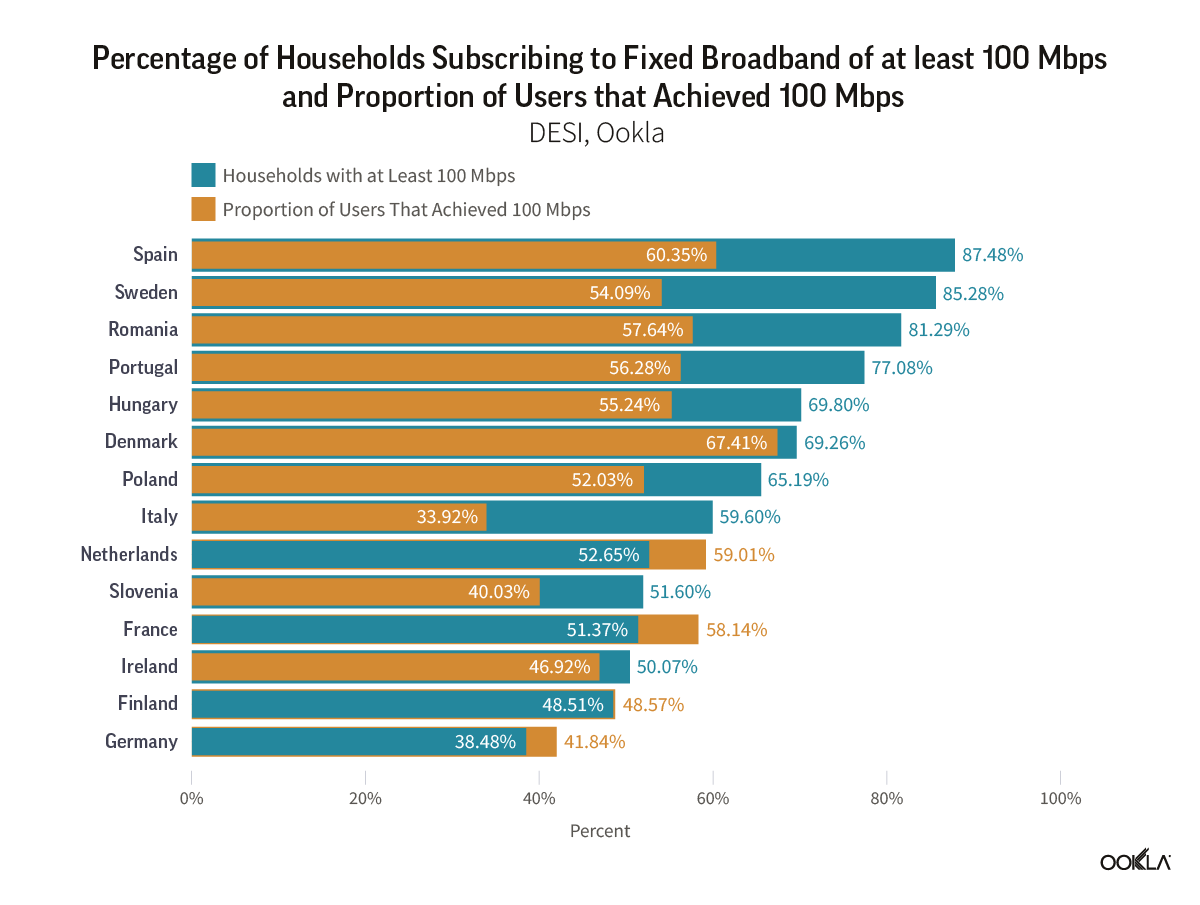
According to the Digital Economy and Society Index DESI 2023 dashboard for the Digital Decade, 55.08% of EU households had already subscribed to fixed broadband services with internet speeds of at least 100 Mbps. While this rate of subscribers is significant and an indicator of the EC’s ongoing progress, the region is still far from achieving its goal of universal, 100 Mbps coverage by 2025. Some countries like Spain, Sweden, and Romania, where over 80% of households subscribe to broadband exceeding 100 Mbps, have already made significant progress in terms of fiber coverage. 

However, in those countries, there is a significant gap between what households subscribe to and what we see from Ookla® data in terms of users actually experiencing speeds above 100 Mbps. Netherlands, France, and Germany are the outliers where we see more users having “high internet speeds” compared to the speeds advertised in their broadband subscription package. This is particularly interesting because Germany still heavily relies on VDSL for high-speed access technologies. Still, there is a significant amount of work to be done before countries can deliver on their strategies to achieve the 100 Mbps target.

Chart of Fibre to the Premise Coverage as Percentage of Households

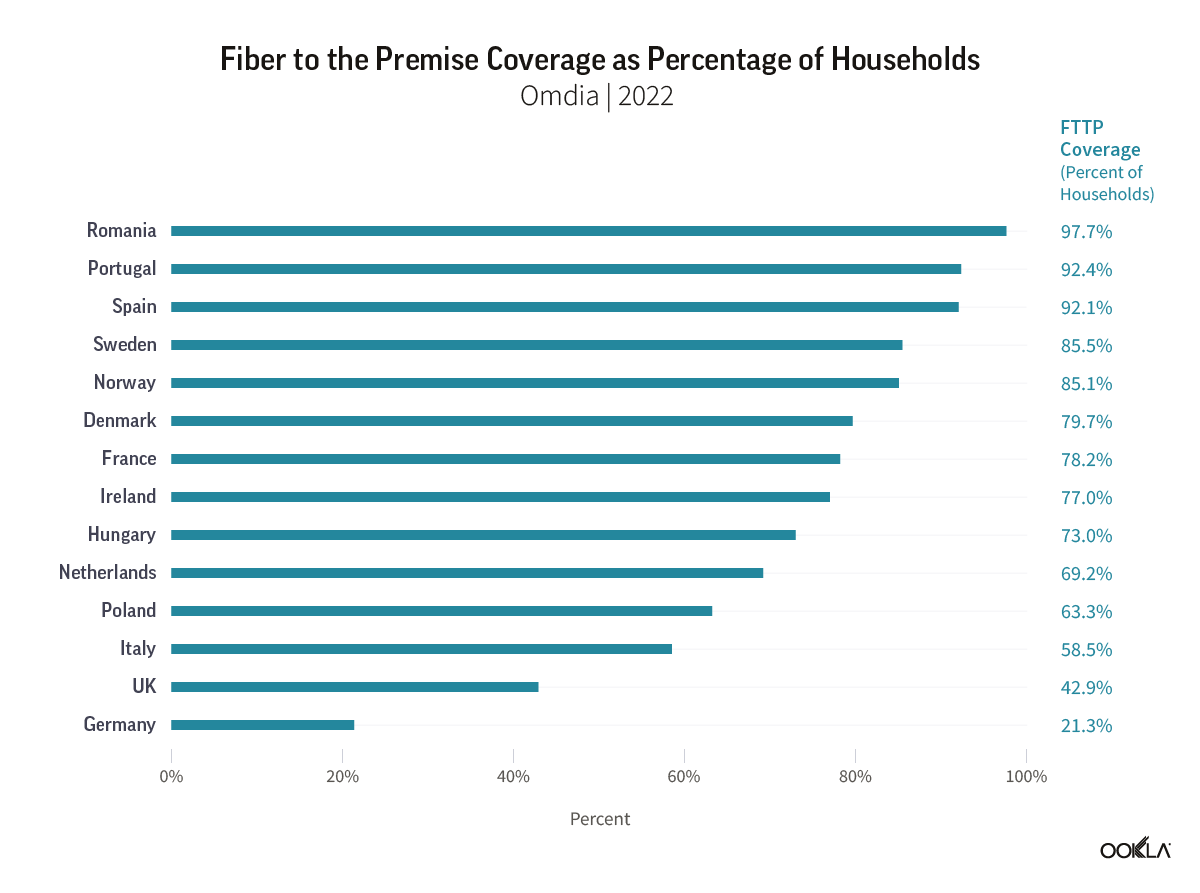
The EC’s goal of gigabit connectivity is certainly one of the driving forces behind the rollout of fiber networks in the region. So far, progress is mixed across the region in terms of fiber network rollouts and adoption. As we have discussed, regulatory incentives propel the move to fiber. For example, Romania has one of the highest Fiber to the Home/ Building (FTTP/B) penetration rates across the region — nearly 97.7% of households — which is partially driven by government-backed fixed infrastructure projects such as RoNet, and the special attention given to rural and disadvantaged areas. Portugal, which already scored high on fiber coverage, plans to launch an international public tender by the end of 2023 for a project to cover all underserved areas with fiber-optic networks to boost fiber penetration further.

The reality of gigabit speeds 

The European Commission’s Digital Decade 2030 strategy seeks to extend gigabit (1 Gbps) connectivity to every European Union household by 2030. To track the progress of these objectives, the DESI plays a crucial role in tracking EC’s progress. Only 56% of households in the EU have access to the necessary fiber networks for gigabit connectivity, and the take-up rate (proportion of households that subscribe to fiber) is even lower. According to the DESI 2023 dashboard for the Digital Decade, 13.76% of households in the European Union have subscribed to fixed broadband with at least 1 Gbps as of 2022. Nevertheless, there is a significant disparity in these percentages across different EU nations. For instance, only five countries surpassed the EU value – France leading with 39.94%, Hungary second at 29.81%, followed by Romania at 23.35%, Denmark at 18.66%, and Spain at 14.57%.

Chart of Percentage of Households Subscribing to Fixed Broadband of at Least 1 Gbps

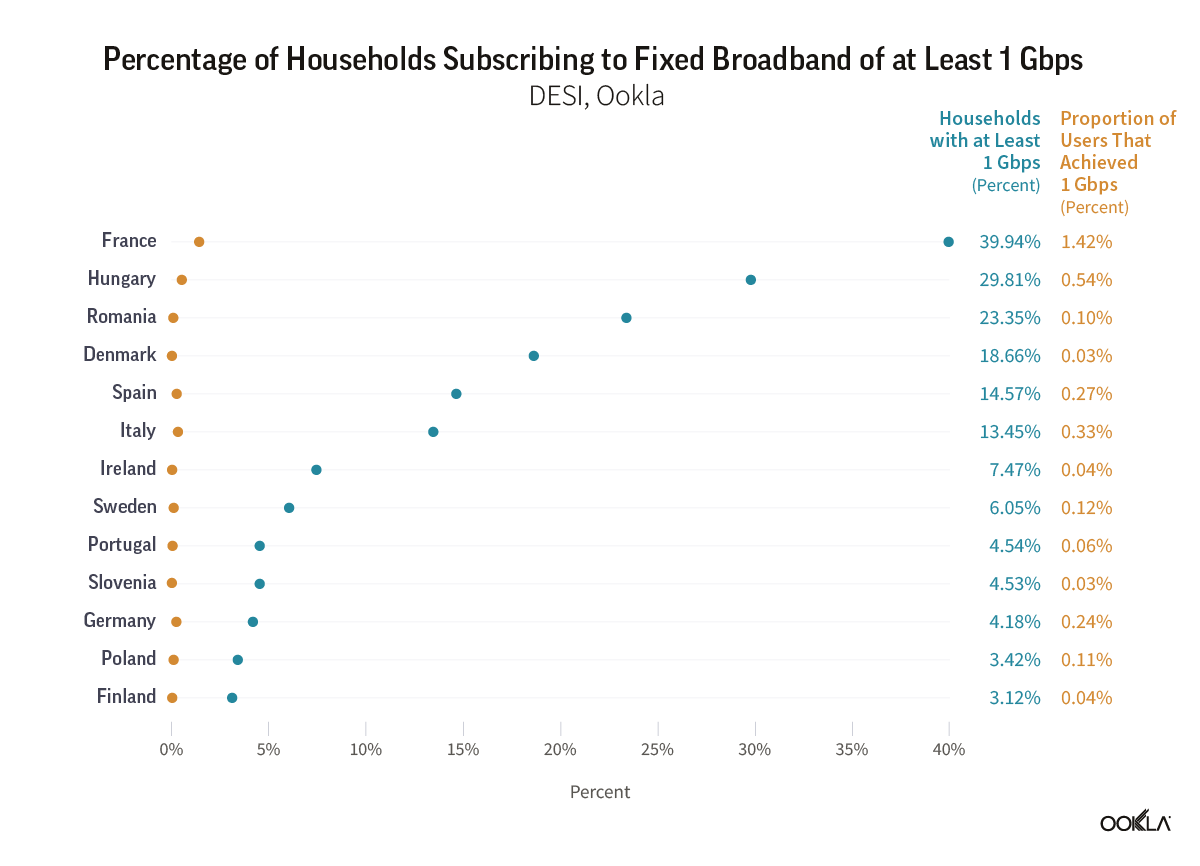
Looking at this data one might believe that many European households have access to Gigabit internet speeds. However, the reality is different as not all of them genuinely experience such high speeds. In fact, the proportion of Speedtest® users registering median download speeds of at least 1 Gbps in many countries is quite low. For example, France only had 1.42%, Hungary at 0.54%, Romania at 0.1%, Denmark at 0.03%, and Spain at 0.27%. 

The significant gap between expectations and reality underscores the importance of not only rolling out gigabit-capable networks but also stimulating demand for those services. Service providers also need to pay attention to home networking equipment. Our research has shown that in markets where legacy broadband technology (such as DSL or coax cable) is being replaced by advanced cable and fiber connections, Wi-Fi performance can lag behind ethernet. Wi-Fi speeds typically range from 30-40% of ethernet, indicating a need to accelerate the adoption of more advanced Wi-Fi technologies and optimize the home network environment.

Median download and upload disparities

Median speeds are a standard metric for measuring performance, but there’s more to the story for the end-user experience. Access technology, be it DSL, cable, or fiber, as well as customer premises equipment and end-user devices, significantly influence the user experience. In our recent article, we highlighted how the persistent use of legacy and underperforming Wi-Fi standards in home networks can hamper efforts to provide the best network experience to customers despite progress in terms of fiber rollout and adoption.

Median Download and Upload Speed across a Sample of European Countries

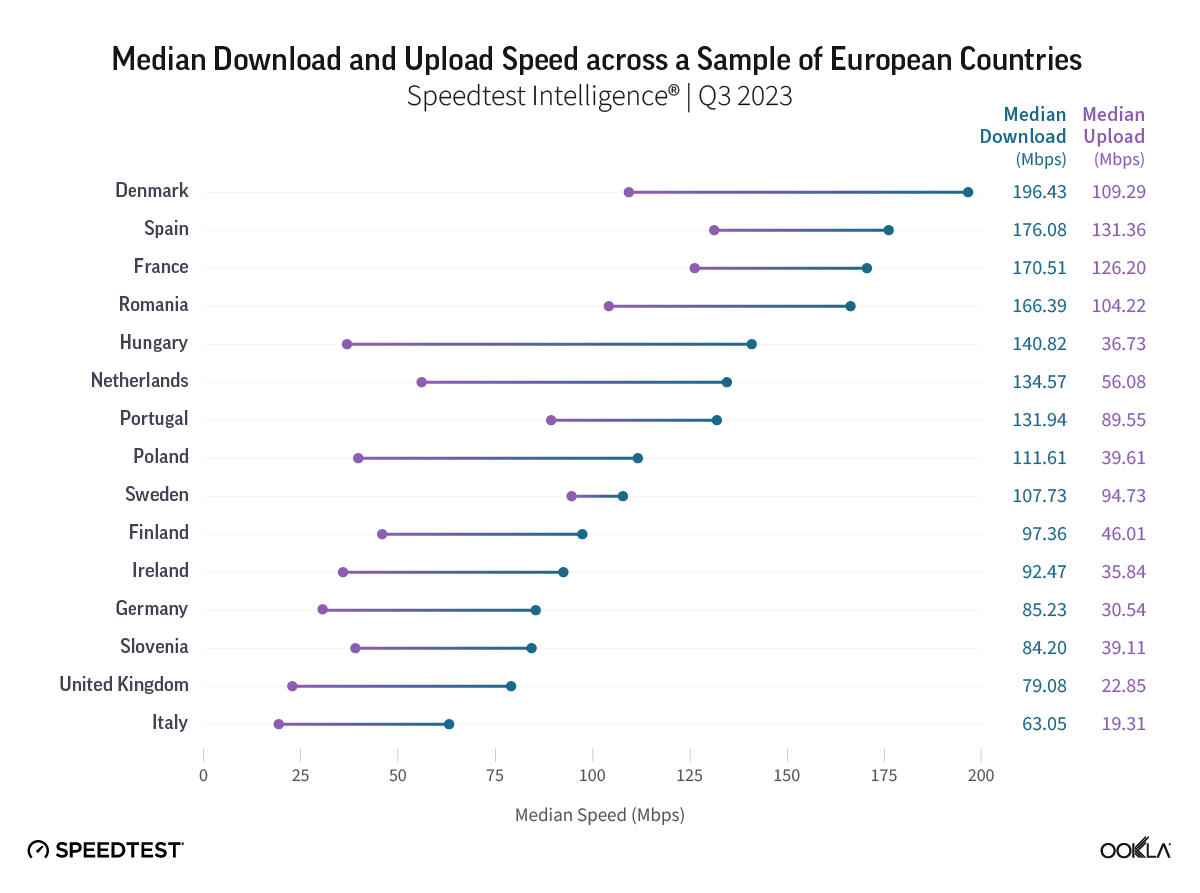
According to Speedtest Intelligence® in Q3 2023, across Europe, Denmark had the fastest median download speed for fixed broadband (196.43 Mbps), followed by Spain (176.08 Mbps), France (170.51 Mbps), and Romania (166.39 Mbps). Notably, several of those countries have a substantial gap between median download and upload speeds. The type of broadband technology implemented can heavily influence the divergence between download and upload performance. Nations still reliant on DSL and cable often exhibit lower median upload speeds and a wider gap between upload and download speeds. On one hand, the UK and Germany lag behind other countries in broadband infrastructure upgrades due to their reliance on copper-based technologies and cable networks and are at the tail end of the ranking. 

On the other hand, Sweden, with a 63% Fiber-to-the-Home (FTTH) penetration rate in 2022, has the narrowest gap between download and upload speeds. Forward-thinking broadband infrastructure and significant municipal involvement have positioned Sweden to reach the EC’s goals in the coming years. France, Spain, Denmark, Romania, and Portugal are also making significant progress toward achieving full-fiber coverage, with France expecting a full-fiber rollout by 2025. As fiber broadband adoption increases, the gap between download and upload speeds will narrow, mainly because fiber subscriptions are typically offered with symmetrical speeds, where users would experience the same level of speed for both download and upload usage. 

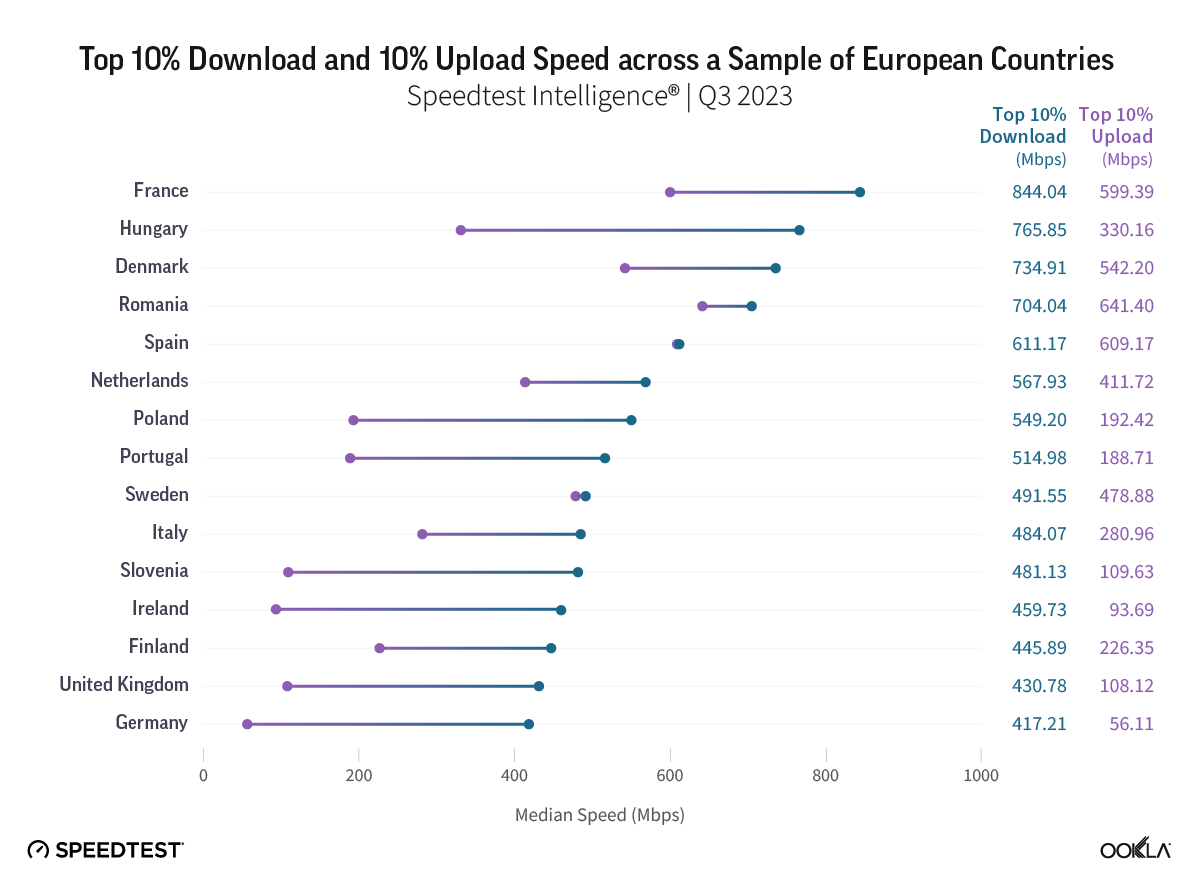
However, even when we look at “the best-connected” Speedtest users (those seeing speeds in the top 10th percentile of our results), there’s a wide range of performance. Download speeds ranged between 417.23 Mbps and 844.04 Mbps, while the range for upload speeds was even wider, with median upload speeds ranging from 57.11 Mbps to 599.39 Mbps. 

When looking at speeds at the 10th percentile, only four countries topped 700 Mbps. France led with a top speed of 844.08 Mbps, followed by Hungary at 765.85 Mbps, Denmark at 734.91 Mbps, and Romania at 704.04 Mbps. Notably, three of these countries (Romania, France, and Denmark) also lead in the top 10% of upload speeds, with all three exceeding 500 Mbps. 

While for most countries included in this analysis, top speeds are at least a few hundred Mbps apart, there are a few exceptions. Spain shined bright, with the top 10% of its download and upload speeds closely matched at 611.17 Mbps and 609.17 Mbps, respectively. 

Chart of Top 10% Download and Upload Speed across a Sample of European Countries

Beyond median speeds

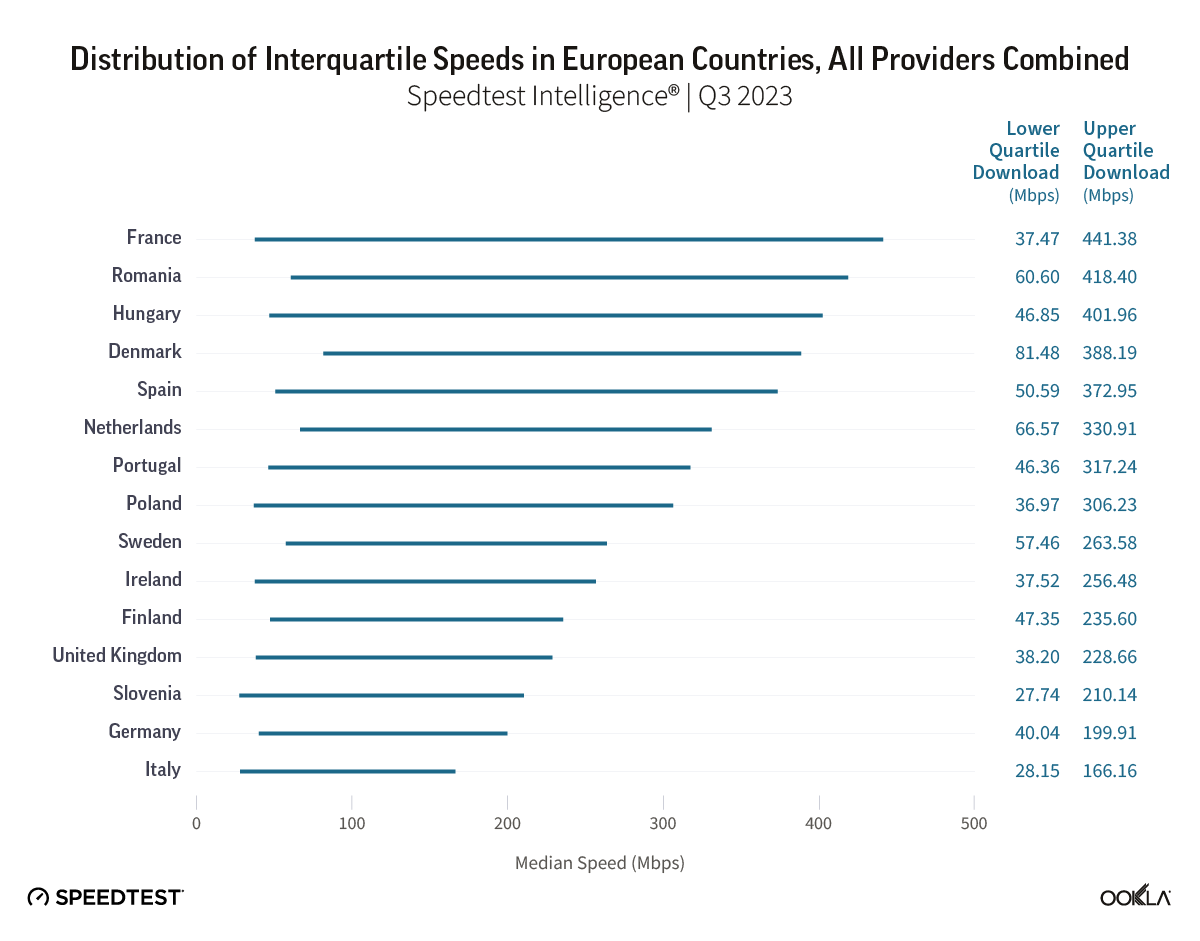
To delve deeper into the performance and reliability of internet services across different countries, it can be helpful to look at the expected speed range, i.e., the range of speeds that the majority of users experience. This middle 50% of speeds are captured by the interquartile range, with the lower value of the range, or lower quartile, indicating the bottom 25% of speeds and the upper value of the range, or upper quartile, indicating the top 25% of speeds. Examining Speedtest Intelligence data from Q3 2023, the lower quartile download speed across European countries ranged from 28.15 Mbps to 81.48 Mbps (in other words,, 25% of downloads were below that speed), while upper quartile speeds clocked in between 166.16 Mbps and 441.38 Mbps (i.e., 25% of downloads were above this speed). 

Chart of Distribution of Interquartile Speeds in European Countries, All Providers Combined

Role of AltNets

According to the FTTH Council Europe, alternative operators (AltNets) are playing a significant role in the adoption of fiber in the EU39 region. The EU39 region comprises the EU27, the UK, Iceland, Israel, North Macedonia, Norway, Serbia, Switzerland, Turkey, and 4 CIS other countries. In 2021, around 56% of FTTH/B initiatives were led by AltNets, which marks a shift from 2011 when alternative ISPs had a 71% share, and incumbents accounted for only 21% of initiatives. 

Chart of Number of Active Internet Service Providers (ISPs) and FTTH Share of All Connections

We looked at data from Omdia to determine whether there is a correlation between the number of active ISPs and the speed of the transition to fiber networks measured by FTTH share of all connections. The relationship is not straightforward and varies significantly depending on each country’s competitive landscape and government initiatives. 

Across a number of countries fiber accounts for the majority of subscriptions – Spain comes on top with 81.8%, followed by Romania (81.7%), Sweden (77.5%), and Portugal (62.4%). Spain is a good example of a market that has been migrating to fiber away from copper ahead of the incumbent Telefonica turning off its legacy fixed network in 2024. Furthermore, Spain’s National Commission for Markets and Competition (CNMC) has simplified its ‘MARCo offer’, making it easier for alternative operators to access Telefonica’s infrastructure to launch their own fiber optic services. 

It is worth noting that countries like the UK and Poland, which have many ISPs, are also leading the way in AltNet-driven fiber initiatives. In our previous article looking at the impact of AltNets in the UK, we concluded that AltNets played an important role. In fact, AltNets provided the top speeds in London, Glasgow, Liverpool, and Manchester, as well as across a number of counties. Public funding has helped facilitate the emergence of fiber ISPs in rural areas where fiber deployment is not commercially viable. Other AltNets like Hyperoptic are already well established, deploying and operating an FTTP network in high-density areas, which connects existing and new multi-dwelling buildings.

Take-up rates come with challenges

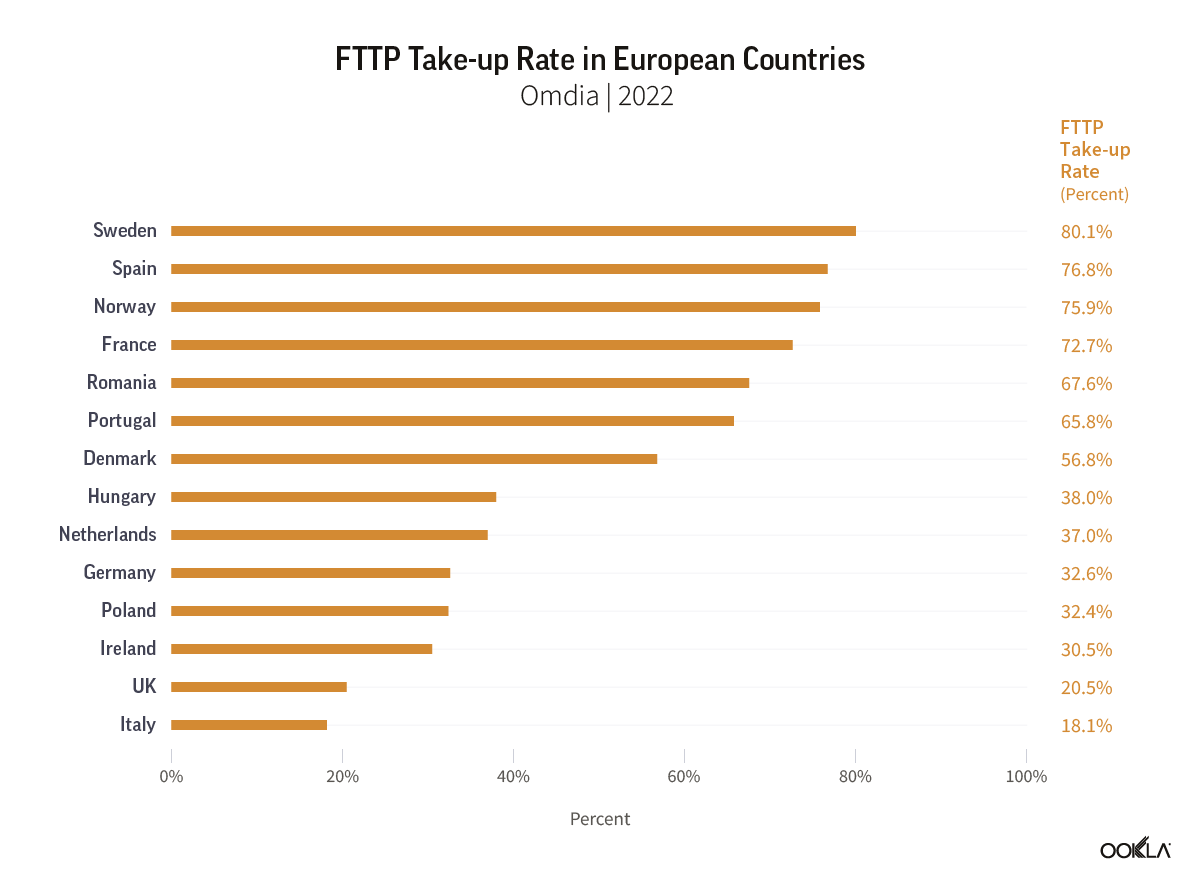
As fiber rollout nears completion in some countries, the focus shifts to selling fiber subscriptions to households that are within fiber network coverage. Sweden leads with an 80.1% consumer take-up rate (proportion of households that subscribed to and are actively using fiber-optic broadband services), but Spain, Norway, and France also boast high rates above 70%. 

Chart of FTTP Take-up Rate in European Countries

Sweden was the country that pioneered the open access model for fiber networks to drive competition and contributed to the country’s high fiber broadband penetration rates. Fiberhost, a Polish open-access network provider, is a significant beneficiary of EU funds, with 99% of funding for building the country’s fiber network in white spot areas (areas with limited or no access to high-speed internet).

There also has been notable progress in the wholesale networks market in Europe, some of which look to connect remote and rural areas. The Italian wholesale operator, Open Fiber, is partially funded by the country’s National Recovery and Resilience Plan (PNRR), with the goal of connecting the grey areas (where no other operator has plans to develop an NGA network) to gigabit speeds. 

However, challenges persist in convincing consumers to switch to full fiber, even in countries with high take-up rates. For instance, a joint venture by Orange conducted a survey in rural areas of France to understand why households with FTTH access hadn’t upgraded to fiber services. The study revealed that 42% found their current internet sufficient, while 37% said incentives would encourage them to upgrade. Incentives and other initiatives are being implemented to migrate customers onto fiber networks in many countries in the region and across the world. 

Future Initiatives and Investments

Fiber offers superior internet speeds, lower latency, enhanced security, and environmental sustainability – a noteworthy upgrade from copper networks and also a path forward for some cable operators (instead of DOCSIS 4.0). AltNets are making strides in driving fiber deployment across Europe, pushing toward the EC’s ambitious goals of achieving a gigabit society.

Despite progress, obstacles remain in convincing consumers to fully transition to fiber services. Comprehending consumer behavior, promoting fiber benefits, and inspiring initiatives will all play significant roles in this endeavor. Likewise, continued investments must be made to keep Europe on track to attain its connectivity targets

For more insightful updates on Europe’s fiber connectivity status, look forward to the Network X event in October 2023. It’ll offer a live pulse on the latest developments in fiber connectivity. We will continue to follow European countries’ progress toward Gigabit society and monitor its impact on fixed broadband speeds. If you’d like to learn more about internet speeds and speed performance in other markets around the world, visit the Speedtest Global Index™.

You can also register for our upcoming webinar, “Accelerating Europe’s Gigabit Revolution” on Wednesday, November 8 at 9 a.m. CET (GMT+1). A panel of industry experts will come together to discuss how Gigabit Society fits into Europe’s digital transformation strategy and propose strategies to ensure digital access for all. A recording will be provided for registrants who can’t join the live presentation. Register now

Ookla retains ownership of this article including all of the intellectual property rights, data, content graphs and analysis. This article may not be quoted, reproduced, distributed or published for any commercial purpose without prior consent. Members of the press and others using the findings in this article for non-commercial purposes are welcome to publicly share and link to report information with attribution to Ookla.

| December 10, 2018

The World’s Internet in 2018: Faster, Modernizing and Always On

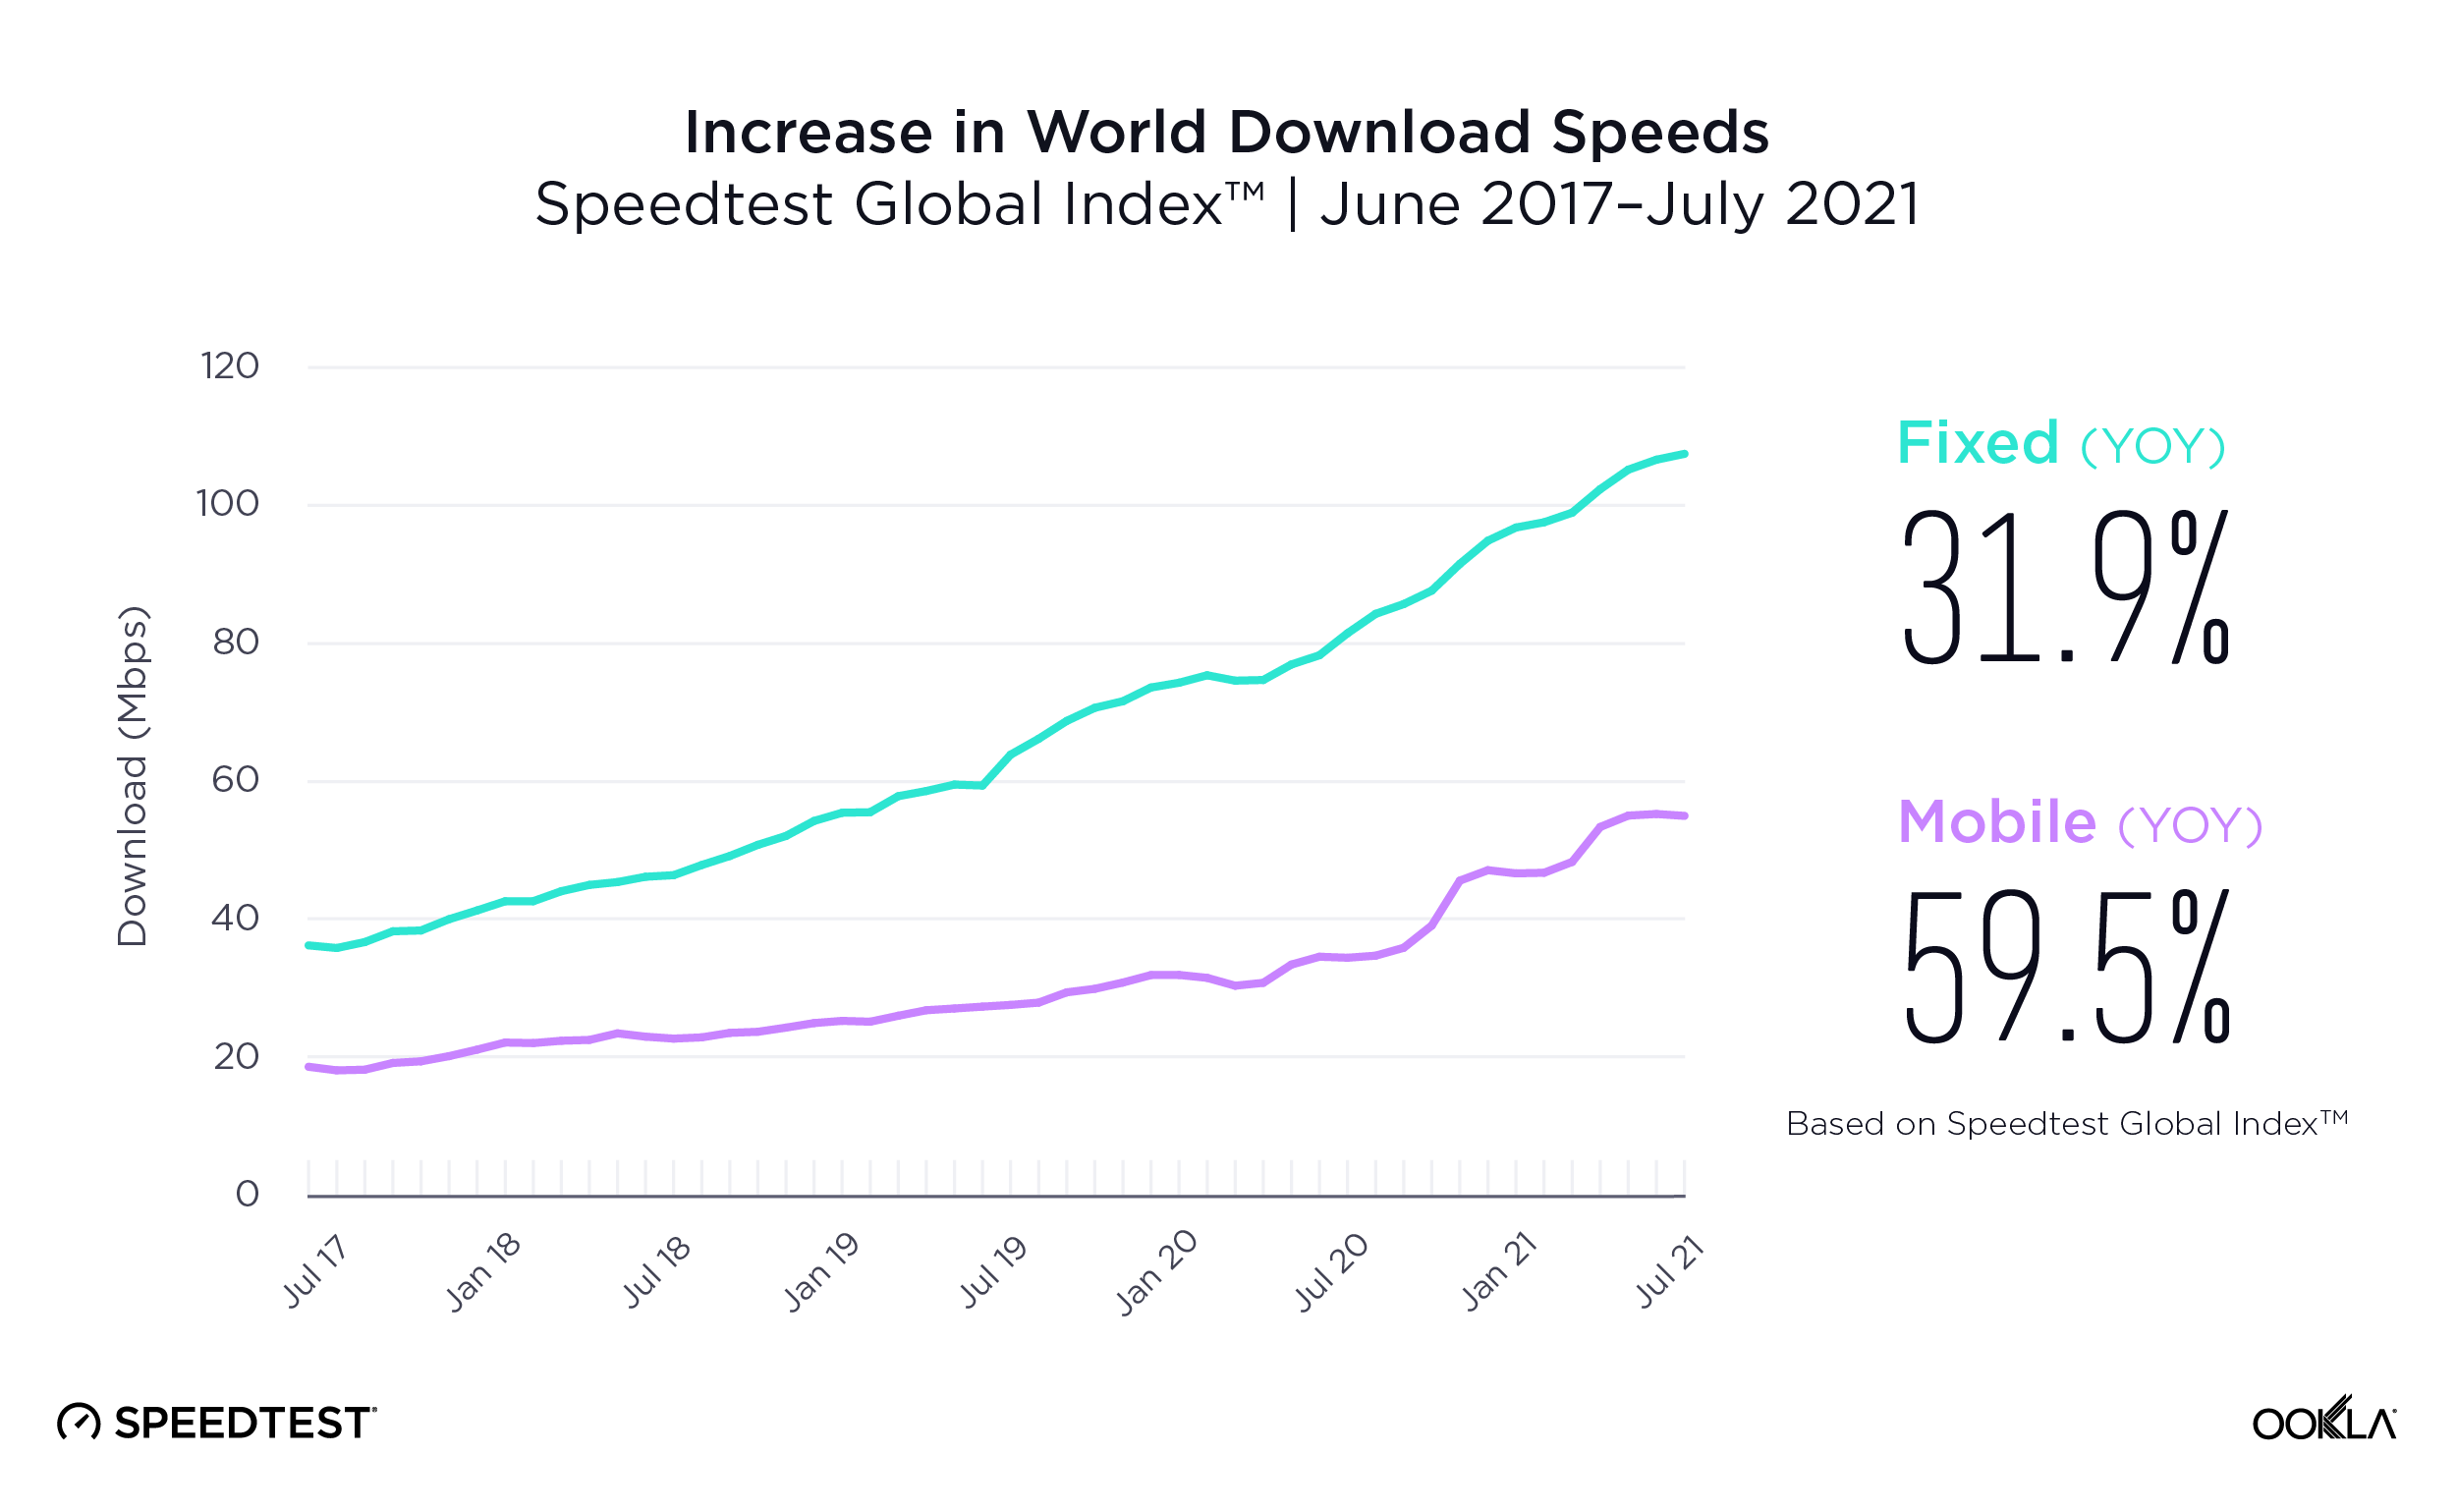
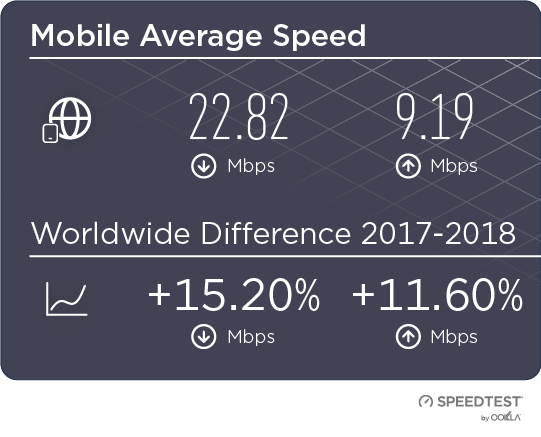
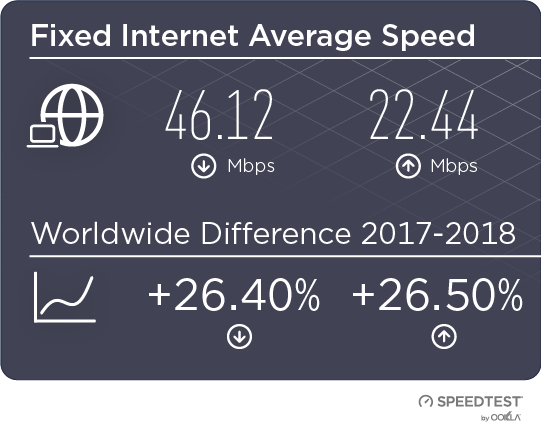
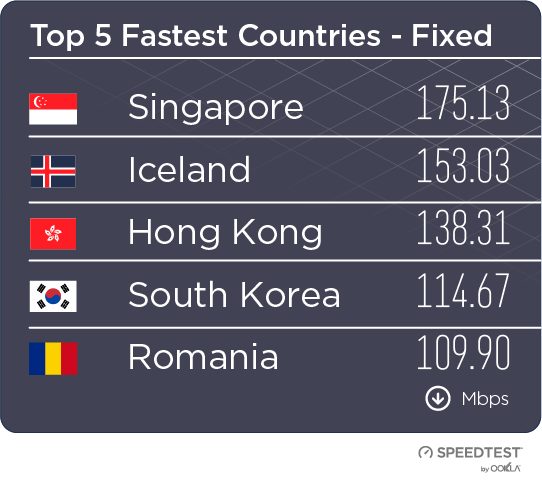
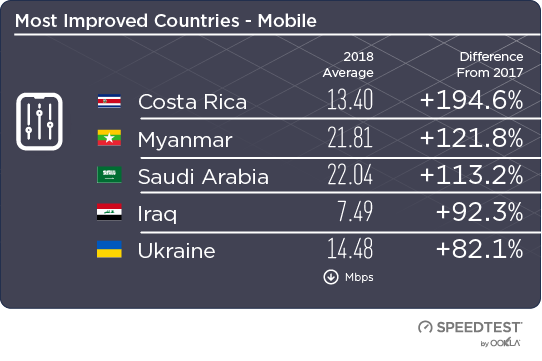
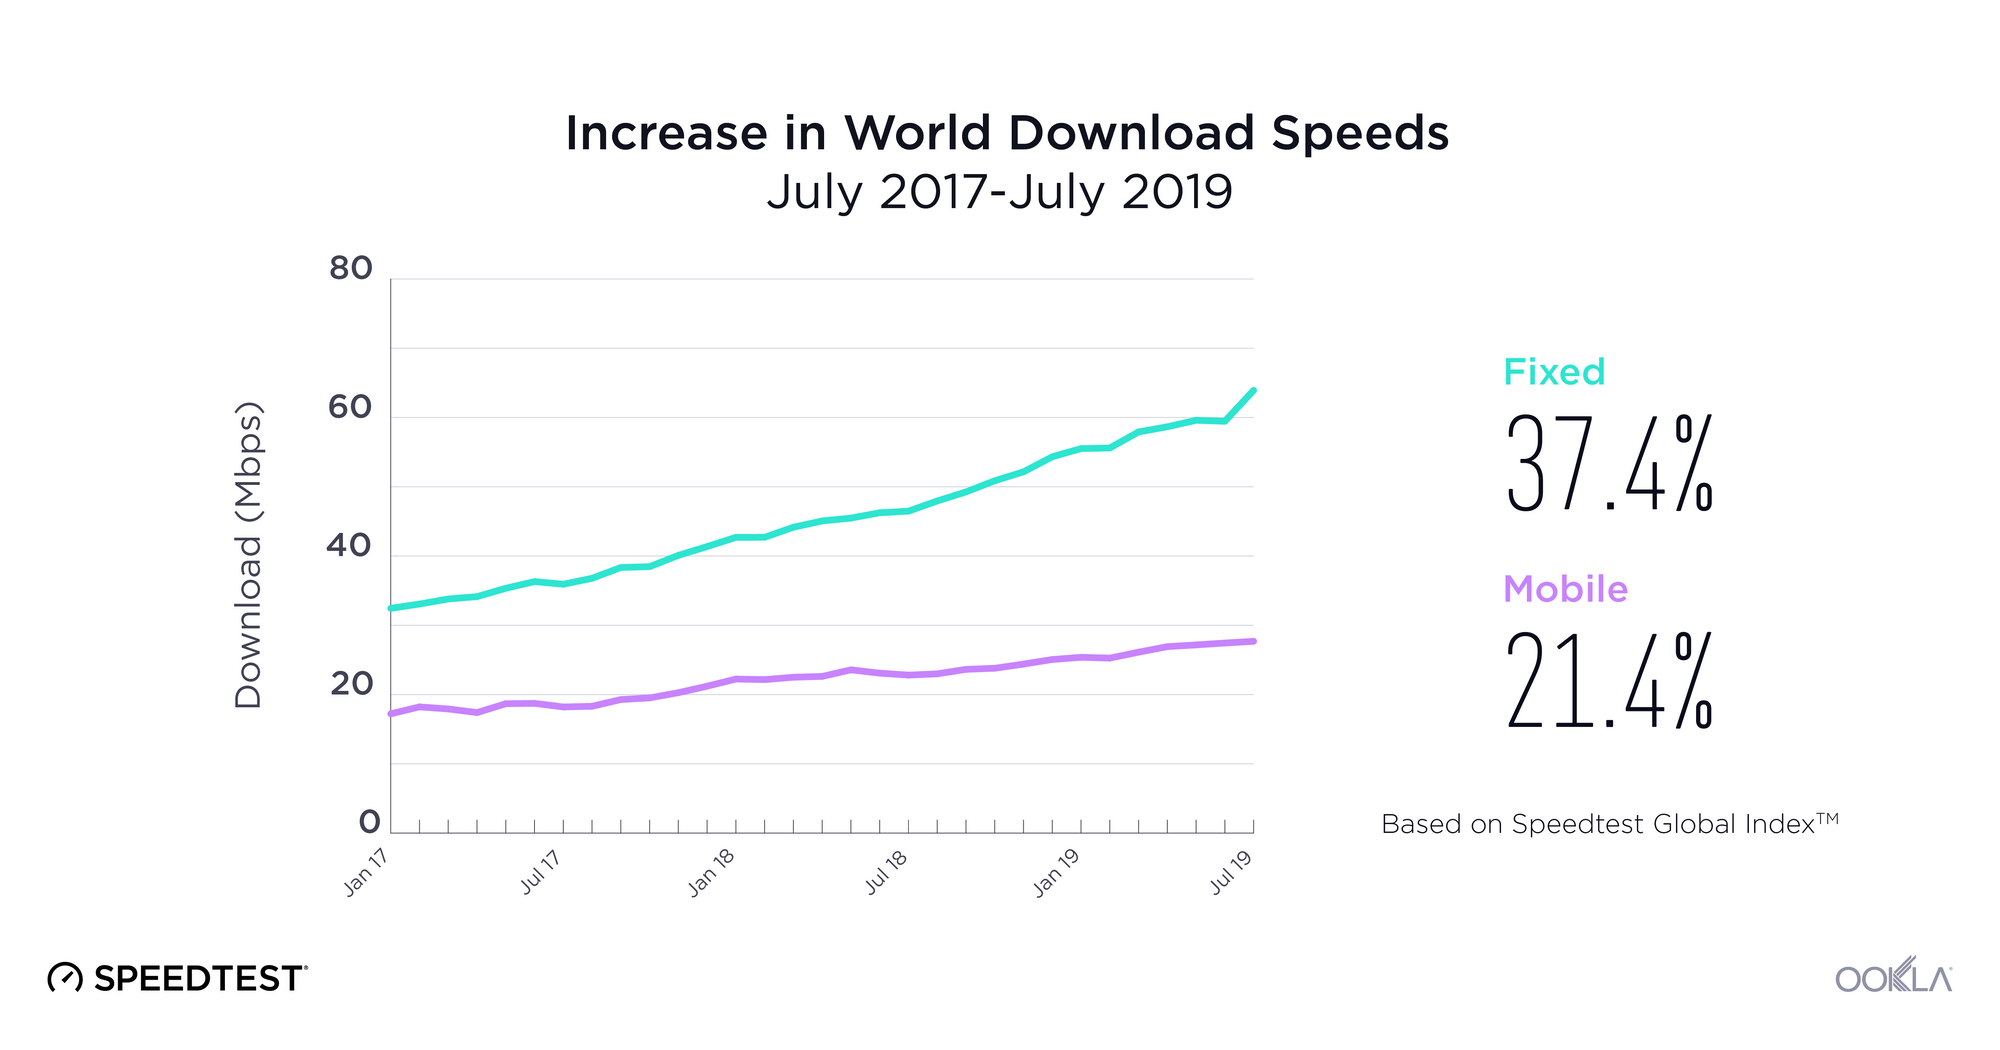
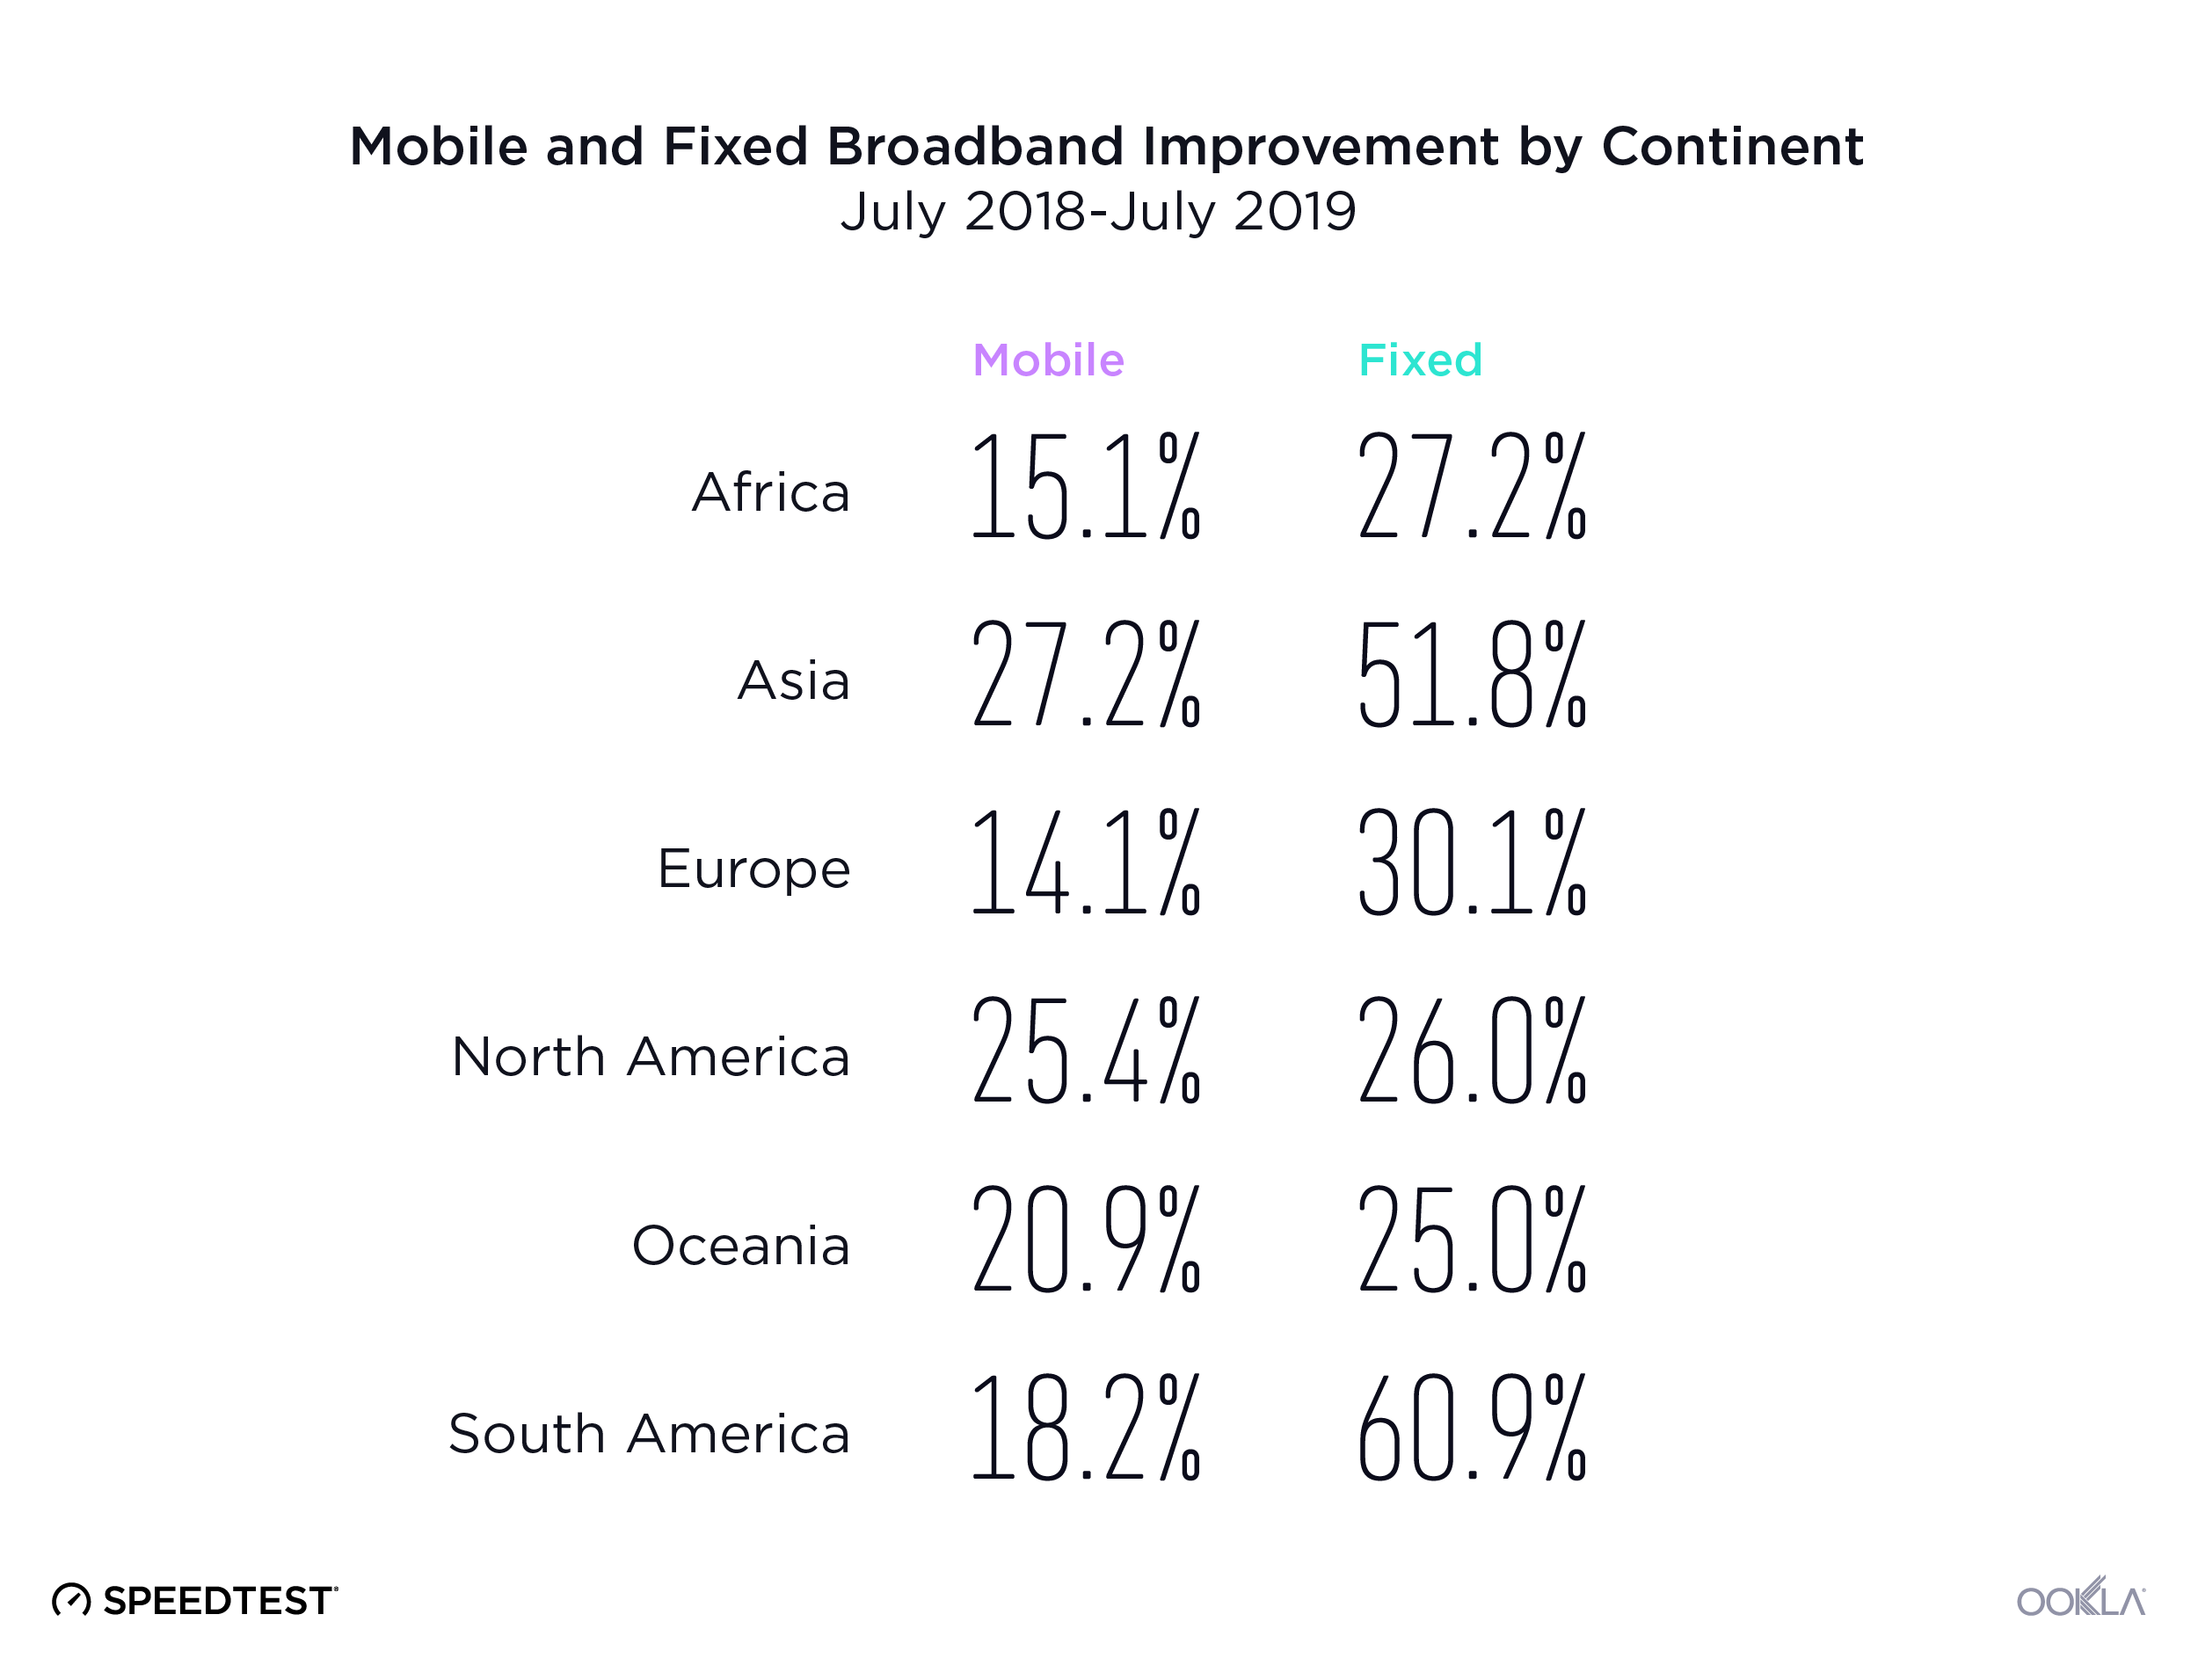
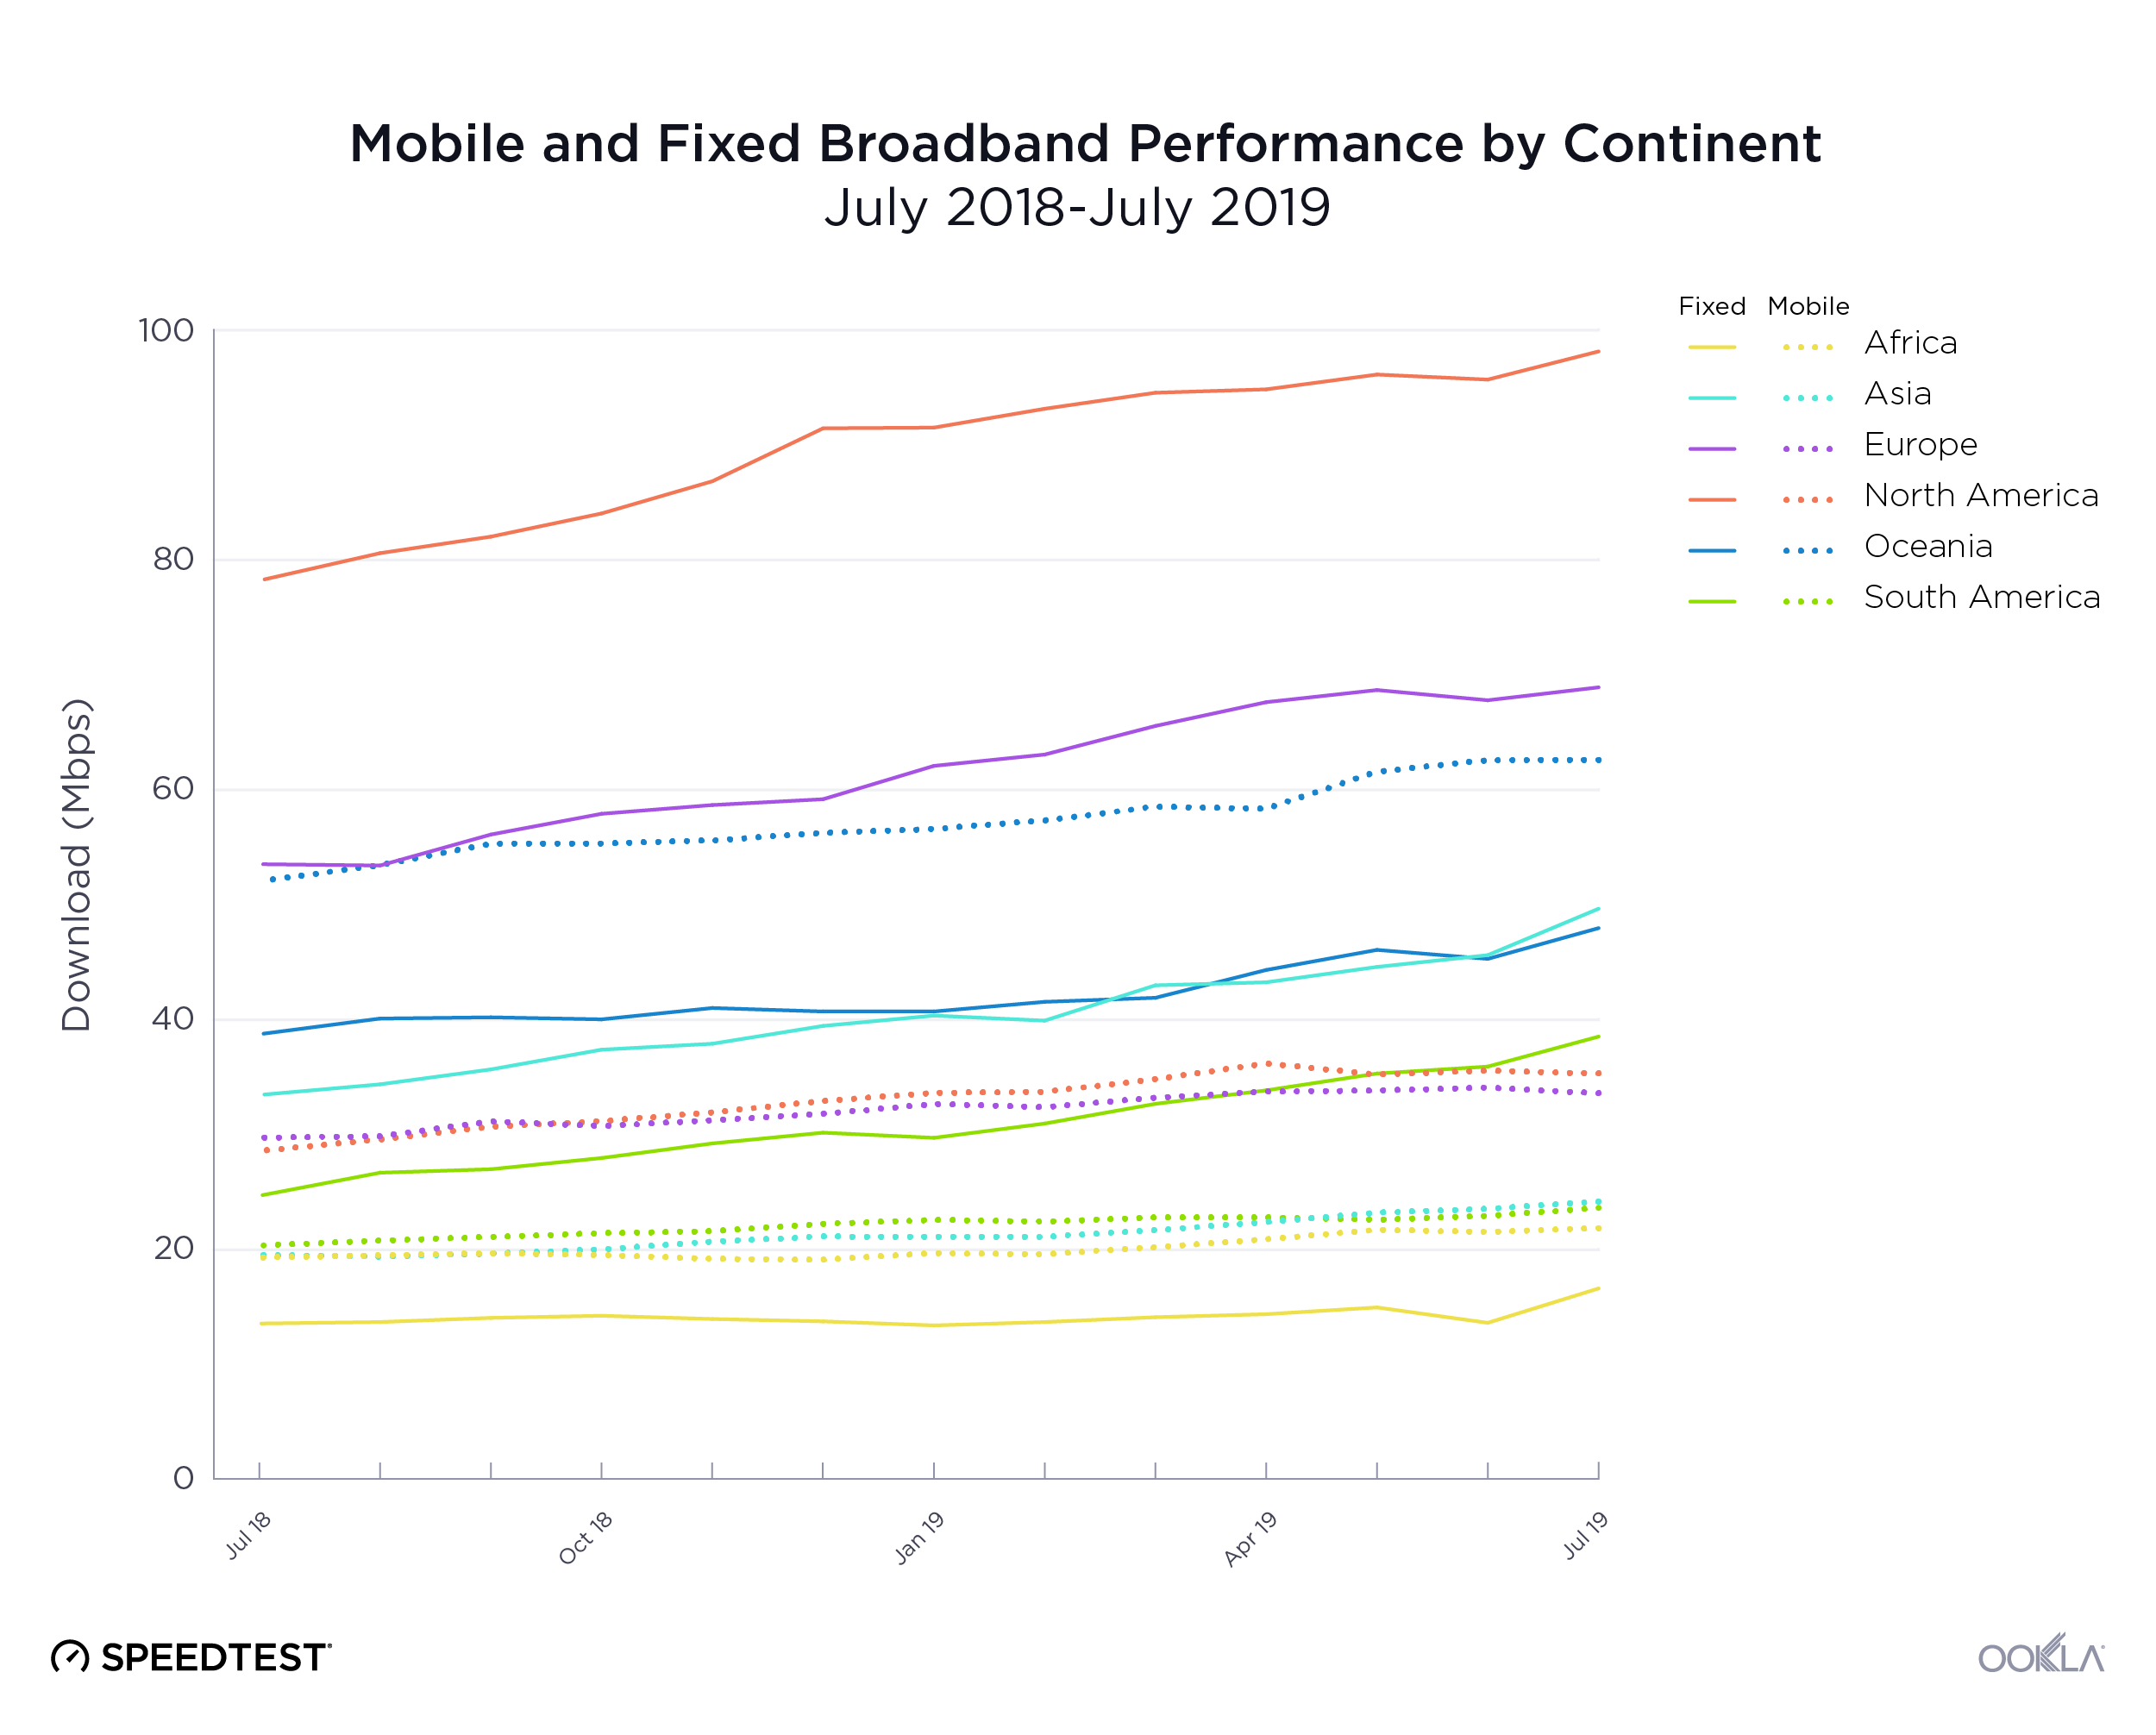
When it comes to the internet, the news is mostly good for 2018. Download and upload speeds are increasing across the globe on both mobile and fixed broadband. 5G is on the horizon and gigabit service is expanding.

We looked at data from Speedtest IntelligenceTM, Ookla’s flagship data platform, from December 2017 through November 2018, to analyze everything from global internet speeds to the world’s fastest countries to when people are online. We also investigated which parts of the world are seeing the most benefit from high speed LTE on mobile and gigabit speeds on fixed broadband.

Mobile speeds increased more than 15% in 2018

Graphic-Tables-Final-v2_mobile-average-speed-3

The world’s average mobile download speed of 22.82 Mbps increased 15.2% over the past year, while mobile upload speed increased 11.6% to reach 9.19 Mbps.

Graphic-Tables-Final-v2_android-vs-ios-1

With a mean download speed of 27.84 Mbps and a mean upload of 10.61 Mbps, worldwide speeds on iOS devices were faster than those on Android (21.35 Mbps download, 8.73 Mbps upload) in 2018. This is likely due to market factors as Android devices are more popular in emerging markets where internet speeds tend to be slower.

However, download speed on Android devices increased 19.0% and upload speed increased 15.1%, more than those on iOS (18.0% increase for download and 11.1% increase for upload), which is good news for those emerging markets.

Fixed broadband speeds increased more than 26% in 2018

Graphic-Tables-Final-v2_fixed-average

On a global level, fixed broadband speeds were nearly twice as fast as those on mobile in 2018. The world’s average download speed on fixed broadband was 46.12 Mbps, 26.4% faster than last year. Upload speed increased 26.5% to 22.44 Mbps.

All said, though, both mobile and fixed broadband speeds increased at a slower rate in 2018 than they did in 2017.

Countries with the fastest internet in 2018

Graphic-Tables-Final-v2_top-5-mobile

The countries with the fastest mean download speeds over mobile in the past 12 months were: Norway (63.19 Mbps), Iceland (58.68 Mbps), Qatar (55.17 Mbps), Singapore (54.71 Mbps) and the Netherlands (53.42 Mbps).

Graphic-Tables-Final-v2_top-5-fixed

Singapore showed the world’s fastest mean download speeds over fixed broadband during the past twelve months at 175.13 Mbps. Next fastest were Iceland (153.03 Mbps), Hong Kong (138.31 Mbps), South Korea (114.67 Mbps) and Romania (109.90 Mbps).

To keep up with month-to-month internet speeds at a global level, visit the Speedtest Global Index.

Most improved countries for 2018 internet speeds

Graphic-Tables-Final-v2_most-improved-mobile

Costa Rica saw the largest increase in mobile download speed over the past year at 194.6%. Myanmar was second with 121.8%, Saudi Arabia third (113.2%), Iraq fourth (92.3%) and the Ukraine fifth (82.1%).

The countries with the largest improvements in upload speeds were Bangladesh (179.2%), the Ukraine (172.5%), Costa Rica (163.4%), Myanmar (146.9%) and Iraq (126.7%).

Graphic-Tables-Final-v2_most-improved-fixed

Paraguay saw the biggest increase in mean download speed over fixed broadband in the world over the past year at 268.6%. Guyana was second with 113.5%, Libya third (108.0%), Malaysia fourth (89.5%) and Laos fifth (76.2%).

Libya showed the most improvement in mean upload speed over fixed broadband during the past twelve months at 176.4%. Guyana was second with 116.1%, Malaysia third (95.2%), Belize fourth (88.9%) and Iraq fifth (76.8%).

4G is increasing mobile speeds

2017-2018-LTE-growth

When we looked specifically at Speedtest results on 4G, we saw that mean download speeds increased in most countries. Costa Rica was most improved for 4G download speed as was the case with overall download speed on mobile increasing 184.3% year over year. Saudi Arabia was second at 110.2% and Myanmar third at 78.0%.

Most encouragingly, we saw the number of Speedtest results over 4G increase in all but 15 countries. This could indicate that 4G availability is expanding. Tanzania saw the greatest increase with 355.0% more tests over 4G in 2018 than in 2017. Malta was second at 267.2% and Algeria third at 143.7%. We can see this expansion on the map above as 4G results fill in areas of the globe that were previously blank.

Gigabit coverage is expanding globally

gigabit-fade-1

Gigabit is in the news as ISPs across the globe expand their high-speed networks. We looked at Speedtest results on fixed broadband in excess of 750 Mbps to see which cities are benefitting most. Comparing locations with 100 or more gigabit-speed results in 2017 with those in 2018, that expansion becomes obvious. In 2017, 60 countries met our gigabit test threshold. In 2018, 16 additional countries joined our gigabit list. We’re also seeing that more cities around the world now have access to gigabit speeds.

Also exciting is that cities which already had gigabit in 2017 saw increases in the number of gigabit-speed results in 2018 as ISPs continue to build out infrastructure across cities. Many cities saw their first real gigabit expansion in 2018. For example, we saw the number of gigabit tests in New Delhi increase from 119 gigabit speed results in 2017 to 20,239 in 2018, that’s a mind-boggling 16,908% increase. Chennai, India saw a 7,481% increase (from 763 to 57,840) and Cormeilles-en-Parisis, France jumped 6,480%. Huge leaps in the number of gigabit-speed results were also seen in Gdańsk, Poland (6,338%); Rome, Italy (4,909%); Lancashire, United Kingdom (3,962%); Ota, Japan (3,240%); São Paulo, Brazil (2,947%); Hangzhou, China (2,669%) and Turda, Romania (2,636%).

When people are online

point-3-sec-final-1

The internet is always on, but we were surprised to see how consistently and steeply usage fell off on both mobile and fixed broadband after 9 pm local time. Normalizing the time of day for Speedtest results from around the globe, we found that usage bottoms out at 4 am and then climbs steeply again until 10 am. From there, the internet gets gradually busier until that night time drop off.

Internet in the world’s largest countries

The world’s five most populous countries are notably absent from the lists of fastest and most improved countries on mobile and fixed broadband. China, India, the U.S., Indonesia and Brazil represent about 46% of the world’s population, which makes their internet speeds worth noting nonetheless.

Internet Speeds in the World’s Largest Countries
Speedtest Data | December 2017-November 2018
Country Mean Mobile Download Speed (Mbps) % Improvement in Mobile Speed Mean Fixed Download Speed (Mbps) % Improvement in Fixed Speed
China 30.96 -5.8% 76.03 42.5%
India 9.11 15.2% 23.00 50.4%
United States 28.50 22.3% 92.77 37.3%
Indonesia 10.39 5.3% 14.89 18.3%
Brazil 18.65 29.3% 22.95 39.4%

Mobile internet speeds in the world’s largest countries

China had the fastest average mobile download speed among the world’s most populous countries in the past twelve months. However, China’s mobile download speed decreased during that time. The United States is fast catching up with China on mobile download speed.

Brazil occupied a middle ground for mobile download speed among the world’s most populous countries and showed the fastest rate of increase. India and Indonesia were at the bottom of this list. While the two nations show similar mobile download speeds to each other, India’s mobile download speed is improving much more quickly than Indonesia’s.

Fixed broadband speeds in the largest countries in the world

The United States showed the fastest fixed broadband download speed among the world’s most populous countries over the past year. China was second, India and Brazil nearly tie for third and Indonesia follows.

India showed the largest improvement in mean download speed over fixed broadband of the world’s five largest countries. China was second, Brazil third, the U.S. fourth and Indonesia fifth.

We’ll be back throughout 2019 to report on the state of the world’s internet as it evolves. Until then, take a Speedtest to find out how your network compares.

Ookla retains ownership of this article including all of the intellectual property rights, data, content graphs and analysis. This article may not be quoted, reproduced, distributed or published for any commercial purpose without prior consent. Members of the press and others using the findings in this article for non-commercial purposes are welcome to publicly share and link to report information with attribution to Ookla.

| July 24, 2019

Touring Mobile Performance with the Speedtest Global Index

Lire en français

At Ookla we celebrate speed and the individuals and companies that dedicate their lives to being the fastest at whatever they do. That’s why this month’s big race in France is so exciting. To cheer all the worn out tires that go into making a great event, we compared the mobile performance of cyclists’ home countries using the Speedtest Global IndexTM. We also looked at download speed in the race’s start and stop cities to see which has the best internet speed advantage.

Which countries’ mobile speeds are breaking away from the main group

The Speedtest Global Index ranks countries based on their download speeds over mobile and fixed broadband. To honor the big race, we narrowed that field to just the countries competing this year and looked at their mobile performance over the past 12 months. We had to leave Eritrea off the list as there were not sufficient samples in the country during the time period to qualify for the Speedtest Global Index.

mobile-performance-chart-final

Mobile speeds in Norway have exploded to the point that they’ve led the pack every single month for the past year. Even when Norway slipped to second in the world for mobile, behind South Korea, they still led all the countries currently touring. Canada’s mobile speeds started strong and rallied to surpass Australia and the Netherlands. These four countries were up in front of the pack for the entire year.

Up next in the chasing group, there was a lot more movement. France started a long climb in September 2018 that took them from 29th in the world for mobile download speed to 17th. This also helped France pass New Zealand and Austria. Belgium started strong but then they fell back in the bunch. The Czech Republic regrouped slightly in April to improve their ranking to a career high of 11, but recently they’ve fallen back to just above where they ranked 12 months ago.

All the way back in the broom wagon, Colombia fell behind early and couldn’t find their second wind. Costa Rica’s decline started later but still left them in second to last place.

Mobile performance in Tour cities

Cyclists and fans are visiting many different cities for the different stages of the race. We compared mean download speeds over mobile in some of the start and stop cities during Q2 2019 to see which were in front and which were chasing. Note that according to the Ookla 5G MapTM, no cities in France or Belgium have commercially-available 5G as of this writing.

Mobile Performance in Tour Start and Stop Cities
Speedtest Data | Q2 2019
City Mean Download (Mbps) Mean Upload (Mbps)
Saint-Étienne, France 60.99 13.08
Reims, France 59.05 13.95
Nancy, France 58.48 14.66
Mulhouse, France 57.60 13.57
Toulouse, France 55.31 12.68
Belfort, France 53.46 13.19
Tarbes, France 53.26 12.92
Pau, France 52.27 13.14
Nîmes, France 51.10 12.84
Rambouillet, France 51.09 12.13
Colmar, France 50.52 13.97
Mâcon, France 48.57 14.42
Paris, France 46.76 11.18
Brussels, Belgium 45.81 16.56
Albi, France 44.49 12.22
Chalon-sur-Saône, France 42.99 12.89
Saint-Dié-des-Vosges, France 35.44 11.93
Gap, France 27.77 8.24

Saint-Étienne led a tight pack that included Reims, Nancy and Mulhouse which all showed mobile download speeds above 57 Mbps. Toulouse, Belfort, Tarbes, Pau, Nîmes, Rambouillet and Colmar were chasing with mobile download speeds between 50 and 56 Mbps.

We hope that last-place Gap and second-to-last Saint-Dié-des-Vosges were regrouping rather than taking a rest day as they showed mobile download speeds that were significantly slower than the rest of the cities.

Not all locations had sufficient samples to be included in our list, so if you want to know what mobile speeds are like at the Pont du Gard (or anywhere else), take a Speedtest on Android or iOS.

Chapeau to all the teams! May the rest of the race feel flat and fast.


Embarquez pour le tour des performances mobiles avec le Speedtest Global Index

Chez Ookla, nous vouons une véritable passion à la vitesse. Et alors que la Grande Boucle bat son plein en France, nous comptons bien la célébrer comme il se doit ! En parallèle de la lutte acharnée que se livrent les valeureuses équipes, nous avons comparé les performances mobiles des pays d’origine des coureurs en utilisant le Speedtest Global IndexTM. Nous avons également mesuré la vitesse de téléchargement dans les villes-étapes pour découvrir laquelle peut se vanter de disposer du meilleur débit Internet.

Performances mobiles : quels pays s’échappent du peloton ?

Le Speedtest Global Index classe les pays en fonction de leur vitesse de téléchargement haut débit mobile et fixe. Pour rendre hommage au Tour, nous avons uniquement examiné les performances mobiles des pays en lice au cours des douze derniers mois. L’Érythrée n’est malheureusement pas au rendez-vous en raison d’un nombre d’échantillons de données insuffisant.

mobile-performance-chart-final

Grâce à une vitesse de téléchargement mobile ultrarapide, la Norvège a trusté la première place du classement tout au long de l’année. Si le pays a rétrogradé à la deuxième place mondiale juste derrière la Corée du Sud, il a littéralement survolé les débats dans le cadre de notre compétition. De son côté, le Canada a démarré fort, en parvenant même à dépasser l’Australie et les Pays-Bas. Ces quatre pays ont réussi une formidable échappée tout au long de l’année.

Derrière, le groupe de poursuivants s’est organisé pour réduire l’écart. Grâce à une folle remontée en septembre 2018, la France est passée de la 29e à la 17e place mondiale, coiffant au poteau la Nouvelle-Zélande et l’Autriche. Après un très bon départ, la Belgique s’est malheureusement retrouvée engluée dans le peloton. La République Tchèque a mis un petit coup d’accélérateur en avril pour atteindre la 11e place (une première !). Elle a ensuite connu une baisse de régime qui l’a vu terminer juste au-dessus de son classement de l’année dernière.

En queue de peloton, la Colombie a rapidement été distancée et n’est jamais parvenue à trouver un second souffle. Malgré ses bonnes intentions, le Costa Rica a quant à lui fini avant-dernier.

Performances mobiles dans les villes-étapes

Les coureurs et les fans visitent de nombreuses villes lors des différentes étapes du Tour. Nous avons comparé les vitesses moyennes de téléchargement mobile dans certaines de ces villes au cours du deuxième trimestre 2019 afin d’établir un classement. Notez que selon l’Ookla 5G MapTM, aucune ville de France ou de Belgique ne propose actuellement la 5G.

Performances mobiles dans les villes-étapes
Données Speedtest Data | Deuxième trimestre 2019
Ville Débit descendant moyen (Mbps) Débit ascendant moyen (Mbps)
Saint-Étienne, France 60,99 13,08
Reims, France 59,05 13,95
Nancy, France 58,48 14,66
Mulhouse, France 57,60 13,57
Toulouse, France 55,31 12,68
Belfort, France 53,46 13,19
Tarbes, France 53,26 12,92
Pau, France 52,27 13,14
Nîmes, France 51,10 12,84
Rambouillet, France 51,09 12,13
Colmar, France 50,52 13,97
Mâcon, France 48,57 14,42
Paris, France 46,76 11,18
Bruxelles, Belgique 45,81 16,56
Albi, France 44,49 12,22
Chalon-sur-Saône, France 42,99 12,89
Saint-Dié-des-Vosges, France 35,44 11,93
Gap, France 27,77 8,24

Au coude-à-coude avec Reims, Nancy et Mulhouse, Saint-Étienne s’est imposée dans un groupe relevé affichant une vitesse de téléchargement mobile supérieure à 57 Mbps. Dans son sillage, Toulouse, Belfort, Tarbes, Pau, Nîmes, Rambouillet et Colmar ont fait bonne figure avec une vitesse comprise entre 50 et 56 Mps.

Gap et Saint-Dié-des-Vosges, respectivement dernier et avant-dernier, n’ont jamais semblé pouvoir suivre le rythme du peloton, avec une vitesse bien inférieure à celle des autres villes.

Faute d’un nombre d’échantillons de données suffisant, cette liste n’est pas exhaustive. Si vous souhaitez connaître la vitesse de téléchargement mobile de Pont du Gard ou de toute autre ville, effectuez un Speedtest sur Android ou iOS.

Un grand bravo à toutes les équipes ! Nous vous souhaitons bonne chance pour le reste de la course !

Ookla retains ownership of this article including all of the intellectual property rights, data, content graphs and analysis. This article may not be quoted, reproduced, distributed or published for any commercial purpose without prior consent. Members of the press and others using the findings in this article for non-commercial purposes are welcome to publicly share and link to report information with attribution to Ookla.

| September 4, 2019

In-Depth Analysis of Changes in World Internet Performance Using the Speedtest Global Index

A lot has changed in the two years since 2017 when we first began ranking mobile and fixed broadband speeds of countries around the world with the Speedtest Global IndexTM. 5G is being deployed around the world and fiber continues to make gigabit speeds a reality in more and more countries. We’ve been tracking it all and are here to report on how much speeds have increased, which countries are leading internet performance and which are falling behind, and what trends we see across continents.

World mobile speed increased 21.4% with fixed broadband up 37.4%

World-Download-Speeds-2019-OG2

Looking just at the last year, the world’s mean download speed over mobile increased 21.4% from 22.81 Mbps in July 2018 to 27.69 Mbps in July 2019. Mean upload speed over mobile increased 18.1% from 9.13 Mbps to 10.78 Mbps. The world average for download speed over fixed broadband increased 37.4% from 46.48 Mbps in July 2018 to 63.85 Mbps in July 2019. Mean upload speed over fixed broadband increased 48.9% from 22.52 Mbps to 33.53 Mbps.

Shake-ups in the country rankings for internet performance

Fastest-Countries-Mobile-2018-2019

Mobile speeds in the fastest countries have skyrocketed in the past year which has dramatically shifted the rankings. South Korea, which was not even in the top ten a year ago, saw a 165.9% increase in mean download speed over mobile during the past 12 months, in large part due to 5G. Switzerland’s mean download speed increased 23.5%. Canada’s was up 22.2%, Australia 21.2%, the Netherlands 17.3%, UAE 11.1%, Malta 10.3% and Norway 5.8%. Qatar remained in the top ten, although the country’s mean download speed over mobile actually dropped 1.4% from July 2018 to July 2019.

Individual mobile operators can make a huge difference in a country’s speeds. In 2017 we were excited to see Telenor uncap their mobile speeds, which drove Norway to the top of the Speedtest Global Index. A big part of South Korea’s mobile success in the past year is the way KT, LG U+ and SK Telecom banded together to release 5G at the same time. Switzerland has also benefited from 5G and Sunrise leads the country with 262 5G deployments across the country while Swisscomm has 52.

Fastest-Countries-Fixed-2018-2019

Fixed broadband rankings on the Speedtest Global Index have not changed as dramatically during the past 12 months as those on mobile. Singapore remains the fastest country with an increase in mean download speed over fixed broadband of 5.6%. Taiwan had the largest jump in speeds among the top 10 with a 166.5% improvement in fixed download speed between July 2018 and July 2019. Mean download speed over fixed broadband increased 52.4% in South Korea, 26.4% in Macau, 21.7% in Romania, 21.0% in Switzerland, 19.3% in the United States and 3.5% in Hong Kong.

Monaco and Andorra did not have enough tests to qualify for the Speedtest Global Index one year ago, but massive fixed broadband improvements in both countries inspired us to lower our test count threshold for inclusion and also share these smaller countries’ success stories.

Technologies paving the way: 5G and gigabit

The presence of 5G is not enough to change a market

As discussed above, 5G has the potential to rocket a country to the top of the mobile rankings on the Speedtest Global Index. In practice, we’ve seen 5G speeds that were over 1000% faster than those on LTE.

Mobile-Download-Speeds-by-Country

In reality, though, unless 5G is commercially available widely across a country and from all mobile operators (as was the case in South Korea), the change in speeds at the country level is not that significant. Though commercial 5G was launched widely across Switzerland by Sunrise and Swisscom in April 2019, the country’s mean download speed only increased 2.8% in the three months since. The average mobile download speed in the U.S. has actually declined slightly since 5G was initially deployed. This is because 5G is still only available in a very limited number of markets to consumers with 5G-capable devices.

Visit the Ookla 5G Map for the latest on 5G deployments across the globe.

Gigabit is a game-changer, if you can get it

Unlike 5G, fiber connections have been rolling out since 2007, opening up the possibility of gigabit-speed fixed broadband. That said, it’s costly and time-intensive to lay miles and miles of fiber so progress has varied widely across the globe.

Gigabit-Test---Performance_Singapore-1

Geographically small countries like Singapore have the advantage when it comes to fiber, because It’s easier and cheaper to lay fiber optic cable across the country’s small footprint. Singaporean internet service providers (ISPs) have used this advantage to go beyond mere gigabit and offer connections as fast as 10 Gbps. This is reflected both in Singapore’s dominance of the fixed rankings on the Speedtest Global Index and in the fact that 2.87% of their total Speedtest results over fixed broadband are gigabit-speed (800 Mbps or higher).

Gigabit-Test---Performance_Brazil-1

Brazil offers a good contrast for how difficult it can be for gigabit to reach the masses. While the first Brazilian ISP to offer fiber-to-the-premises (FTTP) initially did so in 2007, easy access to gigabit speeds was slow to follow. However, that may be starting to change. Between June and July 2019 we saw a large uptick in gigabit-speed results in Brazil, where the proportion of gigabit speed tests increased from 0.02% of total fixed broadband tests to 0.17%. This corresponded with a large increase in mean download speed at the country level.

Comparing world mobile and fixed broadband at a glance

We were curious to see just how different internet performance experiences were around the world, so we plotted average mobile download speed against average download speed on fixed broadband. All of the graphs below use a percentage difference from the global average, a number that changed between 2018 and 2019.

fade-Performance-vs-Global---Quadrant-All

Speed Leaders

There was not much change in the list of countries that showed above-average download speeds on both mobile and fixed broadband between July 2018 and July 2019, the “Speed Leaders.” What did change was that fixed broadband speeds increased significantly enough among the group to bring the whole pack closer to Singapore and Hong Kong. On the mobile axis, South Korea’s major increase in download speed made that country more of an outlier, pushing the boundaries of what great performance can look like.

Fixed-Focused countries

Between July 2018 and July 2019 we saw the number of countries considered to be “Fixed-Focused” (having faster download speeds over fixed broadband than the world average while their average mobile download speeds were slower than average) increase. Ireland was the only country that solidly fit this category in 2018. Thailand and Chile started near the midline for fixed speeds and below-average for mobile speeds in 2018. 2019 found both countries squarely in the Fixed-Focused category. Israel also edged into this category as their mobile download speed fell between July 2018 and 2019.

Mobile-Focused countries

The “Mobile-Focused” category saw the most movement between July 2018 and July 2019 as some countries (the UAE and Qatar) increased their fixed speeds sufficiently to join the Speed Leaders. Meanwhile, Bosnia and Herzegovina’s mobile download speed increased year-over-year to move them into the Mobile-Focused quadrant. Georgia’s mobile download speed decreased enough to move them from Mobile-Focused to Speed Laggers.

It will be interesting to see how many of these Mobile-Focused countries double down on their mobile investments and explore 5G alternatives to fixed broadband.

Speed Laggers

No country wants to be in the position of having slower than average mobile and fixed broadband speeds. We saw 57 countries in this “Speed Laggers” quadrant in July 2018 and 78 in July 2019. This increase is mostly due to our expansion of the number of countries we consider for the Speedtest Global Index based on test count. There were enough countries in this category that we’ve considered them separately by continent below.

Regional views of mobile and fixed broadband performance

Mobile-and-Fixed-Broadband-Improvement-by-Continent-02

We aggregated Speedtest results by continent to analyze mobile and fixed broadband performance by continent.

Mobile-and-Fixed-Performance-by-Continent-01

Asia had the highest percentage increase in mobile download speed followed by North America, Oceania, South America, Africa and Europe. Oceania had the fastest mean download speed in July 2019. North America placed second, Europe third, Asia fourth, South America fifth and Africa sixth.

On the fixed broadband side, South America saw the highest percentage increase in download speed. Asia came in second, Europe third, Africa fourth, North America fifth and Oceania sixth. North America had the fastest mean download speed in July 2019. Europe was second, Asia third, and Oceania fourth. As we saw with mobile, South America and Africa again ranked fifth and sixth, respectively.

A zoomed-in view of the speed quadrants separated by continent offers a more detailed view of each country’s role in these rankings.

Africa mostly lags in internet speeds

2019-Performance-vs-Global---Africa

In July 2019, all but two African countries in the Speedtest Global Index fell into the Speed Laggers category, having mobile and fixed broadband speeds that were below global averages. The exceptions were South Africa and Guinea, which both had fast enough mobile speeds to place them in the mobile-focused quadrant.

Asian markets show a wide breadth of internet performance

2019-Performance-vs-Global---Asia

Asia was the most diverse continent we examined in terms of internet performance. We saw a plurality of countries in each of the four quadrants in July 2019. Most of the Speed Leaders were in East Asia: China, Hong Kong (SAR), Japan, Macau (SAR), South Korea, and Taiwan. If we include Singapore, another Speed Leader, these are among the wealthiest nations in Asia (using GDP per capita). Two of Asia’s Fixed-Focused countries are in Southeast Asia (Malaysia and Thailand) and one is in the Middle East (Israel).

The Speed Laggers category contained countries from South Asia (including Afghanistan, India and Pakistan), Southeast Asia (Brunei, Cambodia, the Philippines and Vietnam) and the Middle East (Jordan). Mobile-Focused countries in Asia were mostly Middle Eastern, including Kuwait, Lebanon, Oman, Saudi Arabia and Turkey.

European mobile performance is mostly strong, fixed varies

2019-Performance-vs-Global---Europe

With the exception of Ireland, the European countries on the Speedtest Global Index fell into the Speed Leaders, Mobile-Focused, and Speed Laggers categories. All of the Speed Laggers (Belarus, Kazakhstan, Russia and the Ukraine) were from Eastern Europe. Countries from Southeast Europe (including Albania, Bosnia and Herzegovina, Croatia, Greece, Montenegro, Moldova, Serbia and Slovenia) and Central Europe (Austria and the Czech Republic) made up the bulk of the Mobile-Focused category.

Speed Leaders included countries from the Baltics (Estonia, Latvia and Lithuania), the Nordics (Denmark, Norway and Sweden), Central Europe (Poland and Romania), and Western Europe (including Belgium, France, Germany, the Netherlands, and Spain).

North American internet performance is sharply divided

2019-Performance-vs-Global---North-America

Canada and the U.S. are the only two North American countries in the Speed Leaders category. Panama is the only North American country under Fixed-Focused. Mexico and all of the Central American countries fall into the Speed Laggers category. There are no North American countries that are Mobile-Focused.

Each country in Oceania has a very different internet story

2019-Performance-vs-Global---Ocean

Oceania is represented in three of the four quadrants: Speed Leaders (New Zealand), Mobile-Focused (Australia) and Speed Laggers (Papua New Guinea) with Fiji straddling the divide between Speed Laggers and Mobile-Focused.

South America mostly lags in mobile and fixed internet speeds

2019-Performance-vs-Global---South-America

Most of the South American countries represented on the Speedtest Global Index are in the Speed Laggers quadrant (Argentina, Bolivia, Brazil, Colombia, Ecuador, Paraguay, Peru, Suriname and Venezuela). Chile is an exception, being part of the Fixed-Focused group, as is Uruguay which sits in Mobile-Focused.

Global internet speeds are improving on average and 5G and gigabit are compounding those advances where available. However, not all countries are benefitting equally. We’ll be interested to see how 5G continues to push mobile speeds in the next year and also whether 5G Wi-Fi becomes a game changer for fixed broadband. Remember to check the Speedtest Global Index on a monthly basis for updated country rankings. And take a Speedtest to make sure your experience is represented in your country’s averages.

Editor’s Note: This article was edited on September 10, 2019 to correct an error in the labeling on the first image. The colors in a later image were updated for consistency.

Ookla retains ownership of this article including all of the intellectual property rights, data, content graphs and analysis. This article may not be quoted, reproduced, distributed or published for any commercial purpose without prior consent. Members of the press and others using the findings in this article for non-commercial purposes are welcome to publicly share and link to report information with attribution to Ookla.

| March 13, 2020

Tracking COVID-19’s Impact on Global Internet Performance (Updated July 20)

We are no longer updating this article as internet speeds in most countries have stabilized to pre-pandemic levels. For ongoing information about internet speeds in specific countries, visit the Speedtest Global IndexTM or contact our press team.

Ookla® closely monitored the impact of COVID-19 on the performance and quality of global mobile and broadband internet networks in the early days of the pandemic. We shared regular information based on Ookla data to assist in the understanding of this unprecedented situation. You can still download the July 20, 2020 CSV here which contains all the public data we tracked in this article. If you are looking for information on internet or online service outages, please check Downdetector®.

Ookla retains ownership of this article including all of the intellectual property rights, data, content graphs and analysis. This article may not be quoted, reproduced, distributed or published for any commercial purpose without prior consent. Members of the press and others using the findings in this article for non-commercial purposes are welcome to publicly share and link to report information with attribution to Ookla.

| August 2, 2022

Find Out Which 50 Top European Vacation Destinations Have the Fastest Mobile Internet Speeds

Vacation season is upon us with millions of tourists already flocking to Europe’s top summer destinations despite the heat. Whether you’re a European looking for the best “staycation” or an American taking advantage of the exchange rates, our analysis of mobile internet performance in 50 popular destinations across the continent should help you see how well you will be able to connect (or disconnect, should you so choose) on vacation this summer.

We divided these towns and cities into four categories that might appeal to different types of travelers: big cities, beach life, cultural havens, and forest getaways. Then we compared Speedtest Intelligence® data for median download speeds and multi-server latency across each category. Of course many of the best vacation destinations belong in multiple categories, so be sure to check each list to find your favorite locale, and you’ll want to remember that your experience may vary based on your carrier’s roaming agreement.

“Big cities” with internet performance as exciting as the lifestyle

Oslo, Norway topped our list of 15 European vacation destinations full of big city excitement with the fastest mobile internet with a median download speed of 156.99 Mbps during Q2 2022. Perfect if you’re planning to do live updates from the Øya Festival. Two other Nordic cities rounded out the top three with Stockholm, Sweden showing a median download speed of 136.74 Mbps and Copenhagen, Denmark coming in at 133.16 Mbps. With speeds like these you should be able to host as many “see how glorious my vacation is?” video calls as you want.

There was a large gap between these three cities and the next fastest group, led by Lisbon, Portugal at 86.49 Mbps. Istanbul, Turkey and Rome, Italy had the lowest median download speeds on this list. These are still adequate mobile speeds, especially if you want to lean into the vacation experience and report back on it later (if ever).

Nicosia, Cyprus had the lowest median multi-server latency on our “big city” list at 17 ms during Q2 2022. This metric measures how quickly your device gets a response after you’ve sent out a request during three stages so you can understand if you’ll run into unnecessary lags in your connection. We’ve previously reported how latency in Europe increased while roaming, and higher latency could mean that you encounter glitches in video calls or even have to shut down apps to get your phone to respond in a timely fashion. Rome had the highest latency on this list.

Where internet speeds are fit for “beach life”

Nothing says summer like relaxing on the beach. If your beach vacation needs fast internet access, surf the web in Biarritz, France and Korčula, Croatia. These two locales had the fastest median download speeds on our beach life list during Q2 2022 at 155.65 Mbps and 133.67 Mbps, respectively, though this is not a statistically significant difference. Varna, Bulgaria and Faro, Portugal rounded out the top four at 104.00 Mbps and 101.74 Mbps, respectively.

Amalfi, Italy and Cefalù, Italy are good beach destinations if you’re looking for encouragement to log off. With median download speeds of 31.40 Mbps and 38.18 Mbps, respectively, during Q2 2022, your internet connection should be adequate (though less inspiring than the Tyrrhenian Sea).

Piran, Slovenia had the lowest median multi-server latency (20 ms) on this list while Cefalù had the highest (56 ms).

“Cultural havens” with research-ready internet speeds

Travelers looking for maximum culture and fast internet speeds can do no better than Tromsø, Norway, which had a median download speed on mobile of 251.52 Mbps during Q2 2022, almost 2.3x faster than runner-up Amsterdam, Netherlands. Whether you’ve traveled to the northernmost bit of Norway for the wooden houses, one of the many summer festivals, or just to escape the heat, you’ll have fast enough internet to thoroughly research all the places you can go if you extend your vacation.

At the other end of the spectrum, if you’re traveling to Yerevan, Armenia or Florence, Italy to enjoy the museums and other cultural highlights of either, you might want to take pictures instead. With median download speeds of 24.11 Mbps and 29.84 Mbps, respectively, these cities were the slowest on this list. All the more reason to immerse yourself in the sights and wait to connect to Wi-Fi before uploading your photos.

Helsingør, Denmark had the lowest median multi-server latency, while Edinburgh, Scotland, United Kingdom had the highest. High latency can impede the performance of your phone even when you’re in an area with great speeds — something to keep in mind if you’re relying on your phone to locate the next Fringe venue.

Navigate internet speeds in “forest getaways”

Some people swear by the forest for the best vacations, especially in the heat of summer. The Alpine cities of Innsbruck, Austria and Digne-les-Bains, France had the fastest median download speeds over mobile on our list of forest getaways during Q2 2022 at 87.34 Mbps and 67.30 Mbps, respectively, though there was no statistical winner between the two. There was also no statistically significant difference between the median download speeds in Zakopane, Poland (43.52 Mbps); Killarney, Ireland (35.90 Mbps); and Sighișoara, Romania (30.48 Mbps). While you may prefer to be offline in the woods, having a strong and fast internet connection available can help you navigate with GPS, check out the names of all the flora you’re encountering, or reach help in case of emergency.

Sighișoara and Killarney had the lowest median multi-server latency on this list at 24 ms and 25 ms, respectively. Digne had the highest latency at 36 ms.

Regardless of where you travel, mobile internet performance will affect your trip. We hope this list prepares you for the getaway you want. If we missed your favorite European vacation destination, take a Speedtest® on Android or iOS to show off your speeds and tweet us your suggestions for next year’s list or share your ideas via this Google form.

Ookla retains ownership of this article including all of the intellectual property rights, data, content graphs and analysis. This article may not be quoted, reproduced, distributed or published for any commercial purpose without prior consent. Members of the press and others using the findings in this article for non-commercial purposes are welcome to publicly share and link to report information with attribution to Ookla.

| February 15, 2023

Are 5G Networks Meeting Consumers’ Expectations?

Key messages

  • In-market 5G performance varies widely. Reviewing the top 10% and worst 10% of Ookla® Speedtest Intelligence® samples reveals significant variance in the consumer experience on today’s 5G networks, with 5G speeds peaking at over 1 Gbps for the top 10% of users in the U.A.E on average, but falling to below 20 Mbps for the lower 10% in Norway, the U.S., Japan, Germany, and Spain.
  • Median 5G performance is declining in many early launch 5G markets. While understandable as 5G adoption grows and users in more remote locations access 5G, declining median download speeds also point to investment and deployment challenges in some markets. At the same time, many of these markets are facing economic headwinds, placing more emphasis than ever on cost control. As a result, operators must carefully balance network investment priorities.
  • 5G Net Promoter Scores (NPS) significantly higher than 4G LTE in most markets, but waning. With the exception of Sweden and Qatar, all the early launch 5G markets in our analysis saw 5G NPS fall year-over-year. Operators’ 5G NPS still trade at a premium compared to 4G, and while performance is just one part of the equation, operators should take care to build on the positive sentiment that 5G has brought to date.

Despite impressive headline speeds, 5G performance varies a lot

Median 5G performance allows us to gauge the midpoint of user experience on 5G networks, however it doesn’t paint the full picture. While headline 5G speeds impress, Speedtest Intelligence data lays bare the ups and downs of 5G performance for consumers, even in early launch, advanced 5G markets. We recently looked at 5G network performance over high frequency (mmW) bands, painting a view of the true potential of 5G networks. However, if we look at performance on today’s 5G networks, looking beyond the median at the range of performance between users in the top 10% and those in the lower 10%, Speedtest Intelligence data reveals huge variance in the performance users experience.

Chart of psread of 5g performance, top 10% of samples versus median and lower 10%

The U.A.E. was the fastest 5G market in our analysis, based on median download performance of 545.53 Mbps in December 2022, followed by South Korea and Qatar. However, the top 10% of users in the U.A.E. recorded speeds of at least 1,266.49 Mbps on average, while the lowest 10% of users experienced speeds of 127.52 Mbps or slower on average. At the other end of the scale, Spain recorded a median 5G speed of 94.14 Mbps, but also demonstrated wide variance between the top 10% of samples at 537.95 Mbps or faster and the lowest 10% with 10.67 Mbps or less.

Based on many of the marketing messages around 5G, consumers are led to expect a big bang change in performance. However, with 5G operating over a greater range of spectrum bands than previous generations, including high frequency spectrum which has relatively poorer propagation, it’s understandable that 5G performance will vary more than previous generations of mobile network technology.

5G markets set to face performance challenges during 2023

While globally 5G speeds have remained stable, for many of the markets in our analysis, median 5G download speeds have fallen over the past year. The U.S. was the main outlier, recording the strongest uplift in 5G performance as T-Mobile continued to drive home its performance advantage in the market, while Verizon’s performance improved early in 2022 through its deployment of 5G in C-band spectrum. This trend is likely to continue in 2023 in the U.S., as more C-band spectrum is made available. However, the picture remains concerning for a number of other 5G markets, particularly those where median 5G speeds are at the lower end of the spectrum.

Chart of Year-over-Year change in median 5G download performance

In some markets, 5G was initially priced at a premium to 4G, with operators focused on driving incremental returns on the new network technology. However, operators have been increasingly opening up 5G access by removing incremental costs for consumers and adding prepaid plans too. As 5G adoption scales, it places more strain on the new networks. The challenge for many of these markets is that network performance is likely to degrade further unless network densification picks up. 

For network operators, this investment imperative is occuring amidst macroeconomic headwinds, which are driving up operating costs and putting pressure on consumer and enterprise spend. In addition, there remain challenges in deploying additional 5G cell sites in dense urban areas where demand is strongest, while in some markets EMF limits and other regulations can limit the deployment of high-capacity 5G sites.

Degrading 5G performance impacts consumer sentiment

Net Promoter Score (NPS) from Speedtest Intelligence paints a largely positive picture of current 5G networks. NPS is a key performance indicator of customer experience, categorizing users into Detractors (score 0-6), Passives (score 7-8), and Promoters (score 9-10), with the NPS representing the percentage of Promoters minus the percent of Detractors, displayed in the range from -100 to 100. Across the markets we analyzed, 5G users on average rated their network operator with NPS scores that were universally higher than those for 4G LTE users. However, consumer sentiment for users on 5G networks is beginning to shift, with NPS scores falling, coinciding with lower median 5G performance in many of the markets we analyzed.

Chart of 5G uplift in Net Promoter Scores vs. 4G LTE

Declining performance levels will be a factor driving NPS down for some 5G users. It’s also important to remember that as 5G scales in many of these early launch markets, the profile of 5G users is also changing from predominantly urban-based users, to more of a mix of urban, suburban, and rural users, which brings additional coverage and performance challenges for network operators. We plan to examine the relationship between 5G performance and spectrum in an up-coming content piece. Please get in touch if you’d like to learn more about Speedtest Intelligence data.

Ookla retains ownership of this article including all of the intellectual property rights, data, content graphs and analysis. This article may not be quoted, reproduced, distributed or published for any commercial purpose without prior consent. Members of the press and others using the findings in this article for non-commercial purposes are welcome to publicly share and link to report information with attribution to Ookla.

| February 21, 2023

European 5G Performance Trails its International Peers

The European Union’s Digital Decade target is rather ambitious. It wants gigabit connectivity for everyone and ubiquitous 5G coverage by the end of 2030 to assist with digital transformation. When we reflected on 5G progress last year, we concluded that Europe had fallen behind its international peers. In this article, we will assess 5G progress across Europe.  

  • Europe trails others’ performance. Although more spectrum has been awarded over the past year, European 5G performance trailed the likes of the UAE and South Korea. 
  • 5G Availability is on the up. Whilst still behind its international peers, 5G adoption has increased during 2022. This, combined with the greater availability of 5G smartphones and the rollout of 5G networks using low-band spectrum, resulted in higher 5G Availability across most European countries. 
  • A tale of two Europes. In the Nordics and some Eastern European markets (Bulgaria and Cyprus) 5G outperformed the big 5 European economies (U.K., Germany, France, Spain, and Italy). Operators call for more consolidation and regulatory intervention to facilitate 5G investment. 
  • A hotbed for private networks. European governments and regulators are keen supporters of enterprise digitization efforts, and 5G is heralded as a key enabler to assist with that. Over 40% of all private networks worldwide are in Europe, a growing proportion of which are utilizing 5G. 

Mid-band is most assigned spectrum across Europe

As per the European Commission’s 2016 5G Action Plan, EU countries are meant to make low-band (700 MHz) spectrum available for use by June 30, 2020, and mid- (3.6 GHz) and high-band/mmWave (26 GHz) spectrum by December 31, 2020. At the EU level, there are the so-called 5G pioneer bands. These are the changes compared to when we last reviewed 5G spectrum assignments across Europe: 

  • Four countries still needed to assign spectrum last year. Now, Poland is the only one without dedicated 5G spectrum. 
  • Over the course of last year, three more countries awarded spectrum across all of the 5G pioneer bands, making a grand total of eight countries. 
  • Four more countries awarded spectrum across both low- and mid-band spectrum, tallying up the count to 17.
  • Mid-band spectrum is the most popular spectrum band, with 28 countries already awarded mid-band spectrum — an additional five to when we last took stock. The remaining countries, Poland and Netherlands, will finally auction the 3.5 GHz spectrum in the summer of 2023.
  • 26 countries auctioned spectrum in the 700 MHz bands, compared to 21 a year ago.
  • Eight countries have awarded mmWave spectrum thus far. Spain is the only addition in 2022, raising €36 million. 

map of european spectrum award in 5g pinoeer bands


Legacy networks give way to 4G LTE and 5G 

5G pioneer bands are not the only frequencies that operators use to deploy 5G. As operators shut down legacy networks, they can refarm sub-3GHz frequencies for 4G LTE or 5G. European operators tend to support 2G in the short term, phasing out 3G networks instead. MNOs also look to optimize their network operations, and the upkeep of legacy networks comes with additional cost and complexity.

The rate of network shutdowns is increasing. So far, across Europe, 21 operators across 11 countries have retired 3G networks compared to only two 2G network shutdowns. 2G is still needed to support M2M/IoT use cases, e.g. ongoing long-term enterprise contracts with utility providers. In contrast, operators see less traffic carried over 3G networks hence the desire to retire them. For example, Magyar Telekom noted 2.3% and 0.84% of total voice and data traffic on the 3G network. Proximus stated that 2% of its data traffic uses 3G, while Telenet/Base shared that 3G devices account for just 1% of its network. Looking ahead, 43 operators across 26 countries announced their plans to switch off 2G networks, and 37 operators in 21 countries will pull the plug on 3G.

5G adoption lags, 5G performance doesn’t impress either 

Most European countries have commercial 5G networks in place. However, 5G adoption across Europe lags behind its global peers. According to GSMA Intelligence, in Q4 2022, 5G uptake in Europe accounted for 7.4 % of total mobile connections, a substantial increase over the Q4 2021 level of 2.5%. Across European countries, 5G adoption is at most 21% (Switzerland), compared to 43.1% in the United States, 42.4% in South Korea, China (36.3%), Australia (30.1%), and Japan (28.5%).

chart of 5g performance in europe with select international comparisons


Our recent article identified four broad clusters of 5G performance based on Speedtest Intelligence® data. Most European countries achieved median 5G download speeds under 200 Mbps, placing them within the 5G Improvers category. Bulgaria was the only country that made it into the 5G Leaders category, which includes the likes of the UAE, South Korea, Singapore, and Qatar, with a median 5G download speed of 342.71 Mbps, a slight decrease compared to last year (374.90 Mbps in Q4 2021). Five countries made it into the High Performers cluster, achieving a median 5G download speed exceeding 200 Mbps: Sweden, Cyprus, Finland, Denmark, and Norway. Interestingly enough, the big five European economies (U.K., Germany, France, Spain, and Italy) were outperformed by the Nordics and two Southern Eastern European markets (Bulgaria and Cyprus). The Nordics have always played a leading role in European telecoms, but the 5G performance gap between them and the big five points to challenges in those markets. 

Across most of Europe, median 5G speeds have actually decreased. This isn’t surprising, as increased adoption leads to higher network congestion, but other factors are at play. Operators feel the pressure of the economic crisis, higher energy costs, and reduced consumers’ spending power. Europe also suffers from fragmentation, low ARPU levels brought about by intense competition, and Capex levels that are half that of the U.S. and Canada. A report by the European Court of Auditors estimates the deployment cost of 5G across all EU member states at around €400 billion. Operators are yet to see additional revenue coming from 5G that can support that level of investment. The optimal market structure and role of governments in supporting the rollout of 5G remains a heavily debated topic as operators’ M&A activities heat up.

chart of top 5g performing providers in europe


Operators’ performance tells an interesting story as there are vast differences between countries and even within a country. The Nordics operators’ 5G performance tends to rank highly compared to other European countries thanks to having access to dedicated 5G spectrum and supportive regulatory environment. Denmark and Sweden have a greater level of network sharing as two operators share Multi-Operator Core Networks (MOCNs) and spectrum. In some countries, operators have to adhere to conditions stipulated by the 5G license, either in terms of network coverage or the number of 5G sites. For example, in France, each operator had to deploy 3,000 5G sites by the end of 2022. Challenger mobile operators often outperform incumbents — strong results from Three in the chart above are proof of that. 

5G Availability shows improvement

chart of 5g availablity in europe with select international comparisons


Given the growth in 5G adoption, not surprisingly, 5G Availability (the percentage of users on 5G-capable devices that spend most of the time with access to 5G networks) has been on the rise too. 5G Availability is a function of 5G network coverage, and 5G tariff and 5G-capable device adoption. At 56%, the U.S. continues to have the highest level of 5G Availability, having started 5G deployment in the 600 MHz (low band) range and with a large pool of customers owning 5G capable devices. The 600 MHz frequency band has further reach compared to 700 MHz and even the LTE mid-band. Within Europe, 5G Availability exceeds 40% in three countries: Cyprus, Switzerland, and Denmark, but the range is broad across those countries. Cyta Cyprus has reached 67.1% 5G Availability in Q4 2022, thanks to extending 5G coverage to 100% of Cypriots. Swisscom ranks highly too, with 61% Availability in Q4 2022. Its 2022 Annual Report notes that the operator covers 99% of the Swiss population with a basic version of 5G (using Dynamic Spectrum Sharing, which borrows capacity from its LTE spectrum) and 74% with 5G + (delivered using mid-band spectrum). 

One critical component driving 5G Availability is the affordability and availability of 5G-capable smartphones. According to Counterpoint Research, in Q4 2022, 5G smartphone sales across Europe totaled 26.8 million, equivalent to 67% of total smartphone sales, compared to 84% in North America and 87% across China, Japan, and South Korea. Europe still needs to catch up to other advanced markets in smartphone adoption. Within Europe, there is also wide variation, with Germany at 90%, Sweden at 88%, the UK at 86%, and Eastern European markets at 49%. Over time, smartphone sales will translate into a more extensive installed base of 5G devices and share of overall subscriptions.charts of 5g sales across select eupropean markets and 5g smartphones as proportional of total smartphone sales

A glimmer of hope for 5G investments

As per the EU Commission’s 5G Action plan, operators should extend 5G networks to all urban areas and major roads and railways by 2025 and populated areas by 2030. For Europe to catch up with its peers and to achieve its digital ambitions, it needs more investment. Operators frequently call for a more supportive policy and regulatory ecosystem to stimulate Capex. During Ookla’s Southeast Europe Regulatory Summit, Professor Konstantinos Masselos, President of Hellenic Telecommunications and Post Commission and BEREC Chair 2023, recognized that Europe is still behind the rest of the world, there is a need to fill the gap for investments, and Europe needs to solve demand issues and cost-effectiveness while not forgetting sustainability.

According to Assembly Research, an issue that came to the fore during 2022 was ‘fair share’ – i.e. the idea that tech companies should contribute to telecoms network costs. Many large telcos believe that deploying Europe’s digital infrastructure should be more evenly distributed among those generating traffic (and costs). However, some smaller operators and access seekers, such as MVNOs, are concerned by the possible implications of fair share, arguing that it could create a competitive distortion that puts them at a disadvantage. In addition, an October 2022 report by BEREC found little evidence that large content and application providers should contribute towards the cost of building telecom networks, considering that this model could risk harming Europe’s internet ecosystem.

Nevertheless, the European Commission is considering potential changes to how networks are funded. Commissioner Thierry Breton is poised to launch the EC’s fair share consultation at MWC23, which will reportedly outline proposals on Big Tech’s contribution towards telecoms network costs. Whether the European telcos’ lobbying campaign will bear fruit, only time will tell. But this will also depend on how well telcos outline what ‘fair share’ should look like. In Assembly’s view, the next step is to develop a practical means of implementing fair share, one which telcos have yet to set out in detail. In response to the EC’s forthcoming consultation, the onus is on operators to present compelling, justifiable policy actions, including how contributions to network costs should be calculated and applied.

European regulators support enterprise digitization efforts 

Digitization of different sectors of the economy is key to supporting sustainable development and climate goals. However, enterprise requirements differ. Some prefer to retain control over their networks, isolating them from the public network. Private mobile networks play an important role in broader digital transformation and addressing Industry 4.0 objectives. According to GSA, there were 954 private networks globally, of which almost half were in Europe (405). In terms of the number of private networks, the U.S. ranked first internationally, Germany was second, and the U.K. came fourth, followed by Japan, Finland, France, and Sweden. All of these countries embarked on digitization strategies to strengthen their position as manufacturing hubs, and it is no coincidence that these are also the markets where enterprises can purchase dedicated spectrum.

chart of top 15 countries by number of private networks

Historically, Wi-Fi has been the connectivity choice for private networks. However, mobile technologies such as 4G LTE and 5G are better suited to Operational Technologies’ network requirements of high volume, high reliability, mobility, and always-on operations. In Europe, almost half of the private networks run on 4G LTE (44%), 21% use a mix of 4G and 5G, with 5G accounting for close to 30% of deployments. As we have noted before, the introduction of industrial chipsets, based on Release 16, scheduled to come to market in 2023, will stimulate the private 5G networks market too.

Furthermore, regulators are creating an encouraging environment for enterprises to deploy their own networks to support their digital transformation targets. A dedicated spectrum for private mobile networks has already been allocated to industry players in France, the U.S., Germany, Japan, and the U.K., among others. Recently, Norwegian regulator Nkom opened up a 3.8 – 4.2 GHz band for interested parties to apply for a license to offer private 5G networks. Germany spearheads the Industry 4.0 movement, with some of the country’s biggest industrial players awarded their own 5G spectrum and experimenting with private 5G networks to address their particular needs. Other countries that look to support their national manufacturers standing in the global marketplace look to follow, as we have discussed the case for private networks in India.

Ookla will be at MWC Barcelona 2023 — visit us at our Stand 2i28 in Hall 2 to talk with us about telco trends and to learn about Ekahau’s private 5G offering. If you are interested in what are the new and exciting use cases as we enter the 5G Advance era, join us at the 5G Futures Summit. In the meantime, please contact us if you’re interested in discovering more about Ookla Speedtest Intelligence and its wealth of fixed and mobile consumer-initiated data and insights.


Ookla retains ownership of this article including all of the intellectual property rights, data, content graphs and analysis. This article may not be quoted, reproduced, distributed or published for any commercial purpose without prior consent. Members of the press and others using the findings in this article for non-commercial purposes are welcome to publicly share and link to report information with attribution to Ookla.

| December 18, 2022

Stable and Expanding: The State of Worldwide 5G in 2022


5G is no longer a new technology, however, consumers in many countries are still waiting to see the full benefits of 5G (or even to connect to 5G at all). We examined Speedtest Intelligence® data from Q3 2022 Speedtest® results to see how 5G performance has changed since last year, where download speeds are the fastest at the country level, and how satellite technologies are offering additional options to connect. We also looked at countries that don’t yet have 5G to understand where consumers are seeing improvements in 4G LTE access.

5G speeds were stable at the global level

Graphic of 5G median speed performance worldwide.

In 2021, we discussed how an expansion of 5G access led to a decline in overall speed at the global level. This year showed a stabilization in overall speed, even as 5G access broadened, with a median global 5G download speed of 168.27 Mbps in Q3 2022 as compared to 166.13 Mbps in Q3 2021. Median upload speed over 5G slowed slightly to 18.71 Mbps (from 21.08 Mbps) during the same period. According to the Ookla® 5G Map™, there were 127,509 5G deployments in 128 countries as of November 30, 2022, compared to 85,602 in 112 countries the year prior.

South Korea and the United Arab Emirates led countries for 5G speeds

Chart of fastest countries for median 5G download speed

South Korea and the U.A.E. had the fastest median download speed over 5G at 516.15 Mbps and 511.70 Mbps, respectively, during Q3 2022, leading a top 10 list that included Bulgaria, Qatar, Saudi Arabia, Singapore, Kuwait, New Zealand, Bahrain, and Brazil. Bulgaria, Singapore, Bahrain, and Brazil were new to the top 10 in 2022, while Norway, Sweden, China, and Taiwan fell out of the top 10.

Satellite became more accessible but performance slowed

2022 saw a proliferation of fast, low-earth orbit (LEO) satellite internet from Starlink across the world. Q1 2022 saw Starlink speeds increase year over year in Canada and the U.S., with Starlink in Mexico having the fastest satellite internet in North America, Starlink in Lithuania the fastest in Europe, Starlink in Chile the fastest in South America, and Starlink in Australia the fastest in Oceania.

Q2 2022 saw Starlink speeds decrease in Canada, France, Germany, New Zealand, the U.K., and the U.S. from Q1 2022 as Starlink crossed the 400,000 user threshold across the world. Starlink in Puerto Rico debuted as the fastest satellite provider in North America. Starlink outperformed fixed broadband averages in 16 European countries. Starlink in Brazil had the fastest satellite speeds in South America. And Starlink in New Zealand was the fastest satellite provider in Oceania.

During Q3 2022, Starlink performance dipped once again from Q2 2022 in Canada and the U.S., while remaining about the same in Chile. Starlink in Puerto Rico and the U.S. Virgin Islands had the fastest satellite speeds in North America, while Starlink in Brazil again was the fastest satellite provider in South America.

With Viasat, HughesNet, and Project Kuiper set to launch huge LEO constellations in 2023, consumers around the world are poised to have more fast satellite internet options, particularly as the European Commission makes its own play for a constellation and Eutelsat and OneWeb potentially merging.

5G Availability points to on-going challenges

5G Availability measures the proportion of Speedtest users with 5G-capable handsets, who spend a majority of time connected to 5G networks. It’s therefore a function of 5G coverage and adoption. We see wide disparity in 5G Availability among markets worldwide, with for example the U.S. recording 54.3% in Q3 2022, well ahead of markets such as Sweden and the U.A.E., with 8.6% and 8.3% respectively.

Chart of 5G availability in select markets, based on users with 5G-capable handsets

Critical levers for mobile operators to increase 5G Availability include:

  • Increasing 5G coverage by deploying additional base stations
  • Obtaining access to, or refarming, sub-GHz spectrum, to help broaden 5G coverage, as sub-GHz spectrum has superior propagation properties than that of higher frequency spectrum bands.
  • Encouraging 5G adoption among users with 5G-capable handsets.

Speedtest Intelligence points to 5G adoption challenges in some markets, with 5G Availability dropping in Bulgaria, South Korea, the Netherlands, and the U.A.E. As more users acquire 5G-capable devices, operators need to balance their pricing models to ensure users have sufficient incentives to purchase a 5G tariff.

Chart of percentage change in 5G availability in select markets, based on users with 5G-capable handsets

Where 5G continues to fail to reach

Speedtest Intelligence showed 29 countries in the world where more than 20% of samples were from 2G and 3G connections (combined) during Q3 2022 and met our statistical threshold to be included (down from 70 in Q3 2021). These are mostly countries where 5G is still aspirational for a majority of the population, which is being left behind technologically, having to rely on decades-old technologies that are only sufficient for basic voice and texting, social media, and navigation apps. We’re glad to see so many countries fall off this list, but having so many consumers on 2G and 3G also prevents mobile operators from making 4G and 5G networks more efficient. If operators and regulators are able to work to upgrade their users to 4G and higher, everyone will benefit.

Countries That Still Rely Heavily on 2G and 3G Connections
Speedtest IntelligenceⓇ | Q3 2021
Country 2G & 3G Samples
Central African Republic 76.2%
Turkmenistan 58.5%
Kiribati 51.6%
Micronesia 47.4%
Rwanda 41.1%
Belarus 39.7%
Equatorial Guinea 37.7%
Afghanistan 36.7%
Palestine 33.5%
Madagascar 27.5%
Sudan 27.4%
Lesotho 26.5%
South Sudan 26.3%
Benin 26.0%
Guinea 25.5%
Cape Verde 24.3%
Tonga 24.3%
Syria 23.4%
The Gambia 23.4%
Ghana 23.3%
Palau 22.9%
Niger 22.8%
Tajikistan 22.7%
Mozambique 22.4%
Guyana 21.8%
Togo 21.8%
Congo 21.1%
Moldova 20.8%
Saint Kitts and Nevis 20.0%

We were pleased to see the following countries come off the list from last year, having dropped below the 20% threshold: Algeria, Angola, Anguilla, Antigua and Barbuda, Armenia, Barbados, Bosnia and Herzegovina, Botswana, Burundi, Caribbean Netherlands, Cook Islands, Dominica, Ecuador, El Salvador, Ethiopia, Gabon, Grenada, Haiti, Honduras, Jamaica, Liberia, Mauritania, Namibia, Nigeria, Papua New Guinea, Saint Lucia, Saint Vincent and the Grenadines, Sierra Leone, Solomon Islands, Somalia, Suriname, Swaziland, Tanzania, Trinidad and Tobago, Uganda, Ukraine, Uzbekistan, Vanuatu, Venezuela, Yemen, Zambia, and Zimbabwe. While countries like Belarus, Cape Verde, Central African Republic, Guinea, Guyana, Madagascar, Palestine, Rwanda, South Sudan, Tajikistan, Togo, and Turkmenistan are still on this list, they have improved the percentage of their samples on these outmoded technologies when compared to last year by at least 10 points. Palestine improved by more than 50 points. 2G and 3G samples in Kiribati increased 3.2 points when comparing Q3 2022 to Q3 2021.

We’re glad to see performance levels normalize as 5G expands to more and more countries and access improves and we are optimistic that 2023 will bring further improvements. Keep track of how well your country is performing on Ookla’s Speedtest Global Index™ or track performance in thousands of cities worldwide with the Speedtest Performance Directory™.

Ookla retains ownership of this article including all of the intellectual property rights, data, content graphs and analysis. This article may not be quoted, reproduced, distributed or published for any commercial purpose without prior consent. Members of the press and others using the findings in this article for non-commercial purposes are welcome to publicly share and link to report information with attribution to Ookla.

| August 15, 2022

5G in Nordics: Sweden Leads on Speeds, Denmark on 5G Availability

The Nordic region performs well when it comes to median mobile download speeds according to the Speedtest Global Index™. In June 2022, Norway took the top spot in the world in terms of median download speed with 129.96 Mbps, Denmark was eighth place (100.25 Mbps), Sweden ranked 17th and Finland 22nd. Having ambitious digital strategies in terms of bringing high-speed networks to households and businesses, those countries look to 5G too as a driver of digital transformation. To achieve that and enable collaboration across the region, the prime ministers of the Nordic countries signed a letter of intent (LOI) April 2018, which stated that the Nordic region should be the “first and most integrated 5G region in the world,” and the region should become a “common Nordic 5G space.” In this article we examine 5G performance across the region, including the state of 5G spectrum awards, private networks status, 5G mobile performance and 5G Availability at the country and city-level.

Key takeaways 

  • Sweden led the Nordics in 5G median download speeds in Q2 2022, which is partially driven by the Swedish digitalization strategy. 
  • Using Speedtest Intelligence®, we compared 5G Availability, which refers to the percentage of users on 5G-capable devices that spend most of the time with access to 5G networks. In Q2 2022, Denmark’s 5G Availability stood at 36.4%, Norway at 23.3%, Finland at 21.0% while Sweden at 6.2%.
  • Swedish operators — Telenor, 3, and Tele 2 — topped the median 5G download rankings in Q2 2022, YouSee Denmark inched away in 5G Availability with 61.3% 5G Availability.
  • The Swedish capital of Stockholm had the fastest median 5G download speed across five cities, whereas Oslo, the capital of Norway, had the best 5G Availability.
  • Nordic 5G performance benefits from having allocated low-band and mid-band spectrum.  
  • Operators and enterprises in the Nordics look to 5G as a tool to enable digital transformation.

Sweden leads on median 5G download speed

Chart comparing 5G performance in Nordics countries to regional peers

We compared 5G performance using Speedtest Intelligence data from Q2 2022 in the Nordic countries against other European countries. The Nordic region performs well in this ranking, with Sweden first amongst the countries in the chart above. Noteworthy is the fact that only Nordic countries have digital strategies in place, as outlined below, that shape their strategies around networks rolled out to meet their digital goals. While most of these policies focus on fixed broadband, in Sweden 5G was identified as a key technology in Sweden’s quest to achieve 100% high speed broadband access.

Denmark’s 5G Availability on par with the Netherlands

Chart comparing 5G availability in Nordic countries to regional peers

Using Speedtest Intelligence, we compared 5G Availability, which refers to the percentage of users on 5G-capable devices that spend most of the time with access to 5G networks, across Nordic countries and a select sample of European markets. In Q2 2022, Denmark’s 5G Availability stood at 36.4%, Norway at 23.3%, Finland at 21%, and Sweden at 6.2%. Both Denmark and Netherland benefit from being flatter and more densely populated, which in turn results in a greater ability to expand 5G coverage. Other Scandinavian countries have much lower population density than Denmark (139.9 people per km2): Sweden (25.5), Finland (18.2), and Norway (17.7). Denmark has been active in prompting 5G adoption, case in point the Danish Energy Agency published a 5G Action Plan for Denmark, which zeroes in on four building blocks: frequencies, roll-out, regulation, and use cases as foundations for a successful roll-out and utilization of 5G.

Swedish operators top the median 5G download rankings in Q2 2022, YouSee Denmark inched away in the 5G Availability

Chart comparing 5G performance and availability in among Nordic countries top providers

The majority of the 14 players operating across the four countries launched commercial 5G networks in 2020, apart from Elisa Finland (July 2019), Telia Finland (October 2019), and Ice Norway (November 2021). 

Sweden tops the charts for 5G speeds but lags on 5G Availability

Swedish operators perform well when it comes to 5G speeds, not so much on the 5G Availability, which was below 10% as of Q2 2022. 5G Availability is a function of 5G network coverage, 5G tariffs, and 5G-capable devices adoption. Operators are taking steps to increase across all of these components. According to Swedish communications regulator PTS, just over one million subscriptions used the 5G mobile network in 2021 (four times more than a year before), which is equivalent to 8% of all mobile subscriptions. Operators are intensifying their network investments to expand 5G network coverage as follows:

  • Net4Mobility is a joint venture between Tele2 and Telenor. Tele2 and Telenor Sweden committed to intensifying 5G network roll out during 2022, planning to extend the reach of Net4Mobility to 90% of Swedish population by the end of 2023 and the rest in 2024. 
  • Telia Sweden in collaboration with its long standing partner, Ericsson, plans to match 5G coverage to that of its 4G network by 2025. The short term target is to cover more than 90% of the population with 5G by 2023; in the longer term extending to 90% geographical and over 99% population coverage. 
  • 3 Sweden has a few milestones over the next couple of years: finalizing 5G deployment on its existing network in 2022, upgrading its core to 5G for lower latency (2022-23), network expansion and densification (2023-24), and rolling out network slicing to serve enterprises needs such as hospitals, airports, and factories.

3 Sweden is also taking steps to allow customers to test and become familiar with its 5G network during 2022. It offers at no additional cost its newly launched services called “3Fullfart” that uses the 3.5GHz band, priced at a cost of SEK49 ($5.13) a month.

Denmark performs better than others in 5G data experience but yet to match Swedish operators’ 5G speeds

Networks have evolved to become increasingly complex, catering to both the wealth of new services and increasing consumer demand for data. 5G heightened this complexity, therefore it is ever so important to be able to measure the actual end user experience. To achieve that, CellRebel® developed a scoring framework to allow its customers to benchmark different services and to combine various KPIs into composite KPIs and scores. The 5G Data Experience score consists of real user experience for four different popular services: web browsing, YouTube video streaming, gaming, and video conferencing. 

  • YouTube Video Streaming Score is a weighted average of the proportion of samples with video start time better than two seconds, those that had no rebuffering events, and had a video resolution better than 240P. 
  • Web Browsing Score is a percentage of web pages loaded in less than 1.5 seconds.
  • Gaming Score is a weighted average of the percentage of samples with a gaming latency better than 60 ms, proportion of those with no packet loss, and percentage of measurement samples with a jitter lower than 10 ms.
  • Video Conferencing Score is a weighted average of the percentage of samples with latencies of less than 60 ms to popular video conferencing services infrastructure, the percentage of measurements with no packet loss, and the percentage of measurement samples with a jitter lower than 10 ms. 

All of these measures are combined into an individual score where 0 is the worst experience and 100 corresponds to the best experience. Looking at the four Nordics markets, Denmark had the best 5G Data Experience score in Q2 2022 but other countries are not far behind. Denmark’s good performance is not a surprise if we consider the fact that it took the top spot across the 27 EU Member States, according to the European Commission’s 2021 edition of the “Digital Economy and Society Index” (DESI). Denmark came first in connectivity, ranked second in integration of digital technology and in digital public services, and fourth in human capital. 

Chart of CellRebel 5G Experience Score across nordic countries

Danish operators continue to upgrade their network taking advantage of their spectrum assignments. 

  • Speedtest Intelligence data puts YouSee Denmark as the operator that had best 5G Availability across the Nordics in Q2 2022, with a 61.3% 5G Availability. YouSee (part of TDC Group) partners with TDC NET for 5G network, a legally separate wholesale network operator within TDC Group, which reached 99% of Denmark with 5G in 2021 compared to 78% in 2020 as reported in its 2021 Annual Report
  • 3 Denmark stated that 60% of its network was 5G-enabled in July 2022, as it continues the upgrade of its 5G network using 2100 MHz and 3.5 GHz frequencies, as well as modernizing 4G. 
  • TT Network (TTN), a joint network between Telia and Telenor, started upgrading the network to 5G following the mid-band spectrum award. In 2021 it upgraded 1,000 mobile masts and an additional 1,400 masts will be upgraded during 2022 out of a total 4,300 sites. 
  • Telenor Denmark’s plans to shut down its 3G network in 2022, which operates using spectrum in the 900 MHz and 2.1 GHz band and refarm the frequencies for 5G. The operator also plans to deploy 5G SA and address the enterprise use case through the recently created separate division for private networks. The first example of such collaboration is connecting robots via a Telenor private 4G network rather than via Wi-Fi for Danish company Mobile Industrial Robots (MiR). 

Finland’s 5G coverage is on the rise, other building blocks such as 5G tariffs and handsets need to fall into place to increase 5G Availability

The Finnish Transport and Communications Agency, Traficom, reported that at the end of 2021, 5G network coverage has extended to 82% of Finish households (a six percentage point increase over the previous year). At the same time, 4% of mobile data was transmitted over the 5G network, which means that only a small proportion have so far started using subscriptions or devices supported by the 5G network despite the increase in 5G coverage. Finnish operators are working to increase customer access to smartphones but also working on enabling new use cases with 5G SA. 

  • Elisa’s 5G network reached over 80% of the Finnish population in more than 180 municipalities as of the end of Q2 2022. The operator also reported that 5G smartphones accounted for 10% of smartphones in Q1 2022 compared to 7% in Q1 2021. In June 2022, Elisa in partnership with Nokia and Qualcomm conducted a 5G live demonstration at the Nokia Arena in Tampere in Finland achieving uplink speeds of 2.1 Gbps utilizing Nokia’s AirScale base station in 26 GHz mmWave spectrum, seemingly as the first operator across the region.
  • In November 2021, Telia Finland launched the first commercially available 5G standalone (SA) core network in the Nordic and Baltic region, creating the opportunity for advanced 5G use cases and a strengthened position in the Enterprise segment. According to Telia’s Q2 Report, the operator achieved a 70% population coverage in Finland, and in Norway. 
  • DNA reported that during the first half of the year, almost 80% of all the phones sold by DNA were already 5G-capable, compared to just over 50% in 1H 2021. Following the activation of the 700 MHz frequency band for 5G use, the 5G network coverage extended to 70% of the population at the end of June 2022. Although all DNA 5G base stations are connected to a standalone 5G core network, the preparation for the 5G SA commercial offering to customers is still underway. 
  • Suomen Yhteisverkko Oy (Finnish Shared Network) has been building a mobile network on behalf of DNA and Telia in northern and eastern Finland. The construction of the Finnish Shared 5G Network started in 2021 and its coverage area was extended towards the inland of Finland. During the spring of 2022, the Finnish Shared Network carried out large-scale 5G network deployment on the 700 MHz frequency in South Savo region, thanks to which 5G coverage has also spread to sparsely populated areas.

Norway shines the brightest when it comes to mobile speeds with good 5G performance 

Norwegian operators perform well on 5G speeds and 5G Availability, without being the top providers. Yet, Norway took the first spot in June’s Speedtest Global Index  performance ranking for global median mobile speeds, which points to a strong 4G performance and a potential challenge Norwegian operators face in trying to convince its customer base to upgrade to 5G. However, according to Nkom’s “Internet in Norway — Annual Report 2022” 5G traffic is growing as mobile operators continue to roll out 5G and introduce 5G-enabled smartphones. In Q1 2022, around 25% of connected handsets were ready for 5G technology, and 5G connections account for around 5% of total internet traffic. Additionally, operators are expanding into 700 MHz and 2100 MHz bands; during the spectrum auction the winning bidders were able to obtain a discount of up to NOK 40 million ($4 million) if they agreed to certain coverage obligations, e.g. Telia to cover “selected railway lines” and Telenor to cover major roadways including “European roads and the coastal road from Mo i Rana to Bodo.” 

  • Telenor Norway is upgrading its 8,500 base stations, with over 2,500 already modernized resulting in a 5G coverage reaching 50% of population. The operator plans to complete the 5G rollout in 1H 2024, with a total number of 9,000 base stations. Telenor was the fastest 5G operator in Norway in terms of 5G mobile network speed in Q1-Q2 2022, but the operator is also eyeing an enterprise opportunity. Telenor Norway set its sight to become the leading player in private mobile networks in Norway, a business opportunity which it values at over NOK 5 billion in 2025. To achieve that it will provide consultancy services for industrial 5G networks edge computing and private mobile networks. It has begun a trial with Yeti Move to run automated bulldozers at Gardermoen Airport. 
  • Telia Norway plans to have nationwide 5G network coverage by 2023. At the end of Q2 2022, 70% of the population was within its 5G network’s reach. The operator began tests in the 26 GHz band with Ericsson aiming to provide service at almost 4 Gbps. Telia targets the corporate market with the 26 GHz spectrum and is currently testing different use cases for companies across various industries. 
  • Despite being a late entrant into the market, Norway’s third mobile network operator – Ice Norway — recorded a 20.8% 5G Availability. Initially, the operator launched in Oslo across 14 cell sites using 2100 MHz and 700 MHz spectrum bands, which was accessible for most 5G-enabled Android phones. In the short term, the coverage will be extended to the country’s 4-5 largest cities with a longer term plan of reaching 75% population coverage. Alongside other Norwegian operators Ice had opted to undertake regional coverage obligation to receive a discount on the spectrum license fee. Stockholm was the fastest city, Oslo had the best 5G Availability.

Stockholm was the fastest city, Oslo had the best 5G Availability 

Map of 5G performance and availability across Nordic cities

Stockholm came first across five cities in the Nordics in Q2 2022, with 3 and Telenor achieving mind-blowing download speeds of over 600 Mbps at 637.14 Mbps and 614.48 Mbps, respectively. It is not surprising that Stockholm performs well as it is often a testing ground for innovation — hosting a number of tech startups and scale-ups (such as Skype and Spotify) and one in ten people working in the digital tech sector. 

During Q1-Q2 2021 Oslo had the title of the fastest 5G of any world capital across 15 world capitals we analyzed in this article. While this is no longer the case, Oslo took the top spot for 5G Availability across the five Nordic cities in Q2 2022.

Nordic 5G performance benefits from having allocated low-band and mid-band spectrum

Within Europe, the Nordics stand out on 5G performance. Part of this is because of 5G spectrum availability as all four of the Nordic countries on the continent have already assigned low-band and mid-band spectrum. This is ahead of the rest of Europe, as we have reflected on the 5G progress across Europe. Denmark and Finland had also awarded mmWave spectrum. In fact, Denmark scored 99% in the 5G readiness indicator and ranked first on 5G mobile-broadband coverage (with 80% of households covered) as per Digital Economy and Society Index (DESI) 2021. Norway’s National Communications Authority (Nkom) and Sweden’s Post and Telecom Agency (PTS), are also looking to make spectrum available for 5G across low and mid-band spectrum.

Chart of 5G band spectrum assignment in Nordic countries

Of course, 5G pioneer bands are not the only frequencies that operators use to deploy 5G, as operators shut down legacy networks, they can also refarm sub 3GHz frequencies for 4G or 5G. European operators tend to support 2G in the short term, phasing out 3G networks instead. The primary reason being long term M2M/IoT contracts with enterprises such as utility providers. In Norway and Sweden, a significant portion of smart meters already deployed are connected to 2G networks, therefore operators are obliged to support millions of 2G smart meters until the end of their lifecycle. Case in point: Telenor Norway switched off 3G in 2021 — five years ahead of their planned switch off of 2G, in fact all of the Norwegian operators have switched off 3G networks in 2021 and all of the Finnish operators plan to do so by 2023, while the Danish and Swedish will follow by 2025.

Operators and enterprises in the Nordics look to 5G as a tool to enable digital transformation

As 5G technology will go beyond pockets of high-speed mobile broadband to deliver low latency, high density, industry-specific applications that make use of cloud and edge technologies, it will also play a role in driving digital transformation. Digitization of different sectors of the economy is key to supporting sustainable development and climate goals. However, enterprise requirements differ. Some prefer to retain control over their networks, isolating them from the public network to address higher availability, lower latency, and enhanced privacy needs. We have commented on how the private networks landscape is developing in Europe here. Like other nations, the Nordics are also looking to private networks to address Industry 4.0 objectives as 5G plays an important role in the digital transformation and creating new services and solutions across a variety of sectors, especially manufacturing.

Nordic regulators created an encouraging environment for enterprises to deploy their own networks; all countries have already allocated spectrum for vertical use across mid- and high-frequency bands. It is worth noting that a vertical set aside is not the only option telecom regulators have at their disposal in addressing enterprise requirements. For example, the Finnish regulator in addition to allocating spectrum in the 2300-2320 MHz and 24.5-25.1 GHz band on a first-come, first-served basis, had also included a leasing option provision in the 3.5 GHz band license. Mobile operators are obliged to lease their spectrum assets: either participate in tenders for vertical contracts in localized areas or sub-license their spectrum to the vertical so they can build their own network.Chart of spectrum allocation in Nordic countries

However, simply assigning or making spectrum available to verticals isn’t enough to drive market adoption. Global Mobile Suppliers Association (GSA) in its report on Private Mobile Networks released in June 2022, identified 794 organizations deploying private mobile networks. In terms of a number of private networks, the United States ranked first internationally, Germany was second, while Finland came in sixth (with 20 networks). 

Finland actively promotes the development of 5G services, via 5G Momentum, driven by the Finnish Transport and Communications Agency Traficom. The main target of the initiative is to bring together vertical industries stakeholders — Finnish companies, research organizations, and the public sector — to run 5G trials and develop new 5G solutions and use cases. On its home turf of Finland, Nokia has been working on a number of private LTE projects, together with edge connectivity provider Edzcom (formerly Ukkoverkot), port machinery maker Kalmar, and port operator Steveco, delivering private networks in the ports of Kokkola and Oulu, as well as Steveco Kotka harbor. Although mobile operators are no longer the de facto service providers, they are involved in delivery of private networks. We have collated a few recent deals with regards to private 5G networks in the region, which show a growing demand from enterprises and also increased operators involvement. Furthemore, despite the fact that the majority of private networks across the Nordics are currently LTE-only (55.3%), a growing proportion is 5G ready (LTE and 5G, 21%), with a few deployed as 5G from the get go.

Location Partners Solution Details  Date
Finland Edzcom and lighting company Signify A private 5G wireless smart network in the city of Tampere A long-term project to use the Tampere’s streetscape assets to create a high-performance wireless private network.  June 2022
Norway  Telia and the Norwegian Defense Materiel Agency A private 5G network for the Armed Forces as part of a cooperation with the Defense Materiel Agency. A pilot private and separate 5G mobile network to run alongside a military slice within Telenor’s commercial network.  June 2022
Norway Telia and Herøya Industrial Park A strategic cooperation within 5G and private mobile networks.  Telia will roll out a private mobile network on the new industrial spectrum 3.8-4.2 GHz and in the industrial park’s test laboratory there will be a separate 5G facility with the option of edge computing.  May 2022
Norway  Telenor and the Norwegian Defense Materiel Agency A private autonomous 5G network will be established for the Armed Forces.  The partnerships involve planning, designing, developing, and operating a pilot on a mobile, autonomous private 5G network, which cooperates with a defense-specific network slice (‘Defense slice’) in the public mobile network.  May 2022
Sweden Tele2 and X Shore A private 5G network in X Shore newly built factory in Nyköping.  X Shore will use its 5G network to wirelessly connect production equipment to collect data and maintain and control production. May 2022
Finland Telia, Nokia and Digita A 5G private network for Posiva Oy for the needs of the nuclear fuel disposal process in Eurajoki.  The private 5G network will enable the operation of an advanced automation system in the disposal process as well as improve safety and processes for employees. May 2022
Sweden Telia and Svenska Cellulosa AB (SCA) Dedicated LTE private mobile network, which is a 5G ready.  Telia supplies an Enterprise Mobile Network (EMN) with Local Breakout, based on 4G equipment that can be upgraded to 5G. The solution leverages the scalability and operational reliability of the public mobile network, but with dedicated capacity. January 2022

Operators in the region continue to roll out 5G but they are also casting their eyes on 5G SA, which offers the most benefits related to eMBB, massive IoT, and critical IoT. This in turn allows support for a wide range of devices and applications with more demanding bandwidth and latency requirements. The recent acquisition of CellRebel by Ookla® helps us expand our ability to help improve the end-user experience. We’re at a key inflection point in which the industry is recognizing the importance of assuring that any network expansion or optimization is actually tied to improving the customer experience. Looking only at network KPIs without understanding their impact on what the customer experiences isn’t enough. Network complexity, moreover, is only increasing with 5G deployments. With CellRebel, we will be able to better monitor and help improve not just radio networks but the entire end-to-end chain, which in turn leads to a stronger customer experience.

We’ll be watching 5G performance closely across the Nordics using Speedtest Intelligence. If you want to learn more about how Speedtest Intelligence can help you benchmark your 5G performance against competitors, please inquire here. If you are interested in how CellRebel can help you measure your network please inquire here.

Ookla retains ownership of this article including all of the intellectual property rights, data, content graphs and analysis. This article may not be quoted, reproduced, distributed or published for any commercial purpose without prior consent. Members of the press and others using the findings in this article for non-commercial purposes are welcome to publicly share and link to report information with attribution to Ookla.