| January 4, 2023

The Speedtest Global Index Shows These Countries Sped Forward for Internet Experience in 2022

Internet connectivity continues to speed ahead for people around the world, especially as countries prioritize and improve mobile and fixed broadband networks. That’s nowhere more apparent than on the Speedtest Global Index™, which tracks countries’ internet speeds and the overall global median internet speeds. Last year, we took a look at the state of the internet speeds over the years, and today we’re back to see how most of 2022 fared from November 2021 to November 2022, and what countries made our top 10 fastest mobile and fixed broadband lists.

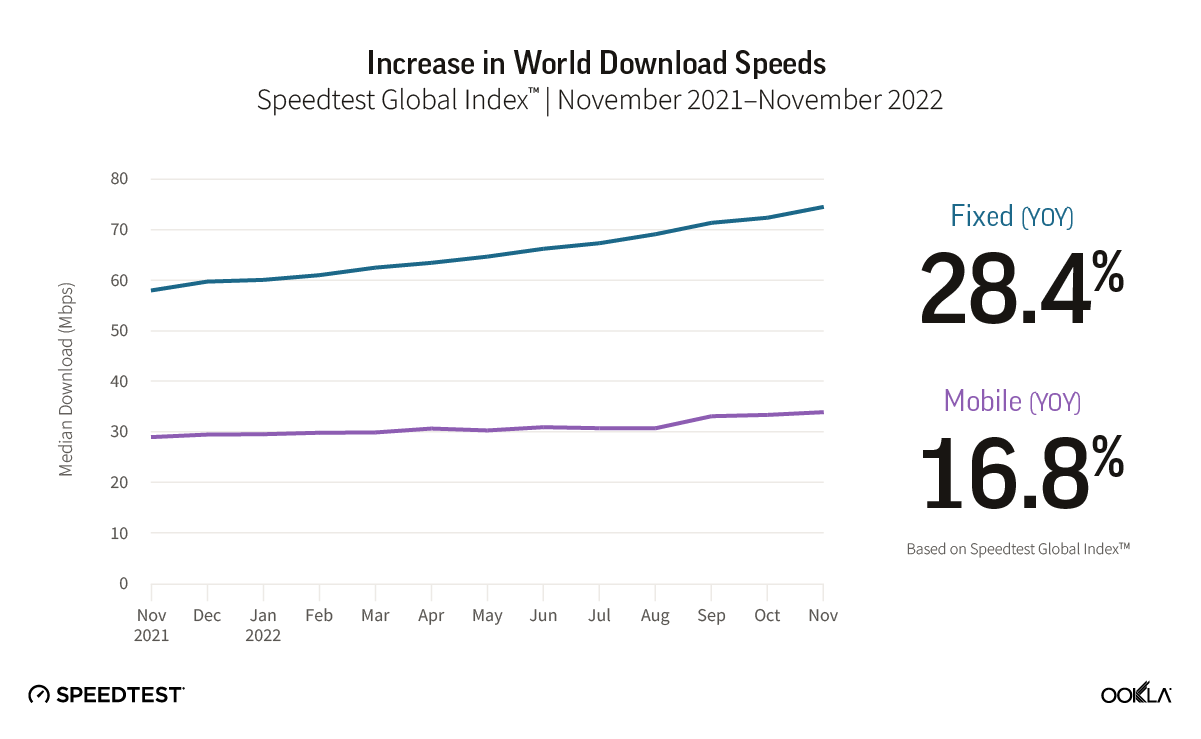
Mobile download speed jumped nearly 17% over the last year globally, fixed broadband up at least 28%

Chart of increase in world download speeds from November 2021 through 2022

The improvement of global median download speeds has been somewhat asymmetrical over the past year on the Speedtest Global Index. Fixed broadband speeds made greater strides over the past year than mobile download speeds, with fixed broadband speeds becoming at least 28% faster and mobile becoming nearly 17% faster from November 2021 to November 2022. Gains in upload speed were even more pronounced with mobile becoming at least 9% faster and fixed broadband becoming at least 30% faster. Latency, which is becoming an increasingly important metric, decreased on mobile over the course of the year from 29 ms in 2021 to 28 ms in 2022, while fixed broadband latency remained the same at 10 ms.

Top 10 rankings remain relatively constant over the past year, U.A.E. joins fixed broadband list and Denmark, Macau (SAR), and Brunei race ahead for mobile during 2022

Chile raced ahead on fixed broadband

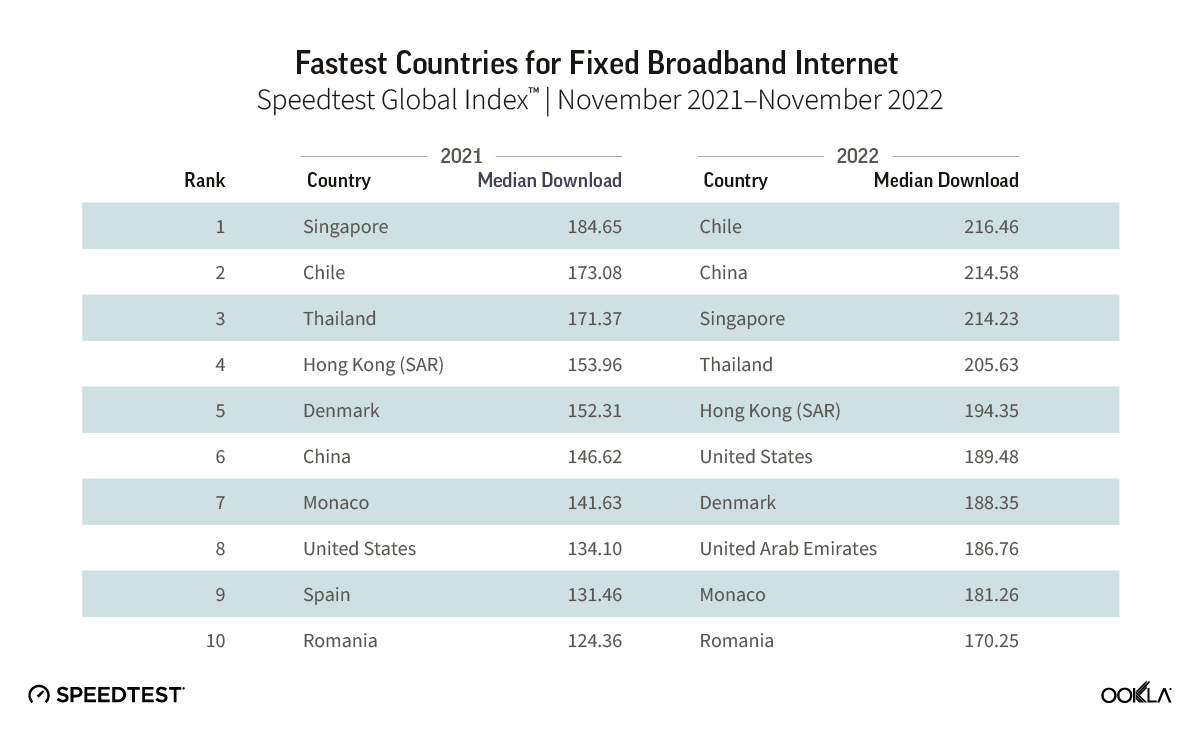
List of fastest countries for fixed braodband internet from November 2021 through 2022

The competition for the fastest fixed broadband was neck-and-neck on the Speedtest Global Index during 2022, with Chile (216.23 Mbps) taking top honors and China (214.23 Mbps) and Singapore (214.23 Mbps) a hair behind. Over the course of the year, the top 10 countries for fastest fixed broadband remained relatively the same while each country jostled up and down the list for fixed broadband superiority. Only Spain was replaced from the top 10 with the U.A.E. taking its place. Notably, China jumped four places from sixth to second, improving its median download speed from 146.62 Mbps in 2021 to 214.58 Mbps in 2022. Romania’s tenth place finish in 2022 would have earned fourth place in 2021, showing how fast these countries are all prioritizing improved fixed broadband speeds.

Qatar soars to first for fastest mobile country

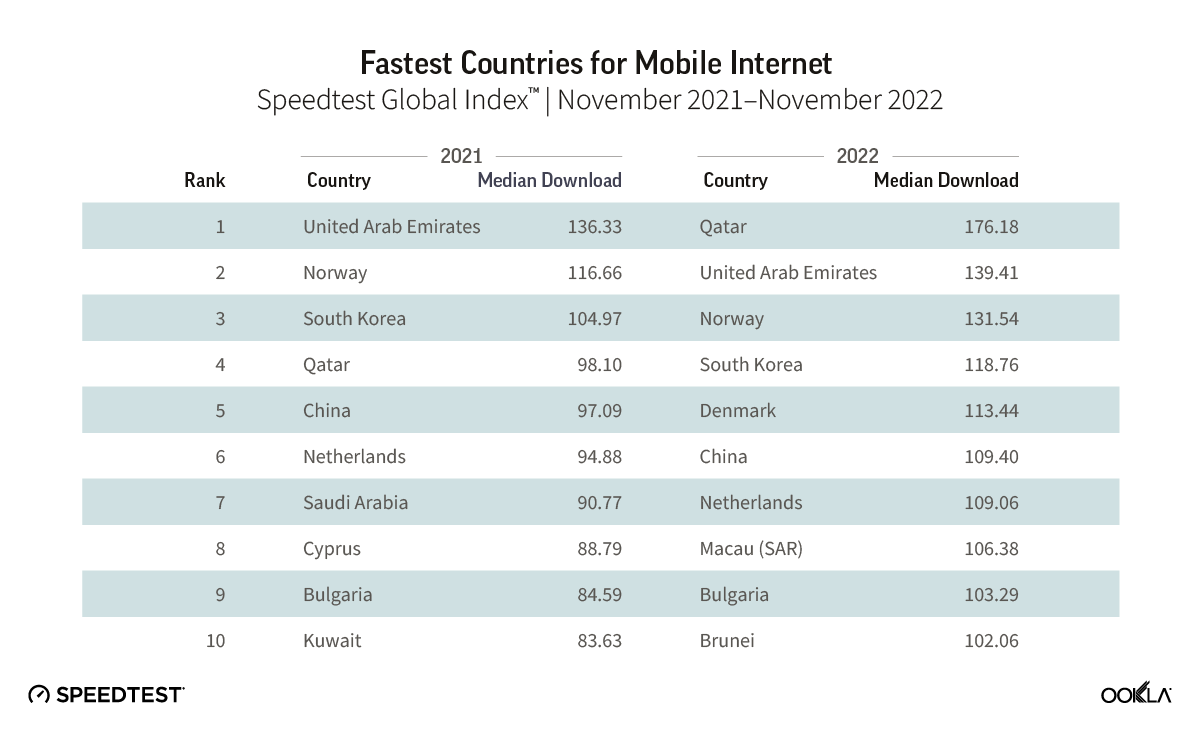
List of fastest countries for mobile internet from November 2021 through 2022

Ahead of hosting the FIFA World Cup 2022®, Qatar rocketed to first place on the Speedtest Global Index with a median download speed of 176.18 Mbps in November 2022 from 98.10 Mbps in November 2022. Next on the list was the U.A.E. at 139.41 Mbps, which had the fastest median download speed in November 2021. Notably, all 10 countries on our November 2022 list had median mobile download speeds greater than 100 Mbps. New to our 2022 list Denmark (113.44 Mbps), Macau (SAR) (106.38 Mbps), and Brunei (102.36 Mbps) replaced Saudi Arabia, Cyprus, and Kuwait from our 2021 list.

Most of the top 10 countries perform well for fixed and mobile

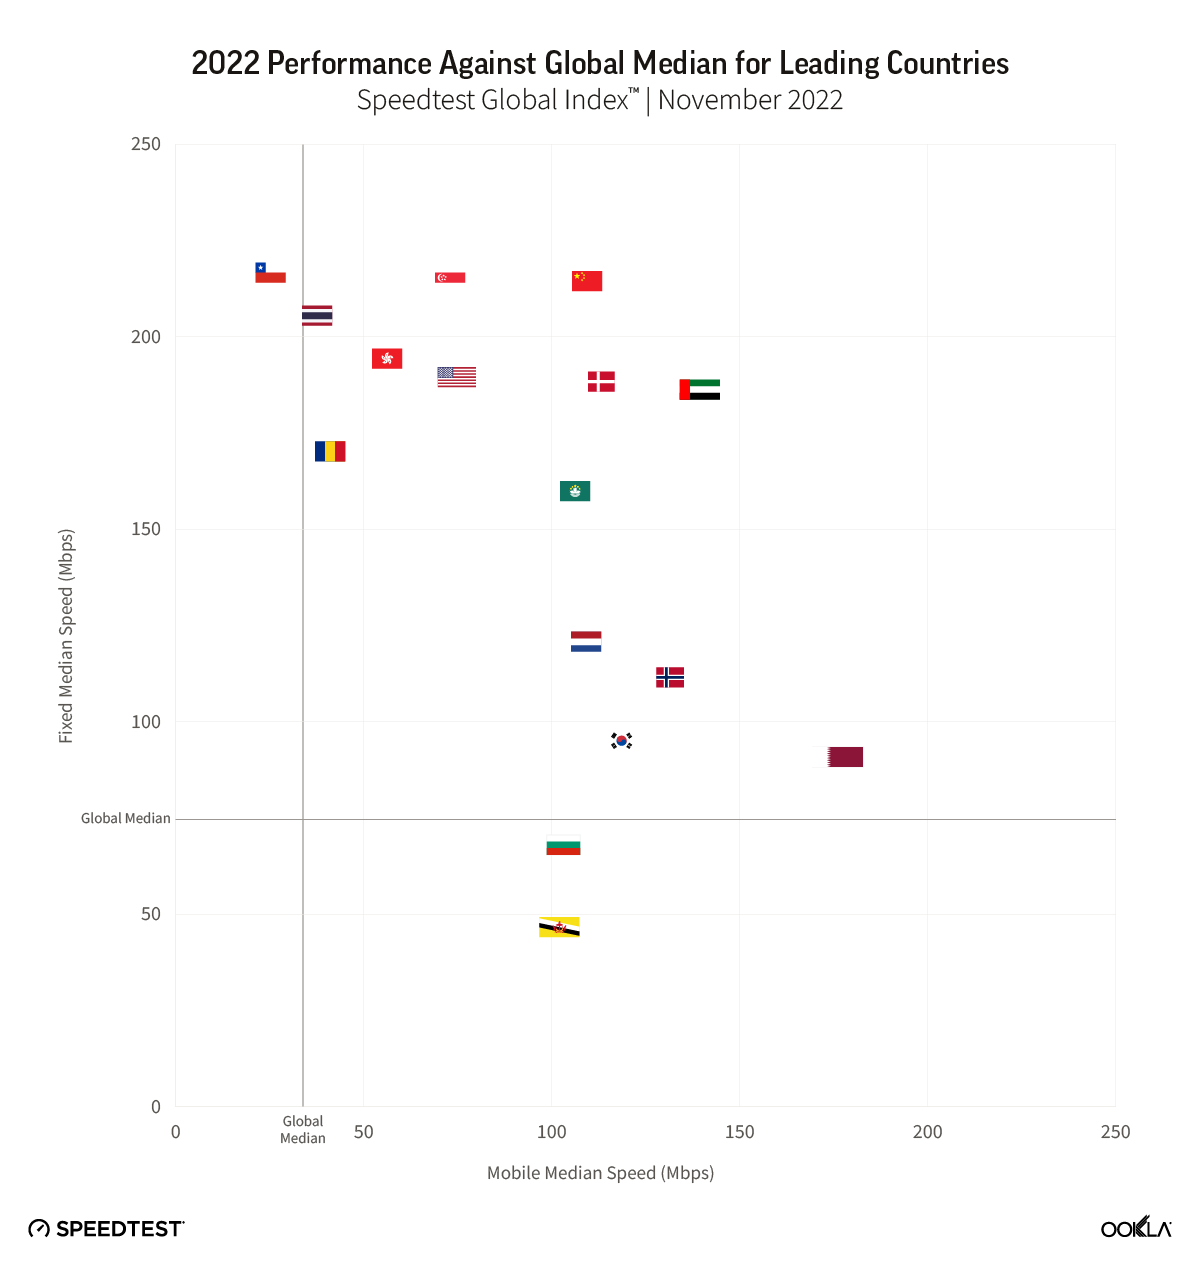
Chart of 2022 perfromance against global median for leading countries

Out of the 17 countries appearing on either the fastest fixed broadband or mobile Speedtest Global Index top 10s during November 2021 — with China, Denmark, and the U.A.E. appearing on both lists — all but Monaco met the statistical threshold to be included to look at overall fixed and mobile performance. Looking at the remaining 16 countries, most every country on both lists performed relatively well against the global median for both fixed and mobile, which appear as gray lines in the image above. Three countries underperformed a global median: Brunei and Bulgaria for fixed, and Chile for mobile. Thailand performed at about roughly the global median for mobile, as did Romania.

We’re excited to see how global speeds and rankings change over the next year as individual countries and their providers choose to invest and expand different technologies, particularly in 5G and fiber. Be sure to track your country’s and check in on our monthly updates on the Speedtest Global Index. If you want more in-depth analyses and updates, subscribe to Ookla Research™.

Ookla retains ownership of this article including all of the intellectual property rights, data, content graphs and analysis. This article may not be quoted, reproduced, distributed or published for any commercial purpose without prior consent. Members of the press and others using the findings in this article for non-commercial purposes are welcome to publicly share and link to report information with attribution to Ookla.

| March 27, 2023

Early Testing Shows How Fast the New Samsung Galaxy S23 Models Are

The new Samsung Galaxy S23, S23+, and S23 Ultra models launched February 17 and Ookla® is here today to see how they’ve performed over 5G against their predecessor S22 models. Our analysis looks at data from the first month after launching in 12 of the largest mobile markets with an established 5G market and the highest number of connected mobile devices during Q4 2022 according to GSMA. Previously, in October 2022, we used Speedtest Intelligence® to look at 5G performance data right after the launches of the iPhone 14 and Samsung Galaxy Z Fold4 in various countries

Note that device data differs across markets due to a variety of factors, including: 5G investments by governments and mobile operators, different 5G spectrum allocations by operator, 5G Availability, the number of and different kinds of 5G deployments, and other differences, including mobile 5G plans. Read on to learn more and see whether or not you should upgrade your Samsung S22 to a newer model.

Key takeaways:

  • The Samsung S23 models only statistically outperformed corresponding S22 models in Germany and two out of three models in the United States for 5G download speed, but the S23 looks poised to be faster as further 5G adoption and build out continues and more spectrum is allocated for 5G across the C-band and mmWave frequencies.

Key improvements to the new Galaxy S23 models

You want to know if the latest technology is worth the price of an upgrade when you’re looking for a new phone. The S23, S23+, and S23 Ultra have various upgrades, but when it comes to performance, here’s a quick list of what’s different between the new and older models. 

All Samsung Galaxy S23 vs. S22 models

  • The Samsung S23 models have a Qualcomm Snapdragon 8 Gen 2, while the Samsung S22 models have a Samsung Snapdragon 8 Gen 1
  • The S23 models have a Qualcomm Snapdragon X70 modem, while the S22 models have an X65 modem
  • The S23 models have an upgraded GPU

Samsung Galaxy S23 vs. S22 base models

  • The S23 has a bigger battery capacity at 3,900 mAh over the S22’s 3,700 mAh
  • The S23 has slightly better ultra-wide and front cameras and video recording capabilities

Samsung Galaxy S23+ vs. S22+ models

  • The S23+ has expanded storage capacity at a base level of 256 GB (which can be upgraded to 512 GB) over the S22+’s base of 128 GB
  • The S23+ has a bigger battery capacity at 4,700 mAh over the S22+’s 4,500 mAh
  • The S23+ has slightly better ultra-wide and front cameras and video recording capabilities

Samsung Galaxy S23 Ultra vs. S22 Ultra models

  • The S23 Ultra has expanded storage capacity at a base level of 256 GB (which can be upgraded to 512 GB) over the S22 Ultra’s base of 128 GB
  • The S23 Ultra has much better main camera, with up to 200 MP vs. the S22 Ultra’s maximum of 108 MP

Samsung Galaxy S23 performance in the world’s largest mobile device markets

Brazilian S22 and S23 users saw seriously fast 5G speeds (even though 5G Availability remains low)

Chart of Samsung Galaxy S23 vs. S22 5G Performance in Brazil

Speedtest Intelligence shows that the new S23 models were not yet statistically faster than the older S22 models in Brazil during the first month of launch, but they did exceed the median 5G download speed in Brazil during Q4 2022. Despite that, every S22 and S23 model had blazing fast speeds in Brazil, with median 5G download speeds faster than 400 Mbps. The S22 had a median download speed of 431.61 Mbps, the S22 Ultra was at 451.01 Mbps, and the S22+ at 451.85 Mbps. While the S23 models were not statistically faster than their S22 counterparts, the S23 had a median download speed of 459.76 Mbps, the S23 Ultra at 479.78 Mbps, and the S23+ at 494.18 Mbps. 5G upload speeds showed a similar trend, with no statistically faster S22 or S23 model, but with S22 models ranging from 35.73 Mbps to 39.42 Mbps and S23 models ranging from 39.30 Mbps to 42.59 Mbps. Multi-server latency — the latency you should expect to encounter more generally when your network is not under heavy load — ranged from 28.01 ms to 31.78 ms across all models over 5G.

Recommendation: Brazilian Galaxy S22 users should consider upgrading your phone if you can get 5G access; you’re going to get fast speeds and the new features of the S23, especially the camera of the S23 Ultra, may be worth it alone.

Chinese S23 users haven’t quite seen an improved 5G experience over S22 users

Chart of Samsung Galaxy S23 vs. S22 5G Performance in China

Data from the first month since the Samsung S23 launching illuminates that S23 models did not statistically outperform S22 models over 5G in China, and S23 models also didn’t quite exceed the Q4 2022 median 5G download speed. The S22 had a median 5G download speed of 267.47 Mbps, the S22 Ultra was similar at 265.65 Mbps, and the S22+ was at 301.41 Mbps. The S23 showed a median 5G download speed at 242.70 Mbps, while the S23 Ultra had a median download speed of 269.86 Mbps. 5G upload speeds on S22 models ranged from 48.40 Mbps to 62.93 Mbps, while the S23 and S23 Ultra were at 50.77 Mbps and 42.65 Mbps, respectively. While the S23 models showed lower median multi-server latency over 5G, there was no statistical winner between the S22 and S23 models. The S23+ did not meet the statistical threshold for inclusion in our analysis in China. 

Recommendation: Chinese Galaxy S22 users should wait to upgrade your phone until speeds improve, unless the new S23 model hardware upgrades have you wanting a new phone.

French S23 users saw promising 5G results, S22 users might want to wait to upgrade

Chart of Samsung Galaxy S23 vs. S22 5G Performance in France

There was no statistically faster Samsung Galaxy S22 or S23 model over 5G in France during the first month of the S23’s release. However, median 5G download speeds for the S22 models ranged from 177.98 Mbps to 219.32 Mbps, while the S23 models ranged from 196.53 to 249.46 Mbps. 5G upload speeds showed a similar story, with no statistical winner. Upload speeds on S22 models ranged from 11.46 Mbps to 14.15 Mbps, and upload speeds on S23 models ranged from 14.89 Mbps to 19.22 Mbps. 5G multi-server latency was virtually the same for both models, which all ranged from 41.40 ms to 43.24 ms.

Recommendation: French Galaxy S22 users who want faster speeds might want to wait to upgrade your phone, but the new features of the S23 may make upgrading very tempting.

German Samsung Galaxy S22 users should feel confident upgrading to S23 models

Chart of Samsung Galaxy S23 vs. S22 5G Performance in Germany

Speedtest Intelligence reveals that German S23 users experienced faster 5G download speeds than their S22 counterparts during the first month of S23 availability across all models. The S23 outperformed the S22 for median 5G download speed, 147.26 Mbps to 112.01 Mbps, the S23 Ultra outperformed the S22 Ultra 141.56 Mbps to 124.45 Mbps, and the S23+ outperformed the S22+ 174.74 Mbps to 128.69 Mbps. Upload speeds had a bit more parity with the S22 models showing a range of 5G upload speeds from 20.47 Mbps to 26.10 Mbps, while the S23 models showed a range from 23.59 Mbps to 31.64 Mbps. Multi-server latency over 5G showed no statistical winner for either model but ranged from 36.76 ms to 38.58 ms.

Recommendation: Germany Galaxy S22 users shouldn’t hesitate to run to your operator to immediately upgrade your phone to an S23 model for faster speeds and better features.

Samsung Galaxy S23 users in Italy saw mixed 5G results after launch

Chart of Samsung Galaxy S23 vs. S22 5G Performance in Italy

New Speedtest Intelligence data reveals that while the basic S23 model outperformed the S22 model over 5G in Italy for median download speed 178.67 Mbps to 128.53 Mbps during the first month after launch, the S23 Ultra and S23+ models didn’t statistically outperform their S22 counterparts. That held true for upload speeds as well, with the S23 recording a median 5G upload speed of 21.73 Mbps to the S22’s 15.50 Mbps, while the S23 Ultra and S23+ weren’t statistically faster than the S22 Ultra and S22+, respectively. All of the S23 and S22 models during the first month of the S23 launch, except the S22 base model, were statistically faster than the 5G median download speed in Italy during Q4 2022. Median multi-server latency showed closer parity, with S22 models ranging from 45.02 ms to 47.79 ms, and S23 models ranging from 43.50 ms to 48.24 ms.

Recommendation: Unless you want a basic Galaxy S23 model and have consistent 5G access in Italy, you might want to wait to upgrade your phone to the S23 models unless you really want the new features.

Samsung Galaxy S23 showed 5G potential in the Philippines

Chart of Samsung Galaxy S23 vs. S22 5G Performance in Philippines

Fresh data from Speedtest Intelligence shows that while the S23 and S23+ had faster median 5G download speeds than their S22 counterparts during the first month of the S23’s launch, there were no statistical winners between the models in the Philippines. The S23 models’ median 5G download speeds ranged from 142.31 Mbps to 185.32 Mbps, while the S22 models ranged from 131.87 Mbps to 143.57 Mbps. Median 5G upload speed for the S23 Ultra was faster than its S22 Ultra counterparts at 15.46 Mbps to 12.68 Mbps, respectively. There were no statistical winners for median multi-server latency over 5G, though the S22 models ranged from 35.42 ms to 38.39 ms, while the S23 models ranged from 34.29 ms to 35.31 ms.

Recommendation: Filippino Galaxy S22 users should upgrade their phones to the S23 models if they want new features, but shouldn’t expect faster speeds and a better experience quite yet.

Polish Samsung S23 models had a promising debut over 5G

Chart of Samsung Galaxy S23 vs. S22 5G Performance in Poland

Speedtest Intelligence data shows Poland had some of the slowest median 5G download speeds on Samsung S23 and S22 models among the countries we surveyed. While the new S23 models had a higher median 5G download speed than their counterparts during the first month after launching, there were no statistically significant faster speeds. The S23 models ranged from 83.74 Mbps to 98.99 Mbps, while the S22 models ranged from 75.70 Mbps to 80.43 Mbps. Upload speeds were similarly faster, but not statistically so, with S22 models ranging from 16.89 Mbps to 19.62 Mbps and S23 models ranging from 19.94 Mbps to 24.25 Mbps. Median multi-server latency over 5G was a mixed bag, with the new S23+ actually having a higher latency than the S22+ 44.25 ms to 38.37 ms, respectively. The other two models were too close to call.

Recommendation: Polish Galaxy S22 users can upgrade their phones to the S23 models for the new features, but might not yet experience faster 5G speeds on the new models.

Samsung S23 models in South Africa don’t live up to the hype just yet

Chart of Samsung Galaxy S23 vs. S22 5G Performance in South Africa

Speedtest Intelligence reveals that the new S23 models weren’t yet statistically faster than their S22 counterparts over 5G in South Africa during the first month after launch. S22 models had median 5G download speeds that ranged from 172.07 Mbps to 206.03 Mbps, while the S23 models ranged from 187.62 Mbps to 202.10 Mbps. There was one bright note — the median 5G upload speed for the S23 Ultra was faster than the S22 Ultra 20.43 Mbps to 14.75 Mbps. Median multi-server latency showed parity over 5G for the S22 models and S23 models. The S22 models ranged from 29.06 ms to 33.75 ms, while the S23 models ranged from 31.41 ms to 32.92 ms.

Recommendation: South African Galaxy S22 users should probably wait to upgrade their phones to the S23 models if they are looking for faster 5G experience, but the S23 features may outweigh the parity in speeds between models.

South Koreans saw fast 5G speeds on the new Samsung Galaxy S23 models

Chart of Samsung Galaxy S23 vs. S22 5G Performance in South Korea

Home to Samsung, South Korea showed some of the fastest 5G speeds on our list. Every S23 model had a faster median 5G download speed than the corresponding S22 models, but statistical winners remained elusive during the first month after launch, which we expect will probably change upon more adoption in the near future. S22 models recorded median 5G download speeds between 418.57 Mbps and 537.28 Mbps, while the S23 models ranged from 503.99 Mbps and 584.08 Mbps. Upload speeds were similarly impressive — though with no statistically faster median 5G upload speeds than another — with S22 models ranging from 37.76 Mbps to 51.66 Mbps over 5G, and S23 models ranging from 47.51 Mbps to 57.62 Mbps. Median multi-server latency over 5G showed ranges from 65.00 ms to 69.81 ms for the S22 models, and a range of 66.13 ms to 68.15 ms for the S23 models.

Recommendation: If you’re a South Korean Galaxy S22 user, you can probably expect slightly faster speeds if you upgrade to the new S23 models, but an upgrade for the new features, especially for the new S23 Ultra camera, might be more justified.

Thai Samsung Galaxy S22 and S23 users saw faster 5G speeds than the median average during Q4 2022

Chart of Samsung Galaxy S23 vs. S22 5G Performance in Thailand

Speedtest Intelligence shows that the Samsung Galaxy S23 Ultra was the only S23 model to achieve faster median 5G speeds than its predecessor in Thailand during the first month after launching. The S23 Ultra outperformed the S22 Ultra 222.21 Mbps to 198.74 Mbps over 5G for download speed and 33.57 Mbps to 30.10 Mbps for upload speed, respectively. The S23 and S23+ were not statistically faster, though the S23+ and S23 had median 5G download speeds of 202.64 Mbps and 229.56 Mbps, respectively. Median 5G multi-server latency showed close parity with the S22 ranging from 31.06 ms to 32.34 ms and the S23 ranging from 30.40 ms to 34.14 ms.

Recommendation: Thai Galaxy S22 Ultra users should feel confident in upgrading your phones to the S23 Ultra, especially for the new features. If you are a S22 and S22+ 5G user, you should absolutely consider upgrading, but might not yet see faster speeds.

Samsung Galaxy S23 results showed potential in the United Kingdom, but you still may want to wait to upgrade

Chart of Samsung Galaxy S23 vs. S22 5G Performance in United Kingdom

New 5G data from the U.K. reveals that while the new Samsung Galaxy S23 models have higher median download speeds, the S23 models are not statistically faster than the S22 models. The S22 models had median 5G download speeds that ranged from 113.18 Mbps to 129.16 Mbps, and the S23 models ranged from 123.57 Mbps to 137.20 Mbps. 5G download speeds in the U.K. weren’t the slowest we saw among the countries we surveyed, but they were quite close to Poland’s bottom-tier results. The S23 Ultra was one stand-out performer, which had a faster median 5G upload speed than the S22 Ultra at 15.36 Mbps to 13.07 Mbps, though the other models weren’t significantly faster, but came close. Median multi-server latency over 5G was too statistically close to call, with the S22 models between 43.04 ms and 45.09 ms, and the S23 models between 41.77 ms and 46.63 ms. 

Recommendation: U.K. Samsung Galaxy S22 users should wait to upgrade their phones to the S23 models unless you’re dying for the S23’s new features. But don’t expect faster results quite yet, especially as the U.K. continues to lag behind other more mature 5G markets around the world.

If you have 5G and a Samsung Galaxy S22 in the United States, don’t hesitate to upgrade to an S23 model

Chart of Samsung Galaxy S23 vs. S22 5G Performance in United States

New data from Speedtest Intelligence reveals that during the first month of the Samsung Galaxy S23 series’ availability, the S23 and S23 Ultra outperformed the S22 and S22 Ultra for 5G download speeds, respectively, while the S23+ and S22+ were statistically too close to call. The S23 raced ahead of the S22 177.15 Mbps to 145.91 Mbps, and the S23 Ultra was faster than the S22 Ultra at 187.83 Mbps to 161.87 Mbps. All of the S22 and S23 models outperformed the median 5G download speed in the U.S. during Q4 2022. The Samsung S23 Ultra was the only S23 model to statistically outperform its counterpart for median 5G upload speeds, with an upload speed of 17.56 Mbps to 14.60 Mbps. The S23 and S23+ were too close to call. Looking at median multi-server latency over 5G, the S23 Ultra edged ahead of its S22 Ultra counterpart 50.44 ms to 51.52, while the other S23 didn’t have a statistical leg up. 

Recommendation: U.S. Samsung Galaxy S22 users shouldn’t hesitate to upgrade to the S23 models, especially for the new features and hardware — particularly if you want the S23 Ultra’s 200 MP camera. With 5G networks increasingly getting faster, we suspect the S23 models have yet to see their full potential in the U.S., too.

The Speedtest® Android app can help benchmark your device’s 5G performance

After promising launches that have seen the Samsung Galaxy S23 models pull ever-so-slightly ahead in the U.S. and Germany, you can track how the Samsung Galaxy S23 performs on our next release of Ookla Market Reports™. If you recently upgraded your phone, be sure to download the Android Speedtest app to make sure you are getting the speeds you need along with access to video testing. We’ll be back throughout the year with fresh data on new phone launches, so if you’re considering upgrading your phone, be on the lookout for a new Ookla® device report.

Ookla retains ownership of this article including all of the intellectual property rights, data, content graphs and analysis. This article may not be quoted, reproduced, distributed or published for any commercial purpose without prior consent. Members of the press and others using the findings in this article for non-commercial purposes are welcome to publicly share and link to report information with attribution to Ookla.
| June 6, 2023

Live Fast, Work Abroad: Countries with Remote Work Visas and Great Internet

Taking advantage of remote work in another country is the dream for many. Who hasn’t imagined themselves sipping fresh squeezed juice on a gorgeous tropical beach during a team call, cozying up next to a crackling fire in a European castle while pouring over a spreadsheet, or even just working anywhere that isn’t the office or our home couch? COVID-19 made working remotely more readily an option for some, and 51 countries have even gone so far as to create remote work or “digital nomad” visas. Today, Ookla® brings you fresh data on how these countries’ internet compares so you can start planning a long-term escape from your current reality. 

Using Speedtest Intelligence®, we looked for remote work countries with the fastest internet, tropical countries with remote work visas and fast internet, fastest European countries for remote work, countries where you won’t lose your connection, and seven affordable remote work countries with good internet. Read on to start planning your next life adventure.

Digital nomad countries with seriously fast internet

Chart of Fastest Countries for Remote Work

Getting the fast download speeds you need to do your daily tasks should be the least of your worries when you work abroad. Thailand had the fastest fixed broadband speeds among countries that have remote work visas with a median download speed of 196.20 Mbps and a median upload speed of 164.85 Mbps during Q1 2023. With speeds like those, you’ll be able to eat your Guay Teow while gaming, streaming multiple 4K videos, and uploading videos of your adventures with no issues (and you should be able to work, too). 

Spain (172.04 Mbps) and Romania (171.15 Mbps) were next on our list of fastest remote work destinations, followed by Hungary (134.43 Mbps), Portugal (128.50 Mbps), Taiwan (127.85 Mbps), Norway (111.44 Mbps), Panama (108.84 Mbps), and Brazil (100.38 Mbps), which all had median download speeds over 100 Mbps during Q1 2023. Rounding out our list of fastest remote work countries are Malta (97.55 Mbps) and Bermuda (97.20 Mbps). If speed is of the utmost importance to you while you work and live in another country, rest assured that these countries can handle the bandwidth you need.

Soak up the sun with fast internet in these beachy countries with remote work visas

Chart of Tropical Remote Work Countries with Fast Internet

If you dream of a remote work escape and prefer tropical, sunny beaches where you can sip piña coladas, we’ve got you covered (though don’t forget your sunblock when you venture outside!) Twenty-seven countries have digital nomad visas, average temperatures above 65° F (roughly 18° C), and beach access. Unsurprisingly, Thailand, again takes the top spot with a median download speed of 196.20 Mbps, followed by Taiwan (127.85 Mbps), Panama (108.84 Mbps), Brazil (100.38 Mbps), Malta (97.55 Mbps), Bermuda (97.20 Mbps), Malaysia (92.53 Mbps), Dominica (80.00 Mbps), Barbados (74.21 Mbps), and St. Lucia (71.40 Mbps). Grenada (65.25 Mbps), Costa Rica (65.07 Mbps), and Montserrat (63.22 Mbps) followed closely behind the top 10. 

If you choose to work remotely from one of these countries, we’ll be jealously awaiting you sharing your Speedtest® results on Twitter as you work from the beach, take a dip in the ocean during your break, and relax with a cool ocean breeze as your biggest worry in the world. 

These European countries with remote work visas had the fastest internet speeds

Chart of Internet Speeds in European Countries with Remote Work Visas

Maybe you’ve been watching all the Eurovision or have been dreaming of jetting off to European locations every weekend. Luckily for you, 16 European countries offer some version of a remote work visa. Speedtest Intelligence data reveals that Spain had the fastest median download speed at 172.04 Mbps during Q1 2023. Romania, Hungary, Portugal, and Norway followed with median download speeds above 100 Mbps. Malta (97.55 Mbps), Germany (82.05 Mbps), Latvia (77.76 Mbps), Estonia (64.80 Mbps), and Czechia (55.97 Mbps) rounded out the top 10, with Cyprus (53.71 Mbps) coming up just behind. Regardless of which European country you choose, you’ll be a few hours away from multiple countries with plenty to do and eat! 

10 remote work countries where you won’t lose your connection

Chart of 10 Remote Work Countries with the Most Consistent Internet

You shouldn’t have to stress about your internet connection while you’re working abroad — especially if you have to video chat often. So we used Speedtest Intelligence data to examine the Consistency — calculated by the percentage of results showing at least a 25 Mbps download speed and 3 Mbps upload speed over fixed broadband — in countries with remote work visas during Q1 2023. While there was no statistically highest Consistency, Thailand had a Consistency of 89.8%, Romania 89.7%, and Taiwan 89.5%. Norway followed at 87.3%, then Malaysia, Brazil, Portugal, Hungary, Spain, and Bermuda rounding out the top 10. Rest assured if you choose one of these countries, you should be able to stream and video chat while you work. Just remember to mute that movie during your team call.

Seven affordable places with good internet for digital nomads on a budget

Chart of 7 Affordable Remote Work Countries with Good Internet

Internet speed and consistency are important for remote work — but they’re not everything when you’re deciding where you want to spend your next adventure. If you’re looking for an affordable location to spend your time, save some money, and get good internet, we’ve got you covered.

We used thresholds of 50 Mbps download, 10 Mbps upload, and under 100 ms latency to designate a country of having “good” internet — these speed thresholds are minimums to what should allow you to stream in 4K, video chat, and do most work-related tasks. The latency threshold number is high, but cheap, fast internet with super low latency is not common enough. We compared that list against World Bank data for GDP per capita (PPP) from 2021 which adjusts for cost of living, and narrowed down countries that have less than the world average of $18,607. Seven countries qualified for inclusion on our list based on those criteria: Barbados, Brazil, Dominica, Ecuador, Grenada, Montserrat, and St. Lucia. 

Brazil had the fastest download speed at 100.38 Mbps on our affordable countries for remote work list, followed by Dominica (80.00 Mbps), Barbados (74.21 Mbps), St. Lucia (71.40 Mbps), Grenada (65.25 Mbps), Montserrat (63.22 Mbps), and Ecuador, which eked out a place on this list at 50.55 Mbps. Every country on this list had a median upload speed above 20 Mbps. All of the countries had a Consistency higher than 70%, except St. Lucia, which was just under at 68.3%. If latency, which causes the kind of lag that can make video calls frustrating, is a major concern, only Ecuador (14 ms) and Brazil (18 ms) had latencies under 20 ms. 

Regardless of where you choose to work remotely among these seven countries, you should have access to internet that can keep you on top of what you need to do at work, while you save some cash, live well, and hit the beach, since all of these countries have average temperatures above 70° F (21°C). You might just have to brush up on your Spanish, Creole, Patois, or Portuguese to really get an immersive experience, but you should sleep easy knowing that you can live well and continue to work online.

What do you need to know before applying for a remote work visa?

Currently, there are 51 countries that offer some form of a remote work visa. The requirements for these visas vary widely across each country, but generally there are a few key things you’ll need to know before you choose a country to apply to.

First, you need to decide where you are going! Besides checking internet performance, you’ll want to research how long a remote visa can last, how much money you are going to have to earn to qualify, what costs you’ll be looking at, options to renew the visa, and what kind of fees you’ll need to pay along the way. At a minimum, you’ll need a passport.

You often can’t just show up and start working remotely; for a long-term stay, you’ll need to apply for a visa (along with any family members you might want to bring along). Approval isn’t straightforward — you may need to prove your income, translate documents, get documents notarized, and even make a minimum amount of money each month. Once approved, you’ll typically pay a fee for each family member you are bringing, and you should make certain if you have any additional fees or taxes you’ll be liable to pay throughout your stay.

Once you have your visa in order, you’ll need to figure out your living situation — whether that is something longer term, or moving around a country, you’ll want to keep any requirements of your visa up to date. Do your due diligence while you apply so you don’t find yourself in an unpredictable situation you could have avoided.

Ookla has the resources you need to plan your remote work trip

We hope this short guide will help you choose the right remote work experience to help you feel fulfilled. If you want to learn more about the internet experience in any of the countries we mentioned, or even find city data or internet provider data for your remote work journey, check out the Speedtest Performance Directory™. If you’re struggling to find a decent internet provider in your area, check out our satellite internet series to see if there is a fast satellite internet connection available. And don’t forget to download the Speedtest app for Mac, Windows, or Linux to make sure you’re getting the speeds you need to continue working remotely!

Interested in what Ookla is doing? We offer fully remote positions around the world, so check out if there is an open role for you!

Ookla retains ownership of this article including all of the intellectual property rights, data, content graphs and analysis. This article may not be quoted, reproduced, distributed or published for any commercial purpose without prior consent. Members of the press and others using the findings in this article for non-commercial purposes are welcome to publicly share and link to report information with attribution to Ookla.
| December 19, 2023

The State of Worldwide Connectivity in 2023

To gain insight into the current performance of networks, we analyzed Speedtest® data in Q3 2023. Our analysis compares changes in 5G performance to the previous year, identifies the top 10 countries with the best performance, and discusses customer satisfaction with 5G. We also ranked countries based on the performance of their fixed networks and investigated the connectivity gap across the world.

5G | Fixed | Connectivity for All

Key takeaways 

  • Global 5G download speed improved. The median global 5G download speed experienced a substantial 20% increase in Q3 2023, reaching 203.04 Mbps, compared to 168.27 Mbps in Q3 2022. This improvement aligns with a significant rise in global 5G subscriptions, indicating positive progress in user adoption of 5G and the performance of 5G networks. 
  • Top 5G performers have shifted. The top 10 countries for 5G performance witnessed notable changes, with the United Arab Emirates claiming the top spot, surpassing South Korea. Malaysia, India, and the Dominican Republic also made significant strides, showcasing a dynamic shift in the global 5G landscape.
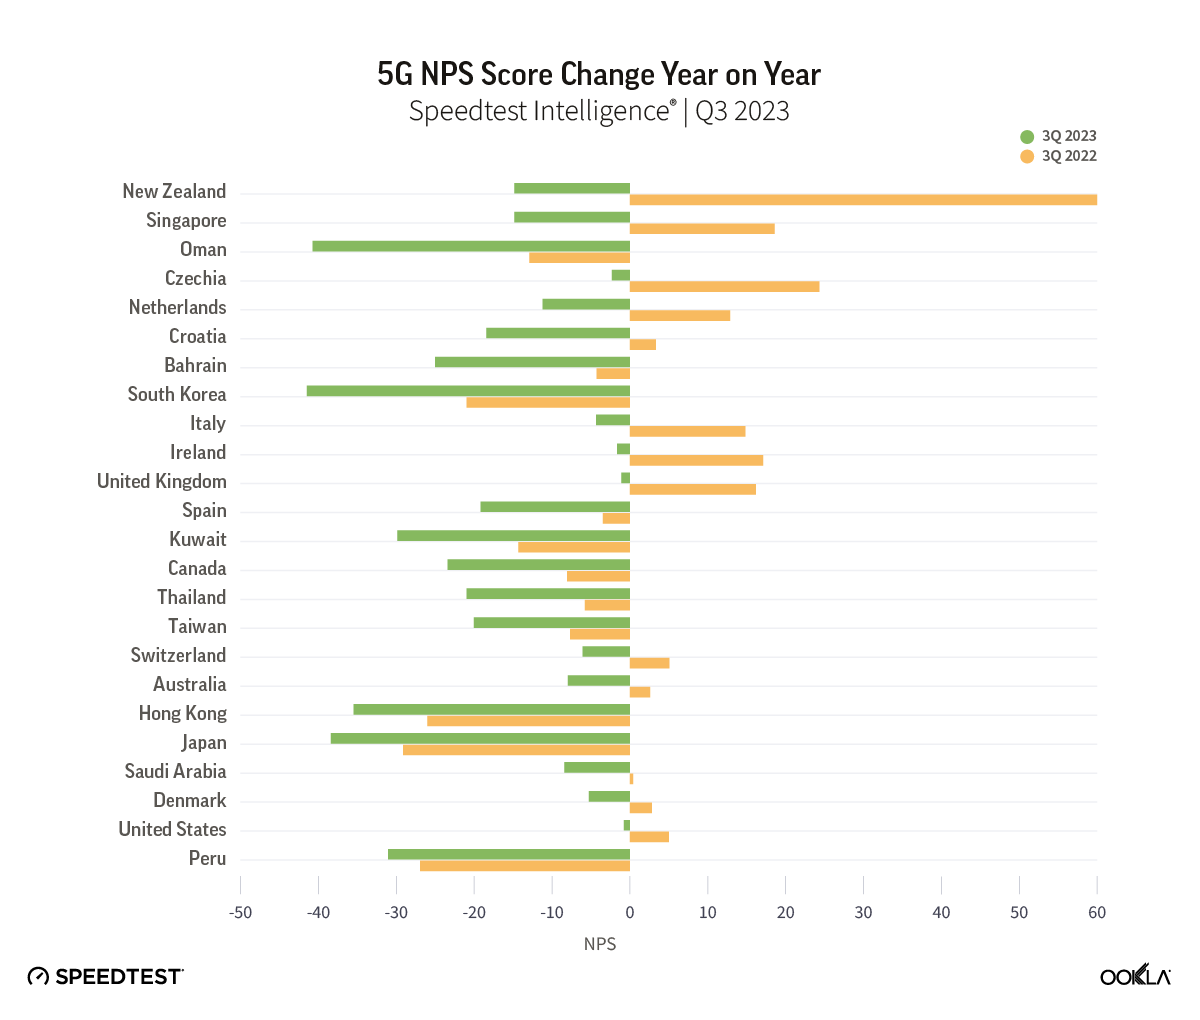
  • Speedtest user ratings indicate room for 5G improvement. Despite advancements in 5G technology, there has been a decline in the Net Promoter Score (NPS) among 5G users. Factors contributing to this dissatisfaction could include unmet expectations and discrepancies between actual 5G speeds and advertised speeds.
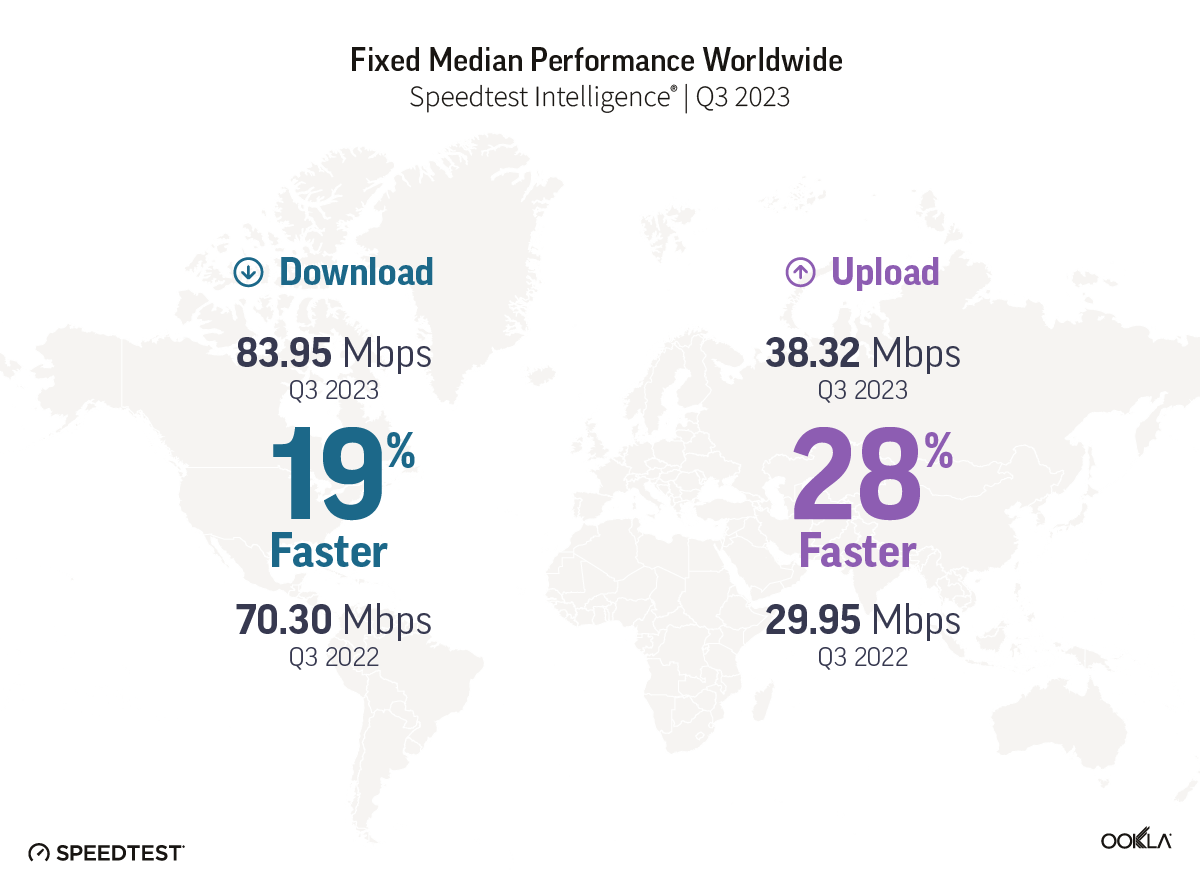
  • Fixed Networks Advancements. On a global scale, fixed networks demonstrated significant performance improvement, with a 19% increase in median download speed (83.95 Mbps) and a 28% increase in upload speed (38.32 Mbps) in Q3 2023 compared to the previous year. This highlights the ongoing transition to more advanced broadband technologies, particularly Fiber-to-the-Home (FTTH).
  • The imperative of closing the connectivity gaps. Despite improvements in global connectivity, there are still areas that fall outside of network coverage. Speedtest® data highlights disparities in internet performance between fixed and mobile networks across different regions, emphasizing the importance of addressing connectivity challenges worldwide.

5G Networks

Global 5G download speed improvements

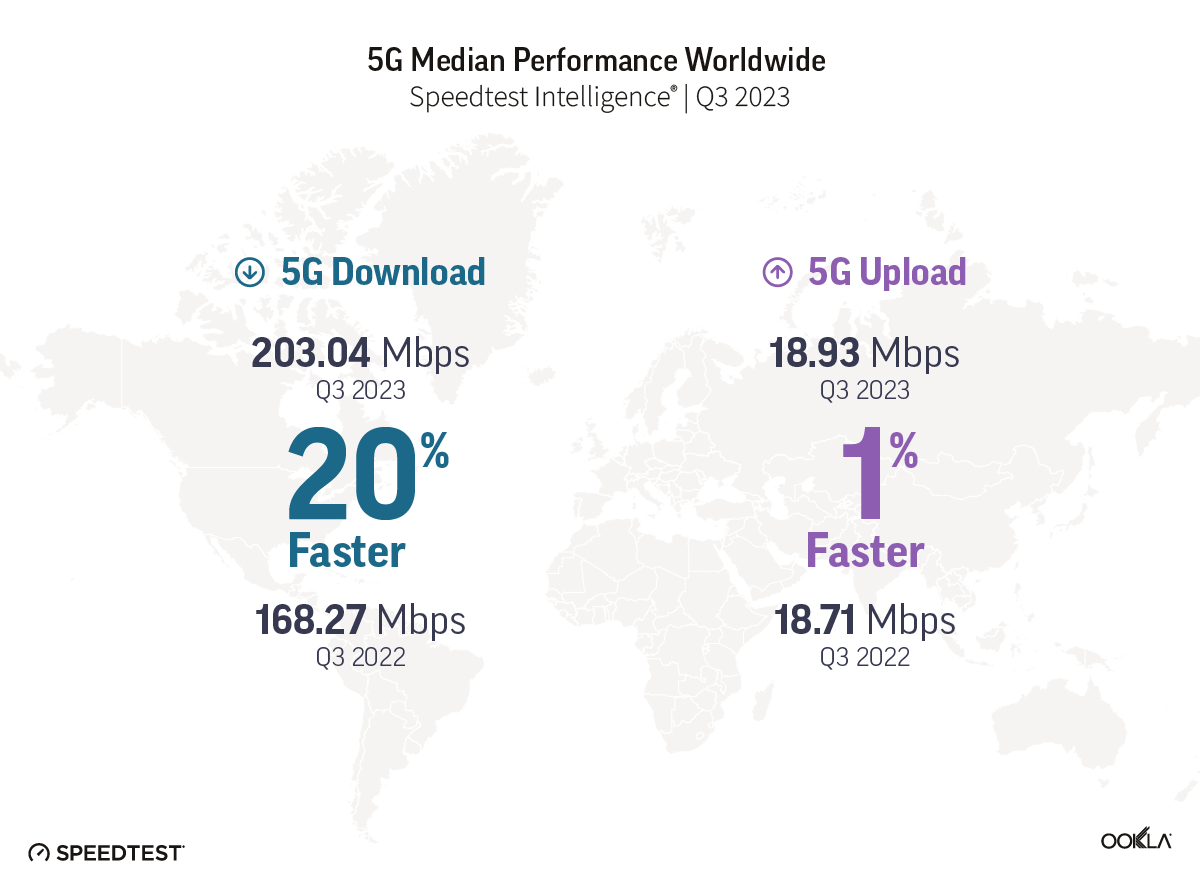
Illustration of 5G Median Performance Worldwide

The median global 5G download speed has experienced a noteworthy surge, registering a 20% increase and reaching 203.04 Mbps in Q3 2023, compared to 168.27 Mbps in Q3 2022, according to Speedtest Intelligence® data. This improvement coincides with a substantial rise in global 5G connections, reaching 1.4 billion according to GSMA Intelligence, representing a 65% year-on-year increase from 872 million a year ago. 

In terms of upload speed and latency, only a very modest improvement of 1% occurred. Median 5G upload speeds reached 18.93 Mbps in Q3 2023, compared to 18.71 Mbps in the same period last year; multi-server latency, a critical metric for network responsiveness, improved from 45 ms in Q3 2022 to 44 ms in Q3 2023. 

Speedtest users experiencing the top 10% of 5G download speeds globally have seen a 9% increase, rising from 525.54 Mbps in Q3 2022 to 573.12 Mbps in Q3 2023. However, speeds have not yet reached Gigabit levels, primarly because of network economics. 5G was originally designed to deliver peak data rates of up to 20 Gbps based on IMT-2020 requirements, but we are still a ways off before gigabit speeds become the new normal. For instance, symmetrical download, upload speeds, and ultra-low latency haven’t been realized, partially because the vast majority of 5G networks are not ‘true 5G’ as they have been deployed in Non-Standalone (NSA) mode, meaning they rely on a 4G LTE network core. According to GSA, over 40 operators have launched 5G standalone (SA) in public networks, but the rollout is not yet complete. Nevertheless, the industry is actively exploring the prospect of 5G Advanced, which promises symmetrical upload and download speeds and ultra-low latency, signaling a proactive stance ahead of the eventual transition to 6G.

Malaysia joined South Korea and the U.A.E at 5G speeds podium

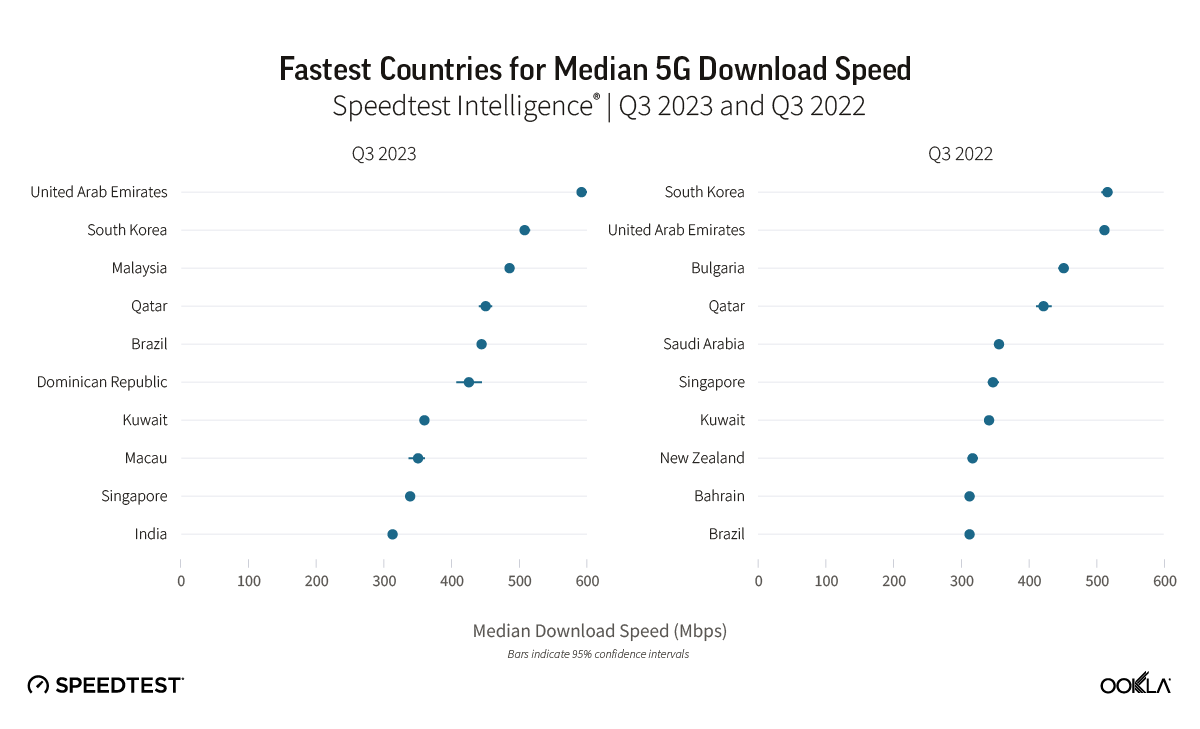
Chart of Fastest Countries for Median 5G Download Speed

During Q3 2023, the United Arab Emirates and South Korea stood out as leaders in 5G performance, boasting the fastest median 5G download speeds globally at 592.01 Mbps and 507.59 Mbps, respectively. Our top 10 list also includes Malaysia, Qatar, Brazil, the Dominican Republic, Kuwait, Macau, Singapore, and India. The shift in the top 10 rankings reveals dynamic changes, with Malaysia, the Dominican Republic, and India making significant strides, while Bulgaria, Saudi Arabia, New Zealand, and Bahrain dropped out of the rankings.

The U.A.E showcased a 14% increase in its median 5G download speed, reaching 592.01 Mbps in Q3 2023, up from 511.68 Mbps in Q3 2022, allowing the U.A.E to take the top spot from South Korea. Key factors contributing to the U.A.E.’s 5G leadership include fierce market competition driven by Etisalat and du, resulting in extensive 5G coverage and widespread access to 5G services. Additionally, the allocation of a 100 MHz of contiguous spectrum, as discussed in our 5G spectrum article, has played a pivotal role in achieving faster speeds, lower latency, and improved spectral efficiency.

The regional shift in 5G performance leadership is noteworthy. In 2022, half of the top 10 countries were from the Middle East, while in 2023, the same proportion hailed from the Asia Pacific region. Our analysis suggests that early adopters in the Asia Pacific region have outperformed major European markets in 5G performance, due to factors such as early spectrum availability and supportive government policies.

Malaysia’s remarkable achievement in reaching the third spot globally for 5G download speed, with a reported speed of 485.24 Mbps in Q3 2023, is particularly noteworthy. Despite launching its nationwide 5G network less than two years ago, Malaysia’s unconventional deployment strategy has proven effective. India has also made a significant leap, with its median 5G download speed of 312.26 Mbps allowing India to reach the top 10 worldwide. The country’s climb of 72 places on the Speedtest Global Index™ between September 2022 and August 2023 is primarily credited to the launch of 5G. Following a 5G spectrum auction in India, operators have successfully addressed network congestion issues by offloading 4G traffic onto 5G networks.

In Brazil, 5G download speed increased 1.4 times, jumping from 312.09 Mbps in Q3 2022 to 443.93 Mbps in Q3 2023. Before Brazil’s 5G spectrum auction, operators had offered 5G using DSS since July 2020. While DSS can provide broad 5G coverage, its speeds are often similar to those on 4G LTE networks. In November of 2021, however, Brazil’s multi-band 5G spectrum auction closed, which not only generated BRL47.2 billion ($8.5 billion) in total commitments, but it also allowed operators to deliver much faster speeds on dedicated 5G spectrum compared to DSS. National operators – Telefonica Brasil (Vivo), Claro Brazil, and TIM Brazil – ended up with 40 MHz or 50 MHz in the 2.3 GHz spectrum band and 100 MHz each in the 3.5 GHz band. The subsequent simultaneous activation of 5G networks in July 2022 marked a transformative moment with the continuous expansion of 5G services to 623 municipalities by December 2023. An upcoming spectrum auction expects to improve Brazil’s 5G standing even further.

The Dominican Republic’s entry into the top 10 fastest 5G countries was marked by its official launch of 5G services in December 2021, making it the first Caribbean nation and the third in Latin America to adopt a 5G network.

Disparity Between 5G Performance and Consumer Perception

The Net Promoter Score (NPS) is a tool that gauges customer loyalty and satisfaction. At the end of Speetest, users may be asked to answer “How likely is it that you would recommend [provider] to a friend or colleague?” on a scale from 0-10. Net Promoter Scores are applied to both users and providers. Users are categorized into Detractors (score 0-6), Passives (score 7-8), and Promoters (score 9-10). NPS is the percent of Promoters minus the percent of Detractors and is displayed in the range from -100 to 100. Providers are ranked in descending order of NPS. NPS categorizes users into Detractors (those that score 0-6), Passives (scores between 7 and 8), and Promoters (scores of 9-10). NPS represents the percentage of Promoters minus the percent of Detractors displayed in the range from -100 to 100. 

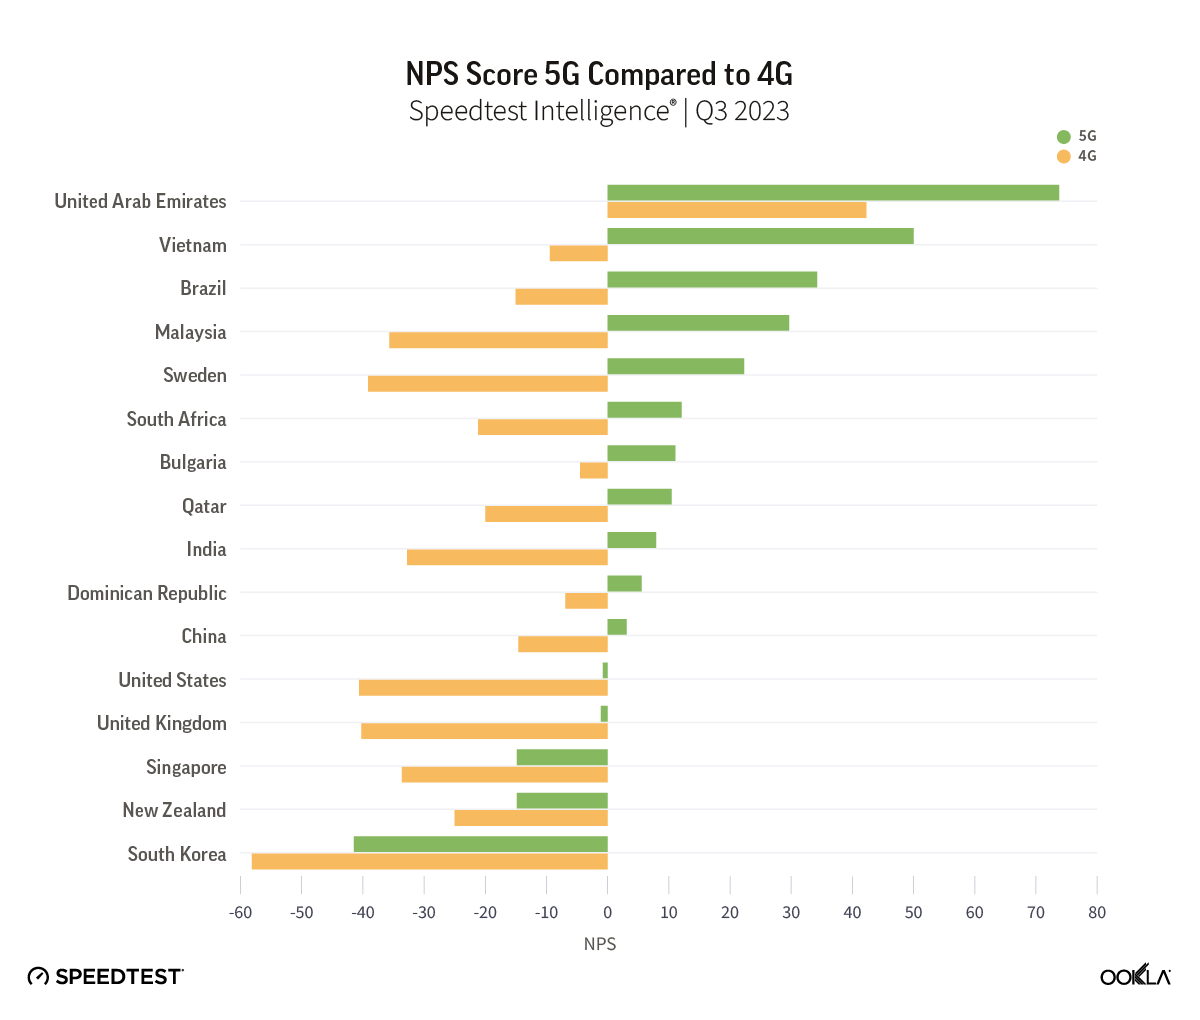
In our article discussing whether 5G was meeting customer expectations, we found that 5G users typically rate their network operator with NPS scores universally higher than those for 4G LTE users. In Q3 2023, that trend continued, as 5G  users that were on 5G network when answering the NPS question still scored higher than those on 4G across all markets analyzed. It isn’t surprising given that at a global level, 5G had a 637% better median download speed than 4G and a 130% better median upload speed. 

Chart of NPS Score, 5G Compared to 4G

While 5G NPS still outpaces scores on 4G, our data shows that 5G NPS has been decreasing annually. This could point to the fact that excitement about 5G as a new technology is waning as users become used to faster speeds, or as customers await new use cases that can take advantage of the faster speeds that 5G can provide. After all, we are still waiting for that killer app for 5G, the way the video and streaming were for 4G. 

While it is difficult to fully explain the reasons behind the 5G NPS decrease without further research, we can clearly see that network performance isn’t the only factor at play influencing NPS declines. Others can include customer care, pricing, and other services. For example, in South Korea, one of the first countries to launch 5G with one of the world’s fastest speeds, consumers scored 5G networks -41.47 in Q3 2023 compared to -20.51 in Q3 2022. 

In March 2021, South Korean consumers launched a class action suit against operators because they felt they were being misled by the promises of 5G in the country. Recently, South Korea’s antitrust regulator fined three 5G operators a total of 33.6 billion won ($25.06 million) for making exaggerated claims about the level of performance their networks could achieve. South Korean operators claimed consumers could experience theoretical 5G speeds, which are not practically achievable in a “real world” environment, as factors such as spectrum usage, network densification, user location, and device capability significantly affect actual performance. Our data shows that the top 10% of 5G users in South Korea experienced speeds of 1.004 Gbps in Q3 2023, which, although impressive, are far lower than the advertised 20 Gbps speeds. 

Chart of 5G NPS Score Change Year on Year

Fixed Networks

Fiber driving fixed performance gains 

Illustration of Fixed Median Performance Worldwide

On a global scale, fixed networks have demonstrated significant advancements, achieving a median download speed of 83.95 Mbps and an upload speed of 38.32 Mbps in Q3 2023, per Speedtest Intelligence data. This signifies a substantial 19% improvement in download speed and an impressive 28% enhancement in upload speed compared to those in 2022. This also indicates that more fixed connections have migrated to fiber networks.

According to the World Broadband Association (WBBA) report titled “Next Generation Broadband Roadmap 2023 to 2030” Fiber-to-the-Home (FTTH) is identified as the natural progression from copper-based xDSL broadband networks. The shift towards FTTH varies across different countries and regions, but the industry is committed to embracing more advanced and efficient broadband technologies. 

Oftentimes, despite improvement in underlying broadband technology, Wi-Fi is the bottleneck that reduces customer experience. Our research has shown that Wi-Fi performance can lag behind ethernet in markets where advanced cable and fiber connections are replacing legacy broadband technology (such as DSL or coax cable). Wi-Fi speeds typically range from 30-40% of ethernet, indicating a need to accelerate the adoption of more advanced Wi-Fi technologies and optimize the home network environment.

The UAE, Singapore, and Hong Kong are in the lead for fixed

Chart of Fastest Countries for Fixed Broadband Download Speed

The United Arab Emirates (UAE) and Singapore led the way in fixed network performance.

The UAE achieved a median download speed of 247.63 Mbps in Q3 2023, representing a notable 1.83 times increase compared to the previous year. Most customers in the UAE have access to fiber networks, and additional measures have been implemented by operators in the region to enhance internet speeds, such as increasing the minimum download speed from 250 Mbps to 500 Mbps and offering price discounts to incentivize users to upgrade to higher-tier plans. 

Singapore also leads on the 2023 Fiber Development Index (FDI), with maximum scores in seven of the nine metrics. Singapore, along with Qatar and South Korea, has achieved 100% FTHH coverage. One of the reasons for this success, besides having a smaller area, is that Singapore’s regulator mandates building owners and real estate developers to provide adequate space, facilities, and accessibility for network operators to pre-install fiber networks.

Hong Kong also demonstrated significant progress, with a 37% increase in median download speed and a 40% increase in upload speed. To track broadband adoption, the Office of the Communications Authority (OFCA) in Hong Kong monitors broadband adoption by advertised speed and technology mix; as of August 2023, 66% of residential clients already subscribed to the Internet with a download speed equal to or greater than 1 Gbps.

Chile has seen a 14% improvement in median download speed and a 29% improvement in upload speed on the back of a greater fiber adoption. Chile has been the top-performing fixed broadband market across Latin America, consistently outperforming other regional markets but over the last three years, it has also closed the performance gap with other leading markets globally. Chile’s strong fixed broadband performance — an anomaly in the region — is primarily due to strong competition among Chilean ISPs. Chile has seven ISPs with over 5% market share, all heavily focused on migrating customers to fiber. 

Thailand is a newcomer to the ranking as FTTH continues to grow strongly. FTTH constitutes an impressive 95% of fixed broadband users in Thailand, equivalent to around 58.96% of household penetration. Operators have been actively rolling out fiber in adherence to the Digital Thailand National Policy.

In the United States, there has been a 26% improvement in median download speed and a 7% improvement in upload speed. In this very competitive market, with a range of access technologies vying for customers, a combination of migration to fiber, 5G fixed-wireless access (FWA), and faster cable connections is helping drive higher performance levels. In line with the demand for faster network performance in the market, the FCC recently announced that it is seeking input on a planned increase to its definition of broadband/high-speed internet to 100 Mbps download and 20 Mbps upload, up from the current 25 Mbps download and 3 Mbps upload standard.

As discussed in our recent article, several European countries are making substantial progress in offering high-speed broadband. Across Europe, Denmark had the fastest median download speed for fixed broadband (196.43 Mbps), followed by Spain (176.08 Mbps) and France (170.51 Mbps). Denmark experienced a 25% improvement in median download speed and a 16% improvement in upload speed. Spain also showed significant improvement, with a 32% increase in median download speed and a 29% increase in upload speed. France exhibited even stronger progress, with a 53% increase in median download speed and a 41% increase in upload speed. The speed gains we’ve seen in Spain and France are correlated with an increase in fiber adoption; for example, Spain boasts nearly 90% fiber optic coverage, thanks to private initiatives and government support, while France expects a full-fiber rollout by 2025.

Connectivity for All

The imperative of closing the connectivity gap

Massive investments are being made to bridge the connectivity gap as recognition of connectivity as a fundamental human right is growing. According to a WBBA Whitepaper, a high level of broadband penetration is critical to the country’s socioeconomic development. However, it’s not only about being connected to the network per se; the quality of that broadband connection is equally crucial. Unlike other utility services like gas and electricity, where quality is generally stable, with broadband, the quality of the network experience is crucial to ensure users can benefit fully from multiple applications.

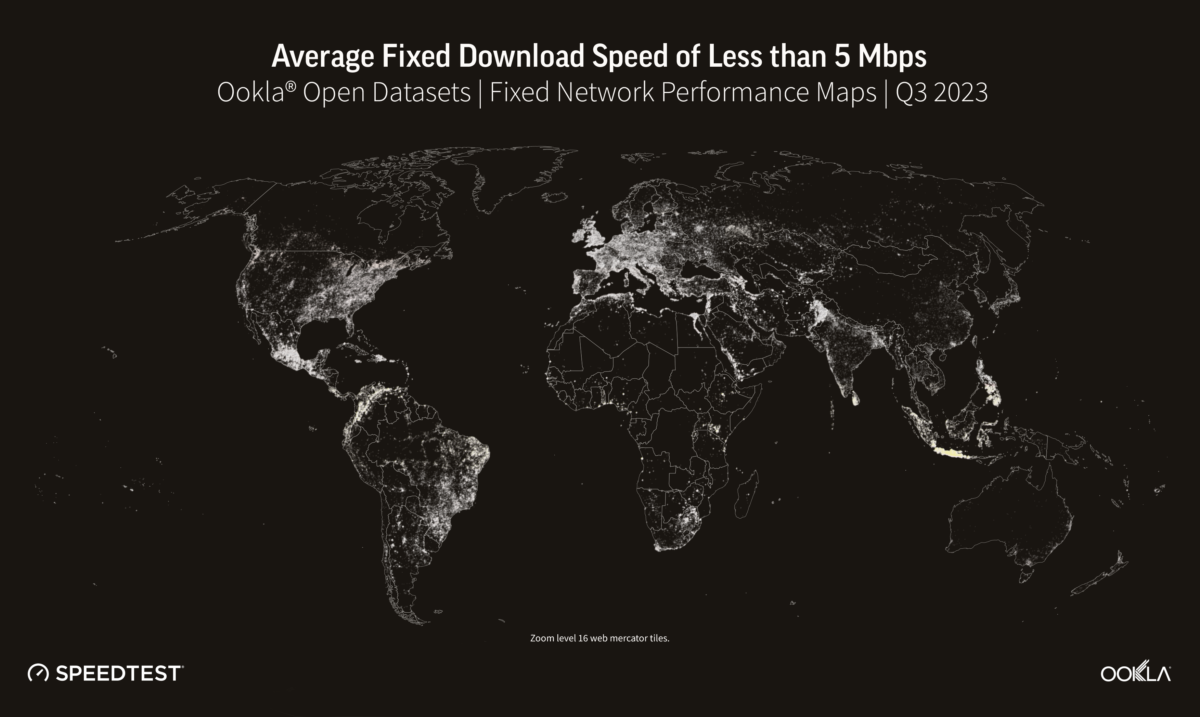
To assess the digital divide, we mapped mobile and fixed internet performance using data from the Open Data Initiative, which Ookla provides as part of Ookla for Good

Determining where a digital divide exists is a complex issue that involves identifying where network infrastructure is located, where people need connectivity, and how affordable it is. Although it can be challenging to dig into a specific location, it is evident that there are varying levels of Internet performance worldwide. A quick glance at our data shows that fixed broadband customers are more likely to experience faster networks (measured as an average download speed of 100 Mbps and above) than mobile across the Americas and Europe. The opposite is true for mobile networks across Africa and APAC, where mobile networks are often the primary means of connectivity. Compared to urban areas, rural communities are often ill-equipped for broadband access. Due to a lack of bandwidth (and therefore slower speeds), people in these areas need help doing many things on the internet, such as streaming videos. The US regulator FCC defines broadband in the United States as access to  25 Mbps download and 3 Mbps upload speeds. Areas without those speeds are classified as broadband “digital deserts,” even if those areas have internet access. Although broadband definitions can vary considerably from country to country, we can see in the next section that many areas fall outside any standards of connectivity globally.

Despite the world becoming increasingly connected, many rural and remote areas still struggle to access the internet. For example, large swathes of South America and Africa fall outside terrestrial network coverage. As discussed in our recent article, cellular networks are critical to connecting individuals and businesses as internet access in Africa is predominantly mobile. Before we can start discussing 5G, connecting communities with the internet in general is a priority. Affordable 4G smartphones and targeted financing for under-served demographics are key for bridging the digital divide and reducing poverty, as a World Bank study found that 4G coverage can help cut poverty by up to 4.3%. 

5G technology can potentially replace fixed internet access in situations where the cost of fiber deployments is high and rolling out traditional fixed broadband networks isn’t commercially viable. However, in countries like Indonesia, satellite technology may be a more effective solution for connecting remote areas. While 5G Fixed Wireless Access (FWA) and satellite technology can complement each other, the adoption of satellite technology is currently limited by factors such as coverage, device affordability, and service cost. As revealed in our recent article, Starlink outperforms GEO satellites and is a suitable replacement for fixed networks in rural areas. While it may not match the leading cable or fiber providers in terms of median speeds or multi-server latency, satellite internet provides a viable alternative in places where cable and fiber access networks are unavailable. This is mainly due to a more consistent distribution of download performance across Speedtest samples, unlike FWA and DSL-based services, where performance is impacted by the distance from the cell site or exchange/DSLAM.

Fixed and mobile network operators across the globe widely use Speedtest data to enhance Internet quality, improve accessibility, and inform network expansion. The United States Federal Communications Commission and the Malaysian Communications and Multimedia Commission rely on Speedtest data to ensure accountability of telecommunications entities and allocate funds for rural and urban connectivity development. Ookla also licenses data to NGOs and educational institutions to help bridge the digital divide between areas with and without modern Internet access. Our mapping data is used to track results and determine whether broadband infrastructure can handle growth as more people connect devices and technologies demand more bandwidth. We are also actively involved in discussing best practices for ensuring digital transformation and connectivity for all in the APAC region, Central Asia, and Europe. If you are interested in working with us, please reach out. 

Keep track of how well your country is performing on Ookla’s Speedtest Global Index and get advice on how to plan and optimize your network.

Ookla retains ownership of this article including all of the intellectual property rights, data, content graphs and analysis. This article may not be quoted, reproduced, distributed or published for any commercial purpose without prior consent. Members of the press and others using the findings in this article for non-commercial purposes are welcome to publicly share and link to report information with attribution to Ookla.
| July 24, 2023

5G in Asia Pacific: Deployment Momentum Continues

The Asia Pacific region has successfully implemented 5G technology despite the challenges posed by the pandemic, global economy, and geopolitical climate. South Korea, China, and Japan have led the way in 5G network deployment. With the continued rollout of 5G networks in other regional markets, Asia Pacific is on track to become the largest 5G market globally.

Key messages

  • Advanced Asia Pacific markets have taken the lead in the 5G rollout. Countries such as South Korea, Australia, and China, were among the first in the world to launch commercial 5G networks as more markets joined the ranks.
  • 5G performance outranks Europe. Early adopters in the Asia Pacific region have outperformed major European markets in terms of 5G performance. This is mainly due to factors like early spectrum availability and supportive government policies. 
  • 5G Availability varies. The region experiences varying levels of 5G Availability and adoption due to factors like population density, device affordability, and tariffs.
  • Seoul and Kuala Lumpur are the top cities for 5G performance, boasting median download speeds of 533.95 Mbps and 523.44 Mbps, respectively.
  • 5G helps to narrow the digital divide. 5G FWA is a viable alternative to traditional fixed broadband to narrow down the digital divide in the region

South Korea sets the pace as 5G networks expand across the region

Many of the more advanced markets in the Asia Pacific have been the frontrunners in terms of 5G rollout. South Korea was the first market in the world to deploy a nationwide 5G network in April 2019, followed by Australia, the Philippines, China, and New Zealand later that year. As predicted by GSMA Intelligence, the recent second wave of 5G rollouts in the region in countries such as Indonesia, India, and Malaysia will see Asia Pacific becoming one of the largest 5G markets in the world by 2025.

5G Launch Timeline in Selected Asia Pacific and European Markets

Allocation of spectrum resources is crucial

In our recent spectrum analysis, we discussed how important spectrum is for the performance and coverage of 5G. In general, regulators in the Asia Pacific region have been quick to allocate spectrum for 5G applications, and in many cases, operators have been able to secure substantial bandwidth in the key C-band.

List of the 5G Pioneer Band Spectrum Awards Across Select Asia Pacific Countries

The mid-band spectrum is the most frequently awarded spectrum band in the Asia Pacific region. It is the top choice for commercial 5G deployment because it balances 5G coverage and capacity. In some markets, 5G deployment uses low-band (sub 1 GHz) frequencies, allowing for wider outdoor 5G coverage and better penetration inside buildings in urban and suburban areas. However, this may come at the expense of the median download speed, which typically peaks at around 100 Mbps.

For some markets, 5G spectrum awards are subject to strict milestones and requirements. Operators in South Korea were required to have 22,500 base stations by the end of 2021, 45,000 by the end of 2023, and 150,000 base stations upon completion of their 3.5 GHz spectrum rollout. Additionally, within three years, there were required to install 15,000 base stations utilizing 28 GHz. However, a review by South Korea’s Ministry of Science and ICT (MSIT) found that all mobile operators met the minimum requirements for the 3.5GHz spectrum but not the 28GHz spectrum. Consequently, the ministry has withdrawn all operators’ spectrum licenses in the 28GHz band. In our recent mmWave analysis, we thoroughly covered the performance and progress inherent in that spectrum band.

Asia Pacific outpaced major European markets in terms of 5G performance

While Europe and the Asia Pacific markets share similarities such as large cultural diversity, customers with varying demographics, and mixed regulations and policies, our recent analysis of European 5G performance revealed that early 5G adopters in the Asia Pacific region performed better than some major European markets. 

Chart of Median 5G Download Speed in Asia Pacific Markets Compared to European Benchmarks

According to Speedtest Intelligence® H1 2023 data, several markets in the Asia Pacific region had faster median download performance compared to the top five European economies. Malaysia and South Korea led the pack with speeds of over 500 Mbps, with Malaysia reporting a median download performance of 512.10 Mbps, and South Korea at 503.99 Mbps  – an impressive accomplishment for Malaysia, which launched 5G 3.5 years after South Korea and has caught up to them in performance. Both countries have notable differences in terms of their telecommunications landscapes. The Malaysian government went with a nationwide single wholesale network (SWN) approach as its 5G deployment plan. Digital Nasional Berhad (DNB) was established in 2021 to construct and operate the 5G network infrastructure and provide 5G services to mobile network operators at wholesale prices. South Korea has long been at the forefront of mobile technology and boasts one of the highest internet penetration rates globally. As a result of its early commitment to 5G development, South Korea became the first market in the world to launch a commercial 5G network.

During the same period, Singapore, India, New Zealand, China, and Australia achieved a median 5G download speed exceeding 200 Mbps. In comparison, only France recorded speeds above 200 Mbps among the European countries mentioned, while Italy, Germany, United Kingdom, and Spain, recorded median download speeds below 150 Mbps.

5G Availability and adoption vary across the region

Chart of 5G Availability in Selected Markets in Asia Pacific and Europe

5G Availability (the percentage of users on 5G-capable devices that spend most of the time with access to 5G networks) varied widely across the Asia Pacific region during H1 2023. Factors such as access to low-band spectrum and affordability and availability of 5G devices influence each market’s reported 5G Availability. Analysis based on data from Speedtest Intelligence shows that Hong Kong stands out as the only country analyzed to have surpassed 40% 5G Availability, reaching 42.3% in H1 2023. Part of the reason is the city’s high population density, 5G coverage that reaches over 90% of the population, and a high 5G smartphone penetration rate, which Counterpoint Research reported as 78% in Q1 of 2023.

Despite Australia being 78 times larger than South Korea, and being one of the least densely populated countries, both countries reported similar 5G Availability rates, at around 36.6%. Counterpoint Research reported a 5G smartphone penetration rate of more than 80% for both countries, with South Korea at 88% and Australia at 82%. Across the European markets, France, Spain, Germany, and the U.K. ranged between 20%-30%. Similarly, Thailand also falls within this range at 26.8%. 

Chart of 5G Connections as Proportion of All Connections in Select Markets in Asia Pacific and Europe

Based on Q2 2023 data from GSMA Intelligence, South Korea, China, and Japan led in 5G adoption, measured as the percentage of 5G connections compared to total connections, higher than the selected European markets looked at in this report. South Korea had a total of 31.3 million 5G connections, which accounted for more than 48% of all mobile connections in the country, while China boasts over 700 million 5G connections, equivalent to 41% of connections. Other early adopters of 5G in the region, such as Japan, Hong Kong, and Australia, have all seen a considerable rise in their total 5G connections from the previous year. Japan experienced a 76% increase of 5G connections between Q2 2022 to Q2 2023, to 60.8 million connections. Hong Kong increased by 65% to 4.8 million, and Australia had 8.8 million connections, up by almost 40% during the same period of time.

Seoul and Kuala Lumpur are the top cities in the Asia Pacific region for 5G speeds.

Map of 5G Performance and 5G Availability Across Selected Cities in Asia Pacific

Given that both Malaysia and South Korea are ahead in 5G performance among their peers, it is unsurprising that their capital cities came first as well in the ranking of selected cities. In H1 2023, Seoul had a median download speed of 533.95 Mbps, while Malaysia’s capital, Kuala Lumpur, reported a median download speed of 523.44 Mbps. Digital Nasional Berhad (DNB), Malaysia’s designated 5G wholesale provider, reported 90% 5G coverage of populated areas (COPA) throughout Kuala Lumpur at the end of 2022. 

Despite being one of the latest markets to launch 5G, the Indian cities of Delhi and Mumbai performed well in the cities’ speeds ranking. Both cities reported median download speeds of over 300 Mbps in H1 2023, with Delhi at 357.43 Mbps and Mumbai at 319.45 Mbps. While Kuala Lumpur, Mumbai, and Delhi have shown 5G performance comparable to or even exceeding those of well-established 5G markets in the region, their 5G networks are still relatively new. As a result, these cities have lower 5G Availability than others as anticipated.

Metro Manila, with one-third of the population of the Philippines, had the lowest median download speed among all the cities in this report for H1 2023, with a speed of 135.51 Mbps. During the same period, Metro Manila reported a 5G availability rate of 35.7%, slightly lower than Seoul (35.9%) and Sydney (39.2%).

Breaking the digital divide with 5G FWA

The benefits of 5G go beyond the faster speeds compared to 4G. It also plays a role in bringing connectivity to underserved areas. Although developed markets in the Asia Pacific are leading in ultra-fast, fixed fiber broadband, there is still a portion of the region where internet connectivity is expensive, unavailable, or insufficient. Many people in these underserved regions rely on mobile devices to access the internet. According to GSMA Intelligence, mobile broadband networks are accessible to more than 96% of the population, making it the primary option for internet access in many households. 

In some markets, mobile operators see 5G, particularly 5G fixed-wireless access (FWA) services, as a viable alternative to traditional fixed broadband. While FWA is not a new concept, the use of 5G technology is expected to accelerate its growth, especially in areas where it is not economically feasible to deploy high-speed fixed broadband networks. According to GSMA Intelligence, nearly three in five users who either have upgraded or plan to upgrade to 5G find the idea of using 5G for home broadband appealing. FWA is becoming one of the operators’ primary 5G use cases, providing an opportunity to increase revenue and monetize network investments and wireless spectrum.

The Asia-Pacific region is seeing a rise in the adoption of 5G FWA, with Southeast Asia leading the way. In 2019, Globe Telecom in the Philippines, became the first country in the region to launch FWA. Other regional operators, such as Telkomsel in Indonesia and AIS in Thailand, have also begun offering FWA services. In New Zealand, operators plan to provide FWA coverage to 90% of the population by the end of 2023.

While 5G FWA shows promising growth potential, operators need to ensure that as 5G adoption in the network increases, they have the capacity to support their FWA services and the spectrum to guarantee quality. When the demand for 5G FWA service grows, operators may have to look at utilizing the mmWave spectrum to maintain the quality of their FWA services while keeping network capacity intact.

We will keep a close eye on the progress and effectiveness of 5G implementation throughout the Asia Pacific region. If you are interested in benchmarking your performance or if you’d like to learn more about internet speeds and performance in other markets around the world, visit the Speedtest Global Index.

Ookla retains ownership of this article including all of the intellectual property rights, data, content graphs and analysis. This article may not be quoted, reproduced, distributed or published for any commercial purpose without prior consent. Members of the press and others using the findings in this article for non-commercial purposes are welcome to publicly share and link to report information with attribution to Ookla.
| April 18, 2022

Speedtest Global Index Market Analyses Now Available for 43 Countries

Speedtest Global Index™ Market Analyses from Ookla® identify key data about internet performance in countries across the world. This quarter we’ve provided updated analyses for 44 markets that include details on fastest mobile and fixed broadband providers, performance of most popular devices and chipsets and internet speeds in cities. Click a country on the list below to see highlights or scroll through the article to learn what Speedtest Intelligence® revealed in all 43 markets:

Africa and the Middle East

Côte d’Ivoire | Jordan | Kenya | Libya | Nigeria
South Africa | Tanzania | Turkey

Asia and Oceania

China | Hong Kong (SAR) | New Zealand | Philippines | Singapore
Taiwan | Thailand | Vietnam

Europe

Austria | Belgium | Czechia | Denmark | Estonia
Finland| France | Germany | Hungary | Latvia
Lithuania | Luxembourg | Malta | Moldova | Poland
Slovakia | Spain

North and South America

Argentina | Brazil | Canada | Chile | Colombia
Ecuador | Guatemala | Mexico | Peru | United States


Africa and the Middle East

Côte d’Ivoire

  • Speedtest Intelligence revealed mobile provider MTN had the fastest median download speed (15.71 Mbps) and Consistency Score (71.1%) in Côte d’Ivoire during Q1 2022.
  • There was no statistical winner for fastest fixed broadband provider in Côte d’Ivoire during Q1 2022, though Orange had a median download speed of 33.65 Mbps and CANALBOX had a median download speed of 33.35 Mbps.

Jordan

  • Speedtest Intelligence found Umniah was the fastest mobile operator in Jordan during Q1 2022, earning a median download speed of 30.42 Mbps.
  • Fixed broadband provider Orange held the fastest median download speed in Jordan at 78.08 Mbps during Q1 2022.

Kenya

  • Mobile operator Safaricom had the fastest median mobile download speed at 20.49 Mbps in Kenya during Q1 2022.
  • For fixed broadband, Faiba had the fastest median download speed (24.64 Mbps) and Consistency Score (49.8%) in Kenya during Q1 2022.

Libya

  • Speedtest Intelligence reveals that mobile operator Libyana had the fastest median mobile download speed in Libya at 12.54 Mbps during Q1 2022.
  • Among top fixed broadband providers, AWAL Telecom had the fastest median download speed in Libya at 20.02 Mbps during Q1 2022.

Nigeria

  • Fixed broadband provider ipNX had the fastest median download speed (21.34 Mbps) and highest Consistency Score (45.9%) in Nigeria during Q1 2022.
  • There was no statistical winner for fastest top mobile operator in Nigeria during Q1 2022, though Airtel and MTN led the way at 22.42 Mbps and 21.71 Mbps, respectively.

South Africa

  • Speedtest Intelligence shows Cool Ideas had the fastest fixed broadband median download speed (46.05 Mbps) and highest Consistency Score (73.2%) in South Africa during Q1 2022.
  • MTN had the fastest median 5G download speed in South Africa at 213.37 Mbps during Q1 2022, much faster than Vodacom (132.11 Mbps).
  • The Samsung Galaxy S22 Ultra dominated for fastest popular device in South Africa during Q1 2022 and achieved a median download speed of 105.21 Mbps. The Apple iPhone 13 Pro Max followed at 82.23 Mbps.

Tanzania

  • Among top mobile operators in Tanzania, Halotel had the fastest median download speed (17.84 Mbps) and highest Consistency Score (80.1%) during Q1 2022.
  • Mwanza had the fastest median mobile download speed among Tanzania’s most populous cities at 13.76 Mbps during Q1 2022.

Turkey

  • Speedtest Intelligence reveals mobile provider Turkcell had the fastest median download speed and highest Consistency Score in Turkey at 53.77 Mbps and 92.7%, respectively, during Q1 2022.
  • For fixed broadband in Turkey, TurkNet had the highest median download speed (47.43 Mbps) and Consistency Score (76.8%) during Q1 2022.


Asia and Oceania

China

  • According to Speedtest Intelligence, China Telecom was the fastest fixed broadband provider in China with a median download speed of 146.70 Mbps during Q1 2022.
  • During Q1 2022, China Mobile achieved the fastest median 5G download speed at 300.96 Mbps, ahead of China Telecom (296.97 Mbps) and China Unicom (280.62 Mbps).
  • Among top device manufacturers, Huawei had the fastest median download speed in China at 108.94 Mbps during Q1 2022.

Hong Kong (SAR)

  • China Mobile Hong Kong was the fastest mobile operator in Hong Kong, achieving a median download speed of 66.11 Mbps during Q1 2022.
  • China Mobile Hong Kong also showed the fastest 5G download speed, achieving a median speed of 172.19 Mbps during Q1 2022. Mobile provider 3 followed at 155.81 Mbps.

New Zealand

  • Vodafone was the fastest mobile operator in New Zealand during Q1 2022, earning a median download speed of 59.65 Mbps.
  • 2degrees blazed ahead with the fastest median 5G download speed in New Zealand at 479.71 Mbps during Q1 2022, beating out Vodafone (342.45 Mbps) and Spark (307.21 Mbps).
  • For fixed broadband, MyRepublic achieved the fastest median download speed in New Zealand at 217.66 Mbps during Q1 2022.

Philippines

  • During Q1 2022, Smart had the fastest median download speed (24.07 Mbps) among top mobile operators in the Philippines.
  • Smart also had the fastest median 5G download speed in the Philippines during Q1 2022 at 200.43 Mbps.
  • Caloocan took the top spot for fastest median mobile download speed among the Philippines’ most populous cities at 25.71 Mbps during Q1 2022.

Singapore

  • Speedtest Intelligence shows Singtel was the fastest top mobile operator in Singapore with a median download speed of 93.00 Mbps during Q1 2022.
  • Singtel blazed ahead of the competition for fastest median 5G download speed in Singapore at 360.31 Mbps during Q1 2022 — a strong rise over its median 5G download speed of 289.01 Mbps during Q4 2021.

Taiwan

  • During Q1 2022, Chunghwa Telecom had the fastest median 5G download speed in Taiwan at 415.45 Mbps. FarEasTone followed at 310.83 Mbps.
  • The Qualcomm Snapdragon 8 Gen 1 had the fastest median download speed among popular chipsets in Taiwan at 162.51 Mbps during Q1 2022.

Thailand

  • Speedtest Intelligence revealed that AIS had the fastest median download speed on mobile in Thailand at 43.52 Mbps during Q1 2022, beating out TrueMove H and dtac.
  • AIS also had the fastest median 5G download speed in Thailand during Q1 2022 at 261.19 Mbps, followed by TrueMove H and dtac.

Vietnam

  • Vinaphone was Vietnam’s fastest mobile operator during Q1 2022, reaching a median mobile download speed of 42.43 Mbps, just faster than Viettel (40.61 Mbps).
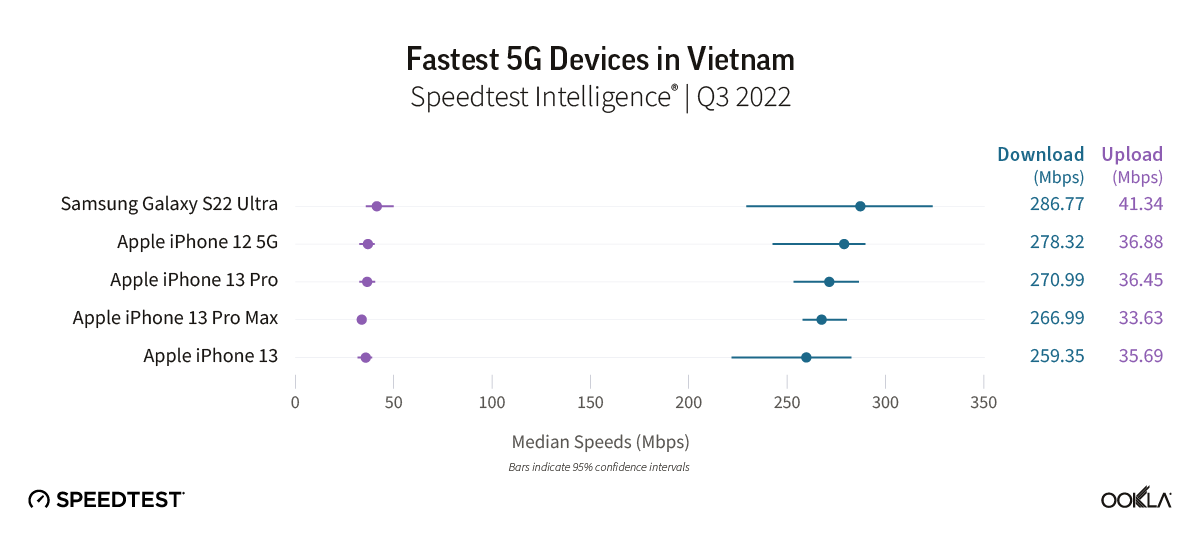
  • Apple’s iPhone 13 Pro had the fastest median download speed among popular devices in Vietnam at 70.91 Mbps during Q1 2022.


Europe

Austria

  • Magenta took the top spot as Austria’s fastest fixed broadband provider with a median download speed of 154.44 Mbps during Q1 2022. LIWEST was the closest competitor (88.75 Mbps).
  • A1 was the fastest mobile provider in Austria during Q1 2022, achieving a median download speed of 69.80 Mbps. Operator 3 followed at 53.73 Mbps.

Belgium

  • Telenet decisively claimed its spot as Belgium’s fastest fixed broadband provider during Q1 2022, earning a median download speed of 129.18 Mbps. VOO followed at 109.76 Mbps.
  • Among mobile operators, Telenet/BASE had the fastest median download speed at 66.92 Mbps.

Czechia

  • Speedtest Intelligence reveals T-Mobile was Czechia’s fastest mobile provider during Q1 2022, recording a median download speed of 55.63 Mbps.
  • Vodafone was Czechia’s fastest fixed broadband provider during Q1 2022, achieving a median download speed of 89.23 Mbps.

Denmark

  • Fastspeed was Denmark’s fastest fixed broadband provider during Q1 2022, achieving a median download speed of 284.28 Mbps. Hiper followed at 239.43 Mbps.
  • YouSee was Denmark’s fastest mobile operator, earning a median download speed of 115.87 Mbps during Q1 2022.

Estonia

  • According to Speedtest Intelligence, Elisa was the fastest fixed broadband provider in Estonia during Q1 2022, achieving a median download speed of 74.48 Mbps.
  • Telia had the fastest mobile median download speed in Estonia at 73.20 Mbps during Q1 2022.

Finland

  • According to Speedtest Intelligence, DNA took the top spot as Finland’s fastest mobile operator in Q1 2022, earning a median download speed of 70.76 Mbps. DNA also edged out Telia for the highest Consistency Score 93.1% to 91.7%.
  • In addition, DNA had the fastest 5G download speed in Finland, achieving a median download speed of 297.70 Mbps. Telia (259.68 Mbps) and Elisa (230.35 Mbps) followed.
  • Competition was tight for Finland’s fastest fixed broadband provider during Q1 2022. DNA (87.87 Mbps) raced past Elisa (86.54 Mbps) and Telia (86.13 Mbps) to take the top spot.

France

  • Orange earned the top spot as France’s fastest and most consistent mobile operator with a median mobile download speed of 81.03 Mbps and a Consistency Score of 89.8% during Q1 2022.
  • During Q1 2022, Orange dominated the competition as France’s fastest 5G provider by achieving a median 5G download speed of 366.42 Mbps. SFR followed at 247.32 Mbps.

Germany

  • According to Speedtest Intelligence, Vodafone was Germany’s fastest fixed broadband provider during Q1 2022, earning a median download speed of 108.67 Mbps.
  • Telekom achieved the fastest median mobile download speed (79.34 Mbps) and Consistency Score (90.9%) among German mobile operators during Q1 2022.
  • Telekom took the top spot for the fastest median 5G download speed in Germany at 193.09 Mbps during Q1 2022.

Hungary

  • Vodafone was Hungary’s fastest fixed broadband provider with a median download speed of 159.59 Mbps during Q1 2022. Vodafone also had the highest Consistency Score at 87.9% during Q1 2022.
  • Yettel was Hungary’s fastest mobile operator during Q1 2022, earning a median download speed of 50.62 Mbps.

Latvia

  • According to Speedtest Intelligence, Balticom had the fastest median fixed broadband download speed in Latvia at 188.27 Mbps and highest Consistency Score (91.9%) during Q1 2022.
  • LMT had the fastest median mobile download speed in Latvia at 50.70 Mbps during Q1 2022.

Lithuania

  • Telia had the fastest median mobile download speed in Lithuania at 77.77 Mbps during Q1 2022. Tele2 followed at 41.75 Mbps, then BITE (29.81 Mbps).
  • Speedtest Intelligence reveals that Cgates had the fastest median fixed broadband speed in Lithuania at 99.50 Mbps during Q1 2022, edging out Penki (93.52 Mbps) and Telia (86.84 Mbps).

Luxembourg

  • Eltrona took the top spot as Luxembourg’s fastest fixed broadband provider during Q1 2022 by achieving a median download speed of 119.65 Mbps.
  • POST was the fastest mobile operator in Luxembourg, achieving a median download speed of 122.74 Mbps in Q1 2022.

Malta

  • Melita took the top spot as Malta’s fastest and most consistent fixed broadband provider during Q1 2022, earning a median download speed of 117.68 Mbps and Consistency Score of 85.2%.

Moldova

  • According to Speedtest Intelligence, Orange dominated as Moldova’s fastest fixed broadband provider, achieving a median download speed of 203.54 Mbps during Q1 2022.
  • Tiraspol showed the fastest median mobile download speed among Moldova’s most populous cities at 35.62 Mbps during Q1 2022.

Poland

  • Speedtest Intelligence revealed that UPC was the fastest fixed broadband provider in Poland, achieving a median download speed of 195.74 Mbps during Q1 2022.
  • Mobile operator Plus had the fastest median 5G download speed in Poland at 167.37 Mbps during Q1 2022, a slight gain over Q4 2021.

Slovakia

  • Orange took the top spot as Slovakia’s fastest mobile operator with a median download speed of 53.30 Mbps, edging out Telekom’s 45.90 Mbps during Q1 2022.
  • Orange also dominated as the fastest 5G operator in Slovakia with a median 5G download speed at 299.09 Mbps during Q1 2022. 4ka followed at 177.76 Mbps.
  • UPC took the top spot as Slovakia’s fastest and most consistent fixed broadband provider with a median download speed of 146.65 Mbps and a Consistency Score of 87.5% during Q1 2022.

Spain

  • Movistar provided the fastest and most consistent mobile experience among Spanish mobile operators during Q1 2022 with a median download speed of 52.44 Mbps and Consistency Score of 89.4%.
  • Vodafone was Spain’s fastest 5G provider by a wide margin, achieving a median download speed of 192.40 Mbps during Q1 2022.


North and South America

Argentina

  • Speedtest Intelligence revealed Personal was Argentina’s fastest mobile operator with a median download speed of 25.57 Mbps during Q1 2022.
  • There was a tight race for the fastest median mobile download speed in Argentina’s most populous cities with no statistical winner during Q1 2022. However, Buenos Aires (25.26 Mbps) and La Plata (25.18 Mbps) led the way.

Brazil

  • Speedtest Intelligence reveals Claro was the fastest and most consistent mobile operator in Brazil during Q1 2022, achieving a median download speed of 33.53 Mbps and Consistency Score of 84.6%.
  • Claro achieved the fastest median 5G download speed in Brazil at 72.35 Mbps during Q1 2022. TIM (62.80 Mbps) and Vivo (62.38 Mbps) followed.

Canada

  • Shaw was Canada’s fastest fixed broadband provider, earning a median download speed of 213.47 Mbps during Q1 2022.
  • TELUS took the top spot as the fastest mobile operator in Canada, achieving a median download speed of 94.48 Mbps during Q1 2022.
  • Competition for the fastest 5G in Canada was tight during Q1 2022 with TELUS edging out Bell 162.47 Mbps to 155.71 Mbps, respectively.

Chile

  • According to Speedtest Intelligence, Entel was the fastest mobile operator in Chile with a median download speed of 23.13 Mbps during Q1 2022.
  • Temuco had the fastest median mobile download speed in Chile at 24.86 Mbps during Q1 2022.

Colombia

  • Cali had the fastest median mobile download speed among Colombia’s most populous cities at 15.32 Mbps during Q1 2022.
  • Among major device manufacturers in Colombia, Apple devices had the fastest median download speed at 17.20 Mbps during Q1 2022.

Ecuador

  • According to Speedtest Intelligence, Netlife was Ecuador’s fastest and most consistent fixed broadband provider during Q1 2022, achieving a median download speed of 45.53 Mbps and Consistency Score of 75.5%.
  • CNT was the fastest and most consistent mobile operator in Ecuador during Q1 2022, with a median download speed of 33.11 Mbps and Consistency Score of 87.4%.

Guatemala

  • According to Speedtest Intelligence, Claro was the fastest and most consistent mobile operator in Guatemala during Q1 2022, achieving a median download speed of 21.40 Mbps and Consistency Score of 80.5%.
  • Tigo was the fastest and most consistent fixed broadband provider in Guatemala with a median download speed of 26.56 Mbps and Consistency Score of 58.3% during Q1 2022.

Mexico

  • Speedtest Intelligence reveals Telcel was Mexico’s fastest mobile operator during Q1 2022, leading the market with a median download speed of 40.25 Mbps.
  • Totalplay was the fastest and most consistent fixed broadband provider in Mexico, achieving a median download speed of 49.33 Mbps and Consistency Score of 74.3% during Q1 2022.

Peru

  • According to Speedtest Intelligence, Winet Telecom was Peru’s fastest fixed broadband provider by a wide margin, achieving a median download speed of 102.83 Mbps during Q1 2022.
  • Claro was the fastest mobile operator in Peru during Q1 2022, earning a median download speed of 19.55 Mbps.

United States

  • Speedtest Intelligence reveals Verizon was the fastest fixed broadband provider in the United States during Q1 2022, edging out XFINITY with a median download speed of 184.36 Mbps to XFINITY’s 179.12 Mbps.
  • T-Mobile took the top spot as the fastest and most consistent mobile operator in the U.S. during Q1 2022, achieving a median download speed of 117.83 Mbps and a Consistency Score of 88.3% — both increases over Q4 2021.
  • Looking at tests taken only on 5G, T-Mobile achieved the fastest median 5G download speed at 191.12 Mbps during Q1 2022. Verizon also had a notable increase in 5G download speed during Q1 2022 over Q4 2021 , which was helped by turning on new C-Band spectrum in January.
  • The Samsung Galaxy S22 Ultra was the fastest popular device in the U.S. at 116.33 Mbps during Q1 2022.

Read the full market analyses and follow monthly ranking updates on the Speedtest Global Index.

Editor’s note: This article was updated on May 11, 2022.

Ookla retains ownership of this article including all of the intellectual property rights, data, content graphs and analysis. This article may not be quoted, reproduced, distributed or published for any commercial purpose without prior consent. Members of the press and others using the findings in this article for non-commercial purposes are welcome to publicly share and link to report information with attribution to Ookla.
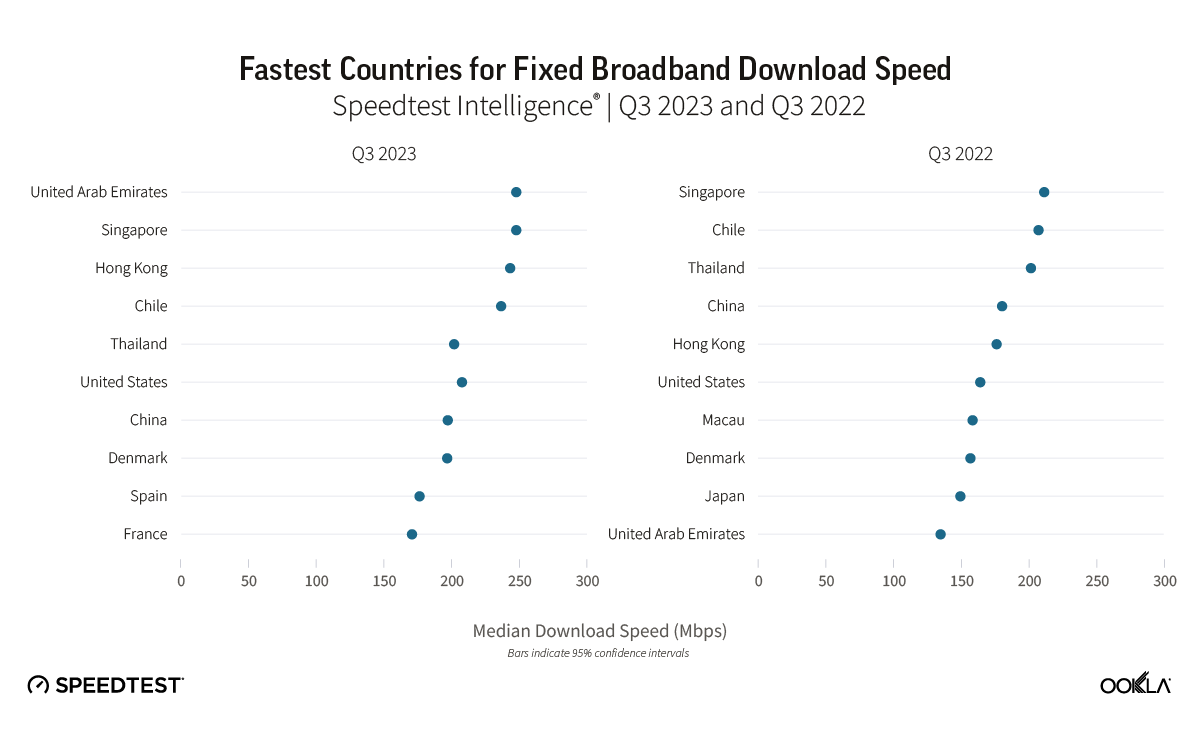
| September 8, 2021

Despite All Odds, Global Internet Speeds Continue Impressive Increase


“A lot has changed” we wrote in our 2019 global roundup of internet speeds based on the Speedtest Global Index. Little did we know how much was about to change. But two things remain the same: the internet is getting faster and the Speedtest Global Index is still a fantastic resource for tracking improvements on a global and country level (if we do say so ourselves). Today we’re taking a look back at how much internet speeds have increased over the past four years and which countries have seen some of the largest gains.

Mobile download speed jumped 59.5% over the last year globally, fixed broadband up 31.9%

The global mean of download speeds improved over the last 12 months on both mobile and fixed broadband to 55.07 Mbps and 107.50 Mbps, respectively, in July 2021. Mobile saw an increase of 59.5% when comparing July 2020 to July 2021 and fixed broadband saw an increase of 31.9%, according to the Speedtest Global Index.

ookla_global-index_world-speeds_0921-1

Looking further back, mean download speed over mobile was 98.9% faster in July 2021 than in July 2019, 141.4% faster when comparing July 2021 to July 2018, and 194.0% faster when comparing July 2021 to June 2017, the month we began tracking speeds on the Speedtest Global Index. Over the last two years there were only two months when the global average for mobile download speed did not show an upward slope: February and March 2020. Speeds began increasing again in April 2020, but did not recover to pre-February levels until May 2020. This coincides with initial lockdowns due to COVID-19 in many countries.

On fixed broadband, mean download speed was 68.2% faster in July 2021 than in July 2019, 131.3% faster in July 2021 than in July 2018, and 196.1% faster in July 2021 than in June 2017. There was a similar dip in download speed over fixed broadband in March of 2020 as we saw on mobile. The speed increased again in April 2020 but did not recover to a pre-March level until April 2020.

Top 10 rankings are somewhat constant over three years, U.S. and Canada slip off in 2021

There has been surprising parity of which countries continue to occupy the top 10 spots on the Speedtest Global Index in July of each year. However, the lists for mobile and fixed broadband are radically different, with only one country (South Korea) showing up on both lists in 2021.

ookla_fastest-countries_mobile_0921

The United Arab Emirates and South Korea maintain their first and second place rankings for mobile in both 2020 and 2021 and China and Qatar merely flip-flop for third and fourth place. It’s interesting to see Australia and Canada decline in the rankings although their speeds have increased dramatically during the past three years. 5G is shifting mobile rankings where even countries with 5G (which few countries had in 2019) need a strong 5G focus to maintain their presence at the top of the list lest they be outpaced by other countries with larger investments in 5G.

ookla_fastest-countries_fixed_0921

The fixed broadband rankings are more dynamic than those on mobile. Monaco traveled up and down the top 10 from sixth place in 2019 to 10th in 2020 to first place in 2021. Singapore ranked first or second in all three years and Hong Kong (SAR) was in the top four. Romania was solidly in fifth place while South Korea dropped lower in the ranking every year. Chile and Denmark both debuted in the top 10 in 2021 and the United States dropped off the list.

Most of the top 10 countries perform well for fixed and mobile

We were curious to see if countries that made the top 10 in July 2021 for either mobile or fixed broadband were also performing well on the other medium, so we plotted the percentage difference from the global average for mobile download speed against download speed on fixed broadband. Note that the global average increased between 2020 and 2021 and that Liechtenstein and Monaco are not included in this comparison as they did not have sufficient samples to be listed on both axes.

2020/2021 chart of leading country performance again global averages

Most countries that made the top 10 in July 2021 for either mobile or fixed broadband were performing well over the global average for both at that point in time. South Korea and the U.A.E. stood out with mean mobile download speeds that were more than 240% faster than the global average and fixed broadband downloads that were more than 70% faster than the global average. China’s mobile download speed was more than 180% faster than the global average and the country was more than 70% faster than the global average for fixed broadband. Switzerland’s mobile and fixed broadband download speeds were close to 100% faster than the global average.

Chile and Thailand are in a quadrant that shows both had faster than average fixed broadband download speeds, but their mobile download speeds were slower than the global average in July 2021. Australia, Bulgaria, Cyprus and Saudi Arabia were in the opposite quadrant with faster than average mobile speeds and below average fixed broadband speeds.

Comparing the chart for July 2021 to that of July 2020, we saw a wide variety of outcomes. Countries with increases compared to the global average on mobile and fixed broadband included Australia, Cyprus, Denmark, Hong Kong, Romania and the U.A.E. Chile and Norway showed dramatic increases compared to the global average on fixed broadband and declines on mobile. Bulgaria, China, Kuwait, Saudi Arabia and Switzerland increased on mobile but showed little change on fixed. South Korea and Qatar increased on mobile compared to the global average and declined on fixed. Singapore and Thailand declined on both mobile and fixed broadband compared to the global average.

We’re interested to see how global speeds and rankings change over time as individual countries and their providers choose to invest in different technologies. Track your country’s performance using monthly updates on the Speedtest Global Index. Check the Ookla 5G Map for up-to-date information on 5G deployments where you live, and if you want more in-depth analyses, subscribe to Ookla Research.

Ookla retains ownership of this article including all of the intellectual property rights, data, content graphs and analysis. This article may not be quoted, reproduced, distributed or published for any commercial purpose without prior consent. Members of the press and others using the findings in this article for non-commercial purposes are welcome to publicly share and link to report information with attribution to Ookla.

| May 17, 2023

ISPs Need to Do More to Improve Wi-Fi Performance in the Home

Key messages

  • Wi-Fi woes continue. Ookla® Speedtest Intelligence® data shows Wi-Fi performance continues to lag behind ethernet performance within home networks in many advanced fixed broadband markets, with Wi-Fi speeds typically ranging from between 30-40% of ethernet speeds during Q1 2023.
  • Developed Asian and North American markets lead the charge to Wi-Fi 6/6E. Wi-Fi 4 and 5 remain the dominant Wi-Fi access technologies globally, accounting for a combined 89% of Speedtest® samples during Q1 2023. However, a number of advanced fixed broadband markets are rapidly migrating to Wi-Fi 6 and 6E, with China, Hong Kong (SAR), Singapore, Canada, and the U.S. leading the charge.
  • Growing Wi-Fi 6/6E adoption helps narrow the gap in Wi-Fi performance. In markets such as Canada, France, Germany, Singapore, Sweden, and the U.S., where the transition to fiber is more advanced, and where ISPs are actively driving adoption of Wi-Fi 6/6E routers, we see Wi-Fi performance closing the gap to ethernet. However, more needs to be done in other markets, where migration to more advanced fixed access networks is exposing the limitations of the installed base of Wi-Fi routers.
  • Router vendors pushing the envelope with Wi-Fi 7 capable launches. ASUS leads the market for Wi-Fi 6/6E routers among Speedtest samples, and both ASUS and other leading router vendors have been quick to launch Wi-Fi 7 capable routers. Despite this, Wi-Fi 6 and 6E remain the growing component of their installed bases. ASUS leads the market according to Speedtest Intelligence with 39% of its routers we sampled supporting Wi-Fi 6/6E during Q1 2023, well ahead of second placed NETGEAR with 26%.
  • Smartphone device support indicates Wi-Fi 6/6E should remain the immediate focus for ISPs. With the two largest smartphone vendors globally, Samsung and Apple, currently shunning Wi-Fi 7, ISPs waiting to see if they can leapfrog Wi-Fi 6E to Wi-Fi 7 should stay their hands. The fact that China still needs to allocate the 6 GHz spectrum band — key for Wi-Fi 6E and 7 — for unlicensed use is also significant, and appears to have weighed on the Wi-Fi 6E adoption among China’s leading Android smartphone manufacturers.

Wi-Fi performance continues to lag ethernet within the home

ISPs in advanced fixed broadband markets are increasingly looking to offer more advanced Wi-Fi routers and solutions such as mesh networks, which are designed to improve Wi-Fi coverage and performance. However, Speedtest Intelligence data shows that more needs to be done to improve Wi-Fi performance, which typically ranged from between 30-40% of ethernet speeds. Median Wi-Fi performance as measured by Speedtest will tend to lag behind median ethernet performance, depending on distance of the end-user device from the router, including any obstacles and signal interference the Wi-Fi signal needs to traverse to reach the device.

Chart of Ratio of Wi-Fi to Ethernet Performance

Our analysis of Speedtest Intelligence data reveals that driving greater adoption of more advanced Wi-Fi routers can help ISPs narrow the gap between Wi-Fi and ethernet performance, with ISPs in Canada, France, Germany, Singapore, Sweden, and the U.S. already successfully doing so over the past year.

Chart of Closing the Gap on Wi-Fi Performance

Despite this, the results are not always positive, with the gap between Wi-Fi and ethernet performance widening, in particular in the U.K. and Taiwan. Where markets are rapidly migrating from more legacy fixed broadband technology to advanced cable and fiber connections, Wi-Fi performance can lag relative to ethernet, indicating a need to accelerate the adoption of more advanced Wi-Fi technologies.

Older generations of Wi-Fi 4 and Wi-Fi 5 remain dominant globally

While much of the focus of the device ecosystem is on spurring adoption of the latest Wi-Fi standards, there is a long way to go before even Wi-Fi 6 becomes a dominant standard globally. Based on Speedtest Intelligence data, the proportion of Wi-Fi tests by generation (a good proxy for adoption) shows that Wi-Fi 4 and Wi-Fi 5 remain the dominant router technology, with Wi-Fi 6 representing just under 10% as of February 2023, and Wi-Fi 7 showing very few samples. The share of samples from Wi-Fi 4 routers has fallen by 6 ppts year-over-year, while Wi-Fi 5’s share of samples has marginally increased.

Chart of Share of wi-Fi Samples by Generation

Asian and North American ISPs lead the charge to Wi-Fi 6 and beyond

ISPs are the main driver behind the adoption of new Wi-Fi standards, as highlighted by a 2022 study by Parks Associates, which found that 52% of U.S. consumers acquired their router from their ISP. Rolling out more advanced routers to their customer bases enables them to take advantage of the increased performance of newer generations of Wi-Fi technology, and helps to ensure ISPs deliver faster speeds, particularly over fiber access networks.

Adoption of Wi-Fi 6 varies by market, even among the most developed fixed broadband markets globally. ISPs in a number of advanced fixed markets have already begun offering Wi-Fi 6E routers to their customer bases, with ISPs in North America in particular moving in this direction, including Bell Canada, Rogers, Telus, Verizon, XFINITY, Charter, and Frontier, as well as leading ISPs in advanced Asian and European markets.

Markets in Asia led the way on Wi-Fi 6 adoption, with China and Hong Kong both recording 42% adoption, followed by Singapore with 37%. Outside of Asia, North America showed the next highest level of adoption, with the U.S. and Canada recording 32% and 30%, respectively. European fixed markets lagged behind, with adoption ranging from 13% in the U.K., to 24% in Sweden. For markets such as Chile, which placed towards the top of the Ookla Speedtest Global Index™ for median fixed broadband speeds, a relatively low-level of Wi-Fi 6 adoption (8% in Q4 2022) signals further opportunity for ISPs in the market to boost performance.

Chart of Adoption of Wi-Fi Generations by Market

The fastest growing markets, in terms of increasing share of Wi-Fi 6 of Speedtest samples year-over-year in Q1 2023, were Canada and Malaysia (+15 ppts), Singapore (+14 ppts), and Hong Kong (+12 ppts). While there was considerable variance between ISPs within each market, leading ISPs such as SmarTone (Hong Kong), DiGi (Malaysia), and ViewQwest (Singapore), are prompting a competitive response so that even ISPs with lower levels of Wi-Fi 6 adoption are prioritizing the technology and seeing adoption grow steadily.

CountryISPWi-Fi 6 %, Q1 2023
Hong Kong (SAR)SmarTone62.4%
CanadaBell pure fibre57.3%
SingaporeViewQwest53.7%
SingaporeMyRepublic50.3%
MalaysiaDigi50.2%
MalaysiaMaxis49.0%
Hong Kong (SAR)NETVIGATOR44.2%
CanadaRogers43.4%
SingaporeM141.7%
SingaporeSingTel41.4%
CanadaTelus PureFibre41.0%
Hong Kong (SAR)HKBN41.0%
CanadaShaw39.0%
SingaporeStarHub35.6%
Hong Kong (SAR)HGC30.0%
MalaysiaTIME28.8%
MalaysiaTM21.5%

In addition to providing newer routers, ISPs are increasingly positioned to help consumers solve Wi-Fi performance issues in the home, such as offering mesh Wi-Fi solutions. For some ISPs, this has even taken precedence over offering newer Wi-Fi 6E routers, as they look to improved coverage within the home as a faster route to improving Wi-Fi performance. 

In the U.K., BT has prioritized whole-home coverage over Wi-Fi 6E with its BT Complete Wi-Fi (mesh) offer, despite the U.K. regulator Ofcom having released the lower portion of the 6 GHz band for unlicensed use in 2020. In Canada, Telus, while having recently released a Wi-Fi 6E router for its broadband users, also offers its WiFi Plus package, which includes professional installation and “wall-to-wall coverage” throughout the home. Rogers also offers guaranteed Wi-Fi coverage throughout the home, as well as Wi-Fi 6E routers. Plume offers a subscription-based service, HomePass, across a number of markets, which allows users to add additional access points to help eradicate not-spots or poor Wi-Fi signal within the home and also offers solutions for ISPs looking to improve their Wi-Fi offerings. In Hong Kong, China Mobile Hong Kong (CMHK) was the first ISP in the market to offer a fiber-to-the-room service, while it and other ISPs such as NETVIGATOR offer consumers the option to subscribe to multiple channels over fiber with separate IP addresses, allowing them to divide their activities across channels and thereby help avoid congestion.

To capture the full performance benefits of Wi-Fi 6E and Wi-Fi 7, countries must allocate 6 GHz spectrum for unlicensed use, therefore allowing Wi-Fi devices to access this higher frequency, higher capacity spectrum, and utilize wider channels. At present, according to the Wi-Fi Alliance, allocation of the lower portion of the 6 GHz spectrum band (5,925 MHz to 6,425 MHz) is common among developed economies, with some notable exceptions in some developed markets in Asia and Asia Pacific, in particular China, while allocation of the full 6 GHz band is more limited, available across North America and some Latin American markets, as well as Saudi Arabia and South Korea.

Wi-Fi 7 on the horizon as router vendors continue to push the envelope on performance

Wi-Fi performance continues to scale, and with Wi-Fi 7 routers and smartphones having launched in the second half of 2022, that trend is set to continue. In addition to higher throughput, successive Wi-Fi generations also support lower latency, helping to better support higher quality video streaming, cloud gaming, and future use cases linked to concepts such as the Metaverse and other uses of extended reality (XR).

The major silicon vendors, Broadcom, Qualcomm, and Mediatek, were quick to update their solutions to support the emerging Wi-Fi 7 standard, and hardware vendors have followed suit. Chinese vendor H3C was the first to launch with its H3C Magic BE18000 Wi-Fi 7 router in July 2022, and it has since been followed by other major vendors including tp-link, ASUS, and more recently NETGEAR. However, the prices of early Wi-Fi 7 routers that take advantage of Wi-Fi 7’s range of enhanced performance capabilities will be a barrier to entry for many, with tp-link’s flagship Archer BE900 currently retailing at a cost of $699.99. 

Speedtest Intelligence data shows minimal Wi-Fi 7 adoption as of March 2023, however we are likely to see the same vendors drive Wi-Fi 7 adoption that are currently leading on Wi-Fi 6. Based on global Speedtest Intelligence samples, we see ASUS leading the market in Wi-Fi 6 penetration, with 39% of samples recorded using Wi-Fi 6 compatible routers. NETGEAR and Belkin followed, but for the remaining major router vendors, Wi-Fi 6 penetration currently stands at close to 10% or below. Wi-Fi 6E remains a small but growing subset of Wi-Fi 6 certified devices, currently standing at 7.7% of products based on the latest Wi-Fi Alliance data. Of these, a majority are either routers or smartphones, with an almost even split between the two.

Chart of Wi-Fi 6 Router Market Share view by Brand (Global)

Smartphone support indicates ISPs should focus on Wi-Fi 6E for now

With Samsung releasing its Galaxy S23 range in February 2023 without Wi-Fi 7 support, and Apple’s latest iPhone 14 smartphones limited to Wi-Fi 6, it’s clear that, for now, ISPs should prioritize the rollout of Wi-Fi 6/6E among their customer bases rather than consider leapfrogging to Wi-Fi 7. The Xiaomi Mi13 Pro was the first Wi-Fi 7 capable smartphone to hit the market, launching in December 2022, although it was limited to Wi-Fi 6E initially, requiring a software update to enable Wi-Fi 7. The availability of Wi-Fi 7 supporting Android smartphones will grow through 2023, enabled by SoCs from leading vendor Qualcomm with its flagship Snapdragon 8 Gen 2, and MediaTek with its Dimensity 9200. Apple, on the other hand, lags on the latest Wi-Fi standard support, with the iPhone 14 series featuring Wi-Fi 6, and with its fall 2023 models rumored to be adding Wi-Fi 6E to their feature list.

Chart of Android Smartphone Vendor Installed Base, by Wi-Fi Standard, Global

Samsung, as the leading Android smartphone vendor globally, has the largest installed base of smartphones supporting Wi-Fi 6 and Wi-Fi 6E, and has stolen a march on its main rivals Xiaomi, OPPO, and Vivo. While the major Chinese smartphone vendors have launched Wi-Fi 7 compatible devices, the lack of assignment of 6 GHz spectrum for unlicensed use in China does appear to have held them back relative to brands such as Samsung and ASUS.

The outlook for Wi-Fi in the home

It’s clear from the gap between Wi-Fi and ethernet performance that ISPs need to do more to improve the customer experience for Wi-Fi users within the home. Part of the solution lies in rolling out more advanced generations of Wi-Fi technology, given Wi-Fi 4 and 5 remain the dominant technologies deployed globally. However, evidence linking increased adoption of Wi-Fi 6 to overall Wi-Fi closing the gap to ethernet performance is mixed, and validates the approach of ISPs looking to also offer mesh networking Wi-Fi solutions. Contact us to find out more about how Ookla Research can help you monitor the performance of your networks, and stay ahead of the competition.

Ookla retains ownership of this article including all of the intellectual property rights, data, content graphs and analysis. This article may not be quoted, reproduced, distributed or published for any commercial purpose without prior consent. Members of the press and others using the findings in this article for non-commercial purposes are welcome to publicly share and link to report information with attribution to Ookla.
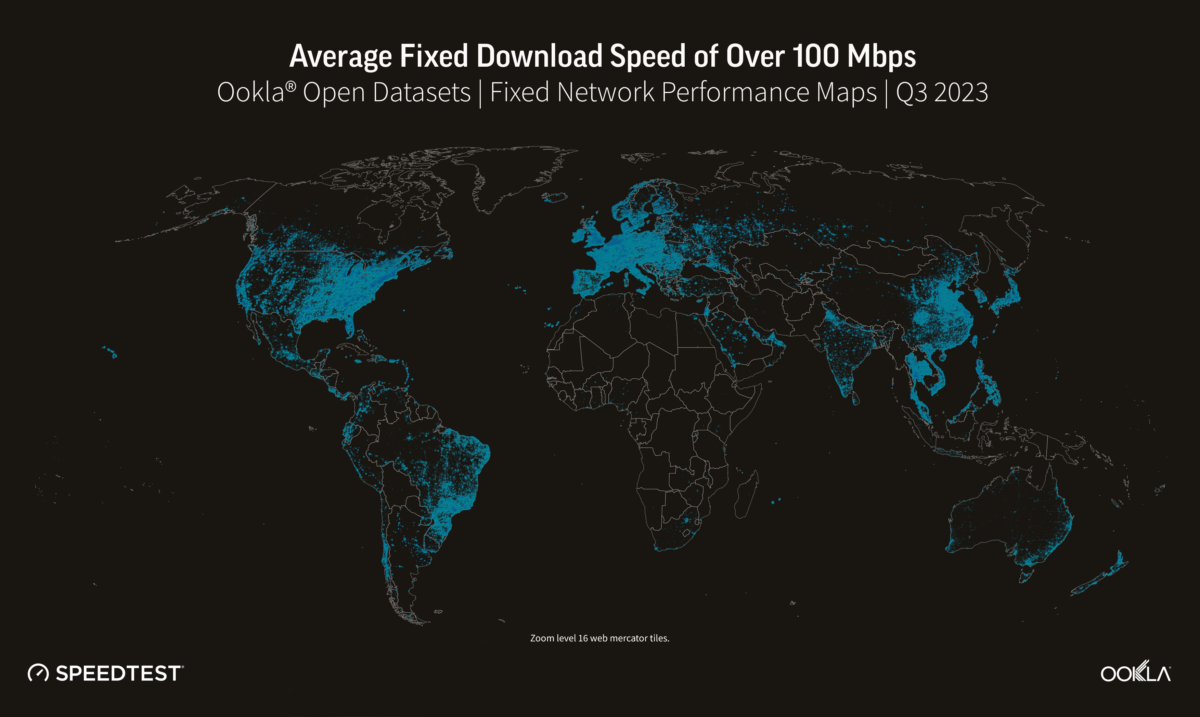
| November 1, 2023

Plan, Optimize, and Monitor Your 5G Network with QoS and QoE Data

5G is a critical technology for the future of mobile communications. To meet the growing demand for mobile data and to enable innovative applications, mobile network operators are expanding 5G networks around the world. As operators face economic challenges with inflation and constrained Capex budgets, the optimization of existing infrastructure and cost-effective investments is essential. Having access to good quality data can help them make informed decisions on how best to allocate resources. Crowdsourced data needs to be a part of the 5G network strategy because it provides operators with a real-time view of their 5G network performance and coverage, as well as insights into how users are experiencing the network. 

Operators can use QoS (Quality of Service) and QoE (Quality of Experience) metrics to plan, monitor, and optimize 5G network performance. In this article we will look at an example of how an operator in Bangkok, Thailand has used Ookla’s QoS and QoE data over the past two years. 

Planning where to add 5G SA cell sites or deploy 5G NSA 

QoS and QoE data can help operators understand whether to add 5G standalone (SA) cell sites or deploy 5G non-standalone (NSA) on existing 4G cell sites. Using Ookla Cell AnalyticsTM, operators can find out where they have poor coverage and performance with existing cell sites, so that they can prioritize additional cell sites in areas that need the most improvement. 

As 5G replaces 4G LTE footprints, operators need to understand existing LTE network performance. LTE optimization priority is a KPI that can help operators identify where optimization is needed by showing areas that have good LTE signal level and poor signal quality. A high percentage indicates that optimization is most urgently needed, and a low percentage indicates that no optimization is needed. 

Looking at data from late 2021, we can see areas with high optimization priority (shown by the red bins in the first image), and network performance test results that indicate low LTE downlink throughput and low 5G downlink throughput (shown by the red dots in the second image). 

Operator A was able to visualize the areas with high optimization priority and low download speeds on LTE and 5G, indicating that those areas have good coverage but bad quality, and should be prioritized for adding new 5G sites.

Operators can also use Consumer QoETM to understand where they have poor user experience and where a new 5G cell site would have the most impact on QoE metrics such as web page load time for web browsing. Customers expect to have good connectivity on the go, so slow page load time for web browsing leads to poor customer experience. 

Looking at data from 2022, Operator A was able to see on a map where web pages were taking the most time to load on customer devices (shown in red). 

Operators can also use Cell Analytics to see where existing 5G cell sites are on their network. In the screenshot below, we can see all of the 5G cell sites for Operator A in Bangkok, Thailand. 

Using 5G cell site locations in conjunction with RF metrics such as LTE optimization priority and QoE metrics like web page load time, Operator A was able to make informed decisions about where to add new 5G SA cell sites or deploy 5G NSA. 

Optimizing your 5G network

After adding new 5G SA cell sites and deploying 5G NSA, operators can use Ookla data to continually optimize their 5G network. QoS and QoE data supports optimization use cases including pinpointing overshooting cells, finding areas with a lack of cell dominance, and identifying areas where users are experiencing poor performance, coverage, quality, or degrading QoE. 

For example, Operator A was able to identify areas with high data traffic that was leading to poor signal quality. In the image below, Operator A can see that mobile data usage is particularly high (shown in red) in the Ratchaprasong District, a popular shopping area with 9 major malls and more than 5,500 shops. 

Taking a look at 5G RSRQ data for this area, Operator A was able to see that signal quality was poor (shown in green and blue) in some of the busier areas of the shopping district.

These problem areas with high traffic and low signal quality are areas where Operator A should optimize their network by ensuring signals are routed efficiently. One year later in Q2 2023, there are many more areas with strong signal quality (shown in red), indicating that Operator A has improved the signal quality in the area. 

We can see that the improvement is due to a new 5G cell site, and we can examine its cell ID and PCI along with its coverage footprint. We can also see that this operator is using the 2500 MHz frequency band for 5G in the area.

Monitoring your 5G network performance and competitor rollouts 

To ensure that customers are realizing the improved QoS and QoE that 5G has promised, it’s important that operators are continuously monitoring and optimizing their network. Operators can use Ookla data to validate the impact that the rollout has had on performance, coverage, and quality. 

Looking again at LTE optimization priority and downlink throughput two years later in 2023, we can see that Operator A has successfully optimized the network and is providing better RSRP, RSSNR, and download speeds to their customers than they were in 2021 (less red and more green). 

Additionally, Operator A can validate improved QoE by looking at web page load time in 2023. There are significantly more green areas on the map than there were in 2022, indicating that page load times in Bangkok have become much faster and Operator A is now providing a better quality of experience.

Operators can also monitor the rollout of their own network and competitor networks by viewing 5G cell site locations. Operator A can see their 5G cell sites (shown in green), as well as their competitor Operator B’s 5G cell sites (shown in red). Operator A is able to see that they are leading the way in 5G deployments for Bangkok. 

From 2021 to 2023, Operator A used Ookla data to plan where to build 5G SA cell sites and deploy 5G NSA, optimize their 5G network, validate network improvements, and monitor competitor rollouts. 

As operators expand their 5G networks to meet the increasing demand for mobile data and support innovative applications, the need for efficient network management becomes paramount. Ookla can help operators make data-driven decisions at every stage of the 5G lifecycle — planning, optimizing, and monitoring — allowing them to stay ahead and deliver exceptional mobile performance to customers. If you’re interested in getting started with Cell Analytics or Consumer QoE, inquire here

Ookla retains ownership of this article including all of the intellectual property rights, data, content graphs and analysis. This article may not be quoted, reproduced, distributed or published for any commercial purpose without prior consent. Members of the press and others using the findings in this article for non-commercial purposes are welcome to publicly share and link to report information with attribution to Ookla.
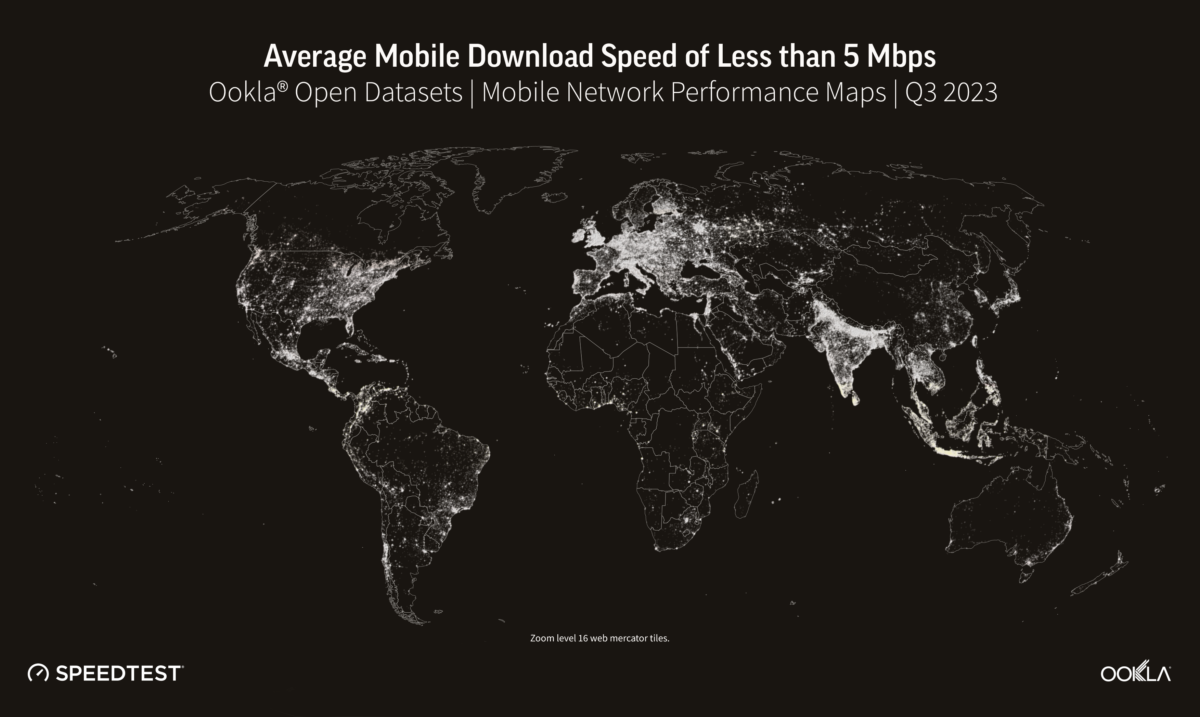
| June 27, 2017

Which Airport Has the Fastest Internet in Asia?

Travelers jetting off to Asia this summer will probably want to know whether you can connect to the internet upon landing and whether that internet is fast enough to help you nail down any final travel details before hitting the hotel and sleeping off the jet lag.

Using Speedtest data for March-May 2017, we analyzed the speeds of free airport Wi-Fi and local cellular signals at the busiest airports in Asia to see what your best options are and where you’re flat out of luck.

Fastest airport Wi-Fi

Dubai reigns when it comes to free airport Wi-Fi. In fact, this airport has the fastest Wi-Fi we’ve seen at any airport in Asia, Europe or Africa. And their average upload speed is even faster than their download. Travelers to second-place Seoul are also in excellent shape if they need to connect to the internet while in transit.
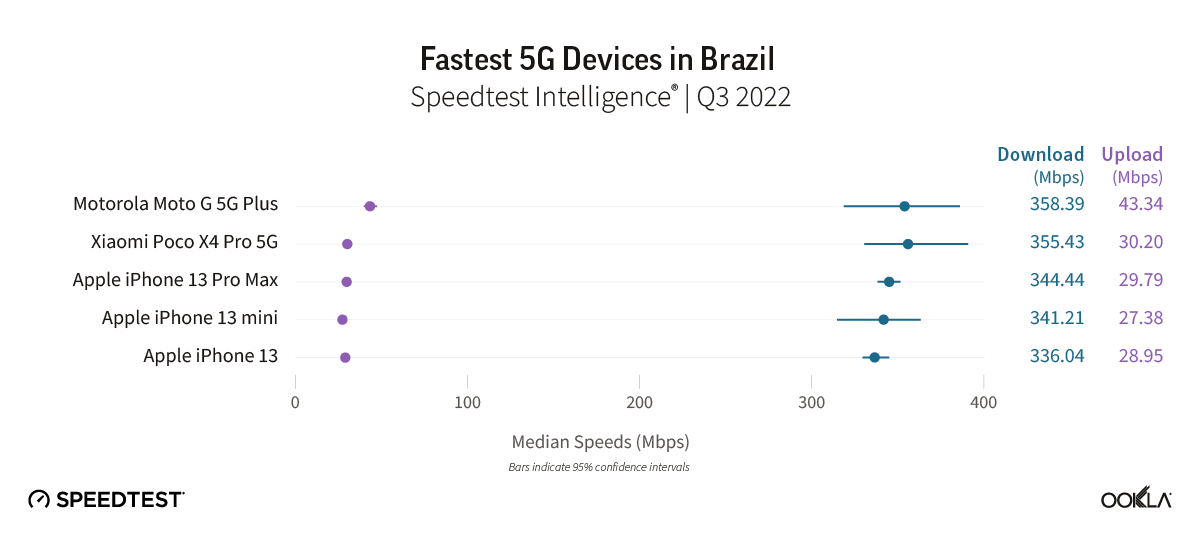
Tokyo, Delhi and Singapore have decently fast download speeds over airport Wi-Fi while Bangkok’s and Hong Kong’s are merely okay. Sadly, the rest of the airports offer painfully slow free Wi-Fi.

You might think airport Wi-Fi is similar to the average mobile Wi-Fi speeds of the country, but instead some of the fastest countries — Singapore (111.59 Mbps), Hong Kong (63.70 Mbps) and China (47.64 Mbps) — have poor to average airport Wi-Fi speeds. Though sitting near the top of the airport Wi-Fi pack, South Korea’s 66.67 Mbps, Japan’s 42.00 Mbps and Thailand’s 30.48 Mbps country averages show the Wi-Fi at their premier airports could be a lot faster. India’s average download speed (12.39 Mbps) is right in line with the Wi-Fi at Indira Gandhi International Airport.

On the other end of the spectrum, the United Arab Emirates has clearly prioritized airport Wi-Fi because the Wi-Fi download speed at Dubai International is nearly double the country average of 22.12 Mbps.

Fastest airport cell

In countries including China and India, you can’t connect to the free airport Wi-Fi without an in-country mobile number, so we checked Speedtest results for users on cell networks as well.

The average mobile download speed at Singapore’s Changi Airport is nearly as fast as the country’s average of 46.12 Mbps. Considering Singapore ranks second fastest in the world for mobile downloads, that’s a hard speed to beat. Dubai also has wonderfully fast speeds, and they beat the country average of 29.81 Mbps.

East Asia’s airports form a strong middle of the pack with cellular download speeds ranging from 18.18 Mbps in Bangkok to 27.12 in Guangzhou. These are comparable to the country average mobile download speeds of 33.63 Mbps for China, 19.70 Mbps for Hong Kong, 18.48 for Japan, and 14.58 for Thailand. Flyers at Delhi’s Indira Gandhi Airport, though, will be sorely disappointed with the 5.85 Mbps on offer. But that’s only slightly slower than India’s 7.62 Mbps mobile download average.

Wi-Fi or cell?

If you’ve already nailed down your international SIM card options, you’re going to have a lot better luck in many parts of Asia on a cellular signal than you would using the free airport Wi-Fi.

Of course you’re in good shape either way in Dubai, Seoul’s Wi-Fi download speed is slightly faster than that on cell, and in India you’ll definitely want to use the airport Wi-Fi if you can access it. Everywhere else the local cell performance puts airport Wi-Fi to shame.

Regional trends

Southeast Asia

If you’re jet-setting through Southeast Asia, count on any time spent in the Singapore Airport for your internet needs and plan to enjoy a more disconnected experience in India and Thailand, especially if you don’t have an Indian phone number and have to rely on cell service at the Delhi airport.

East Asia

As mentioned above, all the airports we analyzed in China, Japan and Korea had strong cellular speeds. Tokyo’s Haneda Airport and Seoul’s Incheon Airport also had good download speeds over their free airport Wi-Fi networks. China’s free airport Wi-Fi, on the other hand, is varying degrees of slow.

China

Within China, Hong Kong has the fastest free airport Wi-Fi, but you will be much better off with cellular networks at any of the airports we surveyed in China. Guangzhou has the fastest average download on cell while Hong Kong is the slowest, but with averages between 22 Mbps and 28 Mbps, you should be just fine.

Watch this space for upcoming articles comparing Wi-Fi and cellular speeds at airports across the globe. Until then, if you think your local airport is over- (or under-) rated, take a Speedtest on Android or iOS and show us what you’re experiencing.

Ookla retains ownership of this article including all of the intellectual property rights, data, content graphs and analysis. This article may not be quoted, reproduced, distributed or published for any commercial purpose without prior consent. Members of the press and others using the findings in this article for non-commercial purposes are welcome to publicly share and link to report information with attribution to Ookla.