Taking advantage of remote work in another country is the dream for many. Who hasn’t imagined themselves sipping fresh squeezed juice on a gorgeous tropical beach during a team call, cozying up next to a crackling fire in a European castle while pouring over a spreadsheet, or even just working anywhere that isn’t the office or our home couch? COVID-19 made working remotely more readily an option for some, and 51 countries have even gone so far as to create remote work or “digital nomad” visas. Today, Ookla® brings you fresh data on how these countries’ internet compares so you can start planning a long-term escape from your current reality.
Using Speedtest Intelligence®, we looked for remote work countries with the fastest internet, tropical countries with remote work visas and fast internet, fastest European countries for remote work, countries where you won’t lose your connection, and seven affordable remote work countries with good internet. Read on to start planning your next life adventure.
Digital nomad countries with seriously fast internet
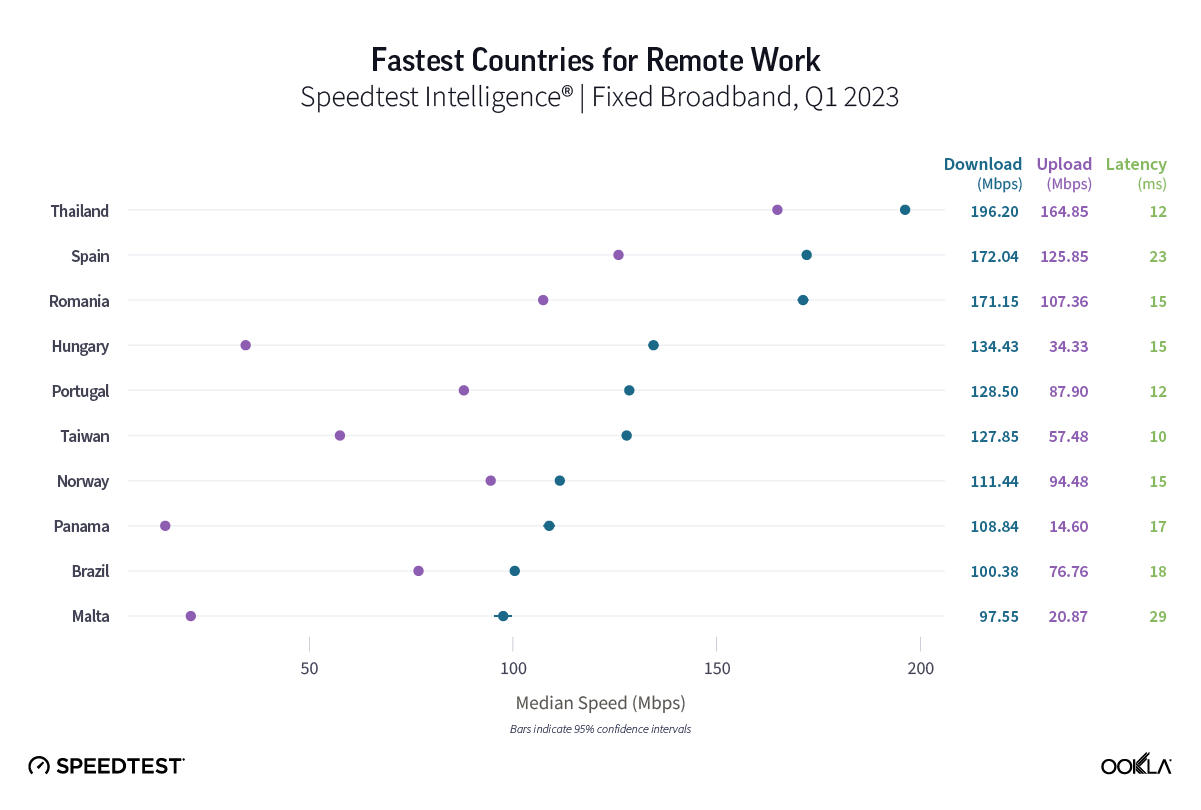
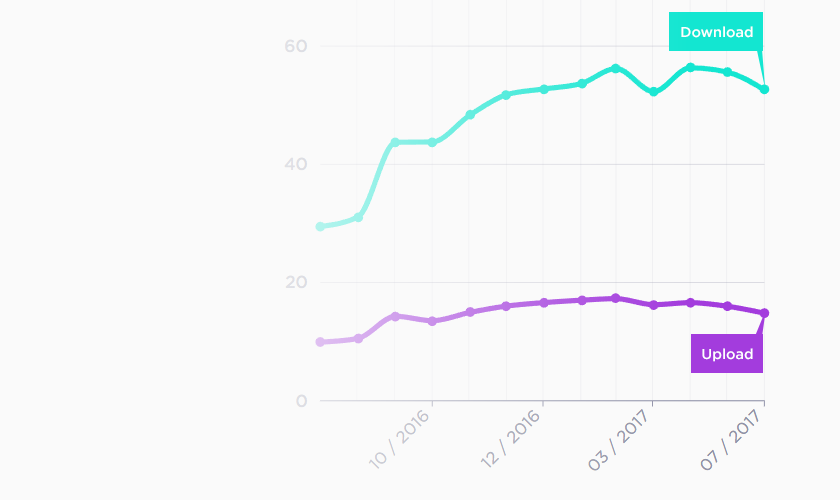
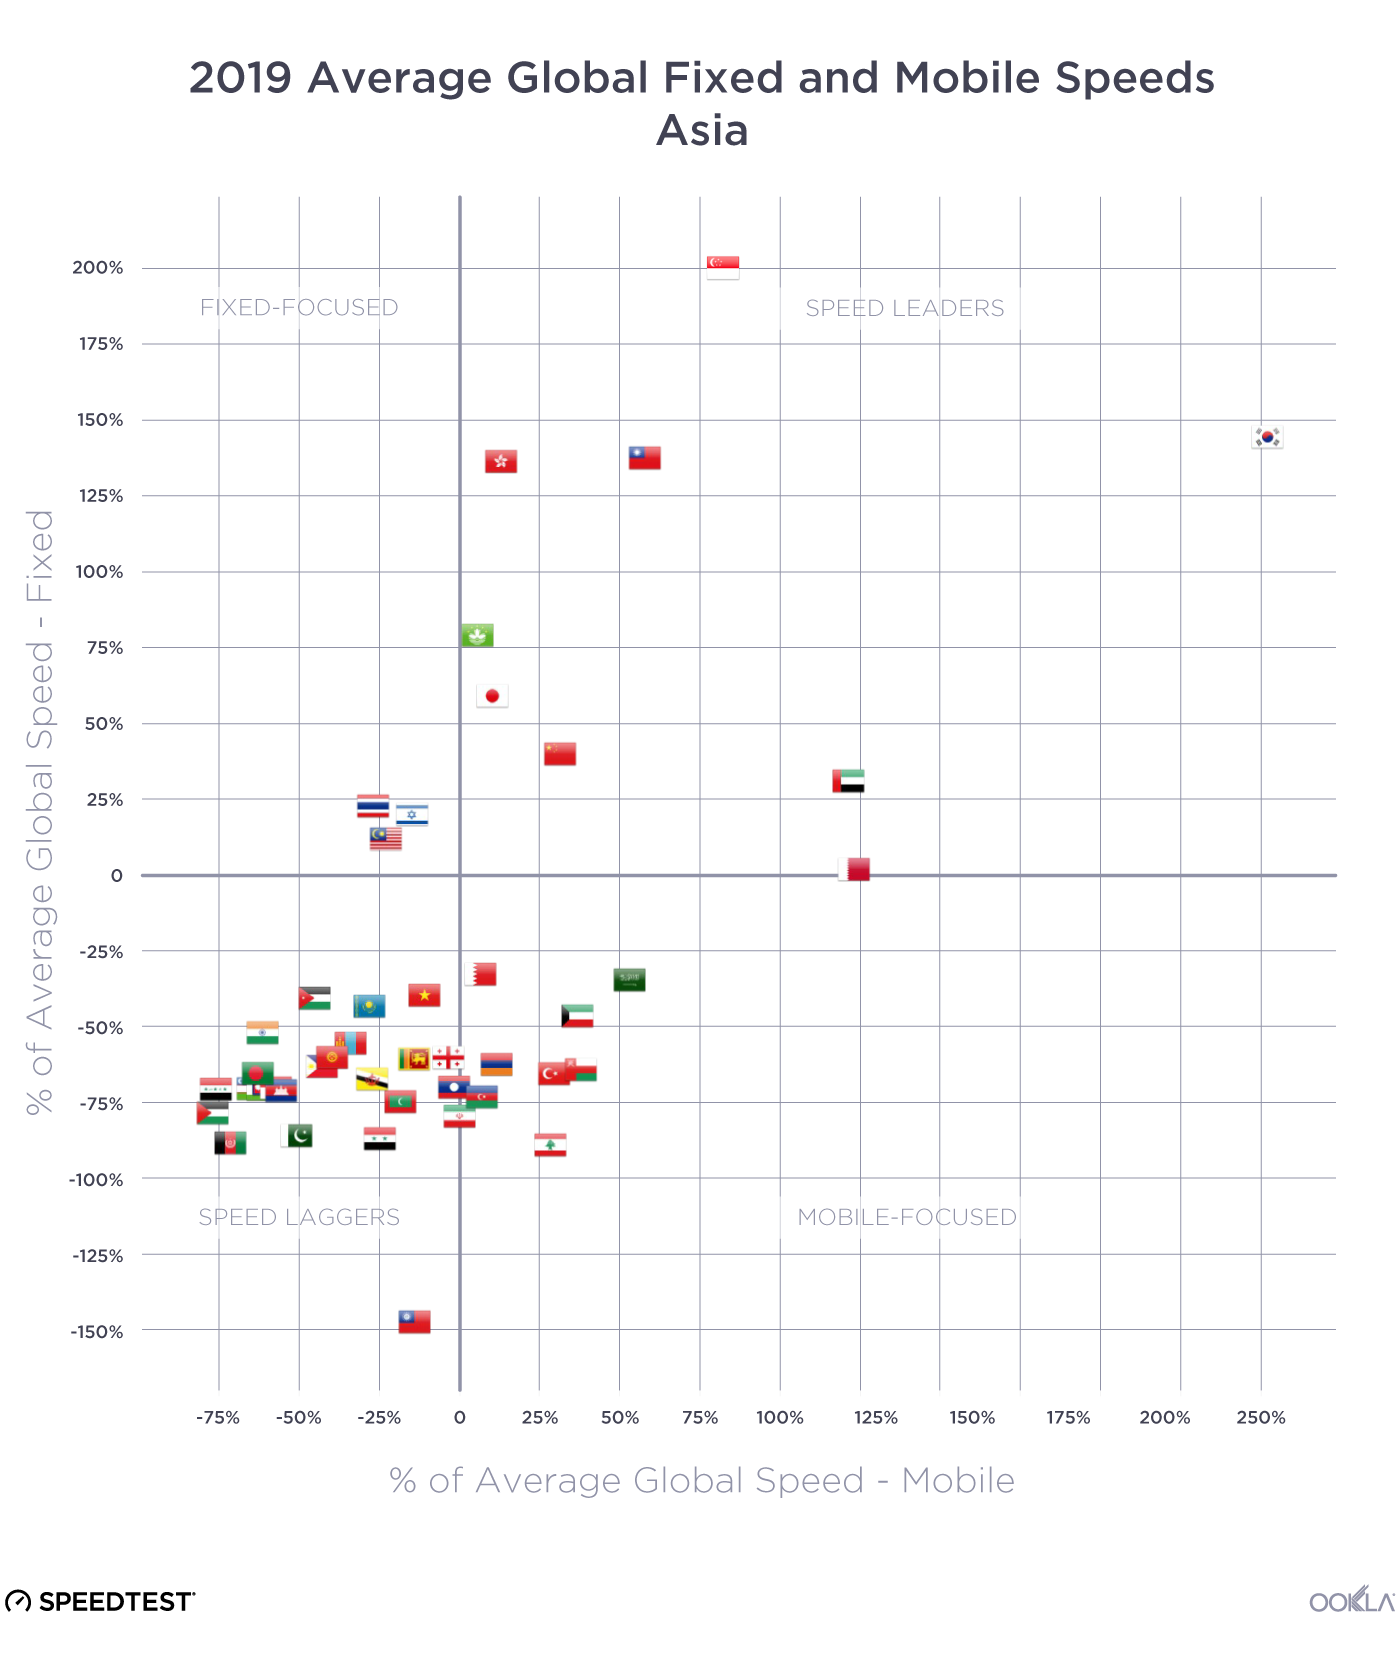
Getting the fast download speeds you need to do your daily tasks should be the least of your worries when you work abroad. Thailand had the fastest fixed broadband speeds among countries that have remote work visas with a median download speed of 196.20 Mbps and a median upload speed of 164.85 Mbps during Q1 2023. With speeds like those, you’ll be able to eat your Guay Teow while gaming, streaming multiple 4K videos, and uploading videos of your adventures with no issues (and you should be able to work, too).
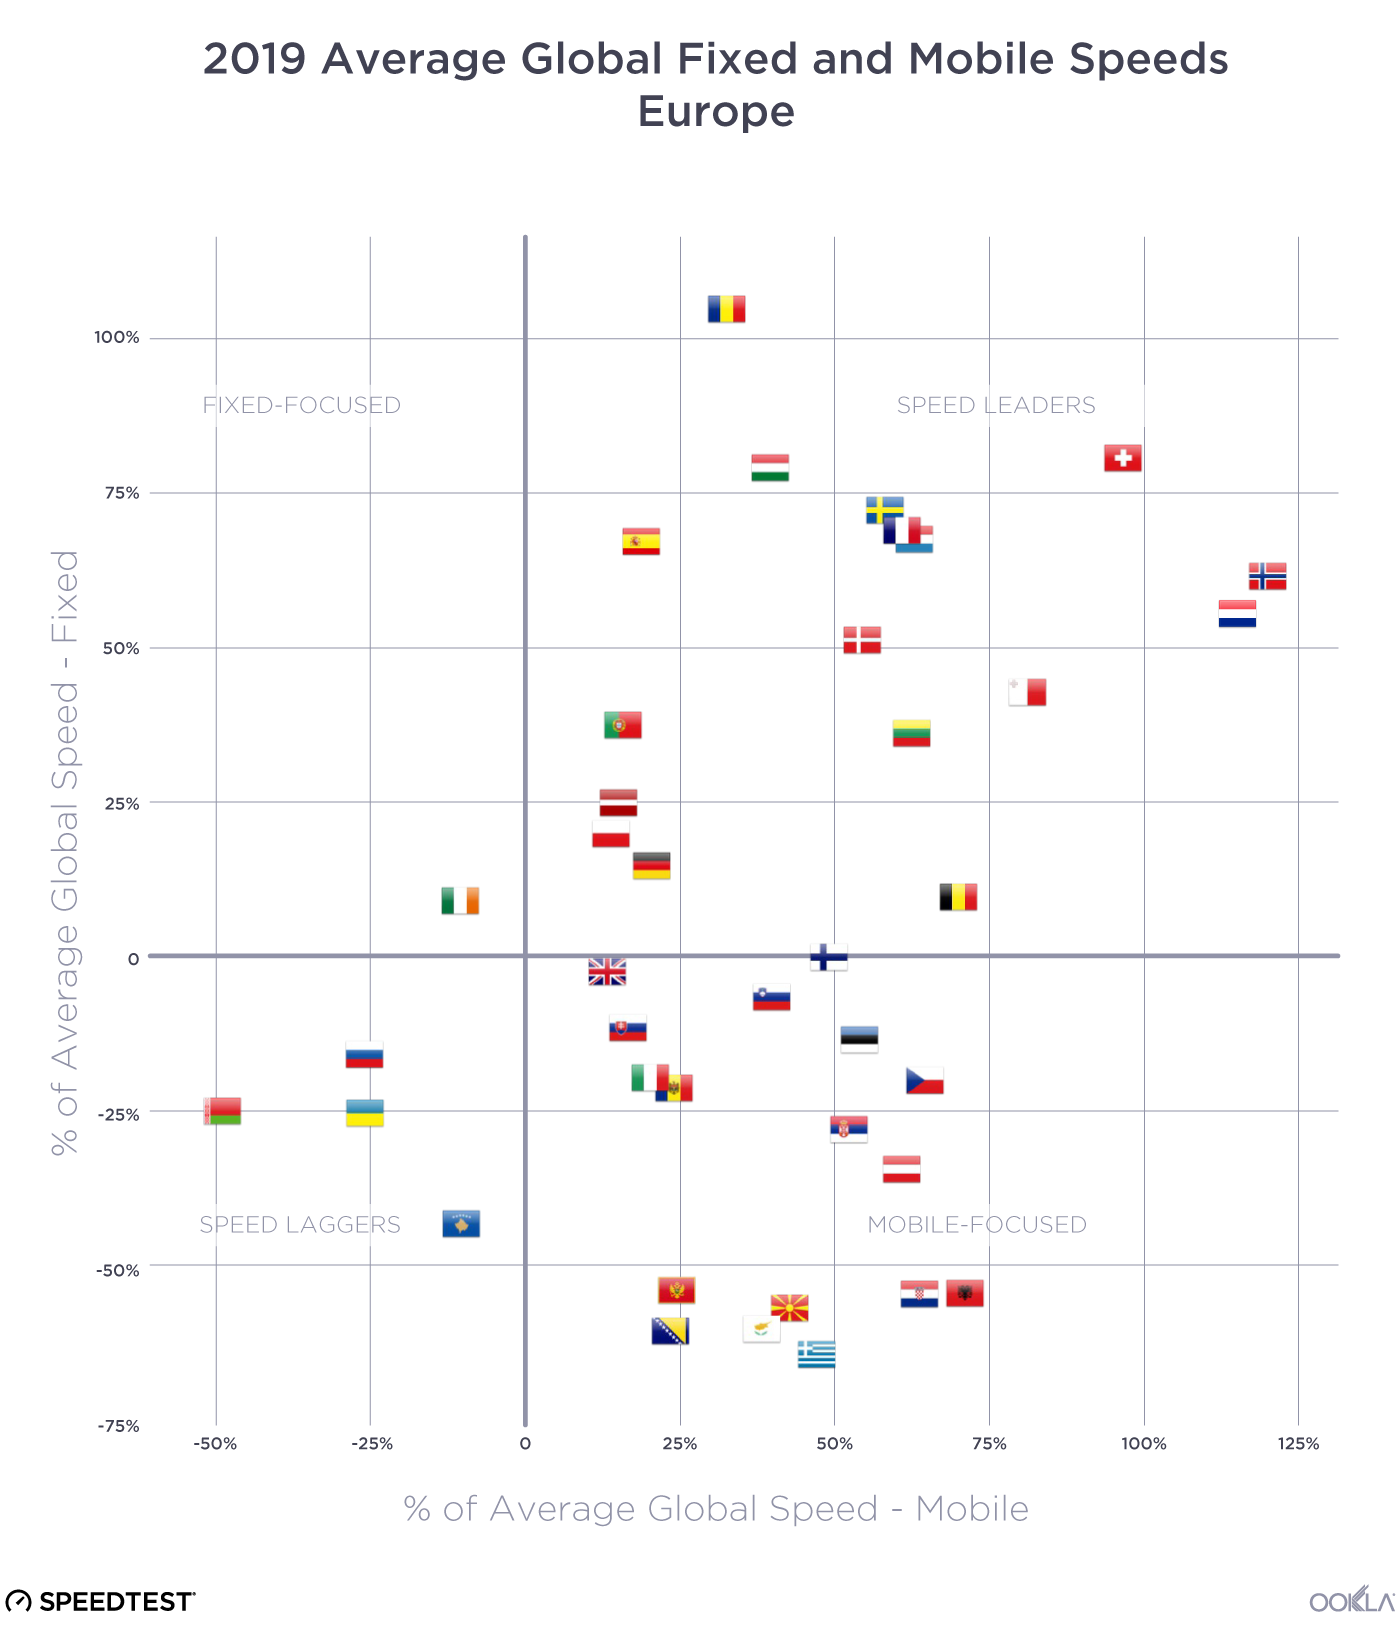
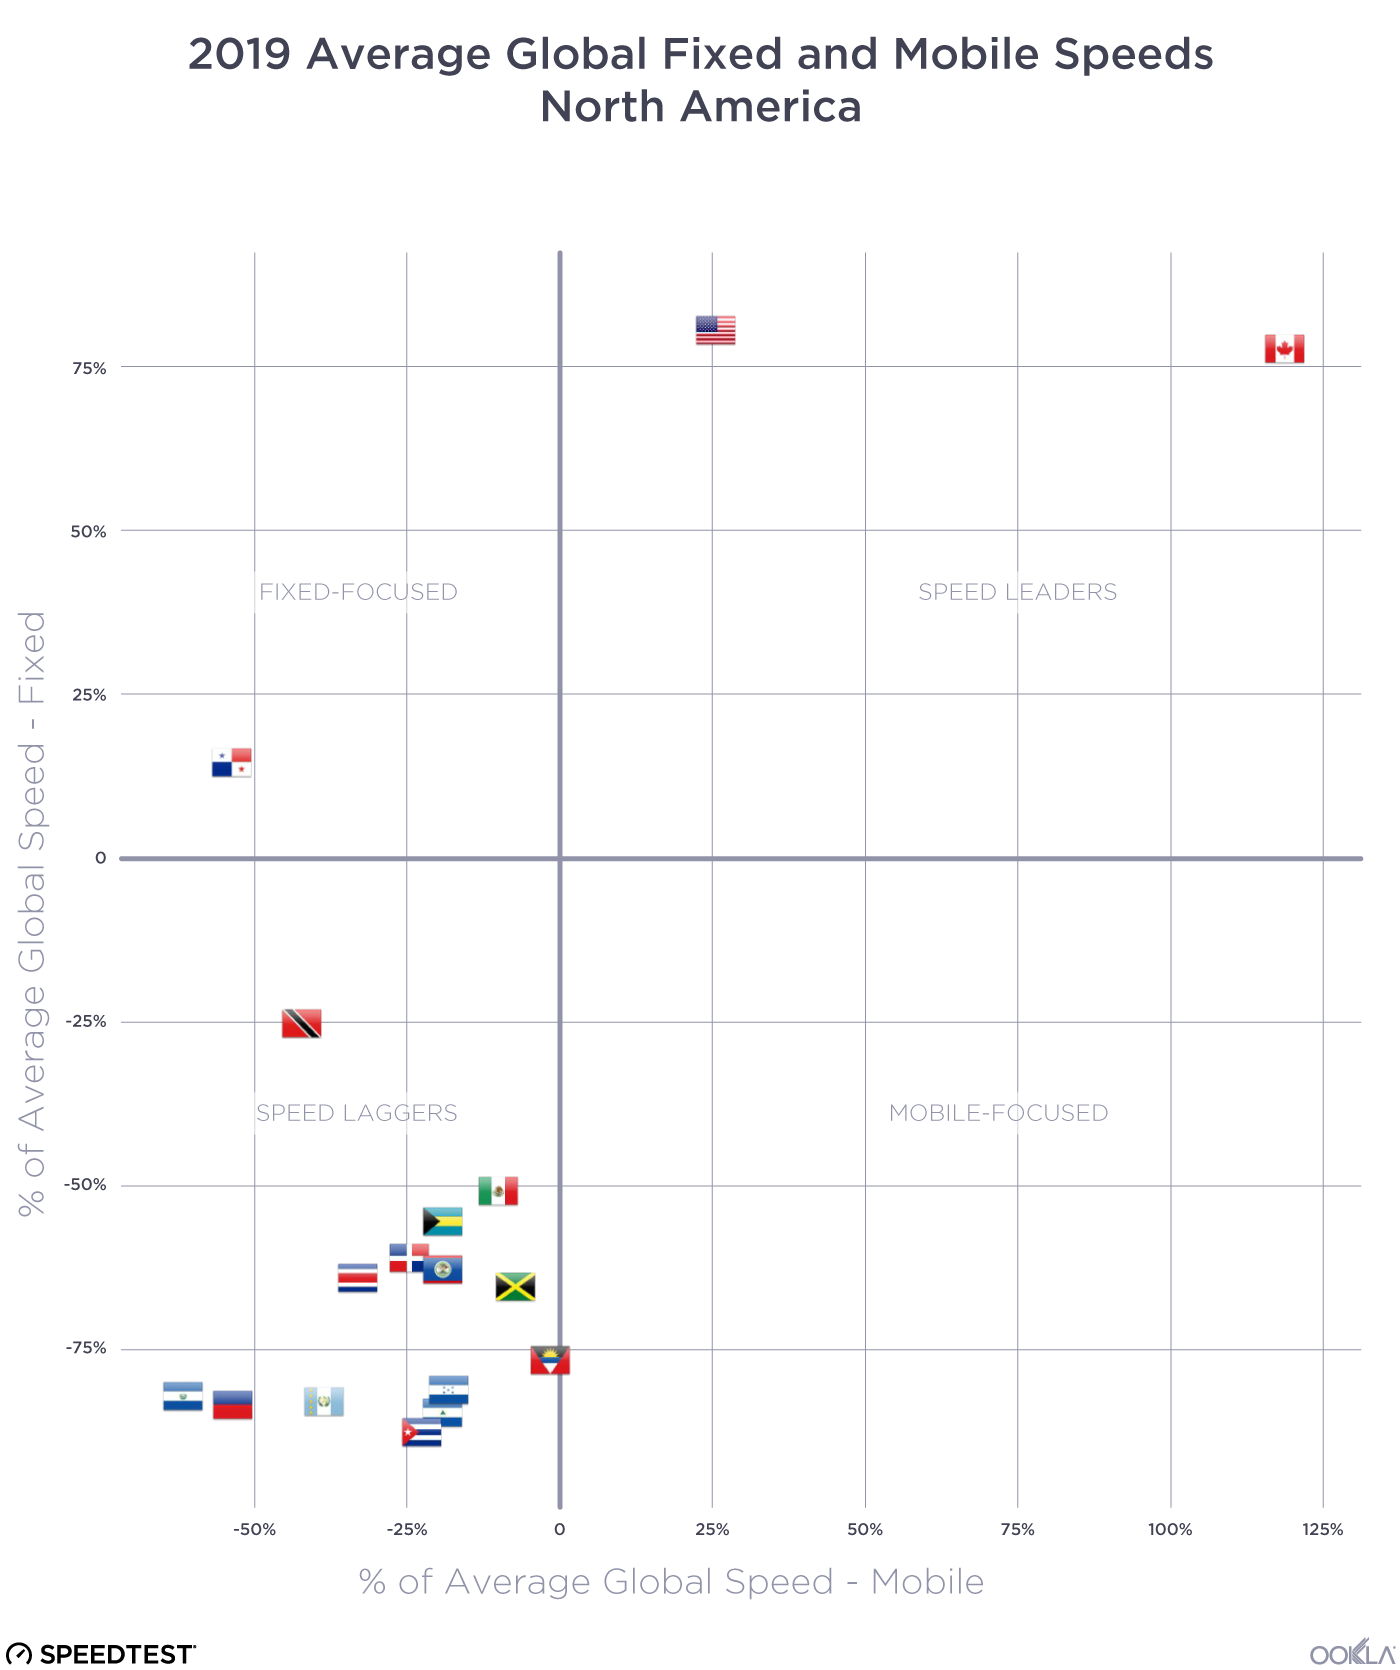
Spain (172.04 Mbps) and Romania (171.15 Mbps) were next on our list of fastest remote work destinations, followed by Hungary (134.43 Mbps), Portugal (128.50 Mbps), Taiwan (127.85 Mbps), Norway (111.44 Mbps), Panama (108.84 Mbps), and Brazil (100.38 Mbps), which all had median download speeds over 100 Mbps during Q1 2023. Rounding out our list of fastest remote work countries are Malta (97.55 Mbps) and Bermuda (97.20 Mbps). If speed is of the utmost importance to you while you work and live in another country, rest assured that these countries can handle the bandwidth you need.
Soak up the sun with fast internet in these beachy countries with remote work visas
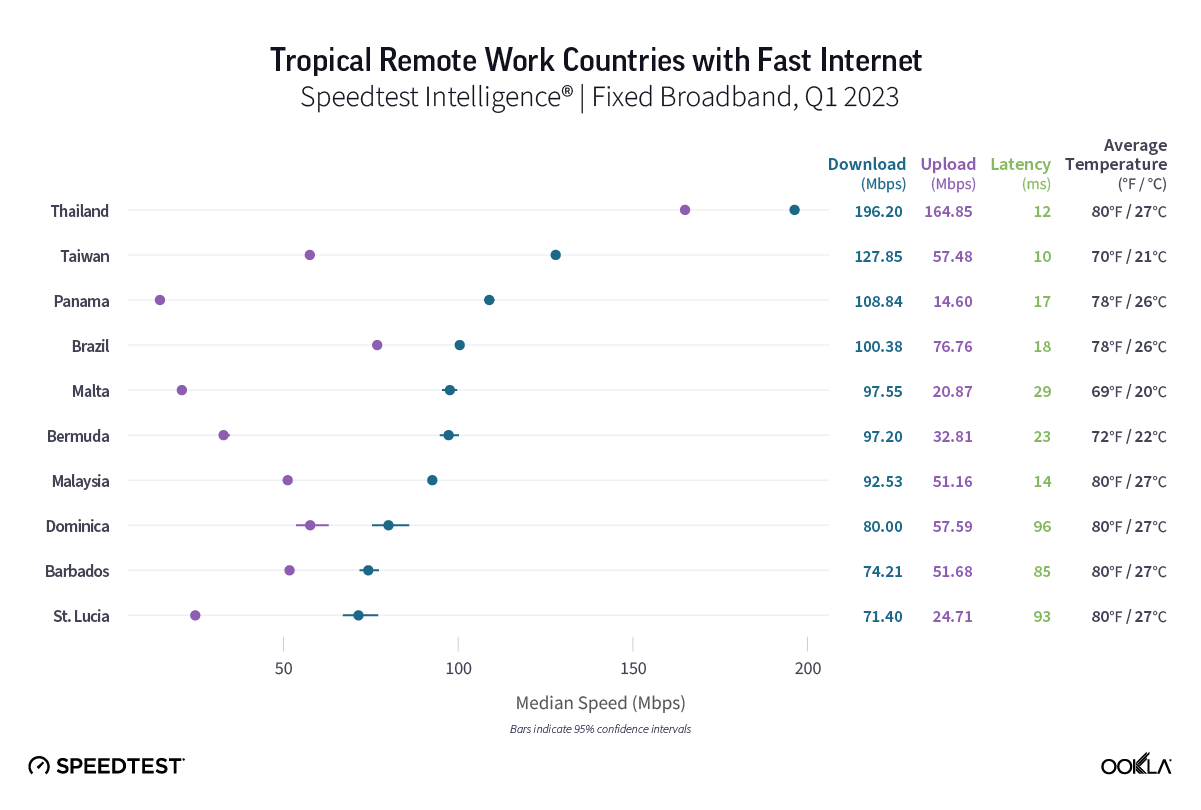
If you dream of a remote work escape and prefer tropical, sunny beaches where you can sip piña coladas, we’ve got you covered (though don’t forget your sunblock when you venture outside!) Twenty-seven countries have digital nomad visas, average temperatures above 65° F (roughly 18° C), and beach access. Unsurprisingly, Thailand, again takes the top spot with a median download speed of 196.20 Mbps, followed by Taiwan (127.85 Mbps), Panama (108.84 Mbps), Brazil (100.38 Mbps), Malta (97.55 Mbps), Bermuda (97.20 Mbps), Malaysia (92.53 Mbps), Dominica (80.00 Mbps), Barbados (74.21 Mbps), and St. Lucia (71.40 Mbps). Grenada (65.25 Mbps), Costa Rica (65.07 Mbps), and Montserrat (63.22 Mbps) followed closely behind the top 10.
If you choose to work remotely from one of these countries, we’ll be jealously awaiting you sharing your Speedtest® results on Twitter as you work from the beach, take a dip in the ocean during your break, and relax with a cool ocean breeze as your biggest worry in the world.
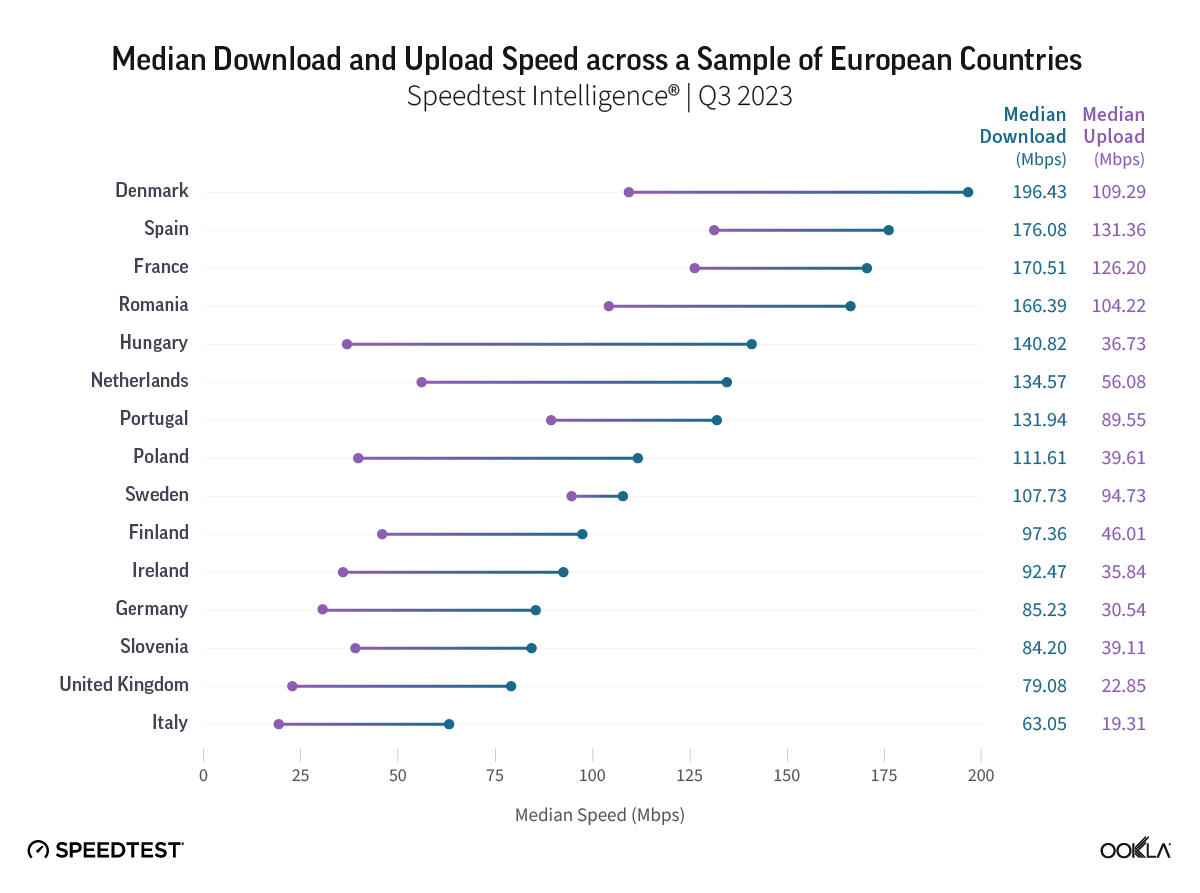
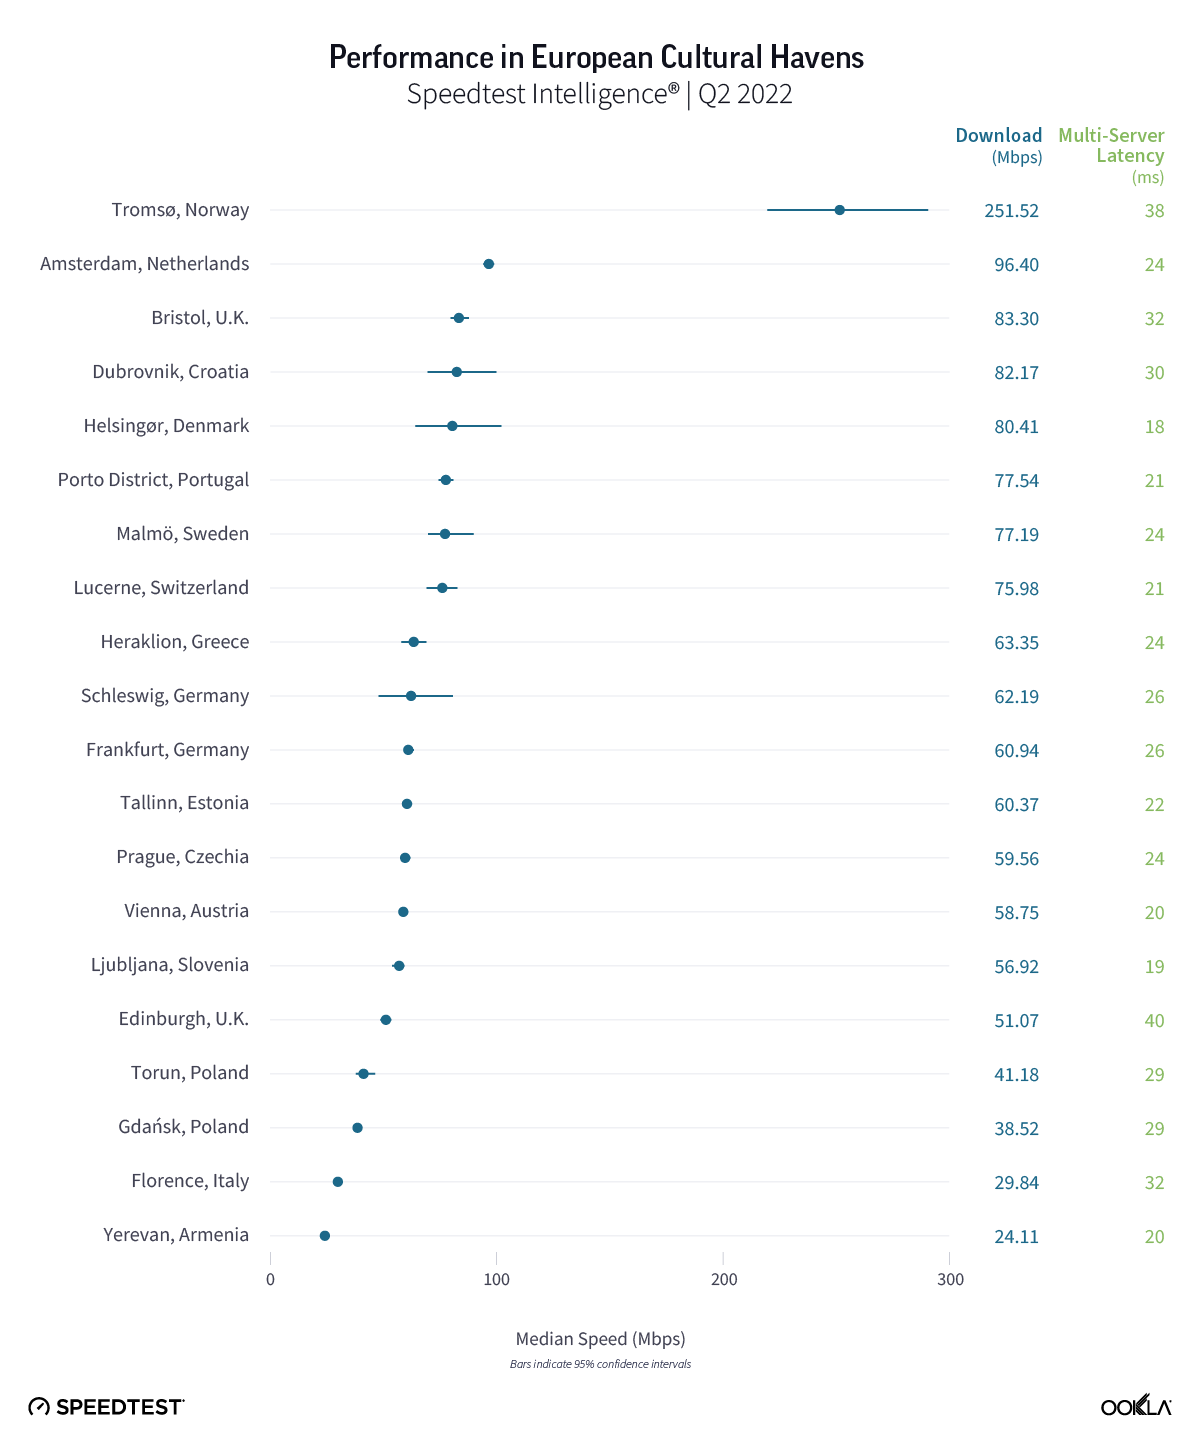
These European countries with remote work visas had the fastest internet speeds

Maybe you’ve been watching all the Eurovision or have been dreaming of jetting off to European locations every weekend. Luckily for you, 16 European countries offer some version of a remote work visa. Speedtest Intelligence data reveals that Spain had the fastest median download speed at 172.04 Mbps during Q1 2023. Romania, Hungary, Portugal, and Norway followed with median download speeds above 100 Mbps. Malta (97.55 Mbps), Germany (82.05 Mbps), Latvia (77.76 Mbps), Estonia (64.80 Mbps), and Czechia (55.97 Mbps) rounded out the top 10, with Cyprus (53.71 Mbps) coming up just behind. Regardless of which European country you choose, you’ll be a few hours away from multiple countries with plenty to do and eat!
10 remote work countries where you won’t lose your connection

You shouldn’t have to stress about your internet connection while you’re working abroad — especially if you have to video chat often. So we used Speedtest Intelligence data to examine the Consistency — calculated by the percentage of results showing at least a 25 Mbps download speed and 3 Mbps upload speed over fixed broadband — in countries with remote work visas during Q1 2023. While there was no statistically highest Consistency, Thailand had a Consistency of 89.8%, Romania 89.7%, and Taiwan 89.5%. Norway followed at 87.3%, then Malaysia, Brazil, Portugal, Hungary, Spain, and Bermuda rounding out the top 10. Rest assured if you choose one of these countries, you should be able to stream and video chat while you work. Just remember to mute that movie during your team call.
Seven affordable places with good internet for digital nomads on a budget
Internet speed and consistency are important for remote work — but they’re not everything when you’re deciding where you want to spend your next adventure. If you’re looking for an affordable location to spend your time, save some money, and get good internet, we’ve got you covered.
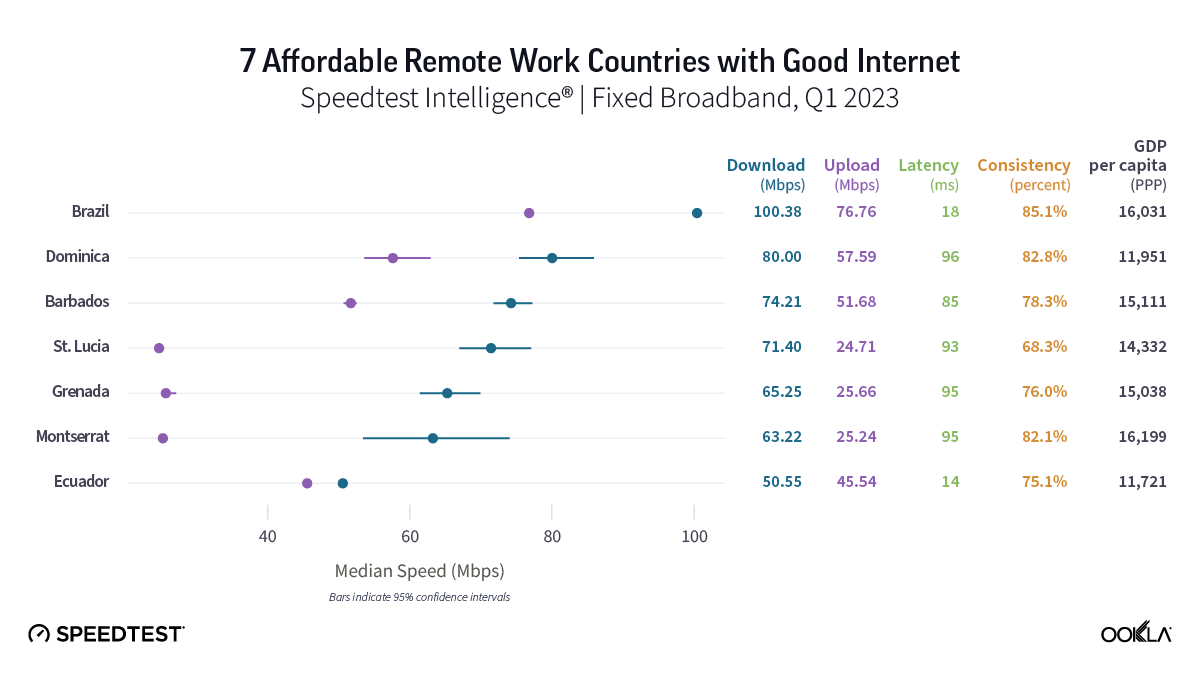
We used thresholds of 50 Mbps download, 10 Mbps upload, and under 100 ms latency to designate a country of having “good” internet — these speed thresholds are minimums to what should allow you to stream in 4K, video chat, and do most work-related tasks. The latency threshold number is high, but cheap, fast internet with super low latency is not common enough. We compared that list against World Bank data for GDP per capita (PPP) from 2021 which adjusts for cost of living, and narrowed down countries that have less than the world average of $18,607. Seven countries qualified for inclusion on our list based on those criteria: Barbados, Brazil, Dominica, Ecuador, Grenada, Montserrat, and St. Lucia.
Brazil had the fastest download speed at 100.38 Mbps on our affordable countries for remote work list, followed by Dominica (80.00 Mbps), Barbados (74.21 Mbps), St. Lucia (71.40 Mbps), Grenada (65.25 Mbps), Montserrat (63.22 Mbps), and Ecuador, which eked out a place on this list at 50.55 Mbps. Every country on this list had a median upload speed above 20 Mbps. All of the countries had a Consistency higher than 70%, except St. Lucia, which was just under at 68.3%. If latency, which causes the kind of lag that can make video calls frustrating, is a major concern, only Ecuador (14 ms) and Brazil (18 ms) had latencies under 20 ms.
Regardless of where you choose to work remotely among these seven countries, you should have access to internet that can keep you on top of what you need to do at work, while you save some cash, live well, and hit the beach, since all of these countries have average temperatures above 70° F (21°C). You might just have to brush up on your Spanish, Creole, Patois, or Portuguese to really get an immersive experience, but you should sleep easy knowing that you can live well and continue to work online.
What do you need to know before applying for a remote work visa?
Currently, there are 51 countries that offer some form of a remote work visa. The requirements for these visas vary widely across each country, but generally there are a few key things you’ll need to know before you choose a country to apply to.
First, you need to decide where you are going! Besides checking internet performance, you’ll want to research how long a remote visa can last, how much money you are going to have to earn to qualify, what costs you’ll be looking at, options to renew the visa, and what kind of fees you’ll need to pay along the way. At a minimum, you’ll need a passport.
You often can’t just show up and start working remotely; for a long-term stay, you’ll need to apply for a visa (along with any family members you might want to bring along). Approval isn’t straightforward — you may need to prove your income, translate documents, get documents notarized, and even make a minimum amount of money each month. Once approved, you’ll typically pay a fee for each family member you are bringing, and you should make certain if you have any additional fees or taxes you’ll be liable to pay throughout your stay.
Once you have your visa in order, you’ll need to figure out your living situation — whether that is something longer term, or moving around a country, you’ll want to keep any requirements of your visa up to date. Do your due diligence while you apply so you don’t find yourself in an unpredictable situation you could have avoided.
Ookla has the resources you need to plan your remote work trip
We hope this short guide will help you choose the right remote work experience to help you feel fulfilled. If you want to learn more about the internet experience in any of the countries we mentioned, or even find city data or internet provider data for your remote work journey, check out the Speedtest Performance Directory™. If you’re struggling to find a decent internet provider in your area, check out our satellite internet series to see if there is a fast satellite internet connection available. And don’t forget to download the Speedtest app for Mac, Windows, or Linux to make sure you’re getting the speeds you need to continue working remotely!
Interested in what Ookla is doing? We offer fully remote positions around the world, so check out if there is an open role for you!
Ookla retains ownership of this article including all of the intellectual property rights, data, content graphs and analysis. This article may not be quoted, reproduced, distributed or published for any commercial purpose without prior consent. Members of the press and others using the findings in this article for non-commercial purposes are welcome to publicly share and link to report information with attribution to Ookla.