| August 17, 2022

The World Bank Uses Ookla Data to Examine Digital Infrastructure in Latin American Countries

Adherence to public health measures like non-pharmaceutical interventions (NPIs) were found to play a crucial role in protecting communities from the spread of COVID-19. A team of World Bank academics analyzed Ookla® Speedtest Intelligence® data alongside other publicly-available data to explore the role of digital infrastructure in NPIs compliance during the pandemic in their new report: “The adoption of non-pharmaceutical interventions and the role of digital infrastructure during the COVID-19 Pandemic in Colombia, Ecuador, and El Salvador.”

Highlights from the report:

  • Adherence to NPIs correlates with socioeconomic factors: It’s been established that disadvantaged communities struggled to implement movement restriction measures during the acute phases of the pandemic. These radically changed many people’s lives, but disadvantaged communities (both in low- and high-income countries) were disproportionately affected, most likely due to limitations in how people in those communities would be able to stay at home for jobs, school, etc.
  • Movement reduction: The research conducted in this report finds that NPIs implemented in Colombia, Ecuador, and El Salvador during 2020 caused a significant drop in movements during 2020. These drops from pre-pandemic baselines were 53% in Colombia and 64% in both Ecuador and El Salvador.
  • Connections between movement reduction and digital infrastructure: Furthermore, the research found that for every 10 Mbps increase in average fixed download speed, movement reduction increases by 13% in Colombia, 4% in Ecuador, and 19% in El Salvador.
  • Digital infrastructure, socioeconomic status, and movement reduction: These findings also may correlate with higher socioeconomic status supported by the fact that mobility reductions were more pronounced in larger, denser, and wealthier municipalities.
  • Further steps: This research shows that there is a significant association between the quality of digital infrastructure and adoption of NPIs, even after controlling for socioeconomic indicators. Due to the disproportionate gap between low-income and wealthier areas, action should be taken for policies and targeted investments aimed at “closing the digital gap, improving network reliability as well as equality across communities.”

We would like to thank Nicolò Gozzi, Niccolò Comini, and Nicola Perra for their work on this project.

Read the World Bank's Announcement Button

Ookla joined the World Bank’s Development Data Partnership platform over two years ago as part of our Ookla for GoodTM initiative. We are thankful to them, alongside the many other organizations we partner with to improve the state of internet performance around the world. Learn more about Ookla for Good.

Ookla retains ownership of this article including all of the intellectual property rights, data, content graphs and analysis. This article may not be quoted, reproduced, distributed or published for any commercial purpose without prior consent. Members of the press and others using the findings in this article for non-commercial purposes are welcome to publicly share and link to report information with attribution to Ookla.

| December 20, 2021

Growing and Slowing: The State of 5G Worldwide in 2021


5G continues to offer new and exciting ways of rethinking everything from streaming video to performing remote surgery. However, not everyone shares equally in these possibilities as many countries do not have access to 5G and even those that do, do not experience the same level of performance from their 5G connections. We examined Speedtest Intelligence® data from Q3 2021 Speedtest® results to see how 5G speeds have changed, where download speeds are the fastest at the country and capital level, where 5G deployments have increased and what worldwide 5G Availability looked like in Q3 2021. We also looked at countries that don’t yet have 5G to understand where consumers are seeing improvements in 4G access.

5G slowed down at the global level

Median-Speeds-Worldwide_1221-01

It’s common to see new mobile access technologies slow down as adoption scales, particularly early on in the tech cycle. Over the past year from Q3 2020 to Q3 2021, the median global 5G download speed fell to 166.13 Mbps, down from 206.22 Mbps in Q3 2020. Median upload speed over 5G also slowed to 21.08 Mbps (from 29.52 Mbps) during the same period.

More users are logging on to existing 5G networks, and we’re also at the stage in the evolution of 5G where countries that have historically had slower speeds are starting to offer 5G. In addition, the widespread use of dynamic spectrum sharing that has been used to boost early 5G coverage weighs on 5G download speeds. While the dip in speeds looks like a letdown, it’s more of a compromise to enable broader access. With additional spectrum and further deployments slated for 2022, we anticipate speeds will begin to pick up again.

South Korea had the fastest 5G in the world

ookla_5g-download_performance_countries_1221-01-1

South Korea had the fastest median download speed over 5G during Q3 2021, leading a top 10 list that included Norway, United Arab Emirates, Saudi Arabia, Qatar, Kuwait, Sweden, China, Taiwan and New Zealand. Sweden, China, Taiwan and New Zealand were new to the top 10 in 2021 while South Africa (whose 5G was brand new last year), Spain and Hungary fell out of the top 10.

5G expanded to 13 additional countries

ookla_5G-map_1221-01

According to the Ookla® 5G Map, there were 5G deployments in 112 countries as of November 30, 2021. That’s up from 99 countries on the same date a year ago. The total number of deployments increased dramatically during the same time period with 85,602 deployments on November 30, 2021 compared to 17,428 on November 30, 2020, highlighting the degree to which 5G networks scaled during the year. Note that there are often multiple deployments in a given city.

Seoul and Oslo lead world capitals for 5G

ookla_5g-download_performance_capitals_1221-01

Speedtest Intelligence data from Q3 2021 shows a wide range of median 5G speeds among global capitals. Seoul, South Korea and Oslo, Norway were in the lead with 530.83 Mbps and 513.08 Mbps, respectively; Abu Dhabi, United Arab Emirates; Riyadh, Saudi Arabia and Doha Qatar followed. Brasilia, Brazil had the slowest median download speed over 5G on our list, followed by Warsaw, Poland; Cape Town, South Africa and Rome, Italy. Stockholm, Sweden and Oslo, Norway had some of the the fastest median upload speeds over 5G at 56.26 Mbps and 49.95 Mbps, respectively, while Cape Town had the slowest at 14.53 Mbps.

The U.S. had the highest 5G Availability

The presence of 5G is only one indicator in a market, because even in markets where 5G has launched, coverage and adoption can be pretty low. We analyzed 5G Availability to see what percent of users on 5G-capable devices spent the majority of their time on 5G, both roaming and on-network during Q3 2021.

ookla_5g-availability_countries_1221-01

The United States had the highest 5G Availability at 49.2%, followed by the Netherlands (45.1%), South Korea (43.8%), Kuwait (35.5%) and Qatar (34.8%). Brazil had the lowest 5G Availability on our list at 0.8%, followed by Sweden (1.5%), South Africa (2.7%), New Zealand (2.9%) and Hungary (3.6%).

Not all 5G networks are created equal

Ookla Speedtest Intelligence data shows a growing disparity in the performance of 5G networks worldwide, even among the pioneer markets who were among the first to launch the new technology. We see leading markets such as South Korea, Norway, the UAE and China pulling well ahead of key European markets, the U.S. and Japan on 5G download speeds, creating what increasingly looks like two tiers of 5G markets.

ookla_5g-download_performance_1221-01

Part of the reason for this divergence is access to key 5G spectrum bands, with Verizon and AT&T in the U.S. for example, soon to deploy their C-band spectrum holdings for 5G use. However, what really seems to separate these markets is the level of 5G network densification. The number of people per 5G base station ranges from 319 in South Korea and 1,531 in China, to 4,224 in the EU and 6,590 in the US, according to the European 5G Observatory’s International Scoreboard during October 2021.

Despite the noise around 6G, 5G still has a long way to run

Median 5G mobile download speeds across these markets are respectable relative to the International Telecommunication Union’s (ITU) IMT-2020 target of 100 Mbps for user experienced download data rates. However, 5G Speedtest® results in each market demonstrate significant variability, with the bottom 10th percentile only recording speeds in excess of the IMT-2020 target in South Korea and Norway, and falling significantly short in many other markets, with Spain, Italy and the U.S. below 20 Mbps.

The story gets worse for upload speeds, where no market’s median speed broke the IMT-2020 recommended 50 Mbps, and where the bottom 10th percentile lay in single digits across the board. Operators are clearly prioritizing download speeds over upload, which makes sense given the asymmetric nature of demand, with most consumer applications requiring higher download speeds. However, as operators increasingly look to target the enterprise market with 5G connectivity and consumer demand for services such as video calling and mobile gaming continues to rise, operators will need to boost upload speeds.

ookla_5g-upload_performance_1221-01-1

Demand for mobile internet bandwidth continues to grow, up 43% year-on-year in Q3 2021 according to Ericsson’s latest mobility report. Looking ahead to 2022, operators will need to increase the capacity of their 5G networks to tackle this growing demand while driving network speeds to new heights. We’ve seen the impact the deployment of new spectrum can have on congested networks during 2021, with Reliance Jio witnessing a bump in 4G LTE performance and consumer sentiment following its acquisition of additional spectrum in India.

Where 5G still fails to reach

Speedtest Intelligence showed 70 countries in the world where more than 20% of samples were from 2G and 3G connections (combined) during Q3 2021 and met our statistical threshold to be included. These are mostly countries where 5G is still aspirational for a majority of the population. As excited as we are about the expansion of 5G, we do not want to see these countries left behind. Not only are 2G and 3G decades old, they are only sufficient for basic voice and texting, social media and navigation apps. To deliver rich media experiences or video calling, users need access to 4G or higher. Having so many consumers on 2G and 3G also prevents mobile operators from refarming that spectrum to make 4G and 5G networks more efficient.

Countries That Still Rely Heavily on 2G and 3G Connections
Speedtest IntelligenceⓇ | Q3 2021
Country 2G & 3G Samples
Central African Republic 89.9%
Palestine 84.7%
Yemen 72.4%
Turkmenistan 71.8%
Micronesia 56.3%
Madagascar 55.0%
Belarus 53.2%
Rwanda 51.7%
Kiribati 48.4%
Equatorial Guinea 47.6%
Afghanistan 44.4%
South Sudan 43.4%
Guyana 42.3%
Guinea 37.0%
Angola 36.8%
Cape Verde 35.9%
Tajikistan 35.6%
Zimbabwe 34.7%
Benin 34.4%
Togo 33.8%
Ghana 33.0%
Sierra Leone 31.7%
Antigua and Barbuda 30.2%
Vanuatu 30.1%
Lesotho 30.0%
Syria 29.6%
Moldova 29.4%
Saint Kitts and Nevis 28.9%
Mozambique 28.8%
Sudan 28.4%
Palau 28.3%
Grenada 28.1%
Tanzania 27.6%
Uganda 27.5%
Niger 27.5%
Gabon 27.5%
Haiti 27.4%
Suriname 27.4%
Tonga 27.3%
Liberia 27.0%
Namibia 26.7%
Swaziland 26.5%
The Gambia 26.3%
Saint Vincent and the Grenadines 26.3%
Dominica 26.3%
Somalia 26.1%
Cook Islands 26.0%
Zambia 25.9%
Barbados 25.7%
Armenia 25.5%
Algeria 25.4%
Papua New Guinea 25.2%
Jamaica 24.5%
Venezuela 24.2%
Ethiopia 24.1%
Uzbekistan 24.0%
El Salvador 23.5%
Honduras 23.1%
Nigeria 23.0%
Solomon Islands 22.8%
Caribbean Netherlands 22.7%
Botswana 22.3%
Anguilla 21.7%
Mauritania 20.6%
Saint Lucia 20.5%
Bosnia and Herzegovina 20.3%
Burundi 20.3%
Ecuador 20.2%
Ukraine 20.1%
Trinidad and Tobago 20.0%

We were pleased to see the following countries come off the list from last year, having dropped below the 20% threshold: Azerbaijan, Bangladesh, Belize, Burkina Faso, Cameroon, Costa Rica, Côte d’Ivoire, DR Congo, Iraq, Kenya, Laos, Libya, Maldives, Mali, Mauritius, Mongolia, Nicaragua, Paraguay and Tunisia. While countries like Palestine, Suriname, Ethiopia, Haiti and Antigua and Barbuda are still on this list, they have improved the percentage of their samples on these outmoded technologies when compared to last year (dropping 10-15 points, respectively), 2G and 3G samples in Belarus increased 6.7 points when comparing Q3 2021 to Q3 2020.

We’re excited to see how performance levels will normalize as 5G expands to more and more countries and access improves. Keep track of how well your country is performing on Ookla’s Speedtest Global Index.

Ookla retains ownership of this article including all of the intellectual property rights, data, content graphs and analysis. This article may not be quoted, reproduced, distributed or published for any commercial purpose without prior consent. Members of the press and others using the findings in this article for non-commercial purposes are welcome to publicly share and link to report information with attribution to Ookla.

| December 10, 2020

Massive Expansions and Huge Improvements in Speed: The Worldwide Growth of 5G in 2020

The rapid expansion of 5G in countries across the globe was a bright spot in a year that needed one. But just how great is the news? We examined Speedtest Intelligence® data from over 60.5 million Speedtest® results during Q3 2020 to see how much speeds have improved, where download speeds are the fastest at the country and capital level, where 5G deployments have increased and what worldwide 5G coverage looks like now. We also looked at countries where 5G doesn’t yet reach to understand where good news might be on the horizon.

We have only included countries with commercially available 5G on these lists in order to provide a more accurate view of the performance consumers can reasonably expect. While our data shows results for many countries where 5G is not yet commercially available, these tests are likely results from engineers testing their own networks. In addition, we’re only providing analysis for countries with more than 200 samples during Q3 2020. The bars shown in our charts are 95% confidence intervals, which represent the range of values in which the true value is likely to be. Countries marked in tables with an asterisk first launched 5G commercially in 2020.

5G downloads were 954% faster than 4G at the global level

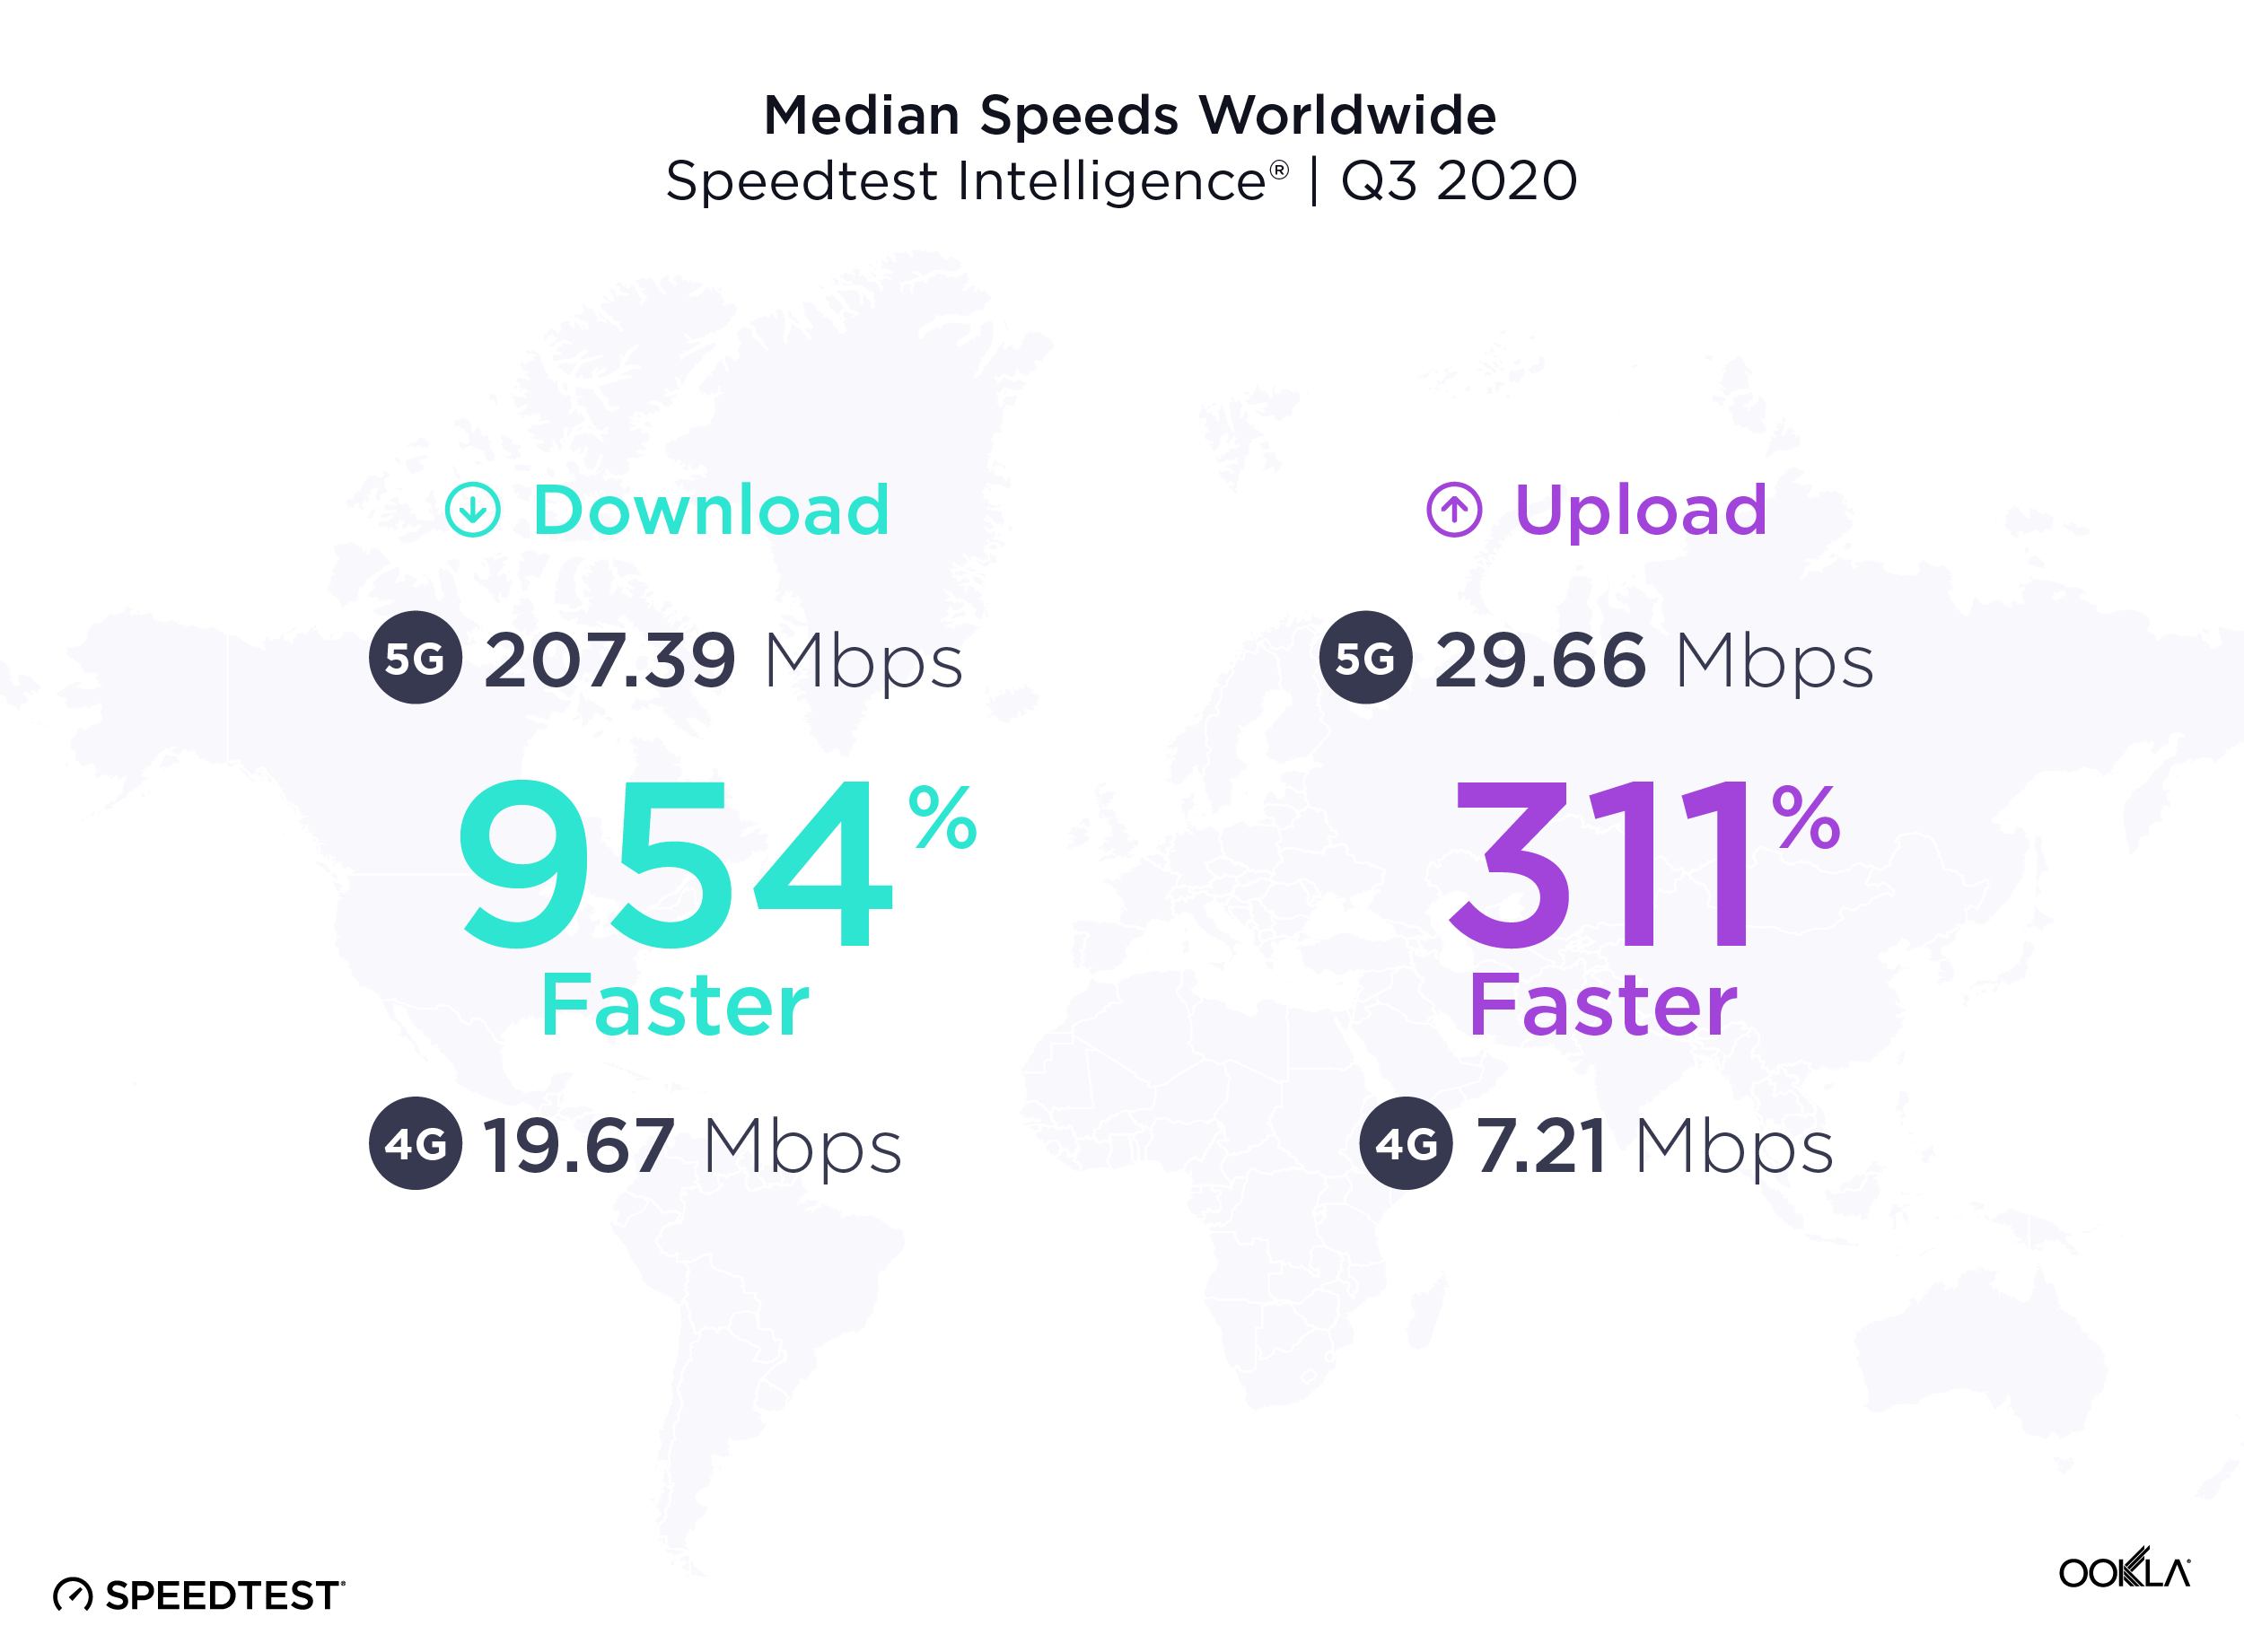
The worldwide median download speed over 5G was 954% faster than that over 4G during Q3 2020. Median upload speed over 5G was 311% faster than that over 4G. Consumers are eagerly adopting the new technology and many have wanted to measure the full throughput capacity of their network connection. In Q3 2020 alone, there were 4,324,788 Speedtest results over 5G.
Median-Speeds-Worldwide_1220-1

United Arab Emirates had the fastest 5G

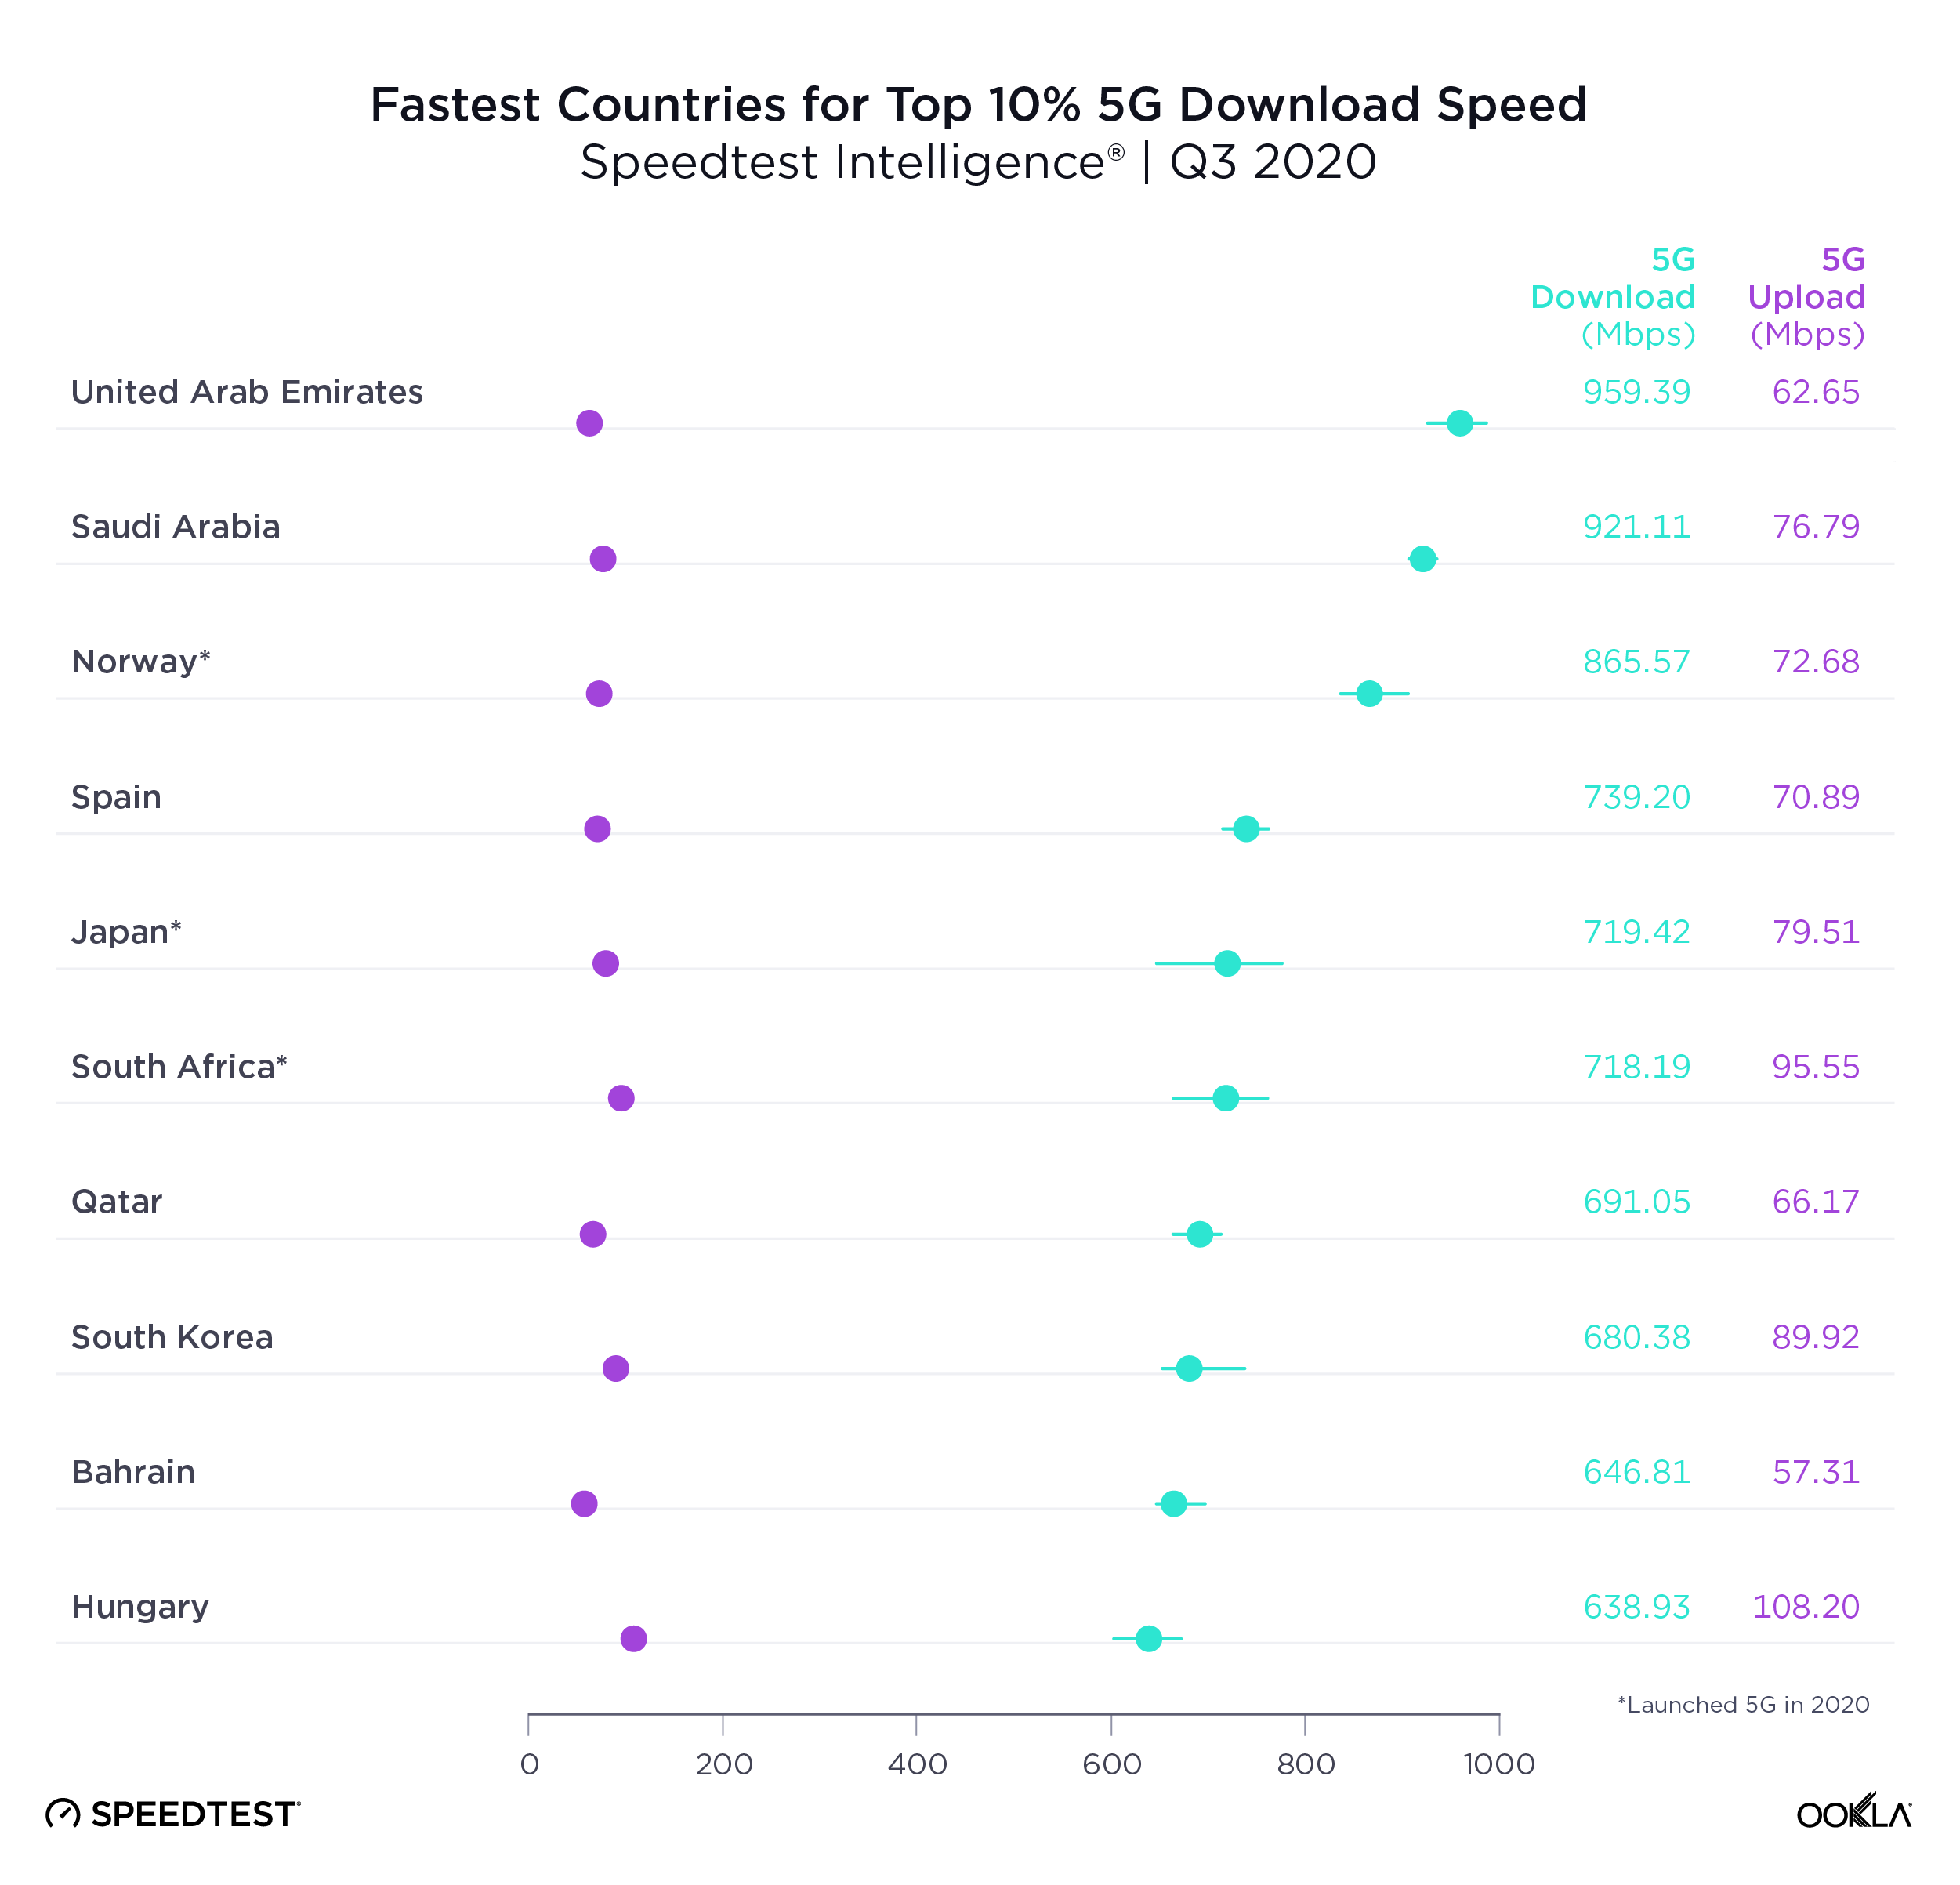
United Arab Emirates topped the list of countries with the fastest top 10% 5G download speed in Q3 2020. Top 10% (or 90th percentile) measures the speeds seen by the fastest 10% of users and is a way to gauge what each country’s networks are capable of. Saudi Arabia was second for top 10% 5G download speed, Norway third, Spain fourth and Japan fifth.
Fastest-Countries-Top-5G-Download-Speed_1220-2

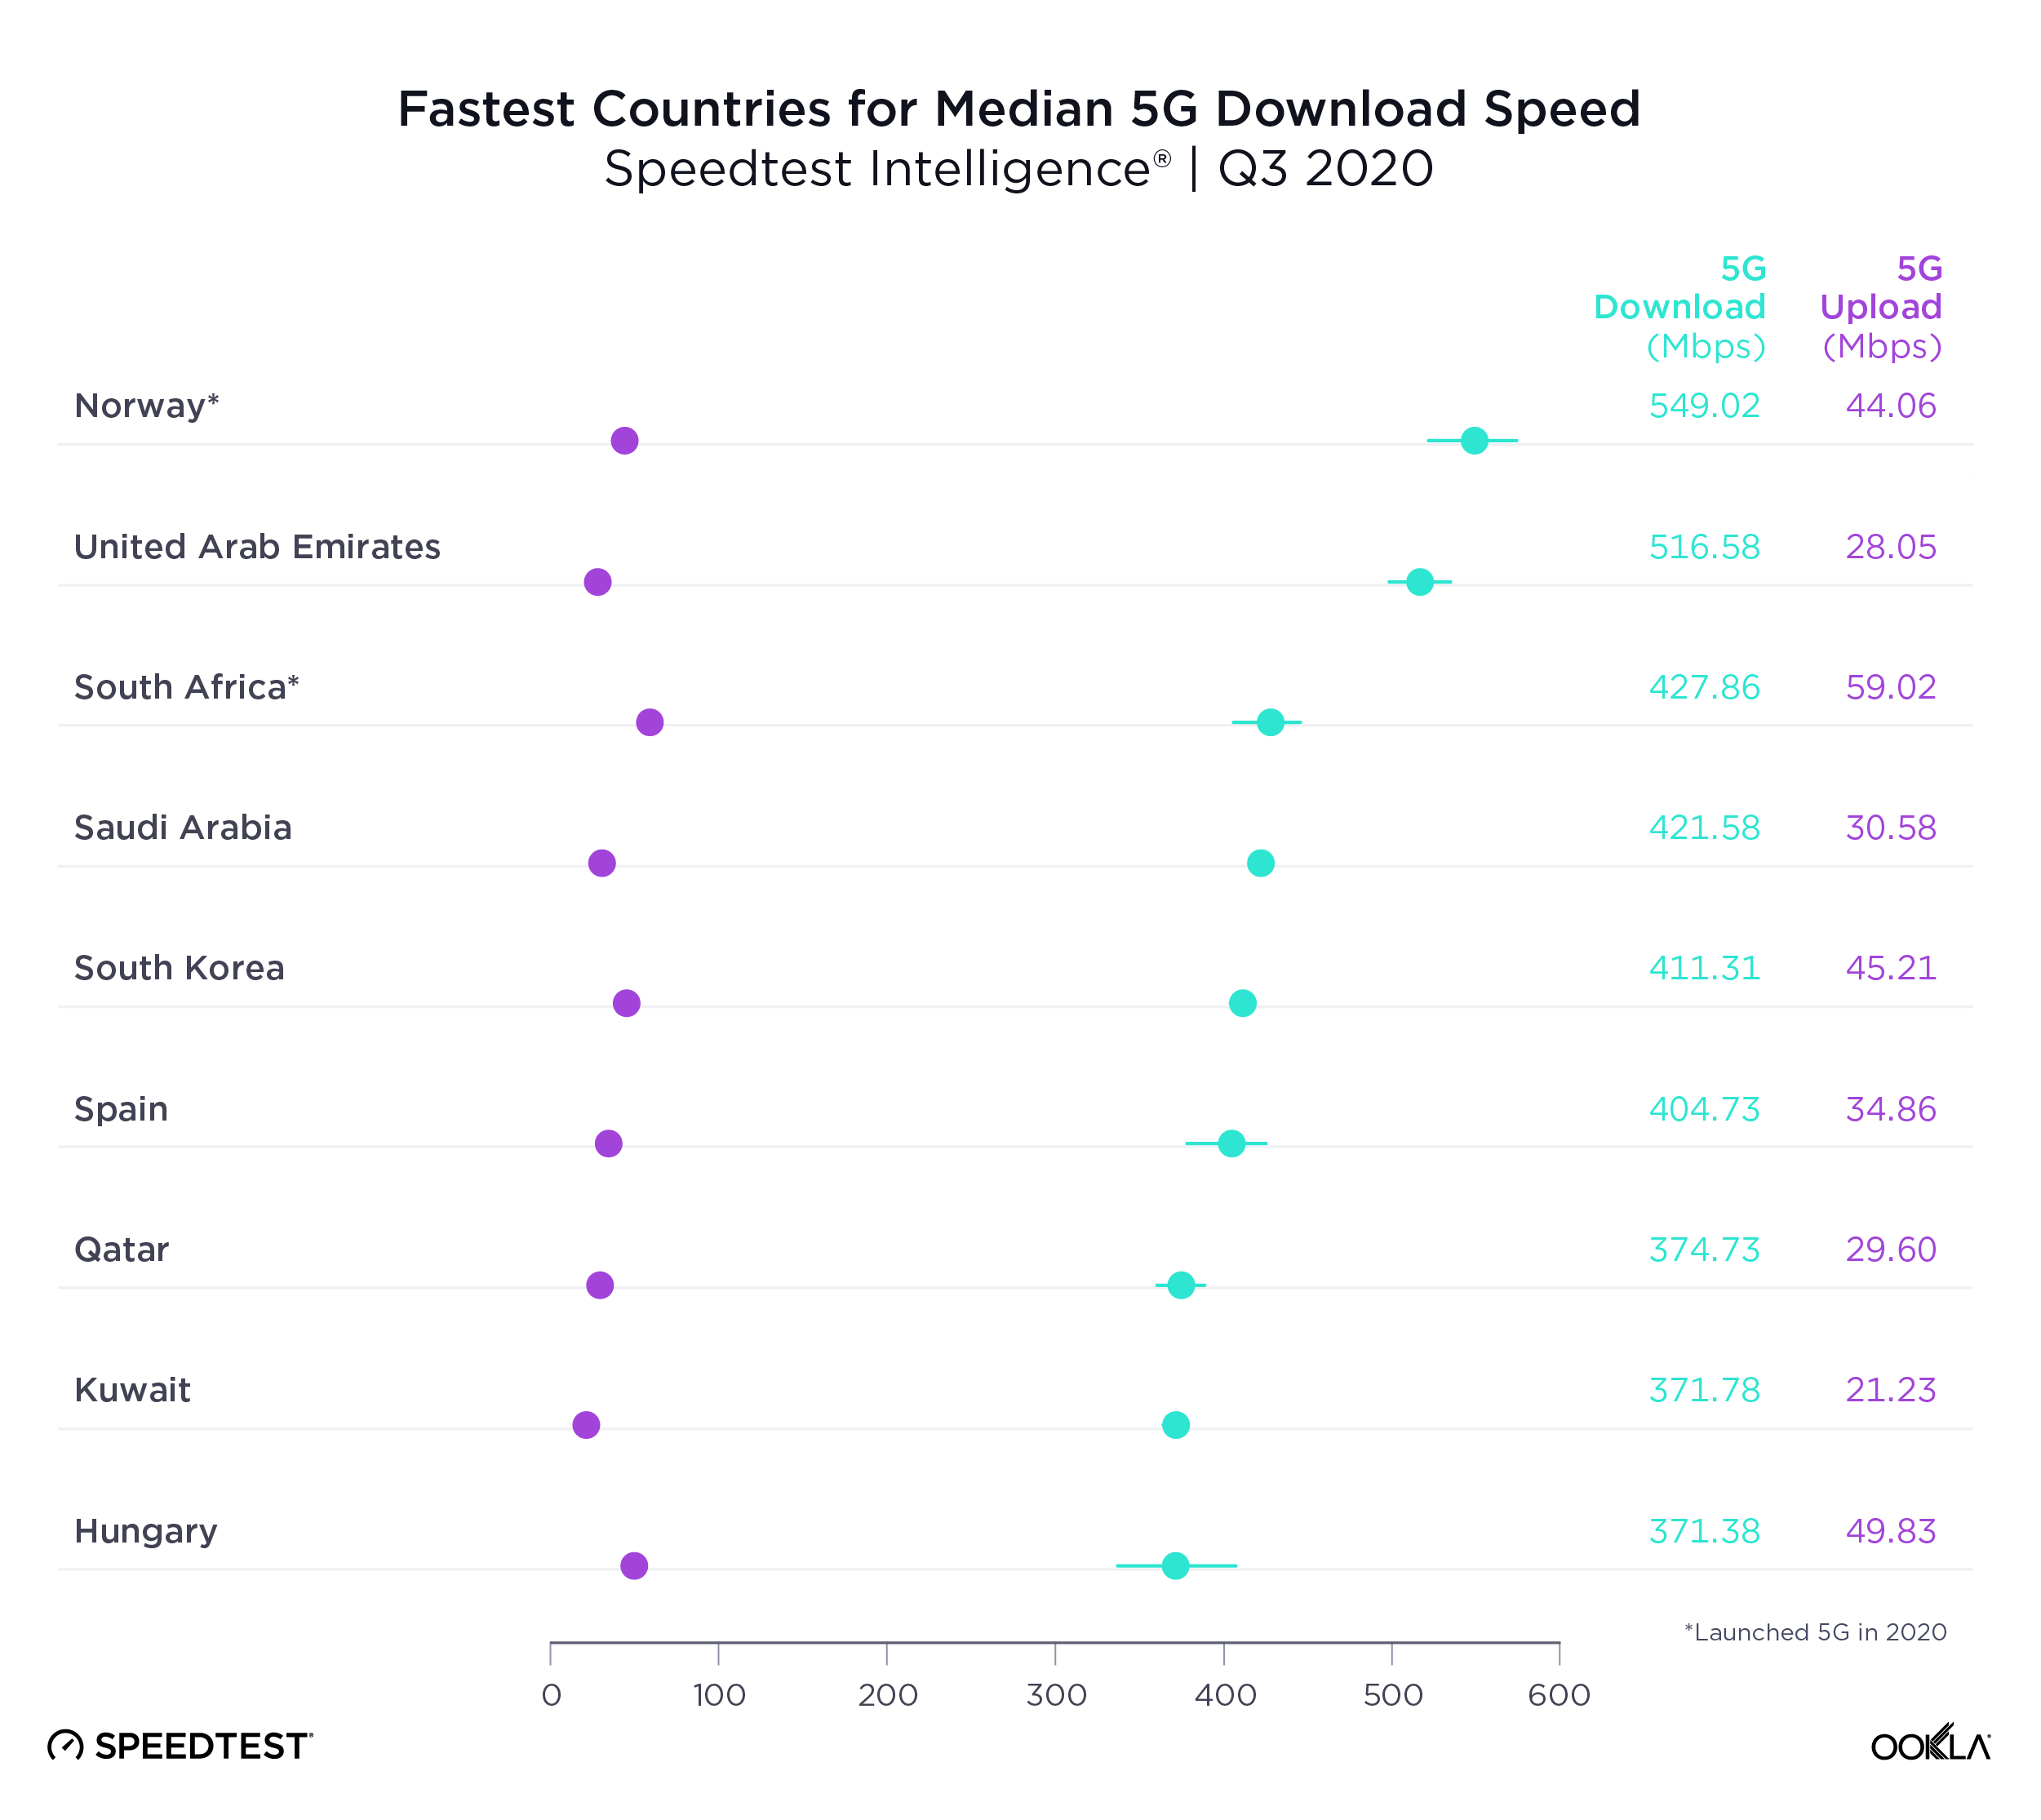
Another way to measure 5G performance is to look at median 5G download speed, which is a better predictor of the kind of performance most 5G customers can expect. Norway was the country with the fastest median download speed over 5G during Q3 2020. U.A.E. was second in this category, South Africa third, Saudi Arabia fourth and Spain fifth.
Fastest-Countries-Median-5G-Download-Speed_1220-2

It’s notable that Japan was on the list of 10 countries with the fastest top 10% 5G download speed but not on the list of 10 countries with the fastest median download speed over 5G. No matter how fast a country’s mobile infrastructure is, many other factors go into median 5G speeds, including device adoption and spectrum allocation.

Abu Dhabi tops list of 5G speeds in world capitals

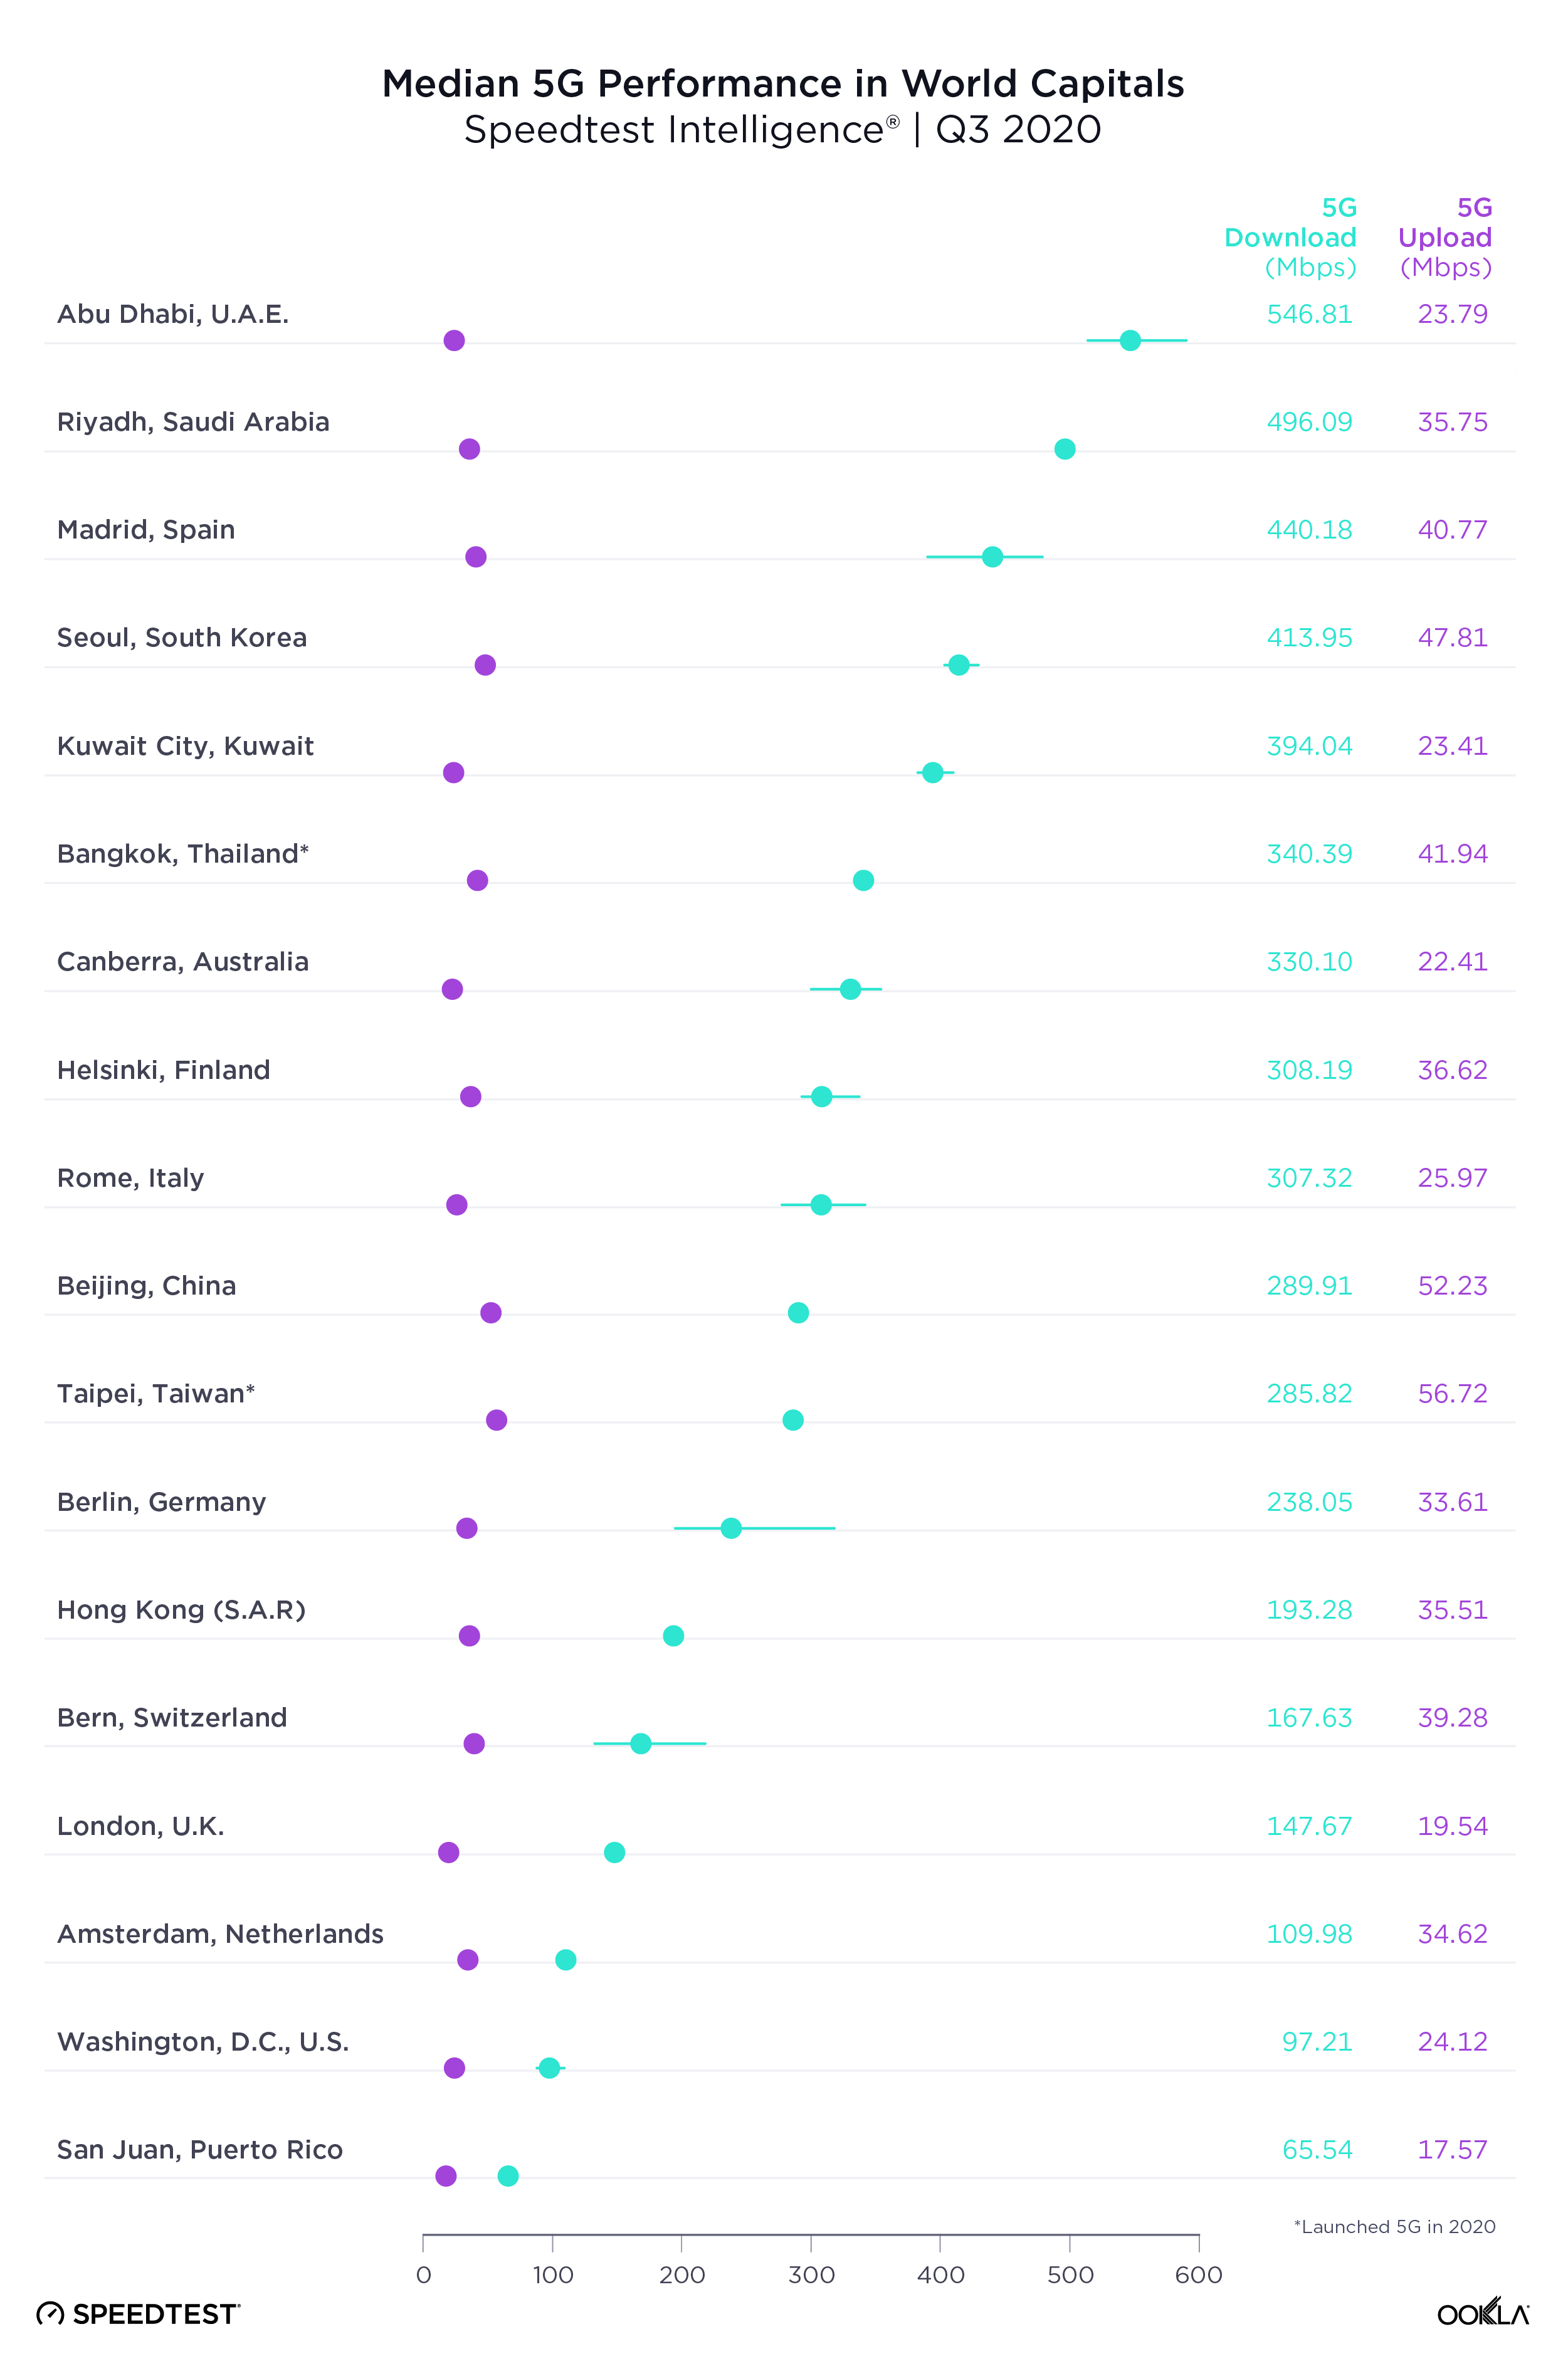
Our examination of 5G performance for 18 world capital cities with 5G during Q3 2020 found that Abu Dhabi had the fastest median download speed over 5G at 546.81 Mbps. Riyadh was second, Madrid third, Seoul fourth and Kuwait City fifth. As we saw at the country level, median upload speed was much lower than download speed.
Median-5G-Performance-Capitals_1220-2

How 5G performance and time spent compare within regions

We looked more closely at 5G performance across several intergovernmental organizations and trade blocs to get a better sense of how countries are performing in comparison to their neighbors and trade partners. We also calculated Time Spent on 5G, the proportion of time that users with 5G-capable devices spent on 5G, for each country.

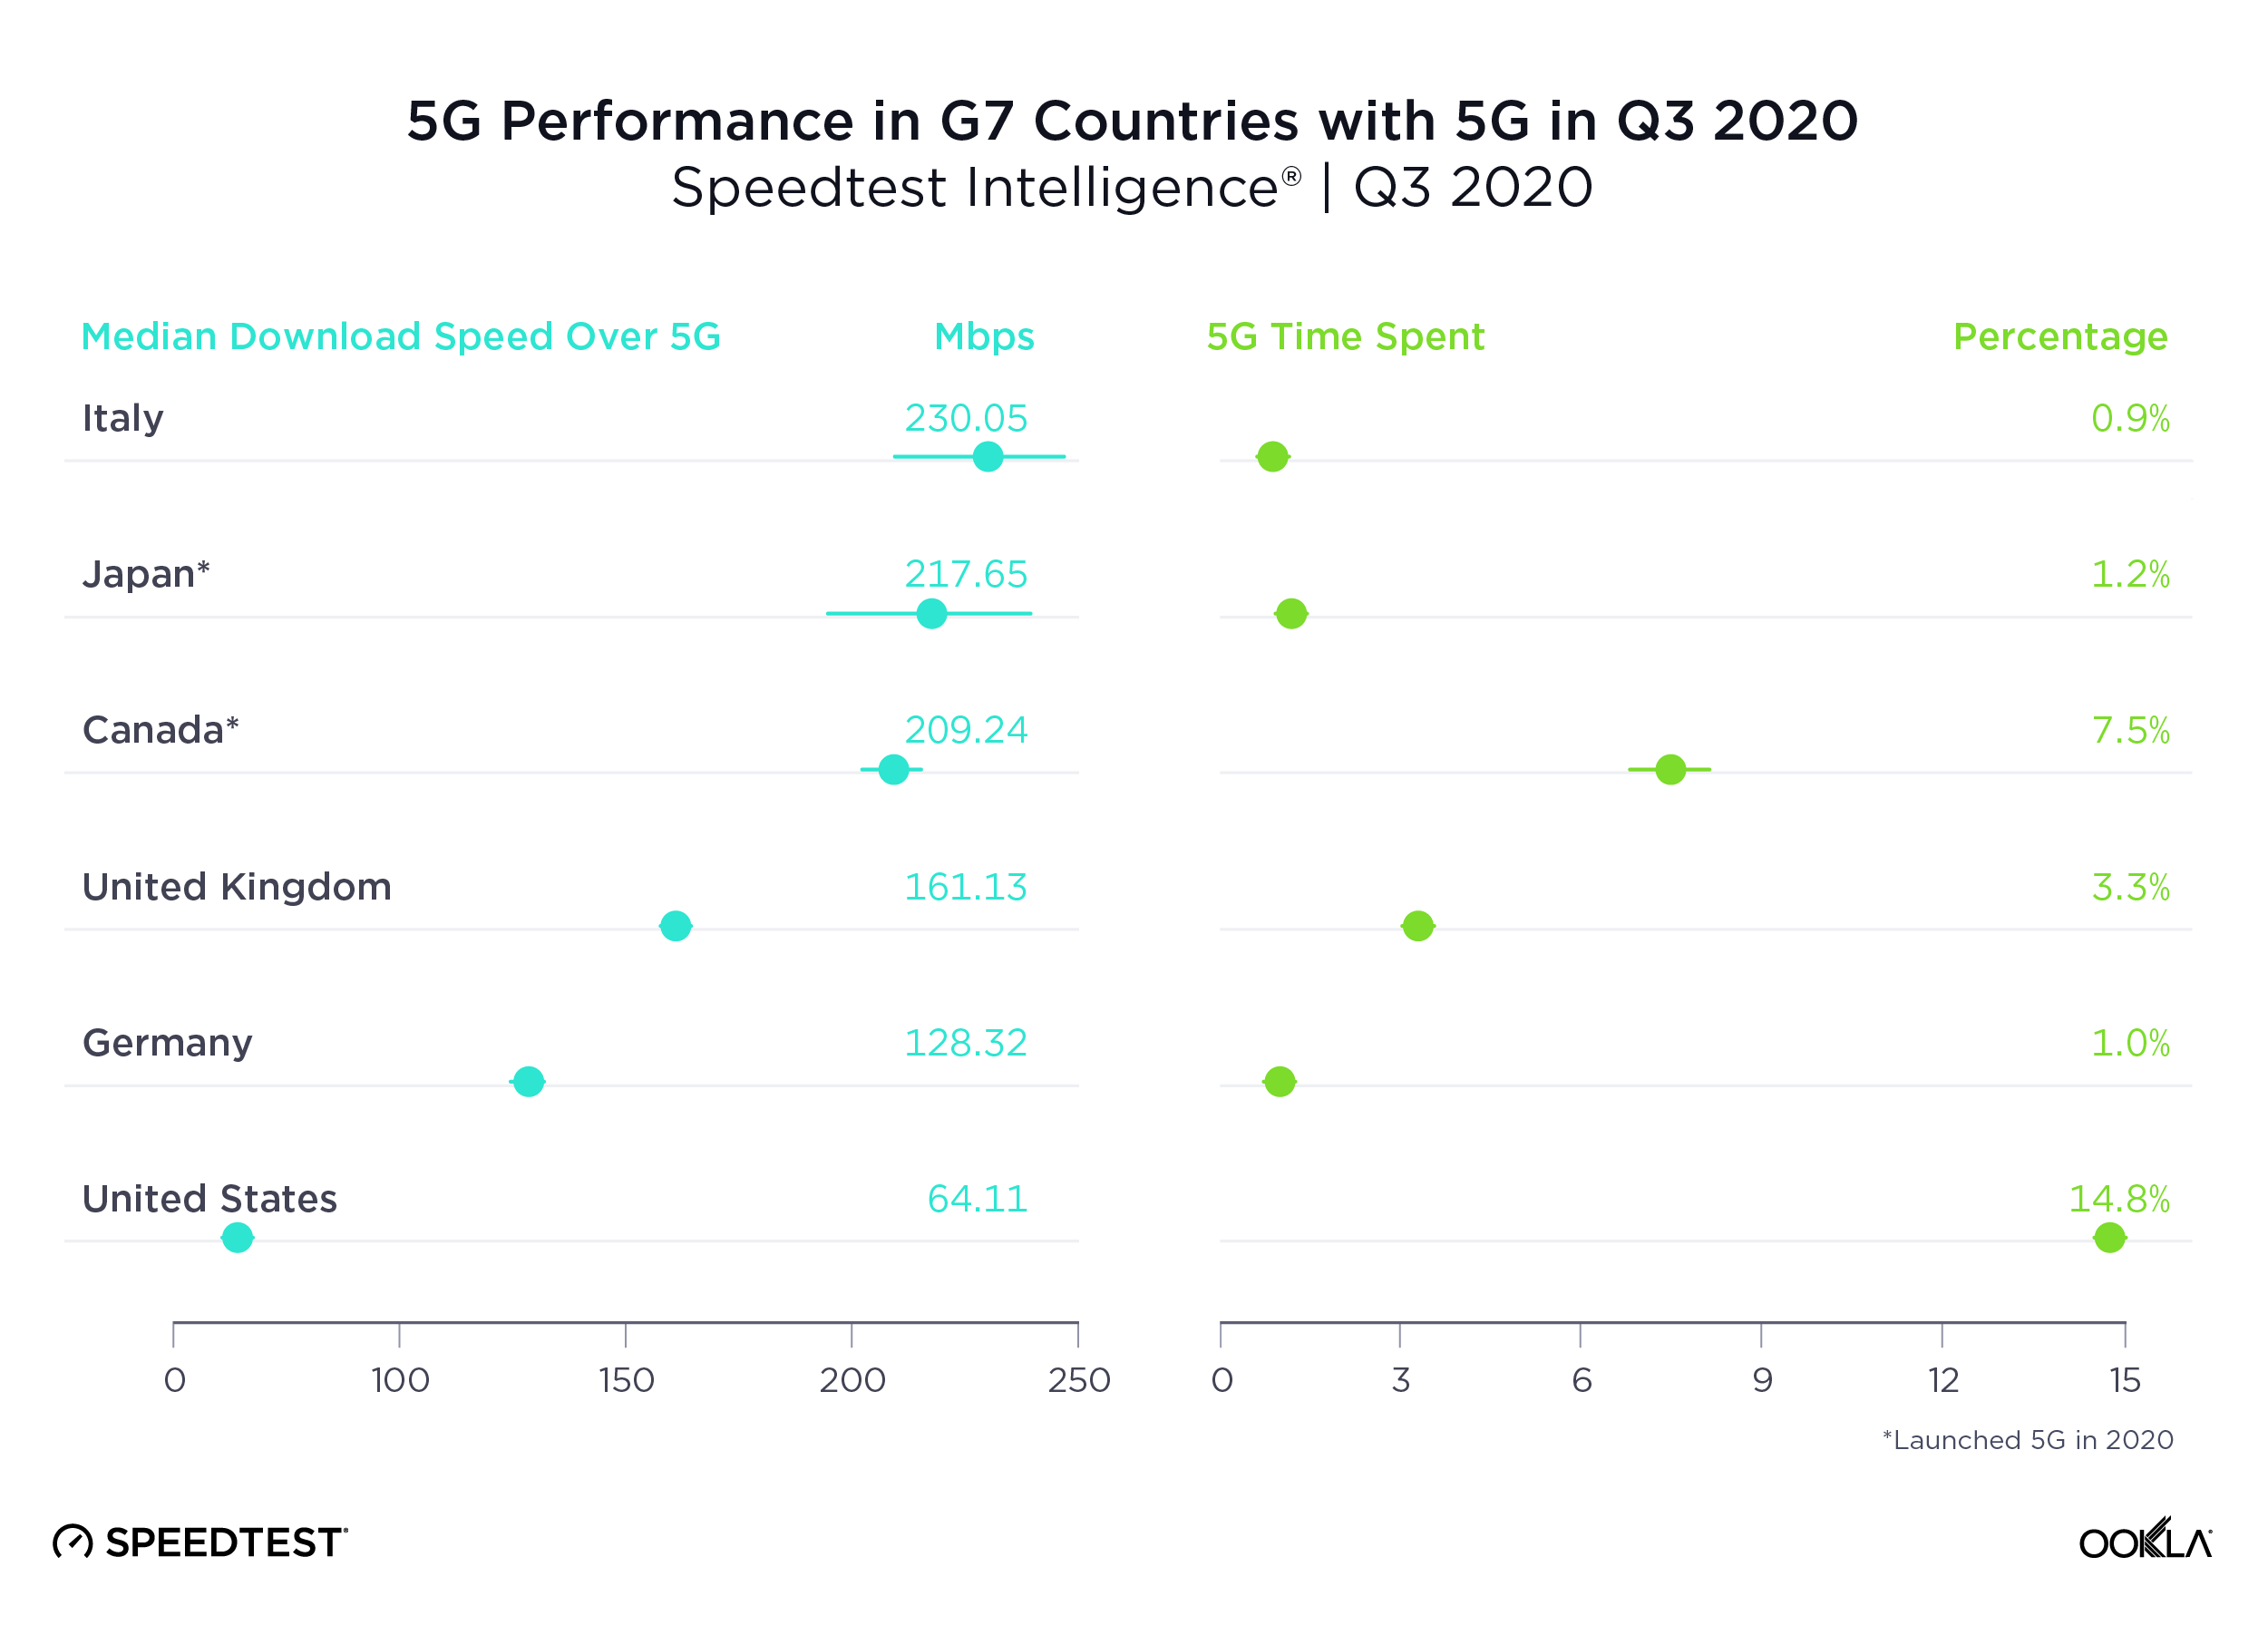
Italy had the fastest 5G among G7 countries, U.S. the slowest

Italy had the fastest median download speed over 5G of all the G7 countries. Japan was second, Canada third, the U.K. fourth and Germany fifth. The U.S. had the highest Time Spent on 5G, followed by Canada. For a deeper analysis of 5G in the U.K., read our previous coverage. Because France launched commercially available 5G only within the last couple of weeks, we have not included it on this table.
5G-Performance-G7-Countries_1220

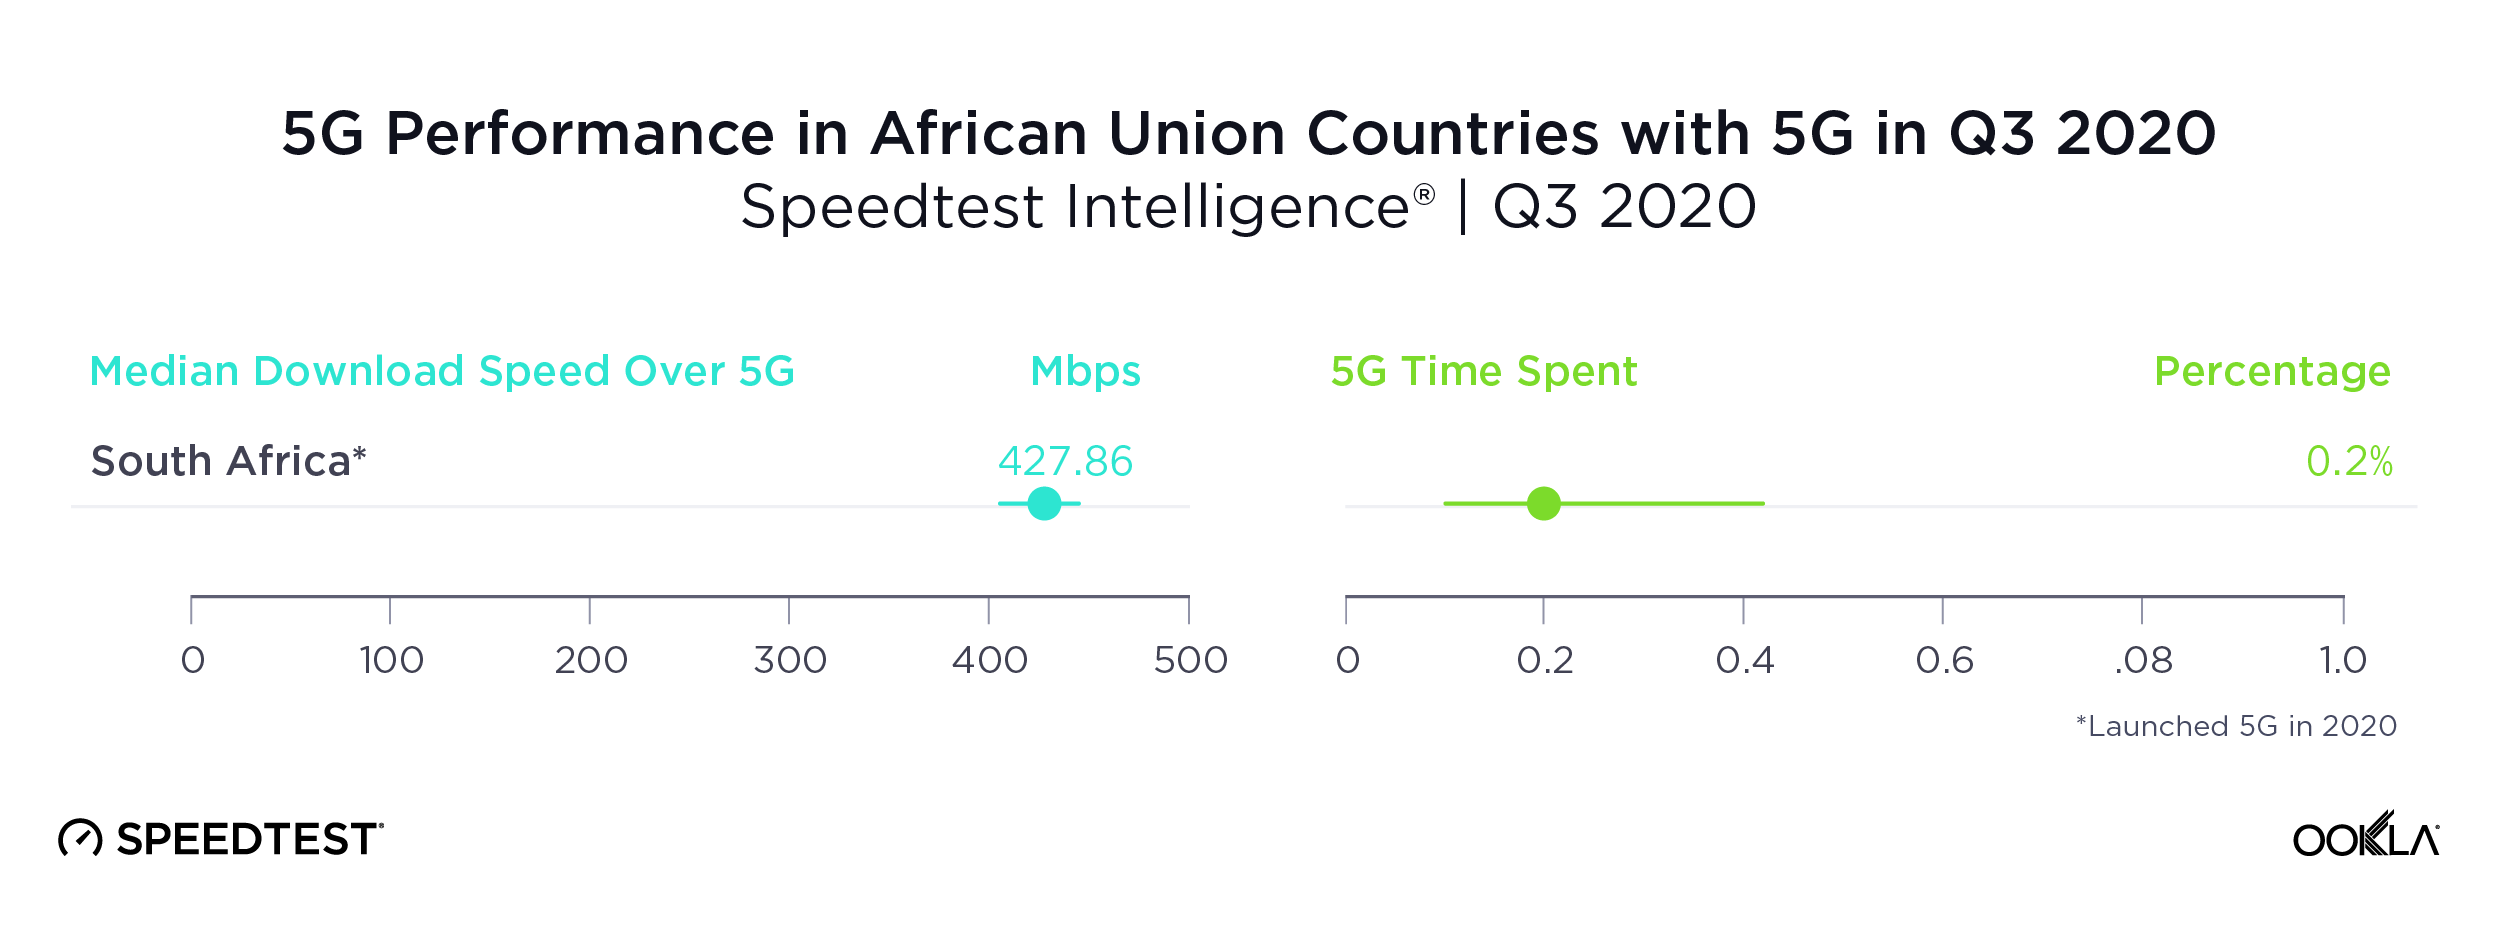
South Africa was the only country in the African Union with sufficient 5G to rate

As we saw above, South Africa’s impressive median download speed over 5G ranked the country third in the world during Q3 2020. South Africa was only one of two countries in the African Union to have commercially available 5G during Q3 2020. The other, Madagascar, did not have sufficient samples to properly analyze. Time Spent on 5G in South Africa was very low, an indication that 5G is not yet widely available there.
5G-Performance-Africa_1220

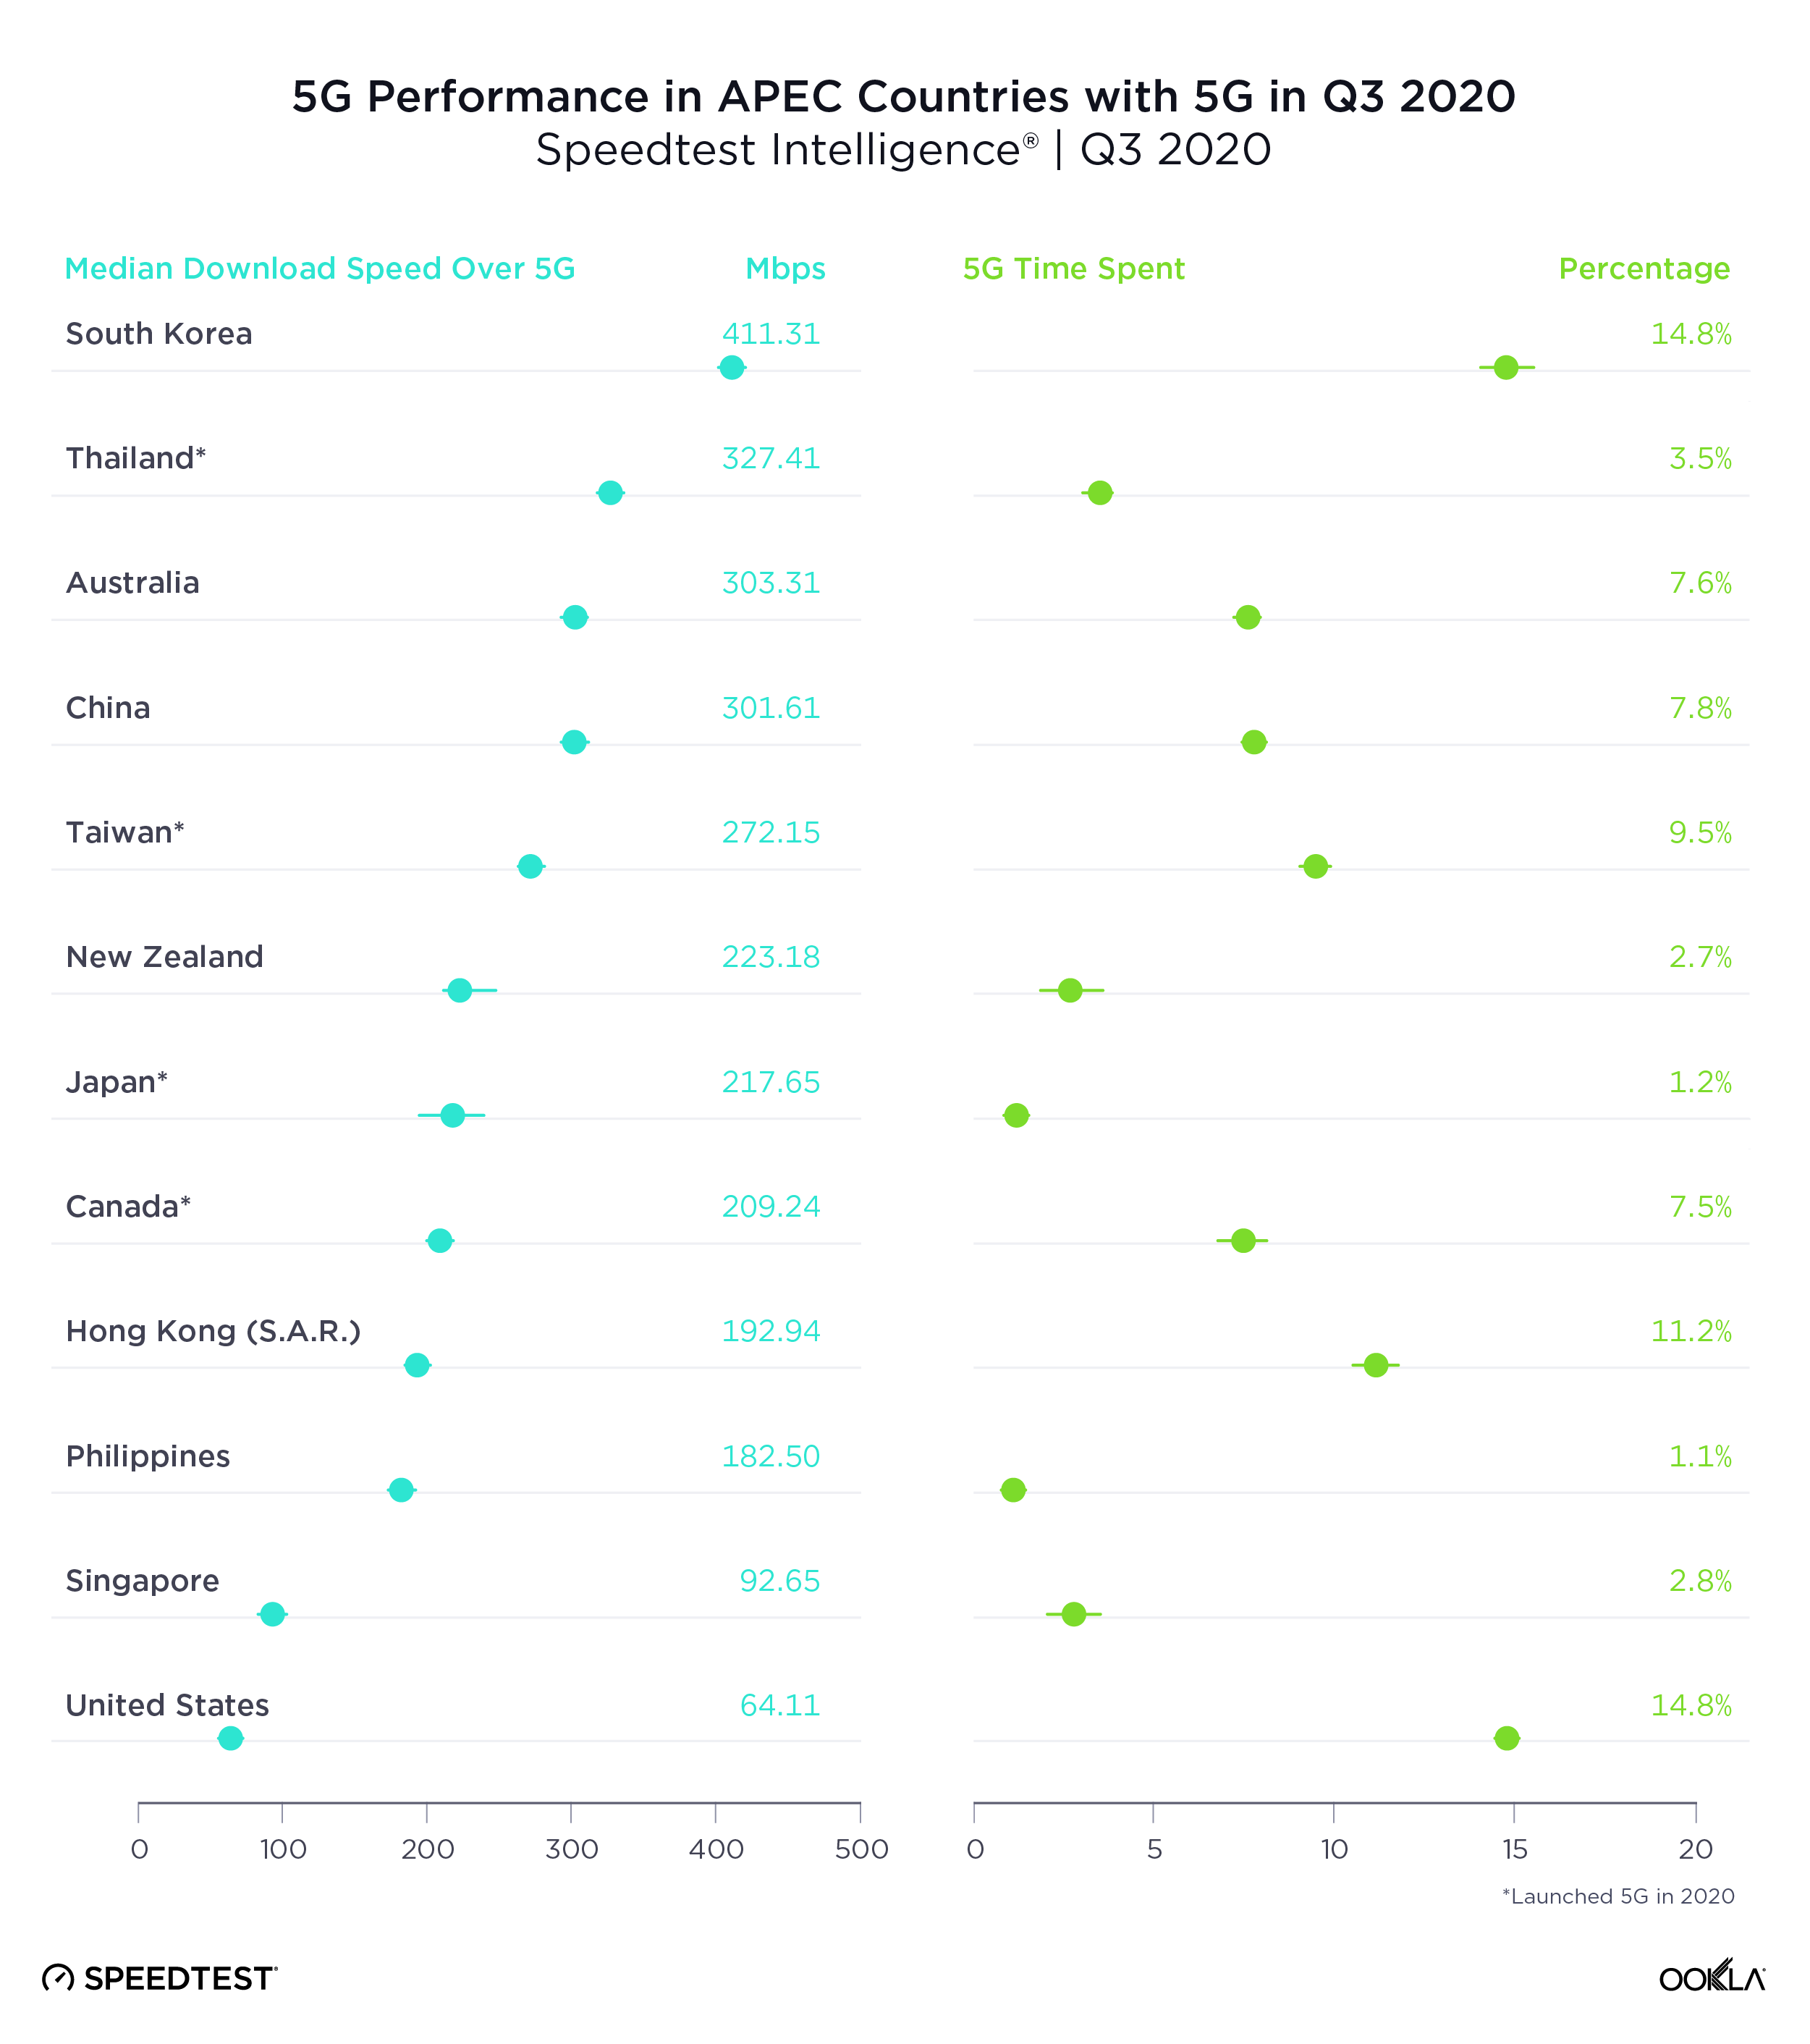
South Korea had the fastest 5G in APEC countries, U.S. the slowest

A median download speed over 5G of 411.11 Mbps put South Korea comfortably at the top of Asia-Pacific Economic Cooperation (APEC) countries with the fastest 5G during Q3 2020. Thailand was second, Australia third, China fourth and Taiwan fifth. 5G speeds represented the largest improvement over 4G in the Philippines where the median download speed over 4G during Q3 2020 (9.36 Mbps) was substantially lower than that of other countries on this list.

South Korea and the U.S. tied for highest Time Spent on 5G among APEC countries during Q3 2020, followed by Hong Kong and Taiwan.
5G-Performance-APEC_1220

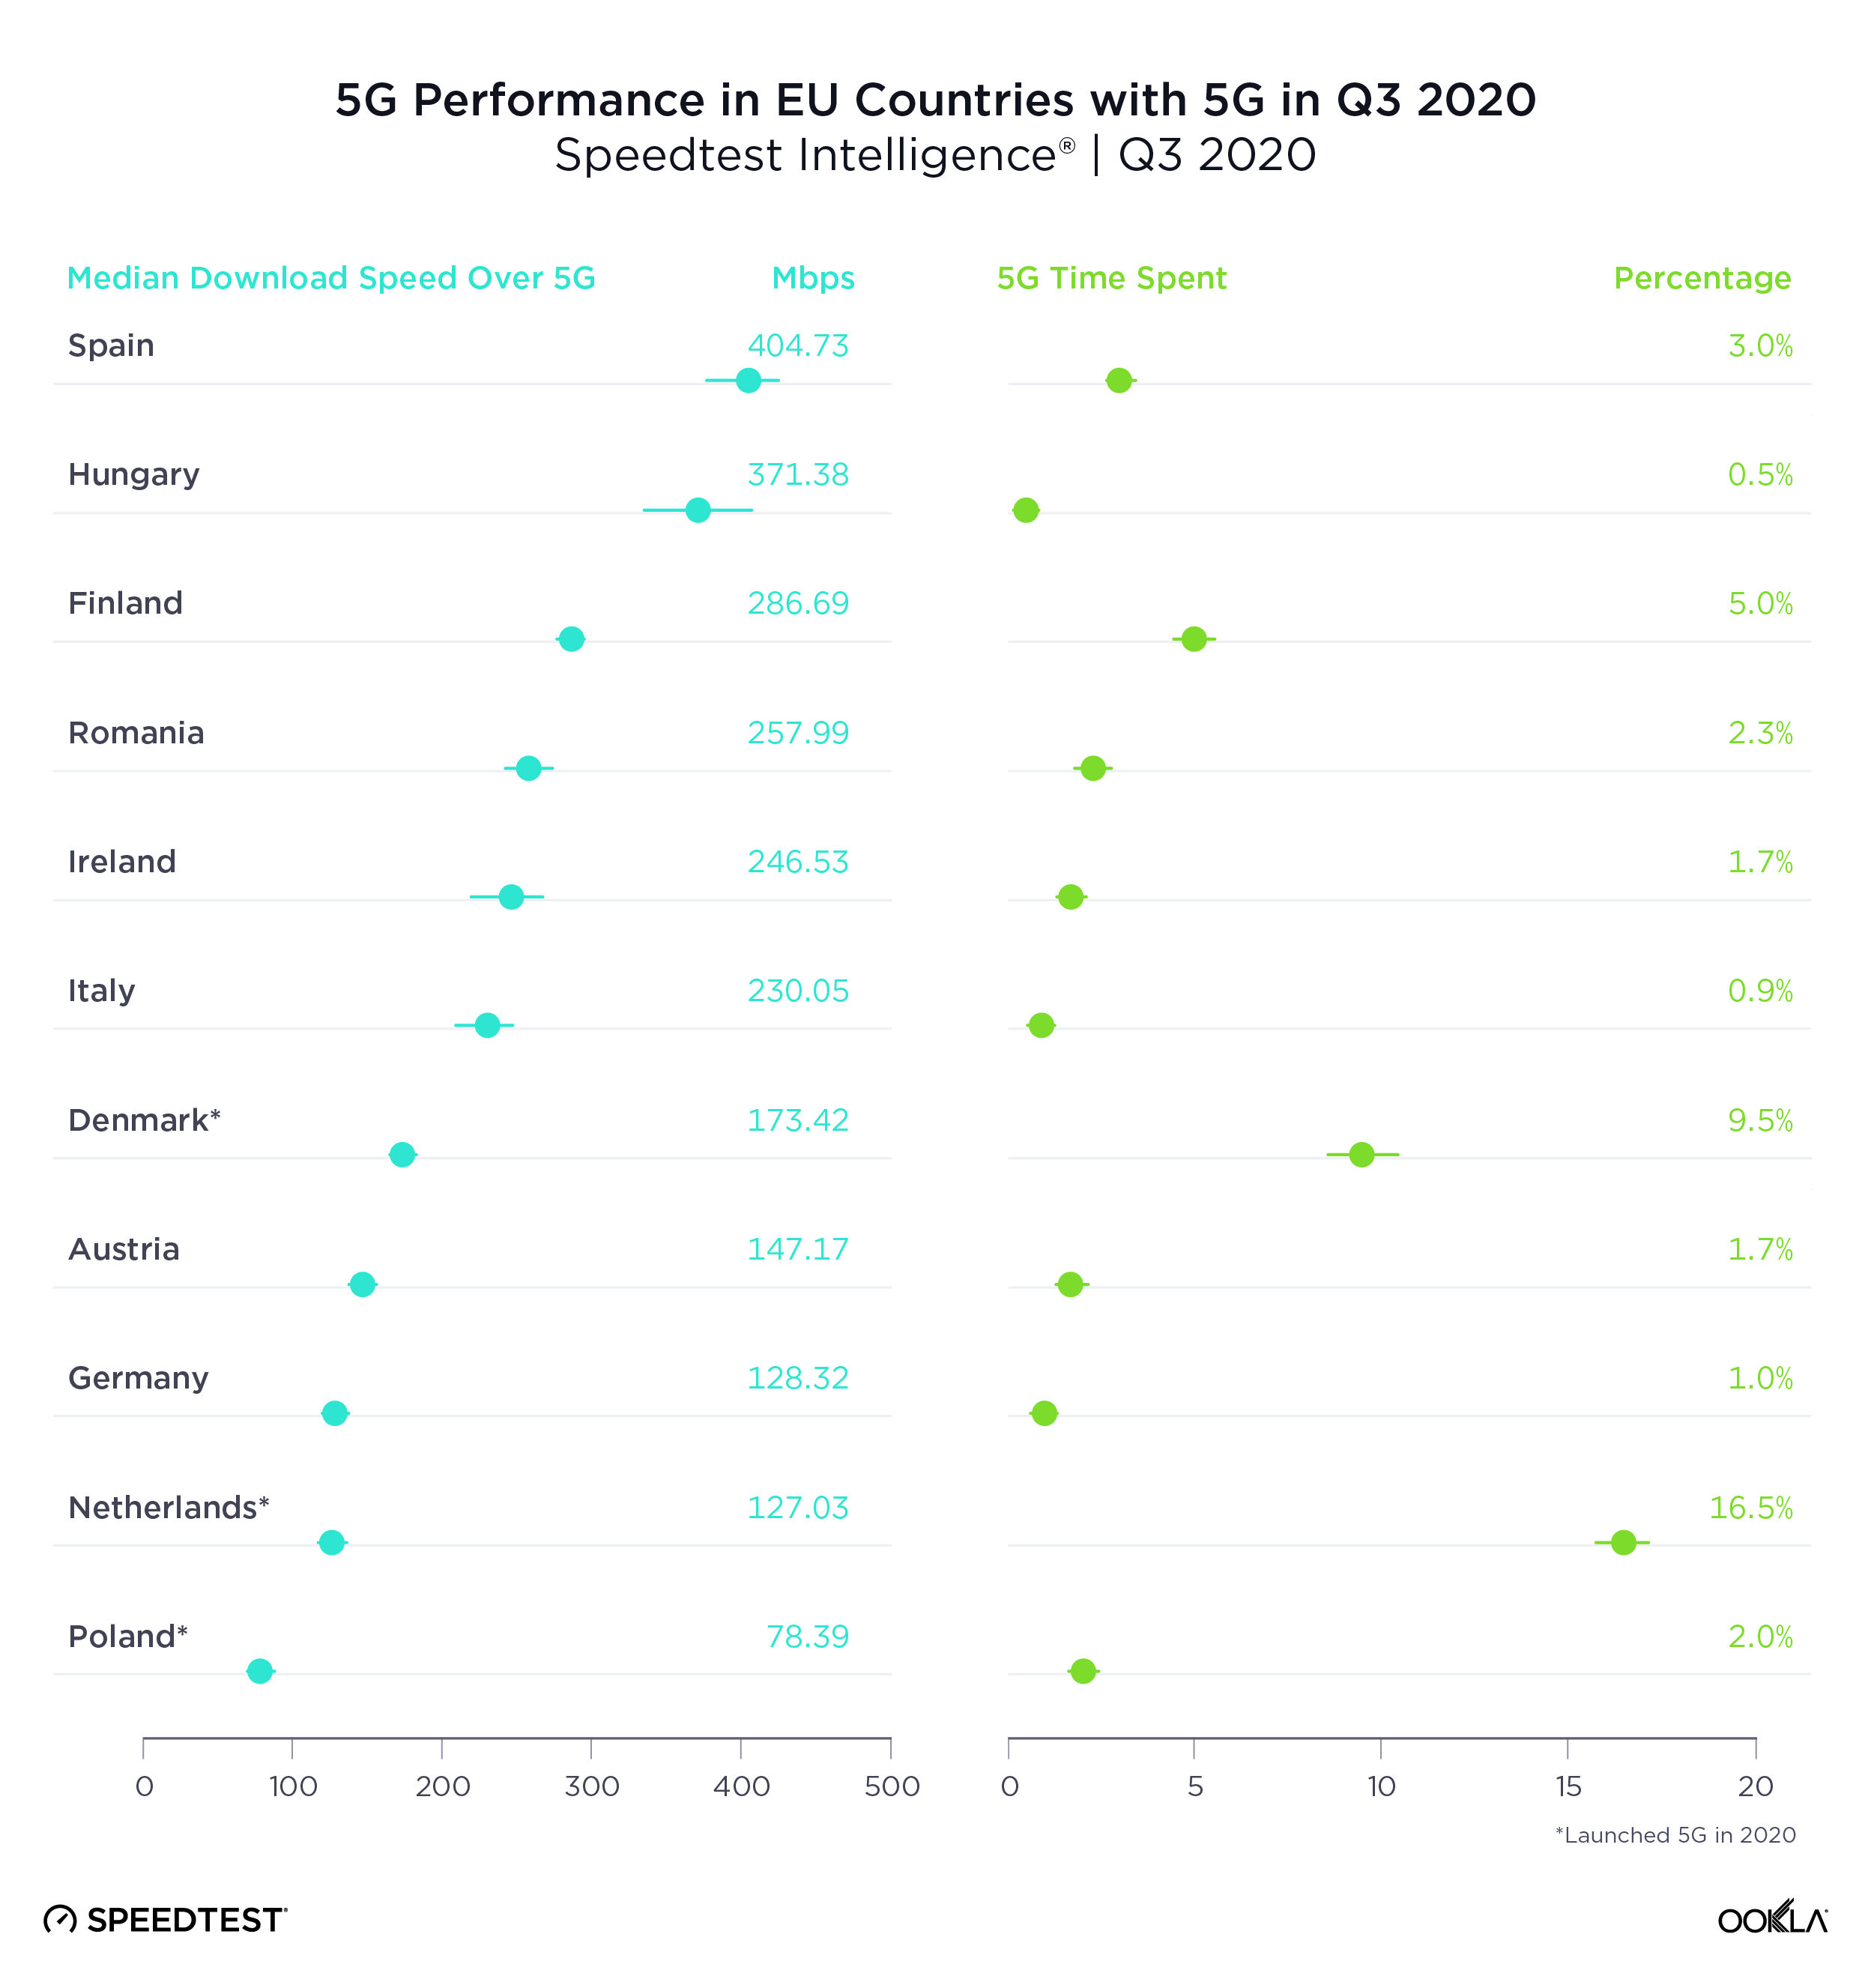
Spain had the fastest 5G in the E.U., Poland the slowest

Spain showed the fastest median download speed over 5G among the 11 European Union (E.U.) countries with sufficient 5G samples to rank during Q3 2020. Hungary was second, Finland third, Romania fourth and Ireland fifth. Spain’s median download speed over 5G also represented the largest gain over 4G among all of these countries, partially because Spain had the second slowest median download speed over 4G. France is not included on this list because 5G did not become commercially available in the country until after Q3 2020.

The Netherlands had the highest Time Spent on 5G among E.U. countries during Q3 2020, indicating that customers with 5G phones are able to spend far more time on 5G there than in other E.U. countries. Denmark was second for Time Spent on 5G among EU countries in Q3 2020 and Finland third.
5G-Performance-EU_1220

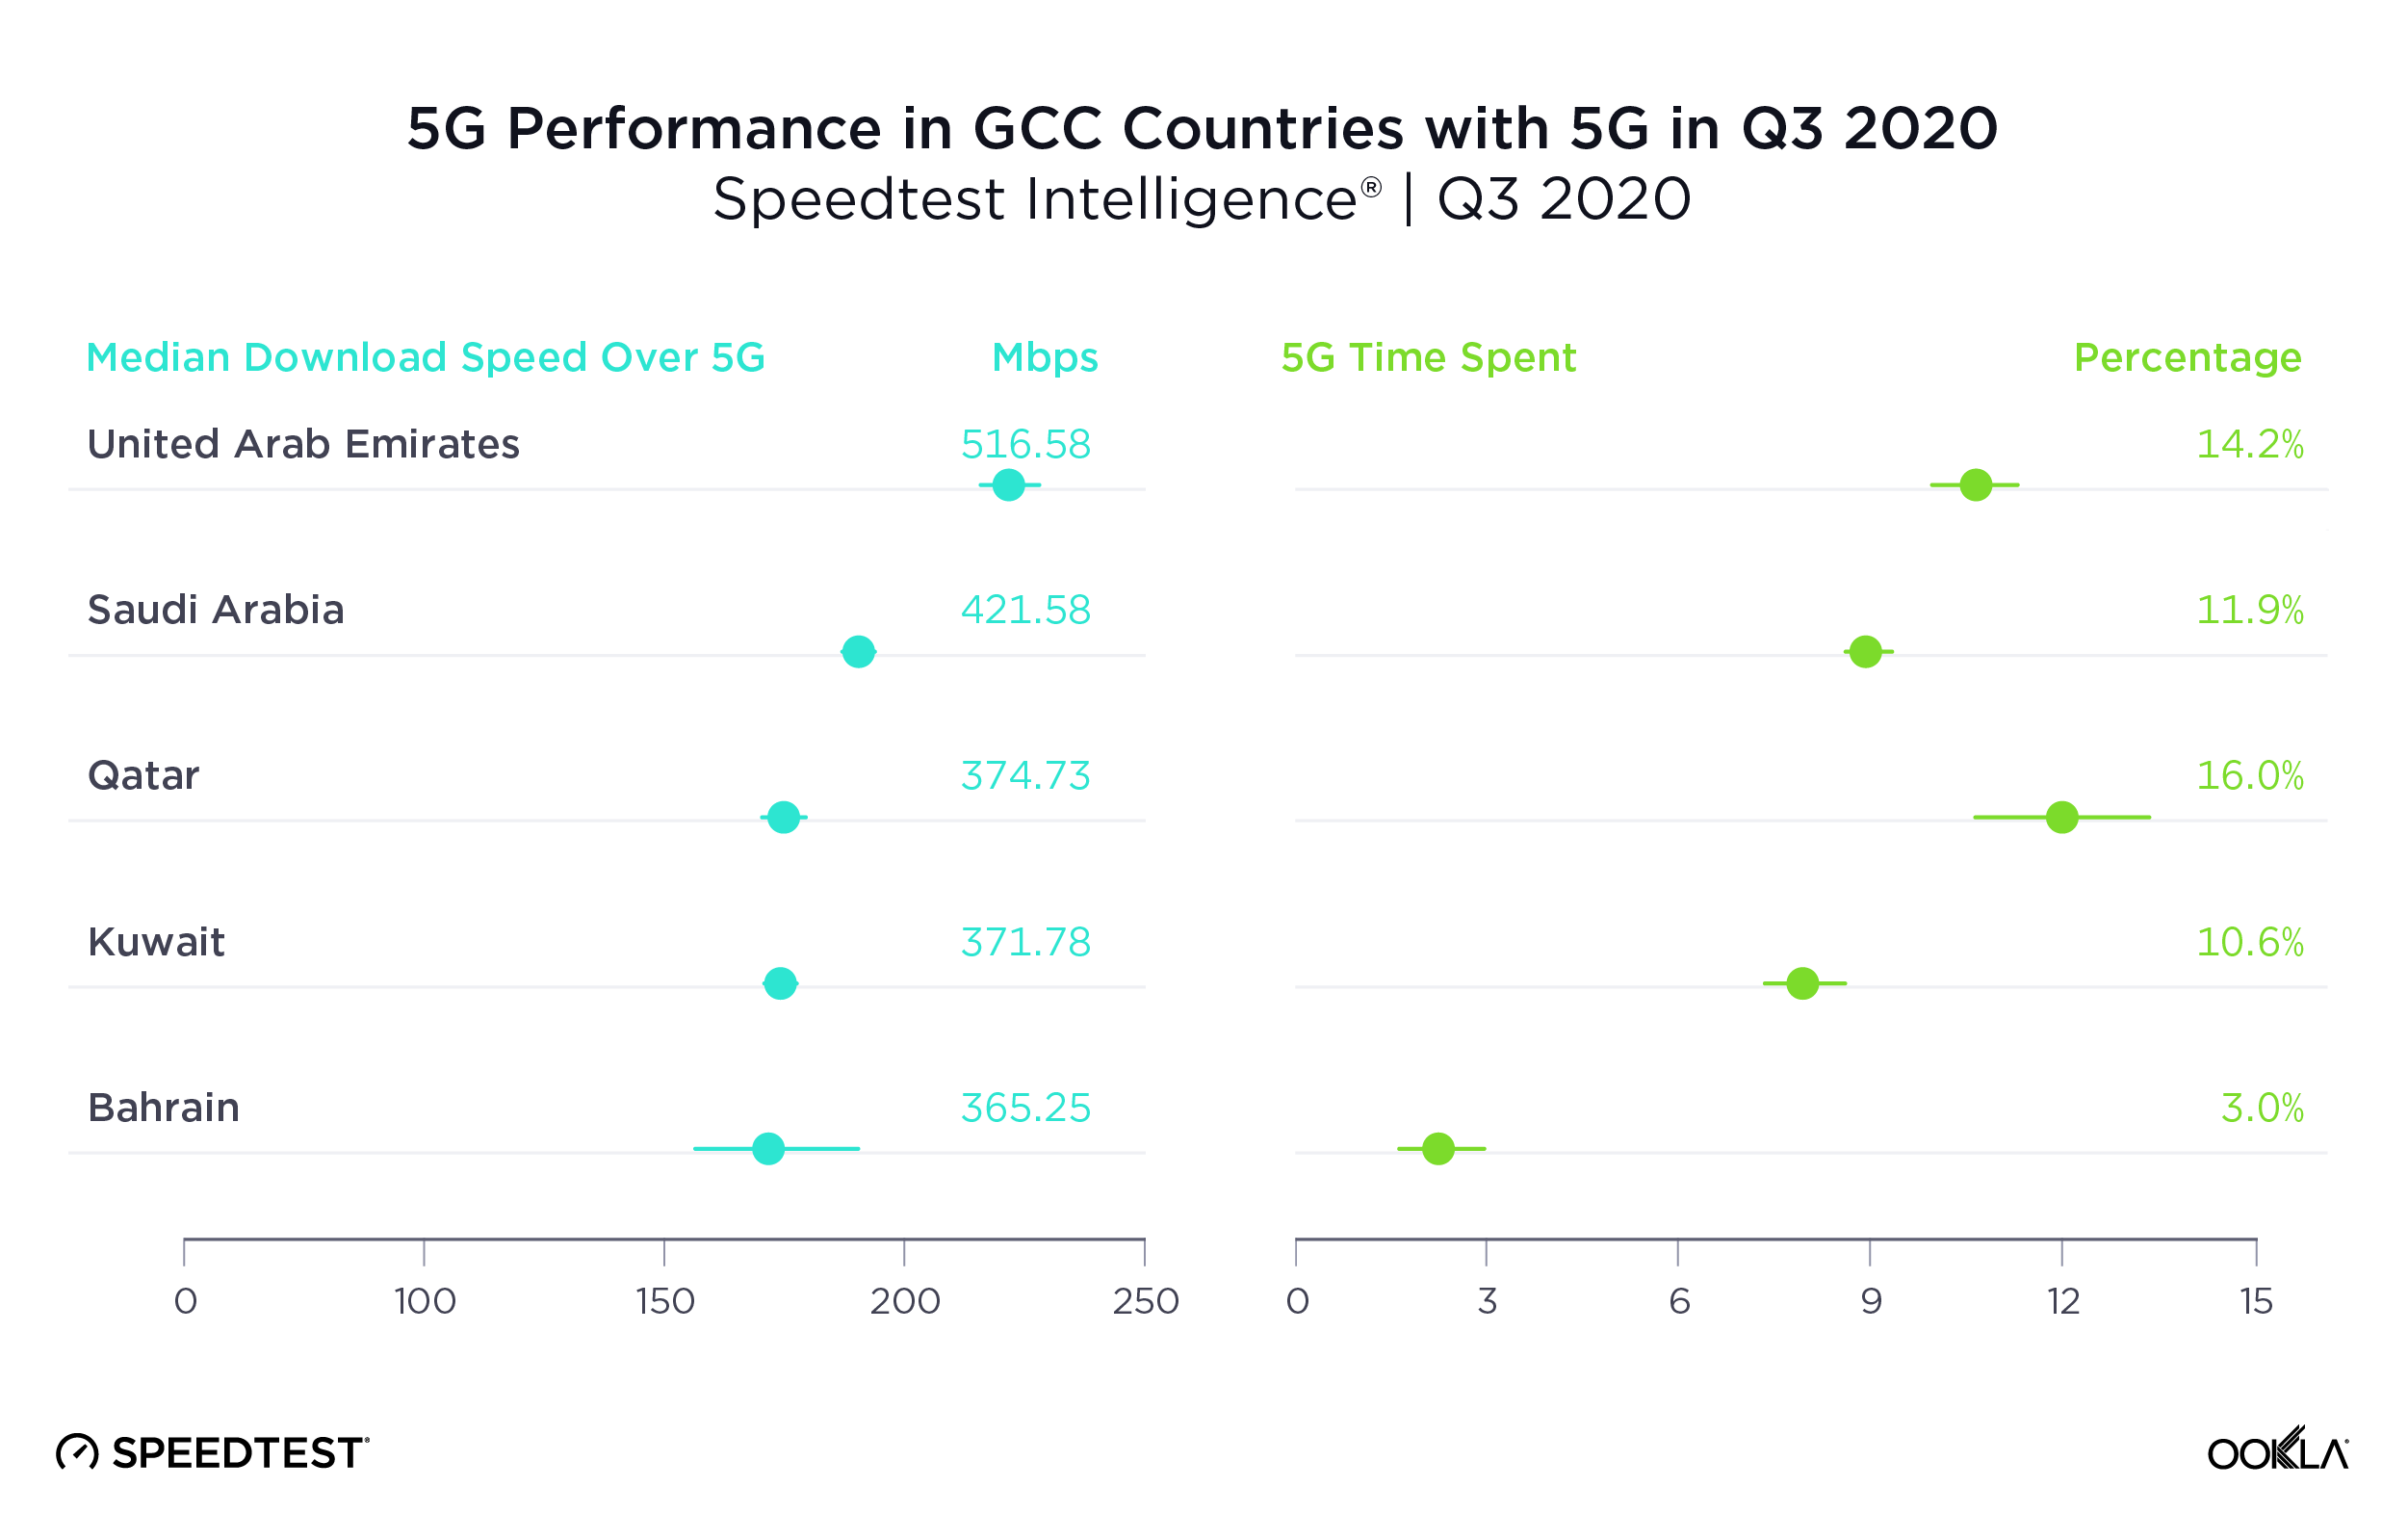
U.A.E had the fastest 5G in Gulf Cooperation Council Countries

With the second fastest median download speed over 5G in the world, U.A.E. was also the Gulf Cooperation Council (GCC) country with the fastest 5G during Q3 2020. Saudi Arabia was second and Qatar third. While Oman does have commercially available 5G, there were insufficient samples in the country during Q3 2020 to properly analyze performance.

5G represented the largest improvement over 4G in Kuwait and Bahrain, countries that had slower median download speeds over 4G than their neighbors.

Time Spent on 5G was relatively high in all the GCC countries on this list, except Bahrain, when compared to other countries in the world during Q3 2020. Qatar showed the highest Time Spent on 5G among GCC countries in Q3 2020 at 16.0%. U.A.E. was second and Saudi Arabia third.
5G-Performance-GCC_1220

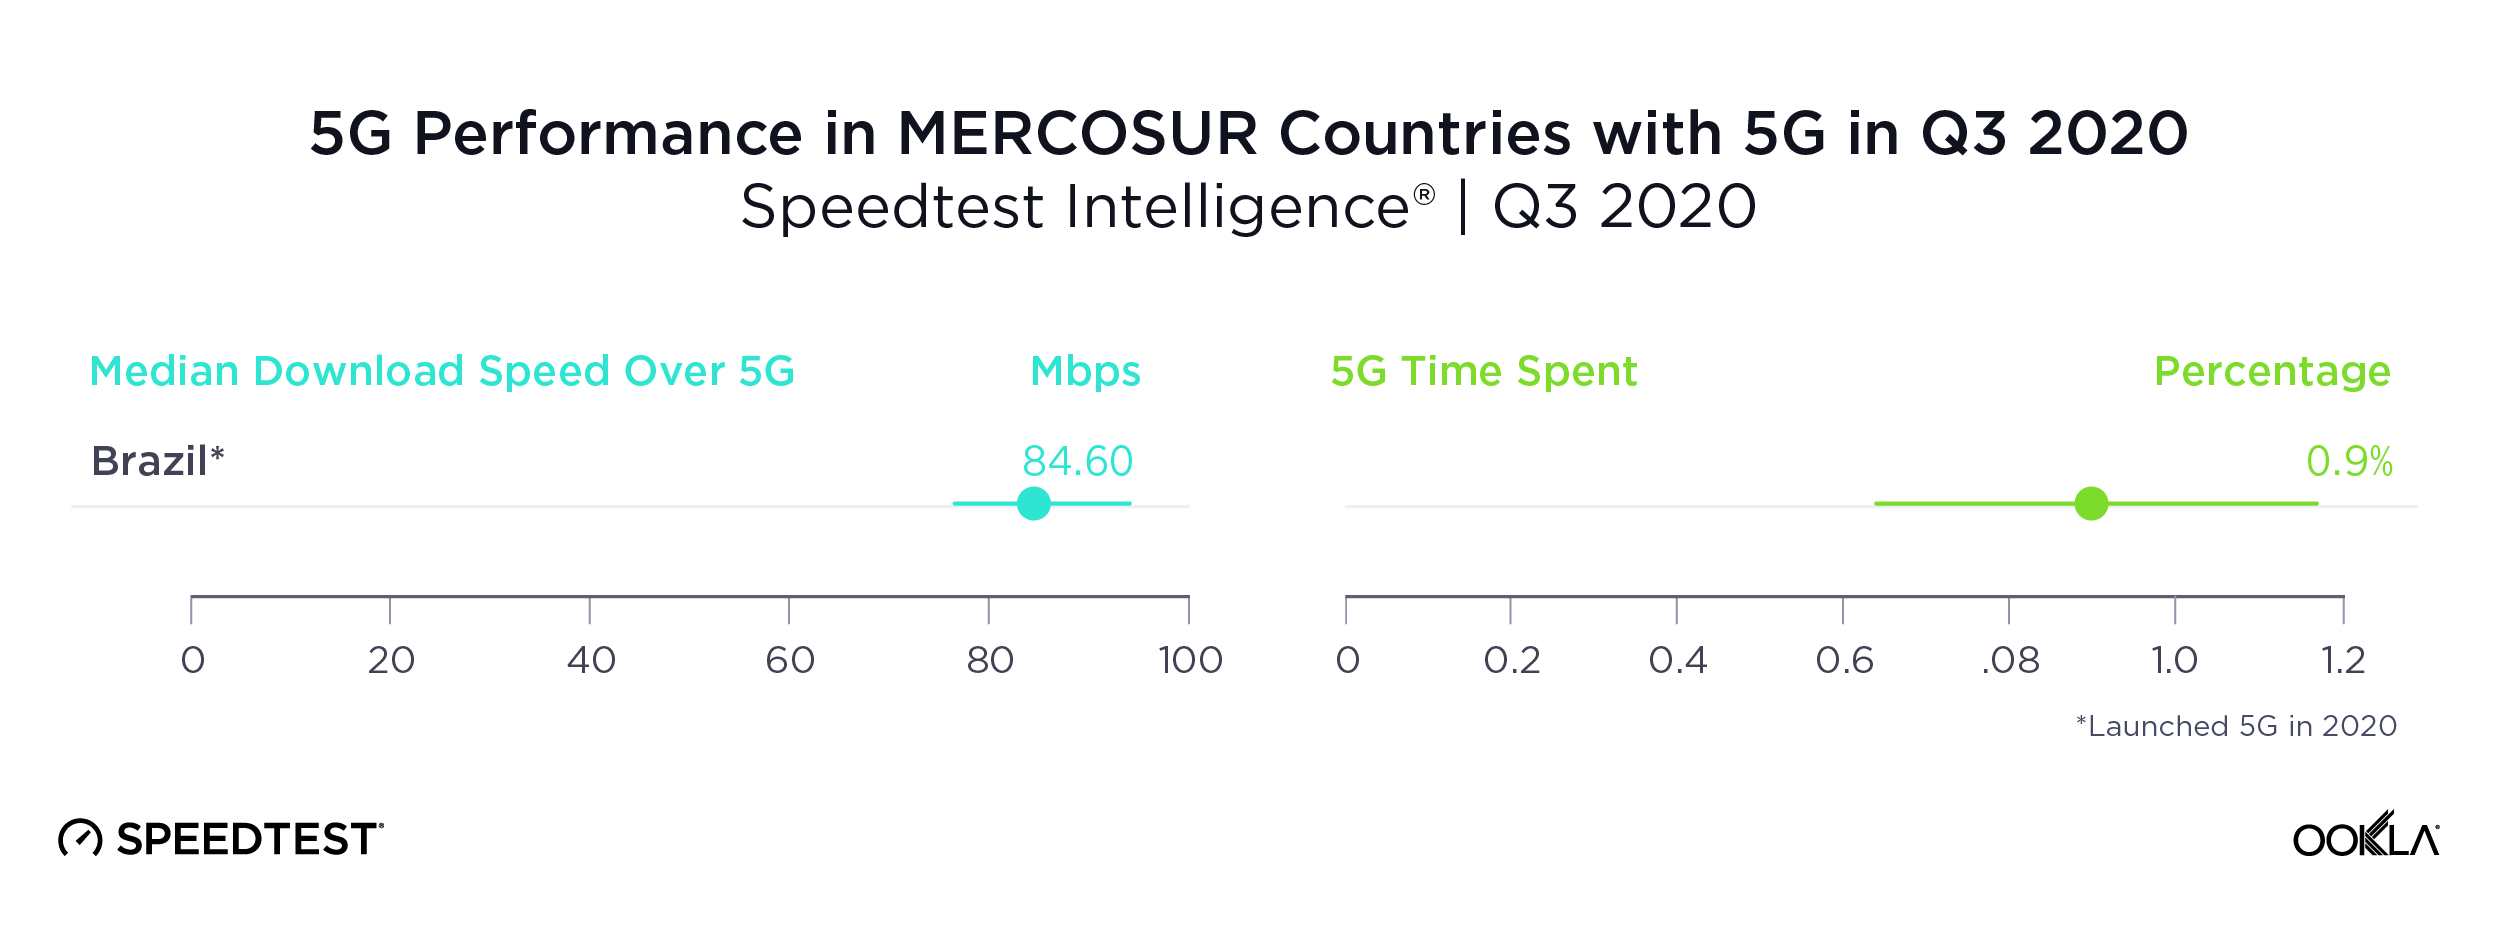
Brazil was the only MERCOSUR country with sufficient 5G to rate

Brazil’s median download speed over 5G of 84.60 Mbps during Q3 2020 may not seem fast for 5G, but it still puts Brazil well ahead of other countries in the Southern Common Market (MERCOSUR), most of which do not yet have 5G at all. We did see 5G results in Colombia, but there were insufficient samples to properly compare.

Time Spent on 5G in Brazil during Q3 2020 was not quite one percent, indicating that customers do not have much access to 5G yet.
5G-Performance-MERCOSUR_1220

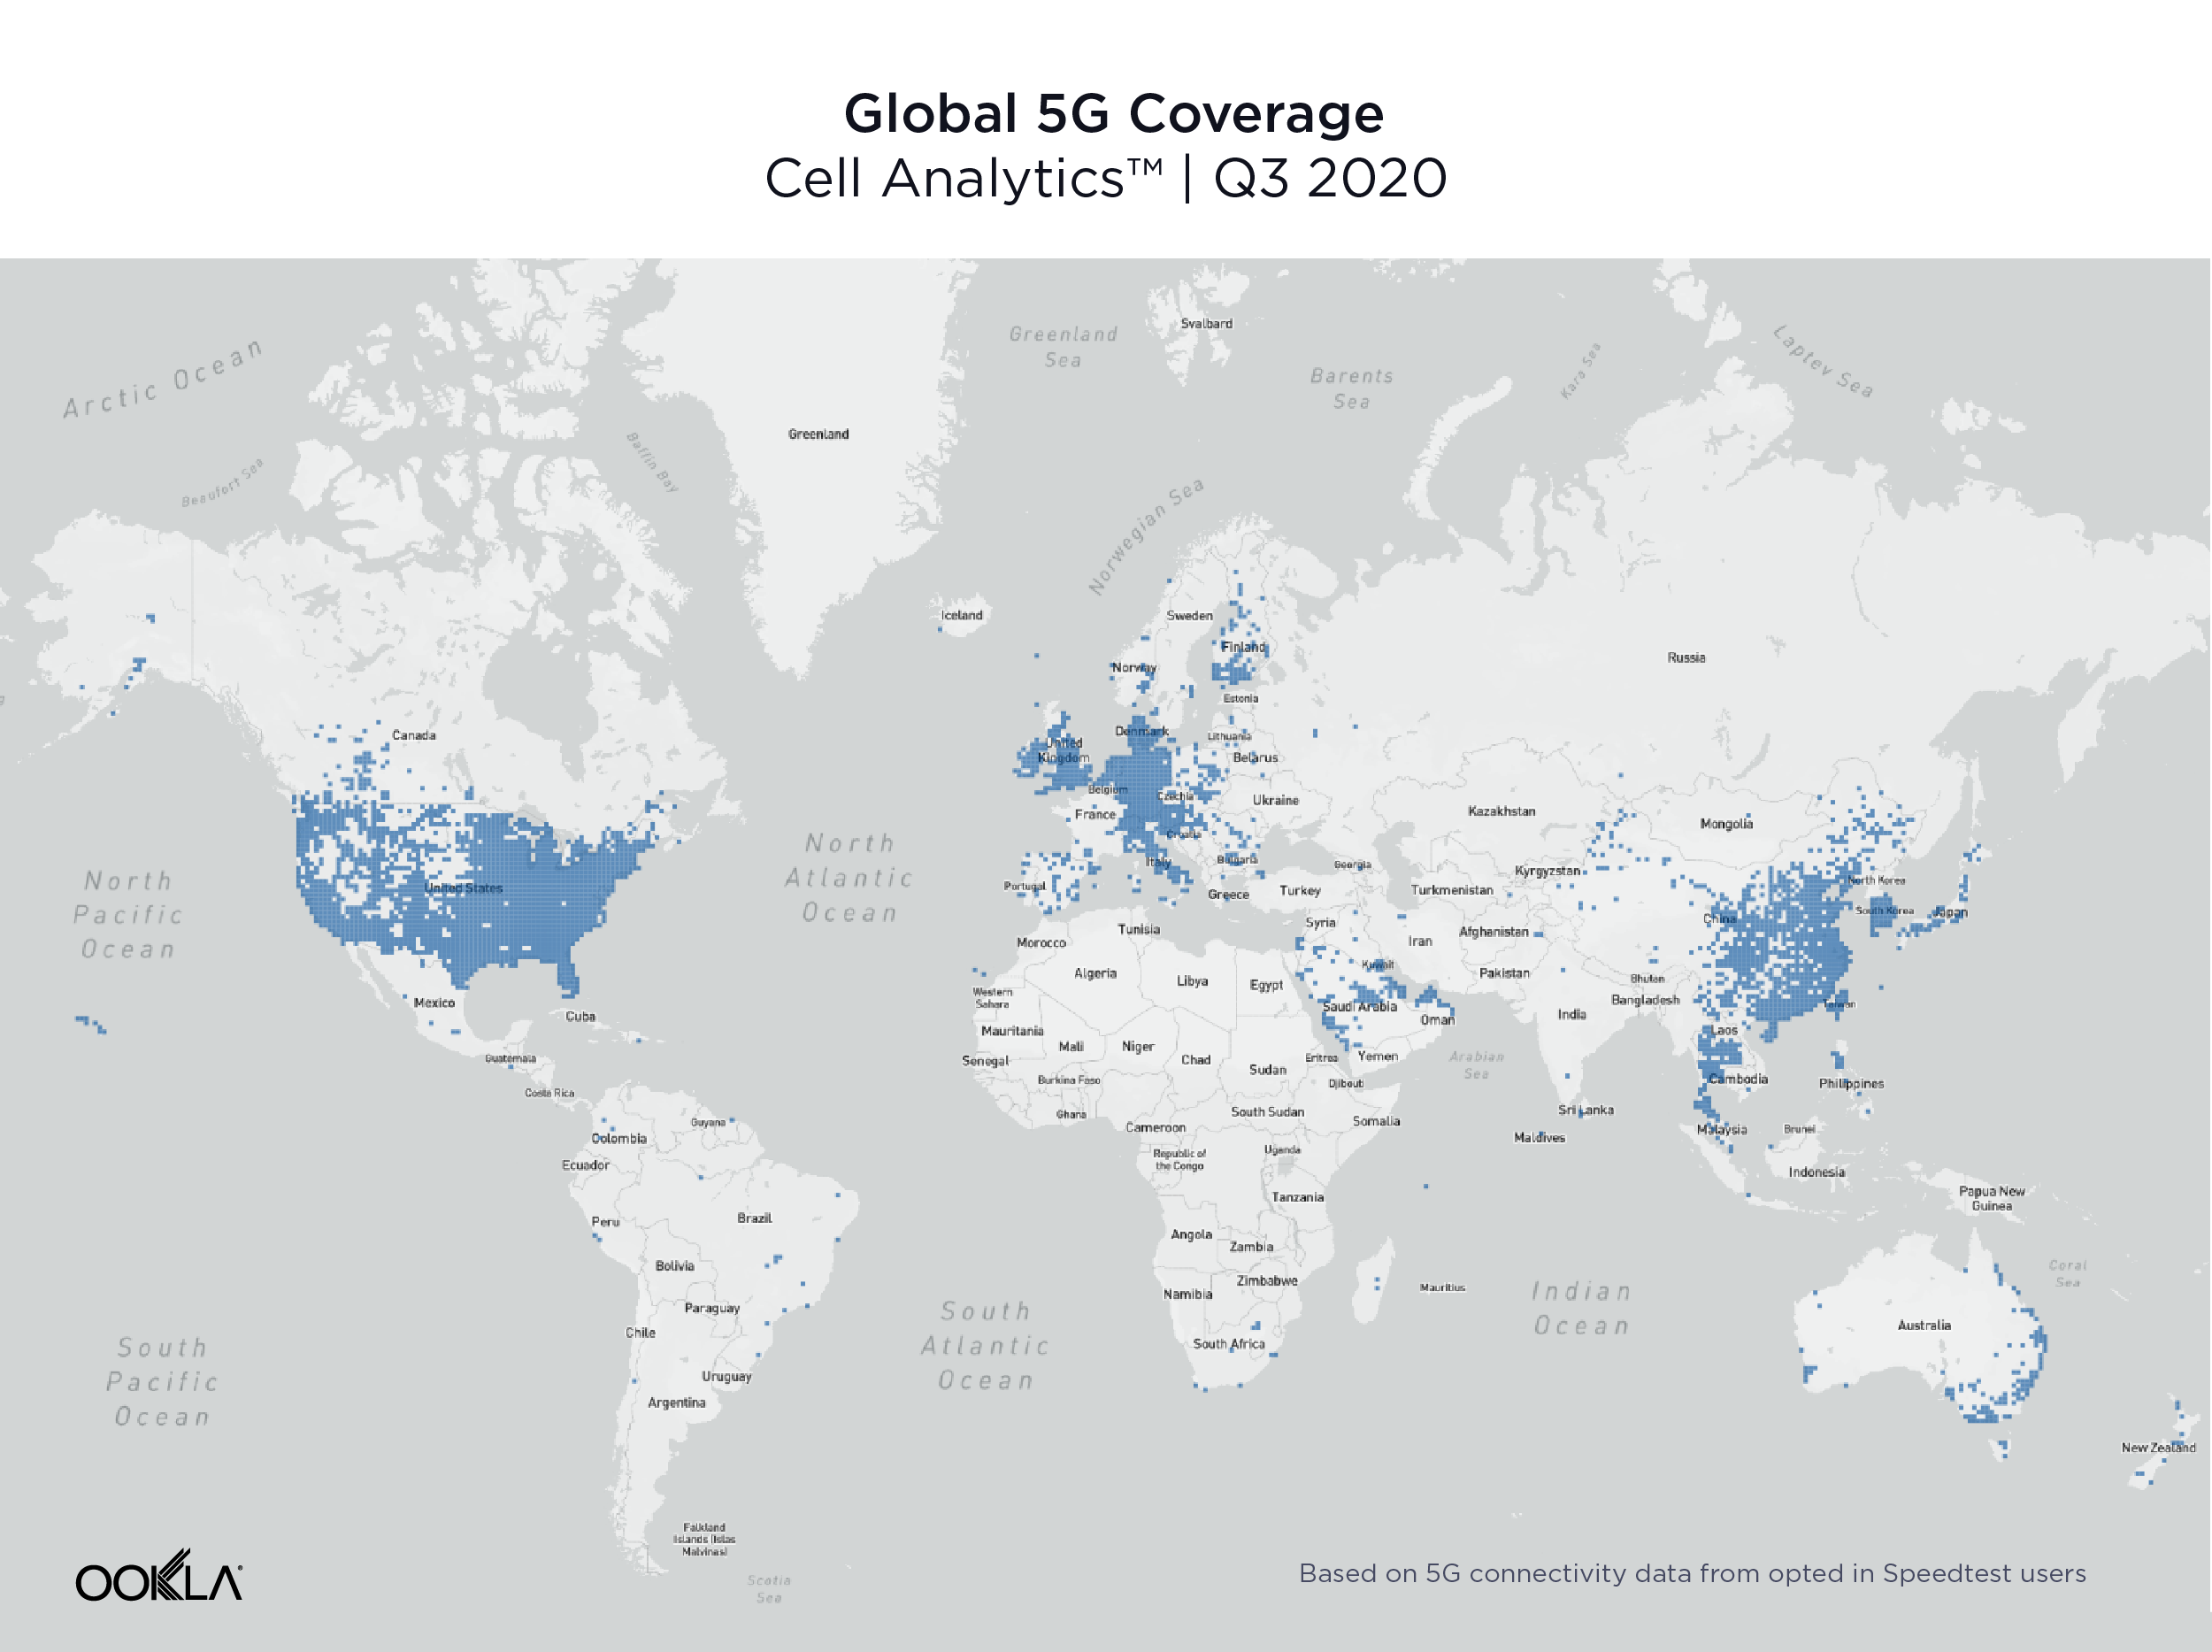
The U.S., Europe and Asia see widespread 5G coverage

Data from Cell Analytics™ shows a global view of 5G coverage in Q3 2020. This map, based on 5G connectivity data for opted-in Speedtest users, shows that 5G is spreading rapidly across the U.S., Europe, the Arabian Peninsula and Asia. In other regions, 5G is primarily available in larger cities, if at all.
Global-5G-Coverage_1220

99 countries worldwide had 5G, in 14,643 total cities

The number of countries with 5G deployments increased 62.3% between Q3 2019 and Q3 2020, with 99 countries having 5G deployments at the end of Q3 2020, according to the Ookla 5G Map™. There were 14,643 cities worldwide with 5G deployments at the end of Q3 2020, a 1,671% increase over Q3 2019. The total number of deployments worldwide was 17,046. The counts here and throughout this section include commercially available 5G as well as 5G networks with limited availability and those in pre-release.

Countries with the Most 5G Cities
Ookla 5G Map™ | Q3 2020
Country Numbers of Cities with 5G
United States 7,583
Germany 2,312
Austria 1,104
Netherlands* 1,009
Switzerland 554
Thailand* 325
Ireland 214
Puerto Rico 187
United Kingdom 169
Kuwait 97

The U.S. had the most cities with 5G deployments at the end of Q3 2020 with 7,583. Germany was second, Austria third, the Netherlands fourth and Switzerland fifth. A deployment is when a provider has some level of 5G presence in a city. A city can have multiple deployments when more than one provider is present.

Countries with the Largest Growth in Number of Deployments
Ookla 5G Map™ | Q3 2020
Country 5G Deployments as of Q3 2020 % Change Q3 2020 vs Q3 2019
Netherlands* 1,071 50,350%
Thailand* 451 32,401%
United States 7,808 21,566%
Germany 2,417 11,460%
Canada* 93 7,600%
Austria 1,173 4,918%
Ireland 236 4,180%
Poland 81 3,150%
Japan* 75 2,050%
Oman 50 2,000%

The Netherlands showed the largest percentage change in the number of 5G deployments between Q3 2019 and Q3 2020 with a 50,350% jump from two deployments in Q3 2019 to 1,071 in Q3 2020. Thailand saw the second largest percentage increase, the U.S. third, Germany fourth and Canada fifth.

Most early trials and commercial deployments of 5G spectrum allocations around the world have been centered around fallow swaths of the mid-band (3.3 GHz – 4.2 GHz) spectrum. With the recent commercialization of Dynamic Spectrum Sharing (DSS) across all major 5G infrastructure vendors, there is now increasing demand for 5G support on many existing 4G frequencies, ranging from 600 MHz to 2.5 GHz. In unique 5G markets like Japan, there is an additional need for the 4.5 GHz band as well as the millimeter wave (FR2).

In the United States, early deployments leveraged millimeter wave frequency bands in the 28 GHz and the 39 GHz, which delivered impressive speeds in a very constrained footprint. The rapid 5G deployment in the 600 MHz band has added a substantial nationwide 5G footprint — and with that, much wider 5G availability for many more Americans. With the recent merger between T-Mobile and Sprint, the deployment of 2.5 GHz spectrum has been significantly accelerated, which should improve both network efficiency and user experience on T-Mobile’s network. Additionally, next year’s availability of 5G Carrier Aggregation will allow T-Mobile to combine 600 MHz with 2.5 GHz to deliver improved 5G speeds on top of the existing nationwide footprint. In addition, DSS has recently been deployed by AT&T and Verizon, which allows operators to choose from existing low-band spectrum assets (850 MHz) and deliver both LTE and 5G at the same time. This feature alone doesn’t add a significant boost in perceived user experience, but will certainly improve the 5G footprint.

China showed the highest percentage of 5G test samples

Another way to measure 5G adoption is to look at the proportion of samples taken over 5G relative to the total number of samples on all technologies. Speedtest Intelligence is uniquely positioned to measure global growth in 5G because of the worldwide adoption of Speedtest apps. China had the highest percentage of 5G Speedtest results compared to other mobile technology types in Q3 2020 at 18.9%. South Korea was second, Hong Kong third, Puerto Rico fourth and Qatar fifth.

Countries with the Most 5G
Speedtest Intelligence® | Q3 2020
Country 5G Samples as a % of Total
China 18.9%
South Korea 15.8%
Hong Kong (S.A.R.)* 7.9%
Puerto Rico 6.7%
Qatar 5.7%
United States 5.5%
Netherlands* 4.9%
United Arab Emirates 4.6%
Kuwait 4.6%
Australia 4.2%

What 5G will look like in 2021

With recently announced device chipset advancements expected in 2021, including 5G Carrier Aggregation, operators will be able to combine two 5G frequency bands in the sub-6GHz (FR1) range, allowing not only faster speeds, but also greater coverage. More importantly, the ability to combine Frequency Division Duplexing (FDD) and Time Division Duplexing (TDD) FR1 channels will enable operators to leverage low-band frequencies (sub-1GHz) for uplink transmissions (user device to cell site), while combining the low-band with the mid-band (2.5 GHz, 3.5 GHz) on the downlink. This should significantly expand the availability of fast 5G download speeds across larger geographies.

Similarly, DSS — which is a stepping stone to standalone 5G and allows for the simultaneous delivery of 4G and 5G technology on the same spectrum slice — will enable operators to combine already-deployed FDD spectrum with dedicated mid-band spectrum for an enhanced standalone 5G experience. This will unlock the full potential of 5G networks, such as ultra low latency and network slicing, while delivering an improved mobile experience to users.

Where 5G fails to reach

During Q3 2020 Speedtest Intelligence showed 55 countries in the world (with more than 200 samples) where more than 20% of samples were from 2G and 3G connections (combined). These are countries where, in many cases, 5G is still aspirational. As excited as we are about the expansion of 5G, we do not want to see these countries left behind.

Countries That Still Rely Heavily on 2G and 3G Connections
Speedtest Intelligence® | Q3 2020
Country 2G & 3G Samples 4G Samples
Turkmenistan 74.9% 25.1%
Rwanda 52.3% 47.7%
Iraq 49.4% 50.6%
Belarus 46.5% 53.5%
Afghanistan 46.0% 54.0%
Antigua and Barbuda 40.2% 59.8%
Tajikistan 40.2% 59.8%
Suriname 39.7% 60.3%
Haiti 37.7% 62.3%
Syria 37.5% 62.5%
Ghana 36.0% 64.0%
Ethiopia 35.0% 65.0%
Mozambique 34.7% 65.3%
Benin 34.3% 65.7%
Angola 34.1% 65.9%
El Salvador 32.5% 67.5%
Moldova 31.8% 68.2%
Venezuela 30.3% 69.7%
Tanzania 30.0% 70.0%
Papua New Guinea 29.5% 70.5%
Jamaica 29.4% 70.6%
Sudan 29.2% 70.8%
Algeria 29.0% 71.0%
Namibia 28.5% 71.5%
Zimbabwe 28.5% 71.5%
Somalia 28.4% 71.6%
Nicaragua 28.1% 71.9%
Armenia 28.1% 71.9%
Bosnia and Herzegovina 28.1% 71.9%
Uzbekistan 27.8% 72.2%
Cameroon 27.5% 72.5%
Zambia 27.4% 72.6%
Uganda 26.6% 73.4%
Trinidad and Tobago 26.6% 73.4%
Honduras 26.5% 73.5%
Bangladesh 26.3% 73.7%
Burkina Faso 26.0% 74.0%
Ukraine 25.8% 74.2%
Nigeria 25.7% 74.3%
DR Congo 24.6% 75.4%
Costa Rica 24.3% 75.7%
Botswana 24.1% 75.9%
Libya 22.9% 77.1%
Azerbaijan 22.9% 77.1%
Ecuador 22.8% 77.2%
Mali 22.4% 77.6%
Mongolia 21.8% 78.2%
Maldives 21.6% 78.4%
Mauritius 21.3% 78.7%
Tunisia 21.0% 79.0%
Belize 20.7% 79.3%
Laos 20.5% 79.5%
Kenya 20.3% 79.7%
Paraguay 20.1% 79.9%
Côte d’Ivoire 20.0% 80.0%

In markets where 4G layers haven’t been deployed or substantially covered, end users fall back to the circuit-switched network (2G, 3G). These decades-old network technologies should be sufficient for basic voice and texting, social media, and navigation apps, but cannot deliver rich media experiences or video calling. Unfortunately, many countries on this list are places where consumers rely primarily on mobile phones for their internet connectivity.

5G is radically changing the speeds and capabilities of mobile networks around the world. If the current growth rate continues, it won’t be long before most nations have access to 5G. But there are nations and subsets of subscribers who may not see the benefits of 5G for years to come. We will continue reporting on 5G achievements across the globe and watching speeds in general on the Speedtest Global Index™.

Ookla retains ownership of this article including all of the intellectual property rights, data, content graphs and analysis. This article may not be quoted, reproduced, distributed or published for any commercial purpose without prior consent. Members of the press and others using the findings in this article for non-commercial purposes are welcome to publicly share and link to report information with attribution to Ookla.

| May 30, 2019

Mobile Speeds, 4G Availability and Coverage in Latin America’s Largest Markets

Leer en español | Leia em Português

Major markets in Latin America, in most cases, saw double-digit percent increases in mean mobile download speeds during the past year. While the only 5G deployments we’ve yet seen in Latin America are in Uruguay and Brazil, operators across the continent are working to expand 4G LTE and prepare for future technologies. Using data from Speedtest Intelligence we’ve examined mobile download speeds to see which countries are fastest and which are quickly improving. We’ve also analyzed which countries offer the best access to 4G and which operators are leading the way in speeds and coverage. For further context, we’ve included a look at speeds and 4G Availability in Central America.

Mobile speeds improved in most of Latin America’s major markets

As we saw last year, Peru had the fastest mean download speed of the group during Q1 2019, and the third largest year-over-year increase. Argentina showed the largest percentage increase and came in fourth during Q1 2019. Mexico is the exception with a second-place download speed but a 4% decline in mobile speed since last year.

Mobile Speeds in Latin America’s Largest Markets
Q1 2019 | Speedtest Data
Country Mean Download (Mbps) % Change YOY
Peru 23.07 15.4%
Mexico 22.02 -4.0%
Brazil 21.30 25.7%
Argentina 19.78 37.5%
Chile 18.47 13.6%
Colombia 17.36 10.3%

Fastest mobile operators

We also looked at the fastest mobile operator in each country during Q1 2019 using Speed ScoreTM (a weighted trimean that combines download and upload speeds) for top providers (operators with 3% or larger market share) on modern devices.

Claro, the Mexican-owned telecommunications company, achieved the highest Speed Score in Peru, Chile and Brazil. In Peru this was due to the combination of 700 MHz LTE and 300 Mbps LTE-A service. In Chile, Claro is mainly using the 700 MHz and 2600 MHz spectrum. Claro uses 700 MHz in Brazil to augment the existing 1800 MHz and 2600 MHz networks, and additional capacity is available in places like Rio de Janeiro where Claro has deployed a 1 Gbps capable License Assisted Access (LAA) network in select locations.

Fastest Operators in Latin America’s Largest Markets
Q1 2019 | Speedtest Data
Country Mobile Operator Speed ScoreTM
Argentina Personal 23.16
Brazil Claro 29.48
Chile Claro 23.53
Colombia TigoUNE 17.78
Mexico Telcel 26.20
Peru Claro 28.43

Personal delivered the fastest speeds in Argentina via 700 MHz, 1700 MHz and 2600 MHz plus carrier aggregation. Personal now provides service in over 1,350 towns and cities, having added 390 new locations in 2018. TigoUNE in Colombia launched LTE-Advanced speeds of up to 230 Mbps in parts of Bogota and Medellín. Mexico’s fastest operator, Telcel, has quietly started deploying gigabit class LTE to 76 cities throughout Mexico.

Cellular service is widely available while 4G Availability varies

Speedtest data shows that mobile users in Latin America’s largest markets were able to find service in 96% or more of surveyed locations. Chile showed the best General Availability at 99.7%. Colombia was second and Peru third. Brazil came in last for General Availability with 96.9%.

4G Availability in Latin America’s Largest Markets
Q1 2019 | Speedtest Data
Country General Availability 4G Availability
Chile 99.7% 78.9%
Colombia 99.3% 59.3%
Peru 99.2% 87.4%
Argentina 98.7% 76.9%
Mexico 98.3% 76.7%
Brazil 96.9% 54.9%

On the other hand, a mobile user’s ability to consistently access 4G is highly dependent on which country they live in. Customers in Peru have the best chance of connecting to LTE with a 4G Availability of 87.4%. Chile, Argentina and Mexico all show 4G Availability in the mid- to upper-70s. Brazil showed the worst 4G Availability in Latin America’s largest markets with mobile users accessing LTE a majority of the time in only 54.9% of surveyed locations.

Mobile operators with the best coverage

Coverage can be as important as speeds, especially in countries with large rural areas and/or difficult terrains. To better understand who offers the best coverage in a country, Ookla aggregates a score for coverage based on where each operator offers service and the average quality of service in those areas. The higher an operator’s Coverage ScoreTM for a given area, the more locations in that overall area where the operator has high quality service.

We looked at which of the top providers showed the best coverage in each country and found that Telcel, a subsidiary of América Móvil, in had the highest Coverage Score in Mexico during Q1 2019. Another América Móvil subsidiary, Claro had the best coverage in both Colombia and Argentina. Telefónica subsidiary Movistar topped the list in Peru and Chile and Vivo, also a subsidiary of Telefónica, had the best coverage in Brazil. Coverage Score is not comparable across countries due to differing geographies.

Operators with Best Coverage in Latin America’s Largest Markets
Q1 2019 | Speedtest Data
Country Mobile Operator Coverage ScoreTM
Argentina Claro 570
Brazil Vivo 547
Chile Movistar 690
Colombia Claro 638
Mexico Telcel 816
Peru Movistar 697

How Central American mobile speeds and availability compare

Smaller markets in Latin America also show interesting dynamics. While some parts of Central America have struggled with poverty, political unrest and corruption, others have not. What’s interesting is that mobile speeds and 4G Availability aren’t always hindered by these conditions in the ways that we might expect.

Mobile Speeds and Availability in Central America
Q1 2019 | Speedtest Data
Country Mean Download (Mbps) General Availability 4G Availability
Belize 23.30 99.4% 67.5%
Costa Rica 19.22 99.5% 45.7%
El Salvador 8.79 99.9% 34.9%
Guatemala 16.75 99.9% 65.9%
Honduras 21.29 99.5% 51.4%
Nicaragua 20.13 99.8% 45.8%
Panama 9.74 99.8% 74.4%

The good news is good. Belize showed the fastest mean download speeds over mobile in Central America in Q1 2019, faster even than those in Peru. Mobile download speeds in Honduras, Nicaragua and Costa Rica were also particularly strong and would place them in the mid- to upper-range if we combined Central America with the list of largest markets. General Availability is above 99% in all Central American countries and Panama showed the best 4G Availability at 74.4%.

The bad news is not great. While mean mobile download speeds in Panama and El Salvador are fast enough to stream HD video, they are much slower than in Latin America’s largest markets and place these countries in line with speeds experienced in Haiti. El Salvador also showed the lowest 4G Availability in Central America at 34.9%. 4G Availability in Nicaragua and Costa Rica was also relatively low at 45.8% and 45.7%, respectively.

We’ll continue watching these markets to see how improving speeds change rankings and how network enhancements affect 4G Availability. If you are interested in detailed views of these metrics and more, learn more about Speedtest Intelligence.


Velocidades, disponibilidad de 4G y cobertura de la telefonía móvil en los mercados más importantes de América Latina

En la mayoría de los casos, los principales mercados de América Latina experimentaron aumentos de dos dígitos en las velocidades medias de descarga móvil durante el año pasado. Mientras que la única implementación de 5G que se ha visto en América Latina se realizó en Uruguay, los operadores de todo el continente están trabajando para expandir el 4G LTE y prepararse para las tecnologías futuras. Con datos de Speedtest Intelligence, examinamos las velocidades de descarga móvil para ver en qué países son más rápidas y en cuáles están mejorando rápidamente. También analizamos qué países ofrecen el mejor acceso al 4G y qué operadores son los líderes en velocidad y cobertura. Para ofrecer un mayor contexto, incluimos un breve análisis de la disponibilidad de 4G en América Central.

Las velocidades móviles mejoraron en la mayoría de los principales mercados de América Latina

Como observamos el año pasado, Perú tuvo la velocidad media de descarga más rápida del grupo durante el primer trimestre de 2019 y el tercer mayor aumento interanual. Argentina mostró el mayor aumento porcentual y quedó cuarta durante el primer trimestre de 2019. México es la excepción, con el segundo lugar en velocidad de descarga, pero una disminución del 4 % en la velocidad móvil respecto del año pasado.

Velocidades móviles en los mercados más importantes de América Latina
Primer trimestre de 2019 | Datos de Speedtest
País Descarga media (Mbps) Porcentaje de cambio interanual
Perú 23,07 15,4%
México 22,02 -4,0%
Brasil 21,30 25,7%
Argentina 19,78 37,5%
Chile 18,47 13,6%
Colombia 17,36 10,3%

Operadores de telefonía móvil más rápidos

También analizamos el operador de telefonía móvil más rápido en cada país durante el primer trimestre de 2019 con Speed ScoreTM (un trimeano ponderado que combina las velocidades de carga y descarga) entre los principales proveedores (operadores con una cuota de mercado del 3 % o superior) en dispositivos modernos.

Claro, la compañía de telecomunicaciones mexicana, logró el mayor Speed Score en Perú, Chile y Brasil. En Perú, esto se debió a la combinación de los servicios LTE de 700 MHz y LTE-A de 300 Mbps. En Chile, Claro utiliza principalmente el espectro de 700 MHz y 2600 MHz. Claro emplea 700 MHz en Brasil para aumentar las redes existentes de 1800 MHz y 2600 MHz, y ofrece capacidad adicional disponible en lugares como Río de Janeiro, donde ha implementado una red de acceso asistido por licencia (LAA, License Assisted Access) con capacidad de 1 Gbps en lugares seleccionados.

Operadores de telefonía móvil más rápidos en los mercados más importantes de América Latina
Primer trimestre de 2019 | Datos de Speedtest
País Operador de telefonía móvil Speed ScoreTM
Argentina Personal 23,16
Brasil Claro 29,48
Chile Claro 23,53
Colombia TigoUNE 17,78
México Telcel 26,20
Perú Claro 28,43

Personal ofreció las velocidades más rápidas en Argentina con 700 MHz, 1700 MHz y 2600 MHz más Carrier Aggregation. Personal ya brinda sus servicios en más de 1350 pueblos y ciudades, después de sumar 390 nuevas localidades en 2018. En Colombia, TigoUNE lanzó velocidades de LTE-Advanced de hasta 230 Mbps en áreas de Bogotá y Medellín. El operador más rápido de México, Telcel, ha comenzado a implementar LTE de clase Gigabit en 76 ciudades de todo México.

El servicio celular está ampliamente disponible, pero la disponibilidad de 4G varía

Según los datos de Speedtest, los usuarios de telefonía móvil en los mercados más importantes de América Latina pudieron encontrar servicio en el 96 % o más de los lugares encuestados. Chile mostró la mejor disponibilidad general, con el 99,7 %. Colombia ocupó el segundo lugar y Perú, el tercero. Brasil quedó último en disponibilidad general, con el 96,9 %.

Disponibilidad de 4G en los mercados más importantes de América Latina
Primer trimestre de 2019 | Datos de Speedtest
País Disponibilidad general Disponibilidad de 4G
Chile 99,7% 78,9%
Colombia 99,3% 59,3%
Perú 99,2% 87,4%
Argentina 98,7% 76,9%
México 98,3% 76,7%
Brasil 96,9% 54,9%

Por otro lado, la capacidad de un usuario móvil de obtener un acceso constante a 4G depende ampliamente del país en el que vive. Los clientes en Perú tienen la mayor probabilidad de conectarse a LTE con una disponibilidad de 4G del 87,4 %. Chile, Argentina y México muestran una disponibilidad de 4G de entre el 75 y el 79 %. Brasil tuvo la peor disponibilidad de 4G entre los mercados más importantes de América Latina, ya que los usuarios de telefonía móvil obtuvieron acceso a LTE la mayor parte del tiempo en solo el 54,9 % de los lugares encuestados.

Operadores de telefonía móvil con la mejor cobertura

La cobertura puede ser tan importante como las velocidades, especialmente en países con grandes zonas rurales o terrenos difíciles. Para ayudar a comprender mejor quién ofrece la mejor cobertura en cada país, Ookla calcula una puntuación por cobertura basada en dónde brinda servicio cada operador y la calidad promedio del servicio en esas áreas. Cuanto mayor es la puntuación de Coverage ScoreTM de un operador para un área determinada, más son las ubicaciones de esa área general en las que el operador presta un servicio de alta calidad.

Analizamos cuál de los principales operadores brindó la mejor cobertura en cada país y concluimos que Telcel, una subsidiaria de América Móvil, obtuvo la mayor puntuación de Coverage Score en México durante el primer trimestre de 2019. Otra subsidiaria de América Móvil, Claro, tuvo la mejor cobertura tanto en Colombia como en Argentina. Una subsidiaria de Telefónica, Movistar, encabezó la lista en Perú y Chile, y Vivo, también subsidiaria de Telefónica, tuvo la mejor cobertura en Brasil. Debido a las diferentes geografías, las puntuaciones de Coverage Score no son comparables entre diferentes países.

Operador con mejor cobertura en los mercados más importantes de América Latina
Primer trimestre de 2019 | Datos de Speedtest
País Operador de telefonía móvil Coverage ScoreTM
Argentina Claro 570
Brasil Vivo 547
Chile Movistar 690
Colombia Claro 638
México Telcel 816
Perú Movistar 697

Comparación con las velocidades y la disponibilidad de la telefonía móvil en América Central

Los mercados más pequeños de América Latina también muestran dinámicas interesantes. Si bien en algunas partes de América Central ha habido dificultades relacionadas con la pobreza, la inestabilidad política y la corrupción, en otras no ha sido así. Resulta interesante destacar que las velocidades móviles y la disponibilidad de 4G no siempre se ven afectadas por estas condiciones de la manera que se podría esperar.

Velocidades y disponibilidad móviles en América Central
Primer trimestre de 2019 | Datos de Speedtest
País Descarga media (Mbps) Disponibilidad general Disponibilidad de 4G
Belice 23,30 99,4% 67,5%
Costa Rica 19,22 99,5% 45,7%
El Salvador 8,79 99,9% 34,9%
Guatemala 16,75 99,9% 65,9%
Honduras 21,29 99,5% 51,4%
Nicaragua 20,13 99,8% 45,8%
Panamá 9,74 99,8% 74,4%

Las buenas noticias son buenas. Belice exhibió las velocidades medias de descarga más rápidas de la telefonía móvil en América Central en el primer trimestre de 2019, superando incluso a las de Perú. Las velocidades de descarga móvil en Honduras, Nicaragua y Costa Rica también fueron especialmente potentes y colocarían a estos países en el rango medio a superior si combináramos América Central con la lista de los mercados más importantes. La disponibilidad general supera el 99 % en todos los países centroamericanos, y Panamá exhibió la mejor disponibilidad de 4G, con el 74,4 %.

Las malas noticias no son alentadoras. Si bien las velocidades medias de descarga móvil en Panamá y El Salvador son lo suficientemente rápidas como para transmitir videos en HD, son mucho más lentas que en los mercados más importantes de América Latina y colocan a estos países en línea con las velocidades experimentadas en Haití. El Salvador también exhibió la menor disponibilidad de 4G en América Central, con el 34,9 %. La disponibilidad de 4G en Nicaragua y Costa Rica también fue baja en términos relativos, con el 45,8 % y el 45,7 %, respectivamente.

Continuaremos atentos a estos mercados para ver cómo la mejora de las velocidades cambia las clasificaciones y de qué manera las mejoras en la red afectan la disponibilidad de 4G. Si desea obtener un análisis detallado de estas métricas y datos adicionales, consulte más información sobre Speedtest Intelligence.


Velocidades móveis, disponibilidade 4G e cobertura nos maiores mercados da América Latina

Os principais mercados da América Latina, na maioria dos casos, registraram aumentos de dois dígitos nas velocidades médias de download de dispositivos móveis durante o ano passado. Embora as únicas implantaçãoes 5G vistas na América Latina tenham sido realizadas no Uruguai e no Brasil, operadoras de todo o continente estão trabalhando para expandir o 4G LTE e se preparar para as próximas tecnologias. Usando dados do Speedtest Intelligence, examinamos as velocidades de download de dispositivos móveis para ver quais países são mais rápidos e quais estão melhorando rapidamente. Analisamos também quais países oferecem o melhor acesso ao 4G e quais operadoras lideram em termos de velocidade e cobertura. Por conta de um contexto mais abrangente, incluímos as velocidades e a disponibilidade do 4G na América Central.

As velocidades de dispositivos móveis melhoraram na maioria dos principais mercados da América Latina

Como vimos no ano passado, o Peru teve a velocidade média de download mais rápida do grupo durante o primeiro trimestre de 2019, e o terceiro maior aumento em relação ao ano anterior. A Argentina apresentou o maior aumento percentual e ficou em quarto lugar no primeiro trimestre de 2019. O México é a exceção, com o segundo lugar em velocidade de download, mas uma queda de 4% na velocidade de dispositivos móveis desde o ano passado.

Velocidades móveis nos maiores mercados da América Latina
1º trimestre de 2019 | Dados do Speedtest
País Download médio (Mbps) % de alteração de ano a ano
Peru 23,07 15,4%
México 22,02 -4,0%
Brasil 21,30 25,7%
Argentina 19,78 37,5%
Chile 18,47 13,6%
Colômbia 17,36 10,3%

Operadoras móveis mais rápidas

Também analisamos a operadora móvel mais rápida em cada país durante o primeiro trimestre de 2019 usando o Speed ScoreTM (um ajuste ponderado que combina velocidades de download e upload) para os principais provedores (operadoras com participação de mercado de 3% ou mais) em dispositivos modernos.

A Claro, empresa de telecomunicações mexicana, alcançou o maior Speed Score no Peru, no Chile e no Brasil. No Peru, isso se deveu àcombinação do serviço LTE de 700 MHz e LTE-A de 300 Mbps. No Chile, a Claro utiliza principalmente o espectro de 700 MHz e 2600 MHz. A Claro usa 700 MHz no Brasil para aumentar as redes existentes de 1800 MHz e 2600 MHz, e há mais capacidade disponível em lugares como o Rio de Janeiro, onde a Claro implantou uma rede de Acesso Licenciado e Assistido (LAA) com capacidade de 1 Gbps em locais selecionados.

Operadoras mais rápidas nos maiores mercados da América Latina
1º trimestre de 2019 | Dados do Speedtest
País Operadora móvel Speed ScoreTM
Argentina Personal 23,16
Brasil Claro 29,48
Chile Claro 23,53
Colômbia TigoUNE 17,78
México Telcel 26,20
Peru Claro 28,43

A Personal forneceu as velocidades mais rápidas na Argentina com 700 MHz, 1700 MHz e 2600 MHz, além da agregação de operadoras. A Personal presta serviços em mais de 1.350 cidades, com 390 novos locais em 2018. A TigoUNE, na Colômbia, lançou velocidades LTE-Advanced de até 230 Mbps em partes de Bogotá e Medellín. A operadora mais rápida do México, a Telcel, começou sem alarde a implantar o LTE de classe gigabit em 76 cidades em todo o México.

O serviço de celulares está amplamente disponível, enquanto a disponibilidade do 4G varia

Os dados do Speedtest mostram que os usuários de dispositivos móveis nos maiores mercados da América Latina conseguiram encontrar serviços em 96% ou mais dos locais pesquisados. O Chile apresentou a melhor disponibilidade geral, com 99,7%. A Colômbia ficou em segundo e o Peru em terceiro. O Brasil ficou em último lugar, com disponibilidade geral de 96,9%.

Disponibilidade do 4G nos maiores mercados da América Latina
1º trimestre de 2019 | Dados do Speedtest
País Disponibilidade geral Disponibilidade do 4G
Chile 99,7% 78,9%
Colômbia 99,3% 59,3%
Peru 99,2% 87,4%
Argentina 98,7% 76,9%
México 98,3% 76,7%
Brasil 96,9% 54,9%

Por outro lado, a capacidade de um usuário de dispositivos móveis de acessar de modo consistente o 4G depende muito do país em que ele mora. Os clientes do Peru têm a melhor chance de se conectar ao LTE, com uma disponibilidade de 87,4% para o 4G. A disponibilidade do 4G no Chile, na Argentina e no México ultrapassa os 70%. O Brasil tem a pior disponibilidade do 4G entre os maiores mercados da América Latina, com usuários móveis acessando o LTE na maior parte do tempo em apenas 54,9% dos locais pesquisados.

Operadoras móveis com a melhor cobertura

A cobertura pode ser tão importante quanto a velocidade, especialmente em países com grandes áreas rurais e/ou terrenos de difícil acesso. Para entender melhor quem oferece a melhor cobertura em um país, a Ookla agrega uma pontuação para cobertura com base no local em que cada operadora oferece serviço e na qualidade média do serviço nessas áreas. Quanto maior o Coverage ScoreTM de um operador para uma determinada área, mais locais nessa área geral o operador terá um serviço de alta qualidade.

Analisamos quais dos principais provedores apresentaram a melhor cobertura em cada país e descobrimos que a Telcel, uma subsidiária da América Móvil, teve o maior Coverage Score no México durante o primeiro trimestre de 2019. Outra subsidiária da América Móvil, a Claro, teve a melhor cobertura na Colômbia e na Argentina. A Movistar, subsidiária da Telefónica, liderou a lista no Peru e no Chile, e a Vivo, também subsidiária da Telefónica, teve a melhor cobertura no Brasil. O Coverage Score não é comparável entre países por causa das diferenças entre as regiões geográficas.

Operadora com melhor cobertura nos maiores mercados da América Latina
1º trimestre de 2019 | Dados do Speedtest
País Operadora móvel Coverage ScoreTM
Argentina Claro 570
Brasil Vivo 547
Chile Movistar 690
Colômbia Claro 638
México Telcel 816
Peru Movistar 697

Como as velocidades e a disponibilidade dos dispositivos móveis da América Central se saem na comparação

Os mercados menores na América Latina também apresentam dinâmicas interessantes. Enquanto algumas partes da América Central lutam contra a pobreza, a agitação política e a corrupção, outras não têm esses problemas. O interessante é que a disponibilidade do 4G e as velocidades dos dispositivos móveis nem sempre são prejudicadas por essas condições da maneira que poderíamos esperar.

Velocidades móveis e disponibilidade na América Central
1º trimestre de 2019 | Dados do Speedtest
País Download médio (Mbps) Disponibilidade geral Disponibilidade do 4G
Belize 23,30 99,4% 67,5%
Costa Rica 19,22 99,5% 45,7%
El Salvador 8,79 99,9% 34,9%
Guatemala 16,75 99,9% 65,9%
Honduras 21,29 99,5% 51,4%
Nicarágua 20,13 99,8% 45,8%
Panamá 9,74 99,8% 74,4%

A boa notícia é boa. Belize mostrou a mais rápida média de velocidade de download em dispositivos móveis da América Central no primeiro trimestre de 2019, mais rápida até do que no Peru. As velocidades de download em dispositivos móveis em Honduras, na Nicarágua e na Costa Rica também foram bem sólidas e colocariam esses países em uma faixa de média a alta se combinássemos a América Central com a lista dos maiores mercados. A disponibilidade geral está acima de 99% em todos os países da América Central, e o Panamá mostrou a melhor disponibilidade do 4G, com 74,4%.

A má notícia não é nada boa. Embora as velocidades médias de download em dispositivos móveis no Panamá e em El Salvador sejam rápidas o suficiente para transmitir vídeo em alta definição, elas são muito mais lentas do que nos maiores mercados da América Latina e colocam esses países alinhados com as velocidades experimentadas no Haiti. El Salvador também apresentou a menor disponibilidade de 4G da América Central, com 34,9%. A disponibilidade do 4G na Nicarágua e na Costa Rica também foi relativamente baixa, com 45,8% e 45,7%, respectivamente.

Continuaremos prestando atenção a esses mercados para ver como a melhoria da velocidade muda a classificação e como os aprimoramentos da rede afetam a disponibilidade do 4G. Se você estiver interessado em visualizações detalhadas dessas métricas e muito mais, saiba mais sobre o Speedtest Intelligence.
Ookla retains ownership of this article including all of the intellectual property rights, data, content graphs and analysis. This article may not be quoted, reproduced, distributed or published for any commercial purpose without prior consent. Members of the press and others using the findings in this article for non-commercial purposes are welcome to publicly share and link to report information with attribution to Ookla.