Key Messages
- 4G continues to expand in Africa, and 5G is on the operators’ radar. South Africa was the first country in the region to launch 5G, and has since been joined by a handful of countries: Seychelles, Zimbabwe, Botswana, Mauritius, Madagascar, and Togo.
- We examine 5G performance in South Africa in Q1 2022 vs. Q1 2021. In Q1 2022, MTN had the fastest median 5G download speed in South Africa at 213.37 Mbps, ahead of Vodacom (132.11 Mbps). MTN showed a strong improvement to its 5G Availability from Q1 2021 to Q1 2022, growing from 1.0% to 9.7%.
- Using Speedtest Intelligence® data, we analyzed mobile performance on modern chipsets during 2021. Southern Africa is the fastest region in Africa in terms of median download speed of 37.89 Mbps, followed by Northern Africa at 25.63 Mbps, Central Africa at 18.73 Mbps, Eastern Africa at 18.31 Mbps, and Western Africa at 17.00 Mbps.
- Johannesburg is the fastest city in sub-Saharan Africa.
Narrowing the digital divide for wider societal benefits
According to GSMA Intelligence, there were almost one billion mobile connections across sub-Saharan Africa (SSA) in Q1 2022. Unfortunately for those users, it’s no secret that mobile performance and coverage in Africa have been subpar. We examined the state of the North African market in June of 2021, but the time is long overdue to examine the state of networks specific to SSA.
Affordable 4G smartphones and targeted financing for under-served demographics are key for bridging the digital divide, but that’s not the only benefit: A World Bank study found that 4G coverage can help cut poverty by up to 4.3%. Additionally, the International Finance Corporation estimates a 10% boost to mobile broadband penetration in Africa could lift GDP per capita by 2.5%.
Southern Africa had the fastest median download speed across African regions
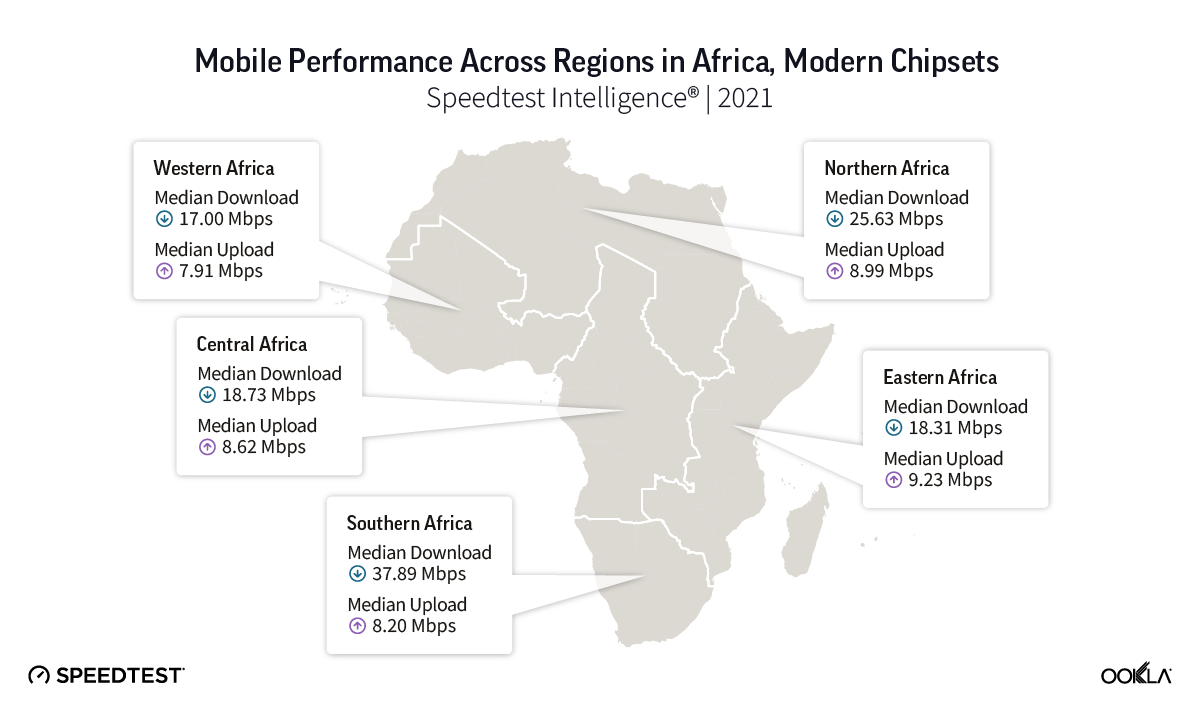
Using Speedtest Intelligence® data, we analyzed mobile performance on modern chipsets during 2021 (full year) across the African continent. Modern chipsets include all mobile tests, regardless of connection technology used, as long as they are taken on devices that are identified as being capable of achieving the fastest speeds available in a market. Ookla closely monitors the launch and widespread release of new device models built on chipsets capable of utilizing the latest mobile network technologies. We aggregated speeds across countries that fall within the five African regions as defined by the United Nations. When looking at median download speeds in 2021, Southern Africa ranked first, with a median download speed of 37.89 Mbps, followed by Northern Africa at 25.63 Mbps, Central Africa at 18.73 Mbps, Eastern Africa at 18.31 Mbps, and Western Africa at 17.00 Mbps.
Eastern Africa had the fastest median upload speed at 9.23 Mbps, followed by Northern Africa at 8.99 Mbps, Central Africa at 8.62 Mbps, Southern Africa (8.20 Mbps), and Western Africa (7.91 Mbps).
To support the growing demand for faster speeds there is a growing investment in both surface and undersea cables. For example, Google’s new subsea cable, the Equiano, landed in Togo in March 2022 and Nigeria in April 2022. The cable is set to become operational by the end of the year and is also expected to bring connectivity to areas such as Namibia, South Africa, and neighboring regions.
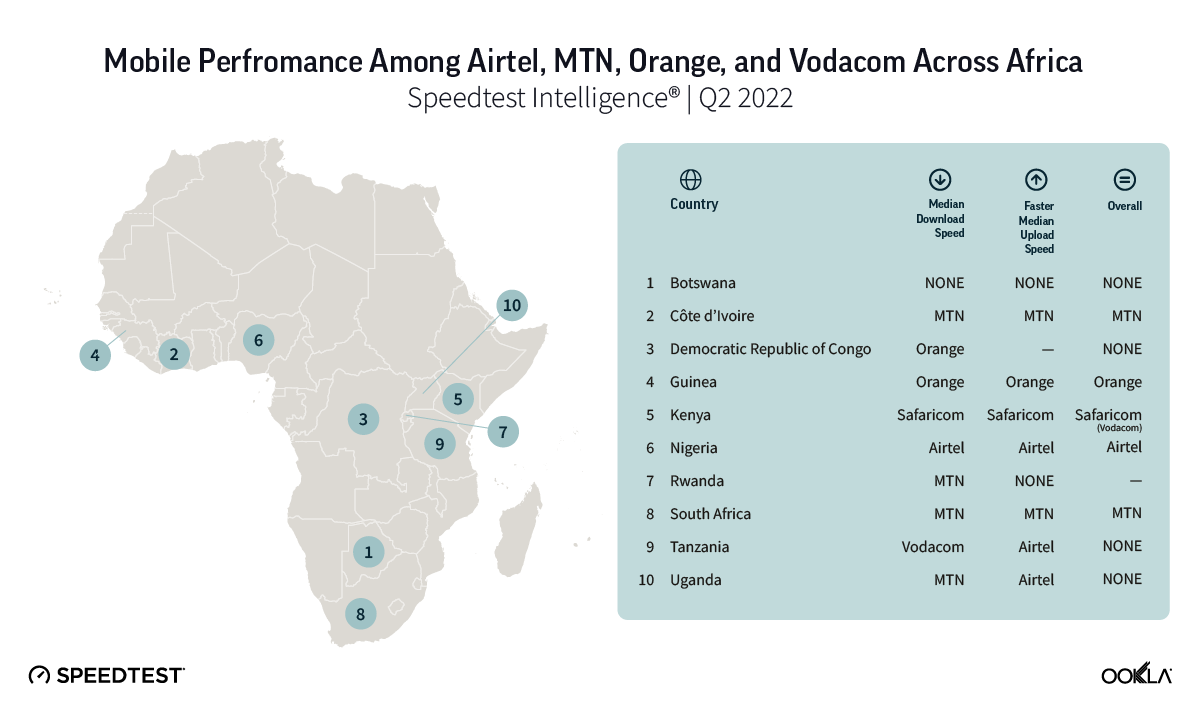
We have chosen nine countries for our analysis as they were home to over half (56%) of the region’s connections, including:
- Eastern Africa: Kenya, Tanzania, and Uganda;
- Southern Africa: Democratic Republic of Congo, South Africa, and Botswana;
- Western Africa: Côte d’Ivoire, Guinea, and Nigeria.
South Africa ahead of the pack for median download speed
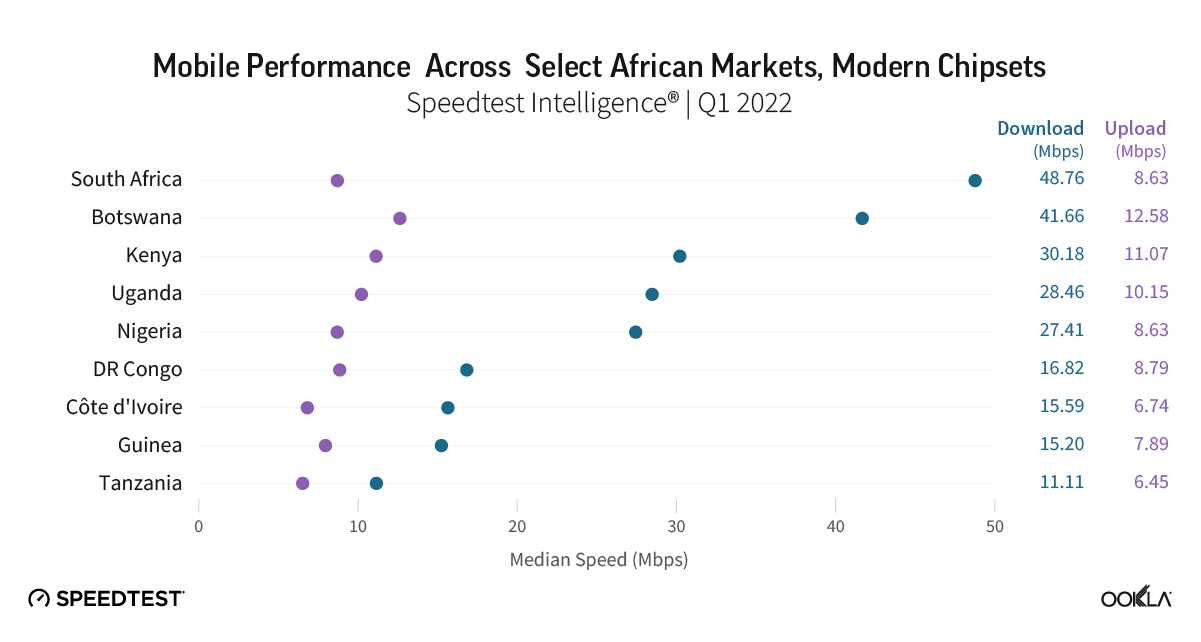
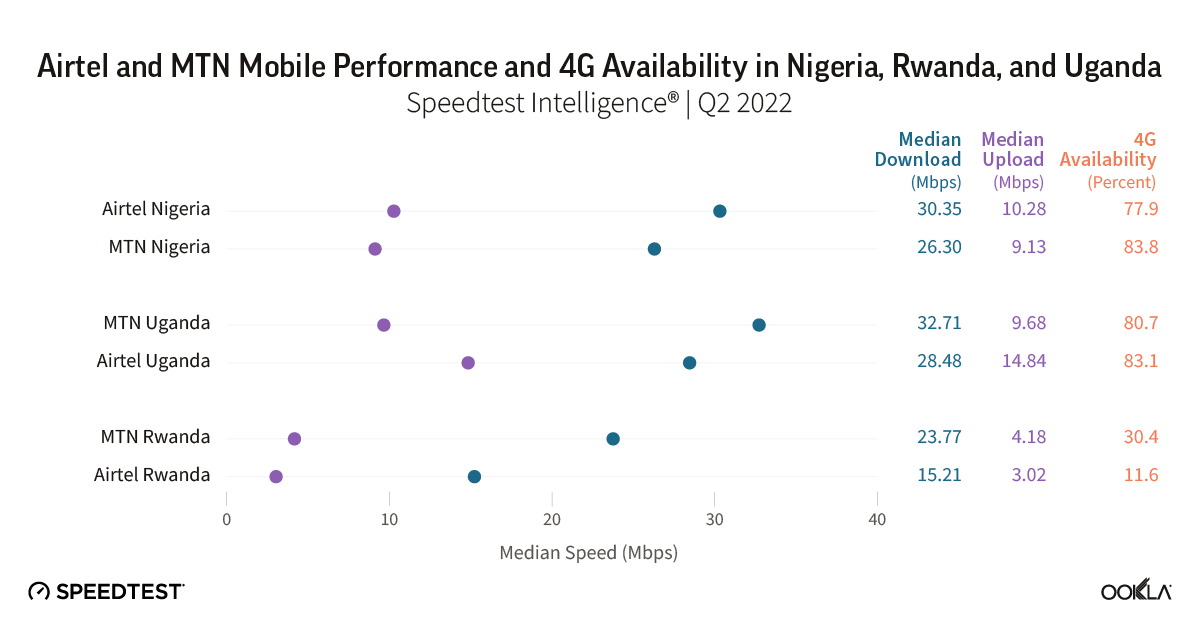
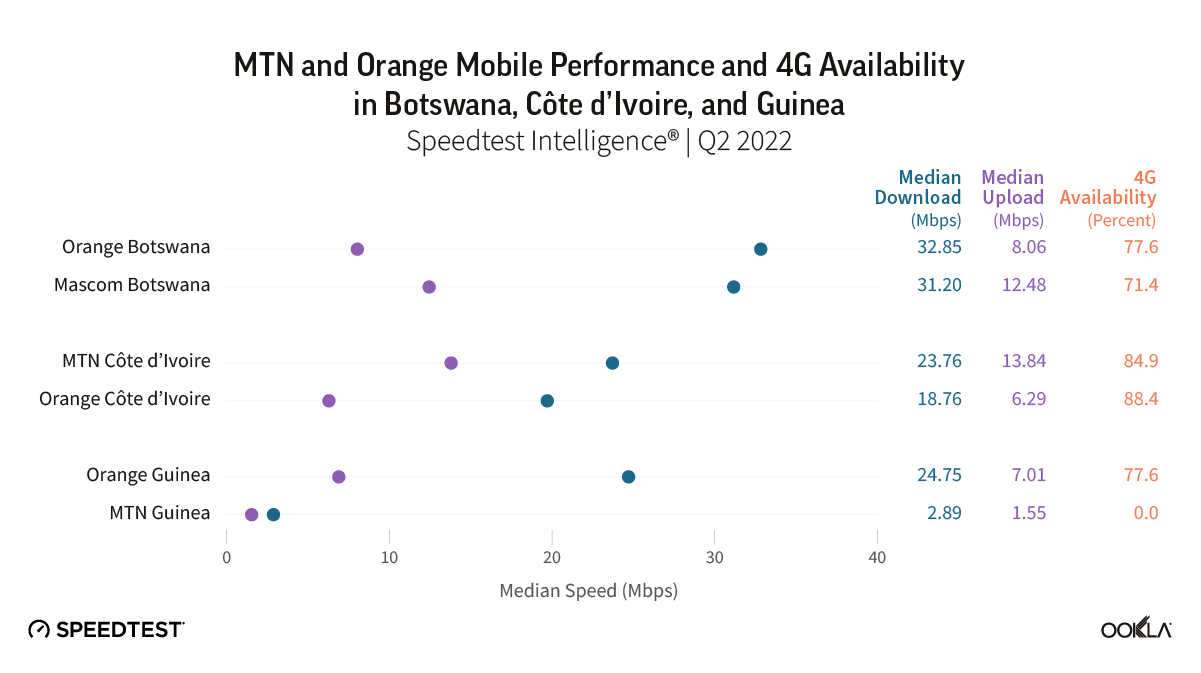
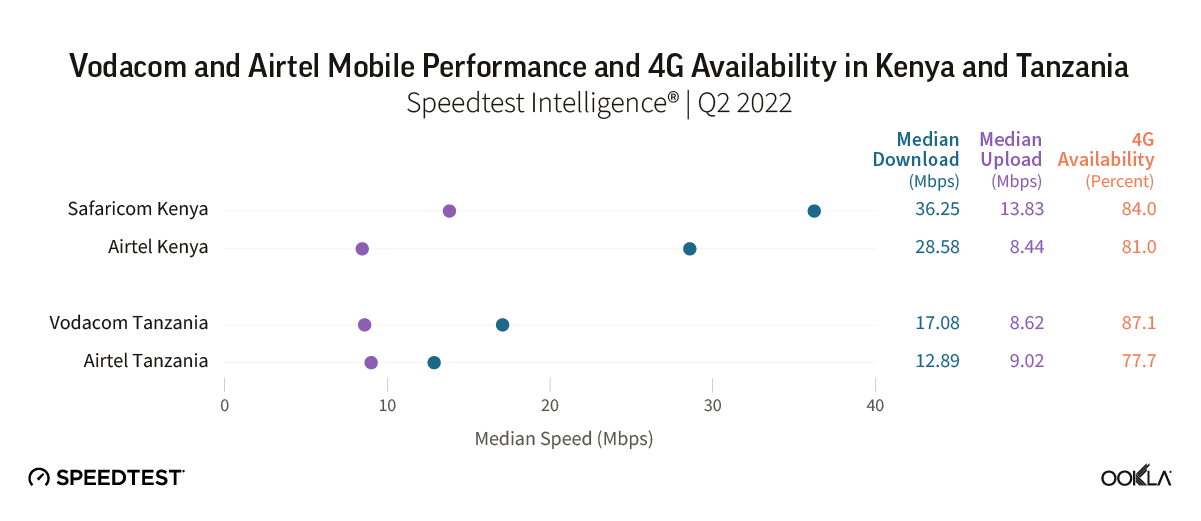
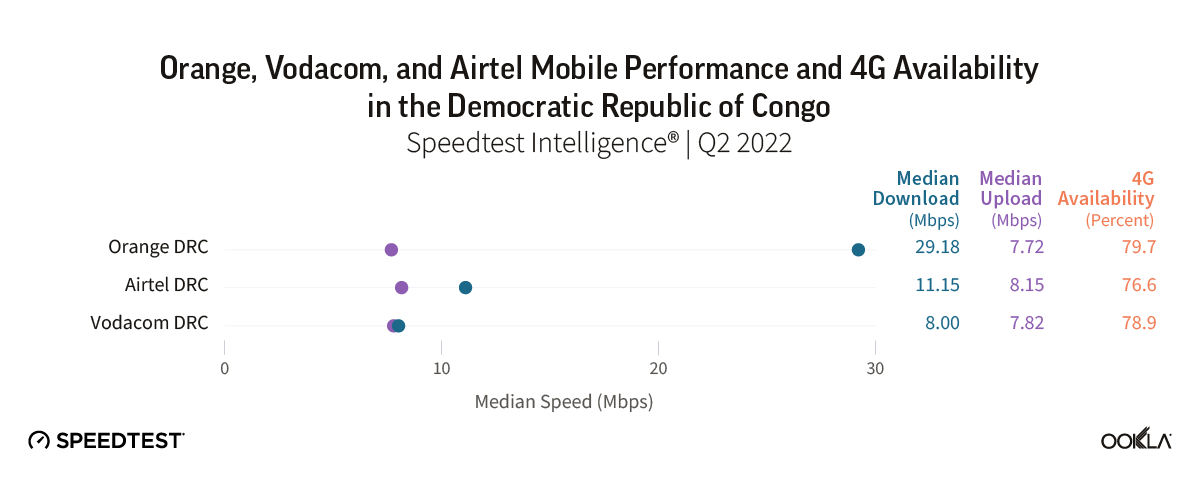
Analysis based on data from Speedtest Intelligence shows that mobile speeds varied widely across African countries during Q1 2022. When looking at mobile performance on modern chipsets across the nine countries of the SSA region, our results showed that median download speeds ranged between 11.11 Mbps (Tanzania) and 48.76 Mbps (South Africa). Median upload speeds were between 6.45 Mbps (Tanzania) and 12.58 Mbps (Botswana).
4G Availability was in excess of 50%
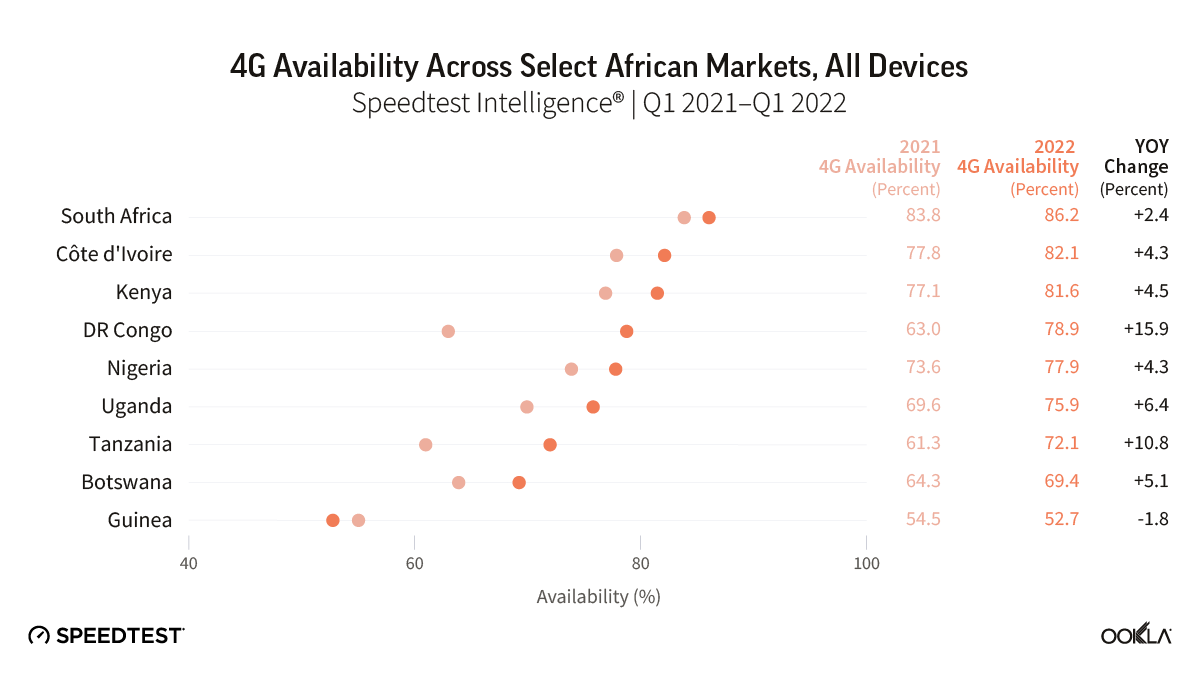
4G Availability describes the percentage of users on all devices who spend the majority of their time connected to 4G technology both roaming and on-network. Across the nine countries we looked at, 4G Availability exceeded 50% across the board. South Africa had the highest 4G Availability at 86.2%, followed by Côte d’Ivoire (82.1%), Kenya (81.5%), Democratic Republic of Congo (78.9%), Nigeria (77.9%), Uganda (75.9%), Tanzania (72.1%), and Botswana (69.4%). Guinea ranked last at 52.7%, largely because only Orange Guinea offers 4G services, utilizing 1800 MHz spectrum for which it was granted a license in March 2019. According to Ookla Map Elements®, Orange’s LTE network covers 14% of the Guinean population. However, that should change soon with MTN being awarded a 4G operating license in February 2022.
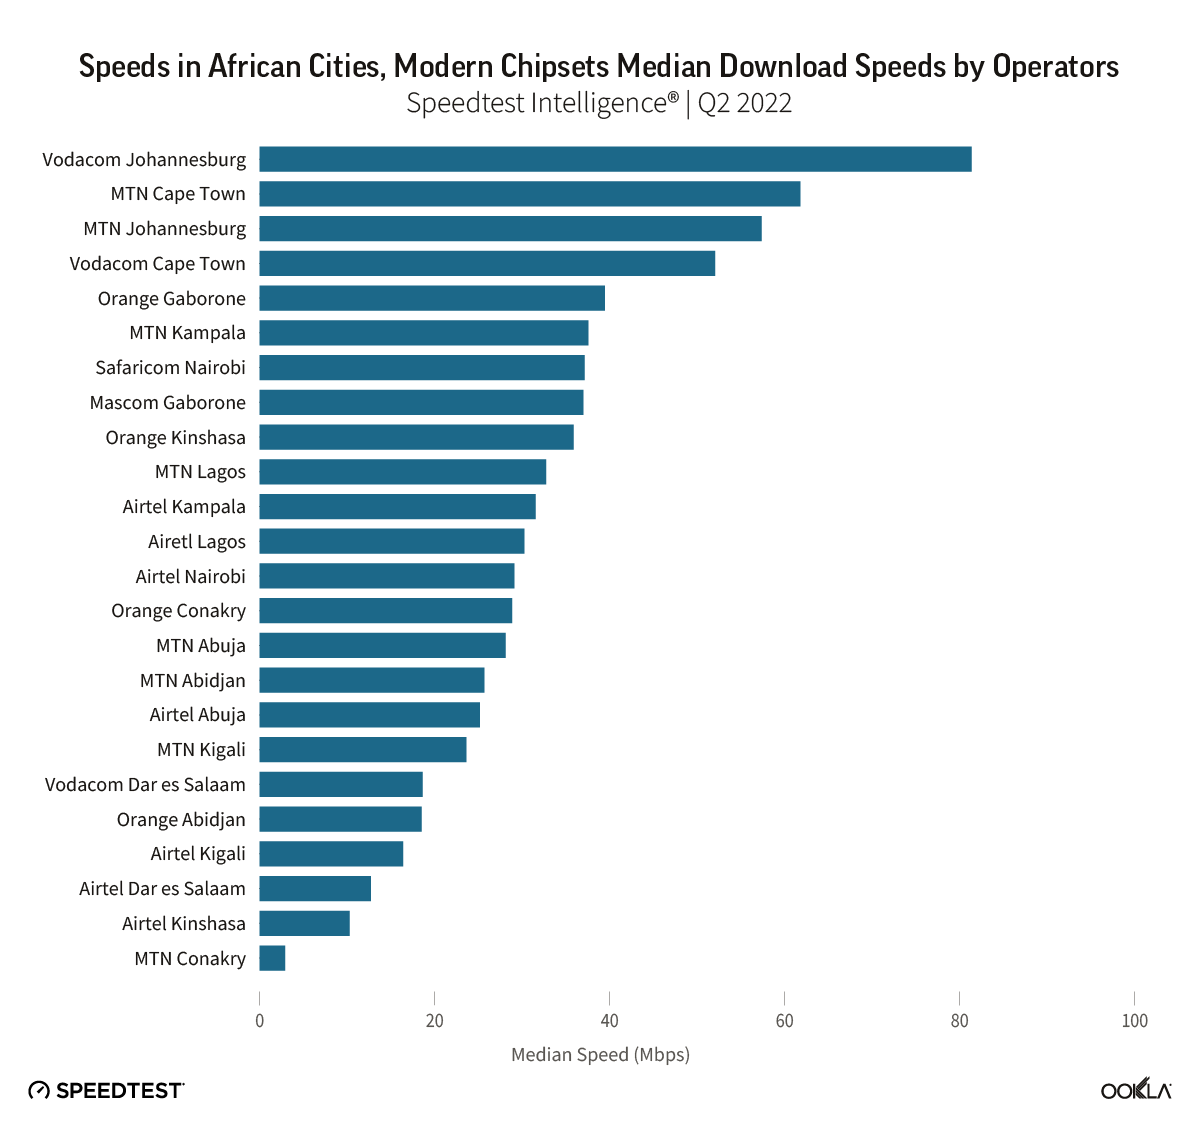
Johannesburg has the fastest median download speed among select African cities
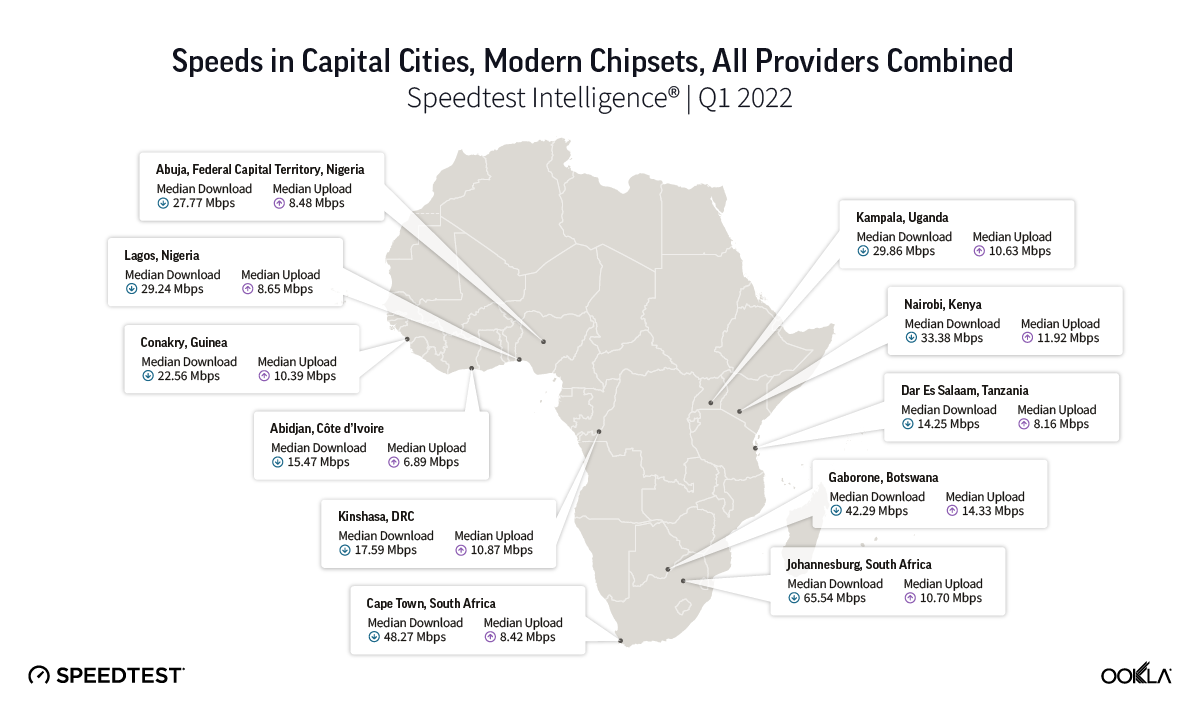
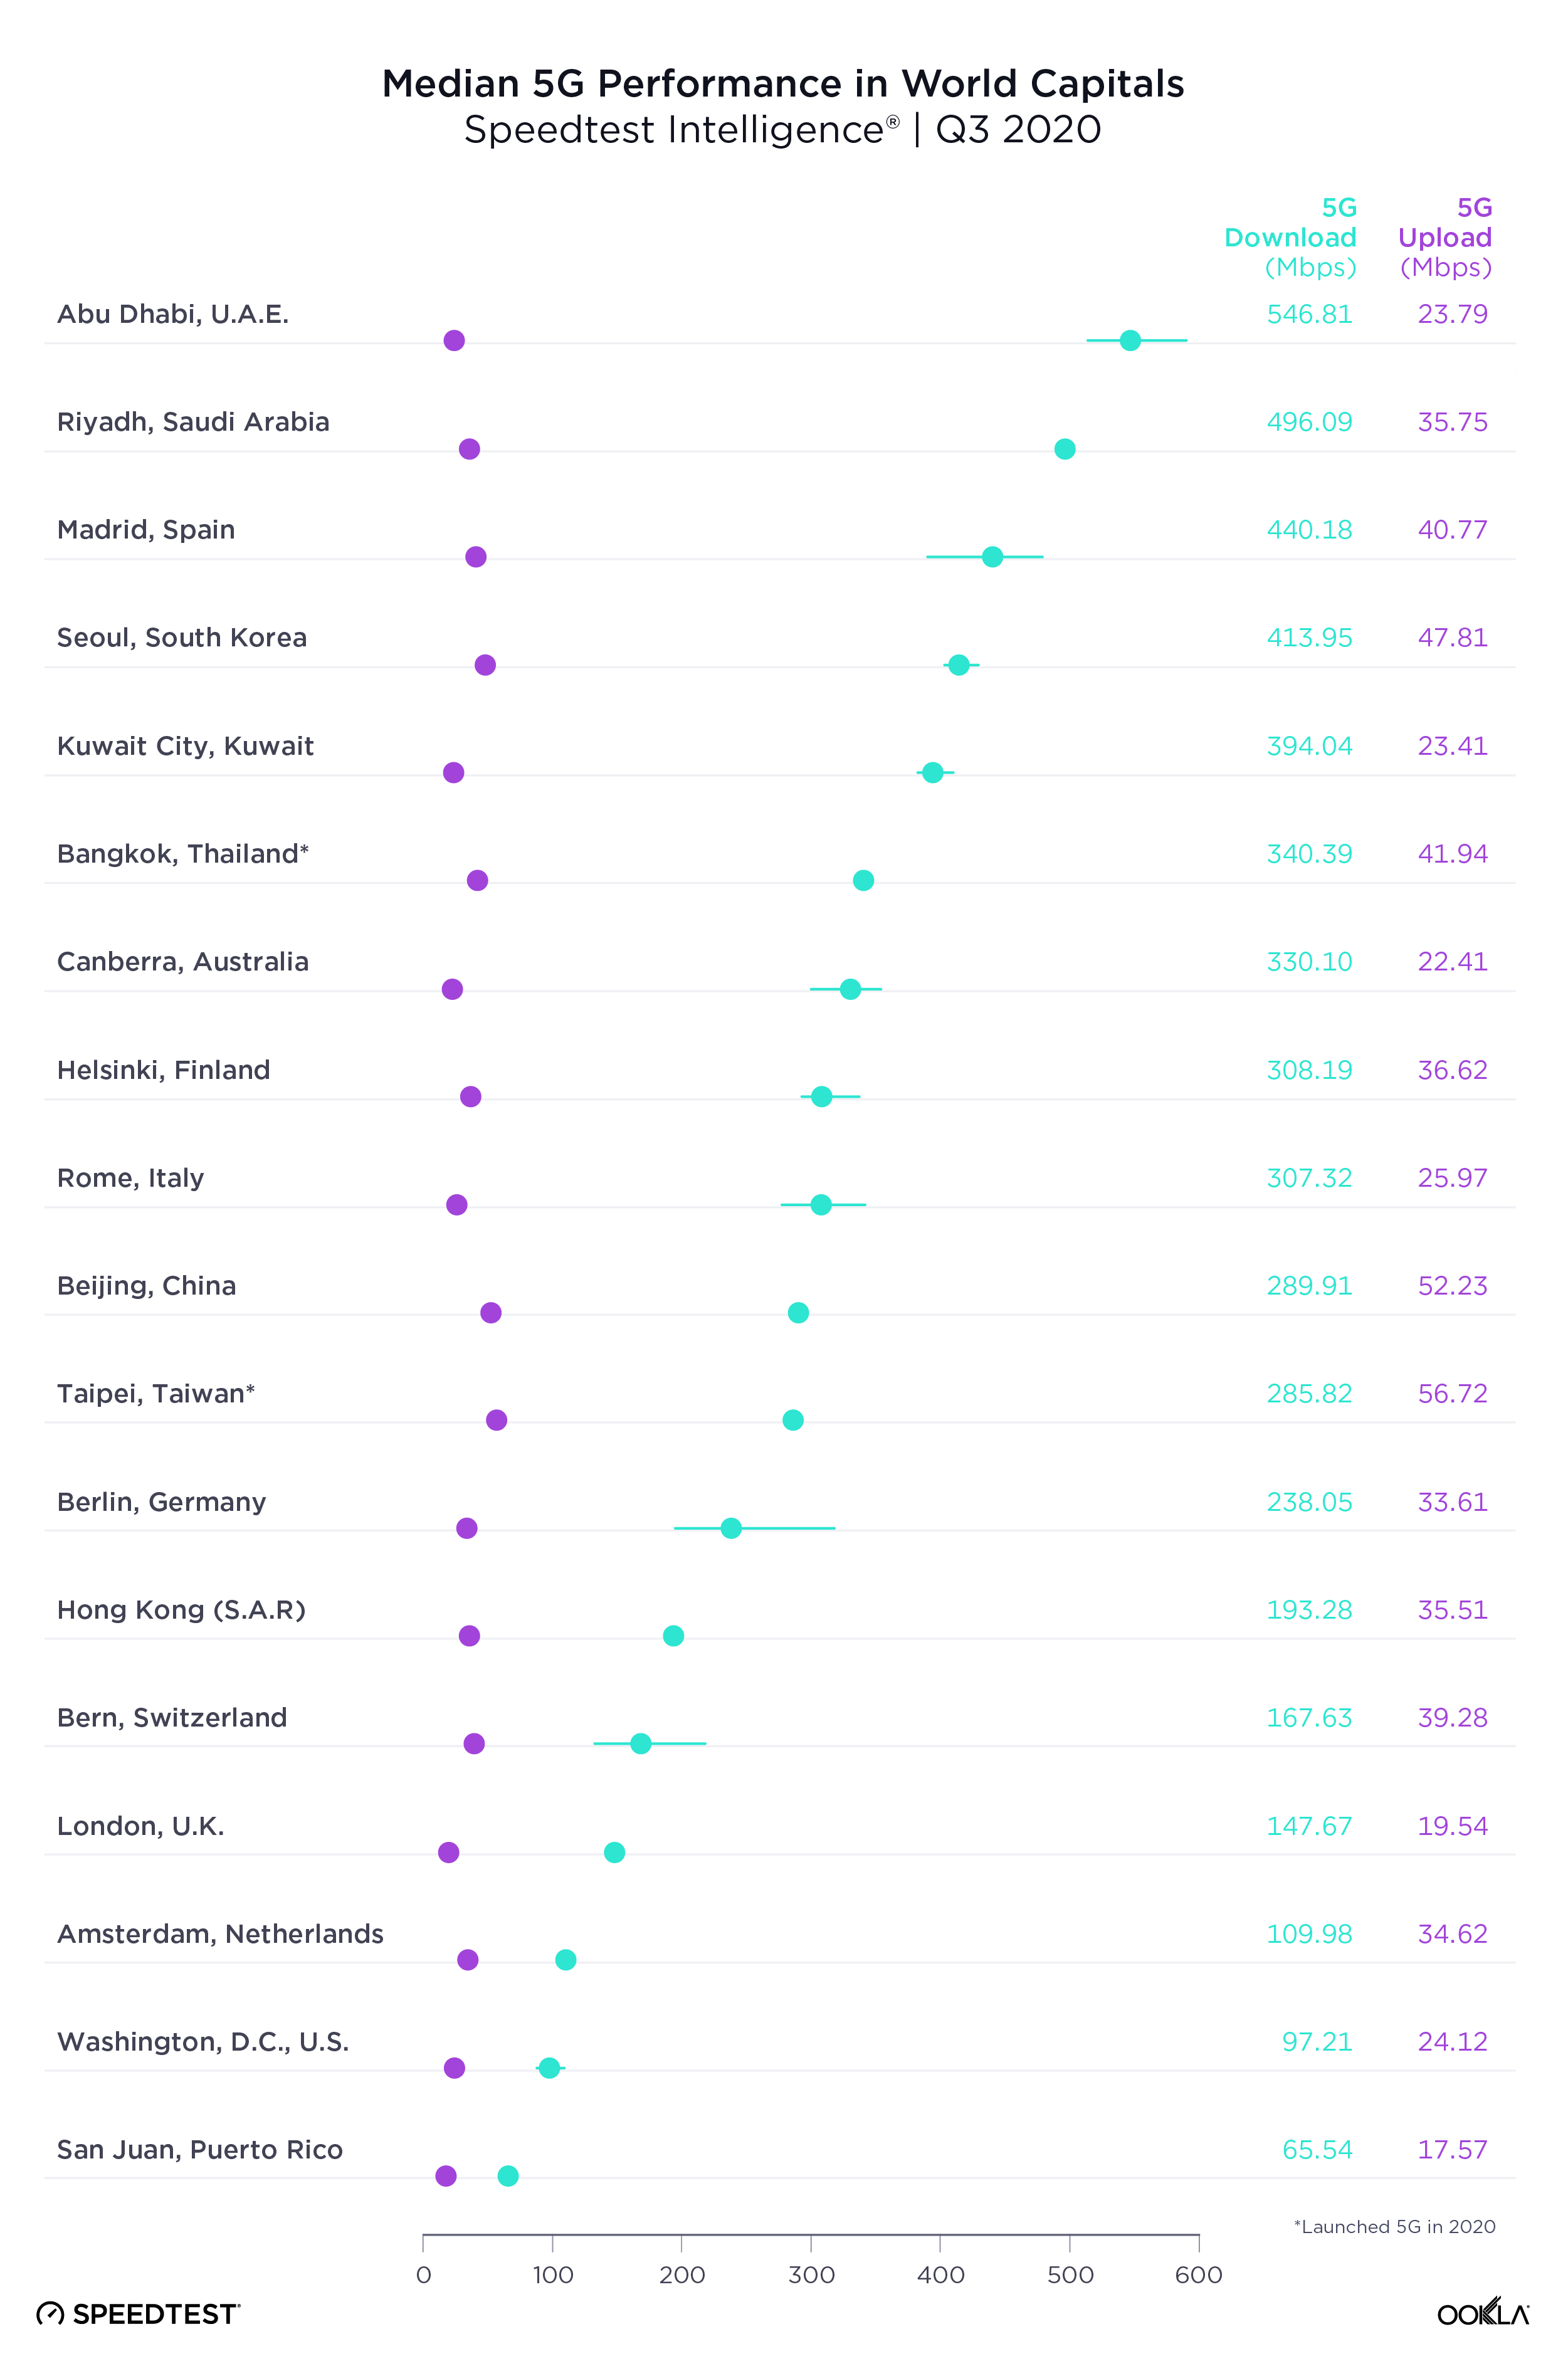
When it comes to speeds in select African capital cities, Johannesburg was fastest with a median download speed of 65.54 Mbps — nearly 35% faster than that of the next-fastest city, Cape Town at 48.27 Mbps.
Gaborone stood out for posting the third-fastest median download speed on the list at 42.29 Mbps. Meanwhile, Nairobi, Kampala, Lagos, and Abuja ranked closely together in terms of median download and upload speeds, with median download speeds ranging between 27.77 Mbps and 33.38 Mbps, with upload speeds ranging between 8.48 Mbps and 11.92 Mbps.
The early days of 5G in Africa show green fields for operators
As 4G continues to expand in Africa, 5G is on operators’ radar. In sub-Saharan Africa, the 5G journey has already begun, but it is still early days for 5G deployment and commercialization.
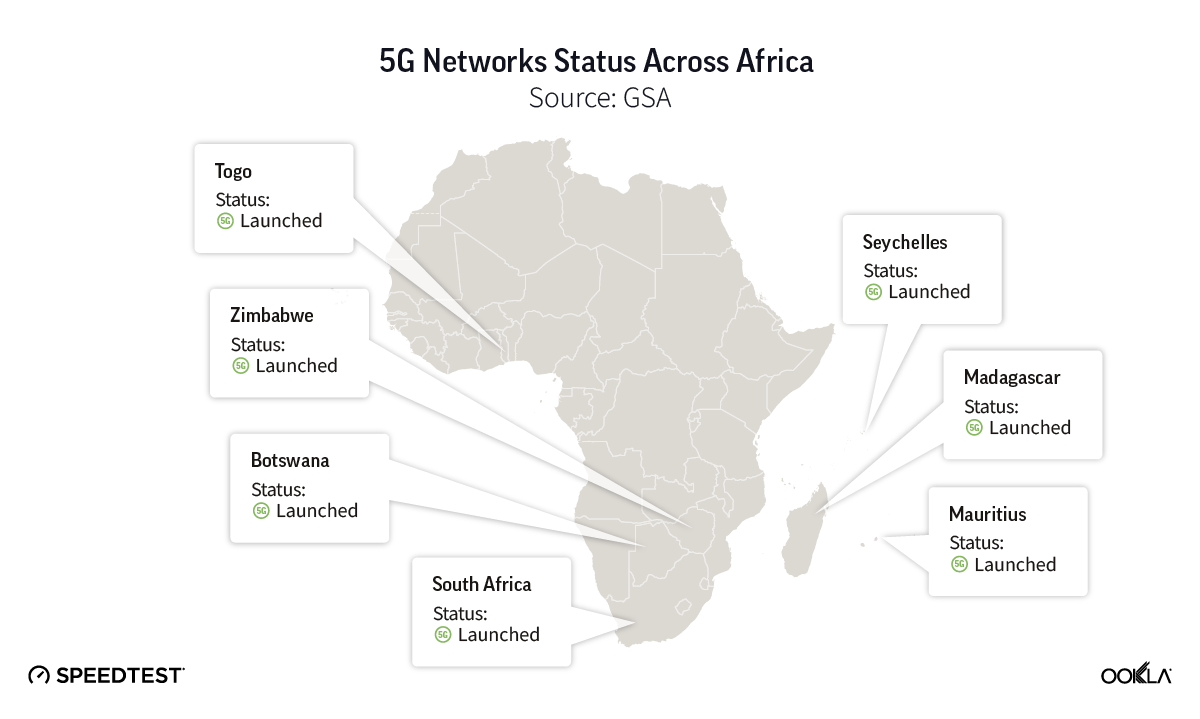
South Africa was the first country in the region to launch 5G, and has since been joined by a handful of countries: Seychelles, Zimbabwe, Botswana, Mauritius, Madagascar, and Togo. According to GSA, there were nine commercial 5G networks in seven markets across the region by the end of May 2022. In these markets, 5G coverage remains limited to major cities. Furthermore, just over two dozen operators are either planning, or testing 5G technology or are already in the deployment stage. Regulators across the regions have also started to make spectrum available for 5G.
BOTSWANA: In February 2022, Botswana Communications Regulatory Authority (BOCRA) offered existing and new operators an opportunity to apply for spectrum in 5G frequency bands, covering low and mid band spectrum. This will allow operators to expand their existing 4G networks and roll out 5G. Operators are allowed to re-farm their existing spectrum to augment new spectrum to enable them to roll out 5G. Shortly after, during the same month, Mascom launched four 5G sites in the capital Gaborone as part of plans to roll out 111 sites across Botswana by the end of 2022.
KENYA: The Communications Authority of Kenya (CA) developed a roadmap to facilitate 5G deployment. CA is preparing to reallocate spectrum in the 3500 MHz band, which was previously assigned for FWA networks in Kenya but will be refarmed for 5G by June 30, 2022. In May 2022, Safaricom was allocated 60 MHz of spectrum in the 2600 MHz band, which was previously used by the security agencies but has been released following a change in the technology that they use.
NIGERIA: In December 2021, MTN and Mafab Communication won 100 MHz TDD each in the 3.5 GHz spectrum band. In line with the terms and conditions of the concessions, the telcos are expected to commence the rollout of their 5G networks from August 24, 2022. While Airtel Africa pulled out of Nigeria’s 5G auction, its CEO Segun Ogunsanya stated they have sufficient spectrum in other bands to launch 5G.
SOUTH AFRICA: In March 2022, the Independent Communications Authority of South Africa (ICASA) completed a delayed 5G auction, selling spectrum across 700 MHz, 800 MHz, 2.6 GHz, and 3.5 GHz bands. Rain and Vodacom got new low-band frequency assets in the 700 MHz band while Telkom and MTN gained spectrum in 800 MHz. All bidders received spectrum in mid-bands, which is considered the sweet spot for 5G in terms of speed and availability.
MTN leads on 5G in South Africa
Despite the fact that the 5G spectrum auction was completed in March 2022, Vodacom and MTN launched 5G services beforehand using emergency, temporary spectrum allocated during the COVID-19 pandemic. The regulator released spectrum in April 2020 to help operators alleviate some of the challenges they faced in responding to the high demand for data during COVID-19.
In May 2020, Vodacom launched the first 5G network across Africa, in partnership with Nokia in the 3.5 GHz band. At the time of launch, the network was available in three cities — Johannesburg, Pretoria, and Cape Town — with a total of 190 5G sites. MTN followed in June 2020, using spectrum across 1800 MHz, 2100 MHz, and 3500 MHz bands. In its latest report, MTN reported that in 2021, it had over 1,000 5G sites across several spectrum bands with plans to significantly scale up with 3.5GHz spectrum.
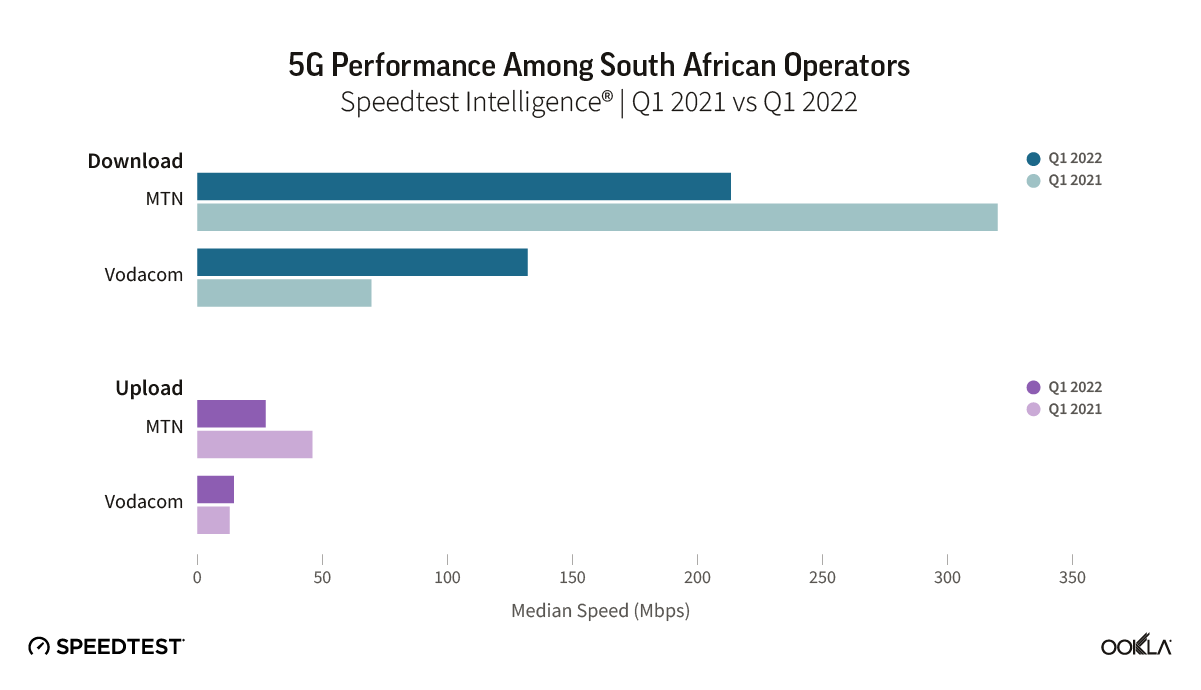
Using Speedtest intelligence data, we compared operators’ 5G performance in Q1 2022 against data from Q1 2021. In Q1 2022, MTN’s median 5G download speed reached 213.37 Mbps — decreasing by a third when compared to Q1 2021 (320.10 Mbps). Median upload speed suffered a nearly 40% decrease, going from 46.05 Mbps to 27.32 Mbps. When we examined the State of 5G Worldwide in 2021, we concluded that it’s common to see new mobile access technologies slow down as adoption scales, particularly early on in the tech cycle and as more users are logging on to existing 5G networks. As such, the downward tendency in MTN’s performance is not surprising at all. Vodacom, on the contrary, almost doubled its median 5G download speed from 69.93 Mbps to 132.11Mbps.
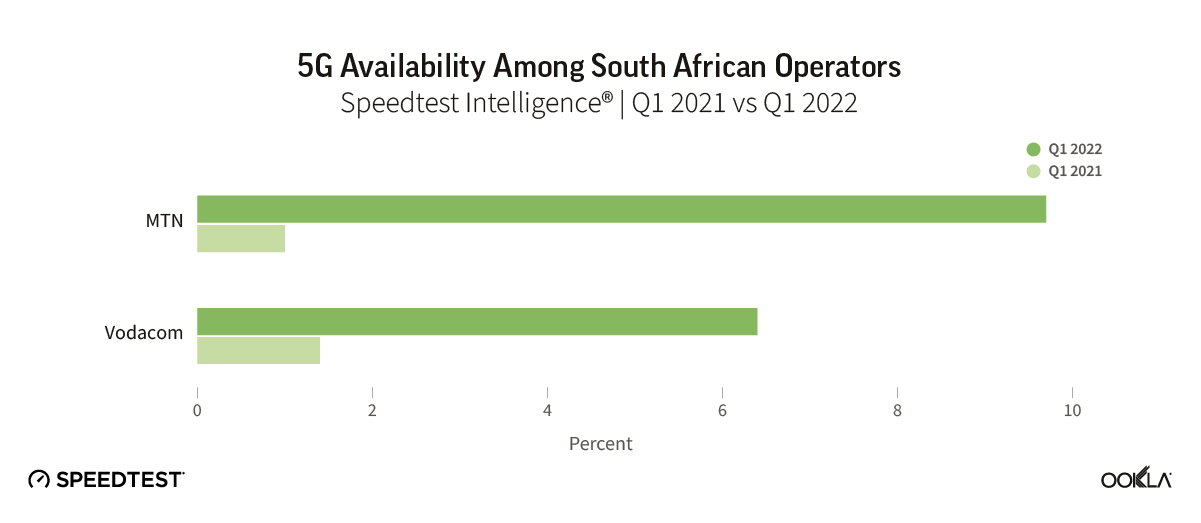
5G Availability, which describes the percent of users on 5G-capable devices that spend the majority of their time on 5G, continues its upward trajectory across South Africa, from just 0.9% in Q1 2021 to 5.6% in Q1 2022. MTN had shown a stronger improvement to its 5G Availability in the Q1 2021 to Q1 2022 period than its rival, growing from 1.0% to 9.7%.
Since the award of temporary spectrum in 2020, MTN has intensified its investment to increase network coverage, improve speeds, and enhance the overall customer experience. The operator has also invested in an expansion drive into rural and peri-urban areas and a major 5G rollout, reaching 15% of South Africa’s population at the end of 2021. MTN is also planning to extend its 5G coverage to 25% of the population by the end of 2022, and 60% by 2025. As part of MTN’s “Modernization of Network South Africa” (MONZA) project, MTN has been allocating a budget to extend network reach into rural communities, support 5G expansion, and restore vandalized infrastructure: ZAR 624 million ($38.7m) for Eastern Cape, ZAR 749 million ($46.5m) for Western Cape, ZAR 820 million ($50.9m) in Limpopo and Mpumalanga.
Vodacom’s 5G Availability had grown from 1.4% in Q1 2021 to 6.4% in Q1 2022. Vodacom reported in its FY 2022 results (for year ended March 2022) that in South Africa, capital expenditure was directed at improving capacity and resilience of the network and increasing 5G roll-out. As of March 2022, the operator’s 4G network covered 97.9% of the population, and it had also extended 5G sites to 624.
This investment drive is paying off. According to ICASA’s report, 5G population coverage reached 7.5% in 2021, an increase from a mere 0.7% in 2020. However, there is a disparity between urban and rural population coverage. 5G was present across all of the urban provinces, with Kwazulu-Natal in the lead with 20% 5G population penetration, while only three regions (Free State, Gauteng, and Western Cape) reported 1-2% population coverage in rural areas.
Having invested into spectrum and network roll-out, the operators look for ways to monetize 5G. For example, MTN has partnered with Australia’s Emerge Gaming to allow people to play cloud games on their Huawei P40 Pro phone using MTN’s 5G network. This is all in order to attract more consumers, especially video games’ enthusiasts. MTN also partnered with Huawei South Africa, Miniandante Mining, and Minetec Smart Mining to transform old mining processes using 5G.
African nations still face many hurdles to modernizing networks
It is still early days for 5G across most of Africa. South Africa is leading the region having launched commercial networks in 2020. One of the key challenges across Africa in terms of network rollouts regardless of technology relate to the cost of mobile base stations, the backhaul technology that connects mobile sites to the core network, and energy supply.
Recent World Bank report points to the three main areas where infrastructure costs can be prohibitive in rural settings, such as the mobile base station, the backhaul technology that connects mobile sites to the core network, and energy supply. To alleviate the challenges operators are taking steps and looking to innovative approaches to improve the situation. For example, Orange DRC partnered with NuRAN to construct and operate 2,000 solar-powered mobile towers, with a particular focus on rural communities, which will cover at least 10 million people in rural areas. These lower-cost “light towers,” are better suited to covering remote locations with small populations and come with significant cost savings. One of the reasons for lower costs is being powered by renewable energy solutions, particularly solar, rather than more expensive diesel generators.
Device affordability is another issue. There are currently a few initiatives across the continent aimed at expanding connectivity to areas where it’s lacking. For instance, Google partnered with Safaricom in Kenya for a program that allows customers to pay for 4G-enabled phones in installments, while MTN Uganda reinforced a partnership with M-Kopa in March 2022 to introduce 4G smartphones on installment payment terms. MTN also inked a partnership with M-Kopa in 2021 that facilitated the sale of more than 70,000 smartphones, financing over 2 million customers across Africa. Orange in Cote d’Ivoire launched a similar initiative in partnership with Yabx and Cofina. Yabx, a Dutch firm that offers credit across multiple countries in Africa, will provide the technology and manage the complete customer journey that will enable Cofina, an Ivorian financial institution that provides SME financing, to launch plans for Orange subscribers. Bringing 5G devices into the African markets will be even more challenging.
Operators continue to innovate and we are keeping a close eye on how the network deployments are progressing and the network performance end users experience. If you are interested in benchmarking your performance or if you’d like to learn more about internet speeds and performance in other markets around the world visit the Speedtest Global Index™.