The holiday travel season is fast approaching in the United States and with it the anticipation of spending more time than you’d hoped at the airport. To help you know whether you’ll have the speeds you need to freely stream videos or whether you’ll need to download those shows in advance, we’ve expanded our previous analysis to examine free airport Wi-Fi at 50 of the busiest airports in the U.S. We’ve also taken a look at some of the other Wi-Fi options available at airports across the country to see how you can get the best network experience (even if you have to pay for it).
Free Wi-Fi at 17 airports beat 100 Mbps
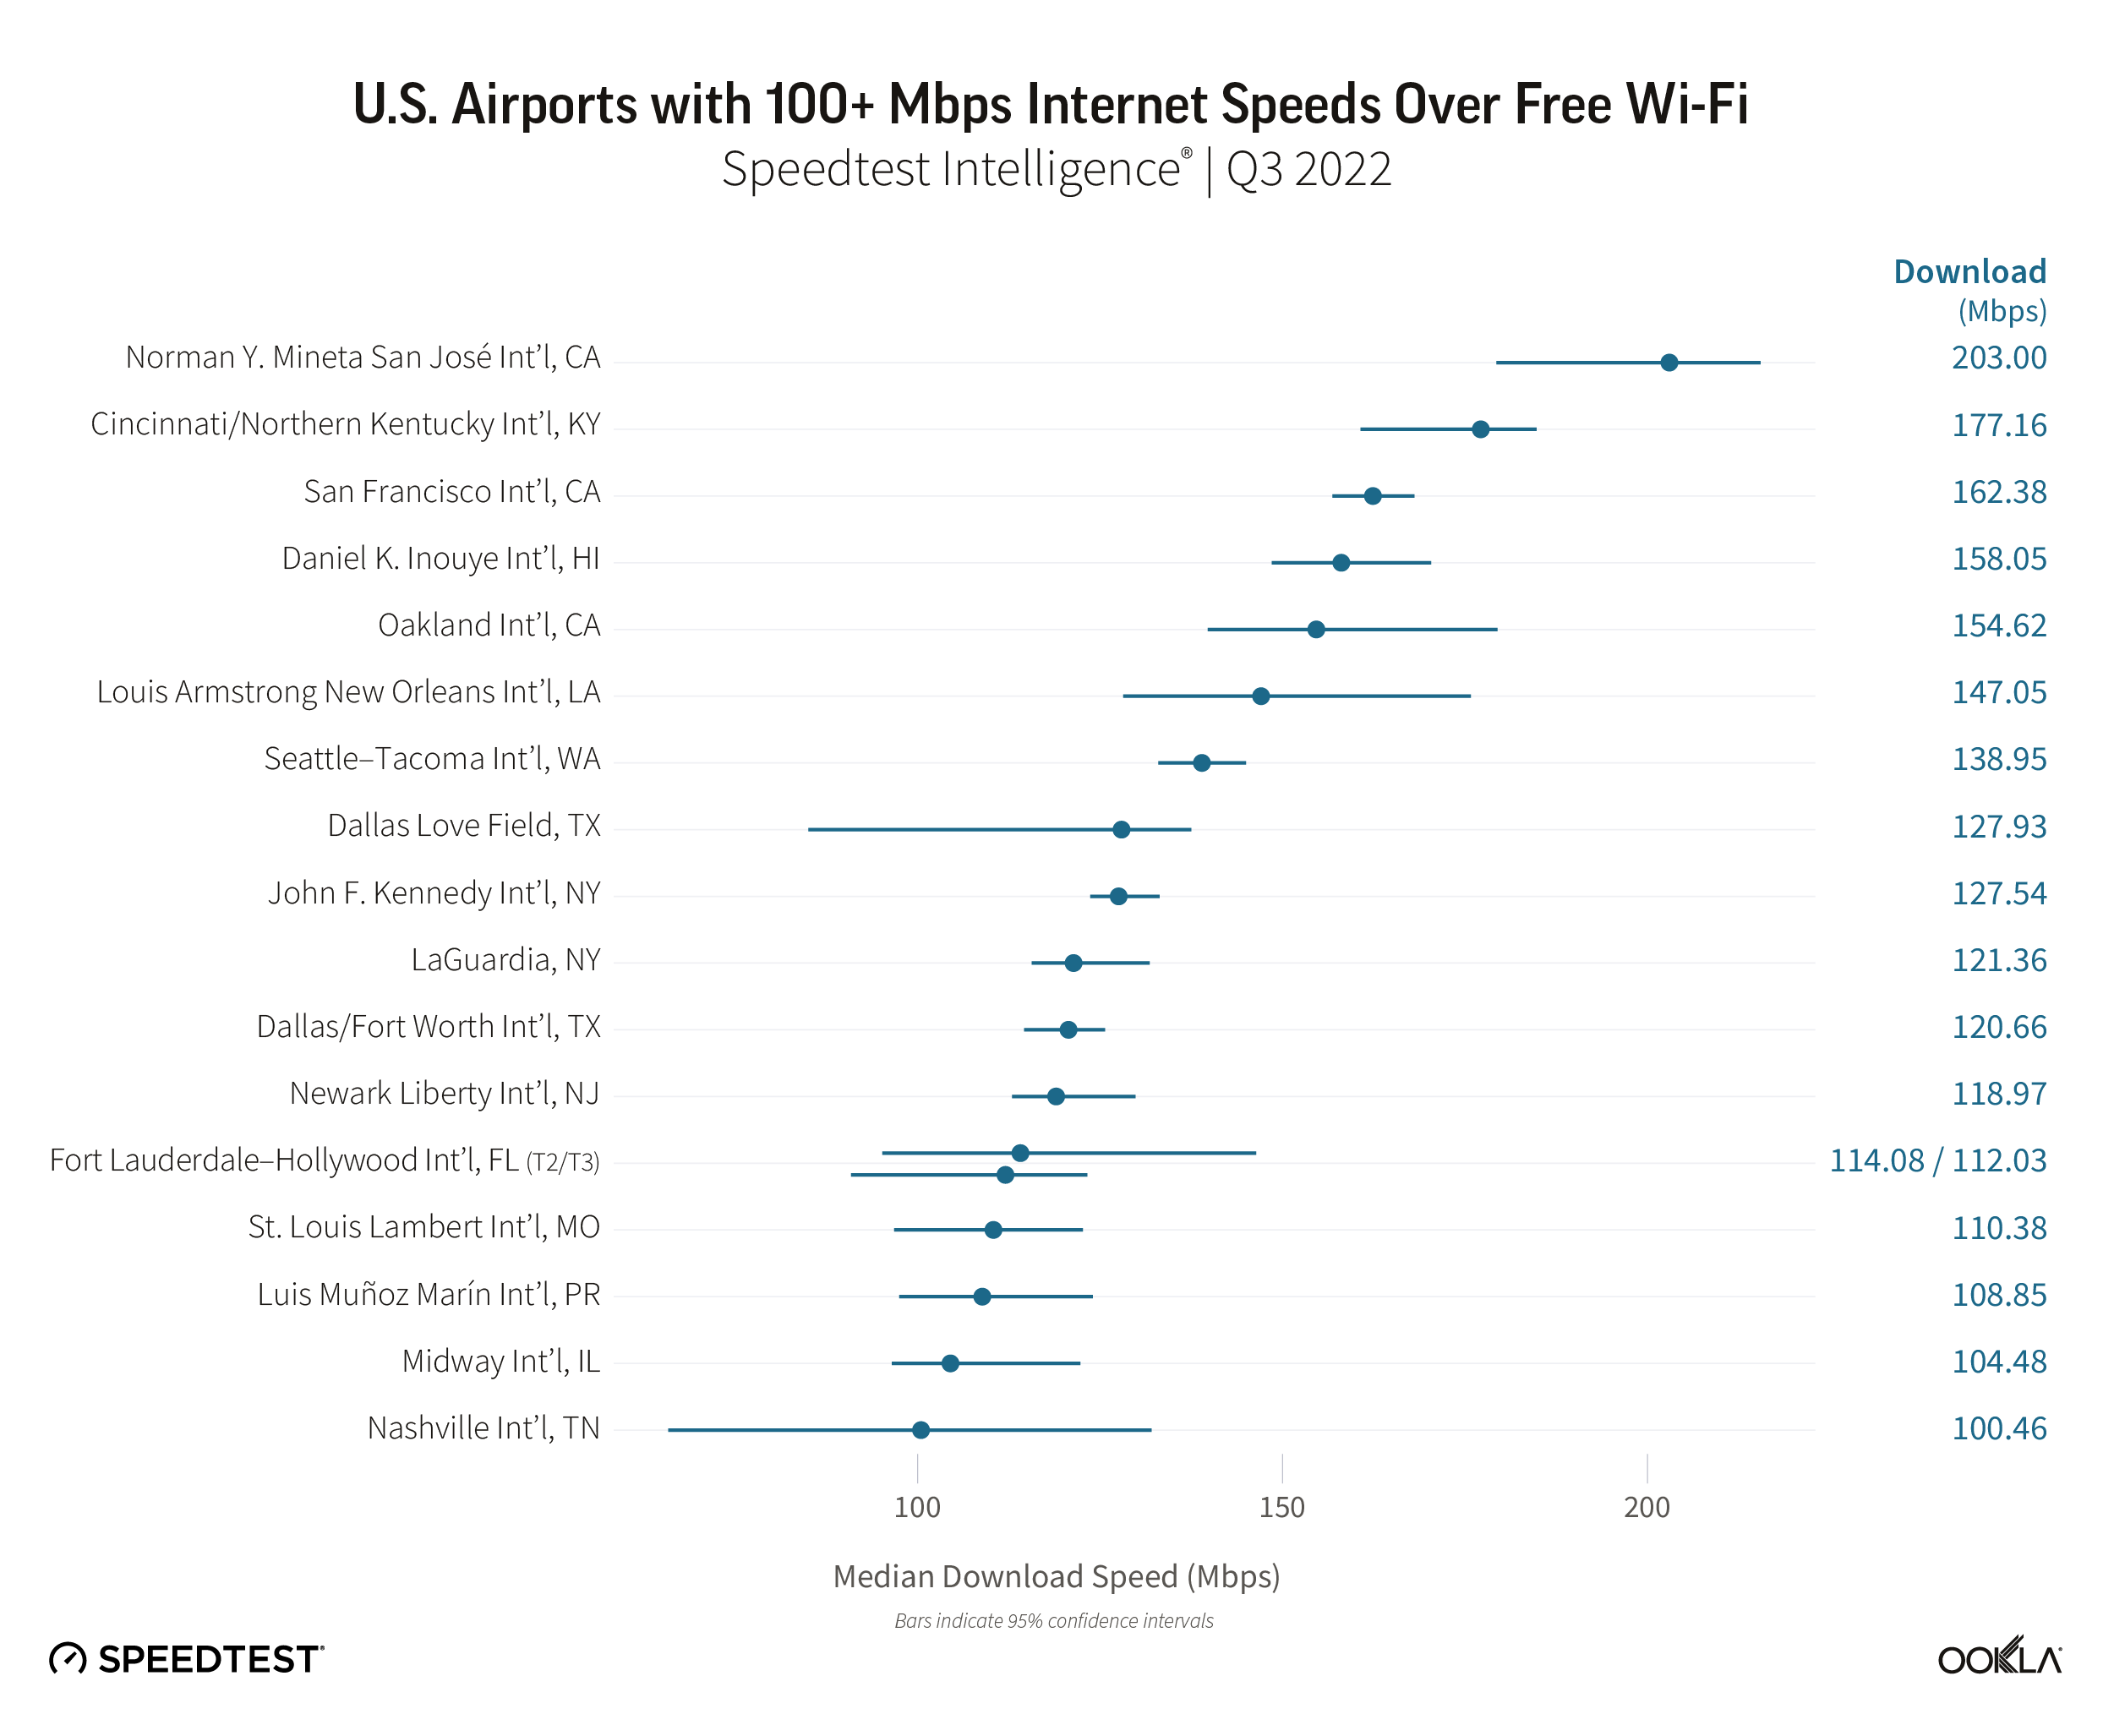
Speedtest Intelligence® shows Norman Y. Mineta San José International Airport, Cincinnati/Northern Kentucky International Airport, and San Francisco International Airport were among the fastest free airport Wi-Fi among the 50 busiest airports in the U.S. with median download speeds of 203.00 Mbps, 177.16 Mbps, and 162.38 Mbps, respectively, during Q3 2022. Daniel K. Inouye International Airport in Honolulu (158.05 Mbps) and Oakland International Airport (154.62 Mbps) rounded out the top five. All 17 of the airports at this performance level showed free airport Wi-Fi that’s capable of keeping the whole family entertained online for as long as your devices hold a charge.
Fort Lauderdale-Hollywood International Airport splits their free airport Wi-Fi among four separate SSIDs (the name of the network you log into), which we have listed separately in these results. The performance does not vary widely between them, but you will see that airport listed here and in the list below.
20 airports with 50-100 Mbps download speed over free airport Wi-Fi
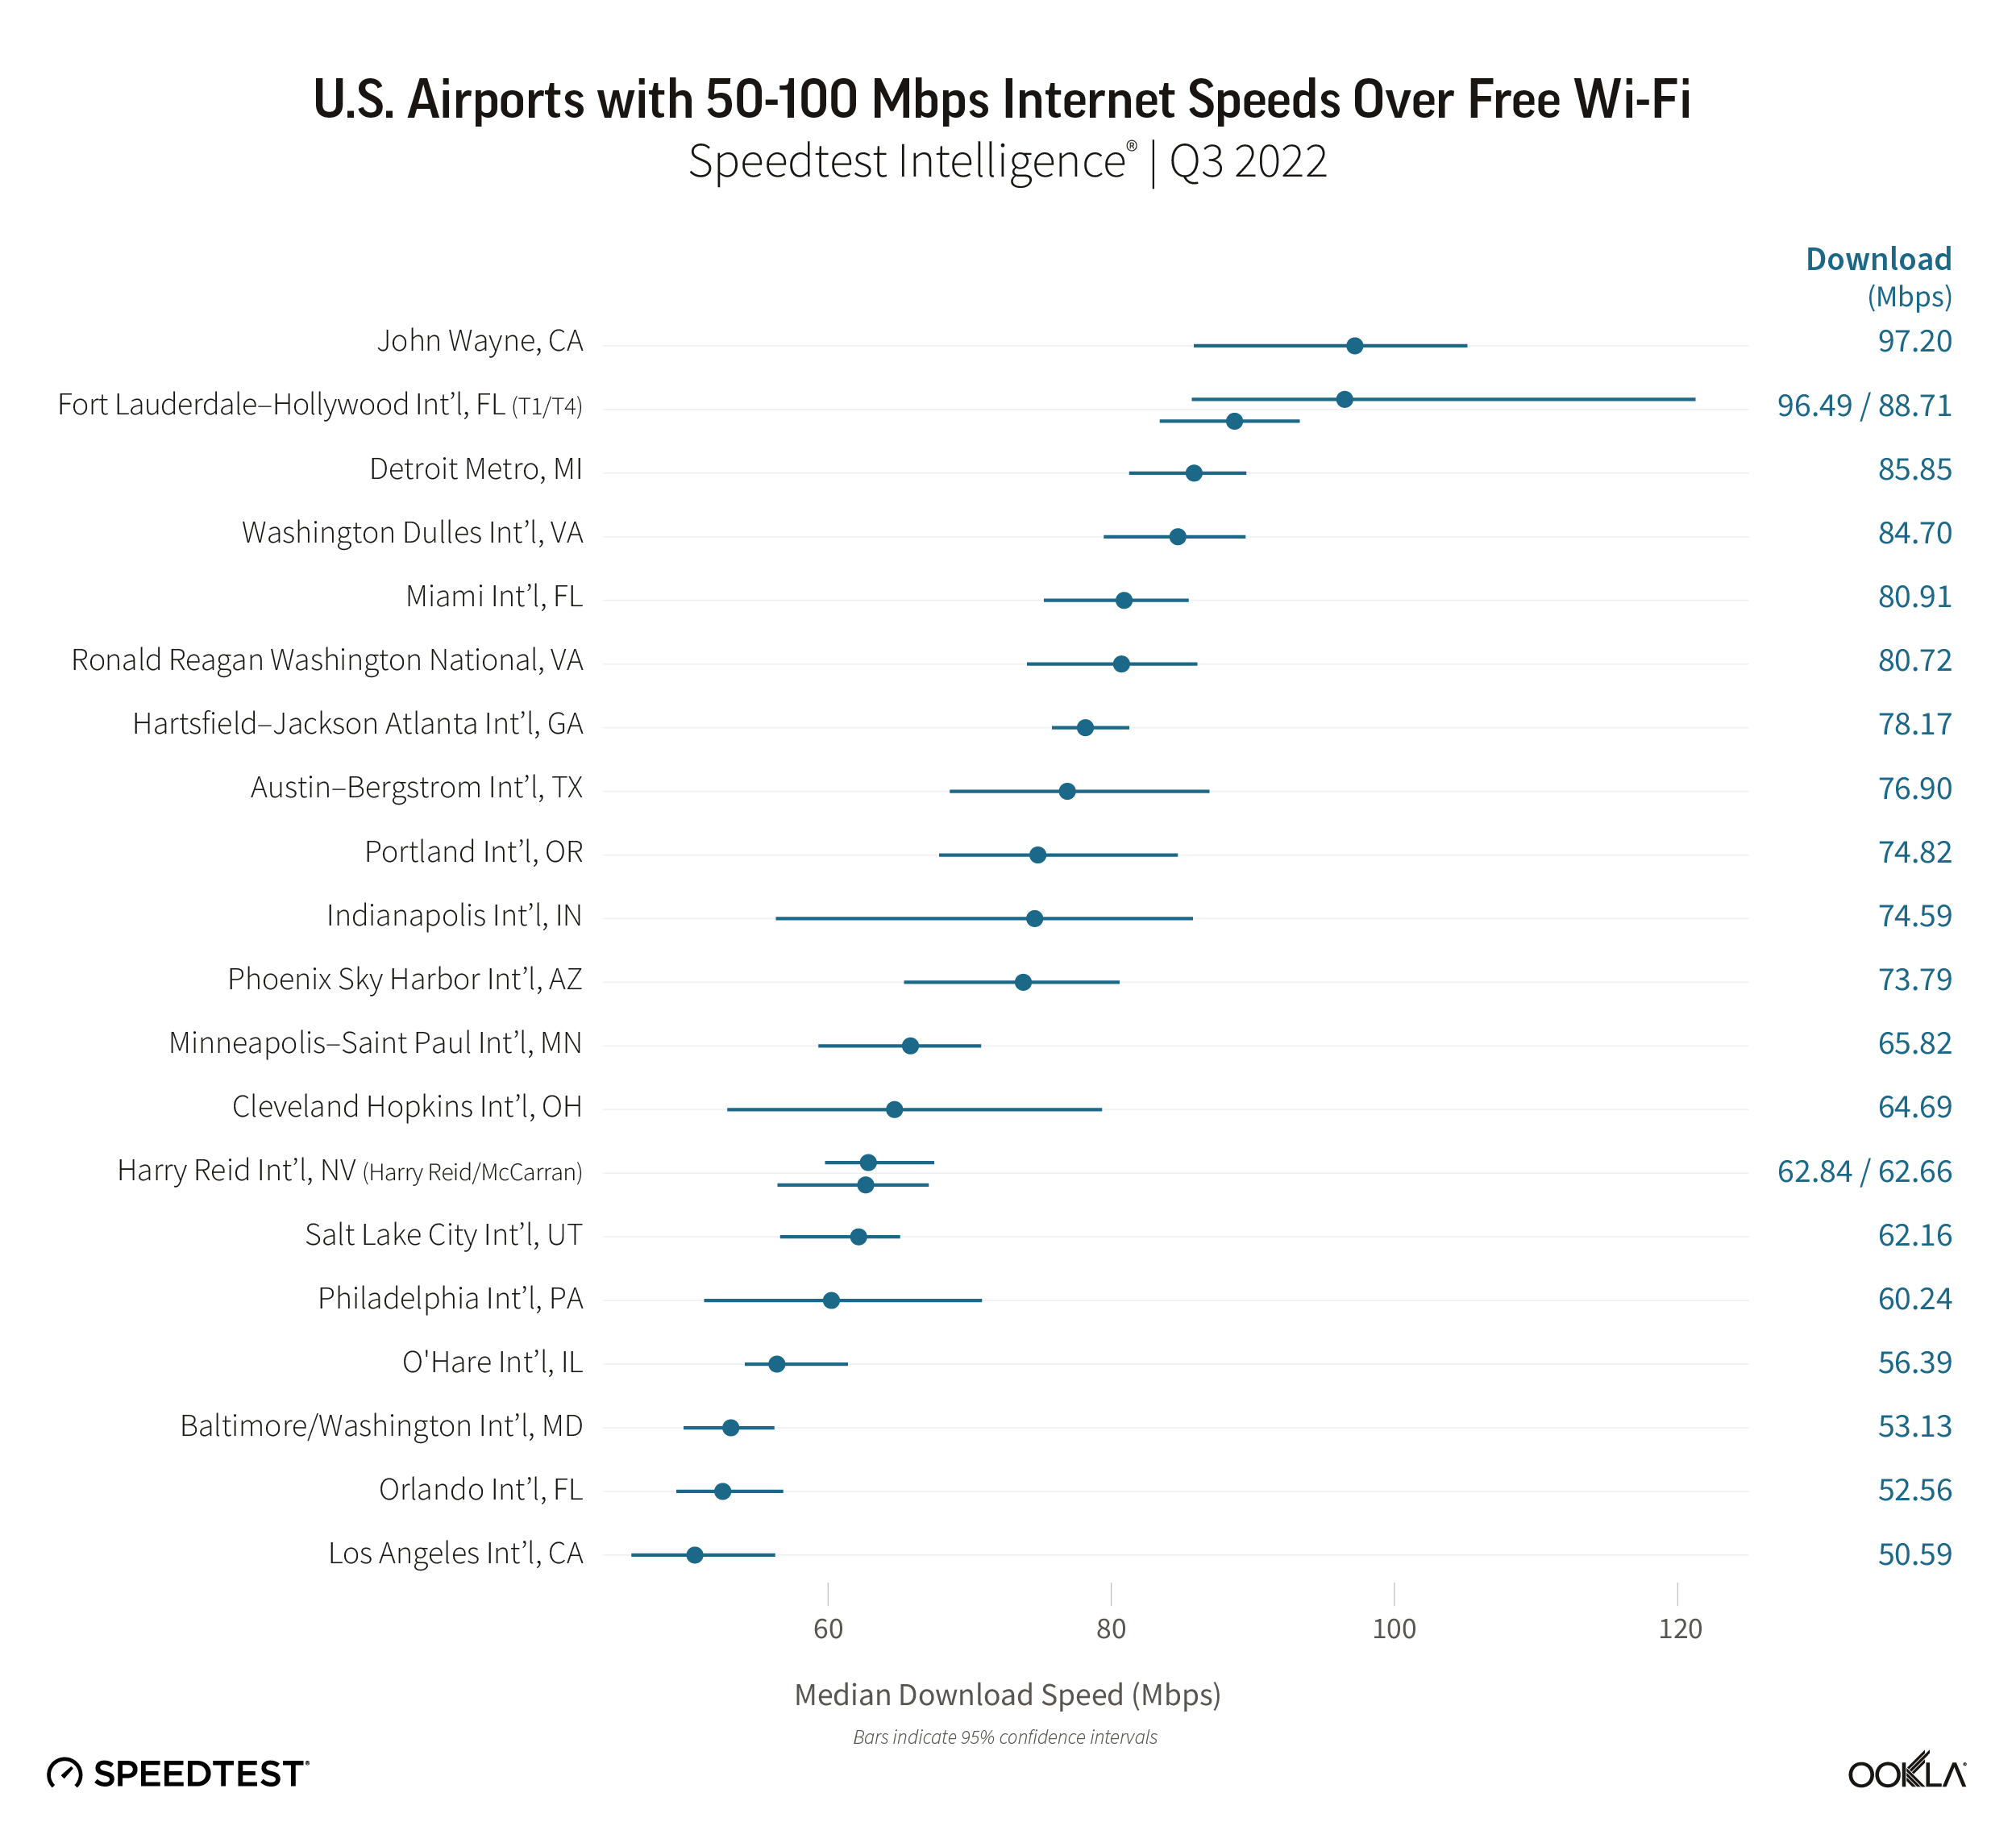
John Wayne Airport, two SSIDs at Fort Lauderdale-Hollywood, Detroit Metropolitan Airport, and Washington Dulles International Airport were at the top of the next performance tier for free airport Wi-Fi. Travelers at airports with Wi-Fi speeds in this range should have enough speed to adequately rebook flights as needed on one device while streaming distractions on another.
Note that Harry Reid International Airport in Las Vegas has two SSIDs on this list with comparable speeds. Philadelphia has a second SSID on the list below with a much lower speed, so you’ll want to make sure you’re connecting to “Free PHL Airport WiFi” when possible, rather than “Free PHL Airport WiFi-24”.
Pittsburgh and Houston have the slowest free airport Wi-Fi among 12 airports below 50 Mbps
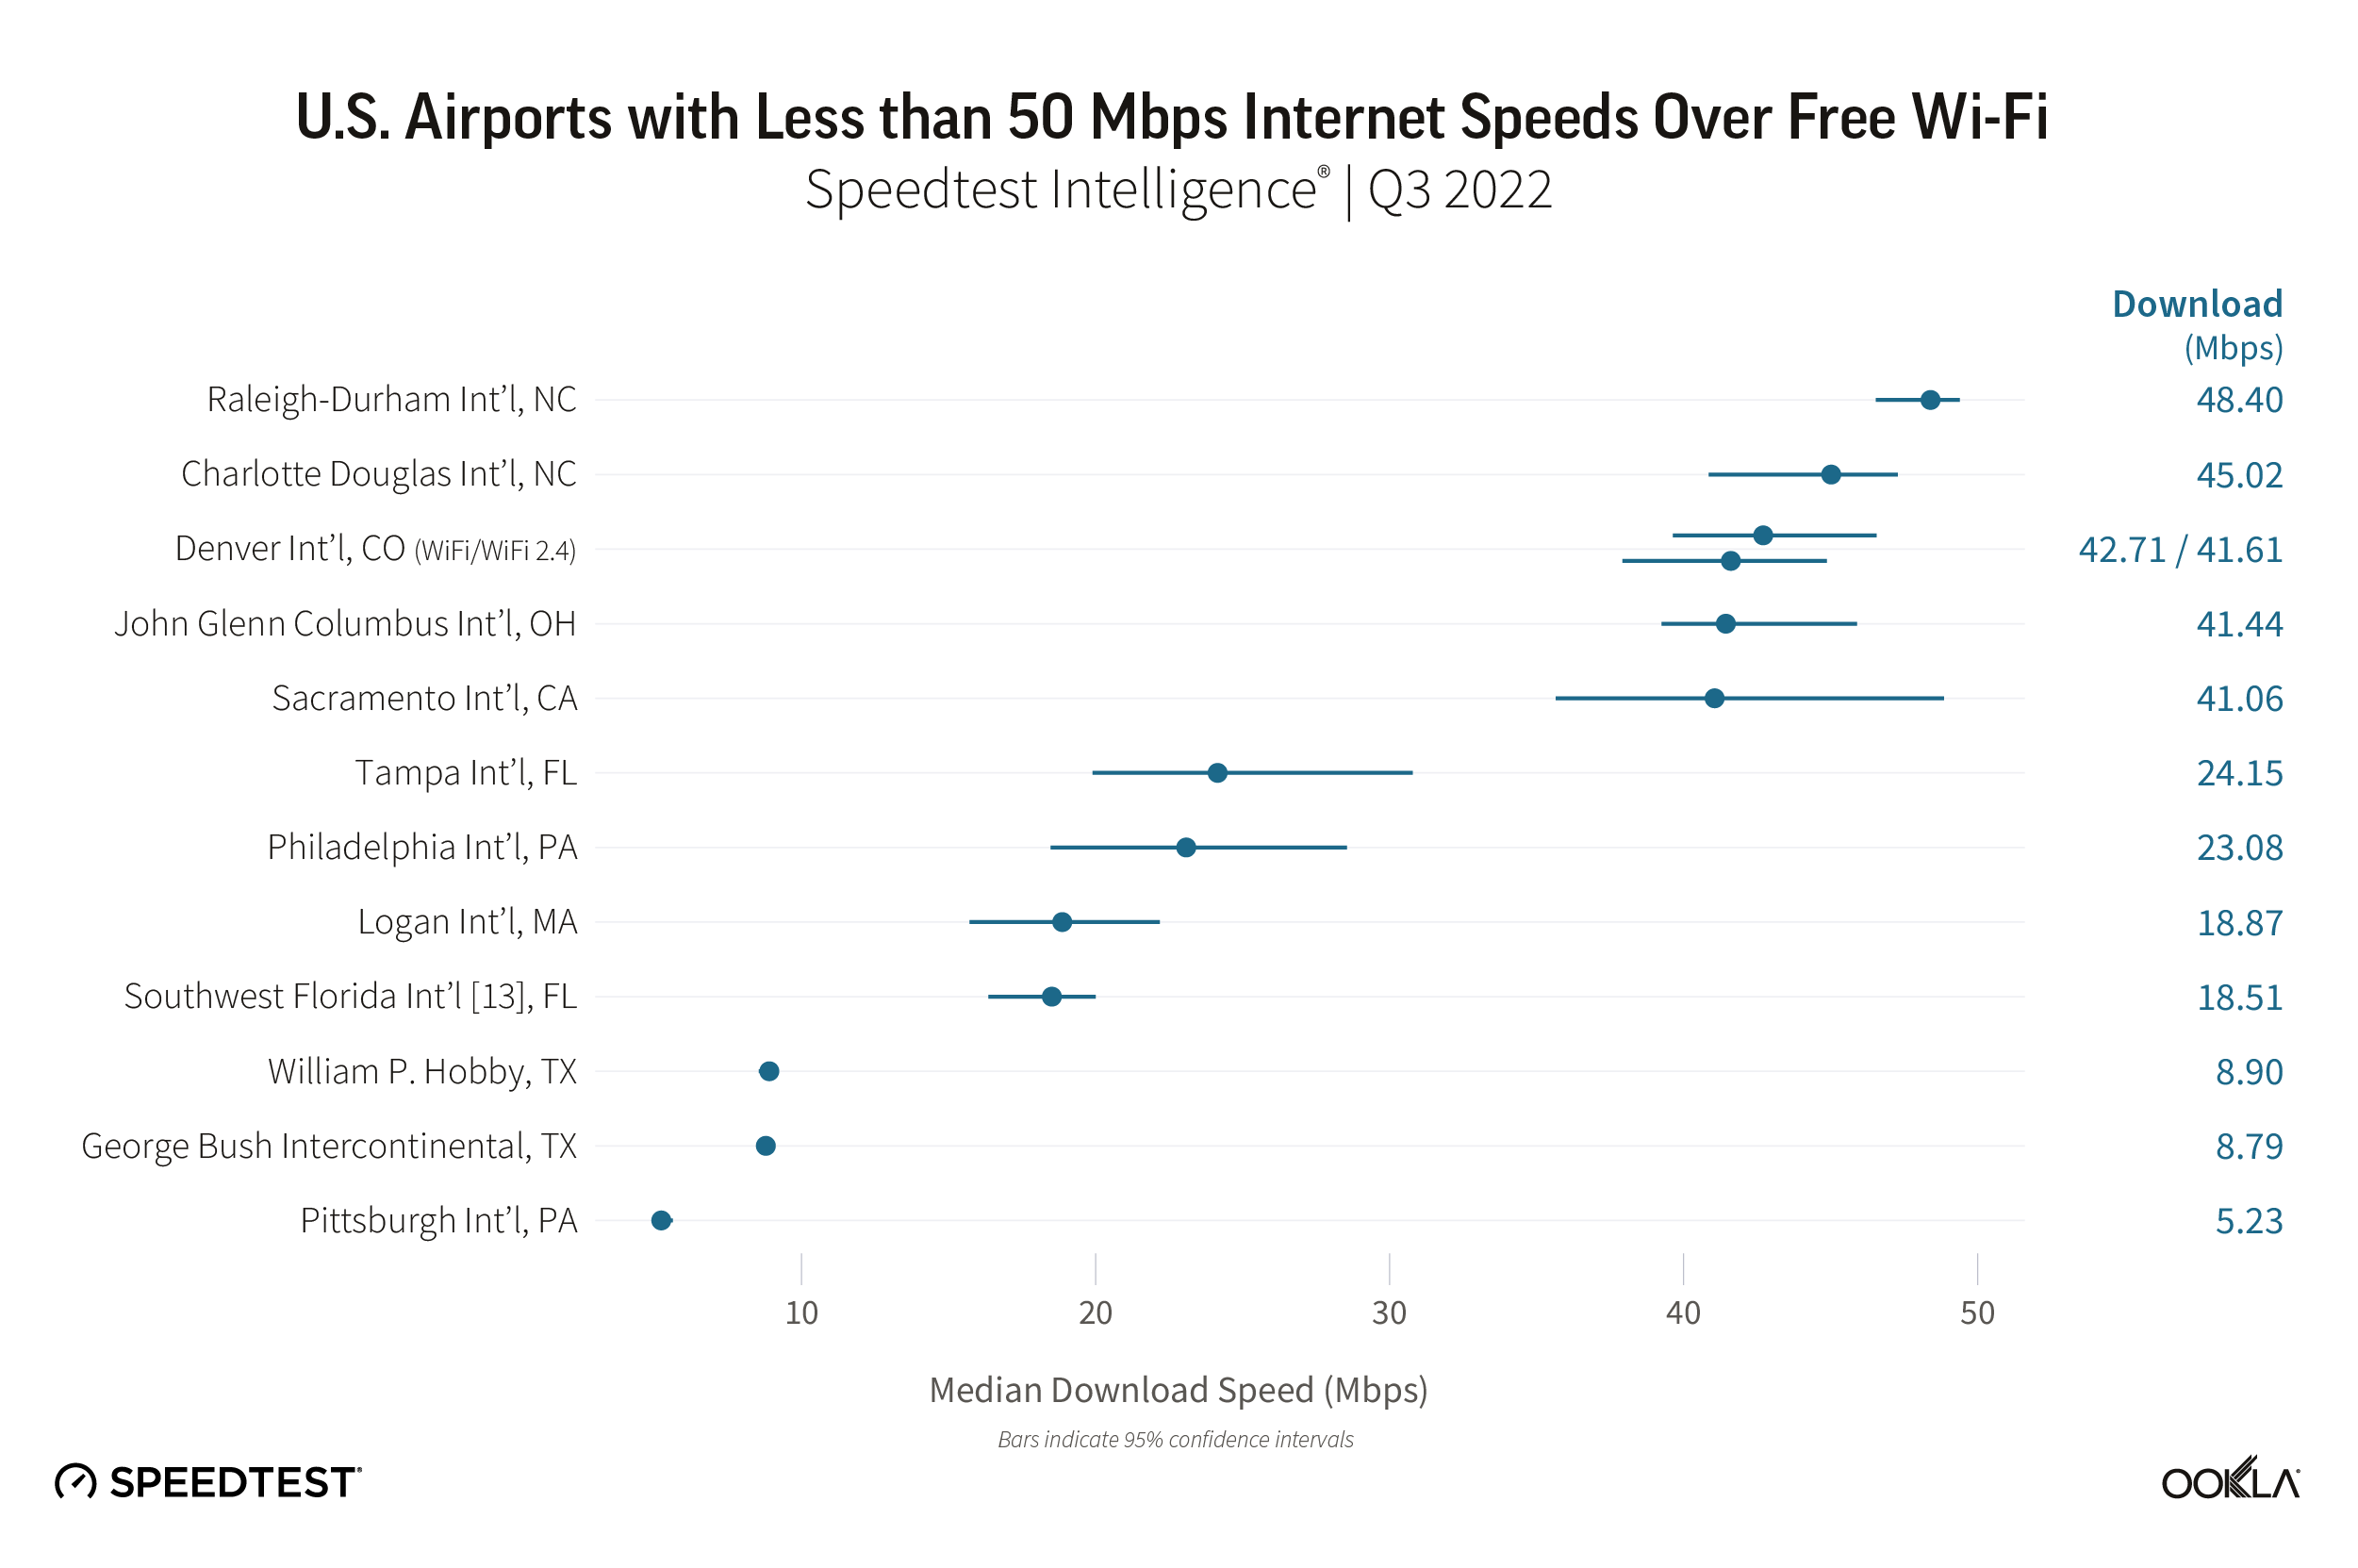
Internet performance might be an issue at airports on this lowest tier. While one device connected to a network that’s offering 20-40 Mbps might have no issues streaming 4K video, airports are notoriously high-volume places as travelers sit and wait for flights, mobile devices in hand for as long as it takes. The real issue is that on high traffic travel days (or worse, if there’s a weather delay) the connection might bog down. Airports at the bottom of our list — like Pittsburgh International Airport (5.23 Mbps median download speed) and George Bush Intercontinental Airport (8.79 Mbps) and William P. Hobby Airport (8.90 Mbps) in Houston — have the least leeway for performance to drop and still be usable, especially in an emergency situation when folks most want to connect.
Wi-Fi speeds decreased at four airports
Our most recent global analysis of free airport Wi-Fi included seven of these airports (over eight SSIDs, with Denver having two). The nominal download speed decreased when comparing Q1 2022 to Q3 2022 in four of those airports: Sea-Tac (32.06 Mbps drop), O’Hare (29.10 Mbps drop), Los Angeles (20.74 Mbps drop), and San Francisco (13.87 Mbps drop). Dallas/Fort Worth showed a 7.02 Mbps increase in median download speed over the same period. There was no meaningful difference in download speed between quarters at Hartsfield-Jackson and on both SSIDs at Denver. We generally expect speeds to improve over time as airports and internet service providers upgrade equipment. When airport Wi-Fi speeds decline we usually expect it’s due to that infrastructure not keeping up with increases in passenger volume or internet usage.
If you’re counting, you’ll see that we have data for 49 airports above, this is because there were insufficient samples at San Diego International Airport for us to analyze to our statistical standards.
Wi-Fi on other SSIDs
While most of the free airport Wi-Fi we saw had more than adequate speeds to do most things on your mobile device, there are other Wi-Fi options if you find that the free Wi-Fi is bogged down by too many users or if you just can’t find the popup to accept the terms and conditions required to connect to the local network. We looked at Speedtest® results across SSIDs to see if your best option might be Wi-Fi at an airport lounge or club or another option entirely.
Wi-Fi at airport lounges and clubs
We found Speedtest results for seven major airport lounge and club chains that serve a variety of airports. Wi-Fi is often free at these locations for folks who have paid for the privilege of lounge access, but median download speeds varied widely by airport within each brand so the Wi-Fi alone may not always be worth the price of admission.
The Alaska Lounge was the only lounge where we saw median download speeds in excess of 100 Mbps in all locations with sufficient samples to analyze, from 100.17 Mbps in Portland to 334.23 Mbps at LAX. The United Club showed everywhere from 57.98 Mbps at Dulles to 232.85 Mbps at SeaTac, and The Delta Sky Club ranged from 57.35 Mbps in Honolulu to 123.23 Mbps in Atlanta. American Airlines Lounge had median download speeds between 5.08 Mbps in Phoenix Sky Harbor and 74.94 Mbps at SFO and British Airways Lounge Wi-Fi download speed was between 25.00 Mbps at Dulles and 56.40 at Boston’s Logan Airport.
Non-airline lounges were equally variable with The Centurion Lounge featuring download speeds from 19.55 Mbps at SeaTac to 127.25 Mbps at George Bush Intercontinental, while The Club fluctuated from 12.90 Mbps in Orlando to 108.79 Mbps in New Orleans.
With such wide variations in Wi-Fi performance we can’t recommend any specific lounge. Your best bet is to take a Speedtest at your regular connections so you know what your options are next time you fly through.
Other Wi-Fi options
Of course there are still more companies that offer Wi-Fi at airports either as part of a tie-in with another business (like your mobile operator or credit card), by subscribing to a paid service, or as part of a larger deal with the airport. Our analysis turned up Speedtest results for three such Wi-Fi options at multiple airports in the U.S.: Boingo, Passpoint, and Skyfi. Median download speeds for Boingo were between 51.41 Mbps at LAX and 149.49 Mbps at Oakland. Passpoint Wi-Fi download speeds showed a low of 10.15 Mbps in Miami and a high of 106.59 Mbps in Oakland. And Skyfi’s median download speeds ranged between 50.15 Mbps in Orlando and 100.04 at LAX. It’s worth checking out which other Wi-Fi services you might have access to before you leave the house.
Overall, travelers should be pleased with the news on airport Wi-Fi in the U.S. Speeds are mostly good and there are a lot of options for travelers if one network gets crowded. Now you just have to remember to charge your devices before you pack them. If you’re traveling this holiday season, download the Speedtest app for Android or iOS before you go, then take a Speedtest at the airport to see how your experience compares.
Ookla retains ownership of this article including all of the intellectual property rights, data, content graphs and analysis. This article may not be quoted, reproduced, distributed or published for any commercial purpose without prior consent. Members of the press and others using the findings in this article for non-commercial purposes are welcome to publicly share and link to report information with attribution to Ookla.